UNITED STATES
SECURITIES AND EXCHANGE COMMISSION
Washington, D.C. 20549
FORM N-CSR
CERTIFIED SHAREHOLDER REPORT OF REGISTERED
MANAGEMENT INVESTMENT COMPANIES
Investment Company Act file number 811-05361
Variable Insurance Products Fund V
(Exact name of registrant as specified in charter)
245 Summer St., Boston, Massachusetts 02210
(Address of principal executive offices) (Zip code)
Cynthia Lo Bessette, Secretary
245 Summer St.
Boston, Massachusetts 02210
(Name and address of agent for service)
Registrant's telephone number, including area code:
617-563-7000
| |
Date of fiscal year end: | December 31 |
|
|
Date of reporting period: | December 31, 2020 |
Item 1.
Reports to Stockholders
Fidelity® Variable Insurance Products:
Government Money Market Portfolio
Annual Report
December 31, 2020


Contents
To view a fund's proxy voting guidelines and proxy voting record for the 12-month period ended June 30, visit http://www.fidelity.com/proxyvotingresults or visit the Securities and Exchange Commission's (SEC) web site at http://www.sec.gov.
You may also call 1-877-208-0098 to request a free copy of the proxy voting guidelines.
Fidelity® Variable Insurance Products are separate account options which are purchased through a variable insurance contract.
Standard & Poor's, S&P and S&P 500 are registered service marks of The McGraw-Hill Companies, Inc. and have been licensed for use by Fidelity Distributors Corporation.
Other third-party marks appearing herein are the property of their respective owners.
All other marks appearing herein are registered or unregistered trademarks or service marks of FMR LLC or an affiliated company. © 2021 FMR LLC. All rights reserved.
This report and the financial statements contained herein are submitted for the general information of the shareholders of the Fund. This report is not authorized for distribution to prospective investors in the Fund unless preceded or accompanied by an effective prospectus.
A fund files its complete schedule of portfolio holdings with the SEC for the first and third quarters of each fiscal year on Form N-PORT. Forms N-PORT are available on the SEC’s web site at http://www.sec.gov. A fund's Forms N-PORT may be reviewed and copied at the SEC’s Public Reference Room in Washington, DC. Information regarding the operation of the SEC's Public Reference Room may be obtained by calling 1-800-SEC-0330.
For a complete list of a fund's portfolio holdings, view the most recent holdings listing, semiannual report, or annual report on Fidelity's web site at http://www.fidelity.com, http://www.institutional.fidelity.com, or http://www.401k.com, as applicable.
NOT FDIC INSURED •MAY LOSE VALUE •NO BANK GUARANTEE
Neither the Fund nor Fidelity Distributors Corporation is a bank.
Note to Shareholders:
Early in 2020, the outbreak and spread of a new coronavirus emerged as a public health emergency that had a major influence on financial markets, primarily based on its impact on the global economy and the outlook for corporate earnings. The virus causes a respiratory disease known as COVID-19. On March 11, the World Health Organization declared the COVID-19 outbreak a pandemic, citing sustained risk of further global spread.
In the weeks following, as the crisis worsened, we witnessed an escalating human tragedy with wide-scale social and economic consequences from coronavirus-containment measures. The outbreak of COVID-19 prompted a number of measures to limit the spread, including travel and border restrictions, quarantines, and restrictions on large gatherings. In turn, these resulted in lower consumer activity, diminished demand for a wide range of products and services, disruption in manufacturing and supply chains, and – given the wide variability in outcomes regarding the outbreak – significant market uncertainty and volatility. Amid the turmoil, global governments and central banks took unprecedented action to help support consumers, businesses, and the broader economies, and to limit disruption to financial systems.
The situation continues to unfold, and the extent and duration of its impact on financial markets and the economy remain highly uncertain. Extreme events such as the coronavirus crisis are “exogenous shocks” that can have significant adverse effects on mutual funds and their investments. Although multiple asset classes may be affected by market disruption, the duration and impact may not be the same for all types of assets.
Fidelity is committed to helping you stay informed amid news about COVID-19 and during increased market volatility, and we’re taking extra steps to be responsive to customer needs. We encourage you to visit our websites, where we offer ongoing updates, commentary, and analysis on the markets and our funds.
Investment Summary/Performance (Unaudited)
Effective Maturity Diversification as of December 31, 2020
| Days | % of fund's investments 12/31/20 |
| 1 - 7 | 48.3 |
| 8 - 30 | 9.9 |
| 31 - 60 | 10.1 |
| 61 - 90 | 10.6 |
| 91 - 180 | 16.8 |
| > 180 | 4.3 |
Effective maturity is determined in accordance with the requirements of Rule 2a-7 under the Investment Company Act of 1940.
Asset Allocation (% of fund's net assets)
| As of December 31, 2020 |
| | Variable Rate Demand Notes (VRDNs) | 0.3% |
| | U.S. Treasury Debt | 45.0% |
| | U.S. Government Agency Debt | 28.9% |
| | Repurchase Agreements | 26.2% |
| | Net Other Assets (Liabilities)* | (0.4)% |

* Net Other Assets (Liabilities) are not included in the pie chart
Current 7-Day Yields
| | 12/31/20 |
| VIP Government Money Market Portfolio | 0.01% |
| VIP Government Money Market Portfolio | 0.01% |
| VIP Government Money Market Portfolio | 0.01% |
| VIP Government Money Market Portfolio | 0.01% |
Yield refers to the income paid by the Fund over a given period. Yield for money market funds is usually for seven-day periods, as it is here, though it is expressed as an annual percentage rate. Past performance is no guarantee of future results. Yield will vary and it's possible to lose money investing in the Fund. A portion of the Fund's expenses was reimbursed and/or waived. Absent such reimbursements and/or waivers the yield for the period ending December 31, 2020, the most recent period shown in the table, would have been (0.09)% for Initial Class, (0.19)% for Service Class, (0.34)% for Service Class 2 and (0.12)% for Investor Class.
Schedule of Investments December 31, 2020
Showing Percentage of Net Assets
| U.S. Treasury Debt - 45.0% | | | | |
| | | Yield(a) | Principal Amount | Value |
| U.S. Treasury Inflation Protected Obligations - 1.3% | | | | |
| U.S. Treasury Notes | | | | |
| 1/15/21 | | 0.09 to 0.12% | $83,323,100 | $83,355,028 |
| U.S. Treasury Obligations - 43.7% | | | | |
| U.S. Treasury Bills | | | | |
| 1/5/21 to 12/2/21 | | 0.09 to 0.17 | 2,290,510,000 | 2,289,977,710 |
| U.S. Treasury Bonds | | | | |
| 5/15/21 | | 0.12 | 2,000,000 | 2,059,027 |
| U.S. Treasury Notes | | | | |
| 1/31/21 to 10/31/22 | | 0.02 to 0.40 (b) | 420,000,000 | 422,694,546 |
| | | | | 2,714,731,283 |
| TOTAL U.S. TREASURY DEBT | | | | |
| (Cost $2,798,086,311) | | | | 2,798,086,311 |
|
| Variable Rate Demand Note - 0.3% | | | | |
| California - 0.0% | | | | |
| FHLMC California Statewide Cmntys. Dev. Auth. Multi-family Hsg. Rev. (Heritage Park Apts. Proj.) Series 2008 C, 0.1% 1/7/21, LOC Freddie Mac, VRDN | | | | |
| 1/7/21 | | 0.10 (b)(c) | 400,000 | 400,000 |
| New York - 0.3% | | | | |
| FHLMC New York Hsg. Fin. Agcy. Rev. (Clinton Green North Hsg. Proj.) Series 2005 A, 0.1% 1/7/21, LOC Freddie Mac, VRDN | | | | |
| 1/7/21 | | 0.10 (b)(c) | 1,100,000 | 1,100,000 |
| FHLMC New York Hsg. Fin. Agcy. Rev. (Clinton Green South Hsg. Proj.) Series 2005 A, 0.1% 1/7/21, LOC Freddie Mac, VRDN | | | | |
| 1/7/21 | | 0.10 (b)(c) | 600,000 | 600,000 |
| FHLMC New York Hsg. Fin. Agcy. Rev. (Theatre Row Tower Hsg. Proj.) Series 2002 A, 0.1% 1/7/21, LOC Freddie Mac, VRDN | | | | |
| 1/7/21 | | 0.10 (b)(c) | 14,500,000 | 14,500,000 |
| FNMA New York City Hsg. Dev. Corp. Multi-family Rental Hsg. Rev. (155 West 21st Street Dev. Proj.) Series 2007 A, 0.1% 1/7/21, LOC Fannie Mae, VRDN | | | | |
| 1/7/21 | | 0.10 (b)(c) | 400,000 | 400,000 |
| FNMA New York Hsg. Fin. Agcy. Rev. (316 Eleventh Ave. Hsg. Proj.) Series 2007 A, 0.1% 1/7/21, LOC Fannie Mae, VRDN | | | | |
| 1/7/21 | | 0.10 (b)(c) | 500,000 | 500,000 |
| FNMA New York Hsg. Fin. Agcy. Rev. (600 West and 42nd St. Hsg. Proj.) Series 2007 A, 0.11% 1/7/21, LOC Fannie Mae, VRDN | | | | |
| 1/7/21 | | 0.11 (b)(c) | 900,000 | 900,000 |
| FNMA New York Hsg. Fin. Agcy. Rev. (Tribeca Park Proj.) Series 1997 A, 0.1% 1/7/21, LOC Fannie Mae, VRDN | | | | |
| 1/7/21 | | 0.10 (b)(c) | 400,000 | 400,000 |
| FNMA New York Hsg. Fin. Agcy. Rev. (West 23rd Street Hsg. Proj.) Series 2001 A, 0.1% 1/7/21, LOC Fannie Mae, VRDN | | | | |
| 1/7/21 | | 0.10 (b)(c) | 200,000 | 200,000 |
| FNMA New York Hsg. Fin. Agcy. Rev. Series 1997 A, 0.1% 1/7/21, LOC Fannie Mae, VRDN | | | | |
| 1/7/21 | | 0.10 (b)(c) | 400,000 | 400,000 |
| FNMA New York Hsg. Fin. Agcy. Rev. Series 2008 A, 0.12% 1/7/21, LOC Fannie Mae, VRDN | | | | |
| 1/7/21 | | 0.12 (b)(c) | 500,000 | 500,000 |
| | | | | 19,500,000 |
| TOTAL VARIABLE RATE DEMAND NOTE | | | | |
| (Cost $19,900,000) | | | | 19,900,000 |
|
| U.S. Government Agency Debt - 28.9% | | | | |
| Federal Agencies - 28.9% | | | | |
| Fannie Mae | | | | |
| 1/29/21 to 7/29/22 | | 0.09 to 0.44 (b) | 425,200,000 | 425,199,810 |
| Federal Farm Credit Bank | | | | |
| 1/5/21 to 3/8/22 | | 0.11 to 0.71 (b) | 27,000,000 | 26,999,442 |
| Federal Home Loan Bank | | | | |
| 1/4/21 to 12/15/22 | | 0.06 to 0.37 (b) | 1,129,030,000 | 1,129,015,433 |
| Freddie Mac | | | | |
| 2/5/21 to 9/9/22 | | 0.10 to 0.39 (b) | 215,400,000 | 215,405,704 |
| TOTAL U.S. GOVERNMENT AGENCY DEBT | | | | |
| (Cost $1,796,620,389) | | | | 1,796,620,389 |
| U.S. Government Agency Repurchase Agreement - 10.6% | | | |
| | | Maturity Amount | Value |
| In a joint trading account at 0.08% dated 12/31/20 due 1/4/21 (Collateralized by U.S. Government Obligations) # | | $369,838,343 | $369,835,000 |
| With: | | | |
| ABN AMRO Bank NV at 0.07%, dated 12/31/20 due 1/4/21 (Collateralized by U.S. Government Obligations valued at $7,140,056, 2.00%, 7/1/50) | | 7,000,054 | 7,000,000 |
| Barclays Bank PLC at 0.11%, dated 12/28/20 due 1/4/21 (Collateralized by U.S. Government Obligations valued at $12,240,262, 2.50%, 12/20/50) | | 12,000,257 | 12,000,000 |
| BMO Capital Markets Corp. at 0.12%, dated 11/16/20 due 1/7/21 (Collateralized by U.S. Treasury Obligations valued at $2,040,345, 0.40% - 2.88%, 10/31/21 - 2/15/49) | | 2,000,400 | 2,000,000 |
| BMO Harris Bank NA at: | | | |
| 0.1%, dated: | | | |
| 12/10/20 due 1/7/21 (Collateralized by Mortgage Loan Obligations valued at $2,040,142, 2.50% - 3.01%, 4/1/24 - 12/1/40) | | 2,000,183 | 2,000,000 |
| 12/14/20 due 1/7/21 (Collateralized by U.S. Government Obligations valued at $4,080,238, 2.00% - 2.50%, 1/1/36 - 12/1/50) | | 4,000,511 | 4,000,000 |
| 0.13%, dated 11/2/20 due 1/7/21 (Collateralized by U.S. Government Obligations valued at $3,061,484, 2.50% - 4.00%, 4/1/24 - 1/1/51) | | 3,000,997 | 3,000,000 |
| BofA Securities, Inc. at 0.11%, dated 12/17/20 due 1/7/21 (Collateralized by U.S. Government Obligations valued at $6,120,337, 3.26% - 4.42%, 7/20/68 - 5/20/70) | | 6,000,532 | 6,000,000 |
| Citibank NA at: | | | |
| 0.11%, dated 12/29/20 due 1/5/21 (Collateralized by U.S. Government Obligations valued at $3,060,056, 0.00% - 4.22%, 2/15/21 - 9/15/65) | | 3,000,064 | 3,000,000 |
| 0.12%, dated 12/29/20 due 1/5/21 (Collateralized by U.S. Treasury Obligations valued at $16,321,028, 1.88% - 5.25%, 8/15/22 - 9/15/65) | | 16,000,373 | 16,000,000 |
| Citigroup Global Capital Markets, Inc. at: | | | |
| 0.11%, dated 12/14/20 due 1/7/21 (Collateralized by U.S. Government Obligations valued at $28,561,916, 0.38% - 3.50%, 4/30/25 - 7/20/50) | | 28,003,080 | 28,000,000 |
| 0.12%, dated 12/29/20 due 1/5/21 (Collateralized by U.S. Government Obligations valued at $22,440,879, 2.00% - 2.50%, 12/20/50) | | 22,000,513 | 22,000,000 |
| Deutsche Bank AG, New York at 0.08%, dated 12/31/20 due 1/4/21 (Collateralized by U.S. Government Obligations valued at $16,480,147, 3.35%, 6/15/24) | | 16,000,142 | 16,000,000 |
| Goldman Sachs & Co. at: | | | |
| 0.07%, dated 12/31/20 due 1/4/21 (Collateralized by U.S. Government Obligations valued at $29,580,230, 2.50% - 5.50%, 2/1/38 - 8/1/50) | | 29,000,226 | 29,000,000 |
| 0.11%, dated 12/28/20 due 1/4/21 (Collateralized by U.S. Government Obligations valued at $32,640,698, 2.50% - 6.00%, 7/1/25 - 1/1/50) | | 32,000,684 | 32,000,000 |
| Mitsubishi UFJ Securities (U.S.A.), Inc. at 0.14%, dated: | | | |
| 12/8/20 due 2/8/21 (Collateralized by U.S. Government Obligations valued at $8,160,857, 3.00% - 4.00%, 7/1/33 - 11/1/48) | | 8,001,929 | 8,000,000 |
| 12/29/20 due 2/26/21 (Collateralized by U.S. Government Obligations valued at $5,100,119, 1.91% - 4.66%, 10/1/31 - 9/1/50) | | 5,001,147 | 5,000,000 |
| 12/31/20 due 3/1/21 (Collateralized by U.S. Government Obligations valued at $7,140,111, 2.95% - 4.00%, 1/1/38 - 11/1/49) | | 7,001,633 | 7,000,000 |
| Morgan Stanley & Co., LLC at 0.07%, dated 12/31/20 due 1/4/21 (Collateralized by U.S. Treasury Obligations valued at $19,380,151, 0.00% - 5.25%, 8/1/23 - 5/15/40) | | 19,000,148 | 19,000,000 |
| RBC Financial Group at: | | | |
| 0.1%, dated 12/28/20 due 1/7/21 (Collateralized by U.S. Government Obligations valued at $19,380,377, 2.00% - 4.50%, 12/1/37 - 10/1/50) | | 19,001,847 | 19,000,000 |
| 0.11%, dated 11/17/20 due 1/7/21 (Collateralized by U.S. Government Obligations valued at $6,120,898, 2.00% - 4.50%, 12/1/37 - 10/1/50) | | 6,001,155 | 6,000,000 |
| Societe Generale at 0.09%, dated 12/31/20 due 1/7/21 (Collateralized by U.S. Treasury Obligations valued at $10,300,005, 0.00% - 8.13%, 5/15/21 - 12/1/50) | | 10,000,175 | 10,000,000 |
| TD Securities (U.S.A.) at 0.08%, dated 12/31/20 due 1/4/21 (Collateralized by U.S. Government Obligations valued at $22,440,200, 4.00% - 4.50%, 10/20/43 - 8/20/48) | | 22,000,196 | 22,000,000 |
| Wells Fargo Securities, LLC at 0.11%, dated 12/30/20 due 1/6/21 (Collateralized by U.S. Government Obligations valued at $11,220,172, 2.00%, 12/1/50) | | 11,000,235 | 11,000,000 |
| TOTAL U.S. GOVERNMENT AGENCY REPURCHASE AGREEMENT | | | |
| (Cost $658,835,000) | | | 658,835,000 |
|
| U.S. Treasury Repurchase Agreement - 15.6% | | | |
| With: | | | |
| Barclays Bank PLC at 0.09%, dated: | | | |
| 11/30/20 due 1/4/21 (Collateralized by U.S. Treasury Obligations valued at $20,401,851, 0.00%, 12/30/21) | | 20,001,750 | 20,000,000 |
| 12/7/20 due 1/7/21 (Collateralized by U.S. Treasury Obligations valued at $27,541,960, 0.00%, 12/30/21) | | 27,002,093 | 27,000,000 |
| BNP Paribas, SA at: | | | |
| 0.09%, dated 12/1/20 due 1/4/21 (Collateralized by U.S. Treasury Obligations valued at $10,241,412, 0.21% - 6.63%, 1/31/22 - 2/15/48) | | 10,000,850 | 10,000,000 |
| 0.1%, dated: | | | |
| 12/1/20 due 1/7/21 (Collateralized by U.S. Treasury Obligations valued at $10,201,047, 0.13% - 6.13%, 1/31/22 - 5/15/42) | | 10,001,722 | 10,000,000 |
| 12/2/20 due 1/7/21 (Collateralized by U.S. Treasury Obligations valued at $53,280,463, 0.21% - 7.63%, 8/15/21 - 5/15/48) | | 52,006,933 | 52,000,000 |
| 12/3/20 due 1/7/21 (Collateralized by U.S. Treasury Obligations valued at $54,520,758, 0.21% - 6.38%, 1/31/22 - 2/15/48) | | 53,007,067 | 53,000,000 |
| 12/4/20 due 1/7/21 (Collateralized by U.S. Treasury Obligations valued at $15,301,366, 0.21% - 6.63%, 9/15/21 - 8/15/48) | | 15,002,000 | 15,000,000 |
| 12/7/20 due 1/7/21 (Collateralized by U.S. Treasury Obligations valued at $8,160,710, 0.13% - 3.00%, 1/31/22 - 2/15/48) | | 8,002,022 | 8,000,000 |
| 12/9/20 due 1/7/21 (Collateralized by U.S. Treasury Obligations valued at $35,932,246, 0.13% - 6.63%, 4/30/22 - 2/15/48) | | 35,008,750 | 35,000,000 |
| 12/14/20 due 1/7/21 (Collateralized by U.S. Treasury Obligations valued at $57,123,416, 0.25% - 6.25%, 10/31/21 - 11/15/43) | | 56,008,867 | 56,000,000 |
| 12/30/20 due 1/7/21 (Collateralized by U.S. Treasury Obligations valued at $26,520,464, 0.21% - 4.25%, 1/31/22 - 5/15/42) | | 26,001,011 | 26,000,000 |
| 0.11%, dated: | | | |
| 11/5/20 due 1/4/21 (Collateralized by U.S. Treasury Obligations valued at $28,601,067, 0.13% - 4.25%, 1/31/21 - 5/15/46) | | 28,005,133 | 28,000,000 |
| 11/9/20 due 1/7/21 (Collateralized by U.S. Treasury Obligations valued at $26,784,257, 0.21% - 4.25%, 1/31/22 - 5/15/46) | | 26,004,767 | 26,000,000 |
| 11/16/20 due 1/7/21 (Collateralized by U.S. Treasury Obligations valued at $26,524,047, 0.00% - 6.75%, 1/14/21 - 2/15/43) | | 26,004,767 | 26,000,000 |
| 0.12%, dated 11/30/20 due 3/1/21 (Collateralized by U.S. Treasury Obligations valued at $3,060,392, 0.21% - 6.25%, 1/31/21 - 2/15/48) | | 3,000,910 | 3,000,000 |
| BofA Securities, Inc. at 0.1%, dated 12/17/20 due 1/7/21 (Collateralized by U.S. Treasury Obligations valued at $5,150,349, 2.50%, 5/15/46) | | 5,000,403 | 5,000,000 |
| CIBC Bank U.S.A. at: | | | |
| 0.1%, dated 11/18/20 due 1/6/21 (Collateralized by U.S. Treasury Obligations valued at $5,100,770, 0.13% - 2.50%, 2/15/22 - 2/15/50) | | 5,000,681 | 5,000,000 |
| 0.11%, dated 11/10/20 due 1/7/21 (Collateralized by U.S. Treasury Obligations valued at $4,080,778, 0.13% - 2.25%, 10/31/21 - 2/15/50) | | 4,000,794 | 4,000,000 |
| Commerz Markets LLC at 0.11%, dated: | | | |
| 12/28/20 due 1/4/21 (Collateralized by U.S. Treasury Obligations valued at $40,800,919, 0.13% - 2.63%, 12/15/21 - 2/15/50) | | 40,000,856 | 40,000,000 |
| 12/29/20 due 1/5/21 (Collateralized by U.S. Treasury Obligations valued at $21,420,483, 0.25% - 2.63%, 12/15/21 - 2/15/50) | | 21,000,449 | 21,000,000 |
| Credit AG at: | | | |
| 0.09%, dated 11/30/20 due 1/4/21 (Collateralized by U.S. Treasury Obligations valued at $15,451,407, 3.00%, 2/15/47) | | 15,001,313 | 15,000,000 |
| 0.1%, dated: | | | |
| 12/8/20 due 1/7/21 (Collateralized by U.S. Treasury Obligations valued at $10,200,783, 1.13%, 8/15/40) | | 10,000,861 | 10,000,000 |
| 12/10/20 due 1/7/21 (Collateralized by U.S. Treasury Obligations valued at $5,100,439, 1.13%, 8/15/40) | | 5,000,458 | 5,000,000 |
| 12/11/20 due 1/7/21 (Collateralized by U.S. Treasury Obligations valued at $2,040,157, 1.13%, 8/15/40) | | 2,000,178 | 2,000,000 |
| 12/14/20 due 1/7/21 (Collateralized by U.S. Treasury Obligations valued at $8,160,531, 1.13%, 8/15/40) | | 8,000,644 | 8,000,000 |
| 12/21/20 due 1/7/21 (Collateralized by U.S. Treasury Obligations valued at $13,260,590, 1.13%, 8/15/40) | | 13,001,119 | 13,000,000 |
| 12/23/20 due 1/7/21 | | | |
| (Collateralized by U.S. Treasury Obligations valued at $15,450,617, 3.00%, 2/15/47) | | 15,000,667 | 15,000,000 |
| (Collateralized by U.S. Treasury Obligations valued at $10,200,403, 1.13%, 8/15/40) | | 10,000,444 | 10,000,000 |
| 0.11%, dated 12/30/20 due 1/5/21 (Collateralized by U.S. Treasury Obligations valued at $5,100,154, 1.13%, 8/15/40) | | 5,000,092 | 5,000,000 |
| ING Financial Markets LLC at 0.07%, dated 12/31/20 due 1/4/21 (Collateralized by U.S. Treasury Obligations valued at $20,410,000, 0.13%, 6/30/22) | | 20,000,156 | 20,000,000 |
| Lloyds Bank Corp. Markets PLC at: | | | |
| 0.14%, dated: | | | |
| 12/3/20 due 3/3/21 (Collateralized by U.S. Treasury Obligations valued at $4,082,421, 0.13%, 7/31/22) | | 4,001,400 | 4,000,000 |
| 12/10/20 due 3/10/21 (Collateralized by U.S. Treasury Obligations valued at $3,090,114, 2.38% - 3.00%, 2/15/24 - 5/15/45) | | 3,001,050 | 3,000,000 |
| 0.15%, dated 11/20/20 due 3/11/21 (Collateralized by U.S. Treasury Obligations valued at $4,092,616, 1.50% - 2.75%, 9/30/21 - 8/31/25) | | 4,001,850 | 4,000,000 |
| Lloyds Bank PLC at: | | | |
| 0.14%, dated: | | | |
| 10/26/20 due 1/26/21 (Collateralized by U.S. Treasury Obligations valued at $5,106,123, 1.50% - 6.00%, 11/15/22 - 8/15/26) | | 5,001,789 | 5,000,000 |
| 11/9/20 due 2/9/21 (Collateralized by U.S. Treasury Obligations valued at $5,100,021, 1.50% - 6.00%, 5/15/21 - 8/15/26) | | 5,001,789 | 5,000,000 |
| 11/10/20 due 2/10/21 (Collateralized by U.S. Treasury Obligations valued at $5,105,874, 1.50% - 2.75%, 11/15/22 - 8/15/26) | | 5,001,789 | 5,000,000 |
| 11/13/20 due 2/16/21 (Collateralized by U.S. Treasury Obligations valued at $2,044,261, 0.13%, 8/15/23) | | 2,000,739 | 2,000,000 |
| 11/17/20 due 2/17/21 (Collateralized by U.S. Treasury Obligations valued at $3,062,550, 1.50% - 1.75%, 7/15/22 - 8/15/26) | | 3,001,073 | 3,000,000 |
| 11/19/20 due 2/19/21 (Collateralized by U.S. Treasury Obligations valued at $10,235,786, 1.63% - 6.00%, 2/15/26) | | 10,003,578 | 10,000,000 |
| 11/23/20 due 2/23/21 (Collateralized by U.S. Treasury Obligations valued at $7,167,621, 1.63% - 6.00%, 2/15/26 - 9/30/26) | | 7,002,504 | 7,000,000 |
| 11/27/20 due 2/26/21 (Collateralized by U.S. Treasury Obligations valued at $5,115,920, 6.00%, 2/15/26) | | 5,001,769 | 5,000,000 |
| 12/30/20 due 3/30/21 (Collateralized by U.S. Treasury Obligations valued at $2,040,022, 1.88%, 2/28/22) | | 2,000,700 | 2,000,000 |
| 0.15%, dated: | | | |
| 10/13/20 due 1/13/21 (Collateralized by U.S. Treasury Obligations valued at $5,099,410, 2.13% - 6.00%, 6/30/21 - 2/15/26) | | 5,001,917 | 5,000,000 |
| 10/16/20 due 1/19/21 (Collateralized by U.S. Treasury Obligations valued at $5,112,208, 1.50% - 6.00%, 11/15/23 - 8/15/26) | | 5,001,979 | 5,000,000 |
| 12/30/20 due 3/30/21 (Collateralized by U.S. Treasury Obligations valued at $2,040,022, 1.88%, 2/28/22) | | 2,000,750 | 2,000,000 |
| 12/31/20 due 3/31/21 (Collateralized by U.S. Treasury Obligations valued at $5,099,340, 2.00%, 11/30/22) | | 5,001,875 | 5,000,000 |
| Mizuho Bank, Ltd. at 0.07%, dated 12/31/20 due 1/4/21 (Collateralized by U.S. Treasury Obligations valued at $5,108,947, 2.38%, 5/15/29) | | 5,000,039 | 5,000,000 |
| MUFG Securities EMEA PLC at: | | | |
| 0.07%, dated 12/31/20 due 1/4/21 (Collateralized by U.S. Treasury Obligations valued at $44,874,326, 1.38% - 2.25%, 4/30/21 - 5/15/25) | | 44,000,342 | 44,000,000 |
| 0.09%, dated 1/4/21 due 1/7/21(d) | | 19,000,190 | 19,000,000 |
| 0.1%, dated: | | | |
| 12/21/20 due 1/4/21 (Collateralized by U.S. Treasury Obligations valued at $22,472,210, 0.50% - 1.13%, 5/31/27 - 8/15/40) | | 22,000,856 | 22,000,000 |
| 12/22/20 due 1/5/21 (Collateralized by U.S. Treasury Obligations valued at $24,482,023, 2.00% - 2.75%, 5/31/21 - 7/31/23) | | 24,000,933 | 24,000,000 |
| 12/23/20 due 1/5/21 (Collateralized by U.S. Treasury Obligations valued at $7,148,539, 1.50% - 1.63%, 5/15/26 - 8/15/26) | | 7,000,253 | 7,000,000 |
| 12/28/20 due: | | | |
| 1/6/21 (Collateralized by U.S. Treasury Obligations valued at $16,333,124, 0.38% - 2.13%, 7/31/23 - 9/30/27) | | 16,000,400 | 16,000,000 |
| 1/7/21 (Collateralized by U.S. Treasury Obligations valued at $37,744,364, 0.25% - 2.75%, 9/30/22 - 2/28/25) | | 37,001,028 | 37,000,000 |
| 0.11%, dated: | | | |
| 12/29/20 due 1/8/21 (Collateralized by U.S. Treasury Obligations valued at $14,284,353, 1.75% - 1.88%, 2/28/22 - 5/15/22) | | 14,000,428 | 14,000,000 |
| 12/30/20 due 1/4/21 (Collateralized by U.S. Treasury Obligations valued at $5,101,322, 1.75%, 5/15/22) | | 5,000,076 | 5,000,000 |
| Natixis SA at: | | | |
| 0.1%, dated: | | | |
| 11/19/20 due 1/7/21 (Collateralized by U.S. Treasury Obligations valued at $10,201,398, 0.00% - 2.50%, 12/30/21 - 5/15/29) | | 10,001,694 | 10,000,000 |
| 11/25/20 due 1/7/21 (Collateralized by U.S. Treasury Obligations valued at $21,431,657, 0.00% - 3.00%, 5/31/21 - 11/15/49) | | 21,002,975 | 21,000,000 |
| 12/7/20 due 1/7/21 (Collateralized by U.S. Treasury Obligations valued at $10,200,887, 0.13% - 3.13%, 5/15/21 - 2/15/49) | | 10,000,861 | 10,000,000 |
| 0.11%, dated 11/16/20 due 1/7/21 (Collateralized by U.S. Treasury Obligations valued at $5,100,853, 0.13% - 4.75%, 2/15/21 - 2/15/37) | | 5,000,917 | 5,000,000 |
| Nomura Securities International, Inc. at 0.1%, dated 12/30/20 due 1/6/21 (Collateralized by U.S. Treasury Obligations valued at $13,260,185, 4.25% - 4.38%, 5/15/40 - 11/15/40) | | 13,000,253 | 13,000,000 |
| Norinchukin Bank at 0.15%, dated: | | | |
| 10/6/20 due 1/7/21 (Collateralized by U.S. Treasury Obligations valued at $8,162,928, 2.00%, 11/15/26) | | 8,003,100 | 8,000,000 |
| 10/7/20 due 1/8/21 (Collateralized by U.S. Treasury Obligations valued at $4,081,484, 2.38%, 5/15/27) | | 4,001,550 | 4,000,000 |
| 10/13/20 due 1/13/21 (Collateralized by U.S. Treasury Obligations valued at $5,101,691, 1.50%, 8/15/26) | | 5,001,917 | 5,000,000 |
| 11/13/20 due 2/12/21 (Collateralized by U.S. Treasury Obligations valued at $5,101,129, 2.75%, 6/30/25) | | 5,001,896 | 5,000,000 |
| 11/18/20 due 2/18/21 (Collateralized by U.S. Treasury Obligations valued at $5,100,930, 2.00%, 11/15/26) | | 5,001,917 | 5,000,000 |
| 11/19/20 due 2/19/21 (Collateralized by U.S. Treasury Obligations valued at $4,080,799, 1.50%, 8/15/26) | | 4,001,533 | 4,000,000 |
| 11/20/20 due 2/22/21 (Collateralized by U.S. Treasury Obligations valued at $7,141,239, 1.50%, 8/15/26) | | 7,002,742 | 7,000,000 |
| 11/24/20 due 2/24/21 (Collateralized by U.S. Treasury Obligations valued at $5,100,796, 2.75%, 6/30/25) | | 5,001,917 | 5,000,000 |
| 12/3/20 due 3/3/21 (Collateralized by U.S. Treasury Obligations valued at $3,060,440, 1.50%, 8/15/26) | | 3,001,125 | 3,000,000 |
| RBC Dominion Securities at: | | | |
| 0.09%, dated 12/2/20 due 1/4/21 (Collateralized by U.S. Treasury Obligations valued at $8,173,023, 0.38% - 4.38%, 1/31/22 - 8/15/50) | | 8,000,660 | 8,000,000 |
| 0.1%, dated 12/28/20 due 1/4/21 (Collateralized by U.S. Treasury Obligations valued at $5,100,187, 1.38% - 7.13%, 1/31/22 - 8/15/40) | | 5,000,097 | 5,000,000 |
| Societe Generale at 0.08%, dated 12/31/20 due 1/7/21 (Collateralized by U.S. Treasury Obligations valued at $10,226,472, 0.25% - 8.13%, 4/30/21 - 11/15/49) | | 10,000,156 | 10,000,000 |
| TOTAL U.S. TREASURY REPURCHASE AGREEMENT | | | |
| (Cost $966,000,000) | | | 966,000,000 |
| TOTAL INVESTMENT IN SECURITIES - 100.4% | | | |
| (Cost $6,239,441,700) | | | 6,239,441,700 |
| NET OTHER ASSETS (LIABILITIES) - (0.4)% | | | (26,527,842) |
| NET ASSETS - 100% | | | $6,212,913,858 |
Security Type Abbreviations
VRDN – VARIABLE RATE DEMAND NOTE (A debt instrument that is payable upon demand, either daily, weekly or monthly)
The date shown for securities represents the date when principal payments must be paid, taking into account any call options exercised by the issuer and any permissible maturity shortening features other than interest rate resets.
Legend
(a) Yield represents either the annualized yield at the date of purchase, or the stated coupon rate, or, for floating and adjustable rate securities, the rate at period end.
(b) Coupon rates for floating and adjustable rate securities reflect the rates in effect at period end.
(c) Private activity obligations whose interest is subject to the federal alternative minimum tax for individuals.
(d) Represents a forward settling transaction and therefore no collateral securities had been allocated as of period end. The agreement contemplated the delivery of U.S. Treasury Obligations as collateral on settlement date.
Investment Valuation
All investments are categorized as Level 2 under the Fair Value Hierarchy. The inputs or methodology used for valuing securities may not be an indication of the risk associated with investing in those securities. For more information on valuation inputs please refer to the Investment Valuation section in the accompanying Notes to Financial Statements.
Other Information
# Additional information on each counterparty to the repurchase agreement is as follows:
| Repurchase Agreement / Counterparty | Value |
| $369,835,000 due 1/04/21 at 0.08% | |
| BNY Mellon Capital Markets LLC | $30,224,000 |
| Bank Of America, N.A. | 32,127,000 |
| BofA Securities, Inc | 26,772,000 |
| Citibank NA | 8,924,000 |
| Citigroup Global Markets, Inc. | 22,310,000 |
| Credit Agricole CIB New York Branch | 2,231,000 |
| HSBC Securities (USA), Inc. | 4,462,000 |
| Nomura Securities International | 48,101,000 |
| RBC Dominion Securities, Inc. | 26,772,000 |
| Sumitomo Mitsu Bk Corp Ny (DI) | 118,161,000 |
| Sumitomo Mitsui Bk Corp (REPO) | 49,082,000 |
| Wells Fargo Securities LLC | 669,000 |
| | $369,835,000 |
See accompanying notes which are an integral part of the financial statements.
Financial Statements
Statement of Assets and Liabilities
| | | December 31, 2020 |
| Assets | | |
Investment in securities, at value (including repurchase agreements of $1,624,835,000) — See accompanying schedule:
Unaffiliated issuers (cost $6,239,441,700) | | $6,239,441,700 |
| Cash | | 918 |
| Receivable for fund shares sold | | 28,737,793 |
| Interest receivable | | 2,782,771 |
| Prepaid expenses | | 7,200 |
| Other receivables | | 54,646 |
| Total assets | | 6,271,025,028 |
| Liabilities | | |
| Payable for investments purchased | $43,993,423 | |
| Payable for fund shares redeemed | 13,317,752 | |
| Distributions payable | 2,167 | |
| Accrued management fee | 627,445 | |
| Other affiliated payables | 44,972 | |
| Other payables and accrued expenses | 125,411 | |
| Total liabilities | | 58,111,170 |
| Net Assets | | $6,212,913,858 |
| Net Assets consist of: | | |
| Paid in capital | | $6,212,653,183 |
| Total accumulated earnings (loss) | | 260,675 |
| Net Assets | | $6,212,913,858 |
| Net Asset Value and Maximum Offering Price | | |
| Initial Class: | | |
| Net Asset Value, offering price and redemption price per share ($2,255,440,390 ÷ 2,255,521,034 shares) | | $1.00 |
| Service Class: | | |
| Net Asset Value, offering price and redemption price per share ($1,641,206,764 ÷ 1,641,209,306 shares) | | $1.00 |
| Service Class 2: | | |
| Net Asset Value, offering price and redemption price per share ($221,427,824 ÷ 221,424,717 shares) | | $1.00 |
| Investor Class: | | |
| Net Asset Value, offering price and redemption price per share ($2,094,838,880 ÷ 2,094,307,009 shares) | | $1.00 |
See accompanying notes which are an integral part of the financial statements.
Statement of Operations
| | | Year ended December 31, 2020 |
| Investment Income | | |
| Interest | | $31,577,854 |
| Expenses | | |
| Management fee | $10,241,772 | |
| Transfer agent fees | 4,927,760 | |
| Distribution and service plan fees | 2,103,981 | |
| Accounting fees and expenses | 543,473 | |
| Custodian fees and expenses | 88,868 | |
| Independent trustees' fees and expenses | 20,746 | |
| Audit | 48,847 | |
| Legal | 12,910 | |
| Interest | 28,631 | |
| Miscellaneous | 20,420 | |
| Total expenses before reductions | 18,037,408 | |
| Expense reductions | (4,119,484) | |
| Total expenses after reductions | | 13,917,924 |
| Net investment income (loss) | | 17,659,930 |
| Realized and Unrealized Gain (Loss) | | |
| Net realized gain (loss) on: | | |
| Investment securities: | | |
| Unaffiliated issuers | | 72,133 |
| Total net realized gain (loss) | | 72,133 |
| Net increase in net assets resulting from operations | | $17,732,063 |
See accompanying notes which are an integral part of the financial statements.
Statement of Changes in Net Assets
| | Year ended December 31, 2020 | Year ended December 31, 2019 |
| Increase (Decrease) in Net Assets | | |
| Operations | | |
| Net investment income (loss) | $17,659,930 | $105,125,779 |
| Net realized gain (loss) | 72,133 | 15,927 |
| Net increase in net assets resulting from operations | 17,732,063 | 105,141,706 |
| Distributions to shareholders | (17,640,857) | (105,152,089) |
| Share transactions - net increase (decrease) | 690,608,448 | 179,101,881 |
| Total increase (decrease) in net assets | 690,699,654 | 179,091,498 |
| Net Assets | | |
| Beginning of period | 5,522,214,204 | 5,343,122,706 |
| End of period | $6,212,913,858 | $5,522,214,204 |
See accompanying notes which are an integral part of the financial statements.
Financial Highlights
VIP Government Money Market Portfolio Initial Class
| Years ended December 31, | 2020 | 2019 | 2018 | 2017 | 2016 |
| Selected Per–Share Data | | | | | |
| Net asset value, beginning of period | $1.00 | $1.00 | $1.00 | $1.00 | $1.00 |
| Income from Investment Operations | | | | | |
| Net investment income (loss) | .003 | .020 | .016 | .007 | .002 |
| Net realized and unrealized gain (loss) | – | – | – | – | – |
| Total from investment operations | .003 | .020 | .016 | .007 | .002 |
| Distributions from net investment income | (.003) | (.020) | (.016) | (.007) | (.002) |
| Total distributions | (.003) | (.020) | (.016) | (.007) | (.002) |
| Net asset value, end of period | $1.00 | $1.00 | $1.00 | $1.00 | $1.00 |
| Total ReturnA,B | .32% | 2.02% | 1.65% | .67% | .20% |
| Ratios to Average Net AssetsC | | | | | |
| Expenses before reductions | .24% | .26% | .26% | .26% | .25% |
| Expenses net of fee waivers, if any | .20% | .26% | .26% | .26% | .25% |
| Expenses net of all reductions | .20% | .26% | .26% | .26% | .25% |
| Net investment income (loss) | .29% | 1.99% | 1.65% | .68% | .21% |
| Supplemental Data | | | | | |
| Net assets, end of period (000 omitted) | $2,255,440 | $2,182,100 | $2,166,787 | $1,310,275 | $1,203,187 |
A Total returns do not reflect charges attributable to your insurance company's separate account. Inclusion of these charges would reduce the total returns shown.
B Total returns would have been lower if certain expenses had not been reduced during the applicable periods shown.
C Expense ratios reflect operating expenses of the class. Expenses before reductions do not reflect amounts reimbursed, waived, or reduced through arrangements with the investment adviser, brokerage services, or other offset arrangements, if applicable, and do not represent the amount paid by the class during periods when reimbursements, waivers or reductions occur.
See accompanying notes which are an integral part of the financial statements.
VIP Government Money Market Portfolio Service Class
| Years ended December 31, | 2020 | 2019 | 2018 | 2017 | 2016 |
| Selected Per–Share Data | | | | | |
| Net asset value, beginning of period | $1.00 | $1.00 | $1.00 | $1.00 | $1.00 |
| Income from Investment Operations | | | | | |
| Net investment income (loss) | .003 | .019 | .015 | .006 | .001 |
| Net realized and unrealized gain (loss) | – | – | – | – | – |
| Total from investment operations | .003 | .019 | .015 | .006 | .001 |
| Distributions from net investment income | (.003) | (.019) | (.015) | (.006) | (.001) |
| Total distributions | (.003) | (.019) | (.015) | (.006) | (.001) |
| Net asset value, end of period | $1.00 | $1.00 | $1.00 | $1.00 | $1.00 |
| Total ReturnA,B | .28% | 1.92% | 1.55% | .57% | .10% |
| Ratios to Average Net AssetsC | | | | | |
| Expenses before reductions | .34% | .36% | .36% | .36% | .35% |
| Expenses net of fee waivers, if any | .23% | .36% | .36% | .36% | .35% |
| Expenses net of all reductions | .23% | .36% | .36% | .36% | .35% |
| Net investment income (loss) | .26% | 1.89% | 1.55% | .58% | .11% |
| Supplemental Data | | | | | |
| Net assets, end of period (000 omitted) | $1,641,207 | $1,179,143 | $1,191,142 | $1,025,081 | $1,158,089 |
A Total returns do not reflect charges attributable to your insurance company's separate account. Inclusion of these charges would reduce the total returns shown.
B Total returns would have been lower if certain expenses had not been reduced during the applicable periods shown.
C Expense ratios reflect operating expenses of the class. Expenses before reductions do not reflect amounts reimbursed, waived, or reduced through arrangements with the investment adviser, brokerage services, or other offset arrangements, if applicable, and do not represent the amount paid by the class during periods when reimbursements, waivers or reductions occur.
See accompanying notes which are an integral part of the financial statements.
VIP Government Money Market Portfolio Service Class 2
| Years ended December 31, | 2020 | 2019 | 2018 | 2017 | 2016 |
| Selected Per–Share Data | | | | | |
| Net asset value, beginning of period | $1.00 | $1.00 | $1.00 | $1.00 | $1.00 |
| Income from Investment Operations | | | | | |
| Net investment income (loss) | .002 | .017 | .014 | .004 | –A |
| Net realized and unrealized gain (loss) | – | – | – | – | – |
| Total from investment operations | .002 | .017 | .014 | .004 | –A |
| Distributions from net investment income | (.002) | (.017) | (.014) | (.004) | –A |
| Total distributions | (.002) | (.017) | (.014) | (.004) | –A |
| Net asset value, end of period | $1.00 | $1.00 | $1.00 | $1.00 | $1.00 |
| Total ReturnB,C | .24% | 1.76% | 1.40% | .42% | .01% |
| Ratios to Average Net AssetsD | | | | | |
| Expenses before reductions | .49% | .51% | .51% | .51% | .50% |
| Expenses net of fee waivers, if any | .28% | .51% | .51% | .51% | .44% |
| Expenses net of all reductions | .28% | .51% | .51% | .51% | .44% |
| Net investment income (loss) | .21% | 1.74% | 1.40% | .43% | .02% |
| Supplemental Data | | | | | |
| Net assets, end of period (000 omitted) | $221,428 | $220,990 | $220,358 | $202,591 | $222,987 |
A Amount represents less than $.0005 per share.
B Total returns do not reflect charges attributable to your insurance company's separate account. Inclusion of these charges would reduce the total returns shown.
C Total returns would have been lower if certain expenses had not been reduced during the applicable periods shown.
D Expense ratios reflect operating expenses of the class. Expenses before reductions do not reflect amounts reimbursed, waived, or reduced through arrangements with the investment adviser, brokerage services, or other offset arrangements, if applicable, and do not represent the amount paid by the class during periods when reimbursements, waivers or reductions occur.
See accompanying notes which are an integral part of the financial statements.
VIP Government Money Market Portfolio Investor Class
| Years ended December 31, | 2020 | 2019 | 2018 | 2017 | 2016 |
| Selected Per–Share Data | | | | | |
| Net asset value, beginning of period | $1.00 | $1.00 | $1.00 | $1.00 | $1.00 |
| Income from Investment Operations | | | | | |
| Net investment income (loss) | .003 | .020 | .016 | .006 | .002 |
| Net realized and unrealized gain (loss) | – | – | – | – | – |
| Total from investment operations | .003 | .020 | .016 | .006 | .002 |
| Distributions from net investment income | (.003) | (.020) | (.016) | (.006) | (.002) |
| Total distributions | (.003) | (.020) | (.016) | (.006) | (.002) |
| Net asset value, end of period | $1.00 | $1.00 | $1.00 | $1.00 | $1.00 |
| Total ReturnA,B | .31% | 1.99% | 1.63% | .65% | .18% |
| Ratios to Average Net AssetsC | | | | | |
| Expenses before reductions | .26% | .28% | .28% | .28% | .27% |
| Expenses net of fee waivers, if any | .21% | .28% | .28% | .28% | .27% |
| Expenses net of all reductions | .21% | .28% | .28% | .28% | .27% |
| Net investment income (loss) | .28% | 1.97% | 1.62% | .65% | .19% |
| Supplemental Data | | | | | |
| Net assets, end of period (000 omitted) | $2,094,839 | $1,939,981 | $1,764,836 | $1,287,257 | $1,241,922 |
A Total returns do not reflect charges attributable to your insurance company's separate account. Inclusion of these charges would reduce the total returns shown.
B Total returns would have been lower if certain expenses had not been reduced during the applicable periods shown.
C Expense ratios reflect operating expenses of the class. Expenses before reductions do not reflect amounts reimbursed, waived, or reduced through arrangements with the investment adviser, brokerage services, or other offset arrangements, if applicable, and do not represent the amount paid by the class during periods when reimbursements, waivers or reductions occur.
See accompanying notes which are an integral part of the financial statements.
Notes to Financial Statements
For the period ended December 31, 2020
1. Organization.
VIP Government Money Market Portfolio (the Fund) is a fund of Variable Insurance Products Fund V (the Trust) and is authorized to issue an unlimited number of shares. The Trust is registered under the Investment Company Act of 1940, as amended (the 1940 Act), as an open-end management investment company organized as a Massachusetts business trust. Shares of the Fund may only be purchased by insurance companies for the purpose of funding variable annuity or variable life insurance contracts. The Fund offers the following classes of shares: Initial Class shares, Service Class shares, Service Class 2 shares and Investor Class shares. All classes have equal rights and voting privileges, except for matters affecting a single class.
Effective January 1, 2020:
Investment advisers Fidelity Investments Money Management, Inc., FMR Co., Inc., and Fidelity SelectCo, LLC, merged with and into Fidelity Management & Research Company. In connection with the merger transactions, the resulting, merged investment adviser was then redomiciled from Massachusetts to Delaware, changed its corporate structure from a corporation to a limited liability company, and changed its name to "Fidelity Management & Research Company LLC".
Broker-dealer Fidelity Distributors Corporation merged with and into Fidelity Investments Institutional Services Company, Inc. ("FIISC"). FIISC was then redomiciled from Massachusetts to Delaware, changed its corporate structure from a corporation to a limited liability company, and changed its name to "Fidelity Distributors Company LLC".
Fidelity Investments Institutional Operations Company, Inc. converted from a Massachusetts corporation to a Massachusetts LLC, and changed its name to "Fidelity Investments Institutional Operations Company LLC".
2. Significant Accounting Policies.
The Fund is an investment company and applies the accounting and reporting guidance of the Financial Accounting Standards Board (FASB) Accounting Standards Codification Topic 946 Financial Services - Investment Companies. The financial statements have been prepared in conformity with accounting principles generally accepted in the United States of America (GAAP), which require management to make certain estimates and assumptions at the date of the financial statements. Actual results could differ from those estimates. Subsequent events, if any, through the date that the financial statements were issued have been evaluated in the preparation of the financial statements. The following summarizes the significant accounting policies of the Fund:
Investment Valuation. The Fund categorizes the inputs to valuation techniques used to value its investments into a disclosure hierarchy consisting of three levels as shown below:
- Level 1 – quoted prices in active markets for identical investments
- Level 2 – other significant observable inputs (including quoted prices for similar investments, interest rates, prepayment speeds, etc.)
- Level 3 – unobservable inputs (including the Fund's own assumptions based on the best information available)
As permitted by compliance with certain conditions under Rule 2a-7 of the 1940 Act, securities are valued at amortized cost, which approximates fair value. The amortized cost of an instrument is determined by valuing it at its original cost and thereafter amortizing any discount or premium from its face value at a constant rate until maturity. Securities held by a money market fund are generally high quality and liquid; however, they are reflected as Level 2 because the inputs used to determine fair value are not quoted prices in an active market.
Investment Transactions and Income. Gains and losses on securities sold are determined on the basis of identified cost and include proceeds received from litigation. Interest income is accrued as earned and includes coupon interest and amortization of premium and accretion of discount on debt securities as applicable. The principal amount on inflation-indexed securities is periodically adjusted to the rate of inflation and interest is accrued based on the principal amount. The adjustments to principal due to inflation are reflected as increases or decreases to Interest in the accompanying Statement of Operations.
Class Allocations and Expenses. Investment income, realized and unrealized capital gains and losses, common expenses of the Fund, and certain fund-level expense reductions, if any, are allocated daily on a pro-rata basis to each class based on the relative net assets of each class to the total net assets of the Fund. Each class differs with respect to transfer agent and distribution and service plan fees incurred. Certain expense reductions may also differ by class. For the reporting period, the allocated portion of income and expenses to each class as a percent of its average net assets may vary due to the timing of recording these transactions in relation to fluctuating net assets of the classes. Expenses directly attributable to a fund are charged to that fund. Expenses attributable to more than one fund are allocated among the respective funds on the basis of relative net assets or other appropriate methods. Expense estimates are accrued in the period to which they relate and adjustments are made when actual amounts are known.
Deferred Trustee Compensation. Under a Deferred Compensation Plan (the Plan) for certain Funds, certain independent Trustees have elected to defer receipt of a portion of their annual compensation. Deferred amounts are invested in affiliated mutual funds, are marked-to-market and remain in a fund until distributed in accordance with the Plan. The investment of deferred amounts and the offsetting payable to the Trustees presented below are included in the accompanying Statement of Assets and Liabilities in other receivables and other payables and accrued expenses, as applicable.
| VIP Government Money Market Portfolio | $54,646 |
Income Tax Information and Distributions to Shareholders. Each year, the Fund intends to qualify as a regulated investment company under Subchapter M of the Internal Revenue Code, including distributing substantially all of its taxable income and realized gains. As a result, no provision for U.S. Federal income taxes is required. As of December 31, 2020, the Fund did not have any unrecognized tax benefits in the financial statements; nor is the Fund aware of any tax positions for which it is reasonably possible that the total amounts of unrecognized tax benefits will significantly change in the next twelve months. The Fund files a U.S. federal tax return, in addition to state and local tax returns as required. The Fund's federal income tax returns are subject to examination by the Internal Revenue Service (IRS) for a period of three fiscal years after they are filed. State and local tax returns may be subject to examination for an additional fiscal year depending on the jurisdiction.
Distributions are declared and recorded daily and paid monthly from net investment income. Distributions from realized gains, if any, are declared and recorded on the ex-dividend date. Income and capital gain distributions are declared separately for each class. Income and capital gain distributions are determined in accordance with income tax regulations, which may differ from GAAP.
Capital accounts within the financial statements are adjusted for permanent book-tax differences. These adjustments have no impact on net assets or the results of operations. Capital accounts are not adjusted for temporary book-tax differences which will reverse in a subsequent period.
Book-tax differences are primarily due to deferred Trustees compensation and losses deferred due to wash sales.
As of period end, the cost and unrealized appreciation (depreciation) in securities for federal income tax purposes were as follows:
| Gross unrealized appreciation | $– |
| Gross unrealized depreciation | – |
| Net unrealized appreciation (depreciation) | $– |
| Tax Cost | $6,239,441,700 |
The tax-based components of distributable earnings as of period end were as follows:
| Undistributed ordinary income | $305,789 |
| Undistributed long-term capital gain | $8,994 |
The tax character of distributions paid was as follows:
| | December 31, 2020 | December 31, 2019 |
| Ordinary Income | $17,640,857 | $ 105,152,089 |
Repurchase Agreements. Pursuant to an Exemptive Order issued by the Securities and Exchange Commission (the SEC), the Fund along with other registered investment companies having management contracts with Fidelity Management & Research Company LLC (FMR), or other affiliated entities of FMR, are permitted to transfer uninvested cash balances into joint trading accounts which are then invested in repurchase agreements. The Fund may also invest directly with institutions in repurchase agreements. Repurchase agreements may be collateralized by cash or government securities. Upon settlement date, collateral is held in segregated accounts with custodian banks and may be obtained in the event of a default of the counterparty. The Fund monitors, on a daily basis, the value of the collateral to ensure it is at least equal to the principal amount of the repurchase agreement (including accrued interest). In the event of a default by the counterparty, realization of the collateral proceeds could be delayed, during which time the value of the collateral may decline.
Reverse Repurchase Agreements. To enhance its yield, the Fund may enter into reverse repurchase transactions under master repurchase agreements whereby the Fund delivers securities to a counterparty in return for cash and agrees to repurchase those securities at a future date and agreed upon price. During the period that reverse repurchase transactions are outstanding, the Fund identifies the securities as pledged in its records with an initial value at least equal to its principal obligation under the agreement. The cash proceeds received by the Fund may be invested in other securities. To the extent cash proceeds received from the counterparty exceed the value of the securities delivered, the counterparty may request additional collateral from the Fund. If the counterparty defaults on its obligation, because of insolvency or other reasons, the Fund could experience delays and costs in recovering the securities delivered. Information regarding securities delivered under a reverse repurchase agreement, if any, is included at the end of the Fund's Schedule of Investments and the cash proceeds are recorded as a liability in the accompanying Statement of Assets and Liabilities. The Fund continues to receive interest and dividend payments on the securities delivered during the term of the reverse repurchase agreement. During the period, the average principal balance of reverse repurchase transactions was $8,031,855 and the weighted average interest rate was 1.26% with payments included in the Statement of Operations as a component of interest expense. At period end, there were no reverse repurchase agreements outstanding.
3. Fees and Other Transactions with Affiliates.
Management Fee. Fidelity Management & Research Company LLC (the investment adviser) and its affiliates provide the Fund with investment management related services for which the Fund pays a monthly management fee. The management fee is calculated on the basis of a group fee rate plus a total income-based component. The annualized group fee rate averaged .10% during the period. The group fee rate is based upon the monthly average net assets of a group of registered investment companies with which the investment adviser has management contracts. The group fee rate decreases as assets under management increase and increases as assets under management decrease. The total income-based component is comprised of an income-based fee and an asset-based fee, and is calculated according to a graduated schedule providing for different rates based on the Fund's gross annualized yield. The rate increases as the Fund's gross yield increases.
During the period the income-based portion of this fee was $3,749,374 or an annual rate of .06% of the Fund's average net assets. For the reporting period, the Fund's total annual management fee rate was .16% of the Fund's average net assets.
Distribution and Service Plan Fees. In accordance with Rule 12b-1 of the 1940 Act, the Fund has adopted separate 12b-1 Plans for each Service Class of shares. Each Service Class pays Fidelity Distributors Company LLC (FDC), an affiliate of the investment adviser, a service fee. For the period, the service fee is based on an annual rate of .10% of Service Class' average net assets and .25% of Service Class 2's average net assets.
For the period, total fees, all of which were re-allowed to insurance companies for the distribution of shares and providing shareholder support services, were as follows:
| Service Class | $1,536,329 |
| Service Class 2 | 567,652 |
| | $2,103,981 |
During the period, the investment adviser or its affiliates waived a portion of these fees.
Transfer Agent Fees. Fidelity Investments Institutional Operations Company LLC (FIIOC), an affiliate of the investment adviser, is the Fund's transfer, dividend disbursing, and shareholder servicing agent. FIIOC receives an asset-based fee with respect to each class. Each class pays a fee for transfer agent services, typesetting and printing and mailing of shareholder reports, excluding mailing of proxy statements. For the period, transfer agent fees for each class were as follows:
| | Amount | % of Class-Level Average Net Assets |
| Initial Class | $1,697,798 | .07 |
| Service Class | 1,044,704 | .07 |
| Service Class 2 | 154,401 | .07 |
| Investor Class | 2,030,857 | .09 |
| | $4,927,760 | |
During the period, the investment adviser or its affiliates waived a portion of these fees.
Accounting Fees. Fidelity Service Company, Inc. (FSC), an affiliate of the investment adviser, maintains the Fund's accounting records. The accounting fee is based on the level of average net assets for each month. For the period, the fees were equivalent to the following annual rates:
| | % of Average Net Assets |
| VIP Government Money Market Portfolio | .01 |
Interfund Trades. Funds may purchase from or sell securities to other Fidelity Funds under procedures adopted by the Board. The procedures have been designed to ensure these interfund trades are executed in accordance with Rule 17a-7 of the 1940 Act.
4. Expense Reductions.
The investment adviser or its affiliates voluntarily agreed to waive certain fees in order to avoid a negative yield. Such arrangements may be discontinued by the investment adviser at any time. For the period, the amount of the waiver for each class was as follows:
| Initial Class | $931,872 |
| Service Class | 1,609,677 |
| Service Class 2 | 469,901 |
| Investor Class | 1,092,998 |
Through arrangements with the Fund's custodian, credits realized as a result of certain uninvested cash balances were used to reduce the Fund's expenses. During the period, custodian credits reduced the Fund's expenses by $3,887.
In addition, during the period the investment adviser or an affiliate reimbursed and/or waived a portion of fund-level operating expenses in the amount of $11,149.
5. Distributions to Shareholders.
Distributions to shareholders of each class were as follows:
| | Year ended
December 31, 2020 | Year ended
December 31, 2019 |
| Distributions to shareholders | | |
| Initial Class | $7,372,653 | $43,645,773 |
| Service Class | 3,519,212 | 22,270,389 |
| Service Class 2 | 526,658 | 3,900,525 |
| Investor Class | 6,222,334 | 35,335,402 |
| Total | $17,640,857 | $105,152,089 |
6. Share Transactions.
Transactions for each class of shares at a $1.00 per share were as follows:
| | Shares | Shares | Dollars | Dollars |
| | Year ended December 31, 2020 | Year ended December 31, 2019 | Year ended December 31, 2020 | Year ended December 31, 2019 |
| Initial Class | | | | |
| Shares sold | 2,039,607,272 | 1,556,350,970 | $2,039,607,272 | $1,556,350,970 |
| Reinvestment of distributions | 7,372,650 | 43,645,773 | 7,372,650 | 43,645,773 |
| Shares redeemed | (1,973,665,661) | (1,584,662,915) | (1,973,665,661) | (1,584,662,915) |
| Net increase (decrease) | 73,314,261 | 15,333,828 | $73,314,261 | $15,333,828 |
| Service Class | | | | |
| Shares sold | 1,784,372,922 | 1,145,541,728 | $1,784,372,922 | $1,145,541,728 |
| Reinvestment of distributions | 3,518,317 | 22,270,389 | 3,518,317 | 22,270,389 |
| Shares redeemed | (1,325,842,669) | (1,179,795,203) | (1,325,842,669) | (1,179,795,203) |
| Net increase (decrease) | 462,048,570 | (11,983,086) | $462,048,570 | $(11,983,086) |
| Service Class 2 | | | | |
| Shares sold | 161,048,740 | 113,971,218 | $161,048,740 | $113,971,218 |
| Reinvestment of distributions | 526,538 | 3,900,525 | 526,538 | 3,900,525 |
| Shares redeemed | (161,139,855) | (117,237,342) | (161,139,855) | (117,237,342) |
| Net increase (decrease) | 435,423 | 634,401 | $435,423 | $634,401 |
| Investor Class | | | | |
| Shares sold | 1,230,062,138 | 537,909,344 | $1,230,062,138 | $537,909,344 |
| Reinvestment of distributions | 6,219,791 | 35,335,047 | 6,219,791 | 35,335,047 |
| Shares redeemed | (1,081,471,735) | (398,127,653) | (1,081,471,735) | (398,127,653) |
| Net increase (decrease) | 154,810,194 | 175,116,738 | $154,810,194 | $175,116,738 |
7. Other.
The Fund's organizational documents provide former and current trustees and officers with a limited indemnification against liabilities arising in connection with the performance of their duties to the Fund. In the normal course of business, the Fund may also enter into contracts that provide general indemnifications. The Fund's maximum exposure under these arrangements is unknown as this would be dependent on future claims that may be made against the Fund. The risk of material loss from such claims is considered remote.
At the end of the period, the investment adviser or its affiliates were the owners of record of 37% of the total outstanding shares of the Fund and two otherwise unaffiliated shareholders were the owners of record of 25% of the total outstanding shares of the Fund.
8. Coronavirus (COVID-19) Pandemic.
An outbreak of COVID-19 first detected in China during December 2019 has since spread globally and was declared a pandemic by the World Health Organization during March 2020. Developments that disrupt global economies and financial markets, such as the COVID-19 pandemic, may magnify factors that affect the Fund's performance.
Report of Independent Registered Public Accounting Firm
To the Board of Trustees of Variable Insurance Products Fund V and Shareholders of VIP Government Money Market Portfolio
Opinion on the Financial Statements
We have audited the accompanying statement of assets and liabilities, including the schedule of investments, of VIP Government Money Market Portfolio (one of the funds constituting Variable Insurance Products Fund V, referred to hereafter as the “Fund”) as of December 31, 2020, the related statement of operations for the year ended December 31, 2020, the statement of changes in net assets for each of the two years in the period ended December 31, 2020, including the related notes, and the financial highlights for each of the five years in the period ended December 31, 2020 (collectively referred to as the “financial statements”). In our opinion, the financial statements present fairly, in all material respects, the financial position of the Fund as of December 31, 2020, the results of its operations for the year then ended, the changes in its net assets for each of the two years in the period ended December 31, 2020 and the financial highlights for each of the five years in the period ended December 31, 2020 in conformity with accounting principles generally accepted in the United States of America.
Basis for Opinion
These financial statements are the responsibility of the Fund’s management. Our responsibility is to express an opinion on the Fund’s financial statements based on our audits. We are a public accounting firm registered with the Public Company Accounting Oversight Board (United States) (PCAOB) and are required to be independent with respect to the Fund in accordance with the U.S. federal securities laws and the applicable rules and regulations of the Securities and Exchange Commission and the PCAOB.
We conducted our audits of these financial statements in accordance with the standards of the PCAOB. Those standards require that we plan and perform the audit to obtain reasonable assurance about whether the financial statements are free of material misstatement, whether due to error or fraud.
Our audits included performing procedures to assess the risks of material misstatement of the financial statements, whether due to error or fraud, and performing procedures that respond to those risks. Such procedures included examining, on a test basis, evidence regarding the amounts and disclosures in the financial statements. Our audits also included evaluating the accounting principles used and significant estimates made by management, as well as evaluating the overall presentation of the financial statements. Our procedures included confirmation of securities owned as of December 31, 2020 by correspondence with the custodians and brokers; when replies were not received from brokers, we performed other auditing procedures. We believe that our audits provide a reasonable basis for our opinion.
/s/ PricewaterhouseCoopers LLP
Boston, Massachusetts
February 9, 2021
We have served as the auditor of one or more investment companies in the Fidelity group of funds since 1932.
Trustees and Officers
The Trustees, Members of the Advisory Board (if any), and officers of the trust and fund, as applicable, are listed below. The Board of Trustees governs the fund and is responsible for protecting the interests of shareholders. The Trustees are experienced executives who meet periodically throughout the year to oversee the fund's activities, review contractual arrangements with companies that provide services to the fund, oversee management of the risks associated with such activities and contractual arrangements, and review the fund's performance. Each of the Trustees oversees 280 funds.
The Trustees hold office without limit in time except that (a) any Trustee may resign; (b) any Trustee may be removed by written instrument, signed by at least two-thirds of the number of Trustees prior to such removal; (c) any Trustee who requests to be retired or who has become incapacitated by illness or injury may be retired by written instrument signed by a majority of the other Trustees; and (d) any Trustee may be removed at any special meeting of shareholders by a two-thirds vote of the outstanding voting securities of the trust. Each Trustee who is not an interested person (as defined in the 1940 Act) of the trust and the fund is referred to herein as an Independent Trustee. Each Independent Trustee shall retire not later than the last day of the calendar year in which his or her 75th birthday occurs. The Independent Trustees may waive this mandatory retirement age policy with respect to individual Trustees. Officers and Advisory Board Members hold office without limit in time, except that any officer or Advisory Board Member may resign or may be removed by a vote of a majority of the Trustees at any regular meeting or any special meeting of the Trustees. Except as indicated, each individual has held the office shown or other offices in the same company for the past five years.
The fund’s Statement of Additional Information (SAI) includes more information about the Trustees. To request a free copy, call Fidelity at 1-877-208-0098.
Experience, Skills, Attributes, and Qualifications of the Trustees. The Governance and Nominating Committee has adopted a statement of policy that describes the experience, qualifications, attributes, and skills that are necessary and desirable for potential Independent Trustee candidates (Statement of Policy). The Board believes that each Trustee satisfied at the time he or she was initially elected or appointed a Trustee, and continues to satisfy, the standards contemplated by the Statement of Policy. The Governance and Nominating Committee also engages professional search firms to help identify potential Independent Trustee candidates who have the experience, qualifications, attributes, and skills consistent with the Statement of Policy. From time to time, additional criteria based on the composition and skills of the current Independent Trustees, as well as experience or skills that may be appropriate in light of future changes to board composition, business conditions, and regulatory or other developments, have also been considered by the professional search firms and the Governance and Nominating Committee. In addition, the Board takes into account the Trustees' commitment and participation in Board and committee meetings, as well as their leadership of standing and ad hoc committees throughout their tenure.
In determining that a particular Trustee was and continues to be qualified to serve as a Trustee, the Board has considered a variety of criteria, none of which, in isolation, was controlling. The Board believes that, collectively, the Trustees have balanced and diverse experience, qualifications, attributes, and skills, which allow the Board to operate effectively in governing the fund and protecting the interests of shareholders. Information about the specific experience, skills, attributes, and qualifications of each Trustee, which in each case led to the Board's conclusion that the Trustee should serve (or continue to serve) as a trustee of the fund, is provided below.
Board Structure and Oversight Function. Abigail P. Johnson is an interested person and currently serves as Chairman. The Trustees have determined that an interested Chairman is appropriate and benefits shareholders because an interested Chairman has a personal and professional stake in the quality and continuity of services provided to the fund. Independent Trustees exercise their informed business judgment to appoint an individual of their choosing to serve as Chairman, regardless of whether the Trustee happens to be independent or a member of management. The Independent Trustees have determined that they can act independently and effectively without having an Independent Trustee serve as Chairman and that a key structural component for assuring that they are in a position to do so is for the Independent Trustees to constitute a substantial majority for the Board. The Independent Trustees also regularly meet in executive session. Arthur E. Johnson serves as Chairman of the Independent Trustees and as such (i) acts as a liaison between the Independent Trustees and management with respect to matters important to the Independent Trustees and (ii) with management prepares agendas for Board meetings.
Fidelity® funds are overseen by different Boards of Trustees. The fund's Board oversees Fidelity's investment-grade bond, money market, asset allocation and certain equity funds, and other Boards oversee Fidelity's high income and other equity funds. The asset allocation funds may invest in Fidelity® funds that are overseen by such other Boards. The use of separate Boards, each with its own committee structure, allows the Trustees of each group of Fidelity® funds to focus on the unique issues of the funds they oversee, including common research, investment, and operational issues. On occasion, the separate Boards establish joint committees to address issues of overlapping consequences for the Fidelity® funds overseen by each Board.
The Trustees operate using a system of committees to facilitate the timely and efficient consideration of all matters of importance to the Trustees, the fund, and fund shareholders and to facilitate compliance with legal and regulatory requirements and oversight of the fund's activities and associated risks. The Board, acting through its committees, has charged FMR and its affiliates with (i) identifying events or circumstances the occurrence of which could have demonstrably adverse effects on the fund's business and/or reputation; (ii) implementing processes and controls to lessen the possibility that such events or circumstances occur or to mitigate the effects of such events or circumstances if they do occur; and (iii) creating and maintaining a system designed to evaluate continuously business and market conditions in order to facilitate the identification and implementation processes described in (i) and (ii) above. Because the day-to-day operations and activities of the fund are carried out by or through FMR, its affiliates, and other service providers, the fund's exposure to risks is mitigated but not eliminated by the processes overseen by the Trustees. While each of the Board's committees has responsibility for overseeing different aspects of the fund's activities, oversight is exercised primarily through the Operations and Audit Committees. In addition, an ad hoc Board committee of Independent Trustees has worked with FMR to enhance the Board's oversight of investment and financial risks, legal and regulatory risks, technology risks, and operational risks, including the development of additional risk reporting to the Board. The Operations Committee also worked and continues to work with FMR to enhance the stress tests required under SEC regulations for money market funds. Appropriate personnel, including but not limited to the fund's Chief Compliance Officer (CCO), FMR's internal auditor, the independent accountants, the fund's Treasurer and portfolio management personnel, make periodic reports to the Board's committees, as appropriate, including an annual review of Fidelity's risk management program for the Fidelity® funds. The responsibilities of each standing committee, including their oversight responsibilities, are described further under "Standing Committees of the Trustees."
Interested Trustees*:
Correspondence intended for a Trustee who is an interested person may be sent to Fidelity Investments, 245 Summer Street, Boston, Massachusetts 02210.
Name, Year of Birth; Principal Occupations and Other Relevant Experience+
Abigail P. Johnson (1961)
Year of Election or Appointment: 2009
Trustee
Chairman of the Board of Trustees
Ms. Johnson also serves as Trustee of other Fidelity® funds. Ms. Johnson serves as Chairman (2016-present), Chief Executive Officer (2014-present), and Director (2007-present) of FMR LLC (diversified financial services company), President of Fidelity Financial Services (2012-present) and President of Personal, Workplace and Institutional Services (2005-present). Ms. Johnson is Chairman and Director of Fidelity Management & Research Company LLC (investment adviser firm, 2011-present). Previously, Ms. Johnson served as Chairman and Director of FMR Co., Inc. (investment adviser firm, 2011-2019), Vice Chairman (2007-2016) and President (2013-2016) of FMR LLC, President and a Director of Fidelity Management & Research Company (2001-2005), a Trustee of other investment companies advised by Fidelity Management & Research Company, Fidelity Investments Money Management, Inc. (investment adviser firm), and FMR Co., Inc. (2001-2005), Senior Vice President of the Fidelity® funds (2001-2005), and managed a number of Fidelity® funds. Ms. Abigail P. Johnson and Mr. Arthur E. Johnson are not related.
Jennifer Toolin McAuliffe (1959)
Year of Election or Appointment: 2016
Trustee
Ms. McAuliffe also serves as Trustee of other Fidelity® funds. Previously, Ms. McAuliffe served as Co-Head of Fixed Income of Fidelity Investments Limited (now known as FIL Limited (FIL)) (diversified financial services company), Director of Research for FIL’s credit and quantitative teams in London, Hong Kong and Tokyo and Director of Research for taxable and municipal bonds at Fidelity Investments Money Management, Inc. Ms. McAuliffe previously served as a member of the Advisory Board of certain Fidelity® funds (2016). Ms. McAuliffe was previously a lawyer at Ropes & Gray LLP and currently serves as director or trustee of several not-for-profit entities.
* Determined to be an “Interested Trustee” by virtue of, among other things, his or her affiliation with the trust or various entities under common control with FMR.
+ The information includes the Trustee's principal occupation during the last five years and other information relating to the experience, attributes, and skills relevant to the Trustee's qualifications to serve as a Trustee, which led to the conclusion that the Trustee should serve as a Trustee for the fund.
Independent Trustees:
Correspondence intended for an Independent Trustee may be sent to Fidelity Investments, P.O. Box 55235, Boston, Massachusetts 02205-5235.
Name, Year of Birth; Principal Occupations and Other Relevant Experience+
Elizabeth S. Acton (1951)
Year of Election or Appointment: 2013
Trustee
Ms. Acton also serves as Trustee of other Fidelity® funds. Prior to her retirement, Ms. Acton served as Executive Vice President, Finance (2011-2012), Executive Vice President, Chief Financial Officer (2002-2011) and Treasurer (2004-2005) of Comerica Incorporated (financial services). Prior to joining Comerica, Ms. Acton held a variety of positions at Ford Motor Company (1983-2002), including Vice President and Treasurer (2000-2002) and Executive Vice President and Chief Financial Officer of Ford Motor Credit Company (1998-2000). Ms. Acton currently serves as a member of the Board and Audit and Finance Committees of Beazer Homes USA, Inc. (homebuilding, 2012-present). Ms. Acton previously served as a member of the Advisory Board of certain Fidelity® funds (2013-2016).
Ann E. Dunwoody (1953)
Year of Election or Appointment: 2018
Trustee
General Dunwoody also serves as Trustee of other Fidelity® funds. General Dunwoody (United States Army, Retired) was the first woman in U.S. military history to achieve the rank of four-star general and prior to her retirement in 2012 held a variety of positions within the U.S. Army, including Commanding General, U.S. Army Material Command (2008-2012). General Dunwoody currently serves as President of First to Four LLC (leadership and mentoring services, 2012-present), a member of the Board and Nomination and Corporate Governance Committees of Kforce Inc. (professional staffing services, 2016-present) and a member of the Board of Automattic Inc. (software engineering, 2018-present). Previously, General Dunwoody served as a member of the Advisory Board and Nominating and Corporate Governance Committee of L3 Technologies, Inc. (communication, electronic, sensor and aerospace systems, 2013-2019) and a member of the Board and Audit and Sustainability and Corporate Responsibility Committees of Republic Services, Inc. (waste collection, disposal and recycling, 2013-2016). Ms. Dunwoody also serves on several boards for non-profit organizations, including as a member of the Board, Chair of the Nomination and Governance Committee and a member of the Audit Committee of Logistics Management Institute (consulting non-profit, 2012-present), a member of the Council of Trustees for the Association of the United States Army (advocacy non-profit, 2013-present), a member of the Board of Florida Institute of Technology (2015-present) and a member of the Board of ThanksUSA (military family education non-profit, 2014-present). General Dunwoody previously served as a member of the Advisory Board of certain Fidelity® funds (2018).
John Engler (1948)
Year of Election or Appointment: 2014
Trustee
Mr. Engler also serves as Trustee of other Fidelity® funds. Previously, Mr. Engler served as Governor of Michigan (1991-2003), President of the Business Roundtable (2011-2017) and interim President of Michigan State University (2018-2019). Mr. Engler currently serves as a member of the Board of K12 Inc. (technology-based education company, 2012-present). Previously, Mr. Engler served as a member of the Board of Universal Forest Products (manufacturer and distributor of wood and wood-alternative products, 2003-2019) and Trustee of The Munder Funds (2003-2014). Mr. Engler previously served as a member of the Advisory Board of certain Fidelity® funds (2014-2016).
Robert F. Gartland (1951)
Year of Election or Appointment: 2010
Trustee
Mr. Gartland also serves as Trustee of other Fidelity® funds. Prior to his retirement, Mr. Gartland held a variety of positions at Morgan Stanley (financial services, 1979-2007), including Managing Director (1987-2007) and Chase Manhattan Bank (1975-1978). Mr. Gartland previously served as Chairman and an investor in Gartland & Mellina Group Corp. (consulting, 2009-2019), as a member of the Board of National Securities Clearing Corporation (1993-1996) and as Chairman of TradeWeb (2003-2004).
Arthur E. Johnson (1947)
Year of Election or Appointment: 2008
Trustee
Chairman of the Independent Trustees
Mr. Johnson also serves as Trustee of other Fidelity® funds. Prior to his retirement, Mr. Johnson served as Senior Vice President of Corporate Strategic Development of Lockheed Martin Corporation (defense contractor, 1999-2009). Mr. Johnson currently serves as a member of the Board of Booz Allen Hamilton (management consulting, 2011-present). Mr. Johnson previously served as a member of the Board of Eaton Corporation plc (diversified power management, 2009-2019) and a member of the Board of AGL Resources, Inc. (holding company, 2002-2016). Mr. Johnson previously served as Vice Chairman (2015-2018) of the Independent Trustees of certain Fidelity® funds. Mr. Arthur E. Johnson is not related to Ms. Abigail P. Johnson.
Michael E. Kenneally (1954)
Year of Election or Appointment: 2009
Trustee
Vice Chairman of the Independent Trustees
Mr. Kenneally also serves as Trustee of other Fidelity® funds. Prior to his retirement, Mr. Kenneally served as Chairman and Global Chief Executive Officer of Credit Suisse Asset Management and Executive Vice President and Chief Investment Officer of Bank of America Corporation. Earlier roles at Bank of America included Director of Research, Senior Portfolio Manager for various institutional equity accounts and mutual funds and Portfolio Manager for a number of institutional fixed-income clients. Mr. Kenneally began his career as a Research Analyst in 1983 and was awarded the Chartered Financial Analyst (CFA) designation in 1991.
Marie L. Knowles (1946)
Year of Election or Appointment: 2001
Trustee
Ms. Knowles also serves as Trustee of other Fidelity® funds. Prior to her retirement, Ms. Knowles held several positions at Atlantic Richfield Company (diversified energy), including Executive Vice President and Chief Financial Officer (1996-2000), Senior Vice President (1993-1996) and President of ARCO Transportation Company (pipeline and tanker operations, 1993-1996). Ms. Knowles currently serves as a member of the Board of McKesson Corporation (healthcare service, since 2002), a member of the Board of the Santa Catalina Island Company (real estate, 2009-present), a member of the Investment Company Institute Board of Governors and a member of the Governing Council of the Independent Directors Council (2014-present). Ms. Knowles also serves as a member of the Advisory Board for the School of Engineering of the University of Southern California. Ms. Knowles previously served as Chairman (2015-2018) and Vice Chairman (2012-2015) of the Independent Trustees of certain Fidelity® funds.
Mark A. Murray (1954)
Year of Election or Appointment: 2016
Trustee
Mr. Murray also serves as Trustee of other Fidelity® funds. Previously, Mr. Murray served as Co-Chief Executive Officer (2013-2016), President (2006-2013) and Vice Chairman (2013-2020) of Meijer, Inc. Mr. Murray serves as a member of the Board and Nuclear Review and Public Policy and Responsibility Committees of DTE Energy Company (diversified energy company, 2009-present) and a member of the Board and Audit Committee and Chairman of the Nominating and Corporate Governance Committee of Universal Forest Products, Inc. (manufacturer and distributor of wood and wood-alternative products, 2004-2016). Mr. Murray previously served as a member of the Board of Spectrum Health (not-for-profit health system, 2015-2019). Mr. Murray also serves as a member of the Board of many community and professional organizations. Mr. Murray previously served as a member of the Advisory Board of certain Fidelity® funds (2016).
+ The information includes the Trustee's principal occupation during the last five years and other information relating to the experience, attributes, and skills relevant to the Trustee's qualifications to serve as a Trustee, which led to the conclusion that the Trustee should serve as a Trustee for the fund.
Advisory Board Members and Officers:
Correspondence intended for an officer may be sent to Fidelity Investments, 245 Summer Street, Boston, Massachusetts 02210. Officers appear below in alphabetical order.
Name, Year of Birth; Principal Occupation
Craig S. Brown (1977)
Year of Election or Appointment: 2019
Assistant Treasurer
Mr. Brown also serves as Assistant Treasurer of other funds. Mr. Brown is an employee of Fidelity Investments (2013-present).
John J. Burke III (1964)
Year of Election or Appointment: 2018
Chief Financial Officer
Mr. Burke also serves as Chief Financial Officer of other funds. Mr. Burke serves as Head of Investment Operations for Fidelity Fund and Investment Operations (2018-present) and is an employee of Fidelity Investments (1998-present). Previously Mr. Burke served as head of Asset Management Investment Operations (2012-2018).
David J. Carter (1973)
Year of Election or Appointment: 2020
Assistant Secretary
Mr. Carter also serves as Assistant Secretary of other funds. Mr. Carter serves as Vice President, Associate General Counsel (2010-present) and is an employee of Fidelity Investments (2005-present).
Jonathan Davis (1968)
Year of Election or Appointment: 2010
Assistant Treasurer
Mr. Davis also serves as Assistant Treasurer of other funds. Mr. Davis serves as Assistant Treasurer of FMR Capital, Inc. (2017-present) and is an employee of Fidelity Investments. Previously, Mr. Davis served as Vice President and Associate General Counsel of FMR LLC (diversified financial services company, 2003-2010).
Laura M. Del Prato (1964)
Year of Election or Appointment: 2018
President and Treasurer
Ms. Del Prato also serves as an officer of other funds. Ms. Del Prato is an employee of Fidelity Investments (2017-present). Previously, Ms. Del Prato served as President and Treasurer of The North Carolina Capital Management Trust: Cash Portfolio and Term Portfolio (2018-2020). Prior to joining Fidelity Investments, Ms. Del Prato served as a Managing Director and Treasurer of the JPMorgan Mutual Funds (2014-2017). Prior to JPMorgan, Ms. Del Prato served as a partner at Cohen Fund Audit Services (accounting firm, 2012-2013) and KPMG LLP (accounting firm, 2004-2012).
Colm A. Hogan (1973)
Year of Election or Appointment: 2016
Assistant Treasurer
Mr. Hogan also serves as an officer of other funds. Mr. Hogan serves as Assistant Treasurer of FMR Capital, Inc. (2017-present) and is an employee of Fidelity Investments (2005-present). Previously, Mr. Hogan served as Deputy Treasurer of certain Fidelity® funds (2016-2020) and Assistant Treasurer of certain Fidelity® funds (2016-2018).
Cynthia Lo Bessette (1969)
Year of Election or Appointment: 2019
Secretary and Chief Legal Officer (CLO)
Ms. Lo Bessette also serves as an officer of other funds. Ms. Lo Bessette serves as CLO, Secretary, and Senior Vice President of Fidelity Management & Research Company LLC (investment adviser firm, 2019-present); and CLO of Fidelity Management & Research (Hong Kong) Limited, FMR Investment Management (UK) Limited, and Fidelity Management & Research (Japan) Limited (investment adviser firms, 2019-present). She is a Senior Vice President and Deputy General Counsel of FMR LLC (diversified financial services company, 2019-present), and is an employee of Fidelity Investments. Previously, Ms. Lo Bessette served as CLO, Secretary, and Senior Vice President of FMR Co., Inc. (investment adviser firm, 2019); Secretary of Fidelity SelectCo, LLC and Fidelity Investments Money Management, Inc. (investment adviser firms, 2019). Prior to joining Fidelity Investments, Ms. Lo Bessette was Executive Vice President, General Counsel (2016-2019) and Senior Vice President, Deputy General Counsel (2015-2016) of OppenheimerFunds (investment management company) and Deputy Chief Legal Officer (2013-2015) of Jennison Associates LLC (investment adviser firm).
Chris Maher (1972)
Year of Election or Appointment: 2013
Assistant Treasurer
Mr. Maher also serves as an officer of other funds. Mr. Maher serves as Assistant Treasurer of FMR Capital, Inc. (2017-present), and is an employee of Fidelity Investments (2008-present). Previously, Mr. Maher served as Assistant Treasurer of certain funds (2013-2020); Vice President of Asset Management Compliance (2013), Vice President of the Program Management Group of FMR (investment adviser firm, 2010-2013), and Vice President of Valuation Oversight (2008-2010).
Jamie Pagliocco (1964)
Year of Election or Appointment: 2020
Vice President
Mr. Pagliocco also serves as Vice President of other funds. Mr. Pagliocco serves as President of Fixed Income (2020-present), and is an employee of Fidelity Investments (2001-present). Previously, Mr. Pagliocco served as Co-Chief Investment Officer – Bond (2017-2020), Global Head of Bond Trading (2016-2019), and as a portfolio manager.
Kenneth B. Robins (1969)
Year of Election or Appointment: 2020
Chief Compliance Officer
Mr. Robins also serves as an officer of other funds. Mr. Robins serves as Compliance Officer of Fidelity Management & Research Company LLC (investment adviser firm, 2016-present) and is an employee of Fidelity Investments (2004-present). Previously, Mr. Robins served as Compliance Officer of FMR Co., Inc. (investment adviser firm, 2016-2019), as Executive Vice President of Fidelity Investments Money Management, Inc. (investment adviser firm, 2013-2016) and served in other fund officer roles.
Brett Segaloff (1972)
Year of Election or Appointment: 2021
Anti-Money Laundering (AML) Officer
Mr. Segaloff also serves as an AML Officer of other funds and other related entities. He is Director, Anti-Money Laundering (2007-present) of FMR LLC (diversified financial services company) and is an employee of Fidelity Investments (1996-present).
Stacie M. Smith (1974)
Year of Election or Appointment: 2013
Assistant Treasurer
Ms. Smith also serves as an officer of other funds. Ms. Smith serves as Assistant Treasurer of FMR Capital, Inc. (2017-present), is an employee of Fidelity Investments (2009-present), and has served in other fund officer roles. Prior to joining Fidelity Investments, Ms. Smith served as Senior Audit Manager of Ernst & Young LLP (accounting firm, 1996-2009). Previously, Ms. Smith served as Assistant Treasurer (2013-2019) and Deputy Treasurer (2013-2016) of certain Fidelity® funds.
Marc L. Spector (1972)
Year of Election or Appointment: 2016
Deputy Treasurer
Mr. Spector also serves as an officer of other funds. Mr. Spector serves as Assistant Treasurer of FMR Capital, Inc. (2017-present) and is an employee of Fidelity Investments (2016-present). Prior to joining Fidelity Investments, Mr. Spector served as Director at the Siegfried Group (accounting firm, 2013-2016), and prior to Siegfried Group as audit senior manager at Deloitte & Touche LLP (accounting firm, 2005-2013).
Jim Wegmann (1979)
Year of Election or Appointment: 2019
Assistant Treasurer
Mr. Wegmann also serves as Assistant Treasurer of other funds. Mr. Wegmann is an employee of Fidelity Investments (2011-present).
Shareholder Expense Example
As a shareholder, you incur two types of costs: (1) transaction costs, which may include sales charges (loads) on purchase payments or redemption proceeds, as applicable and (2) ongoing costs, which generally include management fees, distribution and/or service (12b-1) fees and other Fund expenses. This Example is intended to help you understand your ongoing costs (in dollars) of investing in a fund and to compare these costs with the ongoing costs of investing in other mutual funds.
The Example is based on an investment of $1,000 invested at the beginning of the period and held for the entire period (July 1, 2020 to December 31, 2020).
Actual Expenses
The first line of the accompanying table provides information about actual account values and actual expenses. You may use the information in this line, together with the amount you invested, to estimate the expenses that you paid over the period. Simply divide your account value by $1,000.00 (for example, an $8,600 account value divided by $1,000.00 = 8.6), then multiply the result by the number in the first line for a class/Fund under the heading entitled "Expenses Paid During Period" to estimate the expenses you paid on your account during this period. If any fund is a shareholder of any underlying mutual funds or exchange-traded funds (ETFs) (the Underlying Funds), such fund indirectly bears its proportional share of the expenses of the Underlying Funds in addition to the direct expenses incurred presented in the table. These fees and expenses are not included in the annualized expense ratio used to calculate the expense estimate in the table below. The estimate of expenses does not include any fees or other expenses of any variable annuity or variable life insurance product. If they were, the estimate of expenses you paid during the period would be higher, and your ending account value would be lower.
Hypothetical Example for Comparison Purposes
The second line of the accompanying table provides information about hypothetical account values and hypothetical expenses based on the actual expense ratio and an assumed rate of return of 5% per year before expenses, which is not the actual return. The hypothetical account values and expenses may not be used to estimate the actual ending account balance or expenses you paid for the period. You may use this information to compare the ongoing costs of investing in the Fund and other funds. To do so, compare this 5% hypothetical example with the 5% hypothetical examples that appear in the shareholder reports of the other funds. If any fund is a shareholder of any Underlying Funds, such fund indirectly bears its proportional share of the expenses of the Underlying Funds in addition to the direct expenses as presented in the table. These fees and expenses are not included in the annualized expense ratio used to calculate the expense estimate in the table below. The estimate of expenses does not include any fees or other expenses of any variable annuity or variable life insurance product. If they were, the estimate of expenses you paid during the period would be higher, and your ending account value would be lower.
Please note that the expenses shown in the table are meant to highlight your ongoing costs only and do not reflect any transaction costs. Therefore, the second line of the table is useful in comparing ongoing costs only, and will not help you determine the relative total costs of owning different funds.
| | Annualized Expense Ratio-A | Beginning
Account Value
July 1, 2020 | Ending
Account Value
December 31, 2020 | Expenses Paid
During Period-B
July 1, 2020
to December 31, 2020 |
| VIP Government Money Market Portfolio | | | | |
| Initial Class | .16% | | | |
| Actual | | $1,000.00 | $1,000.10 | $.80** |
| Hypothetical-C | | $1,000.00 | $1,024.33 | $.81** |
| Service Class | .16% | | | |
| Actual | | $1,000.00 | $1,000.10 | $.80** |
| Hypothetical-C | | $1,000.00 | $1,024.33 | $.81** |
| Service Class 2 | .16% | | | |
| Actual | | $1,000.00 | $1,000.10 | $.80** |
| Hypothetical-C | | $1,000.00 | $1,024.33 | $.81** |
| Investor Class | .16% | | | |
| Actual | | $1,000.00 | $1,000.10 | $.80** |
| Hypothetical-C | | $1,000.00 | $1,024.33 | $.81** |
A Annualized expense ratio reflects expenses net of applicable fee waivers.
B Expenses are equal to the annualized expense ratio, multiplied by the average account value over the period, multiplied by 184/ 366 (to reflect the one-half year period). The fees and expenses of any Underlying Funds are not included in each annualized expense ratio.
C 5% return per year before expenses
** If certain fees were not voluntarily waived by the investment adviser or its affiliates during the period, the annualized expense ratio and the expenses paid in the actual and hypothetical examples above would have been shown in the table below:
| | Annualized Expense Ratio-(a)
| Expenses Paid
|
| VIP Government Money Market Portfolio | | |
| Initial Class | .23% | |
| Actual | | $1.16 |
| Hypothetical-(b) | | $1.17 |
| Service Class | .33% | |
| Actual | | $1.66 |
| Hypothetical-(b) | | $1.68 |
| Service Class 2 | .48% | |
| Actual | | $2.41 |
| Hypothetical-(b) | | $2.44 |
| Investor Class | .25% | |
| Actual | | $1.26 |
| Hypothetical-(b) | | $1.27 |
(a) Annualized expense ratio reflects expenses net of applicable fee waivers.
(b) 5% return per year before expenses
Distributions (Unaudited)
The fund hereby designates as a capital gain dividend with respect to the taxable year ended December 31, 2020, $8,994, or, if subsequently determined to be different, the net capital gain of such year.
A total of 57.87% of the dividends distributed during the fiscal year was derived from interest on U.S. Government securities which is generally exempt from state income tax.
Board Approval of Investment Advisory Contracts and Management Fees
VIP Government Money Market Portfolio
Each year, the Board of Trustees, including the Independent Trustees (together, the Board), votes on the renewal of the management contract with Fidelity Management & Research Company LLC (FMR) and the sub-advisory agreements (together, the Advisory Contracts) for the fund. FMR and the sub-advisers are referred to herein as the Investment Advisers. The Board, assisted by the advice of fund counsel and Independent Trustees' counsel, requests and considers a broad range of information relevant to the renewal of the Advisory Contracts throughout the year.
The Board meets regularly and, at each of its meetings, covers an extensive agenda of topics and materials and considers factors that are relevant to its annual consideration of the renewal of the fund's Advisory Contracts, including the services and support provided to the fund and its shareholders. The Board has established four standing committees (Committees) — Operations, Audit, Fair Valuation, and Governance and Nominating — each composed of and chaired by Independent Trustees with varying backgrounds, to which the Board has assigned specific subject matter responsibilities in order to enhance effective decision-making by the Board. The Operations Committee, of which all of the Independent Trustees are members, meets regularly throughout the year and considers, among other matters, information specifically related to the annual consideration of the renewal of the fund's Advisory Contracts. The Board, acting directly and through its Committees, requests and receives information concerning the annual consideration of the renewal of the fund's Advisory Contracts. The Board also meets as needed to review matters specifically related to the Board's annual consideration of the renewal of the Advisory Contracts. Members of the Board may also meet with trustees of other Fidelity funds through joint ad hoc committees to discuss certain matters relevant to all of the Fidelity funds.
At its September 2020 meeting, the Board unanimously determined to renew the fund's Advisory Contracts. In reaching its determination, the Board considered all factors it believed relevant, including (i) the nature, extent, and quality of the services provided to the fund and its shareholders (including the investment performance of the fund); (ii) the competitiveness of the fund's management fee and total expense ratio relative to peer funds; (iii) the total costs of the services provided by and the profits realized by Fidelity from its relationships with the fund; and (iv) the extent to which, if any, economies of scale exist and are realized as the fund grows, and whether any economies of scale are appropriately shared with fund shareholders.
In considering whether to renew the Advisory Contracts for the fund, the Board reached a determination, with the assistance of fund counsel and Independent Trustees' counsel and through the exercise of its business judgment, that the renewal of the Advisory Contracts was in the best interests of the fund and its shareholders and that the compensation payable under the Advisory Contracts was fair and reasonable. The Board's decision to renew the Advisory Contracts was not based on any single factor, but rather was based on a comprehensive consideration of all the information provided to the Board at its meetings throughout the year. The Board, in reaching its determination to renew the Advisory Contracts, was aware that shareholders of the fund have a broad range of investment choices available to them, including a wide choice among funds offered by Fidelity's competitors, and that the fund's shareholders, who have the opportunity to review and weigh the disclosure provided by the fund in its prospectus and other public disclosures, have chosen to invest in this fund, which is part of the Fidelity family of funds.
Nature, Extent, and Quality of Services Provided. The Board considered Fidelity's staffing as it relates to the fund, including the backgrounds of investment personnel of Fidelity, and also considered the fund's investment objective, strategies, and related investment philosophy. The Independent Trustees also had discussions with senior management of Fidelity's investment operations and investment groups. The Board considered the structure of the investment personnel compensation program and whether this structure provides appropriate incentives to act in the best interests of the fund. Additionally, the Board considered the portfolio managers' investments, if any, in the funds that they manage.
Resources Dedicated to Investment Management and Support Services. The Board reviewed the general qualifications and capabilities of Fidelity's investment staff, including its size, education, experience, and resources, as well as Fidelity's approach to recruiting, managing, and compensating investment personnel. The Board noted that Fidelity has continued to increase the resources devoted to non-U.S. offices, including expansion of Fidelity's global investment organization. The Board also noted that Fidelity's analysts have extensive resources, tools and capabilities that allow them to conduct sophisticated quantitative and fundamental analysis, as well as credit analysis of issuers, counterparties and guarantors. Further, the Board considered that Fidelity's investment professionals have sufficient access to global information and data so as to provide competitive investment results over time, and that those professionals also have access to sophisticated tools that permit them to assess portfolio construction and risk and performance attribution characteristics continuously, as well as to transmit new information and research conclusions rapidly around the world. Additionally, in its deliberations, the Board considered Fidelity's trading, risk management, compliance, and technology and operations capabilities and resources, which are integral parts of the investment management process. The Board also considered Fidelity's investments in business continuity planning, and its success in continuously providing services to the fund notwithstanding the severe disruptions caused by the COVID-19 pandemic.
Shareholder and Administrative Services. The Board considered (i) the nature, extent, quality, and cost of advisory, administrative, and shareholder services performed by the Investment Advisers and their affiliates under the Advisory Contracts and under separate agreements covering transfer agency and pricing and bookkeeping services for the fund; (ii) the nature and extent of the supervision of third party service providers, principally custodians, subcustodians, and pricing vendors; and (iii) the resources devoted to, and the record of compliance with, the fund's compliance policies and procedures.
The Board noted that the growth of fund assets over time across the complex allows Fidelity to reinvest in the development of services designed to enhance the value and convenience of the Fidelity funds as investment vehicles. These services include 24-hour access to account information and market information over the Internet and through telephone representatives, investor education materials and asset allocation tools, and the expanded availability of Fidelity Investor Centers.
Investment in a Large Fund Family. The Board considered the benefits to shareholders of investing in a Fidelity fund, including the benefits of investing in a fund that is part of a large family of funds offering a variety of investment disciplines and providing a large variety of mutual fund investor services. The Board noted that Fidelity had taken, or had made recommendations that resulted in the Fidelity funds taking, a number of actions over the previous year that benefited particular funds, including: (i) continuing to dedicate additional resources to Fidelity's investment research process, which includes meetings with management of issuers of securities in which the funds invest, and to the support of the senior management team that oversees asset management; (ii) continuing efforts to enhance Fidelity's global research capabilities; (iii) launching new funds and ETFs with innovative structures, strategies and pricing and making other enhancements to meet client needs; (iv) launching new share classes of existing funds; (v) eliminating purchase minimums and broadening eligibility requirements for certain funds and share classes; (vi) reducing management fees and total expenses for certain target date funds or classes and index funds; (vii) lowering expenses for certain funds and classes by implementing or lowering expense caps; (viii) rationalizing product lines and gaining increased efficiencies from fund mergers, liquidations, and share class consolidations; (ix) continuing to develop, acquire and implement systems and technology to improve services to the funds and shareholders, strengthen information security, and increase efficiency; and (x) continuing to implement enhancements to further strengthen Fidelity's product line to increase investors' probability of success in achieving their investment goals, including retirement income goals.
Investment Performance. The Board considered whether the fund has operated in accordance with its investment objective, as well as its record of compliance with its investment restrictions and its performance history.
The Board took into account discussions that occur at Board meetings throughout the year with representatives of the Investment Advisers about fund investment performance. In this regard the Board noted that as part of regularly scheduled fund reviews and other reports to the Board on fund performance, the Board considers annualized return information for the fund for different time periods, measured against an appropriate peer group of funds with similar objectives (peer group).
In addition to reviewing absolute and relative fund performance, the Independent Trustees periodically consider the appropriateness of fund performance metrics in evaluating the results achieved. In general, the Independent Trustees believe that fund performance should be evaluated based on gross performance (before fees and expenses but after transaction costs) compared to the gross performance of appropriate peer groups, over appropriate time periods that may include full market cycles, taking into account relevant factors including the following: general market conditions; expectations for interest rate levels and credit conditions; issuer-specific information including credit quality; the fund's market value NAV over time and its resilience under various stressed conditions; and fund cash flows and other factors. The Independent Trustees generally give greater weight to fund performance over longer time periods than over shorter time periods.
The Board recognizes that in interest rate environments where many competitors waive fees to maintain a minimum yield, relative money market fund performance on a net basis (after fees and expenses) may not be particularly meaningful due to miniscule performance differences among competitor funds. Depending on the circumstances, the Independent Trustees may be satisfied with a fund's performance notwithstanding that it lags its peer group for certain periods.
The Independent Trustees recognize that shareholders evaluate performance on a net basis over their own holding periods, for which one-, three-, and five-year periods are often used as a proxy. For this reason, the performance information reviewed by the Board also included net cumulative calendar year total return information for the fund and an appropriate peer group for the most recent one-, three-, and five-year periods. The Independent Trustees recognize that shareholders who are not investing through a tax-advantaged retirement account also consider tax consequences in evaluating performance.
Based on its review, the Board concluded that the nature, extent, and quality of services provided to the fund under the Advisory Contracts should continue to benefit the shareholders of the fund.
Competitiveness of Management Fee and Total Expense Ratio. The Board considered the fund's management fee and total expense ratio compared to "mapped groups" of competitive funds and classes created for the purpose of facilitating the Trustees' competitive analysis of management fees and total expenses. Fidelity creates "mapped groups" by combining similar Lipper investment objective categories that have comparable investment mandates. Combining Lipper investment objective categories aids the Board's management fee and total expense ratio comparisons by broadening the competitive group used for comparison.
Management Fee. The Board considered two proprietary management fee comparisons for the 12-month periods shown in basis points (BP) in the chart below. The group of Lipper funds used by the Board for management fee comparisons is referred to below as the "Total Mapped Group" and is broader than the Lipper peer group used by the Board for performance comparisons. The Total Mapped Group comparison focuses on a fund's standing in terms of gross management fees before expense reimbursements or caps relative to the total universe of funds with comparable investment mandates, regardless of whether their management fee structures also are comparable. Funds with comparable investment mandates offer exposure to similar types of securities. Funds with comparable management fee structures have similar management fee contractual arrangements (
e.g., flat rate charged for advisory services, all-inclusive fee rate,
etc.). "TMG %" represents the percentage of funds in the Total Mapped Group that had management fees that were lower than the fund's. For example, a hypothetical TMG % of 20% would mean that 80% of the funds in the Total Mapped Group had higher, and 20% had lower, management fees than the fund. The fund's actual TMG %s and the number of funds in the Total Mapped Group are in the chart below. The "Asset-Sized Peer Group" (ASPG) comparison focuses on a fund's standing relative to a subset of non-Fidelity funds within the Total Mapped Group that are similar in size and management fee structure. For example, if a fund is in the first quartile of the ASPG, the fund's management fee ranks in the least expensive or lowest 25% of funds in the ASPG. The ASPG represents at least 15% of the funds in the Total Mapped Group with comparable asset size and management fee structures, subject to a minimum of 50 funds (or all funds in the Total Mapped Group if fewer than 50). Additional information, such as the ASPG quartile in which the fund's management fee rate ranked, is also included in the chart and was considered by the Board. The Board also recognized that the income-based component of the fund's management fee, which few competitors have, varies depending on the level of the fund's monthly gross income, providing for higher fees at higher income levels, and for lower fees at lower income levels.
VIP Government Money Market Portfolio
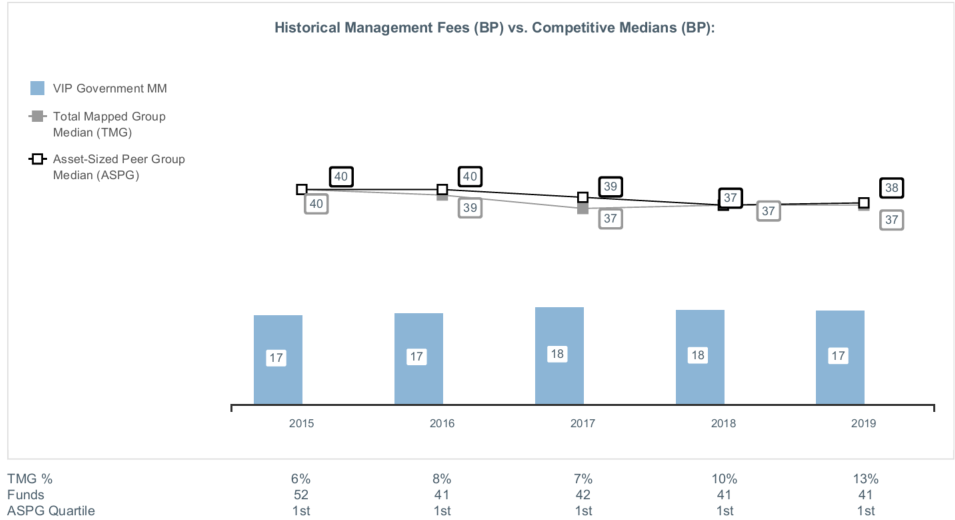
The Board noted that the fund's management fee rate ranked below the median of its Total Mapped Group and below the median of its ASPG for 2019.
The Board noted that it and the boards of other Fidelity funds formed an ad hoc Committee on Group Fee, which meets periodically, to conduct an in-depth review of the "group fee" component of the management fee of funds with such management fee structures. The Committee's focus included the mechanics of the group fee, the competitive landscape of group fee structures, Fidelity funds with no group fee component and investment products not included in group fee assets. The Board also considered that, for funds subject to the group fee, FMR agreed to voluntarily waive fees over a specified period of time in amounts designed to account for assets converted from certain funds to certain collective investment trusts.
Based on its review, the Board concluded that the fund's management fee is fair and reasonable in light of the services that the fund receives and the other factors considered.
Total Expense Ratio. In its review of each class's total expense ratio, the Board considered the fund's management fee rate as well as other fund or class expenses, as applicable, such as transfer agent fees, pricing and bookkeeping fees, fund-paid 12b-1 fees, and custodial, legal, and audit fees. The Board also noted that Fidelity may agree to waive fees or reimburse expenses from time to time, and the extent to which, if any, it has done so for the fund. As part of its review, the Board also considered the current and historical total expense ratios of each class of the fund compared to competitive fund median expenses. Each class of the fund is compared to those funds and classes in the Total Mapped Group (used by the Board for management fee comparisons) that have a similar sales load structure.
The Board noted that the total expense ratio of each of Initial Class, Investor Class, and Service Class ranked below the competitive median for 2019 and the total expense ratio of Service Class 2 ranked above the competitive median for 2019. The Board considered that, in general, various factors can affect total expense ratios. The Board noted that the fund offers multiple classes, each of which has a different 12b-1 fee structure, and that the multiple structures are intended to offer a range of pricing options for the intermediary market. The Board also noted that the total expense ratios of the classes vary primarily by the level of their 12b-1 fees, although differences in transfer agent fees may also cause expenses to vary from class to class. The Board noted that the total expense ratio of Service Class 2 was above the competitive median for 2019 due to its 12b-1 fees. The Board noted that, excluding fee waivers and 12b-1 fees, the total expense ratio of Service Class 2 is below the median. The Board considered that the competitive data reflects periods for which many competitor funds waived fees or reimbursed expenses in order to maintain a minimum yield.
Fees Charged to Other Fidelity Clients. The Board also considered Fidelity fee structures and other information with respect to clients of Fidelity, such as other funds advised or subadvised by Fidelity, pension plan clients, and other institutional clients with similar mandates. The Board noted that a joint ad hoc committee created by it and the boards of other Fidelity funds periodically reviews and compares Fidelity's institutional investment advisory business with its business of providing services to the Fidelity funds and also noted the most recent findings of the committee. The Board noted that the committee's review included a consideration of the differences in services provided, fees charged, and costs incurred, as well as competition in the markets serving the different categories of clients.
Based on its review of total expense ratios and fees charged to other Fidelity clients, the Board concluded that the total expense ratio of each class of the fund was reasonable in light of the services that the fund and its shareholders receive and the other factors considered.
Costs of the Services and Profitability. The Board considered the revenues earned and the expenses incurred by Fidelity in conducting the business of developing, marketing, distributing, managing, administering and servicing the fund and servicing the fund's shareholders. The Board also considered the level of Fidelity's profits in respect of all the Fidelity funds.
On an annual basis, Fidelity presents to the Board information about the profitability of its relationships with the fund. Fidelity calculates profitability information for each fund, as well as aggregate profitability information for groups of Fidelity funds and all Fidelity funds, using a series of detailed revenue and cost allocation methodologies which originate with the books and records of Fidelity on which Fidelity's audited financial statements are based. The Audit Committee of the Board reviews any significant changes from the prior year's methodologies and the full Board approves such changes.
A public accounting firm has been engaged annually by the Board as part of the Board's assessment of Fidelity's profitability analysis. The engagement includes the review and assessment of the methodologies used by Fidelity in determining the revenues and expenses attributable to Fidelity's mutual fund business, and completion of agreed-upon procedures in respect of the mathematical accuracy of certain fund profitability information and its conformity to established allocation methodologies. After considering the reports issued under the engagement and information provided by Fidelity, the Board concluded that while other allocation methods may also be reasonable, Fidelity's profitability methodologies are reasonable in all material respects.
The Board also reviewed Fidelity's non-fund businesses and potential indirect benefits such businesses may have received as a result of their association with Fidelity's mutual fund business (i.e., fall-out benefits) as well as cases where Fidelity's affiliates may benefit from the funds' business. The Board considered areas where potential indirect benefits to the Fidelity funds from their relationships with Fidelity may exist. The Board also considered that in 2019 a joint ad hoc committee created by it and the boards of other Fidelity funds evaluated potential fall-out benefits (PFOB Committee). The Board noted that it considered the PFOB Committee's findings in connection with its consideration of the renewal of the Advisory Contracts.
The Board considered the costs of the services provided by and the profits realized by Fidelity in connection with the operation of the fund, including the conclusions of the PFOB Committee, and was satisfied that the profitability was not excessive.
Economies of Scale. The Board considered whether there have been economies of scale in respect of the management of the Fidelity funds, whether the Fidelity funds (including the fund) have appropriately benefited from any such economies of scale, and whether there is potential for realization of any further economies of scale. The Board considered the extent to which the fund will benefit from economies of scale as assets grow through increased services to the fund, through waivers or reimbursements, or through fee or expense ratio reductions. The Board also noted that a committee (the Economies of Scale Committee) created by it and the boards of other Fidelity funds periodically analyzes whether Fidelity attains economies of scale in respect of the management and servicing of the Fidelity funds, whether the Fidelity funds have appropriately benefited from such economies of scale, and whether there is potential for realization of any further economies of scale.
The Board recognized that the fund's management contract incorporates a "group fee" structure, which provides for lower group fee rates as total "group assets" increase, and for higher group fee rates as total "group assets" decrease ("group assets" as defined in the management contract). FMR calculates the group fee rates based on a tiered asset "breakpoint" schedule that varies based on asset class. The Board considered that the group fee is designed to deliver the benefits of economies of scale to fund shareholders when total Fidelity fund assets increase, even if assets of any particular fund are unchanged or have declined, because some portion of Fidelity's costs are attributable to services provided to all Fidelity funds, and all funds benefit if those costs can be allocated among more assets. The Board concluded that, given the group fee structure, fund shareholders will benefit from lower management fees as "group assets" increase at the fund complex level, regardless of whether Fidelity achieves any such economies of scale.
The Board concluded, taking into account the analysis of the Economies of Scale Committee, that economies of scale, if any, are being appropriately shared between fund shareholders and Fidelity.
Additional Information Requested by the Board. In order to develop fully the factual basis for consideration of the Fidelity funds' advisory contracts, the Board requested and received additional information on certain topics, including: (i) Fidelity's fund profitability methodology, profitability trends for certain funds, the allocation of various costs to different funds, and the impact of certain factors on fund profitability results; (ii) portfolio manager changes that have occurred during the past year and the amount of the investment that each portfolio manager has made in the Fidelity fund(s) that he or she manages; (iii) Fidelity's compensation structure for portfolio managers, research analysts, and other key personnel, including its effects on fund profitability, the rationale for the compensation structure, and the extent to which current market conditions have affected retention and recruitment; (iv) the arrangements with and compensation paid to certain fund sub-advisers on behalf of the Fidelity funds and the treatment of such compensation within Fidelity's fund profitability methodology; (v) the terms of the funds' various management fee structures, including the basic group fee and the terms of Fidelity's voluntary expense limitation agreements; (vi) Fidelity's transfer agent fee, expense, and service structures for different funds and classes relative to competitive trends; (vii) the impact on fund profitability of recent industry trends, such as the growth in passively managed funds and outflows from actively managed equity funds; and (viii) explanations regarding the relative total expense ratios of certain funds and classes, total expense competitive trends and methodologies for total expense competitive comparisons, and actions that might be taken by Fidelity to reduce total expense ratios for certain classes. In addition, the Board considered its discussions with Fidelity regarding Fidelity's efforts to maintain the continuous investment and shareholder services necessary for the funds during the current pandemic and economic circumstances.
Based on its evaluation of all of the conclusions noted above, and after considering all factors it believed relevant, the Board concluded that the advisory fee arrangements are fair and reasonable, and that the fund's Advisory Contracts should be renewed.

VIPMM-ANN-0221
1.701157.123
Fidelity® Variable Insurance Products:
Asset Manager: Growth Portfolio
Annual Report
December 31, 2020
Contents
To view a fund's proxy voting guidelines and proxy voting record for the 12-month period ended June 30, visit http://www.fidelity.com/proxyvotingresults or visit the Securities and Exchange Commission's (SEC) web site at http://www.sec.gov.
You may also call 1-877-208-0098 to request a free copy of the proxy voting guidelines.
Fidelity® Variable Insurance Products are separate account options which are purchased through a variable insurance contract.
Standard & Poor's, S&P and S&P 500 are registered service marks of The McGraw-Hill Companies, Inc. and have been licensed for use by Fidelity Distributors Corporation.
Other third-party marks appearing herein are the property of their respective owners.
All other marks appearing herein are registered or unregistered trademarks or service marks of FMR LLC or an affiliated company. © 2021 FMR LLC. All rights reserved.
This report and the financial statements contained herein are submitted for the general information of the shareholders of the Fund. This report is not authorized for distribution to prospective investors in the Fund unless preceded or accompanied by an effective prospectus.
A fund files its complete schedule of portfolio holdings with the SEC for the first and third quarters of each fiscal year on Form N-PORT. Forms N-PORT are available on the SEC’s web site at http://www.sec.gov. A fund's Forms N-PORT may be reviewed and copied at the SEC’s Public Reference Room in Washington, DC. Information regarding the operation of the SEC's Public Reference Room may be obtained by calling 1-800-SEC-0330.
For a complete list of a fund's portfolio holdings, view the most recent holdings listing, semiannual report, or annual report on Fidelity's web site at http://www.fidelity.com, http://www.institutional.fidelity.com, or http://www.401k.com, as applicable.
NOT FDIC INSURED •MAY LOSE VALUE •NO BANK GUARANTEE
Neither the Fund nor Fidelity Distributors Corporation is a bank.
Note to Shareholders:
Early in 2020, the outbreak and spread of a new coronavirus emerged as a public health emergency that had a major influence on financial markets, primarily based on its impact on the global economy and the outlook for corporate earnings. The virus causes a respiratory disease known as COVID-19. On March 11, the World Health Organization declared the COVID-19 outbreak a pandemic, citing sustained risk of further global spread.
In the weeks following, as the crisis worsened, we witnessed an escalating human tragedy with wide-scale social and economic consequences from coronavirus-containment measures. The outbreak of COVID-19 prompted a number of measures to limit the spread, including travel and border restrictions, quarantines, and restrictions on large gatherings. In turn, these resulted in lower consumer activity, diminished demand for a wide range of products and services, disruption in manufacturing and supply chains, and – given the wide variability in outcomes regarding the outbreak – significant market uncertainty and volatility. Amid the turmoil, global governments and central banks took unprecedented action to help support consumers, businesses, and the broader economies, and to limit disruption to financial systems.
The situation continues to unfold, and the extent and duration of its impact on financial markets and the economy remain highly uncertain. Extreme events such as the coronavirus crisis are “exogenous shocks” that can have significant adverse effects on mutual funds and their investments. Although multiple asset classes may be affected by market disruption, the duration and impact may not be the same for all types of assets.
Fidelity is committed to helping you stay informed amid news about COVID-19 and during increased market volatility, and we’re taking extra steps to be responsive to customer needs. We encourage you to visit our websites, where we offer ongoing updates, commentary, and analysis on the markets and our funds.
Performance: The Bottom Line
Average annual total return reflects the change in the value of an investment, assuming reinvestment of distributions from dividend income and capital gains (the profits earned upon the sale of securities that have grown in value, if any) and assuming a constant rate of performance each year. During periods of reimbursement by Fidelity, a fund’s total return will be greater than it would be had the reimbursement not occurred. Performance numbers are net of all underlying fund operating expenses, but do not include any insurance charges imposed by your insurance company’s separate account. If performance information included the effect of these additional charges, the total returns would have been lower. How a fund did yesterday is no guarantee of how it will do tomorrow.
Average Annual Total Returns
| For the periods ended December 31, 2020 | Past 1 year | Past 5 years | Past 10 years |
| Initial Class | 17.27% | 10.12% | 8.56% |
| Service Class | 17.09% | 10.00% | 8.45% |
| Service Class 2 | 16.95% | 9.82% | 8.27% |
| Investor Class | 17.19% | 10.02% | 8.48% |
$10,000 Over 10 Years
Let's say hypothetically that $10,000 was invested in VIP Asset Manager: Growth Portfolio - Initial Class on Decemer 31, 2010.
The chart shows how the value of your investment would have changed, and also shows how the S&P 500® Index performed over the same period.

| Period Ending Values |
| $22,738 | VIP Asset Manager: Growth Portfolio - Initial Class |
| $36,700 | S&P 500® Index |
Management's Discussion of Fund Performance
Market Recap: Global financial markets were highly volatile and unpredictable in 2020, a year that will be remembered by most investors for the impact of the coronavirus pandemic. The early-2020 outbreak and spread of COVID-19 resulted in a sharp decline for risk assets, followed by a historic rebound. The crisis and containment efforts led to broad contraction in economic activity and dislocation in financial markets. Rapid and expansive monetary- and fiscal-policy responses partially offset the economic disruption and fueled the market surge for many assets from late March through the end of the year.
Non-U.S. equities gained 10.81% in 2020, according to the MSCI ACWI (All Country World Index) ex USA Index, despite significant ups and downs related to the pandemic. Emerging markets (+19%) was the top region, followed by Japan (+15%) and Europe ex U.K. (+12%). Conversely, the U.K. (-10%), Canada (+6%) and Asia Pacific ex Japan (+7%) lagged. By sector, information technology (+46%) was by far the top performer, while consumer discretionary (+23%) and materials (+22%) also notably outpaced the index. Energy (-23%), real estate (-9%) and financials (-4%) all underperformed.
The Dow Jones U.S. Total Stock Market Index gained 20.79% for the year. After a sharp decline in the first quarter (-20.96%) due to the coronavirus outbreak, U.S. equities reversed course, driven by resilient corporate earnings and potential for a vaccine breakthrough, and closed the year at an all-time high. Among sectors, consumer discretionary (+47%) and information technology (+46%) led, whereas energy (-33%) fared worst, followed by real estate (-5%). Large-cap stocks performed about on par with smaller-caps, while growth handily outpaced value. Commodities notably lagged equities.
Turning to fixed income, U.S. taxable investment-grade bonds (the Bloomberg Barclays U.S. Aggregate Bond Index) rose 7.51%, as most categories generated a solid gain. Corporate bonds (+9.35%) led the way, along with commercial mortgage backed securities (+8.11%), Treasury securities (+8.00) and government bonds (7.94%). Agency bonds (+5.48%) and mortgage-backed securities (+3.87%) had smaller gains. Extended (non-core) categories outside the index were mixed, including Treasury Inflation-Protected Securities (+10.99%), high-yield bonds (+6.07%), emerging-markets debt (+5.88%) and floating-rate bank loans (+3.50%).
Comments from Lead Portfolio Manager Geoff Stein and Co-Portfolio Manager Avishek Hazrachoudhury: For the year, the fund’s share classes advanced about 17%, outpacing the 15.01% return of the Fidelity Asset Manager 70% Composite Index℠. Strong security selection across the board – U.S. and international stocks, as well as investment-grade bonds – fueled performance versus the Composite benchmark. Overall asset allocation detracted from relative performance. Our domestic equity portfolio outperformed its benchmark, led by strong stock selection in health care, information technology and communication services. This positive outcome was partially offset by adverse positioning in the consumer discretionary sector. Our international developed-markets (DM) and emerging-markets (EM) portfolios also topped their respective benchmarks by sizable margins. Within DM, picks in continental Europe and Japan helped the most, followed by out-of-benchmark selections in the U.S. In EM, investment choices in China contributed the most by far, although out-of-benchmark picks in the U.S. also meaningfully helped. Within investment-grade bonds, sector positioning drove that portfolio's outperformance of its benchmark. An overweighting and security selection among corporate bonds issued by banks and, to a lesser extent, insurers, provided a major boost. Underweighted exposure to U.S. Treasuries and an out-of-benchmark allocation to Treasury Inflation-Protected Securities (TIPS) also notably contributed. The fund’s overall equity allocation strategy worked against relative performance, hampered by a modest out-of-benchmark position in REITs (real estate investment trusts) and, to a smaller degree, commodity securities. REITs struggled along with other risk assets amid the market turmoil of the first quarter. This negative effect was partially offset by positive results from the fund's fixed-income positioning. Specifically, we underweighted investment-grade bonds and cash to facilitate out-of-benchmark allocations to long-term Treasuries, TIPS and international corporate credit, all of which added value. Looking ahead, we are cautiously optimistic, but believe continued fiscal and monetary stimulus is critical to supporting the economic recovery.
The views expressed above reflect those of the portfolio manager(s) only through the end of the period as stated on the cover of this report and do not necessarily represent the views of Fidelity or any other person in the Fidelity organization. Any such views are subject to change at any time based upon market or other conditions and Fidelity disclaims any responsibility to update such views. These views may not be relied on as investment advice and, because investment decisions for a Fidelity fund are based on numerous factors, may not be relied on as an indication of trading intent on behalf of any Fidelity fund.
Note to shareholders: In September 2020, Fidelity
® VIP Asset Manager: Growth Portfolio changed the means by which it attains its U.S. equity exposure, from 10 individual Fidelity sector central funds to one consolidated, multisector portfolio (Fidelity
® U.S. Equity Central Fund). This new, broad-based investment vehicle provides additional tax efficiencies and more flexibility for the sector specialists to express their convictions, advantages that should serve shareholders well.
Investment Summary (Unaudited)
The information in the following tables is based on the combined investments of the Fund and its pro-rata share of the investments of Fidelity's Central Funds, other than the Commodity Strategy and Money Market Central Funds.
Top Ten Stocks as of December 31, 2020
| | % of fund's net assets |
| Apple, Inc. | 3.1 |
| Microsoft Corp. | 2.9 |
| Amazon.com, Inc. | 1.9 |
| Alphabet, Inc. Class A | 1.8 |
| Facebook, Inc. Class A | 1.0 |
| Roche Holding AG (particiation certificate) | 0.7 |
| Taiwan Semiconductor Manufacturing Co. Ltd. | 0.6 |
| UnitedHealth Group, Inc. | 0.6 |
| Adobe, Inc. | 0.6�� |
| Capital One Financial Corp. | 0.6 |
| | 13.8 |
Top Market Sectors as of December 31, 2020
| (stocks only) | % of fund's net assets |
| Information Technology | 17.5 |
| Financials | 9.8 |
| Consumer Discretionary | 9.3 |
| Health Care | 9.2 |
| Industrials | 7.1 |
| Communication Services | 6.8 |
| Consumer Staples | 5.0 |
| Materials | 2.7 |
| Investment Companies | 2.4 |
| Real Estate | 2.0 |
Asset Allocation (% of fund's net assets)
| As of December 31, 2020 * |
| | Stock Class and Equity Futures | 76.6% |
| | Bonds | 20.6% |
| | Short-Term Class | 2.8% |

* Foreign investments - 28.5%
Asset allocations in the pie chart reflects the categorization of assets as defined in the Fund's prospectus in effect as of the time periods indicated above. Financial Statement categorizations conform to accounting standards and will differ from the pie chart. Percentages are adjusted for the effect of future contracts and swap contracts, if applicable.
An unaudited holdings listing for the Fund, which presents direct holdings as well as the pro-rata share of any securities and other investments held indirectly through its investment in underlying Fidelity Central Funds, other than the Commodity Strategy and Money Market Central Funds, is available at institutional.fidelity.com.
Percentages in the above tables are adjusted for the effect of TBA Sale Commitments.
Schedule of Investments December 31, 2020
Showing Percentage of Net Assets
| U.S. Treasury Obligations - 0.3% | | | |
| | | Principal Amount | Value |
| U.S. Treasury Bills, yield at date of purchase 0.06% to 0.08% 2/25/21 to 4/1/21 (a) | | | |
| (Cost $659,915) | | 660,000 | 659,929 |
| | | Shares | Value |
|
| Fixed-Income Funds - 21.8% | | | |
| Fidelity Emerging Markets Debt Central Fund (b) | | 204,144 | $1,912,830 |
| Fidelity Emerging Markets Debt Local Currency Central Fund (b) | | 10,356 | 1,121,798 |
| Fidelity Floating Rate Central Fund (b) | | 18,055 | 1,788,349 |
| Fidelity High Income Central Fund (b) | | 31,383 | 3,440,176 |
| Fidelity Inflation-Protected Bond Index Central Fund (b) | | 73,310 | 8,001,088 |
| Fidelity International Credit Central Fund (b) | | 27,610 | 2,878,568 |
| Fidelity VIP Investment Grade Central Fund (b) | | 269,063 | 30,923,400 |
| iShares 20+ Year Treasury Bond ETF | | 22,101 | 3,485,991 |
| TOTAL FIXED-INCOME FUNDS | | | |
| (Cost $48,942,276) | | | 53,552,200 |
|
| Money Market Funds - 0.1% | | | |
| Fidelity Cash Central Fund 0.11% (c) | | | |
| (Cost $344,046) | | 343,977 | 344,046 |
|
| Equity Funds - 77.8% | | | |
| Domestic Equity Funds - 54.7% | | | |
| Fidelity Commodity Strategy Central Fund (b) | | 366,718 | 1,727,241 |
| Fidelity Real Estate Equity Central Fund (b) | | 2,779 | 324,389 |
| Fidelity U.S. Equity Central Fund (b) | | 1,121,466 | 129,899,414 |
| Market Vectors Gold Miners ETF | | 61,271 | 2,206,981 |
|
| TOTAL DOMESTIC EQUITY FUNDS | | | 134,158,025 |
|
| International Equity Funds - 23.1% | | | |
| Fidelity Emerging Markets Equity Central Fund (b) | | 70,365 | 20,318,472 |
| Fidelity International Equity Central Fund (b) | | 351,087 | 33,865,815 |
| iShares MSCI Japan ETF | | 36,500 | 2,465,940 |
|
| TOTAL INTERNATIONAL EQUITY FUNDS | | | 56,650,227 |
|
| TOTAL EQUITY FUNDS | | | |
| (Cost $132,828,323) | | | 190,808,252 |
| TOTAL INVESTMENT IN SECURITIES - 100.0% | | | |
| (Cost $182,774,560) | | | 245,364,427 |
| NET OTHER ASSETS (LIABILITIES) - 0.0% | | | (87,024) |
| NET ASSETS - 100% | | | $245,277,403 |
| Futures Contracts | | | | | |
| | Number of contracts | Expiration Date | Notional Amount | Value | Unrealized Appreciation/(Depreciation) |
| Purchased | | | | | |
| Equity Index Contracts | | | | | |
| ICE E-mini MSCI EAFE Index Contracts (United States) | 3 | March 2021 | $319,620 | $4,948 | $4,948 |
| Sold | | | | | |
| Equity Index Contracts | | | | | |
| CME E-mini S&P 500 Index Contracts (United States) | 54 | March 2021 | 10,121,760 | (205,786) | (205,786) |
| TOTAL FUTURES CONTRACTS | | | | | $(200,838) |
The notional amount of futures purchased as a percentage of Net Assets is 0.1%
The notional amount of futures sold as a percentage of Net Assets is 4.1%
For the period, the average monthly notional amount at value for futures contracts in the aggregate was $6,413,685.
Security Type Abbreviations
ETF – Exchange-Traded Fund
Legend
(a) Security or a portion of the security was pledged to cover margin requirements for futures contracts. At period end, the value of securities pledged amounted to $659,929.
(b) Affiliated fund that is generally available only to investment companies and other accounts managed by Fidelity Investments. A complete unaudited schedule of portfolio holdings for each Fidelity Central Fund is filed with the SEC for the first and third quarters of each fiscal year on Form N-PORT and is available upon request or at the SEC's website at www.sec.gov. An unaudited holdings listing for the Fund, which presents direct holdings as well as the pro-rata share of securities and other investments held indirectly through its investment in underlying non-money market Fidelity Central Funds, other than the Commodity Strategy Central Fund, is available at fidelity.com and/or institutional.fidelity.com, as applicable. In addition, each Fidelity Central Fund's financial statements, which are not covered by the Fund's Report of Independent Registered Public Accounting Firm, are available on the SEC's website or upon request.
(c) Affiliated fund that is generally available only to investment companies and other accounts managed by Fidelity Investments. The rate quoted is the annualized seven-day yield of the fund at period end. A complete unaudited listing of the fund's holdings as of its most recent quarter end is available upon request. In addition, each Fidelity Central Fund's financial statements, which are not covered by the Fund's Report of Independent Registered Public Accounting Firm, are available on the SEC's website or upon request.
Affiliated Central Funds
Information regarding fiscal year to date income earned by the Fund from investments in Fidelity Central Funds is as follows:
| Fund | Income earned |
| Fidelity Cash Central Fund | $10,466 |
| Fidelity Commodity Strategy Central Fund | 737 |
| Fidelity Communication Services Central Fund | 265,343 |
| Fidelity Consumer Discretionary Central Fund | 64,972 |
| Fidelity Consumer Staples Central Fund | 124,783 |
| Fidelity Emerging Markets Debt Central Fund | 94,333 |
| Fidelity Emerging Markets Debt Local Currency Central Fund | 14,625 |
| Fidelity Emerging Markets Equity Central Fund | 271,096 |
| Fidelity Energy Central Fund | 68,488 |
| Fidelity Financials Central Fund | 566,744 |
| Fidelity Floating Rate Central Fund | 48,757 |
| Fidelity Health Care Central Fund | 1,476,137 |
| Fidelity High Income Central Fund | 161,750 |
| Fidelity Industrials Central Fund | 104,499 |
| Fidelity Inflation-Protected Bond Index Central Fund | 133,385 |
| Fidelity Information Technology Central Fund | 2,920,006 |
| Fidelity International Credit Central Fund | 135,428 |
| Fidelity International Equity Central Fund | 442,161 |
| Fidelity Materials Central Fund | 24,047 |
| Fidelity Money Market Central Fund | 849 |
| Fidelity Real Estate Equity Central Fund | 15,116 |
| Fidelity Securities Lending Cash Central Fund | 1,262 |
| Fidelity U.S. Equity Central Fund | 1,039,153 |
| Fidelity Utilities Central Fund | 62,721 |
| Fidelity VIP Investment Grade Central Fund | 1,247,002 |
| Total | $9,293,860 |
Amounts in the income column in the above table include any capital gain distributions from underlying funds, which are presented in the corresponding line-item in the Statement of Operations, if applicable. Amount for Fidelity Securities Lending Cash Central Fund represents the income earned on investing cash collateral, less rebates paid to borrowers and any lending agent fees associated with the loan, plus any premium payments received for lending certain types of securities.
Fiscal year to date information regarding the Fund’s investments in non-Money Market Central Funds, including the ownership percentage, is presented below.
| Affiliate | Value, beginning of period | Purchases(a) | Sales Proceeds(a) | Realized Gain (loss) | Change in Unrealized appreciation (depreciation) | Value, end of period | % ownership, end of period |
| Fidelity Commodity Strategy Central Fund | $-- | $1,695,476 | $67,711 | $1,024 | $98,452 | $1,727,241 | 1.2 |
| Fidelity Communication Services Central Fund | 9,416,277 | 1,728,142 | 1,110,582 | 53,933 | (1,418,955) | -- | 0.0 |
| Fidelity Consumer Discretionary Central Fund | 10,863,056 | 1,010,939 | 1,422,345 | 148,157 | (3,047,174) | -- | 0.0 |
| Fidelity Consumer Staples Central Fund | 7,130,400 | 897,942 | 778,463 | (27,136) | (150,577) | -- | 0.0 |
| Fidelity Emerging Markets Debt Central Fund | 2,032,872 | 200,586 | 299,106 | (19,347) | (2,175) | 1,912,830 | 0.1 |
| Fidelity Emerging Markets Debt Local Currency Central Fund | -- | 1,036,624 | -- | -- | 85,174 | 1,121,798 | 0.7 |
| Fidelity Emerging Markets Equity Central Fund | 17,660,309 | 933,734 | 1,925,762 | (51,300) | 3,701,491 | 20,318,472 | 0.8 |
| Fidelity Energy Central Fund | 4,513,193 | 271,113 | 317,868 | (208,513) | 991,533 | -- | 0.0 |
| Fidelity Financials Central Fund | 20,166,947 | 1,265,088 | 2,332,932 | (74,503) | (3,182,271) | -- | 0.0 |
| Fidelity Floating Rate Central Fund | 1,049,184 | 904,051 | 138,976 | (2,167) | (23,743) | 1,788,349 | 0.1 |
| Fidelity Health Care Central Fund | 16,864,575 | 1,929,937 | 1,866,236 | 396,869 | (5,492,387) | -- | 0.0 |
| Fidelity High Income Central Fund | 1,073,011 | 2,744,434 | 669,502 | 9,592 | 282,641 | 3,440,176 | 0.1 |
| Fidelity Industrials Central Fund | 10,435,241 | 530,003 | 1,243,779 | 23,325 | (1,532,443) | -- | 0.0 |
| Fidelity Inflation-Protected Bond Index Central Fund | 10,554,824 | 1,141,544 | 4,312,432 | 143,663 | 473,489 | 8,001,088 | 0.6 |
| Fidelity Information Technology Central Fund | 27,161,288 | 3,742,144 | 3,646,295 | 762,527 | (7,930,905) | -- | 0.0 |
| Fidelity International Credit Central Fund | 2,086,650 | 1,353,884 | 643,275 | 15,963 | 65,346 | 2,878,568 | 0.6 |
| Fidelity International Equity Central Fund | 26,155,752 | 7,407,573 | 4,157,876 | 38,288 | 4,422,078 | 33,865,815 | 1.0 |
| Fidelity Materials Central Fund | 2,523,399 | 439,842 | 394,784 | (22,945) | 125,342 | -- | 0.0 |
| Fidelity Real Estate Equity Central Fund | 3,141,098 | 49,236 | 2,167,838 | (531,320) | (166,787) | 324,389 | 0.0 |
| Fidelity U.S. Equity Central Fund | -- | 3,020,342 | 4,241,437 | (1,861,936) | 43,103,582 | 129,899,414 | 0.5 |
| Fidelity Utilities Central Fund | 3,644,535 | 217,429 | 413,381 | (12,477) | (747,362) | -- | 0.0 |
| Fidelity VIP Investment Grade Central Fund | 32,122,153 | 5,860,460 | 8,696,077 | 151,786 | 1,485,078 | 30,923,400 | 0.4 |
| | $208,594,764 | $38,380,523 | $40,846,657 | $(1,066,517) | $31,139,427 | $236,201,540 | |
(a) Excludes the value of securities received and delivered through merger transactions, if applicable.
Investment Valuation
The following is a summary of the inputs used, as of December 31, 2020, involving the Fund's assets and liabilities carried at fair value. The inputs or methodology used for valuing securities may not be an indication of the risk associated with investing in those securities. For more information on valuation inputs, and their aggregation into the levels used below, please refer to the Investment Valuation section in the accompanying Notes to Financial Statements.
| | Valuation Inputs at Reporting Date: |
| Description | Total | Level 1 | Level 2 | Level 3 |
| Investments in Securities: | | | | |
| U.S. Government and Government Agency Obligations | $659,929 | $-- | $659,929 | $-- |
| Fixed-Income Funds | 53,552,200 | 53,552,200 | -- | -- |
| Money Market Funds | 344,046 | 344,046 | -- | -- |
| Equity Funds | 190,808,252 | 190,808,252 | -- | -- |
| Total Investments in Securities: | $245,364,427 | $244,704,498 | $659,929 | $-- |
| Derivative Instruments: | | | | |
| Assets | | | | |
| Futures Contracts | $4,948 | $4,948 | $-- | $-- |
| Total Assets | $4,948 | $4,948 | $-- | $-- |
| Liabilities | | | | |
| Futures Contracts | $(205,786) | $(205,786) | $-- | $-- |
| Total Liabilities | $(205,786) | $(205,786) | $-- | $-- |
| Total Derivative Instruments: | $(200,838) | $(200,838) | $-- | $-- |
Value of Derivative Instruments
The following table is a summary of the Fund's value of derivative instruments by primary risk exposure as of December 31, 2020. For additional information on derivative instruments, please refer to the Derivative Instruments section in the accompanying Notes to Financial Statements.
| Primary Risk Exposure / Derivative Type | Value |
| | Asset | Liability |
| Equity Risk | | |
| Futures Contracts(a) | $4,948 | $(205,786) |
| Total Equity Risk | 4,948 | (205,786) |
| Total Value of Derivatives | $4,948 | $(205,786) |
(a) Reflects gross cumulative appreciation (depreciation) on futures contracts as presented in the Schedule of Investments. In the Statement of Assets and Liabilities, the period end daily variation margin is included in receivable or payable for daily variation margin on futures contracts, and the net cumulative appreciation (depreciation) is included in Total accumulated earnings (loss).
Other Information
The information in the following tables is based on the combined investments of the Fund and its pro-rata share of the investments of Fidelity's Central Funds, other than the Commodity Strategy and Money Market Central Funds. Percentages in the below tables are adjusted for the effect of TBA Sale Commitments.
The composition of credit quality ratings as a percentage of Total Net Assets is as follows (Unaudited):
| U.S. Government and U.S. Government Agency Obligations | 9.2% |
| AAA,AA,A | 2.5% |
| BBB | 3.3% |
| BB | 1.9% |
| B | 1.4% |
| CCC,CC,C | 0.6% |
| D | 0.0% |
| Not Rated | 1.5% |
| Equities | 77.1% |
| Short-Term Investments and Net Other Assets | 2.5% |
| | 100.0% |
We have used ratings from Moody's Investors Service, Inc. Where Moody's® ratings are not available, we have used S&P® ratings. All ratings are as of the date indicated and do not reflect subsequent changes.
Distribution of investments by country or territory of incorporation, as a percentage of Total Net Assets, is as follows (Unaudited):
| United States of America | 71.5% |
| Cayman Islands | 2.9% |
| United Kingdom | 2.8% |
| Japan | 2.3% |
| Switzerland | 2.1% |
| France | 2.1% |
| Netherlands | 2.0% |
| Germany | 1.6% |
| Korea (South) | 1.5% |
| Canada | 1.4% |
| India | 1.0% |
| Others (Individually Less Than 1%) | 8.8% |
| | 100.0% |
See accompanying notes which are an integral part of the financial statements.
Financial Statements
Statement of Assets and Liabilities
| | | December 31, 2020 |
| Assets | | |
Investment in securities, at value — See accompanying schedule:
Unaffiliated issuers (cost $8,125,991) | $8,818,841 | |
| Fidelity Central Funds (cost $174,648,569) | 236,545,586 | |
| Total Investment in Securities (cost $182,774,560) | | $245,364,427 |
| Cash | | 67 |
| Receivable for investments sold | | 100,837 |
| Receivable for fund shares sold | | 669,784 |
| Dividends receivable | | 1,979 |
| Distributions receivable from Fidelity Central Funds | | 29 |
| Prepaid expenses | | 229 |
| Total assets | | 246,137,352 |
| Liabilities | | |
| Payable for investments purchased | $638,160 | |
| Payable for fund shares redeemed | 9,136 | |
| Accrued management fee | 106,132 | |
| Distribution and service plan fees payable | 963 | |
| Payable for daily variation margin on futures contracts | 69,000 | |
| Other affiliated payables | 31,142 | |
| Other payables and accrued expenses | 5,416 | |
| Total liabilities | | 859,949 |
| Net Assets | | $245,277,403 |
| Net Assets consist of: | | |
| Paid in capital | | $181,245,881 |
| Total accumulated earnings (loss) | | 64,031,522 |
| Net Assets | | $245,277,403 |
| Net Asset Value and Maximum Offering Price | | |
| Initial Class: | | |
| Net Asset Value, offering price and redemption price per share ($106,148,190 ÷ 4,825,636 shares) | | $22.00 |
| Service Class: | | |
| Net Asset Value, offering price and redemption price per share ($3,363,124 ÷ 154,265 shares) | | $21.80 |
| Service Class 2: | | |
| Net Asset Value, offering price and redemption price per share ($3,358,868 ÷ 155,118 shares) | | $21.65 |
| Investor Class: | | |
| Net Asset Value, offering price and redemption price per share ($132,407,221 ÷ 6,060,574 shares) | | $21.85 |
See accompanying notes which are an integral part of the financial statements.
Statement of Operations
| | | Year ended December 31, 2020 |
| Investment Income | | |
| Dividends | | $93,711 |
| Interest | | 2,097 |
| Income from Fidelity Central Funds (including $1,262 from security lending) | | 3,797,943 |
| Total income | | 3,893,751 |
| Expenses | | |
| Management fee | $1,157,004 | |
| Transfer agent fees | 228,719 | |
| Distribution and service plan fees | 10,472 | |
| Accounting fees | 107,243 | |
| Custodian fees and expenses | 1,644 | |
| Independent trustees' fees and expenses | 704 | |
| Audit | 51,161 | |
| Legal | 6,588 | |
| Miscellaneous | 1,272 | |
| Total expenses before reductions | 1,564,807 | |
| Expense reductions | (896) | |
| Total expenses after reductions | | 1,563,911 |
| Net investment income (loss) | | 2,329,840 |
| Realized and Unrealized Gain (Loss) | | |
| Net realized gain (loss) on: | | |
| Investment securities: | | |
| Unaffiliated issuers | 145,660 | |
| Fidelity Central Funds | (1,050,528) | |
| Futures contracts | (2,344,164) | |
| Capital gain distributions from Fidelity Central Funds | 5,495,917 | |
| Total net realized gain (loss) | | 2,246,885 |
| Change in net unrealized appreciation (depreciation) on: | | |
| Investment securities: | | |
| Unaffiliated issuers | (134,487) | |
| Fidelity Central Funds | 31,139,413 | |
| Assets and liabilities in foreign currencies | 169 | |
| Futures contracts | (182,399) | |
| Total change in net unrealized appreciation (depreciation) | | 30,822,696 |
| Net gain (loss) | | 33,069,581 |
| Net increase (decrease) in net assets resulting from operations | | $35,399,421 |
See accompanying notes which are an integral part of the financial statements.
Statement of Changes in Net Assets
| | Year ended December 31, 2020 | Year ended December 31, 2019 |
| Increase (Decrease) in Net Assets | | |
| Operations | | |
| Net investment income (loss) | $2,329,840 | $3,300,516 |
| Net realized gain (loss) | 2,246,885 | 3,149,775 |
| Change in net unrealized appreciation (depreciation) | 30,822,696 | 37,397,571 |
| Net increase (decrease) in net assets resulting from operations | 35,399,421 | 43,847,862 |
| Distributions to shareholders | (5,460,436) | (14,862,647) |
| Share transactions - net increase (decrease) | (12,069,893) | (588,981) |
| Total increase (decrease) in net assets | 17,869,092 | 28,396,234 |
| Net Assets | | |
| Beginning of period | 227,408,311 | 199,012,077 |
| End of period | $245,277,403 | $227,408,311 |
See accompanying notes which are an integral part of the financial statements.
Financial Highlights
VIP Asset Manager: Growth Portfolio Initial Class
| Years ended December 31, | 2020 | 2019 | 2018 | 2017 | 2016 |
| Selected Per–Share Data | | | | | |
| Net asset value, beginning of period | $19.20 | $16.76 | $19.21 | $18.81 | $18.90 |
| Income from Investment Operations | | | | | |
| Net investment income (loss)A | .21 | .28 | .26 | .25 | .24 |
| Net realized and unrealized gain (loss) | 3.09 | 3.42 | (1.69) | 2.97 | .20 |
| Total from investment operations | 3.30 | 3.70 | (1.43) | 3.22 | .44 |
| Distributions from net investment income | (.22) | (.29) | (.28) | (.24) | (.26) |
| Distributions from net realized gain | (.27) | (.97) | (.74) | (2.58) | (.26) |
| Total distributions | (.50)B | (1.26) | (1.02) | (2.82) | (.53)B |
| Net asset value, end of period | $22.00 | $19.20 | $16.76 | $19.21 | $18.81 |
| Total ReturnC,D | 17.27% | 22.83% | (7.65)% | 18.73% | 2.52% |
| Ratios to Average Net AssetsE,F | | | | | |
| Expenses before reductions | .67% | .68% | .68% | .69% | .71% |
| Expenses net of fee waivers, if any | .67% | .68% | .68% | .69% | .71% |
| Expenses net of all reductions | .67% | .68% | .68% | .69% | .70% |
| Net investment income (loss) | 1.12% | 1.58% | 1.40% | 1.32% | 1.31% |
| Supplemental Data | | | | | |
| Net assets, end of period (000 omitted) | $106,148 | $99,971 | $89,477 | $106,903 | $99,882 |
| Portfolio turnover rateG | 23% | 35% | 32% | 29% | 142% |
A Calculated based on average shares outstanding during the period.
B Total distributions per share do not sum due to rounding.
C Total returns do not reflect charges attributable to your insurance company's separate account. Inclusion of these charges would reduce the total returns shown.
D Total returns would have been lower if certain expenses had not been reduced during the applicable periods shown.
E Fees and expenses of any underlying mutual funds or exchange-traded funds (ETFs) are not included in the Fund's expense ratio. The Fund indirectly bears its proportionate share of these expenses. For additional expense information related to investments in Fidelity Central Funds, please refer to the "Investments in Fidelity Central Funds" note found in the Notes to Financial Statements section of the most recent Annual or Semi-Annual report.
F Expense ratios reflect operating expenses of the class. Expenses before reductions do not reflect amounts reimbursed, waived, or reduced through arrangements with the investment adviser, brokerage services, or other offset arrangements, if applicable, and do not represent the amount paid by the class during periods when reimbursements, waivers or reductions occur.
G Amount does not include the portfolio activity of any underlying mutual funds or exchange-traded funds (ETFs).
See accompanying notes which are an integral part of the financial statements.
VIP Asset Manager: Growth Portfolio Service Class
| Years ended December 31, | 2020 | 2019 | 2018 | 2017 | 2016 |
| Selected Per–Share Data | | | | | |
| Net asset value, beginning of period | $19.04 | $16.63 | $19.07 | $18.68 | $18.79 |
| Income from Investment Operations | | | | | |
| Net investment income (loss)A | .19 | .26 | .24 | .23 | .22 |
| Net realized and unrealized gain (loss) | 3.05 | 3.39 | (1.68) | 2.96 | .18 |
| Total from investment operations | 3.24 | 3.65 | (1.44) | 3.19 | .40 |
| Distributions from net investment income | (.20) | (.27) | (.26) | (.22) | (.25) |
| Distributions from net realized gain | (.27) | (.97) | (.74) | (2.58) | (.26) |
| Total distributions | (.48)B | (1.24) | (1.00) | (2.80) | (.51) |
| Net asset value, end of period | $21.80 | $19.04 | $16.63 | $19.07 | $18.68 |
| Total ReturnC,D | 17.09% | 22.72% | (7.75)% | 18.70% | 2.34% |
| Ratios to Average Net AssetsE,F | | | | | |
| Expenses before reductions | .77% | .78% | .78% | .79% | .81% |
| Expenses net of fee waivers, if any | .77% | .78% | .78% | .79% | .81% |
| Expenses net of all reductions | .77% | .78% | .78% | .79% | .80% |
| Net investment income (loss) | 1.02% | 1.48% | 1.30% | 1.22% | 1.21% |
| Supplemental Data | | | | | |
| Net assets, end of period (000 omitted) | $3,363 | $3,009 | $2,621 | $3,018 | $2,698 |
| Portfolio turnover rateG | 23% | 35% | 32% | 29% | 142% |
A Calculated based on average shares outstanding during the period.
B Total distributions per share do not sum due to rounding.
C Total returns do not reflect charges attributable to your insurance company's separate account. Inclusion of these charges would reduce the total returns shown.
D Total returns would have been lower if certain expenses had not been reduced during the applicable periods shown.
E Fees and expenses of any underlying mutual funds or exchange-traded funds (ETFs) are not included in the Fund's expense ratio. The Fund indirectly bears its proportionate share of these expenses. For additional expense information related to investments in Fidelity Central Funds, please refer to the "Investments in Fidelity Central Funds" note found in the Notes to Financial Statements section of the most recent Annual or Semi-Annual report.
F Expense ratios reflect operating expenses of the class. Expenses before reductions do not reflect amounts reimbursed, waived, or reduced through arrangements with the investment adviser, brokerage services, or other offset arrangements, if applicable, and do not represent the amount paid by the class during periods when reimbursements, waivers or reductions occur.
G Amount does not include the portfolio activity of any underlying mutual funds or exchange-traded funds (ETFs).
See accompanying notes which are an integral part of the financial statements.
VIP Asset Manager: Growth Portfolio Service Class 2
| Years ended December 31, | 2020 | 2019 | 2018 | 2017 | 2016 |
| Selected Per–Share Data | | | | | |
| Net asset value, beginning of period | $18.91 | $16.53 | $18.95 | $18.58 | $18.70 |
| Income from Investment Operations | | | | | |
| Net investment income (loss)A | .16 | .24 | .21 | .20 | .19 |
| Net realized and unrealized gain (loss) | 3.03 | 3.36 | (1.67) | 2.94 | .18 |
| Total from investment operations | 3.19 | 3.60 | (1.46) | 3.14 | .37 |
| Distributions from net investment income | (.17) | (.24) | (.22) | (.20) | (.23) |
| Distributions from net realized gain | (.27) | (.97) | (.74) | (2.57) | (.26) |
| Total distributions | (.45)B | (1.22)B | (.96) | (2.77) | (.49) |
| Net asset value, end of period | $21.65 | $18.91 | $16.53 | $18.95 | $18.58 |
| Total ReturnC,D | 16.95% | 22.49% | (7.88)% | 18.49% | 2.18% |
| Ratios to Average Net AssetsE,F | | | | | |
| Expenses before reductions | .92% | .93% | .93% | .94% | .96% |
| Expenses net of fee waivers, if any | .92% | .93% | .93% | .94% | .96% |
| Expenses net of all reductions | .92% | .93% | .93% | .94% | .95% |
| Net investment income (loss) | .87% | 1.33% | 1.15% | 1.07% | 1.06% |
| Supplemental Data | | | | | |
| Net assets, end of period (000 omitted) | $3,359 | $3,199 | $2,904 | $3,755 | $3,425 |
| Portfolio turnover rateG | 23% | 35% | 32% | 29% | 142% |
A Calculated based on average shares outstanding during the period.
B Total distributions per share do not sum due to rounding.
C Total returns do not reflect charges attributable to your insurance company's separate account. Inclusion of these charges would reduce the total returns shown.
D Total returns would have been lower if certain expenses had not been reduced during the applicable periods shown.
E Fees and expenses of any underlying mutual funds or exchange-traded funds (ETFs) are not included in the Fund's expense ratio. The Fund indirectly bears its proportionate share of these expenses. For additional expense information related to investments in Fidelity Central Funds, please refer to the "Investments in Fidelity Central Funds" note found in the Notes to Financial Statements section of the most recent Annual or Semi-Annual report.
F Expense ratios reflect operating expenses of the class. Expenses before reductions do not reflect amounts reimbursed, waived, or reduced through arrangements with the investment adviser, brokerage services, or other offset arrangements, if applicable, and do not represent the amount paid by the class during periods when reimbursements, waivers or reductions occur.
G Amount does not include the portfolio activity of any underlying mutual funds or exchange-traded funds (ETFs).
See accompanying notes which are an integral part of the financial statements.
VIP Asset Manager: Growth Portfolio Investor Class
| Years ended December 31, | 2020 | 2019 | 2018 | 2017 | 2016 |
| Selected Per–Share Data | | | | | |
| Net asset value, beginning of period | $19.07 | $16.66 | $19.10 | $18.71 | $18.82 |
| Income from Investment Operations | | | | | |
| Net investment income (loss)A | .20 | .27 | .25 | .23 | .22 |
| Net realized and unrealized gain (loss) | 3.06 | 3.39 | (1.69) | 2.97 | .18 |
| Total from investment operations | 3.26 | 3.66 | (1.44) | 3.20 | .40 |
| Distributions from net investment income | (.21) | (.28) | (.26) | (.23) | (.25) |
| Distributions from net realized gain | (.27) | (.97) | (.74) | (2.58) | (.26) |
| Total distributions | (.48) | (1.25) | (1.00) | (2.81) | (.51) |
| Net asset value, end of period | $21.85 | $19.07 | $16.66 | $19.10 | $18.71 |
| Total ReturnB,C | 17.19% | 22.70% | (7.72)% | 18.68% | 2.35% |
| Ratios to Average Net AssetsD,E | | | | | |
| Expenses before reductions | .75% | .76% | .76% | .77% | .79% |
| Expenses net of fee waivers, if any | .75% | .76% | .76% | .77% | .79% |
| Expenses net of all reductions | .75% | .76% | .76% | .77% | .79% |
| Net investment income (loss) | 1.04% | 1.50% | 1.32% | 1.24% | 1.23% |
| Supplemental Data | | | | | |
| Net assets, end of period (000 omitted) | $132,407 | $121,229 | $104,010 | $116,417 | $97,855 |
| Portfolio turnover rateF | 23% | 35% | 32% | 29% | 142% |
A Calculated based on average shares outstanding during the period.
B Total returns do not reflect charges attributable to your insurance company's separate account. Inclusion of these charges would reduce the total returns shown.
C Total returns would have been lower if certain expenses had not been reduced during the applicable periods shown.
D Fees and expenses of any underlying mutual funds or exchange-traded funds (ETFs) are not included in the Fund's expense ratio. The Fund indirectly bears its proportionate share of these expenses. For additional expense information related to investments in Fidelity Central Funds, please refer to the "Investments in Fidelity Central Funds" note found in the Notes to Financial Statements section of the most recent Annual or Semi-Annual report.
E Expense ratios reflect operating expenses of the class. Expenses before reductions do not reflect amounts reimbursed, waived, or reduced through arrangements with the investment adviser, brokerage services, or other offset arrangements, if applicable, and do not represent the amount paid by the class during periods when reimbursements, waivers or reductions occur.
F Amount does not include the portfolio activity of any underlying mutual funds or exchange-traded funds (ETFs).
See accompanying notes which are an integral part of the financial statements.
Notes to Financial Statements
For the period ended December 31, 2020
1. Organization.
VIP Asset Manager: Growth Portfolio (the Fund) is a fund of Variable Insurance Products Fund V (the Trust) and is authorized to issue an unlimited number of shares. The Trust is registered under the Investment Company Act of 1940, as amended (the 1940 Act), as an open-end management investment company organized as a Massachusetts business trust. Shares of the Fund may only be purchased by insurance companies for the purpose of funding variable annuity or variable life insurance contracts. The Fund offers the following classes of shares: Initial Class shares, Service Class shares, Service Class 2 shares and Investor Class shares. All classes have equal rights and voting privileges, except for matters affecting a single class.
Effective January 1, 2020:
Investment advisers Fidelity Investments Money Management, Inc., FMR Co., Inc., and Fidelity SelectCo, LLC, merged with and into Fidelity Management & Research Company. In connection with the merger transactions, the resulting, merged investment adviser was then redomiciled from Massachusetts to Delaware, changed its corporate structure from a corporation to a limited liability company, and changed its name to "Fidelity Management & Research Company LLC".
Broker-dealer Fidelity Distributors Corporation merged with and into Fidelity Investments Institutional Services Company, Inc. ("FIISC"). FIISC was then redomiciled from Massachusetts to Delaware, changed its corporate structure from a corporation to a limited liability company, and changed its name to "Fidelity Distributors Company LLC".
Fidelity Investments Institutional Operations Company, Inc. converted from a Massachusetts corporation to a Massachusetts LLC, and changed its name to "Fidelity Investments Institutional Operations Company LLC".
2. Investments in Fidelity Central Funds.
The Fund invests in Fidelity Central Funds, which are open-end investment companies generally available only to other investment companies and accounts managed by the investment adviser and its affiliates. The Fund's Schedule of Investments lists each of the Fidelity Central Funds held as of period end, as an investment of the Fund, but does not include the underlying holdings of each Fidelity Central Fund. As an Investing Fund, the Fund indirectly bears its proportionate share of the expenses of the underlying Fidelity Central Funds.
Based on its investment objective, each Fidelity Central Fund may invest or participate in various investment vehicles or strategies that are similar to those of the Fund. These strategies are consistent with the investment objectives of the Fund and may involve certain economic risks which may cause a decline in value of each of the Fidelity Central Funds and thus a decline in the value of the Fund. The following summarizes the Fund's investment in each Fidelity Central Fund.
| Fidelity Central Fund(a) | Investment Manager | Investment Objective | Investment Practices | Expense Ratio(b),(c),(d) |
| Fidelity Commodity Strategy Central Fund | Geode Capital Management, LLC (Geode) | Seeks to provide investment returns that correspond to the performance of the commodities market. | Investment in commodity-related investments through a wholly-owned subsidiary organized under the laws of the Cayman Islands
Futures
| .02% |
| Fidelity Equity Central Funds | FMR | Each fund seeks capital appreciation by investing primarily in common stocks, with a concentration in a particular industry. | Foreign Securities
Restricted Securities
| Less than .005% to .01% |
| Fidelity Emerging Markets Debt Central Fund | FMR | Seeks high total return by normally investing in debt securities of issuers in emerging markets and other debt investments that are tied economically to emerging markets. | Foreign Securities
Restricted Securities
| Less than .005% |
| Fidelity Emerging Markets Equity Central Fund | FMR | Seeks capital appreciation by investing primarily in equity securities of issuers in emerging markets. | Delayed Delivery & When Issued Securities
Foreign Securities
Futures
| .05% |
| Fidelity International Equity Central Fund | FMR | Seeks capital appreciation by investing primarily in non-U.S. based common stocks, including securities of issuers located in emerging markets. | Foreign Securities
Futures
| .01% |
| Fidelity Floating Rate Central Fund | FMR | Seeks a high level of income by normally investing in floating rate loans and other floating rate securities. | Foreign Securities
Loans & Direct Debt Instruments
Restricted Securities | Less than .005% |
| Fidelity High Income Central Fund | FMR | Seeks a high level of income and may also seek capital appreciation by investing primarily in debt securities, preferred stocks, and convertible securities, with an emphasis on lower-quality debt securities. | Loans & Direct Debt Instruments
Restricted Securities
| Less than .005% |
| Fidelity Inflation-Protected Bond Index Central Fund | FMR | Seeks to provide investment results that correspond to the performance of the inflation-protected United States Treasury market, and may invest in derivatives. | | Less than .005% |
| Fidelity VIP Investment Grade Central Fund | FMR | Seeks a high level of current income by normally investing in investment-grade debt securities and repurchase agreements. | Delayed Delivery & When Issued Securities
Repurchase Agreements
Restricted Securities | Less than
.005% |
| Fidelity Real Estate Equity Central Fund | FMR | Seeks above-average income and long-term capital growth by investing primarily in equity securities of issuers in the real estate industry. | | Less than
.005% |
| Fidelity International Credit Central Fund | FMR | Seeks a high level of current income by normally investing in debt securities of foreign issuers, including debt securities of issuers located in emerging markets. Foreign currency exposure is hedged utilizing foreign currency contracts. | Foreign Securities
Forward Foreign Currency Contracts
Futures
Options
Restricted Securities
Swaps | .01% |
| Fidelity U.S. Equity Central Fund | FMR | Seeks capital appreciation by investing primarily in common stocks, allocated across different market sectors. | Foreign Securities
Futures
Restricted Securities
| Less than
.005% |
| Fidelity Emerging Markets Debt Local Currency Central Fund | FMR | Seeks high total return by normally
investing in debt securities of issuers in emerging markets and other debt investments that are tied economically to emerging markets and denominated in the local currency of the issuer. | Foreign Securities
| .04% |
| Fidelity Money Market Central Funds | FMR | Each fund seeks to obtain a high level of current income consistent with the preservation of capital and liquidity. | Short-term Investments | Less than .005% to .01% |
(a) The Fidelity Equity Central Funds merged into Fidelity U.S. Equity Central Fund on September 18, 2020.
(b) Expenses expressed as a percentage of average net assets and are as of each underlying Central Fund's most recent annual or semi-annual shareholder report.
(c) For Fidelity U.S. Equity Central Fund, Fund commenced operations on September 18, 2020.
(d) For Fidelity Emerging Markets Debt Local Currency Central Fund, Fund commenced operations on September 23, 2020.
An unaudited holdings listing for the Fund, which presents direct holdings as well as the pro-rata share of any securities and other investments held indirectly through its investment in underlying non-money market Fidelity Central Funds, is available at institutional.fidelity.com A complete unaudited list of holdings for each Fidelity Central Fund is available upon request or at the Securities and Exchange Commission (the SEC) website at www.sec.gov. In addition, the financial statements of the Fidelity Central Funds which contain the significant accounting policies (including investment valuation policies) of those funds, which are not covered by the Fund's Report of Independent Registered Public Accounting Firm, are available on the SEC website or upon request.
3. Significant Accounting Policies.
The Fund is an investment company and applies the accounting and reporting guidance of the Financial Accounting Standards Board (FASB) Accounting Standards Codification Topic 946 Financial Services - Investment Companies. The financial statements have been prepared in conformity with accounting principles generally accepted in the United States of America (GAAP), which require management to make certain estimates and assumptions at the date of the financial statements. Actual results could differ from those estimates. Subsequent events, if any, through the date that the financial statements were issued have been evaluated in the preparation of the financial statements. The following summarizes the significant accounting policies of the Fund:
Investment Valuation. Investments are valued as of 4:00 p.m. Eastern time on the last calendar day of the period. The Board of Trustees (the Board) has delegated the day to day responsibility for the valuation of the Fund's investments to the Fair Value Committee (the Committee) established by the Fund's investment adviser. In accordance with valuation policies and procedures approved by the Board, the Fund attempts to obtain prices from one or more third party pricing vendors or brokers to value its investments. When current market prices, quotations or currency exchange rates are not readily available or reliable, investments will be fair valued in good faith by the Committee, in accordance with procedures adopted by the Board. Factors used in determining fair value vary by investment type and may include market or investment specific events, changes in interest rates and credit quality. The frequency with which these procedures are used cannot be predicted and they may be utilized to a significant extent. The Committee oversees the Fund's valuation policies and procedures and reports to the Board on the Committee's activities and fair value determinations. The Board monitors the appropriateness of the procedures used in valuing the Fund's investments and ratifies the fair value determinations of the Committee. The Fund categorizes the inputs to valuation techniques used to value its investments into a disclosure hierarchy consisting of three levels as shown below:
- Level 1 – quoted prices in active markets for identical investments
- Level 2 – other significant observable inputs (including quoted prices for similar investments, interest rates, prepayment speeds, etc.)
- Level 3 – unobservable inputs (including the Fund's own assumptions based on the best information available)
Valuation techniques used to value the Fund's investments by major category are as follows. Debt securities, including restricted securities, are valued based on evaluated prices received from third party pricing vendors or from brokers who make markets in such securities. U.S. government and government agency obligations are valued by pricing vendors who utilize matrix pricing which considers yield or price of bonds of comparable quality, coupon, maturity and type or by broker-supplied prices. When independent prices are unavailable or unreliable, debt securities may be valued utilizing pricing methodologies which consider similar factors that would be used by third party pricing vendors. Debt securities are generally categorized as Level 2 in the hierarchy but may be Level 3 depending on the circumstances.
Exchange-Traded Funds (ETFs are valued at their last sale price or official closing price as reported by a third party pricing vendor on the primary market or exchange on which they are traded and are categorized as Level 1 in the hierarchy. In the event there were no sales during the day but the exchange reports a closing bid level, ETFs are valued at the closing bid and would be categorized as Level 1 in the hierarchy. In the event there was no closing bid, ETFs may be valued by another method that the Board believes reflects fair value in accordance with the Board's fair value pricing policies and may be categorized as Level 2 in the hierarchy.
Futures contracts are valued at the settlement price established each day by the board of trade or exchange on which they are traded and are categorized as Level 1 in the hierarchy. Investments in open-end mutual funds, including the Fidelity Central Funds, are valued at their closing net asset value (NAV) each business day and are categorized as Level 1 in the hierarchy.
Changes in valuation techniques may result in transfers in or out of an assigned level within the disclosure hierarchy. The aggregate value of investments by input level, as of December 31, 2020, is included at the end of the Fund's Schedule of Investments.
Foreign Currency. Certain Funds may use foreign currency contracts to facilitate transactions in foreign-denominated securities. Gains and losses from these transactions may arise from changes in the value of the foreign currency or if the counterparties do not perform under the contracts' terms.
Foreign-denominated assets, including investment securities, and liabilities are translated into U.S. dollars at the exchange rates at period end. Purchases and sales of investment securities, income and dividends received, and expenses denominated in foreign currencies are translated into U.S. dollars at the exchange rate in effect on the transaction date.
The effects of exchange rate fluctuations on investments are included with the net realized and unrealized gain (loss) on investment securities. Other foreign currency transactions resulting in realized and unrealized gain (loss) are disclosed separately.
Investment Transactions and Income. For financial reporting purposes, the Fund's investment holdings and NAV include trades executed through the end of the last business day of the period. The NAV per share for processing shareholder transactions is calculated as of the close of business of the New York Stock Exchange (NYSE), normally 4:00 p.m. Eastern time and includes trades executed through the end of the prior business day. Gains and losses on securities sold are determined on the basis of identified cost and include proceeds received from litigation. Dividend income is recorded on the ex-dividend date, except for certain dividends from foreign securities where the ex-dividend date may have passed, which are recorded as soon as the Fund is informed of the ex-dividend date. Non-cash dividends included in dividend income, if any, are recorded at the fair market value of the securities received. Income and capital gain distributions from Fidelity Central Funds, if any, are recorded on the ex-dividend date. Certain distributions received by the Fund represent a return of capital or capital gain. The Fund determines the components of these distributions subsequent to the ex-dividend date, based upon receipt of tax filings or other correspondence relating to the underlying investment. These distributions are recorded as a reduction of cost of investments and/or as a realized gain. Interest income is accrued as earned and includes coupon interest and amortization of premium and accretion of discount on debt securities as applicable. Investment income is recorded net of foreign taxes withheld where recovery of such taxes is uncertain.
Class Allocations and Expenses. Investment income, realized and unrealized capital gains and losses, common expenses of the Fund, and certain fund-level expense reductions, if any, are allocated daily on a pro-rata basis to each class based on the relative net assets of each class to the total net assets of the Fund. Each class differs with respect to transfer agent and distribution and service plan fees incurred. Certain expense reductions may also differ by class. For the reporting period, the allocated portion of income and expenses to each class as a percent of its average net assets may vary due to the timing of recording these transactions in relation to fluctuating net assets of the classes. Expenses directly attributable to a fund are charged to that fund. Expenses attributable to more than one fund are allocated among the respective funds on the basis of relative net assets or other appropriate methods. Expense estimates are accrued in the period to which they relate and adjustments are made when actual amounts are known. Expenses included in the accompanying financial statements reflect the expenses of the Fund and do not include any expenses associated with any underlying mutual funds or exchange-traded funds (ETFs). Although not included in the Fund's expenses, the Fund indirectly bears its proportionate share of any underlying mutual funds or exchange-traded funds (ETFs) through the impact of these expenses on each underlying mutual fund's or exchange-traded fund's (ETFs) NAV.
Income Tax Information and Distributions to Shareholders. Each year, the Fund intends to qualify as a regulated investment company under Subchapter M of the Internal Revenue Code, including distributing substantially all of its taxable income and realized gains. As a result, no provision for U.S. Federal income taxes is required. As of December 31, 2020, the Fund did not have any unrecognized tax benefits in the financial statements; nor is the Fund aware of any tax positions for which it is reasonably possible that the total amounts of unrecognized tax benefits will significantly change in the next twelve months. The Fund files a U.S. federal tax return, in addition to state and local tax returns as required. The Fund's federal income tax returns are subject to examination by the Internal Revenue Service (IRS) for a period of three fiscal years after they are filed. State and local tax returns may be subject to examination for an additional fiscal year depending on the jurisdiction. Foreign taxes are provided for based on the Fund's understanding of the tax rules and rates that exist in the foreign markets in which it invests.
Distributions are declared and recorded on the ex-dividend date. Income and capital gain distributions are declared separately for each class. Income and capital gain distributions are determined in accordance with income tax regulations, which may differ from GAAP.
Capital accounts within the financial statements are adjusted for permanent book-tax differences. These adjustments have no impact on net assets or the results of operations. Capital accounts are not adjusted for temporary book-tax differences which will reverse in a subsequent period.
Book-tax differences are primarily due to the short-term gain distributions from the underlying mutual funds or exchange-traded funds (ETFs), futures contracts and losses deferred due to wash sales.
As of period end, the cost and unrealized appreciation (depreciation) in securities, and derivatives if applicable, for federal income tax purposes were as follows:
| Gross unrealized appreciation | $64,215,950 |
| Gross unrealized depreciation | (1,225,718) |
| Net unrealized appreciation (depreciation) | $62,990,232 |
| Tax Cost | $182,374,195 |
The tax-based components of distributable earnings as of period end were as follows:
| Undistributed ordinary income | $9,861 |
| Undistributed long-term capital gain | $1,450,654 |
| Net unrealized appreciation (depreciation) on securities and other investments | $62,990,404 |
The tax character of distributions paid was as follows:
| | December 31, 2020 | December 31, 2019 |
| Ordinary Income | $4,089,266 | $ 3,696,617 |
| Long-term Capital Gains | 1,371,170 | 11,166,030 |
| Total | $5,460,436 | $ 14,862,647 |
4. Derivative Instruments.
Risk Exposures and the Use of Derivative Instruments. The Fund's investment objective allows the Fund to enter into various types of derivative contracts, including futures contracts. Derivatives are investments whose value is primarily derived from underlying assets, indices or reference rates and may be transacted on an exchange or over-the-counter (OTC). Derivatives may involve a future commitment to buy or sell a specified asset based on specified terms, to exchange future cash flows at periodic intervals based on a notional principal amount, or for one party to make one or more payments upon the occurrence of specified events in exchange for periodic payments from the other party.
The Fund used derivatives to increase returns and to manage exposure to certain risks as defined below. The success of any strategy involving derivatives depends on analysis of numerous economic factors, and if the strategies for investment do not work as intended, the Fund may not achieve its objectives.
The Fund's use of derivatives increased or decreased its exposure to the following risk:
| Equity Risk | Equity risk relates to the fluctuations in the value of financial instruments as a result of changes in market prices (other than those arising from interest rate risk or foreign exchange risk), whether caused by factors specific to an individual investment, its issuer, or all factors affecting all instruments traded in a market or market segment.
|
The Fund is also exposed to additional risks from investing in derivatives, such as liquidity risk and counterparty credit risk. Liquidity risk is the risk that the Fund will be unable to close out the derivative in the open market in a timely manner. Counterparty credit risk is the risk that the counterparty will not be able to fulfill its obligation to the Fund. Counterparty credit risk related to exchange-traded futures contracts may be mitigated by the protection provided by the exchange on which they trade.
Investing in derivatives may involve greater risks than investing in the underlying assets directly and, to varying degrees, may involve risk of loss in excess of any initial investment and collateral received and amounts recognized in the Statement of Assets and Liabilities. In addition, there may be the risk that the change in value of the derivative contract does not correspond to the change in value of the underlying instrument.
Futures Contracts. A futures contract is an agreement between two parties to buy or sell a specified underlying instrument for a fixed price at a specified future date. The Fund used futures contracts to manage its exposure to the stock market.
Upon entering into a futures contract, a fund is required to deposit either cash or securities (initial margin) with a clearing broker in an amount equal to a certain percentage of the face value of the contract. Futures contracts are marked-to-market daily and subsequent daily payments (variation margin) are made or received by a fund depending on the daily fluctuations in the value of the futures contracts and are recorded as unrealized appreciation or (depreciation). This receivable and/or payable, if any, is included in daily variation margin on futures contracts in the Statement of Assets and Liabilities. Realized gain or (loss) is recorded upon the expiration or closing of a futures contract. The net realized gain (loss) and change in net unrealized appreciation (depreciation) on futures contracts during the period is presented in the Statement of Operations.
Any open futures contracts at period end are presented in the Schedule of Investments under the caption "Futures Contracts". The notional amount at value reflects each contract's exposure to the underlying instrument or index at period end. Securities deposited to meet initial margin requirements are identified in the Schedule of Investments.
5. Purchases and Sales of Investments.
Purchases and sales of securities, other than short-term securities, are noted in the table below.
| | Purchases ($) | Sales ($) |
| VIP Asset Manager: Growth Portfolio | 50,530,981 | 58,947,128 |
6. Fees and Other Transactions with Affiliates.
Management Fee. Fidelity Management & Research Company LLC (the investment adviser) and its affiliates provide the Fund with investment management related services for which the Fund pays a monthly management fee. The management fee is the sum of an individual fund fee rate that is based on an annual rate of .30% of the Fund's average net assets and an annualized group fee rate that averaged .23% during the period. The group fee rate is based upon the monthly average net assets of a group of registered investment companies with which the investment adviser has management contracts. The group fee rate decreases as assets under management increase and increases as assets under management decrease. For the reporting period, the total annual management fee rate was .53% of the Fund's average net assets.
The investment adviser pays a portion of the management fees received from the Fund to the Fidelity Central Funds' investment advisers, who are also affiliates, for managing the assets of the Fidelity Central Funds.
Distribution and Service Plan Fees. In accordance with Rule 12b-1 of the 1940 Act, the Fund has adopted separate 12b-1 Plans for each Service Class of shares. Each Service Class pays Fidelity Distributors Company LLC (FDC), an affiliate of the investment adviser, a service fee. For the period, the service fee is based on an annual rate of .10% of Service Class' average net assets and .25% of Service Class 2's average net assets.
For the period, total fees, all of which were re-allowed to insurance companies for the distribution of shares and providing shareholder support services, were as follows:
| Service Class | $2,943 |
| Service Class 2 | 7,529 |
| | $10,472 |
Transfer Agent Fees. Fidelity Investments Institutional Operations Company LLC (FIIOC), an affiliate of the investment adviser, is the Fund's transfer, dividend disbursing, and shareholder servicing agent. FIIOC receives an asset-based fee with respect to each class. Each class pays a fee for transfer agent services, typesetting and printing and mailing of shareholder reports, excluding mailing of proxy statements. Effective February 1, 2020, the Board approved to change the fee from .145% to .142% for Investor Class, and from .065% to .064% for all other classes. For the period, transfer agent fees for each class were as follows:
| | Amount | % of Class-Level Average Net Assets |
| Initial Class | $60,720 | .06 |
| Service Class | 1,870 | .06 |
| Service Class 2 | 1,913 | .06 |
| Investor Class | 164,216 | .14 |
| | $228,719 | |
Accounting Fees. Fidelity Service Company, Inc. (FSC), an affiliate of the investment adviser, maintains the Fund's accounting records. The accounting fee is based on the level of average net assets for each month. For the period, the fees were equivalent to the following annual rates:
| | % of Average Net Assets |
| VIP Asset Manager: Growth Portfolio | .05 |
Brokerage Commissions. A portion of portfolio transactions were placed with brokerage firms which are affiliates of the investment adviser. Brokerage commissions are included in net realized gain (loss) and change in net unrealized appreciation (depreciation) in the Statement of Operations. The commissions paid to these affiliated firms were as follows:
| | Amount |
| VIP Asset Manager: Growth Portfolio | $15 |
Interfund Trades. Funds may purchase from or sell securities to other Fidelity Funds under procedures adopted by the Board. The procedures have been designed to ensure these interfund trades are executed in accordance with Rule 17a-7 of the 1940 Act. Interfund trades are included within the respective purchases and sales amounts shown in the Purchases and Sales of Investments note, and amounted to $283,181 and $0, respectively.
7. Committed Line of Credit.
Certain Funds participate with other funds managed by the investment adviser or an affiliate in a $4.25 billion credit facility (the "line of credit") to be utilized for temporary or emergency purposes to fund shareholder redemptions or for other short-term liquidity purposes. The participating funds have agreed to pay commitment fees on their pro-rata portion of the line of credit, which are reflected in Miscellaneous expenses on the Statement of Operations, and are as follows:
| | Amount |
| VIP Asset Manager: Growth Portfolio | $505 |
During the period, there were no borrowings on this line of credit.
8. Security Lending.
Funds lend portfolio securities from time to time in order to earn additional income. Lending agents are used, including National Financial Services (NFS), an affiliate of the investment adviser. Pursuant to a securities lending agreement, NFS will receive a fee, which is capped at 9.9% of a fund's daily lending revenue, for its services as lending agent. A fund may lend securities to certain qualified borrowers, including NFS. On the settlement date of the loan, a fund receives collateral (in the form of U.S. Treasury obligations, letters of credit and/or cash) against the loaned securities and maintains collateral in an amount not less than 100% of the market value of the loaned securities during the period of the loan. The market value of the loaned securities is determined at the close of business of a fund and any additional required collateral is delivered to a fund on the next business day. A fund or borrower may terminate the loan at any time, and if the borrower defaults on its obligation to return the securities loaned because of insolvency or other reasons, a fund may apply collateral received from the borrower against the obligation. A fund may experience delays and costs in recovering the securities loaned. Any cash collateral received is invested in the Fidelity Securities Lending Cash Central Fund. Any loaned securities are identified as such in the Schedule of Investments, and the value of loaned securities and cash collateral at period end, as applicable, are presented in the Statement of Assets and Liabilities. Security lending income represents the income earned on investing cash collateral, less rebates paid to borrowers and any lending agent fees associated with the loan, plus any premium payments received for lending certain types of securities. Security lending income is presented in the Statement of Operations as a component of income from Fidelity Central Funds. Affiliated security lending activity, if any, was as follows:
| | Total Security Lending Income Fees Paid to NFS | Security Lending Income From Securities Loaned to NFS | Value of Securities Loaned to NFS at Period End |
| VIP Asset Manager: Growth Portfolio | $139 | $– | $– |
9. Expense Reductions.
During the period the investment adviser or an affiliate reimbursed and/or waived a portion of fund-level operating expenses in the amount of $896.
10. Distributions to Shareholders.
Distributions to shareholders of each class were as follows:
| | Year ended
December 31, 2020 | Year ended
December 31, 2019 |
| Distributions to shareholders | | |
| Initial Class | $2,413,002 | $6,588,499 |
| Service Class | 72,979 | 193,404 |
| Service Class 2 | 69,972 | 211,636 |
| Investor Class | 2,904,483 | 7,869,108 |
| Total | $5,460,436 | $14,862,647 |
11. Share Transactions.
Transactions for each class of shares were as follows:
| | Shares | Shares | Dollars | Dollars |
| | Year ended December 31, 2020 | Year ended December 31, 2019 | Year ended December 31, 2020 | Year ended December 31, 2019 |
| Initial Class | | | | |
| Shares sold | 95,855 | 88,245 | $1,850,935 | $1,585,026 |
| Reinvestment of distributions | 113,745 | 372,512 | 2,413,002 | 6,588,499 |
| Shares redeemed | (590,642) | (593,287) | (11,300,119) | (10,626,407) |
| Net increase (decrease) | (381,042) | (132,530) | $(7,036,182) | $(2,452,882) |
| Service Class | | | | |
| Shares sold | 2,931 | 3,819 | $60,678 | $67,537 |
| Reinvestment of distributions | 3,471 | 11,036 | 72,979 | 193,404 |
| Shares redeemed | (10,186) | (14,474) | (193,366) | (260,577) |
| Net increase (decrease) | (3,784) | 381 | $(59,709) | $364 |
| Service Class 2 | | | | |
| Shares sold | 6,605 | 13,781 | $125,398 | $243,776 |
| Reinvestment of distributions | 3,361 | 12,188 | 69,972 | 211,636 |
| Shares redeemed | (24,016) | (32,496) | (452,650) | (579,318) |
| Net increase (decrease) | (14,050) | (6,527) | $(257,280) | $(123,906) |
| Investor Class | | | | |
| Shares sold | 499,259 | 344,490 | $9,393,039 | $6,210,062 |
| Reinvestment of distributions | 137,918 | 448,003 | 2,904,483 | 7,869,108 |
| Shares redeemed | (932,319) | (680,860) | (17,014,244) | (12,091,727) |
| Net increase (decrease) | (295,142) | 111,633 | $(4,716,722) | $1,987,443 |
12. Other.
The Fund's organizational documents provide former and current trustees and officers with a limited indemnification against liabilities arising in connection with the performance of their duties to the Fund. In the normal course of business, the Fund may also enter into contracts that provide general indemnifications. The Fund's maximum exposure under these arrangements is unknown as this would be dependent on future claims that may be made against the Fund. The risk of material loss from such claims is considered remote.
At the end of the period, the investment adviser or its affiliates were the owners of record of 86% of the total outstanding shares of the Fund.
13. Coronavirus (COVID-19) Pandemic.
An outbreak of COVID-19 first detected in China during December 2019 has since spread globally and was declared a pandemic by the World Health Organization during March 2020. Developments that disrupt global economies and financial markets, such as the COVID-19 pandemic, may magnify factors that affect the Fund's performance.
Report of Independent Registered Public Accounting Firm
To the Board of Trustees of Variable Insurance Products Fund V and Shareholders of VIP Asset Manager: Growth Portfolio
Opinion on the Financial Statements and Financial Highlights
We have audited the accompanying statement of assets and liabilities of VIP Asset Manager: Growth Portfolio (the "Fund"), a fund of Variable Insurance Products Fund V, including the schedule of investments, as of December 31, 2020, the related statement of operations for the year then ended, the statement of changes in net assets for each of the two years in the period then ended, the financial highlights for each of the five years in the period then ended, and the related notes. In our opinion, the financial statements and financial highlights present fairly, in all material respects, the financial position of the Fund as of December 31, 2020, and the results of its operations for the year then ended, the changes in its net assets for each of the two years in the period then ended, and the financial highlights for each of the five years in the period then ended in conformity with accounting principles generally accepted in the United States of America.
Basis for Opinion
These financial statements and financial highlights are the responsibility of the Fund's management. Our responsibility is to express an opinion on the Fund's financial statements and financial highlights based on our audits. We are a public accounting firm registered with the Public Company Accounting Oversight Board (United States) (PCAOB) and are required to be independent with respect to the Fund in accordance with the U.S. federal securities laws and the applicable rules and regulations of the Securities and Exchange Commission and the PCAOB.
We conducted our audits in accordance with the standards of the PCAOB. Those standards require that we plan and perform the audit to obtain reasonable assurance about whether the financial statements and financial highlights are free of material misstatement, whether due to error or fraud. The Fund is not required to have, nor were we engaged to perform, an audit of its internal control over financial reporting. As part of our audits we are required to obtain an understanding of internal control over financial reporting but not for the purpose of expressing an opinion on the effectiveness of the Fund’s internal control over financial reporting. Accordingly, we express no such opinion.
Our audits included performing procedures to assess the risks of material misstatement of the financial statements and financial highlights, whether due to error or fraud, and performing procedures that respond to those risks. Such procedures included examining, on a test basis, evidence regarding the amounts and disclosures in the financial statements and financial highlights. Our audits also included evaluating the accounting principles used and significant estimates made by management, as well as evaluating the overall presentation of the financial statements and financial highlights. Our procedures included confirmation of securities owned as of December 31, 2020, by correspondence with the custodian and brokers; when replies were not received from brokers, we performed other auditing procedures. We believe that our audits provide a reasonable basis for our opinion.
/s/ Deloitte & Touche LLP
Boston, Massachusetts
February 12, 2021
We have served as the auditor of one or more of the Fidelity investment companies since 1999.
Trustees and Officers
The Trustees, Members of the Advisory Board (if any), and officers of the trust and fund, as applicable, are listed below. The Board of Trustees governs the fund and is responsible for protecting the interests of shareholders. The Trustees are experienced executives who meet periodically throughout the year to oversee the fund's activities, review contractual arrangements with companies that provide services to the fund, oversee management of the risks associated with such activities and contractual arrangements, and review the fund's performance. Each of the Trustees oversees 280 funds.
The Trustees hold office without limit in time except that (a) any Trustee may resign; (b) any Trustee may be removed by written instrument, signed by at least two-thirds of the number of Trustees prior to such removal; (c) any Trustee who requests to be retired or who has become incapacitated by illness or injury may be retired by written instrument signed by a majority of the other Trustees; and (d) any Trustee may be removed at any special meeting of shareholders by a two-thirds vote of the outstanding voting securities of the trust. Each Trustee who is not an interested person (as defined in the 1940 Act) of the trust and the fund is referred to herein as an Independent Trustee. Each Independent Trustee shall retire not later than the last day of the calendar year in which his or her 75th birthday occurs. The Independent Trustees may waive this mandatory retirement age policy with respect to individual Trustees. Officers and Advisory Board Members hold office without limit in time, except that any officer or Advisory Board Member may resign or may be removed by a vote of a majority of the Trustees at any regular meeting or any special meeting of the Trustees. Except as indicated, each individual has held the office shown or other offices in the same company for the past five years.
The fund’s Statement of Additional Information (SAI) includes more information about the Trustees. To request a free copy, call Fidelity at 1-877-208-0098.
Experience, Skills, Attributes, and Qualifications of the Trustees. The Governance and Nominating Committee has adopted a statement of policy that describes the experience, qualifications, attributes, and skills that are necessary and desirable for potential Independent Trustee candidates (Statement of Policy). The Board believes that each Trustee satisfied at the time he or she was initially elected or appointed a Trustee, and continues to satisfy, the standards contemplated by the Statement of Policy. The Governance and Nominating Committee also engages professional search firms to help identify potential Independent Trustee candidates who have the experience, qualifications, attributes, and skills consistent with the Statement of Policy. From time to time, additional criteria based on the composition and skills of the current Independent Trustees, as well as experience or skills that may be appropriate in light of future changes to board composition, business conditions, and regulatory or other developments, have also been considered by the professional search firms and the Governance and Nominating Committee. In addition, the Board takes into account the Trustees' commitment and participation in Board and committee meetings, as well as their leadership of standing and ad hoc committees throughout their tenure.
In determining that a particular Trustee was and continues to be qualified to serve as a Trustee, the Board has considered a variety of criteria, none of which, in isolation, was controlling. The Board believes that, collectively, the Trustees have balanced and diverse experience, qualifications, attributes, and skills, which allow the Board to operate effectively in governing the fund and protecting the interests of shareholders. Information about the specific experience, skills, attributes, and qualifications of each Trustee, which in each case led to the Board's conclusion that the Trustee should serve (or continue to serve) as a trustee of the fund, is provided below.
Board Structure and Oversight Function. Abigail P. Johnson is an interested person and currently serves as Chairman. The Trustees have determined that an interested Chairman is appropriate and benefits shareholders because an interested Chairman has a personal and professional stake in the quality and continuity of services provided to the fund. Independent Trustees exercise their informed business judgment to appoint an individual of their choosing to serve as Chairman, regardless of whether the Trustee happens to be independent or a member of management. The Independent Trustees have determined that they can act independently and effectively without having an Independent Trustee serve as Chairman and that a key structural component for assuring that they are in a position to do so is for the Independent Trustees to constitute a substantial majority for the Board. The Independent Trustees also regularly meet in executive session. Arthur E. Johnson serves as Chairman of the Independent Trustees and as such (i) acts as a liaison between the Independent Trustees and management with respect to matters important to the Independent Trustees and (ii) with management prepares agendas for Board meetings.
Fidelity® funds are overseen by different Boards of Trustees. The fund's Board oversees Fidelity's investment-grade bond, money market, asset allocation and certain equity funds, and other Boards oversee Fidelity's high income and other equity funds. The asset allocation funds may invest in Fidelity® funds that are overseen by such other Boards. The use of separate Boards, each with its own committee structure, allows the Trustees of each group of Fidelity® funds to focus on the unique issues of the funds they oversee, including common research, investment, and operational issues. On occasion, the separate Boards establish joint committees to address issues of overlapping consequences for the Fidelity® funds overseen by each Board.
The Trustees operate using a system of committees to facilitate the timely and efficient consideration of all matters of importance to the Trustees, the fund, and fund shareholders and to facilitate compliance with legal and regulatory requirements and oversight of the fund's activities and associated risks. The Board, acting through its committees, has charged FMR and its affiliates with (i) identifying events or circumstances the occurrence of which could have demonstrably adverse effects on the fund's business and/or reputation; (ii) implementing processes and controls to lessen the possibility that such events or circumstances occur or to mitigate the effects of such events or circumstances if they do occur; and (iii) creating and maintaining a system designed to evaluate continuously business and market conditions in order to facilitate the identification and implementation processes described in (i) and (ii) above. Because the day-to-day operations and activities of the fund are carried out by or through FMR, its affiliates, and other service providers, the fund's exposure to risks is mitigated but not eliminated by the processes overseen by the Trustees. While each of the Board's committees has responsibility for overseeing different aspects of the fund's activities, oversight is exercised primarily through the Operations and Audit Committees. In addition, an ad hoc Board committee of Independent Trustees has worked with FMR to enhance the Board's oversight of investment and financial risks, legal and regulatory risks, technology risks, and operational risks, including the development of additional risk reporting to the Board. Appropriate personnel, including but not limited to the fund's Chief Compliance Officer (CCO), FMR's internal auditor, the independent accountants, the fund's Treasurer and portfolio management personnel, make periodic reports to the Board's committees, as appropriate, including an annual review of Fidelity's risk management program for the Fidelity® funds. The responsibilities of each standing committee, including their oversight responsibilities, are described further under "Standing Committees of the Trustees."
Interested Trustees*:
Correspondence intended for a Trustee who is an interested person may be sent to Fidelity Investments, 245 Summer Street, Boston, Massachusetts 02210.
Name, Year of Birth; Principal Occupations and Other Relevant Experience+
Abigail P. Johnson (1961)
Year of Election or Appointment: 2009
Trustee
Chairman of the Board of Trustees
Ms. Johnson also serves as Trustee of other Fidelity® funds. Ms. Johnson serves as Chairman (2016-present), Chief Executive Officer (2014-present), and Director (2007-present) of FMR LLC (diversified financial services company), President of Fidelity Financial Services (2012-present) and President of Personal, Workplace and Institutional Services (2005-present). Ms. Johnson is Chairman and Director of Fidelity Management & Research Company LLC (investment adviser firm, 2011-present). Previously, Ms. Johnson served as Chairman and Director of FMR Co., Inc. (investment adviser firm, 2011-2019), Vice Chairman (2007-2016) and President (2013-2016) of FMR LLC, President and a Director of Fidelity Management & Research Company (2001-2005), a Trustee of other investment companies advised by Fidelity Management & Research Company, Fidelity Investments Money Management, Inc. (investment adviser firm), and FMR Co., Inc. (2001-2005), Senior Vice President of the Fidelity® funds (2001-2005), and managed a number of Fidelity® funds. Ms. Abigail P. Johnson and Mr. Arthur E. Johnson are not related.
Jennifer Toolin McAuliffe (1959)
Year of Election or Appointment: 2016
Trustee
Ms. McAuliffe also serves as Trustee of other Fidelity® funds. Previously, Ms. McAuliffe served as Co-Head of Fixed Income of Fidelity Investments Limited (now known as FIL Limited (FIL)) (diversified financial services company), Director of Research for FIL’s credit and quantitative teams in London, Hong Kong and Tokyo and Director of Research for taxable and municipal bonds at Fidelity Investments Money Management, Inc. Ms. McAuliffe previously served as a member of the Advisory Board of certain Fidelity® funds (2016). Ms. McAuliffe was previously a lawyer at Ropes & Gray LLP and currently serves as director or trustee of several not-for-profit entities.
* Determined to be an “Interested Trustee” by virtue of, among other things, his or her affiliation with the trust or various entities under common control with FMR.
+ The information includes the Trustee's principal occupation during the last five years and other information relating to the experience, attributes, and skills relevant to the Trustee's qualifications to serve as a Trustee, which led to the conclusion that the Trustee should serve as a Trustee for the fund.
Independent Trustees:
Correspondence intended for an Independent Trustee may be sent to Fidelity Investments, P.O. Box 55235, Boston, Massachusetts 02205-5235.
Name, Year of Birth; Principal Occupations and Other Relevant Experience+
Elizabeth S. Acton (1951)
Year of Election or Appointment: 2013
Trustee
Ms. Acton also serves as Trustee of other Fidelity® funds. Prior to her retirement, Ms. Acton served as Executive Vice President, Finance (2011-2012), Executive Vice President, Chief Financial Officer (2002-2011) and Treasurer (2004-2005) of Comerica Incorporated (financial services). Prior to joining Comerica, Ms. Acton held a variety of positions at Ford Motor Company (1983-2002), including Vice President and Treasurer (2000-2002) and Executive Vice President and Chief Financial Officer of Ford Motor Credit Company (1998-2000). Ms. Acton currently serves as a member of the Board and Audit and Finance Committees of Beazer Homes USA, Inc. (homebuilding, 2012-present). Ms. Acton previously served as a member of the Advisory Board of certain Fidelity® funds (2013-2016).
Ann E. Dunwoody (1953)
Year of Election or Appointment: 2018
Trustee
General Dunwoody also serves as Trustee of other Fidelity® funds. General Dunwoody (United States Army, Retired) was the first woman in U.S. military history to achieve the rank of four-star general and prior to her retirement in 2012 held a variety of positions within the U.S. Army, including Commanding General, U.S. Army Material Command (2008-2012). General Dunwoody currently serves as President of First to Four LLC (leadership and mentoring services, 2012-present), a member of the Board and Nomination and Corporate Governance Committees of Kforce Inc. (professional staffing services, 2016-present) and a member of the Board of Automattic Inc. (software engineering, 2018-present). Previously, General Dunwoody served as a member of the Advisory Board and Nominating and Corporate Governance Committee of L3 Technologies, Inc. (communication, electronic, sensor and aerospace systems, 2013-2019) and a member of the Board and Audit and Sustainability and Corporate Responsibility Committees of Republic Services, Inc. (waste collection, disposal and recycling, 2013-2016). Ms. Dunwoody also serves on several boards for non-profit organizations, including as a member of the Board, Chair of the Nomination and Governance Committee and a member of the Audit Committee of Logistics Management Institute (consulting non-profit, 2012-present), a member of the Council of Trustees for the Association of the United States Army (advocacy non-profit, 2013-present), a member of the Board of Florida Institute of Technology (2015-present) and a member of the Board of ThanksUSA (military family education non-profit, 2014-present). General Dunwoody previously served as a member of the Advisory Board of certain Fidelity® funds (2018).
John Engler (1948)
Year of Election or Appointment: 2014
Trustee
Mr. Engler also serves as Trustee of other Fidelity® funds. Previously, Mr. Engler served as Governor of Michigan (1991-2003), President of the Business Roundtable (2011-2017) and interim President of Michigan State University (2018-2019). Mr. Engler currently serves as a member of the Board of K12 Inc. (technology-based education company, 2012-present). Previously, Mr. Engler served as a member of the Board of Universal Forest Products (manufacturer and distributor of wood and wood-alternative products, 2003-2019) and Trustee of The Munder Funds (2003-2014). Mr. Engler previously served as a member of the Advisory Board of certain Fidelity® funds (2014-2016).
Robert F. Gartland (1951)
Year of Election or Appointment: 2010
Trustee
Mr. Gartland also serves as Trustee of other Fidelity® funds. Prior to his retirement, Mr. Gartland held a variety of positions at Morgan Stanley (financial services, 1979-2007), including Managing Director (1987-2007) and Chase Manhattan Bank (1975-1978). Mr. Gartland previously served as Chairman and an investor in Gartland & Mellina Group Corp. (consulting, 2009-2019), as a member of the Board of National Securities Clearing Corporation (1993-1996) and as Chairman of TradeWeb (2003-2004).
Arthur E. Johnson (1947)
Year of Election or Appointment: 2008
Trustee
Chairman of the Independent Trustees
Mr. Johnson also serves as Trustee of other Fidelity® funds. Prior to his retirement, Mr. Johnson served as Senior Vice President of Corporate Strategic Development of Lockheed Martin Corporation (defense contractor, 1999-2009). Mr. Johnson currently serves as a member of the Board of Booz Allen Hamilton (management consulting, 2011-present). Mr. Johnson previously served as a member of the Board of Eaton Corporation plc (diversified power management, 2009-2019) and a member of the Board of AGL Resources, Inc. (holding company, 2002-2016). Mr. Johnson previously served as Vice Chairman (2015-2018) of the Independent Trustees of certain Fidelity® funds. Mr. Arthur E. Johnson is not related to Ms. Abigail P. Johnson.
Michael E. Kenneally (1954)
Year of Election or Appointment: 2009
Trustee
Vice Chairman of the Independent Trustees
Mr. Kenneally also serves as Trustee of other Fidelity® funds. Prior to his retirement, Mr. Kenneally served as Chairman and Global Chief Executive Officer of Credit Suisse Asset Management and Executive Vice President and Chief Investment Officer of Bank of America Corporation. Earlier roles at Bank of America included Director of Research, Senior Portfolio Manager for various institutional equity accounts and mutual funds and Portfolio Manager for a number of institutional fixed-income clients. Mr. Kenneally began his career as a Research Analyst in 1983 and was awarded the Chartered Financial Analyst (CFA) designation in 1991.
Marie L. Knowles (1946)
Year of Election or Appointment: 2001
Trustee
Ms. Knowles also serves as Trustee of other Fidelity® funds. Prior to her retirement, Ms. Knowles held several positions at Atlantic Richfield Company (diversified energy), including Executive Vice President and Chief Financial Officer (1996-2000), Senior Vice President (1993-1996) and President of ARCO Transportation Company (pipeline and tanker operations, 1993-1996). Ms. Knowles currently serves as a member of the Board of McKesson Corporation (healthcare service, since 2002), a member of the Board of the Santa Catalina Island Company (real estate, 2009-present), a member of the Investment Company Institute Board of Governors and a member of the Governing Council of the Independent Directors Council (2014-present). Ms. Knowles also serves as a member of the Advisory Board for the School of Engineering of the University of Southern California. Ms. Knowles previously served as Chairman (2015-2018) and Vice Chairman (2012-2015) of the Independent Trustees of certain Fidelity® funds.
Mark A. Murray (1954)
Year of Election or Appointment: 2016
Trustee
Mr. Murray also serves as Trustee of other Fidelity® funds. Previously, Mr. Murray served as Co-Chief Executive Officer (2013-2016), President (2006-2013) and Vice Chairman (2013-2020) of Meijer, Inc. Mr. Murray serves as a member of the Board and Nuclear Review and Public Policy and Responsibility Committees of DTE Energy Company (diversified energy company, 2009-present) and a member of the Board and Audit Committee and Chairman of the Nominating and Corporate Governance Committee of Universal Forest Products, Inc. (manufacturer and distributor of wood and wood-alternative products, 2004-2016). Mr. Murray previously served as a member of the Board of Spectrum Health (not-for-profit health system, 2015-2019). Mr. Murray also serves as a member of the Board of many community and professional organizations. Mr. Murray previously served as a member of the Advisory Board of certain Fidelity® funds (2016).
+ The information includes the Trustee's principal occupation during the last five years and other information relating to the experience, attributes, and skills relevant to the Trustee's qualifications to serve as a Trustee, which led to the conclusion that the Trustee should serve as a Trustee for the fund.
Advisory Board Members and Officers:
Correspondence intended for an officer may be sent to Fidelity Investments, 245 Summer Street, Boston, Massachusetts 02210. Officers appear below in alphabetical order.
Name, Year of Birth; Principal Occupation
Craig S. Brown (1977)
Year of Election or Appointment: 2019
Assistant Treasurer
Mr. Brown also serves as Assistant Treasurer of other funds. Mr. Brown is an employee of Fidelity Investments (2013-present).
John J. Burke III (1964)
Year of Election or Appointment: 2018
Chief Financial Officer
Mr. Burke also serves as Chief Financial Officer of other funds. Mr. Burke serves as Head of Investment Operations for Fidelity Fund and Investment Operations (2018-present) and is an employee of Fidelity Investments (1998-present). Previously Mr. Burke served as head of Asset Management Investment Operations (2012-2018).
David J. Carter (1973)
Year of Election or Appointment: 2020
Assistant Secretary
Mr. Carter also serves as Assistant Secretary of other funds. Mr. Carter serves as Vice President, Associate General Counsel (2010-present) and is an employee of Fidelity Investments (2005-present).
Jonathan Davis (1968)
Year of Election or Appointment: 2010
Assistant Treasurer
Mr. Davis also serves as Assistant Treasurer of other funds. Mr. Davis serves as Assistant Treasurer of FMR Capital, Inc. (2017-present) and is an employee of Fidelity Investments. Previously, Mr. Davis served as Vice President and Associate General Counsel of FMR LLC (diversified financial services company, 2003-2010).
Laura M. Del Prato (1964)
Year of Election or Appointment: 2018
President and Treasurer
Ms. Del Prato also serves as an officer of other funds. Ms. Del Prato is an employee of Fidelity Investments (2017-present). Previously, Ms. Del Prato served as President and Treasurer of The North Carolina Capital Management Trust: Cash Portfolio and Term Portfolio (2018-2020). Prior to joining Fidelity Investments, Ms. Del Prato served as a Managing Director and Treasurer of the JPMorgan Mutual Funds (2014-2017). Prior to JPMorgan, Ms. Del Prato served as a partner at Cohen Fund Audit Services (accounting firm, 2012-2013) and KPMG LLP (accounting firm, 2004-2012).
Colm A. Hogan (1973)
Year of Election or Appointment: 2016
Assistant Treasurer
Mr. Hogan also serves as an officer of other funds. Mr. Hogan serves as Assistant Treasurer of FMR Capital, Inc. (2017-present) and is an employee of Fidelity Investments (2005-present). Previously, Mr. Hogan served as Deputy Treasurer of certain Fidelity® funds (2016-2020) and Assistant Treasurer of certain Fidelity® funds (2016-2018).
Cynthia Lo Bessette (1969)
Year of Election or Appointment: 2019
Secretary and Chief Legal Officer (CLO)
Ms. Lo Bessette also serves as an officer of other funds. Ms. Lo Bessette serves as CLO, Secretary, and Senior Vice President of Fidelity Management & Research Company LLC (investment adviser firm, 2019-present); and CLO of Fidelity Management & Research (Hong Kong) Limited, FMR Investment Management (UK) Limited, and Fidelity Management & Research (Japan) Limited (investment adviser firms, 2019-present). She is a Senior Vice President and Deputy General Counsel of FMR LLC (diversified financial services company, 2019-present), and is an employee of Fidelity Investments. Previously, Ms. Lo Bessette served as CLO, Secretary, and Senior Vice President of FMR Co., Inc. (investment adviser firm, 2019); Secretary of Fidelity SelectCo, LLC and Fidelity Investments Money Management, Inc. (investment adviser firms, 2019). Prior to joining Fidelity Investments, Ms. Lo Bessette was Executive Vice President, General Counsel (2016-2019) and Senior Vice President, Deputy General Counsel (2015-2016) of OppenheimerFunds (investment management company) and Deputy Chief Legal Officer (2013-2015) of Jennison Associates LLC (investment adviser firm).
Chris Maher (1972)
Year of Election or Appointment: 2013
Assistant Treasurer
Mr. Maher also serves as an officer of other funds. Mr. Maher serves as Assistant Treasurer of FMR Capital, Inc. (2017-present), and is an employee of Fidelity Investments (2008-present). Previously, Mr. Maher served as Assistant Treasurer of certain funds (2013-2020); Vice President of Asset Management Compliance (2013), Vice President of the Program Management Group of FMR (investment adviser firm, 2010-2013), and Vice President of Valuation Oversight (2008-2010).
Kenneth B. Robins (1969)
Year of Election or Appointment: 2020
Chief Compliance Officer
Mr. Robins also serves as an officer of other funds. Mr. Robins serves as Compliance Officer of Fidelity Management & Research Company LLC (investment adviser firm, 2016-present) and is an employee of Fidelity Investments (2004-present). Previously, Mr. Robins served as Compliance Officer of FMR Co., Inc. (investment adviser firm, 2016-2019), as Executive Vice President of Fidelity Investments Money Management, Inc. (investment adviser firm, 2013-2016) and served in other fund officer roles.
Brett Segaloff (1972)
Year of Election or Appointment: 2021
Anti-Money Laundering (AML) Officer
Mr. Segaloff also serves as an AML Officer of other funds and other related entities. He is Director, Anti-Money Laundering (2007-present) of FMR LLC (diversified financial services company) and is an employee of Fidelity Investments (1996-present).
Stacie M. Smith (1974)
Year of Election or Appointment: 2013
Assistant Treasurer
Ms. Smith also serves as an officer of other funds. Ms. Smith serves as Assistant Treasurer of FMR Capital, Inc. (2017-present), is an employee of Fidelity Investments (2009-present), and has served in other fund officer roles. Prior to joining Fidelity Investments, Ms. Smith served as Senior Audit Manager of Ernst & Young LLP (accounting firm, 1996-2009). Previously, Ms. Smith served as Assistant Treasurer (2013-2019) and Deputy Treasurer (2013-2016) of certain Fidelity® funds.
Marc L. Spector (1972)
Year of Election or Appointment: 2016
Deputy Treasurer
Mr. Spector also serves as an officer of other funds. Mr. Spector serves as Assistant Treasurer of FMR Capital, Inc. (2017-present) and is an employee of Fidelity Investments (2016-present). Prior to joining Fidelity Investments, Mr. Spector served as Director at the Siegfried Group (accounting firm, 2013-2016), and prior to Siegfried Group as audit senior manager at Deloitte & Touche LLP (accounting firm, 2005-2013).
Jim Wegmann (1979)
Year of Election or Appointment: 2019
Assistant Treasurer
Mr. Wegmann also serves as Assistant Treasurer of other funds. Mr. Wegmann is an employee of Fidelity Investments (2011-present).
Vadim Zlotnikov (1962)
Year of Election or Appointment: 2019
Vice President
Mr. Zlotnikov also serves as Vice President of other funds. Mr. Zlotnikov serves as President of FIAM (Fidelity Institutional Asset Management) and is an employee of Fidelity Investments (2018-present). Previously, Mr. Zlotnikov served as President and Chief Investment Officer of Global Asset Allocation (2018-2020). Prior to joining Fidelity Investments, Mr. Zlotnikov served as Co-Head of Multi-Asset Solutions, Chief Market Strategist, and CIO of Systematic Strategies with AllianceBernstein (investment adviser firm, 2002-2018).
Shareholder Expense Example
As a shareholder, you incur two types of costs: (1) transaction costs, which may include sales charges (loads) on purchase payments or redemption proceeds, as applicable and (2) ongoing costs, which generally include management fees, distribution and/or service (12b-1) fees and other Fund expenses. This Example is intended to help you understand your ongoing costs (in dollars) of investing in a fund and to compare these costs with the ongoing costs of investing in other mutual funds.
The Example is based on an investment of $1,000 invested at the beginning of the period and held for the entire period (July 1, 2020 to December 31, 2020).
Actual Expenses
The first line of the accompanying table provides information about actual account values and actual expenses. You may use the information in this line, together with the amount you invested, to estimate the expenses that you paid over the period. Simply divide your account value by $1,000.00 (for example, an $8,600 account value divided by $1,000.00 = 8.6), then multiply the result by the number in the first line for a class/Fund under the heading entitled "Expenses Paid During Period" to estimate the expenses you paid on your account during this period. If any fund is a shareholder of any underlying mutual funds or exchange-traded funds (ETFs) (the Underlying Funds), such fund indirectly bears its proportional share of the expenses of the Underlying Funds in addition to the direct expenses incurred presented in the table. These fees and expenses are not included in the annualized expense ratio used to calculate the expense estimate in the table below. The estimate of expenses does not include any fees or other expenses of any variable annuity or variable life insurance product. If they were, the estimate of expenses you paid during the period would be higher, and your ending account value would be lower.
Hypothetical Example for Comparison Purposes
The second line of the accompanying table provides information about hypothetical account values and hypothetical expenses based on the actual expense ratio and an assumed rate of return of 5% per year before expenses, which is not the actual return. The hypothetical account values and expenses may not be used to estimate the actual ending account balance or expenses you paid for the period. You may use this information to compare the ongoing costs of investing in the Fund and other funds. To do so, compare this 5% hypothetical example with the 5% hypothetical examples that appear in the shareholder reports of the other funds. If any fund is a shareholder of any Underlying Funds, such fund indirectly bears its proportional share of the expenses of the Underlying Funds in addition to the direct expenses as presented in the table. These fees and expenses are not included in the annualized expense ratio used to calculate the expense estimate in the table below. The estimate of expenses does not include any fees or other expenses of any variable annuity or variable life insurance product. If they were, the estimate of expenses you paid during the period would be higher, and your ending account value would be lower.
Please note that the expenses shown in the table are meant to highlight your ongoing costs only and do not reflect any transaction costs. Therefore, the second line of the table is useful in comparing ongoing costs only, and will not help you determine the relative total costs of owning different funds.
| | Annualized Expense Ratio-A | Beginning
Account Value
July 1, 2020 | Ending
Account Value
December 31, 2020 | Expenses Paid
During Period-B
July 1, 2020
to December 31, 2020 |
| VIP Asset Manager: Growth Portfolio | | | | |
| Initial Class | .67% | | | |
| Actual | | $1,000.00 | $1,189.00 | $3.69 |
| Hypothetical-C | | $1,000.00 | $1,021.77 | $3.40 |
| Service Class | .77% | | | |
| Actual | | $1,000.00 | $1,188.10 | $4.24 |
| Hypothetical-C | | $1,000.00 | $1,021.27 | $3.91 |
| Service Class 2 | .92% | | | |
| Actual | | $1,000.00 | $1,187.40 | $5.06 |
| Hypothetical-C | | $1,000.00 | $1,020.51 | $4.67 |
| Investor Class | .75% | | | |
| Actual | | $1,000.00 | $1,188.50 | $4.13 |
| Hypothetical-C | | $1,000.00 | $1,021.37 | $3.81 |
A Annualized expense ratio reflects expenses net of applicable fee waivers.
B Expenses are equal to the annualized expense ratio, multiplied by the average account value over the period, multiplied by 184/ 366 (to reflect the one-half year period). The fees and expenses of any Underlying Funds are not included in each annualized expense ratio. In addition to the expenses noted above, the Fund also indirectly bears its proportional share of the expenses of the underlying Fidelity Central Funds. Annualized expenses of the underlying non-money market Fidelity Central Funds as of their most recent fiscal half year ranged from less than .005% to .05%.
C 5% return per year before expenses
Distributions (Unaudited)
The Board of Trustees of VIP Asset Manager Growth Portfolio voted to pay to shareholders of record at the opening of business on record date, the following distributions per share derived from capital gains realized from sales of portfolio securities and dividends derived from net investment income:
| | Pay Date | Record Date | Dividends | Capital Gains |
| VIP Asset Manager Growth Portfolio | | | | |
| Initial Class | 02/12/21 | 02/12/21 | $0.001 | $0.133 |
| Service Class | 02/12/21 | 02/12/21 | $0.000 | $0.133 |
| Service Class 2 | 02/12/21 | 02/12/21 | $0.000 | $0.132 |
| Investor Class | 02/12/21 | 02/12/21 | $0.000 | $0.133 |
The fund hereby designates as a capital gain dividend with respect to the taxable year ended December 31, 2020, $1,462,271, or, if subsequently determined to be different, the net capital gain of such year.
A total of 2.70% of the dividends distributed during the fiscal year was derived from interest on U.S. Government securities which is generally exempt from state income tax.
Initial Class designates 1% and 36%; Service Class designates 1% and 38%; Service Class 2 designates 1% and 42%; and Investor Class designates 1% and 38%; of the dividends distributed in February and December, respectively during the fiscal year as qualifying for the dividends–received deduction for corporate shareholders.
The amounts per share which represent income derived from sources within, and taxes paid to, foreign countries or possessions of the United States are as follows:
| | Pay Date | Income | Taxes |
| VIP Asset Manager Growth Portfolio | | | |
| Initial Class | 12/30/20 | $0.0783 | 0.0080 |
| Service Class | 12/30/20 | $0.0742 | 0.0080 |
| Service Class 2 | 12/30/20 | $0.0679 | 0.0080 |
| Investor Class | 12/30/20 | $0.0750 | 0.0080 |
|
Board Approval of Investment Advisory Contracts and Management Fees
VIP Asset Manager: Growth Portfolio
Each year, the Board of Trustees, including the Independent Trustees (together, the Board), votes on the renewal of the management contract with Fidelity Management & Research Company LLC (FMR) and the sub-advisory agreements (together, the Advisory Contracts) for the fund. FMR and the sub-advisers are referred to herein as the Investment Advisers. The Board, assisted by the advice of fund counsel and Independent Trustees' counsel, requests and considers a broad range of information relevant to the renewal of the Advisory Contracts throughout the year.
The Board meets regularly and, at each of its meetings, covers an extensive agenda of topics and materials and considers factors that are relevant to its annual consideration of the renewal of the fund's Advisory Contracts, including the services and support provided to the fund and its shareholders. The Board has established four standing committees (Committees) — Operations, Audit, Fair Valuation, and Governance and Nominating — each composed of and chaired by Independent Trustees with varying backgrounds, to which the Board has assigned specific subject matter responsibilities in order to enhance effective decision-making by the Board. The Operations Committee, of which all of the Independent Trustees are members, meets regularly throughout the year and considers, among other matters, information specifically related to the annual consideration of the renewal of the fund's Advisory Contracts. The Board, acting directly and through its Committees, requests and receives information concerning the annual consideration of the renewal of the fund's Advisory Contracts. The Board also meets as needed to review matters specifically related to the Board's annual consideration of the renewal of the Advisory Contracts. Members of the Board may also meet with trustees of other Fidelity funds through joint ad hoc committees to discuss certain matters relevant to all of the Fidelity funds.
At its September 2020 meeting, the Board unanimously determined to renew the fund's Advisory Contracts. In reaching its determination, the Board considered all factors it believed relevant, including (i) the nature, extent, and quality of the services provided to the fund and its shareholders (including the investment performance of the fund); (ii) the competitiveness of the fund's management fee and total expense ratio relative to peer funds; (iii) the total costs of the services provided by and the profits realized by Fidelity from its relationships with the fund; and (iv) the extent to which, if any, economies of scale exist and are realized as the fund grows, and whether any economies of scale are appropriately shared with fund shareholders.
In considering whether to renew the Advisory Contracts for the fund, the Board reached a determination, with the assistance of fund counsel and Independent Trustees' counsel and through the exercise of its business judgment, that the renewal of the Advisory Contracts was in the best interests of the fund and its shareholders and that the compensation payable under the Advisory Contracts was fair and reasonable. The Board's decision to renew the Advisory Contracts was not based on any single factor, but rather was based on a comprehensive consideration of all the information provided to the Board at its meetings throughout the year. The Board, in reaching its determination to renew the Advisory Contracts, was aware that shareholders of the fund have a broad range of investment choices available to them, including a wide choice among funds offered by Fidelity's competitors, and that the fund's shareholders, who have the opportunity to review and weigh the disclosure provided by the fund in its prospectus and other public disclosures, have chosen to invest in this fund, which is part of the Fidelity family of funds.
Nature, Extent, and Quality of Services Provided. The Board considered Fidelity's staffing as it relates to the fund, including the backgrounds of investment personnel of Fidelity, and also considered the fund's investment objective, strategies, and related investment philosophy. The Independent Trustees also had discussions with senior management of Fidelity's investment operations and investment groups. The Board considered the structure of the investment personnel compensation program and whether this structure provides appropriate incentives to act in the best interests of the fund. Additionally, the Board considered the portfolio managers' investments, if any, in the funds that they manage.
Resources Dedicated to Investment Management and Support Services. The Board reviewed the general qualifications and capabilities of Fidelity's investment staff, including its size, education, experience, and resources, as well as Fidelity's approach to recruiting, managing, and compensating investment personnel. The Board noted that Fidelity has continued to increase the resources devoted to non-U.S. offices, including expansion of Fidelity's global investment organization. The Board also noted that Fidelity's analysts have extensive resources, tools and capabilities that allow them to conduct sophisticated quantitative and fundamental analysis, as well as credit analysis of issuers, counterparties and guarantors. Further, the Board considered that Fidelity's investment professionals have sufficient access to global information and data so as to provide competitive investment results over time, and that those professionals also have access to sophisticated tools that permit them to assess portfolio construction and risk and performance attribution characteristics continuously, as well as to transmit new information and research conclusions rapidly around the world. Additionally, in its deliberations, the Board considered Fidelity's trading, risk management, compliance, and technology and operations capabilities and resources, which are integral parts of the investment management process. The Board also considered Fidelity's investments in business continuity planning, and its success in continuously providing services to the fund notwithstanding the severe disruptions caused by the COVID-19 pandemic.
Shareholder and Administrative Services. The Board considered (i) the nature, extent, quality, and cost of advisory, administrative, and shareholder services performed by the Investment Advisers and their affiliates under the Advisory Contracts and under separate agreements covering transfer agency, pricing and bookkeeping, and securities lending services for the fund; (ii) the nature and extent of the supervision of third party service providers, principally custodians, subcustodians, and pricing vendors; and (iii) the resources devoted to, and the record of compliance with, the fund's compliance policies and procedures. The Board also reviewed the allocation of fund brokerage, including allocations to brokers affiliated with the Investment Advisers, the use of brokerage commissions to pay fund expenses, and the use of "soft" commission dollars to pay for research services.
The Board noted that the growth of fund assets over time across the complex allows Fidelity to reinvest in the development of services designed to enhance the value and convenience of the Fidelity funds as investment vehicles. These services include 24-hour access to account information and market information over the Internet and through telephone representatives, investor education materials and asset allocation tools, and the expanded availability of Fidelity Investor Centers.
Investment in a Large Fund Family. The Board considered the benefits to shareholders of investing in a Fidelity fund, including the benefits of investing in a fund that is part of a large family of funds offering a variety of investment disciplines and providing a large variety of mutual fund investor services. The Board noted that Fidelity had taken, or had made recommendations that resulted in the Fidelity funds taking, a number of actions over the previous year that benefited particular funds, including: (i) continuing to dedicate additional resources to Fidelity's investment research process, which includes meetings with management of issuers of securities in which the funds invest, and to the support of the senior management team that oversees asset management; (ii) continuing efforts to enhance Fidelity's global research capabilities; (iii) launching new funds and ETFs with innovative structures, strategies and pricing and making other enhancements to meet client needs; (iv) launching new share classes of existing funds; (v) eliminating purchase minimums and broadening eligibility requirements for certain funds and share classes; (vi) reducing management fees and total expenses for certain target date funds or classes and index funds; (vii) lowering expenses for certain funds and classes by implementing or lowering expense caps; (viii) rationalizing product lines and gaining increased efficiencies from fund mergers, liquidations, and share class consolidations; (ix) continuing to develop, acquire and implement systems and technology to improve services to the funds and shareholders, strengthen information security, and increase efficiency; and (x) continuing to implement enhancements to further strengthen Fidelity's product line to increase investors' probability of success in achieving their investment goals, including retirement income goals.
Investment Performance. The Board considered whether the fund has operated in accordance with its investment objective, as well as its record of compliance with its investment restrictions and its performance history.
The Board took into account discussions that occur at Board meetings throughout the year with representatives of the Investment Advisers about fund investment performance. In this regard the Board noted that as part of regularly scheduled fund reviews and other reports to the Board on fund performance, the Board considers annualized return information for the fund for different time periods, measured against one or more appropriate securities market indices, including a customized blended index that reflects the respective weights of the fund's asset classes (each a benchmark index) and an appropriate peer group of funds with similar objectives (peer group). In its evaluation of fund investment performance at meetings throughout the year, the Board gave particular attention to information indicating underperformance of certain Fidelity funds for specific time periods and discussed with the Investment Advisers the reasons for such underperformance.
In addition to reviewing absolute and relative fund performance, the Independent Trustees periodically consider the appropriateness of fund performance metrics in evaluating the results achieved. In general, the Independent Trustees believe that fund performance should be evaluated based on gross performance (before fees and expenses but after transaction costs) compared to appropriate benchmark indices, over appropriate time periods that may include full market cycles, and on net performance (after fees and expenses) compared to appropriate peer groups, as applicable, over the same periods, taking into account relevant factors including the following: general market conditions; expectations for interest rate levels and credit conditions; issuer-specific information including credit quality; and fund cash flows and other factors. The Independent Trustees generally give greater weight to fund performance over longer time periods than over shorter time periods. Depending on the circumstances, the Independent Trustees may be satisfied with a fund's performance notwithstanding that it lags its benchmark index or peer group for certain periods.
The Independent Trustees recognize that shareholders evaluate performance on a net basis over their own holding periods, for which one-, three-, and five-year periods are often used as a proxy. For this reason, the performance information reviewed by the Board also included net cumulative calendar year total return information for the fund and an appropriate benchmark index and peer group for the most recent one-, three-, and five-year periods. The Independent Trustees recognize that shareholders who are not investing through a tax-advantaged retirement account also consider tax consequences in evaluating performance.
Based on its review, the Board concluded that the nature, extent, and quality of services provided to the fund under the Advisory Contracts should continue to benefit the shareholders of the fund.
Competitiveness of Management Fee and Total Expense Ratio. The Board considered the fund's management fee and total expense ratio compared to "mapped groups" of competitive funds and classes created for the purpose of facilitating the Trustees' competitive analysis of management fees and total expenses. Fidelity creates "mapped groups" by combining similar Lipper investment objective categories that have comparable investment mandates. Combining Lipper investment objective categories aids the Board's management fee and total expense ratio comparisons by broadening the competitive group used for comparison.
Management Fee. The Board considered two proprietary management fee comparisons for the 12-month periods shown in basis points (BP) in the chart below. The group of Lipper funds used by the Board for management fee comparisons is referred to below as the "Total Mapped Group." The Total Mapped Group comparison focuses on a fund's standing in terms of gross management fees before expense reimbursements or caps relative to the total universe of funds with comparable investment mandates, regardless of whether their management fee structures also are comparable. Funds with comparable investment mandates offer exposure to similar types of securities. Funds with comparable management fee structures have similar management fee contractual arrangements (
e.g., flat rate charged for advisory services, all-inclusive fee rate,
etc.). "TMG %" represents the percentage of funds in the Total Mapped Group that had management fees that were lower than the fund's. For example, a hypothetical TMG % of 20% would mean that 80% of the funds in the Total Mapped Group had higher, and 20% had lower, management fees than the fund. The fund's actual TMG %s and the number of funds in the Total Mapped Group are in the chart below. The "Asset-Sized Peer Group" (ASPG) comparison focuses on a fund's standing relative to a subset of non-Fidelity funds within the Total Mapped Group that are similar in size and management fee structure. For example, if a fund is in the first quartile of the ASPG, the fund's management fee ranks in the least expensive or lowest 25% of funds in the ASPG. The ASPG represents at least 15% of the funds in the Total Mapped Group with comparable asset size and management fee structures, subject to a minimum of 50 funds (or all funds in the Total Mapped Group if fewer than 50). Additional information, such as the ASPG quartile in which the fund's management fee rate ranked, is also included in the chart and was considered by the Board.
VIP Asset Manager: Growth Portfolio

The Board noted that the fund's management fee rate ranked below the median of its Total Mapped Group and below the median of its ASPG for 2019.
The Board noted that it and the boards of other Fidelity funds formed an ad hoc Committee on Group Fee, which meets periodically, to conduct an in-depth review of the "group fee" component of the management fee of funds with such management fee structures. The Committee's focus included the mechanics of the group fee, the competitive landscape of group fee structures, Fidelity funds with no group fee component and investment products not included in group fee assets. The Board also considered that, for funds subject to the group fee, FMR agreed to voluntarily waive fees over a specified period of time in amounts designed to account for assets converted from certain funds to certain collective investment trusts.
Based on its review, the Board concluded that the fund's management fee is fair and reasonable in light of the services that the fund receives and the other factors considered.
Total Expense Ratio. In its review of each class's total expense ratio, the Board considered the fund's management fee rate as well as other fund or class expenses, as applicable, such as transfer agent fees, pricing and bookkeeping fees, fund-paid 12b-1 fees, and custodial, legal, and audit fees. The Board also noted that Fidelity may agree to waive fees or reimburse expenses from time to time, and the extent to which, if any, it has done so for the fund. As part of its review, the Board also considered the current and historical total expense ratios of each class of the fund compared to competitive fund median expenses. Each class of the fund is compared to those funds and classes in the Total Mapped Group (used by the Board for management fee comparisons) that have a similar sales load structure.
The Board noted that the total expense ratio of each of Initial Class, Investor Class, and Service Class ranked below the competitive median for 2019 and the total expense ratio of Service Class 2 ranked above the competitive median for 2019. The Board considered that, in general, various factors can affect total expense ratios. The Board noted that the total expense ratio of Service Class 2 was above the competitive median because of its 12b-1 fees and that excluding 12b-1 fees of both the class and competitor classes, the total expense ratio of Service Class 2 ranked below the median. The Board noted that the fund offers multiple classes, each of which has a different 12b-1 fee structure, and that the multiple structures are intended to offer a range of pricing options for the intermediary market. The Board also noted that the total expense ratios of the classes vary primarily by the level of their 12b-1 fees, although differences in transfer agent fees may also cause expenses to vary from class to class.
Fees Charged to Other Fidelity Clients. The Board also considered Fidelity fee structures and other information with respect to clients of Fidelity, such as other funds advised or subadvised by Fidelity, pension plan clients, and other institutional clients with similar mandates. The Board noted that a joint ad hoc committee created by it and the boards of other Fidelity funds periodically reviews and compares Fidelity's institutional investment advisory business with its business of providing services to the Fidelity funds and also noted the most recent findings of the committee. The Board noted that the committee's review included a consideration of the differences in services provided, fees charged, and costs incurred, as well as competition in the markets serving the different categories of clients.
Based on its review of total expense ratios and fees charged to other Fidelity clients, the Board concluded that the total expense ratio of each class of the fund was reasonable in light of the services that the fund and its shareholders receive and the other factors considered.
Costs of the Services and Profitability. The Board considered the revenues earned and the expenses incurred by Fidelity in conducting the business of developing, marketing, distributing, managing, administering and servicing the fund and servicing the fund's shareholders. The Board also considered the level of Fidelity's profits in respect of all the Fidelity funds.
On an annual basis, Fidelity presents to the Board information about the profitability of its relationships with the fund. Fidelity calculates profitability information for each fund, as well as aggregate profitability information for groups of Fidelity funds and all Fidelity funds, using a series of detailed revenue and cost allocation methodologies which originate with the books and records of Fidelity on which Fidelity's audited financial statements are based. The Audit Committee of the Board reviews any significant changes from the prior year's methodologies and the full Board approves such changes.
A public accounting firm has been engaged annually by the Board as part of the Board's assessment of Fidelity's profitability analysis. The engagement includes the review and assessment of the methodologies used by Fidelity in determining the revenues and expenses attributable to Fidelity's mutual fund business, and completion of agreed-upon procedures in respect of the mathematical accuracy of certain fund profitability information and its conformity to established allocation methodologies. After considering the reports issued under the engagement and information provided by Fidelity, the Board concluded that while other allocation methods may also be reasonable, Fidelity's profitability methodologies are reasonable in all material respects.
The Board also reviewed Fidelity's non-fund businesses and potential indirect benefits such businesses may have received as a result of their association with Fidelity's mutual fund business (i.e., fall-out benefits) as well as cases where Fidelity's affiliates may benefit from the funds' business. The Board considered areas where potential indirect benefits to the Fidelity funds from their relationships with Fidelity may exist. The Board also considered that in 2019 a joint ad hoc committee created by it and the boards of other Fidelity funds evaluated potential fall-out benefits (PFOB Committee). The Board noted that it considered the PFOB Committee's findings in connection with its consideration of the renewal of the Advisory Contracts.
The Board considered the costs of the services provided by and the profits realized by Fidelity in connection with the operation of the fund, including the conclusions of the PFOB Committee, and was satisfied that the profitability was not excessive.
Economies of Scale. The Board considered whether there have been economies of scale in respect of the management of the Fidelity funds, whether the Fidelity funds (including the fund) have appropriately benefited from any such economies of scale, and whether there is potential for realization of any further economies of scale. The Board considered the extent to which the fund will benefit from economies of scale as assets grow through increased services to the fund, through waivers or reimbursements, or through fee or expense ratio reductions. The Board also noted that a committee (the Economies of Scale Committee) created by it and the boards of other Fidelity funds periodically analyzes whether Fidelity attains economies of scale in respect of the management and servicing of the Fidelity funds, whether the Fidelity funds have appropriately benefited from such economies of scale, and whether there is potential for realization of any further economies of scale.
The Board recognized that the fund's management contract incorporates a "group fee" structure, which provides for lower group fee rates as total "group assets" increase, and for higher group fee rates as total "group assets" decrease ("group assets" as defined in the management contract). FMR calculates the group fee rates based on a tiered asset "breakpoint" schedule that varies based on asset class. The Board considered that the group fee is designed to deliver the benefits of economies of scale to fund shareholders when total Fidelity fund assets increase, even if assets of any particular fund are unchanged or have declined, because some portion of Fidelity's costs are attributable to services provided to all Fidelity funds, and all funds benefit if those costs can be allocated among more assets. The Board concluded that, given the group fee structure, fund shareholders will benefit from lower management fees as "group assets" increase at the fund complex level, regardless of whether Fidelity achieves any such economies of scale.
The Board concluded, taking into account the analysis of the Economies of Scale Committee, that economies of scale, if any, are being appropriately shared between fund shareholders and Fidelity.
Additional Information Requested by the Board. In order to develop fully the factual basis for consideration of the Fidelity funds' advisory contracts, the Board requested and received additional information on certain topics, including: (i) Fidelity's fund profitability methodology, profitability trends for certain funds, the allocation of various costs to different funds, and the impact of certain factors on fund profitability results; (ii) portfolio manager changes that have occurred during the past year and the amount of the investment that each portfolio manager has made in the Fidelity fund(s) that he or she manages; (iii) Fidelity's compensation structure for portfolio managers, research analysts, and other key personnel, including its effects on fund profitability, the rationale for the compensation structure, and the extent to which current market conditions have affected retention and recruitment; (iv) the arrangements with and compensation paid to certain fund sub-advisers on behalf of the Fidelity funds and the treatment of such compensation within Fidelity's fund profitability methodology; (v) the terms of the funds' various management fee structures, including the basic group fee and the terms of Fidelity's voluntary expense limitation agreements; (vi) Fidelity's transfer agent fee, expense, and service structures for different funds and classes relative to competitive trends; (vii) the impact on fund profitability of recent industry trends, such as the growth in passively managed funds and outflows from actively managed equity funds; and (viii) explanations regarding the relative total expense ratios of certain funds and classes, total expense competitive trends and methodologies for total expense competitive comparisons, and actions that might be taken by Fidelity to reduce total expense ratios for certain classes. In addition, the Board considered its discussions with Fidelity regarding Fidelity's efforts to maintain the continuous investment and shareholder services necessary for the funds during the current pandemic and economic circumstances.
Based on its evaluation of all of the conclusions noted above, and after considering all factors it believed relevant, the Board concluded that the advisory fee arrangements are fair and reasonable, and that the fund's Advisory Contracts should be renewed.
VIPAMG-ANN-0221
1.540207.123
Fidelity® Variable Insurance Products:
Investment Grade Bond Portfolio
Annual Report
December 31, 2020
To view a fund's proxy voting guidelines and proxy voting record for the 12-month period ended June 30, visit http://www.fidelity.com/proxyvotingresults or visit the Securities and Exchange Commission's (SEC) web site at http://www.sec.gov.
You may also call 1-877-208-0098 to request a free copy of the proxy voting guidelines.
Fidelity® Variable Insurance Products are separate account options which are purchased through a variable insurance contract.
Standard & Poor's, S&P and S&P 500 are registered service marks of The McGraw-Hill Companies, Inc. and have been licensed for use by Fidelity Distributors Corporation.
Other third-party marks appearing herein are the property of their respective owners.
All other marks appearing herein are registered or unregistered trademarks or service marks of FMR LLC or an affiliated company. © 2021 FMR LLC. All rights reserved.
This report and the financial statements contained herein are submitted for the general information of the shareholders of the Funds. This report is not authorized for distribution to prospective investors in the Funds unless preceded or accompanied by an effective prospectus.
A fund files its complete schedule of portfolio holdings with the SEC for the first and third quarters of each fiscal year on Form N-PORT. Forms N-PORT are available on the SEC’s web site at http://www.sec.gov. A fund's Forms N-PORT may be reviewed and copied at the SEC’s Public Reference Room in Washington, DC. Information regarding the operation of the SEC's Public Reference Room may be obtained by calling 1-800-SEC-0330.
For a complete list of a fund's portfolio holdings, view the most recent holdings listing, semiannual report, or annual report on Fidelity's web site at http://www.fidelity.com, http://www.institutional.fidelity.com, or http://www.401k.com, as applicable.
NOT FDIC INSURED •MAY LOSE VALUE •NO BANK GUARANTEE
Neither the Funds nor Fidelity Distributors Corporation is a bank.
Note to Shareholders:
Early in 2020, the outbreak and spread of a new coronavirus emerged as a public health emergency that had a major influence on financial markets, primarily based on its impact on the global economy and the outlook for corporate earnings. The virus causes a respiratory disease known as COVID-19. On March 11, the World Health Organization declared the COVID-19 outbreak a pandemic, citing sustained risk of further global spread.
In the weeks following, as the crisis worsened, we witnessed an escalating human tragedy with wide-scale social and economic consequences from coronavirus-containment measures. The outbreak of COVID-19 prompted a number of measures to limit the spread, including travel and border restrictions, quarantines, and restrictions on large gatherings. In turn, these resulted in lower consumer activity, diminished demand for a wide range of products and services, disruption in manufacturing and supply chains, and – given the wide variability in outcomes regarding the outbreak – significant market uncertainty and volatility. Amid the turmoil, global governments and central banks took unprecedented action to help support consumers, businesses, and the broader economies, and to limit disruption to financial systems.
The situation continues to unfold, and the extent and duration of its impact on financial markets and the economy remain highly uncertain. Extreme events such as the coronavirus crisis are “exogenous shocks” that can have significant adverse effects on mutual funds and their investments. Although multiple asset classes may be affected by market disruption, the duration and impact may not be the same for all types of assets.
Fidelity is committed to helping you stay informed amid news about COVID-19 and during increased market volatility, and we’re taking extra steps to be responsive to customer needs. We encourage you to visit our websites, where we offer ongoing updates, commentary, and analysis on the markets and our funds.
VIP Investment Grade Bond Portfolio
Performance: The Bottom Line
Average annual total return reflects the change in the value of an investment, assuming reinvestment of distributions from dividend income and capital gains (the profits earned upon the sale of securities that have grown in value, if any) and assuming a constant rate of performance each year. During periods of reimbursement by Fidelity, a fund’s total return will be greater than it would be had the reimbursement not occurred. Performance numbers are net of all underlying fund operating expenses, but do not include any insurance charges imposed by your insurance company’s separate account. If performance information included the effect of these additional charges, the total returns would have been lower. How a fund did yesterday is no guarantee of how it will do tomorrow.
Average Annual Total Returns
| For the periods ended December 31, 2020 | Past 1 year | Past 5 years | Past 10 years |
| Initial Class | 9.39% | 5.43% | 4.34% |
| Service Class | 9.33% | 5.35% | 4.25% |
| Service Class 2 | 9.16% | 5.18% | 4.08% |
| Investor Class | 9.33% | 5.41% | 4.31% |
$10,000 Over 10 Years
Let's say hypothetically that $10,000 was invested in VIP Investment Grade Bond Portfolio - Initial Class on December 31, 2010.
The chart shows how the value of your investment would have changed, and also shows how the Bloomberg Barclays U.S. Aggregate Bond Index performed over the same period.
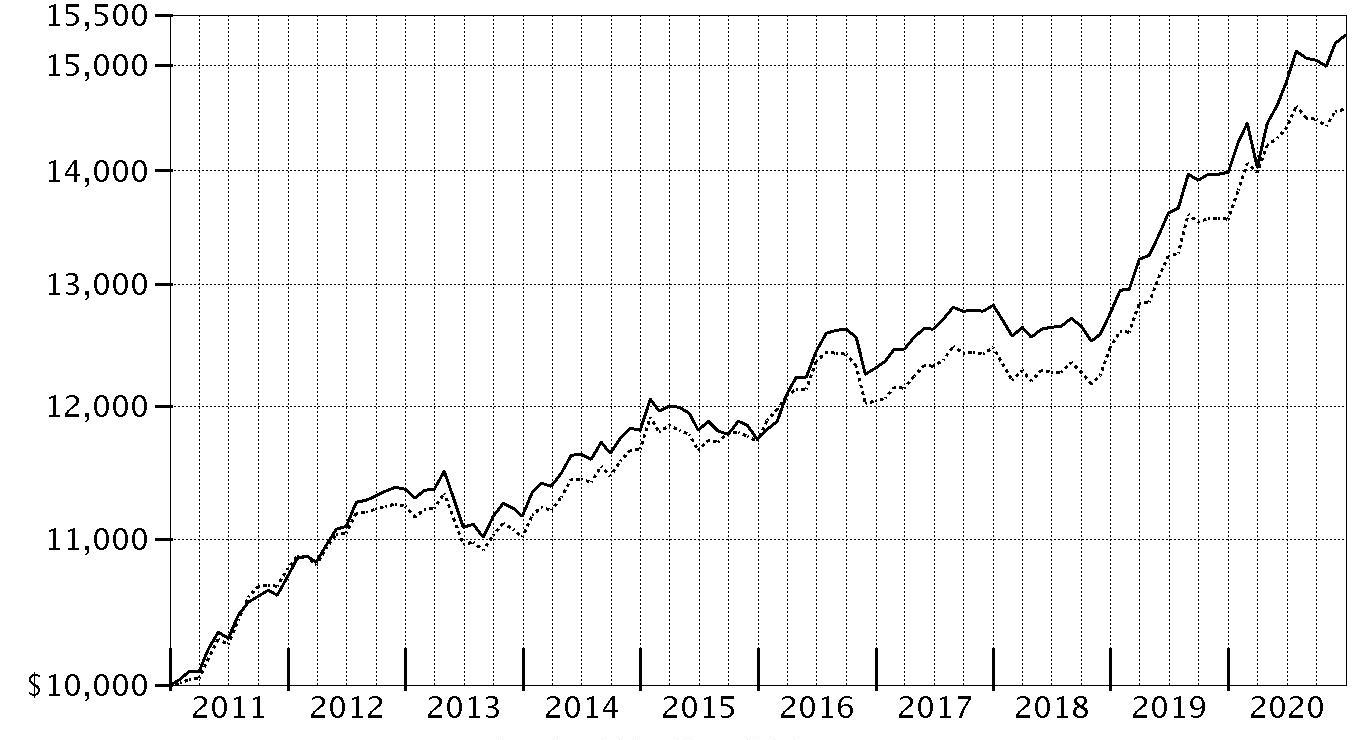
| Period Ending Values |
| $15,299 | VIP Investment Grade Bond Portfolio - Initial Class |
| $14,576 | Bloomberg Barclays U.S. Aggregate Bond Index |
VIP Investment Grade Bond Portfolio
Management's Discussion of Fund Performance
Market Recap: U.S. taxable investment-grade bonds rose strongly in 2020, led by corporate bonds early and late in the period, and by U.S. Treasuries in March, as investors sought safer havens amid the market shock of the outbreak and spread of COVID-19. The Bloomberg Barclays U.S. Aggregate Bond Index gained 7.51% for the year. Corporate bonds advanced early on, then plunged in February. At this time, spreads widened due to robust investor demand for relatively safer assets – especially U.S. Treasury bonds – as the coronavirus pandemic and efforts to contain it threatened global economic growth and corporate earnings, leading to pockets of market illiquidity in March. Aggressive intervention by the U.S. Federal Reserve boosted liquidity and led to a broad rally for fixed-income assets from April through July. Spreads widened moderately in August and September, amid healthy issuance of new corporate bonds, then narrowed in the fourth quarter. Within the Bloomberg Barclays index, corporate bonds gained 9.89% for the year, topping the 8.00% advance of U.S. Treasuries. Securitized sectors, meanwhile, lagged the broader market. Outside the index, U.S. corporate high-yield bonds gained 7.11% and Treasury Inflation-Protected Securities (TIPS) rose 10.99%.
Comments from Co-Portfolio Managers Celso Munoz and Ford O'Neil: or 2020, the fund's share classes posted gains in the range of 9.2% to 9.4%, outpacing, net of fees, the 7.51% advance of the benchmark, the Bloomberg Barclays U.S. Aggregate Bond Index. Nearly all of the fund's assets remained invested in FidelityÒ VIP Investment Grade Central Fund, an investment-grade pool we manage. The fund also was invested in FidelityÒ Specialized High Income Central Fund, as well as individual securities and cash equivalents. Positioning among investment-grade corporate bonds, including our decision to add high-quality, longer longer-term bonds in this asset class beginning in March, added notable relative value. Security selection among investment-grade corporates also produced a positive relative result. We later reduced the fund's investment-grade corporate holdings based on our belief that some holdings had reached their full value. Underweighting U.S. Treasuries also boosted the fund's relative return, as did a non-benchmark position in Treasury Inflation-Protected Securities (TIPS). Spring additions of higher-quality sovereign debt and an allocation to high-yield securities also were helpful. In contrast, holding commercial mortgage-backed securities detracted. Exposure to collateralized loan obligations, as well certain bond and asset-backed securities tied to airline leases, also hurt.
The views expressed above reflect those of the portfolio manager(s) only through the end of the period as stated on the cover of this report and do not necessarily represent the views of Fidelity or any other person in the Fidelity organization. Any such views are subject to change at any time based upon market or other conditions and Fidelity disclaims any responsibility to update such views. These views may not be relied on as investment advice and, because investment decisions for a Fidelity fund are based on numerous factors, may not be relied on as an indication of trading intent on behalf of any Fidelity fund.
VIP Investment Grade Bond Portfolio
Investment Summary (Unaudited)
Quality Diversification (% of fund's net assets)
| As of December 31, 2020 |
| | U.S. Government and U.S. Government Agency Obligations | 44.3% |
| | AAA | 4.5% |
| | AA | 1.7% |
| | A | 9.4% |
| | BBB | 22.5% |
| | BB and Below | 10.1% |
| | Not Rated | 1.8% |
| | Short-Term Investments and Net Other Assets | 5.7% |
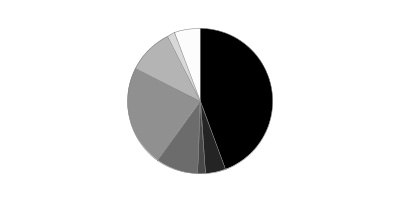
We have used ratings from Moody's Investors Service, Inc. Where Moody's® ratings are not available, we have used S&P® ratings. All ratings are as of the date indicated and do not reflect subsequent changes. Securities rated BB or below were rated investment grade at the time of acquisition. The information in the above tables is based on the combined investments of the Fund and its pro-rata share of investments of Fidelity's fixed-income central funds.
Asset Allocation (% of fund's net assets)
| As of December 31, 2020* |
| | Corporate Bonds | 40.5% |
| | U.S. Government and U.S. Government Agency Obligations | 44.3% |
| | Asset-Backed Securities | 4.7% |
| | CMOs and Other Mortgage Related Securities | 2.6% |
| | Municipal Bonds | 1.0% |
| | Other Investments | 1.2% |
| | Short-Term Investments and Net Other Assets (Liabilities) | 5.7% |
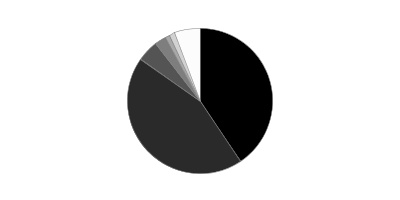
* Foreign investments - 11.5%
The information in the above table is based on the combined investments of the Fund and its pro rata share of the investments of Fidelity's fixed-income central funds. An unaudited holdings listing for the Fund, which presents direct holdings as well as the pro rata share of any securities and other investments held indirectly through its investment in underlying non-money market Fidelity Central Funds, is available at institutional.fidelity.com. Fidelity VIP Investment Grade Central Fund's holdings and financial statements are included at the end of this report.
Percentages in the above tables are adjusted for the effect of TBA Sale Commitments.
VIP Investment Grade Bond Portfolio
Schedule of Investments December 31, 2020
Showing Percentage of Net Assets
| U.S. Government and Government Agency Obligations - 1.7% | | | |
| | | Principal Amount | Value |
| U.S. Treasury Inflation-Protected Obligations - 0.3% | | | |
| U.S. Treasury Inflation-Indexed Bonds 1% 2/15/46 | | 10,989,400 | 15,003,372 |
| U.S. Treasury Obligations - 1.4% | | | |
| U.S. Treasury Bonds: | | | |
| 1.375% 8/15/50 | | $8,949,000 | $8,361,722 |
| 1.625% 11/15/50 | | 18,830,000 | 18,718,197 |
| 3% 2/15/47 | | 10,205,000 | 13,318,322 |
| U.S. Treasury Notes: | | | |
| 0.25% 7/31/25 | | 19,690,000 | 19,628,469 |
| 0.875% 11/15/30 | | 18,970,000 | 18,895,898 |
|
| TOTAL U.S. TREASURY OBLIGATIONS | | | 78,922,608 |
|
| TOTAL U.S. GOVERNMENT AND GOVERNMENT AGENCY OBLIGATIONS | | | |
| (Cost $91,725,673) | | | 93,925,980 |
| | | Shares | Value |
|
| Fixed-Income Funds - 97.3% | | | |
| Fidelity Specialized High Income Central Fund (a) | | 2,421,112 | $244,314,420 |
| Fidelity VIP Investment Grade Central Fund (a)(b) | | 43,488,937 | 4,998,183,586 |
| TOTAL FIXED-INCOME FUNDS | | | |
| (Cost $4,817,150,858) | | | 5,242,498,006 |
|
| Money Market Funds - 1.0% | | | |
| Fidelity Cash Central Fund 0.11% (c) | | | |
| (Cost $55,052,421) | | 55,041,785 | 55,052,793 |
| TOTAL INVESTMENT IN SECURITIES - 100.0% | | | |
| (Cost $4,963,928,952) | | | 5,391,476,779 |
| NET OTHER ASSETS (LIABILITIES) - 0.0% | | | (1,465,805) |
| NET ASSETS - 100% | | | $5,390,010,974 |
Legend
(a) Affiliated fund that is generally available only to investment companies and other accounts managed by Fidelity Investments. A complete unaudited schedule of portfolio holdings for each Fidelity Central Fund is filed with the SEC for the first and third quarters of each fiscal year on Form N-PORT and is available upon request or at the SEC's website at www.sec.gov. An unaudited holdings listing for the Fund, which presents direct holdings as well as the pro-rata share of securities and other investments held indirectly through its investment in underlying non-money market Fidelity Central Funds, is available at fidelity.com and/or institutional.fidelity.com, as applicable. In addition, each Fidelity Central Fund's financial statements, which are not covered by the Fund's Report of Independent Registered Public Accounting Firm, are available on the SEC's website or upon request.
(b) Affiliated central fund that is available only to investment companies and other accounts managed by Fidelity Investments. Fidelity VIP Investment Grade Central Fund's investments and financial statements are included at the end of this report as an attachment.
(c) Affiliated fund that is generally available only to investment companies and other accounts managed by Fidelity Investments. The rate quoted is the annualized seven-day yield of the fund at period end. A complete unaudited listing of the fund's holdings as of its most recent quarter end is available upon request. In addition, each Fidelity Central Fund's financial statements, which are not covered by the Fund's Report of Independent Registered Public Accounting Firm, are available on the SEC's website or upon request.
Affiliated Central Funds
Information regarding fiscal year to date income earned by the Fund from investments in Fidelity Central Funds is as follows:
| Fund | Income earned |
| Fidelity Cash Central Fund | $211,861 |
| Fidelity Securities Lending Cash Central Fund | 4,335 |
| Fidelity Specialized High Income Central Fund | 12,957,931 |
| Fidelity VIP Investment Grade Central Fund | 183,340,393 |
| Total | $196,514,520 |
Amounts in the income column in the above table include any capital gain distributions from underlying funds, which are presented in the corresponding line-item in the Statement of Operations, if applicable. Amount for Fidelity Securities Lending Cash Central Fund represents the income earned on investing cash collateral, less rebates paid to borrowers and any lending agent fees associated with the loan, plus any premium payments received for lending certain types of securities.
Fiscal year to date information regarding the Fund’s investments in non-Money Market Central Funds, including the ownership percentage, is presented below.
| Fund | Value, beginning of period | Purchases | Sales Proceeds | Realized Gain/Loss | Change in Unrealized appreciation (depreciation) | Value, end of period | % ownership, end of period |
| Fidelity Specialized High Income Central Fund | $231,564,896 | $57,957,931 | $50,000,000 | $185,847 | $4,605,746 | $244,314,420 | 44.5% |
| Fidelity VIP Investment Grade Central Fund | 4,224,609,743 | 823,340,393 | 282,005,025 | (3,149,191) | 235,387,666 | 4,998,183,586 | 70.2% |
| Total | $4,456,174,639 | $881,298,324 | $332,005,025 | $(2,963,344) | $239,993,412 | $5,242,498,006 | |
Investment Valuation
The following is a summary of the inputs used, as of December 31, 2020, involving the Fund's assets and liabilities carried at fair value. The inputs or methodology used for valuing securities may not be an indication of the risk associated with investing in those securities. For more information on valuation inputs, and their aggregation into the levels used below, please refer to the Investment Valuation section in the accompanying Notes to Financial Statements.
| | Valuation Inputs at Reporting Date: |
| Description | Total | Level 1 | Level 2 | Level 3 |
| Investments in Securities: | | | | |
| U.S. Government and Government Agency Obligations | $93,925,980 | $-- | $93,925,980 | $-- |
| Fixed-Income Funds | 5,242,498,006 | 5,242,498,006 | -- | -- |
| Money Market Funds | 55,052,793 | 55,052,793 | -- | -- |
| Total Investments in Securities: | $5,391,476,779 | $5,297,550,799 | $93,925,980 | $-- |
Other Information
Distribution of investments by country or territory of incorporation, as a percentage of Total Net Assets, is as follows (Unaudited):
| United States of America | 88.5% |
| Cayman Islands | 3.6% |
| United Kingdom | 1.7% |
| Mexico | 1.4% |
| Others (Individually Less Than 1%) | 4.8% |
| | 100.0% |
The information in the above tables is based on the combined investments of the fund and its pro-rata share of the investments of Fidelity's Fixed-Income Central Funds
See accompanying notes which are an integral part of the financial statements.
VIP Investment Grade Bond Portfolio
Financial Statements
Statement of Assets and Liabilities
| | | December 31, 2020 |
| Assets | | |
Investment in securities, at value — See accompanying schedule:
Unaffiliated issuers (cost $91,725,673) | $93,925,980 | |
| Fidelity Central Funds (cost $4,872,203,279) | 5,297,550,799 | |
| Total Investment in Securities (cost $4,963,928,952) | | $5,391,476,779 |
| Receivable for fund shares sold | | 32,171,103 |
| Interest receivable | | 285,503 |
| Distributions receivable from Fidelity Central Funds | | 5,938 |
| Prepaid expenses | | 5,164 |
| Total assets | | 5,423,944,487 |
| Liabilities | | |
| Payable for investments purchased | $30,000,000 | |
| Payable for fund shares redeemed | 1,704,917 | |
| Accrued management fee | 1,325,315 | |
| Distribution and service plan fees payable | 455,514 | |
| Other affiliated payables | 440,442 | |
| Other payables and accrued expenses | 7,325 | |
| Total liabilities | | 33,933,513 |
| Net Assets | | $5,390,010,974 |
| Net Assets consist of: | | |
| Paid in capital | | $4,888,867,693 |
| Total accumulated earnings (loss) | | 501,143,281 |
| Net Assets | | $5,390,010,974 |
| Net Asset Value and Maximum Offering Price | | |
| Initial Class: | | |
| Net Asset Value, offering price and redemption price per share ($1,322,750,383 ÷ 93,846,716 shares) | | $14.09 |
| Service Class: | | |
| Net Asset Value, offering price and redemption price per share ($692,786,935 ÷ 49,750,751 shares) | | $13.93 |
| Service Class 2: | | |
| Net Asset Value, offering price and redemption price per share ($1,935,644,709 ÷ 141,118,874 shares) | | $13.72 |
| Investor Class: | | |
| Net Asset Value, offering price and redemption price per share ($1,438,828,947 ÷ 102,525,941 shares) | | $14.03 |
See accompanying notes which are an integral part of the financial statements.
Statement of Operations
| | | Year ended December 31, 2020 |
| Investment Income | | |
| Interest | | $1,271,428 |
| Income from Fidelity Central Funds (including $4,335 from security lending) | | 134,742,802 |
| Total income | | 136,014,230 |
| Expenses | | |
| Management fee | $14,729,450 | |
| Transfer agent fees | 3,772,312 | |
| Distribution and service plan fees | 5,112,033 | |
| Accounting fees | 1,168,079 | |
| Custodian fees and expenses | 9,296 | |
| Independent trustees' fees and expenses | 15,731 | |
| Registration fees | 4,013 | |
| Audit | 48,850 | |
| Legal | 9,718 | |
| Miscellaneous | 26,594 | |
| Total expenses before reductions | 24,896,076 | |
| Expense reductions | (9,117) | |
| Total expenses after reductions | | 24,886,959 |
| Net investment income (loss) | | 111,127,271 |
| Realized and Unrealized Gain (Loss) | | |
| Net realized gain (loss) on: | | |
| Investment securities: | | |
| Unaffiliated issuers | 15,561,549 | |
| Fidelity Central Funds | (2,962,679) | |
| Capital gain distributions from Fidelity Central Funds | 61,771,718 | |
| Total net realized gain (loss) | | 74,370,588 |
| Change in net unrealized appreciation (depreciation) on: | | |
| Investment securities: | | |
| Unaffiliated issuers | (4,635,595) | |
| Fidelity Central Funds | 239,993,413 | |
| Total change in net unrealized appreciation (depreciation) | | 235,357,818 |
| Net gain (loss) | | 309,728,406 |
| Net increase (decrease) in net assets resulting from operations | | $420,855,677 |
See accompanying notes which are an integral part of the financial statements.
Statement of Changes in Net Assets
| | Year ended December 31, 2020 | Year ended December 31, 2019 |
| Increase (Decrease) in Net Assets | | |
| Operations | | |
| Net investment income (loss) | $111,127,271 | $119,250,418 |
| Net realized gain (loss) | 74,370,588 | 996,847 |
| Change in net unrealized appreciation (depreciation) | 235,357,818 | 256,365,827 |
| Net increase (decrease) in net assets resulting from operations | 420,855,677 | 376,613,092 |
| Distributions to shareholders | (111,088,904) | (116,450,620) |
| Share transactions - net increase (decrease) | 494,727,468 | 458,358,146 |
| Total increase (decrease) in net assets | 804,494,241 | 718,520,618 |
| Net Assets | | |
| Beginning of period | 4,585,516,733 | 3,866,996,115 |
| End of period | $5,390,010,974 | $4,585,516,733 |
See accompanying notes which are an integral part of the financial statements.
Financial Highlights
VIP Investment Grade Bond Portfolio Initial Class
| Years ended December 31, | 2020 | 2019 | 2018 | 2017 | 2016 |
| Selected Per–Share Data | | | | | |
| Net asset value, beginning of period | $13.17 | $12.34 | $12.80 | $12.64 | $12.37 |
| Income from Investment Operations | | | | | |
| Net investment income (loss)A | .328 | .382 | .311 | .325 | .344 |
| Net realized and unrealized gain (loss) | .903 | .806 | (.381) | .204 | .240 |
| Total from investment operations | 1.231 | 1.188 | (.070) | .529 | .584 |
| Distributions from net investment income | (.306) | (.358) | (.313) | (.312) | (.308) |
| Distributions from net realized gain | (.005) | – | (.077) | (.057) | (.006) |
| Total distributions | (.311) | (.358) | (.390) | (.369) | (.314) |
| Net asset value, end of period | $14.09 | $13.17 | $12.34 | $12.80 | $12.64 |
| Total ReturnB,C | 9.39% | 9.67% | (.53)% | 4.22% | 4.74% |
| Ratios to Average Net AssetsD,E | | | | | |
| Expenses before reductions | .39% | .40% | .40% | .41% | .41% |
| Expenses net of fee waivers, if any | .39% | .40% | .40% | .41% | .41% |
| Expenses net of all reductions | .39% | .40% | .40% | .41% | .41% |
| Net investment income (loss) | 2.38% | 2.93% | 2.49% | 2.53% | 2.67% |
| Supplemental Data | | | | | |
| Net assets, end of period (000 omitted) | $1,322,750 | $1,146,767 | $928,285 | $1,069,371 | $1,023,875 |
| Portfolio turnover rateF | 11% | 5% | 8% | 6% | 11% |
A Calculated based on average shares outstanding during the period.
B Total returns do not reflect charges attributable to your insurance company's separate account. Inclusion of these charges would reduce the total returns shown.
C Total returns would have been lower if certain expenses had not been reduced during the applicable periods shown.
D Fees and expenses of any underlying mutual funds or exchange-traded funds (ETFs) are not included in the Fund's expense ratio. The Fund indirectly bears its proportionate share of these expenses. For additional expense information related to investments in Fidelity Central Funds, please refer to the "Investments in Fidelity Central Funds" note found in the Notes to Financial Statements section of the most recent Annual or Semi-Annual report.
E Expense ratios reflect operating expenses of the class. Expenses before reductions do not reflect amounts reimbursed, waived, or reduced through arrangements with the investment adviser, brokerage services, or other offset arrangements, if applicable, and do not represent the amount paid by the class during periods when reimbursements, waivers or reductions occur.
F Amount does not include the portfolio activity of any underlying mutual funds or exchange-traded funds (ETFs).
See accompanying notes which are an integral part of the financial statements.
VIP Investment Grade Bond Portfolio Service Class
| Years ended December 31, | 2020 | 2019 | 2018 | 2017 | 2016 |
| Selected Per–Share Data | | | | | |
| Net asset value, beginning of period | $13.02 | $12.20 | $12.66 | $12.50 | $12.24 |
| Income from Investment Operations | | | | | |
| Net investment income (loss)A | .310 | .364 | .295 | .309 | .328 |
| Net realized and unrealized gain (loss) | .899 | .800 | (.377) | .207 | .236 |
| Total from investment operations | 1.209 | 1.164 | (.082) | .516 | .564 |
| Distributions from net investment income | (.294) | (.344) | (.301) | (.299) | (.298) |
| Distributions from net realized gain | (.005) | – | (.077) | (.057) | (.006) |
| Total distributions | (.299) | (.344) | (.378) | (.356) | (.304) |
| Net asset value, end of period | $13.93 | $13.02 | $12.20 | $12.66 | $12.50 |
| Total ReturnB,C | 9.33% | 9.58% | (.63)% | 4.16% | 4.63% |
| Ratios to Average Net AssetsD,E | | | | | |
| Expenses before reductions | .49% | .50% | .50% | .51% | .51% |
| Expenses net of fee waivers, if any | .49% | .50% | .50% | .51% | .51% |
| Expenses net of all reductions | .49% | .50% | .50% | .51% | .51% |
| Net investment income (loss) | 2.28% | 2.83% | 2.39% | 2.43% | 2.57% |
| Supplemental Data | | | | | |
| Net assets, end of period (000 omitted) | $692,787 | $582,182 | $553,442 | $587,652 | $541,803 |
| Portfolio turnover rateF | 11% | 5% | 8% | 6% | 11% |
A Calculated based on average shares outstanding during the period.
B Total returns do not reflect charges attributable to your insurance company's separate account. Inclusion of these charges would reduce the total returns shown.
C Total returns would have been lower if certain expenses had not been reduced during the applicable periods shown.
D Fees and expenses of any underlying mutual funds or exchange-traded funds (ETFs) are not included in the Fund's expense ratio. The Fund indirectly bears its proportionate share of these expenses. For additional expense information related to investments in Fidelity Central Funds, please refer to the "Investments in Fidelity Central Funds" note found in the Notes to Financial Statements section of the most recent Annual or Semi-Annual report.
E Expense ratios reflect operating expenses of the class. Expenses before reductions do not reflect amounts reimbursed, waived, or reduced through arrangements with the investment adviser, brokerage services, or other offset arrangements, if applicable, and do not represent the amount paid by the class during periods when reimbursements, waivers or reductions occur.
F Amount does not include the portfolio activity of any underlying mutual funds or exchange-traded funds (ETFs).
See accompanying notes which are an integral part of the financial statements.
VIP Investment Grade Bond Portfolio Service Class 2
| Years ended December 31, | 2020 | 2019 | 2018 | 2017 | 2016 |
| Selected Per–Share Data | | | | | |
| Net asset value, beginning of period | $12.83 | $12.03 | $12.49 | $12.34 | $12.09 |
| Income from Investment Operations | | | | | |
| Net investment income (loss)A | .285 | .340 | .272 | .286 | .304 |
| Net realized and unrealized gain (loss) | .885 | .787 | (.372) | .203 | .235 |
| Total from investment operations | 1.170 | 1.127 | (.100) | .489 | .539 |
| Distributions from net investment income | (.275) | (.327) | (.283) | (.282) | (.283) |
| Distributions from net realized gain | (.005) | – | (.077) | (.057) | (.006) |
| Total distributions | (.280) | (.327) | (.360) | (.339) | (.289) |
| Net asset value, end of period | $13.72 | $12.83 | $12.03 | $12.49 | $12.34 |
| Total ReturnB,C | 9.16% | 9.40% | (.79)% | 3.99% | 4.48% |
| Ratios to Average Net AssetsD,E | | | | | |
| Expenses before reductions | .64% | .65% | .65% | .66% | .66% |
| Expenses net of fee waivers, if any | .64% | .65% | .65% | .66% | .66% |
| Expenses net of all reductions | .64% | .65% | .65% | .66% | .66% |
| Net investment income (loss) | 2.13% | 2.68% | 2.24% | 2.28% | 2.42% |
| Supplemental Data | | | | | |
| Net assets, end of period (000 omitted) | $1,935,645 | $1,698,902 | $1,505,566 | $1,514,502 | $1,310,808 |
| Portfolio turnover rateF | 11% | 5% | 8% | 6% | 11% |
A Calculated based on average shares outstanding during the period.
B Total returns do not reflect charges attributable to your insurance company's separate account. Inclusion of these charges would reduce the total returns shown.
C Total returns would have been lower if certain expenses had not been reduced during the applicable periods shown.
D Fees and expenses of any underlying mutual funds or exchange-traded funds (ETFs) are not included in the Fund's expense ratio. The Fund indirectly bears its proportionate share of these expenses. For additional expense information related to investments in Fidelity Central Funds, please refer to the "Investments in Fidelity Central Funds" note found in the Notes to Financial Statements section of the most recent Annual or Semi-Annual report.
E Expense ratios reflect operating expenses of the class. Expenses before reductions do not reflect amounts reimbursed, waived, or reduced through arrangements with the investment adviser, brokerage services, or other offset arrangements, if applicable, and do not represent the amount paid by the class during periods when reimbursements, waivers or reductions occur.
F Amount does not include the portfolio activity of any underlying mutual funds or exchange-traded funds (ETFs).
See accompanying notes which are an integral part of the financial statements.
VIP Investment Grade Bond Portfolio Investor Class
| Years ended December 31, | 2020 | 2019 | 2018 | 2017 | 2016 |
| Selected Per–Share Data | | | | | |
| Net asset value, beginning of period | $13.12 | $12.29 | $12.75 | $12.59 | $12.32 |
| Income from Investment Operations | | | | | |
| Net investment income (loss)A | .322 | .376 | .305 | .319 | .338 |
| Net realized and unrealized gain (loss) | .896 | .808 | (.380) | .206 | .243 |
| Total from investment operations | 1.218 | 1.184 | (.075) | .525 | .581 |
| Distributions from net investment income | (.303) | (.354) | (.308) | (.308) | (.305) |
| Distributions from net realized gain | (.005) | – | (.077) | (.057) | (.006) |
| Total distributions | (.308) | (.354) | (.385) | (.365) | (.311) |
| Net asset value, end of period | $14.03 | $13.12 | $12.29 | $12.75 | $12.59 |
| Total ReturnB,C | 9.33% | 9.67% | (.57)% | 4.20% | 4.74% |
| Ratios to Average Net AssetsD,E | | | | | |
| Expenses before reductions | .43% | .43% | .44% | .44% | .45% |
| Expenses net of fee waivers, if any | .43% | .43% | .44% | .44% | .45% |
| Expenses net of all reductions | .43% | .43% | .44% | .44% | .45% |
| Net investment income (loss) | 2.34% | 2.90% | 2.46% | 2.49% | 2.63% |
| Supplemental Data | | | | | |
| Net assets, end of period (000 omitted) | $1,438,829 | $1,157,666 | $879,703 | $1,030,725 | $915,550 |
| Portfolio turnover rateF | 11% | 5% | 8% | 6% | 11% |
A Calculated based on average shares outstanding during the period.
B Total returns do not reflect charges attributable to your insurance company's separate account. Inclusion of these charges would reduce the total returns shown.
C Total returns would have been lower if certain expenses had not been reduced during the applicable periods shown.
D Fees and expenses of any underlying mutual funds or exchange-traded funds (ETFs) are not included in the Fund's expense ratio. The Fund indirectly bears its proportionate share of these expenses. For additional expense information related to investments in Fidelity Central Funds, please refer to the "Investments in Fidelity Central Funds" note found in the Notes to Financial Statements section of the most recent Annual or Semi-Annual report.
E Expense ratios reflect operating expenses of the class. Expenses before reductions do not reflect amounts reimbursed, waived, or reduced through arrangements with the investment adviser, brokerage services, or other offset arrangements, if applicable, and do not represent the amount paid by the class during periods when reimbursements, waivers or reductions occur.
F Amount does not include the portfolio activity of any underlying mutual funds or exchange-traded funds (ETFs).
See accompanying notes which are an integral part of the financial statements.
Notes to Financial Statements
For the period ended December 31, 2020
1. Organization.
VIP Investment Grade Bond Portfolio (the Fund) is a fund of Variable Insurance Products Fund V (the Trust) and is authorized to issue an unlimited number of shares. The Trust is registered under the Investment Company Act of 1940, as amended (the 1940 Act), as an open-end management investment company organized as a Massachusetts business trust. Shares of the Fund may only be purchased by insurance companies for the purpose of funding variable annuity or variable life insurance contracts. The Fund offers the following classes of shares: Initial Class shares, Service Class shares, Service Class 2 shares and Investor Class shares. All classes have equal rights and voting privileges, except for matters affecting a single class.
Effective January 1, 2020:
Investment advisers Fidelity Investments Money Management, Inc., FMR Co., Inc., and Fidelity SelectCo, LLC, merged with and into Fidelity Management & Research Company. In connection with the merger transactions, the resulting, merged investment adviser was then redomiciled from Massachusetts to Delaware, changed its corporate structure from a corporation to a limited liability company, and changed its name to "Fidelity Management & Research Company LLC".
Broker-dealer Fidelity Distributors Corporation merged with and into Fidelity Investments Institutional Services Company, Inc. ("FIISC"). FIISC was then redomiciled from Massachusetts to Delaware, changed its corporate structure from a corporation to a limited liability company, and changed its name to "Fidelity Distributors Company LLC".
Fidelity Investments Institutional Operations Company, Inc. converted from a Massachusetts corporation to a Massachusetts LLC, and changed its name to "Fidelity Investments Institutional Operations Company LLC".
2. Investments in Fidelity Central Funds.
The Fund invests in Fidelity Central Funds, which are open-end investment companies generally available only to other investment companies and accounts managed by the investment adviser and its affiliates. The Fund's Schedule of Investments lists each of the Fidelity Central Funds held as of period end, if any, as an investment of the Fund, but does not include the underlying holdings of each Fidelity Central Fund. As an Investing Fund, the Fund indirectly bears its proportionate share of the expenses of the underlying Fidelity Central Funds.
Based on its investment objective, each Fidelity Central Fund may invest or participate in various investment vehicles or strategies that are similar to those of the Fund. These strategies are consistent with the investment objectives of the Fund and may involve certain economic risks which may cause a decline in value of each of the Fidelity Central Funds and thus a decline in the value of the Fund. The Money Market Central Funds seek preservation of capital and current income and are managed by the investment adviser. Annualized expenses of the Money Market Central Funds as of their most recent shareholder report date ranged from less than .005% to .01%. The following summarizes the Fund's investment in each non-money market Fidelity Central Fund.
| Fidelity Central Fund | Investment Manager | Investment Objective | Investment Practices | Expense Ratio(a) |
| Fidelity Specialized High Income Central Fund | FMR | Seeks a high level of current income by normally investing in income-producing debt securities, with an emphasis on lower-quality debt securities. | Delayed Delivery & When Issued Securities
Restricted Securities
| Less than .005% |
| Fidelity VIP Investment Grade Central Fund | FMR | Seeks a high level of current income by normally investing in investment-grade debt securities and repurchase agreements. | Delayed Delivery & When Issued Securities
Repurchase Agreements
Restricted Securities
| Less than .005% |
(a) Expenses expressed as a percentage of average net assets and are as of each underlying Central Fund's most recent annual or semi-annual shareholder report.
An unaudited holdings listing for the Fund, which presents direct holdings as well as the pro-rata share of any securities and other investments held indirectly through its investment in underlying non-money market Fidelity Central Funds, is available at institutional.fidelity.com. A complete unaudited list of holdings for each Fidelity Central Fund is available upon request or at the Securities and Exchange Commission (the SEC) website at www.sec.gov. In addition, the financial statements of the Fidelity Central Funds which contain the significant accounting policies (including investment valuation policies) of those funds, which are not covered by the Fund's Report of Independent Registered Public Accounting Firm, are available on the SEC website or upon request.
3. Significant Accounting Policies.
The Fund is an investment company and applies the accounting and reporting guidance of the Financial Accounting Standards Board (FASB) Accounting Standards Codification Topic 946 Financial Services - Investment Companies. The financial statements have been prepared in conformity with accounting principles generally accepted in the United States of America (GAAP), which require management to make certain estimates and assumptions at the date of the financial statements. Actual results could differ from those estimates. Subsequent events, if any, through the date that the financial statements were issued have been evaluated in the preparation of the financial statements. The following summarizes the significant accounting policies of the Fund:
Investment Valuation. Investments are valued as of 4:00 p.m. Eastern time on the last calendar day of the period. The Board of Trustees (the Board) has delegated the day to day responsibility for the valuation of the Fund's investments to the Fair Value Committee (the Committee) established by the Fund's investment adviser. In accordance with valuation policies and procedures approved by the Board, the Fund attempts to obtain prices from one or more third party pricing vendors or brokers to value its investments. When current market prices, quotations or currency exchange rates are not readily available or reliable, investments will be fair valued in good faith by the Committee, in accordance with procedures adopted by the Board. Factors used in determining fair value vary by investment type and may include market or investment specific events, changes in interest rates and credit quality. The frequency with which these procedures are used cannot be predicted and they may be utilized to a significant extent. The Committee oversees the Fund's valuation policies and procedures and reports to the Board on the Committee's activities and fair value determinations. The Board monitors the appropriateness of the procedures used in valuing the Fund's investments and ratifies the fair value determinations of the Committee.
The Fund categorizes the inputs to valuation techniques used to value its investments into a disclosure hierarchy consisting of three levels as shown below:
- Level 1 – quoted prices in active markets for identical investments
- Level 2 – other significant observable inputs (including quoted prices for similar investments, interest rates, prepayment speeds, etc.)
- Level 3 – unobservable inputs (including the Fund's own assumptions based on the best information available)
Valuation techniques used to value the Fund's investments by major category are as follows:
Debt securities, including restricted securities, are valued based on evaluated prices received from third party pricing vendors or from brokers who make markets in such securities. U.S. government and government agency obligations are valued by pricing vendors who utilize matrix pricing which considers yield or price of bonds of comparable quality, coupon, maturity and type or by broker-supplied prices. When independent prices are unavailable or unreliable, debt securities may be valued utilizing pricing methodologies which consider similar factors that would be used by third party pricing vendors. Debt securities are generally categorized as Level 2 in the hierarchy but may be Level 3 depending on the circumstances.
Investments in open-end mutual funds, including the Fidelity Central Funds, are valued at their closing net asset value (NAV) each business day and are categorized as Level 1 in the hierarchy.
Changes in valuation techniques may result in transfers in or out of an assigned level within the disclosure hierarchy. The aggregate value of investments by input level as of December 31, 2020 is included at the end of the Fund's Schedule of Investments.
Investment Transactions and Income. For financial reporting purposes, the Fund's investment holdings and NAV include trades executed through the end of the last business day of the period. The NAV per share for processing shareholder transactions is calculated as of the close of business of the New York Stock Exchange (NYSE), normally 4:00 p.m. Eastern time and includes trades executed through the end of the prior business day. Gains and losses on securities sold are determined on the basis of identified cost and include proceeds received from litigation. Income and capital gain distributions from Fidelity Central Funds, if any, are recorded on the ex-dividend date. Interest income is accrued as earned and includes coupon interest and amortization of premium and accretion of discount on debt securities as applicable. The principal amount on inflation-indexed securities is periodically adjusted to the rate of inflation and interest is accrued based on the principal amount. The adjustments to principal due to inflation are reflected as increases or decreases to Interest in the accompanying Statement of Operations. Debt obligations may be placed on non-accrual status and related interest income may be reduced by ceasing current accruals and writing off interest receivables when the collection of all or a portion of interest has become doubtful based on consistently applied procedures. A debt obligation is removed from non-accrual status when the issuer resumes interest payments or when collectability of interest is reasonably assured.
Class Allocations and Expenses. Investment income, realized and unrealized capital gains and losses, common expenses of the Fund, and certain fund-level expense reductions, if any, are allocated daily on a pro-rata basis to each class based on the relative net assets of each class to the total net assets of the Fund. Each class differs with respect to transfer agent and distribution and service plan fees incurred. Certain expense reductions may also differ by class. For the reporting period, the allocated portion of income and expenses to each class as a percent of its average net assets may vary due to the timing of recording these transactions in relation to fluctuating net assets of the classes. Expenses directly attributable to a fund are charged to that fund. Expenses attributable to more than one fund are allocated among the respective funds on the basis of relative net assets or other appropriate methods. Expense estimates are accrued in the period to which they relate and adjustments are made when actual amounts are known.
Income Tax Information and Distributions to Shareholders. Each year, the Fund intends to qualify as a regulated investment company under Subchapter M of the Internal Revenue Code, including distributing substantially all of its taxable income and realized gains. As a result, no provision for U.S. Federal income taxes is required. As of December 31, 2020, the Fund did not have any unrecognized tax benefits in the financial statements; nor is the Fund aware of any tax positions for which it is reasonably possible that the total amounts of unrecognized tax benefits will significantly change in the next twelve months. The Fund files a U.S. federal tax return, in addition to state and local tax returns as required. The Fund's federal income tax returns are subject to examination by the Internal Revenue Service (IRS) for a period of three fiscal years after they are filed. State and local tax returns may be subject to examination for an additional fiscal year depending on the jurisdiction.
Distributions are declared and recorded on the ex-dividend date. Income and capital gain distributions are declared separately for each class. Income and capital gain distributions are determined in accordance with income tax regulations, which may differ from GAAP.
Capital accounts within the financial statements are adjusted for permanent book-tax differences. These adjustments have no impact on net assets or the results of operations. Capital accounts are not adjusted for temporary book-tax differences which will reverse in a subsequent period.
Book-tax differences are primarily due to the short-term gain distributions from the Underlying Funds, capital loss carryforwards, market discount and losses deferred due to wash sales.
As of period end, the cost and unrealized appreciation (depreciation) in securities, and derivatives if applicable, for federal income tax purposes were as follows:
| Gross unrealized appreciation | $481,101,134 |
| Gross unrealized depreciation | (4,328,735) |
| Net unrealized appreciation (depreciation) | $476,772,399 |
| Tax Cost | $4,914,704,380 |
The tax-based components of distributable earnings as of period end were as follows:
| Undistributed ordinary income | $80,295,398 |
| Capital loss carryforward | $(1,172,643) |
| Net unrealized appreciation (depreciation) on securities and other investments | $476,772,399 |
Capital loss carryforwards are only available to offset future capital gains of the Fund to the extent provided by regulations and may be limited. The capital loss carryforward information presented below, including any applicable limitation, is estimated as of fiscal period end and is subject to adjustment.
| No expiration | |
| Short-term | $(352,661) |
| Long-term | (819,982) |
| Total capital loss carryforward | $(1,172,643) |
The tax character of distributions paid was as follows:
| | December 31, 2020 | December 31, 2019 |
| Ordinary Income | $111,088,904 | $ 116,450,620 |
4. Purchases and Sales of Investments.
Purchases and sales of securities, other than short-term securities and U.S. government securities are noted in the table below.
| | Purchases ($) | Sales ($) |
| VIP Investment Grade Bond Portfolio | 881,298,324 | 332,005,025 |
5. Fees and Other Transactions with Affiliates.
Management Fee. Fidelity Management & Research Company LLC (the investment adviser) and its affiliates provide the Fund with investment management related services for which the Fund pays a monthly management fee. The management fee is the sum of an individual fund fee rate that is based on an annual rate of .20% of the Fund's average net assets and an annualized group fee rate that averaged .10% during the period. The group fee rate is based upon the monthly average net assets of a group of registered investment companies with which the investment adviser has management contracts. The group fee rate decreases as assets under management increase and increases as assets under management decrease. For the reporting period, the total annual management fee rate was .30% of the Fund's average net assets.
Distribution and Service Plan Fees. In accordance with Rule 12b-1 of the 1940 Act, the Fund has adopted separate 12b-1 Plans for each Service Class of shares. Each Service Class pays Fidelity Distributors Company LLC (FDC), an affiliate of the investment adviser, a service fee. For the period, the service fee is based on an annual rate of .10% of Service Class' average net assets and .25% of Service Class 2's average net assets.
For the period, total fees, all of which were re-allowed to insurance companies for the distribution of shares and providing shareholder support services, were as follows:
| Service Class | $629,537 |
| Service Class 2 | 4,482,496 |
| | $5,112,033 |
Transfer Agent Fees. Fidelity Investments Institutional Operations Company LLC (FIIOC), an affiliate of the investment adviser, is the Fund's transfer, dividend disbursing, and shareholder servicing agent. FIIOC receives an asset-based fee with respect to each class. Each class pays a fee for transfer agent services, typesetting and printing and mailing of shareholder reports, excluding mailing of proxy statements. For the period, transfer agent fees for each class were as follows:
| | Amount | % of Class-Level Average Net Assets |
| Initial Class | $812,948 | .07 |
| Service Class | 428,085 | .07 |
| Service Class 2 | 1,219,239 | .07 |
| Investor Class | 1,312,040 | .10 |
| | $3,772,312 | |
Accounting Fees. Fidelity Service Company, Inc. (FSC), an affiliate of the investment adviser, maintains the Fund's accounting records. The accounting fee is based on the level of average net assets for each month. For the period, the fees were equivalent to the following annual rates:
| | % of Average Net Assets |
| VIP Investment Grade Bond Portfolio | .02 |
Interfund Trades. Funds may purchase from or sell securities to other Fidelity Funds under procedures adopted by the Board. The procedures have been designed to ensure these interfund trades are executed in accordance with Rule 17a-7 of the 1940 Act. Interfund trades are included within the respective purchases and sales amounts shown in the Purchases and Sales of Investments note.
6. Committed Line of Credit.
Certain Funds participate with other funds managed by the investment adviser or an affiliate in a $4.25 billion credit facility (the "line of credit") to be utilized for temporary or emergency purposes to fund shareholder redemptions or for other short-term liquidity purposes. The participating funds have agreed to pay commitment fees on their pro-rata portion of the line of credit, which are reflected in Miscellaneous expenses on the Statement of Operations, and are as follows:
| | Amount |
| VIP Investment Grade Bond Portfolio | $11,077 |
During the period, there were no borrowings on this line of credit.
7. Security Lending.
Funds lend portfolio securities from time to time in order to earn additional income. Lending agents are used, including National Financial Services (NFS), an affiliate of the investment adviser. Pursuant to a securities lending agreement, NFS will receive a fee, which is capped at 9.9% of a fund's daily lending revenue, for its services as lending agent. A fund may lend securities to certain qualified borrowers, including NFS. On the settlement date of the loan, a fund receives collateral (in the form of U.S. Treasury obligations, letters of credit and/or cash) against the loaned securities and maintains collateral in an amount not less than 100% of the market value of the loaned securities during the period of the loan. The market value of the loaned securities is determined at the close of business of a fund and any additional required collateral is delivered to a fund on the next business day. A fund or borrower may terminate the loan at any time, and if the borrower defaults on its obligation to return the securities loaned because of insolvency or other reasons, a fund may apply collateral received from the borrower against the obligation. A fund may experience delays and costs in recovering the securities loaned. Any cash collateral received is invested in the Fidelity Securities Lending Cash Central Fund. Any loaned securities are identified as such in the Schedule of Investments, and the value of loaned securities and cash collateral at period end, as applicable, are presented in the Statement of Assets and Liabilities. Security lending income represents the income earned on investing cash collateral, less rebates paid to borrowers and any lending agent fees associated with the loan, plus any premium payments received for lending certain types of securities. Security lending income is presented in the Statement of Operations as a component of income from Fidelity Central Funds. Affiliated security lending activity, if any, was as follows:
| | Total Security Lending Income Fees Paid to NFS | Security Lending Income From Securities Loaned to NFS | Value of Securities Loaned to NFS at Period End |
| VIP Investment Grade Bond Portfolio | $470 | $– | $– |
8. Expense Reductions.
Through arrangements with the Fund's custodian, credits realized as a result of certain uninvested cash balances were used to reduce the Fund's expenses. During the period, custodian credits reduced the Fund's expenses by $1.
In addition, during the period the investment adviser or an affiliate reimbursed and/or waived a portion of fund-level operating expenses in the amount of $9,116.
9. Distributions to Shareholders.
Distributions to shareholders of each class were as follows:
| | Year ended
December 31, 2020 | Year ended
December 31, 2019 |
| Distributions to shareholders | | |
| Initial Class | $28,048,946 | $29,643,012 |
| Service Class | 14,160,911 | 15,321,484 |
| Service Class 2 | 38,501,835 | 41,958,587 |
| Investor Class | 30,377,212 | 29,527,537 |
| Total | $111,088,904 | $116,450,620 |
10. Share Transactions.
Transactions for each class of shares were as follows:
| | Shares | Shares | Dollars | Dollars |
| | Year ended December 31, 2020 | Year ended December 31, 2019 | Year ended December 31, 2020 | Year ended December 31, 2019 |
| Initial Class | | | | |
| Shares sold | 30,483,697 | 24,096,083 | $422,064,639 | $316,593,233 |
| Reinvestment of distributions | 2,022,440 | 2,271,170 | 28,048,946 | 29,643,012 |
| Shares redeemed | (25,700,849) | (14,546,872) | (350,518,289) | (189,162,526) |
| Net increase (decrease) | 6,805,288 | 11,820,381 | $99,595,296 | $157,073,719 |
| Service Class | | | | |
| Shares sold | 17,304,739 | 9,918,527 | $233,371,592 | $127,112,713 |
| Reinvestment of distributions | 1,033,506 | 1,189,053 | 14,160,911 | 15,321,484 |
| Shares redeemed | (13,295,570) | (11,767,385) | (177,433,533) | (151,792,577) |
| Net increase (decrease) | 5,042,675 | (659,805) | $70,098,970 | $(9,358,380) |
| Service Class 2 | | | | |
| Shares sold | 28,919,035 | 18,822,189 | $386,078,627 | $237,591,452 |
| Reinvestment of distributions | 2,852,841 | 3,300,601 | 38,501,835 | 41,958,587 |
| Shares redeemed | (23,047,687) | (14,893,908) | (301,721,522) | (187,283,764) |
| Net increase (decrease) | 8,724,189 | 7,228,882 | $122,858,940 | $92,266,275 |
| Investor Class | | | | |
| Shares sold | 28,051,409 | 19,947,576 | $386,506,351 | $260,600,681 |
| Reinvestment of distributions | 2,198,924 | 2,271,254 | 30,377,212 | 29,527,537 |
| Shares redeemed | (15,954,766) | (5,559,657) | (214,709,301) | (71,751,686) |
| Net increase (decrease) | 14,295,567 | 16,659,173 | $202,174,262 | $218,376,532 |
11. Other.
The Fund's organizational documents provide former and current trustees and officers with a limited indemnification against liabilities arising in connection with the performance of their duties to the Fund. In the normal course of business, the Fund may also enter into contracts that provide general indemnifications. The Fund's maximum exposure under these arrangements is unknown as this would be dependent on future claims that may be made against the Fund. The risk of material loss from such claims is considered remote.
At the end of the period, the investment adviser or its affiliates were the owners of record of 24% of the total outstanding shares of the Fund and one otherwise unaffiliated shareholder was the owner of record of 28% of the total outstanding shares of the Fund.
12. Coronavirus (COVID-19) Pandemic.
An outbreak of COVID-19 first detected in China during December 2019 has since spread globally and was declared a pandemic by the World Health Organization during March 2020. Developments that disrupt global economies and financial markets, such as the COVID-19 pandemic, may magnify factors that affect the Fund's performance.
VIP Investment Grade Bond Portfolio
Report of Independent Registered Public Accounting Firm
To the Board of Trustees of Variable Insurance Products Fund V and Shareholders of VIP Investment Grade Bond Portfolio:
Opinion on the Financial Statements and Financial Highlights
We have audited the accompanying statement of assets and liabilities of VIP Investment Grade Bond Portfolio (the "Fund"), a fund of Variable Insurance Products Fund V, including the schedule of investments, as of December 31, 2020, the related statement of operations for the year then ended, the statement of changes in net assets for each of the two years in the period then ended, the financial highlights for each of the five years in the period then ended, and the related notes. In our opinion, the financial statements and financial highlights present fairly, in all material respects, the financial position of the Fund as of December 31, 2020, and the results of its operations for the year then ended, the changes in its net assets for each of the two years in the period then ended, and the financial highlights for each of the five years in the period then ended in conformity with accounting principles generally accepted in the United States of America.
Basis for Opinion
These financial statements and financial highlights are the responsibility of the Fund's management. Our responsibility is to express an opinion on the Fund's financial statements and financial highlights based on our audits. We are a public accounting firm registered with the Public Company Accounting Oversight Board (United States) (PCAOB) and are required to be independent with respect to the Fund in accordance with the U.S. federal securities laws and the applicable rules and regulations of the Securities and Exchange Commission and the PCAOB.
We conducted our audits in accordance with the standards of the PCAOB. Those standards require that we plan and perform the audit to obtain reasonable assurance about whether the financial statements and financial highlights are free of material misstatement, whether due to error or fraud. The Fund is not required to have, nor were we engaged to perform, an audit of its internal control over financial reporting. As part of our audits we are required to obtain an understanding of internal control over financial reporting but not for the purpose of expressing an opinion on the effectiveness of the Fund’s internal control over financial reporting. Accordingly, we express no such opinion.
Our audits included performing procedures to assess the risks of material misstatement of the financial statements and financial highlights, whether due to error or fraud, and performing procedures that respond to those risks. Such procedures included examining, on a test basis, evidence regarding the amounts and disclosures in the financial statements and financial highlights. Our audits also included evaluating the accounting principles used and significant estimates made by management, as well as evaluating the overall presentation of the financial statements and financial highlights. Our procedures included confirmation of securities owned as of December 31, 2020, by correspondence with the custodian and brokers; when replies were not received from brokers, we performed other auditing procedures. We believe that our audits provide a reasonable basis for our opinion.
/s/ Deloitte & Touche LLP
Boston, Massachusetts
February 10, 2021
We have served as the auditor of one or more of the Fidelity investment companies since 1999.
VIP Investment Grade Bond Portfolio
Trustees and Officers
The Trustees, Members of the Advisory Board (if any), and officers of the trust and fund, as applicable, are listed below. The Board of Trustees governs the fund and is responsible for protecting the interests of shareholders. The Trustees are experienced executives who meet periodically throughout the year to oversee the fund's activities, review contractual arrangements with companies that provide services to the fund, oversee management of the risks associated with such activities and contractual arrangements, and review the fund's performance. Each of the Trustees oversees 280 funds.
The Trustees hold office without limit in time except that (a) any Trustee may resign; (b) any Trustee may be removed by written instrument, signed by at least two-thirds of the number of Trustees prior to such removal; (c) any Trustee who requests to be retired or who has become incapacitated by illness or injury may be retired by written instrument signed by a majority of the other Trustees; and (d) any Trustee may be removed at any special meeting of shareholders by a two-thirds vote of the outstanding voting securities of the trust. Each Trustee who is not an interested person (as defined in the 1940 Act) of the trust and the fund is referred to herein as an Independent Trustee. Each Independent Trustee shall retire not later than the last day of the calendar year in which his or her 75th birthday occurs. The Independent Trustees may waive this mandatory retirement age policy with respect to individual Trustees. Officers and Advisory Board Members hold office without limit in time, except that any officer or Advisory Board Member may resign or may be removed by a vote of a majority of the Trustees at any regular meeting or any special meeting of the Trustees. Except as indicated, each individual has held the office shown or other offices in the same company for the past five years.
The fund’s Statement of Additional Information (SAI) includes more information about the Trustees. To request a free copy, call Fidelity at 1-800-544-8544.
Experience, Skills, Attributes, and Qualifications of the Trustees. The Governance and Nominating Committee has adopted a statement of policy that describes the experience, qualifications, attributes, and skills that are necessary and desirable for potential Independent Trustee candidates (Statement of Policy). The Board believes that each Trustee satisfied at the time he or she was initially elected or appointed a Trustee, and continues to satisfy, the standards contemplated by the Statement of Policy. The Governance and Nominating Committee also engages professional search firms to help identify potential Independent Trustee candidates who have the experience, qualifications, attributes, and skills consistent with the Statement of Policy. From time to time, additional criteria based on the composition and skills of the current Independent Trustees, as well as experience or skills that may be appropriate in light of future changes to board composition, business conditions, and regulatory or other developments, have also been considered by the professional search firms and the Governance and Nominating Committee. In addition, the Board takes into account the Trustees' commitment and participation in Board and committee meetings, as well as their leadership of standing and ad hoc committees throughout their tenure.
In determining that a particular Trustee was and continues to be qualified to serve as a Trustee, the Board has considered a variety of criteria, none of which, in isolation, was controlling. The Board believes that, collectively, the Trustees have balanced and diverse experience, qualifications, attributes, and skills, which allow the Board to operate effectively in governing the fund and protecting the interests of shareholders. Information about the specific experience, skills, attributes, and qualifications of each Trustee, which in each case led to the Board's conclusion that the Trustee should serve (or continue to serve) as a trustee of the fund, is provided below.
Board Structure and Oversight Function. Abigail P. Johnson is an interested person and currently serves as Chairman. The Trustees have determined that an interested Chairman is appropriate and benefits shareholders because an interested Chairman has a personal and professional stake in the quality and continuity of services provided to the fund. Independent Trustees exercise their informed business judgment to appoint an individual of their choosing to serve as Chairman, regardless of whether the Trustee happens to be independent or a member of management. The Independent Trustees have determined that they can act independently and effectively without having an Independent Trustee serve as Chairman and that a key structural component for assuring that they are in a position to do so is for the Independent Trustees to constitute a substantial majority for the Board. The Independent Trustees also regularly meet in executive session. Arthur E. Johnson serves as Chairman of the Independent Trustees and as such (i) acts as a liaison between the Independent Trustees and management with respect to matters important to the Independent Trustees and (ii) with management prepares agendas for Board meetings.
Fidelity® funds are overseen by different Boards of Trustees. The fund's Board oversees Fidelity's investment-grade bond, money market, asset allocation and certain equity funds, and other Boards oversee Fidelity's high income and other equity funds. The asset allocation funds may invest in Fidelity® funds that are overseen by such other Boards. The use of separate Boards, each with its own committee structure, allows the Trustees of each group of Fidelity® funds to focus on the unique issues of the funds they oversee, including common research, investment, and operational issues. On occasion, the separate Boards establish joint committees to address issues of overlapping consequences for the Fidelity® funds overseen by each Board.
The Trustees operate using a system of committees to facilitate the timely and efficient consideration of all matters of importance to the Trustees, the fund, and fund shareholders and to facilitate compliance with legal and regulatory requirements and oversight of the fund's activities and associated risks. The Board, acting through its committees, has charged FMR and its affiliates with (i) identifying events or circumstances the occurrence of which could have demonstrably adverse effects on the fund's business and/or reputation; (ii) implementing processes and controls to lessen the possibility that such events or circumstances occur or to mitigate the effects of such events or circumstances if they do occur; and (iii) creating and maintaining a system designed to evaluate continuously business and market conditions in order to facilitate the identification and implementation processes described in (i) and (ii) above. Because the day-to-day operations and activities of the fund are carried out by or through FMR, its affiliates, and other service providers, the fund's exposure to risks is mitigated but not eliminated by the processes overseen by the Trustees. While each of the Board's committees has responsibility for overseeing different aspects of the fund's activities, oversight is exercised primarily through the Operations and Audit Committees. In addition, an ad hoc Board committee of Independent Trustees has worked with FMR to enhance the Board's oversight of investment and financial risks, legal and regulatory risks, technology risks, and operational risks, including the development of additional risk reporting to the Board. Appropriate personnel, including but not limited to the fund's Chief Compliance Officer (CCO), FMR's internal auditor, the independent accountants, the fund's Treasurer and portfolio management personnel, make periodic reports to the Board's committees, as appropriate, including an annual review of Fidelity's risk management program for the Fidelity® funds. The responsibilities of each standing committee, including their oversight responsibilities, are described further under "Standing Committees of the Trustees."
Interested Trustees*:
Correspondence intended for a Trustee who is an interested person may be sent to Fidelity Investments, 245 Summer Street, Boston, Massachusetts 02210.
Name, Year of Birth; Principal Occupations and Other Relevant Experience+
Abigail P. Johnson (1961)
Year of Election or Appointment: 2009
Trustee
Chairman of the Board of Trustees
Ms. Johnson also serves as Trustee of other Fidelity® funds. Ms. Johnson serves as Chairman (2016-present), Chief Executive Officer (2014-present), and Director (2007-present) of FMR LLC (diversified financial services company), President of Fidelity Financial Services (2012-present) and President of Personal, Workplace and Institutional Services (2005-present). Ms. Johnson is Chairman and Director of Fidelity Management & Research Company LLC (investment adviser firm, 2011-present). Previously, Ms. Johnson served as Chairman and Director of FMR Co., Inc. (investment adviser firm, 2011-2019), Vice Chairman (2007-2016) and President (2013-2016) of FMR LLC, President and a Director of Fidelity Management & Research Company (2001-2005), a Trustee of other investment companies advised by Fidelity Management & Research Company, Fidelity Investments Money Management, Inc. (investment adviser firm), and FMR Co., Inc. (2001-2005), Senior Vice President of the Fidelity® funds (2001-2005), and managed a number of Fidelity® funds. Ms. Abigail P. Johnson and Mr. Arthur E. Johnson are not related.
Jennifer Toolin McAuliffe (1959)
Year of Election or Appointment: 2016
Trustee
Ms. McAuliffe also serves as Trustee of other Fidelity® funds. Previously, Ms. McAuliffe served as Co-Head of Fixed Income of Fidelity Investments Limited (now known as FIL Limited (FIL)) (diversified financial services company), Director of Research for FIL’s credit and quantitative teams in London, Hong Kong and Tokyo and Director of Research for taxable and municipal bonds at Fidelity Investments Money Management, Inc. Ms. McAuliffe previously served as a member of the Advisory Board of certain Fidelity® funds (2016). Ms. McAuliffe was previously a lawyer at Ropes & Gray LLP and currently serves as director or trustee of several not-for-profit entities.
* Determined to be an “Interested Trustee” by virtue of, among other things, his or her affiliation with the trust or various entities under common control with FMR.
+ The information includes the Trustee's principal occupation during the last five years and other information relating to the experience, attributes, and skills relevant to the Trustee's qualifications to serve as a Trustee, which led to the conclusion that the Trustee should serve as a Trustee for the fund.
Independent Trustees:
Correspondence intended for an Independent Trustee may be sent to Fidelity Investments, P.O. Box 55235, Boston, Massachusetts 02205-5235.
Name, Year of Birth; Principal Occupations and Other Relevant Experience+
Elizabeth S. Acton (1951)
Year of Election or Appointment: 2013
Trustee
Ms. Acton also serves as Trustee of other Fidelity® funds. Prior to her retirement, Ms. Acton served as Executive Vice President, Finance (2011-2012), Executive Vice President, Chief Financial Officer (2002-2011) and Treasurer (2004-2005) of Comerica Incorporated (financial services). Prior to joining Comerica, Ms. Acton held a variety of positions at Ford Motor Company (1983-2002), including Vice President and Treasurer (2000-2002) and Executive Vice President and Chief Financial Officer of Ford Motor Credit Company (1998-2000). Ms. Acton currently serves as a member of the Board and Audit and Finance Committees of Beazer Homes USA, Inc. (homebuilding, 2012-present). Ms. Acton previously served as a member of the Advisory Board of certain Fidelity® funds (2013-2016).
Ann E. Dunwoody (1953)
Year of Election or Appointment: 2018
Trustee
General Dunwoody also serves as Trustee of other Fidelity® funds. General Dunwoody (United States Army, Retired) was the first woman in U.S. military history to achieve the rank of four-star general and prior to her retirement in 2012 held a variety of positions within the U.S. Army, including Commanding General, U.S. Army Material Command (2008-2012). General Dunwoody currently serves as President of First to Four LLC (leadership and mentoring services, 2012-present), a member of the Board and Nomination and Corporate Governance Committees of Kforce Inc. (professional staffing services, 2016-present) and a member of the Board of Automattic Inc. (software engineering, 2018-present). Previously, General Dunwoody served as a member of the Advisory Board and Nominating and Corporate Governance Committee of L3 Technologies, Inc. (communication, electronic, sensor and aerospace systems, 2013-2019) and a member of the Board and Audit and Sustainability and Corporate Responsibility Committees of Republic Services, Inc. (waste collection, disposal and recycling, 2013-2016). Ms. Dunwoody also serves on several boards for non-profit organizations, including as a member of the Board, Chair of the Nomination and Governance Committee and a member of the Audit Committee of Logistics Management Institute (consulting non-profit, 2012-present), a member of the Council of Trustees for the Association of the United States Army (advocacy non-profit, 2013-present), a member of the Board of Florida Institute of Technology (2015-present) and a member of the Board of ThanksUSA (military family education non-profit, 2014-present). General Dunwoody previously served as a member of the Advisory Board of certain Fidelity® funds (2018).
John Engler (1948)
Year of Election or Appointment: 2014
Trustee
Mr. Engler also serves as Trustee of other Fidelity® funds. Previously, Mr. Engler served as Governor of Michigan (1991-2003), President of the Business Roundtable (2011-2017) and interim President of Michigan State University (2018-2019). Mr. Engler currently serves as a member of the Board of K12 Inc. (technology-based education company, 2012-present). Previously, Mr. Engler served as a member of the Board of Universal Forest Products (manufacturer and distributor of wood and wood-alternative products, 2003-2019) and Trustee of The Munder Funds (2003-2014). Mr. Engler previously served as a member of the Advisory Board of certain Fidelity® funds (2014-2016).
Robert F. Gartland (1951)
Year of Election or Appointment: 2010
Trustee
Mr. Gartland also serves as Trustee of other Fidelity® funds. Prior to his retirement, Mr. Gartland held a variety of positions at Morgan Stanley (financial services, 1979-2007), including Managing Director (1987-2007) and Chase Manhattan Bank (1975-1978). Mr. Gartland previously served as Chairman and an investor in Gartland & Mellina Group Corp. (consulting, 2009-2019), as a member of the Board of National Securities Clearing Corporation (1993-1996) and as Chairman of TradeWeb (2003-2004).
Arthur E. Johnson (1947)
Year of Election or Appointment: 2008
Trustee
Chairman of the Independent Trustees
Mr. Johnson also serves as Trustee of other Fidelity® funds. Prior to his retirement, Mr. Johnson served as Senior Vice President of Corporate Strategic Development of Lockheed Martin Corporation (defense contractor, 1999-2009). Mr. Johnson currently serves as a member of the Board of Booz Allen Hamilton (management consulting, 2011-present). Mr. Johnson previously served as a member of the Board of Eaton Corporation plc (diversified power management, 2009-2019) and a member of the Board of AGL Resources, Inc. (holding company, 2002-2016). Mr. Johnson previously served as Vice Chairman (2015-2018) of the Independent Trustees of certain Fidelity® funds. Mr. Arthur E. Johnson is not related to Ms. Abigail P. Johnson.
Michael E. Kenneally (1954)
Year of Election or Appointment: 2009
Trustee
Vice Chairman of the Independent Trustees
Mr. Kenneally also serves as Trustee of other Fidelity® funds. Prior to his retirement, Mr. Kenneally served as Chairman and Global Chief Executive Officer of Credit Suisse Asset Management and Executive Vice President and Chief Investment Officer of Bank of America Corporation. Earlier roles at Bank of America included Director of Research, Senior Portfolio Manager for various institutional equity accounts and mutual funds and Portfolio Manager for a number of institutional fixed-income clients. Mr. Kenneally began his career as a Research Analyst in 1983 and was awarded the Chartered Financial Analyst (CFA) designation in 1991.
Marie L. Knowles (1946)
Year of Election or Appointment: 2001
Trustee
Ms. Knowles also serves as Trustee of other Fidelity® funds. Prior to her retirement, Ms. Knowles held several positions at Atlantic Richfield Company (diversified energy), including Executive Vice President and Chief Financial Officer (1996-2000), Senior Vice President (1993-1996) and President of ARCO Transportation Company (pipeline and tanker operations, 1993-1996). Ms. Knowles currently serves as a member of the Board of McKesson Corporation (healthcare service, since 2002), a member of the Board of the Santa Catalina Island Company (real estate, 2009-present), a member of the Investment Company Institute Board of Governors and a member of the Governing Council of the Independent Directors Council (2014-present). Ms. Knowles also serves as a member of the Advisory Board for the School of Engineering of the University of Southern California. Ms. Knowles previously served as Chairman (2015-2018) and Vice Chairman (2012-2015) of the Independent Trustees of certain Fidelity® funds.
Mark A. Murray (1954)
Year of Election or Appointment: 2016
Trustee
Mr. Murray also serves as Trustee of other Fidelity® funds. Previously, Mr. Murray served as Co-Chief Executive Officer (2013-2016), President (2006-2013) and Vice Chairman (2013-2020) of Meijer, Inc. Mr. Murray serves as a member of the Board and Nuclear Review and Public Policy and Responsibility Committees of DTE Energy Company (diversified energy company, 2009-present) and a member of the Board and Audit Committee and Chairman of the Nominating and Corporate Governance Committee of Universal Forest Products, Inc. (manufacturer and distributor of wood and wood-alternative products, 2004-2016). Mr. Murray previously served as a member of the Board of Spectrum Health (not-for-profit health system, 2015-2019). Mr. Murray also serves as a member of the Board of many community and professional organizations. Mr. Murray previously served as a member of the Advisory Board of certain Fidelity® funds (2016).
+ The information includes the Trustee's principal occupation during the last five years and other information relating to the experience, attributes, and skills relevant to the Trustee's qualifications to serve as a Trustee, which led to the conclusion that the Trustee should serve as a Trustee for the fund.
Advisory Board Members and Officers:
Correspondence intended for an officer may be sent to Fidelity Investments, 245 Summer Street, Boston, Massachusetts 02210. Officers appear below in alphabetical order.
Name, Year of Birth; Principal Occupation
Craig S. Brown (1977)
Year of Election or Appointment: 2019
Assistant Treasurer
Mr. Brown also serves as Assistant Treasurer of other funds. Mr. Brown is an employee of Fidelity Investments (2013-present).
John J. Burke III (1964)
Year of Election or Appointment: 2018
Chief Financial Officer
Mr. Burke also serves as Chief Financial Officer of other funds. Mr. Burke serves as Head of Investment Operations for Fidelity Fund and Investment Operations (2018-present) and is an employee of Fidelity Investments (1998-present). Previously Mr. Burke served as head of Asset Management Investment Operations (2012-2018).
David J. Carter (1973)
Year of Election or Appointment: 2020
Assistant Secretary
Mr. Carter also serves as Assistant Secretary of other funds. Mr. Carter serves as Vice President, Associate General Counsel (2010-present) and is an employee of Fidelity Investments (2005-present).
Jonathan Davis (1968)
Year of Election or Appointment: 2010
Assistant Treasurer
Mr. Davis also serves as Assistant Treasurer of other funds. Mr. Davis serves as Assistant Treasurer of FMR Capital, Inc. (2017-present) and is an employee of Fidelity Investments. Previously, Mr. Davis served as Vice President and Associate General Counsel of FMR LLC (diversified financial services company, 2003-2010).
Laura M. Del Prato (1964)
Year of Election or Appointment: 2018
President and Treasurer
Ms. Del Prato also serves as an officer of other funds. Ms. Del Prato is an employee of Fidelity Investments (2017-present). Previously, Ms. Del Prato served as President and Treasurer of The North Carolina Capital Management Trust: Cash Portfolio and Term Portfolio (2018-2020). Prior to joining Fidelity Investments, Ms. Del Prato served as a Managing Director and Treasurer of the JPMorgan Mutual Funds (2014-2017). Prior to JPMorgan, Ms. Del Prato served as a partner at Cohen Fund Audit Services (accounting firm, 2012-2013) and KPMG LLP (accounting firm, 2004-2012).
Colm A. Hogan (1973)
Year of Election or Appointment: 2016
Assistant Treasurer
Mr. Hogan also serves as an officer of other funds. Mr. Hogan serves as Assistant Treasurer of FMR Capital, Inc. (2017-present) and is an employee of Fidelity Investments (2005-present). Previously, Mr. Hogan served as Deputy Treasurer of certain Fidelity® funds (2016-2020) and Assistant Treasurer of certain Fidelity® funds (2016-2018).
Cynthia Lo Bessette (1969)
Year of Election or Appointment: 2019
Secretary and Chief Legal Officer (CLO)
Ms. Lo Bessette also serves as an officer of other funds. Ms. Lo Bessette serves as CLO, Secretary, and Senior Vice President of Fidelity Management & Research Company LLC (investment adviser firm, 2019-present); and CLO of Fidelity Management & Research (Hong Kong) Limited, FMR Investment Management (UK) Limited, and Fidelity Management & Research (Japan) Limited (investment adviser firms, 2019-present). She is a Senior Vice President and Deputy General Counsel of FMR LLC (diversified financial services company, 2019-present), and is an employee of Fidelity Investments. Previously, Ms. Lo Bessette served as CLO, Secretary, and Senior Vice President of FMR Co., Inc. (investment adviser firm, 2019); Secretary of Fidelity SelectCo, LLC and Fidelity Investments Money Management, Inc. (investment adviser firms, 2019). Prior to joining Fidelity Investments, Ms. Lo Bessette was Executive Vice President, General Counsel (2016-2019) and Senior Vice President, Deputy General Counsel (2015-2016) of OppenheimerFunds (investment management company) and Deputy Chief Legal Officer (2013-2015) of Jennison Associates LLC (investment adviser firm).
Chris Maher (1972)
Year of Election or Appointment: 2013
Assistant Treasurer
Mr. Maher also serves as an officer of other funds. Mr. Maher serves as Assistant Treasurer of FMR Capital, Inc. (2017-present), and is an employee of Fidelity Investments (2008-present). Previously, Mr. Maher served as Assistant Treasurer of certain funds (2013-2020); Vice President of Asset Management Compliance (2013), Vice President of the Program Management Group of FMR (investment adviser firm, 2010-2013), and Vice President of Valuation Oversight (2008-2010).
Jamie Pagliocco (1964)
Year of Election or Appointment: 2020
Vice President
Mr. Pagliocco also serves as Vice President of other funds. Mr. Pagliocco serves as President of Fixed Income (2020-present), and is an employee of Fidelity Investments (2001-present). Previously, Mr. Pagliocco served as Co-Chief Investment Officer – Bond (2017-2020), Global Head of Bond Trading (2016-2019), and as a portfolio manager.
Kenneth B. Robins (1969)
Year of Election or Appointment: 2020
Chief Compliance Officer
Mr. Robins also serves as an officer of other funds. Mr. Robins serves as Compliance Officer of Fidelity Management & Research Company LLC (investment adviser firm, 2016-present) and is an employee of Fidelity Investments (2004-present). Previously, Mr. Robins served as Compliance Officer of FMR Co., Inc. (investment adviser firm, 2016-2019), as Executive Vice President of Fidelity Investments Money Management, Inc. (investment adviser firm, 2013-2016) and served in other fund officer roles.
Brett Segaloff (1972)
Year of Election or Appointment: 2021
Anti-Money Laundering (AML) Officer
Mr. Segaloff also serves as an AML Officer of other funds and other related entities. He is Director, Anti-Money Laundering (2007-present) of FMR LLC (diversified financial services company) and is an employee of Fidelity Investments (1996-present).
Stacie M. Smith (1974)
Year of Election or Appointment: 2013
Assistant Treasurer
Ms. Smith also serves as an officer of other funds. Ms. Smith serves as Assistant Treasurer of FMR Capital, Inc. (2017-present), is an employee of Fidelity Investments (2009-present), and has served in other fund officer roles. Prior to joining Fidelity Investments, Ms. Smith served as Senior Audit Manager of Ernst & Young LLP (accounting firm, 1996-2009). Previously, Ms. Smith served as Assistant Treasurer (2013-2019) and Deputy Treasurer (2013-2016) of certain Fidelity® funds.
Marc L. Spector (1972)
Year of Election or Appointment: 2016
Deputy Treasurer
Mr. Spector also serves as an officer of other funds. Mr. Spector serves as Assistant Treasurer of FMR Capital, Inc. (2017-present) and is an employee of Fidelity Investments (2016-present). Prior to joining Fidelity Investments, Mr. Spector served as Director at the Siegfried Group (accounting firm, 2013-2016), and prior to Siegfried Group as audit senior manager at Deloitte & Touche LLP (accounting firm, 2005-2013).
Jim Wegmann (1979)
Year of Election or Appointment: 2019
Assistant Treasurer
Mr. Wegmann also serves as Assistant Treasurer of other funds. Mr. Wegmann is an employee of Fidelity Investments (2011-present).
VIP Investment Grade Bond Portfolio
Shareholder Expense Example
As a shareholder, you incur two types of costs: (1) transaction costs, which may include sales charges (loads) on purchase payments or redemption proceeds, as applicable and (2) ongoing costs, which generally include management fees, distribution and/or service (12b-1) fees and other Fund expenses. This Example is intended to help you understand your ongoing costs (in dollars) of investing in a fund and to compare these costs with the ongoing costs of investing in other mutual funds.
The Example is based on an investment of $1,000 invested at the beginning of the period and held for the entire period (July 1, 2020 to December 31, 2020).
Actual Expenses
The first line of the accompanying table provides information about actual account values and actual expenses. You may use the information in this line, together with the amount you invested, to estimate the expenses that you paid over the period. Simply divide your account value by $1,000.00 (for example, an $8,600 account value divided by $1,000.00 = 8.6), then multiply the result by the number in the first line for a class/Fund under the heading entitled "Expenses Paid During Period" to estimate the expenses you paid on your account during this period. If any fund is a shareholder of any underlying mutual funds or exchange-traded funds (ETFs) (the Underlying Funds), such fund indirectly bears its proportional share of the expenses of the Underlying Funds in addition to the direct expenses incurred presented in the table. These fees and expenses are not included in the annualized expense ratio used to calculate the expense estimate in the table below. The estimate of expenses does not include any fees or other expenses of any variable annuity or variable life insurance product. If they were, the estimate of expenses you paid during the period would be higher, and your ending account value would be lower.
Hypothetical Example for Comparison Purposes
The second line of the accompanying table provides information about hypothetical account values and hypothetical expenses based on the actual expense ratio and an assumed rate of return of 5% per year before expenses, which is not the actual return. The hypothetical account values and expenses may not be used to estimate the actual ending account balance or expenses you paid for the period. You may use this information to compare the ongoing costs of investing in the Fund and other funds. To do so, compare this 5% hypothetical example with the 5% hypothetical examples that appear in the shareholder reports of the other funds. If any fund is a shareholder of any Underlying Funds, such fund indirectly bears its proportional share of the expenses of the Underlying Funds in addition to the direct expenses as presented in the table. These fees and expenses are not included in the annualized expense ratio used to calculate the expense estimate in the table below. The estimate of expenses does not include any fees or other expenses of any variable annuity or variable life insurance product. If they were, the estimate of expenses you paid during the period would be higher, and your ending account value would be lower.
Please note that the expenses shown in the table are meant to highlight your ongoing costs only and do not reflect any transaction costs. Therefore, the second line of the table is useful in comparing ongoing costs only, and will not help you determine the relative total costs of owning different funds.
| | Annualized Expense Ratio-A | Beginning
Account Value
July 1, 2020 | Ending
Account Value
December 31, 2020 | Expenses Paid
During Period-B
July 1, 2020
to December 31, 2020 |
| VIP Investment Grade Bond Portfolio | | | | |
| Initial Class | .39% | | | |
| Actual | | $1,000.00 | $1,031.10 | $1.99 |
| Hypothetical-C | | $1,000.00 | $1,023.18 | $1.98 |
| Service Class | .49% | | | |
| Actual | | $1,000.00 | $1,031.50 | $2.50 |
| Hypothetical-C | | $1,000.00 | $1,022.67 | $2.49 |
| Service Class 2 | .64% | | | |
| Actual | | $1,000.00 | $1,030.80 | $3.27 |
| Hypothetical-C | | $1,000.00 | $1,021.92 | $3.25 |
| Investor Class | .42% | | | |
| Actual | | $1,000.00 | $1,031.00 | $2.14 |
| Hypothetical-C | | $1,000.00 | $1,023.03 | $2.14 |
A Annualized expense ratio reflects expenses net of applicable fee waivers.
B Expenses are equal to the annualized expense ratio, multiplied by the average account value over the period, multiplied by 184/ 366 (to reflect the one-half year period). The fees and expenses of any Underlying Funds are not included in each annualized expense ratio.
C 5% return per year before expenses
VIP Investment Grade Bond Portfolio
Distributions (Unaudited)
The Board of Trustees of VIP Investment Grade Bond Portfolio voted to pay to shareholders of record at the opening of business on record date, the following distributions per share derived from capital gains realized from sales of portfolio securities, and dividends derived from net investment income:
| | Pay Date | Record Date | Dividends | Capital Gains |
| VIP Investment Grade Bond Portfolio | | | | |
| Initial Class | 02/05/21 | 02/05/21 | $0.056 | $0.152 |
| Service Class | 02/05/21 | 02/05/21 | $0.053 | $0.152 |
| Service Class 2 | 02/05/21 | 02/05/21 | $0.051 | $0.152 |
| Investor Class | 02/05/21 | 02/05/21 | $0.055 | $0.152 |
|
A total of 9.51% of the dividends distributed during the fiscal year was derived from interest on U.S. Government securities which is generally exempt from state income tax.
Board Approval of Investment Advisory Contracts and Management Fees
VIP Investment Grade Bond Portfolio
Each year, the Board of Trustees, including the Independent Trustees (together, the Board), votes on the renewal of the management contract with Fidelity Management & Research Company LLC (FMR) and the sub-advisory agreements (together, the Advisory Contracts) for the fund. FMR and the sub-advisers are referred to herein as the Investment Advisers. The Board, assisted by the advice of fund counsel and Independent Trustees' counsel, requests and considers a broad range of information relevant to the renewal of the Advisory Contracts throughout the year.
The Board meets regularly and, at each of its meetings, covers an extensive agenda of topics and materials and considers factors that are relevant to its annual consideration of the renewal of the fund's Advisory Contracts, including the services and support provided to the fund and its shareholders. The Board has established four standing committees (Committees) — Operations, Audit, Fair Valuation, and Governance and Nominating — each composed of and chaired by Independent Trustees with varying backgrounds, to which the Board has assigned specific subject matter responsibilities in order to enhance effective decision-making by the Board. The Operations Committee, of which all of the Independent Trustees are members, meets regularly throughout the year and considers, among other matters, information specifically related to the annual consideration of the renewal of the fund's Advisory Contracts. The Board, acting directly and through its Committees, requests and receives information concerning the annual consideration of the renewal of the fund's Advisory Contracts. The Board also meets as needed to review matters specifically related to the Board's annual consideration of the renewal of the Advisory Contracts. Members of the Board may also meet with trustees of other Fidelity funds through joint ad hoc committees to discuss certain matters relevant to all of the Fidelity funds.
At its September 2020 meeting, the Board unanimously determined to renew the fund's Advisory Contracts. In reaching its determination, the Board considered all factors it believed relevant, including (i) the nature, extent, and quality of the services provided to the fund and its shareholders (including the investment performance of the fund); (ii) the competitiveness of the fund's management fee and total expense ratio relative to peer funds; (iii) the total costs of the services provided by and the profits realized by Fidelity from its relationships with the fund; and (iv) the extent to which, if any, economies of scale exist and are realized as the fund grows, and whether any economies of scale are appropriately shared with fund shareholders.
In considering whether to renew the Advisory Contracts for the fund, the Board reached a determination, with the assistance of fund counsel and Independent Trustees' counsel and through the exercise of its business judgment, that the renewal of the Advisory Contracts was in the best interests of the fund and its shareholders and that the compensation payable under the Advisory Contracts was fair and reasonable. The Board's decision to renew the Advisory Contracts was not based on any single factor, but rather was based on a comprehensive consideration of all the information provided to the Board at its meetings throughout the year. The Board, in reaching its determination to renew the Advisory Contracts, was aware that shareholders of the fund have a broad range of investment choices available to them, including a wide choice among funds offered by Fidelity's competitors, and that the fund's shareholders, who have the opportunity to review and weigh the disclosure provided by the fund in its prospectus and other public disclosures, have chosen to invest in this fund, which is part of the Fidelity family of funds.
Nature, Extent, and Quality of Services Provided. The Board considered Fidelity’s staffing as it relates to the fund, including the backgrounds of investment personnel of Fidelity, and also considered the fund’s investment objective, strategies, and related investment philosophy. The Independent Trustees also had discussions with senior management of Fidelity’s investment operations and investment groups. The Board considered the structure of the investment personnel compensation program and whether this structure provides appropriate incentives to act in the best interests of the fund. Additionally, the Board considered the portfolio managers’ investments, if any, in the funds that they manage.
Resources Dedicated to Investment Management and Support Services. The Board reviewed the general qualifications and capabilities of Fidelity's investment staff, including its size, education, experience, and resources, as well as Fidelity's approach to recruiting, managing, and compensating investment personnel. The Board noted that Fidelity has continued to increase the resources devoted to non-U.S. offices, including expansion of Fidelity's global investment organization. The Board also noted that Fidelity's analysts have extensive resources, tools and capabilities that allow them to conduct sophisticated quantitative and fundamental analysis, as well as credit analysis of issuers, counterparties and guarantors. Further, the Board considered that Fidelity's investment professionals have sufficient access to global information and data so as to provide competitive investment results over time, and that those professionals also have access to sophisticated tools that permit them to assess portfolio construction and risk and performance attribution characteristics continuously, as well as to transmit new information and research conclusions rapidly around the world. Additionally, in its deliberations, the Board considered Fidelity's trading, risk management, compliance, and technology and operations capabilities and resources, which are integral parts of the investment management process. The Board also considered Fidelity's investments in business continuity planning, and its success in continuously providing services to the fund notwithstanding the severe disruptions caused by the COVID-19 pandemic.
Shareholder and Administrative Services. The Board considered (i) the nature, extent, quality, and cost of advisory, administrative, and shareholder services performed by the Investment Advisers and their affiliates under the Advisory Contracts and under separate agreements covering transfer agency, pricing and bookkeeping, and securities lending services for the fund; (ii) the nature and extent of the supervision of third party service providers, principally custodians, subcustodians, and pricing vendors; and (iii) the resources devoted to, and the record of compliance with, the fund's compliance policies and procedures.
The Board noted that the growth of fund assets over time across the complex allows Fidelity to reinvest in the development of services designed to enhance the value and convenience of the Fidelity funds as investment vehicles. These services include 24-hour access to account information and market information over the Internet and through telephone representatives, investor education materials and asset allocation tools, and the expanded availability of Fidelity Investor Centers.
Investment in a Large Fund Family. The Board considered the benefits to shareholders of investing in a Fidelity fund, including the benefits of investing in a fund that is part of a large family of funds offering a variety of investment disciplines and providing a large variety of mutual fund investor services. The Board noted that Fidelity had taken, or had made recommendations that resulted in the Fidelity funds taking, a number of actions over the previous year that benefited particular funds, including: (i) continuing to dedicate additional resources to Fidelity's investment research process, which includes meetings with management of issuers of securities in which the funds invest, and to the support of the senior management team that oversees asset management; (ii) continuing efforts to enhance Fidelity's global research capabilities; (iii) launching new funds and ETFs with innovative structures, strategies and pricing and making other enhancements to meet client needs; (iv) launching new share classes of existing funds; (v) eliminating purchase minimums and broadening eligibility requirements for certain funds and share classes; (vi) reducing management fees and total expenses for certain target date funds or classes and index funds; (vii) lowering expenses for certain funds and classes by implementing or lowering expense caps; (viii) rationalizing product lines and gaining increased efficiencies from fund mergers, liquidations, and share class consolidations; (ix) continuing to develop, acquire and implement systems and technology to improve services to the funds and shareholders, strengthen information security, and increase efficiency; and (x) continuing to implement enhancements to further strengthen Fidelity's product line to increase investors' probability of success in achieving their investment goals, including retirement income goals.
Investment Performance. The Board considered whether the fund has operated in accordance with its investment objective, as well as its record of compliance with its investment restrictions and its performance history.
The Board took into account discussions that occur at Board meetings throughout the year with representatives of the Investment Advisers about fund investment performance. In this regard the Board noted that as part of regularly scheduled fund reviews and other reports to the Board on fund performance, the Board considers annualized return information for the fund for different time periods, measured against an appropriate securities market index (benchmark index) and an appropriate peer group of funds with similar objectives (peer group). In its evaluation of fund investment performance at meetings throughout the year, the Board gave particular attention to information indicating underperformance of certain Fidelity funds for specific time periods and discussed with the Investment Advisers the reasons for such underperformance.
In addition to reviewing absolute and relative fund performance, the Independent Trustees periodically consider the appropriateness of fund performance metrics in evaluating the results achieved. In general, the Independent Trustees believe that fund performance should be evaluated based on gross performance (before fees and expenses but after transaction costs) compared to appropriate benchmark indices, over appropriate time periods that may include full market cycles, and on net performance (after fees and expenses) compared to appropriate peer groups, as applicable, over the same periods, taking into account relevant factors including the following: general market conditions; expectations for interest rate levels and credit conditions; issuer-specific information including credit quality; the potential for incremental return versus the fund's benchmark index weighed against the risks involved in obtaining that incremental return, including the risk of diminished or negative total returns; and fund cash flows and other factors. The Independent Trustees generally give greater weight to fund performance over longer time periods than over shorter time periods. Depending on the circumstances, the Independent Trustees may be satisfied with a fund's performance notwithstanding that it lags its benchmark index or peer group for certain periods.
The Independent Trustees recognize that shareholders evaluate performance on a net basis over their own holding periods, for which one-, three-, and five-year periods are often used as a proxy. For this reason, the performance information reviewed by the Board also included net cumulative calendar year total return information for the fund and an appropriate benchmark index and peer group for the most recent one-, three-, and five-year periods. The Independent Trustees recognize that shareholders who are not investing through a tax-advantaged retirement account also consider tax consequences in evaluating performance.
Based on its review, the Board concluded that the nature, extent, and quality of services provided to the fund under the Advisory Contracts should continue to benefit the shareholders of the fund.
Competitiveness of Management Fee and Total Expense Ratio. The Board considered the fund’s management fee and total expense ratio compared to “mapped groups” of competitive funds and classes created for the purpose of facilitating the Trustees’ competitive analysis of management fees and total expenses. Fidelity creates “mapped groups” by combining similar Lipper investment objective categories that have comparable investment mandates. Combining Lipper investment objective categories aids the Board’s management fee and total expense ratio comparisons by broadening the competitive group used for comparison.
Management Fee. The Board considered two proprietary management fee comparisons for the 12-month periods shown in basis points (BP) in the chart below. The group of Lipper funds used by the Board for management fee comparisons is referred to below as the "Total Mapped Group" and is broader than the Lipper peer group used by the Board for performance comparisons. The Total Mapped Group comparison focuses on a fund's standing in terms of gross management fees before expense reimbursements or caps relative to the total universe of funds with comparable investment mandates, regardless of whether their management fee structures also are comparable. Funds with comparable investment mandates offer exposure to similar types of securities. Funds with comparable management fee structures have similar management fee contractual arrangements (
e.g., flat rate charged for advisory services, all-inclusive fee rate,
etc.). "TMG %" represents the percentage of funds in the Total Mapped Group that had management fees that were lower than the fund's. For example, a hypothetical TMG % of 20% would mean that 80% of the funds in the Total Mapped Group had higher, and 20% had lower, management fees than the fund. The fund's actual TMG %s and the number of funds in the Total Mapped Group are in the chart below. The "Asset-Sized Peer Group" (ASPG) comparison focuses on a fund's standing relative to a subset of non-Fidelity funds within the Total Mapped Group that are similar in size and management fee structure. For example, if a fund is in the first quartile of the ASPG, the fund's management fee ranks in the least expensive or lowest 25% of funds in the ASPG. The ASPG represents at least 15% of the funds in the Total Mapped Group with comparable asset size and management fee structures, subject to a minimum of 50 funds (or all funds in the Total Mapped Group if fewer than 50). Additional information, such as the ASPG quartile in which the fund's management fee rate ranked, is also included in the chart and was considered by the Board.
VIP Investment Grade Bond Portfolio

The Board noted that the fund's management fee rate ranked below the median of its Total Mapped Group and below the median of its ASPG for 2019.
The Board noted that it and the boards of other Fidelity funds formed an ad hoc Committee on Group Fee, which meets periodically, to conduct an in-depth review of the "group fee" component of the management fee of funds with such management fee structures. The Committee's focus included the mechanics of the group fee, the competitive landscape of group fee structures, Fidelity funds with no group fee component and investment products not included in group fee assets. The Board also considered that, for funds subject to the group fee, FMR agreed to voluntarily waive fees over a specified period of time in amounts designed to account for assets converted from certain funds to certain collective investment trusts.
Based on its review, the Board concluded that the fund's management fee is fair and reasonable in light of the services that the fund receives and the other factors considered.
Total Expense Ratio. In its review of each class's total expense ratio, the Board considered the fund's management fee rate as well as other fund or class expenses, as applicable, such as transfer agent fees, pricing and bookkeeping fees, fund-paid 12b-1 fees, and custodial, legal, and audit fees. The Board also noted that Fidelity may agree to waive fees or reimburse expenses from time to time, and the extent to which, if any, it has done so for the fund. As part of its review, the Board also considered the current and historical total expense ratios of each class of the fund compared to competitive fund median expenses. Each class of the fund is compared to those funds and classes in the Total Mapped Group (used by the Board for management fee comparisons) that have a similar sales load structure.
The Board noted that the total expense ratio of each class ranked below the competitive median for 2019.
Fees Charged to Other Fidelity Clients. The Board also considered Fidelity fee structures and other information with respect to clients of Fidelity, such as other funds advised or subadvised by Fidelity, pension plan clients, and other institutional clients with similar mandates. The Board noted that a joint ad hoc committee created by it and the boards of other Fidelity funds periodically reviews and compares Fidelity's institutional investment advisory business with its business of providing services to the Fidelity funds and also noted the most recent findings of the committee. The Board noted that the committee's review included a consideration of the differences in services provided, fees charged, and costs incurred, as well as competition in the markets serving the different categories of clients.
Based on its review of total expense ratios and fees charged to other Fidelity clients, the Board concluded that the total expense ratio of each class of the fund was reasonable in light of the services that the fund and its shareholders receive and the other factors considered.
Costs of the Services and Profitability. The Board considered the revenues earned and the expenses incurred by Fidelity in conducting the business of developing, marketing, distributing, managing, administering and servicing the fund and servicing the fund’s shareholders. The Board also considered the level of Fidelity’s profits in respect of all the Fidelity funds.
On an annual basis, Fidelity presents to the Board information about the profitability of its relationships with the fund. Fidelity calculates profitability information for each fund, as well as aggregate profitability information for groups of Fidelity funds and all Fidelity funds, using a series of detailed revenue and cost allocation methodologies which originate with the books and records of Fidelityon which Fidelity’s audited financial statements are based. The Audit Committee of the Board reviews any significant changes from the prior year’s methodologies and the full Board approves such changes.
A public accounting firm has been engaged annually by the Board as part of the Board's assessment of Fidelity's profitability analysis. The engagement includes the review and assessment of the methodologies used by Fidelity in determining the revenues and expenses attributable to Fidelity's mutual fund business, and completion of agreed-upon procedures in respect of the mathematical accuracy of certain fund profitability information and its conformity to established allocation methodologies. After considering the reports issued under the engagement and information provided by Fidelity, the Board concluded that while other allocation methods may also be reasonable, Fidelity's profitability methodologies are reasonable in all material respects.
The Board also reviewed Fidelity’s non-fund businesses and potential indirect benefits such businesses may have received as a result of their association with Fidelity’s mutual fund business (i.e., fall-out benefits) as well as cases where Fidelity’s affiliates may benefit from the funds’ business. The Board considered areas where potential indirect benefits to the Fidelity funds from their relationships with Fidelity may exist. The Board also considered that in 2019 a joint ad hoc committee created by it and the boards of other Fidelity funds evaluated potential fall-out benefits (PFOB Committee). The Board noted that it considered the PFOB Committee’s findings in connection with its consideration of the renewal of the Advisory Contracts.
The Board considered the costs of the services provided by and the profits realized by Fidelity in connection with the operation of the fund, including the conclusions of the PFOB Committee, and was satisfied that the profitability was not excessive.
Economies of Scale. The Board considered whether there have been economies of scale in respect of the management of the Fidelity funds, whether the Fidelity funds (including the fund) have appropriately benefited from any such economies of scale, and whether there is potential for realization of any further economies of scale. The Board considered the extent to which the fund will benefit from economies of scale as assets grow through increased services to the fund, through waivers or reimbursements, or through fee or expense ratio reductions. The Board also noted that a committee (the Economies of Scale Committee) created by it and the boards of other Fidelity funds periodically analyzes whether Fidelity attains economies of scale in respect of the management and servicing of the Fidelity funds, whether the Fidelity funds have appropriately benefited from such economies of scale, and whether there is potential for realization of any further economies of scale.
The Board recognized that the fund’s management contract incorporates a “group fee” structure, which provides for lower group fee rates as total “group assets” increase, and for higher group fee rates as total “group assets” decrease (“group assets” as defined in the management contract). FMR calculates the group fee rates based on a tiered asset “breakpoint” schedule that varies based on asset class. The Board considered that the group fee is designed to deliver the benefits of economies of scale to fund shareholders when total Fidelity fund assets increase, even if assets of any particular fund are unchanged or have declined, because some portion of Fidelity’s costs are attributable to services provided to all Fidelity funds, and all funds benefit if those costs can be allocated among more assets. The Board concluded that, given the group fee structure, fund shareholders will benefit from lower management fees as “group assets” increase at the fund complex level, regardless of whether Fidelity achieves any such economies of scale.
The Board concluded, taking into account the analysis of the Economies of Scale Committee, that economies of scale, if any, are being appropriately shared between fund shareholders and Fidelity.
Additional Information Requested by the Board. In order to develop fully the factual basis for consideration of the Fidelity funds’ advisory contracts, the Board requested and received additional information on certain topics, including: (i) Fidelity’s fund profitability methodology, profitability trends for certain funds, the allocation of various costs to different funds, and the impact of certain factors on fund profitability results; (ii) portfolio manager changes that have occurred during the past year and the amount of the investment that each portfolio manager has made in the Fidelity fund(s) that he or she manages; (iii) Fidelity’s compensation structure for portfolio managers, research analysts, and other key personnel, including its effects on fund profitability, the rationale for the compensation structure, and the extent to which current market conditions have affected retention and recruitment; (iv) the arrangements with and compensation paid to certain fund sub-advisers on behalf of the Fidelity funds and the treatment of such compensation within Fidelity’s fund profitability methodology; (v) the terms of the funds’ various management fee structures, including the basic group fee and the terms of Fidelity’s voluntary expense limitation agreements; (vi) Fidelity’s transfer agent fee, expense, and service structures for different funds and classes relative to competitive trends; (vii) the impact on fund profitability of recent industry trends, such as the growth in passively managed funds and outflows from actively managed equity funds; and (viii) explanations regarding the relative total expense ratios of certain funds and classes, total expense competitive trends and methodologies for total expense competitive comparisons, and actions that might be taken by Fidelity to reduce total expense ratios for certain classes. In addition, the Board considered its discussions with Fidelity regarding Fidelity’s efforts to maintain the continuous investment and shareholder services necessary for the funds during the current pandemic and economic circumstances.
Based on its evaluation of all of the conclusions noted above, and after considering all factors it believed relevant, the Board concluded that the advisory fee arrangements are fair and reasonable, and that the fund’s Advisory Contracts should be renewed.
The following are the financial statements for the Fidelity® VIP Investment Grade Central Fund as of December 31, 2020 which is a direct investment of VIP Investment Grade Bond Portfolio.
Note to Shareholders:
Early in 2020, the outbreak and spread of a new coronavirus emerged as a public health emergency that had a major influence on financial markets, primarily based on its impact on the global economy and the outlook for corporate earnings. The virus causes a respiratory disease known as COVID-19. On March 11, the World Health Organization declared the COVID-19 outbreak a pandemic, citing sustained risk of further global spread.
In the weeks following, as the crisis worsened, we witnessed an escalating human tragedy with wide-scale social and economic consequences from coronavirus-containment measures. The outbreak of COVID-19 prompted a number of measures to limit the spread, including travel and border restrictions, quarantines, and restrictions on large gatherings. In turn, these resulted in lower consumer activity, diminished demand for a wide range of products and services, disruption in manufacturing and supply chains, and – given the wide variability in outcomes regarding the outbreak – significant market uncertainty and volatility. Amid the turmoil, global governments and central banks took unprecedented action to help support consumers, businesses, and the broader economies, and to limit disruption to financial systems.
The situation continues to unfold, and the extent and duration of its impact on financial markets and the economy remain highly uncertain. Extreme events such as the coronavirus crisis are “exogenous shocks” that can have significant adverse effects on mutual funds and their investments. Although multiple asset classes may be affected by market disruption, the duration and impact may not be the same for all types of assets.
Fidelity is committed to helping you stay informed amid news about COVID-19 and during increased market volatility, and we’re taking extra steps to be responsive to customer needs. We encourage you to visit our websites, where we offer ongoing updates, commentary, and analysis on the markets and our funds.
Fidelity® VIP Investment Grade Central Fund
Performance: The Bottom Line
Average annual total return reflects the change in the value of an investment, assuming reinvestment of distributions from dividend income and capital gains (the profits earned upon the sale of securities that have grown in value, if any) and assuming a constant rate of performance each year. The hypothetical investment and the average annual total returns do not reflect the deduction of taxes that a shareholder would pay on fund distributions or the redemption of fund shares. During periods of reimbursement by Fidelity, a fund’s total return will be greater than it would be had the reimbursement not occurred. How a fund did yesterday is no guarantee of how it will do tomorrow.
Average Annual Total Returns
| For the periods ended December 31, 2020 | Past 1 year | Past 5 years | Past 10 years |
| Fidelity VIP Investment Grade Central Fund | 9.87% | 5.71% | 4.74% |
$10,000 Over 10 Years
Let's say hypothetically that $10,000 was invested in Fidelity® VIP Investment Grade Central Fund on December 31, 2010.
The chart shows how the value of your investment would have changed, and also shows how the Bloomberg Barclays U.S. Aggregate Bond Index performed over the same period.
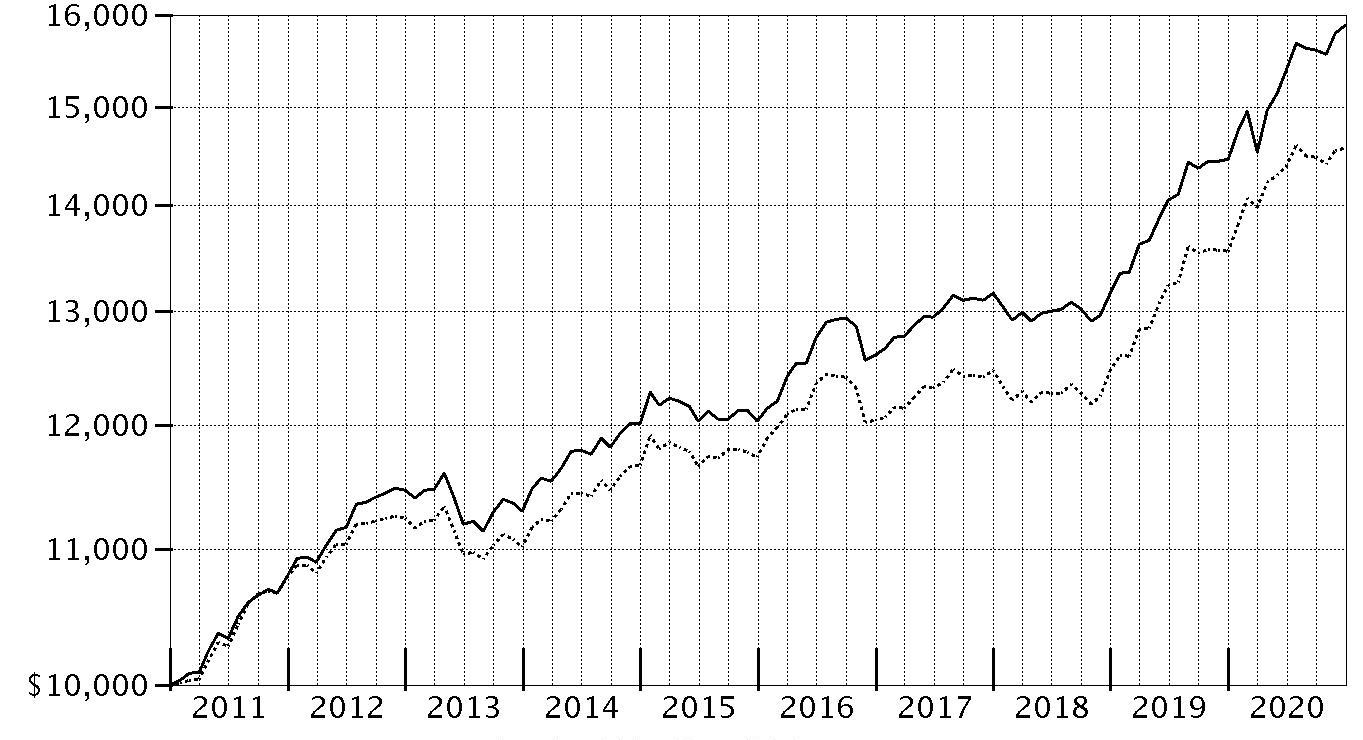
| Period Ending Values |
| $15,888 | Fidelity VIP Investment Grade Central Fund |
| $14,576 | Bloomberg Barclays U.S. Aggregate Bond Index |
Fidelity® VIP Investment Grade Central Fund
Management's Discussion of Fund Performance
Market Recap: U.S. taxable investment-grade bonds rose strongly in 2020, led by corporate bonds early and late in the period, and by U.S. Treasuries in March, as investors sought safer havens amid the market shock of the outbreak and spread of COVID-19. The Bloomberg Barclays U.S. Aggregate Bond Index gained 7.51% for the year. Corporate bonds advanced early on, then plunged in February. At this time, spreads widened due to robust investor demand for relatively safer assets – especially U.S. Treasury bonds – as the coronavirus pandemic and efforts to contain it threatened global economic growth and corporate earnings, leading to pockets of market illiquidity in March. Aggressive intervention by the U.S. Federal Reserve boosted liquidity and led to a broad rally for fixed-income assets from April through July. Spreads widened moderately in August and September, amid healthy issuance of new corporate bonds, then narrowed in the fourth quarter. Within the Bloomberg Barclays index, corporate bonds gained 9.89% for the year, topping the 8.00% advance of U.S. Treasuries. Securitized sectors, meanwhile, lagged the broader market. Outside the index, U.S. corporate high-yield bonds gained 7.11% and Treasury Inflation-Protected Securities (TIPS) rose 10.99%.
Comments from Co-Portfolio Managers Celso Munoz and Ford O'Neil: For 2020, the fund gained 9.87% outpacing the 7.51% advance of the benchmark, the Bloomberg Barclays U.S. Aggregate Bond Index. Positioning among investment-grade corporate bonds, including our decision to add high-quality, longer-term investment-grade bonds beginning in March, added notable relative value. Security selection among investment-grade corporates also produced a positive relative result. Late in the year, we reduced the fund's investment-grade corporate holdings based on our belief that some had reached their full value. Overweighting investment-grade corporates, on average, went hand in hand with our decision to underweight U.S. Treasuries, which boosted the fund's relative return because they lagged comparable-duration corporates from March through year end. A non-benchmark position in Treasury Inflation-Protected Securities (TIPS) further aided the fund's the relative result. Adding higher-quality sovereign debt to the fund in the spring also contributed. In contrast, holding commercial mortgage-backed securities detracted. Exposure to collateralized loan obligations, as well as certain bonds and asset-backed securities tied to airline leases, also hurt.
The views expressed above reflect those of the portfolio manager(s) only through the end of the period as stated on the cover of this report and do not necessarily represent the views of Fidelity or any other person in the Fidelity organization. Any such views are subject to change at any time based upon market or other conditions and Fidelity disclaims any responsibility to update such views. These views may not be relied on as investment advice and, because investment decisions for a Fidelity fund are based on numerous factors, may not be relied on as an indication of trading intent on behalf of any Fidelity fund.
Fidelity® VIP Investment Grade Central Fund
Investment Summary (Unaudited)
Quality Diversification (% of fund's net assets)
| As of December 31, 2020 |
| | U.S. Government and U.S. Government Agency Obligations | 46.1% |
| | AAA | 4.9% |
| | AA | 1.7% |
| | A | 10.4% |
| | BBB | 23.6% |
| | BB and Below | 6.4% |
| | Not Rated | 2.0% |
| | Short-Term Investments and Net Other Assets | 4.9% |

We have used ratings from Moody's Investors Service, Inc. Where Moody's® ratings are not available, we have used S&P® ratings. All ratings are as of the date indicated and do not reflect subsequent changes. Securities rated BB or below were rated investment grade at the time of acquisition.
Asset Allocation (% of fund's net assets)
| As of December 31, 2020* |
| | Corporate Bonds | 38.9% |
| | U.S. Government and U.S. Government Agency Obligations | 46.1% |
| | Asset-Backed Securities | 5.1% |
| | CMOs and Other Mortgage Related Securities | 2.8% |
| | Municipal Bonds | 1.0% |
| | Other Investments | 1.2% |
| | Short-Term Investments and Net Other Assets (Liabilities) | 4.9% |

* Foreign investments - 11.9%
Percentages in the above tables are adjusted for the effect of TBA Sale Commitments.
Fidelity® VIP Investment Grade Central Fund
Schedule of Investments December 31, 2020
Showing Percentage of Net Assets
| Nonconvertible Bonds - 38.9% | | | |
| | | Principal Amount | Value |
| COMMUNICATION SERVICES - 3.5% | | | |
| Diversified Telecommunication Services - 1.1% | | | |
| AT&T, Inc.: | | | |
| 2.55% 12/1/33 (a) | | $14,944,000 | $15,366,621 |
| 3.8% 12/1/57 (a) | | 15,250,000 | 15,838,685 |
| 4.3% 2/15/30 | | 2,799,000 | 3,343,461 |
| 4.45% 4/1/24 | | 480,000 | 535,982 |
| 4.75% 5/15/46 | | 15,700,000 | 19,442,475 |
| Verizon Communications, Inc.: | | | |
| 2.987% 10/30/56 (a) | | 13,203,000 | 13,262,342 |
| 3% 3/22/27 | | 1,295,000 | 1,433,958 |
| 4.862% 8/21/46 | | 7,441,000 | 10,040,140 |
| 5.012% 4/15/49 | | 289,000 | 400,212 |
| | | | 79,663,876 |
| Entertainment - 0.5% | | | |
| The Walt Disney Co.: | | | |
| 3.8% 3/22/30 | | 23,020,000 | 27,421,242 |
| 4.7% 3/23/50 | | 7,268,000 | 10,247,885 |
| | | | 37,669,127 |
| Media - 1.6% | | | |
| Charter Communications Operating LLC/Charter Communications Operating Capital Corp.: | | | |
| 4.464% 7/23/22 | | 5,742,000 | 6,053,298 |
| 4.908% 7/23/25 | | 3,860,000 | 4,484,746 |
| 5.375% 5/1/47 | | 18,172,000 | 22,647,034 |
| 6.484% 10/23/45 | | 2,744,000 | 3,888,206 |
| Comcast Corp.: | | | |
| 3.9% 3/1/38 | | 1,072,000 | 1,310,159 |
| 4.65% 7/15/42 | | 2,539,000 | 3,435,224 |
| Discovery Communications LLC: | | | |
| 3.625% 5/15/30 | | 3,476,000 | 3,979,698 |
| 4.65% 5/15/50 | | 9,399,000 | 11,736,001 |
| Fox Corp.: | | | |
| 3.666% 1/25/22 | | 721,000 | 746,173 |
| 4.03% 1/25/24 | | 1,268,000 | 1,396,313 |
| 4.709% 1/25/29 | | 1,835,000 | 2,225,415 |
| 5.476% 1/25/39 | | 1,809,000 | 2,477,753 |
| 5.576% 1/25/49 | | 1,201,000 | 1,752,742 |
| Time Warner Cable LLC: | | | |
| 4% 9/1/21 | | 7,363,000 | 7,467,484 |
| 4.5% 9/15/42 | | 924,000 | 1,081,239 |
| 5.5% 9/1/41 | | 1,700,000 | 2,181,450 |
| 5.875% 11/15/40 | | 1,500,000 | 1,999,670 |
| 6.55% 5/1/37 | | 20,209,000 | 27,711,570 |
| 7.3% 7/1/38 | | 3,781,000 | 5,597,039 |
| | | | 112,171,214 |
| Wireless Telecommunication Services - 0.3% | | | |
| T-Mobile U.S.A., Inc.: | | | |
| 3.75% 4/15/27 (a) | | 6,100,000 | 6,946,680 |
| 3.875% 4/15/30 (a) | | 8,820,000 | 10,213,648 |
| 4.375% 4/15/40 (a) | | 1,316,000 | 1,606,007 |
| 4.5% 4/15/50 (a) | | 2,586,000 | 3,189,534 |
| | | | 21,955,869 |
|
| TOTAL COMMUNICATION SERVICES | | | 251,460,086 |
|
| CONSUMER DISCRETIONARY - 1.0% | | | |
| Automobiles - 0.5% | | | |
| General Motors Financial Co., Inc.: | | | |
| 4.2% 3/1/21 | | 5,411,000 | 5,424,306 |
| 4.25% 5/15/23 | | 2,080,000 | 2,241,630 |
| 4.375% 9/25/21 | | 15,702,000 | 16,125,874 |
| Volkswagen Group of America Finance LLC: | | | |
| 2.9% 5/13/22 (a) | | 5,728,000 | 5,908,835 |
| 3.125% 5/12/23 (a) | | 4,990,000 | 5,270,066 |
| | | | 34,970,711 |
| Diversified Consumer Services - 0.0% | | | |
| Ingersoll-Rand Global Holding Co. Ltd. 4.25% 6/15/23 | | 2,932,000 | 3,198,317 |
| Hotels, Restaurants & Leisure - 0.1% | | | |
| McDonald's Corp.: | | | |
| 3.5% 7/1/27 | | 1,685,000 | 1,932,149 |
| 3.6% 7/1/30 | | 2,005,000 | 2,348,706 |
| 4.2% 4/1/50 | | 1,015,000 | 1,302,565 |
| | | | 5,583,420 |
| Leisure Products - 0.1% | | | |
| Hasbro, Inc.: | | | |
| 2.6% 11/19/22 | | 1,931,000 | 2,005,243 |
| 3% 11/19/24 | | 4,395,000 | 4,758,083 |
| | | | 6,763,326 |
| Specialty Retail - 0.3% | | | |
| AutoNation, Inc. 4.75% 6/1/30 | | 764,000 | 918,882 |
| AutoZone, Inc.: | | | |
| 3.625% 4/15/25 | | 1,142,000 | 1,278,984 |
| 4% 4/15/30 | | 5,311,000 | 6,288,759 |
| Lowe's Companies, Inc. 4.5% 4/15/30 | | 3,815,000 | 4,746,373 |
| O'Reilly Automotive, Inc. 4.2% 4/1/30 | | 1,177,000 | 1,417,129 |
| TJX Companies, Inc. 3.75% 4/15/27 | | 4,337,000 | 5,013,617 |
| | | | 19,663,744 |
|
| TOTAL CONSUMER DISCRETIONARY | | | 70,179,518 |
|
| CONSUMER STAPLES - 3.0% | | | |
| Beverages - 1.8% | | | |
| Anheuser-Busch InBev Finance, Inc.: | | | |
| 4.7% 2/1/36 | | 9,265,000 | 11,642,542 |
| 4.9% 2/1/46 | | 11,511,000 | 14,769,340 |
| Anheuser-Busch InBev Worldwide, Inc.: | | | |
| 3.5% 6/1/30 | | 3,700,000 | 4,283,676 |
| 4.35% 6/1/40 | | 3,527,000 | 4,321,768 |
| 4.5% 6/1/50 | | 5,000,000 | 6,291,380 |
| 4.6% 6/1/60 | | 3,700,000 | 4,724,025 |
| 4.75% 4/15/58 | | 5,750,000 | 7,510,092 |
| 5.45% 1/23/39 | | 4,690,000 | 6,332,058 |
| 5.55% 1/23/49 | | 10,715,000 | 15,207,814 |
| 5.8% 1/23/59 (Reg. S) | | 11,321,000 | 17,394,766 |
| Molson Coors Beverage Co.: | | | |
| 3% 7/15/26 | | 7,500,000 | 8,174,355 |
| 5% 5/1/42 | | 13,093,000 | 16,363,423 |
| The Coca-Cola Co.: | | | |
| 3.375% 3/25/27 | | 5,679,000 | 6,510,919 |
| 3.45% 3/25/30 | | 3,470,000 | 4,087,968 |
| | | | 127,614,126 |
| Food & Staples Retailing - 0.0% | | | |
| Walgreens Boots Alliance, Inc. 3.3% 11/18/21 | | 2,918,000 | 2,978,659 |
| Food Products - 0.0% | | | |
| General Mills, Inc. 2.875% 4/15/30 | | 718,000 | 795,688 |
| Tobacco - 1.2% | | | |
| Altria Group, Inc.: | | | |
| 3.875% 9/16/46 | | 4,590,000 | 4,840,678 |
| 4% 1/31/24 | | 2,227,000 | 2,445,577 |
| 4.25% 8/9/42 | | 5,531,000 | 6,172,513 |
| 4.5% 5/2/43 | | 3,707,000 | 4,241,187 |
| 4.8% 2/14/29 | | 5,504,000 | 6,599,931 |
| 5.375% 1/31/44 | | 6,678,000 | 8,523,169 |
| 5.95% 2/14/49 | | 3,700,000 | 5,175,635 |
| Imperial Tobacco Finance PLC: | | | |
| 3.75% 7/21/22 (a) | | 4,804,000 | 5,008,435 |
| 4.25% 7/21/25 (a) | | 15,488,000 | 17,439,559 |
| Reynolds American, Inc.: | | | |
| 4.45% 6/12/25 | | 2,341,000 | 2,665,889 |
| 5.7% 8/15/35 | | 1,215,000 | 1,534,531 |
| 5.85% 8/15/45 | | 9,320,000 | 11,901,474 |
| 6.15% 9/15/43 | | 4,000,000 | 5,168,556 |
| 7.25% 6/15/37 | | 2,962,000 | 4,112,476 |
| | | | 85,829,610 |
|
| TOTAL CONSUMER STAPLES | | | 217,218,083 |
|
| ENERGY - 5.1% | | | |
| Energy Equipment & Services - 0.0% | | | |
| Halliburton Co.: | | | |
| 3.8% 11/15/25 | | 151,000 | 169,315 |
| 4.85% 11/15/35 | | 2,154,000 | 2,511,990 |
| | | | 2,681,305 |
| Oil, Gas & Consumable Fuels - 5.1% | | | |
| Canadian Natural Resources Ltd.: | | | |
| 3.8% 4/15/24 | | 6,783,000 | 7,386,284 |
| 5.85% 2/1/35 | | 2,497,000 | 3,141,433 |
| Cenovus Energy, Inc. 4.25% 4/15/27 | | 6,400,000 | 6,986,460 |
| Columbia Pipeline Group, Inc. 4.5% 6/1/25 | | 1,336,000 | 1,536,163 |
| DCP Midstream Operating LP: | | | |
| 3.875% 3/15/23 | | 1,771,000 | 1,824,130 |
| 4.75% 9/30/21 (a) | | 3,739,000 | 3,795,085 |
| 5.6% 4/1/44 | | 1,227,000 | 1,265,307 |
| 6.45% 11/3/36 (a) | | 2,477,000 | 2,650,390 |
| Empresa Nacional de Petroleo 4.375% 10/30/24 (a) | | 3,540,000 | 3,897,319 |
| Enable Midstream Partners LP 3.9% 5/15/24 (b) | | 1,322,000 | 1,351,614 |
| Enbridge Energy Partners LP 4.2% 9/15/21 | | 4,399,000 | 4,472,899 |
| Enbridge, Inc.: | | | |
| 4% 10/1/23 | | 2,813,000 | 3,059,553 |
| 4.25% 12/1/26 | | 1,773,000 | 2,073,690 |
| Energy Transfer Partners LP: | | | |
| 3.75% 5/15/30 | | 2,315,000 | 2,495,792 |
| 4.2% 9/15/23 | | 1,186,000 | 1,278,218 |
| 4.25% 3/15/23 | | 1,017,000 | 1,080,654 |
| 4.5% 4/15/24 | | 1,262,000 | 1,380,027 |
| 4.95% 6/15/28 | | 4,048,000 | 4,663,875 |
| 5% 5/15/50 | | 5,176,000 | 5,596,471 |
| 5.25% 4/15/29 | | 2,052,000 | 2,394,765 |
| 5.8% 6/15/38 | | 2,257,000 | 2,590,023 |
| 6% 6/15/48 | | 1,470,000 | 1,747,110 |
| 6.25% 4/15/49 | | 1,409,000 | 1,701,879 |
| Enterprise Products Operating LP 3.7% 2/15/26 | | 4,800,000 | 5,435,825 |
| Exxon Mobil Corp. 3.482% 3/19/30 | | 13,440,000 | 15,640,803 |
| Hess Corp.: | | | |
| 4.3% 4/1/27 | | 870,000 | 958,812 |
| 7.125% 3/15/33 | | 1,003,000 | 1,309,096 |
| 7.3% 8/15/31 | | 1,341,000 | 1,753,596 |
| 7.875% 10/1/29 | | 4,387,000 | 5,764,373 |
| Kinder Morgan Energy Partners LP: | | | |
| 3.45% 2/15/23 | | 1,700,000 | 1,791,098 |
| 5% 10/1/21 | | 1,517,000 | 1,549,764 |
| 6.55% 9/15/40 | | 460,000 | 600,357 |
| Kinder Morgan, Inc. 5.55% 6/1/45 | | 2,436,000 | 3,126,153 |
| Marathon Petroleum Corp. 5.125% 3/1/21 | | 2,187,000 | 2,202,468 |
| MPLX LP: | | | |
| 3 month U.S. LIBOR + 1.100% 1.3304% 9/9/22 (b)(c) | | 2,383,000 | 2,383,404 |
| 4.5% 7/15/23 | | 1,975,000 | 2,151,005 |
| 4.8% 2/15/29 | | 1,126,000 | 1,360,181 |
| 4.875% 12/1/24 | | 2,736,000 | 3,139,283 |
| 5.5% 2/15/49 | | 3,377,000 | 4,439,997 |
| Occidental Petroleum Corp.: | | | |
| 2.9% 8/15/24 | | 4,509,000 | 4,339,913 |
| 3.2% 8/15/26 | | 607,000 | 567,545 |
| 3.5% 8/15/29 | | 1,909,000 | 1,747,060 |
| 4.3% 8/15/39 | | 278,000 | 233,840 |
| 4.4% 8/15/49 | | 279,000 | 235,141 |
| 5.55% 3/15/26 | | 5,174,000 | 5,401,346 |
| 6.2% 3/15/40 | | 1,700,000 | 1,687,250 |
| 6.45% 9/15/36 | | 4,602,000 | 4,818,294 |
| 6.6% 3/15/46 | | 5,708,000 | 5,793,620 |
| 7.5% 5/1/31 | | 7,680,000 | 8,563,200 |
| Petrobras Global Finance BV: | | | |
| 5.093% 1/15/30 | | 3,804,000 | 4,241,460 |
| 7.25% 3/17/44 | | 24,245,000 | 31,268,473 |
| Petroleos Mexicanos: | | | |
| 4.5% 1/23/26 | | 5,320,000 | 5,317,340 |
| 5.95% 1/28/31 | | 1,521,000 | 1,517,198 |
| 6.35% 2/12/48 | | 13,200,000 | 11,859,375 |
| 6.49% 1/23/27 | | 3,830,000 | 4,040,650 |
| 6.5% 3/13/27 | | 4,830,000 | 5,103,813 |
| 6.5% 1/23/29 | | 5,560,000 | 5,737,225 |
| 6.75% 9/21/47 | | 12,105,000 | 11,348,438 |
| 6.84% 1/23/30 | | 20,585,000 | 21,428,985 |
| 6.95% 1/28/60 | | 7,879,000 | 7,395,623 |
| 7.69% 1/23/50 | | 16,210,000 | 16,343,733 |
| Phillips 66 Co.: | | | |
| 3.7% 4/6/23 | | 476,000 | 509,757 |
| 3.85% 4/9/25 | | 614,000 | 691,554 |
| Plains All American Pipeline LP/PAA Finance Corp.: | | | |
| 3.55% 12/15/29 | | 1,322,000 | 1,382,790 |
| 3.6% 11/1/24 | | 1,389,000 | 1,480,110 |
| 3.65% 6/1/22 | | 2,155,000 | 2,218,899 |
| Regency Energy Partners LP/Regency Energy Finance Corp. 5.875% 3/1/22 | | 2,030,000 | 2,122,380 |
| Sabine Pass Liquefaction LLC 4.5% 5/15/30 (a) | | 7,977,000 | 9,450,263 |
| Southwestern Energy Co. 6.45% 1/23/25 (b) | | 2,509,000 | 2,609,360 |
| Sunoco Logistics Partner Operations LP 5.4% 10/1/47 | | 1,349,000 | 1,519,428 |
| The Williams Companies, Inc.: | | | |
| 3.5% 11/15/30 | | 8,506,000 | 9,628,511 |
| 3.7% 1/15/23 | | 1,208,000 | 1,279,605 |
| 3.9% 1/15/25 | | 1,216,000 | 1,348,010 |
| 4% 11/15/21 | | 2,221,000 | 2,268,767 |
| 4.3% 3/4/24 | | 5,449,000 | 6,010,234 |
| 4.5% 11/15/23 | | 1,751,000 | 1,930,324 |
| 4.55% 6/24/24 | | 13,337,000 | 14,926,660 |
| Transcontinental Gas Pipe Line Co. LLC: | | | |
| 3.25% 5/15/30 | | 1,017,000 | 1,139,031 |
| 3.95% 5/15/50 | | 3,282,000 | 3,705,743 |
| Valero Energy Corp.: | | | |
| 2.7% 4/15/23 | | 1,663,000 | 1,735,425 |
| 2.85% 4/15/25 | | 957,000 | 1,019,050 |
| Western Gas Partners LP: | | | |
| 3.95% 6/1/25 | | 868,000 | 885,360 |
| 4.5% 3/1/28 | | 2,000,000 | 2,073,000 |
| 4.65% 7/1/26 | | 9,056,000 | 9,503,276 |
| 4.75% 8/15/28 | | 1,155,000 | 1,201,200 |
| | | | 361,603,615 |
|
| TOTAL ENERGY | | | 364,284,920 |
|
| FINANCIALS - 18.2% | | | |
| Banks - 7.3% | | | |
| Bank of America Corp.: | | | |
| 3.004% 12/20/23 (b) | | 30,548,000 | 32,167,089 |
| 3.3% 1/11/23 | | 4,342,000 | 4,603,191 |
| 3.419% 12/20/28 (b) | | 18,965,000 | 21,442,852 |
| 3.5% 4/19/26 | | 5,024,000 | 5,692,504 |
| 3.864% 7/23/24 (b) | | 4,370,000 | 4,737,651 |
| 3.95% 4/21/25 | | 4,125,000 | 4,649,859 |
| 4.2% 8/26/24 | | 19,977,000 | 22,410,036 |
| 4.25% 10/22/26 | | 4,261,000 | 4,996,957 |
| 4.45% 3/3/26 | | 1,517,000 | 1,767,887 |
| Barclays PLC: | | | |
| 2.852% 5/7/26 (b) | | 8,092,000 | 8,688,609 |
| 3.25% 1/12/21 | | 4,610,000 | 4,612,488 |
| 4.375% 1/12/26 | | 6,221,000 | 7,168,716 |
| 5.088% 6/20/30 (b) | | 7,347,000 | 8,809,214 |
| 5.2% 5/12/26 | | 6,222,000 | 7,234,444 |
| BNP Paribas SA 2.219% 6/9/26 (a)(b) | | 7,541,000 | 7,891,043 |
| CIT Group, Inc. 3.929% 6/19/24 (b) | | 1,670,000 | 1,766,025 |
| Citigroup, Inc.: | | | |
| 2.7% 10/27/22 | | 9,998,000 | 10,397,750 |
| 3.352% 4/24/25 (b) | | 4,959,000 | 5,390,486 |
| 3.875% 3/26/25 | | 9,500,000 | 10,602,927 |
| 4.05% 7/30/22 | | 1,800,000 | 1,903,369 |
| 4.3% 11/20/26 | | 1,733,000 | 2,020,584 |
| 4.412% 3/31/31 (b) | | 10,622,000 | 12,871,351 |
| 4.45% 9/29/27 | | 17,100,000 | 20,160,958 |
| 4.6% 3/9/26 | | 2,195,000 | 2,572,662 |
| 5.5% 9/13/25 | | 5,524,000 | 6,638,614 |
| Citizens Financial Group, Inc. 2.638% 9/30/32 (a) | | 4,857,000 | 5,134,895 |
| Commonwealth Bank of Australia 3.61% 9/12/34 (a)(b) | | 2,615,000 | 2,871,433 |
| Credit Suisse Group Funding Guernsey Ltd. 3.8% 9/15/22 | | 7,240,000 | 7,646,556 |
| Discover Bank 4.2% 8/8/23 | | 2,849,000 | 3,114,604 |
| Fifth Third Bancorp 8.25% 3/1/38 | | 4,319,000 | 7,304,432 |
| HSBC Holdings PLC: | | | |
| 4.25% 3/14/24 | | 2,200,000 | 2,427,447 |
| 4.95% 3/31/30 | | 1,425,000 | 1,782,862 |
| Intesa Sanpaolo SpA: | | | |
| 5.017% 6/26/24 (a) | | 4,337,000 | 4,745,016 |
| 5.71% 1/15/26 (a) | | 9,864,000 | 11,287,417 |
| JPMorgan Chase & Co.: | | | |
| 2.956% 5/13/31 (b) | | 4,318,000 | 4,733,545 |
| 3.797% 7/23/24 (b) | | 5,719,000 | 6,206,949 |
| 3.875% 9/10/24 | | 43,751,000 | 48,981,134 |
| 4.125% 12/15/26 | | 14,080,000 | 16,465,277 |
| 4.493% 3/24/31 (b) | | 12,800,000 | 15,737,505 |
| NatWest Markets PLC 2.375% 5/21/23 (a) | | 8,695,000 | 9,044,611 |
| Rabobank Nederland 4.375% 8/4/25 | | 7,451,000 | 8,501,923 |
| Royal Bank of Scotland Group PLC: | | | |
| 3.073% 5/22/28 (b) | | 4,651,000 | 5,046,020 |
| 5.125% 5/28/24 | | 20,522,000 | 23,185,595 |
| 6% 12/19/23 | | 10,433,000 | 11,921,871 |
| 6.1% 6/10/23 | | 13,369,000 | 14,984,373 |
| 6.125% 12/15/22 | | 8,239,000 | 9,060,717 |
| Societe Generale 1.488% 12/14/26 (a)(b) | | 9,735,000 | 9,812,325 |
| Synchrony Bank 3% 6/15/22 | | 4,542,000 | 4,689,953 |
| UniCredit SpA 6.572% 1/14/22 (a) | | 5,565,000 | 5,864,372 |
| Wells Fargo & Co.: | | | |
| 2.406% 10/30/25 (b) | | 4,563,000 | 4,823,928 |
| 4.478% 4/4/31 (b) | | 14,300,000 | 17,473,456 |
| 5.013% 4/4/51 (b) | | 21,093,000 | 29,961,527 |
| Westpac Banking Corp. 4.11% 7/24/34 (b) | | 3,712,000 | 4,244,721 |
| | | | 518,251,730 |
| Capital Markets - 5.1% | | | |
| Affiliated Managers Group, Inc.: | | | |
| 3.5% 8/1/25 | | 5,541,000 | 6,158,340 |
| 4.25% 2/15/24 | | 4,287,000 | 4,726,472 |
| Ares Capital Corp.: | | | |
| 3.875% 1/15/26 | | 12,461,000 | 13,499,582 |
| 4.2% 6/10/24 | | 8,906,000 | 9,612,008 |
| Credit Suisse Group AG: | | | |
| 2.593% 9/11/25 (a)(b) | | 10,580,000 | 11,131,163 |
| 3.75% 3/26/25 | | 4,660,000 | 5,172,593 |
| 3.8% 6/9/23 | | 8,582,000 | 9,242,158 |
| 3.869% 1/12/29 (a)(b) | | 4,020,000 | 4,551,174 |
| 4.194% 4/1/31 (a)(b) | | 9,619,000 | 11,308,240 |
| 4.55% 4/17/26 | | 2,575,000 | 3,028,789 |
| Deutsche Bank AG 4.5% 4/1/25 | | 11,961,000 | 12,975,586 |
| Deutsche Bank AG New York Branch: | | | |
| 3.15% 1/22/21 | | 6,514,000 | 6,521,225 |
| 3.3% 11/16/22 | | 9,310,000 | 9,708,473 |
| 5% 2/14/22 | | 9,082,000 | 9,495,279 |
| Goldman Sachs Group, Inc.: | | | |
| 2.876% 10/31/22 (b) | | 22,903,000 | 23,367,418 |
| 3.2% 2/23/23 | | 7,150,000 | 7,554,422 |
| 3.691% 6/5/28 (b) | | 41,645,000 | 48,004,102 |
| 3.8% 3/15/30 | | 15,490,000 | 18,217,067 |
| 4.25% 10/21/25 | | 2,269,000 | 2,601,837 |
| 6.75% 10/1/37 | | 2,246,000 | 3,432,959 |
| Moody's Corp.: | | | |
| 3.25% 1/15/28 | | 2,386,000 | 2,683,915 |
| 3.75% 3/24/25 | | 5,075,000 | 5,698,115 |
| 4.875% 2/15/24 | | 2,240,000 | 2,521,981 |
| Morgan Stanley: | | | |
| 3.125% 1/23/23 | | 26,000,000 | 27,438,158 |
| 3.125% 7/27/26 | | 21,964,000 | 24,595,546 |
| 3.622% 4/1/31 (b) | | 10,036,000 | 11,654,366 |
| 3.625% 1/20/27 | | 11,000,000 | 12,621,072 |
| 3.737% 4/24/24 (b) | | 5,000,000 | 5,379,621 |
| 4.431% 1/23/30 (b) | | 4,395,000 | 5,355,596 |
| 4.875% 11/1/22 | | 7,751,000 | 8,350,149 |
| 5% 11/24/25 | | 14,636,000 | 17,500,947 |
| 5.75% 1/25/21 | | 3,512,000 | 3,522,480 |
| Peachtree Corners Funding Trust 3.976% 2/15/25 (a) | | 5,000,000 | 5,543,072 |
| State Street Corp. 2.825% 3/30/23 (b) | | 681,000 | 702,818 |
| UBS Group AG 4.125% 9/24/25 (a) | | 5,261,000 | 6,022,888 |
| | | | 359,899,611 |
| Consumer Finance - 2.5% | | | |
| AerCap Ireland Capital Ltd./AerCap Global Aviation Trust: | | | |
| 2.875% 8/14/24 | | 5,996,000 | 6,234,057 |
| 3.5% 5/26/22 | | 348,000 | 359,997 |
| 3.5% 1/15/25 | | 8,300,000 | 8,811,172 |
| 4.125% 7/3/23 | | 4,192,000 | 4,489,400 |
| 4.45% 4/3/26 | | 3,126,000 | 3,509,244 |
| 4.875% 1/16/24 | | 5,015,000 | 5,473,283 |
| 6.5% 7/15/25 | | 3,625,000 | 4,332,680 |
| Ally Financial, Inc.: | | | |
| 1.45% 10/2/23 | | 2,209,000 | 2,254,833 |
| 3.05% 6/5/23 | | 9,631,000 | 10,154,320 |
| 5.125% 9/30/24 | | 2,138,000 | 2,464,352 |
| 5.8% 5/1/25 | | 5,237,000 | 6,217,529 |
| 8% 11/1/31 | | 2,703,000 | 3,965,548 |
| Capital One Financial Corp.: | | | |
| 2.6% 5/11/23 | | 7,472,000 | 7,832,537 |
| 3.65% 5/11/27 | | 13,479,000 | 15,431,638 |
| 3.8% 1/31/28 | | 6,237,000 | 7,207,294 |
| Discover Financial Services: | | | |
| 3.85% 11/21/22 | | 5,040,000 | 5,359,954 |
| 3.95% 11/6/24 | | 2,847,000 | 3,160,927 |
| 4.1% 2/9/27 | | 3,673,000 | 4,230,109 |
| 4.5% 1/30/26 | | 4,686,000 | 5,412,712 |
| Ford Motor Credit Co. LLC: | | | |
| 4.063% 11/1/24 | | 17,607,000 | 18,497,386 |
| 5.085% 1/7/21 | | 2,973,000 | 2,973,000 |
| 5.584% 3/18/24 | | 6,246,000 | 6,737,248 |
| 5.596% 1/7/22 | | 6,152,000 | 6,359,199 |
| Synchrony Financial: | | | |
| 2.85% 7/25/22 | | 1,524,000 | 1,573,710 |
| 3.75% 8/15/21 | | 2,203,000 | 2,234,522 |
| 3.95% 12/1/27 | | 7,681,000 | 8,611,864 |
| 4.25% 8/15/24 | | 2,218,000 | 2,450,332 |
| 4.375% 3/19/24 | | 5,468,000 | 6,019,883 |
| 5.15% 3/19/29 | | 8,400,000 | 10,123,272 |
| Toyota Motor Credit Corp. 2.9% 3/30/23 | | 7,749,000 | 8,197,161 |
| | | | 180,679,163 |
| Diversified Financial Services - 0.7% | | | |
| Brixmor Operating Partnership LP: | | | |
| 3.25% 9/15/23 | | 5,952,000 | 6,300,656 |
| 4.05% 7/1/30 | | 5,065,000 | 5,810,451 |
| 4.125% 6/15/26 | | 4,647,000 | 5,264,169 |
| 4.125% 5/15/29 | | 5,051,000 | 5,807,534 |
| Equitable Holdings, Inc.: | | | |
| 3.9% 4/20/23 | | 1,041,000 | 1,119,932 |
| 4.35% 4/20/28 | | 4,250,000 | 5,022,611 |
| Park Aerospace Holdings Ltd. 5.5% 2/15/24 (a) | | 6,100,000 | 6,652,875 |
| Pine Street Trust I 4.572% 2/15/29 (a) | | 5,707,000 | 6,762,753 |
| Pine Street Trust II 5.568% 2/15/49 (a) | | 5,700,000 | 7,400,272 |
| Voya Financial, Inc. 3.125% 7/15/24 | | 2,851,000 | 3,080,656 |
| | | | 53,221,909 |
| Insurance - 2.6% | | | |
| AIA Group Ltd.: | | | |
| 3.2% 9/16/40 (a) | | 3,487,000 | 3,655,701 |
| 3.375% 4/7/30 (a) | | 7,358,000 | 8,243,213 |
| American International Group, Inc.: | | | |
| 2.5% 6/30/25 | | 11,900,000 | 12,789,876 |
| 3.3% 3/1/21 | | 2,355,000 | 2,359,958 |
| 3.4% 6/30/30 | | 11,900,000 | 13,626,713 |
| 3.75% 7/10/25 | | 8,311,000 | 9,335,575 |
| 4.875% 6/1/22 | | 3,597,000 | 3,816,173 |
| Five Corners Funding Trust II 2.85% 5/15/30 (a) | | 9,549,000 | 10,557,527 |
| Liberty Mutual Group, Inc. 4.569% 2/1/29 (a) | | 4,093,000 | 5,026,902 |
| Marsh & McLennan Companies, Inc.: | | | |
| 4.375% 3/15/29 | | 3,978,000 | 4,841,101 |
| 4.75% 3/15/39 | | 1,825,000 | 2,453,327 |
| 4.8% 7/15/21 | | 2,278,000 | 2,309,362 |
| Massachusetts Mutual Life Insurance Co. 3.729% 10/15/70 (a) | | 5,810,000 | 6,399,773 |
| MetLife, Inc. 4.55% 3/23/30 | | 11,500,000 | 14,356,773 |
| Metropolitan Life Global Funding I: | | | |
| U.S. SECURED OVERNIGHT FINL RATE (SOFR) INDX + 0.500% 0.5836% 5/28/21 (a)(b)(c) | | 27,560,000 | 27,606,006 |
| 3% 1/10/23 (a) | | 2,636,000 | 2,778,797 |
| Pacific LifeCorp 5.125% 1/30/43 (a) | | 5,252,000 | 6,550,641 |
| Swiss Re Finance Luxembourg SA 5% 4/2/49 (a)(b) | | 2,200,000 | 2,560,835 |
| Teachers Insurance & Annuity Association of America 4.9% 9/15/44 (a) | | 5,347,000 | 7,227,897 |
| TIAA Asset Management Finance LLC 4.125% 11/1/24 (a) | | 1,771,000 | 1,995,644 |
| Unum Group: | | | |
| 3.875% 11/5/25 | | 4,860,000 | 5,383,944 |
| 4% 3/15/24 | | 5,930,000 | 6,461,978 |
| 4% 6/15/29 | | 4,410,000 | 4,957,780 |
| 4.5% 3/15/25 | | 6,953,000 | 7,873,855 |
| 5.75% 8/15/42 | | 7,278,000 | 8,827,173 |
| | | | 181,996,524 |
|
| TOTAL FINANCIALS | | | 1,294,048,937 |
|
| HEALTH CARE - 1.7% | | | |
| Biotechnology - 0.1% | | | |
| AbbVie, Inc. 3.45% 3/15/22 | | 6,868,000 | 7,083,098 |
| Health Care Providers & Services - 0.9% | | | |
| Centene Corp.: | | | |
| 3.375% 2/15/30 | | 5,100,000 | 5,365,659 |
| 4.25% 12/15/27 | | 5,745,000 | 6,089,700 |
| 4.625% 12/15/29 | | 8,925,000 | 9,908,624 |
| 4.75% 1/15/25 | | 4,565,000 | 4,684,740 |
| Cigna Corp.: | | | |
| 3.05% 10/15/27 | | 3,200,000 | 3,583,505 |
| 4.375% 10/15/28 | | 6,064,000 | 7,326,279 |
| 4.8% 8/15/38 | | 3,776,000 | 4,913,570 |
| 4.9% 12/15/48 | | 3,772,000 | 5,178,455 |
| CVS Health Corp.: | | | |
| 3% 8/15/26 | | 625,000 | 692,130 |
| 3.625% 4/1/27 | | 1,795,000 | 2,041,883 |
| 3.7% 3/9/23 | | 340,000 | 363,960 |
| 4.78% 3/25/38 | | 5,967,000 | 7,529,573 |
| HCA Holdings, Inc. 4.75% 5/1/23 | | 215,000 | 234,459 |
| Toledo Hospital: | | | |
| 5.325% 11/15/28 | | 2,109,000 | 2,485,346 |
| 6.015% 11/15/48 | | 4,201,000 | 5,259,831 |
| | | | 65,657,714 |
| Pharmaceuticals - 0.7% | | | |
| Bayer U.S. Finance II LLC 4.25% 12/15/25 (a) | | 4,363,000 | 4,986,207 |
| Elanco Animal Health, Inc.: | | | |
| 4.912% 8/27/21 (b) | | 1,003,000 | 1,025,568 |
| 5.272% 8/28/23 (b) | | 3,166,000 | 3,458,855 |
| 5.9% 8/28/28 (b) | | 1,334,000 | 1,574,120 |
| Mylan NV 4.55% 4/15/28 | | 4,000,000 | 4,753,268 |
| Shire Acquisitions Investments Ireland DAC 2.4% 9/23/21 | | 2,659,000 | 2,693,659 |
| Teva Pharmaceutical Finance Netherlands III BV: | | | |
| 2.2% 7/21/21 | | 939,000 | 936,653 |
| 2.8% 7/21/23 | | 1,463,000 | 1,448,516 |
| Utah Acquisition Sub, Inc.: | | | |
| 3.15% 6/15/21 | | 5,002,000 | 5,050,336 |
| 3.95% 6/15/26 | | 2,549,000 | 2,915,720 |
| Viatris, Inc.: | | | |
| 1.125% 6/22/22 (a) | | 3,058,000 | 3,086,810 |
| 1.65% 6/22/25 (a) | | 983,000 | 1,015,823 |
| 2.7% 6/22/30 (a) | | 4,997,000 | 5,299,560 |
| 3.85% 6/22/40 (a) | | 2,177,000 | 2,453,822 |
| 4% 6/22/50 (a) | | 3,759,000 | 4,299,132 |
| Zoetis, Inc. 3.25% 2/1/23 | | 1,649,000 | 1,734,480 |
| | | | 46,732,529 |
|
| TOTAL HEALTH CARE | | | 119,473,341 |
|
| INDUSTRIALS - 1.0% | | | |
| Aerospace & Defense - 0.3% | | | |
| BAE Systems PLC 3.4% 4/15/30 (a) | | 2,268,000 | 2,568,016 |
| The Boeing Co.: | | | |
| 5.04% 5/1/27 | | 2,962,000 | 3,461,495 |
| 5.15% 5/1/30 | | 2,962,000 | 3,584,523 |
| 5.705% 5/1/40 | | 3,000,000 | 3,879,337 |
| 5.805% 5/1/50 | | 3,000,000 | 4,137,757 |
| 5.93% 5/1/60 | | 2,960,000 | 4,191,478 |
| | | | 21,822,606 |
| Professional Services - 0.0% | | | |
| Thomson Reuters Corp. 3.85% 9/29/24 | | 1,034,000 | 1,135,293 |
| Trading Companies & Distributors - 0.5% | | | |
| Air Lease Corp.: | | | |
| 2.25% 1/15/23 | | 1,326,000 | 1,361,375 |
| 3% 9/15/23 | | 877,000 | 921,973 |
| 3.375% 6/1/21 | | 2,523,000 | 2,549,896 |
| 3.375% 7/1/25 | | 6,445,000 | 6,929,567 |
| 3.75% 2/1/22 | | 4,522,000 | 4,642,697 |
| 3.875% 4/1/21 | | 3,180,000 | 3,195,964 |
| 3.875% 7/3/23 | | 5,581,000 | 5,958,883 |
| 4.25% 2/1/24 | | 5,740,000 | 6,228,433 |
| 4.25% 9/15/24 | | 3,565,000 | 3,905,108 |
| | | | 35,693,896 |
| Transportation Infrastructure - 0.2% | | | |
| Avolon Holdings Funding Ltd.: | | | |
| 3.95% 7/1/24 (a) | | 2,088,000 | 2,204,954 |
| 4.25% 4/15/26 (a) | | 1,580,000 | 1,701,859 |
| 4.375% 5/1/26 (a) | | 2,546,000 | 2,757,338 |
| 5.25% 5/15/24 (a) | | 3,813,000 | 4,146,516 |
| | | | 10,810,667 |
|
| TOTAL INDUSTRIALS | | | 69,462,462 |
|
| INFORMATION TECHNOLOGY - 0.5% | | | |
| Electronic Equipment & Components - 0.2% | | | |
| Diamond 1 Finance Corp./Diamond 2 Finance Corp.: | | | |
| 5.45% 6/15/23 (a) | | 4,500,000 | 4,976,805 |
| 5.85% 7/15/25 (a) | | 1,294,000 | 1,554,125 |
| 6.02% 6/15/26 (a) | | 1,564,000 | 1,909,212 |
| 6.1% 7/15/27 (a) | | 2,376,000 | 2,952,260 |
| 6.2% 7/15/30 (a) | | 2,056,000 | 2,671,342 |
| | | | 14,063,744 |
| Semiconductors & Semiconductor Equipment - 0.1% | | | |
| Micron Technology, Inc. 2.497% 4/24/23 | | 7,020,000 | 7,314,528 |
| Software - 0.2% | | | |
| Oracle Corp.: | | | |
| 2.8% 4/1/27 | | 5,858,000 | 6,458,135 |
| 3.6% 4/1/40 | | 5,860,000 | 6,857,051 |
| | | | 13,315,186 |
|
| TOTAL INFORMATION TECHNOLOGY | | | 34,693,458 |
|
| MATERIALS - 0.0% | | | |
| Metals & Mining - 0.0% | | | |
| Corporacion Nacional del Cobre de Chile (Codelco): | | | |
| 3.625% 8/1/27 (a) | | 1,696,000 | 1,893,690 |
| 4.5% 8/1/47 (a) | | 1,720,000 | 2,107,538 |
| | | | 4,001,228 |
| REAL ESTATE - 3.2% | | | |
| Equity Real Estate Investment Trusts (REITs) - 2.6% | | | |
| Alexandria Real Estate Equities, Inc. 4.9% 12/15/30 | | 4,167,000 | 5,300,000 |
| Boston Properties, Inc.: | | | |
| 3.25% 1/30/31 | | 3,880,000 | 4,275,358 |
| 3.85% 2/1/23 | | 4,708,000 | 5,008,456 |
| 4.5% 12/1/28 | | 3,891,000 | 4,651,755 |
| Corporate Office Properties LP: | | | |
| 2.25% 3/15/26 | | 1,664,000 | 1,734,289 |
| 5% 7/1/25 | | 3,156,000 | 3,599,596 |
| Duke Realty LP: | | | |
| 3.625% 4/15/23 | | 2,123,000 | 2,250,579 |
| 3.75% 12/1/24 | | 1,576,000 | 1,740,115 |
| Healthcare Trust of America Holdings LP: | | | |
| 3.1% 2/15/30 | | 1,312,000 | 1,432,399 |
| 3.5% 8/1/26 | | 1,366,000 | 1,546,553 |
| Healthpeak Properties, Inc.: | | | |
| 3.25% 7/15/26 | | 573,000 | 646,670 |
| 3.5% 7/15/29 | | 656,000 | 743,766 |
| Hudson Pacific Properties LP 4.65% 4/1/29 | | 7,741,000 | 9,038,438 |
| Lexington Corporate Properties Trust: | | | |
| 2.7% 9/15/30 | | 1,827,000 | 1,900,815 |
| 4.4% 6/15/24 | | 1,441,000 | 1,567,401 |
| Omega Healthcare Investors, Inc.: | | | |
| 3.375% 2/1/31 | | 3,348,000 | 3,516,889 |
| 3.625% 10/1/29 | | 5,913,000 | 6,276,281 |
| 4.375% 8/1/23 | | 6,023,000 | 6,513,343 |
| 4.5% 1/15/25 | | 2,677,000 | 2,930,236 |
| 4.5% 4/1/27 | | 16,195,000 | 18,219,641 |
| 4.75% 1/15/28 | | 6,382,000 | 7,270,167 |
| 4.95% 4/1/24 | | 1,354,000 | 1,473,816 |
| 5.25% 1/15/26 | | 5,686,000 | 6,498,851 |
| Realty Income Corp. 3.25% 1/15/31 | | 1,020,000 | 1,155,643 |
| Retail Opportunity Investments Partnership LP: | | | |
| 4% 12/15/24 | | 978,000 | 1,024,161 |
| 5% 12/15/23 | | 737,000 | 790,363 |
| Retail Properties America, Inc.: | | | |
| 4% 3/15/25 | | 6,232,000 | 6,380,294 |
| 4.75% 9/15/30 | | 9,714,000 | 10,308,334 |
| Simon Property Group LP 2.45% 9/13/29 | | 1,628,000 | 1,709,223 |
| SITE Centers Corp.: | | | |
| 3.625% 2/1/25 | | 2,262,000 | 2,349,141 |
| 4.25% 2/1/26 | | 2,954,000 | 3,188,786 |
| Store Capital Corp.: | | | |
| 2.75% 11/18/30 | | 8,724,000 | 8,867,159 |
| 4.625% 3/15/29 | | 1,793,000 | 2,079,074 |
| Ventas Realty LP: | | | |
| 3% 1/15/30 | | 7,629,000 | 8,204,476 |
| 3.125% 6/15/23 | | 1,289,000 | 1,361,850 |
| 3.5% 2/1/25 | | 6,443,000 | 7,094,381 |
| 4% 3/1/28 | | 2,243,000 | 2,557,761 |
| 4.125% 1/15/26 | | 1,557,000 | 1,790,648 |
| 4.375% 2/1/45 | | 763,000 | 850,413 |
| 4.75% 11/15/30 | | 10,016,000 | 12,220,448 |
| VEREIT Operating Partnership LP: | | | |
| 2.2% 6/15/28 | | 797,000 | 814,579 |
| 2.85% 12/15/32 | | 980,000 | 1,024,058 |
| 3.4% 1/15/28 | | 1,593,000 | 1,757,813 |
| Weingarten Realty Investors 3.375% 10/15/22 | | 812,000 | 837,644 |
| WP Carey, Inc.: | | | |
| 2.4% 2/1/31 | | 3,800,000 | 3,944,189 |
| 3.85% 7/15/29 | | 1,275,000 | 1,463,943 |
| 4% 2/1/25 | | 5,360,000 | 5,921,014 |
| | | | 185,830,809 |
| Real Estate Management & Development - 0.6% | | | |
| Brandywine Operating Partnership LP: | | | |
| 3.95% 2/15/23 | | 5,510,000 | 5,738,521 |
| 3.95% 11/15/27 | | 4,613,000 | 4,928,332 |
| 4.1% 10/1/24 | | 5,070,000 | 5,346,773 |
| 4.55% 10/1/29 | | 5,842,000 | 6,562,042 |
| Mack-Cali Realty LP: | | | |
| 3.15% 5/15/23 | | 4,988,000 | 4,926,045 |
| 4.5% 4/18/22 | | 1,218,000 | 1,212,142 |
| Post Apartment Homes LP 3.375% 12/1/22 | | 790,000 | 824,186 |
| Tanger Properties LP: | | | |
| 3.125% 9/1/26 | | 6,109,000 | 6,300,665 |
| 3.75% 12/1/24 | | 3,470,000 | 3,638,091 |
| 3.875% 12/1/23 | | 1,792,000 | 1,861,148 |
| | | | 41,337,945 |
|
| TOTAL REAL ESTATE | | | 227,168,754 |
|
| UTILITIES - 1.7% | | | |
| Electric Utilities - 0.8% | | | |
| Cleco Corporate Holdings LLC: | | | |
| 3.375% 9/15/29 | | 3,447,000 | 3,538,499 |
| 3.743% 5/1/26 | | 13,180,000 | 14,582,974 |
| Duke Energy Corp. 2.45% 6/1/30 | | 2,783,000 | 2,959,602 |
| Duquesne Light Holdings, Inc.: | | | |
| 2.532% 10/1/30 (a) | | 1,321,000 | 1,365,650 |
| 5.9% 12/1/21 (a) | | 2,664,000 | 2,777,873 |
| Entergy Corp. 2.8% 6/15/30 | | 2,856,000 | 3,082,751 |
| Eversource Energy 2.8% 5/1/23 | | 5,110,000 | 5,361,305 |
| Exelon Corp.: | | | |
| 4.05% 4/15/30 | | 1,740,000 | 2,057,858 |
| 4.7% 4/15/50 | | 775,000 | 1,028,784 |
| FirstEnergy Corp.: | | | |
| 4.25% 3/15/23 | | 11,729,000 | 12,384,951 |
| 7.375% 11/15/31 | | 5,363,000 | 7,643,315 |
| IPALCO Enterprises, Inc. 3.7% 9/1/24 | | 2,157,000 | 2,350,697 |
| | | | 59,134,259 |
| Gas Utilities - 0.1% | | | |
| Nakilat, Inc. 6.067% 12/31/33 (a) | | 1,808,000 | 2,307,460 |
| Southern Natural Gas Co./Southern Natural Issuing Corp. 4.4% 6/15/21 | | 1,182,000 | 1,190,805 |
| | | | 3,498,265 |
| Independent Power and Renewable Electricity Producers - 0.3% | | | |
| Emera U.S. Finance LP: | | | |
| 2.7% 6/15/21 | | 1,182,000 | 1,191,194 |
| 3.55% 6/15/26 | | 1,891,000 | 2,124,721 |
| The AES Corp.: | | | |
| 3.3% 7/15/25 (a) | | 8,591,000 | 9,364,190 |
| 3.95% 7/15/30 (a) | | 7,492,000 | 8,469,032 |
| | | | 21,149,137 |
| Multi-Utilities - 0.5% | | | |
| Berkshire Hathaway Energy Co. 4.05% 4/15/25 (a) | | 12,432,000 | 14,073,728 |
| Consolidated Edison Co. of New York, Inc. 3.35% 4/1/30 | | 790,000 | 904,807 |
| NiSource, Inc. 2.95% 9/1/29 | | 8,554,000 | 9,405,347 |
| Puget Energy, Inc.: | | | |
| 4.1% 6/15/30 | | 3,363,000 | 3,800,681 |
| 6% 9/1/21 | | 4,807,000 | 4,974,714 |
| WEC Energy Group, Inc. 3 month U.S. LIBOR + 2.110% 2.3335% 5/15/67 (b)(c) | | 1,426,000 | 1,222,765 |
| | | | 34,382,042 |
|
| TOTAL UTILITIES | | | 118,163,703 |
|
| TOTAL NONCONVERTIBLE BONDS | | | |
| (Cost $2,462,445,507) | | | 2,770,154,490 |
|
| U.S. Government and Government Agency Obligations - 28.5% | | | |
| U.S. Treasury Inflation-Protected Obligations - 6.4% | | | |
| U.S. Treasury Inflation-Indexed Bonds: | | | |
| 0.25% 2/15/50 | | $5,064,050 | $6,044,080 |
| 0.75% 2/15/45 | | 37,413,728 | 48,299,661 |
| 1% 2/15/49 | | 17,912,042 | 25,252,910 |
| U.S. Treasury Inflation-Indexed Notes: | | | |
| 0.125% 7/15/24 | | 18,438,569 | 19,746,182 |
| 0.125% 10/15/24 | | 62,887,873 | 67,442,379 |
| 0.125% 7/15/30 | | 53,318,475 | 59,839,103 |
| 0.25% 1/15/25 | | 7,475,648 | 8,068,426 |
| 0.25% 7/15/29 | | 30,538,800 | 34,585,802 |
| 0.375% 1/15/27 | | 17,743,057 | 19,805,718 |
| 0.375% 7/15/27 | | 17,193,852 | 19,350,421 |
| 0.625% 1/15/26 | | 71,392,539 | 79,709,681 |
| 0.75% 7/15/28 | | 27,489,245 | 31,983,039 |
| 0.875% 1/15/29 | | 27,861,875 | 32,756,919 |
|
| TOTAL U.S. TREASURY INFLATION-PROTECTED OBLIGATIONS | | | 452,884,321 |
|
| U.S. Treasury Obligations - 22.1% | | | |
| U.S. Treasury Bonds: | | | |
| 1.125% 5/15/40 | | 40,277,000 | 38,175,044 |
| 1.375% 8/15/50 (d) | | 130,822,100 | 122,236,900 |
| 1.625% 11/15/50 | | 219,052,000 | 217,751,379 |
| 3% 2/15/47 | | 99,232,000 | 129,505,512 |
| U.S. Treasury Notes: | | | |
| 0.125% 8/15/23 | | 114,167,000 | 114,095,646 |
| 0.125% 12/15/23 | | 25,459,000 | 25,427,176 |
| 0.25% 7/31/25 | | 272,299,000 | 271,448,059 |
| 0.375% 12/31/25 | | 29,651,000 | 29,667,216 |
| 0.625% 12/31/27 | | 40,000,000 | 39,937,500 |
| 0.875% 11/15/30 | | 102,317,000 | 101,917,324 |
| 1.625% 9/30/26 | | 102,917,300 | 109,687,329 |
| 1.875% 3/31/22 | | 14,649,000 | 14,969,447 |
| 2% 12/31/21 | | 119,319,000 | 121,546,899 |
| 2.125% 3/31/24 | | 60,434,000 | 64,201,682 |
| 2.125% 11/30/24 | | 11,586,000 | 12,429,153 |
| 2.5% 1/31/24 | | 77,300,000 | 82,810,644 |
| 2.5% 2/28/26 | | 73,467,000 | 81,427,839 |
|
| TOTAL U.S. TREASURY OBLIGATIONS | | | 1,577,234,749 |
|
| TOTAL U.S. GOVERNMENT AND GOVERNMENT AGENCY OBLIGATIONS | | | |
| (Cost $1,978,406,441) | | | 2,030,119,070 |
|
| U.S. Government Agency - Mortgage Securities - 19.0% | | | |
| Fannie Mae - 8.5% | | | |
| 12 month U.S. LIBOR + 1.480% 2.476% 7/1/34 (b)(c) | | 11,230 | 11,730 |
| 12 month U.S. LIBOR + 1.550% 2.553% 6/1/36 (b)(c) | | 11,321 | 11,901 |
| 12 month U.S. LIBOR + 1.680% 3.055% 11/1/36 (b)(c) | | 151,282 | 158,835 |
| 12 month U.S. LIBOR + 1.700% 3.005% 6/1/42 (b)(c) | | 74,720 | 78,295 |
| 12 month U.S. LIBOR + 1.750% 3.382% 7/1/35 (b)(c) | | 8,533 | 8,957 |
| 12 month U.S. LIBOR + 1.770% 2.905% 5/1/36 (b)(c) | | 84,170 | 88,835 |
| 12 month U.S. LIBOR + 1.780% 3.788% 2/1/36 (b)(c) | | 81,961 | 86,048 |
| 12 month U.S. LIBOR + 1.800% 2.706% 7/1/41 (b)(c) | | 64,973 | 67,596 |
| 12 month U.S. LIBOR + 1.810% 2.321% 9/1/41 (b)(c) | | 36,717 | 38,280 |
| 12 month U.S. LIBOR + 1.810% 2.694% 7/1/41 (b)(c) | | 64,599 | 68,066 |
| 12 month U.S. LIBOR + 1.820% 3.82% 12/1/35 (b)(c) | | 57,662 | 60,860 |
| 12 month U.S. LIBOR + 1.830% 2.33% 10/1/41(b)(c) | | 31,594 | 32,823 |
| 12 month U.S. LIBOR + 1.940% 3.145% 9/1/36 (b)(c) | | 52,955 | 55,376 |
| 12 month U.S. LIBOR + 1.950% 2.806% 7/1/37 (b)(c) | | 18,196 | 19,309 |
| 6 month U.S. LIBOR + 1.310% 2.438% 5/1/34 (b)(c) | | 50,945 | 52,438 |
| 6 month U.S. LIBOR + 1.420% 2.314% 9/1/33 (b)(c) | | 124,618 | 128,684 |
| 6 month U.S. LIBOR + 1.550% 1.874% 10/1/33 (b)(c) | | 5,811 | 6,025 |
| 6 month U.S. LIBOR + 1.560% 2.105% 7/1/35 (b)(c) | | 9,278 | 9,651 |
| U.S. TREASURY 1 YEAR INDEX + 1.940% 2.277% 10/1/33 (b)(c) | | 125,998 | 132,523 |
| U.S. TREASURY 1 YEAR INDEX + 2.200% 3.708% 3/1/35 (b)(c) | | 6,347 | 6,685 |
| U.S. TREASURY 1 YEAR INDEX + 2.220% 3.636% 8/1/36 (b)(c) | | 219,331 | 231,667 |
| U.S. TREASURY 1 YEAR INDEX + 2.280% 2.417% 10/1/33 (b)(c) | | 15,367 | 16,136 |
| U.S. TREASURY 1 YEAR INDEX + 2.420% 3.339% 5/1/35 (b)(c) | | 21,361 | 22,475 |
| 2.5% 8/1/24 to 10/1/50 | | 45,293,573 | 47,884,365 |
| 3% 8/1/27 to 7/1/50 | | 212,170,348 | 225,439,447 |
| 3.5% 1/1/34 to 7/1/50 | | 177,526,316 | 190,226,279 |
| 4% 11/1/31 to 11/1/49 | | 69,830,481 | 76,444,433 |
| 4.5% 5/1/25 to 9/1/49 | | 39,448,708 | 43,617,544 |
| 5% 12/1/22 to 11/1/44 | | 10,797,972 | 12,307,998 |
| 6% 10/1/34 to 1/1/42 | | 5,119,798 | 6,081,379 |
| 6.5% 12/1/23 to 8/1/36 | | 931,480 | 1,088,732 |
| 7% 11/1/23 to 8/1/32 | | 205,378 | 229,141 |
| 7.5% 9/1/22 to 11/1/31 | | 185,083 | 211,440 |
| 8% 1/1/30 to 3/1/30 | | 1,021 | 1,118 |
| 8.5% 3/1/25 to 6/1/25 | | 263 | 291 |
|
| TOTAL FANNIE MAE | | | 604,925,362 |
|
| Freddie Mac - 3.7% | | | |
| 12 month U.S. LIBOR + 1.370% 2.835% 3/1/36 (b)(c) | | 58,833 | 61,299 |
| 12 month U.S. LIBOR + 1.880% 2.463% 9/1/41 (b)(c) | | 53,404 | 55,105 |
| 12 month U.S. LIBOR + 1.880% 3.722% 4/1/41 (b)(c) | | 24,296 | 25,608 |
| 12 month U.S. LIBOR + 1.910% 2.91% 6/1/41 (b)(c) | | 27,835 | 29,373 |
| 12 month U.S. LIBOR + 1.910% 2.925% 6/1/41 (b)(c) | | 101,485 | 107,052 |
| 12 month U.S. LIBOR + 1.910% 3.069% 5/1/41 (b)(c) | | 75,162 | 78,832 |
| 12 month U.S. LIBOR + 1.910% 3.321% 5/1/41 (b)(c) | | 94,640 | 99,997 |
| 12 month U.S. LIBOR + 2.040% 3.236% 3/1/33 (b)(c) | | 1,261 | 1,322 |
| 12 month U.S. LIBOR + 2.160% 4.285% 11/1/35 (b)(c) | | 29,575 | 31,233 |
| 6 month U.S. LIBOR + 1.650% 1.945% 4/1/35 (b)(c) | | 84,299 | 87,712 |
| 6 month U.S. LIBOR + 2.690% 2.993% 10/1/35 (b)(c) | | 11,847 | 12,482 |
| U.S. TREASURY 1 YEAR INDEX + 2.240% 3.869% 1/1/35 (b)(c) | | 8,030 | 8,439 |
| 2.5% 5/1/28 to 11/1/50 | | 39,974,678 | 42,239,553 |
| 3% 6/1/31 to 6/1/50 (e) | | 47,835,218 | 51,169,358 |
| 3.5% 3/1/32 to 2/1/50 | | 76,934,943 | 83,178,336 |
| 4% 5/1/37 to 6/1/48 | | 48,402,304 | 53,075,157 |
| 4.5% 7/1/25 to 10/1/48 | | 27,141,109 | 30,134,598 |
| 5% 1/1/35 to 6/1/41 | | 2,044,509 | 2,354,786 |
| 6% 4/1/32 to 8/1/37 | | 496,163 | 578,450 |
| 7.5% 5/1/26 to 11/1/31 | | 23,441 | 27,247 |
| 8% 4/1/27 to 5/1/27 | | 1,574 | 1,777 |
| 8.5% 5/1/27 to 1/1/28 | | 3,330 | 3,744 |
|
| TOTAL FREDDIE MAC | | | 263,361,460 |
|
| Ginnie Mae - 4.7% | | | |
| 3% 12/20/42 to 9/20/50 | | 87,565,295 | 91,831,354 |
| 3.5% 12/20/40 to 8/20/50 | | 59,970,406 | 64,784,157 |
| 4% 2/15/40 to 4/20/48 | | 53,546,689 | 58,721,164 |
| 4.5% 5/15/39 to 6/20/47 | | 21,888,045 | 24,196,235 |
| 5% 3/15/39 to 4/20/48 | | 5,024,486 | 5,625,548 |
| 6.5% 4/15/35 to 11/15/35 | | 61,687 | 73,045 |
| 7% 1/15/28 to 7/15/32 | | 560,693 | 643,295 |
| 7.5% 4/15/22 to 10/15/28 | | 125,069 | 139,724 |
| 8% 3/15/30 to 9/15/30 | | 8,432 | 9,904 |
| 2.5% 1/1/51 (e) | | 12,950,000 | 13,710,126 |
| 2.5% 1/1/51 (e) | | 12,400,000 | 13,127,843 |
| 2.5% 1/1/51 (e) | | 12,700,000 | 13,445,452 |
| 2.5% 1/1/51 (e) | | 7,750,000 | 8,204,902 |
| 2.5% 1/1/51 (e) | | 6,900,000 | 7,305,009 |
| 2.5% 2/1/51 (e) | | 11,750,000 | 12,415,364 |
| 3% 1/1/51 (e) | | 4,050,000 | 4,234,658 |
| 3% 1/1/51 (e) | | 2,250,000 | 2,352,588 |
| 3% 1/1/51 (e) | | 700,000 | 731,916 |
| 3% 1/1/51 (e) | | 350,000 | 365,958 |
| 3% 1/1/51 (e) | | 3,250,000 | 3,398,182 |
| 3% 1/1/51 (e) | | 450,000 | 470,518 |
| 3% 2/1/51 (e) | | 450,000 | 470,799 |
| 3.5% 1/1/51 (e) | | 2,500,000 | 2,649,260 |
| 3.5% 1/1/51 (e) | | 2,250,000 | 2,384,334 |
| 3.5% 1/1/51 (e) | | 1,450,000 | 1,536,571 |
| 3.5% 1/1/51 (e) | | 1,450,000 | 1,536,571 |
|
| TOTAL GINNIE MAE | | | 334,364,477 |
|
| Uniform Mortgage Backed Securities - 2.1% | | | |
| 2.5% 1/1/36 (e) | | 1,200,000 | 1,251,937 |
| 2.5% 1/1/36 (e) | | 1,900,000 | 1,982,234 |
| 2.5% 1/1/36 (e) | | 2,000,000 | 2,086,562 |
| 2.5% 1/1/51 (e) | | 5,900,000 | 6,221,502 |
| 2.5% 1/1/51 (e) | | 2,000,000 | 2,108,984 |
| 2.5% 2/1/51 (e) | | 750,000 | 789,492 |
| 3% 1/1/51 (e) | | 11,600,000 | 12,153,256 |
| 3% 1/1/51 (e) | | 11,350,000 | 11,891,333 |
| 3% 1/1/51 (e) | | 27,050,000 | 28,340,136 |
| 3% 1/1/51 (e) | | 12,650,000 | 13,253,335 |
| 3% 1/1/51 (e) | | 700,000 | 733,386 |
| 3% 1/1/51 (e) | | 3,100,000 | 3,247,853 |
| 3% 1/1/51 (e) | | 100,000 | 104,769 |
| 3% 1/1/51 (e) | | 13,950,000 | 14,615,338 |
| 3% 2/1/51 (e) | | 21,100,000 | 22,124,487 |
| 3% 2/1/51 (e) | | 27,550,000 | 28,887,660 |
| 3.5% 1/1/51 (e) | | 750,000 | 792,891 |
| 3.5% 1/1/51 (e) | | 750,000 | 792,891 |
|
| TOTAL UNIFORM MORTGAGE BACKED SECURITIES | | | 151,378,046 |
|
| TOTAL U.S. GOVERNMENT AGENCY - MORTGAGE SECURITIES | | | |
| (Cost $1,318,705,747) | | | 1,354,029,345 |
|
| Asset-Backed Securities - 5.1% | | | |
| AASET Trust: | | | |
| Series 2018-1A Class A, 3.844% 1/16/38 (a) | | $2,487,059 | $2,350,785 |
| Series 2019-1 Class A, 3.844% 5/15/39 (a) | | 3,765,053 | 3,555,687 |
| Series 2019-2: | | | |
| Class A, 3.376% 10/16/39 (a) | | 6,060,368 | 5,729,475 |
| Class B, 4.458% 10/16/39 (a) | | 1,126,362 | 965,405 |
| Aimco Series 2019-10A Class A, 3 month U.S. LIBOR + 1.320% 1.5358% 7/22/32 (a)(b)(c) | | 8,377,000 | 8,368,799 |
| AIMCO CLO Ltd.: | | | |
| Series 2020-11A Class A1, 3 month U.S. LIBOR + 1.380% 1.6046% 10/15/31 (a)(b)(c) | | 4,716,000 | 4,715,552 |
| Series 2021-12A Class A, 3 month U.S. LIBOR + 1.210% 0% 1/17/32 (a)(b)(c)(e) | | 6,650,000 | 6,650,000 |
| Allegany Park CLO, Ltd. / Allegany Series 2020-1A Class A, 3 month U.S. LIBOR + 1.330% 1.5484% 1/20/33 (a)(b)(c) | | 3,021,000 | 3,024,492 |
| Apollo Aviation Securitization Equity Trust Series 2020-1A: | | | |
| Class A, 3.351% 1/16/40 (a) | | 2,885,871 | 2,716,496 |
| Class B, 4.335% 1/16/40 (a) | | 473,101 | 405,686 |
| Ares CLO Series 2019-54A Class A, 3 month U.S. LIBOR + 1.320% 1.5569% 10/15/32 (a)(b)(c) | | 5,467,000 | 5,469,553 |
| Ares CLO Ltd. Series 2020-58A Class A, 3 month U.S. LIBOR + 1.220% 0% 1/15/33 (a)(b)(c) | | 6,350,000 | 6,350,000 |
| Ares LV CLO Ltd. Series 2020-55A Class A1, 3 month U.S. LIBOR + 1.700% 1.9369% 4/15/31 (a)(b)(c) | | 5,831,000 | 5,839,088 |
| Ares XLI CLO Ltd. / Ares XLI CLO LLC Series 2016-41A Class AR, 3 month U.S. LIBOR + 1.200% 1.4369% 1/15/29 (a)(b)(c) | | 6,857,000 | 6,848,573 |
| Ares XXXIV CLO Ltd. Series 2020-2A Class AR2, 3 month U.S. LIBOR + 1.250% 1.4678% 4/17/33 (a)(b)(c) | | 2,171,000 | 2,179,141 |
| Babson CLO Ltd./Cayman Islands Series 2020-1A Class A1, 3 month U.S. LIBOR + 1.400% 1.6301% 10/15/32 (a)(b)(c) | | 7,485,000 | 7,493,166 |
| Barings CLO Ltd. Series 2021-4A Class A, 3 month U.S. LIBOR + 1.220% 1.22% 1/20/32 (a)(b)(c)(e) | | 6,750,000 | 6,750,000 |
| Beechwood Park CLO Ltd. Series 2019-1A Class A1, 3 month U.S. LIBOR + 1.330% 1.5478% 1/17/33 (a)(b)(c) | | 2,958,000 | 2,961,381 |
| Blackbird Capital Aircraft Series 2016-1A: | | | |
| Class A, 4.213% 12/16/41 (a) | | 7,448,534 | 7,098,710 |
| Class AA, 2.487% 12/16/41 (a)(b) | | 1,293,396 | 1,248,909 |
| Bristol Park CLO, Ltd. Series 2020-1A Class AR, 3 month U.S. LIBOR + 0.990% 1.2269% 4/15/29 (a)(b)(c) | | 6,492,000 | 6,464,824 |
| Castlelake Aircraft Securitization Trust Series 2019-1A: | | | |
| Class A, 3.967% 4/15/39 (a) | | 5,434,977 | 5,168,630 |
| Class B, 5.095% 4/15/39 (a)(f) | | 2,529,234 | 2,077,231 |
| Castlelake Aircraft Structured Trust Series 2018-1 Class A, 4.125% 6/15/43 (a) | | 5,422,205 | 5,153,827 |
| Cedar Funding Ltd.: | | | |
| Series 2019-10A Class A, 3 month U.S. LIBOR + 1.340% 1.5584% 10/20/32 (a)(b)(c) | | 4,495,000 | 4,492,586 |
| Series 2019-11A Class A1A, 3 month U.S. LIBOR + 1.350% 1.5744% 5/29/32 (a)(b)(c) | | 3,185,000 | 3,182,949 |
| Cedar Funding XII CLO Ltd. / Cedar Funding XII CLO LLC Series 2020-12A Class A, 3 month U.S. LIBOR + 1.270% 1.5101% 10/25/32 (a)(b)(c) | | 3,720,000 | 3,715,305 |
| CEDF Series 2018-6A Class AR, 3 month U.S. LIBOR + 1.090% 1.3084% 10/20/28 (a)(b)(c) | | 1,420,000 | 1,414,188 |
| Cent CLO Ltd. / Cent CLO Series 2020-29A Class A1N, 3 month U.S. LIBOR + 1.700% 1.9194% 7/20/31 (a)(b)(c) | | 6,101,000 | 6,123,879 |
| Columbia Cent CLO Ltd. / Columbia Cent CLO Corp. Series 2021-30A Class A1, 3 month U.S. LIBOR + 1.310% 0% 1/20/34 (a)(b)(c)(e) | | 8,900,000 | 8,900,000 |
| DB Master Finance LLC Series 2017-1A: | | | |
| Class A2I, 3.629% 11/20/47 (a) | | 3,463,073 | 3,555,086 |
| Class A2II, 4.03% 11/20/47 (a) | | 5,862,230 | 6,225,219 |
| Dryden 68 CLO Ltd. 3 month U.S. LIBOR + 1.310% 1.5469% 7/15/32 (a)(b)(c) | | 5,140,000 | 5,136,551 |
| Dryden CLO, Ltd.: | | | |
| Series 2019-75A Class AR, 3 month U.S. LIBOR + 1.200% 1.4369% 7/15/30 (a)(b)(c) | | 2,913,000 | 2,909,356 |
| Series 2019-76A Class A1, 3 month U.S. LIBOR + 1.330% 1.5484% 10/20/32 (a)(b)(c) | | 5,921,000 | 5,919,703 |
| Series 2021-83A Class A, 3 month U.S. LIBOR + 1.220% 1.22% 1/18/32 (a)(b)(c)(e) | | 2,840,000 | 2,840,000 |
| Dryden CLO, Ltd. / Dryden CLO, LLC Series 2020-85A Class A1, 3 month U.S. LIBOR + 1.350% 1.5633% 10/15/32 (a)(b)(c) | | 5,478,000 | 5,471,081 |
| Dryden Senior Loan Fund: | | | |
| Series 2019-72A Class A, 3 month U.S. LIBOR + 1.330% 1.6101% 5/15/32 (a)(b)(c) | | 5,210,000 | 5,207,848 |
| Series 2020-78A Class A, 3 month U.S. LIBOR + 1.180% 1.3978% 4/17/33 (a)(b)(c) | | 4,300,000 | 4,313,287 |
| Eaton Vance CLO, Ltd.: | | | |
| Series 2020-1A Class A, 1.65% 10/15/30 (a) | | 6,500,000 | 6,517,232 |
| Series 2020-2A Class A1, 3 month U.S. LIBOR + 1.370% 1.5603% 10/15/32 (a)(b)(c) | | 6,730,000 | 6,721,507 |
| Flatiron CLO Ltd. Series 2019-1A Class A, 3 month U.S. LIBOR + 1.320% 1.541% 11/16/32 (a)(b)(c) | | 6,083,000 | 6,081,710 |
| Flatiron CLO Ltd. / Flatiron CLO LLC Series 2020-1A Class A, 3 month U.S. LIBOR + 1.300% 1.5483% 11/20/33 (a)(b)(c) | | 6,330,000 | 6,329,911 |
| Horizon Aircraft Finance I Ltd. Series 2018-1 Class A, 4.458% 12/15/38 (a) | | 2,708,172 | 2,615,888 |
| Horizon Aircraft Finance Ltd. Series 2019-1 Class A, 3.721% 7/15/39 (a) | | 2,731,891 | 2,635,484 |
| Lucali CLO Ltd. Series 2021-1A Class A, 3 month U.S. LIBOR + 1.210% 1.21% 1/15/33 (a)(b)(c)(e) | | 3,200,000 | 3,200,000 |
| Madison Park Funding Series 2020-19A Class A1R2, 3 month U.S. LIBOR + 0.920% 1.1358% 1/22/28 (a)(b)(c) | | 4,688,000 | 4,671,442 |
| Madison Park Funding Ltd.: | | | |
| Series 2012-10A Class AR2, 3 month U.S. LIBOR + 1.220% 1.4384% 1/20/29 (a)(b)(c) | | 2,547,000 | 2,544,045 |
| Series 2019-37A Class A1, 3 month U.S. LIBOR + 1.300% 1.5369% 7/15/32 (a)(b)(c) | | 6,816,000 | 6,811,065 |
| Madison Park Funding XLV Ltd./Madison Park Funding XLV LLC Series 2020-45A Class A, 3 month U.S. LIBOR + 1.650% 1.9184% 7/15/31 (a)(b)(c) | | 6,840,000 | 6,849,932 |
| Madison Park Funding XXXIII Ltd. Series 2019-33A Class A, 3 month U.S. LIBOR + 1.330% 1.5669% 10/15/32 (a)(b)(c) | | 2,954,000 | 2,957,379 |
| Magnetite CLO Ltd.: | | | |
| Series 2019-21A Class A, 3 month U.S. LIBOR + 1.280% 1.4984% 4/20/30 (a)(b)(c) | | 5,650,000 | 5,643,305 |
| Series 2019-24A Class A, 3 month U.S. LIBOR + 1.330% 1.5669% 1/15/33 (a)(b)(c) | | 9,042,000 | 9,052,344 |
| Milos CLO, Ltd. Series 2020-1A Class AR, 3 month U.S. LIBOR + 1.070% 1.2884% 10/20/30 (a)(b)(c) | | 6,512,000 | 6,465,244 |
| New Century Home Equity Loan Trust Series 2005-4 Class M2, 1 month U.S. LIBOR + 0.760% 0.913% 9/25/35 (b)(c) | | 45,612 | 45,663 |
| Niagara Park CLO, Ltd. Series 2019-1A Class A, 3 month U.S. LIBOR + 1.300% 1.5178% 7/17/32 (a)(b)(c) | | 6,261,000 | 6,259,911 |
| Park Place Securities, Inc. Series 2005-WCH1 Class M4, 1 month U.S. LIBOR + 1.240% 1.3951% 1/25/36 (b)(c) | | 458,674 | 458,893 |
| Planet Fitness Master Issuer LLC Series 2019-1A Class A2, 3.858% 12/5/49 (a) | | 4,734,180 | 4,464,616 |
| Project Silver Series 2019-1 Class A, 3.967% 7/15/44 (a) | | 4,868,280 | 4,669,400 |
| Sapphire Aviation Finance Series 2020-1A: | | | |
| Class A, 3.228% 3/15/40 (a) | | 5,519,365 | 5,343,352 |
| Class B, 4.335% 3/15/40 (a) | | 521,805 | 424,798 |
| SBA Tower Trust: | | | |
| Series 2019, 2.836% 1/15/50 (a) | | 6,201,000 | 6,601,888 |
| 1.884% 7/15/50 (a) | | 2,389,000 | 2,458,815 |
| 2.328% 7/15/52 (a) | | 1,826,000 | 1,840,457 |
| Stratus CLO Ltd. Series 2020-1A Class A, 3 month U.S. LIBOR + 1.980% 2.1984% 5/1/28 (a)(b)(c) | | 7,886,807 | 8,023,202 |
| Symphony CLO XXIII Ltd. Series 2020-23A Class A, 3 month U.S. LIBOR + 0.000% 1.32% 1/15/34 (a)(b)(c) | | 3,860,000 | 3,855,148 |
| Taconic Park CLO, Ltd. Series 2020-1A Class A1R, 3 month U.S. LIBOR + 1.000% 1.2184% 1/20/29 (a)(b)(c) | | 4,342,000 | 4,319,118 |
| Terwin Mortgage Trust Series 2003-4HE Class A1, 1 month U.S. LIBOR + 0.860% 1.0101% 9/25/34 (b)(c) | | 8,753 | 8,050 |
| Thunderbolt Aircraft Lease Ltd. Series 2018-A Class A, 4.147% 9/15/38 (a)(b) | | 6,259,948 | 6,012,737 |
| Thunderbolt III Aircraft Lease Ltd. Series 2019-1 Class A, 3.671% 11/15/39 (a) | | 7,727,093 | 7,365,743 |
| Verde CLO Ltd. Series 2019-1A Class A, 3 month U.S. LIBOR + 1.350% 1.5869% 4/15/32 (a)(b)(c) | | 6,307,000 | 6,300,504 |
| Voya Series 2020-1A Class A, 3 month U.S. LIBOR + 1.700% 2.0027% 7/16/31 (a)(b)(c) | | 6,885,000 | 6,905,559 |
| Voya CLO Ltd.: | | | |
| Series 2017-1A Class A1, 3 month U.S. LIBOR + 1.250% 1.4678% 4/17/30 (a)(b)(c) | | 5,002,000 | 5,002,965 |
| Series 2019-2A Class A, 3 month U.S. LIBOR + 1.270% 1.4884% 7/20/32 (a)(b)(c) | | 6,552,000 | 6,548,056 |
| Voya CLO Ltd. / Voya CLO LLC Series 2020-3A Class A1, 3 month U.S. LIBOR + 1.300% 1.4965% 10/20/31 (a)(b)(c) | | 8,400,000 | 8,423,184 |
| Voya CLO Ltd./Voya CLO LLC Series 2020-2A Class A1, 3 month U.S. LIBOR + 1.600% 1.7848% 7/19/31 (a)(b)(c) | | 6,400,000 | 6,407,494 |
| TOTAL ASSET-BACKED SECURITIES | | | |
| (Cost $362,189,854) | | | 359,828,489 |
|
| Collateralized Mortgage Obligations - 0.0% | | | |
| Private Sponsor - 0.0% | | | |
| Sequoia Mortgage Trust floater Series 2004-6 Class A3B, 6 month U.S. LIBOR + 0.880% 1.3048% 7/20/34 (b)(c) | | 2,921 | 2,812 |
| U.S. Government Agency - 0.0% | | | |
| Fannie Mae planned amortization class: | | | |
| Series 1999-54 Class PH, 6.5% 11/18/29 | | 106,844 | 114,923 |
| Series 1999-57 Class PH, 6.5% 12/25/29 | | 140,625 | 161,607 |
| Ginnie Mae guaranteed REMIC pass-thru certificates: | | | |
| sequential payer Series 2013-H06 Class HA, 1.65% 1/20/63 (g) | | 184,452 | 184,865 |
| Series 2007-35 Class SC, 40.200% - 1 month U.S. LIBOR 39.2812% 6/16/37 (b)(h) | | 15,686 | 29,921 |
| Series 2015-H21 Class JA, 2.5% 6/20/65 (g) | | 20,631 | 20,619 |
|
| TOTAL U.S. GOVERNMENT AGENCY | | | 511,935 |
|
| TOTAL COLLATERALIZED MORTGAGE OBLIGATIONS | | | |
| (Cost $457,037) | | | 514,747 |
|
| Commercial Mortgage Securities - 2.8% | | | |
| BAMLL Commercial Mortgage Securities Trust: | | | |
| floater sequential payer Series 2020-JGDN Class A, 1 month U.S. LIBOR + 2.750% 3% 11/15/30 (a)(b)(c) | | 5,790,000 | 5,795,299 |
| sequential payer Series 2019-BPR Class ANM, 3.112% 11/5/32 (a) | | 3,856,000 | 3,898,520 |
| Series 2019-BPR: | | | |
| Class BNM, 3.465% 11/5/32 (a) | | 865,000 | 810,651 |
| Class CNM, 3.7186% 11/5/32 (a)(b) | | 358,000 | 322,113 |
| BANK sequential payer: | | | |
| Series 2018-BN10 Class A5, 3.688% 2/15/61 | | 4,609,000 | 5,315,658 |
| Series 2019-BN21 Class A5, 2.851% 10/17/52 | | 658,000 | 728,442 |
| Benchmark Mortgage Trust: | | | |
| sequential payer: | | | |
| Series 2018-B4 Class A5, 4.121% 7/15/51 | | 1,371,000 | 1,620,871 |
| Series 2019-B10 Class A4, 3.717% 3/15/62 | | 1,271,000 | 1,485,027 |
| Series 2019-B14 Class A5, 3.0486% 12/15/62 | | 2,997,000 | 3,365,188 |
| Series 2018-B8 Class A5, 4.2317% 1/15/52 | | 9,399,000 | 11,256,790 |
| BFLD Trust floater sequential payer Series 2020-OBRK Class A, 1 month U.S. LIBOR + 2.050% 2.2% 11/15/28 (a)(b)(c) | | 3,518,000 | 3,517,997 |
| BX Commercial Mortgage Trust: | | | |
| floater Series 2020-BXLP: | | | |
| Class B, 1 month U.S. LIBOR + 1.000% 1.159% 12/15/36 (a)(b)(c) | | 3,525,773 | 3,525,772 |
| Class C, 1 month U.S. LIBOR + 1.120% 1.279% 12/15/36 (a)(b)(c) | | 2,812,426 | 2,801,848 |
| Class D, 1 month U.S. LIBOR + 1.250% 1.409% 12/15/36 (a)(b)(c) | | 4,363,007 | 4,313,997 |
| floater sequential payer: | | | |
| Series 2020-BXLP Class A, 1 month U.S. LIBOR + 0.800% 0.959% 12/15/36 (a)(b)(c) | | 9,667,152 | 9,670,150 |
| Series 2020-FOX Class A, 1 month U.S. LIBOR + 1.000% 1.159% 11/15/32 (a)(b)(c) | | 5,117,000 | 5,125,205 |
| BX Trust: | | | |
| floater: | | | |
| Series 2018-EXCL Class D, 1 month U.S. LIBOR + 2.620% 2.7836% 9/15/37 (a)(b)(c) | | 1,924,568 | 1,474,142 |
| Series 2018-IND: | | | |
| Class B, 1 month U.S. LIBOR + 0.900% 1.059% 11/15/35 (a)(b)(c) | | 1,117,900 | 1,116,557 |
| Class F, 1 month U.S. LIBOR + 1.800% 1.959% 11/15/35 (a)(b)(c) | | 2,048,200 | 2,040,500 |
| Series 2019-IMC: | | | |
| Class B, 1 month U.S. LIBOR + 1.300% 1.459% 4/15/34 (a)(b)(c) | | 3,284,000 | 3,152,211 |
| Class C, 1 month U.S. LIBOR + 1.600% 1.759% 4/15/34 (a)(b)(c) | | 2,171,000 | 2,051,209 |
| Class D, 1 month U.S. LIBOR + 1.900% 2.059% 4/15/34 (a)(b)(c) | | 2,279,000 | 2,130,389 |
| Series 2019-XL: | | | |
| Class B, 1 month U.S. LIBOR + 1.080% 1.239% 10/15/36 (a)(b)(c) | | 2,937,127 | 2,937,127 |
| Class C, 1 month U.S. LIBOR + 1.250% 1.409% 10/15/36 (a)(b)(c) | | 3,692,768 | 3,683,504 |
| Class D, 1 month U.S. LIBOR + 1.450% 1.609% 10/15/36 (a)(b)(c) | | 5,229,682 | 5,228,046 |
| Class E, 1 month U.S. LIBOR + 1.800% 1.959% 10/15/36 (a)(b)(c) | | 7,348,514 | 7,293,240 |
| Series 2020-BXLP Class E, 1 month U.S. LIBOR + 1.600% 1.759% 12/15/36 (a)(b)(c) | | 3,568,734 | 3,497,165 |
| floater, sequential payer Series 2019-IMC Class A, 1 month U.S. LIBOR + 1.000% 1.159% 4/15/34 (a)(b)(c) | | 5,400,000 | 5,264,560 |
| CHC Commercial Mortgage Trust floater Series 2019-CHC: | | | |
| Class A, 1 month U.S. LIBOR + 1.120% 1.279% 6/15/34 (a)(b)(c) | | 7,913,850 | 7,591,872 |
| Class B, 1 month U.S. LIBOR + 1.500% 1.659% 6/15/34 (a)(b)(c) | | 1,558,276 | 1,482,079 |
| Class C, 1 month U.S. LIBOR + 1.750% 1.909% 6/15/34 (a)(b)(c) | | 1,760,404 | 1,660,953 |
| COMM Mortgage Trust sequential payer Series 2014-CR18 Class A5, 3.828% 7/15/47 | | 1,264,000 | 1,392,328 |
| Credit Suisse Mortgage Trust: | | | |
| floater Series 2019-ICE4: | | | |
| Class B, 1 month U.S. LIBOR + 1.230% 1.389% 5/15/36 (a)(b)(c) | | 3,291,000 | 3,290,012 |
| Class C, 1 month U.S. LIBOR + 1.430% 1.589% 5/15/36 (a)(b)(c) | | 3,615,000 | 3,610,643 |
| sequential payer Series 2020-NET Class A, 2.2569% 8/15/37 (a) | | 1,972,000 | 2,042,653 |
| Series 2018-SITE: | | | |
| Class A, 4.284% 4/15/36 (a) | | 3,682,000 | 3,667,417 |
| Class B, 4.5349% 4/15/36 (a) | | 1,132,000 | 1,104,877 |
| Class C, 4.782% 4/15/36 (a)(b) | | 760,000 | 714,729 |
| Class D, 4.782% 4/15/36 (a)(b) | | 1,519,000 | 1,281,209 |
| GB Trust floater Series 2020-FLIX: | | | |
| Class A, 1 month U.S. LIBOR + 1.120% 1.2786% 8/15/37 (a)(b)(c) | | 4,400,000 | 4,405,985 |
| Class B, 1 month U.S. LIBOR + 1.350% 1.5086% 8/15/37 (a)(b)(c) | | 940,000 | 944,247 |
| Class C, 1 month U.S. LIBOR + 1.600% 1.7586% 8/15/37 (a)(b)(c) | | 500,000 | 502,246 |
| JPMorgan Chase Commercial Mortgage Securities Trust Series 2018-WPT: | | | |
| Class CFX, 4.9498% 7/5/33 (a) | | 729,000 | 753,841 |
| Class DFX, 5.3503% 7/5/33 (a) | | 1,121,000 | 1,121,749 |
| Class EFX, 5.5422% 7/5/33 (a) | | 1,533,000 | 1,497,138 |
| Merit floater Series 2020-HILL Class A, 1 month U.S. LIBOR + 1.150% 1.3086% 8/15/37 (a)(b)(c) | | 1,912,000 | 1,915,640 |
| Morgan Stanley Capital Barclays Bank Trust sequential payer Series 2016-MART Class A, 2.2004% 9/13/31 (a) | | 1,700,000 | 1,697,801 |
| Morgan Stanley Capital I Trust: | | | |
| floater Series 2018-BOP: | | | |
| Class B, 1 month U.S. LIBOR + 1.250% 1.409% 8/15/33 (a)(b)(c) | | 4,160,105 | 3,987,272 |
| Class C, 1 month U.S. LIBOR + 1.500% 1.659% 8/15/33 (a)(b)(c) | | 10,019,706 | 9,429,782 |
| sequential payer Series 2019-MEAD Class A, 3.17% 11/10/36 (a) | | 8,381,000 | 8,705,104 |
| Series 2018-H4 Class A4, 4.31% 12/15/51 | | 6,179,000 | 7,389,264 |
| Series 2019-MEAD: | | | |
| Class B, 3.1771% 11/10/36 (a)(b) | | 1,211,000 | 1,174,790 |
| Class C, 3.1771% 11/10/36 (a)(b) | | 1,162,000 | 1,059,865 |
| Providence Place Group Ltd. Partnership Series 2000-C1 Class A2, 7.75% 7/20/28 (a) | | 3,523,287 | 4,085,168 |
| RETL floater Series 2019-RVP Class C, 1 month U.S. LIBOR + 2.100% 2.259% 3/15/36 (a)(b)(c) | | 5,621,000 | 5,412,008 |
| VLS Commercial Mortgage Trust: | | | |
| sequential payer Series 2020-LAB Class A, 2.13% 10/10/42 (a) | | 4,250,000 | 4,405,474 |
| Series 2020-LAB Class B, 2.453% 10/10/42 (a) | | 370,000 | 384,804 |
| Wells Fargo Commercial Mortgage Trust: | | | |
| sequential payer Series 2015-C26 Class A4, 3.166% 2/15/48 | | 3,348,000 | 3,650,372 |
| Series 2018-C48 Class A5, 4.302% 1/15/52 | | 2,773,000 | 3,316,367 |
| TOTAL COMMERCIAL MORTGAGE SECURITIES | | | |
| (Cost $197,415,519) | | | 197,099,867 |
|
| Municipal Securities - 1.0% | | | |
| California Gen. Oblig.: | | | |
| Series 2009: | | $ | $ |
| 7.35% 11/1/39 | | 805,000 | 1,337,057 |
| 7.5% 4/1/34 | | 5,055,000 | 8,424,966 |
| 7.55% 4/1/39 | | 3,585,000 | 6,294,543 |
| Series 2010, 6.65% 3/1/22 | | 4,360,000 | 4,539,763 |
| Chicago Gen. Oblig. (Taxable Proj.) Series 2010 C1, 7.781% 1/1/35 | | 2,940,000 | 3,593,738 |
| Illinois Gen. Oblig.: | | | |
| Series 2003: | | | |
| 4.95% 6/1/23 | | 3,510,000 | 3,596,627 |
| 5.1% 6/1/33 | | 4,805,000 | 5,171,189 |
| Series 2010-1, 6.63% 2/1/35 | | 12,290,000 | 14,080,039 |
| Series 2010-3: | | | |
| 6.725% 4/1/35 | | 9,480,000 | 10,946,746 |
| 7.35% 7/1/35 | | 5,540,000 | 6,605,120 |
| Series 2010-5, 6.2% 7/1/21 | | 452,000 | 459,721 |
| New Jersey Econ. Dev. Auth. State Pension Fdg. Rev. Series 1997, 7.425% 2/15/29 (Nat'l. Pub. Fin. Guarantee Corp. Insured) | | 7,240,000 | 9,331,708 |
| TOTAL MUNICIPAL SECURITIES | | | |
| (Cost $67,035,854) | | | 74,381,217 |
|
| Foreign Government and Government Agency Obligations - 0.7% | | | |
| Chilean Republic 2.45% 1/31/31 | | $5,775,000 | $6,179,250 |
| Emirate of Abu Dhabi: | | | |
| 3.125% 4/16/30 (a) | | 6,600,000 | 7,453,875 |
| 3.875% 4/16/50 (a) | | 5,700,000 | 6,923,719 |
| Kingdom of Saudi Arabia: | | | |
| 2.9% 10/22/25 (a) | | 3,150,000 | 3,394,125 |
| 3.25% 10/22/30 (a) | | 3,150,000 | 3,468,938 |
| 4.5% 4/22/60 (a) | | 2,400,000 | 3,012,000 |
| State of Qatar: | | | |
| 3.4% 4/16/25 (a) | | 3,655,000 | 4,027,353 |
| 3.75% 4/16/30 (a) | | 7,435,000 | 8,729,155 |
| 4.4% 4/16/50 (a) | | 7,110,000 | 9,243,000 |
| TOTAL FOREIGN GOVERNMENT AND GOVERNMENT AGENCY OBLIGATIONS | | | |
| (Cost $45,181,241) | | | 52,431,415 |
|
| Supranational Obligations - 0.1% | | | |
Corporacion Andina de Fomento 2.375% 5/12/23
(Cost $5,889,655) | | 5,900,000 | 6,112,636 |
|
| Bank Notes - 0.4% | | | |
| Discover Bank: | | | |
| 3.2% 8/9/21 | | $6,841,000 | $6,941,804 |
| 3.35% 2/6/23 | | 3,206,000 | 3,382,756 |
| 4.682% 8/9/28 (b) | | 2,761,000 | 2,934,943 |
| KeyBank NA 6.95% 2/1/28 | | 800,000 | 1,045,715 |
| RBS Citizens NA 2.55% 5/13/21 | | 1,560,000 | 1,569,629 |
| Regions Bank 6.45% 6/26/37 | | 7,720,000 | 10,905,545 |
| Synchrony Bank 3.65% 5/24/21 | | 4,766,000 | 4,813,243 |
| TOTAL BANK NOTES | | | |
| (Cost $27,067,395) | | | 31,593,635 |
| | | Shares | Value |
|
| Money Market Funds - 8.2% | | | |
| Fidelity Cash Central Fund 0.11% (i) | | 503,369,198 | $503,469,872 |
| Fidelity Securities Lending Cash Central Fund 0.11% (i)(j) | | 76,586,054 | 76,593,713 |
| TOTAL MONEY MARKET FUNDS | | | |
| (Cost $580,063,191) | | | 580,063,585 |
| TOTAL INVESTMENT IN SECURITIES - 104.7% | | | |
| (Cost $7,044,857,441) | | | 7,456,328,496 |
| NET OTHER ASSETS (LIABILITIES) - (4.7)% | | | (336,934,793) |
| NET ASSETS - 100% | | | $7,119,393,703 |
| TBA Sale Commitments | | |
| | Principal Amount | Value |
| Ginnie Mae | | |
| 2.5% 1/1/51 | $(11,750,000) | $(12,439,690) |
| 3% 1/1/51 | (5,850,000) | (6,116,728) |
| 3% 1/1/51 | (3,250,000) | (3,398,182) |
| 3% 1/1/51 | (450,000) | (470,518) |
| 3% 1/1/51 | (450,000) | (470,518) |
| 3.5% 1/1/51 | (4,700,000) | (4,980,608) |
| 3.5% 1/1/51 | (1,450,000) | (1,536,571) |
| 3.5% 1/1/51 | (750,000) | (794,778) |
| 3.5% 1/1/51 | (750,000) | (794,778) |
|
| TOTAL GINNIE MAE | | (31,002,371) |
|
| Uniform Mortgage Backed Securities | | |
| 2.5% 1/1/36 | (5,100,000) | (5,320,733) |
| 2.5% 1/1/51 | (2,000,000) | (2,108,984) |
| 2.5% 1/1/51 | (3,150,000) | (3,321,649) |
| 2.5% 1/1/51 | (2,000,000) | (2,108,984) |
| 2.5% 1/1/51 | (750,000) | (790,869) |
| 3% 1/1/51 | (900,000) | (942,925) |
| 3% 1/1/51 | (1,600,000) | (1,676,311) |
| 3% 1/1/51 | (1,500,000) | (1,571,542) |
| 3% 1/1/51 | (100,000) | (104,769) |
| 3% 1/1/51 | (700,000) | (733,386) |
| 3% 1/1/51 | (21,100,000) | (22,106,354) |
| 3% 1/1/51 | (700,000) | (733,386) |
| 3% 1/1/51 | (3,100,000) | (3,247,853) |
| 3% 1/1/51 | (100,000) | (104,769) |
| 3% 1/1/51 | (27,550,000) | (28,863,983) |
| 3% 1/1/51 | (13,950,000) | (14,615,338) |
|
| TOTAL UNIFORM MORTGAGE BACKED SECURITIES | | (88,351,835) |
|
| TOTAL TBA SALE COMMITMENTS | | |
| (Proceeds $119,131,522) | | $(119,354,206) |
Legend
(a) Security exempt from registration under Rule 144A of the Securities Act of 1933. These securities may be resold in transactions exempt from registration, normally to qualified institutional buyers. At the end of the period, the value of these securities amounted to $972,560,504 or 13.7% of net assets.
(b) Coupon rates for floating and adjustable rate securities reflect the rates in effect at period end.
(c) Coupon is indexed to a floating interest rate which may be multiplied by a specified factor and/or subject to caps or floors.
(d) Security or a portion of the security is on loan at period end.
(e) Security or a portion of the security purchased on a delayed delivery or when-issued basis.
(f) Level 3 security
(g) Represents an investment in an underlying pool of reverse mortgages which typically do not require regular principal and interest payments as repayment is deferred until a maturity event.
(h) Coupon is inversely indexed to a floating interest rate multiplied by a specified factor. The price may be considerably more volatile than the price of a comparable fixed rate security.
(i) Affiliated fund that is generally available only to investment companies and other accounts managed by Fidelity Investments. The rate quoted is the annualized seven-day yield of the fund at period end. A complete unaudited listing of the fund's holdings as of its most recent quarter end is available upon request. In addition, each Fidelity Central Fund's financial statements, which are not covered by the Fund's Report of Independent Registered Public Accounting Firm, are available on the SEC's website or upon request.
(j) Investment made with cash collateral received from securities on loan.
Affiliated Central Funds
Information regarding fiscal year to date income earned by the Fund from investments in Fidelity Central Funds is as follows:
| Fund | Income earned |
| Fidelity Cash Central Fund | $480,376 |
| Fidelity Securities Lending Cash Central Fund | 37,257 |
| Total | $517,633 |
Amounts in the income column in the above table include any capital gain distributions from underlying funds, which are presented in the corresponding line-item in the Statement of Operations, if applicable.
The value, beginning of period, for the Fidelity Cash Central Fund was $24,486,972. Net realized gain (loss) and change in net unrealized appreciation (depreciation) on Fidelity Cash Central Fund is presented in the Statement of Operations, if applicable. Purchases and sales of the Fidelity Cash Central Fund were $2,575,820,772 and $2,096,819,869, respectively, during the period.
Investment Valuation
The following is a summary of the inputs used, as of December 31, 2020, involving the Fund's assets and liabilities carried at fair value. The inputs or methodology used for valuing securities may not be an indication of the risk associated with investing in those securities. For more information on valuation inputs, and their aggregation into the levels used below, please refer to the Investment Valuation section in the accompanying Notes to Financial Statements.
| | Valuation Inputs at Reporting Date: |
| Description | Total | Level 1 | Level 2 | Level 3 |
| Investments in Securities: | | | | |
| Corporate Bonds | $2,770,154,490 | $-- | $2,770,154,490 | $-- |
| U.S. Government and Government Agency Obligations | 2,030,119,070 | -- | 2,030,119,070 | -- |
| U.S. Government Agency - Mortgage Securities | 1,354,029,345 | -- | 1,354,029,345 | -- |
| Asset-Backed Securities | 359,828,489 | -- | 357,751,258 | 2,077,231 |
| Collateralized Mortgage Obligations | 514,747 | -- | 514,747 | -- |
| Commercial Mortgage Securities | 197,099,867 | -- | 197,099,867 | -- |
| Municipal Securities | 74,381,217 | -- | 74,381,217 | -- |
| Foreign Government and Government Agency Obligations | 52,431,415 | -- | 52,431,415 | -- |
| Supranational Obligations | 6,112,636 | -- | 6,112,636 | -- |
| Bank Notes | 31,593,635 | -- | 31,593,635 | -- |
| Money Market Funds | 580,063,585 | 580,063,585 | -- | -- |
| Total Investments in Securities: | $7,456,328,496 | $580,063,585 | $6,874,187,680 | $2,077,231 |
| Other Financial Instruments: | | | | |
| TBA Sale Commitments | $(119,354,206) | $-- | $(119,354,206) | $-- |
| Total Other Financial Instruments: | $(119,354,206) | $-- | $(119,354,206) | $-- |
Other Information
Distribution of investments by country or territory of incorporation, as a percentage of Total Net Assets, is as follows (Unaudited):
| United States of America | 88.1% |
| Cayman Islands | 3.9% |
| United Kingdom | 1.8% |
| Mexico | 1.4% |
| Others (Individually Less Than 1%) | 4.8% |
| | 100.0% |
See accompanying notes which are an integral part of the financial statements.
Fidelity® VIP Investment Grade Central Fund
Financial Statements
Statement of Assets and Liabilities
| | | December 31, 2020 |
| Assets | | |
Investment in securities, at value (including securities loaned of $75,016,583) — See accompanying schedule:
Unaffiliated issuers (cost $6,464,794,250) | $6,876,264,911 | |
| Fidelity Central Funds (cost $580,063,191) | 580,063,585 | |
| Total Investment in Securities (cost $7,044,857,441) | | $7,456,328,496 |
| Receivable for investments sold | | 5,834 |
| Receivable for TBA sale commitments | | 119,131,522 |
| Receivable for fund shares sold | | 30,109,974 |
| Interest receivable | | 39,815,259 |
| Distributions receivable from Fidelity Central Funds | | 61,605 |
| Total assets | | 7,645,452,690 |
| Liabilities | | |
| Payable for investments purchased | | |
| Regular delivery | $59,296,751 | |
| Delayed delivery | 270,453,378 | |
| TBA sale commitments, at value | 119,354,206 | |
| Payable for fund shares redeemed | 323,170 | |
| Other payables and accrued expenses | 37,769 | |
| Collateral on securities loaned | 76,593,713 | |
| Total liabilities | | 526,058,987 |
| Net Assets | | $7,119,393,703 |
| Net Assets consist of: | | |
| Paid in capital | | $6,579,147,385 |
| Total accumulated earnings (loss) | | 540,246,318 |
| Net Assets | | $7,119,393,703 |
| Net Asset Value, offering price and redemption price per share ($7,119,393,703 ÷ 61,943,061 shares) | | $114.93 |
See accompanying notes which are an integral part of the financial statements.
Statement of Operations
| | | Year ended December 31, 2020 |
| Investment Income | | |
| Interest (including $14,233 from security lending) | | $171,756,751 |
| Income from Fidelity Central Funds (including $37,257 from security lending) | | 517,633 |
| Total income | | 172,274,384 |
| Expenses | | |
| Custodian fees and expenses | $89,612 | |
| Independent trustees' fees and expenses | 20,612 | |
| Total expenses before reductions | 110,224 | |
| Expense reductions | (9,710) | |
| Total expenses after reductions | | 100,514 |
| Net investment income (loss) | | 172,173,870 |
| Realized and Unrealized Gain (Loss) | | |
| Net realized gain (loss) on: | | |
| Investment securities: | | |
| Unaffiliated issuers | 218,491,584 | |
| Fidelity Central Funds | (18,003) | |
| Total net realized gain (loss) | | 218,473,581 |
| Change in net unrealized appreciation (depreciation) on: | | |
| Investment securities: | | |
| Unaffiliated issuers | 195,462,731 | |
| Delayed delivery commitments | (42,107) | |
| Total change in net unrealized appreciation (depreciation) | | 195,420,624 |
| Net gain (loss) | | 413,894,205 |
| Net increase (decrease) in net assets resulting from operations | | $586,068,075 |
See accompanying notes which are an integral part of the financial statements.
Statement of Changes in Net Assets
| | Year ended December 31, 2020 | Year ended December 31, 2019 |
| Increase (Decrease) in Net Assets | | |
| Operations | | |
| Net investment income (loss) | $172,173,870 | $176,691,614 |
| Net realized gain (loss) | 218,473,581 | 27,551,736 |
| Change in net unrealized appreciation (depreciation) | 195,420,624 | 311,153,322 |
| Net increase (decrease) in net assets resulting from operations | 586,068,075 | 515,396,672 |
| Distributions to shareholders | (259,592,182) | (182,277,023) |
| Share transactions | | |
| Proceeds from sales of shares | 1,038,954,518 | 416,263,032 |
| Reinvestment of distributions | 259,592,182 | 182,255,282 |
| Cost of shares redeemed | (520,108,672) | (186,295,111) |
| Net increase (decrease) in net assets resulting from share transactions | 778,438,028 | 412,223,203 |
| Total increase (decrease) in net assets | 1,104,913,921 | 745,342,852 |
| Net Assets | | |
| Beginning of period | 6,014,479,782 | 5,269,136,930 |
| End of period | $7,119,393,703 | $6,014,479,782 |
| Other Information | | |
| Shares | | |
| Sold | 9,164,163 | 3,860,591 |
| Issued in reinvestment of distributions | 2,283,601 | 1,708,468 |
| Redeemed | (4,783,334) | (1,794,147) |
| Net increase (decrease) | 6,664,430 | 3,774,912 |
See accompanying notes which are an integral part of the financial statements.
Financial Highlights
Fidelity VIP Investment Grade Central Fund
| | | | | | |
| Years ended December 31, | 2020 | 2019 | 2018 | 2017 | 2016 |
| Selected Per–Share Data | | | | | |
| Net asset value, beginning of period | $108.80 | $102.31 | $105.26 | $104.18 | $103.71 |
| Income from Investment Operations | | | | | |
| Net investment income (loss)A | 3.026 | 3.371 | 3.163 | 2.887 | 3.167 |
| Net realized and unrealized gain (loss) | 7.583 | 6.606 | (3.209) | 1.693 | 1.659 |
| Total from investment operations | 10.609 | 9.977 | (.046) | 4.580 | 4.826 |
| Distributions from net investment income | (3.070) | (3.487) | (2.904) | (2.985) | (3.096) |
| Distributions from net realized gain | (1.409) | – | – | (.515) | (1.260) |
| Total distributions | (4.479) | (3.487) | (2.904) | (3.500) | (4.356) |
| Net asset value, end of period | $114.93 | $108.80 | $102.31 | $105.26 | $104.18 |
| Total ReturnB | 9.87% | 9.87% | (.01)% | 4.46% | 4.70% |
| Ratios to Average Net AssetsC,D | | | | | |
| Expenses before reductionsE | -% | -% | -% | -% | -% |
| Expenses net of fee waivers, if anyE | -% | -% | -% | -% | -% |
| Expenses net of all reductionsE | -% | -% | -% | -% | -% |
| Net investment income (loss) | 2.68% | 3.16% | 3.09% | 2.75% | 3.00% |
| Supplemental Data | | | | | |
| Net assets, end of period (000 omitted) | $7,119,394 | $6,014,480 | $5,269,137 | $5,605,082 | $4,865,507 |
| Portfolio turnover rateF | 169% | 146% | 92% | 110% | 162% |
A Calculated based on average shares outstanding during the period.
B Total returns would have been lower if certain expenses had not been reduced during the applicable periods shown.
C Fees and expenses of any underlying mutual funds or exchange-traded funds (ETFs) are not included in the Fund's expense ratio. The Fund indirectly bears its proportionate share of these expenses. For additional expense information related to investments in Fidelity Central Funds, please refer to the "Investments in Fidelity Central Funds" note found in the Notes to Financial Statements section of the most recent Annual or Semi-Annual report.
D Expense ratios reflect operating expenses of the class. Expenses before reductions do not reflect amounts reimbursed, waived, or reduced through arrangements with the investment advisor, brokerage services, or other offset arrangements, if applicable, and do not represent the amount paid by the class during periods when reimbursements, waivers or reductions occur.
E Amount represents less than .005%.
F Amount does not include the portfolio activity of any underlying mutual funds or exchange-traded funds (ETFs).
See accompanying notes which are an integral part of the financial statements.
Notes to Financial Statements
For the period ended December 31, 2020
1. Organization.
Fidelity VIP Investment Grade Central Fund (the Fund) is a fund of Fidelity Garrison Street Trust (the Trust) and is authorized to issue an unlimited number of shares. Shares of the Fund are only offered to other investment companies and accounts managed by Fidelity Management & Research Company LLC (FMR), or its affiliates (the Investing Funds). The Trust is registered under the Investment Company Act of 1940, as amended (the 1940 Act), as an open-end management investment company organized as a Massachusetts business trust.
Effective January 1, 2020:
Investment advisers Fidelity Investments Money Management, Inc., FMR Co., Inc., and Fidelity SelectCo, LLC, merged with and into Fidelity Management & Research Company. In connection with the merger transactions, the resulting, merged investment adviser was then redomiciled from Massachusetts to Delaware, changed its corporate structure from a corporation to a limited liability company, and changed its name to "Fidelity Management & Research Company LLC".
2. Investments in Fidelity Central Funds.
The Fund invests in Fidelity Central Funds, which are open-end investment companies generally available only to other investment companies and accounts managed by the investment adviser and its affiliates. The Fund's Schedule of Investments lists each of the Fidelity Central Funds held as of period end, if any, as an investment of the Fund, but does not include the underlying holdings of each Fidelity Central Fund. As an Investing Fund, the Fund indirectly bears its proportionate share of the expenses of the underlying Fidelity Central Funds.
The Money Market Central Funds seek preservation of capital and current income and are managed by the investment adviser. Annualized expenses of the Money Market Central Funds as of their most recent shareholder report date ranged from less than .005% to .01%.
A complete unaudited list of holdings for each Fidelity Central Fund is available upon request or at the Securities and Exchange Commission (the SEC) website at www.sec.gov. In addition, the financial statements of the Fidelity Central Funds, which are not covered by the Fund's Report of Independent Registered Public Accounting Firm, are available on the SEC website or upon request.
3. Significant Accounting Policies.
The Fund is an investment company and applies the accounting and reporting guidance of the Financial Accounting Standards Board (FASB) Accounting Standards Codification Topic 946 Financial Services - Investment Companies. The financial statements have been prepared in conformity with accounting principles generally accepted in the United States of America (GAAP), which require management to make certain estimates and assumptions at the date of the financial statements. Actual results could differ from those estimates. Subsequent events, if any, through the date that the financial statements were issued have been evaluated in the preparation of the financial statements. The following summarizes the significant accounting policies of the Fund:
Investment Valuation. Investments are valued as of 4:00 p.m. Eastern time on the last calendar day of the period. The Board of Trustees (the Board) has delegated the day to day responsibility for the valuation of the Fund's investments to the Fair Value Committee (the Committee) established by the Fund's investment adviser. In accordance with valuation policies and procedures approved by the Board, the Fund attempts to obtain prices from one or more third party pricing vendors or brokers to value its investments. When current market prices, quotations or currency exchange rates are not readily available or reliable, investments will be fair valued in good faith by the Committee, in accordance with procedures adopted by the Board. Factors used in determining fair value vary by investment type and may include market or investment specific events, changes in interest rates and credit quality. The frequency with which these procedures are used cannot be predicted and they may be utilized to a significant extent. The Committee oversees the Fund's valuation policies and procedures and reports to the Board on the Committee's activities and fair value determinations. The Board monitors the appropriateness of the procedures used in valuing the Fund's investments and ratifies the fair value determinations of the Committee.
The Fund categorizes the inputs to valuation techniques used to value its investments into a disclosure hierarchy consisting of three levels as shown below:
- Level 1 – quoted prices in active markets for identical investments
- Level 2 – other significant observable inputs (including quoted prices for similar investments, interest rates, prepayment speeds, etc.)
- Level 3 – unobservable inputs (including the Fund's own assumptions based on the best information available)
Valuation techniques used to value the Fund's investments by major category are as follows:
Debt securities, including restricted securities, are valued based on evaluated prices received from third party pricing vendors or from brokers who make markets in such securities. Corporate bonds, bank notes, foreign government and government agency obligations, municipal securities, supranational obligations and U.S. government and government agency obligations are valued by pricing vendors who utilize matrix pricing which considers yield or price of bonds of comparable quality, coupon, maturity and type or by broker-supplied prices. Asset backed securities, collateralized mortgage obligations, commercial mortgage securities and U.S. government agency mortgage securities are valued by pricing vendors who utilize matrix pricing which considers prepayment speed assumptions, attributes of the collateral, yield or price of bonds of comparable quality, coupon, maturity and type or by broker-supplied prices. Brokers which make markets in asset backed securities, collateralized mortgage obligations and commercial mortgage securities may also consider such factors as the structure of the issue, cash flow assumptions, the value of underlying assets as well as any guarantees. When independent prices are unavailable or unreliable, debt securities may be valued utilizing pricing methodologies which consider similar factors that would be used by third party pricing vendors. Debt securities are generally categorized as Level 2 in the hierarchy but may be Level 3 depending on the circumstances.
Investments in open-end mutual funds, including the Fidelity Central Funds, are valued at their closing net asset value (NAV) each business day and are categorized as Level 1 in the hierarchy.
Changes in valuation techniques may result in transfers in or out of an assigned level within the disclosure hierarchy. The aggregate value of investments by input level as of December 31, 2020 is included at the end of the Fund's Schedule of Investments.
Investment Transactions and Income. For financial reporting purposes, the Fund's investment holdings and NAV include trades executed through the end of the last business day of the period. The NAV per share for processing shareholder transactions is calculated as of the close of business of the New York Stock Exchange (NYSE), normally 4:00 p.m. Eastern time and includes trades executed through the end of the prior business day. Gains and losses on securities sold are determined on the basis of identified cost and include proceeds received from litigation. Income and capital gain distributions from Fidelity Central Funds, if any, are recorded on the ex-dividend date. Interest income is accrued as earned and includes coupon interest and amortization of premium and accretion of discount on debt securities as applicable. The principal amount on inflation-indexed securities is periodically adjusted to the rate of inflation and interest is accrued based on the principal amount. The adjustments to principal due to inflation are reflected as increases or decreases to Interest in the accompanying Statement of Operations. Debt obligations may be placed on non-accrual status and related interest income may be reduced by ceasing current accruals and writing off interest receivables when the collection of all or a portion of interest has become doubtful based on consistently applied procedures. A debt obligation is removed from non-accrual status when the issuer resumes interest payments or when collectability of interest is reasonably assured.
Expenses. Expenses directly attributable to a fund are charged to that fund. Expenses attributable to more than one fund are allocated among the respective funds on the basis of relative net assets or other appropriate methods. Expense estimates are accrued in the period to which they relate and adjustments are made when actual amounts are known.
Income Tax Information and Distributions to Shareholders. Each year, the Fund intends to qualify as a regulated investment company under Subchapter M of the Internal Revenue Code, including distributing substantially all of its taxable income and realized gains. As a result, no provision for U.S. Federal income taxes is required. As of December 31, 2020, the Fund did not have any unrecognized tax benefits in the financial statements; nor is the Fund aware of any tax positions for which it is reasonably possible that the total amounts of unrecognized tax benefits will significantly change in the next twelve months. The Fund files a U.S. federal tax return, in addition to state and local tax returns as required. The Fund's federal income tax returns are subject to examination by the Internal Revenue Service (IRS) for a period of three fiscal years after they are filed. State and local tax returns may be subject to examination for an additional fiscal year depending on the jurisdiction.
Distributions are declared and recorded daily and paid monthly from net investment income. Distributions from realized gains, if any, are declared and recorded on the ex-dividend date. Income and capital gain distributions are determined in accordance with income tax regulations, which may differ from GAAP.
Capital accounts within the financial statements are adjusted for permanent book-tax differences. These adjustments have no impact on net assets or the results of operations. Capital accounts are not adjusted for temporary book-tax differences which will reverse in a subsequent period.
Book-tax differences are primarily due to market discount, capital loss carryforwards and losses deferred due to wash sales and excise tax regulations.
As of period end, the cost and unrealized appreciation (depreciation) in securities, and derivatives if applicable, for federal income tax purposes were as follows:
| Gross unrealized appreciation | $455,428,005 |
| Gross unrealized depreciation | (38,036,493) |
| Net unrealized appreciation (depreciation) | $417,391,512 |
| Tax Cost | $7,038,714,300 |
The tax-based components of distributable earnings as of period end were as follows:
| Undistributed ordinary income | $67,382 |
| Undistributed long-term capital gain | $126,481,664 |
| Net unrealized appreciation (depreciation) on securities and other investments | $417,391,512 |
The Fund intends to elect to defer to its next fiscal year $3,694,241 of capital losses recognized during the period November 1, 2020 to December 31, 2020.
The tax character of distributions paid was as follows:
| | December 31, 2020 | December 31, 2019 |
| Ordinary Income | $259,592,182 | $ 182,277,023 |
Delayed Delivery Transactions and When-Issued Securities. During the period, certain Funds transacted in securities on a delayed delivery or when-issued basis. Payment and delivery may take place after the customary settlement period for that security. The price of the underlying securities and the date when the securities will be delivered and paid for are fixed at the time the transaction is negotiated. Securities purchased on a delayed delivery or when-issued basis are identified as such in the Schedule of Investments. Compensation for interest forgone in the purchase of a delayed delivery or when-issued debt security may be received. With respect to purchase commitments, each applicable Fund identifies securities as segregated in its records with a value at least equal to the amount of the commitment. Payables and receivables associated with the purchases and sales of delayed delivery securities having the same coupon, settlement date and broker are offset. Delayed delivery or when-issued securities that have been purchased from and sold to different brokers are reflected as both payables and receivables in the Statement of Assets and Liabilities under the caption "Delayed delivery", as applicable. Losses may arise due to changes in the value of the underlying securities or if the counterparty does not perform under the contract's terms, or if the issuer does not issue the securities due to political, economic, or other factors.
To-Be-Announced (TBA) Securities and Mortgage Dollar Rolls. During the period, the Fund transacted in TBA securities that involved buying or selling mortgage-backed securities (MBS) on a forward commitment basis. A TBA transaction typically does not designate the actual security to be delivered and only includes an approximate principal amount; however delivered securities must meet specified terms defined by industry guidelines, including issuer, rate and current principal amount outstanding on underlying mortgage pools. The Fund may enter into a TBA transaction with the intent to take possession of or deliver the underlying MBS, or the Fund may elect to extend the settlement by entering into either a mortgage or reverse mortgage dollar roll. Mortgage dollar rolls are transactions where a fund sells TBA securities and simultaneously agrees to repurchase MBS on a later date at a lower price and with the same counterparty. Reverse mortgage dollar rolls involve the purchase and simultaneous agreement to sell TBA securities on a later date at a lower price. Transactions in mortgage dollar rolls and reverse mortgage dollar rolls are accounted for as purchases and sales and may result in an increase to the Fund's portfolio turnover rate.
Purchases and sales of TBA securities involve risks similar to those discussed above for delayed delivery and when-issued securities. Also, if the counterparty in a mortgage dollar roll or a reverse mortgage dollar roll transaction files for bankruptcy or becomes insolvent, the Fund's right to repurchase or sell securities may be limited. Additionally, when a fund sells TBA securities without already owning or having the right to obtain the deliverable securities (an uncovered forward commitment to sell), it incurs a risk of loss because it could have to purchase the securities at a price that is higher than the price at which it sold them. A fund may be unable to purchase the deliverable securities if the corresponding market is illiquid.
TBA securities subject to a forward commitment to sell at period end are included at the end of the Fund's Schedule of Investments under the caption "TBA Sale Commitments." The proceeds and value of these commitments are reflected in the Fund's Statement of Assets and Liabilities as Receivable for TBA sale commitments and TBA sale commitments, at value, respectively.
Restricted Securities (including Private Placements). The Fund may invest in securities that are subject to legal or contractual restrictions on resale. These securities generally may be resold in transactions exempt from registration or to the public if the securities are registered. Disposal of these securities may involve time-consuming negotiations and expense, and prompt sale at an acceptable price may be difficult. Information regarding restricted securities is included at the end of the Fund's Schedule of Investments.
4. Purchases and Sales of Investments.
Purchases and sales of securities, other than short-term securities and U.S. government securities, are noted in the table below.
| | Purchases ($) | Sales ($) |
| Fidelity VIP Investment Grade Central Fund | 5,253,487,501 | 4,629,429,051 |
5. Fees and Other Transactions with Affiliates.
Management Fee and Expense Contract. Fidelity Management & Research Company LLC (the investment adviser) provides the Fund with investment management services. The Fund does not pay any fees for these services. Pursuant to the Fund's management contract, the investment adviser receives a monthly management fee that represents a portion of the management fees it receives from the Investing Funds. In addition, under an expense contract, the investment adviser also pays all other expenses of the Fund, excluding custody fees, the compensation of the independent Trustees, and certain miscellaneous expenses such as proxy and shareholder meeting expenses.
Interfund Trades. Funds may purchase from or sell securities to other Fidelity Funds under procedures adopted by the Board. The procedures have been designed to ensure these interfund trades are executed in accordance with Rule 17a-7 of the 1940 Act. Interfund trades are included within the respective purchases and sales amounts shown in the Purchases and Sales of Investments note.
6. Security Lending.
Funds lend portfolio securities from time to time in order to earn additional income. Lending agents are used, including National Financial Services (NFS), an affiliate of the investment adviser. Pursuant to a securities lending agreement, NFS will receive a fee, which is capped at 9.9% of a fund's daily lending revenue, for its services as lending agent. A fund may lend securities to certain qualified borrowers, including NFS. On the settlement date of the loan, a fund receives collateral (in the form of U.S. Treasury obligations, letters of credit and/or cash) against the loaned securities and maintains collateral in an amount not less than 100% of the market value of the loaned securities during the period of the loan. The market value of the loaned securities is determined at the close of business of a fund and any additional required collateral is delivered to a fund on the next business day. A fund or borrower may terminate the loan at any time, and if the borrower defaults on its obligation to return the securities loaned because of insolvency or other reasons, a fund may apply collateral received from the borrower against the obligation. A fund may experience delays and costs in recovering the securities loaned. Any cash collateral received is invested in the Fidelity Securities Lending Cash Central Fund. Any loaned securities are identified as such in the Schedule of Investments, and the value of loaned securities and cash collateral at period end, as applicable, are presented in the Statement of Assets and Liabilities. Security lending income represents the income earned on investing cash collateral, less rebates paid to borrowers and any lending agent fees associated with the loan, plus any premium payments received for lending certain types of securities. Security lending income is presented in the Statement of Operations as a component of interest income and as a component of income from Fidelity Central Funds. Affiliated security lending activity, if any, was as follows:
| | Total Security Lending Income Fees Paid to NFS | Security Lending Income From Securities Loaned to NFS | Value of Securities Loaned to NFS at Period End |
| Fidelity VIP Investment Grade Central Fund | $4,044 | $– | $– |
7. Expense Reductions.
Through arrangements with the Fund's custodian, credits realized as a result of certain uninvested cash balances were used to reduce the Fund's expenses by $9,710.
8. Other.
The Fund's organizational documents provide former and current trustees and officers with a limited indemnification against liabilities arising in connection with the performance of their duties to the Fund. In the normal course of business, the Fund may also enter into contracts that provide general indemnifications. The Fund's maximum exposure under these arrangements is unknown as this would be dependent on future claims that may be made against the Fund. The risk of material loss from such claims is considered remote.
At the end of the period, mutual funds managed by FMR or its affiliates were the owners of record of all of the outstanding shares of the Fund according to the following schedule.
| Fund | Ownership % |
| VIP Asset Manager Portfolio | 5.1% |
| VIP Asset Manager: Growth Portfolio | 0.5% |
| VIP Balanced Portfolio | 24.2% |
| VIP Investment Grade Bond Portfolio | 70.2% |
9. Credit Risk.
The Fund invests a portion of its assets in structured securities of issuers backed by commercial and residential mortgage loans, credit card receivables and automotive loans. The value and related income of these securities is sensitive to changes in economic conditions, including delinquencies and/or defaults.
10. Coronavirus (COVID-19) Pandemic.
An outbreak of COVID-19 first detected in China during December 2019 has since spread globally and was declared a pandemic by the World Health Organization during March 2020. Developments that disrupt global economies and financial markets, such as the COVID-19 pandemic, may magnify factors that affect the Fund's performance.
Fidelity® VIP Investment Grade Central Fund
Report of Independent Registered Public Accounting Firm
To the Board of Trustees of Fidelity Garrison Street Trust and Shareholders of VIP Investment Grade Central Fund:
Opinion on the Financial Statements and Financial Highlights
We have audited the accompanying statement of assets and liabilities of VIP Investment Grade Central Fund (the "Fund"), a fund of Fidelity Garrison Street Trust, including the schedule of investments, as of December 31, 2020, the related statement of operations for the year then ended, the statement of changes in net assets for each of the two years in the period then ended, the financial highlights for each of the five years in the period then ended, and the related notes. In our opinion, the financial statements and financial highlights present fairly, in all material respects, the financial position of the Fund as of December 31, 2020, and the results of its operations for the year then ended, the changes in its net assets for each of the two years in the period then ended, and the financial highlights for each of the five years in the period then ended in conformity with accounting principles generally accepted in the United States of America.
Basis for Opinion
These financial statements and financial highlights are the responsibility of the Fund's management. Our responsibility is to express an opinion on the Fund's financial statements and financial highlights based on our audits. We are a public accounting firm registered with the Public Company Accounting Oversight Board (United States) (PCAOB) and are required to be independent with respect to the Fund in accordance with the U.S. federal securities laws and the applicable rules and regulations of the Securities and Exchange Commission and the PCAOB.
We conducted our audits in accordance with the standards of the PCAOB. Those standards require that we plan and perform the audit to obtain reasonable assurance about whether the financial statements and financial highlights are free of material misstatement, whether due to error or fraud. The Fund is not required to have, nor were we engaged to perform, an audit of its internal control over financial reporting. As part of our audits we are required to obtain an understanding of internal control over financial reporting but not for the purpose of expressing an opinion on the effectiveness of the Fund’s internal control over financial reporting. Accordingly, we express no such opinion.
Our audits included performing procedures to assess the risks of material misstatement of the financial statements and financial highlights, whether due to error or fraud, and performing procedures that respond to those risks. Such procedures included examining, on a test basis, evidence regarding the amounts and disclosures in the financial statements and financial highlights. Our audits also included evaluating the accounting principles used and significant estimates made by management, as well as evaluating the overall presentation of the financial statements and financial highlights. Our procedures included confirmation of securities owned as of December 31, 2020, by correspondence with the custodian and brokers; when replies were not received from brokers, we performed other auditing procedures. We believe that our audits provide a reasonable basis for our opinion.
/s/ Deloitte & Touche LLP
Boston, Massachusetts
February 10, 2021
We have served as the auditor of one or more of the Fidelity investment companies since 1999.
Fidelity
® VIP Investment Grade Central Fund
Trustees and Officers
The Trustees, Members of the Advisory Board (if any), and officers of the trust and fund, as applicable, are listed below. The Board of Trustees governs the fund and is responsible for protecting the interests of shareholders. The Trustees are experienced executives who meet periodically throughout the year to oversee the fund's activities, review contractual arrangements with companies that provide services to the fund, oversee management of the risks associated with such activities and contractual arrangements, and review the fund's performance. Each of the Trustees oversees 280 funds.
The Trustees hold office without limit in time except that (a) any Trustee may resign; (b) any Trustee may be removed by written instrument, signed by at least two-thirds of the number of Trustees prior to such removal; (c) any Trustee who requests to be retired or who has become incapacitated by illness or injury may be retired by written instrument signed by a majority of the other Trustees; and (d) any Trustee may be removed at any special meeting of shareholders by a two-thirds vote of the outstanding voting securities of the trust. Each Trustee who is not an interested person (as defined in the 1940 Act) of the trust and the fund is referred to herein as an Independent Trustee. Each Independent Trustee shall retire not later than the last day of the calendar year in which his or her 75th birthday occurs. The Independent Trustees may waive this mandatory retirement age policy with respect to individual Trustees. Officers and Advisory Board Members hold office without limit in time, except that any officer or Advisory Board Member may resign or may be removed by a vote of a majority of the Trustees at any regular meeting or any special meeting of the Trustees. Except as indicated, each individual has held the office shown or other offices in the same company for the past five years.
The fund’s Statement of Additional Information (SAI) includes more information about the Trustees. To request a free copy, call Fidelity at 1-800-544-8544.
Experience, Skills, Attributes, and Qualifications of the Trustees. The Governance and Nominating Committee has adopted a statement of policy that describes the experience, qualifications, attributes, and skills that are necessary and desirable for potential Independent Trustee candidates (Statement of Policy). The Board believes that each Trustee satisfied at the time he or she was initially elected or appointed a Trustee, and continues to satisfy, the standards contemplated by the Statement of Policy. The Governance and Nominating Committee also engages professional search firms to help identify potential Independent Trustee candidates who have the experience, qualifications, attributes, and skills consistent with the Statement of Policy. From time to time, additional criteria based on the composition and skills of the current Independent Trustees, as well as experience or skills that may be appropriate in light of future changes to board composition, business conditions, and regulatory or other developments, have also been considered by the professional search firms and the Governance and Nominating Committee. In addition, the Board takes into account the Trustees' commitment and participation in Board and committee meetings, as well as their leadership of standing and ad hoc committees throughout their tenure.
In determining that a particular Trustee was and continues to be qualified to serve as a Trustee, the Board has considered a variety of criteria, none of which, in isolation, was controlling. The Board believes that, collectively, the Trustees have balanced and diverse experience, qualifications, attributes, and skills, which allow the Board to operate effectively in governing the fund and protecting the interests of shareholders. Information about the specific experience, skills, attributes, and qualifications of each Trustee, which in each case led to the Board's conclusion that the Trustee should serve (or continue to serve) as a trustee of the fund, is provided below.
Board Structure and Oversight Function. Abigail P. Johnson is an interested person and currently serves as Chairman. The Trustees have determined that an interested Chairman is appropriate and benefits shareholders because an interested Chairman has a personal and professional stake in the quality and continuity of services provided to the fund. Independent Trustees exercise their informed business judgment to appoint an individual of their choosing to serve as Chairman, regardless of whether the Trustee happens to be independent or a member of management. The Independent Trustees have determined that they can act independently and effectively without having an Independent Trustee serve as Chairman and that a key structural component for assuring that they are in a position to do so is for the Independent Trustees to constitute a substantial majority for the Board. The Independent Trustees also regularly meet in executive session. Arthur E. Johnson serves as Chairman of the Independent Trustees and as such (i) acts as a liaison between the Independent Trustees and management with respect to matters important to the Independent Trustees and (ii) with management prepares agendas for Board meetings.
Fidelity® funds are overseen by different Boards of Trustees. The fund's Board oversees Fidelity's investment-grade bond, money market, asset allocation and certain equity funds, and other Boards oversee Fidelity's high income and other equity funds. The asset allocation funds may invest in Fidelity® funds that are overseen by such other Boards. The use of separate Boards, each with its own committee structure, allows the Trustees of each group of Fidelity® funds to focus on the unique issues of the funds they oversee, including common research, investment, and operational issues. On occasion, the separate Boards establish joint committees to address issues of overlapping consequences for the Fidelity® funds overseen by each Board.
The Trustees operate using a system of committees to facilitate the timely and efficient consideration of all matters of importance to the Trustees, the fund, and fund shareholders and to facilitate compliance with legal and regulatory requirements and oversight of the fund's activities and associated risks. The Board, acting through its committees, has charged FMR and its affiliates with (i) identifying events or circumstances the occurrence of which could have demonstrably adverse effects on the fund's business and/or reputation; (ii) implementing processes and controls to lessen the possibility that such events or circumstances occur or to mitigate the effects of such events or circumstances if they do occur; and (iii) creating and maintaining a system designed to evaluate continuously business and market conditions in order to facilitate the identification and implementation processes described in (i) and (ii) above. Because the day-to-day operations and activities of the fund are carried out by or through FMR, its affiliates, and other service providers, the fund's exposure to risks is mitigated but not eliminated by the processes overseen by the Trustees. While each of the Board's committees has responsibility for overseeing different aspects of the fund's activities, oversight is exercised primarily through the Operations and Audit Committees. In addition, an ad hoc Board committee of Independent Trustees has worked with FMR to enhance the Board's oversight of investment and financial risks, legal and regulatory risks, technology risks, and operational risks, including the development of additional risk reporting to the Board. Appropriate personnel, including but not limited to the fund's Chief Compliance Officer (CCO), FMR's internal auditor, the independent accountants, the fund's Treasurer and portfolio management personnel, make periodic reports to the Board's committees, as appropriate, including an annual review of Fidelity's risk management program for the Fidelity® funds. The responsibilities of each standing committee, including their oversight responsibilities, are described further under "Standing Committees of the Trustees."
Interested Trustees*:
Correspondence intended for a Trustee who is an interested person may be sent to Fidelity Investments, 245 Summer Street, Boston, Massachusetts 02210.
Name, Year of Birth; Principal Occupations and Other Relevant Experience+
Abigail P. Johnson (1961)
Year of Election or Appointment: 2009
Trustee
Chairman of the Board of Trustees
Ms. Johnson also serves as Trustee of other Fidelity® funds. Ms. Johnson serves as Chairman (2016-present), Chief Executive Officer (2014-present), and Director (2007-present) of FMR LLC (diversified financial services company), President of Fidelity Financial Services (2012-present) and President of Personal, Workplace and Institutional Services (2005-present). Ms. Johnson is Chairman and Director of Fidelity Management & Research Company LLC (investment adviser firm, 2011-present). Previously, Ms. Johnson served as Chairman and Director of FMR Co., Inc. (investment adviser firm, 2011-2019), Vice Chairman (2007-2016) and President (2013-2016) of FMR LLC, President and a Director of Fidelity Management & Research Company (2001-2005), a Trustee of other investment companies advised by Fidelity Management & Research Company, Fidelity Investments Money Management, Inc. (investment adviser firm), and FMR Co., Inc. (2001-2005), Senior Vice President of the Fidelity® funds (2001-2005), and managed a number of Fidelity® funds. Ms. Abigail P. Johnson and Mr. Arthur E. Johnson are not related.
Jennifer Toolin McAuliffe (1959)
Year of Election or Appointment: 2016
Trustee
Ms. McAuliffe also serves as Trustee of other Fidelity® funds. Previously, Ms. McAuliffe served as Co-Head of Fixed Income of Fidelity Investments Limited (now known as FIL Limited (FIL)) (diversified financial services company), Director of Research for FIL’s credit and quantitative teams in London, Hong Kong and Tokyo and Director of Research for taxable and municipal bonds at Fidelity Investments Money Management, Inc. Ms. McAuliffe previously served as a member of the Advisory Board of certain Fidelity® funds (2016). Ms. McAuliffe was previously a lawyer at Ropes & Gray LLP and currently serves as director or trustee of several not-for-profit entities.
* Determined to be an “Interested Trustee” by virtue of, among other things, his or her affiliation with the trust or various entities under common control with FMR.
+ The information includes the Trustee's principal occupation during the last five years and other information relating to the experience, attributes, and skills relevant to the Trustee's qualifications to serve as a Trustee, which led to the conclusion that the Trustee should serve as a Trustee for the fund.
Independent Trustees:
Correspondence intended for an Independent Trustee may be sent to Fidelity Investments, P.O. Box 55235, Boston, Massachusetts 02205-5235.
Name, Year of Birth; Principal Occupations and Other Relevant Experience+
Elizabeth S. Acton (1951)
Year of Election or Appointment: 2013
Trustee
Ms. Acton also serves as Trustee of other Fidelity® funds. Prior to her retirement, Ms. Acton served as Executive Vice President, Finance (2011-2012), Executive Vice President, Chief Financial Officer (2002-2011) and Treasurer (2004-2005) of Comerica Incorporated (financial services). Prior to joining Comerica, Ms. Acton held a variety of positions at Ford Motor Company (1983-2002), including Vice President and Treasurer (2000-2002) and Executive Vice President and Chief Financial Officer of Ford Motor Credit Company (1998-2000). Ms. Acton currently serves as a member of the Board and Audit and Finance Committees of Beazer Homes USA, Inc. (homebuilding, 2012-present). Ms. Acton previously served as a member of the Advisory Board of certain Fidelity® funds (2013-2016).
Ann E. Dunwoody (1953)
Year of Election or Appointment: 2018
Trustee
General Dunwoody also serves as Trustee of other Fidelity® funds. General Dunwoody (United States Army, Retired) was the first woman in U.S. military history to achieve the rank of four-star general and prior to her retirement in 2012 held a variety of positions within the U.S. Army, including Commanding General, U.S. Army Material Command (2008-2012). General Dunwoody currently serves as President of First to Four LLC (leadership and mentoring services, 2012-present), a member of the Board and Nomination and Corporate Governance Committees of Kforce Inc. (professional staffing services, 2016-present) and a member of the Board of Automattic Inc. (software engineering, 2018-present). Previously, General Dunwoody served as a member of the Advisory Board and Nominating and Corporate Governance Committee of L3 Technologies, Inc. (communication, electronic, sensor and aerospace systems, 2013-2019) and a member of the Board and Audit and Sustainability and Corporate Responsibility Committees of Republic Services, Inc. (waste collection, disposal and recycling, 2013-2016). Ms. Dunwoody also serves on several boards for non-profit organizations, including as a member of the Board, Chair of the Nomination and Governance Committee and a member of the Audit Committee of Logistics Management Institute (consulting non-profit, 2012-present), a member of the Council of Trustees for the Association of the United States Army (advocacy non-profit, 2013-present), a member of the Board of Florida Institute of Technology (2015-present) and a member of the Board of ThanksUSA (military family education non-profit, 2014-present). General Dunwoody previously served as a member of the Advisory Board of certain Fidelity® funds (2018).
John Engler (1948)
Year of Election or Appointment: 2014
Trustee
Mr. Engler also serves as Trustee of other Fidelity® funds. Previously, Mr. Engler served as Governor of Michigan (1991-2003), President of the Business Roundtable (2011-2017) and interim President of Michigan State University (2018-2019). Mr. Engler currently serves as a member of the Board of K12 Inc. (technology-based education company, 2012-present). Previously, Mr. Engler served as a member of the Board of Universal Forest Products (manufacturer and distributor of wood and wood-alternative products, 2003-2019) and Trustee of The Munder Funds (2003-2014). Mr. Engler previously served as a member of the Advisory Board of certain Fidelity® funds (2014-2016).
Robert F. Gartland (1951)
Year of Election or Appointment: 2010
Trustee
Mr. Gartland also serves as Trustee of other Fidelity® funds. Prior to his retirement, Mr. Gartland held a variety of positions at Morgan Stanley (financial services, 1979-2007), including Managing Director (1987-2007) and Chase Manhattan Bank (1975-1978). Mr. Gartland previously served as Chairman and an investor in Gartland & Mellina Group Corp. (consulting, 2009-2019), as a member of the Board of National Securities Clearing Corporation (1993-1996) and as Chairman of TradeWeb (2003-2004).
Arthur E. Johnson (1947)
Year of Election or Appointment: 2008
Trustee
Chairman of the Independent Trustees
Mr. Johnson also serves as Trustee of other Fidelity® funds. Prior to his retirement, Mr. Johnson served as Senior Vice President of Corporate Strategic Development of Lockheed Martin Corporation (defense contractor, 1999-2009). Mr. Johnson currently serves as a member of the Board of Booz Allen Hamilton (management consulting, 2011-present). Mr. Johnson previously served as a member of the Board of Eaton Corporation plc (diversified power management, 2009-2019) and a member of the Board of AGL Resources, Inc. (holding company, 2002-2016). Mr. Johnson previously served as Vice Chairman (2015-2018) of the Independent Trustees of certain Fidelity® funds. Mr. Arthur E. Johnson is not related to Ms. Abigail P. Johnson.
Michael E. Kenneally (1954)
Year of Election or Appointment: 2009
Trustee
Vice Chairman of the Independent Trustees
Mr. Kenneally also serves as Trustee of other Fidelity® funds. Prior to his retirement, Mr. Kenneally served as Chairman and Global Chief Executive Officer of Credit Suisse Asset Management and Executive Vice President and Chief Investment Officer of Bank of America Corporation. Earlier roles at Bank of America included Director of Research, Senior Portfolio Manager for various institutional equity accounts and mutual funds and Portfolio Manager for a number of institutional fixed-income clients. Mr. Kenneally began his career as a Research Analyst in 1983 and was awarded the Chartered Financial Analyst (CFA) designation in 1991.
Marie L. Knowles (1946)
Year of Election or Appointment: 2001
Trustee
Ms. Knowles also serves as Trustee of other Fidelity® funds. Prior to her retirement, Ms. Knowles held several positions at Atlantic Richfield Company (diversified energy), including Executive Vice President and Chief Financial Officer (1996-2000), Senior Vice President (1993-1996) and President of ARCO Transportation Company (pipeline and tanker operations, 1993-1996). Ms. Knowles currently serves as a member of the Board of McKesson Corporation (healthcare service, since 2002), a member of the Board of the Santa Catalina Island Company (real estate, 2009-present), a member of the Investment Company Institute Board of Governors and a member of the Governing Council of the Independent Directors Council (2014-present). Ms. Knowles also serves as a member of the Advisory Board for the School of Engineering of the University of Southern California. Ms. Knowles previously served as Chairman (2015-2018) and Vice Chairman (2012-2015) of the Independent Trustees of certain Fidelity® funds.
Mark A. Murray (1954)
Year of Election or Appointment: 2016
Trustee
Mr. Murray also serves as Trustee of other Fidelity® funds. Previously, Mr. Murray served as Co-Chief Executive Officer (2013-2016), President (2006-2013) and Vice Chairman (2013-2020) of Meijer, Inc. Mr. Murray serves as a member of the Board and Nuclear Review and Public Policy and Responsibility Committees of DTE Energy Company (diversified energy company, 2009-present) and a member of the Board and Audit Committee and Chairman of the Nominating and Corporate Governance Committee of Universal Forest Products, Inc. (manufacturer and distributor of wood and wood-alternative products, 2004-2016). Mr. Murray previously served as a member of the Board of Spectrum Health (not-for-profit health system, 2015-2019). Mr. Murray also serves as a member of the Board of many community and professional organizations. Mr. Murray previously served as a member of the Advisory Board of certain Fidelity® funds (2016).
+ The information includes the Trustee's principal occupation during the last five years and other information relating to the experience, attributes, and skills relevant to the Trustee's qualifications to serve as a Trustee, which led to the conclusion that the Trustee should serve as a Trustee for the fund.
Advisory Board Members and Officers:
Correspondence intended for an officer may be sent to Fidelity Investments, 245 Summer Street, Boston, Massachusetts 02210. Officers appear below in alphabetical order.
Name, Year of Birth; Principal Occupation
Craig S. Brown (1977)
Year of Election or Appointment: 2019
Assistant Treasurer
Mr. Brown also serves as Assistant Treasurer of other funds. Mr. Brown is an employee of Fidelity Investments (2013-present).
John J. Burke III (1964)
Year of Election or Appointment: 2018
Chief Financial Officer
Mr. Burke also serves as Chief Financial Officer of other funds. Mr. Burke serves as Head of Investment Operations for Fidelity Fund and Investment Operations (2018-present) and is an employee of Fidelity Investments (1998-present). Previously Mr. Burke served as head of Asset Management Investment Operations (2012-2018).
David J. Carter (1973)
Year of Election or Appointment: 2020
Assistant Secretary
Mr. Carter also serves as Assistant Secretary of other funds. Mr. Carter serves as Vice President, Associate General Counsel (2010-present) and is an employee of Fidelity Investments (2005-present).
Jonathan Davis (1968)
Year of Election or Appointment: 2010
Assistant Treasurer
Mr. Davis also serves as Assistant Treasurer of other funds. Mr. Davis serves as Assistant Treasurer of FMR Capital, Inc. (2017-present) and is an employee of Fidelity Investments. Previously, Mr. Davis served as Vice President and Associate General Counsel of FMR LLC (diversified financial services company, 2003-2010).
Laura M. Del Prato (1964)
Year of Election or Appointment: 2018
President and Treasurer
Ms. Del Prato also serves as an officer of other funds. Ms. Del Prato is an employee of Fidelity Investments (2017-present). Previously, Ms. Del Prato served as President and Treasurer of The North Carolina Capital Management Trust: Cash Portfolio and Term Portfolio (2018-2020). Prior to joining Fidelity Investments, Ms. Del Prato served as a Managing Director and Treasurer of the JPMorgan Mutual Funds (2014-2017). Prior to JPMorgan, Ms. Del Prato served as a partner at Cohen Fund Audit Services (accounting firm, 2012-2013) and KPMG LLP (accounting firm, 2004-2012).
Colm A. Hogan (1973)
Year of Election or Appointment: 2016
Assistant Treasurer
Mr. Hogan also serves as an officer of other funds. Mr. Hogan serves as Assistant Treasurer of FMR Capital, Inc. (2017-present) and is an employee of Fidelity Investments (2005-present). Previously, Mr. Hogan served as Deputy Treasurer of certain Fidelity® funds (2016-2020) and Assistant Treasurer of certain Fidelity® funds (2016-2018).
Cynthia Lo Bessette (1969)
Year of Election or Appointment: 2019
Secretary and Chief Legal Officer (CLO)
Ms. Lo Bessette also serves as an officer of other funds. Ms. Lo Bessette serves as CLO, Secretary, and Senior Vice President of Fidelity Management & Research Company LLC (investment adviser firm, 2019-present); and CLO of Fidelity Management & Research (Hong Kong) Limited, FMR Investment Management (UK) Limited, and Fidelity Management & Research (Japan) Limited (investment adviser firms, 2019-present). She is a Senior Vice President and Deputy General Counsel of FMR LLC (diversified financial services company, 2019-present), and is an employee of Fidelity Investments. Previously, Ms. Lo Bessette served as CLO, Secretary, and Senior Vice President of FMR Co., Inc. (investment adviser firm, 2019); Secretary of Fidelity SelectCo, LLC and Fidelity Investments Money Management, Inc. (investment adviser firms, 2019). Prior to joining Fidelity Investments, Ms. Lo Bessette was Executive Vice President, General Counsel (2016-2019) and Senior Vice President, Deputy General Counsel (2015-2016) of OppenheimerFunds (investment management company) and Deputy Chief Legal Officer (2013-2015) of Jennison Associates LLC (investment adviser firm).
Chris Maher (1972)
Year of Election or Appointment: 2013
Assistant Treasurer
Mr. Maher also serves as an officer of other funds. Mr. Maher serves as Assistant Treasurer of FMR Capital, Inc. (2017-present), and is an employee of Fidelity Investments (2008-present). Previously, Mr. Maher served as Assistant Treasurer of certain funds (2013-2020); Vice President of Asset Management Compliance (2013), Vice President of the Program Management Group of FMR (investment adviser firm, 2010-2013), and Vice President of Valuation Oversight (2008-2010).
Jamie Pagliocco (1964)
Year of Election or Appointment: 2020
Vice President
Mr. Pagliocco also serves as Vice President of other funds. Mr. Pagliocco serves as President of Fixed Income (2020-present), and is an employee of Fidelity Investments (2001-present). Previously, Mr. Pagliocco served as Co-Chief Investment Officer – Bond (2017-2020), Global Head of Bond Trading (2016-2019), and as a portfolio manager.
Kenneth B. Robins (1969)
Year of Election or Appointment: 2020
Chief Compliance Officer
Mr. Robins also serves as an officer of other funds. Mr. Robins serves as Compliance Officer of Fidelity Management & Research Company LLC (investment adviser firm, 2016-present) and is an employee of Fidelity Investments (2004-present). Previously, Mr. Robins served as Compliance Officer of FMR Co., Inc. (investment adviser firm, 2016-2019), as Executive Vice President of Fidelity Investments Money Management, Inc. (investment adviser firm, 2013-2016) and served in other fund officer roles.
Brett Segaloff (1972)
Year of Election or Appointment: 2021
Anti-Money Laundering (AML) Officer
Mr. Segaloff also serves as an AML Officer of other funds and other related entities. He is Director, Anti-Money Laundering (2007-present) of FMR LLC (diversified financial services company) and is an employee of Fidelity Investments (1996-present).
Stacie M. Smith (1974)
Year of Election or Appointment: 2013
Assistant Treasurer
Ms. Smith also serves as an officer of other funds. Ms. Smith serves as Assistant Treasurer of FMR Capital, Inc. (2017-present), is an employee of Fidelity Investments (2009-present), and has served in other fund officer roles. Prior to joining Fidelity Investments, Ms. Smith served as Senior Audit Manager of Ernst & Young LLP (accounting firm, 1996-2009). Previously, Ms. Smith served as Assistant Treasurer (2013-2019) and Deputy Treasurer (2013-2016) of certain Fidelity® funds.
Marc L. Spector (1972)
Year of Election or Appointment: 2016
Deputy Treasurer
Mr. Spector also serves as an officer of other funds. Mr. Spector serves as Assistant Treasurer of FMR Capital, Inc. (2017-present) and is an employee of Fidelity Investments (2016-present). Prior to joining Fidelity Investments, Mr. Spector served as Director at the Siegfried Group (accounting firm, 2013-2016), and prior to Siegfried Group as audit senior manager at Deloitte & Touche LLP (accounting firm, 2005-2013).
Jim Wegmann (1979)
Year of Election or Appointment: 2019
Assistant Treasurer
Mr. Wegmann also serves as Assistant Treasurer of other funds. Mr. Wegmann is an employee of Fidelity Investments (2011-present).
Fidelity® VIP Investment Grade Central Fund
Shareholder Expense Example
As a shareholder, you incur two types of costs: (1) transaction costs, which may include sales charges (loads) on purchase payments or redemption proceeds, as applicable and (2) ongoing costs, which generally include management fees, distribution and/or service (12b-1) fees and other Fund expenses. This Example is intended to help you understand your ongoing costs (in dollars) of investing in a fund and to compare these costs with the ongoing costs of investing in other mutual funds.
The Example is based on an investment of $1,000 invested at the beginning of the period and held for the entire period (July 1, 2020 to December 31, 2020).
Actual Expenses
The first line of the accompanying table provides information about actual account values and actual expenses. You may use the information in this line, together with the amount you invested, to estimate the expenses that you paid over the period. Simply divide your account value by $1,000.00 (for example, an $8,600 account value divided by $1,000.00 = 8.6), then multiply the result by the number in the first line for a class/Fund under the heading entitled "Expenses Paid During Period" to estimate the expenses you paid on your account during this period. If any fund is a shareholder of any underlying mutual funds or exchange-traded funds (ETFs) (the Underlying Funds), such fund indirectly bears its proportional share of the expenses of the Underlying Funds in addition to the direct expenses incurred presented in the table. These fees and expenses are not included in the annualized expense ratio used to calculate the expense estimate in the table below.
Hypothetical Example for Comparison Purposes
The second line of the accompanying table provides information about hypothetical account values and hypothetical expenses based on the actual expense ratio and an assumed rate of return of 5% per year before expenses, which is not the actual return. The hypothetical account values and expenses may not be used to estimate the actual ending account balance or expenses you paid for the period. You may use this information to compare the ongoing costs of investing in the Fund and other funds. To do so, compare this 5% hypothetical example with the 5% hypothetical examples that appear in the shareholder reports of the other funds. If any fund is a shareholder of any Underlying Funds, such fund indirectly bears its proportional share of the expenses of the Underlying Funds in addition to the direct expenses as presented in the table. These fees and expenses are not included in the annualized expense ratio used to calculate the expense estimate in the table below.
Please note that the expenses shown in the table are meant to highlight your ongoing costs only and do not reflect any transaction costs. Therefore, the second line of the table is useful in comparing ongoing costs only, and will not help you determine the relative total costs of owning different funds.
| | Annualized Expense Ratio-A | Beginning
Account Value
July 1, 2020 | Ending
Account Value
December 31, 2020 | Expenses Paid
During Period-B
July 1, 2020
to December 31, 2020 |
| Fidelity VIP Investment Grade Central Fund | .0016% | | | |
| Actual | | $1,000.00 | $1,032.50 | $.01 |
| Hypothetical-C | | $1,000.00 | $1,025.13 | $.01 |
A Annualized expense ratio reflects expenses net of applicable fee waivers.
B Expenses are equal to the annualized expense ratio, multiplied by the average account value over the period, multiplied by 184/ 366 (to reflect the one-half year period). The fees and expenses of any Underlying Funds are not included in each annualized expense ratio.
C 5% return per year before expenses
Fidelity
® VIP Investment Grade Central Fund
Distributions (Unaudited)
The Board of Trustees of Fidelity VIP Investment Grade Central Fund voted to pay on February 5, 2021, to shareholders of record at the opening of business on February 5, 2021, a distribution of $1.974 per share derived from capital gains realized from sales of portfolio securities.
The fund hereby designates as a capital gain dividend with respect to the taxable year ended December 31, 2020, $126,481,664, or, if subsequently determined to be different, the net capital gain of such year.
A total of 10.31% of the dividends distributed during the fiscal year was derived from interest on U.S. Government securities which is generally exempt from state income tax.
Board Approval of Investment Advisory Contracts and Management Fees
VIP Investment Grade Central Fund
Each year, the Board of Trustees, including the Independent Trustees (together, the Board), votes on the renewal of the management contract with Fidelity Management & Research Company LLC (FMR) and the sub-advisory agreements (together, the Advisory Contracts) for the fund. FMR and the sub-advisers are referred to herein as the Investment Advisers. The Board, assisted by the advice of fund counsel and Independent Trustees' counsel, requests and considers a broad range of information relevant to the renewal of the Advisory Contracts throughout the year.
The Board meets regularly and, at each of its meetings, covers an extensive agenda of topics and materials and considers factors that are relevant to its annual consideration of the renewal of the fund's Advisory Contracts, including the services and support provided to the fund and its shareholders. The Board has established four standing committees (Committees) — Operations, Audit, Fair Valuation, and Governance and Nominating — each composed of and chaired by Independent Trustees with varying backgrounds, to which the Board has assigned specific subject matter responsibilities in order to enhance effective decision-making by the Board. The Operations Committee, of which all of the Independent Trustees are members, meets regularly throughout the year and considers, among other matters, information specifically related to the annual consideration of the renewal of the fund's Advisory Contracts. The Board, acting directly and through its Committees, requests and receives information concerning the annual consideration of the renewal of the fund's Advisory Contracts. The Board also meets as needed to review matters specifically related to the Board's annual consideration of the renewal of the Advisory Contracts. Members of the Board may also meet with trustees of other Fidelity funds through joint ad hoc committees to discuss certain matters relevant to all of the Fidelity funds.
At its September 2020 meeting, the Board unanimously determined to renew the fund's Advisory Contracts. In reaching its determination, the Board considered all factors it believed relevant and reached a determination, with the assistance of fund counsel and Independent Trustees' counsel and through the exercise of its business judgment, that the renewal of the Advisory Contracts was in the best interests of the fund and its shareholders and the fact that no fee is payable under the management contract was fair and reasonable.
Nature, Extent, and Quality of Services Provided. The Board considered Fidelity's staffing as it relates to the fund, including the backgrounds of investment personnel of Fidelity, and also considered the fund's investment objective, strategies, and related investment philosophy. The Independent Trustees also had discussions with senior management of Fidelity's investment operations and investment groups. The Board considered the structure of the investment personnel compensation program and whether this structure provides appropriate incentives to act in the best interests of the fund.
Resources Dedicated to Investment Management and Support Services. The Board reviewed the general qualifications and capabilities of Fidelity's investment staff, including its size, education, experience, and resources, as well as Fidelity's approach to recruiting, managing, and compensating investment personnel. The Board noted that Fidelity has continued to increase the resources devoted to non-U.S. offices, including expansion of Fidelity's global investment organization. The Board also noted that Fidelity's analysts have extensive resources, tools and capabilities that allow them to conduct sophisticated quantitative and fundamental analysis, as well as credit analysis of issuers, counterparties and guarantors. Further, the Board considered that Fidelity's investment professionals have sufficient access to global information and data so as to provide competitive investment results over time, and that those professionals also have access to sophisticated tools that permit them to assess portfolio construction and risk and performance attribution characteristics continuously, as well as to transmit new information and research conclusions rapidly around the world. Additionally, in its deliberations, the Board considered Fidelity's trading, risk management, compliance, and technology and operations capabilities and resources, which are integral parts of the investment management process. The Board also considered Fidelity's investments in business continuity planning, and its success in continuously providing services to the fund notwithstanding the severe disruptions caused by the COVID-19 pandemic.
Administrative Services. The Board considered (i) the nature, extent, quality, and cost of advisory and administrative services performed by the Investment Advisers and their affiliates under the Advisory Contracts and under separate agreements covering transfer agency, pricing and bookkeeping, and securities lending services for the fund; (ii) the nature and extent of the supervision of third party service providers, principally custodians, subcustodians, and pricing vendors; and (iii) the resources devoted to, and the record of compliance with, the fund's compliance policies and procedures.
Investment Performance. The Board considered whether the fund has operated in accordance with its investment objective, as well as its record of compliance with its investment restrictions. The Board reviewed the fund's absolute investment performance, as well as the fund's relative investment performance. In this regard, the Board noted that the fund is designed to offer a liquid investment option for other Fidelity funds and accounts and ultimately to enhance the performance of those funds and accounts.
Based on its review, the Board concluded that the nature, extent, and quality of services provided to the fund under the Advisory Contracts should continue to benefit the shareholders of the fund.
Competitiveness of Management Fee and Total Expense Ratio The Board considered that while the fund does not pay a management fee, FMR receives fees for providing services to funds that invest in the fund. The Board also noted that FMR bears all expenses of the fund with certain limited exceptions (i.e., custody fees, interest, taxes, fees and expenses of the Independent Trustees, proxy and shareholder meeting expenses, and extraordinary expenses). The Board further noted that the fund pays its non-operating expenses, including brokerage commissions and fees and expenses associated with the fund's securities lending program, if applicable. Based on its review, the Board concluded that the management fee received for providing services to the fund and the fund's total expense ratio were reasonable in light of the services that the fund and its shareholders receive and the other factors considered.
Costs of the Services and Profitability. The Board considered the level of Fidelity's profits in respect of all the Fidelity funds, as well as the profitability of the funds that invest in the fund.
A public accounting firm has been engaged annually by the Board as part of the Board's assessment of Fidelity's profitability analysis. The engagement includes the review and assessment of the methodologies used by Fidelity in determining the revenues and expenses attributable to Fidelity's mutual fund business, and completion of agreed-upon procedures in respect of the mathematical accuracy of certain fund profitability information and its conformity to established allocation methodologies. After considering the reports issued under the engagement and information provided by Fidelity, the Board concluded that while other allocation methods may also be reasonable, Fidelity's profitability methodologies are reasonable in all material respects.
The Board also reviewed Fidelity's non-fund businesses and potential indirect benefits such businesses may have received as a result of their association with Fidelity's mutual fund business (i.e., fall-out benefits) as well as cases where Fidelity's affiliates may benefit from the funds' business. The Board considered areas where potential indirect benefits to the Fidelity funds from their relationships with Fidelity may exist. The Board also considered that in 2019 a joint ad hoc committee created by it and the boards of other Fidelity funds evaluated potential fall-out benefits (PFOB Committee). The Board noted that it considered the PFOB Committee's findings in connection with its consideration of the renewal of the Advisory Contracts.
The Board concluded that the costs of the services provided by and the profits realized by Fidelity in connection with the operation of the fund were not relevant to the renewal of the Advisory Contracts because the fund pays no advisory fees and FMR bears all expenses of the fund with certain limited exceptions.
Economies of Scale. The Board concluded that because the fund pays no advisory fees and FMR bears all expenses of the fund with certain limited exceptions, the realization of economies of scale was not a material factor in the Board's decision to renew the fund's Advisory Contract.
Additional Information Requested by the Board. In order to develop fully the factual basis for consideration of the Fidelity funds' advisory contracts, the Board requested and received additional information on certain topics, including: (i) Fidelity's fund profitability methodology, profitability trends for certain funds, the allocation of various costs to different funds, and the impact of certain factors on fund profitability results; (ii) portfolio manager changes that have occurred during the past year and the amount of the investment that each portfolio manager has made in the Fidelity fund(s) that he or she manages; (iii) Fidelity's compensation structure for portfolio managers, research analysts, and other key personnel, including its effects on fund profitability, the rationale for the compensation structure, and the extent to which current market conditions have affected retention and recruitment; (iv) the arrangements with and compensation paid to certain fund sub-advisers on behalf of the Fidelity funds and the treatment of such compensation within Fidelity's fund profitability methodology; (v) the terms of the funds' various management fee structures, including the basic group fee and the terms of Fidelity's voluntary expense limitation agreements; (vi) Fidelity's transfer agent fee, expense, and service structures for different funds and classes relative to competitive trends; (vii) the impact on fund profitability of recent industry trends, such as the growth in passively managed funds and outflows from actively managed equity funds; and (viii) explanations regarding the relative total expense ratios of certain funds and classes, total expense competitive trends and methodologies for total expense competitive comparisons, and actions that might be taken by Fidelity to reduce total expense ratios for certain classes. In addition, the Board considered its discussions with Fidelity regarding Fidelity's efforts to maintain the continuous investment and shareholder services necessary for the funds during the current pandemic and economic circumstances.
Based on its evaluation of all of the conclusions noted above, and after considering all factors it believed relevant, the Board concluded that the advisory fee arrangements are fair and reasonable, and that the fund's Advisory Contracts should be renewed.
VIPIGB-ANN-0221
1.540025.123
Fidelity® Variable Insurance Products:
Asset Manager Portfolio
Annual Report
December 31, 2020
Contents
To view a fund's proxy voting guidelines and proxy voting record for the 12-month period ended June 30, visit http://www.fidelity.com/proxyvotingresults or visit the Securities and Exchange Commission's (SEC) web site at http://www.sec.gov.
You may also call 1-877-208-0098 to request a free copy of the proxy voting guidelines.
Fidelity® Variable Insurance Products are separate account options which are purchased through a variable insurance contract.
Standard & Poor's, S&P and S&P 500 are registered service marks of The McGraw-Hill Companies, Inc. and have been licensed for use by Fidelity Distributors Corporation.
Other third-party marks appearing herein are the property of their respective owners.
All other marks appearing herein are registered or unregistered trademarks or service marks of FMR LLC or an affiliated company. © 2021 FMR LLC. All rights reserved.
This report and the financial statements contained herein are submitted for the general information of the shareholders of the Fund. This report is not authorized for distribution to prospective investors in the Fund unless preceded or accompanied by an effective prospectus.
A fund files its complete schedule of portfolio holdings with the SEC for the first and third quarters of each fiscal year on Form N-PORT. Forms N-PORT are available on the SEC’s web site at http://www.sec.gov. A fund's Forms N-PORT may be reviewed and copied at the SEC’s Public Reference Room in Washington, DC. Information regarding the operation of the SEC's Public Reference Room may be obtained by calling 1-800-SEC-0330.
For a complete list of a fund's portfolio holdings, view the most recent holdings listing, semiannual report, or annual report on Fidelity's web site at http://www.fidelity.com, http://www.institutional.fidelity.com, or http://www.401k.com, as applicable.
NOT FDIC INSURED •MAY LOSE VALUE •NO BANK GUARANTEE
Neither the Fund nor Fidelity Distributors Corporation is a bank.
Note to Shareholders:
Early in 2020, the outbreak and spread of a new coronavirus emerged as a public health emergency that had a major influence on financial markets, primarily based on its impact on the global economy and the outlook for corporate earnings. The virus causes a respiratory disease known as COVID-19. On March 11, the World Health Organization declared the COVID-19 outbreak a pandemic, citing sustained risk of further global spread.
In the weeks following, as the crisis worsened, we witnessed an escalating human tragedy with wide-scale social and economic consequences from coronavirus-containment measures. The outbreak of COVID-19 prompted a number of measures to limit the spread, including travel and border restrictions, quarantines, and restrictions on large gatherings. In turn, these resulted in lower consumer activity, diminished demand for a wide range of products and services, disruption in manufacturing and supply chains, and – given the wide variability in outcomes regarding the outbreak – significant market uncertainty and volatility. Amid the turmoil, global governments and central banks took unprecedented action to help support consumers, businesses, and the broader economies, and to limit disruption to financial systems.
The situation continues to unfold, and the extent and duration of its impact on financial markets and the economy remain highly uncertain. Extreme events such as the coronavirus crisis are “exogenous shocks” that can have significant adverse effects on mutual funds and their investments. Although multiple asset classes may be affected by market disruption, the duration and impact may not be the same for all types of assets.
Fidelity is committed to helping you stay informed amid news about COVID-19 and during increased market volatility, and we’re taking extra steps to be responsive to customer needs. We encourage you to visit our websites, where we offer ongoing updates, commentary, and analysis on the markets and our funds.
Performance: The Bottom Line
Average annual total return reflects the change in the value of an investment, assuming reinvestment of distributions from dividend income and capital gains (the profits earned upon the sale of securities that have grown in value, if any) and assuming a constant rate of performance each year. During periods of reimbursement by Fidelity, a fund’s total return will be greater than it would be had the reimbursement not occurred. Performance numbers are net of all underlying fund operating expenses, but do not include any insurance charges imposed by your insurance company’s separate account. If performance information included the effect of these additional charges, the total returns would have been lower. How a fund did yesterday is no guarantee of how it will do tomorrow.
Average Annual Total Returns
| For the periods ended December 31, 2020 | Past 1 year | Past 5 years | Past 10 years |
| Initial Class | 14.87% | 8.62% | 7.35% |
| Service Class | 14.74% | 8.51% | 7.23% |
| Service Class 2 | 14.54% | 8.34% | 7.07% |
| Investor Class | 14.77% | 8.53% | 7.26% |
$10,000 Over 10 Years
Let's say hypothetically that $10,000 was invested in VIP Asset Manager Portfolio - Initial Class on December 31, 2010.
The chart shows how the value of your investment would have changed, and also shows how the S&P 500® Index performed over the same period.
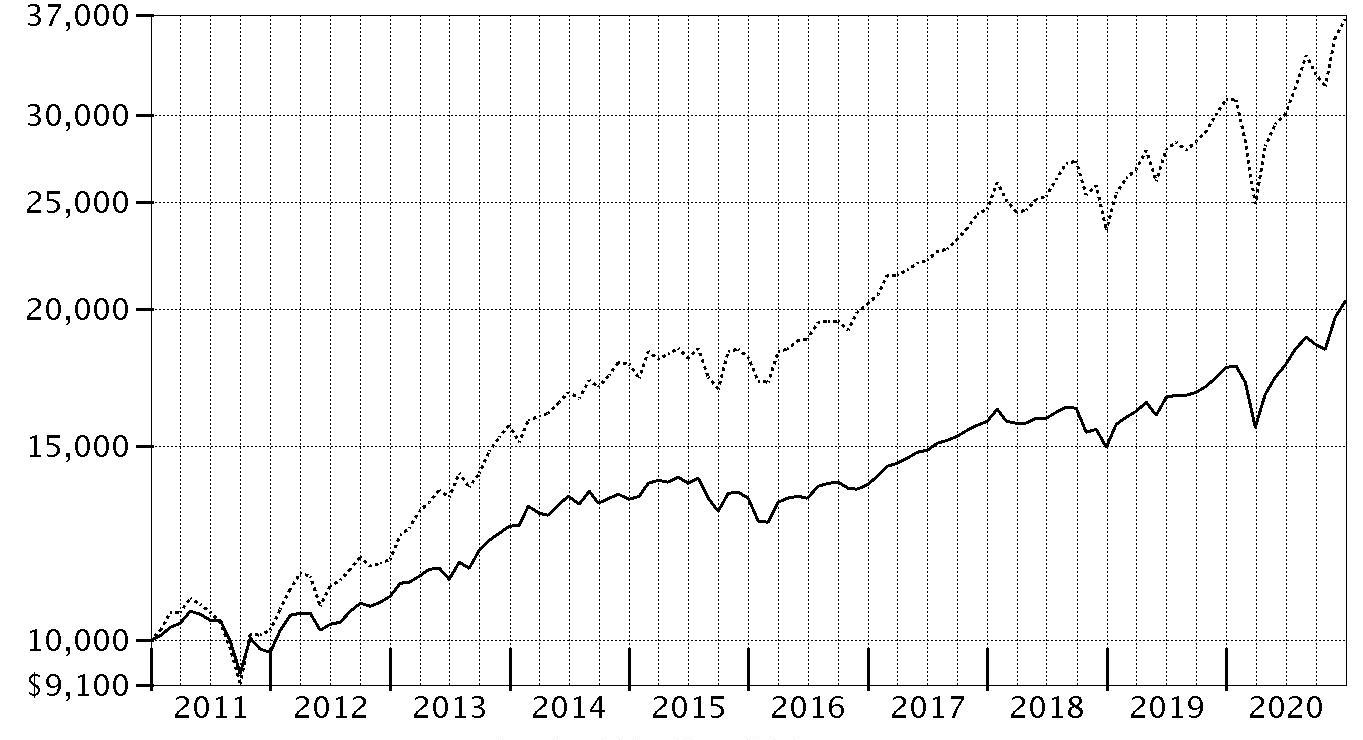
| Period Ending Values |
| $20,322 | VIP Asset Manager Portfolio - Initial Class |
| $36,700 | S&P 500® Index |
Management's Discussion of Fund Performance
Market Recap: Global financial markets were highly volatile and unpredictable in 2020, a year that will be remembered by most investors for the impact of the coronavirus pandemic. The early-2020 outbreak and spread of COVID-19 resulted in a sharp decline for risk assets, followed by a historic rebound. The crisis and containment efforts led to broad contraction in economic activity and dislocation in financial markets. Rapid and expansive monetary- and fiscal-policy responses partially offset the economic disruption and fueled the market surge for many assets from late March through the end of the year.
Non-U.S. equities gained 10.81% in 2020, according to the MSCI ACWI (All Country World Index) ex USA Index, despite significant ups and downs related to the pandemic. Emerging markets (+19%) was the top region, followed by Japan (+15%) and Europe ex U.K. (+12%). Conversely, the U.K. (-10%), Canada (+6%) and Asia Pacific ex Japan (+7%) lagged. By sector, information technology (+46%) was by far the top performer, while consumer discretionary (+23%) and materials (+22%) also notably outpaced the index. Energy (-23%), real estate (-9%) and financials (-4%) all underperformed.
The Dow Jones U.S. Total Stock Market Index gained 20.79% for the year. After a sharp decline in the first quarter (-20.96%) due to the coronavirus outbreak, U.S. equities reversed course, driven by resilient corporate earnings and potential for a vaccine breakthrough, and closed the year at an all-time high. Among sectors, consumer discretionary (+47%) and information technology (+46%) led, whereas energy (-33%) fared worst, followed by real estate (-5%). Large-cap stocks performed about on par with smaller-caps, while growth handily outpaced value. Commodities notably lagged equities.
Turning to fixed income, U.S. taxable investment-grade bonds (the Bloomberg Barclays U.S. Aggregate Bond Index) rose 7.51%, as most categories generated a solid gain. Corporate bonds (+9.35%) led the way, along with commercial mortgage backed securities (+8.11%), Treasury securities (+8.00) and government bonds (7.94%). Agency bonds (+5.48%) and mortgage-backed securities (+3.87%) had smaller gains. Extended (non-core) categories outside the index were mixed, including Treasury Inflation-Protected Securities (+10.99%), high-yield bonds (+6.07%), emerging-markets debt (+5.88%) and floating-rate bank loans (+3.50%).
Comments from Lead Portfolio Manager Geoff Stein and Co-Portfolio Manager Avishek Hazrachoudhury: For the year, the fund’s share classes advanced about 15%, outpacing the 12.71% return of the Fidelity Asset Manager 50% Composite Index℠. Strong security selection across the board – U.S. and international stocks, as well as investment-grade bonds – fueled performance versus the Composite benchmark. Overall asset allocation detracted from relative performance. Our domestic equity portfolio outperformed its benchmark, led by strong stock selection in health care, information technology and communication services. This positive outcome was partially offset by adverse positioning in the consumer discretionary sector. Our international developed-markets (DM) and emerging-markets (EM) portfolios also topped their respective benchmarks by sizable margins. Within DM, picks in continental Europe and Japan helped the most, followed by out-of-benchmark selections in the U.S. In EM, investment choices in China contributed the most by far, although out-of-benchmark picks in the U.S. also meaningfully helped. Within investment-grade bonds, sector positioning drove that portfolio's outperformance of its benchmark. An overweighting and security selection among corporate bonds issued by banks and, to a lesser extent, insurers, provided a major boost. Underweighted exposure to U.S. Treasuries and an out-of-benchmark allocation to Treasury Inflation-Protected Securities (TIPS) also notably contributed. The fund’s overall equity allocation worked against relative performance, hampered by a modest out-of-benchmark position in REITs (real estate investment trusts). REITs struggled along with other risk assets amid the market turmoil of the first quarter. This negative effect was offset by positive results from fixed-income positioning. We underweighted investment-grade bonds and cash to facilitate out-of-benchmark allocations to long-term Treasuries, TIPS and international corporate credit, all of which added value. Looking ahead, we are cautiously optimistic, but believe continued fiscal and monetary stimulus is critical to supporting the economic recovery.
The views expressed above reflect those of the portfolio manager(s) only through the end of the period as stated on the cover of this report and do not necessarily represent the views of Fidelity or any other person in the Fidelity organization. Any such views are subject to change at any time based upon market or other conditions and Fidelity disclaims any responsibility to update such views. These views may not be relied on as investment advice and, because investment decisions for a Fidelity fund are based on numerous factors, may not be relied on as an indication of trading intent on behalf of any Fidelity fund.
Note to shareholders: In September 2020, Fidelity
® VIP Asset Manager Portfolio changed the means by which it attains its U.S. equity exposure, from 10 individual Fidelity sector central funds to one consolidated, multisector portfolio (Fidelity
® U.S. Equity Central Fund). This new, broad-based investment vehicle provides additional tax efficiencies and more flexibility for the sector specialists to express their convictions, advantages that should serve shareholders well.
Investment Summary (Unaudited)
The information in the following tables is based on the combined investments of the Fund and its pro-rata share of the investments of Fidelity's Central Funds, other than the Commodity Strategy and Money Market Central Funds.
Top Five Stocks as of December 31, 2020
| | % of fund's net assets |
| Apple, Inc. | 2.3 |
| Microsoft Corp. | 2.2 |
| Amazon.com, Inc. | 1.4 |
| Alphabet, Inc. Class A | 1.3 |
| Facebook, Inc. Class A | 0.8 |
| | 8.0 |
Top Five Bond Issuers as of December 31, 2020
| (with maturities greater than one year) | % of fund's net assets |
| U.S. Treasury Obligations | 13.2 |
| Fannie Mae | 2.6 |
| Ginnie Mae | 1.4 |
| Freddie Mac | 1.1 |
| Morgan Stanley | 0.5 |
| | 18.8 |
Top Five Market Sectors as of December 31, 2020
| | % of fund's net assets |
| Financials | 13.8 |
| Information Technology | 13.6 |
| Consumer Discretionary | 7.8 |
| Health Care | 7.5 |
| Communication Services | 6.8 |
Asset Allocation (% of fund's net assets)
| As of December 31, 2020* |
| | Stock Class and Equity Futures | 56.7% |
| | Bonds | 39.5% |
| | Short-Term Class | 3.8% |

* Foreign investments - 24.7%
Asset allocations in the pie chart reflects the categorization of assets as defined in the Fund's prospectus in effect as of the time periods indicated above. Financial Statement categorizations conform to accounting standards and will differ from the pie chart. Percentages are adjusted for the effect of future contracts and swap contracts, if applicable.
An unaudited holdings listing for the Fund, which presents direct holdings as well as the pro-rata share of any securities and other investments held indirectly through its investment in underlying Fidelity Central Funds, other than the Commodity Strategy and Money Market Central Funds, is available at institutional.fidelity.com.
Percentages in the above tables are adjusted for the effect of TBA Sale Commitments.
Schedule of Investments December 31, 2020
Showing Percentage of Net Assets
| U.S. Treasury Obligations - 0.3% | | | |
| | | Principal Amount | Value |
| U.S. Treasury Bills, yield at date of purchase 0.06% to 0.08% 2/25/21 to 4/1/21 (a) | | | |
| (Cost $3,569,542) | | 3,570,000 | 3,569,603 |
| | | Shares | Value |
|
| Fixed-Income Funds - 41.8% | | | |
| Fidelity Emerging Markets Debt Central Fund (b) | | 1,060,015 | $9,932,336 |
| Fidelity Emerging Markets Debt Local Currency Central Fund (b) | | 51,184 | 5,544,231 |
| Fidelity Floating Rate Central Fund (b) | | 86,462 | 8,564,031 |
| Fidelity High Income Central Fund (b) | | 160,846 | 17,631,951 |
| Fidelity Inflation-Protected Bond Index Central Fund (b) | | 463,410 | 50,576,543 |
| Fidelity International Credit Central Fund (b) | | 141,192 | 14,720,662 |
| Fidelity VIP Investment Grade Central Fund (b) | | 3,178,743 | 365,332,953 |
| iShares 20+ Year Treasury Bond ETF (c) | | 106,460 | 16,791,936 |
| TOTAL FIXED-INCOME FUNDS | | | |
| (Cost $448,032,939) | | | 489,094,643 |
|
| Money Market Funds - 2.1% | | | |
| Fidelity Cash Central Fund 0.11% (d) | | 1,740,877 | 1,741,225 |
| Fidelity Securities Lending Cash Central Fund 0.11% (d)(e) | | 22,734,827 | 22,737,100 |
| TOTAL MONEY MARKET FUNDS | | | |
| (Cost $24,478,325) | | | 24,478,325 |
|
| Equity Funds - 57.8% | | | |
| Domestic Equity Funds - 40.0% | | | |
| Fidelity Real Estate Equity Central Fund (b) | | 13,786 | 1,609,363 |
| Fidelity U.S. Equity Central Fund (b) | | 4,018,248 | 465,433,625 |
|
| TOTAL DOMESTIC EQUITY FUNDS | | | 467,042,988 |
|
| International Equity Funds - 17.8% | | | |
| Fidelity Emerging Markets Equity Central Fund (b) | | 283,823 | 81,956,840 |
| Fidelity International Equity Central Fund (b) | | 1,186,019 | 114,403,396 |
| iShares MSCI Japan ETF (c) | | 175,793 | 11,876,575 |
|
| TOTAL INTERNATIONAL EQUITY FUNDS | | | 208,236,811 |
|
| TOTAL EQUITY FUNDS | | | |
| (Cost $462,001,714) | | | 675,279,799 |
| TOTAL INVESTMENT IN SECURITIES - 102.0% | | | |
| (Cost $938,082,520) | | | 1,192,422,370 |
| NET OTHER ASSETS (LIABILITIES) - (2.0)% | | | (23,266,354) |
| NET ASSETS - 100% | | | $1,169,156,016 |
| Futures Contracts | | | | | |
| | Number of contracts | Expiration Date | Notional Amount | Value | Unrealized Appreciation/(Depreciation) |
| Sold | | | | | |
| Equity Index Contracts | | | | | |
| CME E-mini S&P 500 Index Contracts (United States) | 308 | March 2021 | $57,731,520 | $(1,203,455) | $(1,203,455) |
The notional amount of futures sold as a percentage of Net Assets is 4.9%
For the period, the average monthly notional amount at value for futures contracts in the aggregate was $33,093,504.
Security Type Abbreviations
ETF – Exchange-Traded Fund
Legend
(a) Security or a portion of the security was pledged to cover margin requirements for futures contracts. At period end, the value of securities pledged amounted to $3,569,603.
(b) Affiliated fund that is generally available only to investment companies and other accounts managed by Fidelity Investments. A complete unaudited schedule of portfolio holdings for each Fidelity Central Fund is filed with the SEC for the first and third quarters of each fiscal year on Form N-PORT and is available upon request or at the SEC's website at www.sec.gov. An unaudited holdings listing for the Fund, which presents direct holdings as well as the pro-rata share of securities and other investments held indirectly through its investment in underlying non-money market Fidelity Central Funds, is available at fidelity.com and/or institutional.fidelity.com, as applicable. In addition, each Fidelity Central Fund's financial statements, which are not covered by the Fund's Report of Independent Registered Public Accounting Firm, are available on the SEC's website or upon request.
(c) Security or a portion of the security is on loan at period end.
(d) Affiliated fund that is generally available only to investment companies and other accounts managed by Fidelity Investments. The rate quoted is the annualized seven-day yield of the fund at period end. A complete unaudited listing of the fund's holdings as of its most recent quarter end is available upon request. In addition, each Fidelity Central Fund's financial statements, which are not covered by the Fund's Report of Independent Registered Public Accounting Firm, are available on the SEC's website or upon request.
(e) Investment made with cash collateral received from securities on loan.
Affiliated Central Funds
Information regarding fiscal year to date income earned by the Fund from investments in Fidelity Central Funds is as follows:
| Fund | Income earned |
| Fidelity Cash Central Fund | $104,189 |
| Fidelity Communication Services Central Fund | 965,368 |
| Fidelity Consumer Discretionary Central Fund | 232,337 |
| Fidelity Consumer Staples Central Fund | 444,738 |
| Fidelity Emerging Markets Debt Central Fund | 488,941 |
| Fidelity Emerging Markets Debt Local Currency Central Fund | 72,280 |
| Fidelity Emerging Markets Equity Central Fund | 1,090,259 |
| Fidelity Energy Central Fund | 246,746 |
| Fidelity Financials Central Fund | 2,046,377 |
| Fidelity Floating Rate Central Fund | 240,730 |
| Fidelity Health Care Central Fund | 5,368,412 |
| Fidelity High Income Central Fund | 819,984 |
| Fidelity Industrials Central Fund | 371,701 |
| Fidelity Inflation-Protected Bond Index Central Fund | 819,733 |
| Fidelity Information Technology Central Fund | 10,241,877 |
| Fidelity International Credit Central Fund | 692,231 |
| Fidelity International Equity Central Fund | 1,543,624 |
| Fidelity Materials Central Fund | 86,609 |
| Fidelity Money Market Central Fund | 111,213 |
| Fidelity Real Estate Equity Central Fund | 76,289 |
| Fidelity Securities Lending Cash Central Fund | 7,769 |
| Fidelity U.S. Equity Central Fund | 3,730,734 |
| Fidelity Utilities Central Fund | 226,873 |
| Fidelity VIP Investment Grade Central Fund | 13,953,968 |
| Total | $43,982,982 |
Amounts in the income column in the above table include any capital gain distributions from underlying funds, which are presented in the corresponding line-item in the Statement of Operations, if applicable. Amount for Fidelity Securities Lending Cash Central Fund represents the income earned on investing cash collateral, less rebates paid to borrowers and any lending agent fees associated with the loan, plus any premium payments received for lending certain types of securities.
Fiscal year to date information regarding the Fund’s investments in non-Money Market Central Funds, including the ownership percentage, is presented below.
| Affiliate | Value, beginning of period | Purchases(a) | Sales Proceeds(a) | Realized Gain (loss) | Change in Unrealized appreciation (depreciation) | Value, end of period | % ownership, end of period |
| Fidelity Communication Services Central Fund | $32,747,886 | $5,810,215 | $2,277,368 | $12,615 | $(5,006,665) | $-- | 0.0 |
| Fidelity Consumer Discretionary Central Fund | 37,693,009 | 3,733,911 | 3,700,133 | 196,998 | (10,581,095) | -- | 0.0 |
| Fidelity Consumer Staples Central Fund | 24,834,070 | 2,948,193 | 1,623,041 | (28,082) | (503,036) | -- | 0.0 |
| Fidelity Emerging Markets Debt Central Fund | 10,461,973 | 690,645 | 1,115,976 | (61,992) | (42,314) | 9,932,336 | 0.4 |
| Fidelity Emerging Markets Debt Local Currency Central Fund | -- | 5,123,280 | -- | -- | 420,951 | 5,544,231 | 3.4 |
| Fidelity Emerging Markets Equity Central Fund | 70,389,406 | 2,020,715 | 5,286,170 | (115,700) | 14,948,589 | 81,956,840 | 3.3 |
| Fidelity Energy Central Fund | 15,742,178 | 880,432 | 700,596 | (177,898) | 3,553,296 | -- | 0.0 |
| Fidelity Financials Central Fund | 69,996,005 | 4,744,072 | 6,389,213 | (265,741) | (11,042,680) | -- | 0.0 |
| Fidelity Floating Rate Central Fund | 5,165,538 | 4,016,468 | 488,824 | (6,898) | (122,253) | 8,564,031 | 0.5 |
| Fidelity Health Care Central Fund | 58,687,448 | 7,053,818 | 4,500,863 | 574,800 | (19,156,806) | -- | 0.0 |
| Fidelity High Income Central Fund | 5,282,818 | 13,496,555 | 2,645,645 | 64,009 | 1,434,214 | 17,631,951 | 0.7 |
| Fidelity Industrials Central Fund | 36,172,208 | 1,934,462 | 3,236,791 | 140,465 | (5,310,264) | -- | 0.0 |
| Fidelity Inflation-Protected Bond Index Central Fund | 54,097,453 | 4,205,251 | 11,122,527 | 279,940 | 3,116,426 | 50,576,543 | 3.8 |
| Fidelity Information Technology Central Fund | 94,559,041 | 16,444,604 | 12,412,915 | 3,033,427 | (27,659,781) | -- | 0.0 |
| Fidelity International Credit Central Fund | 10,724,832 | 6,213,385 | 2,627,206 | 79,986 | 329,665 | 14,720,662 | 3.2 |
| Fidelity International Equity Central Fund | 96,091,057 | 14,947,282 | 10,686,386 | 694,683 | 13,356,760 | 114,403,396 | 3.2 |
| Fidelity Materials Central Fund | 8,820,843 | 1,565,131 | 1,162,794 | (52,170) | 445,236 | -- | 0.0 |
| Fidelity Real Estate Equity Central Fund | 15,459,016 | 155,761 | 10,615,403 | (2,562,818) | (827,193) | 1,609,363 | 0.2 |
| Fidelity U.S. Equity Central Fund | -- | 6,144,789 | 14,514,408 | (9,045,494) | 156,613,894 | 465,433,625 | 1.9 |
| Fidelity Utilities Central Fund | 12,748,581 | 810,114 | 1,148,437 | (60,352) | (2,651,493) | -- | 0.0 |
| Fidelity VIP Investment Grade Central Fund | 337,592,156 | 61,935,874 | 52,212,945 | 337,746 | 17,680,122 | 365,332,953 | 5.1 |
| | $997,265,518 | $164,874,957 | $148,467,641 | $(6,962,476) | $128,995,573 | $1,135,705,931 | |
(a) Excludes the value of securities received and delivered through merger transactions, if applicable.
Investment Valuation
The following is a summary of the inputs used, as of December 31, 2020, involving the Fund's assets and liabilities carried at fair value. The inputs or methodology used for valuing securities may not be an indication of the risk associated with investing in those securities. For more information on valuation inputs, and their aggregation into the levels used below, please refer to the Investment Valuation section in the accompanying Notes to Financial Statements.
| | Valuation Inputs at Reporting Date: |
| Description | Total | Level 1 | Level 2 | Level 3 |
| Investments in Securities: | | | | |
| U.S. Government and Government Agency Obligations | $3,569,603 | $-- | $3,569,603 | $-- |
| Fixed-Income Funds | 489,094,643 | 489,094,643 | -- | -- |
| Money Market Funds | 24,478,325 | 24,478,325 | -- | -- |
| Equity Funds | 675,279,799 | 675,279,799 | -- | -- |
| Total Investments in Securities: | $1,192,422,370 | $1,188,852,767 | $3,569,603 | $-- |
| Derivative Instruments: | | | | |
| Liabilities | | | | |
| Futures Contracts | $(1,203,455) | $(1,203,455) | $-- | $-- |
| Total Liabilities | $(1,203,455) | $(1,203,455) | $-- | $-- |
| Total Derivative Instruments: | $(1,203,455) | $(1,203,455) | $-- | $-- |
Value of Derivative Instruments
The following table is a summary of the Fund's value of derivative instruments by primary risk exposure as of December 31, 2020. For additional information on derivative instruments, please refer to the Derivative Instruments section in the accompanying Notes to Financial Statements.
| Primary Risk Exposure / Derivative Type | Value |
| | Asset | Liability |
| Equity Risk | | |
| Futures Contracts(a) | $0 | $(1,203,455) |
| Total Equity Risk | 0 | (1,203,455) |
| Total Value of Derivatives | $0 | $(1,203,455) |
(a) Reflects gross cumulative appreciation (depreciation) on futures contracts as presented in the Schedule of Investments. In the Statement of Assets and Liabilities, the period end daily variation margin is included in receivable or payable for daily variation margin on futures contracts, and the net cumulative appreciation (depreciation) is included in Total accumulated earnings (loss).
Other Information
The information in the following tables is based on the combined investments of the Fund and its pro-rata share of the investments of Fidelity's Central Funds, other than the Commodity Strategy and Money Market Central Funds. Percentages in the below tables are adjusted for the effect of TBA Sale Commitments.
The composition of credit quality ratings as a percentage of Total Net Assets is as follows (Unaudited):
| U.S. Government and U.S. Government Agency Obligations | 18.7% |
| AAA,AA,A | 5.2% |
| BBB | 7.9% |
| BB | 3.2% |
| B | 1.4% |
| CCC,CC,C | 0.6% |
| D | 0.0% |
| Not Rated | 1.3% |
| Equities | 58.0% |
| Short-Term Investments and Net Other Assets | 3.7% |
| | 100.0% |
We have used ratings from Moody's Investors Service, Inc. Where Moody's® ratings are not available, we have used S&P® ratings. All ratings are as of the date indicated and do not reflect subsequent changes. Percentages are adjusted for the effect of futures contracts, if applicable.
Distribution of investments by country or territory of incorporation, as a percentage of Total Net Assets, is as follows (Unaudited):
| United States of America | 75.3% |
| Cayman Islands | 3.4% |
| United Kingdom | 2.7% |
| Switzerland | 1.9% |
| Netherlands | 1.8% |
| Japan | 1.7% |
| France | 1.3% |
| Germany | 1.2% |
| Korea (South) | 1.2% |
| Canada | 1.1% |
| Mexico | 1.0% |
| Others (Individually Less Than 1%) | 7.4% |
| | 100.0% |
Percentages shown as 0.0% may reflect amounts less than 0.05%.
See accompanying notes which are an integral part of the financial statements.
Financial Statements
Statement of Assets and Liabilities
| | | December 31, 2020 |
| Assets | | |
Investment in securities, at value (including securities loaned of $22,327,791) — See accompanying schedule:
Unaffiliated issuers (cost $29,676,132) | $32,238,114 | |
| Fidelity Central Funds (cost $908,406,388) | 1,160,184,256 | |
| Total Investment in Securities (cost $938,082,520) | | $1,192,422,370 |
| Cash | | 7 |
| Receivable for investments sold | | 897,870 |
| Receivable for fund shares sold | | 173,069 |
| Distributions receivable from Fidelity Central Funds | | 103 |
| Prepaid expenses | | 1,133 |
| Other receivables | | 23,614 |
| Total assets | | 1,193,518,166 |
| Liabilities | | |
| Payable for fund shares redeemed | $632,737 | |
| Accrued management fee | 459,902 | |
| Distribution and service plan fees payable | 4,556 | |
| Payable for daily variation margin on futures contracts | 378,840 | |
| Other affiliated payables | 117,470 | |
| Other payables and accrued expenses | 31,545 | |
| Collateral on securities loaned | 22,737,100 | |
| Total liabilities | | 24,362,150 |
| Net Assets | | $1,169,156,016 |
| Net Assets consist of: | | |
| Paid in capital | | $917,198,694 |
| Total accumulated earnings (loss) | | 251,957,322 |
| Net Assets | | $1,169,156,016 |
| Net Asset Value and Maximum Offering Price | | |
| Initial Class: | | |
| Net Asset Value, offering price and redemption price per share ($889,472,991 ÷ 52,208,794 shares) | | $17.04 |
| Service Class: | | |
| Net Asset Value, offering price and redemption price per share ($5,108,241 ÷ 303,002 shares) | | $16.86 |
| Service Class 2: | | |
| Net Asset Value, offering price and redemption price per share ($19,942,680 ÷ 1,204,111 shares) | | $16.56 |
| Investor Class: | | |
| Net Asset Value, offering price and redemption price per share ($254,632,104 ÷ 15,057,957 shares) | | $16.91 |
See accompanying notes which are an integral part of the financial statements.
Statement of Operations
| | | Year ended December 31, 2020 |
| Investment Income | | |
| Dividends | | $400,644 |
| Interest | | 9,968 |
| Income from Fidelity Central Funds (including $7,769 from security lending) | | 20,919,436 |
| Total income | | 21,330,048 |
| Expenses | | |
| Management fee | $5,129,373 | |
| Transfer agent fees | 853,102 | |
| Distribution and service plan fees | 51,288 | |
| Accounting fees | 446,081 | |
| Custodian fees and expenses | 1,966 | |
| Independent trustees' fees and expenses | 3,453 | |
| Audit | 54,783 | |
| Legal | 8,167 | |
| Miscellaneous | 6,400 | |
| Total expenses before reductions | 6,554,613 | |
| Expense reductions | (4,359) | |
| Total expenses after reductions | | 6,550,254 |
| Net investment income (loss) | | 14,779,794 |
| Realized and Unrealized Gain (Loss) | | |
| Net realized gain (loss) on: | | |
| Investment securities: | | |
| Unaffiliated issuers | 1,291,044 | |
| Fidelity Central Funds | (6,958,426) | |
| Futures contracts | (9,543,836) | |
| Capital gain distributions from Fidelity Central Funds | 23,063,546 | |
| Total net realized gain (loss) | | 7,852,328 |
| Change in net unrealized appreciation (depreciation) on: | | |
| Investment securities: | | |
| Unaffiliated issuers | (937,220) | |
| Fidelity Central Funds | 128,993,593 | |
| Futures contracts | (1,002,827) | |
| Total change in net unrealized appreciation (depreciation) | | 127,053,546 |
| Net gain (loss) | | 134,905,874 |
| Net increase (decrease) in net assets resulting from operations | | $149,685,668 |
See accompanying notes which are an integral part of the financial statements.
Statement of Changes in Net Assets
| | Year ended December 31, 2020 | Year ended December 31, 2019 |
| Increase (Decrease) in Net Assets | | |
| Operations | | |
| Net investment income (loss) | $14,779,794 | $19,778,375 |
| Net realized gain (loss) | 7,852,328 | 13,934,879 |
| Change in net unrealized appreciation (depreciation) | 127,053,546 | 143,643,153 |
| Net increase (decrease) in net assets resulting from operations | 149,685,668 | 177,356,407 |
| Distributions to shareholders | (30,027,237) | (63,324,107) |
| Share transactions - net increase (decrease) | (46,098,465) | (31,400,284) |
| Total increase (decrease) in net assets | 73,559,966 | 82,632,016 |
| Net Assets | | |
| Beginning of period | 1,095,596,050 | 1,012,964,034 |
| End of period | $1,169,156,016 | $1,095,596,050 |
See accompanying notes which are an integral part of the financial statements.
Financial Highlights
VIP Asset Manager Portfolio Initial Class
| Years ended December 31, | 2020 | 2019 | 2018 | 2017 | 2016 |
| Selected Per–Share Data | | | | | |
| Net asset value, beginning of period | $15.23 | $13.68 | $15.23 | $15.29 | $15.76 |
| Income from Investment Operations | | | | | |
| Net investment income (loss)A | .22 | .27 | .24 | .23 | .24 |
| Net realized and unrealized gain (loss) | 2.03 | 2.16 | (1.04) | 1.76 | .18 |
| Total from investment operations | 2.25 | 2.43 | (.80) | 1.99 | .42 |
| Distributions from net investment income | (.24) | (.27) | (.26)B | (.29) | (.23) |
| Distributions from net realized gain | (.21) | (.61) | (.49)B | (1.76) | (.66) |
| Total distributions | (.44)C | (.88) | (.75) | (2.05) | (.89) |
| Net asset value, end of period | $17.04 | $15.23 | $13.68 | $15.23 | $15.29 |
| Total ReturnD,E | 14.87% | 18.25% | (5.35)% | 14.03% | 3.14% |
| Ratios to Average Net AssetsF,G | | | | | |
| Expenses before reductions | .59% | .60% | .60% | .61% | .62% |
| Expenses net of fee waivers, if any | .59% | .60% | .60% | .61% | .61% |
| Expenses net of all reductions | .59% | .60% | .60% | .61% | .61% |
| Net investment income (loss) | 1.41% | 1.88% | 1.64% | 1.54% | 1.57% |
| Supplemental Data | | | | | |
| Net assets, end of period (000 omitted) | $889,473 | $843,000 | $788,193 | $937,508 | $932,248 |
| Portfolio turnover rateH | 20% | 30% | 27% | 26% | 108% |
A Calculated based on average shares outstanding during the period.
B The amounts shown reflect certain reclassifications related to book to tax differences that were made in the year shown.
C Total distributions per share do not sum due to rounding.
D Total returns do not reflect charges attributable to your insurance company's separate account. Inclusion of these charges would reduce the total returns shown.
E Total returns would have been lower if certain expenses had not been reduced during the applicable periods shown.
F Fees and expenses of any underlying mutual funds or exchange-traded funds (ETFs) are not included in the Fund's expense ratio. The Fund indirectly bears its proportionate share of these expenses. For additional expense information related to investments in Fidelity Central Funds, please refer to the "Investments in Fidelity Central Funds" note found in the Notes to Financial Statements section of the most recent Annual or Semi-Annual report.
G Expense ratios reflect operating expenses of the class. Expenses before reductions do not reflect amounts reimbursed, waived, or reduced through arrangements with the investment adviser, brokerage services, or other offset arrangements, if applicable, and do not represent the amount paid by the class during periods when reimbursements, waivers or reductions occur.
H Amount does not include the portfolio activity of any underlying mutual funds or exchange-traded funds (ETFs).
See accompanying notes which are an integral part of the financial statements.
VIP Asset Manager Portfolio Service Class
| Years ended December 31, | 2020 | 2019 | 2018 | 2017 | 2016 |
| Selected Per–Share Data | | | | | |
| Net asset value, beginning of period | $15.08 | $13.55 | $15.09 | $15.16 | $15.64 |
| Income from Investment Operations | | | | | |
| Net investment income (loss)A | .20 | .26 | .23 | .21 | .22 |
| Net realized and unrealized gain (loss) | 2.01 | 2.13 | (1.03) | 1.75 | .18 |
| Total from investment operations | 2.21 | 2.39 | (.80) | 1.96 | .40 |
| Distributions from net investment income | (.23) | (.25) | (.25)B | (.27) | (.22) |
| Distributions from net realized gain | (.21) | (.61) | (.49)B | (1.76) | (.66) |
| Total distributions | (.43)C | (.86) | (.74) | (2.03) | (.88) |
| Net asset value, end of period | $16.86 | $15.08 | $13.55 | $15.09 | $15.16 |
| Total ReturnD,E | 14.74% | 18.16% | (5.44)% | 13.94% | 3.01% |
| Ratios to Average Net AssetsF,G | | | | | |
| Expenses before reductions | .69% | .70% | .70% | .71% | .72% |
| Expenses net of fee waivers, if any | .69% | .70% | .70% | .71% | .71% |
| Expenses net of all reductions | .69% | .70% | .70% | .71% | .71% |
| Net investment income (loss) | 1.31% | 1.78% | 1.54% | 1.44% | 1.47% |
| Supplemental Data | | | | | |
| Net assets, end of period (000 omitted) | $5,108 | $3,923 | $4,378 | $5,004 | $5,437 |
| Portfolio turnover rateH | 20% | 30% | 27% | 26% | 108% |
A Calculated based on average shares outstanding during the period.
B The amounts shown reflect certain reclassifications related to book to tax differences that were made in the year shown.
C Total distributions per share do not sum due to rounding.
D Total returns do not reflect charges attributable to your insurance company's separate account. Inclusion of these charges would reduce the total returns shown.
E Total returns would have been lower if certain expenses had not been reduced during the applicable periods shown.
F Fees and expenses of any underlying mutual funds or exchange-traded funds (ETFs) are not included in the Fund's expense ratio. The Fund indirectly bears its proportionate share of these expenses. For additional expense information related to investments in Fidelity Central Funds, please refer to the "Investments in Fidelity Central Funds" note found in the Notes to Financial Statements section of the most recent Annual or Semi-Annual report.
G Expense ratios reflect operating expenses of the class. Expenses before reductions do not reflect amounts reimbursed, waived, or reduced through arrangements with the investment adviser, brokerage services, or other offset arrangements, if applicable, and do not represent the amount paid by the class during periods when reimbursements, waivers or reductions occur.
H Amount does not include the portfolio activity of any underlying mutual funds or exchange-traded funds (ETFs).
See accompanying notes which are an integral part of the financial statements.
VIP Asset Manager Portfolio Service Class 2
| Years ended December 31, | 2020 | 2019 | 2018 | 2017 | 2016 |
| Selected Per–Share Data | | | | | |
| Net asset value, beginning of period | $14.82 | $13.33 | $14.86 | $14.96 | $15.45 |
| Income from Investment Operations | | | | | |
| Net investment income (loss)A | .17 | .23 | .20 | .19 | .20 |
| Net realized and unrealized gain (loss) | 1.97 | 2.11 | (1.02) | 1.71 | .17 |
| Total from investment operations | 2.14 | 2.34 | (.82) | 1.90 | .37 |
| Distributions from net investment income | (.20) | (.23) | (.22)B | (.25) | (.20) |
| Distributions from net realized gain | (.21) | (.61) | (.49)B | (1.76) | (.66) |
| Total distributions | (.40)C | (.85)C | (.71) | (2.00)C | (.86) |
| Net asset value, end of period | $16.56 | $14.82 | $13.33 | $14.86 | $14.96 |
| Total ReturnD,E | 14.54% | 18.01% | (5.61)% | 13.74% | 2.84% |
| Ratios to Average Net AssetsF,G | | | | | |
| Expenses before reductions | .84% | .85% | .85% | .86% | .87% |
| Expenses net of fee waivers, if any | .84% | .85% | .85% | .86% | .86% |
| Expenses net of all reductions | .84% | .85% | .85% | .86% | .86% |
| Net investment income (loss) | 1.16% | 1.63% | 1.39% | 1.29% | 1.32% |
| Supplemental Data | | | | | |
| Net assets, end of period (000 omitted) | $19,943 | $19,343 | $18,211 | $20,807 | $21,651 |
| Portfolio turnover rateH | 20% | 30% | 27% | 26% | 108% |
A Calculated based on average shares outstanding during the period.
B The amounts shown reflect certain reclassifications related to book to tax differences that were made in the year shown.
C Total distributions per share do not sum due to rounding.
D Total returns do not reflect charges attributable to your insurance company's separate account. Inclusion of these charges would reduce the total returns shown.
E Total returns would have been lower if certain expenses had not been reduced during the applicable periods shown.
F Fees and expenses of any underlying mutual funds or exchange-traded funds (ETFs) are not included in the Fund's expense ratio. The Fund indirectly bears its proportionate share of these expenses. For additional expense information related to investments in Fidelity Central Funds, please refer to the "Investments in Fidelity Central Funds" note found in the Notes to Financial Statements section of the most recent Annual or Semi-Annual report.
G Expense ratios reflect operating expenses of the class. Expenses before reductions do not reflect amounts reimbursed, waived, or reduced through arrangements with the investment adviser, brokerage services, or other offset arrangements, if applicable, and do not represent the amount paid by the class during periods when reimbursements, waivers or reductions occur.
H Amount does not include the portfolio activity of any underlying mutual funds or exchange-traded funds (ETFs).
See accompanying notes which are an integral part of the financial statements.
VIP Asset Manager Portfolio Investor Class
| Years ended December 31, | 2020 | 2019 | 2018 | 2017 | 2016 |
| Selected Per–Share Data | | | | | |
| Net asset value, beginning of period | $15.12 | $13.59 | $15.13 | $15.20 | $15.68 |
| Income from Investment Operations | | | | | |
| Net investment income (loss)A | .20 | .26 | .23 | .22 | .23 |
| Net realized and unrealized gain (loss) | 2.02 | 2.14 | (1.03) | 1.74 | .17 |
| Total from investment operations | 2.22 | 2.40 | (.80) | 1.96 | .40 |
| Distributions from net investment income | (.23) | (.25) | (.25)B | (.28) | (.22) |
| Distributions from net realized gain | (.21) | (.61) | (.49)B | (1.76) | (.66) |
| Total distributions | (.43)C | (.87)C | (.74) | (2.03)C | (.88) |
| Net asset value, end of period | $16.91 | $15.12 | $13.59 | $15.13 | $15.20 |
| Total ReturnD,E | 14.77% | 18.14% | (5.39)% | 13.95% | 3.01% |
| Ratios to Average Net AssetsF,G | | | | | |
| Expenses before reductions | .67% | .68% | .68% | .69% | .70% |
| Expenses net of fee waivers, if any | .67% | .68% | .68% | .69% | .70% |
| Expenses net of all reductions | .67% | .68% | .68% | .69% | .69% |
| Net investment income (loss) | 1.33% | 1.80% | 1.56% | 1.46% | 1.49% |
| Supplemental Data | | | | | |
| Net assets, end of period (000 omitted) | $254,632 | $229,330 | $202,182 | $213,497 | $182,324 |
| Portfolio turnover rateH | 20% | 30% | 27% | 26% | 108% |
A Calculated based on average shares outstanding during the period.
B The amounts shown reflect certain reclassifications related to book to tax differences that were made in the year shown.
C Total distributions per share do not sum due to rounding.
D Total returns do not reflect charges attributable to your insurance company's separate account. Inclusion of these charges would reduce the total returns shown.
E Total returns would have been lower if certain expenses had not been reduced during the applicable periods shown.
F Fees and expenses of any underlying mutual funds or exchange-traded funds (ETFs) are not included in the Fund's expense ratio. The Fund indirectly bears its proportionate share of these expenses. For additional expense information related to investments in Fidelity Central Funds, please refer to the "Investments in Fidelity Central Funds" note found in the Notes to Financial Statements section of the most recent Annual or Semi-Annual report.
G Expense ratios reflect operating expenses of the class. Expenses before reductions do not reflect amounts reimbursed, waived, or reduced through arrangements with the investment adviser, brokerage services, or other offset arrangements, if applicable, and do not represent the amount paid by the class during periods when reimbursements, waivers or reductions occur.
H Amount does not include the portfolio activity of any underlying mutual funds or exchange-traded funds (ETFs).
See accompanying notes which are an integral part of the financial statements.
Notes to Financial Statements
For the period ended December 31, 2020
1. Organization.
VIP Asset Manager Portfolio (the Fund) is a fund of Variable Insurance Products Fund V (the Trust) and is authorized to issue an unlimited number of shares. The Trust is registered under the Investment Company Act of 1940, as amended (the 1940 Act), as an open-end management investment company organized as a Massachusetts business trust. Shares of the Fund may only be purchased by insurance companies for the purpose of funding variable annuity or variable life insurance contracts. The Fund offers the following classes of shares: Initial Class shares, Service Class shares, Service Class 2 shares and Investor Class shares. All classes have equal rights and voting privileges, except for matters affecting a single class.
Effective January 1, 2020:
Investment advisers Fidelity Investments Money Management, Inc., FMR Co., Inc., and Fidelity SelectCo, LLC, merged with and into Fidelity Management & Research Company. In connection with the merger transactions, the resulting, merged investment adviser was then redomiciled from Massachusetts to Delaware, changed its corporate structure from a corporation to a limited liability company, and changed its name to "Fidelity Management & Research Company LLC".
Broker-dealer Fidelity Distributors Corporation merged with and into Fidelity Investments Institutional Services Company, Inc. ("FIISC"). FIISC was then redomiciled from Massachusetts to Delaware, changed its corporate structure from a corporation to a limited liability company, and changed its name to "Fidelity Distributors Company LLC".
Fidelity Investments Institutional Operations Company, Inc. converted from a Massachusetts corporation to a Massachusetts LLC, and changed its name to "Fidelity Investments Institutional Operations Company LLC".
2. Investments in Fidelity Central Funds.
The Fund invests in Fidelity Central Funds, which are open-end investment companies generally available only to other investment companies and accounts managed by the investment adviser and its affiliates. The Fund's Schedule of Investments lists each of the Fidelity Central Funds held as of period end, as an investment of the Fund, but does not include the underlying holdings of each Fidelity Central Fund. As an Investing Fund, the Fund indirectly bears its proportionate share of the expenses of the underlying Fidelity Central Funds.
Based on its investment objective, each Fidelity Central Fund may invest or participate in various investment vehicles or strategies that are similar to those of the Fund. These strategies are consistent with the investment objectives of the Fund and may involve certain economic risks which may cause a decline in value of each of the Fidelity Central Funds and thus a decline in the value of the Fund. The following summarizes the Fund's investment in each Fidelity Central Fund.
| Fidelity Central Fund(a) | Investment Manager | Investment Objective | Investment Practices | Expense Ratio(b),(c),(d) |
| Fidelity Emerging Markets Debt Central Fund | FMR | Seeks high total return by normally investing in debt securities of issuers in emerging markets and other debt investments that are tied economically to emerging markets. | Foreign Securities
Restricted Securities
| Less than .005% |
| Fidelity International Equity Central Fund | FMR | Seeks capital appreciation by investing primarily in non-U.S. based common stocks, including securities of issuers located in emerging markets. | Foreign Securities
Futures
| .01% |
| Fidelity Floating Rate Central Fund | FMR | Seeks a high level of income by normally investing in floating rate loans and other floating rate securities. | Foreign Securities
Loans & Direct Debt Instruments
Restricted Securities
| Less than .005% |
| Fidelity High Income Central Fund | FMR | Seeks a high level of income and may also seek capital appreciation by investing primarily in debt securities, preferred stocks, and convertible securities, with an emphasis on lower-quality debt securities. | Loans & Direct Debt Instruments
Restricted Securities | Less than .005% |
| Fidelity Inflation-Protected Bond Index Central Fund | FMR | Seeks to provide investment results that correspond to the performance of the inflation-protected United States Treasury market, and may invest in derivatives. | | Less than .005% |
| Fidelity VIP Investment Grade Central Fund | FMR | Seeks a high level of current income by normally investing in investment-grade debt securities and repurchase agreements. | Delayed Delivery & When Issued Securities
Repurchase Agreements
Restricted Securities
| Less than .005% |
| Fidelity Real Estate Equity Central Fund | FMR | Seeks above-average income and long-term capital growth by investing primarily in equity securities of issuers in the real estate industry. | | Less than .005% |
| Fidelity International Credit Central Fund | FMR | Seeks a high level of current income by normally investing in debt securities of foreign issuers, including debt securities of issuers located in emerging markets. Foreign currency exposure is hedged utilizing foreign currency contracts. | Foreign Securities
Futures
Options
Restricted Securities
Swaps
Forward Foreign Currency Contracts | .01% |
| Fidelity U.S. Equity Central Fund | FMR | Seeks capital appreciation by investing primarily in common stocks, allocated across different market sectors. | Foreign Securities
Futures
Restricted Securities
| Less than .005% |
| Fidelity Emerging Markets Debt Local Currency Central Fund | FMR | Seeks high total return by normally
investing in debt securities of issuers in emerging markets and other debt investments that are tied economically to emerging markets and denominated in the local currency of the issuer. | Foreign Securities
| .04% |
| Fidelity Money Market Central Funds | FMR | Each fund seeks to obtain a high level of current income consistent with the preservation of capital and liquidity. | Short-term Investments | Less than .005% to .01% |
(a) The Fidelity Equity Central Funds merged into Fidelity U.S. Equity Central Fund on September 18, 2020.
(b) Expenses expressed as a percentage of average net assets and are as of each underlying Central Fund's most recent annual or semi-annual shareholder report.
(c) For Fidelity U.S. Equity Central Fund, Fund commenced operations on September 18, 2020.
(d) For Fidelity Emerging Markets Debt Local Currency Central Fund, Fund commenced operations on September 23, 2020.
An unaudited holdings listing for the Fund, which presents direct holdings as well as the pro-rata share of any securities and other investments held indirectly through its investment in underlying non-money market Fidelity Central Funds, is available at institutional.fidelity.com. A complete unaudited list of holdings for each Fidelity Central Fund is available upon request or at the Securities and Exchange Commission (the SEC) website at www.sec.gov. In addition, the financial statements of the Fidelity Central Funds which contain the significant accounting policies (including investment valuation policies) of those funds, which are not covered by the Fund's Report of Independent Registered Public Accounting Firm, are available on the SEC website or upon request.
3. Significant Accounting Policies.
The Fund is an investment company and applies the accounting and reporting guidance of the Financial Accounting Standards Board (FASB) Accounting Standards Codification Topic 946 Financial Services - Investment Companies. The financial statements have been prepared in conformity with accounting principles generally accepted in the United States of America (GAAP), which require management to make certain estimates and assumptions at the date of the financial statements. Actual results could differ from those estimates. Subsequent events, if any, through the date that the financial statements were issued have been evaluated in the preparation of the financial statements. The following summarizes the significant accounting policies of the Fund:
Investment Valuation. Investments are valued as of 4:00 p.m. Eastern time on the last calendar day of the period. The Board of Trustees (the Board) has delegated the day to day responsibility for the valuation of the Fund's investments to the Fair Value Committee (the Committee) established by the Fund's investment adviser. In accordance with valuation policies and procedures approved by the Board, the Fund attempts to obtain prices from one or more third party pricing vendors or brokers to value its investments. When current market prices, quotations or currency exchange rates are not readily available or reliable, investments will be fair valued in good faith by the Committee, in accordance with procedures adopted by the Board. Factors used in determining fair value vary by investment type and may include market or investment specific events, changes in interest rates and credit quality. The frequency with which these procedures are used cannot be predicted and they may be utilized to a significant extent. The Committee oversees the Fund's valuation policies and procedures and reports to the Board on the Committee's activities and fair value determinations. The Board monitors the appropriateness of the procedures used in valuing the Fund's investments and ratifies the fair value determinations of the Committee. The Fund categorizes the inputs to valuation techniques used to value its investments into a disclosure hierarchy consisting of three levels as shown below:
- Level 1 – quoted prices in active markets for identical investments
- Level 2 – other significant observable inputs (including quoted prices for similar investments, interest rates, prepayment speeds, etc.)
- Level 3 – unobservable inputs (including the Fund's own assumptions based on the best information available)
Valuation techniques used to value the Fund's investments by major category are as follows. Debt securities, including restricted securities, are valued based on evaluated prices received from third party pricing vendors or from brokers who make markets in such securities. U.S. government and government agency obligations are valued by pricing vendors who utilize matrix pricing which considers yield or price of bonds of comparable quality, coupon, maturity and type or by broker-supplied prices. When independent prices are unavailable or unreliable, debt securities may be valued utilizing pricing methodologies which consider similar factors that would be used by third party pricing vendors. Debt securities are generally categorized as Level 2 in the hierarchy but may be Level 3 depending on the circumstances.
Exchange-Traded Funds (ETFs) are valued at their last sale price or official closing price as reported by a third party pricing vendor on the primary market or exchange on which they are traded and are categorized as Level 1 in the hierarchy. In the event there were no sales during the day but the exchange reports a closing bid level, ETFs are valued at the closing bid and would be categorized as Level 1 in the hierarchy. In the event there was no closing bid, ETFs may be valued by another method that the Board believes reflects fair value in accordance with the Board's fair value pricing policies and may be categorized as Level 2 in the hierarchy.
Futures contracts are valued at the settlement price established each day by the board of trade or exchange on which they are traded and are categorized as Level 1 in the hierarchy. Investments in open-end mutual funds, including the Fidelity Central Funds, are valued at their closing net asset value (NAV) each business day and are categorized as Level 1 in the hierarchy.
Changes in valuation techniques may result in transfers in or out of an assigned level within the disclosure hierarchy. The aggregate value of investments by input level, as of December 31, 2020, is included at the end of the Fund's Schedule of Investments.
Investment Transactions and Income. For financial reporting purposes, the Fund's investment holdings and NAV include trades executed through the end of the last business day of the period. The NAV per share for processing shareholder transactions is calculated as of the close of business of the New York Stock Exchange (NYSE), normally 4:00 p.m. Eastern time and includes trades executed through the end of the prior business day. Gains and losses on securities sold are determined on the basis of identified cost and include proceeds received from litigation. Dividend income is recorded on the ex-dividend date, except for certain dividends from foreign securities where the ex-dividend date may have passed, which are recorded as soon as the Fund is informed of the ex-dividend date. Non-cash dividends included in dividend income, if any, are recorded at the fair market value of the securities received. Income and capital gain distributions from Fidelity Central Funds, if any, are recorded on the ex-dividend date. Certain distributions received by the Fund represent a return of capital or capital gain. The Fund determines the components of these distributions subsequent to the ex-dividend date, based upon receipt of tax filings or other correspondence relating to the underlying investment. These distributions are recorded as a reduction of cost of investments and/or as a realized gain. Interest income is accrued as earned and includes coupon interest and amortization of premium and accretion of discount on debt securities as applicable.
Class Allocations and Expenses. Investment income, realized and unrealized capital gains and losses, common expenses of the Fund, and certain fund-level expense reductions, if any, are allocated daily on a pro-rata basis to each class based on the relative net assets of each class to the total net assets of the Fund. Each class differs with respect to transfer agent and distribution and service plan fees incurred. Certain expense reductions may also differ by class. For the reporting period, the allocated portion of income and expenses to each class as a percent of its average net assets may vary due to the timing of recording these transactions in relation to fluctuating net assets of the classes. Expenses directly attributable to a fund are charged to that fund. Expenses attributable to more than one fund are allocated among the respective funds on the basis of relative net assets or other appropriate methods. Expense estimates are accrued in the period to which they relate and adjustments are made when actual amounts are known. Expenses included in the accompanying financial statements reflect the expenses of the Fund and do not include any expenses associated with any underlying mutual funds or exchange-traded funds (ETFs). Although not included in the Fund's expenses, the Fund indirectly bears its proportionate share of any underlying mutual funds or exchange-traded funds (ETFs) through the impact of these expenses on each underlying mutual fund's or exchange-traded fund's (ETFs) NAV.
Deferred Trustee Compensation. Under a Deferred Compensation Plan (the Plan) for certain Funds, certain independent Trustees have elected to defer receipt of a portion of their annual compensation. Deferred amounts are invested in affiliated mutual funds, are marked-to-market and remain in a fund until distributed in accordance with the Plan. The investment of deferred amounts and the offsetting payable to the Trustees presented below are included in the accompanying Statement of Assets and Liabilities in other receivables and other payables and accrued expenses, as applicable.
| VIP Asset Manager Portfolio | $23,614 |
Income Tax Information and Distributions to Shareholders. Each year, the Fund intends to qualify as a regulated investment company under Subchapter M of the Internal Revenue Code, including distributing substantially all of its taxable income and realized gains. As a result, no provision for U.S. Federal income taxes is required. As of December 31, 2020, the Fund did not have any unrecognized tax benefits in the financial statements; nor is the Fund aware of any tax positions for which it is reasonably possible that the total amounts of unrecognized tax benefits will significantly change in the next twelve months. The Fund files a U.S. federal tax return, in addition to state and local tax returns as required. The Fund's federal income tax returns are subject to examination by the Internal Revenue Service (IRS) for a period of three fiscal years after they are filed. State and local tax returns may be subject to examination for an additional fiscal year depending on the jurisdiction.
Distributions are declared and recorded on the ex-dividend date. Income and capital gain distributions are declared separately for each class. Income and capital gain distributions are determined in accordance with income tax regulations, which may differ from GAAP.
Capital accounts within the financial statements are adjusted for permanent book-tax differences. These adjustments have no impact on net assets or the results of operations. Capital accounts are not adjusted for temporary book-tax differences which will reverse in a subsequent period.
Book-tax differences are primarily due to the short-term gain distributions from the underlying mutual funds or exchange-traded funds (ETFs), futures contracts, market discount, deferred trustees compensation, capital loss carryforwards and losses deferred due to wash sales.
As of period end, the cost and unrealized appreciation (depreciation) in securities, and derivatives if applicable, for federal income tax purposes were as follows:
| Gross unrealized appreciation | $264,214,199 |
| Gross unrealized depreciation | (2,172,253) |
| Net unrealized appreciation (depreciation) | $262,041,946 |
| Tax Cost | $930,380,424 |
The tax-based components of distributable earnings as of period end were as follows:
| Undistributed ordinary income | $142,778 |
| Capital loss carryforward | $(995,515) |
| Net unrealized appreciation (depreciation) on securities and other investments | $262,041,946 |
Capital loss carryforwards are only available to offset future capital gains of the Fund to the extent provided by regulations and may be limited. The capital loss carryforward information presented below, including any applicable limitation, is estimated as of fiscal period end and is subject to adjustment.
| No expiration | |
| Short-term | $(995,515) |
| Total capital loss carryforward | $(995,515) |
The tax character of distributions paid was as follows:
| | December 31, 2020 | December 31, 2019 |
| Ordinary Income | $26,031,633 | $ 20,023,804 |
| Long-term Capital Gains | 3,995,604 | 43,300,303 |
| Total | $30,027,237 | $ 63,324,107 |
4. Derivative Instruments.
Risk Exposures and the Use of Derivative Instruments. The Fund's investment objective allows the Fund to enter into various types of derivative contracts, including futures contracts. Derivatives are investments whose value is primarily derived from underlying assets, indices or reference rates and may be transacted on an exchange or over-the-counter (OTC). Derivatives may involve a future commitment to buy or sell a specified asset based on specified terms, to exchange future cash flows at periodic intervals based on a notional principal amount, or for one party to make one or more payments upon the occurrence of specified events in exchange for periodic payments from the other party.
The Fund used derivatives to increase returns and to manage exposure to certain risks as defined below. The success of any strategy involving derivatives depends on analysis of numerous economic factors, and if the strategies for investment do not work as intended, the Fund may not achieve its objectives.
The Fund's use of derivatives increased or decreased its exposure to the following risk:
| Equity Risk | Equity risk relates to the fluctuations in the value of financial instruments as a result of changes in market prices (other than those arising from interest rate risk or foreign exchange risk), whether caused by factors specific to an individual investment, its issuer, or all factors affecting all instruments traded in a market or market segment.
|
The Fund is also exposed to additional risks from investing in derivatives, such as liquidity risk and counterparty credit risk. Liquidity risk is the risk that the Fund will be unable to close out the derivative in the open market in a timely manner. Counterparty credit risk is the risk that the counterparty will not be able to fulfill its obligation to the Fund. Counterparty credit risk related to exchange-traded futures contracts may be mitigated by the protection provided by the exchange on which they trade.
Investing in derivatives may involve greater risks than investing in the underlying assets directly and, to varying degrees, may involve risk of loss in excess of any initial investment and collateral received and amounts recognized in the Statement of Assets and Liabilities. In addition, there may be the risk that the change in value of the derivative contract does not correspond to the change in value of the underlying instrument.
Futures Contracts. A futures contract is an agreement between two parties to buy or sell a specified underlying instrument for a fixed price at a specified future date. The Fund used futures contracts to manage its exposure to the stock market.
Upon entering into a futures contract, a fund is required to deposit either cash or securities (initial margin) with a clearing broker in an amount equal to a certain percentage of the face value of the contract. Futures contracts are marked-to-market daily and subsequent daily payments (variation margin) are made or received by a fund depending on the daily fluctuations in the value of the futures contracts and are recorded as unrealized appreciation or (depreciation). This receivable and/or payable, if any, is included in daily variation margin on futures contracts in the Statement of Assets and Liabilities. Realized gain or (loss) is recorded upon the expiration or closing of a futures contract. The net realized gain (loss) and change in net unrealized appreciation (depreciation) on futures contracts during the period is presented in the Statement of Operations.
Any open futures contracts at period end are presented in the Schedule of Investments under the caption "Futures Contracts". The notional amount at value reflects each contract's exposure to the underlying instrument or index at period end. Securities deposited to meet initial margin requirements are identified in the Schedule of Investments.
5. Purchases and Sales of Investments.
Purchases and sales of securities, other than short-term securities and U.S. government securities, are noted in the table below.
| | Purchases ($) | Sales ($) |
| VIP Asset Manager Portfolio | 204,263,711 | 207,897,016 |
6. Fees and Other Transactions with Affiliates.
Management Fee. Fidelity Management & Research Company LLC (the investment adviser) and its affiliates provide the Fund with investment management related services for which the Fund pays a monthly management fee. The management fee is the sum of an individual fund fee rate that is based on an annual rate of .25% of the Fund's average net assets and an annualized group fee rate that averaged .23% during the period. The group fee rate is based upon the monthly average net assets of a group of registered investment companies with which the investment adviser has management contracts. The group fee rate decreases as assets under management increase and increases as assets under management decrease. For the reporting period, the total annual management fee rate was .48% of the Fund's average net assets.
The investment adviser pays a portion of the management fees received from the Fund to the Fidelity Central Funds' investment advisers, who are also affiliates, for managing the assets of the Fidelity Central Funds.
Distribution and Service Plan Fees. In accordance with Rule 12b-1 of the 1940 Act, the Fund has adopted separate 12b-1 Plans for each Service Class of shares. Each Service Class pays Fidelity Distributors Company LLC (FDC), an affiliate of the investment adviser, a service fee. For the period, the service fee is based on an annual rate of .10% of Service Class' average net assets and .25% of Service Class 2's average net assets.
For the period, total fees, all of which were re-allowed to insurance companies for the distribution of shares and providing shareholder support services, were as follows:
| Service Class | $3,932 |
| Service Class 2 | 47,356 |
| | $51,288 |
Transfer Agent Fees. Fidelity Investments Institutional Operations Company LLC (FIIOC), an affiliate of the investment adviser, is the Fund's transfer, dividend disbursing, and shareholder servicing agent. FIIOC receives an asset-based fee with respect to each class. Each class pays a fee for transfer agent services, typesetting and printing and mailing of shareholder reports, excluding mailing of proxy statements. Effective February 1, 2020, the Board approved to change the fee from .145% to .142% for Investor Class, and from .065% to .064% for all other classes. For the period, transfer agent fees for each class were as follows:
| | Amount | % of Class-Level Average Net Assets |
| Initial Class | $519,635 | .06 |
| Service Class | 2,499 | .06 |
| Service Class 2 | 12,037 | .06 |
| Investor Class | 318,931 | .14 |
| | $853,102 | |
Accounting Fees. Fidelity Service Company, Inc. (FSC), an affiliate of the investment adviser, maintains the Fund's accounting records. The accounting fee is based on the level of average net assets for each month. For the period, the fees were equivalent to the following annual rates:
| | % of Average Net Assets |
| VIP Asset Manager Portfolio | .04 |
Brokerage Commissions. A portion of portfolio transactions were placed with brokerage firms which are affiliates of the investment adviser. Brokerage commissions are included in net realized gain (loss) and change in net unrealized appreciation (depreciation) in the Statement of Operations. The commissions paid to these affiliated firms were as follows:
| | Amount |
| VIP Asset Manager Portfolio | $25 |
Interfund Trades. Funds may purchase from or sell securities to other Fidelity Funds under procedures adopted by the Board. The procedures have been designed to ensure these interfund trades are executed in accordance with Rule 17a-7 of the 1940 Act. Interfund trades are included within the respective purchases and sales amounts shown in the Purchases and Sales of Investments note, and amounted to $1,358,112 and $0, respectively.
7. Committed Line of Credit.
Certain Funds participate with other funds managed by the investment adviser or an affiliate in a $4.25 billion credit facility (the "line of credit") to be utilized for temporary or emergency purposes to fund shareholder redemptions or for other short-term liquidity purposes. The participating funds have agreed to pay commitment fees on their pro-rata portion of the line of credit, which are reflected in Miscellaneous expenses on the Statement of Operations, and are as follows:
| | Amount |
| VIP Asset Manager Portfolio | $2,477 |
During the period, there were no borrowings on this line of credit.
8. Security Lending.
Funds lend portfolio securities from time to time in order to earn additional income. Lending agents are used, including National Financial Services (NFS), an affiliate of the investment adviser. Pursuant to a securities lending agreement, NFS will receive a fee, which is capped at 9.9% of a fund's daily lending revenue, for its services as lending agent. A fund may lend securities to certain qualified borrowers, including NFS. On the settlement date of the loan, a fund receives collateral (in the form of U.S. Treasury obligations, letters of credit and/or cash) against the loaned securities and maintains collateral in an amount not less than 100% of the market value of the loaned securities during the period of the loan. The market value of the loaned securities is determined at the close of business of a fund and any additional required collateral is delivered to a fund on the next business day. A fund or borrower may terminate the loan at any time, and if the borrower defaults on its obligation to return the securities loaned because of insolvency or other reasons, a fund may apply collateral received from the borrower against the obligation. A fund may experience delays and costs in recovering the securities loaned. Any cash collateral received is invested in the Fidelity Securities Lending Cash Central Fund. Any loaned securities are identified as such in the Schedule of Investments, and the value of loaned securities and cash collateral at period end, as applicable, are presented in the Statement of Assets and Liabilities. Security lending income represents the income earned on investing cash collateral, less rebates paid to borrowers and any lending agent fees associated with the loan, plus any premium payments received for lending certain types of securities. Security lending income is presented in the Statement of Operations as a component of income from Fidelity Central Funds. Affiliated security lending activity, if any, was as follows:
| | Total Security Lending Income Fees Paid to NFS | Security Lending Income From Securities Loaned to NFS | Value of Securities Loaned to NFS at Period End |
| VIP Asset Manager Portfolio | $823 | $– | $– |
9. Expense Reductions.
Through arrangements with the Fund's custodian, credits realized as a result of certain uninvested cash balances were used to reduce the Fund's expenses. During the period, custodian credits reduced the Fund's expenses by $22.
In addition, during the period the investment adviser or an affiliate reimbursed and/or waived a portion of fund-level operating expenses in the amount of $4,337.
10. Distributions to Shareholders.
Distributions to shareholders of each class were as follows:
| | Year ended
December 31, 2020 | Year ended
December 31, 2019 |
| Distributions to shareholders | | |
| Initial Class | $23,007,844 | $49,207,361 |
| Service Class | 127,874 | 245,850 |
| Service Class 2 | 488,100 | 1,116,038 |
| Investor Class | 6,403,419 | 12,754,858 |
| Total | $30,027,237 | $63,324,107 |
11. Share Transactions.
Transactions for each class of shares were as follows:
| | Shares | Shares | Dollars | Dollars |
| | Year ended December 31, 2020 | Year ended December 31, 2019 | Year ended December 31, 2020 | Year ended December 31, 2019 |
| Initial Class | | | | |
| Shares sold | 1,304,784 | 1,202,995 | $20,262,782 | $17,542,999 |
| Reinvestment of distributions | 1,380,922 | 3,436,870 | 23,007,844 | 49,207,361 |
| Shares redeemed | (5,825,344) | (6,918,465) | (88,982,044) | (100,380,867) |
| Net increase (decrease) | (3,139,638) | (2,278,600) | $(45,711,418) | $(33,630,507) |
| Service Class | | | | |
| Shares sold | 146,389 | 24,778 | $2,322,889 | $357,927 |
| Reinvestment of distributions | 7,749 | 17,386 | 127,874 | 245,850 |
| Shares redeemed | (111,308) | (105,091) | (1,599,194) | (1,506,313) |
| Net increase (decrease) | 42,830 | (62,927) | $851,569 | $(902,536) |
| Service Class 2 | | | | |
| Shares sold | 159,896 | 109,934 | $2,395,498 | $1,557,635 |
| Reinvestment of distributions | 30,193 | 80,261 | 488,100 | 1,116,038 |
| Shares redeemed | (291,218) | (250,775) | (4,396,065) | (3,520,975) |
| Net increase (decrease) | (101,129) | (60,580) | $(1,512,467) | $(847,302) |
| Investor Class | | | | |
| Shares sold | 1,528,840 | 1,199,490 | $23,661,477 | $17,276,823 |
| Reinvestment of distributions | 387,134 | 896,737 | 6,403,419 | 12,754,858 |
| Shares redeemed | (2,023,779) | (1,812,177) | (29,791,045) | (26,051,620) |
| Net increase (decrease) | (107,805) | 284,050 | $273,851 | $3,980,061 |
12. Other.
The Fund's organizational documents provide former and current trustees and officers with a limited indemnification against liabilities arising in connection with the performance of their duties to the Fund. In the normal course of business, the Fund may also enter into contracts that provide general indemnifications. The Fund's maximum exposure under these arrangements is unknown as this would be dependent on future claims that may be made against the Fund. The risk of material loss from such claims is considered remote.
At the end of the period, the investment adviser or its affiliates were the owners of record of 42% of the total outstanding shares of the Fund and two otherwise unaffiliated shareholders were the owners of record of 28% of the total outstanding shares of the Fund.
13. Coronavirus (COVID-19) Pandemic.
An outbreak of COVID-19 first detected in China during December 2019 has since spread globally and was declared a pandemic by the World Health Organization during March 2020. Developments that disrupt global economies and financial markets, such as the COVID-19 pandemic, may magnify factors that affect the Fund's performance.
Report of Independent Registered Public Accounting Firm
To the Board of Trustees of Variable Insurance Products Fund V and Shareholders of VIP Asset Manager Portfolio
Opinion on the Financial Statements and Financial Highlights
We have audited the accompanying statement of assets and liabilities of VIP Asset Manager Portfolio (the "Fund"), a fund of Variable Insurance Products Fund V, including the schedule of investments, as of December 31, 2020, the related statement of operations for the year then ended, the statement of changes in net assets for each of the two years in the period then ended, the financial highlights for each of the five years in the period then ended, and the related notes. In our opinion, the financial statements and financial highlights present fairly, in all material respects, the financial position of the Fund as of December 31, 2020, and the results of its operations for the year then ended, the changes in its net assets for each of the two years in the period then ended, and the financial highlights for each of the five years in the period then ended in conformity with accounting principles generally accepted in the United States of America.
Basis for Opinion
These financial statements and financial highlights are the responsibility of the Fund's management. Our responsibility is to express an opinion on the Fund's financial statements and financial highlights based on our audits. We are a public accounting firm registered with the Public Company Accounting Oversight Board (United States) (PCAOB) and are required to be independent with respect to the Fund in accordance with the U.S. federal securities laws and the applicable rules and regulations of the Securities and Exchange Commission and the PCAOB.
We conducted our audits in accordance with the standards of the PCAOB. Those standards require that we plan and perform the audit to obtain reasonable assurance about whether the financial statements and financial highlights are free of material misstatement, whether due to error or fraud. The Fund is not required to have, nor were we engaged to perform, an audit of its internal control over financial reporting. As part of our audits we are required to obtain an understanding of internal control over financial reporting but not for the purpose of expressing an opinion on the effectiveness of the Fund’s internal control over financial reporting. Accordingly, we express no such opinion.
Our audits included performing procedures to assess the risks of material misstatement of the financial statements and financial highlights, whether due to error or fraud, and performing procedures that respond to those risks. Such procedures included examining, on a test basis, evidence regarding the amounts and disclosures in the financial statements and financial highlights. Our audits also included evaluating the accounting principles used and significant estimates made by management, as well as evaluating the overall presentation of the financial statements and financial highlights. Our procedures included confirmation of securities owned as of December 31, 2020, by correspondence with the custodian and brokers; when replies were not received from brokers, we performed other auditing procedures. We believe that our audits provide a reasonable basis for our opinion.
/s/ Deloitte & Touche LLP
Boston, Massachusetts
February 12, 2021
We have served as the auditor of one or more of the Fidelity investment companies since 1999.
Trustees and Officers
The Trustees, Members of the Advisory Board (if any), and officers of the trust and fund, as applicable, are listed below. The Board of Trustees governs the fund and is responsible for protecting the interests of shareholders. The Trustees are experienced executives who meet periodically throughout the year to oversee the fund's activities, review contractual arrangements with companies that provide services to the fund, oversee management of the risks associated with such activities and contractual arrangements, and review the fund's performance. Each of the Trustees oversees 280 funds.
The Trustees hold office without limit in time except that (a) any Trustee may resign; (b) any Trustee may be removed by written instrument, signed by at least two-thirds of the number of Trustees prior to such removal; (c) any Trustee who requests to be retired or who has become incapacitated by illness or injury may be retired by written instrument signed by a majority of the other Trustees; and (d) any Trustee may be removed at any special meeting of shareholders by a two-thirds vote of the outstanding voting securities of the trust. Each Trustee who is not an interested person (as defined in the 1940 Act) of the trust and the fund is referred to herein as an Independent Trustee. Each Independent Trustee shall retire not later than the last day of the calendar year in which his or her 75th birthday occurs. The Independent Trustees may waive this mandatory retirement age policy with respect to individual Trustees. Officers and Advisory Board Members hold office without limit in time, except that any officer or Advisory Board Member may resign or may be removed by a vote of a majority of the Trustees at any regular meeting or any special meeting of the Trustees. Except as indicated, each individual has held the office shown or other offices in the same company for the past five years.
The fund’s Statement of Additional Information (SAI) includes more information about the Trustees. To request a free copy, call Fidelity at 1-877-208-0098.
Experience, Skills, Attributes, and Qualifications of the Trustees. The Governance and Nominating Committee has adopted a statement of policy that describes the experience, qualifications, attributes, and skills that are necessary and desirable for potential Independent Trustee candidates (Statement of Policy). The Board believes that each Trustee satisfied at the time he or she was initially elected or appointed a Trustee, and continues to satisfy, the standards contemplated by the Statement of Policy. The Governance and Nominating Committee also engages professional search firms to help identify potential Independent Trustee candidates who have the experience, qualifications, attributes, and skills consistent with the Statement of Policy. From time to time, additional criteria based on the composition and skills of the current Independent Trustees, as well as experience or skills that may be appropriate in light of future changes to board composition, business conditions, and regulatory or other developments, have also been considered by the professional search firms and the Governance and Nominating Committee. In addition, the Board takes into account the Trustees' commitment and participation in Board and committee meetings, as well as their leadership of standing and ad hoc committees throughout their tenure.
In determining that a particular Trustee was and continues to be qualified to serve as a Trustee, the Board has considered a variety of criteria, none of which, in isolation, was controlling. The Board believes that, collectively, the Trustees have balanced and diverse experience, qualifications, attributes, and skills, which allow the Board to operate effectively in governing the fund and protecting the interests of shareholders. Information about the specific experience, skills, attributes, and qualifications of each Trustee, which in each case led to the Board's conclusion that the Trustee should serve (or continue to serve) as a trustee of the fund, is provided below.
Board Structure and Oversight Function. Abigail P. Johnson is an interested person and currently serves as Chairman. The Trustees have determined that an interested Chairman is appropriate and benefits shareholders because an interested Chairman has a personal and professional stake in the quality and continuity of services provided to the fund. Independent Trustees exercise their informed business judgment to appoint an individual of their choosing to serve as Chairman, regardless of whether the Trustee happens to be independent or a member of management. The Independent Trustees have determined that they can act independently and effectively without having an Independent Trustee serve as Chairman and that a key structural component for assuring that they are in a position to do so is for the Independent Trustees to constitute a substantial majority for the Board. The Independent Trustees also regularly meet in executive session. Arthur E. Johnson serves as Chairman of the Independent Trustees and as such (i) acts as a liaison between the Independent Trustees and management with respect to matters important to the Independent Trustees and (ii) with management prepares agendas for Board meetings.
Fidelity® funds are overseen by different Boards of Trustees. The fund's Board oversees Fidelity's investment-grade bond, money market, asset allocation and certain equity funds, and other Boards oversee Fidelity's high income and other equity funds. The asset allocation funds may invest in Fidelity® funds that are overseen by such other Boards. The use of separate Boards, each with its own committee structure, allows the Trustees of each group of Fidelity® funds to focus on the unique issues of the funds they oversee, including common research, investment, and operational issues. On occasion, the separate Boards establish joint committees to address issues of overlapping consequences for the Fidelity® funds overseen by each Board.
The Trustees operate using a system of committees to facilitate the timely and efficient consideration of all matters of importance to the Trustees, the fund, and fund shareholders and to facilitate compliance with legal and regulatory requirements and oversight of the fund's activities and associated risks. The Board, acting through its committees, has charged FMR and its affiliates with (i) identifying events or circumstances the occurrence of which could have demonstrably adverse effects on the fund's business and/or reputation; (ii) implementing processes and controls to lessen the possibility that such events or circumstances occur or to mitigate the effects of such events or circumstances if they do occur; and (iii) creating and maintaining a system designed to evaluate continuously business and market conditions in order to facilitate the identification and implementation processes described in (i) and (ii) above. Because the day-to-day operations and activities of the fund are carried out by or through FMR, its affiliates, and other service providers, the fund's exposure to risks is mitigated but not eliminated by the processes overseen by the Trustees. While each of the Board's committees has responsibility for overseeing different aspects of the fund's activities, oversight is exercised primarily through the Operations and Audit Committees. In addition, an ad hoc Board committee of Independent Trustees has worked with FMR to enhance the Board's oversight of investment and financial risks, legal and regulatory risks, technology risks, and operational risks, including the development of additional risk reporting to the Board. Appropriate personnel, including but not limited to the fund's Chief Compliance Officer (CCO), FMR's internal auditor, the independent accountants, the fund's Treasurer and portfolio management personnel, make periodic reports to the Board's committees, as appropriate, including an annual review of Fidelity's risk management program for the Fidelity® funds. The responsibilities of each standing committee, including their oversight responsibilities, are described further under "Standing Committees of the Trustees."
Interested Trustees*:
Correspondence intended for a Trustee who is an interested person may be sent to Fidelity Investments, 245 Summer Street, Boston, Massachusetts 02210.
Name, Year of Birth; Principal Occupations and Other Relevant Experience+
Abigail P. Johnson (1961)
Year of Election or Appointment: 2009
Trustee
Chairman of the Board of Trustees
Ms. Johnson also serves as Trustee of other Fidelity® funds. Ms. Johnson serves as Chairman (2016-present), Chief Executive Officer (2014-present), and Director (2007-present) of FMR LLC (diversified financial services company), President of Fidelity Financial Services (2012-present) and President of Personal, Workplace and Institutional Services (2005-present). Ms. Johnson is Chairman and Director of Fidelity Management & Research Company LLC (investment adviser firm, 2011-present). Previously, Ms. Johnson served as Chairman and Director of FMR Co., Inc. (investment adviser firm, 2011-2019), Vice Chairman (2007-2016) and President (2013-2016) of FMR LLC, President and a Director of Fidelity Management & Research Company (2001-2005), a Trustee of other investment companies advised by Fidelity Management & Research Company, Fidelity Investments Money Management, Inc. (investment adviser firm), and FMR Co., Inc. (2001-2005), Senior Vice President of the Fidelity® funds (2001-2005), and managed a number of Fidelity® funds. Ms. Abigail P. Johnson and Mr. Arthur E. Johnson are not related.
Jennifer Toolin McAuliffe (1959)
Year of Election or Appointment: 2016
Trustee
Ms. McAuliffe also serves as Trustee of other Fidelity® funds. Previously, Ms. McAuliffe served as Co-Head of Fixed Income of Fidelity Investments Limited (now known as FIL Limited (FIL)) (diversified financial services company), Director of Research for FIL’s credit and quantitative teams in London, Hong Kong and Tokyo and Director of Research for taxable and municipal bonds at Fidelity Investments Money Management, Inc. Ms. McAuliffe previously served as a member of the Advisory Board of certain Fidelity® funds (2016). Ms. McAuliffe was previously a lawyer at Ropes & Gray LLP and currently serves as director or trustee of several not-for-profit entities.
* Determined to be an “Interested Trustee” by virtue of, among other things, his or her affiliation with the trust or various entities under common control with FMR.
+ The information includes the Trustee's principal occupation during the last five years and other information relating to the experience, attributes, and skills relevant to the Trustee's qualifications to serve as a Trustee, which led to the conclusion that the Trustee should serve as a Trustee for the fund.
Independent Trustees:
Correspondence intended for an Independent Trustee may be sent to Fidelity Investments, P.O. Box 55235, Boston, Massachusetts 02205-5235.
Name, Year of Birth; Principal Occupations and Other Relevant Experience+
Elizabeth S. Acton (1951)
Year of Election or Appointment: 2013
Trustee
Ms. Acton also serves as Trustee of other Fidelity® funds. Prior to her retirement, Ms. Acton served as Executive Vice President, Finance (2011-2012), Executive Vice President, Chief Financial Officer (2002-2011) and Treasurer (2004-2005) of Comerica Incorporated (financial services). Prior to joining Comerica, Ms. Acton held a variety of positions at Ford Motor Company (1983-2002), including Vice President and Treasurer (2000-2002) and Executive Vice President and Chief Financial Officer of Ford Motor Credit Company (1998-2000). Ms. Acton currently serves as a member of the Board and Audit and Finance Committees of Beazer Homes USA, Inc. (homebuilding, 2012-present). Ms. Acton previously served as a member of the Advisory Board of certain Fidelity® funds (2013-2016).
Ann E. Dunwoody (1953)
Year of Election or Appointment: 2018
Trustee
General Dunwoody also serves as Trustee of other Fidelity® funds. General Dunwoody (United States Army, Retired) was the first woman in U.S. military history to achieve the rank of four-star general and prior to her retirement in 2012 held a variety of positions within the U.S. Army, including Commanding General, U.S. Army Material Command (2008-2012). General Dunwoody currently serves as President of First to Four LLC (leadership and mentoring services, 2012-present), a member of the Board and Nomination and Corporate Governance Committees of Kforce Inc. (professional staffing services, 2016-present) and a member of the Board of Automattic Inc. (software engineering, 2018-present). Previously, General Dunwoody served as a member of the Advisory Board and Nominating and Corporate Governance Committee of L3 Technologies, Inc. (communication, electronic, sensor and aerospace systems, 2013-2019) and a member of the Board and Audit and Sustainability and Corporate Responsibility Committees of Republic Services, Inc. (waste collection, disposal and recycling, 2013-2016). Ms. Dunwoody also serves on several boards for non-profit organizations, including as a member of the Board, Chair of the Nomination and Governance Committee and a member of the Audit Committee of Logistics Management Institute (consulting non-profit, 2012-present), a member of the Council of Trustees for the Association of the United States Army (advocacy non-profit, 2013-present), a member of the Board of Florida Institute of Technology (2015-present) and a member of the Board of ThanksUSA (military family education non-profit, 2014-present). General Dunwoody previously served as a member of the Advisory Board of certain Fidelity® funds (2018).
John Engler (1948)
Year of Election or Appointment: 2014
Trustee
Mr. Engler also serves as Trustee of other Fidelity® funds. Previously, Mr. Engler served as Governor of Michigan (1991-2003), President of the Business Roundtable (2011-2017) and interim President of Michigan State University (2018-2019). Mr. Engler currently serves as a member of the Board of K12 Inc. (technology-based education company, 2012-present). Previously, Mr. Engler served as a member of the Board of Universal Forest Products (manufacturer and distributor of wood and wood-alternative products, 2003-2019) and Trustee of The Munder Funds (2003-2014). Mr. Engler previously served as a member of the Advisory Board of certain Fidelity® funds (2014-2016).
Robert F. Gartland (1951)
Year of Election or Appointment: 2010
Trustee
Mr. Gartland also serves as Trustee of other Fidelity® funds. Prior to his retirement, Mr. Gartland held a variety of positions at Morgan Stanley (financial services, 1979-2007), including Managing Director (1987-2007) and Chase Manhattan Bank (1975-1978). Mr. Gartland previously served as Chairman and an investor in Gartland & Mellina Group Corp. (consulting, 2009-2019), as a member of the Board of National Securities Clearing Corporation (1993-1996) and as Chairman of TradeWeb (2003-2004).
Arthur E. Johnson (1947)
Year of Election or Appointment: 2008
Trustee
Chairman of the Independent Trustees
Mr. Johnson also serves as Trustee of other Fidelity® funds. Prior to his retirement, Mr. Johnson served as Senior Vice President of Corporate Strategic Development of Lockheed Martin Corporation (defense contractor, 1999-2009). Mr. Johnson currently serves as a member of the Board of Booz Allen Hamilton (management consulting, 2011-present). Mr. Johnson previously served as a member of the Board of Eaton Corporation plc (diversified power management, 2009-2019) and a member of the Board of AGL Resources, Inc. (holding company, 2002-2016). Mr. Johnson previously served as Vice Chairman (2015-2018) of the Independent Trustees of certain Fidelity® funds. Mr. Arthur E. Johnson is not related to Ms. Abigail P. Johnson.
Michael E. Kenneally (1954)
Year of Election or Appointment: 2009
Trustee
Vice Chairman of the Independent Trustees
Mr. Kenneally also serves as Trustee of other Fidelity® funds. Prior to his retirement, Mr. Kenneally served as Chairman and Global Chief Executive Officer of Credit Suisse Asset Management and Executive Vice President and Chief Investment Officer of Bank of America Corporation. Earlier roles at Bank of America included Director of Research, Senior Portfolio Manager for various institutional equity accounts and mutual funds and Portfolio Manager for a number of institutional fixed-income clients. Mr. Kenneally began his career as a Research Analyst in 1983 and was awarded the Chartered Financial Analyst (CFA) designation in 1991.
Marie L. Knowles (1946)
Year of Election or Appointment: 2001
Trustee
Ms. Knowles also serves as Trustee of other Fidelity® funds. Prior to her retirement, Ms. Knowles held several positions at Atlantic Richfield Company (diversified energy), including Executive Vice President and Chief Financial Officer (1996-2000), Senior Vice President (1993-1996) and President of ARCO Transportation Company (pipeline and tanker operations, 1993-1996). Ms. Knowles currently serves as a member of the Board of McKesson Corporation (healthcare service, since 2002), a member of the Board of the Santa Catalina Island Company (real estate, 2009-present), a member of the Investment Company Institute Board of Governors and a member of the Governing Council of the Independent Directors Council (2014-present). Ms. Knowles also serves as a member of the Advisory Board for the School of Engineering of the University of Southern California. Ms. Knowles previously served as Chairman (2015-2018) and Vice Chairman (2012-2015) of the Independent Trustees of certain Fidelity® funds.
Mark A. Murray (1954)
Year of Election or Appointment: 2016
Trustee
Mr. Murray also serves as Trustee of other Fidelity® funds. Previously, Mr. Murray served as Co-Chief Executive Officer (2013-2016), President (2006-2013) and Vice Chairman (2013-2020) of Meijer, Inc. Mr. Murray serves as a member of the Board and Nuclear Review and Public Policy and Responsibility Committees of DTE Energy Company (diversified energy company, 2009-present) and a member of the Board and Audit Committee and Chairman of the Nominating and Corporate Governance Committee of Universal Forest Products, Inc. (manufacturer and distributor of wood and wood-alternative products, 2004-2016). Mr. Murray previously served as a member of the Board of Spectrum Health (not-for-profit health system, 2015-2019). Mr. Murray also serves as a member of the Board of many community and professional organizations. Mr. Murray previously served as a member of the Advisory Board of certain Fidelity® funds (2016).
+ The information includes the Trustee's principal occupation during the last five years and other information relating to the experience, attributes, and skills relevant to the Trustee's qualifications to serve as a Trustee, which led to the conclusion that the Trustee should serve as a Trustee for the fund.
Advisory Board Members and Officers:
Correspondence intended for an officer may be sent to Fidelity Investments, 245 Summer Street, Boston, Massachusetts 02210. Officers appear below in alphabetical order.
Name, Year of Birth; Principal Occupation
Craig S. Brown (1977)
Year of Election or Appointment: 2019
Assistant Treasurer
Mr. Brown also serves as Assistant Treasurer of other funds. Mr. Brown is an employee of Fidelity Investments (2013-present).
John J. Burke III (1964)
Year of Election or Appointment: 2018
Chief Financial Officer
Mr. Burke also serves as Chief Financial Officer of other funds. Mr. Burke serves as Head of Investment Operations for Fidelity Fund and Investment Operations (2018-present) and is an employee of Fidelity Investments (1998-present). Previously Mr. Burke served as head of Asset Management Investment Operations (2012-2018).
David J. Carter (1973)
Year of Election or Appointment: 2020
Assistant Secretary
Mr. Carter also serves as Assistant Secretary of other funds. Mr. Carter serves as Vice President, Associate General Counsel (2010-present) and is an employee of Fidelity Investments (2005-present).
Jonathan Davis (1968)
Year of Election or Appointment: 2010
Assistant Treasurer
Mr. Davis also serves as Assistant Treasurer of other funds. Mr. Davis serves as Assistant Treasurer of FMR Capital, Inc. (2017-present) and is an employee of Fidelity Investments. Previously, Mr. Davis served as Vice President and Associate General Counsel of FMR LLC (diversified financial services company, 2003-2010).
Laura M. Del Prato (1964)
Year of Election or Appointment: 2018
President and Treasurer
Ms. Del Prato also serves as an officer of other funds. Ms. Del Prato is an employee of Fidelity Investments (2017-present). Previously, Ms. Del Prato served as President and Treasurer of The North Carolina Capital Management Trust: Cash Portfolio and Term Portfolio (2018-2020). Prior to joining Fidelity Investments, Ms. Del Prato served as a Managing Director and Treasurer of the JPMorgan Mutual Funds (2014-2017). Prior to JPMorgan, Ms. Del Prato served as a partner at Cohen Fund Audit Services (accounting firm, 2012-2013) and KPMG LLP (accounting firm, 2004-2012).
Colm A. Hogan (1973)
Year of Election or Appointment: 2016
Assistant Treasurer
Mr. Hogan also serves as an officer of other funds. Mr. Hogan serves as Assistant Treasurer of FMR Capital, Inc. (2017-present) and is an employee of Fidelity Investments (2005-present). Previously, Mr. Hogan served as Deputy Treasurer of certain Fidelity® funds (2016-2020) and Assistant Treasurer of certain Fidelity® funds (2016-2018).
Cynthia Lo Bessette (1969)
Year of Election or Appointment: 2019
Secretary and Chief Legal Officer (CLO)
Ms. Lo Bessette also serves as an officer of other funds. Ms. Lo Bessette serves as CLO, Secretary, and Senior Vice President of Fidelity Management & Research Company LLC (investment adviser firm, 2019-present); and CLO of Fidelity Management & Research (Hong Kong) Limited, FMR Investment Management (UK) Limited, and Fidelity Management & Research (Japan) Limited (investment adviser firms, 2019-present). She is a Senior Vice President and Deputy General Counsel of FMR LLC (diversified financial services company, 2019-present), and is an employee of Fidelity Investments. Previously, Ms. Lo Bessette served as CLO, Secretary, and Senior Vice President of FMR Co., Inc. (investment adviser firm, 2019); Secretary of Fidelity SelectCo, LLC and Fidelity Investments Money Management, Inc. (investment adviser firms, 2019). Prior to joining Fidelity Investments, Ms. Lo Bessette was Executive Vice President, General Counsel (2016-2019) and Senior Vice President, Deputy General Counsel (2015-2016) of OppenheimerFunds (investment management company) and Deputy Chief Legal Officer (2013-2015) of Jennison Associates LLC (investment adviser firm).
Chris Maher (1972)
Year of Election or Appointment: 2013
Assistant Treasurer
Mr. Maher also serves as an officer of other funds. Mr. Maher serves as Assistant Treasurer of FMR Capital, Inc. (2017-present), and is an employee of Fidelity Investments (2008-present). Previously, Mr. Maher served as Assistant Treasurer of certain funds (2013-2020); Vice President of Asset Management Compliance (2013), Vice President of the Program Management Group of FMR (investment adviser firm, 2010-2013), and Vice President of Valuation Oversight (2008-2010).
Kenneth B. Robins (1969)
Year of Election or Appointment: 2020
Chief Compliance Officer
Mr. Robins also serves as an officer of other funds. Mr. Robins serves as Compliance Officer of Fidelity Management & Research Company LLC (investment adviser firm, 2016-present) and is an employee of Fidelity Investments (2004-present). Previously, Mr. Robins served as Compliance Officer of FMR Co., Inc. (investment adviser firm, 2016-2019), as Executive Vice President of Fidelity Investments Money Management, Inc. (investment adviser firm, 2013-2016) and served in other fund officer roles.
Brett Segaloff (1972)
Year of Election or Appointment: 2021
Anti-Money Laundering (AML) Officer
Mr. Segaloff also serves as an AML Officer of other funds and other related entities. He is Director, Anti-Money Laundering (2007-present) of FMR LLC (diversified financial services company) and is an employee of Fidelity Investments (1996-present).
Stacie M. Smith (1974)
Year of Election or Appointment: 2013
Assistant Treasurer
Ms. Smith also serves as an officer of other funds. Ms. Smith serves as Assistant Treasurer of FMR Capital, Inc. (2017-present), is an employee of Fidelity Investments (2009-present), and has served in other fund officer roles. Prior to joining Fidelity Investments, Ms. Smith served as Senior Audit Manager of Ernst & Young LLP (accounting firm, 1996-2009). Previously, Ms. Smith served as Assistant Treasurer (2013-2019) and Deputy Treasurer (2013-2016) of certain Fidelity® funds.
Marc L. Spector (1972)
Year of Election or Appointment: 2016
Deputy Treasurer
Mr. Spector also serves as an officer of other funds. Mr. Spector serves as Assistant Treasurer of FMR Capital, Inc. (2017-present) and is an employee of Fidelity Investments (2016-present). Prior to joining Fidelity Investments, Mr. Spector served as Director at the Siegfried Group (accounting firm, 2013-2016), and prior to Siegfried Group as audit senior manager at Deloitte & Touche LLP (accounting firm, 2005-2013).
Jim Wegmann (1979)
Year of Election or Appointment: 2019
Assistant Treasurer
Mr. Wegmann also serves as Assistant Treasurer of other funds. Mr. Wegmann is an employee of Fidelity Investments (2011-present).
Vadim Zlotnikov (1962)
Year of Election or Appointment: 2019
Vice President
Mr. Zlotnikov also serves as Vice President of other funds. Mr. Zlotnikov serves as President of FIAM (Fidelity Institutional Asset Management) and is an employee of Fidelity Investments (2018-present). Previously, Mr. Zlotnikov served as President and Chief Investment Officer of Global Asset Allocation (2018-2020). Prior to joining Fidelity Investments, Mr. Zlotnikov served as Co-Head of Multi-Asset Solutions, Chief Market Strategist, and CIO of Systematic Strategies with AllianceBernstein (investment adviser firm, 2002-2018).
Shareholder Expense Example
As a shareholder, you incur two types of costs: (1) transaction costs, which may include sales charges (loads) on purchase payments or redemption proceeds, as applicable and (2) ongoing costs, which generally include management fees, distribution and/or service (12b-1) fees and other Fund expenses. This Example is intended to help you understand your ongoing costs (in dollars) of investing in a fund and to compare these costs with the ongoing costs of investing in other mutual funds.
The Example is based on an investment of $1,000 invested at the beginning of the period and held for the entire period (July 1, 2020 to December 31, 2020).
Actual Expenses
The first line of the accompanying table provides information about actual account values and actual expenses. You may use the information in this line, together with the amount you invested, to estimate the expenses that you paid over the period. Simply divide your account value by $1,000.00 (for example, an $8,600 account value divided by $1,000.00 = 8.6), then multiply the result by the number in the first line for a class/Fund under the heading entitled "Expenses Paid During Period" to estimate the expenses you paid on your account during this period. If any fund is a shareholder of any underlying mutual funds or exchange-traded funds (ETFs) (the Underlying Funds), such fund indirectly bears its proportional share of the expenses of the Underlying Funds in addition to the direct expenses incurred presented in the table. These fees and expenses are not included in the annualized expense ratio used to calculate the expense estimate in the table below. The estimate of expenses does not include any fees or other expenses of any variable annuity or variable life insurance product. If they were, the estimate of expenses you paid during the period would be higher, and your ending account value would be lower.
Hypothetical Example for Comparison Purposes
The second line of the accompanying table provides information about hypothetical account values and hypothetical expenses based on the actual expense ratio and an assumed rate of return of 5% per year before expenses, which is not the actual return. The hypothetical account values and expenses may not be used to estimate the actual ending account balance or expenses you paid for the period. You may use this information to compare the ongoing costs of investing in the Fund and other funds. To do so, compare this 5% hypothetical example with the 5% hypothetical examples that appear in the shareholder reports of the other funds. If any fund is a shareholder of any Underlying Funds, such fund indirectly bears its proportional share of the expenses of the Underlying Funds in addition to the direct expenses as presented in the table. These fees and expenses are not included in the annualized expense ratio used to calculate the expense estimate in the table below. The estimate of expenses does not include any fees or other expenses of any variable annuity or variable life insurance product. If they were, the estimate of expenses you paid during the period would be higher, and your ending account value would be lower.
Please note that the expenses shown in the table are meant to highlight your ongoing costs only and do not reflect any transaction costs. Therefore, the second line of the table is useful in comparing ongoing costs only, and will not help you determine the relative total costs of owning different funds.
| | Annualized Expense Ratio-A | Beginning
Account Value
July 1, 2020 | Ending
Account Value
December 31, 2020 | Expenses Paid
During Period-B
July 1, 2020
to December 31, 2020 |
| VIP Asset Manager Portfolio | | | | |
| Initial Class | .59% | | | |
| Actual | | $1,000.00 | $1,143.90 | $3.18 |
| Hypothetical-C | | $1,000.00 | $1,022.17 | $3.00 |
| Service Class | .69% | | | |
| Actual | | $1,000.00 | $1,142.60 | $3.72 |
| Hypothetical-C | | $1,000.00 | $1,021.67 | $3.51 |
| Service Class 2 | .84% | | | |
| Actual | | $1,000.00 | $1,142.10 | $4.52 |
| Hypothetical-C | | $1,000.00 | $1,020.91 | $4.27 |
| Investor Class | .67% | | | |
| Actual | | $1,000.00 | $1,142.90 | $3.61 |
| Hypothetical-C | | $1,000.00 | $1,021.77 | $3.40 |
A Annualized expense ratio reflects expenses net of applicable fee waivers.
B Expenses are equal to the annualized expense ratio, multiplied by the average account value over the period, multiplied by 184/ 366 (to reflect the one-half year period). The fees and expenses of any Underlying Funds are not included in each annualized expense ratio.
C 5% return per year before expenses
Distributions (Unaudited)
A total of 4.37% of the dividends distributed during the fiscal year was derived from interest on U.S. Government securities which is generally exempt from state income tax.
Initial Class designates 0% and 21%; Service Class designates 0% and 22%; Service Class 2 designates 0% and 24%; and Investor Class designates 0% and 22%; of the dividends distributed in February and December respectively during the fiscal year as qualifying for the dividends–received deduction for corporate shareholders.
The amounts per share which represent income derived from sources within, and taxes paid to, foreign countries or possessions of the United States are as follows:
| | Pay Date | Income | Taxes |
| VIP Asset Manager Portfolio | | | |
| Initial Class | 12/30/20 | $0.0448 | $0.0045 |
| Service Class | 12/30/20 | $0.0434 | $0.0045 |
| Service Class 2 | 12/30/20 | $0.0398 | $0.0045 |
| Investor Class | 12/30/20 | $0.0434 | $0.0045 |
|
Board Approval of Investment Advisory Contracts and Management Fees
VIP Asset Manager Portfolio
Each year, the Board of Trustees, including the Independent Trustees (together, the Board), votes on the renewal of the management contract with Fidelity Management & Research Company LLC (FMR) and the sub-advisory agreements (together, the Advisory Contracts) for the fund. FMR and the sub-advisers are referred to herein as the Investment Advisers. The Board, assisted by the advice of fund counsel and Independent Trustees' counsel, requests and considers a broad range of information relevant to the renewal of the Advisory Contracts throughout the year.
The Board meets regularly and, at each of its meetings, covers an extensive agenda of topics and materials and considers factors that are relevant to its annual consideration of the renewal of the fund's Advisory Contracts, including the services and support provided to the fund and its shareholders. The Board has established four standing committees (Committees) — Operations, Audit, Fair Valuation, and Governance and Nominating — each composed of and chaired by Independent Trustees with varying backgrounds, to which the Board has assigned specific subject matter responsibilities in order to enhance effective decision-making by the Board. The Operations Committee, of which all of the Independent Trustees are members, meets regularly throughout the year and considers, among other matters, information specifically related to the annual consideration of the renewal of the fund's Advisory Contracts. The Board, acting directly and through its Committees, requests and receives information concerning the annual consideration of the renewal of the fund's Advisory Contracts. The Board also meets as needed to review matters specifically related to the Board's annual consideration of the renewal of the Advisory Contracts. Members of the Board may also meet with trustees of other Fidelity funds through joint ad hoc committees to discuss certain matters relevant to all of the Fidelity funds.
At its September 2020 meeting, the Board unanimously determined to renew the fund's Advisory Contracts. In reaching its determination, the Board considered all factors it believed relevant, including (i) the nature, extent, and quality of the services provided to the fund and its shareholders (including the investment performance of the fund); (ii) the competitiveness of the fund's management fee and total expense ratio relative to peer funds; (iii) the total costs of the services provided by and the profits realized by Fidelity from its relationships with the fund; and (iv) the extent to which, if any, economies of scale exist and are realized as the fund grows, and whether any economies of scale are appropriately shared with fund shareholders.
In considering whether to renew the Advisory Contracts for the fund, the Board reached a determination, with the assistance of fund counsel and Independent Trustees' counsel and through the exercise of its business judgment, that the renewal of the Advisory Contracts was in the best interests of the fund and its shareholders and that the compensation payable under the Advisory Contracts was fair and reasonable. The Board's decision to renew the Advisory Contracts was not based on any single factor, but rather was based on a comprehensive consideration of all the information provided to the Board at its meetings throughout the year. The Board, in reaching its determination to renew the Advisory Contracts, was aware that shareholders of the fund have a broad range of investment choices available to them, including a wide choice among funds offered by Fidelity's competitors, and that the fund's shareholders, who have the opportunity to review and weigh the disclosure provided by the fund in its prospectus and other public disclosures, have chosen to invest in this fund, which is part of the Fidelity family of funds.
Nature, Extent, and Quality of Services Provided. The Board considered Fidelity's staffing as it relates to the fund, including the backgrounds of investment personnel of Fidelity, and also considered the fund's investment objective, strategies, and related investment philosophy. The Independent Trustees also had discussions with senior management of Fidelity's investment operations and investment groups. The Board considered the structure of the investment personnel compensation program and whether this structure provides appropriate incentives to act in the best interests of the fund. Additionally, the Board considered the portfolio managers' investments, if any, in the funds that they manage.
Resources Dedicated to Investment Management and Support Services. The Board reviewed the general qualifications and capabilities of Fidelity's investment staff, including its size, education, experience, and resources, as well as Fidelity's approach to recruiting, managing, and compensating investment personnel. The Board noted that Fidelity has continued to increase the resources devoted to non-U.S. offices, including expansion of Fidelity's global investment organization. The Board also noted that Fidelity's analysts have extensive resources, tools and capabilities that allow them to conduct sophisticated quantitative and fundamental analysis, as well as credit analysis of issuers, counterparties and guarantors. Further, the Board considered that Fidelity's investment professionals have sufficient access to global information and data so as to provide competitive investment results over time, and that those professionals also have access to sophisticated tools that permit them to assess portfolio construction and risk and performance attribution characteristics continuously, as well as to transmit new information and research conclusions rapidly around the world. Additionally, in its deliberations, the Board considered Fidelity's trading, risk management, compliance, and technology and operations capabilities and resources, which are integral parts of the investment management process. The Board also considered Fidelity's investments in business continuity planning, and its success in continuously providing services to the fund notwithstanding the severe disruptions caused by the COVID-19 pandemic.
Shareholder and Administrative Services. The Board considered (i) the nature, extent, quality, and cost of advisory, administrative, and shareholder services performed by the Investment Advisers and their affiliates under the Advisory Contracts and under separate agreements covering transfer agency, pricing and bookkeeping, and securities lending services for the fund; (ii) the nature and extent of the supervision of third party service providers, principally custodians, subcustodians, and pricing vendors; and (iii) the resources devoted to, and the record of compliance with, the fund's compliance policies and procedures. The Board also reviewed the allocation of fund brokerage, including allocations to brokers affiliated with the Investment Advisers, the use of brokerage commissions to pay fund expenses, and the use of "soft" commission dollars to pay for research services.
The Board noted that the growth of fund assets over time across the complex allows Fidelity to reinvest in the development of services designed to enhance the value and convenience of the Fidelity funds as investment vehicles. These services include 24-hour access to account information and market information over the Internet and through telephone representatives, investor education materials and asset allocation tools, and the expanded availability of Fidelity Investor Centers.
Investment in a Large Fund Family. The Board considered the benefits to shareholders of investing in a Fidelity fund, including the benefits of investing in a fund that is part of a large family of funds offering a variety of investment disciplines and providing a large variety of mutual fund investor services. The Board noted that Fidelity had taken, or had made recommendations that resulted in the Fidelity funds taking, a number of actions over the previous year that benefited particular funds, including: (i) continuing to dedicate additional resources to Fidelity's investment research process, which includes meetings with management of issuers of securities in which the funds invest, and to the support of the senior management team that oversees asset management; (ii) continuing efforts to enhance Fidelity's global research capabilities; (iii) launching new funds and ETFs with innovative structures, strategies and pricing and making other enhancements to meet client needs; (iv) launching new share classes of existing funds; (v) eliminating purchase minimums and broadening eligibility requirements for certain funds and share classes; (vi) reducing management fees and total expenses for certain target date funds or classes and index funds; (vii) lowering expenses for certain funds and classes by implementing or lowering expense caps; (viii) rationalizing product lines and gaining increased efficiencies from fund mergers, liquidations, and share class consolidations; (ix) continuing to develop, acquire and implement systems and technology to improve services to the funds and shareholders, strengthen information security, and increase efficiency; and (x) continuing to implement enhancements to further strengthen Fidelity's product line to increase investors' probability of success in achieving their investment goals, including retirement income goals.
Investment Performance. The Board considered whether the fund has operated in accordance with its investment objective, as well as its record of compliance with its investment restrictions and its performance history.
The Board took into account discussions that occur at Board meetings throughout the year with representatives of the Investment Advisers about fund investment performance. In this regard the Board noted that as part of regularly scheduled fund reviews and other reports to the Board on fund performance, the Board considers annualized return information for the fund for different time periods, measured against one or more appropriate securities market indices, including a customized blended index that reflects the respective weights of the fund's asset classes (each a benchmark index) and an appropriate peer group of funds with similar objectives (peer group). In its evaluation of fund investment performance at meetings throughout the year, the Board gave particular attention to information indicating underperformance of certain Fidelity funds for specific time periods and discussed with the Investment Advisers the reasons for such underperformance.
In addition to reviewing absolute and relative fund performance, the Independent Trustees periodically consider the appropriateness of fund performance metrics in evaluating the results achieved. In general, the Independent Trustees believe that fund performance should be evaluated based on gross performance (before fees and expenses but after transaction costs) compared to appropriate benchmark indices, over appropriate time periods that may include full market cycles, and on net performance (after fees and expenses) compared to appropriate peer groups, as applicable, over the same periods, taking into account relevant factors including the following: general market conditions; expectations for interest rate levels and credit conditions; issuer-specific information including credit quality; and fund cash flows and other factors. The Independent Trustees generally give greater weight to fund performance over longer time periods than over shorter time periods. Depending on the circumstances, the Independent Trustees may be satisfied with a fund's performance notwithstanding that it lags its benchmark index or peer group for certain periods.
The Independent Trustees recognize that shareholders evaluate performance on a net basis over their own holding periods, for which one-, three-, and five-year periods are often used as a proxy. For this reason, the performance information reviewed by the Board also included net cumulative calendar year total return information for the fund and an appropriate benchmark index and peer group for the most recent one-, three-, and five-year periods. The Independent Trustees recognize that shareholders who are not investing through a tax-advantaged retirement account also consider tax consequences in evaluating performance.
Based on its review, the Board concluded that the nature, extent, and quality of services provided to the fund under the Advisory Contracts should continue to benefit the shareholders of the fund.
Competitiveness of Management Fee and Total Expense Ratio. The Board considered the fund's management fee and total expense ratio compared to "mapped groups" of competitive funds and classes created for the purpose of facilitating the Trustees' competitive analysis of management fees and total expenses. Fidelity creates "mapped groups" by combining similar Lipper investment objective categories that have comparable investment mandates. Combining Lipper investment objective categories aids the Board's management fee and total expense ratio comparisons by broadening the competitive group used for comparison.
Management Fee. The Board considered two proprietary management fee comparisons for the 12-month periods shown in basis points (BP) in the chart below. The group of Lipper funds used by the Board for management fee comparisons is referred to below as the "Total Mapped Group." The Total Mapped Group comparison focuses on a fund's standing in terms of gross management fees before expense reimbursements or caps relative to the total universe of funds with comparable investment mandates, regardless of whether their management fee structures also are comparable. Funds with comparable investment mandates offer exposure to similar types of securities. Funds with comparable management fee structures have similar management fee contractual arrangements (
e.g., flat rate charged for advisory services, all-inclusive fee rate,
etc.). "TMG %" represents the percentage of funds in the Total Mapped Group that had management fees that were lower than the fund's. For example, a hypothetical TMG % of 20% would mean that 80% of the funds in the Total Mapped Group had higher, and 20% had lower, management fees than the fund. The fund's actual TMG %s and the number of funds in the Total Mapped Group are in the chart below. The "Asset-Sized Peer Group" (ASPG) comparison focuses on a fund's standing relative to a subset of non-Fidelity funds within the Total Mapped Group that are similar in size and management fee structure. For example, if a fund is in the first quartile of the ASPG, the fund's management fee ranks in the least expensive or lowest 25% of funds in the ASPG. The ASPG represents at least 15% of the funds in the Total Mapped Group with comparable asset size and management fee structures, subject to a minimum of 50 funds (or all funds in the Total Mapped Group if fewer than 50). Additional information, such as the ASPG quartile in which the fund's management fee rate ranked, is also included in the chart and was considered by the Board.
VIP Asset Manager Portfolio
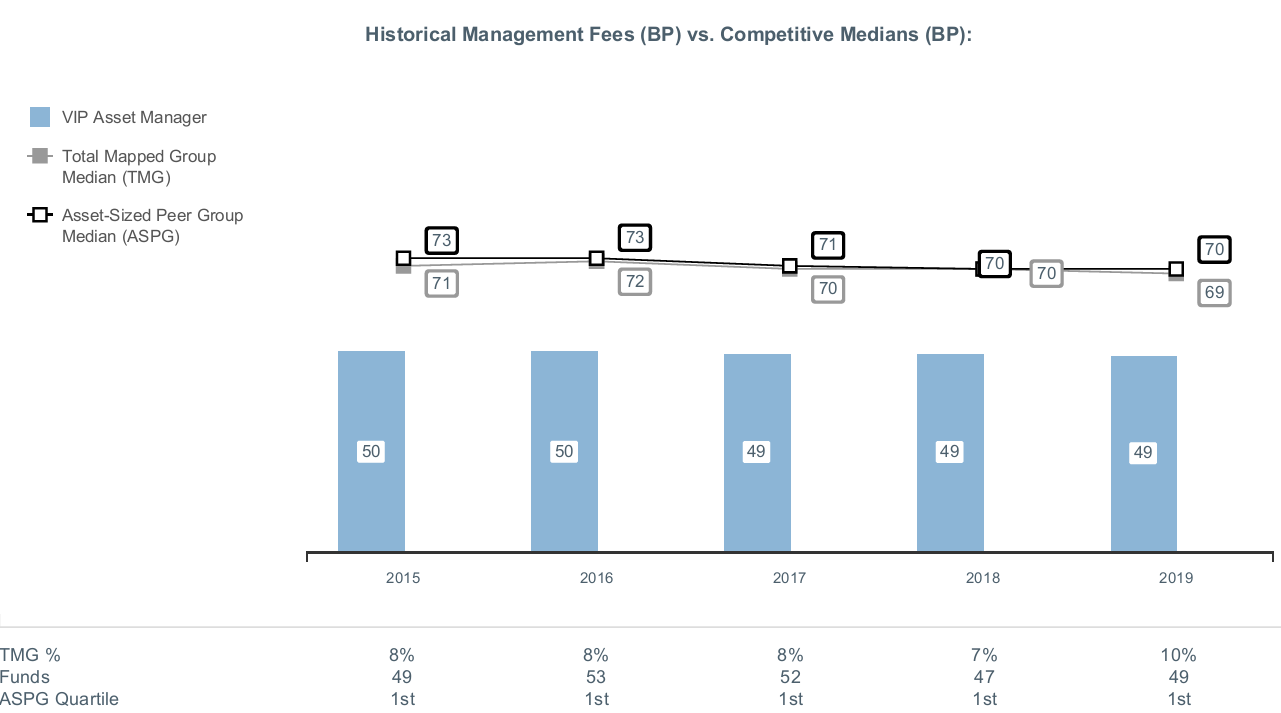
The Board noted that the fund's management fee rate ranked below the median of its Total Mapped Group and below the median of its ASPG for 2019.
The Board noted that it and the boards of other Fidelity funds formed an ad hoc Committee on Group Fee, which meets periodically, to conduct an in-depth review of the "group fee" component of the management fee of funds with such management fee structures. The Committee's focus included the mechanics of the group fee, the competitive landscape of group fee structures, Fidelity funds with no group fee component and investment products not included in group fee assets. The Board also considered that, for funds subject to the group fee, FMR agreed to voluntarily waive fees over a specified period of time in amounts designed to account for assets converted from certain funds to certain collective investment trusts.
Based on its review, the Board concluded that the fund's management fee is fair and reasonable in light of the services that the fund receives and the other factors considered.
Total Expense Ratio. In its review of each class's total expense ratio, the Board considered the fund's management fee rate as well as other fund or class expenses, as applicable, such as transfer agent fees, pricing and bookkeeping fees, fund-paid 12b-1 fees, and custodial, legal, and audit fees. The Board also noted that Fidelity may agree to waive fees or reimburse expenses from time to time, and the extent to which, if any, it has done so for the fund. As part of its review, the Board also considered the current and historical total expense ratios of each class of the fund compared to competitive fund median expenses. Each class of the fund is compared to those funds and classes in the Total Mapped Group (used by the Board for management fee comparisons) that have a similar sales load structure.
The Board noted that the total expense ratio of each class ranked below the competitive median for 2019.
Fees Charged to Other Fidelity Clients. The Board also considered Fidelity fee structures and other information with respect to clients of Fidelity, such as other funds advised or subadvised by Fidelity, pension plan clients, and other institutional clients with similar mandates. The Board noted that a joint ad hoc committee created by it and the boards of other Fidelity funds periodically reviews and compares Fidelity's institutional investment advisory business with its business of providing services to the Fidelity funds and also noted the most recent findings of the committee. The Board noted that the committee's review included a consideration of the differences in services provided, fees charged, and costs incurred, as well as competition in the markets serving the different categories of clients.
Based on its review of total expense ratios and fees charged to other Fidelity clients, the Board concluded that the total expense ratio of each class of the fund was reasonable in light of the services that the fund and its shareholders receive and the other factors considered.
Costs of the Services and Profitability. The Board considered the revenues earned and the expenses incurred by Fidelity in conducting the business of developing, marketing, distributing, managing, administering and servicing the fund and servicing the fund's shareholders. The Board also considered the level of Fidelity's profits in respect of all the Fidelity funds.
On an annual basis, Fidelity presents to the Board information about the profitability of its relationships with the fund. Fidelity calculates profitability information for each fund, as well as aggregate profitability information for groups of Fidelity funds and all Fidelity funds, using a series of detailed revenue and cost allocation methodologies which originate with the books and records of Fidelity on which Fidelity's audited financial statements are based. The Audit Committee of the Board reviews any significant changes from the prior year's methodologies and the full Board approves such changes.
A public accounting firm has been engaged annually by the Board as part of the Board's assessment of Fidelity's profitability analysis. The engagement includes the review and assessment of the methodologies used by Fidelity in determining the revenues and expenses attributable to Fidelity's mutual fund business, and completion of agreed-upon procedures in respect of the mathematical accuracy of certain fund profitability information and its conformity to established allocation methodologies. After considering the reports issued under the engagement and information provided by Fidelity, the Board concluded that while other allocation methods may also be reasonable, Fidelity's profitability methodologies are reasonable in all material respects.
The Board also reviewed Fidelity's non-fund businesses and potential indirect benefits such businesses may have received as a result of their association with Fidelity's mutual fund business (i.e., fall-out benefits) as well as cases where Fidelity's affiliates may benefit from the funds' business. The Board considered areas where potential indirect benefits to the Fidelity funds from their relationships with Fidelity may exist. The Board also considered that in 2019 a joint ad hoc committee created by it and the boards of other Fidelity funds evaluated potential fall-out benefits (PFOB Committee). The Board noted that it considered the PFOB Committee's findings in connection with its consideration of the renewal of the Advisory Contracts.
The Board considered the costs of the services provided by and the profits realized by Fidelity in connection with the operation of the fund, including the conclusions of the PFOB Committee, and was satisfied that the profitability was not excessive.
Economies of Scale. The Board considered whether there have been economies of scale in respect of the management of the Fidelity funds, whether the Fidelity funds (including the fund) have appropriately benefited from any such economies of scale, and whether there is potential for realization of any further economies of scale. The Board considered the extent to which the fund will benefit from economies of scale as assets grow through increased services to the fund, through waivers or reimbursements, or through fee or expense ratio reductions. The Board also noted that a committee (the Economies of Scale Committee) created by it and the boards of other Fidelity funds periodically analyzes whether Fidelity attains economies of scale in respect of the management and servicing of the Fidelity funds, whether the Fidelity funds have appropriately benefited from such economies of scale, and whether there is potential for realization of any further economies of scale.
The Board recognized that the fund's management contract incorporates a "group fee" structure, which provides for lower group fee rates as total "group assets" increase, and for higher group fee rates as total "group assets" decrease ("group assets" as defined in the management contract). FMR calculates the group fee rates based on a tiered asset "breakpoint" schedule that varies based on asset class. The Board considered that the group fee is designed to deliver the benefits of economies of scale to fund shareholders when total Fidelity fund assets increase, even if assets of any particular fund are unchanged or have declined, because some portion of Fidelity's costs are attributable to services provided to all Fidelity funds, and all funds benefit if those costs can be allocated among more assets. The Board concluded that, given the group fee structure, fund shareholders will benefit from lower management fees as "group assets" increase at the fund complex level, regardless of whether Fidelity achieves any such economies of scale.
The Board concluded, taking into account the analysis of the Economies of Scale Committee, that economies of scale, if any, are being appropriately shared between fund shareholders and Fidelity.
Additional Information Requested by the Board. In order to develop fully the factual basis for consideration of the Fidelity funds' advisory contracts, the Board requested and received additional information on certain topics, including: (i) Fidelity's fund profitability methodology, profitability trends for certain funds, the allocation of various costs to different funds, and the impact of certain factors on fund profitability results; (ii) portfolio manager changes that have occurred during the past year and the amount of the investment that each portfolio manager has made in the Fidelity fund(s) that he or she manages; (iii) Fidelity's compensation structure for portfolio managers, research analysts, and other key personnel, including its effects on fund profitability, the rationale for the compensation structure, and the extent to which current market conditions have affected retention and recruitment; (iv) the arrangements with and compensation paid to certain fund sub-advisers on behalf of the Fidelity funds and the treatment of such compensation within Fidelity's fund profitability methodology; (v) the terms of the funds' various management fee structures, including the basic group fee and the terms of Fidelity's voluntary expense limitation agreements; (vi) Fidelity's transfer agent fee, expense, and service structures for different funds and classes relative to competitive trends; (vii) the impact on fund profitability of recent industry trends, such as the growth in passively managed funds and outflows from actively managed equity funds; and (viii) explanations regarding the relative total expense ratios of certain funds and classes, total expense competitive trends and methodologies for total expense competitive comparisons, and actions that might be taken by Fidelity to reduce total expense ratios for certain classes. In addition, the Board considered its discussions with Fidelity regarding Fidelity's efforts to maintain the continuous investment and shareholder services necessary for the funds during the current pandemic and economic circumstances.
Based on its evaluation of all of the conclusions noted above, and after considering all factors it believed relevant, the Board concluded that the advisory fee arrangements are fair and reasonable, and that the fund's Advisory Contracts should be renewed.
VIPAM-ANN-0221
1.540206.123
Fidelity® Variable Insurance Products:
Strategic Income Portfolio
Annual Report
December 31, 2020
Contents
To view a fund's proxy voting guidelines and proxy voting record for the 12-month period ended June 30, visit http://www.fidelity.com/proxyvotingresults or visit the Securities and Exchange Commission's (SEC) web site at http://www.sec.gov.
You may also call 1-877-208-0098 to request a free copy of the proxy voting guidelines.
Fidelity® Variable Insurance Products are separate account options which are purchased through a variable insurance contract.
Standard & Poor's, S&P and S&P 500 are registered service marks of The McGraw-Hill Companies, Inc. and have been licensed for use by Fidelity Distributors Corporation.
Other third-party marks appearing herein are the property of their respective owners.
All other marks appearing herein are registered or unregistered trademarks or service marks of FMR LLC or an affiliated company. © 2021 FMR LLC. All rights reserved.
This report and the financial statements contained herein are submitted for the general information of the shareholders of the Fund. This report is not authorized for distribution to prospective investors in the Fund unless preceded or accompanied by an effective prospectus.
A fund files its complete schedule of portfolio holdings with the SEC for the first and third quarters of each fiscal year on Form N-PORT. Forms N-PORT are available on the SEC’s web site at http://www.sec.gov. A fund's Forms N-PORT may be reviewed and copied at the SEC’s Public Reference Room in Washington, DC. Information regarding the operation of the SEC's Public Reference Room may be obtained by calling 1-800-SEC-0330.
For a complete list of a fund's portfolio holdings, view the most recent holdings listing, semiannual report, or annual report on Fidelity's web site at http://www.fidelity.com, http://www.institutional.fidelity.com, or http://www.401k.com, as applicable.
NOT FDIC INSURED •MAY LOSE VALUE •NO BANK GUARANTEE
Neither the Fund nor Fidelity Distributors Corporation is a bank.
Note to Shareholders:
Early in 2020, the outbreak and spread of a new coronavirus emerged as a public health emergency that had a major influence on financial markets, primarily based on its impact on the global economy and the outlook for corporate earnings. The virus causes a respiratory disease known as COVID-19. On March 11, the World Health Organization declared the COVID-19 outbreak a pandemic, citing sustained risk of further global spread.
In the weeks following, as the crisis worsened, we witnessed an escalating human tragedy with wide-scale social and economic consequences from coronavirus-containment measures. The outbreak of COVID-19 prompted a number of measures to limit the spread, including travel and border restrictions, quarantines, and restrictions on large gatherings. In turn, these resulted in lower consumer activity, diminished demand for a wide range of products and services, disruption in manufacturing and supply chains, and – given the wide variability in outcomes regarding the outbreak – significant market uncertainty and volatility. Amid the turmoil, global governments and central banks took unprecedented action to help support consumers, businesses, and the broader economies, and to limit disruption to financial systems.
The situation continues to unfold, and the extent and duration of its impact on financial markets and the economy remain highly uncertain. Extreme events such as the coronavirus crisis are “exogenous shocks” that can have significant adverse effects on mutual funds and their investments. Although multiple asset classes may be affected by market disruption, the duration and impact may not be the same for all types of assets.
Fidelity is committed to helping you stay informed amid news about COVID-19 and during increased market volatility, and we’re taking extra steps to be responsive to customer needs. We encourage you to visit our websites, where we offer ongoing updates, commentary, and analysis on the markets and our funds.
Performance: The Bottom Line
Average annual total return reflects the change in the value of an investment, assuming reinvestment of distributions from dividend income and capital gains (the profits earned upon the sale of securities that have grown in value, if any) and assuming a constant rate of performance each year. During periods of reimbursement by Fidelity, a fund’s total return will be greater than it would be had the reimbursement not occurred. Performance numbers are net of all underlying fund operating expenses, but do not include any insurance charges imposed by your insurance company’s separate account. If performance information included the effect of these additional charges, the total returns would have been lower. How a fund did yesterday is no guarantee of how it will do tomorrow.
Average Annual Total Returns
| For the periods ended December 31, 2020 | Past 1 year | Past 5 years | Past 10 years |
| Initial Class | 7.52% | 6.27% | 4.83% |
| Service Class | 7.56% | 6.20% | 4.74% |
| Service Class 2 | 7.25% | 6.02% | 4.58% |
| Investor Class | 7.51% | 6.24% | 4.79% |
$10,000 Over 10 Years
Let's say hypothetically that $10,000 was invested in VIP Strategic Income Portfolio - Initial Class on December 31, 2010.
The chart shows how the value of your investment would have changed, and also shows how the Bloomberg Barclays U.S. Universal Bond Index performed over the same period.

| Period Ending Values |
| $16,025 | VIP Strategic Income Portfolio - Initial Class |
| $15,036 | Bloomberg Barclays U.S. Universal Bond Index |
Management's Discussion of Fund Performance
Market Recap: Financial markets experienced a highly volatile and unpredictable year that will be remembered by most investors for the impact of the coronavirus pandemic. The early-2020 outbreak and spread of COVID-19 resulted in high yield bonds suffering a swift decline through March 23, followed by a historic rebound through year-end. Declared a pandemic on March 11, the crisis and containment efforts caused broad economic contraction, along with extreme uncertainty, volatility and dislocation in financial markets. A historically rapid and expansive U.S. monetary/fiscal-policy response provided a partial offset to the economic disruption and fueled the market surge, as did resilient corporate earnings and potential for a COVID-19 vaccine breakthrough. Against this backdrop, the Fidelity Strategic Income Composite Index℠ gained 6.63%. Within the index, high-yield bonds fared best, with the ICE BofA
® U.S. High Yield Constrained Index, a proxy for the high-yield bond market, gaining 8.24%, as credit spreads narrowed from historically wide levels at the height of the pandemic in early 2020. U.S. government bonds, as measured by the Bloomberg Barclays U.S. Government Bond Index, rose 7.94%, compared with an advance of 4.87% for non-U.S. developed-markets debt, as measured by the Bloomberg Barclays Global Aggregate Developed Markets GDP Weighted Ex USD Index (Hedged). Elsewhere, floating-rate bonds, as measured by the S&P/LSTA
® Leveraged Performing Loan Index, were up 3.50% in 2020.
Comments from Co-Lead Portfolio Manager Adam Kramer: For the year, the fund's share classes (excluding sales charges, if applicable) rose roughly 7% to 8%, outperforming the 6.63% gain of the Fidelity Strategic Income Composite Index. Favorable security selection was the main driver of the funds' relative outperformance, while asset allocation also contributed to a lesser extent. By far, security selection in the fund's high-yield bond subportfolio helped the most, while overweighting this outperforming asset class also added value. Much of the relative outperformance came from this subportfolio's out-of-benchmark equity allocation, as stocks notably outpaced corporate bonds during the year. In industry terms, security selection in the technology, telecommunications and gaming categories particularly helped, even as security selection and industry allocation in energy and air transportation hurt. Also contributing was security selection combined with a helpful overweighting in the fund's non-U.S. developed debt subportfolio. Here, defensive positioning contributed during the first-quarter sell-off in global financial markets, as did the manager's subsequent decision to tactically add back risk as asset prices recovered. Favorably timed asset class positioning in the fund's U.S. government bond subportfolio further helped. On the negative side, bond selection in the emerging-markets debt subportfolio detracted due to weak bond picks in Mexico and Ukraine, as well as an overweighting in the lagging Argentinian market. Security selection and an overweighting in the lagging floating-rate debt subportfolio also modestly detracted.
The views expressed above reflect those of the portfolio manager(s) only through the end of the period as stated on the cover of this report and do not necessarily represent the views of Fidelity or any other person in the Fidelity organization. Any such views are subject to change at any time based upon market or other conditions and Fidelity disclaims any responsibility to update such views. These views may not be relied on as investment advice and, because investment decisions for a Fidelity fund are based on numerous factors, may not be relied on as an indication of trading intent on behalf of any Fidelity fund.
Investment Summary (Unaudited)
The information in the following tables is based on the combined investments of the Fund and its pro-rata share of the investments of Fidelity's Fixed-Income Central Funds.
Top Five Holdings as of December 31, 2020
| (by issuer, excluding cash equivalents) | % of fund's net assets |
| U.S. Treasury Obligations | 16.8 |
| German Federal Republic | 4.3 |
| CCO Holdings LLC/CCO Holdings Capital Corp. | 1.9 |
| Ally Financial, Inc. | 1.6 |
| JPMorgan Chase & Co. | 1.3 |
| | 25.9 |
Top Five Market Sectors as of December 31, 2020
| | % of fund's net assets |
| Communication Services | 10.2 |
| Financials | 9.8 |
| Energy | 8.8 |
| Consumer Discretionary | 6.3 |
| Industrials | 5.3 |
Quality Diversification (% of fund's net assets)
| As of December 31, 2020 |
| | U.S. Government and U.S. Government Agency Obligations* | 17.3% |
| | AAA,AA,A | 4.7% |
| | BBB | 7.0% |
| | BB | 18.1% |
| | B | 24.3% |
| | CCC,CC,C | 5.7% |
| | Not Rated | 8.4% |
| | Equities | 7.3% |
| | Short-Term Investments and Net Other Assets | 7.2% |
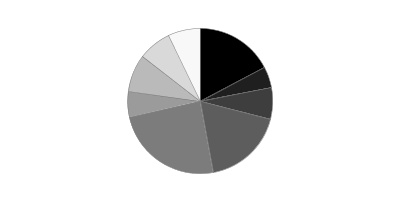
* Includes NCUA Guaranteed Notes
We have used ratings from Moody's Investors Service, Inc. Where Moody's® ratings are not available, we have used S&P® ratings. All ratings are as of the date indicated and do not reflect subsequent changes.
Asset Allocation (% of fund's net assets)
| As of December 31, 2020*,**,***,† |
| | Preferred Securities | 4.9% |
| | Corporate Bonds | 38.6% |
| | U.S. Government and U.S. Government Agency Obligations†† | 17.3% |
| | Foreign Government & Government Agency Obligations | 15.6% |
| | Bank Loan Obligations | 9.1% |
| | Stocks | 7.3% |
| | Short-Term Investments and Net Other Assets (Liabilities) | 7.2% |

* Futures and Swaps - 3.6%
** Written options - (0.5)%
*** Foreign investments - 28.6%
† Foreign Currency Contracts - (9.0)%
†† Includes NCUA Guaranteed Notes
An unaudited holdings listing for the Fund, which presents direct holdings as well as the pro-rata share of any securities and other investments held indirectly through its investment in underlying non-money market Fidelity Central Funds, is available at fidelity.com and/or institutional.fidelity.com, as applicable.
Schedule of Investments December 31, 2020
Showing Percentage of Net Assets
| Corporate Bonds - 38.3% | | | |
| | | Principal Amount(a) | Value |
| Convertible Bonds - 0.1% | | | |
| ENERGY - 0.1% | | | |
| Energy Equipment & Services - 0.1% | | | |
| Forum Energy Technologies, Inc. 9% 8/4/25 | | $718,113 | $459,592 |
| Oil, Gas & Consumable Fuels - 0.0% | | | |
| Mesquite Energy, Inc.: | | | |
| 15% 7/15/23 (b)(c) | | 175,000 | 175,000 |
| 15% 7/15/23 (b)(c) | | 99,538 | 99,538 |
| | | | 274,538 |
| TOTAL ENERGY | | | 734,130 |
| Nonconvertible Bonds - 38.2% | | | |
| COMMUNICATION SERVICES - 7.8% | | | |
| Diversified Telecommunication Services - 2.4% | | | |
| Axtel S.A.B. de CV 6.375% 11/14/24 (d) | | 100,000 | 104,219 |
| C&W Senior Financing Designated Activity Co. 6.875% 9/15/27 (d) | | 1,435,000 | 1,548,178 |
| Cablevision Lightpath LLC: | | | |
| 3.875% 9/15/27 (d) | | 325,000 | 327,031 |
| 5.625% 9/15/28 (d) | | 260,000 | 272,025 |
| Colombia Telecomunicaciones SA 4.95% 7/17/30 (d) | | 210,000 | 233,034 |
| Frontier Communications Corp.: | | | |
| 5% 5/1/28 (d) | | 1,165,000 | 1,214,513 |
| 5.875% 10/15/27 (d) | | 620,000 | 670,375 |
| 6.75% 5/1/29 (d) | | 745,000 | 797,150 |
| Liquid Telecommunications Financing PLC 8.5% 7/13/22 (d) | | 350,000 | 356,563 |
| Qtel International Finance Ltd.: | | | |
| 3.25% 2/21/23 (d) | | 450,000 | 470,250 |
| 5% 10/19/25 (d) | | 230,000 | 268,453 |
| Qwest Corp. 7.25% 9/15/25 | | 35,000 | 41,388 |
| Sable International Finance Ltd. 5.75% 9/7/27 (d) | | 1,395,000 | 1,483,931 |
| SFR Group SA: | | | |
| 5.5% 1/15/28 (d) | | 1,190,000 | 1,244,157 |
| 7.375% 5/1/26 (d) | | 5,100,000 | 5,367,750 |
| 8.125% 2/1/27 (d) | | 370,000 | 407,929 |
| Sprint Capital Corp.: | | | |
| 6.875% 11/15/28 | | 8,522,000 | 11,236,087 |
| 8.75% 3/15/32 | | 3,506,000 | 5,551,313 |
| Telecom Argentina SA 8.5% 8/6/25 (d) | | 140,000 | 130,769 |
| Telefonica Celular del Paraguay SA 5.875% 4/15/27 (d) | | 455,000 | 485,428 |
| Telefonica del Peru SA 7.375% 4/10/27 (d) | PEN | 1,630,000 | 470,539 |
| Telenet Finance Luxembourg Notes SARL 5.5% 3/1/28 (d) | | 600,000 | 639,900 |
| Virgin Media Finance PLC 5% 7/15/30 (d) | | 1,385,000 | 1,436,938 |
| Windstream Escrow LLC 7.75% 8/15/28 (d) | | 1,915,000 | 1,928,405 |
| Zayo Group Holdings, Inc. 4% 3/1/27 (d) | | 900,000 | 902,250 |
| | | | 37,588,575 |
| Entertainment - 0.5% | | | |
| Allen Media LLC 10.5% 2/15/28 (d) | | 595,000 | 617,313 |
| Lions Gate Entertainment Corp. 5.875% 11/1/24 (d) | | 215,000 | 218,225 |
| Netflix, Inc.: | | | |
| 4.375% 11/15/26 | | 320,000 | 354,800 |
| 4.875% 4/15/28 | | 1,465,000 | 1,652,081 |
| 5.375% 11/15/29 (d) | | 590,000 | 695,463 |
| 5.875% 11/15/28 | | 3,265,000 | 3,913,919 |
| Total Play Telecomunicaciones SA de CV 7.5% 11/12/25 (d) | | 585,000 | 581,527 |
| | | | 8,033,328 |
| Interactive Media & Services - 0.1% | | | |
| ANGI Homeservices, Inc. 3.875% 8/15/28 (d) | | 335,000 | 340,943 |
| Baidu.com, Inc.: | | | |
| 1.72% 4/9/26 | | 285,000 | 288,580 |
| 2.375% 10/9/30 | | 270,000 | 275,991 |
| Tencent Holdings Ltd.: | | | |
| 2.39% 6/3/30 (d) | | 295,000 | 302,098 |
| 3.975% 4/11/29 (d) | | 180,000 | 204,919 |
| | | | 1,412,531 |
| Media - 4.1% | | | |
| Altice Financing SA 5% 1/15/28 (d) | | 2,250,000 | 2,305,429 |
| Block Communications, Inc. 4.875% 3/1/28 (d) | | 410,000 | 422,300 |
| Cable Onda SA 4.5% 1/30/30 (d) | | 515,000 | 568,109 |
| CCO Holdings LLC/CCO Holdings Capital Corp.: | | | |
| 4.25% 2/1/31 (d) | | 1,005,000 | 1,059,129 |
| 4.5% 8/15/30 (d) | | 4,690,000 | 4,977,263 |
| 4.5% 5/1/32 (d) | | 665,000 | 710,034 |
| 4.75% 3/1/30 (d) | | 4,810,000 | 5,189,990 |
| 5% 2/1/28 (d) | | 4,665,000 | 4,933,238 |
| 5.125% 5/1/27 (d) | | 3,500,000 | 3,714,165 |
| 5.375% 6/1/29 (d) | | 4,800,000 | 5,262,000 |
| 5.5% 5/1/26 (d) | | 2,450,000 | 2,538,813 |
| 5.75% 2/15/26 (d) | | 1,030,000 | 1,062,806 |
| 5.875% 5/1/27 (d) | | 855,000 | 888,131 |
| Clear Channel International BV 6.625% 8/1/25 (d) | | 965,000 | 1,018,075 |
| CSC Holdings LLC: | | | |
| 3.375% 2/15/31 (d) | | 860,000 | 843,875 |
| 4.625% 12/1/30 (d) | | 1,430,000 | 1,492,563 |
| 5.375% 2/1/28 (d) | | 1,190,000 | 1,270,325 |
| 5.5% 5/15/26 (d) | | 2,555,000 | 2,657,200 |
| 5.75% 1/15/30 (d) | | 5,510,000 | 6,040,338 |
| 6.5% 2/1/29 (d) | | 1,320,000 | 1,490,346 |
| 7.5% 4/1/28 (d) | | 725,000 | 815,321 |
| Diamond Sports Group LLC/Diamond Sports Finance Co. 5.375% 8/15/26 (d) | | 1,325,000 | 1,076,563 |
| LCPR Senior Secured Financing DAC 6.75% 10/15/27 (d) | | 605,000 | 651,131 |
| Nexstar Broadcasting, Inc.: | | | |
| 4.75% 11/1/28 (d) | | 1,335,000 | 1,396,744 |
| 5.625% 7/15/27 (d) | | 1,275,000 | 1,365,844 |
| Quebecor Media, Inc. 5.75% 1/15/23 | | 790,000 | 853,200 |
| Radiate Holdco LLC/Radiate Financial Service Ltd.: | | | |
| 4.5% 9/15/26 (d) | | 495,000 | 510,469 |
| 6.5% 9/15/28 (d) | | 1,325,000 | 1,391,250 |
| Scripps Escrow II, Inc.: | | | |
| 3.875% 1/15/29 (d) | | 165,000 | 172,012 |
| 5.375% 1/15/31 (d) | | 315,000 | 331,256 |
| Sirius XM Radio, Inc.: | | | |
| 5% 8/1/27 (d) | | 800,000 | 850,008 |
| 5.375% 7/15/26 (d) | | 620,000 | 646,350 |
| Townsquare Media, Inc. 6.875% 2/1/26 (d)(e) | | 325,000 | 340,730 |
| TV Azteca SA de CV 8.25% 8/9/24 (Reg. S) | | 2,300,000 | 1,288,713 |
| Videotron Ltd. 5.125% 4/15/27 (d) | | 615,000 | 652,669 |
| VTR Finance BV 6.375% 7/15/28 (d) | | 320,000 | 348,558 |
| Ziggo Bond Co. BV: | | | |
| 5.125% 2/28/30 (d) | | 315,000 | 332,420 |
| 6% 1/15/27 (d) | | 635,000 | 671,049 |
| Ziggo BV: | | | |
| 4.875% 1/15/30 (d) | | 430,000 | 452,038 |
| 5.5% 1/15/27 (d) | | 1,142,000 | 1,191,963 |
| | | | 63,782,417 |
| Wireless Telecommunication Services - 0.7% | | | |
| America Movil S.A.B. de CV 6.45% 12/5/22 | MXN | 18,930,000 | 965,252 |
| Bharti Airtel International BV 5.35% 5/20/24 (d) | | 325,000 | 358,719 |
| Digicel Group Ltd. 6.75% 3/1/23 (d) | | 270,000 | 203,850 |
| Intelsat Jackson Holdings SA: | | | |
| 5.5% 8/1/23 (f) | | 2,395,000 | 1,622,613 |
| 8% 2/15/24 (d) | | 1,285,000 | 1,315,519 |
| 8.5% 10/15/24 (d)(f) | | 1,150,000 | 822,250 |
| 9.75% 7/15/25 (d)(f) | | 1,950,000 | 1,404,000 |
| Millicom International Cellular SA 4.5% 4/27/31 (d) | | 645,000 | 696,600 |
| MTN (Mauritius) Investments Ltd. 6.5% 10/13/26 (d) | | 315,000 | 360,084 |
| Silknet JSC 11% 4/2/24 (Reg. S) | | 200,000 | 217,000 |
| Sprint Corp. 7.625% 3/1/26 | | 540,000 | 670,245 |
| TBG Global Pte. Ltd. 5.25% 2/10/22 (Reg. S) | | 400,000 | 400,832 |
| VimpelCom Holdings BV: | | | |
| 3.375% 11/25/27 (d) | | 410,000 | 422,300 |
| 7.25% 4/26/23 (d) | | 445,000 | 492,366 |
| VTR Comunicaciones SpA 5.125% 1/15/28 (d) | | 410,000 | 436,394 |
| | | | 10,388,024 |
| TOTAL COMMUNICATION SERVICES | | | 121,204,875 |
| CONSUMER DISCRETIONARY - 3.2% | | | |
| Auto Components - 0.1% | | | |
| Allison Transmission, Inc. 5.875% 6/1/29 (d) | | 420,000 | 465,150 |
| Exide Technologies: | | | |
| 11% 10/31/24 pay-in-kind (c)(d)(f)(g) | | 384,000 | 0 |
| 11% 10/31/24 pay-in-kind (c)(d)(f)(g) | | 185,848 | 83,632 |
| Metalsa SA de CV 4.9% 4/24/23 (d) | | 945,000 | 987,525 |
| | | | 1,536,307 |
| Automobiles - 0.0% | | | |
| Tesla, Inc. 5.3% 8/15/25 (d) | | 80,000 | 83,400 |
| Diversified Consumer Services - 0.1% | | | |
| GEMS MENASA Cayman Ltd. 7.125% 7/31/26 (d) | | 710,000 | 736,625 |
| Sotheby's 7.375% 10/15/27 (d) | | 295,000 | 316,019 |
| | | | 1,052,644 |
| Hotels, Restaurants & Leisure - 2.2% | | | |
| 1011778 BC Unlimited Liability Co./New Red Finance, Inc.: | | | |
| 4% 10/15/30 (d) | | 2,320,000 | 2,337,400 |
| 4.375% 1/15/28 (d) | | 560,000 | 576,800 |
| Affinity Gaming LLC 6.875% 12/15/27 (d) | | 250,000 | 261,563 |
| Caesars Entertainment, Inc.: | | | |
| 6.25% 7/1/25 (d) | | 2,520,000 | 2,683,800 |
| 8.125% 7/1/27 (d) | | 3,360,000 | 3,719,596 |
| Caesars Resort Collection LLC 5.75% 7/1/25 (d) | | 840,000 | 890,045 |
| Carnival Corp.: | | | |
| 7.625% 3/1/26 (d) | | 500,000 | 544,745 |
| 9.875% 8/1/27 (d) | | 1,000,000 | 1,150,000 |
| 10.5% 2/1/26 (d) | | 730,000 | 850,450 |
| 11.5% 4/1/23 (d) | | 1,990,000 | 2,301,873 |
| Choice Hotels International, Inc. 5.75% 7/1/22 | | 145,000 | 154,095 |
| Hilton Domestic Operating Co., Inc.: | | | |
| 3.75% 5/1/29 (d) | | 330,000 | 344,088 |
| 4% 5/1/31 (d) | | 500,000 | 527,555 |
| 4.875% 1/15/30 | | 975,000 | 1,065,188 |
| 5.125% 5/1/26 | | 925,000 | 955,063 |
| Hilton Worldwide Finance LLC/Hilton Worldwide Finance Corp. 4.875% 4/1/27 | | 435,000 | 460,415 |
| MCE Finance Ltd.: | | | |
| 4.875% 6/6/25 (d) | | 1,832,000 | 1,887,913 |
| 5.25% 4/26/26 (d) | | 640,000 | 669,120 |
| 5.375% 12/4/29 (d) | | 435,000 | 451,616 |
| 5.75% 7/21/28 (d) | | 335,000 | 356,943 |
| Merlin Entertainments PLC 5.75% 6/15/26 (d) | | 395,000 | 414,632 |
| MGM Resorts International: | | | |
| 4.75% 10/15/28 | | 665,000 | 712,794 |
| 6.75% 5/1/25 | | 1,485,000 | 1,607,364 |
| NagaCorp Ltd.: | | | |
| 7.95% 7/6/24 (Reg. S) | | 400,000 | 416,625 |
| 9.375% 5/21/21 (d) | | 625,000 | 634,961 |
| NCL Corp. Ltd.: | | | |
| 5.875% 3/15/26 (d) | | 390,000 | 410,963 |
| 12.25% 5/15/24 (d) | | 905,000 | 1,086,000 |
| Peninsula Pacific Entertainment LLC 8.5% 11/15/27 (d) | | 665,000 | 711,550 |
| Royal Caribbean Cruises Ltd.: | | | |
| 10.875% 6/1/23 (d) | | 845,000 | 961,509 |
| 11.5% 6/1/25 (d) | | 1,230,000 | 1,434,488 |
| SeaWorld Parks & Entertainment, Inc. 9.5% 8/1/25 (d) | | 545,000 | 591,666 |
| Vail Resorts, Inc. 6.25% 5/15/25 (d) | | 380,000 | 405,650 |
| Viking Cruises Ltd.: | | | |
| 5.875% 9/15/27 (d) | | 595,000 | 581,897 |
| 13% 5/15/25 (d) | | 570,000 | 681,150 |
| Voc Escrow Ltd. 5% 2/15/28 (d) | | 545,000 | 540,913 |
| Wynn Macau Ltd.: | | | |
| 5.125% 12/15/29 (d) | | 890,000 | 908,913 |
| 5.5% 1/15/26 (d) | | 365,000 | 379,600 |
| | | | 34,668,943 |
| Household Durables - 0.2% | | | |
| Brookfield Residential Properties, Inc./Brookfield Residential U.S. Corp. 4.875% 2/15/30 (d) | | 405,000 | 418,669 |
| LGI Homes, Inc. 6.875% 7/15/26 (d) | | 605,000 | 635,250 |
| Taylor Morrison Communities, Inc./Monarch Communities, Inc. 5.625% 3/1/24 (d) | | 65,000 | 69,794 |
| TRI Pointe Group, Inc./TRI Pointe Holdings, Inc. 5.875% 6/15/24 | | 780,000 | 851,370 |
| TRI Pointe Homes, Inc. 5.7% 6/15/28 | | 865,000 | 976,585 |
| | | | 2,951,668 |
| Internet & Direct Marketing Retail - 0.3% | | | |
| B2W Digital Lux SARL 4.375% 12/20/30 (d) | | 440,000 | 455,400 |
| JD.com, Inc. 3.375% 1/14/30 | | 450,000 | 488,284 |
| Meituan: | | | |
| 2.125% 10/28/25 (d) | | 395,000 | 401,387 |
| 3.05% 10/28/30 (d) | | 335,000 | 349,028 |
| Prosus NV: | | | |
| 2.031% 8/3/32 (Reg. S) | EUR | 210,000 | 266,808 |
| 3.68% 1/21/30 (d) | | 205,000 | 222,553 |
| 4.027% 8/3/50 (d) | | 595,000 | 617,313 |
| Terrier Media Buyer, Inc. 8.875% 12/15/27 (d) | | 2,160,000 | 2,381,400 |
| | | | 5,182,173 |
| Specialty Retail - 0.3% | | | |
| Asbury Automotive Group, Inc.: | | | |
| 4.5% 3/1/28 | | 184,000 | 191,820 |
| 4.75% 3/1/30 | | 184,000 | 197,340 |
| Burlington Coat Factory Warehouse Corp. 6.25% 4/15/25 (d) | | 200,000 | 212,500 |
| L Brands, Inc.: | | | |
| 6.625% 10/1/30 (d) | | 330,000 | 364,650 |
| 6.75% 7/1/36 | | 1,025,000 | 1,141,978 |
| 6.875% 11/1/35 | | 335,000 | 376,038 |
| 7.5% 6/15/29 | | 500,000 | 556,250 |
| LBM Acquisition LLC 6.25% 1/15/29 (d) | | 270,000 | 280,889 |
| Penske Automotive Group, Inc. 5.5% 5/15/26 | | 460,000 | 477,825 |
| | | | 3,799,290 |
| Textiles, Apparel & Luxury Goods - 0.0% | | | |
| Delta Merlin Dunia Tekstil PT 8.625% 3/12/24 (d)(f) | | 200,000 | 9,438 |
| TOTAL CONSUMER DISCRETIONARY | | | 49,283,863 |
| CONSUMER STAPLES - 1.8% | | | |
| Beverages - 0.0% | | | |
| Central American Bottling Corp. 5.75% 1/31/27 (d) | | 325,000 | 344,297 |
| Food & Staples Retailing - 0.6% | | | |
| Albertsons Companies LLC/Safeway, Inc./New Albertson's, Inc./Albertson's LLC: | | | |
| 3.5% 3/15/29 (d) | | 525,000 | 530,250 |
| 4.625% 1/15/27 (d) | | 865,000 | 920,144 |
| 4.875% 2/15/30 (d) | | 4,920,000 | 5,421,250 |
| C&S Group Enterprises LLC 5% 12/15/28 (d) | | 510,000 | 508,689 |
| KeHE Distributors LLC / KeHE Finance Corp. 8.625% 10/15/26 (d) | | 525,000 | 589,313 |
| Performance Food Group, Inc. 5.5% 10/15/27 (d) | | 475,000 | 501,125 |
| SEG Holding LLC/SEG Finance Corp. 5.625% 10/15/28 (d) | | 665,000 | 701,575 |
| United Natural Foods, Inc. 6.75% 10/15/28 (d) | | 465,000 | 486,497 |
| | | | 9,658,843 |
| Food Products - 1.2% | | | |
| Camposol SA 6% 2/3/27 (d) | | 225,000 | 236,742 |
| Chobani LLC/Finance Corp., Inc. 4.625% 11/15/28 (d) | | 375,000 | 380,625 |
| Del Monte Foods, Inc. 11.875% 5/15/25 (d) | | 380,000 | 431,300 |
| JBS Investments II GmbH: | | | |
| 5.75% 1/15/28 (d) | | 575,000 | 615,256 |
| 7% 1/15/26 (d) | | 760,000 | 820,572 |
| JBS U.S.A. LLC/JBS U.S.A. Finance, Inc.: | | | |
| 5.75% 6/15/25 (d) | | 1,275,000 | 1,316,438 |
| 6.75% 2/15/28 (d) | | 925,000 | 1,039,238 |
| JBS U.S.A. Lux SA / JBS Food Co.: | | | |
| 5.5% 1/15/30 (d) | | 1,085,000 | 1,246,405 |
| 6.5% 4/15/29 (d) | | 1,550,000 | 1,805,750 |
| Lamb Weston Holdings, Inc.: | | | |
| 4.625% 11/1/24 (d) | | 425,000 | 443,063 |
| 4.875% 11/1/26 (d) | | 430,000 | 449,479 |
| MHP SA 7.75% 5/10/24 (d) | | 345,000 | 377,559 |
| Pilgrim's Pride Corp. 5.75% 3/15/25 (d) | | 925,000 | 949,605 |
| Post Holdings, Inc.: | | | |
| 4.625% 4/15/30 (d) | | 3,850,000 | 4,050,046 |
| 5% 8/15/26 (d) | | 2,440,000 | 2,519,300 |
| 5.5% 12/15/29 (d) | | 810,000 | 883,913 |
| 5.75% 3/1/27 (d) | | 405,000 | 428,794 |
| TreeHouse Foods, Inc. 4% 9/1/28 | | 220,000 | 227,563 |
| | | | 18,221,648 |
| TOTAL CONSUMER STAPLES | | | 28,224,788 |
| ENERGY - 6.4% | | | |
| Energy Equipment & Services - 0.4% | | | |
| ADES International Holding Ltd. 8.625% 4/24/24 (d) | | 650,000 | 648,375 |
| Borets Finance DAC 6% 9/17/26 (d) | | 215,000 | 223,600 |
| Diamond Offshore Drilling, Inc.: | | | |
| 4.875% 11/1/43 (f) | | 25,000 | 3,063 |
| 5.7% 10/15/39 (f) | | 145,000 | 17,763 |
| Exterran Energy Solutions LP 8.125% 5/1/25 | | 575,000 | 480,125 |
| Nabors Industries Ltd.: | | | |
| 7.25% 1/15/26 (d) | | 595,000 | 417,196 |
| 7.5% 1/15/28 (d) | | 510,000 | 349,197 |
| Nine Energy Service, Inc. 8.75% 11/1/23 (d) | | 300,000 | 133,500 |
| NuStar Logistics LP 6% 6/1/26 | | 640,000 | 692,166 |
| Oleoducto Central SA 4% 7/14/27 (d) | | 340,000 | 368,688 |
| SESI LLC 7.75% 9/15/24 (f) | | 365,000 | 116,800 |
| Southern Gas Corridor CJSC 6.875% 3/24/26 (d) | | 590,000 | 710,950 |
| State Oil Co. of Azerbaijan Republic 6.95% 3/18/30 (Reg. S) | | 200,000 | 255,773 |
| Summit Midstream Holdings LLC 5.75% 4/15/25 | | 285,000 | 182,400 |
| The Oil and Gas Holding Co.: | | | |
| 7.5% 10/25/27 (d) | | 505,000 | 575,700 |
| 7.625% 11/7/24 (d) | | 855,000 | 956,264 |
| 8.375% 11/7/28 (d) | | 180,000 | 211,950 |
| | | | 6,343,510 |
| Oil, Gas & Consumable Fuels - 6.0% | | | |
| Antero Midstream Partners LP/Antero Midstream Finance Corp. 5.75% 1/15/28 (d) | | 955,000 | 916,991 |
| Antero Resources Corp. 5.625% 6/1/23 (Reg. S) | | 115,000 | 112,700 |
| Callon Petroleum Co.: | | | |
| 6.125% 10/1/24 | | 225,000 | 129,375 |
| 6.25% 4/15/23 | | 380,000 | 241,300 |
| Cheniere Energy, Inc. 4.625% 10/15/28 (d) | | 1,325,000 | 1,391,250 |
| Chesapeake Energy Corp.: | | | |
| 7% 10/1/24 (f) | | 360,000 | 16,200 |
| 8% 1/15/25 (f) | | 180,000 | 8,100 |
| 8% 6/15/27 (f) | | 115,000 | 5,175 |
| 11.5% 1/1/25 (d)(f) | | 1,310,000 | 229,250 |
| Citgo Holding, Inc. 9.25% 8/1/24 (d) | | 2,195,000 | 2,019,400 |
| Citgo Petroleum Corp.: | | | |
| 6.25% 8/15/22 (d) | | 1,850,000 | 1,813,000 |
| 7% 6/15/25 (d) | | 1,340,000 | 1,336,650 |
| CNX Midstream Partners LP 6.5% 3/15/26 (d) | | 335,000 | 340,863 |
| CNX Resources Corp. 6% 1/15/29 (d) | | 315,000 | 322,713 |
| Comstock Resources, Inc.: | | | |
| 7.5% 5/15/25 (d) | | 580,000 | 587,250 |
| 9.75% 8/15/26 | | 3,060,000 | 3,281,850 |
| 9.75% 8/15/26 | | 445,000 | 477,263 |
| Continental Resources, Inc.: | | | |
| 3.8% 6/1/24 | | 1,165,000 | 1,199,950 |
| 4.375% 1/15/28 | | 295,000 | 300,900 |
| 4.5% 4/15/23 | | 33,000 | 34,026 |
| 4.9% 6/1/44 | | 745,000 | 731,963 |
| Crestwood Midstream Partners LP/Crestwood Midstream Finance Corp.: | | | |
| 5.625% 5/1/27 (d) | | 960,000 | 950,400 |
| 5.75% 4/1/25 | | 250,000 | 254,375 |
| 6.25% 4/1/23 | | 345,000 | 345,863 |
| CVR Energy, Inc.: | | | |
| 5.25% 2/15/25 (d) | | 895,000 | 863,675 |
| 5.75% 2/15/28 (d) | | 2,320,000 | 2,198,200 |
| DCP Midstream Operating LP 5.85% 5/21/43 (d)(g) | | 885,000 | 761,100 |
| Delek Overriding Royalty 7.494% 12/30/23 (Reg. S) (d) | | 590,000 | 592,950 |
| DTEK Finance PLC 10.75% 12/31/24 pay-in-kind (g) | | 470,000 | 290,813 |
| Ecopetrol SA: | | | |
| 5.875% 5/28/45 | | 185,000 | 223,041 |
| 6.875% 4/29/30 | | 190,000 | 243,723 |
| EG Global Finance PLC 8.5% 10/30/25 (d) | | 855,000 | 910,575 |
| Endeavor Energy Resources LP/EER Finance, Inc.: | | | |
| 5.5% 1/30/26 (d) | | 505,000 | 518,206 |
| 5.75% 1/30/28 (d) | | 880,000 | 949,256 |
| 6.625% 7/15/25 (d) | | 335,000 | 358,450 |
| Energy Transfer Equity LP 5.5% 6/1/27 | | 860,000 | 878,055 |
| EQT Corp. 3.9% 10/1/27 | | 1,413,000 | 1,403,745 |
| Extraction Oil & Gas, Inc. 7.375% 5/15/24 (d)(f) | | 365,000 | 65,700 |
| FEL Energy VI SARL 5.75% 12/1/40 (d) | | 285,000 | 301,473 |
| Galaxy Pipeline Assets BidCo Ltd. 2.625% 3/31/36 (d) | | 585,000 | 605,475 |
| GeoPark Ltd. 6.5% 9/21/24 (d) | | 515,000 | 533,508 |
| Georgian Oil & Gas Corp. 6.75% 4/26/21 (d) | | 390,000 | 392,072 |
| Hess Midstream Partners LP: | | | |
| 5.125% 6/15/28 (d) | | 595,000 | 621,959 |
| 5.625% 2/15/26 (d) | | 795,000 | 826,800 |
| Hilcorp Energy I LP/Hilcorp Finance Co.: | | | |
| 5% 12/1/24 (d) | | 510,000 | 506,175 |
| 5.75% 10/1/25 (d) | | 580,000 | 586,525 |
| 6.25% 11/1/28 (d) | | 590,000 | 603,275 |
| Holly Energy Partners LP/Holly Energy Finance Corp. 5% 2/1/28 (d) | | 400,000 | 403,000 |
| Indigo Natural Resources LLC 6.875% 2/15/26 (d) | | 1,135,000 | 1,160,538 |
| Indika Energy Capital IV Pte Ltd. 8.25% 10/22/25 (d) | | 345,000 | 373,031 |
| KazMunaiGaz National Co.: | | | |
| 3.5% 4/14/33 (d) | | 335,000 | 364,313 |
| 4.75% 4/24/25 (d) | | 105,000 | 119,667 |
| 5.75% 4/19/47 (d) | | 170,000 | 227,534 |
| Kosmos Energy Ltd. 7.125% 4/4/26 (d) | | 1,610,000 | 1,513,903 |
| Laredo Petroleum, Inc. 10.125% 1/15/28 | | 235,000 | 199,750 |
| Leviathan Bond Ltd.: | | | |
| 5.75% 6/30/23 (Reg. S) (d) | | 370,000 | 394,050 |
| 6.125% 6/30/25 (Reg. S) (d) | | 375,000 | 411,563 |
| Medco Oak Tree Pte Ltd. 7.375% 5/14/26 (d) | | 105,000 | 112,416 |
| Medco Platinum Road Pte Ltd. 6.75% 1/30/25 (d) | | 350,000 | 366,823 |
| MEG Energy Corp. 7.125% 2/1/27 (d) | | 595,000 | 614,338 |
| Murphy Oil U.S.A., Inc.: | | | |
| 4.75% 9/15/29 | | 370,000 | 393,588 |
| 5.625% 5/1/27 | | 305,000 | 322,538 |
| NAK Naftogaz Ukraine: | | | |
| 7.375% 7/19/22 (Reg. S) | | 255,000 | 262,491 |
| 7.625% 11/8/26 (d) | | 230,000 | 237,475 |
| New Fortress Energy LLC 6.75% 9/15/25 (d) | | 2,765,000 | 2,928,273 |
| Newfield Exploration Co. 5.375% 1/1/26 | | 475,000 | 509,642 |
| NGL Energy Partners LP/NGL Energy Finance Corp.: | | | |
| 6.125% 3/1/25 | | 630,000 | 399,263 |
| 7.5% 4/15/26 | | 860,000 | 533,200 |
| NGPL PipeCo LLC: | | | |
| 4.375% 8/15/22 (d) | | 150,000 | 156,273 |
| 4.875% 8/15/27 (d) | | 150,000 | 169,883 |
| Nostrum Oil & Gas Finance BV 8% 7/25/22 (d)(f) | | 2,620,000 | 655,000 |
| Occidental Petroleum Corp.: | | | |
| 2.9% 8/15/24 | | 815,000 | 784,438 |
| 3.2% 8/15/26 | | 50,000 | 46,750 |
| 3.4% 4/15/26 | | 65,000 | 61,971 |
| 4.4% 4/15/46 | | 575,000 | 501,092 |
| 4.4% 8/15/49 | | 1,455,000 | 1,226,274 |
| 4.625% 6/15/45 | | 475,000 | 414,024 |
| 5.875% 9/1/25 | | 670,000 | 713,550 |
| 6.2% 3/15/40 | | 350,000 | 347,375 |
| 6.375% 9/1/28 | | 670,000 | 706,850 |
| 6.45% 9/15/36 | | 1,171,000 | 1,226,037 |
| 6.6% 3/15/46 | | 940,000 | 954,100 |
| 6.625% 9/1/30 | | 1,340,000 | 1,454,905 |
| 7.2% 3/15/29 | | 240,000 | 244,800 |
| 7.5% 5/1/31 | | 65,000 | 72,475 |
| PBF Holding Co. LLC/PBF Finance Corp.: | | | |
| 6% 2/15/28 | | 1,445,000 | 825,456 |
| 7.25% 6/15/25 | | 1,145,000 | 742,229 |
| 9.25% 5/15/25 (d) | | 1,330,000 | 1,304,331 |
| PBF Logistics LP/PBF Logistics Finance, Inc. 6.875% 5/15/23 | | 435,000 | 416,513 |
| PDC Energy, Inc.: | | | |
| 6.125% 9/15/24 | | 200,000 | 205,522 |
| 6.25% 12/1/25 | | 380,000 | 375,250 |
| Petrobras Global Finance BV: | | | |
| 5.75% 2/1/29 | | 325,000 | 377,731 |
| 6.75% 6/3/50 | | 590,000 | 730,678 |
| 6.875% 1/20/40 | | 569,000 | 713,739 |
| 6.9% 3/19/49 | | 215,000 | 272,781 |
| 7.375% 1/17/27 | | 160,000 | 198,400 |
| 8.75% 5/23/26 | | 735,000 | 952,514 |
| Petroleos de Venezuela SA: | | | |
| 5.375% 4/12/27 (f) | | 480,000 | 15,360 |
| 6% 5/16/24 (d)(f) | | 585,000 | 18,720 |
| 6% 11/15/26 (d)(f) | | 930,000 | 30,225 |
| 12.75% 2/17/22 (d)(f) | | 110,000 | 3,520 |
| Petroleos Mexicanos: | | | |
| 3 month U.S. LIBOR + 3.650% 3.8706% 3/11/22 (g)(h) | | 410,000 | 414,920 |
| 3.5% 1/30/23 | | 750,000 | 764,850 |
| 4.875% 1/24/22 | | 760,000 | 781,508 |
| 4.875% 1/18/24 | | 2,360,000 | 2,469,150 |
| 5.375% 3/13/22 | | 290,000 | 298,791 |
| 6.375% 2/4/21 | | 145,000 | 145,498 |
| 6.5% 6/2/41 | | 170,000 | 157,808 |
| 6.625% 6/15/35 | | 1,715,000 | 1,689,275 |
| 6.75% 9/21/47 | | 798,000 | 748,125 |
| 6.875% 10/16/25 (d) | | 630,000 | 689,000 |
| 6.95% 1/28/60 | | 145,000 | 136,104 |
| 7.69% 1/23/50 | | 4,043,000 | 4,076,355 |
| 8.625% 2/1/22 | | 140,000 | 149,844 |
| 8.625% 12/1/23 (g) | | 250,000 | 270,703 |
| Petronas Capital Ltd. 3.5% 4/21/30 (d) | | 230,000 | 265,021 |
| PT Adaro Indonesia 4.25% 10/31/24 (d) | | 605,000 | 622,772 |
| Sanchez Energy Corp. 7.25% 2/15/23 (c)(d)(f) | | 1,063,000 | 0 |
| Saudi Arabian Oil Co.: | | | |
| 1.625% 11/24/25 (d) | | 240,000 | 244,800 |
| 3.5% 4/16/29 (d) | | 2,350,000 | 2,604,828 |
| 4.25% 4/16/39 (d) | | 970,000 | 1,129,444 |
| 4.375% 4/16/49 (d) | | 520,000 | 628,388 |
| Sibur Securities DAC 2.95% 7/8/25 (d) | | 225,000 | 231,188 |
| Sinopec Group Overseas Development Ltd. 2.7% 5/13/30 (d) | | 220,000 | 228,181 |
| SM Energy Co.: | | | |
| 5.625% 6/1/25 | | 330,000 | 267,300 |
| 6.625% 1/15/27 | | 1,125,000 | 897,188 |
| 6.75% 9/15/26 | | 250,000 | 202,500 |
| Southwestern Energy Co.: | | | |
| 6.45% 1/23/25 (g) | | 100,000 | 104,000 |
| 7.5% 4/1/26 | | 1,090,000 | 1,143,410 |
| 7.75% 10/1/27 | | 680,000 | 734,196 |
| Sunoco LP/Sunoco Finance Corp.: | | | |
| 4.5% 5/15/29 (d) | | 605,000 | 629,200 |
| 5.5% 2/15/26 | | 595,000 | 609,875 |
| Tallgrass Energy Partners LP / Tallgrass Energy Finance Corp. 7.5% 10/1/25 (d) | | 495,000 | 534,397 |
| Targa Resources Partners LP/Targa Resources Partners Finance Corp. 4.875% 2/1/31 (d) | | 625,000 | 678,125 |
| Teine Energy Ltd. 6.875% 9/30/22 (d) | | 590,000 | 588,525 |
| Tengizchevroil Finance Co. International Ltd. 3.25% 8/15/30 (d) | | 425,000 | 449,969 |
| Tennessee Gas Pipeline Co. 7.625% 4/1/37 | | 50,000 | 70,692 |
| Transportadora de Gas del Sur SA 6.75% 5/2/25 (d) | | 575,000 | 525,406 |
| Tullow Oil PLC 6.25% 4/15/22 (d) | | 2,615,000 | 2,085,463 |
| Ultra Resources, Inc. 11% 7/12/24 pay-in-kind (c)(f) | | 543,409 | 27,170 |
| W&T Offshore, Inc. 9.75% 11/1/23 (d) | | 2,005,000 | 1,418,538 |
| YPF SA: | | | |
| 8.5% 3/23/25 (d) | | 766,000 | 621,349 |
| 8.75% 4/4/24 (d) | | 2,615,000 | 2,304,469 |
| | | | 93,686,045 |
| TOTAL ENERGY | | | 100,029,555 |
| FINANCIALS - 4.6% | | | |
| Banks - 0.7% | | | |
| AIB Group PLC 2.875% 5/30/31 (Reg. S) (g) | EUR | 1,441,000 | 1,876,686 |
| Banco de Reservas de La Republica Dominicana 7% 2/1/23 (d) | | 90,000 | 93,741 |
| Banco Macro SA 6.75% 11/4/26 (d)(g) | | 685,000 | 587,388 |
| Biz Finance PLC 9.625% 4/27/22 (d) | | 252,500 | 263,610 |
| Citigroup, Inc. 1.25% 7/6/26 (Reg. S) (g) | EUR | 733,000 | 942,213 |
| Commerzbank AG 4% 3/23/26 (Reg. S) | EUR | 1,200,000 | 1,641,405 |
| Danske Bank A/S 2.5% 6/21/29 (Reg. S) (g) | EUR | 1,005,000 | 1,298,845 |
| Development Bank of Mongolia 7.25% 10/23/23 (d) | | 105,000 | 113,138 |
| Georgia Bank Joint Stock Co. 6% 7/26/23 (d) | | 880,000 | 918,500 |
| JSC Halyk Bank of Kazakhstan 5.5% 12/21/22 (d) | | 697,459 | 698,984 |
| Lloyds Banking Group PLC 4.5% 3/18/30 (Reg. S) (g) | EUR | 787,000 | 1,099,451 |
| National Bank of Uzbekistan 4.85% 10/21/25 (Reg. S) | | 225,000 | 232,875 |
| Oschadbank Via SSB #1 PLC 9.375% 3/10/23 (d) | | 200,000 | 209,188 |
| T.C. Ziraat Bankasi A/S 5.125% 5/3/22 (d) | | 485,000 | 486,213 |
| Turkiye Vakiflar Bankasi TAO 5.75% 1/30/23 (d) | | 565,000 | 569,061 |
| | | | 11,031,298 |
| Capital Markets - 0.1% | | | |
| AssuredPartners, Inc.: | | | |
| 5.625% 1/15/29 (d) | | 390,000 | 407,063 |
| 7% 8/15/25 (d) | | 245,000 | 253,930 |
| MSCI, Inc. 4% 11/15/29 (d) | | 340,000 | 362,100 |
| UBS Group AG 0.25% 11/5/28 (Reg. S) (g) | EUR | 933,000 | 1,143,748 |
| | | | 2,166,841 |
| Consumer Finance - 2.5% | | | |
| Ally Financial, Inc.: | | | |
| 8% 11/1/31 | | 823,000 | 1,170,890 |
| 8% 11/1/31 | | 16,143,000 | 23,683,258 |
| Ford Motor Credit Co. LLC: | | | |
| 3.375% 11/13/25 | | 1,585,000 | 1,623,135 |
| 4% 11/13/30 | | 2,525,000 | 2,656,123 |
| 5.113% 5/3/29 | | 610,000 | 679,357 |
| Springleaf Finance Corp.: | | | |
| 4% 9/15/30 | | 330,000 | 342,411 |
| 5.375% 11/15/29 | | 500,000 | 562,500 |
| 6.625% 1/15/28 | | 385,000 | 457,188 |
| 6.875% 3/15/25 | | 2,580,000 | 2,996,025 |
| 7.125% 3/15/26 | | 3,405,000 | 4,026,413 |
| Unifin Financiera SAPI de CV: | | | |
| 7% 1/15/25 (d) | | 200,000 | 190,875 |
| 7.25% 9/27/23 (d) | | 10,000 | 9,678 |
| 7.375% 2/12/26 (d) | | 170,000 | 162,403 |
| | | | 38,560,256 |
| Diversified Financial Services - 0.9% | | | |
| 1MDB Global Investments Ltd. 4.4% 3/9/23 | | 4,000,000 | 4,048,875 |
| Cimpor Financial Operations BV 5.75% 7/17/24 (d) | | 485,000 | 422,102 |
| Enviva Partners LP / Enviva Partners Finance Corp. 6.5% 1/15/26 (d) | | 595,000 | 632,188 |
| Icahn Enterprises LP/Icahn Enterprises Finance Corp.: | | | |
| 5.25% 5/15/27 | | 1,570,000 | 1,683,040 |
| 6.25% 5/15/26 | | 1,305,000 | 1,381,865 |
| 6.375% 12/15/25 | | 2,785,000 | 2,881,083 |
| 6.75% 2/1/24 | | 535,000 | 544,084 |
| James Hardie International Finance Ltd.: | | | |
| 4.75% 1/15/25 (d) | | 450,000 | 457,745 |
| 5% 1/15/28 (d) | | 455,000 | 483,287 |
| MDC GMTN BV 2.875% 11/7/29 (d) | | 530,000 | 571,764 |
| PTT Treasury Center Co. Ltd. 3.7% 7/16/70 (d) | | 230,000 | 241,859 |
| Sasol Financing International PLC 4.5% 11/14/22 | | 515,000 | 525,300 |
| Shift4 Payments LLC / Shift4 Payments Finance Sub, Inc. 4.625% 11/1/26 (d) | | 225,000 | 234,000 |
| Sparc Em Spc 0% 12/5/22 (d) | | 67,213 | 65,449 |
| | | | 14,172,641 |
| Insurance - 0.4% | | | |
| Acrisure LLC / Acrisure Finance, Inc.: | | | |
| 7% 11/15/25 (d) | | 1,805,000 | 1,879,095 |
| 8.125% 2/15/24 (d) | | 685,000 | 725,220 |
| 10.125% 8/1/26 (d) | | 605,000 | 694,238 |
| Alliant Holdings Intermediate LLC: | | | |
| 4.25% 10/15/27 (d) | | 665,000 | 679,963 |
| 6.75% 10/15/27 (d) | | 965,000 | 1,032,550 |
| HUB International Ltd. 7% 5/1/26 (d) | | 595,000 | 622,245 |
| | | | 5,633,311 |
| Thrifts & Mortgage Finance - 0.0% | | | |
| MGIC Investment Corp. 5.25% 8/15/28 | | 465,000 | 497,550 |
| TOTAL FINANCIALS | | | 72,061,897 |
| HEALTH CARE - 2.3% | | | |
| Health Care Equipment & Supplies - 0.0% | | | |
| Hologic, Inc. 4.625% 2/1/28 (d) | | 215,000 | 228,169 |
| Health Care Providers & Services - 1.9% | | | |
| Akumin, Inc. 7% 11/1/25 (d) | | 335,000 | 351,750 |
| AMN Healthcare 4.625% 10/1/27 (d) | | 165,000 | 172,849 |
| Centene Corp.: | | | |
| 4.25% 12/15/27 | | 615,000 | 651,900 |
| 4.625% 12/15/29 | | 2,150,000 | 2,386,952 |
| 4.75% 1/15/25 | | 490,000 | 502,853 |
| 5.375% 6/1/26 (d) | | 1,545,000 | 1,629,527 |
| 5.375% 8/15/26 (d) | | 385,000 | 406,656 |
| Community Health Systems, Inc.: | | | |
| 5.625% 3/15/27 (d) | | 330,000 | 354,833 |
| 6% 1/15/29 (d) | | 325,000 | 351,085 |
| 6.625% 2/15/25 (d) | | 685,000 | 720,949 |
| 8% 3/15/26 (d) | | 3,270,000 | 3,523,425 |
| 8.125% 6/30/24 (d) | | 2,162,000 | 2,237,670 |
| 9.875% 6/30/23 (d) | | 1,825,000 | 1,918,531 |
| Encompass Health Corp. 5.125% 3/15/23 | | 330,000 | 330,482 |
| Horizon Pharma U.S.A., Inc. 5.5% 8/1/27 (d) | | 650,000 | 697,983 |
| Jaguar Holding Co. II/Pharmaceutical Product Development LLC 5% 6/15/28 (d) | | 715,000 | 763,263 |
| Molina Healthcare, Inc.: | | | |
| 3.875% 11/15/30 (d) | | 640,000 | 686,400 |
| 4.375% 6/15/28 (d) | | 465,000 | 489,413 |
| Providence Service Corp. 5.875% 11/15/25 (d) | | 485,000 | 512,888 |
| Radiology Partners, Inc. 9.25% 2/1/28 (d) | | 2,690,000 | 3,027,057 |
| RP Escrow Issuer LLC 5.25% 12/15/25 (d) | | 615,000 | 643,241 |
| Tenet Healthcare Corp.: | | | |
| 4.625% 7/15/24 | | 305,000 | 312,631 |
| 4.625% 9/1/24 (d) | | 650,000 | 671,125 |
| 4.875% 1/1/26 (d) | | 1,625,000 | 1,699,929 |
| 5.125% 5/1/25 | | 305,000 | 310,944 |
| 5.125% 11/1/27 (d) | | 975,000 | 1,032,281 |
| 6.125% 10/1/28 (d) | | 1,000,000 | 1,043,655 |
| 6.25% 2/1/27 (d) | | 955,000 | 1,012,300 |
| U.S. Renal Care, Inc. 10.625% 7/15/27 (d) | | 1,147,000 | 1,267,435 |
| Vizient, Inc. 6.25% 5/15/27 (d) | | 145,000 | 155,875 |
| | | | 29,865,882 |
| Health Care Technology - 0.0% | | | |
| IMS Health, Inc. 5% 5/15/27 (d) | | 640,000 | 680,336 |
| Life Sciences Tools & Services - 0.1% | | | |
| Charles River Laboratories International, Inc. 4.25% 5/1/28 (d) | | 185,000 | 193,788 |
| Syneos Health, Inc. 3.625% 1/15/29 (d) | | 500,000 | 501,383 |
| | | | 695,171 |
| Pharmaceuticals - 0.3% | | | |
| Bausch Health Companies, Inc.: | | | |
| 5% 2/15/29 (d) | | 500,000 | 514,100 |
| 5.25% 2/15/31 (d) | | 500,000 | 522,360 |
| Catalent Pharma Solutions: | | | |
| 4.875% 1/15/26 (d) | | 205,000 | 209,100 |
| 5% 7/15/27 (d) | | 205,000 | 216,509 |
| Takeda Pharmaceutical Co. Ltd. 2% 7/9/40 | EUR | 1,100,000 | 1,525,499 |
| Teva Pharmaceutical Finance Co. BV: | | | |
| 2.95% 12/18/22 | | 250,000 | 249,375 |
| 3.65% 11/10/21 | | 75,000 | 75,938 |
| Teva Pharmaceutical Finance IV BV 3.65% 11/10/21 | | 45,000 | 45,563 |
| Teva Pharmaceutical Finance Netherlands III BV 2.8% 7/21/23 | | 235,000 | 232,674 |
| Utah Acquisition Sub, Inc. 3.125% 11/22/28 (Reg. S) | EUR | 1,059,000 | 1,538,927 |
| | | | 5,130,045 |
| TOTAL HEALTH CARE | | | 36,599,603 |
| INDUSTRIALS - 4.0% | | | |
| Aerospace & Defense - 1.6% | | | |
| BBA U.S. Holdings, Inc. 5.375% 5/1/26 (d) | | 225,000 | 230,625 |
| Bombardier, Inc.: | | | |
| 6.125% 1/15/23 (d) | | 650,000 | 635,375 |
| 7.5% 12/1/24 (d) | | 520,000 | 498,820 |
| 7.5% 3/15/25 (d) | | 895,000 | 830,113 |
| 7.875% 4/15/27 (d) | | 2,685,000 | 2,468,696 |
| BWX Technologies, Inc.: | | | |
| 4.125% 6/30/28 (d) | | 630,000 | 655,988 |
| 5.375% 7/15/26 (d) | | 430,000 | 446,663 |
| Moog, Inc. 4.25% 12/15/27 (d) | | 185,000 | 191,938 |
| Rolls-Royce PLC 5.75% 10/15/27 (d) | | 650,000 | 719,875 |
| Spirit Aerosystems, Inc. 7.5% 4/15/25 (d) | | 905,000 | 970,613 |
| TransDigm UK Holdings PLC 6.875% 5/15/26 | | 1,805,000 | 1,907,073 |
| TransDigm, Inc.: | | | |
| 5.5% 11/15/27 | | 6,745,000 | 7,099,113 |
| 6.25% 3/15/26 (d) | | 955,000 | 1,017,075 |
| 6.375% 6/15/26 | | 3,145,000 | 3,255,075 |
| 6.5% 5/15/25 | | 835,000 | 857,963 |
| 7.5% 3/15/27 | | 960,000 | 1,024,800 |
| Wolverine Escrow LLC: | | | |
| 8.5% 11/15/24 (d) | | 1,215,000 | 1,159,146 |
| 9% 11/15/26 (d) | | 1,245,000 | 1,178,455 |
| | | | 25,147,406 |
| Air Freight & Logistics - 0.2% | | | |
| Cargo Aircraft Management, Inc. 4.75% 2/1/28 (d) | | 365,000 | 376,406 |
| Rumo Luxembourg SARL 7.375% 2/9/24 (d) | | 1,682,000 | 1,751,908 |
| XPO Logistics, Inc. 6.25% 5/1/25 (d) | | 1,140,000�� | 1,226,800 |
| | | | 3,355,114 |
| Airlines - 0.7% | | | |
| Aerovias de Mexico SA de CV 7% 2/5/25 (d)(f) | | 135,000 | 53,367 |
| Air Canada 2013-1 Pass Through Trust 5.375% 11/15/22 (d) | | 85,511 | 85,709 |
| Azul Investments LLP 5.875% 10/26/24 (d) | | 765,000 | 713,602 |
| Delta Air Lines, Inc. 7% 5/1/25 (d) | | 280,000 | 323,216 |
| Delta Air Lines, Inc. / SkyMiles IP Ltd.: | | | |
| 4.5% 10/20/25 (d) | | 2,860,000 | 3,056,469 |
| 4.75% 10/20/28 (d) | | 2,365,000 | 2,580,806 |
| Delta Air Lines, Inc. pass-thru trust certificates 8.021% 2/10/24 | | 66,356 | 64,820 |
| Hawaiian Airlines pass-thru certificates Series 2013-1 Class B, 4.95% 7/15/23 | | 172,211 | 156,988 |
| Mileage Plus Holdings LLC 6.5% 6/20/27 (d) | | 2,045,000 | 2,198,375 |
| Spirit Loyalty Cayman Ltd. / Spirit IP Cayman Ltd. 8% 9/20/25 (d) | | 770,000 | 862,400 |
| | | | 10,095,752 |
| Building Products - 0.1% | | | |
| Advanced Drain Systems, Inc. 5% 9/30/27 (d) | | 125,000 | 131,298 |
| CP Atlas Buyer, Inc. 7% 12/1/28 (d) | | 325,000 | 337,188 |
| Elementia S.A.B. de CV 5.5% 1/15/25 (d) | | 427,000 | 432,338 |
| Shea Homes Ltd. Partnership/Corp. 4.75% 4/1/29 (d) | | 475,000 | 488,063 |
| | | | 1,388,887 |
| Commercial Services & Supplies - 0.2% | | | |
| Covanta Holding Corp.: | | | |
| 5% 9/1/30 | | 670,000 | 716,858 |
| 5.875% 7/1/25 | | 165,000 | 171,600 |
| 6% 1/1/27 | | 585,000 | 614,453 |
| IAA Spinco, Inc. 5.5% 6/15/27 (d) | | 250,000 | 265,000 |
| KAR Auction Services, Inc. 5.125% 6/1/25 (d) | | 525,000 | 540,241 |
| Ritchie Bros. Auctioneers, Inc. 5.375% 1/15/25 (d) | | 190,000 | 195,558 |
| The Brink's Co. 4.625% 10/15/27 (d) | | 620,000 | 647,900 |
| | | | 3,151,610 |
| Construction & Engineering - 0.1% | | | |
| AECOM 5.125% 3/15/27 | | 625,000 | 695,519 |
| Odebrecht Finance Ltd.: | | | |
| 4.375% 4/25/25 (d)(f) | | 1,530,000 | 62,156 |
| 5.25% 6/27/29 (d)(f) | | 580,000 | 24,469 |
| 7.125% 6/26/42 (d)(f) | | 1,406,000 | 62,391 |
| Pike Corp. 5.5% 9/1/28 (d) | | 525,000 | 554,531 |
| | | | 1,399,066 |
| Electrical Equipment - 0.0% | | | |
| Sensata Technologies BV 5% 10/1/25 (d) | | 575,000 | 639,688 |
| Industrial Conglomerates - 0.1% | | | |
| Turk Sise ve Cam Fabrikalari A/S 6.95% 3/14/26 (d) | | 575,000 | 640,219 |
| Machinery - 0.0% | | | |
| ATS Automation Tooling System, Inc. 4.125% 12/15/28 (d) | | 460,000 | 468,050 |
| Stevens Holding Co., Inc. 6.125% 10/1/26 (d) | | 155,000 | 167,400 |
| | | | 635,450 |
| Marine - 0.0% | | | |
| Navios South American Logistics, Inc./Navios Logistics Finance U.S., Inc. 10.75% 7/1/25 (d) | | 215,000 | 231,394 |
| Professional Services - 0.1% | | | |
| ASGN, Inc. 4.625% 5/15/28 (d) | | 510,000 | 530,400 |
| Booz Allen Hamilton, Inc. 3.875% 9/1/28 (d) | | 620,000 | 638,600 |
| | | | 1,169,000 |
| Road & Rail - 0.6% | | | |
| Hertz Corp.: | | | |
| 5.5% 10/15/24 (d)(f) | | 590,000 | 318,600 |
| 6% 1/15/28 (d)(f) | | 340,000 | 183,600 |
| 6.25% 10/15/22 (f) | | 455,000 | 245,700 |
| 7.125% 8/1/26 (d)(f) | | 620,000 | 334,800 |
| JSC Georgian Railway 7.75% 7/11/22 (d) | | 100,000 | 105,188 |
| Kazakhstan Temir Zholy Finance BV 6.95% 7/10/42 (d) | | 120,000 | 178,238 |
| Uber Technologies, Inc.: | | | |
| 6.25% 1/15/28 (d) | | 545,000 | 592,688 |
| 7.5% 9/15/27 (d) | | 2,950,000 | 3,245,000 |
| 8% 11/1/26 (d) | | 4,260,000 | 4,638,075 |
| | | | 9,841,889 |
| Trading Companies & Distributors - 0.1% | | | |
| H&E Equipment Services, Inc. 3.875% 12/15/28 (d) | | 995,000 | 1,002,492 |
| United Rentals North America, Inc.: | | | |
| 3.875% 11/15/27 | | 300,000 | 314,250 |
| 5.5% 5/15/27 | | 405,000 | 433,856 |
| | | | 1,750,598 |
| Transportation Infrastructure - 0.2% | | | |
| Aeropuertos Argentina 2000 SA: | | | |
| 6.875% 2/1/27 (d) | | 15,625 | 10,938 |
| 9.375% 2/1/27 pay-in-kind (d)(g) | | 949,416 | 818,575 |
| DP World Crescent Ltd.: | | | |
| 3.7495% 1/30/30 (d) | | 765,000 | 831,938 |
| 3.875% 7/18/29 (Reg. S) | | 400,000 | 439,000 |
| DP World Ltd. 5.625% 9/25/48 (d) | | 155,000 | 197,431 |
| | | | 2,297,882 |
| TOTAL INDUSTRIALS | | | 61,743,955 |
| INFORMATION TECHNOLOGY - 1.0% | | | |
| Communications Equipment - 0.1% | | | |
| HTA Group Ltd. 7% 12/18/25 (d) | | 235,000 | 252,625 |
| IHS Netherlands Holdco BV 7.125% 3/18/25 (d) | | 1,085,000 | 1,138,233 |
| | | | 1,390,858 |
| Electronic Equipment & Components - 0.0% | | | |
| MTS Systems Corp. 5.75% 8/15/27 (d) | | 170,000 | 184,484 |
| IT Services - 0.2% | | | |
| Banff Merger Sub, Inc. 9.75% 9/1/26 (d) | | 490,000 | 529,274 |
| Camelot Finance SA 4.5% 11/1/26 (d) | | 570,000 | 594,938 |
| Gartner, Inc. 3.75% 10/1/30 (d) | | 685,000 | 719,250 |
| Go Daddy Operating Co. LLC / GD Finance Co., Inc. 5.25% 12/1/27 (d) | | 500,000 | 526,250 |
| GTT Communications, Inc. 7.875% 12/31/24 (d) | | 60,000 | 24,000 |
| Northwest Fiber LLC/Northwest Fiber Finance Sub, Inc. 10.75% 6/1/28 (d) | | 365,000 | 416,100 |
| Rackspace Hosting, Inc. 5.375% 12/1/28 (d) | | 380,000 | 398,126 |
| RP Crown Parent, LLC 7.375% 10/15/24 (d) | | 225,000 | 228,938 |
| Unisys Corp. 6.875% 11/1/27 (d) | | 365,000 | 398,763 |
| | | | 3,835,639 |
| Semiconductors & Semiconductor Equipment - 0.0% | | | |
| ON Semiconductor Corp. 3.875% 9/1/28 (d) | | 690,000 | 712,425 |
| Software - 0.5% | | | |
| Ascend Learning LLC: | | | |
| 6.875% 8/1/25 (d) | | 630,000 | 648,113 |
| 6.875% 8/1/25 (d) | | 210,000 | 216,038 |
| Black Knight InfoServ LLC 3.625% 9/1/28 (d) | | 690,000 | 706,388 |
| Boxer Parent Co., Inc. 7.125% 10/2/25 (d) | | 340,000 | 369,052 |
| Fair Isaac Corp. 4% 6/15/28 (d) | | 580,000 | 610,450 |
| NortonLifeLock, Inc. 5% 4/15/25 (d) | | 530,000 | 540,600 |
| Open Text Corp.: | | | |
| 3.875% 2/15/28 (d) | | 300,000 | 311,250 |
| 5.875% 6/1/26 (d) | | 465,000 | 483,019 |
| Open Text Holdings, Inc. 4.125% 2/15/30 (d) | | 300,000 | 319,140 |
| PTC, Inc.: | | | |
| 3.625% 2/15/25 (d) | | 350,000 | 359,811 |
| 4% 2/15/28 (d) | | 345,000 | 361,603 |
| Veritas U.S., Inc./Veritas Bermuda Ltd.: | | | |
| 7.5% 2/1/23 (d) | | 875,000 | 877,100 |
| 7.5% 9/1/25 (d) | | 1,165,000 | 1,195,581 |
| | | | 6,998,145 |
| Technology Hardware, Storage & Peripherals - 0.2% | | | |
| Lenovo Group Ltd. 3.421% 11/2/30 (d) | | 485,000 | 511,053 |
| NCR Corp.: | | | |
| 5% 10/1/28 (d) | | 335,000 | 353,425 |
| 5.25% 10/1/30 (d) | | 335,000 | 359,288 |
| 5.75% 9/1/27 (d) | | 485,000 | 515,313 |
| 6.125% 9/1/29 (d) | | 485,000 | 537,138 |
| 8.125% 4/15/25 (d) | | 285,000 | 317,387 |
| | | | 2,593,604 |
| TOTAL INFORMATION TECHNOLOGY | | | 15,715,155 |
| MATERIALS - 3.5% | | | |
| Chemicals - 1.5% | | | |
| Braskem Idesa SAPI 7.45% 11/15/29 (d) | | 125,000 | 116,133 |
| CF Industries Holdings, Inc.: | | | |
| 4.95% 6/1/43 | | 3,610,000 | 4,431,275 |
| 5.15% 3/15/34 | | 1,719,000 | 2,112,316 |
| 5.375% 3/15/44 | | 3,080,000 | 3,898,525 |
| Consolidated Energy Finance SA: | | | |
| 3 month U.S. LIBOR + 3.750% 3.9665% 6/15/22 (d)(g)(h) | | 155,000 | 152,162 |
| 6.5% 5/15/26 (d) | | 2,795,000 | 2,795,000 |
| 6.875% 6/15/25 (d) | | 560,000 | 567,700 |
| Ingevity Corp. 3.875% 11/1/28 (d) | | 665,000 | 669,988 |
| Kraton Polymers LLC/Kraton Polymers Capital Corp. 4.25% 12/15/25 (d) | | 435,000 | 443,744 |
| Kronos Acquisition Holdings, Inc. / KIK Custom Products, Inc.: | | | |
| 5% 12/31/26 (d) | | 150,000 | 156,375 |
| 7% 12/31/27 (d) | | 190,000 | 198,934 |
| LSB Industries, Inc. 9.625% 5/1/23 (d) | | 310,000 | 319,300 |
| MEGlobal Canada, Inc. 5% 5/18/25 (d) | | 105,000 | 117,863 |
| Neon Holdings, Inc. 10.125% 4/1/26 (d) | | 635,000 | 693,738 |
| Nouryon Holding BV 8% 10/1/26 (d) | | 414,000 | 439,875 |
| OCI NV 5.25% 11/1/24 (d) | | 895,000 | 929,681 |
| OCP SA 6.875% 4/25/44 (d) | | 95,000 | 124,064 |
| Petkim Petrokimya Holding A/S 5.875% 1/26/23 (d) | | 725,000 | 739,273 |
| SABIC Capital II BV 4% 10/10/23 (d) | | 560,000 | 602,700 |
| Sasol Financing U.S.A. LLC 5.875% 3/27/24 | | 135,000 | 143,606 |
| The Chemours Co. LLC: | | | |
| 5.375% 5/15/27 | | 1,700,000 | 1,810,500 |
| 5.75% 11/15/28 (d) | | 995,000 | 1,014,900 |
| Tronox, Inc. 6.5% 5/1/25 (d) | | 530,000 | 567,100 |
| Valvoline, Inc. 4.25% 2/15/30 (d) | | 435,000 | 461,100 |
| | | | 23,505,852 |
| Construction Materials - 0.1% | | | |
| CEMEX S.A.B. de CV 7.75% 4/16/26 (d) | | 215,000 | 226,556 |
| Summit Materials LLC/Summit Materials Finance Corp.: | | | |
| 5.125% 6/1/25 (d) | | 260,000 | 264,550 |
| 5.25% 1/15/29 (d) | | 645,000 | 677,250 |
| U.S. Concrete, Inc.: | | | |
| 5.125% 3/1/29 (d) | | 495,000 | 509,850 |
| 6.375% 6/1/24 | | 100,000 | 102,500 |
| | | | 1,780,706 |
| Containers & Packaging - 0.3% | | | |
| ARD Finance SA 6.5% 6/30/27 pay-in-kind (d)(g) | | 595,000 | 635,163 |
| Cascades, Inc.: | | | |
| 5.125% 1/15/26 (d) | | 300,000 | 316,875 |
| 5.375% 1/15/28 (d) | | 300,000 | 318,844 |
| Crown Cork & Seal, Inc.: | | | |
| 7.375% 12/15/26 | | 1,210,000 | 1,473,175 |
| 7.5% 12/15/96 | | 160,000 | 177,200 |
| Graham Packaging Co., Inc. 7.125% 8/15/28 (d) | | 365,000 | 403,325 |
| Intelligent Packaging Ltd. Finco, Inc. 6% 9/15/28 (d) | | 255,000 | 262,013 |
| Trivium Packaging Finance BV 5.5% 8/15/26 (d) | | 375,000 | 396,563 |
| | | | 3,983,158 |
| Metals & Mining - 1.6% | | | |
| Alcoa Nederland Holding BV: | | | |
| 6.125% 5/15/28 (d) | | 200,000 | 218,500 |
| 6.75% 9/30/24 (d) | | 430,000 | 447,867 |
| 7% 9/30/26 (d) | | 355,000 | 378,075 |
| Algoma Steel SCA 0% 12/31/23 (c) | | 102,200 | 0 |
| Alrosa Finance SA 3.1% 6/25/27 (d) | | 225,000 | 230,625 |
| Antofagasta PLC 2.375% 10/14/30 (d) | | 685,000 | 690,994 |
| Arconic Rolled Products Corp.: | | | |
| 6% 5/15/25 (d) | | 400,000 | 427,000 |
| 6.125% 2/15/28 (d) | | 875,000 | 943,359 |
| Celtic Resources Holdings DAC 4.125% 10/9/24 (d) | | 200,000 | 210,500 |
| Cleveland-Cliffs, Inc.: | | | |
| 4.875% 1/15/24 (d) | | 620,000 | 630,850 |
| 5.75% 3/1/25 | | 160,000 | 162,400 |
| 5.875% 6/1/27 | | 960,000 | 978,835 |
| Commercial Metals Co. 5.75% 4/15/26 | | 460,000 | 474,950 |
| Compass Minerals International, Inc. 6.75% 12/1/27 (d) | | 1,305,000 | 1,414,777 |
| Corporacion Nacional del Cobre de Chile (Codelco): | | | |
| 3% 9/30/29 (d) | | 105,000 | 113,761 |
| 3.15% 1/14/30 (d) | | 280,000 | 305,288 |
| 3.7% 1/30/50 (d) | | 650,000 | 714,188 |
| CSN Resources SA 7.625% 2/13/23 (d) | | 1,515,000 | 1,569,919 |
| First Quantum Minerals Ltd.: | | | |
| 6.5% 3/1/24 (d) | | 610,000 | 625,822 |
| 6.875% 3/1/26 (d) | | 1,265,000 | 1,321,530 |
| 7.25% 4/1/23 (d) | | 2,140,000 | 2,194,185 |
| 7.5% 4/1/25 (d) | | 1,330,000 | 1,379,875 |
| FMG Resources (August 2006) Pty Ltd.: | | | |
| 4.5% 9/15/27 (d) | | 485,000 | 538,830 |
| 4.75% 5/15/22 (d) | | 405,000 | 416,644 |
| 5.125% 3/15/23 (d) | | 650,000 | 686,563 |
| 5.125% 5/15/24 (d) | | 495,000 | 537,075 |
| Fresnillo PLC 4.25% 10/2/50 (d) | | 360,000 | 394,200 |
| Gold Fields Orogen Holding BVI Ltd. 5.125% 5/15/24 (d) | | 160,000 | 175,750 |
| Indonesia Asahan Aluminium Tbk PT 5.45% 5/15/30 (d) | | 170,000 | 204,531 |
| Infrabuild Australia Pty Ltd. 12% 10/1/24 (d) | | 485,000 | 490,456 |
| Kaiser Aluminum Corp. 4.625% 3/1/28 (d) | | 595,000 | 617,313 |
| Metinvest BV 7.75% 4/23/23 (d) | | 1,004,000 | 1,069,260 |
| Mineral Resources Ltd. 8.125% 5/1/27 (d) | | 960,000 | 1,062,000 |
| Murray Energy Corp.: | | | |
| 11.25% 4/15/21 (c)(d)(f) | | 490,000 | 5 |
| 12% 4/15/24 pay-in-kind (c)(d)(f)(g) | | 548,100 | 27 |
| Stillwater Mining Co. 6.125% 6/27/22 (d) | | 1,385,000 | 1,403,178 |
| TMK Capital SA 4.3% 2/12/27 (Reg. S) | | 400,000 | 396,375 |
| United States Steel Corp. 6.25% 3/15/26 | | 615,000 | 562,725 |
| Usiminas International SARL 5.875% 7/18/26 (d) | | 400,000 | 433,875 |
| Vedanta Resources PLC 6.375% 7/30/22 (d) | | 665,000 | 588,317 |
| VM Holding SA 6.5% 1/18/28 (d) | | 285,000 | 336,300 |
| | | | 25,346,724 |
| TOTAL MATERIALS | | | 54,616,440 |
| REAL ESTATE - 1.3% | | | |
| Equity Real Estate Investment Trusts (REITs) - 1.0% | | | |
| Crown Castle International Corp. 5.25% 1/15/23 | | 1,530,000 | 1,674,116 |
| Iron Mountain, Inc.: | | | |
| 4.875% 9/15/29 (d) | | 1,300,000 | 1,371,500 |
| 5% 7/15/28 (d) | | 630,000 | 669,293 |
| 5.25% 7/15/30 (d) | | 585,000 | 631,800 |
| 5.625% 7/15/32 (d) | | 585,000 | 644,963 |
| MGM Growth Properties Operating Partnership LP 3.875% 2/15/29 (d) | | 665,000 | 679,963 |
| MPT Operating Partnership LP/MPT Finance Corp.: | | | |
| 3.5% 3/15/31 | | 665,000 | 686,613 |
| 4.625% 8/1/29 | | 970,000 | 1,042,750 |
| 5% 10/15/27 | | 1,295,000 | 1,377,556 |
| SBA Communications Corp. 3.875% 2/15/27 | | 890,000 | 934,500 |
| The GEO Group, Inc.: | | | |
| 5.125% 4/1/23 | | 695,000 | 628,106 |
| 5.875% 10/15/24 | | 810,000 | 672,300 |
| 6% 4/15/26 | | 1,971,000 | 1,566,945 |
| Uniti Group, Inc. 7.875% 2/15/25 (d) | | 920,000 | 988,273 |
| VICI Properties, Inc.: | | | |
| 4.25% 12/1/26 (d) | | 1,140,000 | 1,182,351 |
| 4.625% 12/1/29 (d) | | 650,000 | 695,500 |
| | | | 15,446,529 |
| Real Estate Management & Development - 0.3% | | | |
| DTZ U.S. Borrower LLC 6.75% 5/15/28 (d) | | 650,000 | 716,625 |
| Realogy Group LLC/Realogy Co-Issuer Corp. 7.625% 6/15/25 (d) | | 2,000,000 | 2,171,440 |
| Taylor Morrison Communities, Inc./Monarch Communities, Inc.: | | | |
| 5.125% 8/1/30 (d) | | 635,000 | 711,200 |
| 5.875% 6/15/27 (d) | | 495,000 | 560,993 |
| Weekley Homes LLC/Weekley Finance Corp. 4.875% 9/15/28 (d) | | 300,000 | 313,500 |
| | | | 4,473,758 |
| TOTAL REAL ESTATE | | | 19,920,287 |
| UTILITIES - 2.3% | | | |
| Electric Utilities - 2.2% | | | |
| Clearway Energy Operating LLC 4.75% 3/15/28 (d) | | 365,000 | 391,463 |
| Eskom Holdings SOC Ltd.: | | | |
| 5.75% 1/26/21 (d) | | 4,226,000 | 4,215,435 |
| 6.75% 8/6/23 (d) | | 755,000 | 766,561 |
| NextEra Energy Partners LP: | | | |
| 4.25% 7/15/24 (d) | | 360,000 | 385,200 |
| 4.25% 9/15/24 (d) | | 23,000 | 24,610 |
| NRG Energy, Inc.: | | | |
| 3.375% 2/15/29 (d) | | 305,000 | 312,259 |
| 3.625% 2/15/31 (d) | | 605,000 | 622,424 |
| 5.75% 1/15/28 | | 1,740,000 | 1,900,950 |
| 6.625% 1/15/27 | | 1,345,000 | 1,420,374 |
| Pacific Gas & Electric Co.: | | | |
| 3.45% 7/1/25 | | 151,500 | 164,142 |
| 3.75% 7/1/28 | | 151,500 | 165,360 |
| 3.75% 8/15/42 | | 555,000 | 557,253 |
| 3.95% 12/1/47 | | 2,880,000 | 2,975,622 |
| 4% 12/1/46 | | 1,315,000 | 1,363,481 |
| 4.25% 3/15/46 | | 125,000 | 133,944 |
| 4.3% 3/15/45 | | 315,000 | 335,841 |
| 4.55% 7/1/30 | | 5,339,000 | 6,078,532 |
| 4.95% 7/1/50 | | 5,339,000 | 6,351,814 |
| Pampa Holding SA 7.5% 1/24/27 (d) | | 195,000 | 171,173 |
| PG&E Corp.: | | | |
| 5% 7/1/28 | | 1,345,000 | 1,432,425 |
| 5.25% 7/1/30 | | 510,000 | 561,000 |
| Vistra Operations Co. LLC: | | | |
| 5% 7/31/27 (d) | | 1,220,000 | 1,293,200 |
| 5.5% 9/1/26 (d) | | 820,000 | 854,604 |
| 5.625% 2/15/27 (d) | | 1,495,000 | 1,590,142 |
| | | | 34,067,809 |
| Gas Utilities - 0.1% | | | |
| Promigas SA ESP/Gases del Pacifico SAC 3.75% 10/16/29 (d) | | 335,000 | 356,461 |
| Southern Natural Gas Co. LLC: | | | |
| 7.35% 2/15/31 | | 175,000 | 234,711 |
| 8% 3/1/32 | | 335,000 | 479,948 |
| | | | 1,071,120 |
| Independent Power and Renewable Electricity Producers - 0.0% | | | |
| EnfraGen Energia Sur SA 5.375% 12/30/30 (d) | | 440,000 | 455,950 |
| Termocandelaria Power Ltd. 7.875% 1/30/29 (d) | | 305,000 | 335,500 |
| | | | 791,450 |
| Multi-Utilities - 0.0% | | | |
| Abu Dhabi National Energy Co. PJSC: | | | |
| 4% 10/3/49 (d) | | 143,000 | 171,108 |
| 4.875% 4/23/30 (d) | | 95,000 | 118,305 |
| | | | 289,413 |
| TOTAL UTILITIES | | | 36,219,792 |
|
| TOTAL NONCONVERTIBLE BONDS | | | 595,620,210 |
|
| TOTAL CORPORATE BONDS | | | |
| (Cost $562,559,667) | | | 596,354,340 |
|
| U.S. Government and Government Agency Obligations - 17.3% | | | |
| U.S. Government Agency Obligations - 0.2% | | | |
| Fannie Mae 0.625% 4/22/25 | | 210,000 | 212,426 |
| Federal Farm Credit Bank 0.375% 4/8/22 | | 2,900,000 | 2,909,371 |
| Tennessee Valley Authority: | | | |
| 5.25% 9/15/39 | | $126,000 | $189,041 |
| 5.375% 4/1/56 | | 302,000 | 514,205 |
|
| TOTAL U.S. GOVERNMENT AGENCY OBLIGATIONS | | | 3,825,043 |
|
| U.S. Treasury Obligations - 16.8% | | | |
| U.S. Treasury Bonds: | | | |
| 1.375% 8/15/50 | | 1,098,000 | 1,025,944 |
| 1.625% 11/15/50 | | 9,058,000 | 9,004,218 |
| 2.5% 2/15/45 (i) | | 17,524,000 | 20,859,036 |
| 3% 5/15/45 | | 1,800,000 | 2,331,141 |
| 3% 2/15/49 | | 16,081,000 | 21,170,385 |
| 4.75% 2/15/37 (i)(j) | | 8,126,000 | 12,374,692 |
| 6.25% 8/15/23 (i) | | 2,249,000 | 2,608,489 |
| U.S. Treasury Notes: | | | |
| 0.125% 5/31/22 | | 7,475,000 | 7,476,460 |
| 0.125% 6/30/22 | | 575,000 | 575,067 |
| 0.125% 8/31/22 | | 5,100,000 | 5,100,199 |
| 0.125% 10/31/22 | | 8,000,000 | 8,000,938 |
| 0.125% 11/30/22 | | 4,000,000 | 4,000,312 |
| 0.125% 8/15/23 | | 374,000 | 373,766 |
| 0.125% 10/15/23 | | 280,000 | 279,781 |
| 0.125% 12/15/23 | | 83,000 | 82,896 |
| 0.25% 7/31/25 | | 1,221,000 | 1,217,184 |
| 0.25% 9/30/25 | | 1,207,000 | 1,202,191 |
| 0.25% 10/31/25 | | 1,700,000 | 1,692,297 |
| 0.375% 12/31/25 | | 6,019,000 | 6,022,292 |
| 0.625% 11/30/27 | | 20,148,000 | 20,135,408 |
| 0.625% 12/31/27 | | 13,663,000 | 13,641,652 |
| 0.875% 11/15/30 | | 7,415,000 | 7,386,035 |
| 1.375% 8/31/23 | | 500,000 | 516,289 |
| 1.5% 8/31/21 | | 2,000,000 | 2,018,438 |
| 1.5% 9/30/21 | | 4,616,000 | 4,663,603 |
| 1.5% 9/30/24 | | 1,995,000 | 2,088,827 |
| 1.5% 10/31/24 | | 280,000 | 293,420 |
| 1.5% 1/31/27 | | 5,095,000 | 5,398,511 |
| 1.625% 11/15/22 | | 3,584,000 | 3,683,680 |
| 1.625% 5/31/23 | | 760,000 | 787,045 |
| 1.625% 9/30/26 | | 4,153,000 | 4,426,190 |
| 2.125% 3/31/24 | | 5,843,000 | 6,207,275 |
| 2.125% 7/31/24 | | 9,671,000 | 10,330,592 |
| 2.25% 3/31/21 | | 700,000 | 703,504 |
| 2.25% 4/30/21 | | 1,350,000 | 1,359,334 |
| 2.25% 7/31/21 | | 1,379,000 | 1,395,914 |
| 2.25% 4/30/24 | | 3,531,000 | 3,771,136 |
| 2.25% 3/31/26 | | 3,329,000 | 3,650,197 |
| 2.375% 4/15/21 | | 9,090,000 | 9,148,233 |
| 2.5% 1/31/21 | | 2,753,000 | 2,757,763 |
| 2.5% 2/28/21 | | 5,080,000 | 5,098,124 |
| 2.5% 1/15/22 | | 22,856,000 | 23,415,760 |
| 2.5% 1/31/24 | | 630,000 | 674,912 |
| 2.5% 2/28/26 | | 7,215,000 | 7,996,813 |
| 2.625% 12/31/23 | | 8,827,000 | 9,473,164 |
| 2.875% 11/30/25 | | 3,162,000 | 3,549,469 |
| 3.125% 11/15/28 | | 1,580,000 | 1,869,770 |
|
| TOTAL U.S. TREASURY OBLIGATIONS | | | 261,838,346 |
|
| Other Government Related - 0.3% | | | |
| National Credit Union Administration Guaranteed Notes Master Trust 3.45% 6/12/21 (NCUA Guaranteed) | | 3,400,000 | 3,446,737 |
| Private Export Funding Corp. Secured 1.75% 11/15/24 | | 1,030,000 | 1,078,046 |
|
| TOTAL OTHER GOVERNMENT RELATED | | | 4,524,783 |
|
| TOTAL U.S. GOVERNMENT AND GOVERNMENT AGENCY OBLIGATIONS | | | |
| (Cost $251,958,003) | | | 270,188,172 |
|
| Foreign Government and Government Agency Obligations - 15.6% | | | |
| Angola Republic: | | | |
| 8.25% 5/9/28 (d) | | $270,000 | $259,116 |
| 9.375% 5/8/48 (d) | | 85,000 | 80,245 |
| 9.5% 11/12/25 (d) | | 590,000 | 613,784 |
| Arab Republic of Egypt: | | | |
| yield at date of purchase 12.451% to 13.619% 1/26/21 to 7/6/21 | EGP | 16,375,000 | 1,000,804 |
| 7.5% 1/31/27 (d) | | 2,850,000 | 3,287,297 |
| 7.6003% 3/1/29 (d) | | 500,000 | 574,219 |
| 7.903% 2/21/48 (d) | | 385,000 | 418,447 |
| 8.5% 1/31/47 (d) | | 580,000 | 657,575 |
| 8.7002% 3/1/49 (d) | | 200,000 | 231,188 |
| Argentine Republic: | | | |
| 0.125% 7/9/30 (k) | | 8,200,308 | 3,333,425 |
| 0.125% 7/9/35 (k) | | 2,607,241 | 954,250 |
| 0.125% 1/9/38 (k) | | 897,304 | 367,053 |
| 1% 7/9/29 | | 738,798 | 321,377 |
| Australian Commonwealth 1.75% 6/21/51 (Reg. S) | AUD | 6,641,000 | 4,871,889 |
| Barbados Government: | | | |
| 6.5% 2/1/21 (d) | | 19,823 | 19,724 |
| 6.5% 10/1/29 (d) | | 859,000 | 868,127 |
| Bermuda Government: | | | |
| 2.375% 8/20/30 (d) | | 55,000 | 57,695 |
| 3.375% 8/20/50 (d) | | 165,000 | 177,736 |
| 3.717% 1/25/27 (d) | | 645,000 | 721,594 |
| 4.75% 2/15/29 (d) | | 360,000 | 439,200 |
| Brazilian Federative Republic: | | | |
| 2.875% 6/6/25 | | 1,165,000 | 1,213,930 |
| 3.875% 6/12/30 | | 570,000 | 601,350 |
| 4.75% 1/14/50 | | 425,000 | 453,422 |
| 7.125% 1/20/37 | | 390,000 | 529,059 |
| 8.25% 1/20/34 | | 1,230,000 | 1,789,266 |
| 10% 1/1/27 | BRL | 2,780,000 | 631,763 |
| Buoni del Tesoro Poliennali: | | | |
| 1.65% 12/1/30 (Reg. S) (d) | EUR | 1,750,000 | 2,371,623 |
| 1.7% 9/1/51 (Reg. S) (d) | EUR | 723,000 | 939,304 |
| Cameroon Republic 9.5% 11/19/25 (d) | | 1,345,000 | 1,488,327 |
| Canadian Government: | | | |
| 0.25% 11/1/22 | CAD | 18,910,000 | 14,869,063 |
| 2% 12/1/51 | CAD | 1,340,000 | 1,266,068 |
| Chilean Republic 3.86% 6/21/47 | | 195,000 | 237,717 |
| Colombian Republic: | | | |
| 3% 1/30/30 | | 265,000 | 278,416 |
| 4.125% 5/15/51 | | 220,000 | 244,420 |
| 5% 6/15/45 | | 670,000 | 818,866 |
| Costa Rican Republic: | | | |
| 5.625% 4/30/43 (d) | | 200,000 | 166,938 |
| 7% 4/4/44 (d) | | 60,000 | 54,881 |
| Democratic Socialist Republic of Sri Lanka: | | | |
| 7.55% 3/28/30 (d) | | 155,000 | 87,963 |
| 7.85% 3/14/29 (d) | | 415,000 | 236,161 |
| Dominican Republic: | | | |
| 5.875% 1/30/60 (d) | | 270,000 | 295,988 |
| 5.95% 1/25/27 (d) | | 445,000 | 519,120 |
| 6% 7/19/28 (d) | | 360,000 | 428,063 |
| 6.4% 6/5/49 (d) | | 380,000 | 446,144 |
| 6.5% 2/15/48 (d) | | 65,000 | 76,598 |
| 6.5% 2/15/48 (Reg. S) | | 150,000 | 176,766 |
| 6.85% 1/27/45 (d) | | 300,000 | 364,969 |
| 6.875% 1/29/26 (d) | | 780,000 | 939,413 |
| 7.45% 4/30/44 (d) | | 690,000 | 889,669 |
| Dutch Government 0% 7/15/30 (Reg. S) (d) | EUR | 7,680,000 | 9,830,628 |
| Ecuador Republic: | | | |
| 0.5% 7/31/30 (d)(k) | | 890,000 | 571,825 |
| 0.5% 7/31/35 (d)(k) | | 580,000 | 314,650 |
| El Salvador Republic: | | | |
| 5.875% 1/30/25 (d) | | 80,000 | 75,350 |
| 7.1246% 1/20/50 (d) | | 220,000 | 195,938 |
| 7.625% 2/1/41 (d) | | 90,000 | 83,616 |
| 7.75% 1/24/23 (d) | | 730,000 | 720,419 |
| 9.5% 7/15/52 (d) | | 25,000 | 25,219 |
| Emirate of Abu Dhabi: | | | |
| 1.7% 3/2/31 (d) | | 570,000 | 568,575 |
| 2.5% 4/16/25 (d) | | 510,000 | 545,063 |
| 3.125% 4/16/30 (d) | | 915,000 | 1,033,378 |
| 3.125% 9/30/49 (d) | | 920,000 | 982,675 |
| 3.875% 4/16/50 (d) | | 620,000 | 753,106 |
| Emirate of Dubai 3.9% 9/9/50 (Reg. S) | | 200,000 | 195,625 |
| Gabonese Republic 6.375% 12/12/24 (d) | | 525,000 | 546,000 |
| Georgia Republic 6.875% 4/12/21 (d) | | 230,000 | 232,659 |
| German Federal Republic: | | | |
| 0% 9/16/22 (Reg. S) | EUR | 27,190,000 | 33,620,032 |
| 0% 2/15/30 (Reg. S) | EUR | 13,910,000 | 17,949,262 |
| 0% 8/15/50 | EUR | 1,120,000 | 1,435,555 |
| 0.25% 2/15/29 | EUR | 9,664,575 | 12,698,112 |
| Ghana Republic: | | | |
| 8.125% 1/18/26 (d) | | 220,000 | 246,263 |
| 10.75% 10/14/30 (d) | | 360,000 | 480,713 |
| Guatemalan Republic: | | | |
| 4.9% 6/1/30 (d) | | 40,000 | 46,513 |
| 5.375% 4/24/32 (d) | | 380,000 | 462,175 |
| 6.125% 6/1/50 (d) | | 225,000 | 296,719 |
| Indonesian Republic: | | | |
| 3.85% 10/15/30 | | 330,000 | 383,109 |
| 4.1% 4/24/28 | | 665,000 | 772,231 |
| 4.35% 1/11/48 | | 300,000 | 357,563 |
| 5.125% 1/15/45 (d) | | 825,000 | 1,061,672 |
| 5.25% 1/17/42 (d) | | 305,000 | 394,213 |
| 5.95% 1/8/46 (d) | | 350,000 | 503,672 |
| 6.625% 2/17/37 (d) | | 220,000 | 312,538 |
| 6.75% 1/15/44 (d) | | 330,000 | 506,138 |
| 7% 9/15/30 | IDR | 7,863,000,000 | 598,819 |
| 7.75% 1/17/38 (d) | | 730,000 | 1,144,731 |
| 8.5% 10/12/35 (Reg. S) | | 700,000 | 1,144,938 |
| Islamic Republic of Pakistan: | | | |
| 6.875% 12/5/27 (d) | | 230,000 | 238,769 |
| 8.25% 4/15/24 (d) | | 95,000 | 103,134 |
| Israeli State: | | | |
| (guaranteed by U.S. Government through Agency for International Development): | | | |
| 5.5% 9/18/23 | | 5,395,000 | 6,141,945 |
| 5.5% 12/4/23 | | 1,628,000 | 1,875,977 |
| 3.375% 1/15/50 | | 595,000 | 657,784 |
| Ivory Coast: | | | |
| 4.875% 1/30/32 (d) | EUR | 365,000 | 457,607 |
| 5.875% 10/17/31 (d) | EUR | 500,000 | 674,771 |
| 6.125% 6/15/33 (d) | | 200,000 | 225,313 |
| Jamaican Government: | | | |
| 6.75% 4/28/28 | | 255,000 | 310,223 |
| 7.875% 7/28/45 | | 160,000 | 228,750 |
| Japan Government: | | | |
| 0.1% 9/20/29 | JPY | 659,350,000 | 6,457,358 |
| 0.4% 3/20/56 | JPY | 418,450,000 | 3,709,050 |
| 0.9% 6/20/22 | JPY | 764,100,000 | 7,509,130 |
| Jordanian Kingdom: | | | |
| 4.95% 7/7/25 (d) | | 575,000 | 609,500 |
| 7.375% 10/10/47 (d) | | 110,000 | 128,253 |
| Kingdom of Saudi Arabia: | | | |
| 2.9% 10/22/25 (d) | | 535,000 | 576,463 |
| 3.625% 3/4/28 (d) | | 315,000 | 353,588 |
| 3.75% 1/21/55 (d) | | 255,000 | 278,508 |
| 4.5% 4/22/60 (d) | | 425,000 | 533,375 |
| 4.625% 10/4/47 (d) | | 330,000 | 407,447 |
| Korean Republic 1% 9/16/30 | | 590,000 | 580,837 |
| Lebanese Republic: | | | |
| 5.8% 12/31/49 (f) | | 625,000 | 78,125 |
| 6.375% 12/31/49 (f) | | 810,000 | 101,250 |
| Ministry of Finance of the Russian Federation: | | | |
| 4.25% 6/23/27(Reg. S) | | 600,000 | 685,500 |
| 4.375% 3/21/29(Reg. S) | | 1,400,000 | 1,633,800 |
| 5.1% 3/28/35 (d) | | 1,200,000 | 1,514,625 |
| 5.1% 3/28/35(Reg. S) | | 1,000,000 | 1,262,188 |
| 5.25% 6/23/47 (d) | | 600,000 | 828,000 |
| 5.25% 6/23/47(Reg. S) | | 600,000 | 828,000 |
| 5.625% 4/4/42 (d) | | 200,000 | 278,063 |
| 7.6% 7/20/22 | RUB | 43,870,000 | 620,951 |
| 8.5% 9/17/31 | RUB | 37,155,000 | 601,695 |
| Mongolia Government 5.125% 4/7/26 (d) | | 480,000 | 514,800 |
| Moroccan Kingdom: | | | |
| 2.375% 12/15/27 (d) | | 520,000 | 521,950 |
| 3% 12/15/32 (d) | | 200,000 | 202,500 |
| 4% 12/15/50 (d) | | 200,000 | 205,750 |
| 5.5% 12/11/42 (d) | | 70,000 | 87,216 |
| Panamanian Republic: | | | |
| 2.252% 9/29/32 | | 315,000 | 324,135 |
| 3.87% 7/23/60 | | 235,000 | 276,713 |
| Peoples Republic of China 1.2% 10/21/30 (d) | | 430,000 | 428,884 |
| Peruvian Republic: | | | |
| 1.862% 12/1/32 | | 235,000 | 237,233 |
| 2.78% 12/1/60 | | 250,000 | 251,625 |
| Province of Santa Fe 7% 3/23/23 (d) | | 1,190,000 | 892,500 |
| Provincia de Cordoba: | | | |
| 7.125% 6/10/21 (d) | | 1,500,000 | 984,375 |
| 7.45% 9/1/24 (d) | | 880,000 | 528,825 |
| Republic of Benin 5.75% 3/26/26 (d) | EUR | 245,000 | 315,672 |
| Republic of Honduras 5.625% 6/24/30 (d) | | 230,000 | 261,194 |
| Republic of Iraq 5.8% 1/15/28 (Reg. S) | | 515,625 | 478,887 |
| Republic of Kenya: | | | |
| 6.875% 6/24/24 (d) | | 540,000 | 591,131 |
| 7% 5/22/27 (d) | | 215,000 | 236,366 |
| Republic of Montenegro 2.875% 12/16/27 (d) | EUR | 275,000 | 328,815 |
| Republic of Nigeria: | | | |
| 6.375% 7/12/23 (d) | | 385,000 | 415,920 |
| 6.5% 11/28/27 (d) | | 225,000 | 242,367 |
| 7.143% 2/23/30 (d) | | 240,000 | 258,375 |
| 7.625% 11/21/25 (d) | | 1,575,000 | 1,807,805 |
| Republic of Paraguay: | | | |
| 4.95% 4/28/31 (d) | | 480,000 | 579,600 |
| 5.4% 3/30/50 (d) | | 390,000 | 492,253 |
| Republic of Serbia 2.125% 12/1/30 (d) | | 335,000 | 330,394 |
| Republic of Uzbekistan: | | | |
| 3.7% 11/25/30 (d) | | 270,000 | 284,175 |
| 4.75% 2/20/24 (d) | | 215,000 | 234,028 |
| Romanian Republic: | | | |
| 3% 2/14/31 (d) | | 500,000 | 535,156 |
| 4.375% 8/22/23 (d) | | 210,000 | 229,228 |
| 4.625% 4/3/49 | EUR | 190,000 | 313,353 |
| Rwanda Republic 6.625% 5/2/23 (d) | | 910,000 | 961,756 |
| State of Qatar: | | | |
| 3.75% 4/16/30 (d) | | 1,755,000 | 2,060,480 |
| 4% 3/14/29 (d) | | 840,000 | 996,450 |
| 4.4% 4/16/50 (d) | | 520,000 | 676,000 |
| 4.817% 3/14/49 (d) | | 1,060,000 | 1,443,588 |
| 5.103% 4/23/48 (d) | | 70,000 | 98,350 |
| 9.75% 6/15/30 (d) | | 295,000 | 501,039 |
| Sultanate of Oman: | | | |
| 3.875% 3/8/22 (d) | | 575,000 | 577,336 |
| 4.125% 1/17/23 (d) | | 310,000 | 312,616 |
| 6.75% 1/17/48 (d) | | 750,000 | 740,859 |
| The Third Pakistan International Sukuk Co. Ltd. 5.5% 10/13/21 (d) | | 340,000 | 343,719 |
| Turkish Republic: | | | |
| 3.25% 3/23/23 | | 2,595,000 | 2,588,513 |
| 4.25% 3/13/25 | | 845,000 | 846,320 |
| 4.25% 4/14/26 | | 215,000 | 212,783 |
| 4.875% 10/9/26 | | 400,000 | 404,250 |
| 4.875% 4/16/43 | | 715,000 | 625,625 |
| 5.125% 3/25/22 | | 1,615,000 | 1,650,328 |
| 5.125% 2/17/28 | | 520,000 | 526,500 |
| 5.25% 3/13/30 | | 835,000 | 837,870 |
| 5.75% 5/11/47 | | 1,415,000 | 1,344,250 |
| 5.95% 1/15/31 | | 455,000 | 474,338 |
| 6% 1/14/41 | | 240,000 | 236,625 |
| 6.25% 9/26/22 | | 1,205,000 | 1,261,108 |
| 6.35% 8/10/24 | | 270,000 | 289,322 |
| 6.375% 10/14/25 | | 585,000 | 631,617 |
| Ukraine Government: | | | |
| 1.471% 9/29/21 | | 1,600,000 | 1,614,390 |
| 7.253% 3/15/33 (d) | | 585,000 | 637,650 |
| 7.375% 9/25/32 (d) | | 285,000 | 313,144 |
| 7.75% 9/1/21 (d) | | 4,783,000 | 4,959,971 |
| 7.75% 9/1/22 (d) | | 346,000 | 370,566 |
| 7.75% 9/1/23 (d) | | 545,000 | 599,500 |
| 7.75% 9/1/24 (d) | | 1,055,000 | 1,170,061 |
| 7.75% 9/1/26 (d) | | 200,000 | 225,750 |
| 7.75% 9/1/27 (d) | | 110,000 | 124,850 |
| 17% 5/11/22 | UAH | 15,070,000 | 569,912 |
| United Kingdom, Great Britain and Northern Ireland 0.125% 1/31/23 (Reg. S) | GBP | 3,420,000 | 4,695,541 |
| United Kingdom, Great Britain and Northern Ireland Treasury GILT 2.5% 7/22/65 (Reg. S) | GBP | 1,260,000 | 2,954,559 |
| United Mexican States: | | | |
| 3.25% 4/16/30 | | 620,000 | 671,925 |
| 3.75% 1/11/28 | | 590,000 | 664,672 |
| 3.9% 4/27/25 | | 250,000 | 281,235 |
| 4.5% 4/22/29 | | 345,000 | 404,513 |
| 5.75% 10/12/2110 | | 955,000 | 1,267,763 |
| 6.05% 1/11/40 | | 670,000 | 898,009 |
| Uruguay Republic 5.1% 6/18/50 | | 675,000 | 944,578 |
| Venezuelan Republic: | | | |
| 9.25% 9/15/27 (f) | | 2,395,000 | 215,550 |
| 11.95% 8/5/31 (Reg. S) (f) | | 1,090,000 | 98,100 |
| 12.75% 8/23/22 (f) | | 190,000 | 17,100 |
| Vietnamese Socialist Republic 5.5% 3/12/28 | | 1,892,000 | 1,888,453 |
| TOTAL FOREIGN GOVERNMENT AND GOVERNMENT AGENCY OBLIGATIONS | | | |
| (Cost $233,799,551) | | | 242,870,344 |
| | | Shares | Value |
|
| Common Stocks - 7.2% | | | |
| COMMUNICATION SERVICES - 0.9% | | | |
| Entertainment - 0.1% | | | |
| New Cotai LLC/New Cotai Capital Corp. (b)(c) | | 247,075 | 948,768 |
| Interactive Media & Services - 0.4% | | | |
| Alphabet, Inc. Class A (l) | | 1,400 | 2,453,696 |
| Facebook, Inc. Class A (l) | | 9,300 | 2,540,388 |
| Tencent Holdings Ltd. sponsored ADR | | 11,900 | 855,491 |
| | | | 5,849,575 |
| Media - 0.2% | | | |
| Altice U.S.A., Inc. Class A (l) | | 47,800 | 1,810,186 |
| iHeartMedia, Inc. warrants 5/1/39 (l) | | 5,655 | 73,397 |
| Nexstar Broadcasting Group, Inc. Class A | | 12,200 | 1,332,118 |
| | | | 3,215,701 |
| Wireless Telecommunication Services - 0.2% | | | |
| T-Mobile U.S., Inc. | | 27,400 | 3,694,890 |
|
| TOTAL COMMUNICATION SERVICES | | | 13,708,934 |
|
| CONSUMER DISCRETIONARY - 1.2% | | | |
| Auto Components - 0.0% | | | |
| Exide Technologies (c) | | 84 | 54,600 |
| Exide Technologies (c)(l) | | 2,115 | 2,115 |
| Exide Technologies (c)(l) | | 124,905 | 1 |
| UC Holdings, Inc. (c)(l) | | 33,750 | 354,713 |
| | | | 411,429 |
| Hotels, Restaurants & Leisure - 0.7% | | | |
| Boyd Gaming Corp. | | 41,400 | 1,776,888 |
| Caesars Entertainment, Inc. (l) | | 67,500 | 5,013,225 |
| MGM Resorts International | | 21,600 | 680,616 |
| Penn National Gaming, Inc. (l) | | 44,100 | 3,808,917 |
| Studio City International Holdings Ltd. ADR (l) | | 11,100 | 131,757 |
| | | | 11,411,403 |
| Household Durables - 0.2% | | | |
| Tempur Sealy International, Inc. (l) | | 93,200 | 2,516,400 |
| Whirlpool Corp. | | 5,300 | 956,597 |
| | | | 3,472,997 |
| Internet & Direct Marketing Retail - 0.2% | | | |
| Alibaba Group Holding Ltd. sponsored ADR (l) | | 4,000 | 930,920 |
| Amazon.com, Inc. (l) | | 400 | 1,302,772 |
| | | | 2,233,692 |
| Specialty Retail - 0.1% | | | |
| Lowe's Companies, Inc. | | 8,600 | 1,380,386 |
|
| TOTAL CONSUMER DISCRETIONARY | | | 18,909,907 |
|
| CONSUMER STAPLES - 0.3% | | | |
| Food & Staples Retailing - 0.0% | | | |
| Southeastern Grocers, Inc. (c)(l) | | 9,431 | 691,670 |
| Food Products - 0.3% | | | |
| Darling Ingredients, Inc. (l) | | 40,100 | 2,312,968 |
| JBS SA | | 447,600 | 2,038,854 |
| Reddy Ice Holdings, Inc. (c)(l) | | 5,683 | 0 |
| Reddy Ice Holdings, Inc. (c)(l) | | 2,286 | 126 |
| | | | 4,351,948 |
|
| TOTAL CONSUMER STAPLES | | | 5,043,618 |
|
| ENERGY - 1.0% | | | |
| Energy Equipment & Services - 0.0% | | | |
| Forbes Energy Services Ltd. (l) | | 6,562 | 591 |
| Jonah Energy LLC (c) | | 15,708 | 235,620 |
| | | | 236,211 |
| Oil, Gas & Consumable Fuels - 1.0% | | | |
| California Resources Corp. (l) | | 281,680 | 6,644,831 |
| California Resources Corp. (b) | | 124,259 | 2,931,270 |
| California Resources Corp. warrants 10/27/24 (l) | | 3,099 | 12,396 |
| Chaparral Energy, Inc.: | | | |
| Series A warrants 10/1/24 (c)(l) | | 13 | 22 |
| Series B warrants 10/1/25 (c)(l) | | 13 | 22 |
| Denbury, Inc. (l) | | 167,489 | 4,302,792 |
| Denbury, Inc. warrants 9/18/25 (l) | | 22,930 | 114,650 |
| EP Energy Corp. (c) | | 52,316 | 1,042,658 |
| Goodrich Petroleum Corp. (l) | | 4,211 | 42,489 |
| Harvest Oil & Gas Corp. | | 1,335 | 27,621 |
| Mesquite Energy, Inc.(c) | | 15,322 | 245,145 |
| Unit Corp. (c)(l) | | 1,943 | 15,706 |
| Whiting Petroleum Corp. (l) | | 6,615 | 165,375 |
| | | | 15,544,977 |
|
| TOTAL ENERGY | | | 15,781,188 |
|
| FINANCIALS - 0.2% | | | |
| Capital Markets - 0.0% | | | |
| Motors Liquidation Co. GUC Trust (l) | | 137 | 252 |
| Penson Worldwide, Inc. Class A (c)(l) | | 314,563 | 3 |
| | | | 255 |
| Consumer Finance - 0.1% | | | |
| OneMain Holdings, Inc. | | 35,200 | 1,695,232 |
| Diversified Financial Services - 0.0% | | | |
| ACNR Holdings, Inc. (c) | | 2,055 | 14,205 |
| Insurance - 0.1% | | | |
| Arthur J. Gallagher & Co. | | 8,000 | 989,680 |
|
| TOTAL FINANCIALS | | | 2,699,372 |
|
| HEALTH CARE - 0.6% | | | |
| Biotechnology - 0.0% | | | |
| Regeneron Pharmaceuticals, Inc. (l) | | 100 | 48,311 |
| Health Care Providers & Services - 0.3% | | | |
| HCA Holdings, Inc. | | 10,300 | 1,693,938 |
| Humana, Inc. | | 3,200 | 1,312,864 |
| Rotech Healthcare, Inc. (c)(l) | | 6,069 | 63,178 |
| UnitedHealth Group, Inc. | | 4,100 | 1,437,788 |
| | | | 4,507,768 |
| Life Sciences Tools & Services - 0.3% | | | |
| Charles River Laboratories International, Inc. (l) | | 4,800 | 1,199,328 |
| IQVIA Holdings, Inc. (l) | | 13,900 | 2,490,463 |
| Thermo Fisher Scientific, Inc. | | 3,500 | 1,630,230 |
| | | | 5,320,021 |
|
| TOTAL HEALTH CARE | | | 9,876,100 |
|
| INDUSTRIALS - 0.4% | | | |
| Air Freight & Logistics - 0.1% | | | |
| XPO Logistics, Inc. (l) | | 9,900 | 1,180,080 |
| Airlines - 0.0% | | | |
| Air Canada (l) | | 21,800 | 389,965 |
| Building Products - 0.1% | | | |
| Carrier Global Corp. | | 45,100 | 1,701,172 |
| Commercial Services & Supplies - 0.0% | | | |
| Novus Holdings Ltd. (l) | | 3,285 | 182 |
| Machinery - 0.1% | | | |
| Allison Transmission Holdings, Inc. | | 12,900 | 556,377 |
| Fortive Corp. | | 12,200 | 864,004 |
| | | | 1,420,381 |
| Marine - 0.0% | | | |
| U.S. Shipping Partners Corp. (c)(l) | | 644 | 0 |
| U.S. Shipping Partners Corp. warrants 12/31/29 (c)(l) | | 6,028 | 0 |
| | | | 0 |
| Professional Services - 0.0% | | | |
| ASGN, Inc. (l) | | 9,200 | 768,476 |
| Trading Companies & Distributors - 0.1% | | | |
| Penhall Acquisition Co.: | | | |
| Class A (c)(l) | | 321 | 24,075 |
| Class B (c)(l) | | 107 | 8,025 |
| United Rentals, Inc. (l) | | 3,863 | 895,868 |
| | | | 927,968 |
| Transportation Infrastructure - 0.0% | | | |
| Tricer Holdco SCA: | | | |
| Class A1 (b)(c)(l) | | 16,755 | 19 |
| Class A2 (b)(c)(l) | | 16,755 | 19 |
| Class A3 (b)(c)(l) | | 16,755 | 19 |
| Class A4 (b)(c)(l) | | 16,755 | 19 |
| Class A5 (b)(c)(l) | | 16,755 | 19 |
| Class A6 (b)(c)(l) | | 16,755 | 19 |
| Class A7 (b)(c)(l) | | 16,755 | 19 |
| Class A8 (b)(c)(l) | | 16,755 | 19 |
| Class A9 (b)(c)(l) | | 16,755 | 19 |
| | | | 171 |
|
| TOTAL INDUSTRIALS | | | 6,388,395 |
|
| INFORMATION TECHNOLOGY - 2.0% | | | |
| Electronic Equipment & Components - 0.3% | | | |
| CDW Corp. | | 5,700 | 751,203 |
| Vontier Corp. (l) | | 4,880 | 162,992 |
| Zebra Technologies Corp. Class A (l) | | 9,700 | 3,728,001 |
| | | | 4,642,196 |
| IT Services - 0.7% | | | |
| EPAM Systems, Inc. (l) | | 5,400 | 1,935,090 |
| Global Payments, Inc. | | 11,200 | 2,412,704 |
| GoDaddy, Inc. (l) | | 10,100 | 837,795 |
| MasterCard, Inc. Class A | | 4,400 | 1,570,536 |
| PayPal Holdings, Inc. (l) | | 11,500 | 2,693,300 |
| Visa, Inc. Class A | | 7,100 | 1,552,983 |
| | | | 11,002,408 |
| Semiconductors & Semiconductor Equipment - 0.4% | | | |
| Array Technologies, Inc. | | 300 | 12,942 |
| Lam Research Corp. | | 5,500 | 2,597,485 |
| Microchip Technology, Inc. | | 6,800 | 939,148 |
| Micron Technology, Inc. (l) | | 13,300 | 999,894 |
| ON Semiconductor Corp. (l) | | 33,700 | 1,103,001 |
| | | | 5,652,470 |
| Software - 0.6% | | | |
| Adobe, Inc. (l) | | 5,700 | 2,850,684 |
| Microsoft Corp. | | 16,900 | 3,758,898 |
| Palo Alto Networks, Inc. (l) | | 3,800 | 1,350,482 |
| SS&C Technologies Holdings, Inc. | | 17,308 | 1,259,157 |
| | | | 9,219,221 |
|
| TOTAL INFORMATION TECHNOLOGY | | | 30,516,295 |
|
| MATERIALS - 0.4% | | | |
| Chemicals - 0.2% | | | |
| Albemarle Corp. U.S. | | 7,400 | 1,091,648 |
| CF Industries Holdings, Inc. | | 25,200 | 975,492 |
| The Chemours Co. LLC | | 49,100 | 1,217,189 |
| | | | 3,284,329 |
| Containers & Packaging - 0.1% | | | |
| Berry Global Group, Inc. (l) | | 24,200 | 1,359,798 |
| WestRock Co. | | 27,600 | 1,201,428 |
| | | | 2,561,226 |
| Metals & Mining - 0.1% | | | |
| Algoma Steel GP (c)(l) | | 10,220 | 0 |
| Algoma Steel SCA (c)(l) | | 10,220 | 0 |
| Elah Holdings, Inc. (l) | | 14 | 1,148 |
| First Quantum Minerals Ltd. | | 63,200 | 1,134,512 |
| | | | 1,135,660 |
|
| TOTAL MATERIALS | | | 6,981,215 |
|
| UTILITIES - 0.2% | | | |
| Electric Utilities - 0.1% | | | |
| NRG Energy, Inc. | | 27,900 | 1,047,645 |
| PG&E Corp. (l) | | 88,466 | 1,102,286 |
| Portland General Electric Co. | | 140 | 5,988 |
| | | | 2,155,919 |
| Independent Power and Renewable Electricity Producers - 0.1% | | | |
| Vistra Corp. | | 44,500 | 874,870 |
|
| TOTAL UTILITIES | | | 3,030,789 |
|
| TOTAL COMMON STOCKS | | | |
| (Cost $87,523,141) | | | 112,935,813 |
|
| Nonconvertible Preferred Stocks - 0.0% | | | |
| CONSUMER DISCRETIONARY - 0.0% | | | |
| Auto Components - 0.0% | | | |
| Exide Technologies (c) | | 187 | 174,050 |
| FINANCIALS - 0.0% | | | |
| Diversified Financial Services - 0.0% | | | |
| ACNR Holdings, Inc. (c) | | 715 | 89,375 |
| INDUSTRIALS - 0.0% | | | |
| Transportation Infrastructure - 0.0% | | | |
| Tricer Holdco SCA (b)(c)(l) | | 8,042,141 | 2,716 |
| TOTAL NONCONVERTIBLE PREFERRED STOCKS | | | |
| (Cost $550,179) | | | 266,141 |
| | | Principal Amount | Value |
|
| Bank Loan Obligations - 1.5% | | | |
| COMMUNICATION SERVICES - 0.2% | | | |
| Diversified Telecommunication Services - 0.1% | | | |
| Connect Finco Sarl Tranche B 1LN, term loan 3 month U.S. LIBOR + 4.500% 5.5% 12/11/26 (g)(h)(m) | | 481,363 | 482,479 |
| Frontier Communications Corp. 1LN, term loan 3 month U.S. LIBOR + 4.750% 5.75% 10/8/27 (g)(h)(m) | | 95,000 | 95,297 |
| Securus Technologies Holdings Tranche B, term loan 3 month U.S. LIBOR + 4.500% 5.5% 11/1/24 (g)(h)(m) | | 420,000 | 392,440 |
| Zayo Group Holdings, Inc. 1LN, term loan 3 month U.S. LIBOR + 3.000% 3.1468% 3/9/27 (g)(h)(m) | | 409,763 | 406,690 |
| | | | 1,376,906 |
| Entertainment - 0.1% | | | |
| Allen Media LLC Tranche B 1LN, term loan 3 month U.S. LIBOR + 5.500% 5.7539% 2/10/27 (g)(h)(m) | | 441,592 | 439,199 |
| Media - 0.0% | | | |
| LCPR Loan Financing LLC Tranche B 1LN, term loan 3 month U.S. LIBOR + 5.000% 5.1586% 10/22/26 (g)(h)(m) | | 115,000 | 115,312 |
| Nexstar Broadcasting, Inc. Tranche B, term loan 3 month U.S. LIBOR + 2.750% 2.9048% 9/19/26 (g)(h)(m) | | 207,059 | 205,429 |
| | | | 320,741 |
| Wireless Telecommunication Services - 0.0% | | | |
| Intelsat Jackson Holdings SA Tranche DD 1LN, term loan 3 month U.S. LIBOR + 5.500% 6.5% 7/13/22 (g)(h)(m) | | 318,729 | 324,626 |
|
| TOTAL COMMUNICATION SERVICES | | | 2,461,472 |
|
| CONSUMER DISCRETIONARY - 0.2% | | | |
| Auto Components - 0.0% | | | |
| Midas Intermediate Holdco II LLC Tranche B 1LN, term loan 3 month U.S. LIBOR + 6.750% 12/16/25 (h)(m)(n) | | 50,000 | 50,625 |
| Diversified Consumer Services - 0.1% | | | |
| KUEHG Corp. Tranche B 2LN, term loan 3 month U.S. LIBOR + 8.250% 9.25% 8/22/25 (g)(h)(m) | | 305,000 | 289,369 |
| Sotheby's 1LN, term loan 3 month U.S. LIBOR + 5.500% 6.5% 1/3/27 (g)(h)(m) | | 600,320 | 601,821 |
| | | | 891,190 |
| Hotels, Restaurants & Leisure - 0.0% | | | |
| Travelport Finance Luxembourg SARL 1LN, term loan 3 month U.S. LIBOR + 5.000% 5.2539% 5/30/26 (g)(h)(m) | | 488,775 | 329,821 |
| Specialty Retail - 0.1% | | | |
| Wand NewCo 3, Inc. Tranche B 1LN, term loan 3 month U.S. LIBOR + 3.000% 3.1468% 2/5/26 (g)(h)(m) | | 970,423 | 955,381 |
|
| TOTAL CONSUMER DISCRETIONARY | | | 2,227,017 |
|
| ENERGY - 0.4% | | | |
| Energy Equipment & Services - 0.0% | | | |
| Forbes Energy Services LLC Tranche B, term loan 18% 4/13/21 (c)(g)(m) | | 69,601 | 70,123 |
| Oil, Gas & Consumable Fuels - 0.4% | | | |
| California Resources Corp. 2LN, term loan 3 month U.S. LIBOR + 9.000% 10% 10/27/25 (g)(h)(m) | | 1,178,920 | 1,170,078 |
| Chesapeake Energy Corp. term loan 3 month U.S. LIBOR + 8.000% 9% 6/9/24 (f)(g)(h)(m) | | 6,150,000 | 5,104,500 |
| Citgo Holding, Inc. Tranche B 1LN, term loan 3 month U.S. LIBOR + 7.000% 8% 8/1/23 (g)(h)(m) | | 74,063 | 68,138 |
| EG America LLC 2LN, term loan 3 month U.S. LIBOR + 8.000% 9% 3/23/26 (g)(h)(m) | | 302,000 | 292,028 |
| Sanchez Energy Corp.: | | | |
| 1LN, term loan 3 month U.S. LIBOR + 8.000% 0% 5/11/20 (c)(f)(h)(m) | | 283,417 | 0 |
| term loan 3 month U.S. LIBOR + 0.000% 7.25% 5/11/20 (c)(f)(g)(h)(m) | | 122,000 | 0 |
| | | | 6,634,744 |
|
| TOTAL ENERGY | | | 6,704,867 |
|
| FINANCIALS - 0.0% | | | |
| Capital Markets - 0.0% | | | |
| Citadel Securities LP Tranche B 1LN, term loan 3 month U.S. LIBOR + 2.750% 2.8968% 2/27/26 (g)(h)(m) | | 191,862 | 191,781 |
| Diversified Financial Services - 0.0% | | | |
| ACNR Holdings, Inc. term loan 17% 9/21/27 (c)(g)(m) | | 292,782 | 292,782 |
| New Cotai LLC 1LN, term loan 3 month U.S. LIBOR + 12.000% 14% 9/9/25 (c)(g)(h)(m) | | 66,844 | 66,844 |
| | | | 359,626 |
|
| TOTAL FINANCIALS | | | 551,407 |
|
| HEALTH CARE - 0.2% | | | |
| Health Care Equipment & Supplies - 0.0% | | | |
| CPI Holdco LLC 1LN, term loan 3 month U.S. LIBOR + 4.250% 4.3968% 11/4/26 (g)(h)(m) | | 29,775 | 29,775 |
| Health Care Providers & Services - 0.2% | | | |
| Milano Acquisition Corp. Tranche B 1LN, term loan 3 month U.S. LIBOR + 4.000% 4.75% 10/1/27 (g)(h)(m) | | 370,000 | 369,382 |
| U.S. Renal Care, Inc. Tranche B 1LN, term loan 3 month U.S. LIBOR + 5.000% 5.1875% 6/13/26 (g)(h)(m) | | 2,330,500 | 2,315,934 |
| | | | 2,685,316 |
| Pharmaceuticals - 0.0% | | | |
| Valeant Pharmaceuticals International, Inc. Tranche B, term loan 3 month U.S. LIBOR + 3.000% 3.148% 6/1/25 (g)(h)(m) | | 86,691 | 86,312 |
|
| TOTAL HEALTH CARE | | | 2,801,403 |
|
| INDUSTRIALS - 0.1% | | | |
| Air Freight & Logistics - 0.0% | | | |
| Dynasty Acquisition Co., Inc.: | | | |
| Tranche B 1LN, term loan 3 month U.S. LIBOR + 3.500% 3.7539% 4/8/26 (g)(h)(m) | | 138,262 | 131,349 |
| Tranche B2 1LN, term loan 3 month U.S. LIBOR + 3.500% 3.7539% 4/4/26 (g)(h)(m) | | 74,335 | 70,618 |
| | | | 201,967 |
| Airlines - 0.0% | | | |
| SkyMiles IP Ltd. Tranche B 1LN, term loan 3 month U.S. LIBOR + 3.750% 4.75% 10/20/27 (g)(h)(m) | | 205,000 | 212,245 |
| Building Products - 0.0% | | | |
| ACProducts, Inc. 1LN, term loan 3 month U.S. LIBOR + 6.500% 7.5% 8/13/25 (g)(h)(m) | | 240,406 | 246,416 |
| Commercial Services & Supplies - 0.1% | | | |
| Maverick Purchaser Sub LLC Tranche B 1LN, term loan 3 month U.S. LIBOR + 3.500% 3.6468% 1/23/27 (g)(h)(m) | | 114,425 | 113,996 |
| Sabert Corp. Tranche B 1LN, term loan 3 month U.S. LIBOR + 4.500% 5.5% 12/10/26 (g)(h)(m) | | 424,435 | 422,665 |
| | | | 536,661 |
|
| TOTAL INDUSTRIALS | | | 1,197,289 |
|
| INFORMATION TECHNOLOGY - 0.3% | | | |
| IT Services - 0.1% | | | |
| Camelot Finance SA Tranche B, term loan 3 month U.S. LIBOR + 3.000% 3.1468% 10/31/26 (g)(h)(m) | | 59,400 | 59,078 |
| GTT Communications, Inc.: | | | |
| 1LN, term loan 3 month U.S. LIBOR + 5.000% 8.5% 12/31/21 (c)(g)(h)(m) | | 97,959 | 97,959 |
| Tranche B, term loan 3 month U.S. LIBOR + 2.750% 3% 5/31/25 (g)(h)(m) | | 1,477,179 | 1,149,866 |
| Tranche DD 1LN, term loan 3 month U.S. LIBOR + 4.000% 12/31/21 (c)(h)(m)(o) | | 171,429 | 171,429 |
| Web.com Group, Inc.: | | | |
| 2LN, term loan 3 month U.S. LIBOR + 7.750% 7.898% 10/11/26 (g)(h)(m) | | 186,353 | 177,347 |
| Tranche B 1LN, term loan 3 month U.S. LIBOR + 3.750% 3.898% 10/11/25 (g)(h)(m) | | 545,205 | 536,798 |
| | | | 2,192,477 |
| Software - 0.2% | | | |
| Boxer Parent Co., Inc. Tranche B, term loan 3 month U.S. LIBOR + 4.250% 4.3968% 10/2/25 (g)(h)(m) | | 1,842,400 | 1,832,654 |
| McAfee LLC Tranche B, term loan 3 month U.S. LIBOR + 3.750% 3.898% 9/29/24 (g)(h)(m) | | 211,246 | 211,088 |
| Ultimate Software Group, Inc.: | | | |
| 1LN, term loan 3 month U.S. LIBOR + 4.000% 4.75% 5/3/26 (g)(h)(m) | | 668,325 | 671,286 |
| 2LN, term loan 3 month U.S. LIBOR + 6.750% 7.5% 5/3/27 (g)(h)(m) | | 140,000 | 143,675 |
| VS Buyer LLC Tranche B 1LN, term loan 3 month U.S. LIBOR + 3.250% 3.3968% 2/28/27 (g)(h)(m) | | 124,063 | 123,287 |
| | | | 2,981,990 |
|
| TOTAL INFORMATION TECHNOLOGY | | | 5,174,467 |
|
| UTILITIES - 0.1% | | | |
| Electric Utilities - 0.1% | | | |
| PG&E Corp. Tranche B 1LN, term loan 3 month U.S. LIBOR + 4.500% 5.5% 6/23/25 (g)(h)(m) | | 1,671,600 | 1,688,734 |
| TOTAL BANK LOAN OBLIGATIONS | | | |
| (Cost $22,799,829) | | | 22,806,656 |
| | | Shares | Value |
|
| Fixed-Income Funds - 8.5% | | | |
| Fidelity Floating Rate Central Fund (p) | | 1,335,379 | 132,269,326 |
| Fidelity Mortgage Backed Securities Central Fund (p) | | 68 | 7,573 |
| TOTAL FIXED-INCOME FUNDS | | | |
| (Cost $136,941,837) | | | 132,276,899 |
| | | Principal Amount | Value |
|
| Preferred Securities - 4.9% | | | |
| CONSUMER STAPLES - 0.2% | | | |
| Food Products - 0.2% | | | |
| Cosan Overseas Ltd. 8.25% (q) | | 1,885,000 | 1,952,089 |
| ENERGY - 0.5% | | | |
| Oil, Gas & Consumable Fuels - 0.5% | | | |
| DCP Midstream Partners LP 7.375% (g)(q) | | 775,000 | 645,919 |
| Energy Transfer Partners LP: | | | |
| 6.25% (g)(q) | | 3,540,000 | 2,897,870 |
| 6.625% (g)(q) | | 1,370,000 | 1,192,618 |
| Eni SpA 3.375% (Reg. S) (g)(q) | EUR | 695,000 | 916,866 |
| Gazprom PJSC Via Gaz Finance PLC 4.5985% (d)(g)(q) | | 550,000 | 575,917 |
| MPLX LP 6.875% (g)(q) | | 1,550,000 | 1,535,417 |
| Summit Midstream Partners LP 9.5% (g)(q) | | 148,000 | 48,017 |
| | | | 7,812,624 |
| FINANCIALS - 4.2% | | | |
| Banks - 3.6% | | | |
| Alfa Bond Issuance PLC: | | | |
| 6.95% (Reg. S) (g)(q) | | 200,000 | 209,567 |
| 8% (Reg. S) (g)(q) | | 475,000 | 497,866 |
| Banco Do Brasil SA 6.25% (d)(g)(q) | | 560,000 | 580,975 |
| Banco Mercantil del Norte SA: | | | |
| 6.875% (d)(g)(q) | | 295,000 | 315,098 |
| 7.625% (d)(g)(q) | | 210,000 | 241,086 |
| Bank of America Corp.: | | | |
| 5.125% (g)(q) | | 1,950,000 | 2,064,956 |
| 5.2% (g)(q) | | 3,717,000 | 3,891,434 |
| 5.875% (g)(q) | | 5,125,000 | 5,881,079 |
| 6.25% (g)(q) | | 1,410,000 | 1,592,476 |
| Citigroup, Inc.: | | | |
| 4.7% (g)(q) | | 3,805,000 | 3,984,909 |
| 5% (g)(q) | | 3,245,000 | 3,421,623 |
| 5.9% (g)(q) | | 1,455,000 | 1,560,432 |
| 5.95% (g)(q) | | 2,675,000 | 2,874,364 |
| 6.3% (g)(q) | | 270,000 | 294,842 |
| Emirates NBD Bank PJSC 6.125% (Reg. S) (g)(q) | | 425,000 | 460,032 |
| Georgia Bank Joint Stock Co. 11.125% (Reg. S) (g)(q) | | 200,000 | 208,245 |
| Huntington Bancshares, Inc. 5.7% (g)(q) | | 650,000 | 661,103 |
| Itau Unibanco Holding SA 6.125% (d)(g)(q) | | 660,000 | 677,468 |
| JPMorgan Chase & Co.: | | | |
| 3 month U.S. LIBOR + 3.320% 3.5451% (g)(h)(q) | | 2,145,000 | 2,126,358 |
| 3 month U.S. LIBOR + 3.800% 4.0144% (g)(h)(q) | | 865,000 | 867,942 |
| 4% (g)(q) | | 4,805,000 | 4,931,659 |
| 4.6% (g)(q) | | 1,225,000 | 1,288,241 |
| 5% (g)(q) | | 1,660,000 | 1,780,871 |
| 6% (g)(q) | | 6,524,000 | 7,076,019 |
| 6.125% (g)(q) | | 850,000 | 935,511 |
| 6.75% (g)(q) | | 400,000 | 460,157 |
| NBK Tier 1 Financing 2 Ltd. 4.5% (d)(g)(q) | | 455,000 | 465,369 |
| Tinkoff Credit Systems 9.25% (Reg. S) (g)(q) | | 1,005,000 | 1,071,888 |
| Wells Fargo & Co.: | | | |
| 5.875% (g)(q) | | 2,600,000 | 2,954,878 |
| 5.9% (g)(q) | | 3,065,000 | 3,261,177 |
| | | | 56,637,625 |
| Capital Markets - 0.6% | | | |
| Goldman Sachs Group, Inc.: | | | |
| 3 month U.S. LIBOR + 3.920% 4.1279% (g)(h)(q) | | 3,165,000 | 3,177,068 |
| 4.4% (g)(q) | | 420,000 | 436,681 |
| 4.95% (g)(q) | | 710,000 | 764,876 |
| 5% (g)(q) | | 4,331,000 | 4,405,417 |
| | | | 8,784,042 |
|
| TOTAL FINANCIALS | | | 65,421,667 |
|
| INDUSTRIALS - 0.0% | | | |
| Construction & Engineering - 0.0% | | | |
| Odebrecht Finance Ltd. 7.5% (d)(f)(q) | | 1,975,000 | 87,641 |
| Marine - 0.0% | | | |
| DP World Salaam 6% (Reg. S) (g)(q) | | 200,000 | 222,938 |
|
| TOTAL INDUSTRIALS | | | 310,579 |
|
| INFORMATION TECHNOLOGY - 0.0% | | | |
| IT Services - 0.0% | | | |
| Network i2i Ltd. 5.65% (d)(g)(q) | | 255,000 | 275,061 |
| TOTAL PREFERRED SECURITIES | | | |
| (Cost $74,267,111) | | | 75,772,020 |
| | | Shares | Value |
|
| Money Market Funds - 5.9% | | | |
| Fidelity Cash Central Fund 0.11% (r) | | | |
| (Cost $91,904,004) | | 91,894,179 | 91,912,557 |
| Purchased Swaptions - 0.0% | | | | |
| | | Expiration Date | Notional Amount | Value |
| Put Options - 0.0% | | | | |
| Option on an interest rate swap with Bank of America N.A. to pay semi-annually a fixed rate of 1.7375% and receive quarterly a floating rate based on 3-month LIBOR, expiring September 2029 | | 9/20/24 | 4,400,000 | $53,521 |
| Option on an interest rate swap with Goldman Sachs Bank U.S.A. to pay semi-annually a fixed rate of 1.4025% and receive quarterly a floating rate based on 3-month LIBOR, expiring February 2030 | | 2/26/25 | 1,900,000 | 40,206 |
| Option on an interest rate swap with JPMorgan Chase Bank N.A. to pay semi-annually a fixed rate of 1.57125% and receive quarterly a floating rate based on 3-month LIBOR, expiring September 2029 | | 9/5/24 | 2,600,000 | 37,527 |
|
| TOTAL PUT OPTIONS | | | | 131,254 |
|
| Call Options - 0.0% | | | | |
| Option on an interest rate swap with Bank of America N.A. to receive semi-annually a fixed rate of 1.7375% and pay quarterly a floating rate based on 3-month LIBOR, expiring September 2029 | | 9/20/24 | 4,400,000 | 163,157 |
| Option on an interest rate swap with Goldman Sachs Bank U.S.A. to receive semi-annually a fixed rate of 1.4025% and pay quarterly a floating rate based on 3-month LIBOR, expiring February 2030 | | 2/26/25 | 1,900,000 | 49,200 |
| Option on an interest rate swap with JPMorgan Chase Bank N.A. to receive semi-annually a fixed rate of 1.57125% and pay quarterly a floating rate based on 3-month LIBOR, expiring September 2029 | | 9/5/24 | 2,600,000 | 82,355 |
|
| TOTAL CALL OPTIONS | | | | 294,712 |
|
| TOTAL PURCHASED SWAPTIONS | | | | |
| (Cost $504,878) | | | | 425,966 |
| TOTAL INVESTMENT IN SECURITIES - 99.2% | | | | |
| (Cost $1,462,808,200) | | | | 1,545,808,908 |
| NET OTHER ASSETS (LIABILITIES) - 0.8% | | | | 12,590,770 |
| NET ASSETS - 100% | | | | $1,558,399,678 |
| Written Swaptions | | | |
| | Expiration Date | Notional Amount | Value |
| Put Swaptions | | | |
| Option on an interest rate swap with Goldman Sachs Bank U.S.A. to pay semi-annually a fixed rate of 1.27% and receive quarterly a floating rate based on 3-month LIBOR, expiring November 2030 | 11/25/25 | 3,700,000 | $(110,595) |
| Call Swaptions | | | |
| Option on an interest rate swap with Goldman Sachs Bank U.S.A. to receive semi-annually a fixed rate of 1.27% and pay quarterly a floating rate based on 3-month LIBOR, expiring November 2030 | 11/25/25 | 3,700,000 | (82,860) |
| TOTAL WRITTEN SWAPTIONS | | | $(193,455) |
| Futures Contracts | | | | | |
| | Number of contracts | Expiration Date | Notional Amount | Value | Unrealized Appreciation/(Depreciation) |
| Purchased | | | | | |
| Treasury Contracts | | | | | |
| CBOT 10-Year U.S. Treasury Note Contracts (United States) | 157 | March 2021 | $21,678,266 | $25,358 | $25,358 |
| CBOT 2-Year U.S. Treasury Note Contracts (United States) | 150 | March 2021 | 33,146,484 | 28,876 | 28,876 |
| CBOT 5-Year U.S. Treasury Note Contracts (United States) | 2 | March 2021 | 252,328 | 596 | 596 |
| CBOT Long Term U.S. Treasury Bond Contracts (United States) | 6 | March 2021 | 1,039,125 | (4,044) | (4,044) |
| TOTAL FUTURES CONTRACTS | | | | | $50,786 |
The notional amount of futures purchased as a percentage of Net Assets is 3.6%
| Forward Foreign Currency Contracts | | | | | | |
| Currency Purchased | Currency Sold | Counterparty | Settlement Date | Unrealized Appreciation/(Depreciation) |
| AUD | 246,000 | USD | 179,089 | BNP Paribas | 2/9/21 | $10,636 |
| AUD | 7,383,000 | USD | 5,351,959 | JPMorgan Chase Bank, N.A. | 2/9/21 | 342,088 |
| CAD | 1,272,000 | USD | 991,687 | Morgan Stanley | 2/9/21 | 7,740 |
| EUR | 125,000 | USD | 148,304 | BNP Paribas | 2/9/21 | 4,532 |
| EUR | 316,000 | USD | 384,281 | Brown Brothers Harriman & Co. | 2/9/21 | 2,087 |
| EUR | 1,269,000 | USD | 1,534,698 | Hsbc Bank Plc | 2/9/21 | 16,889 |
| EUR | 495,000 | USD | 601,478 | JPMorgan Chase Bank, N.A. | 2/9/21 | 3,751 |
| EUR | 6,240,000 | USD | 7,574,106 | JPMorgan Chase Bank, N.A. | 2/9/21 | 55,449 |
| EUR | 182,000 | USD | 223,282 | JPMorgan Chase Bank, N.A. | 2/9/21 | (753) |
| EUR | 1,143,000 | USD | 1,362,549 | Morgan Stanley | 2/9/21 | 34,980 |
| GBP | 2,426,000 | USD | 3,241,255 | BNP Paribas | 2/9/21 | 77,165 |
| GBP | 1,586,000 | USD | 2,102,960 | State Street Bank | 2/9/21 | 66,461 |
| USD | 9,877,234 | AUD | 13,830,000 | JPMorgan Chase Bank, N.A. | 2/9/21 | (788,981) |
| USD | 16,393,052 | CAD | 21,595,000 | CIBC World Markets | 2/9/21 | (574,412) |
| USD | 5,537,787 | EUR | 4,672,000 | BNP Paribas | 2/9/21 | (174,597) |
| USD | 185,886 | EUR | 157,000 | BNP Paribas | 2/9/21 | (6,076) |
| USD | 1,686,151 | EUR | 1,404,000 | BNP Paribas | 2/9/21 | (30,499) |
| USD | 3,557,217 | EUR | 2,931,000 | BNP Paribas | 2/9/21 | (26,473) |
| USD | 234,236 | EUR | 198,000 | CIBC World Markets | 2/9/21 | (7,856) |
| USD | 5,808,864 | EUR | 4,867,000 | Citibank NA | 2/9/21 | (141,944) |
| USD | 3,077,194 | EUR | 2,527,000 | Citibank NA | 2/9/21 | (12,531) |
| USD | 3,077,194 | EUR | 2,527,000 | Citibank NA | 2/9/21 | (12,531) |
| USD | 2,853,223 | EUR | 2,422,000 | Hsbc Bank Plc | 2/9/21 | (108,120) |
| USD | 437,586 | EUR | 368,000 | Hsbc Bank Plc | 2/9/21 | (12,362) |
| USD | 72,317,495 | EUR | 61,626,000 | Hsbc Bank Plc | 2/9/21 | (3,031,692) |
| USD | 303,604 | EUR | 255,000 | JPMorgan Chase Bank, N.A. | 2/9/21 | (8,181) |
| USD | 2,088,052 | EUR | 1,711,000 | National Australia Bank | 2/9/21 | (3,962) |
| USD | 1,197,872 | EUR | 1,012,000 | State Street Bank | 2/9/21 | (39,485) |
| USD | 8,988,859 | GBP | 6,924,000 | Barclays Bank PLC | 2/9/21 | (482,180) |
| USD | 3,280,962 | GBP | 2,483,000 | Brown Brothers Harriman & Co. | 2/9/21 | (115,426) |
| USD | 17,462,343 | JPY | 1,821,724,000 | Hsbc Bank Plc | 2/9/21 | (188,144) |
| TOTAL FORWARD FOREIGN CURRENCY CONTRACTS | | | | | | $(5,144,427) |
| | | | | | Unrealized Appreciation | 621,778 |
| | | | | | Unrealized Depreciation | (5,766,205) |
For the period, the average contract value for forward foreign currency contracts was $217,458,533. Contract value represents contract amount in United States dollars plus or minus unrealized appreciation or depreciation, respectively
Swaps
| Payment Received | Payment Frequency | Payment Paid | Payment Frequency | Clearinghouse / Counterparty(1) | Maturity Date | Notional Amount | Value | Upfront Premium Received/(Paid)(2) | Unrealized Appreciation/(Depreciation) |
| Interest Rate Swaps | | | | | | | | | |
| 0.25% | Semi - annual | 3-month LIBOR(3) | Quarterly | LCH | Mar. 2023 | $1,315,000 | $365 | $0 | $365 |
| 0.5% | Semi - annual | 3-month LIBOR(3) | Quarterly | LCH | Mar. 2026 | 46,000 | 115 | 0 | 115 |
| 3-month LIBOR(3) | Quarterly | 0.75% | Semi - annual | LCH | Mar. 2031 | 1,987,000 | 34,584 | 0 | 34,584 |
| 1% | Semi - annual | 3-month LIBOR(3) | Quarterly | LCH | Mar. 2051 | 34,000 | (2,960) | 0 | (2,960) |
|
| TOTAL INTEREST RATE SWAPS | | | | | | | $32,104 | $0 | $32,104 |
|
(1) Swaps with LCH Clearnet Group (LCH) are centrally cleared over-the-counter (OTC) swaps.
(2) Any premiums for centrally cleared over-the-counter (OTC) swaps are recorded periodically throughout the term of the swap to variation margin and included in unrealized appreciation (depreciation).
(3) Represents floating rate.
Currency Abbreviations
AUD – Australian dollar
BRL – Brazilian real
CAD – Canadian dollar
EGP – Egyptian pound
EUR – European Monetary Unit
GBP – British pound
IDR – Indonesian rupiah
JPY – Japanese yen
MXN – Mexican peso
PEN – Peruvian new sol
RUB – Russian ruble
UAH – Ukrainian hryvnia
Legend
(a) Amount is stated in United States dollars unless otherwise noted.
(b) Restricted securities (including private placements) - Investment in securities not registered under the Securities Act of 1933 (excluding 144A issues). At the end of the period, the value of restricted securities (excluding 144A issues) amounted to $4,157,459 or 0.3% of net assets.
(c) Level 3 security
(d) Security exempt from registration under Rule 144A of the Securities Act of 1933. These securities may be resold in transactions exempt from registration, normally to qualified institutional buyers. At the end of the period, the value of these securities amounted to $454,954,496 or 29.2% of net assets.
(e) Security or a portion of the security purchased on a delayed delivery or when-issued basis.
(f) Non-income producing - Security is in default.
(g) Coupon rates for floating and adjustable rate securities reflect the rates in effect at period end.
(h) Coupon is indexed to a floating interest rate which may be multiplied by a specified factor and/or subject to caps or floors.
(i) Security or a portion of the security was pledged to cover margin requirements for futures contracts. At period end, the value of securities pledged amounted to $317,286.
(j) Security or a portion of the security was pledged to cover margin requirements for centrally cleared OTC swaps. At period end, the value of securities pledged amounted to $129,443.
(k) Security initially issued at one coupon which converts to a higher coupon at a specified date. The rate shown is the rate at period end.
(l) Non-income producing
(m) Remaining maturities of bank loan obligations may be less than the stated maturities shown as a result of contractual or optional prepayments by the borrower. Such prepayments cannot be predicted with certainty.
(n) The coupon rate will be determined upon settlement of the loan after period end.
(o) Position represents an unfunded loan commitment. At period end, the total principal amount and market value of unfunded commitments totaled $171,429 and $171,429, respectively.
(p) Affiliated fund that is generally available only to investment companies and other accounts managed by Fidelity Investments. A complete unaudited schedule of portfolio holdings for each Fidelity Central Fund is filed with the SEC for the first and third quarters of each fiscal year on Form N-PORT and is available upon request or at the SEC's website at www.sec.gov. An unaudited holdings listing for the Fund, which presents direct holdings as well as the pro-rata share of securities and other investments held indirectly through its investment in underlying non-money market Fidelity Central Funds, is available at fidelity.com and/or institutional.fidelity.com, as applicable. In addition, each Fidelity Central Fund's financial statements, which are not covered by the Fund's Report of Independent Registered Public Accounting Firm, are available on the SEC's website or upon request.
(q) Security is perpetual in nature with no stated maturity date.
(r) Affiliated fund that is generally available only to investment companies and other accounts managed by Fidelity Investments. The rate quoted is the annualized seven-day yield of the fund at period end. A complete unaudited listing of the fund's holdings as of its most recent quarter end is available upon request. In addition, each Fidelity Central Fund's financial statements, which are not covered by the Fund's Report of Independent Registered Public Accounting Firm, are available on the SEC's website or upon request.
Additional information on each restricted holding is as follows:
| Security | Acquisition Date | Acquisition Cost |
| California Resources Corp. | 10/27/20 | $1,368,874 |
| Mesquite Energy, Inc. 15% 7/15/23 | 7/10/20 - 10/15/20 | $99,538 |
| Mesquite Energy, Inc. 15% 7/15/23 | 11/5/20 | $175,000 |
| New Cotai LLC/New Cotai Capital Corp. | 9/11/20 | $1,223,948 |
| Tricer Holdco SCA | 10/16/09 - 12/30/17 | $286,754 |
| Tricer Holdco SCA Class A1 | 10/16/09 - 10/29/09 | $45,666 |
| Tricer Holdco SCA Class A2 | 10/16/09 - 10/29/09 | $45,666 |
| Tricer Holdco SCA Class A3 | 10/16/09 - 10/29/09 | $45,666 |
| Tricer Holdco SCA Class A4 | 10/16/09 - 10/29/09 | $45,666 |
| Tricer Holdco SCA Class A5 | 10/16/09 - 10/29/09 | $45,666 |
| Tricer Holdco SCA Class A6 | 10/16/09 - 10/29/09 | $45,666 |
| Tricer Holdco SCA Class A7 | 10/16/09 - 10/29/09 | $45,666 |
| Tricer Holdco SCA Class A8 | 10/16/09 - 10/29/09 | $45,666 |
| Tricer Holdco SCA Class A9 | 10/16/09 - 10/29/09 | $45,706 |
Affiliated Central Funds
Information regarding fiscal year to date income earned by the Fund from investments in Fidelity Central Funds is as follows:
| Fund | Income earned |
| Fidelity Cash Central Fund | $547,584 |
| Fidelity Floating Rate Central Fund | 6,925,069 |
| Fidelity Mortgage Backed Securities Central Fund | 256,813 |
| Fidelity Securities Lending Cash Central Fund | 532 |
| Total | $7,729,998 |
Amounts in the income column in the above table include any capital gain distributions from underlying funds, which are presented in the corresponding line-item in the Statement of Operations, if applicable. Amount for Fidelity Securities Lending Cash Central Fund represents the income earned on investing cash collateral, less rebates paid to borrowers and any lending agent fees associated with the loan, plus any premium payments received for lending certain types of securities.
The value, beginning of period, for the Fidelity Cash Central Fund was $131,470,128. Net realized gain (loss) and change in net unrealized appreciation (depreciation) on Fidelity Cash Central Fund was $1,662 and $0, respectively, during the period. Purchases and sales of the Fidelity Cash Central Fund were $701,536,515 and $741,095,748, respectively, during the period.
Fiscal year to date information regarding the Fund’s investments in non-Money Market Central Funds, including the ownership percentage, is presented below.
| Fund | Value, beginning of period | Purchases(a) | Sales Proceeds | Realized Gain/Loss | Change in Unrealized appreciation (depreciation) | Value, end of period | % ownership, end of period |
| Fidelity Floating Rate Central Fund | $137,478,893 | $19,246,463 | $22,008,820 | $(891,072) | $(1,556,138) | $132,269,326 | 7.1% |
| Fidelity Mortgage Backed Securities Central Fund | -- | 35,565,727 | 35,324,952 | (233,205) | 3 | 7,573 | 0.0% |
| Total | $137,478,893 | $54,812,190 | $57,333,772 | $(1,124,277) | $(1,556,135) | $132,276,899 | |
(a) Includes the value of shares purchased or redeemed through in-kind transactions, if applicable.
Investment Valuation
The following is a summary of the inputs used, as of December 31, 2020, involving the Fund's assets and liabilities carried at fair value. The inputs or methodology used for valuing securities may not be an indication of the risk associated with investing in those securities. For more information on valuation inputs, and their aggregation into the levels used below, please refer to the Investment Valuation section in the accompanying Notes to Financial Statements.
| | Valuation Inputs at Reporting Date: |
| Description | Total | Level 1 | Level 2 | Level 3 |
| Investments in Securities: | | | | |
| Equities: | | | | |
| Communication Services | $13,708,934 | $12,686,769 | $73,397 | $948,768 |
| Consumer Discretionary | 19,083,957 | 18,498,478 | -- | 585,479 |
| Consumer Staples | 5,043,618 | 4,351,822 | -- | 691,796 |
| Energy | 15,781,188 | 14,242,015 | -- | 1,539,173 |
| Financials | 2,788,747 | 2,685,164 | -- | 103,583 |
| Health Care | 9,876,100 | 9,812,922 | -- | 63,178 |
| Industrials | 6,391,111 | 6,355,942 | 182 | 34,987 |
| Information Technology | 30,516,295 | 30,516,295 | -- | -- |
| Materials | 6,981,215 | 6,981,215 | -- | -- |
| Utilities | 3,030,789 | 3,030,789 | -- | -- |
| Corporate Bonds | 596,354,340 | -- | 595,968,968 | 385,372 |
| U.S. Government and Government Agency Obligations | 270,188,172 | -- | 270,188,172 | -- |
| Foreign Government and Government Agency Obligations | 242,870,344 | -- | 242,870,344 | -- |
| Bank Loan Obligations | 22,806,656 | -- | 22,107,519 | 699,137 |
| Fixed-Income Funds | 132,276,899 | 132,276,899 | -- | -- |
| Preferred Securities | 75,772,020 | -- | 75,772,020 | -- |
| Money Market Funds | 91,912,557 | 91,912,557 | -- | -- |
| Purchased Swaptions | 425,966 | -- | 425,966 | -- |
| Total Investments in Securities: | $1,545,808,908 | $333,350,867 | $1,207,406,568 | $5,051,473 |
| Derivative Instruments: | | | | |
| Assets | | | | |
| Futures Contracts | $54,830 | $54,830 | $-- | $-- |
| Forward Foreign Currency Contracts | 621,778 | -- | 621,778 | -- |
| Swaps | 35,064 | -- | 35,064 | -- |
| Total Assets | $711,672 | $54,830 | $656,842 | $-- |
| Liabilities | | | | |
| Futures Contracts | $(4,044) | $(4,044) | $-- | $-- |
| Forward Foreign Currency Contracts | (5,766,205) | -- | (5,766,205) | -- |
| Swaps | (2,960) | -- | (2,960) | -- |
| Written Swaptions | (193,455) | -- | (193,455) | -- |
| Total Liabilities | $(5,966,664) | $(4,044) | $(5,962,620) | $-- |
| Total Derivative Instruments: | $(5,254,992) | $50,786 | $(5,305,778) | $-- |
Value of Derivative Instruments
The following table is a summary of the Fund's value of derivative instruments by primary risk exposure as of December 31, 2020. For additional information on derivative instruments, please refer to the Derivative Instruments section in the accompanying Notes to Financial Statements.
| Primary Risk Exposure / Derivative Type | Value |
| | Asset | Liability |
| Foreign Exchange Risk | | |
| Forward Foreign Currency Contracts(a) | $621,778 | $(5,766,205) |
| Total Foreign Exchange Risk | 621,778 | (5,766,205) |
| Interest Rate Risk | | |
| Futures Contracts(b) | 54,830 | (4,044) |
| Purchased Swaptions(c) | 425,966 | 0 |
| Swaps(d) | 35,064 | (2,960) |
| Written Swaptions(e) | 0 | (193,455) |
| Total Interest Rate Risk | 515,860 | (200,459) |
| Total Value of Derivatives | $1,137,638 | $(5,966,664) |
(a) Gross value is presented in the Statement of Assets and Liabilities in the unrealized appreciation/depreciation on forward foreign currency contracts line-items.
(b) Reflects gross cumulative appreciation (depreciation) on futures contracts as presented in the Schedule of Investments. In the Statement of Assets and Liabilities, the period end daily variation margin is included in receivable or payable for daily variation margin on futures contracts, and the net cumulative appreciation (depreciation) is included in Total accumulated earnings (loss).
(c) Gross value is included in the Statement of Assets and Liabilities in the investments, at value line-item.
(d) For centrally cleared over-the-counter (OTC) swaps, reflects gross cumulative appreciation (depreciation) as presented in the Schedule of Investments. In the Statement of Assets and Liabilities, the period end daily variation margin for centrally cleared OTC swaps is included in receivable or payable for daily variation margin on centrally cleared OTC swaps, and the net cumulative appreciation (depreciation) for centrally cleared OTC swaps is included in Total accumulated earnings (loss).
(e) Gross value is presented in the Statement of Assets and Liabilities in the written options, at value line-item.
Other Information
Distribution of investments by country or territory of incorporation, as a percentage of Total Net Assets, is as follows (Unaudited):
| United States of America | 71.4% |
| Germany | 4.4% |
| Canada | 2.4% |
| Luxembourg | 2.3% |
| Netherlands | 1.7% |
| Mexico | 1.7% |
| Japan | 1.2% |
| United Kingdom | 1.1% |
| Cayman Islands | 1.1% |
| Turkey | 1.1% |
| Others (Individually Less Than 1%) | 11.6% |
| | 100.0% |
The information in the above tables is based on the combined investments of the fund and its pro-rata share of the investments of Fidelity's Fixed-Income Central Funds
See accompanying notes which are an integral part of the financial statements.
Financial Statements
Statement of Assets and Liabilities
| | | December 31, 2020 |
| Assets | | |
Investment in securities, at value — See accompanying schedule:
Unaffiliated issuers (cost $1,233,962,359) | $1,321,619,452 | |
| Fidelity Central Funds (cost $228,845,841) | 224,189,456 | |
| Total Investment in Securities (cost $1,462,808,200) | | $1,545,808,908 |
| Cash | | 8,303,467 |
| Foreign currency held at value (cost $130,104) | | 136,316 |
| Receivable for investments sold | | 1,845,583 |
| Receivable for premium on written options | | 184,815 |
| Unrealized appreciation on forward foreign currency contracts | | 621,778 |
| Receivable for fund shares sold | | 397,584 |
| Dividends receivable | | 24,492 |
| Interest receivable | | 12,558,796 |
| Distributions receivable from Fidelity Central Funds | | 7,436 |
| Receivable for daily variation margin on futures contracts | | 18,800 |
| Receivable for daily variation margin on centrally cleared OTC swaps | | 2,022 |
| Prepaid expenses | | 1,582 |
| Other receivables | | 641 |
| Total assets | | 1,569,912,220 |
| Liabilities | | |
| Payable for investments purchased | | |
| Regular delivery | $3,739,120 | |
| Delayed delivery | 325,000 | |
| Unrealized depreciation on forward foreign currency contracts | 5,766,205 | |
| Payable for fund shares redeemed | 393,223 | |
| Accrued management fee | 706,157 | |
| Distribution and service plan fees payable | 109,982 | |
| Written options, at value (premium receivable $184,815) | 193,455 | |
| Other affiliated payables | 157,435 | |
| Other payables and accrued expenses | 121,965 | |
| Total liabilities | | 11,512,542 |
| Net Assets | | $1,558,399,678 |
| Net Assets consist of: | | |
| Paid in capital | | $1,474,866,811 |
| Total accumulated earnings (loss) | | 83,532,867 |
| Net Assets | | $1,558,399,678 |
| Net Asset Value and Maximum Offering Price | | |
| Initial Class: | | |
| Net Asset Value, offering price and redemption price per share ($79,319,738 ÷ 6,714,311 shares) | | $11.81 |
| Service Class: | | |
| Net Asset Value, offering price and redemption price per share ($426,327 ÷ 36,108 shares) | | $11.81 |
| Service Class 2: | | |
| Net Asset Value, offering price and redemption price per share ($534,028,533 ÷ 45,699,787 shares) | | $11.69 |
| Investor Class: | | |
| Net Asset Value, offering price and redemption price per share ($944,625,080 ÷ 80,261,010 shares) | | $11.77 |
See accompanying notes which are an integral part of the financial statements.
Statement of Operations
| | | Year ended December 31, 2020 |
| Investment Income | | |
| Dividends | | $4,554,364 |
| Interest | | 47,285,048 |
| Income from Fidelity Central Funds (including $532 from security lending) | | 7,514,843 |
| Total income | | 59,354,255 |
| Expenses | | |
| Management fee | $8,209,944 | |
| Transfer agent fees | 1,325,232 | |
| Distribution and service plan fees | 1,247,535 | |
| Accounting fees | 506,011 | |
| Custodian fees and expenses | 55,881 | |
| Independent trustees' fees and expenses | 4,868 | |
| Registration fees | 15 | |
| Audit | 117,171 | |
| Legal | 5,808 | |
| Miscellaneous | 14,198 | |
| Total expenses before reductions | 11,486,663 | |
| Expense reductions | (25,849) | |
| Total expenses after reductions | | 11,460,814 |
| Net investment income (loss) | | 47,893,441 |
| Realized and Unrealized Gain (Loss) | | |
| Net realized gain (loss) on: | | |
| Investment securities: | | |
| Unaffiliated issuers | 17,229,997 | |
| Affiliated in-kind | 823,366 | |
| Fidelity Central Funds | (1,122,615) | |
| Forward foreign currency contracts | (4,240,713) | |
| Foreign currency transactions | 213,948 | |
| Futures contracts | 3,037,356 | |
| Swaps | (752,094) | |
| Written options | (122,256) | |
| Capital gain distributions from Fidelity Central Funds | 215,155 | |
| Total net realized gain (loss) | | 15,282,144 |
| Change in net unrealized appreciation (depreciation) on: | | |
| Investment securities: | | |
| Unaffiliated issuers | 43,289,222 | |
| Fidelity Central Funds | (1,556,136) | |
| Forward foreign currency contracts | (4,202,906) | |
| Assets and liabilities in foreign currencies | 1,094 | |
| Futures contracts | 398,229 | |
| Swaps | (90,784) | |
| Written options | (10,704) | |
| Delayed delivery commitments | 27,348 | |
| Total change in net unrealized appreciation (depreciation) | | 37,855,363 |
| Net gain (loss) | | 53,137,507 |
| Net increase (decrease) in net assets resulting from operations | | $101,030,948 |
See accompanying notes which are an integral part of the financial statements.
Statement of Changes in Net Assets
| | Year ended December 31, 2020 | Year ended December 31, 2019 |
| Increase (Decrease) in Net Assets | | |
| Operations | | |
| Net investment income (loss) | $47,893,441 | $53,140,468 |
| Net realized gain (loss) | 15,282,144 | 13,109,968 |
| Change in net unrealized appreciation (depreciation) | 37,855,363 | 84,091,127 |
| Net increase (decrease) in net assets resulting from operations | 101,030,948 | 150,341,563 |
| Distributions to shareholders | (61,920,679) | (60,335,625) |
| Share transactions - net increase (decrease) | (39,226,740) | 78,995,652 |
| Total increase (decrease) in net assets | (116,471) | 169,001,590 |
| Net Assets | | |
| Beginning of period | 1,558,516,149 | 1,389,514,559 |
| End of period | $1,558,399,678 | $1,558,516,149 |
See accompanying notes which are an integral part of the financial statements.
Financial Highlights
VIP Strategic Income Portfolio Initial Class
| Years ended December 31, | 2020 | 2019 | 2018 | 2017 | 2016 |
| Selected Per–Share Data | | | | | |
| Net asset value, beginning of period | $11.45 | $10.75 | $11.50 | $11.07 | $10.60 |
| Income from Investment Operations | | | | | |
| Net investment income (loss)A | .380 | .421 | .418B | .399 | .429 |
| Net realized and unrealized gain (loss) | .477 | .749 | (.716)B | .462 | .446 |
| Total from investment operations | .857 | 1.170 | (.298) | .861 | .875 |
| Distributions from net investment income | (.385) | (.385) | (.444) | (.371) | (.405) |
| Distributions from net realized gain | (.112) | (.085) | (.008) | (.060) | – |
| Total distributions | (.497) | (.470) | (.452) | (.431) | (.405) |
| Net asset value, end of period | $11.81 | $11.45 | $10.75 | $11.50 | $11.07 |
| Total ReturnC,D | 7.52% | 10.89% | (2.57)% | 7.79% | 8.27% |
| Ratios to Average Net AssetsE,F | | | | | |
| Expenses before reductions | .67% | .67% | .66% | .67% | .68% |
| Expenses net of fee waivers, if any | .67% | .67% | .66% | .67% | .68% |
| Expenses net of all reductions | .66% | .66% | .66% | .67% | .68% |
| Net investment income (loss) | 3.32% | 3.67% | 3.66% | 3.45% | 3.84% |
| Supplemental Data | | | | | |
| Net assets, end of period (000 omitted) | $79,320 | $83,769 | $82,529 | $96,952 | $91,630 |
| Portfolio turnover rateG | 116% | 144% | 118% | 124% | 81% |
A Calculated based on average shares outstanding during the period.
B The amounts shown reflect certain reclassifications related to book to tax differences that were made in the year shown.
C Total returns do not reflect charges attributable to your insurance company's separate account. Inclusion of these charges would reduce the total returns shown.
D Total returns would have been lower if certain expenses had not been reduced during the applicable periods shown.
E Fees and expenses of any underlying mutual funds or exchange-traded funds (ETFs) are not included in the Fund's expense ratio. The Fund indirectly bears its proportionate share of these expenses. For additional expense information related to investments in Fidelity Central Funds, please refer to the "Investments in Fidelity Central Funds" note found in the Notes to Financial Statements section of the most recent Annual or Semi-Annual report.
F Expense ratios reflect operating expenses of the class. Expenses before reductions do not reflect amounts reimbursed, waived, or reduced through arrangements with the investment adviser, brokerage services, or other offset arrangements, if applicable, and do not represent the amount paid by the class during periods when reimbursements, waivers or reductions occur.
G Amount does not include the portfolio activity of any underlying mutual funds or exchange-traded funds (ETFs).
See accompanying notes which are an integral part of the financial statements.
VIP Strategic Income Portfolio Service Class
| Years ended December 31, | 2020 | 2019 | 2018 | 2017 | 2016 |
| Selected Per–Share Data | | | | | |
| Net asset value, beginning of period | $11.42 | $10.72 | $11.47 | $11.05 | $10.59 |
| Income from Investment Operations | | | | | |
| Net investment income (loss)A | .371 | .409 | .406B | .389 | .417 |
| Net realized and unrealized gain (loss) | .489 | .750 | (.715)B | .461 | .444 |
| Total from investment operations | .860 | 1.159 | (.309) | .850 | .861 |
| Distributions from net investment income | (.358) | (.374) | (.433) | (.370) | (.401) |
| Distributions from net realized gain | (.112) | (.085) | (.008) | (.060) | – |
| Total distributions | (.470) | (.459) | (.441) | (.430) | (.401) |
| Net asset value, end of period | $11.81 | $11.42 | $10.72 | $11.47 | $11.05 |
| Total ReturnC,D | 7.56% | 10.82% | (2.68)% | 7.71% | 8.14% |
| Ratios to Average Net AssetsE,F | | | | | |
| Expenses before reductions | .77% | .77% | .76% | .77% | .78% |
| Expenses net of fee waivers, if any | .77% | .77% | .76% | .77% | .78% |
| Expenses net of all reductions | .77% | .76% | .76% | .77% | .78% |
| Net investment income (loss) | 3.21% | 3.57% | 3.56% | 3.35% | 3.75% |
| Supplemental Data | | | | | |
| Net assets, end of period (000 omitted) | $426 | $1,945 | $1,745 | $1,899 | $526 |
| Portfolio turnover rateG | 116% | 144% | 118% | 124% | 81% |
A Calculated based on average shares outstanding during the period.
B The amounts shown reflect certain reclassifications related to book to tax differences that were made in the year shown.
C Total returns do not reflect charges attributable to your insurance company's separate account. Inclusion of these charges would reduce the total returns shown.
D Total returns would have been lower if certain expenses had not been reduced during the applicable periods shown.
E Fees and expenses of any underlying mutual funds or exchange-traded funds (ETFs) are not included in the Fund's expense ratio. The Fund indirectly bears its proportionate share of these expenses. For additional expense information related to investments in Fidelity Central Funds, please refer to the "Investments in Fidelity Central Funds" note found in the Notes to Financial Statements section of the most recent Annual or Semi-Annual report.
F Expense ratios reflect operating expenses of the class. Expenses before reductions do not reflect amounts reimbursed, waived, or reduced through arrangements with the investment adviser, brokerage services, or other offset arrangements, if applicable, and do not represent the amount paid by the class during periods when reimbursements, waivers or reductions occur.
G Amount does not include the portfolio activity of any underlying mutual funds or exchange-traded funds (ETFs).
See accompanying notes which are an integral part of the financial statements.
VIP Strategic Income Portfolio Service Class 2
| Years ended December 31, | 2020 | 2019 | 2018 | 2017 | 2016 |
| Selected Per–Share Data | | | | | |
| Net asset value, beginning of period | $11.34 | $10.65 | $11.40 | $10.98 | $10.52 |
| Income from Investment Operations | | | | | |
| Net investment income (loss)A | .348 | .389 | .385B | .368 | .398 |
| Net realized and unrealized gain (loss) | .471 | .745 | (.709)B | .459 | .444 |
| Total from investment operations | .819 | 1.134 | (.324) | .827 | .842 |
| Distributions from net investment income | (.357) | (.359) | (.418) | (.347) | (.382) |
| Distributions from net realized gain | (.112) | (.085) | (.008) | (.060) | – |
| Total distributions | (.469) | (.444) | (.426) | (.407) | (.382) |
| Net asset value, end of period | $11.69 | $11.34 | $10.65 | $11.40 | $10.98 |
| Total ReturnC,D | 7.25% | 10.66% | (2.82)% | 7.54% | 8.02% |
| Ratios to Average Net AssetsE,F | | | | | |
| Expenses before reductions | .92% | .92% | .91% | .92% | .93% |
| Expenses net of fee waivers, if any | .92% | .92% | .91% | .92% | .93% |
| Expenses net of all reductions | .91% | .91% | .91% | .92% | .93% |
| Net investment income (loss) | 3.07% | 3.42% | 3.41% | 3.20% | 3.59% |
| Supplemental Data | | | | | |
| Net assets, end of period (000 omitted) | $534,029 | $502,859 | $397,785 | $374,227 | $260,789 |
| Portfolio turnover rateG | 116% | 144% | 118% | 124% | 81% |
A Calculated based on average shares outstanding during the period.
B The amounts shown reflect certain reclassifications related to book to tax differences that were made in the year shown.
C Total returns do not reflect charges attributable to your insurance company's separate account. Inclusion of these charges would reduce the total returns shown.
D Total returns would have been lower if certain expenses had not been reduced during the applicable periods shown.
E Fees and expenses of any underlying mutual funds or exchange-traded funds (ETFs) are not included in the Fund's expense ratio. The Fund indirectly bears its proportionate share of these expenses. For additional expense information related to investments in Fidelity Central Funds, please refer to the "Investments in Fidelity Central Funds" note found in the Notes to Financial Statements section of the most recent Annual or Semi-Annual report.
F Expense ratios reflect operating expenses of the class. Expenses before reductions do not reflect amounts reimbursed, waived, or reduced through arrangements with the investment adviser, brokerage services, or other offset arrangements, if applicable, and do not represent the amount paid by the class during periods when reimbursements, waivers or reductions occur.
G Amount does not include the portfolio activity of any underlying mutual funds or exchange-traded funds (ETFs).
See accompanying notes which are an integral part of the financial statements.
VIP Strategic Income Portfolio Investor Class
| Years ended December 31, | 2020 | 2019 | 2018 | 2017 | 2016 |
| Selected Per–Share Data | | | | | |
| Net asset value, beginning of period | $11.41 | $10.71 | $11.46 | $11.03 | $10.57 |
| Income from Investment Operations | | | | | |
| Net investment income (loss)A | .375 | .416 | .413B | .394 | .424 |
| Net realized and unrealized gain (loss) | .478 | .750 | (.715)B | .463 | .438 |
| Total from investment operations | .853 | 1.166 | (.302) | .857 | .862 |
| Distributions from net investment income | (.381) | (.381) | (.440) | (.367) | (.402) |
| Distributions from net realized gain | (.112) | (.085) | (.008) | (.060) | – |
| Total distributions | (.493) | (.466) | (.448) | (.427) | (.402) |
| Net asset value, end of period | $11.77 | $11.41 | $10.71 | $11.46 | $11.03 |
| Total ReturnC,D | 7.51% | 10.89% | (2.62)% | 7.78% | 8.17% |
| Ratios to Average Net AssetsE,F | | | | | |
| Expenses before reductions | .70% | .70% | .70% | .71% | .72% |
| Expenses net of fee waivers, if any | .70% | .70% | .70% | .71% | .72% |
| Expenses net of all reductions | .70% | .70% | .70% | .71% | .72% |
| Net investment income (loss) | 3.28% | 3.63% | 3.63% | 3.41% | 3.81% |
| Supplemental Data | | | | | |
| Net assets, end of period (000 omitted) | $944,625 | $969,943 | $907,456 | $1,072,701 | $945,087 |
| Portfolio turnover rateG | 116% | 144% | 118% | 124% | 81% |
A Calculated based on average shares outstanding during the period.
B The amounts shown reflect certain reclassifications related to book to tax differences that were made in the year shown.
C Total returns do not reflect charges attributable to your insurance company's separate account. Inclusion of these charges would reduce the total returns shown.
D Total returns would have been lower if certain expenses had not been reduced during the applicable periods shown.
E Fees and expenses of any underlying mutual funds or exchange-traded funds (ETFs) are not included in the Fund's expense ratio. The Fund indirectly bears its proportionate share of these expenses. For additional expense information related to investments in Fidelity Central Funds, please refer to the "Investments in Fidelity Central Funds" note found in the Notes to Financial Statements section of the most recent Annual or Semi-Annual report.
F Expense ratios reflect operating expenses of the class. Expenses before reductions do not reflect amounts reimbursed, waived, or reduced through arrangements with the investment adviser, brokerage services, or other offset arrangements, if applicable, and do not represent the amount paid by the class during periods when reimbursements, waivers or reductions occur.
G Amount does not include the portfolio activity of any underlying mutual funds or exchange-traded funds (ETFs).
See accompanying notes which are an integral part of the financial statements.
Notes to Financial Statements
For the period ended December 31, 2020
1. Organization.
VIP Strategic Income Portfolio (the Fund) is a fund of Variable Insurance Products Fund V (the Trust) and is authorized to issue an unlimited number of shares. The Trust is registered under the Investment Company Act of 1940, as amended (the 1940 Act), as an open-end management investment company organized as a Massachusetts business trust. Shares of the Fund may only be purchased by insurance companies for the purpose of funding variable annuity or variable life insurance contracts. The Fund offers the following classes of shares: Initial Class shares, Service Class shares, Service Class 2 shares and Investor Class shares. All classes have equal rights and voting privileges, except for matters affecting a single class.
Effective January 1, 2020:
Investment advisers Fidelity Investments Money Management, Inc., FMR Co., Inc., and Fidelity SelectCo, LLC, merged with and into Fidelity Management & Research Company. In connection with the merger transactions, the resulting, merged investment adviser was then redomiciled from Massachusetts to Delaware, changed its corporate structure from a corporation to a limited liability company, and changed its name to "Fidelity Management & Research Company LLC".
Broker-dealer Fidelity Distributors Corporation merged with and into Fidelity Investments Institutional Services Company, Inc. ("FIISC"). FIISC was then redomiciled from Massachusetts to Delaware, changed its corporate structure from a corporation to a limited liability company, and changed its name to "Fidelity Distributors Company LLC".
Fidelity Investments Institutional Operations Company, Inc. converted from a Massachusetts corporation to a Massachusetts LLC, and changed its name to "Fidelity Investments Institutional Operations Company LLC".
2. Investments in Fidelity Central Funds.
The Fund invests in Fidelity Central Funds, which are open-end investment companies generally available only to other investment companies and accounts managed by the investment adviser and its affiliates. The Fund's Schedule of Investments lists each of the Fidelity Central Funds held as of period end, if any, as an investment of the Fund, but does not include the underlying holdings of each Fidelity Central Fund. As an Investing Fund, the Fund indirectly bears its proportionate share of the expenses of the underlying Fidelity Central Funds.
Based on its investment objective, each Fidelity Central Fund may invest or participate in various investment vehicles or strategies that are similar to those of the Fund. These strategies are consistent with the investment objectives of the Fund and may involve certain economic risks which may cause a decline in value of each of the Fidelity Central Funds and thus a decline in the value of the Fund. The Money Market Central Funds seek preservation of capital and current income and are managed by the investment adviser. Annualized expenses of the Money Market Central Funds as of their most recent shareholder report date ranged from less than .005% to .01%. The following summarizes the Fund's investment in each non-money market Fidelity Central Fund.
| Fidelity Central Fund | Investment Manager | Investment Objective | Investment Practices | Expense Ratio(a) |
| Fidelity Floating Rate Central Fund | FMR | Seeks a high level of income by normally investing in floating rate loans and other floating rate securities. | Foreign Securities
Loans & Direct Debt Instruments
Restricted Securities | Less than .005% |
| Fidelity Mortgage Backed Securities Central Fund | FMR | Seeks a high level of income by normally investing in investment-grade mortgage-related securities and repurchase agreements for those securities. | Delayed Delivery & When Issued Securities
Futures
Options
Restricted Securities
Swaps | .01% |
(a) Expenses expressed as a percentage of average net assets and are as of each underlying Central Fund's most recent annual or semi-annual shareholder report.
An unaudited holdings listing for the Fund, which presents direct holdings as well as the pro-rata share of any securities and other investments held indirectly through its investment in underlying non-money market Fidelity Central Funds, is available at institutional.fidelity.com. A complete unaudited list of holdings for each Fidelity Central Fund is available upon request or at the Securities and Exchange Commission (the SEC) website at www.sec.gov. In addition, the financial statements of the Fidelity Central Funds which contain the significant accounting policies (including investment valuation policies) of those funds, which are not covered by the Fund's Report of Independent Registered Public Accounting Firm, are available on the SEC website or upon request.
3. Significant Accounting Policies.
The Fund is an investment company and applies the accounting and reporting guidance of the Financial Accounting Standards Board (FASB) Accounting Standards Codification Topic 946 Financial Services - Investment Companies. The financial statements have been prepared in conformity with accounting principles generally accepted in the United States of America (GAAP), which require management to make certain estimates and assumptions at the date of the financial statements. Actual results could differ from those estimates. Subsequent events, if any, through the date that the financial statements were issued have been evaluated in the preparation of the financial statements. The following summarizes the significant accounting policies of the Fund:
Investment Valuation. Investments are valued as of 4:00 p.m. Eastern time on the last calendar day of the period. The Board of Trustees (the Board) has delegated the day to day responsibility for the valuation of the Fund's investments to the Fair Value Committee (the Committee) established by the Fund's investment adviser. In accordance with valuation policies and procedures approved by the Board, the Fund attempts to obtain prices from one or more third party pricing vendors or brokers to value its investments. When current market prices, quotations or currency exchange rates are not readily available or reliable, investments will be fair valued in good faith by the Committee, in accordance with procedures adopted by the Board. Factors used in determining fair value vary by investment type and may include market or investment specific events, changes in interest rates and credit quality. The frequency with which these procedures are used cannot be predicted and they may be utilized to a significant extent. The Committee oversees the Fund's valuation policies and procedures and reports to the Board on the Committee's activities and fair value determinations. The Board monitors the appropriateness of the procedures used in valuing the Fund's investments and ratifies the fair value determinations of the Committee.
The Fund categorizes the inputs to valuation techniques used to value its investments into a disclosure hierarchy consisting of three levels as shown below:
- Level 1 – quoted prices in active markets for identical investments
- Level 2 – other significant observable inputs (including quoted prices for similar investments, interest rates, prepayment speeds, etc.)
- Level 3 – unobservable inputs (including the Fund's own assumptions based on the best information available)
Valuation techniques used to value the Fund's investments by major category are as follows:
Debt securities, including restricted securities, are valued based on evaluated prices received from third party pricing vendors or from brokers who make markets in such securities. Corporate bonds, bank loan obligations, foreign government and government agency obligations, preferred securities and U.S. government and government agency obligations are valued by pricing vendors who utilize matrix pricing which considers yield or price of bonds of comparable quality, coupon, maturity and type or by broker-supplied prices. Swaps are marked-to-market daily based on valuations from third party pricing vendors, registered derivatives clearing organizations (clearinghouses) or broker-supplied valuations. These pricing sources may utilize inputs such as interest rate curves, credit spread curves, default possibilities and recovery rates. When independent prices are unavailable or unreliable, debt securities and swaps may be valued utilizing pricing methodologies which consider similar factors that would be used by third party pricing vendors. For foreign debt securities, when significant market or security specific events arise, valuations may be determined in good faith in accordance with procedures adopted by the Board. Debt securities and swaps are generally categorized as Level 2 in the hierarchy but may be Level 3 depending on the circumstances. The Fund invests a significant portion of its assets in below investment grade securities. The value of these securities can be more volatile due to changes in the credit quality of the issuer and is sensitive to changes in economic, market and regulatory conditions.
Equity securities, including restricted securities, for which market quotations are readily available, are valued at the last reported sale price or official closing price as reported by a third party pricing vendor on the primary market or exchange on which they are traded and are categorized as Level 1 in the hierarchy. In the event there were no sales during the day or closing prices are not available, securities are valued at the last quoted bid price or may be valued using the last available price and are generally categorized as Level 2 in the hierarchy. For foreign equity securities, when market or security specific events arise, comparisons to the valuation of American Depositary Receipts (ADRs), futures contracts, Exchange-Traded Funds (ETFs) and certain indexes as well as quoted prices for similar securities may be used and would be categorized as Level 2 in the hierarchy. For equity securities, including restricted securities, where observable inputs are limited, assumptions about market activity and risk are used and these securities may be categorized as Level 3 in the hierarchy.
The U.S. dollar value of foreign currency contracts is determined using currency exchange rates supplied by a pricing service and are categorized as Level 2 in the hierarchy. Futures contracts are valued at the settlement price established each day by the board of trade or exchange on which they are traded and are categorized as Level 1 in the hierarchy. Options traded over-the-counter are valued using vendor or broker-supplied valuations and are categorized as Level 2 in the hierarchy. Investments in open-end mutual funds, including the Fidelity Central Funds, are valued at their closing net asset value (NAV) each business day and are categorized as Level 1 in the hierarchy.
Changes in valuation techniques may result in transfers in or out of an assigned level within the disclosure hierarchy. The aggregate value of investments by input level as of December 31, 2020 is included at the end of the Fund's Schedule of Investments.
Foreign Currency. Foreign-denominated assets, including investment securities, and liabilities are translated into U.S. dollars at the exchange rates at period end. Purchases and sales of investment securities, income and dividends received, and expenses denominated in foreign currencies are translated into U.S. dollars at the exchange rate in effect on the transaction date.
The effects of exchange rate fluctuations on investments are included with the net realized and unrealized gain (loss) on investment securities. Other foreign currency transactions resulting in realized and unrealized gain (loss) are disclosed separately.
Realized gains and losses on foreign currency transactions arise from the disposition of foreign currency, realized changes in the value of foreign currency between the trade and settlement dates on security transactions, and the difference between the amounts of dividends, interest and foreign withholding taxes recorded on transaction date and the U.S. dollar equivalent of the amounts actually received or paid. Unrealized gains and losses on assets and liabilities in foreign currencies arise from changes in the value of foreign currency, and from assets and liabilities denominated in foreign currencies, other than investments, which are held at period end.
Investment Transactions and Income. For financial reporting purposes, the Fund's investment holdings and NAV include trades executed through the end of the last business day of the period. The NAV per share for processing shareholder transactions is calculated as of the close of business of the New York Stock Exchange (NYSE), normally 4:00 p.m. Eastern time and includes trades executed through the end of the prior business day. Gains and losses on securities sold are determined on the basis of identified cost and include proceeds received from litigation. Dividend income is recorded on the ex-dividend date, except for certain dividends from foreign securities where the ex-dividend date may have passed, which are recorded as soon as the Fund is informed of the ex-dividend date. Non-cash dividends included in dividend income, if any, are recorded at the fair market value of the securities received. Income and capital gain distributions from Fidelity Central Funds, if any, are recorded on the ex-dividend date. Certain distributions received by the Fund represent a return of capital or capital gain. The Fund determines the components of these distributions subsequent to the ex-dividend date, based upon receipt of tax filings or other correspondence relating to the underlying investment. These distributions are recorded as a reduction of cost of investments and/or as a realized gain. Interest income is accrued as earned and includes coupon interest and amortization of premium and accretion of discount on debt securities as applicable. Paid in Kind (PIK) income is recorded at the fair market value of the securities received. Investment income is recorded net of foreign taxes withheld where recovery of such taxes is uncertain. Debt obligations may be placed on non-accrual status and related interest income may be reduced by ceasing current accruals and writing off interest receivables when the collection of all or a portion of interest has become doubtful based on consistently applied procedures. A debt obligation is removed from non-accrual status when the issuer resumes interest payments or when collectability of interest is reasonably assured.
Class Allocations and Expenses. Investment income, realized and unrealized capital gains and losses, common expenses of the Fund, and certain fund-level expense reductions, if any, are allocated daily on a pro-rata basis to each class based on the relative net assets of each class to the total net assets of the Fund. Each class differs with respect to transfer agent and distribution and service plan fees incurred. Certain expense reductions may also differ by class. For the reporting period, the allocated portion of income and expenses to each class as a percent of its average net assets may vary due to the timing of recording these transactions in relation to fluctuating net assets of the classes. Expenses directly attributable to a fund are charged to that fund. Expenses attributable to more than one fund are allocated among the respective funds on the basis of relative net assets or other appropriate methods. Expense estimates are accrued in the period to which they relate and adjustments are made when actual amounts are known.
Income Tax Information and Distributions to Shareholders. Each year, the Fund intends to qualify as a regulated investment company under Subchapter M of the Internal Revenue Code, including distributing substantially all of its taxable income and realized gains. As a result, no provision for U.S. Federal income taxes is required. As of December 31, 2020, the Fund did not have any unrecognized tax benefits in the financial statements; nor is the Fund aware of any tax positions for which it is reasonably possible that the total amounts of unrecognized tax benefits will significantly change in the next twelve months. The Fund files a U.S. federal tax return, in addition to state and local tax returns as required. The Fund's federal income tax returns are subject to examination by the Internal Revenue Service (IRS) for a period of three fiscal years after they are filed. State and local tax returns may be subject to examination for an additional fiscal year depending on the jurisdiction. Foreign taxes are provided for based on the Fund's understanding of the tax rules and rates that exist in the foreign markets in which it invests.
Distributions are declared and recorded on the ex-dividend date. Income and capital gain distributions are declared separately for each class. Income and capital gain distributions are determined in accordance with income tax regulations, which may differ from GAAP.
Capital accounts within the financial statements are adjusted for permanent book-tax differences. These adjustments have no impact on net assets or the results of operations. Capital accounts are not adjusted for temporary book-tax differences which will reverse in a subsequent period.
Book-tax differences are primarily due to the short-term gain distributions from the Fidelity Central Funds, futures contracts, swaps, foreign currency transactions, market discount, partnerships, losses deferred due to wash sales, futures transactions, and excise tax regulations.
As of period end, the cost and unrealized appreciation (depreciation) in securities, and derivatives if applicable, for federal income tax purposes were as follows:
| Gross unrealized appreciation | $134,044,987 |
| Gross unrealized depreciation | (51,952,281) |
| Net unrealized appreciation (depreciation) | $82,092,706 |
| Tax Cost | $1,457,989,990 |
The tax-based components of distributable earnings as of period end were as follows:
| Undistributed ordinary income | $964,412 |
| Undistributed long-term capital gain | $847,216 |
| Net unrealized appreciation (depreciation) on securities and other investments | $76,576,815 |
The tax character of distributions paid was as follows:
| | December 31, 2020 | December 31, 2019 |
| Ordinary Income | $55,710,999 | $ 53,895,816 |
| Long-term Capital Gains | 6,209,680 | 6,439,809 |
| Total | $61,920,679 | $ 60,335,625 |
Delayed Delivery Transactions and When-Issued Securities. During the period, certain Funds transacted in securities on a delayed delivery or when-issued basis. Payment and delivery may take place after the customary settlement period for that security. The price of the underlying securities and the date when the securities will be delivered and paid for are fixed at the time the transaction is negotiated. Securities purchased on a delayed delivery or when-issued basis are identified as such in the Schedule of Investments. Compensation for interest forgone in the purchase of a delayed delivery or when-issued debt security may be received. With respect to purchase commitments, each applicable Fund identifies securities as segregated in its records with a value at least equal to the amount of the commitment. Payables and receivables associated with the purchases and sales of delayed delivery securities having the same coupon, settlement date and broker are offset. Delayed delivery or when-issued securities that have been purchased from and sold to different brokers are reflected as both payables and receivables in the Statement of Assets and Liabilities under the caption "Delayed delivery", as applicable. Losses may arise due to changes in the value of the underlying securities or if the counterparty does not perform under the contract's terms, or if the issuer does not issue the securities due to political, economic, or other factors.
Restricted Securities (including Private Placements). The Fund may invest in securities that are subject to legal or contractual restrictions on resale. These securities generally may be resold in transactions exempt from registration or to the public if the securities are registered. Disposal of these securities may involve time-consuming negotiations and expense, and prompt sale at an acceptable price may be difficult. Information regarding restricted securities is included at the end of the Fund's Schedule of Investments.
Loans and Other Direct Debt Instruments. Direct debt instruments are interests in amounts owed to lenders by corporate or other borrowers. These instruments may be in the form of loans, trade claims or other receivables and may include standby financing commitments such as revolving credit facilities that obligate a fund to supply additional cash to the borrower on demand. Loans may be acquired through assignment, participation, or may be made directly to a borrower. Such instruments are presented in the Bank Loan Obligations section in the Schedule of Investments. Certain funds may also invest in unfunded loan commitments, which are contractual obligations for future funding. Information regarding unfunded commitments is included at the end of the Schedule of Investments, if applicable.
4. Derivative Instruments.
Risk Exposures and the Use of Derivative Instruments. The Fund's investment objective allows the Fund to enter into various types of derivative contracts, including futures contracts, forward foreign currency contracts, options and swaps. Derivatives are investments whose value is primarily derived from underlying assets, indices or reference rates and may be transacted on an exchange or over-the-counter (OTC). Derivatives may involve a future commitment to buy or sell a specified asset based on specified terms, to exchange future cash flows at periodic intervals based on a notional principal amount, or for one party to make one or more payments upon the occurrence of specified events in exchange for periodic payments from the other party.
The Fund used derivatives to increase returns, to gain exposure to certain types of assets, to facilitate transactions in foreign-denominated securities and to manage exposure to certain risks as defined below. The success of any strategy involving derivatives depends on analysis of numerous economic factors, and if the strategies for investment do not work as intended, the Fund may not achieve its objectives.
The Fund's use of derivatives increased or decreased its exposure to the following risks:
| Foreign Exchange Risk | Foreign exchange rate risk relates to fluctuations in the value of an asset or liability due to changes in currency exchange rates.
|
| Interest Rate Risk | Interest rate risk relates to the fluctuations in the value of interest-bearing securities due to changes in the prevailing levels of market interest rates. |
The Fund is also exposed to additional risks from investing in derivatives, such as liquidity risk and counterparty credit risk. Liquidity risk is the risk that the Fund will be unable to close out the derivative in the open market in a timely manner. Counterparty credit risk is the risk that the counterparty will not be able to fulfill its obligation to the Fund. Derivative counterparty credit risk is managed through formal evaluation of the creditworthiness of all potential counterparties. On certain OTC derivatives such as forward foreign currency contracts and options, the Fund attempts to reduce its exposure to counterparty credit risk by entering into an International Swaps and Derivatives Association, Inc. (ISDA) Master Agreement with each of its counterparties. The ISDA Master Agreement gives the Fund the right to terminate all transactions traded under such agreement upon the deterioration in the credit quality of the counterparty beyond specified levels. The ISDA Master Agreement gives each party the right, upon an event of default by the other party or a termination of the agreement, to close out all transactions traded under such agreement and to net amounts owed under each transaction to one net payable by one party to the other. To mitigate counterparty credit risk on bi-lateral OTC derivatives, the Fund receives collateral in the form of cash or securities once the Fund's net unrealized appreciation on outstanding derivative contracts under an ISDA Master Agreement exceeds certain applicable thresholds, subject to certain minimum transfer provisions. The collateral received is held in segregated accounts with the Fund's custodian bank in accordance with the collateral agreements entered into between the Fund, the counterparty and the Fund's custodian bank. The Fund could experience delays and costs in gaining access to the collateral even though it is held by the Fund's custodian bank. The Fund's maximum risk of loss from counterparty credit risk related to bi-lateral OTC derivatives is generally the aggregate unrealized appreciation and unpaid counterparty payments in excess of any collateral pledged by the counterparty to the Fund. For OTC written options with upfront premiums received, the Fund is obligated to perform and therefore does not have counterparty risk. For OTC written options with premiums to be received at a future date, the maximum risk of loss from counterparty credit risk is the amount of the premium in excess of any collateral pledged by the counterparty. The Fund may be required to pledge collateral for the benefit of the counterparties on bi-lateral OTC derivatives in an amount not less than each counterparty's unrealized appreciation on outstanding derivative contracts, subject to certain minimum transfer provisions, and any such pledged collateral is identified in the Schedule of Investments. Exchange-traded futures contracts are not covered by the ISDA Master Agreement; however counterparty credit risk related to exchange-traded futures contracts may be mitigated by the protection provided by the exchange on which they trade. Counterparty credit risk related to centrally cleared OTC swaps may be mitigated by the protection provided by the clearinghouse.
Investing in derivatives may involve greater risks than investing in the underlying assets directly and, to varying degrees, may involve risk of loss in excess of any initial investment and collateral received and amounts recognized in the Statement of Assets and Liabilities. In addition, there may be the risk that the change in value of the derivative contract does not correspond to the change in value of the underlying instrument.
Net Realized Gain (Loss) and Change in Net Unrealized Appreciation (Depreciation) on Derivatives. The table below, which reflects the impacts of derivatives on the financial performance of the Fund, summarizes the net realized gain (loss) and change in net unrealized appreciation (depreciation) for derivatives during the period as presented in the Statement of Operations.
| Primary Risk Exposure / Derivative Type | Net Realized Gain (Loss) | Change in Net Unrealized Appreciation (Depreciation) |
| Foreign Exchange Risk�� | | |
| Forward Foreign Currency Contracts | $(4,240,713) | $(4,202,906) |
| Total Foreign Exchange Risk | (4,240,713) | (4,202,906) |
| Interest Rate Risk | | |
| Futures Contracts | 3,037,356 | 398,229 |
| Purchased Options | 1,632,570 | (101,058) |
| Swaps | (752,094) | (90,784) |
| Written Options | (122,256) | (10,704) |
| Total Interest Rate Risk | 3,795,576 | 195,683 |
| Totals | $(445,137) | $(4,007,223) |
A summary of the value of derivatives by primary risk exposure as of period end is included at the end of the Schedule of Investments.
Forward Foreign Currency Contracts. Forward foreign currency contracts represent obligations to purchase or sell foreign currency on a specified future date at a price fixed at the time the contracts are entered into. The Fund used forward foreign currency contracts to facilitate transactions in foreign-denominated securities and to manage exposure to certain foreign currencies.
Forward foreign currency contracts are valued daily and fluctuations in exchange rates on open contracts are recorded as unrealized appreciation or (depreciation) and reflected in the Statement of Assets and Liabilities. When the contract is closed, the Fund realizes a gain or loss equal to the difference between the closing value and the value at the time it was opened. Non-deliverable forward foreign currency exchange contracts are settled with the counterparty in cash without the delivery of foreign currency. The net realized gain (loss) and change in net unrealized appreciation (depreciation) on forward foreign currency contracts during the period is presented in the Statement of Operations.
Any open forward foreign currency contracts at period end are presented in the Schedule of Investments under the caption "Forward Foreign Currency Contracts." The contract amount and unrealized appreciation (depreciation) reflects each contract's exposure to the underlying currency at period end.
Futures Contracts. A futures contract is an agreement between two parties to buy or sell a specified underlying instrument for a fixed price at a specified future date. The Fund used futures contracts to manage its exposure to the bond market and fluctuations in interest rates.
Upon entering into a futures contract, a fund is required to deposit either cash or securities (initial margin) with a clearing broker in an amount equal to a certain percentage of the face value of the contract. Futures contracts are marked-to-market daily and subsequent daily payments (variation margin) are made or received by a fund depending on the daily fluctuations in the value of the futures contracts and are recorded as unrealized appreciation or (depreciation). This receivable and/or payable, if any, is included in daily variation margin on futures contracts in the Statement of Assets and Liabilities. Realized gain or (loss) is recorded upon the expiration or closing of a futures contract. The net realized gain (loss) and change in net unrealized appreciation (depreciation) on futures contracts during the period is presented in the Statement of Operations.
Any open futures contracts at period end are presented in the Schedule of Investments under the caption "Futures Contracts". The notional amount at value reflects each contract's exposure to the underlying instrument or index at period end and is representative of volume of activity during the period. Securities deposited to meet initial margin requirements are identified in the Schedule of Investments.
Options. Options give the purchaser the right, but not the obligation, to buy (call) or sell (put) an underlying security or financial instrument at an agreed exercise or strike price between or on certain dates. Options obligate the seller (writer) to buy (put) or sell (call) an underlying instrument at the exercise or strike price or cash settle an underlying derivative instrument if the holder exercises the option on or before the expiration date. The Fund uses OTC options, such as swaptions, which are options where the underlying instrument is a swap, to manage its exposure to fluctuations in interest rates.
Upon entering into an options contract, a fund will pay or receive a premium. Premiums paid on purchased options are reflected as cost of investments and premiums received on written options are reflected as a liability on the Statement of Assets and Liabilities. Certain options may be purchased or written with premiums to be paid or received on a future date. Options are valued daily and any unrealized appreciation (depreciation) is reflected on the Statement of Assets and Liabilities. When an option is exercised, the cost or proceeds of the underlying instrument purchased or sold is adjusted by the amount of the premium. When an option is closed the Fund will realize a gain or loss depending on whether the proceeds or amount paid for the closing sale transaction is greater or less than the premium received or paid. When an option expires, gains and losses are realized to the extent of premiums received and paid, respectively. The net realized and unrealized gains (losses) on purchased options are included in the Statement of Operations in net realized gain (loss) and change in net unrealized appreciation (depreciation) on investment securities. The net realized gain (loss) and change in net unrealized appreciation (depreciation) on written options are presented in the Statement of Operations.
Any open options at period end are presented in the Schedule of Investments under the captions "Purchased Options," "Purchased Swaptions," "Written Options" and "Written Swaptions," as applicable, and are representative of volume of activity during the period.
Writing puts and buying calls tend to increase exposure to the underlying instrument while buying puts and writing calls tend to decrease exposure to the underlying instrument. For purchased options, risk of loss is limited to the premium paid, and for written options, risk of loss is the change in value in excess of the premium received.
Swaps. A swap is a contract between two parties to exchange future cash flows at periodic intervals based on a notional principal amount. A centrally cleared OTC swap is a transaction executed between a fund and a dealer counterparty, then cleared by a futures commission merchant (FCM) through a clearinghouse. Once cleared, the clearinghouse serves as a central counterparty, with whom a fund exchanges cash flows for the life of the transaction, similar to transactions in futures contracts.
Centrally cleared OTC swaps require a fund to deposit either cash or securities (initial margin) with the FCM, at the instruction of and for the benefit of the clearinghouse. Securities deposited to meet initial margin requirements are identified in the Schedule of Investments. Centrally cleared OTC swaps are marked-to-market daily and subsequent payments (variation margin) are made or received depending on the daily fluctuations in the value of the swaps and are recorded as unrealized appreciation or (depreciation). These daily payments, if any, are included in receivable or payable for daily variation margin on centrally cleared OTC swaps in the Statement of Assets and Liabilities. Any premiums for centrally cleared OTC swaps are recorded periodically throughout the term of the swap to variation margin and included in unrealized appreciation (depreciation) in the Statement of Assets and Liabilities. Any premiums are recognized as realized gain (loss) upon termination or maturity of the swap.
Payments are exchanged at specified intervals, accrued daily commencing with the effective date of the contract and recorded as realized gain or (loss). Some swaps may be terminated prior to the effective date and realize a gain or loss upon termination. The net realized gain (loss) and change in net unrealized appreciation (depreciation) on swaps during the period is presented in the Statement of Operations.
Any open swaps at period end are included in the Schedule of Investments under the caption "Swaps" and are representative of volume of activity during the period.
Interest Rate Swaps. Interest rate swaps are agreements between counterparties to exchange cash flows, one based on a fixed rate, and the other on a floating rate. The Fund entered into interest rate swaps to manage its exposure to interest rate changes. Changes in interest rates can have an effect on both the value of bond holdings as well as the amount of interest income earned. In general, the value of bonds can fall when interest rates rise and can rise when interest rates fall.
5. Purchases and Sales of Investments.
Purchases and sales of securities, other than short-term securities and U.S. government securities, are noted in the table below.
| | Purchases ($) | Sales ($) |
| VIP Strategic Income Portfolio | 1,096,079,864 | 1,026,411,178 |
6. Fees and Other Transactions with Affiliates.
Management Fee. Fidelity Management & Research Company LLC (the investment adviser) and its affiliates provide the Fund with investment management related services for which the Fund pays a monthly management fee. The management fee is the sum of an individual fund fee rate that is based on an annual rate of .45% of the Fund's average net assets and an annualized group fee rate that averaged .10% during the period. The group fee rate is based upon the monthly average net assets of a group of registered investment companies with which the investment adviser has management contracts. The group fee rate decreases as assets under management increase and increases as assets under management decrease. For the reporting period, the total annual management fee rate was .55% of the Fund's average net assets.
Distribution and Service Plan Fees. In accordance with Rule 12b-1 of the 1940 Act, the Fund has adopted separate 12b-1 Plans for each Service Class of shares. Each Service Class pays Fidelity Distributors Company LLC (FDC), an affiliate of the investment adviser, a service fee. For the period, the service fee is based on an annual rate of .10% of Service Class' average net assets and .25% of Service Class 2's average net assets.
For the period, total fees, all of which were re-allowed to insurance companies for the distribution of shares and providing shareholder support services, were as follows:
| Service Class | $745 |
| Service Class 2 | 1,246,790 |
| | $1,247,535 |
Transfer Agent Fees. Fidelity Investments Institutional Operations Company LLC (FIIOC), an affiliate of the investment adviser, is the Fund's transfer, dividend disbursing, and shareholder servicing agent. FIIOC receives an asset-based fee with respect to each class. Each class pays a fee for transfer agent services, typesetting and printing and mailing of shareholder reports, excluding mailing of proxy statements. For the period, transfer agent fees for each class were as follows:
| | Amount | % of Class-Level Average Net Assets |
| Initial Class | $53,033 | .07 |
| Service Class | 506 | .07 |
| Service Class 2 | 339,127 | .07 |
| Investor Class | 932,566 | .10 |
| | $1,325,232 | |
Accounting Fees. Fidelity Service Company, Inc. (FSC), an affiliate of the investment adviser, maintains the Fund's accounting records. The accounting fee is based on the level of average net assets for each month. For the period, the fees were equivalent to the following annual rates:
| | % of Average Net Assets |
| VIP Strategic Income Portfolio | .03 |
Brokerage Commissions. A portion of portfolio transactions were placed with brokerage firms which are affiliates of the investment adviser. Brokerage commissions are included in net realized gain (loss) and change in net unrealized appreciation (depreciation) in the Statement of Operations. The commissions paid to these affiliated firms were as follows:
| | Amount |
| VIP Strategic Income Portfolio | $618 |
Interfund Trades. Funds may purchase from or sell securities to other Fidelity Funds under procedures adopted by the Board. The procedures have been designed to ensure these interfund trades are executed in accordance with Rule 17a-7 of the 1940 Act. Interfund trades are included within the respective purchases and sales amounts shown in the Purchases and Sales of Investments note, and amounted to $592,513 and $2,059,402, respectively.
Affiliated Exchanges In-Kind. During the period, the Fund completed an exchange in-kind with Fidelity Mortgage Backed Securities Central Fund. The Fund delivered investments, including accrued interest, and cash valued at $33,308,914 in exchange for 294,144 shares of the Central Fund. The net realized gain of $823,366 on investments delivered in-kind is included in the accompanying Statement of Operations. The Fund recognized net gains for federal income tax purposes.
7. Committed Line of Credit.
Certain Funds participate with other funds managed by the investment adviser or an affiliate in a $4.25 billion credit facility (the "line of credit") to be utilized for temporary or emergency purposes to fund shareholder redemptions or for other short-term liquidity purposes. The participating funds have agreed to pay commitment fees on their pro-rata portion of the line of credit, which are reflected in Miscellaneous expenses on the Statement of Operations, and are as follows:
| | Amount |
| VIP Strategic Income Portfolio | $3,520 |
During the period, there were no borrowings on this line of credit.
8. Security Lending.
Funds lend portfolio securities from time to time in order to earn additional income. Lending agents are used, including National Financial Services (NFS), an affiliate of the investment adviser. Pursuant to a securities lending agreement, NFS will receive a fee, which is capped at 9.9% of a fund's daily lending revenue, for its services as lending agent. A fund may lend securities to certain qualified borrowers, including NFS. On the settlement date of the loan, a fund receives collateral (in the form of U.S. Treasury obligations, letters of credit and/or cash) against the loaned securities and maintains collateral in an amount not less than 100% of the market value of the loaned securities during the period of the loan. The market value of the loaned securities is determined at the close of business of a fund and any additional required collateral is delivered to a fund on the next business day. A fund or borrower may terminate the loan at any time, and if the borrower defaults on its obligation to return the securities loaned because of insolvency or other reasons, a fund may apply collateral received from the borrower against the obligation. A fund may experience delays and costs in recovering the securities loaned. Any cash collateral received is invested in the Fidelity Securities Lending Cash Central Fund. Any loaned securities are identified as such in the Schedule of Investments, and the value of loaned securities and cash collateral at period end, as applicable, are presented in the Statement of Assets and Liabilities. Security lending income represents the income earned on investing cash collateral, less rebates paid to borrowers and any lending agent fees associated with the loan, plus any premium payments received for lending certain types of securities. Security lending income is presented in the Statement of Operations as a component of income from Fidelity Central Funds. Affiliated security lending activity, if any, was as follows:
| | Total Security Lending Income Fees Paid to NFS | Security Lending Income From Securities Loaned to NFS | Value of Securities Loaned to NFS at Period End |
| VIP Strategic Income Portfolio | $51 | $– | $– |
9. Expense Reductions.
Commissions paid to certain brokers with whom the investment adviser, or its affiliates, places trades on behalf of the Fund include an amount in addition to trade execution, which may be rebated back to the Fund to offset certain expenses. This amount totaled $1,980 for the period. In addition, through arrangements with the Fund's custodian, credits realized as a result of certain uninvested cash balances were used to reduce the Fund's expenses. During the period, custodian credits reduced the Fund's expenses by $20,779.
In addition, during the period the investment adviser or an affiliate reimbursed and/or waived a portion of fund-level operating expenses in the amount of $3,090.
10. Distributions to Shareholders.
Distributions to shareholders of each class were as follows:
| | Year ended
December 31, 2020 | Year ended
December 31, 2019 |
| Distributions to shareholders | | |
| Initial Class | $3,223,768 | $3,300,863 |
| Service Class | 18,054 | 75,615 |
| Service Class 2 | 20,586,910 | 18,874,089 |
| Investor Class | 38,091,947 | 38,085,058 |
| Total | $61,920,679 | $60,335,625 |
11. Share Transactions.
Transactions for each class of shares were as follows:
| | Shares | Shares | Dollars | Dollars |
| | Year ended December 31, 2020 | Year ended December 31, 2019 | Year ended December 31, 2020 | Year ended December 31, 2019 |
| Initial Class | | | | |
| Shares sold | 621,919 | 646,742 | $7,201,199 | $7,430,356 |
| Reinvestment of distributions | 274,674 | 288,789 | 3,223,768 | 3,300,863 |
| Shares redeemed | (1,495,726) | (1,299,251) | (16,896,208) | (14,908,838) |
| Net increase (decrease) | (599,133) | (363,720) | $(6,471,241) | $(4,177,619) |
| Service Class | | | | |
| Shares sold | 11,015 | 13,557 | $121,592 | $154,777 |
| Reinvestment of distributions | 448 | 5,535 | 5,237 | 63,098 |
| Shares redeemed | (145,627) | (11,610) | (1,451,012) | (131,118) |
| Net increase (decrease) | (134,164) | 7,482 | $(1,324,183) | $86,757 |
| Service Class 2 | | | | |
| Shares sold | 6,290,432 | 8,160,489 | $71,388,158 | $92,979,352 |
| Reinvestment of distributions | 1,772,164 | 1,667,322 | 20,586,910 | 18,874,089 |
| Shares redeemed | (6,717,654) | (2,834,317) | (74,651,617) | (31,977,779) |
| Net increase (decrease) | 1,344,942 | 6,993,494 | $17,323,451 | $79,875,662 |
| Investor Class | | | | |
| Shares sold | 3,035,320 | 3,055,170 | $34,858,018 | $35,020,378 |
| Reinvestment of distributions | 3,256,630 | 3,343,728 | 38,091,947 | 38,085,058 |
| Shares redeemed | (11,014,938) | (6,123,366) | (121,704,732) | (69,894,584) |
| Net increase (decrease) | (4,722,988) | 275,532 | $(48,754,767) | $3,210,852 |
12. Other.
The Fund's organizational documents provide former and current trustees and officers with a limited indemnification against liabilities arising in connection with the performance of their duties to the Fund. In the normal course of business, the Fund may also enter into contracts that provide general indemnifications. The Fund's maximum exposure under these arrangements is unknown as this would be dependent on future claims that may be made against the Fund. The risk of material loss from such claims is considered remote.
At the end of the period, the investment adviser or its affiliates were the owners of record of 64% of the total outstanding shares of the Fund and two otherwise unaffiliated shareholder was the owner of record of 21% of the total outstanding shares of the Fund.
13. Credit Risk.
The Fund's relatively large investment in countries with limited or developing capital markets may involve greater risks than investments in more developed markets and the prices of such investments may be volatile. The yields of emerging market debt obligations reflect, among other things, perceived credit risk. The consequences of political, social or economic changes in these markets may have disruptive effects on the market prices of the Fund's investments and the income they generate, as well as the Fund's ability to repatriate such amounts.
14. Coronavirus (COVID-19) Pandemic.
An outbreak of COVID-19 first detected in China during December 2019 has since spread globally and was declared a pandemic by the World Health Organization during March 2020. Developments that disrupt global economies and financial markets, such as the COVID-19 pandemic, may magnify factors that affect the Fund's performance.
Report of Independent Registered Public Accounting Firm
To the Board of Trustees of Variable Insurance Products Fund V and Shareholders of VIP Strategic Income Portfolio
Opinion on the Financial Statements
We have audited the accompanying statement of assets and liabilities, including the schedule of investments, of VIP Strategic Income Portfolio (one of the funds constituting Variable Insurance Products Fund V, referred to hereafter as the “Fund”) as of December 31, 2020, the related statement of operations for the year ended December 31, 2020, the statement of changes in net assets for each of the two years in the period ended December 31, 2020, including the related notes, and the financial highlights for each of the five years in the period ended December 31, 2020 (collectively referred to as the “financial statements”). In our opinion, the financial statements present fairly, in all material respects, the financial position of the Fund as of December 31, 2020, the results of its operations for the year then ended, the changes in its net assets for each of the two years in the period ended December 31, 2020 and the financial highlights for each of the five years in the period ended December 31, 2020 in conformity with accounting principles generally accepted in the United States of America.
Basis for Opinion
These financial statements are the responsibility of the Fund’s management. Our responsibility is to express an opinion on the Fund’s financial statements based on our audits. We are a public accounting firm registered with the Public Company Accounting Oversight Board (United States) (PCAOB) and are required to be independent with respect to the Fund in accordance with the U.S. federal securities laws and the applicable rules and regulations of the Securities and Exchange Commission and the PCAOB.
We conducted our audits of these financial statements in accordance with the standards of the PCAOB. Those standards require that we plan and perform the audit to obtain reasonable assurance about whether the financial statements are free of material misstatement, whether due to error or fraud.
Our audits included performing procedures to assess the risks of material misstatement of the financial statements, whether due to error or fraud, and performing procedures that respond to those risks. Such procedures included examining, on a test basis, evidence regarding the amounts and disclosures in the financial statements. Our audits also included evaluating the accounting principles used and significant estimates made by management, as well as evaluating the overall presentation of the financial statements. Our procedures included confirmation of securities owned as of December 31, 2020 by correspondence with the custodian, issuers of privately offered securities, agent banks and brokers; when replies were not received from brokers, we performed other auditing procedures. We believe that our audits provide a reasonable basis for our opinion.
/s/ PricewaterhouseCoopers LLP
Boston, Massachusetts
February 18, 2021
We have served as the auditor of one or more investment companies in the Fidelity group of funds since 1932.
Trustees and Officers
The Trustees, Members of the Advisory Board (if any), and officers of the trust and fund, as applicable, are listed below. The Board of Trustees governs the fund and is responsible for protecting the interests of shareholders. The Trustees are experienced executives who meet periodically throughout the year to oversee the fund's activities, review contractual arrangements with companies that provide services to the fund, oversee management of the risks associated with such activities and contractual arrangements, and review the fund's performance. Each of the Trustees oversees 280 funds.
The Trustees hold office without limit in time except that (a) any Trustee may resign; (b) any Trustee may be removed by written instrument, signed by at least two-thirds of the number of Trustees prior to such removal; (c) any Trustee who requests to be retired or who has become incapacitated by illness or injury may be retired by written instrument signed by a majority of the other Trustees; and (d) any Trustee may be removed at any special meeting of shareholders by a two-thirds vote of the outstanding voting securities of the trust. Each Trustee who is not an interested person (as defined in the 1940 Act) of the trust and the fund is referred to herein as an Independent Trustee. Each Independent Trustee shall retire not later than the last day of the calendar year in which his or her 75th birthday occurs. The Independent Trustees may waive this mandatory retirement age policy with respect to individual Trustees. Officers and Advisory Board Members hold office without limit in time, except that any officer or Advisory Board Member may resign or may be removed by a vote of a majority of the Trustees at any regular meeting or any special meeting of the Trustees. Except as indicated, each individual has held the office shown or other offices in the same company for the past five years.
The fund’s Statement of Additional Information (SAI) includes more information about the Trustees. To request a free copy, call Fidelity at 1-877-208-0098.
Experience, Skills, Attributes, and Qualifications of the Trustees. The Governance and Nominating Committee has adopted a statement of policy that describes the experience, qualifications, attributes, and skills that are necessary and desirable for potential Independent Trustee candidates (Statement of Policy). The Board believes that each Trustee satisfied at the time he or she was initially elected or appointed a Trustee, and continues to satisfy, the standards contemplated by the Statement of Policy. The Governance and Nominating Committee also engages professional search firms to help identify potential Independent Trustee candidates who have the experience, qualifications, attributes, and skills consistent with the Statement of Policy. From time to time, additional criteria based on the composition and skills of the current Independent Trustees, as well as experience or skills that may be appropriate in light of future changes to board composition, business conditions, and regulatory or other developments, have also been considered by the professional search firms and the Governance and Nominating Committee. In addition, the Board takes into account the Trustees' commitment and participation in Board and committee meetings, as well as their leadership of standing and ad hoc committees throughout their tenure.
In determining that a particular Trustee was and continues to be qualified to serve as a Trustee, the Board has considered a variety of criteria, none of which, in isolation, was controlling. The Board believes that, collectively, the Trustees have balanced and diverse experience, qualifications, attributes, and skills, which allow the Board to operate effectively in governing the fund and protecting the interests of shareholders. Information about the specific experience, skills, attributes, and qualifications of each Trustee, which in each case led to the Board's conclusion that the Trustee should serve (or continue to serve) as a trustee of the fund, is provided below.
Board Structure and Oversight Function. Abigail P. Johnson is an interested person and currently serves as Chairman. The Trustees have determined that an interested Chairman is appropriate and benefits shareholders because an interested Chairman has a personal and professional stake in the quality and continuity of services provided to the fund. Independent Trustees exercise their informed business judgment to appoint an individual of their choosing to serve as Chairman, regardless of whether the Trustee happens to be independent or a member of management. The Independent Trustees have determined that they can act independently and effectively without having an Independent Trustee serve as Chairman and that a key structural component for assuring that they are in a position to do so is for the Independent Trustees to constitute a substantial majority for the Board. The Independent Trustees also regularly meet in executive session. Arthur E. Johnson serves as Chairman of the Independent Trustees and as such (i) acts as a liaison between the Independent Trustees and management with respect to matters important to the Independent Trustees and (ii) with management prepares agendas for Board meetings.
Fidelity® funds are overseen by different Boards of Trustees. The fund's Board oversees Fidelity's investment-grade bond, money market, asset allocation and certain equity funds, and other Boards oversee Fidelity's high income and other equity funds. The asset allocation funds may invest in Fidelity® funds that are overseen by such other Boards. The use of separate Boards, each with its own committee structure, allows the Trustees of each group of Fidelity® funds to focus on the unique issues of the funds they oversee, including common research, investment, and operational issues. On occasion, the separate Boards establish joint committees to address issues of overlapping consequences for the Fidelity® funds overseen by each Board.
The Trustees operate using a system of committees to facilitate the timely and efficient consideration of all matters of importance to the Trustees, the fund, and fund shareholders and to facilitate compliance with legal and regulatory requirements and oversight of the fund's activities and associated risks. The Board, acting through its committees, has charged FMR and its affiliates with (i) identifying events or circumstances the occurrence of which could have demonstrably adverse effects on the fund's business and/or reputation; (ii) implementing processes and controls to lessen the possibility that such events or circumstances occur or to mitigate the effects of such events or circumstances if they do occur; and (iii) creating and maintaining a system designed to evaluate continuously business and market conditions in order to facilitate the identification and implementation processes described in (i) and (ii) above. Because the day-to-day operations and activities of the fund are carried out by or through FMR, its affiliates, and other service providers, the fund's exposure to risks is mitigated but not eliminated by the processes overseen by the Trustees. While each of the Board's committees has responsibility for overseeing different aspects of the fund's activities, oversight is exercised primarily through the Operations and Audit Committees. In addition, an ad hoc Board committee of Independent Trustees has worked with FMR to enhance the Board's oversight of investment and financial risks, legal and regulatory risks, technology risks, and operational risks, including the development of additional risk reporting to the Board. Appropriate personnel, including but not limited to the fund's Chief Compliance Officer (CCO), FMR's internal auditor, the independent accountants, the fund's Treasurer and portfolio management personnel, make periodic reports to the Board's committees, as appropriate, including an annual review of Fidelity's risk management program for the Fidelity® funds. The responsibilities of each standing committee, including their oversight responsibilities, are described further under "Standing Committees of the Trustees."
Interested Trustees*:
Correspondence intended for a Trustee who is an interested person may be sent to Fidelity Investments, 245 Summer Street, Boston, Massachusetts 02210.
Name, Year of Birth; Principal Occupations and Other Relevant Experience+
Abigail P. Johnson (1961)
Year of Election or Appointment: 2009
Trustee
Chairman of the Board of Trustees
Ms. Johnson also serves as Trustee of other Fidelity® funds. Ms. Johnson serves as Chairman (2016-present), Chief Executive Officer (2014-present), and Director (2007-present) of FMR LLC (diversified financial services company), President of Fidelity Financial Services (2012-present) and President of Personal, Workplace and Institutional Services (2005-present). Ms. Johnson is Chairman and Director of Fidelity Management & Research Company LLC (investment adviser firm, 2011-present). Previously, Ms. Johnson served as Chairman and Director of FMR Co., Inc. (investment adviser firm, 2011-2019), Vice Chairman (2007-2016) and President (2013-2016) of FMR LLC, President and a Director of Fidelity Management & Research Company (2001-2005), a Trustee of other investment companies advised by Fidelity Management & Research Company, Fidelity Investments Money Management, Inc. (investment adviser firm), and FMR Co., Inc. (2001-2005), Senior Vice President of the Fidelity® funds (2001-2005), and managed a number of Fidelity® funds. Ms. Abigail P. Johnson and Mr. Arthur E. Johnson are not related.
Jennifer Toolin McAuliffe (1959)
Year of Election or Appointment: 2016
Trustee
Ms. McAuliffe also serves as Trustee of other Fidelity® funds. Previously, Ms. McAuliffe served as Co-Head of Fixed Income of Fidelity Investments Limited (now known as FIL Limited (FIL)) (diversified financial services company), Director of Research for FIL’s credit and quantitative teams in London, Hong Kong and Tokyo and Director of Research for taxable and municipal bonds at Fidelity Investments Money Management, Inc. Ms. McAuliffe previously served as a member of the Advisory Board of certain Fidelity® funds (2016). Ms. McAuliffe was previously a lawyer at Ropes & Gray LLP and currently serves as director or trustee of several not-for-profit entities.
* Determined to be an “Interested Trustee” by virtue of, among other things, his or her affiliation with the trust or various entities under common control with FMR.
+ The information includes the Trustee's principal occupation during the last five years and other information relating to the experience, attributes, and skills relevant to the Trustee's qualifications to serve as a Trustee, which led to the conclusion that the Trustee should serve as a Trustee for the fund.
Independent Trustees:
Correspondence intended for an Independent Trustee may be sent to Fidelity Investments, P.O. Box 55235, Boston, Massachusetts 02205-5235.
Name, Year of Birth; Principal Occupations and Other Relevant Experience+
Elizabeth S. Acton (1951)
Year of Election or Appointment: 2013
Trustee
Ms. Acton also serves as Trustee of other Fidelity® funds. Prior to her retirement, Ms. Acton served as Executive Vice President, Finance (2011-2012), Executive Vice President, Chief Financial Officer (2002-2011) and Treasurer (2004-2005) of Comerica Incorporated (financial services). Prior to joining Comerica, Ms. Acton held a variety of positions at Ford Motor Company (1983-2002), including Vice President and Treasurer (2000-2002) and Executive Vice President and Chief Financial Officer of Ford Motor Credit Company (1998-2000). Ms. Acton currently serves as a member of the Board and Audit and Finance Committees of Beazer Homes USA, Inc. (homebuilding, 2012-present). Ms. Acton previously served as a member of the Advisory Board of certain Fidelity® funds (2013-2016).
Ann E. Dunwoody (1953)
Year of Election or Appointment: 2018
Trustee
General Dunwoody also serves as Trustee of other Fidelity® funds. General Dunwoody (United States Army, Retired) was the first woman in U.S. military history to achieve the rank of four-star general and prior to her retirement in 2012 held a variety of positions within the U.S. Army, including Commanding General, U.S. Army Material Command (2008-2012). General Dunwoody currently serves as President of First to Four LLC (leadership and mentoring services, 2012-present), a member of the Board and Nomination and Corporate Governance Committees of Kforce Inc. (professional staffing services, 2016-present) and a member of the Board of Automattic Inc. (software engineering, 2018-present). Previously, General Dunwoody served as a member of the Advisory Board and Nominating and Corporate Governance Committee of L3 Technologies, Inc. (communication, electronic, sensor and aerospace systems, 2013-2019) and a member of the Board and Audit and Sustainability and Corporate Responsibility Committees of Republic Services, Inc. (waste collection, disposal and recycling, 2013-2016). Ms. Dunwoody also serves on several boards for non-profit organizations, including as a member of the Board, Chair of the Nomination and Governance Committee and a member of the Audit Committee of Logistics Management Institute (consulting non-profit, 2012-present), a member of the Council of Trustees for the Association of the United States Army (advocacy non-profit, 2013-present), a member of the Board of Florida Institute of Technology (2015-present) and a member of the Board of ThanksUSA (military family education non-profit, 2014-present). General Dunwoody previously served as a member of the Advisory Board of certain Fidelity® funds (2018).
John Engler (1948)
Year of Election or Appointment: 2014
Trustee
Mr. Engler also serves as Trustee of other Fidelity® funds. Previously, Mr. Engler served as Governor of Michigan (1991-2003), President of the Business Roundtable (2011-2017) and interim President of Michigan State University (2018-2019). Mr. Engler currently serves as a member of the Board of K12 Inc. (technology-based education company, 2012-present). Previously, Mr. Engler served as a member of the Board of Universal Forest Products (manufacturer and distributor of wood and wood-alternative products, 2003-2019) and Trustee of The Munder Funds (2003-2014). Mr. Engler previously served as a member of the Advisory Board of certain Fidelity® funds (2014-2016).
Robert F. Gartland (1951)
Year of Election or Appointment: 2010
Trustee
Mr. Gartland also serves as Trustee of other Fidelity® funds. Prior to his retirement, Mr. Gartland held a variety of positions at Morgan Stanley (financial services, 1979-2007), including Managing Director (1987-2007) and Chase Manhattan Bank (1975-1978). Mr. Gartland previously served as Chairman and an investor in Gartland & Mellina Group Corp. (consulting, 2009-2019), as a member of the Board of National Securities Clearing Corporation (1993-1996) and as Chairman of TradeWeb (2003-2004).
Arthur E. Johnson (1947)
Year of Election or Appointment: 2008
Trustee
Chairman of the Independent Trustees
Mr. Johnson also serves as Trustee of other Fidelity® funds. Prior to his retirement, Mr. Johnson served as Senior Vice President of Corporate Strategic Development of Lockheed Martin Corporation (defense contractor, 1999-2009). Mr. Johnson currently serves as a member of the Board of Booz Allen Hamilton (management consulting, 2011-present). Mr. Johnson previously served as a member of the Board of Eaton Corporation plc (diversified power management, 2009-2019) and a member of the Board of AGL Resources, Inc. (holding company, 2002-2016). Mr. Johnson previously served as Vice Chairman (2015-2018) of the Independent Trustees of certain Fidelity® funds. Mr. Arthur E. Johnson is not related to Ms. Abigail P. Johnson.
Michael E. Kenneally (1954)
Year of Election or Appointment: 2009
Trustee
Vice Chairman of the Independent Trustees
Mr. Kenneally also serves as Trustee of other Fidelity® funds. Prior to his retirement, Mr. Kenneally served as Chairman and Global Chief Executive Officer of Credit Suisse Asset Management and Executive Vice President and Chief Investment Officer of Bank of America Corporation. Earlier roles at Bank of America included Director of Research, Senior Portfolio Manager for various institutional equity accounts and mutual funds and Portfolio Manager for a number of institutional fixed-income clients. Mr. Kenneally began his career as a Research Analyst in 1983 and was awarded the Chartered Financial Analyst (CFA) designation in 1991.
Marie L. Knowles (1946)
Year of Election or Appointment: 2001
Trustee
Ms. Knowles also serves as Trustee of other Fidelity® funds. Prior to her retirement, Ms. Knowles held several positions at Atlantic Richfield Company (diversified energy), including Executive Vice President and Chief Financial Officer (1996-2000), Senior Vice President (1993-1996) and President of ARCO Transportation Company (pipeline and tanker operations, 1993-1996). Ms. Knowles currently serves as a member of the Board of McKesson Corporation (healthcare service, since 2002), a member of the Board of the Santa Catalina Island Company (real estate, 2009-present), a member of the Investment Company Institute Board of Governors and a member of the Governing Council of the Independent Directors Council (2014-present). Ms. Knowles also serves as a member of the Advisory Board for the School of Engineering of the University of Southern California. Ms. Knowles previously served as Chairman (2015-2018) and Vice Chairman (2012-2015) of the Independent Trustees of certain Fidelity® funds.
Mark A. Murray (1954)
Year of Election or Appointment: 2016
Trustee
Mr. Murray also serves as Trustee of other Fidelity® funds. Previously, Mr. Murray served as Co-Chief Executive Officer (2013-2016), President (2006-2013) and Vice Chairman (2013-2020) of Meijer, Inc. Mr. Murray serves as a member of the Board and Nuclear Review and Public Policy and Responsibility Committees of DTE Energy Company (diversified energy company, 2009-present) and a member of the Board and Audit Committee and Chairman of the Nominating and Corporate Governance Committee of Universal Forest Products, Inc. (manufacturer and distributor of wood and wood-alternative products, 2004-2016). Mr. Murray previously served as a member of the Board of Spectrum Health (not-for-profit health system, 2015-2019). Mr. Murray also serves as a member of the Board of many community and professional organizations. Mr. Murray previously served as a member of the Advisory Board of certain Fidelity® funds (2016).
+ The information includes the Trustee's principal occupation during the last five years and other information relating to the experience, attributes, and skills relevant to the Trustee's qualifications to serve as a Trustee, which led to the conclusion that the Trustee should serve as a Trustee for the fund.
Advisory Board Members and Officers:
Correspondence intended for an officer may be sent to Fidelity Investments, 245 Summer Street, Boston, Massachusetts 02210. Officers appear below in alphabetical order.
Name, Year of Birth; Principal Occupation
Craig S. Brown (1977)
Year of Election or Appointment: 2019
Assistant Treasurer
Mr. Brown also serves as Assistant Treasurer of other funds. Mr. Brown is an employee of Fidelity Investments (2013-present).
John J. Burke III (1964)
Year of Election or Appointment: 2018
Chief Financial Officer
Mr. Burke also serves as Chief Financial Officer of other funds. Mr. Burke serves as Head of Investment Operations for Fidelity Fund and Investment Operations (2018-present) and is an employee of Fidelity Investments (1998-present). Previously Mr. Burke served as head of Asset Management Investment Operations (2012-2018).
David J. Carter (1973)
Year of Election or Appointment: 2020
Assistant Secretary
Mr. Carter also serves as Assistant Secretary of other funds. Mr. Carter serves as Vice President, Associate General Counsel (2010-present) and is an employee of Fidelity Investments (2005-present).
Jonathan Davis (1968)
Year of Election or Appointment: 2010
Assistant Treasurer
Mr. Davis also serves as Assistant Treasurer of other funds. Mr. Davis serves as Assistant Treasurer of FMR Capital, Inc. (2017-present) and is an employee of Fidelity Investments. Previously, Mr. Davis served as Vice President and Associate General Counsel of FMR LLC (diversified financial services company, 2003-2010).
Laura M. Del Prato (1964)
Year of Election or Appointment: 2018
President and Treasurer
Ms. Del Prato also serves as an officer of other funds. Ms. Del Prato is an employee of Fidelity Investments (2017-present). Previously, Ms. Del Prato served as President and Treasurer of The North Carolina Capital Management Trust: Cash Portfolio and Term Portfolio (2018-2020). Prior to joining Fidelity Investments, Ms. Del Prato served as a Managing Director and Treasurer of the JPMorgan Mutual Funds (2014-2017). Prior to JPMorgan, Ms. Del Prato served as a partner at Cohen Fund Audit Services (accounting firm, 2012-2013) and KPMG LLP (accounting firm, 2004-2012).
Colm A. Hogan (1973)
Year of Election or Appointment: 2016
Assistant Treasurer
Mr. Hogan also serves as an officer of other funds. Mr. Hogan serves as Assistant Treasurer of FMR Capital, Inc. (2017-present) and is an employee of Fidelity Investments (2005-present). Previously, Mr. Hogan served as Deputy Treasurer of certain Fidelity® funds (2016-2020) and Assistant Treasurer of certain Fidelity® funds (2016-2018).
Cynthia Lo Bessette (1969)
Year of Election or Appointment: 2019
Secretary and Chief Legal Officer (CLO)
Ms. Lo Bessette also serves as an officer of other funds. Ms. Lo Bessette serves as CLO, Secretary, and Senior Vice President of Fidelity Management & Research Company LLC (investment adviser firm, 2019-present); and CLO of Fidelity Management & Research (Hong Kong) Limited, FMR Investment Management (UK) Limited, and Fidelity Management & Research (Japan) Limited (investment adviser firms, 2019-present). She is a Senior Vice President and Deputy General Counsel of FMR LLC (diversified financial services company, 2019-present), and is an employee of Fidelity Investments. Previously, Ms. Lo Bessette served as CLO, Secretary, and Senior Vice President of FMR Co., Inc. (investment adviser firm, 2019); Secretary of Fidelity SelectCo, LLC and Fidelity Investments Money Management, Inc. (investment adviser firms, 2019). Prior to joining Fidelity Investments, Ms. Lo Bessette was Executive Vice President, General Counsel (2016-2019) and Senior Vice President, Deputy General Counsel (2015-2016) of OppenheimerFunds (investment management company) and Deputy Chief Legal Officer (2013-2015) of Jennison Associates LLC (investment adviser firm).
Chris Maher (1972)
Year of Election or Appointment: 2013
Assistant Treasurer
Mr. Maher also serves as an officer of other funds. Mr. Maher serves as Assistant Treasurer of FMR Capital, Inc. (2017-present), and is an employee of Fidelity Investments (2008-present). Previously, Mr. Maher served as Assistant Treasurer of certain funds (2013-2020); Vice President of Asset Management Compliance (2013), Vice President of the Program Management Group of FMR (investment adviser firm, 2010-2013), and Vice President of Valuation Oversight (2008-2010).
Kenneth B. Robins (1969)
Year of Election or Appointment: 2020
Chief Compliance Officer
Mr. Robins also serves as an officer of other funds. Mr. Robins serves as Compliance Officer of Fidelity Management & Research Company LLC (investment adviser firm, 2016-present) and is an employee of Fidelity Investments (2004-present). Previously, Mr. Robins served as Compliance Officer of FMR Co., Inc. (investment adviser firm, 2016-2019), as Executive Vice President of Fidelity Investments Money Management, Inc. (investment adviser firm, 2013-2016) and served in other fund officer roles.
Brett Segaloff (1972)
Year of Election or Appointment: 2021
Anti-Money Laundering (AML) Officer
Mr. Segaloff also serves as an AML Officer of other funds and other related entities. He is Director, Anti-Money Laundering (2007-present) of FMR LLC (diversified financial services company) and is an employee of Fidelity Investments (1996-present).
Stacie M. Smith (1974)
Year of Election or Appointment: 2013
Assistant Treasurer
Ms. Smith also serves as an officer of other funds. Ms. Smith serves as Assistant Treasurer of FMR Capital, Inc. (2017-present), is an employee of Fidelity Investments (2009-present), and has served in other fund officer roles. Prior to joining Fidelity Investments, Ms. Smith served as Senior Audit Manager of Ernst & Young LLP (accounting firm, 1996-2009). Previously, Ms. Smith served as Assistant Treasurer (2013-2019) and Deputy Treasurer (2013-2016) of certain Fidelity® funds.
Marc L. Spector (1972)
Year of Election or Appointment: 2016
Deputy Treasurer
Mr. Spector also serves as an officer of other funds. Mr. Spector serves as Assistant Treasurer of FMR Capital, Inc. (2017-present) and is an employee of Fidelity Investments (2016-present). Prior to joining Fidelity Investments, Mr. Spector served as Director at the Siegfried Group (accounting firm, 2013-2016), and prior to Siegfried Group as audit senior manager at Deloitte & Touche LLP (accounting firm, 2005-2013).
Jim Wegmann (1979)
Year of Election or Appointment: 2019
Assistant Treasurer
Mr. Wegmann also serves as Assistant Treasurer of other funds. Mr. Wegmann is an employee of Fidelity Investments (2011-present).
Vadim Zlotnikov (1962)
Year of Election or Appointment: 2019
Vice President
Mr. Zlotnikov also serves as Vice President of other funds. Mr. Zlotnikov serves as President of FIAM (Fidelity Institutional Asset Management) and is an employee of Fidelity Investments (2018-present). Previously, Mr. Zlotnikov served as President and Chief Investment Officer of Global Asset Allocation (2018-2020). Prior to joining Fidelity Investments, Mr. Zlotnikov served as Co-Head of Multi-Asset Solutions, Chief Market Strategist, and CIO of Systematic Strategies with AllianceBernstein (investment adviser firm, 2002-2018).
Shareholder Expense Example
As a shareholder, you incur two types of costs: (1) transaction costs, which may include sales charges (loads) on purchase payments or redemption proceeds, as applicable and (2) ongoing costs, which generally include management fees, distribution and/or service (12b-1) fees and other Fund expenses. This Example is intended to help you understand your ongoing costs (in dollars) of investing in a fund and to compare these costs with the ongoing costs of investing in other mutual funds.
The Example is based on an investment of $1,000 invested at the beginning of the period and held for the entire period (July 1, 2020 to December 31, 2020).
Actual Expenses
The first line of the accompanying table provides information about actual account values and actual expenses. You may use the information in this line, together with the amount you invested, to estimate the expenses that you paid over the period. Simply divide your account value by $1,000.00 (for example, an $8,600 account value divided by $1,000.00 = 8.6), then multiply the result by the number in the first line for a class/Fund under the heading entitled "Expenses Paid During Period" to estimate the expenses you paid on your account during this period. If any fund is a shareholder of any underlying mutual funds or exchange-traded funds (ETFs) (the Underlying Funds), such fund indirectly bears its proportional share of the expenses of the Underlying Funds in addition to the direct expenses incurred presented in the table. These fees and expenses are not included in the annualized expense ratio used to calculate the expense estimate in the table below. The estimate of expenses does not include any fees or other expenses of any variable annuity or variable life insurance product. If they were, the estimate of expenses you paid during the period would be higher, and your ending account value would be lower.
Hypothetical Example for Comparison Purposes
The second line of the accompanying table provides information about hypothetical account values and hypothetical expenses based on the actual expense ratio and an assumed rate of return of 5% per year before expenses, which is not the actual return. The hypothetical account values and expenses may not be used to estimate the actual ending account balance or expenses you paid for the period. You may use this information to compare the ongoing costs of investing in the Fund and other funds. To do so, compare this 5% hypothetical example with the 5% hypothetical examples that appear in the shareholder reports of the other funds. If any fund is a shareholder of any Underlying Funds, such fund indirectly bears its proportional share of the expenses of the Underlying Funds in addition to the direct expenses as presented in the table. These fees and expenses are not included in the annualized expense ratio used to calculate the expense estimate in the table below. The estimate of expenses does not include any fees or other expenses of any variable annuity or variable life insurance product. If they were, the estimate of expenses you paid during the period would be higher, and your ending account value would be lower.
Please note that the expenses shown in the table are meant to highlight your ongoing costs only and do not reflect any transaction costs. Therefore, the second line of the table is useful in comparing ongoing costs only, and will not help you determine the relative total costs of owning different funds.
| | Annualized Expense Ratio-A | Beginning
Account Value
July 1, 2020 | Ending
Account Value
December 31, 2020 | Expenses Paid
During Period-B
July 1, 2020
to December 31, 2020 |
| VIP Strategic Income Portfolio | | | | |
| Initial Class | .66% | | | |
| Actual | | $1,000.00 | $1,083.80 | $3.46 |
| Hypothetical-C | | $1,000.00 | $1,021.82 | $3.35 |
| Service Class | .75% | | | |
| Actual | | $1,000.00 | $1,084.30 | $3.93 |
| Hypothetical-C | | $1,000.00 | $1,021.37 | $3.81 |
| Service Class 2 | .91% | | | |
| Actual | | $1,000.00 | $1,083.10 | $4.76 |
| Hypothetical-C | | $1,000.00 | $1,020.56 | $4.62 |
| Investor Class | .69% | | | |
| Actual | | $1,000.00 | $1,084.70 | $3.62 |
| Hypothetical-C | | $1,000.00 | $1,021.67 | $3.51 |
A Annualized expense ratio reflects expenses net of applicable fee waivers.
B Expenses are equal to the annualized expense ratio, multiplied by the average account value over the period, multiplied by 184/ 366 (to reflect the one-half year period). The fees and expenses of any Underlying Funds are not included in each annualized expense ratio.
C 5% return per year before expenses
Distributions (Unaudited)
The Board of Trustees of VIP Strategic Income Portfolio voted to pay to shareholders of record at the opening of business on record date, the following distributions per share derived from capital gains realized from sales of portfolio securities:
| | Pay Date | Record Date | Capital Gains |
| VIP Strategic Income Portfolio | | | |
| Initial Class | 02/12/21 | 02/12/21 | $0.015 |
| Service Class | 02/12/21 | 02/12/21 | $0.015 |
| Service Class 2 | 02/12/21 | 02/12/21 | $0.014 |
| Investor Class | 02/12/21 | 02/12/21 | $0.015 |
|
The fund hereby designates as a capital gain dividend with respect to the taxable year ended December 31, 2020, $5,841,629, or, if subsequently determined to be different, the net capital gain of such year.
A total of 7.56% of the dividends distributed during the fiscal year was derived from interest on U.S. Government securities which is generally exempt from state income tax.
Initial Class, Service Class, Service Class 2, and Investor Class designate 1% of the dividends distributed during the fiscal year as qualifying for the dividends–received deduction for corporate shareholders.
Board Approval of Investment Advisory Contracts and Management Fees
VIP Strategic Income Portfolio
Each year, the Board of Trustees, including the Independent Trustees (together, the Board), votes on the renewal of the management contract with Fidelity Management & Research Company LLC (FMR) and the sub-advisory agreements (together, the Advisory Contracts) for the fund. FMR and the sub-advisers are referred to herein as the Investment Advisers. The Board, assisted by the advice of fund counsel and Independent Trustees' counsel, requests and considers a broad range of information relevant to the renewal of the Advisory Contracts throughout the year.
The Board meets regularly and, at each of its meetings, covers an extensive agenda of topics and materials and considers factors that are relevant to its annual consideration of the renewal of the fund's Advisory Contracts, including the services and support provided to the fund and its shareholders. The Board has established four standing committees (Committees) — Operations, Audit, Fair Valuation, and Governance and Nominating — each composed of and chaired by Independent Trustees with varying backgrounds, to which the Board has assigned specific subject matter responsibilities in order to enhance effective decision-making by the Board. The Operations Committee, of which all of the Independent Trustees are members, meets regularly throughout the year and considers, among other matters, information specifically related to the annual consideration of the renewal of the fund's Advisory Contracts. The Board, acting directly and through its Committees, requests and receives information concerning the annual consideration of the renewal of the fund's Advisory Contracts. The Board also meets as needed to review matters specifically related to the Board's annual consideration of the renewal of the Advisory Contracts. Members of the Board may also meet with trustees of other Fidelity funds through joint ad hoc committees to discuss certain matters relevant to all of the Fidelity funds.
At its September 2020 meeting, the Board unanimously determined to renew the fund's Advisory Contracts. In reaching its determination, the Board considered all factors it believed relevant, including (i) the nature, extent, and quality of the services provided to the fund and its shareholders (including the investment performance of the fund); (ii) the competitiveness of the fund's management fee and total expense ratio relative to peer funds; (iii) the total costs of the services provided by and the profits realized by Fidelity from its relationships with the fund; and (iv) the extent to which, if any, economies of scale exist and are realized as the fund grows, and whether any economies of scale are appropriately shared with fund shareholders.
In considering whether to renew the Advisory Contracts for the fund, the Board reached a determination, with the assistance of fund counsel and Independent Trustees' counsel and through the exercise of its business judgment, that the renewal of the Advisory Contracts was in the best interests of the fund and its shareholders and that the compensation payable under the Advisory Contracts was fair and reasonable. The Board's decision to renew the Advisory Contracts was not based on any single factor, but rather was based on a comprehensive consideration of all the information provided to the Board at its meetings throughout the year. The Board, in reaching its determination to renew the Advisory Contracts, was aware that shareholders of the fund have a broad range of investment choices available to them, including a wide choice among funds offered by Fidelity's competitors, and that the fund's shareholders, who have the opportunity to review and weigh the disclosure provided by the fund in its prospectus and other public disclosures, have chosen to invest in this fund, which is part of the Fidelity family of funds.
Nature, Extent, and Quality of Services Provided. The Board considered Fidelity's staffing as it relates to the fund, including the backgrounds of investment personnel of Fidelity, and also considered the fund's investment objective, strategies, and related investment philosophy. The Independent Trustees also had discussions with senior management of Fidelity's investment operations and investment groups. The Board considered the structure of the investment personnel compensation program and whether this structure provides appropriate incentives to act in the best interests of the fund. Additionally, the Board considered the portfolio managers' investments, if any, in the funds that they manage.
Resources Dedicated to Investment Management and Support Services. The Board reviewed the general qualifications and capabilities of Fidelity's investment staff, including its size, education, experience, and resources, as well as Fidelity's approach to recruiting, managing, and compensating investment personnel. The Board noted that Fidelity has continued to increase the resources devoted to non-U.S. offices, including expansion of Fidelity's global investment organization. The Board also noted that Fidelity's analysts have extensive resources, tools and capabilities that allow them to conduct sophisticated quantitative and fundamental analysis, as well as credit analysis of issuers, counterparties and guarantors. Further, the Board considered that Fidelity's investment professionals have sufficient access to global information and data so as to provide competitive investment results over time, and that those professionals also have access to sophisticated tools that permit them to assess portfolio construction and risk and performance attribution characteristics continuously, as well as to transmit new information and research conclusions rapidly around the world. Additionally, in its deliberations, the Board considered Fidelity's trading, risk management, compliance, and technology and operations capabilities and resources, which are integral parts of the investment management process. The Board also considered Fidelity's investments in business continuity planning, and its success in continuously providing services to the fund notwithstanding the severe disruptions caused by the COVID-19 pandemic.
Shareholder and Administrative Services. The Board considered (i) the nature, extent, quality, and cost of advisory, administrative, and shareholder services performed by the Investment Advisers and their affiliates under the Advisory Contracts and under separate agreements covering transfer agency, pricing and bookkeeping, and securities lending services for the fund; (ii) the nature and extent of the supervision of third party service providers, principally custodians, subcustodians, and pricing vendors; and (iii) the resources devoted to, and the record of compliance with, the fund's compliance policies and procedures. The Board also reviewed the allocation of fund brokerage, including allocations to brokers affiliated with the Investment Advisers, the use of brokerage commissions to pay fund expenses, and the use of "soft" commission dollars to pay for research services.
The Board noted that the growth of fund assets over time across the complex allows Fidelity to reinvest in the development of services designed to enhance the value and convenience of the Fidelity funds as investment vehicles. These services include 24-hour access to account information and market information over the Internet and through telephone representatives, investor education materials and asset allocation tools, and the expanded availability of Fidelity Investor Centers.
Investment in a Large Fund Family. The Board considered the benefits to shareholders of investing in a Fidelity fund, including the benefits of investing in a fund that is part of a large family of funds offering a variety of investment disciplines and providing a large variety of mutual fund investor services. The Board noted that Fidelity had taken, or had made recommendations that resulted in the Fidelity funds taking, a number of actions over the previous year that benefited particular funds, including: (i) continuing to dedicate additional resources to Fidelity's investment research process, which includes meetings with management of issuers of securities in which the funds invest, and to the support of the senior management team that oversees asset management; (ii) continuing efforts to enhance Fidelity's global research capabilities; (iii) launching new funds and ETFs with innovative structures, strategies and pricing and making other enhancements to meet client needs; (iv) launching new share classes of existing funds; (v) eliminating purchase minimums and broadening eligibility requirements for certain funds and share classes; (vi) reducing management fees and total expenses for certain target date funds or classes and index funds; (vii) lowering expenses for certain funds and classes by implementing or lowering expense caps; (viii) rationalizing product lines and gaining increased efficiencies from fund mergers, liquidations, and share class consolidations; (ix) continuing to develop, acquire and implement systems and technology to improve services to the funds and shareholders, strengthen information security, and increase efficiency; and (x) continuing to implement enhancements to further strengthen Fidelity's product line to increase investors' probability of success in achieving their investment goals, including retirement income goals.
Investment Performance. The Board considered whether the fund has operated in accordance with its investment objective, as well as its record of compliance with its investment restrictions and its performance history. The Board noted that there were portfolio management changes for the fund in October 2019 and April 2020.
The Board took into account discussions that occur at Board meetings throughout the year with representatives of the Investment Advisers about fund investment performance. In this regard the Board noted that as part of regularly scheduled fund reviews and other reports to the Board on fund performance, the Board considers annualized return information for the fund for different time periods, measured against one or more appropriate securities market indices, including a customized blended index that reflects the respective weights of the fund's asset classes (each a benchmark index) and an appropriate peer group of funds with similar objectives (peer group). In its evaluation of fund investment performance at meetings throughout the year, the Board gave particular attention to information indicating underperformance of certain Fidelity funds for specific time periods and discussed with the Investment Advisers the reasons for such underperformance.
In addition to reviewing absolute and relative fund performance, the Independent Trustees periodically consider the appropriateness of fund performance metrics in evaluating the results achieved. In general, the Independent Trustees believe that fund performance should be evaluated based on gross performance (before fees and expenses but after transaction costs) compared to appropriate benchmark indices, over appropriate time periods that may include full market cycles, and on net performance (after fees and expenses) compared to appropriate peer groups, as applicable, over the same periods, taking into account relevant factors including the following: general market conditions; expectations for interest rate levels and credit conditions; issuer-specific information including credit quality; and fund cash flows and other factors. The Independent Trustees generally give greater weight to fund performance over longer time periods than over shorter time periods. Depending on the circumstances, the Independent Trustees may be satisfied with a fund's performance notwithstanding that it lags its benchmark index or peer group for certain periods.
The Independent Trustees recognize that shareholders evaluate performance on a net basis over their own holding periods, for which one-, three-, and five-year periods are often used as a proxy. For this reason, the performance information reviewed by the Board also included net cumulative calendar year total return information for the fund and an appropriate benchmark index and peer group for the most recent one-, three-, and five-year periods. The Independent Trustees recognize that shareholders who are not investing through a tax-advantaged retirement account also consider tax consequences in evaluating performance.
Based on its review, the Board concluded that the nature, extent, and quality of services provided to the fund under the Advisory Contracts should continue to benefit the shareholders of the fund.
Competitiveness of Management Fee and Total Expense Ratio. The Board considered the fund's management fee and total expense ratio compared to "mapped groups" of competitive funds and classes created for the purpose of facilitating the Trustees' competitive analysis of management fees and total expenses. Fidelity creates "mapped groups" by combining similar Lipper investment objective categories that have comparable investment mandates. Combining Lipper investment objective categories aids the Board's management fee and total expense ratio comparisons by broadening the competitive group used for comparison.
Management Fee. The Board considered two proprietary management fee comparisons for the 12-month periods shown in basis points (BP) in the chart below. The group of Lipper funds used by the Board for management fee comparisons is referred to below as the "Total Mapped Group." The Total Mapped Group comparison focuses on a fund's standing in terms of gross management fees before expense reimbursements or caps relative to the total universe of funds with comparable investment mandates, regardless of whether their management fee structures also are comparable. Funds with comparable investment mandates offer exposure to similar types of securities. Funds with comparable management fee structures have similar management fee contractual arrangements (
e.g., flat rate charged for advisory services, all-inclusive fee rate,
etc.). "TMG %" represents the percentage of funds in the Total Mapped Group that had management fees that were lower than the fund's. For example, a hypothetical TMG % of 20% would mean that 80% of the funds in the Total Mapped Group had higher, and 20% had lower, management fees than the fund. The fund's actual TMG %s and the number of funds in the Total Mapped Group are in the chart below. The "Asset-Sized Peer Group" (ASPG) comparison focuses on a fund's standing relative to a subset of non-Fidelity funds within the Total Mapped Group that are similar in size and management fee structure. For example, if a fund is in the first quartile of the ASPG, the fund's management fee ranks in the least expensive or lowest 25% of funds in the ASPG. The ASPG represents at least 15% of the funds in the Total Mapped Group with comparable asset size and management fee structures, subject to a minimum of 50 funds (or all funds in the Total Mapped Group if fewer than 50). Additional information, such as the ASPG quartile in which the fund's management fee rate ranked, is also included in the chart and was considered by the Board.
VIP Strategic Income Portfolio
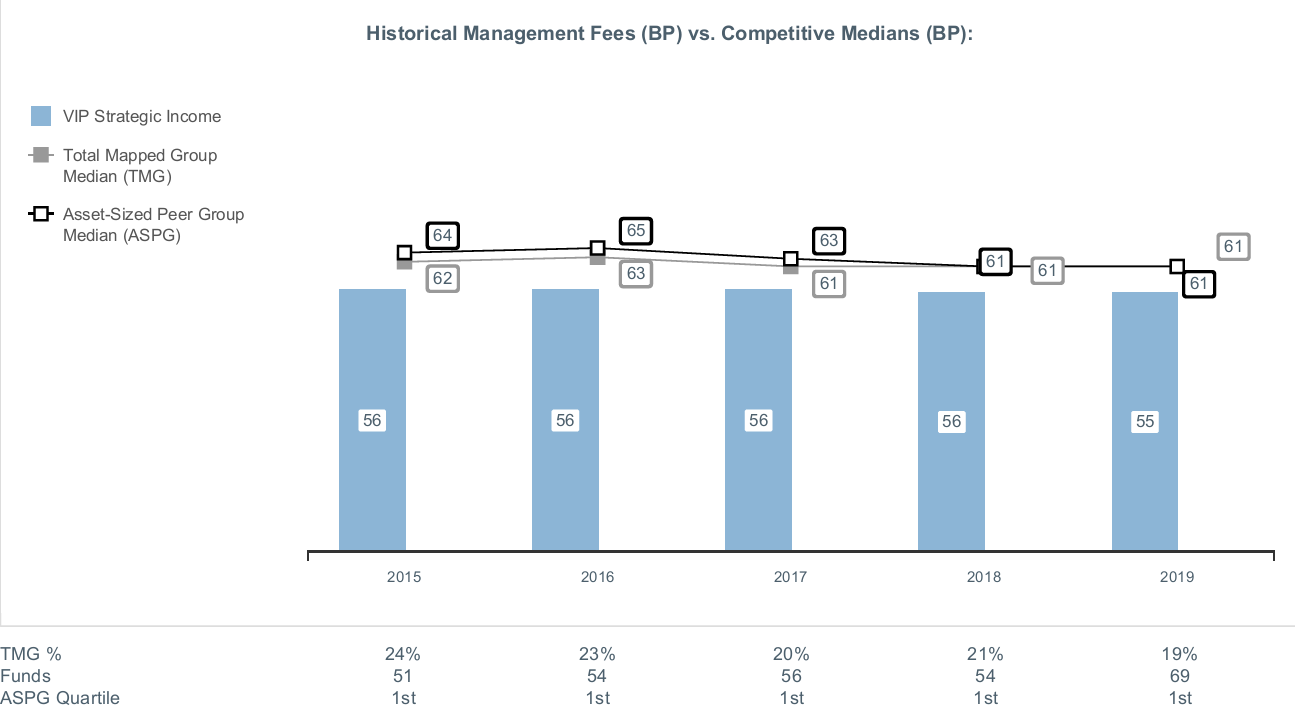
The Board noted that the fund's management fee rate ranked below the median of its Total Mapped Group and below the median of its ASPG for 2019.
The Board noted that it and the boards of other Fidelity funds formed an ad hoc Committee on Group Fee, which meets periodically, to conduct an in-depth review of the "group fee" component of the management fee of funds with such management fee structures. The Committee's focus included the mechanics of the group fee, the competitive landscape of group fee structures, Fidelity funds with no group fee component and investment products not included in group fee assets. The Board also considered that, for funds subject to the group fee, FMR agreed to voluntarily waive fees over a specified period of time in amounts designed to account for assets converted from certain funds to certain collective investment trusts.
Based on its review, the Board concluded that the fund's management fee is fair and reasonable in light of the services that the fund receives and the other factors considered.
Total Expense Ratio. In its review of each class's total expense ratio, the Board considered the fund's management fee rate as well as other fund or class expenses, as applicable, such as transfer agent fees, pricing and bookkeeping fees, fund-paid 12b-1 fees, and custodial, legal, and audit fees. The Board also noted that Fidelity may agree to waive fees or reimburse expenses from time to time, and the extent to which, if any, it has done so for the fund. As part of its review, the Board also considered the current and historical total expense ratios of each class of the fund compared to competitive fund median expenses. Each class of the fund is compared to those funds and classes in the Total Mapped Group (used by the Board for management fee comparisons) that have a similar sales load structure.
The Board noted that the total expense ratio of each of Initial Class, Investor Class, and Service Class ranked below the competitive median for 2019 and the total expense ratio of Service Class 2 ranked above the competitive median for 2019. The Board considered that, in general, various factors can affect total expense ratios. The Board noted that the total expense ratio of Service Class 2 was above the competitive median because of its 12b-1 fees and that excluding 12b-1 fees of both the class and competitor classes, the total expense ratio of Service Class 2 ranked below the median. The Board noted that the fund offers multiple classes, each of which has a different 12b-1 fee structure, and that the multiple structures are intended to offer a range of pricing options for the intermediary market. The Board also noted that the total expense ratios of the classes vary primarily by the level of their 12b-1 fees, although differences in transfer agent fees may also cause expenses to vary from class to class.
Fees Charged to Other Fidelity Clients. The Board also considered Fidelity fee structures and other information with respect to clients of Fidelity, such as other funds advised or subadvised by Fidelity, pension plan clients, and other institutional clients with similar mandates. The Board noted that a joint ad hoc committee created by it and the boards of other Fidelity funds periodically reviews and compares Fidelity's institutional investment advisory business with its business of providing services to the Fidelity funds and also noted the most recent findings of the committee. The Board noted that the committee's review included a consideration of the differences in services provided, fees charged, and costs incurred, as well as competition in the markets serving the different categories of clients.
Based on its review of total expense ratios and fees charged to other Fidelity clients, the Board concluded that the total expense ratio of each class of the fund was reasonable in light of the services that the fund and its shareholders receive and the other factors considered.
Costs of the Services and Profitability. The Board considered the revenues earned and the expenses incurred by Fidelity in conducting the business of developing, marketing, distributing, managing, administering and servicing the fund and servicing the fund's shareholders. The Board also considered the level of Fidelity's profits in respect of all the Fidelity funds.
On an annual basis, Fidelity presents to the Board information about the profitability of its relationships with the fund. Fidelity calculates profitability information for each fund, as well as aggregate profitability information for groups of Fidelity funds and all Fidelity funds, using a series of detailed revenue and cost allocation methodologies which originate with the books and records of Fidelity on which Fidelity's audited financial statements are based. The Audit Committee of the Board reviews any significant changes from the prior year's methodologies and the full Board approves such changes.
A public accounting firm has been engaged annually by the Board as part of the Board's assessment of Fidelity's profitability analysis. The engagement includes the review and assessment of the methodologies used by Fidelity in determining the revenues and expenses attributable to Fidelity's mutual fund business, and completion of agreed-upon procedures in respect of the mathematical accuracy of certain fund profitability information and its conformity to established allocation methodologies. After considering the reports issued under the engagement and information provided by Fidelity, the Board concluded that while other allocation methods may also be reasonable, Fidelity's profitability methodologies are reasonable in all material respects.
The Board also reviewed Fidelity's non-fund businesses and potential indirect benefits such businesses may have received as a result of their association with Fidelity's mutual fund business (i.e., fall-out benefits) as well as cases where Fidelity's affiliates may benefit from the funds' business. The Board considered areas where potential indirect benefits to the Fidelity funds from their relationships with Fidelity may exist. The Board also considered that in 2019 a joint ad hoc committee created by it and the boards of other Fidelity funds evaluated potential fall-out benefits (PFOB Committee). The Board noted that it considered the PFOB Committee's findings in connection with its consideration of the renewal of the Advisory Contracts.
The Board considered the costs of the services provided by and the profits realized by Fidelity in connection with the operation of the fund, including the conclusions of the PFOB Committee, and was satisfied that the profitability was not excessive.
Economies of Scale. The Board considered whether there have been economies of scale in respect of the management of the Fidelity funds, whether the Fidelity funds (including the fund) have appropriately benefited from any such economies of scale, and whether there is potential for realization of any further economies of scale. The Board considered the extent to which the fund will benefit from economies of scale as assets grow through increased services to the fund, through waivers or reimbursements, or through fee or expense ratio reductions. The Board also noted that a committee (the Economies of Scale Committee) created by it and the boards of other Fidelity funds periodically analyzes whether Fidelity attains economies of scale in respect of the management and servicing of the Fidelity funds, whether the Fidelity funds have appropriately benefited from such economies of scale, and whether there is potential for realization of any further economies of scale.
The Board recognized that the fund's management contract incorporates a "group fee" structure, which provides for lower group fee rates as total "group assets" increase, and for higher group fee rates as total "group assets" decrease ("group assets" as defined in the management contract). FMR calculates the group fee rates based on a tiered asset "breakpoint" schedule that varies based on asset class. The Board considered that the group fee is designed to deliver the benefits of economies of scale to fund shareholders when total Fidelity fund assets increase, even if assets of any particular fund are unchanged or have declined, because some portion of Fidelity's costs are attributable to services provided to all Fidelity funds, and all funds benefit if those costs can be allocated among more assets. The Board concluded that, given the group fee structure, fund shareholders will benefit from lower management fees as "group assets" increase at the fund complex level, regardless of whether Fidelity achieves any such economies of scale.
The Board concluded, taking into account the analysis of the Economies of Scale Committee, that economies of scale, if any, are being appropriately shared between fund shareholders and Fidelity.
Additional Information Requested by the Board. In order to develop fully the factual basis for consideration of the Fidelity funds' advisory contracts, the Board requested and received additional information on certain topics, including: (i) Fidelity's fund profitability methodology, profitability trends for certain funds, the allocation of various costs to different funds, and the impact of certain factors on fund profitability results; (ii) portfolio manager changes that have occurred during the past year and the amount of the investment that each portfolio manager has made in the Fidelity fund(s) that he or she manages; (iii) Fidelity's compensation structure for portfolio managers, research analysts, and other key personnel, including its effects on fund profitability, the rationale for the compensation structure, and the extent to which current market conditions have affected retention and recruitment; (iv) the arrangements with and compensation paid to certain fund sub-advisers on behalf of the Fidelity funds and the treatment of such compensation within Fidelity's fund profitability methodology; (v) the terms of the funds' various management fee structures, including the basic group fee and the terms of Fidelity's voluntary expense limitation agreements; (vi) Fidelity's transfer agent fee, expense, and service structures for different funds and classes relative to competitive trends; (vii) the impact on fund profitability of recent industry trends, such as the growth in passively managed funds and outflows from actively managed equity funds; and (viii) explanations regarding the relative total expense ratios of certain funds and classes, total expense competitive trends and methodologies for total expense competitive comparisons, and actions that might be taken by Fidelity to reduce total expense ratios for certain classes. In addition, the Board considered its discussions with Fidelity regarding Fidelity's efforts to maintain the continuous investment and shareholder services necessary for the funds during the current pandemic and economic circumstances.
Based on its evaluation of all of the conclusions noted above, and after considering all factors it believed relevant, the Board concluded that the advisory fee arrangements are fair and reasonable, and that the fund's Advisory Contracts should be renewed.
VIPSI-ANN-0221
1.796350.118
Fidelity® Variable Insurance Products:
Freedom Funds - Income, 2005, 2010, 2015, 2020, 2025, 2030, 2035, 2040, 2045, 2050, 2055, 2060, 2065
Annual Report
December 31, 2020
Contents
To view a fund's proxy voting guidelines and proxy voting record for the 12-month period ended June 30, visit http://www.fidelity.com/proxyvotingresults or visit the Securities and Exchange Commission's (SEC) web site at http://www.sec.gov.
You may also call 1-877-208-0098 to request a free copy of the proxy voting guidelines.
Fidelity® Variable Insurance Products are separate account options which are purchased through a variable insurance contract.
Standard & Poor's, S&P and S&P 500 are registered service marks of The McGraw-Hill Companies, Inc. and have been licensed for use by Fidelity Distributors Corporation.
Other third-party marks appearing herein are the property of their respective owners.
All other marks appearing herein are registered or unregistered trademarks or service marks of FMR LLC or an affiliated company. © 2021 FMR LLC. All rights reserved.
This report and the financial statements contained herein are submitted for the general information of the shareholders of the Funds. This report is not authorized for distribution to prospective investors in the Funds unless preceded or accompanied by an effective prospectus.
A fund files its complete schedule of portfolio holdings with the SEC for the first and third quarters of each fiscal year on Form N-PORT. Forms N-PORT are available on the SEC’s web site at http://www.sec.gov. A fund's Forms N-PORT may be reviewed and copied at the SEC’s Public Reference Room in Washington, DC. Information regarding the operation of the SEC's Public Reference Room may be obtained by calling 1-800-SEC-0330.
For a complete list of a fund's portfolio holdings, view the most recent holdings listing, semiannual report, or annual report on Fidelity's web site at http://www.fidelity.com, http://www.institutional.fidelity.com, or http://www.401k.com, as applicable.
NOT FDIC INSURED •MAY LOSE VALUE •NO BANK GUARANTEE
Neither the Funds nor Fidelity Distributors Corporation is a bank.
Note to Shareholders:
Early in 2020, the outbreak and spread of a new coronavirus emerged as a public health emergency that had a major influence on financial markets, primarily based on its impact on the global economy and the outlook for corporate earnings. The virus causes a respiratory disease known as COVID-19. On March 11, the World Health Organization declared the COVID-19 outbreak a pandemic, citing sustained risk of further global spread.
In the weeks following, as the crisis worsened, we witnessed an escalating human tragedy with wide-scale social and economic consequences from coronavirus-containment measures. The outbreak of COVID-19 prompted a number of measures to limit the spread, including travel and border restrictions, quarantines, and restrictions on large gatherings. In turn, these resulted in lower consumer activity, diminished demand for a wide range of products and services, disruption in manufacturing and supply chains, and – given the wide variability in outcomes regarding the outbreak – significant market uncertainty and volatility. Amid the turmoil, global governments and central banks took unprecedented action to help support consumers, businesses, and the broader economies, and to limit disruption to financial systems.
The situation continues to unfold, and the extent and duration of its impact on financial markets and the economy remain highly uncertain. Extreme events such as the coronavirus crisis are “exogenous shocks” that can have significant adverse effects on mutual funds and their investments. Although multiple asset classes may be affected by market disruption, the duration and impact may not be the same for all types of assets.
Fidelity is committed to helping you stay informed amid news about COVID-19 and during increased market volatility, and we’re taking extra steps to be responsive to customer needs. We encourage you to visit our websites, where we offer ongoing updates, commentary, and analysis on the markets and our funds.
VIP Freedom Income Portfolio℠
Performance: The Bottom Line
Average annual total return reflects the change in the value of an investment, assuming reinvestment of distributions from dividend income and capital gains (the profits earned upon the sale of securities that have grown in value, if any) and assuming a constant rate of performance each year. During periods of reimbursement by Fidelity, a fund’s total return will be greater than it would be had the reimbursement not occurred. Performance numbers are net of all underlying fund operating expenses, but do not include any insurance charges imposed by your insurance company’s separate account. If performance information included the effect of these additional charges, the total returns would have been lower. How a fund did yesterday is no guarantee of how it will do tomorrow.
Average Annual Total Returns
| Periods ended December 31, 2020 | Past 1 year | Past 5 years | Past 10 years |
| Initial Class | 10.47% | 6.57% | 4.97% |
| Service Class | 10.38% | 6.47% | 4.87% |
| Service Class 2 | 10.29% | 6.31% | 4.71% |
$10,000 Over 10 Years
Let's say hypothetically that $10,000 was invested in VIP Freedom Income Portfolio℠ - Initial Class on December 31, 2010.
The chart shows how the value of your investment would have changed, and also shows how the Bloomberg Barclays U.S. Aggregate Bond Index performed over the same period.
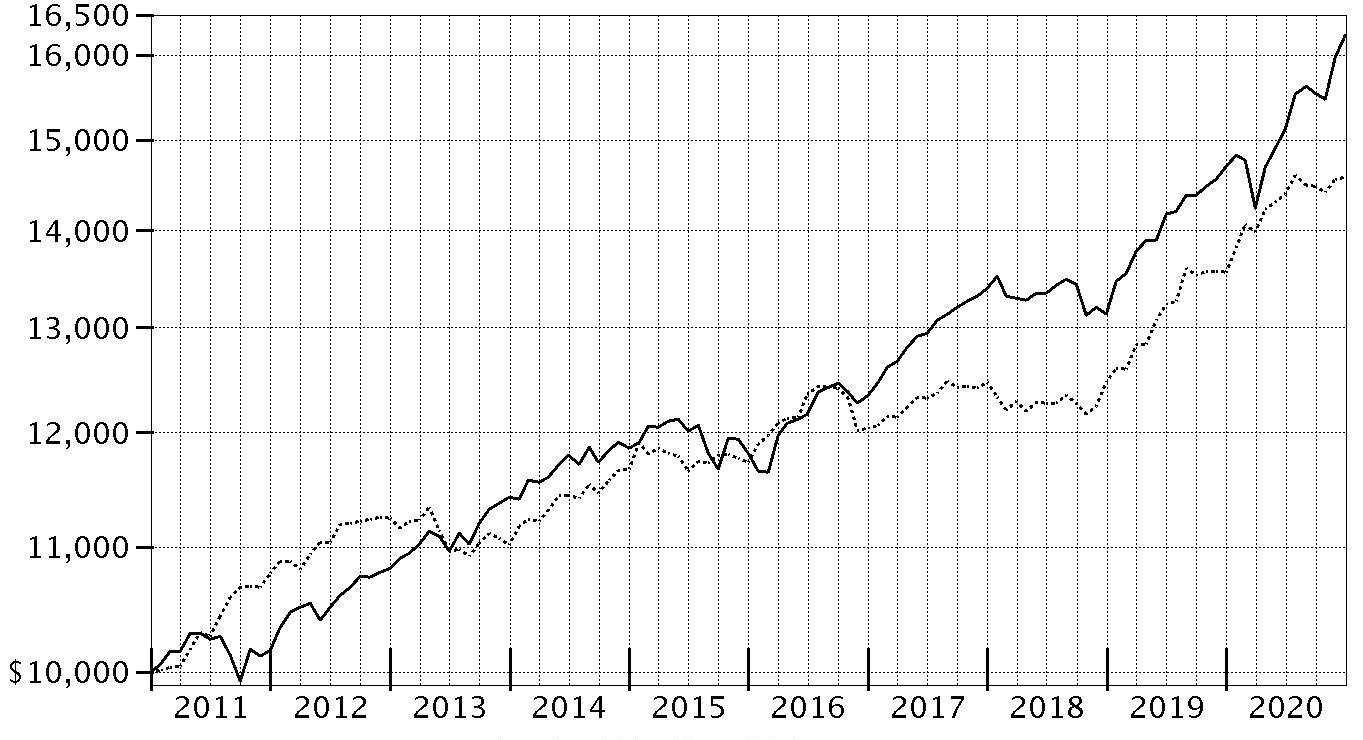
| Period Ending Values |
| $16,243 | VIP Freedom Income Portfolio℠ - Initial Class |
| $14,576 | Bloomberg Barclays U.S. Aggregate Bond Index |
VIP Freedom 2005 Portfolio℠
Performance: The Bottom Line
Average annual total return reflects the change in the value of an investment, assuming reinvestment of distributions from dividend income and capital gains (the profits earned upon the sale of securities that have grown in value, if any) and assuming a constant rate of performance each year. During periods of reimbursement by Fidelity, a fund’s total return will be greater than it would be had the reimbursement not occurred. Performance numbers are net of all underlying fund operating expenses, but do not include any insurance charges imposed by your insurance company’s separate account. If performance information included the effect of these additional charges, the total returns would have been lower. How a fund did yesterday is no guarantee of how it will do tomorrow.
Average Annual Total Returns
| Periods ended December 31, 2020 | Past 1 year | Past 5 years | Past 10 years |
| Initial Class | 11.25% | 7.46% | 6.03% |
| Service Class | 11.07% | 7.34% | 5.91% |
| Service Class 2 | 10.93% | 7.19% | 5.77% |
$10,000 Over 10 Years
Let's say hypothetically that $10,000 was invested in VIP Freedom 2005 Portfolio℠ - Initial Class on December 31, 2010.
The chart shows how the value of your investment would have changed, and also shows how the Bloomberg Barclays U.S. Aggregate Bond Index performed over the same period.

| Period Ending Values |
| $17,955 | VIP Freedom 2005 Portfolio℠ - Initial Class |
| $14,576 | Bloomberg Barclays U.S. Aggregate Bond Index |
VIP Freedom 2010 Portfolio℠
Performance: The Bottom Line
Average annual total return reflects the change in the value of an investment, assuming reinvestment of distributions from dividend income and capital gains (the profits earned upon the sale of securities that have grown in value, if any) and assuming a constant rate of performance each year. During periods of reimbursement by Fidelity, a fund’s total return will be greater than it would be had the reimbursement not occurred. Performance numbers are net of all underlying fund operating expenses, but do not include any insurance charges imposed by your insurance company’s separate account. If performance information included the effect of these additional charges, the total returns would have been lower. How a fund did yesterday is no guarantee of how it will do tomorrow.
Average Annual Total Returns
| Periods ended December 31, 2020 | Past 1 year | Past 5 years | Past 10 years |
| Initial Class | 12.49% | 8.37% | 7.03% |
| Service Class | 12.39% | 8.26% | 6.93% |
| Service Class 2 | 12.24% | 8.10% | 6.77% |
$10,000 Over 10 Years
Let's say hypothetically that $10,000 was invested in VIP Freedom 2010 Portfolio℠ - Initial Class on December 31, 2010.
The chart shows how the value of your investment would have changed, and also shows how the Bloomberg Barclays U.S. Aggregate Bond Index performed over the same period.

| Period Ending Values |
| $19,727 | VIP Freedom 2010 Portfolio℠ - Initial Class |
| $14,576 | Bloomberg Barclays U.S. Aggregate Bond Index |
VIP Freedom 2015 Portfolio℠
Performance: The Bottom Line
Average annual total return reflects the change in the value of an investment, assuming reinvestment of distributions from dividend income and capital gains (the profits earned upon the sale of securities that have grown in value, if any) and assuming a constant rate of performance each year. During periods of reimbursement by Fidelity, a fund’s total return will be greater than it would be had the reimbursement not occurred. Performance numbers are net of all underlying fund operating expenses, but do not include any insurance charges imposed by your insurance company’s separate account. If performance information included the effect of these additional charges, the total returns would have been lower. How a fund did yesterday is no guarantee of how it will do tomorrow.
Average Annual Total Returns
| Periods ended December 31, 2020 | Past 1 year | Past 5 years | Past 10 years |
| Initial Class | 13.76% | 9.27% | 7.60% |
| Service Class | 13.62% | 9.16% | 7.49% |
| Service Class 2 | 13.56% | 8.99% | 7.34% |
$10,000 Over 10 Years
Let's say hypothetically that $10,000 was invested in VIP Freedom 2015 Portfolio℠ - Initial Class on December 31, 2010.
The chart shows how the value of your investment would have changed, and also shows how the Bloomberg Barclays U.S. Aggregate Bond Index performed over the same period.
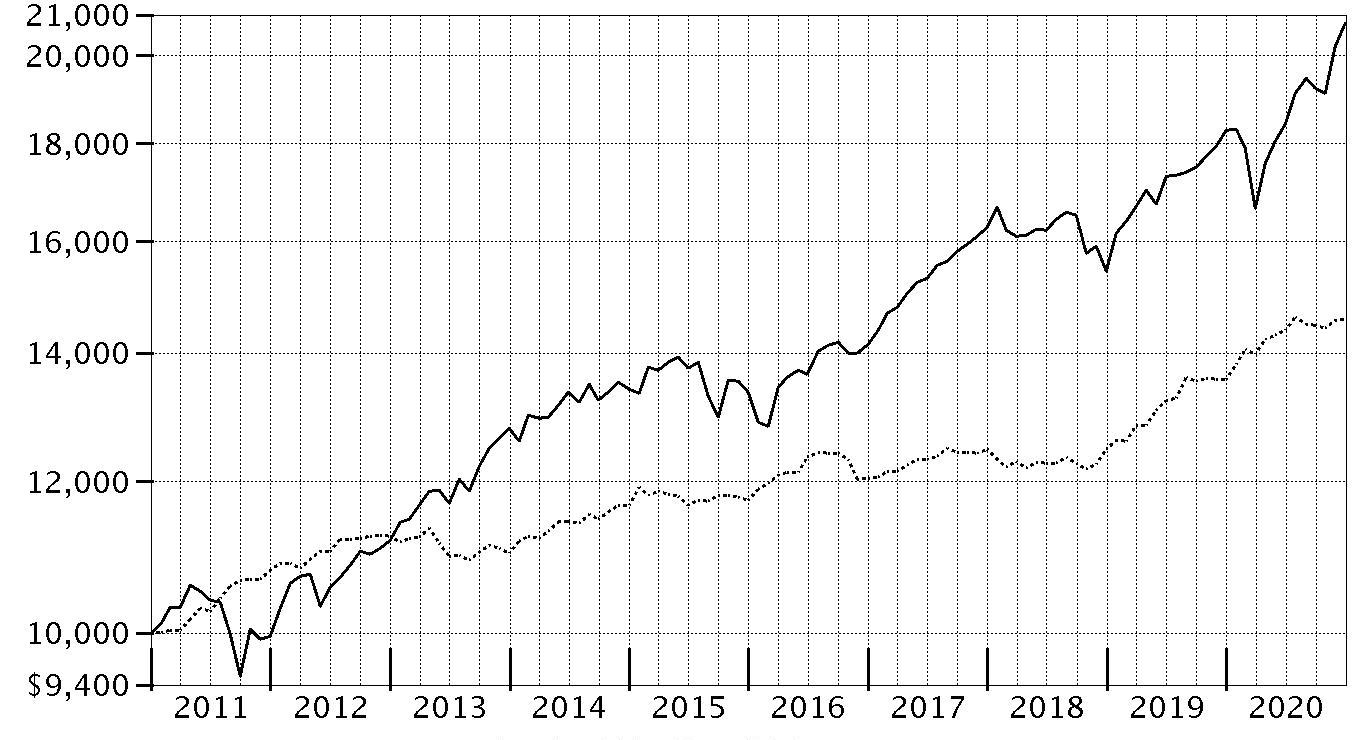
| Period Ending Values |
| $20,802 | VIP Freedom 2015 Portfolio℠ - Initial Class |
| $14,576 | Bloomberg Barclays U.S. Aggregate Bond Index |
VIP Freedom 2020 Portfolio℠
Performance: The Bottom Line
Average annual total return reflects the change in the value of an investment, assuming reinvestment of distributions from dividend income and capital gains (the profits earned upon the sale of securities that have grown in value, if any) and assuming a constant rate of performance each year. During periods of reimbursement by Fidelity, a fund’s total return will be greater than it would be had the reimbursement not occurred. Performance numbers are net of all underlying fund operating expenses, but do not include any insurance charges imposed by your insurance company’s separate account. If performance information included the effect of these additional charges, the total returns would have been lower. How a fund did yesterday is no guarantee of how it will do tomorrow.
Average Annual Total Returns
| Periods ended December 31, 2020 | Past 1 year | Past 5 years | Past 10 years |
| Initial Class | 15.06% | 10.00% | 8.16% |
| Service Class | 14.92% | 9.88% | 8.04% |
| Service Class 2 | 14.72% | 9.70% | 7.88% |
$10,000 Over 10 Years
Let's say hypothetically that $10,000 was invested in VIP Freedom 2020 Portfolio℠ - Initial Class on December 31, 2010.
The chart shows how the value of your investment would have changed, and also shows how the S&P 500® Index performed over the same period.
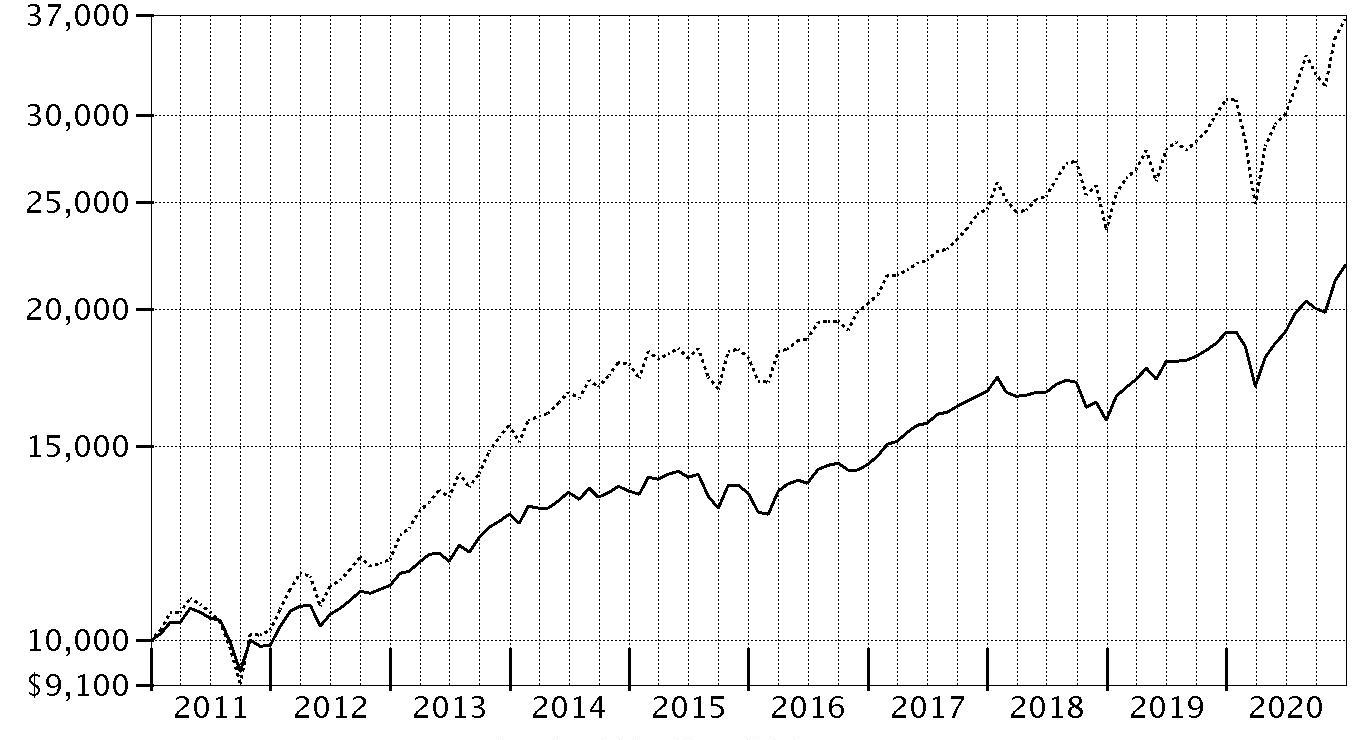
| Period Ending Values |
| $21,914 | VIP Freedom 2020 Portfolio℠ - Initial Class |
| $36,700 | S&P 500® Index |
VIP Freedom 2025 Portfolio℠
Performance: The Bottom Line
Average annual total return reflects the change in the value of an investment, assuming reinvestment of distributions from dividend income and capital gains (the profits earned upon the sale of securities that have grown in value, if any) and assuming a constant rate of performance each year. During periods of reimbursement by Fidelity, a fund’s total return will be greater than it would be had the reimbursement not occurred. Performance numbers are net of all underlying fund operating expenses, but do not include any insurance charges imposed by your insurance company’s separate account. If performance information included the effect of these additional charges, the total returns would have been lower. How a fund did yesterday is no guarantee of how it will do tomorrow.
Average Annual Total Returns
| Periods ended December 31, 2020 | Past 1 year | Past 5 years | Past 10 years |
| Initial Class | 15.95% | 10.58% | 8.89% |
| Service Class | 15.83% | 10.48% | 8.78% |
| Service Class 2 | 15.68% | 10.30% | 8.62% |
$10,000 Over 10 Years
Let's say hypothetically that $10,000 was invested in VIP Freedom 2025 Portfolio℠ - Initial Class on December 31, 2010.
The chart shows how the value of your investment would have changed, and also shows how the S&P 500® Index performed over the same period.

| Period Ending Values |
| $23,439 | VIP Freedom 2025 Portfolio℠ - Initial Class |
| $36,700 | S&P 500® Index |
VIP Freedom 2030 Portfolio℠
Performance: The Bottom Line
Average annual total return reflects the change in the value of an investment, assuming reinvestment of distributions from dividend income and capital gains (the profits earned upon the sale of securities that have grown in value, if any) and assuming a constant rate of performance each year. During periods of reimbursement by Fidelity, a fund’s total return will be greater than it would be had the reimbursement not occurred. Performance numbers are net of all underlying fund operating expenses, but do not include any insurance charges imposed by your insurance company’s separate account. If performance information included the effect of these additional charges, the total returns would have been lower. How a fund did yesterday is no guarantee of how it will do tomorrow.
Average Annual Total Returns
| Periods ended December 31, 2020 | Past 1 year | Past 5 years | Past 10 years |
| Initial Class | 16.89% | 11.58% | 9.51% |
| Service Class | 16.76% | 11.48% | 9.40% |
| Service Class 2 | 16.64% | 11.31% | 9.24% |
$10,000 Over 10 Years
Let's say hypothetically that $10,000 was invested in VIP Freedom 2030 Portfolio℠ - Initial Class on December 31, 2010.
The chart shows how the value of your investment would have changed, and also shows how the S&P 500® Index performed over the same period.
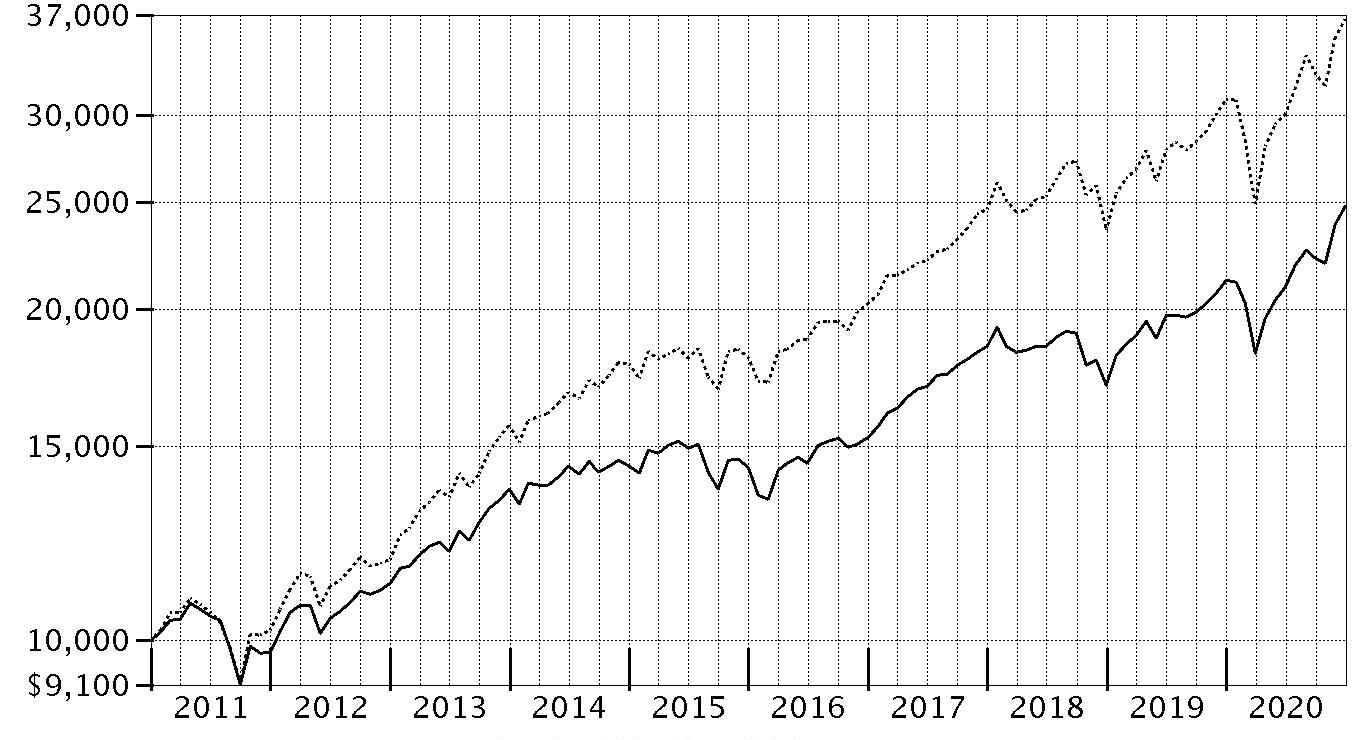
| Period Ending Values |
| $24,805 | VIP Freedom 2030 Portfolio℠ - Initial Class |
| $36,700 | S&P 500® Index |
VIP Freedom 2035 Portfolio℠
Performance: The Bottom Line
Average annual total return reflects the change in the value of an investment, assuming reinvestment of distributions from dividend income and capital gains (the profits earned upon the sale of securities that have grown in value, if any) and assuming a constant rate of performance each year. During periods of reimbursement by Fidelity, a fund’s total return will be greater than it would be had the reimbursement not occurred. Performance numbers are net of all underlying fund operating expenses, but do not include any insurance charges imposed by your insurance company’s separate account. If performance information included the effect of these additional charges, the total returns would have been lower. How a fund did yesterday is no guarantee of how it will do tomorrow.
Average Annual Total Returns
| Periods ended December 31, 2020 | Past 1 year | Past 5 years | Past 10 years |
| Initial Class | 18.28% | 12.51% | 10.20% |
| Service Class | 18.15% | 12.39% | 10.09% |
| Service Class 2 | 17.96% | 12.21% | 9.92% |
$10,000 Over Life of Fund
Let's say hypothetically that $10,000 was invested in VIP Freedom 2035 Portfolio℠ - Initial Class on December 31, 2010.
The chart shows how the value of your investment would have changed, and also shows how the S&P 500® Index performed over the same period.

| Period Ending Values |
| $26,406 | VIP Freedom 2035 Portfolio℠ - Initial Class |
| $36,700 | S&P 500® Index |
VIP Freedom 2040 Portfolio℠
Performance: The Bottom Line
Average annual total return reflects the change in the value of an investment, assuming reinvestment of distributions from dividend income and capital gains (the profits earned upon the sale of securities that have grown in value, if any) and assuming a constant rate of performance each year. During periods of reimbursement by Fidelity, a fund’s total return will be greater than it would be had the reimbursement not occurred. Performance numbers are net of all underlying fund operating expenses, but do not include any insurance charges imposed by your insurance company’s separate account. If performance information included the effect of these additional charges, the total returns would have been lower. How a fund did yesterday is no guarantee of how it will do tomorrow.
Average Annual Total Returns
| Periods ended December 31, 2020 | Past 1 year | Past 5 years | Past 10 years |
| Initial Class | 19.28% | 12.77% | 10.38% |
| Service Class | 19.16% | 12.66% | 10.27% |
| Service Class 2 | 18.99% | 12.49% | 10.10% |
$10,000 Over Life of Fund
Let's say hypothetically that $10,000 was invested in VIP Freedom 2040 Portfolio℠ - Initial Class on December 31, 2010.
The chart shows how the value of your investment would have changed, and also shows how the S&P 500® Index performed over the same period.
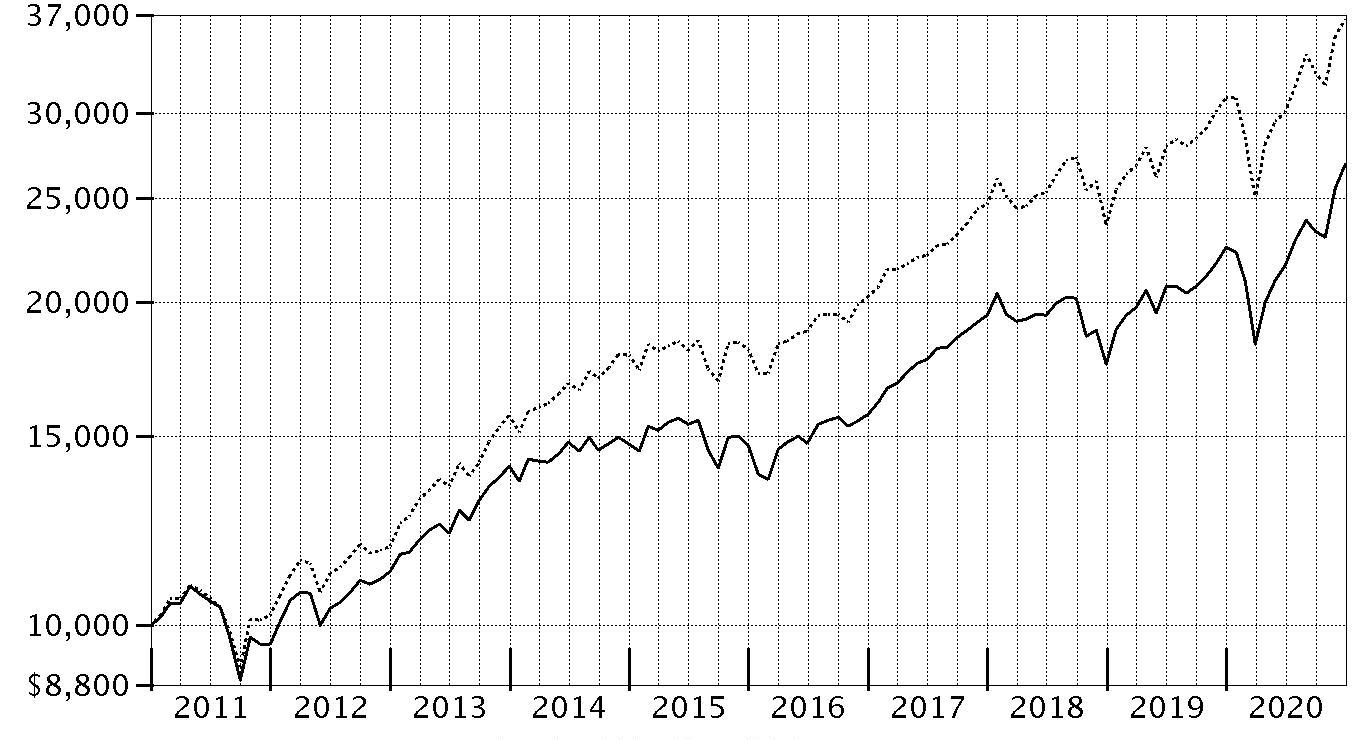
| Period Ending Values |
| $26,844 | VIP Freedom 2040 Portfolio℠ - Initial Class |
| $36,700 | S&P 500® Index |
VIP Freedom 2045 Portfolio℠
Performance: The Bottom Line
Average annual total return reflects the change in the value of an investment, assuming reinvestment of distributions from dividend income and capital gains (the profits earned upon the sale of securities that have grown in value, if any) and assuming a constant rate of performance each year. During periods of reimbursement by Fidelity, a fund’s total return will be greater than it would be had the reimbursement not occurred. Performance numbers are net of all underlying fund operating expenses, but do not include any insurance charges imposed by your insurance company’s separate account. If performance information included the effect of these additional charges, the total returns would have been lower. How a fund did yesterday is no guarantee of how it will do tomorrow.
Average Annual Total Returns
| Periods ended December 31, 2020 | Past 1 year | Past 5 years | Past 10 years |
| Initial Class | 19.27% | 12.77% | 10.44% |
| Service Class | 19.18% | 12.66% | 10.33% |
| Service Class 2 | 18.97% | 12.49% | 10.16% |
$10,000 Over Life of Fund
Let's say hypothetically that $10,000 was invested in VIP Freedom 2045 Portfolio℠ - Initial Class on December 31, 2010.
The chart shows how the value of your investment would have changed, and also shows how the S&P 500® Index performed over the same period.

| Period Ending Values |
| $26,996 | VIP Freedom 2045 Portfolio℠ - Initial Class |
| $36,700 | S&P 500® Index |
VIP Freedom 2050 Portfolio℠
Performance: The Bottom Line
Average annual total return reflects the change in the value of an investment, assuming reinvestment of distributions from dividend income and capital gains (the profits earned upon the sale of securities that have grown in value, if any) and assuming a constant rate of performance each year. During periods of reimbursement by Fidelity, a fund’s total return will be greater than it would be had the reimbursement not occurred. Performance numbers are net of all underlying fund operating expenses, but do not include any insurance charges imposed by your insurance company’s separate account. If performance information included the effect of these additional charges, the total returns would have been lower. How a fund did yesterday is no guarantee of how it will do tomorrow.
Average Annual Total Returns
| Periods ended December 31, 2020 | Past 1 year | Past 5 years | Past 10 years |
| Initial Class | 19.28% | 12.76% | 10.44% |
| Service Class | 19.17% | 12.65% | 10.33% |
| Service Class 2 | 18.99% | 12.50% | 10.17% |
$10,000 Over Life of Fund
Let's say hypothetically that $10,000 was invested in VIP Freedom 2050 Portfolio℠ - Initial Class on December 31, 2010.
The chart shows how the value of your investment would have changed, and also shows how the S&P 500® Index performed over the same period.

| Period Ending Values |
| $26,985 | VIP Freedom 2050 Portfolio℠ - Initial Class |
| $36,700 | S&P 500® Index |
VIP Freedom 2055 Portfolio℠
Performance: The Bottom Line
Average annual total return reflects the change in the value of an investment, assuming reinvestment of distributions from dividend income and capital gains (the profits earned upon the sale of securities that have grown in value, if any) and assuming a constant rate of performance each year. During periods of reimbursement by Fidelity, a fund’s total return will be greater than it would be had the reimbursement not occurred. Performance numbers are net of all underlying fund operating expenses, but do not include any insurance charges imposed by your insurance company’s separate account. If performance information included the effect of these additional charges, the total returns would have been lower. How a fund did yesterday is no guarantee of how it will do tomorrow.
Average Annual Total Returns
| Periods ended December 31, 2020 | Past 1 year | Life of Portfolio |
| Initial Class | 19.28% | 18.18% |
| Service Class | 19.11% | 18.04% |
| Service Class 2 | 19.01% | 17.87% |
$10,000 Over Life of Fund
Let's say hypothetically that $10,000 was invested in VIP Freedom 2055 Portfolio℠ - Initial Class on April 11, 2019, when the fund started.
The chart shows how the value of your investment would have changed, and also shows how the S&P 500® Index performed over the same period.
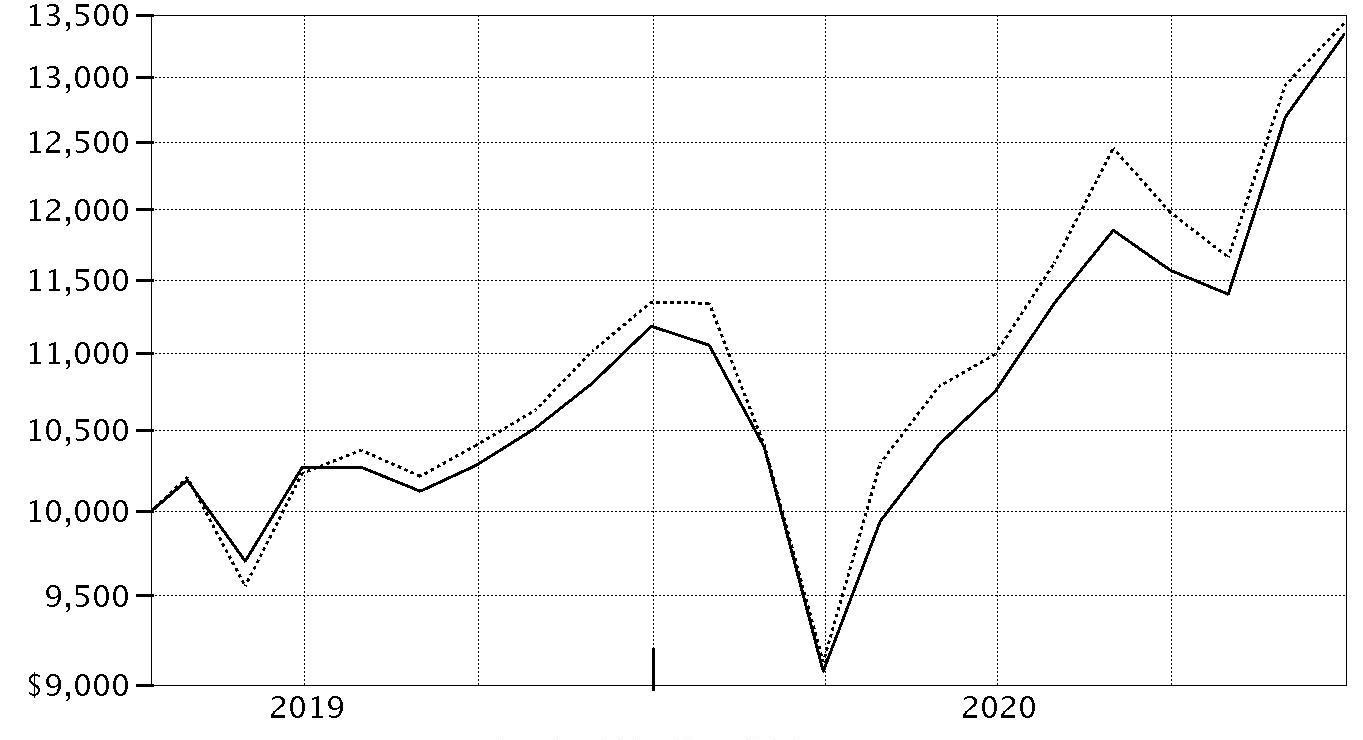
| Period Ending Values |
| $13,342 | VIP Freedom 2055 Portfolio℠ - Initial Class |
| $13,433 | S&P 500® Index |
VIP Freedom 2060 Portfolio℠
Performance: The Bottom Line
Average annual total return reflects the change in the value of an investment, assuming reinvestment of distributions from dividend income and capital gains (the profits earned upon the sale of securities that have grown in value, if any) and assuming a constant rate of performance each year. During periods of reimbursement by Fidelity, a fund’s total return will be greater than it would be had the reimbursement not occurred. Performance numbers are net of all underlying fund operating expenses, but do not include any insurance charges imposed by your insurance company’s separate account. If performance information included the effect of these additional charges, the total returns would have been lower. How a fund did yesterday is no guarantee of how it will do tomorrow.
Average Annual Total Returns
| Periods ended December 31, 2020 | Past 1 year | Life of Portfolio |
| Initial Class | 19.30% | 18.19% |
| Service Class | 19.22% | 18.11% |
| Service Class 2 | 19.04% | 17.89% |
$10,000 Over Life of Fund
Let's say hypothetically that $10,000 was invested in VIP Freedom 2060 Portfolio℠ - Initial Class on April 11, 2019, when the fund started.
The chart shows how the value of your investment would have changed, and also shows how the S&P 500® Index performed over the same period.
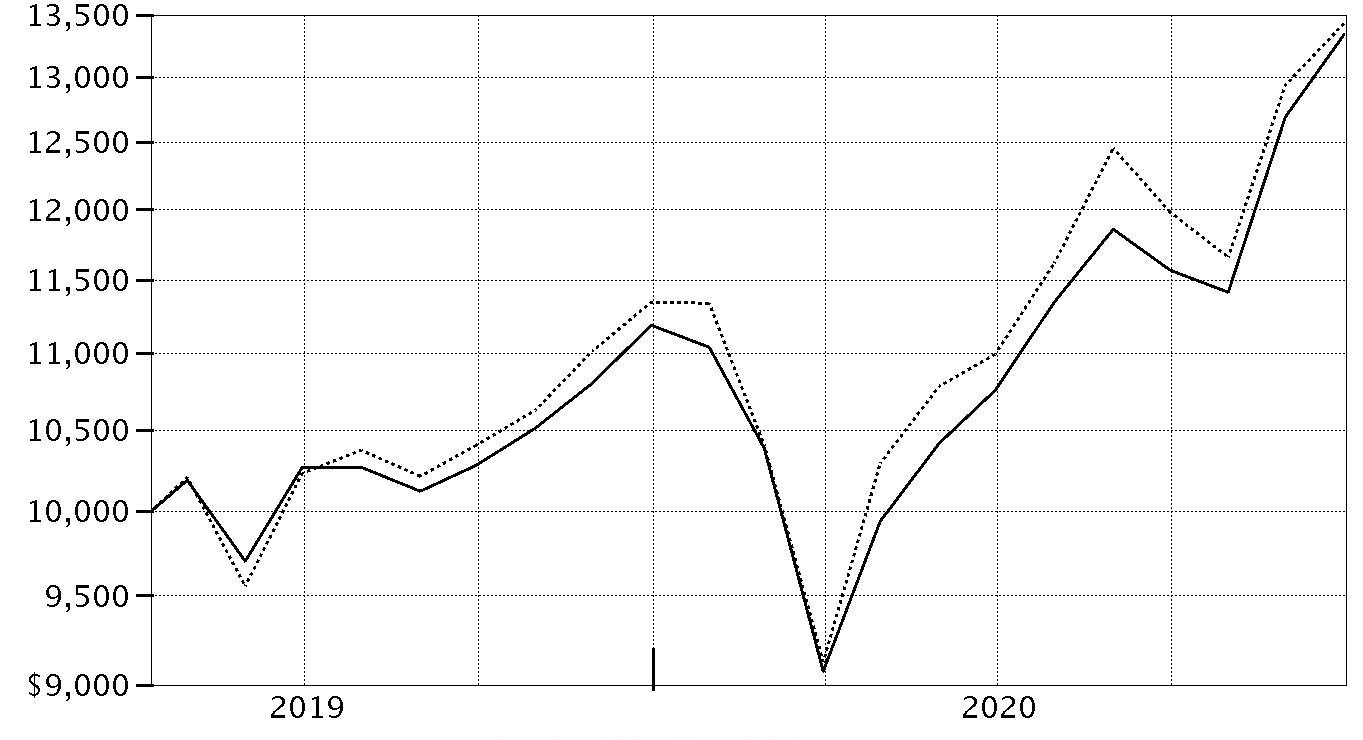
| Period Ending Values |
| $13,345 | VIP Freedom 2060 Portfolio℠ - Initial Class |
| $13,433 | S&P 500® Index |
VIP Freedom 2065 Portfolio℠
Performance: The Bottom Line
Average annual total return reflects the change in the value of an investment, assuming reinvestment of distributions from dividend income and capital gains (the profits earned upon the sale of securities that have grown in value, if any) and assuming a constant rate of performance each year. During periods of reimbursement by Fidelity, a fund’s total return will be greater than it would be had the reimbursement not occurred. Performance numbers are net of all underlying fund operating expenses, but do not include any insurance charges imposed by your insurance company’s separate account. If performance information included the effect of these additional charges, the total returns would have been lower. How a fund did yesterday is no guarantee of how it will do tomorrow.
Average Annual Total Returns
| Periods ended December 31, 2020 | Past 1 year | Life of Portfolio |
| Initial Class | 19.35% | 18.18% |
| Service Class | 19.16% | 18.03% |
| Service Class 2 | 19.03% | 17.89% |
$10,000 Over Life of Fund
Let's say hypothetically that $10,000 was invested in VIP Freedom 2065 Portfolio℠ - Initial Class on April 11, 2019, when the fund started.
The chart shows how the value of your investment would have changed, and also shows how the S&P 500® Index performed over the same period.

| Period Ending Values |
| $13,343 | VIP Freedom 2065 Portfolio℠ - Initial Class |
| $13,433 | S&P 500® Index |
Management's Discussion of Fund Performance
Market Recap: Global financial markets were highly volatile and unpredictable in 2020, a year that will be remembered by most investors for the impact of the coronavirus pandemic. The early-2020 outbreak and spread of COVID-19 resulted in a sharp decline for risk assets, followed by a historic rebound. The crisis and containment efforts led to broad contraction in economic activity and dislocation in financial markets. Rapid and expansive monetary- and fiscal-policy responses partially offset the economic disruption and fueled the market surge for many assets from late March through the end of the year.
Non-U.S. equities gained 10.81% in 2020, according to the MSCI ACWI (All Country World Index) ex USA Index, despite significant ups and downs related to the pandemic. Emerging markets (+19%) was the top region, followed by Japan (+15%) and Europe ex U.K. (+12%). Conversely, the U.K. (-10%), Canada (+6%) and Asia Pacific ex Japan (+7%) lagged. By sector, information technology (+46%) was by far the top performer, while consumer discretionary (+23%) and materials (+22%) also notably outpaced the index. Energy (-23%), real estate (-9%) and financials (-4%) all underperformed.
The Dow Jones U.S. Total Stock Market Index gained 20.79% for the year. After a sharp decline in the first quarter (-20.96%) due to the coronavirus outbreak, U.S. equities reversed course, driven by resilient corporate earnings and potential for a vaccine breakthrough, and closed the year at an all-time high. Among sectors, consumer discretionary (+47%) and information technology (+46%) led, whereas energy (-33%) fared worst, followed by real estate (-5%). Large-cap stocks performed about on par with smaller-caps, while growth handily outpaced value. Commodities notably lagged equities.
Turning to fixed income, U.S. taxable investment-grade bonds (the Bloomberg Barclays U.S. Aggregate Bond Index) rose 7.51%, as most categories generated a solid gain. Corporate bonds (+9.35%) led the way, along with commercial mortgage backed securities (+8.11%), Treasury securities (+8.00) and government bonds (7.94%). Agency bonds (+5.48%) and mortgage-backed securities (+3.87%) had smaller gains. Extended (non-core) categories outside the index were mixed, including Treasury Inflation-Protected Securities (+10.99%), high-yield bonds (+6.07%), emerging-markets debt (+5.88%) and floating-rate bank loans (+3.50%).
Comments from Co-Portfolio Managers Andrew Dierdorf and Brett Sumsion: For the year, the share classes of each VIP Freedom Fund posted a double-digit gain, ranging from about 10% for VIP Freedom Income Portfolio to roughly 19% for VIP Freedom 2065 Portfolio. Each Portfolio outpaced its Composite index in 2020. Versus Composites, favorable returns among underlying investment funds drove the Portfolios’ outperformance for the year. In particular, active security selection among non-U.S. equities added the most value, while performance among U.S. equities and investment-grade bonds helped to a lesser extent. Among non-U.S. equities, Fidelity
® VIP Emerging Markets Portfolio (+31.27%) and Fidelity
® VIP Overseas Portfolio (+15.61%) led the way, as both funds handily topped their benchmark. Within U.S. equities, Fidelity
® VIP Contrafund Portfolio (+30.57%) contributed most. An allocation to Fidelity
® VIP Investment Grade Bond Portfolio (+9.39%) also helped, as it outperformed its benchmark, the Bloomberg Barclays U.S. Aggregate Bond Index (+7.51%). Top-down, active asset allocation decisions had mixed results in 2020. On one hand, overweighting non-U.S. equities made a notable contribution to the Portfolios’ relative performance, as did an underweighting in investment-grade bonds. Conversely, the Portfolios’ underexposure to U.S. equities detracted, as this was the strongest-performing asset class for the year. Out-of-Composite exposure to high-yield bonds and overweighting in inflation-protected debt securities also held back the Portfolios’ relative performance.
The views expressed above reflect those of the portfolio manager(s) only through the end of the period as stated on the cover of this report and do not necessarily represent the views of Fidelity or any other person in the Fidelity organization. Any such views are subject to change at any time based upon market or other conditions and Fidelity disclaims any responsibility to update such views. These views may not be relied on as investment advice and, because investment decisions for a Fidelity fund are based on numerous factors, may not be relied on as an indication of trading intent on behalf of any Fidelity fund.
VIP Freedom Income Portfolio℠
Investment Summary (Unaudited)
The information in the following tables is based on the direct investments of the Fund.
Top Holdings as of December 31, 2020
| | % of fund's net assets |
| VIP Investment Grade Bond Portfolio Initial Class | 41.0 |
| VIP Government Money Market Portfolio Initial Class 0.01% | 22.7 |
| Fidelity Inflation-Protected Bond Index Fund | 12.0 |
| VIP Emerging Markets Portfolio Initial Class | 7.9 |
| VIP Overseas Portfolio Initial Class | 5.2 |
| Fidelity Long-Term Treasury Bond Index Fund | 2.3 |
| VIP High Income Portfolio Initial Class | 2.0 |
| VIP Growth & Income Portfolio Initial Class | 1.5 |
| VIP Equity-Income Portfolio Initial Class | 1.3 |
| VIP Growth Portfolio Initial Class | 1.2 |
| | 97.1 |
Asset Allocation (% of fund's net assets)
| Period end |
| | Domestic Equity Funds | 6.9% |
| | International Equity Funds | 13.1% |
| | Bond Funds | 57.3% |
| | Short-Term Funds | 22.7% |

VIP Freedom Income Portfolio℠
Schedule of Investments December 31, 2020
Showing Percentage of Net Assets
| Domestic Equity Funds - 6.9% | | | |
| | | Shares | Value |
| VIP Contrafund Portfolio Initial Class (a) | | 19,401 | $934,527 |
| VIP Equity-Income Portfolio Initial Class (a) | | 41,270 | 986,356 |
| VIP Growth & Income Portfolio Initial Class (a) | | 50,244 | 1,123,457 |
| VIP Growth Portfolio Initial Class (a) | | 9,244 | 952,179 |
| VIP Mid Cap Portfolio Initial Class (a) | | 7,035 | 272,392 |
| VIP Value Portfolio Initial Class (a) | | 45,229 | 721,408 |
| VIP Value Strategies Portfolio Initial Class (a) | | 26,047 | 352,933 |
| TOTAL DOMESTIC EQUITY FUNDS | | | |
| (Cost $3,672,564) | | | 5,343,252 |
|
| International Equity Funds - 13.1% | | | |
| VIP Emerging Markets Portfolio Initial Class (a) | | 411,648 | 6,071,802 |
| VIP Overseas Portfolio Initial Class (a) | | 152,455 | 4,043,108 |
| TOTAL INTERNATIONAL EQUITY FUNDS | | | |
| (Cost $6,679,702) | | | 10,114,910 |
|
| Bond Funds - 57.3% | | | |
| Fidelity Inflation-Protected Bond Index Fund (a) | | 840,297 | 9,276,880 |
| Fidelity Long-Term Treasury Bond Index Fund (a) | | 111,509 | 1,778,565 |
| VIP High Income Portfolio Initial Class (a) | | 290,601 | 1,543,093 |
| VIP Investment Grade Bond Portfolio Initial Class (a) | | 2,244,089 | 31,619,218 |
| TOTAL BOND FUNDS | | | |
| (Cost $40,748,277) | | | 44,217,756 |
|
| Short-Term Funds - 22.7% | | | |
| VIP Government Money Market Portfolio Initial Class 0.01% (a)(b) | | | |
| (Cost $17,515,214) | | 17,515,214 | 17,515,214 |
| TOTAL INVESTMENT IN SECURITIES - 100.0% | | | |
| (Cost $68,615,757) | | | 77,191,132 |
| NET OTHER ASSETS (LIABILITIES) - 0.0% | | | (8,329) |
| NET ASSETS - 100% | | | $77,182,803 |
Legend
(a) Affiliated Fund
(b) The rate quoted is the annualized seven-day yield of the fund at period end.
Affiliated Underlying Funds
Fiscal year to date information regarding the Fund's investments in affiliated Underlying Funds, excluding any Money Market Central Funds, is presented below. Exchanges between classes of the same affiliated Underlying Funds may occur. Certain Underlying Funds incurred name changes since their most recent shareholder report. The names of the Underlying Funds are those in effect at period end.
| Affiliate | Value, beginning of period | Purchases | Sales Proceeds | Dividend Income | Realized Gain (loss) | Change in Unrealized appreciation (depreciation) | Value, end of period |
| Fidelity Inflation-Protected Bond Index Fund | $6,968,463 | $5,900,722 | $4,279,036 | $110,227 | $11,716 | $675,015 | $9,276,880 |
| Fidelity Long-Term Treasury Bond Index Fund | 1,464,713 | 1,393,358 | 1,263,690 | 64,973 | 82,168 | 102,016 | 1,778,565 |
| VIP Contrafund Portfolio Initial Class | 646,934 | 1,065,634 | 980,816 | 5,744 | 72,475 | 130,300 | 934,527 |
| VIP Emerging Markets Portfolio Initial Class | 3,527,180 | 5,314,899 | 3,958,999 | 488,455 | 27,174 | 1,161,548 | 6,071,802 |
| VIP Equity-Income Portfolio Initial Class | 683,365 | 1,238,203 | 996,254 | 46,843 | (14,074) | 75,116 | 986,356 |
| VIP Government Money Market Portfolio Initial Class 0.01% | 13,672,664 | 13,595,413 | 9,752,863 | 46,432 | -- | -- | 17,515,214 |
| VIP Growth & Income Portfolio Initial Class | 779,128 | 1,408,665 | 1,136,032 | 60,323 | 68,286 | 3,410 | 1,123,457 |
| VIP Growth Portfolio Initial Class | 661,184 | 1,116,111 | 1,044,408 | 73,965 | 155,862 | 63,430 | 952,179 |
| VIP High Income Portfolio Initial Class | 1,164,339 | 1,145,166 | 745,883 | 71,031 | (22,028) | 1,499 | 1,543,093 |
| VIP Investment Grade Bond Portfolio Initial Class | 23,759,506 | 20,375,674 | 14,154,889 | 653,490 | (42,795) | 1,681,722 | 31,619,218 |
| VIP Mid Cap Portfolio Initial Class | 189,779 | 290,056 | 267,342 | 1,425 | (3,531) | 63,430 | 272,392 |
| VIP Overseas Portfolio Initial Class | 3,774,439 | 3,595,377 | 3,805,823 | 33,463 | (106,438) | 585,553 | 4,043,108 |
| VIP Value Portfolio Initial Class | 502,068 | 873,311 | 736,876 | 28,573 | 383 | 82,522 | 721,408 |
| VIP Value Strategies Portfolio Initial Class | 246,043 | 412,403 | 351,775 | 16,791 | (5,712) | 51,974 | 352,933 |
| | 58,039,805 | 57,724,992 | 43,474,686 | 1,701,735 | 223,486 | 4,677,535 | 77,191,132 |
Amounts in the income column in the above table include any capital gain distributions from underlying funds, which are presented in the corresponding line-item in the Statement of Operations, if applicable.
Investment Valuation
The following is a summary of the inputs used, as of December 31, 2020, involving the Fund's assets and liabilities carried at fair value. The inputs or methodology used for valuing securities may not be an indication of the risk associated with investing in those securities. For more information on valuation inputs, and their aggregation into the levels used below, please refer to the Investment Valuation section in the accompanying Notes to Financial Statements.
| | Valuation Inputs at Reporting Date: |
| Description | Total | Level 1 | Level 2 | Level 3 |
| Investments in Securities: | | | | |
| Domestic Equity Funds | $5,343,252 | $5,343,252 | $-- | $-- |
| International Equity Funds | 10,114,910 | 10,114,910 | -- | -- |
| Bond Funds | 44,217,756 | 44,217,756 | -- | -- |
| Short-Term Funds | 17,515,214 | 17,515,214 | -- | -- |
| Total Investments in Securities: | $77,191,132 | $77,191,132 | $-- | $-- |
See accompanying notes which are an integral part of the financial statements.
VIP Freedom Income Portfolio℠
Financial Statements
Statement of Assets and Liabilities
| | | December 31, 2020 |
| Assets | | |
Investment in securities, at value — See accompanying schedule:
| | |
| Affiliated issuers (cost $68,615,757) | $77,191,132 | |
| Total Investment in Securities (cost $68,615,757) | | $77,191,132 |
| Cash | | 5 |
| Receivable for investments sold | | 1,103,727 |
| Receivable for fund shares sold | | 23,901 |
| Total assets | | 78,318,765 |
| Liabilities | | |
| Payable for investments purchased | $589,094 | |
| Payable for fund shares redeemed | 538,539 | |
| Distribution and service plan fees payable | 8,329 | |
| Total liabilities | | 1,135,962 |
| Net Assets | | $77,182,803 |
| Net Assets consist of: | | |
| Paid in capital | | $67,938,517 |
| Total accumulated earnings (loss) | | 9,244,286 |
| Net Assets | | $77,182,803 |
| Net Asset Value and Maximum Offering Price | | |
| Initial Class: | | |
| Net Asset Value, offering price and redemption price per share ($16,853,904 ÷ 1,322,661 shares) | | $12.74 |
| Service Class: | | |
| Net Asset Value, offering price and redemption price per share ($32,810,450 ÷ 2,577,438 shares) | | $12.73 |
| Service Class 2: | | |
| Net Asset Value, offering price and redemption price per share ($27,518,449 ÷ 2,170,898 shares) | | $12.68 |
See accompanying notes which are an integral part of the financial statements.
Statement of Operations
| | | Year ended December 31, 2020 |
| Investment Income | | |
| Dividends: | | |
| Affiliated issuers | | $919,124 |
| Expenses | | |
| Distribution and service plan fees | $83,476 | |
| Independent trustees' fees and expenses | 208 | |
| Total expenses | | 83,684 |
| Net investment income (loss) | | 835,440 |
| Realized and Unrealized Gain (Loss) | | |
| Net realized gain (loss) on: | | |
| Investment securities: | | |
| Affiliated issuers | 223,486 | |
| Capital gain distributions from underlying funds: | | |
| Affiliated issuers | 782,611 | |
| Total net realized gain (loss) | | 1,006,097 |
| Change in net unrealized appreciation (depreciation) on: | | |
| Investment securities: | | |
| Affiliated issuers | 4,677,535 | |
| Total change in net unrealized appreciation (depreciation) | | 4,677,535 |
| Net gain (loss) | | 5,683,632 |
| Net increase (decrease) in net assets resulting from operations | | $6,519,072 |
See accompanying notes which are an integral part of the financial statements.
Statement of Changes in Net Assets
| | Year ended December 31, 2020 | Year ended December 31, 2019 |
| Increase (Decrease) in Net Assets | | |
| Operations | | |
| Net investment income (loss) | $835,440 | $1,102,725 |
| Net realized gain (loss) | 1,006,097 | 1,094,578 |
| Change in net unrealized appreciation (depreciation) | 4,677,535 | 3,237,264 |
| Net increase (decrease) in net assets resulting from operations | 6,519,072 | 5,434,567 |
| Distributions to shareholders | (1,976,401) | (2,106,455) |
| Share transactions - net increase (decrease) | 14,606,211 | 10,073,022 |
| Total increase (decrease) in net assets | 19,148,882 | 13,401,134 |
| Net Assets | | |
| Beginning of period | 58,033,921 | 44,632,787 |
| End of period | $77,182,803 | $58,033,921 |
See accompanying notes which are an integral part of the financial statements.
Financial Highlights
VIP Freedom Income Portfolio Initial Class
| Years ended December 31, | 2020 | 2019 | 2018 | 2017 | 2016 |
| Selected Per–Share Data | | | | | |
| Net asset value, beginning of period | $11.89 | $11.08 | $11.63 | $10.98 | $10.78 |
| Income from Investment Operations | | | | | |
| Net investment income (loss)A | .17 | .27 | .22 | .19 | .16 |
| Net realized and unrealized gain (loss) | 1.06 | 1.03 | (.45) | .74 | .32 |
| Total from investment operations | 1.23 | 1.30 | (.23) | .93 | .48 |
| Distributions from net investment income | (.16) | (.25) | (.20) | (.18) | (.16) |
| Distributions from net realized gain | (.22) | (.25) | (.13) | (.10) | (.11) |
| Total distributions | (.38) | (.49)B | (.32)B | (.28) | (.28)B |
| Net asset value, end of period | $12.74 | $11.89 | $11.08 | $11.63 | $10.98 |
| Total ReturnC,D | 10.47% | 11.94% | (1.96)% | 8.48% | 4.50% |
| Ratios to Average Net AssetsE | | | | | |
| Expenses before reductionsF | -% | -% | -% | -% | -% |
| Expenses net of fee waivers, if any | - %F | - %F | - %F | -% | -% |
| Expenses net of all reductions | - %F | - %F | - %F | -% | -% |
| Net investment income (loss) | 1.40% | 2.31% | 1.90% | 1.67% | 1.48% |
| Supplemental Data | | | | | |
| Net assets, end of period (000 omitted) | $16,854 | $14,870 | $14,582 | $16,086 | $14,956 |
| Portfolio turnover rateG | 66% | 40% | 48% | 35% | 38% |
A Calculated based on average shares outstanding during the period.
B Total distributions per share do not sum due to rounding.
C Total returns do not reflect charges attributable to your insurance company's separate account. Inclusion of these charges would reduce the total returns shown.
D Total returns would have been lower if certain expenses had not been reduced during the applicable periods shown.
E Expense ratios reflect operating expenses of the class. Expenses before reductions do not reflect amounts reimbursed, waived, or reduced through arrangements with the investment adviser, brokerage services, or other offset arrangements, if applicable, and do not represent the amount paid by the class during periods when reimbursements, waivers or reductions occur.
F Amount represents less than .005%.
G Amount does not include the portfolio activity of any underlying mutual funds or exchange-traded funds (ETFs).
See accompanying notes which are an integral part of the financial statements.
VIP Freedom Income Portfolio Service Class
| Years ended December 31, | 2020 | 2019 | 2018 | 2017 | 2016 |
| Selected Per–Share Data | | | | | |
| Net asset value, beginning of period | $11.88 | $11.07 | $11.63 | $10.97 | $10.78 |
| Income from Investment Operations | | | | | |
| Net investment income (loss)A | .16 | .26 | .21 | .18 | .15 |
| Net realized and unrealized gain (loss) | 1.06 | 1.03 | (.46) | .75 | .31 |
| Total from investment operations | 1.22 | 1.29 | (.25) | .93 | .46 |
| Distributions from net investment income | (.15) | (.24) | (.19) | (.17) | (.15) |
| Distributions from net realized gain | (.22) | (.25) | (.13) | (.10) | (.11) |
| Total distributions | (.37) | (.48)B | (.31)B | (.27) | (.27)B |
| Net asset value, end of period | $12.73 | $11.88 | $11.07 | $11.63 | $10.97 |
| Total ReturnC,D | 10.38% | 11.87% | (2.12)% | 8.49% | 4.32% |
| Ratios to Average Net AssetsE | | | | | |
| Expenses before reductions | .10% | .10% | .10% | .10% | .10% |
| Expenses net of fee waivers, if any | .10% | .10% | .10% | .10% | .10% |
| Expenses net of all reductions | .10% | .10% | .10% | .10% | .10% |
| Net investment income (loss) | 1.30% | 2.21% | 1.80% | 1.57% | 1.38% |
| Supplemental Data | | | | | |
| Net assets, end of period (000 omitted) | $32,810 | $24,831 | $14,591 | $11,227 | $9,286 |
| Portfolio turnover rateF | 66% | 40% | 48% | 35% | 38% |
A Calculated based on average shares outstanding during the period.
B Total distributions per share do not sum due to rounding.
C Total returns do not reflect charges attributable to your insurance company's separate account. Inclusion of these charges would reduce the total returns shown.
D Total returns would have been lower if certain expenses had not been reduced during the applicable periods shown.
E Expense ratios reflect operating expenses of the class. Expenses before reductions do not reflect amounts reimbursed, waived, or reduced through arrangements with the investment adviser, brokerage services, or other offset arrangements, if applicable, and do not represent the amount paid by the class during periods when reimbursements, waivers or reductions occur.
F Amount does not include the portfolio activity of any underlying mutual funds or exchange-traded funds (ETFs).
See accompanying notes which are an integral part of the financial statements.
VIP Freedom Income Portfolio Service Class 2
| Years ended December 31, | 2020 | 2019 | 2018 | 2017 | 2016 |
| Selected Per–Share Data | | | | | |
| Net asset value, beginning of period | $11.83 | $11.03 | $11.59 | $10.93 | $10.74 |
| Income from Investment Operations | | | | | |
| Net investment income (loss)A | .14 | .24 | .19 | .16 | .13 |
| Net realized and unrealized gain (loss) | 1.06 | 1.02 | (.45) | .75 | .31 |
| Total from investment operations | 1.20 | 1.26 | (.26) | .91 | .44 |
| Distributions from net investment income | (.13) | (.22) | (.17) | (.15) | (.14) |
| Distributions from net realized gain | (.22) | (.25) | (.13) | (.10) | (.11) |
| Total distributions | (.35) | (.46)B | (.30) | (.25) | (.25) |
| Net asset value, end of period | $12.68 | $11.83 | $11.03 | $11.59 | $10.93 |
| Total ReturnC,D | 10.29% | 11.63% | (2.27)% | 8.36% | 4.17% |
| Ratios to Average Net AssetsE | | | | | |
| Expenses before reductions | .25% | .25% | .25% | .25% | .25% |
| Expenses net of fee waivers, if any | .25% | .25% | .25% | .25% | .25% |
| Expenses net of all reductions | .25% | .25% | .25% | .25% | .25% |
| Net investment income (loss) | 1.15% | 2.06% | 1.65% | 1.42% | 1.23% |
| Supplemental Data | | | | | |
| Net assets, end of period (000 omitted) | $27,518 | $18,333 | $15,459 | $14,911 | $14,007 |
| Portfolio turnover rateF | 66% | 40% | 48% | 35% | 38% |
A Calculated based on average shares outstanding during the period.
B Total distributions per share do not sum due to rounding.
C Total returns do not reflect charges attributable to your insurance company's separate account. Inclusion of these charges would reduce the total returns shown.
D Total returns would have been lower if certain expenses had not been reduced during the applicable periods shown.
E Expense ratios reflect operating expenses of the class. Expenses before reductions do not reflect amounts reimbursed, waived, or reduced through arrangements with the investment adviser, brokerage services, or other offset arrangements, if applicable, and do not represent the amount paid by the class during periods when reimbursements, waivers or reductions occur.
F Amount does not include the portfolio activity of any underlying mutual funds or exchange-traded funds (ETFs).
See accompanying notes which are an integral part of the financial statements.
VIP Freedom 2005 Portfolio℠
Investment Summary (Unaudited)
The information in the following tables is based on the direct investments of the Fund.
Top Holdings as of December 31, 2020
| | % of fund's net assets |
| VIP Investment Grade Bond Portfolio Initial Class | 39.3 |
| VIP Government Money Market Portfolio Initial Class 0.01% | 20.4 |
| Fidelity Inflation-Protected Bond Index Fund | 11.2 |
| VIP Emerging Markets Portfolio Initial Class | 8.4 |
| VIP Overseas Portfolio Initial Class | 6.6 |
| Fidelity Long-Term Treasury Bond Index Fund | 2.3 |
| VIP Growth & Income Portfolio Initial Class | 2.1 |
| VIP High Income Portfolio Initial Class | 2.0 |
| VIP Equity-Income Portfolio Initial Class | 1.8 |
| VIP Growth Portfolio Initial Class | 1.7 |
| | 95.8 |
Asset Allocation (% of fund's net assets)
| Period end |
| | Domestic Equity Funds | 9.8% |
| | International Equity Funds | 15.0% |
| | Bond Funds | 54.8% |
| | Short-Term Funds | 20.4% |

VIP Freedom 2005 Portfolio℠
Schedule of Investments December 31, 2020
Showing Percentage of Net Assets
| Domestic Equity Funds - 9.8% | | | |
| | | Shares | Value |
| VIP Contrafund Portfolio Initial Class (a) | | 5,697 | $274,430 |
| VIP Equity-Income Portfolio Initial Class (a) | | 12,119 | 289,644 |
| VIP Growth & Income Portfolio Initial Class (a) | | 14,754 | 329,907 |
| VIP Growth Portfolio Initial Class (a) | | 2,715 | 279,618 |
| VIP Mid Cap Portfolio Initial Class (a) | | 2,066 | 79,989 |
| VIP Value Portfolio Initial Class (a) | | 13,282 | 211,844 |
| VIP Value Strategies Portfolio Initial Class (a) | | 7,649 | 103,642 |
| TOTAL DOMESTIC EQUITY FUNDS | | | |
| (Cost $999,307) | | | 1,569,074 |
|
| International Equity Funds - 15.0% | | | |
| VIP Emerging Markets Portfolio Initial Class (a) | | 91,847 | 1,354,742 |
| VIP Overseas Portfolio Initial Class (a) | | 39,616 | 1,050,628 |
| TOTAL INTERNATIONAL EQUITY FUNDS | | | |
| (Cost $1,610,054) | | | 2,405,370 |
|
| Bond Funds - 54.8% | | | |
| Fidelity Inflation-Protected Bond Index Fund (a) | | 162,547 | 1,794,523 |
| Fidelity Long-Term Treasury Bond Index Fund (a) | | 23,174 | 369,621 |
| VIP High Income Portfolio Initial Class (a) | | 60,392 | 320,681 |
| VIP Investment Grade Bond Portfolio Initial Class (a) | | 447,568 | 6,306,239 |
| TOTAL BOND FUNDS | | | |
| (Cost $8,001,476) | | | 8,791,064 |
|
| Short-Term Funds - 20.4% | | | |
| VIP Government Money Market Portfolio Initial Class 0.01% (a)(b) | | | |
| (Cost $3,275,991) | | 3,275,991 | 3,275,991 |
| TOTAL INVESTMENT IN SECURITIES - 100.0% | | | |
| (Cost $13,886,828) | | | 16,041,499 |
| NET OTHER ASSETS (LIABILITIES) - 0.0% | | | (490) |
| NET ASSETS - 100% | | | $16,041,009 |
Legend
(a) Affiliated Fund
(b) The rate quoted is the annualized seven-day yield of the fund at period end.
Affiliated Underlying Funds
Fiscal year to date information regarding the Fund's investments in affiliated Underlying Funds, excluding any Money Market Central Funds, is presented below. Exchanges between classes of the same affiliated Underlying Funds may occur. Certain Underlying Funds incurred name changes since their most recent shareholder report. The names of the Underlying Funds are those in effect at period end.
| Affiliate | Value, beginning of period | Purchases | Sales Proceeds | Dividend Income | Realized Gain (loss) | Change in Unrealized appreciation (depreciation) | Value, end of period |
| Fidelity Inflation-Protected Bond Index Fund | $1,498,652 | $782,226 | $631,753 | $21,659 | $5,369 | $140,029 | $1,794,523 |
| Fidelity Long-Term Treasury Bond Index Fund | 348,058 | 229,326 | 255,321 | 14,146 | 17,336 | 30,222 | 369,621 |
| VIP Contrafund Portfolio Initial Class | 247,913 | 217,262 | 260,212 | 1,965 | 16,906 | 52,561 | 274,430 |
| VIP Emerging Markets Portfolio Initial Class | 938,675 | 955,840 | 804,538 | 118,954 | 19,830 | 244,935 | 1,354,742 |
| VIP Equity-Income Portfolio Initial Class | 261,867 | 273,542 | 256,594 | 16,003 | (6,373) | 17,202 | 289,644 |
| VIP Government Money Market Portfolio Initial Class 0.01% | 2,820,355 | 2,007,655 | 1,552,019 | 9,701 | -- | -- | 3,275,991 |
| VIP Growth & Income Portfolio Initial Class | 298,559 | 311,349 | 293,184 | 20,588 | 7,359 | 5,824 | 329,907 |
| VIP Growth Portfolio Initial Class | 253,381 | 233,579 | 280,887 | 25,884 | 39,284 | 34,261 | 279,618 |
| VIP High Income Portfolio Initial Class | 276,690 | 165,254 | 115,602 | 14,820 | (6,387) | 726 | 320,681 |
| VIP Investment Grade Bond Portfolio Initial Class | 5,329,156 | 2,868,577 | 2,267,613 | 130,853 | 5,837 | 370,282 | 6,306,239 |
| VIP Mid Cap Portfolio Initial Class | 72,725 | 62,750 | 72,497 | 441 | (1,137) | 18,148 | 79,989 |
| VIP Overseas Portfolio Initial Class | 1,157,412 | 724,051 | 964,610 | 9,270 | 4,768 | 129,007 | 1,050,628 |
| VIP Value Portfolio Initial Class | 192,386 | 194,696 | 191,764 | 9,829 | 127 | 16,399 | 211,844 |
| VIP Value Strategies Portfolio Initial Class | 94,278 | 94,785 | 95,302 | 5,855 | (4,324) | 14,205 | 103,642 |
| | 13,790,107 | 9,120,892 | 8,041,896 | 399,968 | 98,595 | 1,073,801 | 16,041,499 |
Amounts in the income column in the above table include any capital gain distributions from underlying funds, which are presented in the corresponding line-item in the Statement of Operations, if applicable.
Investment Valuation
The following is a summary of the inputs used, as of December 31, 2020, involving the Fund's assets and liabilities carried at fair value. The inputs or methodology used for valuing securities may not be an indication of the risk associated with investing in those securities. For more information on valuation inputs, and their aggregation into the levels used below, please refer to the Investment Valuation section in the accompanying Notes to Financial Statements.
| | Valuation Inputs at Reporting Date: |
| Description | Total | Level 1 | Level 2 | Level 3 |
| Investments in Securities: | | | | |
| Domestic Equity Funds | $1,569,074 | $1,569,074 | $-- | $-- |
| International Equity Funds | 2,405,370 | 2,405,370 | -- | -- |
| Bond Funds | 8,791,064 | 8,791,064 | -- | -- |
| Short-Term Funds | 3,275,991 | 3,275,991 | -- | -- |
| Total Investments in Securities: | $16,041,499 | $16,041,499 | $-- | $-- |
See accompanying notes which are an integral part of the financial statements.
VIP Freedom 2005 Portfolio℠
Financial Statements
Statement of Assets and Liabilities
| | | December 31, 2020 |
| Assets | | |
Investment in securities, at value — See accompanying schedule:
| | |
| Affiliated issuers (cost $13,886,828) | $16,041,499 | |
| Total Investment in Securities (cost $13,886,828) | | $16,041,499 |
| Cash | | 15 |
| Receivable for investments sold | | 185,356 |
| Receivable for fund shares sold | | 71,921 |
| Total assets | | 16,298,791 |
| Liabilities | | |
| Payable for investments purchased | $205,967 | |
| Payable for fund shares redeemed | 51,304 | |
| Distribution and service plan fees payable | 511 | |
| Total liabilities | | 257,782 |
| Net Assets | | $16,041,009 |
| Net Assets consist of: | | |
| Paid in capital | | $13,675,526 |
| Total accumulated earnings (loss) | | 2,365,483 |
| Net Assets | | $16,041,009 |
| Net Asset Value and Maximum Offering Price | | |
| Initial Class: | | |
| Net Asset Value, offering price and redemption price per share ($10,081,844 ÷ 739,864 shares) | | $13.63 |
| Service Class: | | |
| Net Asset Value, offering price and redemption price per share ($5,672,807 ÷ 413,711 shares) | | $13.71 |
| Service Class 2: | | |
| Net Asset Value, offering price and redemption price per share ($286,358 ÷ 21,076 shares) | | $13.59 |
See accompanying notes which are an integral part of the financial statements.
Statement of Operations
| | | Year ended December 31, 2020 |
| Investment Income | | |
| Dividends: | | |
| Affiliated issuers | | $193,461 |
| Expenses | | |
| Distribution and service plan fees | $5,620 | |
| Independent trustees' fees and expenses | 47 | |
| Total expenses | | 5,667 |
| Net investment income (loss) | | 187,794 |
| Realized and Unrealized Gain (Loss) | | |
| Net realized gain (loss) on: | | |
| Investment securities: | | |
| Affiliated issuers | 98,595 | |
| Capital gain distributions from underlying funds: | | |
| Affiliated issuers | 206,507 | |
| Total net realized gain (loss) | | 305,102 |
| Change in net unrealized appreciation (depreciation) on: | | |
| Investment securities: | | |
| Affiliated issuers | 1,073,801 | |
| Total change in net unrealized appreciation (depreciation) | | 1,073,801 |
| Net gain (loss) | | 1,378,903 |
| Net increase (decrease) in net assets resulting from operations | | $1,566,697 |
See accompanying notes which are an integral part of the financial statements.
Statement of Changes in Net Assets
| | Year ended December 31, 2020 | Year ended December 31, 2019 |
| Increase (Decrease) in Net Assets | | |
| Operations | | |
| Net investment income (loss) | $187,794 | $260,505 |
| Net realized gain (loss) | 305,102 | 357,460 |
| Change in net unrealized appreciation (depreciation) | 1,073,801 | 912,000 |
| Net increase (decrease) in net assets resulting from operations | 1,566,697 | 1,529,965 |
| Distributions to shareholders | (577,014) | (462,350) |
| Share transactions - net increase (decrease) | 1,261,527 | 2,131,032 |
| Total increase (decrease) in net assets | 2,251,210 | 3,198,647 |
| Net Assets | | |
| Beginning of period | 13,789,799 | 10,591,152 |
| End of period | $16,041,009 | $13,789,799 |
See accompanying notes which are an integral part of the financial statements.
Financial Highlights
VIP Freedom 2005 Portfolio Initial Class
| Years ended December 31, | 2020 | 2019 | 2018 | 2017 | 2016 |
| Selected Per–Share Data | | | | | |
| Net asset value, beginning of period | $12.75 | $11.65 | $12.39 | $11.51 | $11.29 |
| Income from Investment Operations | | | | | |
| Net investment income (loss)A | .17 | .27 | .22 | .20 | .17 |
| Net realized and unrealized gain (loss) | 1.23 | 1.32 | (.58) | 1.06 | .38 |
| Total from investment operations | 1.40 | 1.59 | (.36) | 1.26 | .55 |
| Distributions from net investment income | (.17) | (.27) | (.20) | (.19) | (.18) |
| Distributions from net realized gain | (.35) | (.22) | (.17) | (.19) | (.15) |
| Total distributions | (.52) | (.49) | (.38)B | (.38) | (.33) |
| Net asset value, end of period | $13.63 | $12.75 | $11.65 | $12.39 | $11.51 |
| Total ReturnC,D | 11.25% | 13.81% | (2.95)% | 11.06% | 5.00% |
| Ratios to Average Net AssetsE | | | | | |
| Expenses before reductionsF | -% | -% | -% | -% | -% |
| Expenses net of fee waivers, if any | - %F | - %F | - %F | -% | -% |
| Expenses net of all reductions | - %F | - %F | - %F | -% | -% |
| Net investment income (loss) | 1.31% | 2.18% | 1.80% | 1.65% | 1.50% |
| Supplemental Data | | | | | |
| Net assets, end of period (000 omitted) | $10,082 | $9,364 | $8,191 | $7,931 | $6,363 |
| Portfolio turnover rateG | 54% | 24% | 32% | 33% | 24% |
A Calculated based on average shares outstanding during the period.
B Total distributions per share do not sum due to rounding.
C Total returns do not reflect charges attributable to your insurance company's separate account. Inclusion of these charges would reduce the total returns shown.
D Total returns would have been lower if certain expenses had not been reduced during the applicable periods shown.
E Expense ratios reflect operating expenses of the class. Expenses before reductions do not reflect amounts reimbursed, waived, or reduced through arrangements with the investment adviser, brokerage services, or other offset arrangements, if applicable, and do not represent the amount paid by the class during periods when reimbursements, waivers or reductions occur.
F Amount represents less than .005%.
G Amount does not include the portfolio activity of any underlying mutual funds or exchange-traded funds (ETFs).
See accompanying notes which are an integral part of the financial statements.
VIP Freedom 2005 Portfolio Service Class
| Years ended December 31, | 2020 | 2019 | 2018 | 2017 | 2016 |
| Selected Per–Share Data | | | | | |
| Net asset value, beginning of period | $12.83 | $11.72 | $12.46 | $11.58 | $11.36 |
| Income from Investment Operations | | | | | |
| Net investment income (loss)A | .16 | .26 | .21 | .19 | .16 |
| Net realized and unrealized gain (loss) | 1.23 | 1.33 | (.58) | 1.06 | .38 |
| Total from investment operations | 1.39 | 1.59 | (.37) | 1.25 | .54 |
| Distributions from net investment income | (.16) | (.26) | (.20) | (.18) | (.17) |
| Distributions from net realized gain | (.35) | (.22) | (.17) | (.19) | (.15) |
| Total distributions | (.51) | (.48) | (.37) | (.37) | (.32) |
| Net asset value, end of period | $13.71 | $12.83 | $11.72 | $12.46 | $11.58 |
| Total ReturnB,C | 11.07% | 13.71% | (3.01)% | 10.90% | 4.89% |
| Ratios to Average Net AssetsD | | | | | |
| Expenses before reductions | .10% | .10% | .10% | .10% | .10% |
| Expenses net of fee waivers, if any | .10% | .10% | .10% | .10% | .10% |
| Expenses net of all reductions | .10% | .10% | .10% | .10% | .10% |
| Net investment income (loss) | 1.21% | 2.08% | 1.70% | 1.55% | 1.40% |
| Supplemental Data | | | | | |
| Net assets, end of period (000 omitted) | $5,673 | $4,248 | $2,279 | $1,222 | $558 |
| Portfolio turnover rateE | 54% | 24% | 32% | 33% | 24% |
A Calculated based on average shares outstanding during the period.
B Total returns do not reflect charges attributable to your insurance company's separate account. Inclusion of these charges would reduce the total returns shown.
C Total returns would have been lower if certain expenses had not been reduced during the applicable periods shown.
D Expense ratios reflect operating expenses of the class. Expenses before reductions do not reflect amounts reimbursed, waived, or reduced through arrangements with the investment adviser, brokerage services, or other offset arrangements, if applicable, and do not represent the amount paid by the class during periods when reimbursements, waivers or reductions occur.
E Amount does not include the portfolio activity of any underlying mutual funds or exchange-traded funds (ETFs).
See accompanying notes which are an integral part of the financial statements.
VIP Freedom 2005 Portfolio Service Class 2
| Years ended December 31, | 2020 | 2019 | 2018 | 2017 | 2016 |
| Selected Per–Share Data | | | | | |
| Net asset value, beginning of period | $12.72 | $11.62 | $12.37 | $11.50 | $11.28 |
| Income from Investment Operations | | | | | |
| Net investment income (loss)A | .14 | .24 | .19 | .17 | .14 |
| Net realized and unrealized gain (loss) | 1.22 | 1.32 | (.59) | 1.05 | .39 |
| Total from investment operations | 1.36 | 1.56 | (.40) | 1.22 | .53 |
| Distributions from net investment income | (.14) | (.24) | (.18) | (.16) | (.15) |
| Distributions from net realized gain | (.35) | (.22) | (.17) | (.19) | (.15) |
| Total distributions | (.49) | (.46) | (.35) | (.35) | (.31)B |
| Net asset value, end of period | $13.59 | $12.72 | $11.62 | $12.37 | $11.50 |
| Total ReturnC,D | 10.93% | 13.60% | (3.24)% | 10.74% | 4.78% |
| Ratios to Average Net AssetsE | | | | | |
| Expenses before reductions | .25% | .25% | .25% | .25% | .25% |
| Expenses net of fee waivers, if any | .25% | .25% | .25% | .25% | .25% |
| Expenses net of all reductions | .25% | .25% | .25% | .25% | .25% |
| Net investment income (loss) | 1.06% | 1.93% | 1.55% | 1.40% | 1.25% |
| Supplemental Data | | | | | |
| Net assets, end of period (000 omitted) | $286 | $178 | $121 | $104 | $83 |
| Portfolio turnover rateF | 54% | 24% | 32% | 33% | 24% |
A Calculated based on average shares outstanding during the period.
B Total distributions per share do not sum due to rounding.
C Total returns do not reflect charges attributable to your insurance company's separate account. Inclusion of these charges would reduce the total returns shown.
D Total returns would have been lower if certain expenses had not been reduced during the applicable periods shown.
E Expense ratios reflect operating expenses of the class. Expenses before reductions do not reflect amounts reimbursed, waived, or reduced through arrangements with the investment adviser, brokerage services, or other offset arrangements, if applicable, and do not represent the amount paid by the class during periods when reimbursements, waivers or reductions occur.
F Amount does not include the portfolio activity of any underlying mutual funds or exchange-traded funds (ETFs).
See accompanying notes which are an integral part of the financial statements.
VIP Freedom 2010 Portfolio℠
Investment Summary (Unaudited)
The information in the following tables is based on the direct investments of the Fund.
Top Holdings as of December 31, 2020
| | % of fund's net assets |
| VIP Investment Grade Bond Portfolio Initial Class | 35.8 |
| VIP Government Money Market Portfolio Initial Class 0.01% | 16.3 |
| Fidelity Inflation-Protected Bond Index Fund | 9.7 |
| VIP Emerging Markets Portfolio Initial Class | 9.5 |
| VIP Overseas Portfolio Initial Class | 9.1 |
| VIP Growth & Income Portfolio Initial Class | 3.2 |
| VIP Equity-Income Portfolio Initial Class | 2.8 |
| VIP Growth Portfolio Initial Class | 2.7 |
| VIP Contrafund Portfolio Initial Class | 2.7 |
| Fidelity Long-Term Treasury Bond Index Fund | 2.3 |
| | 94.1 |
Asset Allocation (% of fund's net assets)
| Period end |
| | Domestic Equity Funds | 15.3% |
| | International Equity Funds | 18.6% |
| | Bond Funds | 49.8% |
| | Short-Term Funds | 16.3% |

VIP Freedom 2010 Portfolio℠
Schedule of Investments December 31, 2020
Showing Percentage of Net Assets
| Domestic Equity Funds - 15.3% | | | |
| | | Shares | Value |
| VIP Contrafund Portfolio Initial Class (a) | | 201,533 | $9,707,849 |
| VIP Equity-Income Portfolio Initial Class (a) | | 428,695 | 10,245,807 |
| VIP Growth & Income Portfolio Initial Class (a) | | 521,921 | 11,670,164 |
| VIP Growth Portfolio Initial Class (a) | | 96,035 | 9,891,611 |
| VIP Mid Cap Portfolio Initial Class (a) | | 73,078 | 2,829,582 |
| VIP Value Portfolio Initial Class (a) | | 469,836 | 7,493,877 |
| VIP Value Strategies Portfolio Initial Class (a) | | 270,579 | 3,666,342 |
| TOTAL DOMESTIC EQUITY FUNDS | | | |
| (Cost $30,462,705) | | | 55,505,232 |
|
| International Equity Funds - 18.6% | | | |
| VIP Emerging Markets Portfolio Initial Class (a) | | 2,356,934 | 34,764,770 |
| VIP Overseas Portfolio Initial Class (a) | | 1,242,480 | 32,950,569 |
| TOTAL INTERNATIONAL EQUITY FUNDS | | | |
| (Cost $40,974,936) | | | 67,715,339 |
|
| Bond Funds - 49.8% | | | |
| Fidelity Inflation-Protected Bond Index Fund (a) | | 3,182,317 | 35,132,778 |
| Fidelity Long-Term Treasury Bond Index Fund (a) | | 525,150 | 8,376,139 |
| VIP High Income Portfolio Initial Class (a) | | 1,368,579 | 7,267,154 |
| VIP Investment Grade Bond Portfolio Initial Class (a) | | 9,247,051 | 130,290,954 |
| TOTAL BOND FUNDS | | | |
| (Cost $164,950,786) | | | 181,067,025 |
|
| Short-Term Funds - 16.3% | | | |
| VIP Government Money Market Portfolio Initial Class 0.01% (a)(b) | | | |
| (Cost $59,231,528) | | 59,231,528 | 59,231,528 |
| TOTAL INVESTMENT IN SECURITIES - 100.0% | | | |
| (Cost $295,619,955) | | | 363,519,124 |
| NET OTHER ASSETS (LIABILITIES) - 0.0% | | | (67,172) |
| NET ASSETS - 100% | | | $363,451,952 |
Legend
(a) Affiliated Fund
(b) The rate quoted is the annualized seven-day yield of the fund at period end.
Affiliated Underlying Funds
Fiscal year to date information regarding the Fund's investments in affiliated Underlying Funds, excluding any Money Market Central Funds, is presented below. Exchanges between classes of the same affiliated Underlying Funds may occur. Certain Underlying Funds incurred name changes since their most recent shareholder report. The names of the Underlying Funds are those in effect at period end.
| Affiliate | Value, beginning of period | Purchases | Sales Proceeds | Dividend Income | Realized Gain (loss) | Change in Unrealized appreciation (depreciation) | Value, end of period |
| Fidelity Inflation-Protected Bond Index Fund | $30,510,489 | $9,228,237 | $7,395,737 | $421,525 | $111,227 | $2,678,562 | $35,132,778 |
| Fidelity Long-Term Treasury Bond Index Fund | 8,205,514 | 3,642,968 | 4,528,919 | 318,632 | 556,938 | 499,638 | 8,376,139 |
| VIP Contrafund Portfolio Initial Class | 8,958,033 | 4,027,679 | 5,675,325 | 71,094 | 753,007 | 1,644,455 | 9,707,849 |
| VIP Emerging Markets Portfolio Initial Class | 25,368,812 | 16,807,094 | 14,002,187 | 3,204,665 | 732,420 | 5,858,631 | 34,764,770 |
| VIP Equity-Income Portfolio Initial Class | 9,461,866 | 5,982,410 | 5,553,013 | 579,068 | 53,692 | 300,852 | 10,245,807 |
| VIP Government Money Market Portfolio Initial Class 0.01% | 53,021,428 | 27,291,125 | 21,081,025 | 176,413 | -- | -- | 59,231,528 |
| VIP Growth & Income Portfolio Initial Class | 10,787,727 | 6,882,577 | 6,448,533 | 744,977 | 268,269 | 180,124 | 11,670,164 |
| VIP Growth Portfolio Initial Class | 9,155,592 | 4,513,771 | 6,284,465 | 937,359 | 1,115,642 | 1,391,071 | 9,891,611 |
| VIP High Income Portfolio Initial Class | 6,521,610 | 2,331,598 | 1,443,389 | 343,964 | (60,021) | (82,644) | 7,267,154 |
| VIP Investment Grade Bond Portfolio Initial Class | 114,073,633 | 38,477,321 | 29,673,142 | 2,767,007 | (93,962) | 7,507,104 | 130,290,954 |
| VIP Mid Cap Portfolio Initial Class | 2,627,719 | 1,350,130 | 1,728,219 | 15,887 | 44,020 | 535,932 | 2,829,582 |
| VIP Overseas Portfolio Initial Class | 35,920,663 | 13,970,665 | 21,202,839 | 292,412 | 809,435 | 3,452,645 | 32,950,569 |
| VIP Value Portfolio Initial Class | 6,951,308 | 4,569,079 | 4,570,802 | 355,745 | 153,681 | 390,611 | 7,493,877 |
| VIP Value Strategies Portfolio Initial Class | 3,406,361 | 2,307,408 | 2,370,201 | 211,987 | 67,742 | 255,032 | 3,666,342 |
| | 324,970,755 | 141,382,062 | 131,957,796 | 10,440,735 | 4,512,090 | 24,612,013 | 363,519,124 |
Amounts in the income column in the above table include any capital gain distributions from underlying funds, which are presented in the corresponding line-item in the Statement of Operations, if applicable.
Investment Valuation
The following is a summary of the inputs used, as of December 31, 2020, involving the Fund's assets and liabilities carried at fair value. The inputs or methodology used for valuing securities may not be an indication of the risk associated with investing in those securities. For more information on valuation inputs, and their aggregation into the levels used below, please refer to the Investment Valuation section in the accompanying Notes to Financial Statements.
| | Valuation Inputs at Reporting Date: |
| Description | Total | Level 1 | Level 2 | Level 3 |
| Investments in Securities: | | | | |
| Domestic Equity Funds | $55,505,232 | $55,505,232 | $-- | $-- |
| International Equity Funds | 67,715,339 | 67,715,339 | -- | -- |
| Bond Funds | 181,067,025 | 181,067,025 | -- | -- |
| Short-Term Funds | 59,231,528 | 59,231,528 | -- | -- |
| Total Investments in Securities: | $363,519,124 | $363,519,124 | $-- | $-- |
See accompanying notes which are an integral part of the financial statements.
VIP Freedom 2010 Portfolio℠
Financial Statements
Statement of Assets and Liabilities
| | | December 31, 2020 |
| Assets | | |
Investment in securities, at value — See accompanying schedule:
| | |
| Affiliated issuers (cost $295,619,955) | $363,519,124 | |
| Total Investment in Securities (cost $295,619,955) | | $363,519,124 |
| Cash | | 319 |
| Receivable for investments sold | | 4,637,581 |
| Receivable for fund shares sold | | 171,582 |
| Total assets | | 368,328,606 |
| Liabilities | | |
| Payable for investments purchased | $4,760,466 | |
| Payable for fund shares redeemed | 48,694 | |
| Distribution and service plan fees payable | 67,494 | |
| Total liabilities | | 4,876,654 |
| Net Assets | | $363,451,952 |
| Net Assets consist of: | | |
| Paid in capital | | $287,159,772 |
| Total accumulated earnings (loss) | | 76,292,180 |
| Net Assets | | $363,451,952 |
| Net Asset Value and Maximum Offering Price | | |
| Initial Class: | | |
| Net Asset Value, offering price and redemption price per share ($19,194,907 ÷ 1,343,984 shares) | | $14.28 |
| Service Class: | | |
| Net Asset Value, offering price and redemption price per share ($26,484,006 ÷ 1,857,214 shares) | | $14.26 |
| Service Class 2: | | |
| Net Asset Value, offering price and redemption price per share ($317,773,039 ÷ 22,419,917 shares) | | $14.17 |
See accompanying notes which are an integral part of the financial statements.
Statement of Operations
| | | Year ended December 31, 2020 |
| Investment Income | | |
| Dividends: | | |
| Affiliated issuers | | $4,419,206 |
| Expenses | | |
| Distribution and service plan fees | $741,585 | |
| Independent trustees' fees and expenses | 1,066 | |
| Total expenses | | 742,651 |
| Net investment income (loss) | | 3,676,555 |
| Realized and Unrealized Gain (Loss) | | |
| Net realized gain (loss) on: | | |
| Investment securities: | | |
| Affiliated issuers | 4,512,402 | |
| Capital gain distributions from underlying funds: | | |
| Affiliated issuers | 6,021,529 | |
| Total net realized gain (loss) | | 10,533,931 |
| Change in net unrealized appreciation (depreciation) on: | | |
| Investment securities: | | |
| Affiliated issuers | 24,612,013 | |
| Total change in net unrealized appreciation (depreciation) | | 24,612,013 |
| Net gain (loss) | | 35,145,944 |
| Net increase (decrease) in net assets resulting from operations | | $38,822,499 |
See accompanying notes which are an integral part of the financial statements.
Statement of Changes in Net Assets
| | Year ended December 31, 2020 | Year ended December 31, 2019 |
| Increase (Decrease) in Net Assets | | |
| Operations | | |
| Net investment income (loss) | $3,676,555 | $5,909,448 |
| Net realized gain (loss) | 10,533,931 | 13,879,983 |
| Change in net unrealized appreciation (depreciation) | 24,612,013 | 24,820,522 |
| Net increase (decrease) in net assets resulting from operations | 38,822,499 | 44,609,953 |
| Distributions to shareholders | (17,970,235) | (18,588,689) |
| Share transactions - net increase (decrease) | 17,689,139 | 14,107,679 |
| Total increase (decrease) in net assets | 38,541,403 | 40,128,943 |
| Net Assets | | |
| Beginning of period | 324,910,549 | 284,781,606 |
| End of period | $363,451,952 | $324,910,549 |
See accompanying notes which are an integral part of the financial statements.
Financial Highlights
VIP Freedom 2010 Portfolio Initial Class
| Years ended December 31, | 2020 | 2019 | 2018 | 2017 | 2016 |
| Selected Per–Share Data | | | | | |
| Net asset value, beginning of period | $13.42 | $12.32 | $13.43 | $12.31 | $12.15 |
| Income from Investment Operations | | | | | |
| Net investment income (loss)A | .18 | .28 | .22 | .20 | .18 |
| Net realized and unrealized gain (loss) | 1.44 | 1.65 | (.75) | 1.39 | .45 |
| Total from investment operations | 1.62 | 1.93 | (.53) | 1.59 | .63 |
| Distributions from net investment income | (.18) | (.28) | (.22) | (.21) | (.19) |
| Distributions from net realized gain | (.58) | (.55) | (.37) | (.26) | (.28) |
| Total distributions | (.76) | (.83) | (.58)B | (.47) | (.47) |
| Net asset value, end of period | $14.28 | $13.42 | $12.32 | $13.43 | $12.31 |
| Total ReturnC,D | 12.49% | 16.09% | (4.00)% | 13.08% | 5.45% |
| Ratios to Average Net AssetsE | | | | | |
| Expenses before reductionsF | -% | -% | -% | -% | -% |
| Expenses net of fee waivers, if any | - %F | - %F | - %F | -% | -% |
| Expenses net of all reductions | - %F | - %F | - %F | -% | -% |
| Net investment income (loss) | 1.34% | 2.15% | 1.66% | 1.56% | 1.51% |
| Supplemental Data | | | | | |
| Net assets, end of period (000 omitted) | $19,195 | $17,895 | $16,991 | $18,519 | $19,569 |
| Portfolio turnover rateG | 40% | 28% | 31% | 22% | 23% |
A Calculated based on average shares outstanding during the period.
B Total distributions per share do not sum due to rounding.
C Total returns do not reflect charges attributable to your insurance company's separate account. Inclusion of these charges would reduce the total returns shown.
D Total returns would have been lower if certain expenses had not been reduced during the applicable periods shown.
E Expense ratios reflect operating expenses of the class. Expenses before reductions do not reflect amounts reimbursed, waived, or reduced through arrangements with the investment adviser, brokerage services, or other offset arrangements, if applicable, and do not represent the amount paid by the class during periods when reimbursements, waivers or reductions occur.
F Amount represents less than .005%.
G Amount does not include the portfolio activity of any underlying mutual funds or exchange-traded funds (ETFs).
See accompanying notes which are an integral part of the financial statements.
VIP Freedom 2010 Portfolio Service Class
| Years ended December 31, | 2020 | 2019 | 2018 | 2017 | 2016 |
| Selected Per–Share Data | | | | | |
| Net asset value, beginning of period | $13.40 | $12.30 | $13.41 | $12.30 | $12.14 |
| Income from Investment Operations | | | | | |
| Net investment income (loss)A | .16 | .27 | .20 | .19 | .17 |
| Net realized and unrealized gain (loss) | 1.44 | 1.64 | (.74) | 1.38 | .45 |
| Total from investment operations | 1.60 | 1.91 | (.54) | 1.57 | .62 |
| Distributions from net investment income | (.16) | (.27) | (.20) | (.19) | (.18) |
| Distributions from net realized gain | (.58) | (.55) | (.37) | (.26) | (.28) |
| Total distributions | (.74) | (.81)B | (.57) | (.46)B | (.46) |
| Net asset value, end of period | $14.26 | $13.40 | $12.30 | $13.41 | $12.30 |
| Total ReturnC,D | 12.39% | 16.00% | (4.10)% | 12.90% | 5.36% |
| Ratios to Average Net AssetsE | | | | | |
| Expenses before reductions | .10% | .10% | .10% | .10% | .10% |
| Expenses net of fee waivers, if any | .10% | .10% | .10% | .10% | .10% |
| Expenses net of all reductions | .10% | .10% | .10% | .10% | .10% |
| Net investment income (loss) | 1.24% | 2.05% | 1.56% | 1.46% | 1.41% |
| Supplemental Data | | | | | |
| Net assets, end of period (000 omitted) | $26,484 | $26,232 | $23,851 | $27,597 | $25,360 |
| Portfolio turnover rateF | 40% | 28% | 31% | 22% | 23% |
A Calculated based on average shares outstanding during the period.
B Total distributions per share do not sum due to rounding.
C Total returns do not reflect charges attributable to your insurance company's separate account. Inclusion of these charges would reduce the total returns shown.
D Total returns would have been lower if certain expenses had not been reduced during the applicable periods shown.
E Expense ratios reflect operating expenses of the class. Expenses before reductions do not reflect amounts reimbursed, waived, or reduced through arrangements with the investment adviser, brokerage services, or other offset arrangements, if applicable, and do not represent the amount paid by the class during periods when reimbursements, waivers or reductions occur.
F Amount does not include the portfolio activity of any underlying mutual funds or exchange-traded funds (ETFs).
See accompanying notes which are an integral part of the financial statements.
VIP Freedom 2010 Portfolio Service Class 2
| Years ended December 31, | 2020 | 2019 | 2018 | 2017 | 2016 |
| Selected Per–Share Data | | | | | |
| Net asset value, beginning of period | $13.32 | $12.24 | $13.35 | $12.24 | $12.08 |
| Income from Investment Operations | | | | | |
| Net investment income (loss)A | .14 | .24 | .18 | .17 | .15 |
| Net realized and unrealized gain (loss) | 1.43 | 1.63 | (.74) | 1.38 | .45 |
| Total from investment operations | 1.57 | 1.87 | (.56) | 1.55 | .60 |
| Distributions from net investment income | (.14) | (.25) | (.19) | (.17) | (.16) |
| Distributions from net realized gain | (.58) | (.55) | (.37) | (.26) | (.28) |
| Total distributions | (.72) | (.79)B | (.55)B | (.44)B | (.44) |
| Net asset value, end of period | $14.17 | $13.32 | $12.24 | $13.35 | $12.24 |
| Total ReturnC,D | 12.24% | 15.75% | (4.26)% | 12.80% | 5.23% |
| Ratios to Average Net AssetsE | | | | | |
| Expenses before reductions | .25% | .25% | .25% | .25% | .25% |
| Expenses net of fee waivers, if any | .25% | .25% | .25% | .25% | .25% |
| Expenses net of all reductions | .25% | .25% | .25% | .25% | .25% |
| Net investment income (loss) | 1.09% | 1.90% | 1.41% | 1.31% | 1.26% |
| Supplemental Data | | | | | |
| Net assets, end of period (000 omitted) | $317,773 | $280,783 | $243,940 | $269,507 | $251,795 |
| Portfolio turnover rateF | 40% | 28% | 31% | 22% | 23% |
A Calculated based on average shares outstanding during the period.
B Total distributions per share do not sum due to rounding.
C Total returns do not reflect charges attributable to your insurance company's separate account. Inclusion of these charges would reduce the total returns shown.
D Total returns would have been lower if certain expenses had not been reduced during the applicable periods shown.
E Expense ratios reflect operating expenses of the class. Expenses before reductions do not reflect amounts reimbursed, waived, or reduced through arrangements with the investment adviser, brokerage services, or other offset arrangements, if applicable, and do not represent the amount paid by the class during periods when reimbursements, waivers or reductions occur.
F Amount does not include the portfolio activity of any underlying mutual funds or exchange-traded funds (ETFs).
See accompanying notes which are an integral part of the financial statements.
VIP Freedom 2015 Portfolio℠
Investment Summary (Unaudited)
The information in the following tables is based on the direct investments of the Fund.
Top Holdings as of December 31, 2020
| | % of fund's net assets |
| VIP Investment Grade Bond Portfolio Initial Class | 32.1 |
| VIP Government Money Market Portfolio Initial Class 0.01% | 12.1 |
| VIP Overseas Portfolio Initial Class | 11.6 |
| VIP Emerging Markets Portfolio Initial Class | 10.7 |
| Fidelity Inflation-Protected Bond Index Fund | 8.4 |
| VIP Growth & Income Portfolio Initial Class | 4.4 |
| VIP Equity-Income Portfolio Initial Class | 3.8 |
| VIP Growth Portfolio Initial Class | 3.7 |
| VIP Contrafund Portfolio Initial Class | 3.6 |
| VIP Value Portfolio Initial Class | 2.8 |
| | 93.2 |
Asset Allocation (% of fund's net assets)
| Period end |
| | Domestic Equity Funds | 20.8% |
| | International Equity Funds | 22.3% |
| | Bond Funds | 44.8% |
| | Short-Term Funds | 12.1% |

VIP Freedom 2015 Portfolio℠
Schedule of Investments December 31, 2020
Showing Percentage of Net Assets
| Domestic Equity Funds - 20.8% | | | |
| | | Shares | Value |
| VIP Contrafund Portfolio Initial Class (a) | | 74,770 | $3,601,690 |
| VIP Equity-Income Portfolio Initial Class (a) | | 159,046 | 3,801,195 |
| VIP Growth & Income Portfolio Initial Class (a) | | 193,631 | 4,329,594 |
| VIP Growth Portfolio Initial Class (a) | | 35,631 | 3,669,953 |
| VIP Mid Cap Portfolio Initial Class (a) | | 27,113 | 1,049,803 |
| VIP Value Portfolio Initial Class (a) | | 174,312 | 2,780,278 |
| VIP Value Strategies Portfolio Initial Class (a) | | 100,386 | 1,360,234 |
| TOTAL DOMESTIC EQUITY FUNDS | | | |
| (Cost $8,904,595) | | | 20,592,747 |
|
| International Equity Funds - 22.3% | | | |
| VIP Emerging Markets Portfolio Initial Class (a) | | 717,435 | 10,582,173 |
| VIP Overseas Portfolio Initial Class (a) | | 432,929 | 11,481,288 |
| TOTAL INTERNATIONAL EQUITY FUNDS | | | |
| (Cost $12,704,467) | | | 22,063,461 |
|
| Bond Funds - 44.8% | | | |
| Fidelity Inflation-Protected Bond Index Fund (a) | | 752,239 | 8,304,718 |
| Fidelity Long-Term Treasury Bond Index Fund (a) | | 143,119 | 2,282,752 |
| VIP High Income Portfolio Initial Class (a) | | 372,981 | 1,980,531 |
| VIP Investment Grade Bond Portfolio Initial Class (a) | | 2,258,459 | 31,821,686 |
| TOTAL BOND FUNDS | | | |
| (Cost $40,059,269) | | | 44,389,687 |
|
| Short-Term Funds - 12.1% | | | |
| VIP Government Money Market Portfolio Initial Class 0.01% (a)(b) | | | |
| (Cost $12,022,658) | | 12,022,658 | 12,022,658 |
| TOTAL INVESTMENT IN SECURITIES - 100.0% | | | |
| (Cost $73,690,989) | | | 99,068,553 |
| NET OTHER ASSETS (LIABILITIES) - 0.0% | | | (9,653) |
| NET ASSETS - 100% | | | $99,058,900 |
Legend
(a) Affiliated Fund
(b) The rate quoted is the annualized seven-day yield of the fund at period end.
Affiliated Central Funds
Information regarding fiscal year to date income earned by the Fund from investments in Fidelity Central Funds is as follows:
| Fund | Income earned |
| Fidelity Cash Central Fund | $2 |
| Total | $2 |
Amounts in the income column in the above table include any capital gain distributions from underlying funds, which are presented in the corresponding line-item in the Statement of Operations, if applicable.
Affiliated Underlying Funds
Fiscal year to date information regarding the Fund's investments in affiliated Underlying Funds, excluding any Money Market Central Funds, is presented below. Exchanges between classes of the same affiliated Underlying Funds may occur. Certain Underlying Funds incurred name changes since their most recent shareholder report. The names of the Underlying Funds are those in effect at period end.
| Affiliate | Value, beginning of period | Purchases | Sales Proceeds | Dividend Income | Realized Gain (loss) | Change in Unrealized appreciation (depreciation) | Value, end of period |
| Fidelity Inflation-Protected Bond Index Fund | $7,637,591 | $3,556,973 | $3,550,552 | $99,260 | $29,835 | $630,871 | $8,304,718 |
| Fidelity Long-Term Treasury Bond Index Fund | 2,372,970 | 1,352,110 | 1,743,917 | 86,542 | 168,073 | 133,516 | 2,282,752 |
| VIP Contrafund Portfolio Initial Class | 3,492,848 | 1,560,428 | 2,319,715 | 26,755 | 321,910 | 546,219 | 3,601,690 |
| VIP Emerging Markets Portfolio Initial Class | 8,292,353 | 5,832,551 | 5,420,938 | 1,005,520 | 162,238 | 1,715,969 | 10,582,173 |
| VIP Equity-Income Portfolio Initial Class | 3,689,086 | 2,394,011 | 2,374,306 | 217,905 | 13,794 | 78,610 | 3,801,195 |
| VIP Government Money Market Portfolio Initial Class 0.01% | 11,411,775 | 8,072,125 | 7,461,242 | 37,188 | -- | -- | 12,022,658 |
| VIP Growth & Income Portfolio Initial Class | 4,206,126 | 2,776,817 | 2,772,507 | 280,323 | 48,347 | 70,811 | 4,329,594 |
| VIP Growth Portfolio Initial Class | 3,569,954 | 1,752,803 | 2,547,186 | 353,665 | 535,467 | 358,915 | 3,669,953 |
| VIP High Income Portfolio Initial Class | 1,885,826 | 873,343 | 732,180 | 94,014 | (23,853) | (22,605) | 1,980,531 |
| VIP Investment Grade Bond Portfolio Initial Class | 29,453,381 | 14,680,086 | 14,096,198 | 677,725 | (26,519) | 1,810,936 | 31,821,686 |
| VIP Mid Cap Portfolio Initial Class | 1,024,513 | 571,951 | 744,173 | 5,908 | 13,315 | 184,197 | 1,049,803 |
| VIP Overseas Portfolio Initial Class | 12,877,039 | 6,009,926 | 8,816,434 | 101,853 | 51,726 | 1,359,031 | 11,481,288 |
| VIP Value Portfolio Initial Class | 2,710,222 | 1,916,567 | 1,998,331 | 133,975 | 49,450 | 102,370 | 2,780,278 |
| VIP Value Strategies Portfolio Initial Class | 1,328,086 | 978,838 | 1,039,832 | 79,952 | 43,975 | 49,167 | 1,360,234 |
| | 93,951,770 | 52,328,529 | 55,617,511 | 3,200,585 | 1,387,758 | 7,018,007 | 99,068,553 |
Amounts in the income column in the above table include any capital gain distributions from underlying funds, which are presented in the corresponding line-item in the Statement of Operations, if applicable.
Investment Valuation
The following is a summary of the inputs used, as of December 31, 2020, involving the Fund's assets and liabilities carried at fair value. The inputs or methodology used for valuing securities may not be an indication of the risk associated with investing in those securities. For more information on valuation inputs, and their aggregation into the levels used below, please refer to the Investment Valuation section in the accompanying Notes to Financial Statements.
| | Valuation Inputs at Reporting Date: |
| Description | Total | Level 1 | Level 2 | Level 3 |
| Investments in Securities: | | | | |
| Domestic Equity Funds | $20,592,747 | $20,592,747 | $-- | $-- |
| International Equity Funds | 22,063,461 | 22,063,461 | -- | -- |
| Bond Funds | 44,389,687 | 44,389,687 | -- | -- |
| Short-Term Funds | 12,022,658 | 12,022,658 | -- | -- |
| Total Investments in Securities: | $99,068,553 | $99,068,553 | $-- | $-- |
See accompanying notes which are an integral part of the financial statements.
VIP Freedom 2015 Portfolio℠
Financial Statements
Statement of Assets and Liabilities
| | | December 31, 2020 |
| Assets | | |
Investment in securities, at value — See accompanying schedule:
| | |
| Affiliated issuers (cost $73,690,989) | $99,068,553 | |
| Total Investment in Securities (cost $73,690,989) | | $99,068,553 |
| Cash | | 206 |
| Receivable for investments sold | | 1,397,102 |
| Receivable for fund shares sold | | 80,150 |
| Total assets | | 100,546,011 |
| Liabilities | | |
| Payable for investments purchased | $1,326,224 | |
| Payable for fund shares redeemed | 151,022 | |
| Distribution and service plan fees payable | 9,865 | |
| Total liabilities | | 1,487,111 |
| Net Assets | | $99,058,900 |
| Net Assets consist of: | | |
| Paid in capital | | $71,005,172 |
| Total accumulated earnings (loss) | | 28,053,728 |
| Net Assets | | $99,058,900 |
| Net Asset Value and Maximum Offering Price | | |
| Initial Class: | | |
| Net Asset Value, offering price and redemption price per share ($35,009,862 ÷ 2,479,500 shares) | | $14.12 |
| Service Class: | | |
| Net Asset Value, offering price and redemption price per share ($27,208,660 ÷ 1,931,898 shares) | | $14.08 |
| Service Class 2: | | |
| Net Asset Value, offering price and redemption price per share ($36,840,378 ÷ 2,624,494 shares) | | $14.04 |
See accompanying notes which are an integral part of the financial statements.
Statement of Operations
| | | Year ended December 31, 2020 |
| Investment Income | | |
| Dividends: | | |
| Affiliated issuers | | $1,189,598 |
| Income from Fidelity Central Funds | | 2 |
| Total income | | 1,189,600 |
| Expenses | | |
| Distribution and service plan fees | $109,332 | |
| Independent trustees' fees and expenses | 290 | |
| Total expenses | | 109,622 |
| Net investment income (loss) | | 1,079,978 |
| Realized and Unrealized Gain (Loss) | | |
| Net realized gain (loss) on: | | |
| Investment securities: | | |
| Affiliated issuers | 1,387,950 | |
| Capital gain distributions from underlying funds: | | |
| Affiliated issuers | 2,010,987 | |
| Total net realized gain (loss) | | 3,398,937 |
| Change in net unrealized appreciation (depreciation) on: | | |
| Investment securities: | | |
| Affiliated issuers | 7,018,007 | |
| Total change in net unrealized appreciation (depreciation) | | 7,018,007 |
| Net gain (loss) | | 10,416,944 |
| Net increase (decrease) in net assets resulting from operations | | $11,496,922 |
See accompanying notes which are an integral part of the financial statements.
Statement of Changes in Net Assets
| | Year ended December 31, 2020 | Year ended December 31, 2019 |
| Increase (Decrease) in Net Assets | | |
| Operations | | |
| Net investment income (loss) | $1,079,978 | $1,707,642 |
| Net realized gain (loss) | 3,398,937 | 4,435,955 |
| Change in net unrealized appreciation (depreciation) | 7,018,007 | 7,447,377 |
| Net increase (decrease) in net assets resulting from operations | 11,496,922 | 13,590,974 |
| Distributions to shareholders | (5,646,407) | (7,551,822) |
| Share transactions - net increase (decrease) | (733,588) | 11,543,610 |
| Total increase (decrease) in net assets | 5,116,927 | 17,582,762 |
| Net Assets | | |
| Beginning of period | 93,941,973 | 76,359,211 |
| End of period | $99,058,900 | $93,941,973 |
See accompanying notes which are an integral part of the financial statements.
Financial Highlights
VIP Freedom 2015 Portfolio Initial Class
| Years ended December 31, | 2020 | 2019 | 2018 | 2017 | 2016 |
| Selected Per–Share Data | | | | | |
| Net asset value, beginning of period | $13.20 | $12.26 | $13.68 | $12.39 | $12.24 |
| Income from Investment Operations | | | | | |
| Net investment income (loss)A | .17 | .28 | .20 | .20 | .18 |
| Net realized and unrealized gain (loss) | 1.57 | 1.86 | (.87) | 1.64 | .50 |
| Total from investment operations | 1.74 | 2.14 | (.67) | 1.84 | .68 |
| Distributions from net investment income | (.17) | (.27) | (.22) | (.21) | (.19) |
| Distributions from net realized gain | (.65) | (.94) | (.53) | (.34) | (.34) |
| Total distributions | (.82) | (1.20)B | (.75) | (.55) | (.53) |
| Net asset value, end of period | $14.12 | $13.20 | $12.26 | $13.68 | $12.39 |
| Total ReturnC,D | 13.76% | 18.35% | (5.07)% | 15.10% | 5.91% |
| Ratios to Average Net AssetsE,F | | | | | |
| Expenses before reductionsG | -% | -% | -% | -% | -% |
| Expenses net of fee waivers, if any | - %G | - %G | - %G | -% | -% |
| Expenses net of all reductions | - %G | - %G | - %G | -% | -% |
| Net investment income (loss) | 1.33% | 2.22% | 1.52% | 1.51% | 1.46% |
| Supplemental Data | | | | | |
| Net assets, end of period (000 omitted) | $35,010 | $32,215 | $29,361 | $33,249 | $32,720 |
| Portfolio turnover rateH | 58% | 39% | 33% | 27% | 24% |
A Calculated based on average shares outstanding during the period.
B Total distributions per share do not sum due to rounding.
C Total returns do not reflect charges attributable to your insurance company's separate account. Inclusion of these charges would reduce the total returns shown.
D Total returns would have been lower if certain expenses had not been reduced during the applicable periods shown.
E Fees and expenses of any underlying mutual funds or exchange-traded funds (ETFs) are not included in the Fund's expense ratio. The Fund indirectly bears its proportionate share of these expenses. For additional expense information related to investments in Fidelity Central Funds, please refer to the "Investments in Fidelity Central Funds" note found in the Notes to Financial Statements section of the most recent Annual or Semi-Annual report.
F Expense ratios reflect operating expenses of the class. Expenses before reductions do not reflect amounts reimbursed, waived, or reduced through arrangements with the investment adviser, brokerage services, or other offset arrangements, if applicable, and do not represent the amount paid by the class during periods when reimbursements, waivers or reductions occur.
G Amount represents less than .005%.
H Amount does not include the portfolio activity of any underlying mutual funds or exchange-traded funds (ETFs).
See accompanying notes which are an integral part of the financial statements.
VIP Freedom 2015 Portfolio Service Class
| Years ended December 31, | 2020 | 2019 | 2018 | 2017 | 2016 |
| Selected Per–Share Data | | | | | |
| Net asset value, beginning of period | $13.17 | $12.24 | $13.65 | $12.37 | $12.22 |
| Income from Investment Operations | | | | | |
| Net investment income (loss)A | .16 | .27 | .19 | .18 | .17 |
| Net realized and unrealized gain (loss) | 1.56 | 1.85 | (.86) | 1.64 | .50 |
| Total from investment operations | 1.72 | 2.12 | (.67) | 1.82 | .67 |
| Distributions from net investment income | (.16) | (.26) | (.20) | (.19) | (.18) |
| Distributions from net realized gain | (.65) | (.94) | (.53) | (.34) | (.34) |
| Total distributions | (.81) | (1.19)B | (.74)B | (.54)B | (.52) |
| Net asset value, end of period | $14.08 | $13.17 | $12.24 | $13.65 | $12.37 |
| Total ReturnC,D | 13.62% | 18.21% | (5.11)% | 14.93% | 5.81% |
| Ratios to Average Net AssetsE,F | | | | | |
| Expenses before reductions | .10% | .10% | .10% | .10% | .10% |
| Expenses net of fee waivers, if any | .10% | .10% | .10% | .10% | .10% |
| Expenses net of all reductions | .10% | .10% | .10% | .10% | .10% |
| Net investment income (loss) | 1.23% | 2.12% | 1.42% | 1.41% | 1.36% |
| Supplemental Data | | | | | |
| Net assets, end of period (000 omitted) | $27,209 | $22,763 | $11,777 | $17,058 | $14,384 |
| Portfolio turnover rateG | 58% | 39% | 33% | 27% | 24% |
A Calculated based on average shares outstanding during the period.
B Total distributions per share do not sum due to rounding.
C Total returns do not reflect charges attributable to your insurance company's separate account. Inclusion of these charges would reduce the total returns shown.
D Total returns would have been lower if certain expenses had not been reduced during the applicable periods shown.
E Fees and expenses of any underlying mutual funds or exchange-traded funds (ETFs) are not included in the Fund's expense ratio. The Fund indirectly bears its proportionate share of these expenses. For additional expense information related to investments in Fidelity Central Funds, please refer to the "Investments in Fidelity Central Funds" note found in the Notes to Financial Statements section of the most recent Annual or Semi-Annual report.
F Expense ratios reflect operating expenses of the class. Expenses before reductions do not reflect amounts reimbursed, waived, or reduced through arrangements with the investment adviser, brokerage services, or other offset arrangements, if applicable, and do not represent the amount paid by the class during periods when reimbursements, waivers or reductions occur.
G Amount does not include the portfolio activity of any underlying mutual funds or exchange-traded funds (ETFs).
See accompanying notes which are an integral part of the financial statements.
VIP Freedom 2015 Portfolio Service Class 2
| Years ended December 31, | 2020 | 2019 | 2018 | 2017 | 2016 |
| Selected Per–Share Data | | | | | |
| Net asset value, beginning of period | $13.12 | $12.20 | $13.61 | $12.33 | $12.19 |
| Income from Investment Operations | | | | | |
| Net investment income (loss)A | .14 | .25 | .17 | .16 | .15 |
| Net realized and unrealized gain (loss) | 1.57 | 1.84 | (.86) | 1.63 | .49 |
| Total from investment operations | 1.71 | 2.09 | (.69) | 1.79 | .64 |
| Distributions from net investment income | (.14) | (.23) | (.18) | (.17) | (.16) |
| Distributions from net realized gain | (.65) | (.94) | (.53) | (.34) | (.34) |
| Total distributions | (.79) | (1.17) | (.72)B | (.51) | (.50) |
| Net asset value, end of period | $14.04 | $13.12 | $12.20 | $13.61 | $12.33 |
| Total ReturnC,D | 13.56% | 17.97% | (5.28)% | 14.80% | 5.58% |
| Ratios to Average Net AssetsE,F | | | | | |
| Expenses before reductions | .25% | .25% | .25% | .25% | .25% |
| Expenses net of fee waivers, if any | .25% | .25% | .25% | .25% | .25% |
| Expenses net of all reductions | .25% | .25% | .25% | .25% | .25% |
| Net investment income (loss) | 1.08% | 1.97% | 1.27% | 1.26% | 1.21% |
| Supplemental Data | | | | | |
| Net assets, end of period (000 omitted) | $36,840 | $38,963 | $35,222 | $49,688 | $50,238 |
| Portfolio turnover rateG | 58% | 39% | 33% | 27% | 24% |
A Calculated based on average shares outstanding during the period.
B Total distributions per share do not sum due to rounding.
C Total returns do not reflect charges attributable to your insurance company's separate account. Inclusion of these charges would reduce the total returns shown.
D Total returns would have been lower if certain expenses had not been reduced during the applicable periods shown.
E Fees and expenses of any underlying mutual funds or exchange-traded funds (ETFs) are not included in the Fund's expense ratio. The Fund indirectly bears its proportionate share of these expenses. For additional expense information related to investments in Fidelity Central Funds, please refer to the "Investments in Fidelity Central Funds" note found in the Notes to Financial Statements section of the most recent Annual or Semi-Annual report.
F Expense ratios reflect operating expenses of the class. Expenses before reductions do not reflect amounts reimbursed, waived, or reduced through arrangements with the investment adviser, brokerage services, or other offset arrangements, if applicable, and do not represent the amount paid by the class during periods when reimbursements, waivers or reductions occur.
G Amount does not include the portfolio activity of any underlying mutual funds or exchange-traded funds (ETFs).
See accompanying notes which are an integral part of the financial statements.
VIP Freedom 2020 Portfolio℠
Investment Summary (Unaudited)
The information in the following tables is based on the direct investments of the Fund.
Top Holdings as of December 31, 2020
| | % of fund's net assets |
| VIP Investment Grade Bond Portfolio Initial Class | 28.4 |
| VIP Overseas Portfolio Initial Class | 14.0 |
| VIP Emerging Markets Portfolio Initial Class | 11.8 |
| VIP Government Money Market Portfolio Initial Class 0.01% | 8.3 |
| Fidelity Inflation-Protected Bond Index Fund | 7.1 |
| VIP Growth & Income Portfolio Initial Class | 5.5 |
| VIP Equity-Income Portfolio Initial Class | 4.8 |
| VIP Growth Portfolio Initial Class | 4.7 |
| VIP Contrafund Portfolio Initial Class | 4.6 |
| VIP Value Portfolio Initial Class | 3.5 |
| | 92.7 |
Asset Allocation (% of fund's net assets)
| Period end |
| | Domestic Equity Funds | 26.1% |
| | International Equity Funds | 25.8% |
| | Bond Funds | 39.8% |
| | Short-Term Funds | 8.3% |

VIP Freedom 2020 Portfolio℠
Schedule of Investments December 31, 2020
Showing Percentage of Net Assets
| Domestic Equity Funds - 26.1% | | | |
| | | Shares | Value |
| VIP Contrafund Portfolio Initial Class (a) | | 740,122 | $35,651,655 |
| VIP Equity-Income Portfolio Initial Class (a) | | 1,574,296 | 37,625,684 |
| VIP Growth & Income Portfolio Initial Class (a) | | 1,916,638 | 42,856,034 |
| VIP Growth Portfolio Initial Class (a) | | 352,700 | 36,328,151 |
| VIP Mid Cap Portfolio Initial Class (a) | | 268,377 | 10,391,566 |
| VIP Value Portfolio Initial Class (a) | | 1,725,422 | 27,520,478 |
| VIP Value Strategies Portfolio Initial Class (a) | | 993,676 | 13,464,304 |
| TOTAL DOMESTIC EQUITY FUNDS | | | |
| (Cost $101,798,592) | | | 203,837,872 |
|
| International Equity Funds - 25.8% | | | |
| VIP Emerging Markets Portfolio Initial Class (a) | | 6,230,770 | 91,903,860 |
| VIP Overseas Portfolio Initial Class (a) | | 4,129,967 | 109,526,724 |
| TOTAL INTERNATIONAL EQUITY FUNDS | | | |
| (Cost $119,274,653) | | | 201,430,584 |
|
| Bond Funds - 39.8% | | | |
| Fidelity Inflation-Protected Bond Index Fund (a) | | 5,054,909 | 55,806,197 |
| Fidelity Long-Term Treasury Bond Index Fund (a) | | 1,128,997 | 18,007,495 |
| VIP High Income Portfolio Initial Class (a) | | 2,942,281 | 15,623,512 |
| VIP Investment Grade Bond Portfolio Initial Class (a) | | 15,763,004 | 222,100,722 |
| TOTAL BOND FUNDS | | | |
| (Cost $283,842,146) | | | 311,537,926 |
|
| Short-Term Funds - 8.3% | | | |
| VIP Government Money Market Portfolio Initial Class 0.01% (a)(b) | | | |
| (Cost $64,685,797) | | 64,685,797 | 64,685,797 |
| TOTAL INVESTMENT IN SECURITIES - 100.0% | | | |
| (Cost $569,601,188) | | | 781,492,179 |
| NET OTHER ASSETS (LIABILITIES) - 0.0% | | | (122,369) |
| NET ASSETS - 100% | | | $781,369,810 |
Legend
(a) Affiliated Fund
(b) The rate quoted is the annualized seven-day yield of the fund at period end.
Affiliated Central Funds
Information regarding fiscal year to date income earned by the Fund from investments in Fidelity Central Funds is as follows:
| Fund | Income earned |
| Fidelity Cash Central Fund | $17 |
| Total | $17 |
Amounts in the income column in the above table include any capital gain distributions from underlying funds, which are presented in the corresponding line-item in the Statement of Operations, if applicable.
Affiliated Underlying Funds
Fiscal year to date information regarding the Fund's investments in affiliated Underlying Funds, excluding any Money Market Central Funds, is presented below. Exchanges between classes of the same affiliated Underlying Funds may occur. Certain Underlying Funds incurred name changes since their most recent shareholder report. The names of the Underlying Funds are those in effect at period end.
| Affiliate | Value, beginning of period | Purchases | Sales Proceeds | Dividend Income | Realized Gain (loss) | Change in Unrealized appreciation (depreciation) | Value, end of period |
| Fidelity Inflation-Protected Bond Index Fund | $52,304,443 | $16,038,027 | $17,138,784 | $670,270 | $310,284 | $4,292,227 | $55,806,197 |
| Fidelity Long-Term Treasury Bond Index Fund | 19,040,701 | 8,219,842 | 11,728,885 | 695,003 | 1,438,946 | 1,036,891 | 18,007,495 |
| VIP Contrafund Portfolio Initial Class | 34,492,277 | 10,091,884 | 17,729,721 | 266,664 | 3,098,091 | 5,699,124 | 35,651,655 |
| VIP Emerging Markets Portfolio Initial Class | 73,323,118 | 34,565,483 | 32,541,304 | 8,932,652 | 1,909,833 | 14,646,730 | 91,903,860 |
| VIP Equity-Income Portfolio Initial Class | 36,430,507 | 15,739,781 | 15,397,286 | 2,171,875 | 258,718 | 593,964 | 37,625,684 |
| VIP Government Money Market Portfolio Initial Class 0.01% | 64,501,175 | 39,916,983 | 39,732,361 | 217,870 | -- | -- | 64,685,797 |
| VIP Growth & Income Portfolio Initial Class | 41,535,914 | 18,896,677 | 18,708,920 | 2,793,933 | 579,677 | 552,686 | 42,856,034 |
| VIP Growth Portfolio Initial Class | 35,253,337 | 10,504,243 | 18,545,452 | 3,528,300 | 5,073,647 | 4,042,376 | 36,328,151 |
| VIP High Income Portfolio Initial Class | 15,132,475 | 4,480,334 | 3,621,235 | 746,194 | (92,131) | (275,931) | 15,623,512 |
| VIP Investment Grade Bond Portfolio Initial Class | 210,474,015 | 74,499,186 | 75,946,607 | 4,772,412 | (378,020) | 13,452,148 | 222,100,722 |
| VIP Mid Cap Portfolio Initial Class | 10,117,078 | 3,624,148 | 5,342,806 | 58,626 | 178,269 | 1,814,877 | 10,391,566 |
| VIP Overseas Portfolio Initial Class | 121,255,989 | 34,849,886 | 60,699,074 | 971,465 | 2,411,168 | 11,708,755 | 109,526,724 |
| VIP Value Portfolio Initial Class | 26,763,797 | 13,775,745 | 14,542,742 | 1,335,785 | 811,256 | 712,422 | 27,520,478 |
| VIP Value Strategies Portfolio Initial Class | 13,114,930 | 7,196,541 | 7,787,470 | 797,536 | 544,211 | 396,092 | 13,464,304 |
| | 753,739,756 | 292,398,760 | 339,462,647 | 27,958,585 | 16,143,949 | 58,672,361 | 781,492,179 |
Amounts in the income column in the above table include any capital gain distributions from underlying funds, which are presented in the corresponding line-item in the Statement of Operations, if applicable.
Investment Valuation
The following is a summary of the inputs used, as of December 31, 2020, involving the Fund's assets and liabilities carried at fair value. The inputs or methodology used for valuing securities may not be an indication of the risk associated with investing in those securities. For more information on valuation inputs, and their aggregation into the levels used below, please refer to the Investment Valuation section in the accompanying Notes to Financial Statements.
| | Valuation Inputs at Reporting Date: |
| Description | Total | Level 1 | Level 2 | Level 3 |
| Investments in Securities: | | | | |
| Domestic Equity Funds | $203,837,872 | $203,837,872 | $-- | $-- |
| International Equity Funds | 201,430,584 | 201,430,584 | -- | -- |
| Bond Funds | 311,537,926 | 311,537,926 | -- | -- |
| Short-Term Funds | 64,685,797 | 64,685,797 | -- | -- |
| Total Investments in Securities: | $781,492,179 | $781,492,179 | $-- | $-- |
See accompanying notes which are an integral part of the financial statements.
VIP Freedom 2020 Portfolio℠
Financial Statements
Statement of Assets and Liabilities
| | | December 31, 2020 |
| Assets | | |
Investment in securities, at value — See accompanying schedule:
| | |
| Affiliated issuers (cost $569,601,188) | $781,492,179 | |
| Total Investment in Securities (cost $569,601,188) | | $781,492,179 |
| Cash | | 76 |
| Receivable for investments sold | | 11,678,040 |
| Receivable for fund shares sold | | 830,137 |
| Total assets | | 794,000,432 |
| Liabilities | | |
| Payable for investments purchased | $10,480,857 | |
| Payable for fund shares redeemed | 2,027,321 | |
| Distribution and service plan fees payable | 122,444 | |
| Total liabilities | | 12,630,622 |
| Net Assets | | $781,369,810 |
| Net Assets consist of: | | |
| Paid in capital | | $538,610,532 |
| Total accumulated earnings (loss) | | 242,759,278 |
| Net Assets | | $781,369,810 |
| Net Asset Value and Maximum Offering Price | | |
| Initial Class: | | |
| Net Asset Value, offering price and redemption price per share ($80,503,286 ÷ 5,357,490 shares) | | $15.03 |
| Service Class: | | |
| Net Asset Value, offering price and redemption price per share ($178,229,313 ÷ 11,901,947 shares) | | $14.97 |
| Service Class 2: | | |
| Net Asset Value, offering price and redemption price per share ($522,637,211 ÷ 35,029,832 shares) | | $14.92 |
See accompanying notes which are an integral part of the financial statements.
Statement of Operations
| | | Year ended December 31, 2020 |
| Investment Income | | |
| Dividends: | | |
| Affiliated issuers | | $9,308,475 |
| Income from Fidelity Central Funds | | 17 |
| Total income | | 9,308,492 |
| Expenses | | |
| Distribution and service plan fees | $1,391,668 | |
| Independent trustees' fees and expenses | 2,375 | |
| Total expenses before reductions | 1,394,043 | |
| Expense reductions | (2) | |
| Total expenses after reductions | | 1,394,041 |
| Net investment income (loss) | | 7,914,451 |
| Realized and Unrealized Gain (Loss) | | |
| Net realized gain (loss) on: | | |
| Investment securities: | | |
| Affiliated issuers | 16,143,979 | |
| Capital gain distributions from underlying funds: | | |
| Affiliated issuers | 18,650,110 | |
| Total net realized gain (loss) | | 34,794,089 |
| Change in net unrealized appreciation (depreciation) on: | | |
| Investment securities: | | |
| Affiliated issuers | 58,672,361 | |
| Total change in net unrealized appreciation (depreciation) | | 58,672,361 |
| Net gain (loss) | | 93,466,450 |
| Net increase (decrease) in net assets resulting from operations | | $101,380,901 |
See accompanying notes which are an integral part of the financial statements.
Statement of Changes in Net Assets
| | Year ended December 31, 2020 | Year ended December 31, 2019 |
| Increase (Decrease) in Net Assets | | |
| Operations | | |
| Net investment income (loss) | $7,914,451 | $13,374,034 |
| Net realized gain (loss) | 34,794,089 | 44,185,595 |
| Change in net unrealized appreciation (depreciation) | 58,672,361 | 70,320,158 |
| Net increase (decrease) in net assets resulting from operations | 101,380,901 | 127,879,787 |
| Distributions to shareholders | (51,135,890) | (51,869,890) |
| Share transactions - net increase (decrease) | (22,496,103) | 17,856,515 |
| Total increase (decrease) in net assets | 27,748,908 | 93,866,412 |
| Net Assets | | |
| Beginning of period | 753,620,902 | 659,754,490 |
| End of period | $781,369,810 | $753,620,902 |
See accompanying notes which are an integral part of the financial statements.
Financial Highlights
VIP Freedom 2020 Portfolio Initial Class
| Years ended December 31, | 2020 | 2019 | 2018 | 2017 | 2016 |
| Selected Per–Share Data | | | | | |
| Net asset value, beginning of period | $14.01 | $12.58 | $14.03 | $12.56 | $12.44 |
| Income from Investment Operations | | | | | |
| Net investment income (loss)A | .17 | .28 | .21 | .21 | .18 |
| Net realized and unrealized gain (loss) | 1.84 | 2.16 | (1.01) | 1.84 | .53 |
| Total from investment operations | 2.01 | 2.44 | (.80) | 2.05 | .71 |
| Distributions from net investment income | (.18) | (.28) | (.21) | (.21) | (.19) |
| Distributions from net realized gain | (.80) | (.73) | (.44) | (.37) | (.39) |
| Total distributions | (.99)B | (1.01) | (.65) | (.58) | (.59)B |
| Net asset value, end of period | $15.03 | $14.01 | $12.58 | $14.03 | $12.56 |
| Total ReturnC,D | 15.06% | 20.13% | (5.86)% | 16.62% | 6.12% |
| Ratios to Average Net AssetsE,F | | | | | |
| Expenses before reductionsG | -% | -% | -% | -% | -% |
| Expenses net of fee waivers, if any | - %G | - %G | - %G | -% | -% |
| Expenses net of all reductions | - %G | - %G | - %G | -% | -% |
| Net investment income (loss) | 1.27% | 2.08% | 1.50% | 1.54% | 1.50% |
| Supplemental Data | | | | | |
| Net assets, end of period (000 omitted) | $80,503 | $74,801 | $63,490 | $75,021 | $63,131 |
| Portfolio turnover rateH | 40% | 31% | 28% | 21% | 19% |
A Calculated based on average shares outstanding during the period.
B Total distributions per share do not sum due to rounding.
C Total returns do not reflect charges attributable to your insurance company's separate account. Inclusion of these charges would reduce the total returns shown.
D Total returns would have been lower if certain expenses had not been reduced during the applicable periods shown.
E Fees and expenses of any underlying mutual funds or exchange-traded funds (ETFs) are not included in the Fund's expense ratio. The Fund indirectly bears its proportionate share of these expenses. For additional expense information related to investments in Fidelity Central Funds, please refer to the "Investments in Fidelity Central Funds" note found in the Notes to Financial Statements section of the most recent Annual or Semi-Annual report.
F Expense ratios reflect operating expenses of the class. Expenses before reductions do not reflect amounts reimbursed, waived, or reduced through arrangements with the investment adviser, brokerage services, or other offset arrangements, if applicable, and do not represent the amount paid by the class during periods when reimbursements, waivers or reductions occur.
G Amount represents less than .005%.
H Amount does not include the portfolio activity of any underlying mutual funds or exchange-traded funds (ETFs).
See accompanying notes which are an integral part of the financial statements.
VIP Freedom 2020 Portfolio Service Class
| Years ended December 31, | 2020 | 2019 | 2018 | 2017 | 2016 |
| Selected Per–Share Data | | | | | |
| Net asset value, beginning of period | $13.96 | $12.54 | $13.99 | $12.53 | $12.41 |
| Income from Investment Operations | | | | | |
| Net investment income (loss)A | .16 | .26 | .19 | .19 | .17 |
| Net realized and unrealized gain (loss) | 1.82 | 2.16 | (1.00) | 1.84 | .53 |
| Total from investment operations | 1.98 | 2.42 | (.81) | 2.03 | .70 |
| Distributions from net investment income | (.17) | (.27) | (.20) | (.20) | (.18) |
| Distributions from net realized gain | (.80) | (.73) | (.44) | (.37) | (.39) |
| Total distributions | (.97) | (1.00) | (.64) | (.57) | (.58)B |
| Net asset value, end of period | $14.97 | $13.96 | $12.54 | $13.99 | $12.53 |
| Total ReturnC,D | 14.92% | 20.01% | (5.98)% | 16.47% | 6.04% |
| Ratios to Average Net AssetsE,F | | | | | |
| Expenses before reductions | .10% | .10% | .10% | .10% | .10% |
| Expenses net of fee waivers, if any | .10% | .10% | .10% | .10% | .10% |
| Expenses net of all reductions | .10% | .10% | .10% | .10% | .10% |
| Net investment income (loss) | 1.17% | 1.98% | 1.40% | 1.44% | 1.40% |
| Supplemental Data | | | | | |
| Net assets, end of period (000 omitted) | $178,229 | $171,842 | $132,086 | $140,686 | $109,279 |
| Portfolio turnover rateG | 40% | 31% | 28% | 21% | 19% |
A Calculated based on average shares outstanding during the period.
B Total distributions per share do not sum due to rounding.
C Total returns do not reflect charges attributable to your insurance company's separate account. Inclusion of these charges would reduce the total returns shown.
D Total returns would have been lower if certain expenses had not been reduced during the applicable periods shown.
E Fees and expenses of any underlying mutual funds or exchange-traded funds (ETFs) are not included in the Fund's expense ratio. The Fund indirectly bears its proportionate share of these expenses. For additional expense information related to investments in Fidelity Central Funds, please refer to the "Investments in Fidelity Central Funds" note found in the Notes to Financial Statements section of the most recent Annual or Semi-Annual report.
F Expense ratios reflect operating expenses of the class. Expenses before reductions do not reflect amounts reimbursed, waived, or reduced through arrangements with the investment adviser, brokerage services, or other offset arrangements, if applicable, and do not represent the amount paid by the class during periods when reimbursements, waivers or reductions occur.
G Amount does not include the portfolio activity of any underlying mutual funds or exchange-traded funds (ETFs).
See accompanying notes which are an integral part of the financial statements.
VIP Freedom 2020 Portfolio Service Class 2
| Years ended December 31, | 2020 | 2019 | 2018 | 2017 | 2016 |
| Selected Per–Share Data | | | | | |
| Net asset value, beginning of period | $13.92 | $12.50 | $13.94 | $12.49 | $12.38 |
| Income from Investment Operations | | | | | |
| Net investment income (loss)A | .14 | .24 | .17 | .17 | .15 |
| Net realized and unrealized gain (loss) | 1.81 | 2.16 | (.99) | 1.83 | .51 |
| Total from investment operations | 1.95 | 2.40 | (.82) | 2.00 | .66 |
| Distributions from net investment income | (.14) | (.25) | (.18) | (.17) | (.16) |
| Distributions from net realized gain | (.80) | (.73) | (.44) | (.37) | (.39) |
| Total distributions | (.95)B | (.98) | (.62) | (.55)B | (.55) |
| Net asset value, end of period | $14.92 | $13.92 | $12.50 | $13.94 | $12.49 |
| Total ReturnC,D | 14.72% | 19.88% | (6.08)% | 16.26% | 5.80% |
| Ratios to Average Net AssetsE,F | | | | | |
| Expenses before reductions | .25% | .25% | .25% | .25% | .25% |
| Expenses net of fee waivers, if any | .25% | .25% | .25% | .25% | .25% |
| Expenses net of all reductions | .25% | .25% | .25% | .25% | .25% |
| Net investment income (loss) | 1.02% | 1.83% | 1.25% | 1.29% | 1.25% |
| Supplemental Data | | | | | |
| Net assets, end of period (000 omitted) | $522,637 | $506,978 | $464,178 | $556,429 | $531,518 |
| Portfolio turnover rateG | 40% | 31% | 28% | 21% | 19% |
A Calculated based on average shares outstanding during the period.
B Total distributions per share do not sum due to rounding.
C Total returns do not reflect charges attributable to your insurance company's separate account. Inclusion of these charges would reduce the total returns shown.
D Total returns would have been lower if certain expenses had not been reduced during the applicable periods shown.
E Fees and expenses of any underlying mutual funds or exchange-traded funds (ETFs) are not included in the Fund's expense ratio. The Fund indirectly bears its proportionate share of these expenses. For additional expense information related to investments in Fidelity Central Funds, please refer to the "Investments in Fidelity Central Funds" note found in the Notes to Financial Statements section of the most recent Annual or Semi-Annual report.
F Expense ratios reflect operating expenses of the class. Expenses before reductions do not reflect amounts reimbursed, waived, or reduced through arrangements with the investment adviser, brokerage services, or other offset arrangements, if applicable, and do not represent the amount paid by the class during periods when reimbursements, waivers or reductions occur.
G Amount does not include the portfolio activity of any underlying mutual funds or exchange-traded funds (ETFs).
See accompanying notes which are an integral part of the financial statements.
VIP Freedom 2025 Portfolio℠
Investment Summary (Unaudited)
The information in the following tables is based on the direct investments of the Fund.
Top Holdings as of December 31, 2020
| | % of fund's net assets |
| VIP Investment Grade Bond Portfolio Initial Class | 25.9 |
| VIP Overseas Portfolio Initial Class | 15.8 |
| VIP Emerging Markets Portfolio Initial Class | 12.6 |
| Fidelity Inflation-Protected Bond Index Fund | 6.3 |
| VIP Growth & Income Portfolio Initial Class | 6.3 |
| VIP Equity-Income Portfolio Initial Class | 5.5 |
| VIP Growth Portfolio Initial Class | 5.3 |
| VIP Contrafund Portfolio Initial Class | 5.3 |
| VIP Government Money Market Portfolio Initial Class 0.01% | 5.1 |
| VIP Value Portfolio Initial Class | 4.1 |
| | 92.2 |
Asset Allocation (% of fund's net assets)
| Period end |
| | Domestic Equity Funds | 30.0% |
| | International Equity Funds | 28.4% |
| | Bond Funds | 36.5% |
| | Short-Term Funds | 5.1% |

VIP Freedom 2025 Portfolio℠
Schedule of Investments December 31, 2020
Showing Percentage of Net Assets
| Domestic Equity Funds - 30.0% | | | |
| | | Shares | Value |
| VIP Contrafund Portfolio Initial Class (a) | | 343,577 | $16,550,098 |
| VIP Equity-Income Portfolio Initial Class (a) | | 730,806 | 17,466,263 |
| VIP Growth & Income Portfolio Initial Class (a) | | 889,729 | 19,894,340 |
| VIP Growth Portfolio Initial Class (a) | | 163,731 | 16,864,291 |
| VIP Mid Cap Portfolio Initial Class (a) | | 124,586 | 4,823,974 |
| VIP Value Portfolio Initial Class (a) | | 800,966 | 12,775,403 |
| VIP Value Strategies Portfolio Initial Class (a) | | 461,280 | 6,250,350 |
| TOTAL DOMESTIC EQUITY FUNDS | | | |
| (Cost $62,505,275) | | | 94,624,719 |
|
| International Equity Funds - 28.4% | | | |
| VIP Emerging Markets Portfolio Initial Class (a) | | 2,687,790 | 39,644,903 |
| VIP Overseas Portfolio Initial Class (a) | | 1,881,269 | 49,891,258 |
| TOTAL INTERNATIONAL EQUITY FUNDS | | | |
| (Cost $61,894,424) | | | 89,536,161 |
|
| Bond Funds - 36.5% | | | |
| Fidelity Inflation-Protected Bond Index Fund (a) | | 1,812,774 | 20,013,026 |
| Fidelity Long-Term Treasury Bond Index Fund (a) | | 456,035 | 7,273,757 |
| VIP High Income Portfolio Initial Class (a) | | 1,188,506 | 6,310,969 |
| VIP Investment Grade Bond Portfolio Initial Class (a) | | 5,798,026 | 81,694,180 |
| TOTAL BOND FUNDS | | | |
| (Cost $107,170,475) | | | 115,291,932 |
|
| Short-Term Funds - 5.1% | | | |
| VIP Government Money Market Portfolio Initial Class 0.01% (a)(b) | | | |
| (Cost $16,220,300) | | 16,220,300 | 16,220,300 |
| TOTAL INVESTMENT IN SECURITIES - 100.0% | | | |
| (Cost $247,790,474) | | | 315,673,112 |
| NET OTHER ASSETS (LIABILITIES) - 0.0% | | | (31,502) |
| NET ASSETS - 100% | | | $315,641,610 |
Legend
(a) Affiliated Fund
(b) The rate quoted is the annualized seven-day yield of the fund at period end.
Affiliated Central Funds
Information regarding fiscal year to date income earned by the Fund from investments in Fidelity Central Funds is as follows:
| Fund | Income earned |
| Fidelity Cash Central Fund | $3 |
| Total | $3 |
Amounts in the income column in the above table include any capital gain distributions from underlying funds, which are presented in the corresponding line-item in the Statement of Operations, if applicable.
Affiliated Underlying Funds
Fiscal year to date information regarding the Fund's investments in affiliated Underlying Funds, excluding any Money Market Central Funds, is presented below. Exchanges between classes of the same affiliated Underlying Funds may occur. Certain Underlying Funds incurred name changes since their most recent shareholder report. The names of the Underlying Funds are those in effect at period end.
| Affiliate | Value, beginning of period | Purchases | Sales Proceeds | Dividend Income | Realized Gain (loss) | Change in Unrealized appreciation (depreciation) | Value, end of period |
| Fidelity Inflation-Protected Bond Index Fund | $14,947,742 | $11,648,002 | $8,014,875 | $233,962 | $64,072 | $1,368,085 | $20,013,026 |
| Fidelity Long-Term Treasury Bond Index Fund | 6,102,626 | 5,483,485 | 5,081,856 | 259,096 | 410,868 | 358,634 | 7,273,757 |
| VIP Contrafund Portfolio Initial Class | 12,709,454 | 8,912,190 | 8,771,555 | 105,325 | 320,185 | 3,379,824 | 16,550,098 |
| VIP Emerging Markets Portfolio Initial Class | 25,230,537 | 22,823,865 | 15,637,651 | 3,316,823 | 401,613 | 6,826,539 | 39,644,903 |
| VIP Equity-Income Portfolio Initial Class | 13,422,714 | 11,260,528 | 7,899,438 | 858,696 | (46,123) | 728,582 | 17,466,263 |
| VIP Government Money Market Portfolio Initial Class 0.01% | 12,818,552 | 17,558,864 | 14,157,116 | 46,805 | -- | -- | 16,220,300 |
| VIP Growth & Income Portfolio Initial Class | 15,304,170 | 13,204,651 | 9,499,521 | 1,105,604 | (22,951) | 907,991 | 19,894,340 |
| VIP Growth Portfolio Initial Class | 12,990,028 | 9,056,861 | 9,132,466 | 1,367,931 | 415,871 | 3,533,997 | 16,864,291 |
| VIP High Income Portfolio Initial Class | 4,849,296 | 3,673,025 | 2,115,874 | 285,009 | (35,194) | (60,284) | 6,310,969 |
| VIP Investment Grade Bond Portfolio Initial Class | 61,264,240 | 51,567,861 | 35,250,095 | 1,646,058 | (53,701) | 4,165,875 | 81,694,180 |
| VIP Mid Cap Portfolio Initial Class | 3,727,548 | 2,843,103 | 2,671,901 | 25,210 | (45,065) | 970,289 | 4,823,974 |
| VIP Overseas Portfolio Initial Class | 43,453,220 | 29,203,219 | 29,363,658 | 388,889 | (170,392) | 6,768,869 | 49,891,258 |
| VIP Value Portfolio Initial Class | 9,860,799 | 9,153,433 | 7,232,749 | 525,176 | (96,284) | 1,090,204 | 12,775,403 |
| VIP Value Strategies Portfolio Initial Class | 4,831,881 | 4,672,193 | 3,835,274 | 310,113 | (218,377) | 799,927 | 6,250,350 |
| | 241,512,807 | 201,061,280 | 158,664,029 | 10,474,697 | 924,522 | 30,838,532 | 315,673,112 |
Amounts in the income column in the above table include any capital gain distributions from underlying funds, which are presented in the corresponding line-item in the Statement of Operations, if applicable.
Investment Valuation
The following is a summary of the inputs used, as of December 31, 2020, involving the Fund's assets and liabilities carried at fair value. The inputs or methodology used for valuing securities may not be an indication of the risk associated with investing in those securities. For more information on valuation inputs, and their aggregation into the levels used below, please refer to the Investment Valuation section in the accompanying Notes to Financial Statements.
| | Valuation Inputs at Reporting Date: |
| Description | Total | Level 1 | Level 2 | Level 3 |
| Investments in Securities: | | | | |
| Domestic Equity Funds | $94,624,719 | $94,624,719 | $-- | $-- |
| International Equity Funds | 89,536,161 | 89,536,161 | -- | -- |
| Bond Funds | 115,291,932 | 115,291,932 | -- | -- |
| Short-Term Funds | 16,220,300 | 16,220,300 | -- | -- |
| Total Investments in Securities: | $315,673,112 | $315,673,112 | $-- | $-- |
See accompanying notes which are an integral part of the financial statements.
VIP Freedom 2025 Portfolio℠
Financial Statements
Statement of Assets and Liabilities
| | | December 31, 2020 |
| Assets | | |
Investment in securities, at value — See accompanying schedule:
| | |
| Affiliated issuers (cost $247,790,474) | $315,673,112 | |
| Total Investment in Securities (cost $247,790,474) | | $315,673,112 |
| Cash | | 3,461 |
| Receivable for investments sold | | 4,537,269 |
| Receivable for fund shares sold | | 375,709 |
| Total assets | | 320,589,551 |
| Liabilities | | |
| Payable for investments purchased | $4,093,665 | |
| Payable for fund shares redeemed | 819,316 | |
| Distribution and service plan fees payable | 34,960 | |
| Total liabilities | | 4,947,941 |
| Net Assets | | $315,641,610 |
| Net Assets consist of: | | |
| Paid in capital | | $241,903,379 |
| Total accumulated earnings (loss) | | 73,738,231 |
| Net Assets | | $315,641,610 |
| Net Asset Value and Maximum Offering Price | | |
| Initial Class: | | |
| Net Asset Value, offering price and redemption price per share ($55,624,242 ÷ 3,303,424 shares) | | $16.84 |
| Service Class: | | |
| Net Asset Value, offering price and redemption price per share ($147,903,729 ÷ 8,809,787 shares) | | $16.79 |
| Service Class 2: | | |
| Net Asset Value, offering price and redemption price per share ($112,113,639 ÷ 6,716,423 shares) | | $16.69 |
See accompanying notes which are an integral part of the financial statements.
Statement of Operations
| | | Year ended December 31, 2020 |
| Investment Income | | |
| Dividends: | | |
| Affiliated issuers | | $3,476,168 |
| Income from Fidelity Central Funds | | 3 |
| Total income | | 3,476,171 |
| Expenses | | |
| Distribution and service plan fees | $362,133 | |
| Independent trustees' fees and expenses | 825 | |
| Total expenses | | 362,958 |
| Net investment income (loss) | | 3,113,213 |
| Realized and Unrealized Gain (Loss) | | |
| Net realized gain (loss) on: | | |
| Investment securities: | | |
| Affiliated issuers | 927,946 | |
| Capital gain distributions from underlying funds: | | |
| Affiliated issuers | 6,998,529 | |
| Total net realized gain (loss) | | 7,926,475 |
| Change in net unrealized appreciation (depreciation) on: | | |
| Investment securities: | | |
| Affiliated issuers | 30,838,532 | |
| Total change in net unrealized appreciation (depreciation) | | 30,838,532 |
| Net gain (loss) | | 38,765,007 |
| Net increase (decrease) in net assets resulting from operations | | $41,878,220 |
See accompanying notes which are an integral part of the financial statements.
Statement of Changes in Net Assets
| | Year ended December 31, 2020 | Year ended December 31, 2019 |
| Increase (Decrease) in Net Assets | | |
| Operations | | |
| Net investment income (loss) | $3,113,213 | $4,200,362 |
| Net realized gain (loss) | 7,926,475 | 10,333,454 |
| Change in net unrealized appreciation (depreciation) | 30,838,532 | 27,368,384 |
| Net increase (decrease) in net assets resulting from operations | 41,878,220 | 41,902,200 |
| Distributions to shareholders | (14,133,069) | (10,068,406) |
| Share transactions - net increase (decrease) | 46,411,025 | 23,288,175 |
| Total increase (decrease) in net assets | 74,156,176 | 55,121,969 |
| Net Assets | | |
| Beginning of period | 241,485,434 | 186,363,465 |
| End of period | $315,641,610 | $241,485,434 |
See accompanying notes which are an integral part of the financial statements.
Financial Highlights
VIP Freedom 2025 Portfolio Initial Class
| Years ended December 31, | 2020 | 2019 | 2018 | 2017 | 2016 |
| Selected Per–Share Data | | | | | |
| Net asset value, beginning of period | $15.34 | $13.21 | $14.64 | $12.95 | $12.82 |
| Income from Investment Operations | | | | | |
| Net investment income (loss)A | .20 | .30 | .23 | .22 | .21 |
| Net realized and unrealized gain (loss) | 2.16 | 2.53 | (1.17) | 2.06 | .52 |
| Total from investment operations | 2.36 | 2.83 | (.94) | 2.28 | .73 |
| Distributions from net investment income | (.19) | (.30) | (.21) | (.21) | (.20) |
| Distributions from net realized gain | (.67) | (.41) | (.28) | (.38) | (.41) |
| Total distributions | (.86) | (.70)B | (.49) | (.59) | (.60)B |
| Net asset value, end of period | $16.84 | $15.34 | $13.21 | $14.64 | $12.95 |
| Total ReturnC,D | 15.95% | 21.86% | (6.52)% | 17.89% | 6.18% |
| Ratios to Average Net AssetsE,F | | | | | |
| Expenses before reductionsG | -% | -% | -% | -% | -% |
| Expenses net of fee waivers, if any | - %G | - %G | - %G | -% | -% |
| Expenses net of all reductions | - %G | - %G | - %G | -% | -% |
| Net investment income (loss) | 1.33% | 2.04% | 1.57% | 1.58% | 1.65% |
| Supplemental Data | | | | | |
| Net assets, end of period (000 omitted) | $55,624 | $47,253 | $38,096 | $37,773 | $27,359 |
| Portfolio turnover rateH | 61% | 51% | 32% | 29% | 24% |
A Calculated based on average shares outstanding during the period.
B Total distributions per share do not sum due to rounding.
C Total returns do not reflect charges attributable to your insurance company's separate account. Inclusion of these charges would reduce the total returns shown.
D Total returns would have been lower if certain expenses had not been reduced during the applicable periods shown.
E Fees and expenses of any underlying mutual funds or exchange-traded funds (ETFs) are not included in the Fund's expense ratio. The Fund indirectly bears its proportionate share of these expenses. For additional expense information related to investments in Fidelity Central Funds, please refer to the "Investments in Fidelity Central Funds" note found in the Notes to Financial Statements section of the most recent Annual or Semi-Annual report.
F Expense ratios reflect operating expenses of the class. Expenses before reductions do not reflect amounts reimbursed, waived, or reduced through arrangements with the investment adviser, brokerage services, or other offset arrangements, if applicable, and do not represent the amount paid by the class during periods when reimbursements, waivers or reductions occur.
G Amount represents less than .005%.
H Amount does not include the portfolio activity of any underlying mutual funds or exchange-traded funds (ETFs).
See accompanying notes which are an integral part of the financial statements.
VIP Freedom 2025 Portfolio Service Class
| Years ended December 31, | 2020 | 2019 | 2018 | 2017 | 2016 |
| Selected Per–Share Data | | | | | |
| Net asset value, beginning of period | $15.30 | $13.18 | $14.61 | $12.92 | $12.79 |
| Income from Investment Operations | | | | | |
| Net investment income (loss)A | .18 | .28 | .21 | .21 | .20 |
| Net realized and unrealized gain (loss) | 2.15 | 2.53 | (1.16) | 2.06 | .52 |
| Total from investment operations | 2.33 | 2.81 | (.95) | 2.27 | .72 |
| Distributions from net investment income | (.18) | (.28) | (.19) | (.20) | (.19) |
| Distributions from net realized gain | (.67) | (.41) | (.28) | (.38) | (.41) |
| Total distributions | (.84)B | (.69) | (.48)B | (.58) | (.59)B |
| Net asset value, end of period | $16.79 | $15.30 | $13.18 | $14.61 | $12.92 |
| Total ReturnC,D | 15.83% | 21.70% | (6.61)% | 17.84% | 6.11% |
| Ratios to Average Net AssetsE,F | | | | | |
| Expenses before reductions | .10% | .10% | .10% | .10% | .10% |
| Expenses net of fee waivers, if any | .10% | .10% | .10% | .10% | .10% |
| Expenses net of all reductions | .10% | .10% | .10% | .10% | .10% |
| Net investment income (loss) | 1.23% | 1.94% | 1.47% | 1.48% | 1.55% |
| Supplemental Data | | | | | |
| Net assets, end of period (000 omitted) | $147,904 | $96,430 | $79,033 | $69,430 | $48,319 |
| Portfolio turnover rateG | 61% | 51% | 32% | 29% | 24% |
A Calculated based on average shares outstanding during the period.
B Total distributions per share do not sum due to rounding.
C Total returns do not reflect charges attributable to your insurance company's separate account. Inclusion of these charges would reduce the total returns shown.
D Total returns would have been lower if certain expenses had not been reduced during the applicable periods shown.
E Fees and expenses of any underlying mutual funds or exchange-traded funds (ETFs) are not included in the Fund's expense ratio. The Fund indirectly bears its proportionate share of these expenses. For additional expense information related to investments in Fidelity Central Funds, please refer to the "Investments in Fidelity Central Funds" note found in the Notes to Financial Statements section of the most recent Annual or Semi-Annual report.
F Expense ratios reflect operating expenses of the class. Expenses before reductions do not reflect amounts reimbursed, waived, or reduced through arrangements with the investment adviser, brokerage services, or other offset arrangements, if applicable, and do not represent the amount paid by the class during periods when reimbursements, waivers or reductions occur.
G Amount does not include the portfolio activity of any underlying mutual funds or exchange-traded funds (ETFs).
See accompanying notes which are an integral part of the financial statements.
VIP Freedom 2025 Portfolio Service Class 2
| Years ended December 31, | 2020 | 2019 | 2018 | 2017 | 2016 |
| Selected Per–Share Data | | | | | |
| Net asset value, beginning of period | $15.21 | $13.11 | $14.54 | $12.87 | $12.74 |
| Income from Investment Operations | | | | | |
| Net investment income (loss)A | .16 | .26 | .19 | .18 | .18 |
| Net realized and unrealized gain (loss) | 2.14 | 2.51 | (1.16) | 2.04 | .52 |
| Total from investment operations | 2.30 | 2.77 | (.97) | 2.22 | .70 |
| Distributions from net investment income | (.15) | (.26) | (.18) | (.18) | (.17) |
| Distributions from net realized gain | (.67) | (.41) | (.28) | (.38) | (.41) |
| Total distributions | (.82) | (.67) | (.46) | (.55)B | (.57)B |
| Net asset value, end of period | $16.69 | $15.21 | $13.11 | $14.54 | $12.87 |
| Total ReturnC,D | 15.68% | 21.51% | (6.78)% | 17.57% | 5.98% |
| Ratios to Average Net AssetsE,F | | | | | |
| Expenses before reductions | .25% | .25% | .25% | .25% | .25% |
| Expenses net of fee waivers, if any | .25% | .25% | .25% | .25% | .25% |
| Expenses net of all reductions | .25% | .25% | .25% | .25% | .25% |
| Net investment income (loss) | 1.08% | 1.79% | 1.32% | 1.33% | 1.40% |
| Supplemental Data | | | | | |
| Net assets, end of period (000 omitted) | $112,114 | $97,802 | $69,234 | $63,568 | $59,895 |
| Portfolio turnover rateG | 61% | 51% | 32% | 29% | 24% |
A Calculated based on average shares outstanding during the period.
B Total distributions per share do not sum due to rounding.
C Total returns do not reflect charges attributable to your insurance company's separate account. Inclusion of these charges would reduce the total returns shown.
D Total returns would have been lower if certain expenses had not been reduced during the applicable periods shown.
E Fees and expenses of any underlying mutual funds or exchange-traded funds (ETFs) are not included in the Fund's expense ratio. The Fund indirectly bears its proportionate share of these expenses. For additional expense information related to investments in Fidelity Central Funds, please refer to the "Investments in Fidelity Central Funds" note found in the Notes to Financial Statements section of the most recent Annual or Semi-Annual report.
F Expense ratios reflect operating expenses of the class. Expenses before reductions do not reflect amounts reimbursed, waived, or reduced through arrangements with the investment adviser, brokerage services, or other offset arrangements, if applicable, and do not represent the amount paid by the class during periods when reimbursements, waivers or reductions occur.
G Amount does not include the portfolio activity of any underlying mutual funds or exchange-traded funds (ETFs).
See accompanying notes which are an integral part of the financial statements.
VIP Freedom 2030 Portfolio℠
Investment Summary (Unaudited)
The information in the following tables is based on the direct investments of the Fund.
Top Holdings as of December 31, 2020
| | % of fund's net assets |
| VIP Investment Grade Bond Portfolio Initial Class | 22.7 |
| VIP Overseas Portfolio Initial Class | 18.0 |
| VIP Emerging Markets Portfolio Initial Class | 13.5 |
| VIP Growth & Income Portfolio Initial Class | 7.3 |
| VIP Equity-Income Portfolio Initial Class | 6.4 |
| VIP Growth Portfolio Initial Class | 6.2 |
| VIP Contrafund Portfolio Initial Class | 6.1 |
| Fidelity Inflation-Protected Bond Index Fund | 5.6 |
| VIP Value Portfolio Initial Class | 4.7 |
| Fidelity Long-Term Treasury Bond Index Fund | 2.3 |
| | 92.8 |
Asset Allocation (% of fund's net assets)
| Period end |
| | Domestic Equity Funds | 34.8% |
| | International Equity Funds | 31.5% |
| | Bond Funds | 32.6% |
| | Short-Term Funds | 1.1% |

VIP Freedom 2030 Portfolio℠
Schedule of Investments December 31, 2020
Showing Percentage of Net Assets
| Domestic Equity Funds - 34.8% | | | |
| | | Shares | Value |
| VIP Contrafund Portfolio Initial Class (a) | | 672,245 | $32,382,026 |
| VIP Equity-Income Portfolio Initial Class (a) | | 1,429,879 | 34,174,104 |
| VIP Growth & Income Portfolio Initial Class (a) | | 1,740,827 | 38,924,885 |
| VIP Growth Portfolio Initial Class (a) | | 320,361 | 32,997,132 |
| VIP Mid Cap Portfolio Initial Class (a) | | 243,765 | 9,438,577 |
| VIP Value Portfolio Initial Class (a) | | 1,567,160 | 24,996,194 |
| VIP Value Strategies Portfolio Initial Class (a) | | 902,529 | 12,229,273 |
| TOTAL DOMESTIC EQUITY FUNDS | | | |
| (Cost $117,877,898) | | | 185,142,191 |
|
| International Equity Funds - 31.5% | | | |
| VIP Emerging Markets Portfolio Initial Class (a) | | 4,883,993 | 72,038,898 |
| VIP Overseas Portfolio Initial Class (a) | | 3,615,516 | 95,883,493 |
| TOTAL INTERNATIONAL EQUITY FUNDS | | | |
| (Cost $113,413,342) | | | 167,922,391 |
|
| Bond Funds - 32.6% | | | |
| Fidelity Inflation-Protected Bond Index Fund (a) | | 2,697,773 | 29,783,413 |
| Fidelity Long-Term Treasury Bond Index Fund (a) | | 769,893 | 12,279,798 |
| VIP High Income Portfolio Initial Class (a) | | 2,006,490 | 10,654,461 |
| VIP Investment Grade Bond Portfolio Initial Class (a) | | 8,600,344 | 121,178,845 |
| TOTAL BOND FUNDS | | | |
| (Cost $162,186,922) | | | 173,896,517 |
|
| Short-Term Funds - 1.1% | | | |
| VIP Government Money Market Portfolio Initial Class 0.01% (a)(b) | | | |
| (Cost $5,966,821) | | 5,966,821 | 5,966,821 |
| TOTAL INVESTMENT IN SECURITIES - 100.0% | | | |
| (Cost $399,444,983) | | | 532,927,920 |
| NET OTHER ASSETS (LIABILITIES) - 0.0% | | | (54,973) |
| NET ASSETS - 100% | | | $532,872,947 |
Legend
(a) Affiliated Fund
(b) The rate quoted is the annualized seven-day yield of the fund at period end.
Affiliated Central Funds
Information regarding fiscal year to date income earned by the Fund from investments in Fidelity Central Funds is as follows:
| Fund | Income earned |
| Fidelity Cash Central Fund | $8 |
| Total | $8 |
Amounts in the income column in the above table include any capital gain distributions from underlying funds, which are presented in the corresponding line-item in the Statement of Operations, if applicable.
Affiliated Underlying Funds
Fiscal year to date information regarding the Fund's investments in affiliated Underlying Funds, excluding any Money Market Central Funds, is presented below. Exchanges between classes of the same affiliated Underlying Funds may occur. Certain Underlying Funds incurred name changes since their most recent shareholder report. The names of the Underlying Funds are those in effect at period end.
| Affiliate | Value, beginning of period | Purchases | Sales Proceeds | Dividend Income | Realized Gain (loss) | Change in Unrealized appreciation (depreciation) | Value, end of period |
| Fidelity Inflation-Protected Bond Index Fund | $20,178,572 | $14,572,623 | $7,007,993 | $343,236 | $40,563 | $1,999,648 | $29,783,413 |
| Fidelity Long-Term Treasury Bond Index Fund | 10,995,285 | 7,321,830 | 7,413,721 | 438,857 | 806,315 | 570,089 | 12,279,798 |
| VIP Contrafund Portfolio Initial Class | 27,308,152 | 10,497,452 | 12,677,944 | 217,390 | 1,003,118 | 6,251,248 | 32,382,026 |
| VIP Emerging Markets Portfolio Initial Class | 50,118,765 | 29,936,892 | 20,405,636 | 6,326,577 | 499,126 | 11,889,751 | 72,038,898 |
| VIP Equity-Income Portfolio Initial Class | 28,841,595 | 14,588,984 | 10,175,117 | 1,771,647 | (56,266) | 974,908 | 34,174,104 |
| VIP Government Money Market Portfolio Initial Class 0.01% | 4,366,252 | 19,113,727 | 17,513,158 | 22,335 | -- | -- | 5,966,821 |
| VIP Growth & Income Portfolio Initial Class | 32,883,849 | 17,384,262 | 12,548,859 | 2,280,277 | (44,706) | 1,250,339 | 38,924,885 |
| VIP Growth Portfolio Initial Class | 27,910,845 | 11,194,754 | 13,718,374 | 2,845,703 | 1,939,805 | 5,670,102 | 32,997,132 |
| VIP High Income Portfolio Initial Class | 8,737,751 | 4,517,663 | 2,392,401 | 482,758 | (61,110) | (147,442) | 10,654,461 |
| VIP Investment Grade Bond Portfolio Initial Class | 93,622,240 | 61,659,407 | 40,038,968 | 2,439,432 | (188,680) | 6,124,846 | 121,178,845 |
| VIP Mid Cap Portfolio Initial Class | 8,009,517 | 3,617,937 | 3,904,869 | 50,257 | (148,307) | 1,864,299 | 9,438,577 |
| VIP Overseas Portfolio Initial Class | 90,517,049 | 35,029,270 | 41,732,821 | 771,271 | (173,912) | 12,243,907 | 95,883,493 |
| VIP Value Portfolio Initial Class | 21,188,462 | 12,973,777 | 10,669,611 | 1,086,146 | (246,236) | 1,749,802 | 24,996,194 |
| VIP Value Strategies Portfolio Initial Class | 10,382,762 | 6,718,659 | 5,782,319 | 644,323 | (480,560) | 1,390,731 | 12,229,273 |
| | 435,061,096 | 249,127,237 | 205,981,791 | 19,720,209 | 2,889,150 | 51,832,228 | 532,927,920 |
Amounts in the income column in the above table include any capital gain distributions from underlying funds, which are presented in the corresponding line-item in the Statement of Operations, if applicable.
Investment Valuation
The following is a summary of the inputs used, as of December 31, 2020, involving the Fund's assets and liabilities carried at fair value. The inputs or methodology used for valuing securities may not be an indication of the risk associated with investing in those securities. For more information on valuation inputs, and their aggregation into the levels used below, please refer to the Investment Valuation section in the accompanying Notes to Financial Statements.
| | Valuation Inputs at Reporting Date: |
| Description | Total | Level 1 | Level 2 | Level 3 |
| Investments in Securities: | | | | |
| Domestic Equity Funds | $185,142,191 | $185,142,191 | $-- | $-- |
| International Equity Funds | 167,922,391 | 167,922,391 | -- | -- |
| Bond Funds | 173,896,517 | 173,896,517 | -- | -- |
| Short-Term Funds | 5,966,821 | 5,966,821 | -- | -- |
| Total Investments in Securities: | $532,927,920 | $532,927,920 | $-- | $-- |
See accompanying notes which are an integral part of the financial statements.
VIP Freedom 2030 Portfolio℠
Financial Statements
Statement of Assets and Liabilities
| | | December 31, 2020 |
| Assets | | |
Investment in securities, at value — See accompanying schedule:
| | |
| Affiliated issuers (cost $399,444,983) | $532,927,920 | |
| Total Investment in Securities (cost $399,444,983) | | $532,927,920 |
| Cash | | 2,723 |
| Receivable for investments sold | | 7,396,554 |
| Receivable for fund shares sold | | 540,733 |
| Total assets | | 540,867,930 |
| Liabilities | | |
| Payable for investments purchased | $7,250,612 | |
| Payable for fund shares redeemed | 686,679 | |
| Distribution and service plan fees payable | 57,692 | |
| Total liabilities | | 7,994,983 |
| Net Assets | | $532,872,947 |
| Net Assets consist of: | | |
| Paid in capital | | $387,370,439 |
| Total accumulated earnings (loss) | | 145,502,508 |
| Net Assets | | $532,872,947 |
| Net Asset Value and Maximum Offering Price | | |
| Initial Class: | | |
| Net Asset Value, offering price and redemption price per share ($113,726,519 ÷ 6,755,690 shares) | | $16.83 |
| Service Class: | | |
| Net Asset Value, offering price and redemption price per share ($225,149,217 ÷ 13,408,494 shares) | | $16.79 |
| Service Class 2: | | |
| Net Asset Value, offering price and redemption price per share ($193,997,211 ÷ 11,595,995 shares) | | $16.73 |
See accompanying notes which are an integral part of the financial statements.
Statement of Operations
| | | Year ended December 31, 2020 |
| Investment Income | | |
| Dividends: | | |
| Affiliated issuers | | $5,827,358 |
| Income from Fidelity Central Funds | | 8 |
| Total income | | 5,827,366 |
| Expenses | | |
| Distribution and service plan fees | $604,538 | |
| Independent trustees' fees and expenses | 1,420 | |
| Total expenses before reductions | 605,958 | |
| Expense reductions | (5) | |
| Total expenses after reductions | | 605,953 |
| Net investment income (loss) | | 5,221,413 |
| Realized and Unrealized Gain (Loss) | | |
| Net realized gain (loss) on: | | |
| Investment securities: | | |
| Affiliated issuers | 2,891,823 | |
| Capital gain distributions from underlying funds: | | |
| Affiliated issuers | 13,892,851 | |
| Total net realized gain (loss) | | 16,784,674 |
| Change in net unrealized appreciation (depreciation) on: | | |
| Investment securities: | | |
| Affiliated issuers | 51,832,228 | |
| Total change in net unrealized appreciation (depreciation) | | 51,832,228 |
| Net gain (loss) | | 68,616,902 |
| Net increase (decrease) in net assets resulting from operations | | $73,838,315 |
See accompanying notes which are an integral part of the financial statements.
Statement of Changes in Net Assets
| | Year ended December 31, 2020 | Year ended December 31, 2019 |
| Increase (Decrease) in Net Assets | | |
| Operations | | |
| Net investment income (loss) | $5,221,413 | $7,484,193 |
| Net realized gain (loss) | 16,784,674 | 21,053,340 |
| Change in net unrealized appreciation (depreciation) | 51,832,228 | 52,311,125 |
| Net increase (decrease) in net assets resulting from operations | 73,838,315 | 80,848,658 |
| Distributions to shareholders | (26,551,803) | (20,320,962) |
| Share transactions - net increase (decrease) | 50,646,251 | 51,686,634 |
| Total increase (decrease) in net assets | 97,932,763 | 112,214,330 |
| Net Assets | | |
| Beginning of period | 434,940,184 | 322,725,854 |
| End of period | $532,872,947 | $434,940,184 |
See accompanying notes which are an integral part of the financial statements.
Financial Highlights
VIP Freedom 2030 Portfolio Initial Class
| Years ended December 31, | 2020 | 2019 | 2018 | 2017 | 2016 |
| Selected Per–Share Data | | | | | |
| Net asset value, beginning of period | $15.28 | $12.98 | $14.67 | $12.75 | $12.68 |
| Income from Investment Operations | | | | | |
| Net investment income (loss)A | .19 | .30 | .20 | .20 | .18 |
| Net realized and unrealized gain (loss) | 2.28 | 2.80 | (1.32) | 2.41 | .57 |
| Total from investment operations | 2.47 | 3.10 | (1.12) | 2.61 | .75 |
| Distributions from net investment income | (.19) | (.29) | (.20) | (.20) | (.19) |
| Distributions from net realized gain | (.74) | (.51) | (.37) | (.49) | (.49) |
| Total distributions | (.92)B | (.80) | (.57) | (.69) | (.68) |
| Net asset value, end of period | $16.83 | $15.28 | $12.98 | $14.67 | $12.75 |
| Total ReturnC,D | 16.89% | 24.43% | (7.78)% | 20.96% | 6.61% |
| Ratios to Average Net AssetsE,F | | | | | |
| Expenses before reductionsG | -% | -% | -% | -% | -% |
| Expenses net of fee waivers, if any | - %G | - %G | - %G | -% | -% |
| Expenses net of all reductions | - %G | - %G | - %G | -% | -% |
| Net investment income (loss) | 1.31% | 2.09% | 1.42% | 1.48% | 1.42% |
| Supplemental Data | | | | | |
| Net assets, end of period (000 omitted) | $113,727 | $93,564 | $71,004 | $74,247 | $57,779 |
| Portfolio turnover rateH | 46% | 30% | 29% | 26% | 25% |
A Calculated based on average shares outstanding during the period.
B Total distributions per share do not sum due to rounding.
C Total returns do not reflect charges attributable to your insurance company's separate account. Inclusion of these charges would reduce the total returns shown.
D Total returns would have been lower if certain expenses had not been reduced during the applicable periods shown.
E Fees and expenses of any underlying mutual funds or exchange-traded funds (ETFs) are not included in the Fund's expense ratio. The Fund indirectly bears its proportionate share of these expenses. For additional expense information related to investments in Fidelity Central Funds, please refer to the "Investments in Fidelity Central Funds" note found in the Notes to Financial Statements section of the most recent Annual or Semi-Annual report.
F Expense ratios reflect operating expenses of the class. Expenses before reductions do not reflect amounts reimbursed, waived, or reduced through arrangements with the investment adviser, brokerage services, or other offset arrangements, if applicable, and do not represent the amount paid by the class during periods when reimbursements, waivers or reductions occur.
G Amount represents less than .005%.
H Amount does not include the portfolio activity of any underlying mutual funds or exchange-traded funds (ETFs).
See accompanying notes which are an integral part of the financial statements.
VIP Freedom 2030 Portfolio Service Class
| Years ended December 31, | 2020 | 2019 | 2018 | 2017 | 2016 |
| Selected Per–Share Data | | | | | |
| Net asset value, beginning of period | $15.25 | $12.95 | $14.64 | $12.73 | $12.66 |
| Income from Investment Operations | | | | | |
| Net investment income (loss)A | .18 | .29 | .19 | .19 | .16 |
| Net realized and unrealized gain (loss) | 2.27 | 2.79 | (1.32) | 2.40 | .58 |
| Total from investment operations | 2.45 | 3.08 | (1.13) | 2.59 | .74 |
| Distributions from net investment income | (.17) | (.28) | (.19) | (.19) | (.17) |
| Distributions from net realized gain | (.74) | (.51) | (.37) | (.49) | (.49) |
| Total distributions | (.91) | (.78)B | (.56) | (.68) | (.67)B |
| Net asset value, end of period | $16.79 | $15.25 | $12.95 | $14.64 | $12.73 |
| Total ReturnC,D | 16.76% | 24.37% | (7.88)% | 20.82% | 6.52% |
| Ratios to Average Net AssetsE,F | | | | | |
| Expenses before reductions | .10% | .10% | .10% | .10% | .10% |
| Expenses net of fee waivers, if any | .10% | .10% | .10% | .10% | .10% |
| Expenses net of all reductions | .10% | .10% | .10% | .10% | .10% |
| Net investment income (loss) | 1.21% | 1.99% | 1.32% | 1.38% | 1.32% |
| Supplemental Data | | | | | |
| Net assets, end of period (000 omitted) | $225,149 | $168,105 | $121,155 | $111,029 | $70,501 |
| Portfolio turnover rateG | 46% | 30% | 29% | 26% | 25% |
A Calculated based on average shares outstanding during the period.
B Total distributions per share do not sum due to rounding.
C Total returns do not reflect charges attributable to your insurance company's separate account. Inclusion of these charges would reduce the total returns shown.
D Total returns would have been lower if certain expenses had not been reduced during the applicable periods shown.
E Fees and expenses of any underlying mutual funds or exchange-traded funds (ETFs) are not included in the Fund's expense ratio. The Fund indirectly bears its proportionate share of these expenses. For additional expense information related to investments in Fidelity Central Funds, please refer to the "Investments in Fidelity Central Funds" note found in the Notes to Financial Statements section of the most recent Annual or Semi-Annual report.
F Expense ratios reflect operating expenses of the class. Expenses before reductions do not reflect amounts reimbursed, waived, or reduced through arrangements with the investment adviser, brokerage services, or other offset arrangements, if applicable, and do not represent the amount paid by the class during periods when reimbursements, waivers or reductions occur.
G Amount does not include the portfolio activity of any underlying mutual funds or exchange-traded funds (ETFs).
See accompanying notes which are an integral part of the financial statements.
VIP Freedom 2030 Portfolio Service Class 2
| Years ended December 31, | 2020 | 2019 | 2018 | 2017 | 2016 |
| Selected Per–Share Data | | | | | |
| Net asset value, beginning of period | $15.19 | $12.91 | $14.60 | $12.69 | $12.62 |
| Income from Investment Operations | | | | | |
| Net investment income (loss)A | .16 | .26 | .17 | .17 | .14 |
| Net realized and unrealized gain (loss) | 2.26 | 2.78 | (1.32) | 2.40 | .58 |
| Total from investment operations | 2.42 | 3.04 | (1.15) | 2.57 | .72 |
| Distributions from net investment income | (.15) | (.26) | (.17) | (.16) | (.15) |
| Distributions from net realized gain | (.74) | (.51) | (.37) | (.49) | (.49) |
| Total distributions | (.88)B | (.76)B | (.54) | (.66)B | (.65)B |
| Net asset value, end of period | $16.73 | $15.19 | $12.91 | $14.60 | $12.69 |
| Total ReturnC,D | 16.64% | 24.11% | (8.05)% | 20.69% | 6.37% |
| Ratios to Average Net AssetsE,F | | | | | |
| Expenses before reductions | .25% | .25% | .25% | .25% | .25% |
| Expenses net of fee waivers, if any | .25% | .25% | .25% | .25% | .25% |
| Expenses net of all reductions | .25% | .25% | .25% | .25% | .25% |
| Net investment income (loss) | 1.06% | 1.84% | 1.17% | 1.23% | 1.17% |
| Supplemental Data | | | | | |
| Net assets, end of period (000 omitted) | $193,997 | $173,271 | $130,567 | $144,577 | $132,682 |
| Portfolio turnover rateG | 46% | 30% | 29% | 26% | 25% |
A Calculated based on average shares outstanding during the period.
B Total distributions per share do not sum due to rounding.
C Total returns do not reflect charges attributable to your insurance company's separate account. Inclusion of these charges would reduce the total returns shown.
D Total returns would have been lower if certain expenses had not been reduced during the applicable periods shown.
E Fees and expenses of any underlying mutual funds or exchange-traded funds (ETFs) are not included in the Fund's expense ratio. The Fund indirectly bears its proportionate share of these expenses. For additional expense information related to investments in Fidelity Central Funds, please refer to the "Investments in Fidelity Central Funds" note found in the Notes to Financial Statements section of the most recent Annual or Semi-Annual report.
F Expense ratios reflect operating expenses of the class. Expenses before reductions do not reflect amounts reimbursed, waived, or reduced through arrangements with the investment adviser, brokerage services, or other offset arrangements, if applicable, and do not represent the amount paid by the class during periods when reimbursements, waivers or reductions occur.
G Amount does not include the portfolio activity of any underlying mutual funds or exchange-traded funds (ETFs).
See accompanying notes which are an integral part of the financial statements.
VIP Freedom 2035 Portfolio℠
Investment Summary (Unaudited)
The information in the following tables is based on the direct investments of the Fund.
Top Holdings as of December 31, 2020
| | % of fund's net assets |
| VIP Overseas Portfolio Initial Class | 22.2 |
| VIP Emerging Markets Portfolio Initial Class | 15.4 |
| VIP Investment Grade Bond Portfolio Initial Class | 12.0 |
| VIP Growth & Income Portfolio Initial Class | 9.2 |
| VIP Equity-Income Portfolio Initial Class | 8.1 |
| VIP Growth Portfolio Initial Class | 7.8 |
| VIP Contrafund Portfolio Initial Class | 7.7 |
| VIP Value Portfolio Initial Class | 5.9 |
| VIP Value Strategies Portfolio Initial Class | 2.9 |
| Fidelity Long-Term Treasury Bond Index Fund | 2.3 |
| | 93.5 |
Asset Allocation (% of fund's net assets)
| Period end |
| | Domestic Equity Funds | 43.9% |
| | International Equity Funds | 37.6% |
| | Bond Funds | 18.3% |
| | Short-Term Funds | 0.2% |

VIP Freedom 2035 Portfolio℠
Schedule of Investments December 31, 2020
Showing Percentage of Net Assets
| Domestic Equity Funds - 43.9% | | | |
| | | Shares | Value |
| VIP Contrafund Portfolio Initial Class (a) | | 249,742 | $12,030,066 |
| VIP Equity-Income Portfolio Initial Class (a) | | 531,188 | 12,695,397 |
| VIP Growth & Income Portfolio Initial Class (a) | | 646,711 | 14,460,466 |
| VIP Growth Portfolio Initial Class (a) | | 119,018 | 12,258,848 |
| VIP Mid Cap Portfolio Initial Class (a) | | 90,558 | 3,506,419 |
| VIP Value Portfolio Initial Class (a) | | 582,199 | 9,286,069 |
| VIP Value Strategies Portfolio Initial Class (a) | | 335,286 | 4,543,120 |
| TOTAL DOMESTIC EQUITY FUNDS | | | |
| (Cost $54,366,967) | | | 68,780,385 |
|
| International Equity Funds - 37.6% | | | |
| VIP Emerging Markets Portfolio Initial Class (a) | | 1,633,467 | 24,093,645 |
| VIP Overseas Portfolio Initial Class (a) | | 1,310,236 | 34,747,453 |
| TOTAL INTERNATIONAL EQUITY FUNDS | | | |
| (Cost $44,458,371) | | | 58,841,098 |
|
| Bond Funds - 18.3% | | | |
| Fidelity Inflation-Protected Bond Index Fund (a) | | 284,151 | 3,137,030 |
| Fidelity Long-Term Treasury Bond Index Fund (a) | | 226,244 | 3,608,584 |
| VIP High Income Portfolio Initial Class (a) | | 589,639 | 3,130,984 |
| VIP Investment Grade Bond Portfolio Initial Class (a) | | 1,333,143 | 18,783,979 |
| TOTAL BOND FUNDS | | | |
| (Cost $27,190,404) | | | 28,660,577 |
|
| Short-Term Funds - 0.2% | | | |
| Fidelity Cash Central Fund 0.11% (b) | | 8 | 9 |
| VIP Government Money Market Portfolio Initial Class 0.01% (a)(c) | | 313,117 | 313,117 |
| TOTAL SHORT-TERM FUNDS | | | |
| (Cost $313,126) | | | 313,126 |
| TOTAL INVESTMENT IN SECURITIES - 100.0% | | | |
| (Cost $126,328,868) | | | 156,595,186 |
| NET OTHER ASSETS (LIABILITIES) - 0.0% | | | (21,934) |
| NET ASSETS - 100% | | | $156,573,252 |
Legend
(a) Affiliated Fund
(b) Affiliated fund that is generally available only to investment companies and other accounts managed by Fidelity Investments. The rate quoted is the annualized seven-day yield of the fund at period end. A complete unaudited listing of the fund's holdings as of its most recent quarter end is available upon request. In addition, each Fidelity Central Fund's financial statements, which are not covered by the Fund's Report of Independent Registered Public Accounting Firm, are available on the SEC's website or upon request.
(c) The rate quoted is the annualized seven-day yield of the fund at period end.
Affiliated Underlying Funds
Fiscal year to date information regarding the Fund's investments in affiliated Underlying Funds, excluding any Money Market Central Funds, is presented below. Exchanges between classes of the same affiliated Underlying Funds may occur. Certain Underlying Funds incurred name changes since their most recent shareholder report. The names of the Underlying Funds are those in effect at period end.
| Affiliate | Value, beginning of period | Purchases | Sales Proceeds | Dividend Income | Realized Gain (loss) | Change in Unrealized appreciation (depreciation) | Value, end of period |
| Fidelity Inflation-Protected Bond Index Fund | $2,300,656 | $2,093,844 | $1,480,699 | $36,321 | $9,876 | $213,353 | $3,137,030 |
| Fidelity Long-Term Treasury Bond Index Fund | 2,902,617 | 2,864,724 | 2,522,927 | 125,601 | 157,126 | 207,044 | 3,608,584 |
| VIP Contrafund Portfolio Initial Class | 8,955,034 | 5,663,069 | 5,173,612 | 74,614 | 105,784 | 2,479,791 | 12,030,066 |
| VIP Emerging Markets Portfolio Initial Class | 15,062,527 | 12,700,881 | 7,866,129 | 1,991,078 | 49,976 | 4,146,390 | 24,093,645 |
| VIP Equity-Income Portfolio Initial Class | 9,457,342 | 6,881,838 | 4,072,567 | 608,507 | (55,513) | 484,297 | 12,695,397 |
| VIP Government Money Market Portfolio Initial Class 0.01% | 1,152,428 | 4,360,756 | 5,200,067 | 6,014 | -- | -- | 313,117 |
| VIP Growth & Income Portfolio Initial Class | 10,782,927 | 8,164,922 | 5,051,093 | 783,604 | (80,881) | 644,591 | 14,460,466 |
| VIP Growth Portfolio Initial Class | 9,152,824 | 5,821,566 | 5,473,296 | 965,906 | 187,640 | 2,570,114 | 12,258,848 |
| VIP High Income Portfolio Initial Class | 2,306,243 | 1,966,595 | 1,092,526 | 140,234 | (22,258) | (27,070) | 3,130,984 |
| VIP Investment Grade Bond Portfolio Initial Class | 11,022,934 | 14,527,989 | 7,539,088 | 359,008 | (34,374) | 806,518 | 18,783,979 |
| VIP Mid Cap Portfolio Initial Class | 2,626,253 | 1,741,121 | 1,506,869 | 18,120 | (55,209) | 701,123 | 3,506,419 |
| VIP Overseas Portfolio Initial Class | 28,742,351 | 16,938,740 | 15,455,285 | 263,311 | (40,265) | 4,561,912 | 34,747,453 |
| VIP Value Portfolio Initial Class | 6,947,673 | 5,837,532 | 4,162,410 | 371,820 | (277,073) | 940,347 | 9,286,069 |
| VIP Value Strategies Portfolio Initial Class | 3,404,309 | 2,954,074 | 2,203,988 | 219,124 | (239,777) | 628,502 | 4,543,120 |
| | 114,816,118 | 92,517,651 | 68,800,556 | 5,963,262 | (294,948) | 18,356,912 | 156,595,177 |
Amounts in the income column in the above table include any capital gain distributions from underlying funds, which are presented in the corresponding line-item in the Statement of Operations, if applicable.
Investment Valuation
The following is a summary of the inputs used, as of December 31, 2020, involving the Fund's assets and liabilities carried at fair value. The inputs or methodology used for valuing securities may not be an indication of the risk associated with investing in those securities. For more information on valuation inputs, and their aggregation into the levels used below, please refer to the Investment Valuation section in the accompanying Notes to Financial Statements.
| | Valuation Inputs at Reporting Date: |
| Description | Total | Level 1 | Level 2 | Level 3 |
| Investments in Securities: | | | | |
| Domestic Equity Funds | $68,780,385 | $68,780,385 | $-- | $-- |
| International Equity Funds | 58,841,098 | 58,841,098 | -- | -- |
| Bond Funds | 28,660,577 | 28,660,577 | -- | -- |
| Short-Term Funds | 313,126 | 313,126 | -- | -- |
| Total Investments in Securities: | $156,595,186 | $156,595,186 | $-- | $-- |
See accompanying notes which are an integral part of the financial statements.
VIP Freedom 2035 Portfolio℠
Financial Statements
Statement of Assets and Liabilities
| | | December 31, 2020 |
| Assets | | |
Investment in securities, at value — See accompanying schedule:
| | |
| Fidelity Central Funds (cost $9) | $9 | |
| Other affiliated issuers (cost $126,328,859) | 156,595,177 | |
| Total Investment in Securities (cost $126,328,868) | | $156,595,186 |
| Cash | | 1 |
| Receivable for investments sold | | 1,999,958 |
| Receivable for fund shares sold | | 196,810 |
| Total assets | | 158,791,955 |
| Liabilities | | |
| Payable for investments purchased | $1,697,446 | |
| Payable for fund shares redeemed | 499,316 | |
| Distribution and service plan fees payable | 21,941 | |
| Total liabilities | | 2,218,703 |
| Net Assets | | $156,573,252 |
| Net Assets consist of: | | |
| Paid in capital | | $123,595,878 |
| Total accumulated earnings (loss) | | 32,977,374 |
| Net Assets | | $156,573,252 |
| Net Asset Value and Maximum Offering Price | | |
| Initial Class: | | |
| Net Asset Value, offering price and redemption price per share ($17,851,895 ÷ 653,055 shares) | | $27.34 |
| Service Class: | | |
| Net Asset Value, offering price and redemption price per share ($51,597,793 ÷ 1,892,341 shares) | | $27.27 |
| Service Class 2: | | |
| Net Asset Value, offering price and redemption price per share ($87,123,564 ÷ 3,213,373 shares) | | $27.11 |
See accompanying notes which are an integral part of the financial statements.
Statement of Operations
| | | Year ended December 31, 2020 |
| Investment Income | | |
| Dividends: | | |
| Affiliated issuers | | $1,508,880 |
| Expenses | | |
| Distribution and service plan fees | $220,429 | |
| Independent trustees' fees and expenses | 393 | |
| Total expenses | | 220,822 |
| Net investment income (loss) | | 1,288,058 |
| Realized and Unrealized Gain (Loss) | | |
| Net realized gain (loss) on: | | |
| Investment securities: | | |
| Affiliated issuers | (294,948) | |
| Capital gain distributions from underlying funds: | | |
| Affiliated issuers | 4,454,382 | |
| Total net realized gain (loss) | | 4,159,434 |
| Change in net unrealized appreciation (depreciation) on: | | |
| Investment securities: | | |
| Affiliated issuers | 18,356,912 | |
| Total change in net unrealized appreciation (depreciation) | | 18,356,912 |
| Net gain (loss) | | 22,516,346 |
| Net increase (decrease) in net assets resulting from operations | | $23,804,404 |
See accompanying notes which are an integral part of the financial statements.
Statement of Changes in Net Assets
| | Year ended December 31, 2020 | Year ended December 31, 2019 |
| Increase (Decrease) in Net Assets | | |
| Operations | | |
| Net investment income (loss) | $1,288,058 | $1,693,267 |
| Net realized gain (loss) | 4,159,434 | 4,409,706 |
| Change in net unrealized appreciation (depreciation) | 18,356,912 | 14,187,707 |
| Net increase (decrease) in net assets resulting from operations | 23,804,404 | 20,290,680 |
| Distributions to shareholders | (6,485,254) | (4,152,908) |
| Share transactions - net increase (decrease) | 24,454,816 | 33,368,834 |
| Total increase (decrease) in net assets | 41,773,966 | 49,506,606 |
| Net Assets | | |
| Beginning of period | 114,799,286 | 65,292,680 |
| End of period | $156,573,252 | $114,799,286 |
See accompanying notes which are an integral part of the financial statements.
Financial Highlights
VIP Freedom 2035 Portfolio Initial Class
| Years ended December 31, | 2020 | 2019 | 2018 | 2017 | 2016 |
| Selected Per–Share Data | | | | | |
| Net asset value, beginning of period | $24.35 | $20.07 | $22.88 | $19.39 | $19.05 |
| Income from Investment Operations | | | | | |
| Net investment income (loss)A | .28 | .48 | .29 | .30 | .31 |
| Net realized and unrealized gain (loss) | 4.01 | 4.92 | (2.39) | 4.14 | .88 |
| Total from investment operations | 4.29 | 5.40 | (2.10) | 4.44 | 1.19B |
| Distributions from net investment income | (.27) | (.41) | (.26) | (.27) | (.26) |
| Distributions from net realized gain | (1.04) | (.71) | (.45) | (.69) | (.60) |
| Total distributions | (1.30)B | (1.12) | (.71) | (.95)B | (.85)B |
| Net asset value, end of period | $27.34 | $24.35 | $20.07 | $22.88 | $19.39 |
| Total ReturnC,D | 18.28% | 27.49% | (9.30)% | 23.35% | 6.87% |
| Ratios to Average Net AssetsE,F | | | | | |
| Expenses before reductionsG | -% | -% | -% | -% | -% |
| Expenses net of fee waivers, if any | - %G | - %G | - %G | -% | -% |
| Expenses net of all reductions | - %G | - %G | - %G | -% | -% |
| Net investment income (loss) | 1.20% | 2.13% | 1.30% | 1.42% | 1.65% |
| Supplemental Data | | | | | |
| Net assets, end of period (000 omitted) | $17,852 | $12,846 | $7,977 | $6,197 | $3,522 |
| Portfolio turnover rateH | 55% | 29% | 27% | 25% | 18% |
A Calculated based on average shares outstanding during the period.
B Total distributions per share do not sum due to rounding.
C Total returns do not reflect charges attributable to your insurance company's separate account. Inclusion of these charges would reduce the total returns shown.
D Total returns would have been lower if certain expenses had not been reduced during the applicable periods shown.
E Fees and expenses of any underlying mutual funds or exchange-traded funds (ETFs) are not included in the Fund's expense ratio. The Fund indirectly bears its proportionate share of these expenses. For additional expense information related to investments in Fidelity Central Funds, please refer to the "Investments in Fidelity Central Funds" note found in the Notes to Financial Statements section of the most recent Annual or Semi-Annual report.
F Expense ratios reflect operating expenses of the class. Expenses before reductions do not reflect amounts reimbursed, waived, or reduced through arrangements with the investment adviser, brokerage services, or other offset arrangements, if applicable, and do not represent the amount paid by the class during periods when reimbursements, waivers or reductions occur.
G Amount represents less than .005%.
H Amount does not include the portfolio activity of any underlying mutual funds or exchange-traded funds (ETFs).
See accompanying notes which are an integral part of the financial statements.
VIP Freedom 2035 Portfolio Service Class
| Years ended December 31, | 2020 | 2019 | 2018 | 2017 | 2016 |
| Selected Per–Share Data | | | | | |
| Net asset value, beginning of period | $24.30 | $20.04 | $22.84 | $19.36 | $19.04 |
| Income from Investment Operations | | | | | |
| Net investment income (loss)A | .26 | .46 | .27 | .28 | .29 |
| Net realized and unrealized gain (loss) | 3.99 | 4.90 | (2.38) | 4.13 | .87 |
| Total from investment operations | 4.25 | 5.36 | (2.11) | 4.41 | 1.16 |
| Distributions from net investment income | (.25) | (.39) | (.25) | (.25) | (.24) |
| Distributions from net realized gain | (1.04) | (.71) | (.45) | (.69) | (.60) |
| Total distributions | (1.28)B | (1.10) | (.69)B | (.93)B | (.84) |
| Net asset value, end of period | $27.27 | $24.30 | $20.04 | $22.84 | $19.36 |
| Total ReturnC,D | 18.15% | 27.33% | (9.36)% | 23.24% | 6.70% |
| Ratios to Average Net AssetsE,F | | | | | |
| Expenses before reductions | .10% | .10% | .10% | .10% | .10% |
| Expenses net of fee waivers, if any | .10% | .10% | .10% | .10% | .10% |
| Expenses net of all reductions | .10% | .10% | .10% | .10% | .10% |
| Net investment income (loss) | 1.10% | 2.03% | 1.20% | 1.32% | 1.55% |
| Supplemental Data | | | | | |
| Net assets, end of period (000 omitted) | $51,598 | $30,573 | $12,303 | $8,385 | $4,661 |
| Portfolio turnover rateG | 55% | 29% | 27% | 25% | 18% |
A Calculated based on average shares outstanding during the period.
B Total distributions per share do not sum due to rounding.
C Total returns do not reflect charges attributable to your insurance company's separate account. Inclusion of these charges would reduce the total returns shown.
D Total returns would have been lower if certain expenses had not been reduced during the applicable periods shown.
E Fees and expenses of any underlying mutual funds or exchange-traded funds (ETFs) are not included in the Fund's expense ratio. The Fund indirectly bears its proportionate share of these expenses. For additional expense information related to investments in Fidelity Central Funds, please refer to the "Investments in Fidelity Central Funds" note found in the Notes to Financial Statements section of the most recent Annual or Semi-Annual report.
F Expense ratios reflect operating expenses of the class. Expenses before reductions do not reflect amounts reimbursed, waived, or reduced through arrangements with the investment adviser, brokerage services, or other offset arrangements, if applicable, and do not represent the amount paid by the class during periods when reimbursements, waivers or reductions occur.
G Amount does not include the portfolio activity of any underlying mutual funds or exchange-traded funds (ETFs).
See accompanying notes which are an integral part of the financial statements.
VIP Freedom 2035 Portfolio Service Class 2
| Years ended December 31, | 2020 | 2019 | 2018 | 2017 | 2016 |
| Selected Per–Share Data | | | | | |
| Net asset value, beginning of period | $24.17 | $19.94 | $22.73 | $19.27 | $18.96 |
| Income from Investment Operations | | | | | |
| Net investment income (loss)A | .22 | .42 | .24 | .25 | .26 |
| Net realized and unrealized gain (loss) | 3.97 | 4.88 | (2.37) | 4.11 | .86 |
| Total from investment operations | 4.19 | 5.30 | (2.13) | 4.36 | 1.12 |
| Distributions from net investment income | (.21) | (.36) | (.22) | (.22) | (.22) |
| Distributions from net realized gain | (1.04) | (.71) | (.45) | (.69) | (.60) |
| Total distributions | (1.25) | (1.07) | (.66)B | (.90)B | (.81)B |
| Net asset value, end of period | $27.11 | $24.17 | $19.94 | $22.73 | $19.27 |
| Total ReturnC,D | 17.96% | 27.13% | (9.50)% | 23.07% | 6.52% |
| Ratios to Average Net AssetsE,F | | | | | |
| Expenses before reductions | .25% | .25% | .25% | .25% | .25% |
| Expenses net of fee waivers, if any | .25% | .25% | .25% | .25% | .25% |
| Expenses net of all reductions | .25% | .25% | .25% | .25% | .25% |
| Net investment income (loss) | .95% | 1.88% | 1.05% | 1.17% | 1.40% |
| Supplemental Data | | | | | |
| Net assets, end of period (000 omitted) | $87,124 | $71,380 | $45,013 | $41,677 | $28,467 |
| Portfolio turnover rateG | 55% | 29% | 27% | 25% | 18% |
A Calculated based on average shares outstanding during the period.
B Total distributions per share do not sum due to rounding.
C Total returns do not reflect charges attributable to your insurance company's separate account. Inclusion of these charges would reduce the total returns shown.
D Total returns would have been lower if certain expenses had not been reduced during the applicable periods shown.
E Fees and expenses of any underlying mutual funds or exchange-traded funds (ETFs) are not included in the Fund's expense ratio. The Fund indirectly bears its proportionate share of these expenses. For additional expense information related to investments in Fidelity Central Funds, please refer to the "Investments in Fidelity Central Funds" note found in the Notes to Financial Statements section of the most recent Annual or Semi-Annual report.
F Expense ratios reflect operating expenses of the class. Expenses before reductions do not reflect amounts reimbursed, waived, or reduced through arrangements with the investment adviser, brokerage services, or other offset arrangements, if applicable, and do not represent the amount paid by the class during periods when reimbursements, waivers or reductions occur.
G Amount does not include the portfolio activity of any underlying mutual funds or exchange-traded funds (ETFs).
See accompanying notes which are an integral part of the financial statements.
VIP Freedom 2040 Portfolio℠
Investment Summary (Unaudited)
The information in the following tables is based on the direct investments of the Fund.
Top Holdings as of December 31, 2020
| | % of fund's net assets |
| VIP Overseas Portfolio Initial Class | 24.8 |
| VIP Emerging Markets Portfolio Initial Class | 16.6 |
| VIP Growth & Income Portfolio Initial Class | 10.4 |
| VIP Equity-Income Portfolio Initial Class | 9.2 |
| VIP Growth Portfolio Initial Class | 8.9 |
| VIP Contrafund Portfolio Initial Class | 8.7 |
| VIP Value Portfolio Initial Class | 6.7 |
| VIP Value Strategies Portfolio Initial Class | 3.3 |
| VIP Mid Cap Portfolio Initial Class | 2.5 |
| VIP Investment Grade Bond Portfolio Initial Class | 2.4 |
| | 93.5 |
Asset Allocation (% of fund's net assets)
| Period end |
| | Domestic Equity Funds | 49.7% |
| | International Equity Funds | 41.4% |
| | Bond Funds | 8.7% |
| | Short-Term Funds | 0.2% |

VIP Freedom 2040 Portfolio℠
Schedule of Investments December 31, 2020
Showing Percentage of Net Assets
| Domestic Equity Funds - 49.7% | | | |
| | | Shares | Value |
| VIP Contrafund Portfolio Initial Class (a) | | 271,479 | $13,077,143 |
| VIP Equity-Income Portfolio Initial Class (a) | | 577,381 | 13,799,404 |
| VIP Growth & Income Portfolio Initial Class (a) | | 702,984 | 15,718,713 |
| VIP Growth Portfolio Initial Class (a) | | 129,383 | 13,326,401 |
| VIP Mid Cap Portfolio Initial Class (a) | | 98,439 | 3,811,563 |
| VIP Value Portfolio Initial Class (a) | | 632,862 | 10,094,146 |
| VIP Value Strategies Portfolio Initial Class (a) | | 364,459 | 4,938,425 |
| TOTAL DOMESTIC EQUITY FUNDS | | | |
| (Cost $57,264,135) | | | 74,765,795 |
|
| International Equity Funds - 41.4% | | | |
| VIP Emerging Markets Portfolio Initial Class (a) | | 1,689,862 | 24,925,471 |
| VIP Overseas Portfolio Initial Class (a) | | 1,409,349 | 37,375,927 |
| TOTAL INTERNATIONAL EQUITY FUNDS | | | |
| (Cost $45,851,901) | | | 62,301,398 |
|
| Bond Funds - 8.7% | | | |
| Fidelity Inflation-Protected Bond Index Fund (a) | | 273,163 | 3,015,724 |
| Fidelity Long-Term Treasury Bond Index Fund (a) | | 217,496 | 3,469,059 |
| VIP High Income Portfolio Initial Class (a) | | 566,848 | 3,009,962 |
| VIP Investment Grade Bond Portfolio Initial Class (a) | | 261,883 | 3,689,937 |
| TOTAL BOND FUNDS | | | |
| (Cost $12,415,093) | | | 13,184,682 |
|
| Short-Term Funds - 0.2% | | | |
| Fidelity Cash Central Fund 0.11% (b) | | 2,100 | 2,100 |
| VIP Government Money Market Portfolio Initial Class 0.01% (a)(c) | | 300,700 | 300,700 |
| TOTAL SHORT-TERM FUNDS | | | |
| (Cost $302,800) | | | 302,800 |
| TOTAL INVESTMENT IN SECURITIES - 100.0% | | | |
| (Cost $115,833,929) | | | 150,554,675 |
| NET OTHER ASSETS (LIABILITIES) - 0.0% | | | (13,058) |
| NET ASSETS - 100% | | | $150,541,617 |
Legend
(a) Affiliated Fund
(b) Affiliated fund that is generally available only to investment companies and other accounts managed by Fidelity Investments. The rate quoted is the annualized seven-day yield of the fund at period end. A complete unaudited listing of the fund's holdings as of its most recent quarter end is available upon request. In addition, each Fidelity Central Fund's financial statements, which are not covered by the Fund's Report of Independent Registered Public Accounting Firm, are available on the SEC's website or upon request.
(c) The rate quoted is the annualized seven-day yield of the fund at period end.
Affiliated Central Funds
Information regarding fiscal year to date income earned by the Fund from investments in Fidelity Central Funds is as follows:
| Fund | Income earned |
| Fidelity Cash Central Fund | $4 |
| Total | $4 |
Amounts in the income column in the above table include any capital gain distributions from underlying funds, which are presented in the corresponding line-item in the Statement of Operations, if applicable.
Affiliated Underlying Funds
Fiscal year to date information regarding the Fund's investments in affiliated Underlying Funds, excluding any Money Market Central Funds, is presented below. Exchanges between classes of the same affiliated Underlying Funds may occur. Certain Underlying Funds incurred name changes since their most recent shareholder report. The names of the Underlying Funds are those in effect at period end.
| Affiliate | Value, beginning of period | Purchases | Sales Proceeds | Dividend Income | Realized Gain (loss) | Change in Unrealized appreciation (depreciation) | Value, end of period |
| Fidelity Inflation-Protected Bond Index Fund | $2,288,160 | $1,887,080 | $1,370,295 | $34,553 | $2,756 | $208,023 | $3,015,724 |
| Fidelity Long-Term Treasury Bond Index Fund | 2,886,614 | 2,607,315 | 2,368,899 | 120,212 | 210,532 | 133,497 | 3,469,059 |
| VIP Contrafund Portfolio Initial Class | 9,760,852 | 5,709,209 | 5,141,599 | 79,612 | 61,802 | 2,686,879 | 13,077,143 |
| VIP Emerging Markets Portfolio Initial Class | 15,885,334 | 11,520,756 | 6,752,821 | 2,046,029 | 97,187 | 4,175,015 | 24,925,471 |
| VIP Equity-Income Portfolio Initial Class | 10,308,470 | 6,875,228 | 3,869,912 | 649,353 | (22,777) | 508,395 | 13,799,404 |
| VIP Government Money Market Portfolio Initial Class 0.01% | 1,146,197 | 4,045,980 | 4,891,477 | 5,791 | -- | -- | 300,700 |
| VIP Growth & Income Portfolio Initial Class | 11,753,343 | 8,167,426 | 4,836,978 | 836,291 | (64,585) | 699,507 | 15,718,713 |
| VIP Growth Portfolio Initial Class | 9,976,373 | 5,791,361 | 5,379,444 | 1,028,376 | 168,618 | 2,769,493 | 13,326,401 |
| VIP High Income Portfolio Initial Class | 2,293,766 | 1,723,712 | 952,942 | 134,686 | (22,436) | (32,138) | 3,009,962 |
| VIP Investment Grade Bond Portfolio Initial Class | 2,800,670 | 3,872,760 | 3,147,553 | 73,210 | (8,698) | 172,758 | 3,689,937 |
| VIP Mid Cap Portfolio Initial Class | 2,862,652 | 1,586,213 | 1,323,121 | 19,513 | (46,897) | 732,716 | 3,811,563 |
| VIP Overseas Portfolio Initial Class | 30,936,305 | 15,192,838 | 13,521,221 | 278,977 | (9,784) | 4,777,789 | 37,375,927 |
| VIP Value Portfolio Initial Class | 7,572,990 | 5,733,012 | 3,945,225 | 396,526 | (141,543) | 874,912 | 10,094,146 |
| VIP Value Strategies Portfolio Initial Class | 3,710,794 | 2,858,452 | 2,057,754 | 233,381 | (177,058) | 603,991 | 4,938,425 |
| | 114,182,520 | 77,571,342 | 59,559,241 | 5,936,510 | 47,117 | 18,310,837 | 150,552,575 |
Amounts in the income column in the above table include any capital gain distributions from underlying funds, which are presented in the corresponding line-item in the Statement of Operations, if applicable.
Investment Valuation
The following is a summary of the inputs used, as of December 31, 2020, involving the Fund's assets and liabilities carried at fair value. The inputs or methodology used for valuing securities may not be an indication of the risk associated with investing in those securities. For more information on valuation inputs, and their aggregation into the levels used below, please refer to the Investment Valuation section in the accompanying Notes to Financial Statements.
| | Valuation Inputs at Reporting Date: |
| Description | Total | Level 1 | Level 2 | Level 3 |
| Investments in Securities: | | | | |
| Domestic Equity Funds | $74,765,795 | $74,765,795 | $-- | $-- |
| International Equity Funds | 62,301,398 | 62,301,398 | -- | -- |
| Bond Funds | 13,184,682 | 13,184,682 | -- | -- |
| Short-Term Funds | 302,800 | 302,800 | -- | -- |
| Total Investments in Securities: | $150,554,675 | $150,554,675 | $-- | $-- |
See accompanying notes which are an integral part of the financial statements.
VIP Freedom 2040 Portfolio℠
Financial Statements
Statement of Assets and Liabilities
| | | December 31, 2020 |
| Assets | | |
Investment in securities, at value — See accompanying schedule:
| | |
| Fidelity Central Funds (cost $2,100) | $2,100 | |
| Other affiliated issuers (cost $115,831,829) | 150,552,575 | |
| Total Investment in Securities (cost $115,833,929) | | $150,554,675 |
| Cash | | 3 |
| Receivable for investments sold | | 1,156,305 |
| Receivable for fund shares sold | | 629,625 |
| Total assets | | 152,340,608 |
| Liabilities | | |
| Payable for investments purchased | $1,631,479 | |
| Payable for fund shares redeemed | 154,454 | |
| Distribution and service plan fees payable | 13,058 | |
| Total liabilities | | 1,798,991 |
| Net Assets | | $150,541,617 |
| Net Assets consist of: | | |
| Paid in capital | | $112,748,854 |
| Total accumulated earnings (loss) | | 37,792,763 |
| Net Assets | | $150,541,617 |
| Net Asset Value and Maximum Offering Price | | |
| Initial Class: | | |
| Net Asset Value, offering price and redemption price per share ($34,364,959 ÷ 1,323,517 shares) | | $25.96 |
| Service Class: | | |
| Net Asset Value, offering price and redemption price per share ($85,197,057 ÷ 3,288,221 shares) | | $25.91 |
| Service Class 2: | | |
| Net Asset Value, offering price and redemption price per share ($30,979,601 ÷ 1,200,707 shares) | | $25.80 |
See accompanying notes which are an integral part of the financial statements.
Statement of Operations
| | | Year ended December 31, 2020 |
| Investment Income | | |
| Dividends: | | |
| Affiliated issuers | | $1,283,050 |
| Income from Fidelity Central Funds | | 4 |
| Total income | | 1,283,054 |
| Expenses | | |
| Distribution and service plan fees | $130,000 | |
| Independent trustees' fees and expenses | 379 | |
| Total expenses before reductions | 130,379 | |
| Expense reductions | (24) | |
| Total expenses after reductions | | 130,355 |
| Net investment income (loss) | | 1,152,699 |
| Realized and Unrealized Gain (Loss) | | |
| Net realized gain (loss) on: | | |
| Investment securities: | | |
| Affiliated issuers | 47,117 | |
| Capital gain distributions from underlying funds: | | |
| Affiliated issuers | 4,653,460 | |
| Total net realized gain (loss) | | 4,700,577 |
| Change in net unrealized appreciation (depreciation) on: | | |
| Investment securities: | | |
| Affiliated issuers | 18,310,837 | |
| Total change in net unrealized appreciation (depreciation) | | 18,310,837 |
| Net gain (loss) | | 23,011,414 |
| Net increase (decrease) in net assets resulting from operations | | $24,164,113 |
See accompanying notes which are an integral part of the financial statements.
Statement of Changes in Net Assets
| | Year ended December 31, 2020 | Year ended December 31, 2019 |
| Increase (Decrease) in Net Assets | | |
| Operations | | |
| Net investment income (loss) | $1,152,699 | $1,763,499 |
| Net realized gain (loss) | 4,700,577 | 5,687,981 |
| Change in net unrealized appreciation (depreciation) | 18,310,837 | 16,800,663 |
| Net increase (decrease) in net assets resulting from operations | 24,164,113 | 24,252,143 |
| Distributions to shareholders | (7,009,502) | (5,115,366) |
| Share transactions - net increase (decrease) | 19,212,268 | 11,566,566 |
| Total increase (decrease) in net assets | 36,366,879 | 30,703,343 |
| Net Assets | | |
| Beginning of period | 114,174,738 | 83,471,395 |
| End of period | $150,541,617 | $114,174,738 |
See accompanying notes which are an integral part of the financial statements.
Financial Highlights
VIP Freedom 2040 Portfolio Initial Class
| Years ended December 31, | 2020 | 2019 | 2018 | 2017 | 2016 |
| Selected Per–Share Data | | | | | |
| Net asset value, beginning of period | $23.08 | $18.94 | $21.76 | $18.39 | $18.19 |
| Income from Investment Operations | | | | | |
| Net investment income (loss)A | .24 | .40 | .27 | .28 | .23 |
| Net realized and unrealized gain (loss) | 4.02 | 4.88 | (2.39) | 3.98 | .88 |
| Total from investment operations | 4.26 | 5.28 | (2.12) | 4.26 | 1.11 |
| Distributions from net investment income | (.23) | (.39) | (.25) | (.25) | (.24) |
| Distributions from net realized gain | (1.16) | (.75) | (.45) | (.64) | (.67) |
| Total distributions | (1.38)B | (1.14) | (.70) | (.89) | (.91) |
| Net asset value, end of period | $25.96 | $23.08 | $18.94 | $21.76 | $18.39 |
| Total ReturnC,D | 19.28% | 28.52% | (9.88)% | 23.60% | 6.83% |
| Ratios to Average Net AssetsE,F | | | | | |
| Expenses before reductionsG | -% | -% | -% | -% | -% |
| Expenses net of fee waivers, if any | - %G | - %G | - %G | -% | -% |
| Expenses net of all reductions | - %G | - %G | - %G | -% | -% |
| Net investment income (loss) | 1.07% | 1.86% | 1.26% | 1.39% | 1.29% |
| Supplemental Data | | | | | |
| Net assets, end of period (000 omitted) | $34,365 | $27,284 | $19,652 | $16,561 | $11,515 |
| Portfolio turnover rateH | 49% | 36% | 39% | 26% | 36% |
A Calculated based on average shares outstanding during the period.
B Total distributions per share do not sum due to rounding.
C Total returns do not reflect charges attributable to your insurance company's separate account. Inclusion of these charges would reduce the total returns shown.
D Total returns would have been lower if certain expenses had not been reduced during the applicable periods shown.
E Fees and expenses of any underlying mutual funds or exchange-traded funds (ETFs) are not included in the Fund's expense ratio. The Fund indirectly bears its proportionate share of these expenses. For additional expense information related to investments in Fidelity Central Funds, please refer to the "Investments in Fidelity Central Funds" note found in the Notes to Financial Statements section of the most recent Annual or Semi-Annual report.
F Expense ratios reflect operating expenses of the class. Expenses before reductions do not reflect amounts reimbursed, waived, or reduced through arrangements with the investment adviser, brokerage services, or other offset arrangements, if applicable, and do not represent the amount paid by the class during periods when reimbursements, waivers or reductions occur.
G Amount represents less than .005%.
H Amount does not include the portfolio activity of any underlying mutual funds or exchange-traded funds (ETFs).
See accompanying notes which are an integral part of the financial statements.
VIP Freedom 2040 Portfolio Service Class
| Years ended December 31, | 2020 | 2019 | 2018 | 2017 | 2016 |
| Selected Per–Share Data | | | | | |
| Net asset value, beginning of period | $23.04 | $18.91 | $21.72 | $18.37 | $18.17 |
| Income from Investment Operations | | | | | |
| Net investment income (loss)A | .21 | .37 | .25 | .26 | .21 |
| Net realized and unrealized gain (loss) | 4.02 | 4.88 | (2.38) | 3.96 | .89 |
| Total from investment operations | 4.23 | 5.25 | (2.13) | 4.22 | 1.10 |
| Distributions from net investment income | (.21) | (.37) | (.23) | (.23) | (.23) |
| Distributions from net realized gain | (1.16) | (.75) | (.45) | (.64) | (.67) |
| Total distributions | (1.36)B | (1.12) | (.68) | (.87) | (.90) |
| Net asset value, end of period | $25.91 | $23.04 | $18.91 | $21.72 | $18.37 |
| Total ReturnC,D | 19.16% | 28.39% | (9.94)% | 23.42% | 6.75% |
| Ratios to Average Net AssetsE,F | | | | | |
| Expenses before reductions | .10% | .10% | .10% | .10% | .10% |
| Expenses net of fee waivers, if any | .10% | .10% | .10% | .10% | .10% |
| Expenses net of all reductions | .10% | .10% | .10% | .10% | .10% |
| Net investment income (loss) | .97% | 1.76% | 1.16% | 1.29% | 1.19% |
| Supplemental Data | | | | | |
| Net assets, end of period (000 omitted) | $85,197 | $63,170 | $48,429 | $45,492 | $22,986 |
| Portfolio turnover rateG | 49% | 36% | 39% | 26% | 36% |
A Calculated based on average shares outstanding during the period.
B Total distributions per share do not sum due to rounding.
C Total returns do not reflect charges attributable to your insurance company's separate account. Inclusion of these charges would reduce the total returns shown.
D Total returns would have been lower if certain expenses had not been reduced during the applicable periods shown.
E Fees and expenses of any underlying mutual funds or exchange-traded funds (ETFs) are not included in the Fund's expense ratio. The Fund indirectly bears its proportionate share of these expenses. For additional expense information related to investments in Fidelity Central Funds, please refer to the "Investments in Fidelity Central Funds" note found in the Notes to Financial Statements section of the most recent Annual or Semi-Annual report.
F Expense ratios reflect operating expenses of the class. Expenses before reductions do not reflect amounts reimbursed, waived, or reduced through arrangements with the investment adviser, brokerage services, or other offset arrangements, if applicable, and do not represent the amount paid by the class during periods when reimbursements, waivers or reductions occur.
G Amount does not include the portfolio activity of any underlying mutual funds or exchange-traded funds (ETFs).
See accompanying notes which are an integral part of the financial statements.
VIP Freedom 2040 Portfolio Service Class 2
| Years ended December 31, | 2020 | 2019 | 2018 | 2017 | 2016 |
| Selected Per–Share Data | | | | | |
| Net asset value, beginning of period | $22.95 | $18.84 | $21.65 | $18.30 | $18.12 |
| Income from Investment Operations | | | | | |
| Net investment income (loss)A | .18 | .34 | .22 | .23 | .18 |
| Net realized and unrealized gain (loss) | 4.00 | 4.86 | (2.38) | 3.95 | .87 |
| Total from investment operations | 4.18 | 5.20 | (2.16) | 4.18 | 1.05 |
| Distributions from net investment income | (.17) | (.34) | (.20) | (.19) | (.20) |
| Distributions from net realized gain | (1.15) | (.75) | (.45) | (.64) | (.67) |
| Total distributions | (1.33)B | (1.09) | (.65) | (.83) | (.87) |
| Net asset value, end of period | $25.80 | $22.95 | $18.84 | $21.65 | $18.30 |
| Total ReturnC,D | 18.99% | 28.23% | (10.12)% | 23.30% | 6.53% |
| Ratios to Average Net AssetsE,F | | | | | |
| Expenses before reductions | .25% | .25% | .25% | .25% | .25% |
| Expenses net of fee waivers, if any | .25% | .25% | .25% | .25% | .25% |
| Expenses net of all reductions | .25% | .25% | .25% | .25% | .25% |
| Net investment income (loss) | .82% | 1.61% | 1.01% | 1.14% | 1.04% |
| Supplemental Data | | | | | |
| Net assets, end of period (000 omitted) | $30,980 | $23,721 | $15,391 | $16,380 | $15,086 |
| Portfolio turnover rateG | 49% | 36% | 39% | 26% | 36% |
A Calculated based on average shares outstanding during the period.
B Total distributions per share do not sum due to rounding.
C Total returns do not reflect charges attributable to your insurance company's separate account. Inclusion of these charges would reduce the total returns shown.
D Total returns would have been lower if certain expenses had not been reduced during the applicable periods shown.
E Fees and expenses of any underlying mutual funds or exchange-traded funds (ETFs) are not included in the Fund's expense ratio. The Fund indirectly bears its proportionate share of these expenses. For additional expense information related to investments in Fidelity Central Funds, please refer to the "Investments in Fidelity Central Funds" note found in the Notes to Financial Statements section of the most recent Annual or Semi-Annual report.
F Expense ratios reflect operating expenses of the class. Expenses before reductions do not reflect amounts reimbursed, waived, or reduced through arrangements with the investment adviser, brokerage services, or other offset arrangements, if applicable, and do not represent the amount paid by the class during periods when reimbursements, waivers or reductions occur.
G Amount does not include the portfolio activity of any underlying mutual funds or exchange-traded funds (ETFs).
See accompanying notes which are an integral part of the financial statements.
VIP Freedom 2045 Portfolio℠
Investment Summary (Unaudited)
The information in the following tables is based on the direct investments of the Fund.
Top Holdings as of December 31, 2020
| | % of fund's net assets |
| VIP Overseas Portfolio Initial Class | 24.8 |
| VIP Emerging Markets Portfolio Initial Class | 16.6 |
| VIP Growth & Income Portfolio Initial Class | 10.4 |
| VIP Equity-Income Portfolio Initial Class | 9.2 |
| VIP Growth Portfolio Initial Class | 8.9 |
| VIP Contrafund Portfolio Initial Class | 8.7 |
| VIP Value Portfolio Initial Class | 6.7 |
| VIP Value Strategies Portfolio Initial Class | 3.3 |
| VIP Mid Cap Portfolio Initial Class | 2.5 |
| VIP Investment Grade Bond Portfolio Initial Class | 2.4 |
| | 93.5 |
Asset Allocation (% of fund's net assets)
| Period end |
| | Domestic Equity Funds | 49.7% |
| | International Equity Funds | 41.4% |
| | Bond Funds | 8.7% |
| | Short-Term Funds | 0.2% |

VIP Freedom 2045 Portfolio℠
Schedule of Investments December 31, 2020
Showing Percentage of Net Assets
| Domestic Equity Funds - 49.7% | | | |
| | | Shares | Value |
| VIP Contrafund Portfolio Initial Class (a) | | 147,400 | $7,100,261 |
| VIP Equity-Income Portfolio Initial Class (a) | | 313,501 | 7,492,668 |
| VIP Growth & Income Portfolio Initial Class (a) | | 381,680 | 8,534,374 |
| VIP Growth Portfolio Initial Class (a) | | 70,248 | 7,235,530 |
| VIP Mid Cap Portfolio Initial Class (a) | | 53,448 | 2,069,512 |
| VIP Value Portfolio Initial Class (a) | | 343,615 | 5,480,655 |
| VIP Value Strategies Portfolio Initial Class (a) | | 197,884 | 2,681,333 |
| TOTAL DOMESTIC EQUITY FUNDS | | | |
| (Cost $32,447,618) | | | 40,594,333 |
|
| International Equity Funds - 41.4% | | | |
| VIP Emerging Markets Portfolio Initial Class (a) | | 917,475 | 13,532,750 |
| VIP Overseas Portfolio Initial Class (a) | | 765,206 | 20,293,269 |
| TOTAL INTERNATIONAL EQUITY FUNDS | | | |
| (Cost $25,767,139) | | | 33,826,019 |
|
| Bond Funds - 8.7% | | | |
| Fidelity Inflation-Protected Bond Index Fund (a) | | 148,318 | 1,637,430 |
| Fidelity Long-Term Treasury Bond Index Fund (a) | | 118,094 | 1,883,597 |
| VIP High Income Portfolio Initial Class (a) | | 307,776 | 1,634,291 |
| VIP Investment Grade Bond Portfolio Initial Class (a) | | 142,192 | 2,003,485 |
| TOTAL BOND FUNDS | | | |
| (Cost $6,770,176) | | | 7,158,803 |
|
| Short-Term Funds - 0.2% | | | |
| Fidelity Cash Central Fund 0.11% (b) | | 899 | 900 |
| VIP Government Money Market Portfolio Initial Class 0.01% (a)(c) | | 163,305 | 163,305 |
| TOTAL SHORT-TERM FUNDS | | | |
| (Cost $164,205) | | | 164,205 |
| TOTAL INVESTMENT IN SECURITIES - 100.0% | | �� | |
| (Cost $65,149,138) | | | 81,743,360 |
| NET OTHER ASSETS (LIABILITIES) - 0.0% | | | (13,889) |
| NET ASSETS - 100% | | | $81,729,471 |
Legend
(a) Affiliated Fund
(b) Affiliated fund that is generally available only to investment companies and other accounts managed by Fidelity Investments. The rate quoted is the annualized seven-day yield of the fund at period end. A complete unaudited listing of the fund's holdings as of its most recent quarter end is available upon request. In addition, each Fidelity Central Fund's financial statements, which are not covered by the Fund's Report of Independent Registered Public Accounting Firm, are available on the SEC's website or upon request.
(c) The rate quoted is the annualized seven-day yield of the fund at period end.
Affiliated Underlying Funds
Fiscal year to date information regarding the Fund's investments in affiliated Underlying Funds, excluding any Money Market Central Funds, is presented below. Exchanges between classes of the same affiliated Underlying Funds may occur. Certain Underlying Funds incurred name changes since their most recent shareholder report. The names of the Underlying Funds are those in effect at period end.
| Affiliate | Value, beginning of period | Purchases | Sales Proceeds | Dividend Income | Realized Gain (loss) | Change in Unrealized appreciation (depreciation) | Value, end of period |
| Fidelity Inflation-Protected Bond Index Fund | $1,140,493 | $931,887 | $543,957 | $18,660 | $590 | $108,417 | $1,637,430 |
| Fidelity Long-Term Treasury Bond Index Fund | 1,438,753 | 1,307,774 | 1,029,686 | 64,254 | 84,678 | 82,078 | 1,883,597 |
| VIP Contrafund Portfolio Initial Class | 4,864,921 | 2,912,754 | 2,132,246 | 41,258 | 30,604 | 1,424,228 | 7,100,261 |
| VIP Emerging Markets Portfolio Initial Class | 7,918,408 | 5,540,869 | 2,253,600 | 1,064,012 | 8,143 | 2,318,930 | 13,532,750 |
| VIP Equity-Income Portfolio Initial Class | 5,137,967 | 3,378,140 | 1,339,557 | 336,721 | (34,061) | 350,179 | 7,492,668 |
| VIP Government Money Market Portfolio Initial Class 0.01% | 571,302 | 2,007,526 | 2,415,523 | 2,919 | -- | -- | 163,305 |
| VIP Growth & Income Portfolio Initial Class | 5,858,089 | 3,992,134 | 1,721,593 | 433,861 | (22,980) | 428,724 | 8,534,374 |
| VIP Growth Portfolio Initial Class | 4,972,337 | 2,903,653 | 2,203,882 | 527,637 | 32,864 | 1,530,558 | 7,235,530 |
| VIP High Income Portfolio Initial Class | 1,143,288 | 880,643 | 365,554 | 73,388 | (12,354) | (11,732) | 1,634,291 |
| VIP Investment Grade Bond Portfolio Initial Class | 1,395,945 | 1,963,972 | 1,440,541 | 39,792 | (3,549) | 87,658 | 2,003,485 |
| VIP Mid Cap Portfolio Initial Class | 1,426,819 | 740,925 | 479,113 | 10,540 | (19,646) | 400,527 | 2,069,512 |
| VIP Overseas Portfolio Initial Class | 15,418,324 | 7,722,735 | 5,470,486 | 147,436 | (82,073) | 2,704,769 | 20,293,269 |
| VIP Value Portfolio Initial Class | 3,774,526 | 2,783,719 | 1,531,683 | 205,010 | (68,030) | 522,123 | 5,480,655 |
| VIP Value Strategies Portfolio Initial Class | 1,849,557 | 1,361,271 | 789,958 | 119,943 | (71,264) | 331,727 | 2,681,333 |
| | 56,910,729 | 38,428,002 | 23,717,379 | 3,085,431 | (157,078) | 10,278,186 | 81,742,460 |
Amounts in the income column in the above table include any capital gain distributions from underlying funds, which are presented in the corresponding line-item in the Statement of Operations, if applicable.
Investment Valuation
The following is a summary of the inputs used, as of December 31, 2020, involving the Fund's assets and liabilities carried at fair value. The inputs or methodology used for valuing securities may not be an indication of the risk associated with investing in those securities. For more information on valuation inputs, and their aggregation into the levels used below, please refer to the Investment Valuation section in the accompanying Notes to Financial Statements.
| | Valuation Inputs at Reporting Date: |
| Description | Total | Level 1 | Level 2 | Level 3 |
| Investments in Securities: | | | | |
| Domestic Equity Funds | $40,594,333 | $40,594,333 | $-- | $-- |
| International Equity Funds | 33,826,019 | 33,826,019 | -- | -- |
| Bond Funds | 7,158,803 | 7,158,803 | -- | -- |
| Short-Term Funds | 164,205 | 164,205 | -- | -- |
| Total Investments in Securities: | $81,743,360 | $81,743,360 | $-- | $-- |
See accompanying notes which are an integral part of the financial statements.
VIP Freedom 2045 Portfolio℠
Financial Statements
Statement of Assets and Liabilities
| | | December 31, 2020 |
| Assets | | |
Investment in securities, at value — See accompanying schedule:
| | |
| Fidelity Central Funds (cost $900) | $900 | |
| Other affiliated issuers (cost $65,148,238) | 81,742,460 | |
| Total Investment in Securities (cost $65,149,138) | | $81,743,360 |
| Receivable for investments sold | | 717,792 |
| Receivable for fund shares sold | | 137,731 |
| Total assets | | 82,598,883 |
| Liabilities | | |
| Payable for investments purchased | $775,111 | |
| Payable for fund shares redeemed | 80,408 | |
| Distribution and service plan fees payable | 13,893 | |
| Total liabilities | | 869,412 |
| Net Assets | | $81,729,471 |
| Net Assets consist of: | | |
| Paid in capital | | $63,842,321 |
| Total accumulated earnings (loss) | | 17,887,150 |
| Net Assets | | $81,729,471 |
| Net Asset Value and Maximum Offering Price | | |
| Initial Class: | | |
| Net Asset Value, offering price and redemption price per share ($5,281,506 ÷ 202,406 shares) | | $26.09 |
| Service Class: | | |
| Net Asset Value, offering price and redemption price per share ($13,322,345 ÷ 511,750 shares) | | $26.03 |
| Service Class 2: | | |
| Net Asset Value, offering price and redemption price per share ($63,125,620 ÷ 2,436,904 shares) | | $25.90 |
See accompanying notes which are an integral part of the financial statements.
Statement of Operations
| | | Year ended December 31, 2020 |
| Investment Income | | |
| Dividends: | | |
| Affiliated issuers | | $695,464 |
| Expenses | | |
| Distribution and service plan fees | $132,108 | |
| Independent trustees' fees and expenses | 194 | |
| Total expenses before reductions | 132,302 | |
| Expense reductions | (13) | |
| Total expenses after reductions | | 132,289 |
| Net investment income (loss) | | 563,175 |
| Realized and Unrealized Gain (Loss) | | |
| Net realized gain (loss) on: | | |
| Investment securities: | | |
| Affiliated issuers | (157,078) | |
| Capital gain distributions from underlying funds: | | |
| Affiliated issuers | 2,389,967 | |
| Total net realized gain (loss) | | 2,232,889 |
| Change in net unrealized appreciation (depreciation) on: | | |
| Investment securities: | | |
| Affiliated issuers | 10,278,186 | |
| Total change in net unrealized appreciation (depreciation) | | 10,278,186 |
| Net gain (loss) | | 12,511,075 |
| Net increase (decrease) in net assets resulting from operations | | $13,074,250 |
See accompanying notes which are an integral part of the financial statements.
Statement of Changes in Net Assets
| | Year ended December 31, 2020 | Year ended December 31, 2019 |
| Increase (Decrease) in Net Assets | | |
| Operations | | |
| Net investment income (loss) | $563,175 | $806,330 |
| Net realized gain (loss) | 2,232,889 | 2,316,712 |
| Change in net unrealized appreciation (depreciation) | 10,278,186 | 7,695,918 |
| Net increase (decrease) in net assets resulting from operations | 13,074,250 | 10,818,960 |
| Distributions to shareholders | (3,303,391) | (2,203,901) |
| Share transactions - net increase (decrease) | 15,056,889 | 13,505,541 |
| Total increase (decrease) in net assets | 24,827,748 | 22,120,600 |
| Net Assets | | |
| Beginning of period | 56,901,723 | 34,781,123 |
| End of period | $81,729,471 | $56,901,723 |
See accompanying notes which are an integral part of the financial statements.
Financial Highlights
VIP Freedom 2045 Portfolio Initial Class
| Years ended December 31, | 2020 | 2019 | 2018 | 2017 | 2016 |
| Selected Per–Share Data | | | | | |
| Net asset value, beginning of period | $23.08 | $18.91 | $21.64 | $18.31 | $18.03 |
| Income from Investment Operations | | | | | |
| Net investment income (loss)A | .25 | .43 | .27 | .30 | .28 |
| Net realized and unrealized gain (loss) | 4.03 | 4.85 | (2.39) | 3.93 | .83 |
| Total from investment operations | 4.28 | 5.28 | (2.12) | 4.23 | 1.11 |
| Distributions from net investment income | (.22) | (.37) | (.25) | (.24) | (.24) |
| Distributions from net realized gain | (1.05) | (.74) | (.37) | (.66) | (.59) |
| Total distributions | (1.27) | (1.11) | (.61)B | (.90) | (.83) |
| Net asset value, end of period | $26.09 | $23.08 | $18.91 | $21.64 | $18.31 |
| Total ReturnC,D | 19.27% | 28.57% | (9.89)% | 23.59% | 6.80% |
| Ratios to Average Net AssetsE | | | | | |
| Expenses before reductionsF | -% | -% | -% | -% | -% |
| Expenses net of fee waivers, if any | - %F | - %F | - %F | -% | -% |
| Expenses net of all reductions | - %F | - %F | - %F | -% | -% |
| Net investment income (loss) | 1.12% | 2.01% | 1.25% | 1.46% | 1.57% |
| Supplemental Data | | | | | |
| Net assets, end of period (000 omitted) | $5,282 | $3,686 | $2,583 | $1,491 | $789 |
| Portfolio turnover rateG | 38% | 25% | 42% | 23% | 19% |
A Calculated based on average shares outstanding during the period.
B Total distributions per share do not sum due to rounding.
C Total returns do not reflect charges attributable to your insurance company's separate account. Inclusion of these charges would reduce the total returns shown.
D Total returns would have been lower if certain expenses had not been reduced during the applicable periods shown.
E Expense ratios reflect operating expenses of the class. Expenses before reductions do not reflect amounts reimbursed, waived, or reduced through arrangements with the investment adviser, brokerage services, or other offset arrangements, if applicable, and do not represent the amount paid by the class during periods when reimbursements, waivers or reductions occur.
F Amount represents less than .005%.
G Amount does not include the portfolio activity of any underlying mutual funds or exchange-traded funds (ETFs).
See accompanying notes which are an integral part of the financial statements.
VIP Freedom 2045 Portfolio Service Class
| Years ended December 31, | 2020 | 2019 | 2018 | 2017 | 2016 |
| Selected Per–Share Data | | | | | |
| Net asset value, beginning of period | $23.03 | $18.88 | $21.61 | $18.30 | $18.02 |
| Income from Investment Operations | | | | | |
| Net investment income (loss)A | .23 | .41 | .24 | .28 | .26 |
| Net realized and unrealized gain (loss) | 4.02 | 4.83 | (2.37) | 3.92 | .84 |
| Total from investment operations | 4.25 | 5.24 | (2.13) | 4.20 | 1.10 |
| Distributions from net investment income | (.21) | (.35) | (.23) | (.23) | (.23) |
| Distributions from net realized gain | (1.05) | (.74) | (.37) | (.66) | (.59) |
| Total distributions | (1.25)B | (1.09) | (.60) | (.89) | (.82) |
| Net asset value, end of period | $26.03 | $23.03 | $18.88 | $21.61 | $18.30 |
| Total ReturnC,D | 19.18% | 28.40% | (9.97)% | 23.42% | 6.73% |
| Ratios to Average Net AssetsE | | | | | |
| Expenses before reductions | .10% | .10% | .10% | .10% | .10% |
| Expenses net of fee waivers, if any | .10% | .10% | .10% | .10% | .10% |
| Expenses net of all reductions | .10% | .10% | .10% | .10% | .10% |
| Net investment income (loss) | 1.02% | 1.91% | 1.15% | 1.36% | 1.47% |
| Supplemental Data | | | | | |
| Net assets, end of period (000 omitted) | $13,322 | $7,345 | $3,900 | $1,923 | $396 |
| Portfolio turnover rateF | 38% | 25% | 42% | 23% | 19% |
A Calculated based on average shares outstanding during the period.
B Total distributions per share do not sum due to rounding.
C Total returns do not reflect charges attributable to your insurance company's separate account. Inclusion of these charges would reduce the total returns shown.
D Total returns would have been lower if certain expenses had not been reduced during the applicable periods shown.
E Expense ratios reflect operating expenses of the class. Expenses before reductions do not reflect amounts reimbursed, waived, or reduced through arrangements with the investment adviser, brokerage services, or other offset arrangements, if applicable, and do not represent the amount paid by the class during periods when reimbursements, waivers or reductions occur.
F Amount does not include the portfolio activity of any underlying mutual funds or exchange-traded funds (ETFs).
See accompanying notes which are an integral part of the financial statements.
VIP Freedom 2045 Portfolio Service Class 2
| Years ended December 31, | 2020 | 2019 | 2018 | 2017 | 2016 |
| Selected Per–Share Data | | | | | |
| Net asset value, beginning of period | $22.93 | $18.80 | $21.52 | $18.22 | $17.95 |
| Income from Investment Operations | | | | | |
| Net investment income (loss)A | .19 | .37 | .21 | .24 | .23 |
| Net realized and unrealized gain (loss) | 4.00 | 4.82 | (2.37) | 3.92 | .84 |
| Total from investment operations | 4.19 | 5.19 | (2.16) | 4.16 | 1.07 |
| Distributions from net investment income | (.17) | (.33) | (.20) | (.20) | (.20) |
| Distributions from net realized gain | (1.05) | (.74) | (.37) | (.66) | (.59) |
| Total distributions | (1.22) | (1.06)B | (.56)B | (.86) | (.80)B |
| Net asset value, end of period | $25.90 | $22.93 | $18.80 | $21.52 | $18.22 |
| Total ReturnC,D | 18.97% | 28.25% | (10.13)% | 23.30% | 6.56% |
| Ratios to Average Net AssetsE | | | | | |
| Expenses before reductions | .25% | .25% | .25% | .25% | .25% |
| Expenses net of fee waivers, if any | .25% | .25% | .25% | .25% | .25% |
| Expenses net of all reductions | .25% | .25% | .25% | .25% | .25% |
| Net investment income (loss) | .87% | 1.76% | 1.00% | 1.21% | 1.32% |
| Supplemental Data | | | | | |
| Net assets, end of period (000 omitted) | $63,126 | $45,871 | $28,298 | $27,399 | $16,671 |
| Portfolio turnover rateF | 38% | 25% | 42% | 23% | 19% |
A Calculated based on average shares outstanding during the period.
B Total distributions per share do not sum due to rounding.
C Total returns do not reflect charges attributable to your insurance company's separate account. Inclusion of these charges would reduce the total returns shown.
D Total returns would have been lower if certain expenses had not been reduced during the applicable periods shown.
E Expense ratios reflect operating expenses of the class. Expenses before reductions do not reflect amounts reimbursed, waived, or reduced through arrangements with the investment adviser, brokerage services, or other offset arrangements, if applicable, and do not represent the amount paid by the class during periods when reimbursements, waivers or reductions occur.
F Amount does not include the portfolio activity of any underlying mutual funds or exchange-traded funds (ETFs).
See accompanying notes which are an integral part of the financial statements.
VIP Freedom 2050 Portfolio℠
Investment Summary (Unaudited)
The information in the following tables is based on the direct investments of the Fund.
Top Holdings as of December 31, 2020
| | % of fund's net assets |
| VIP Overseas Portfolio Initial Class | 24.8 |
| VIP Emerging Markets Portfolio Initial Class | 16.6 |
| VIP Growth & Income Portfolio Initial Class | 10.4 |
| VIP Equity-Income Portfolio Initial Class | 9.2 |
| VIP Growth Portfolio Initial Class | 8.9 |
| VIP Contrafund Portfolio Initial Class | 8.7 |
| VIP Value Portfolio Initial Class | 6.7 |
| VIP Value Strategies Portfolio Initial Class | 3.3 |
| VIP Mid Cap Portfolio Initial Class | 2.5 |
| VIP Investment Grade Bond Portfolio Initial Class | 2.4 |
| | 93.5 |
Asset Allocation (% of fund's net assets)
| Period end |
| | Domestic Equity Funds | 49.7% |
| | International Equity Funds | 41.4% |
| | Bond Funds | 8.7% |
| | Short-Term Funds | 0.2% |

VIP Freedom 2050 Portfolio℠
Schedule of Investments December 31, 2020
Showing Percentage of Net Assets
| Domestic Equity Funds - 49.7% | | | |
| | | Shares | Value |
| VIP Contrafund Portfolio Initial Class (a) | | 123,521 | $5,950,011 |
| VIP Equity-Income Portfolio Initial Class (a) | | 262,710 | 6,278,779 |
| VIP Growth & Income Portfolio Initial Class (a) | | 319,852 | 7,151,897 |
| VIP Growth Portfolio Initial Class (a) | | 58,867 | 6,063,332 |
| VIP Mid Cap Portfolio Initial Class (a) | | 44,789 | 1,734,234 |
| VIP Value Portfolio Initial Class (a) | | 287,948 | 4,592,766 |
| VIP Value Strategies Portfolio Initial Class (a) | | 165,827 | 2,246,949 |
| TOTAL DOMESTIC EQUITY FUNDS | | | |
| (Cost $26,920,651) | | | 34,017,968 |
|
| International Equity Funds - 41.4% | | | |
| VIP Emerging Markets Portfolio Initial Class (a) | | 768,878 | 11,340,951 |
| VIP Overseas Portfolio Initial Class (a) | | 641,247 | 17,005,863 |
| TOTAL INTERNATIONAL EQUITY FUNDS | | | |
| (Cost $21,520,245) | | | 28,346,814 |
|
| Bond Funds - 8.7% | | | |
| Fidelity Inflation-Protected Bond Index Fund (a) | | 124,293 | 1,372,191 |
| Fidelity Long-Term Treasury Bond Index Fund (a) | | 98,962 | 1,578,446 |
| VIP High Income Portfolio Initial Class (a) | | 257,923 | 1,369,570 |
| VIP Investment Grade Bond Portfolio Initial Class (a) | | 119,159 | 1,678,955 |
| TOTAL BOND FUNDS | | | |
| (Cost $5,642,118) | | | 5,999,162 |
|
| Short-Term Funds - 0.2% | | | |
| Fidelity Cash Central Fund 0.11% (b) | | 615 | 616 |
| VIP Government Money Market Portfolio Initial Class 0.01% (a)(c) | | 136,874 | 136,874 |
| TOTAL SHORT-TERM FUNDS | | | |
| (Cost $137,490) | | | 137,490 |
| TOTAL INVESTMENT IN SECURITIES - 100.0% | | | |
| (Cost $54,220,504) | | | 68,501,434 |
| NET OTHER ASSETS (LIABILITIES) - 0.0% | | | (8,324) |
| NET ASSETS - 100% | | | $68,493,110 |
Legend
(a) Affiliated Fund
(b) Affiliated fund that is generally available only to investment companies and other accounts managed by Fidelity Investments. The rate quoted is the annualized seven-day yield of the fund at period end. A complete unaudited listing of the fund's holdings as of its most recent quarter end is available upon request. In addition, each Fidelity Central Fund's financial statements, which are not covered by the Fund's Report of Independent Registered Public Accounting Firm, are available on the SEC's website or upon request.
(c) The rate quoted is the annualized seven-day yield of the fund at period end.
Affiliated Central Funds
Information regarding fiscal year to date income earned by the Fund from investments in Fidelity Central Funds is as follows:
| Fund | Income earned |
| Fidelity Cash Central Fund | $1 |
| Total | $1 |
Amounts in the income column in the above table include any capital gain distributions from underlying funds, which are presented in the corresponding line-item in the Statement of Operations, if applicable.
Affiliated Underlying Funds
Fiscal year to date information regarding the Fund's investments in affiliated Underlying Funds, excluding any Money Market Central Funds, is presented below. Exchanges between classes of the same affiliated Underlying Funds may occur. Certain Underlying Funds incurred name changes since their most recent shareholder report. The names of the Underlying Funds are those in effect at period end.
| Affiliate | Value, beginning of period | Purchases | Sales Proceeds | Dividend Income | Realized Gain (loss) | Change in Unrealized appreciation (depreciation) | Value, end of period |
| Fidelity Inflation-Protected Bond Index Fund | $904,084 | $896,386 | $517,196 | $15,490 | $723 | $88,194 | $1,372,191 |
| Fidelity Long-Term Treasury Bond Index Fund | 1,140,494 | 1,229,102 | 927,825 | 52,437 | 75,004 | 61,671 | 1,578,446 |
| VIP Contrafund Portfolio Initial Class | 3,856,590 | 2,801,187 | 1,886,845 | 33,668 | 2,262 | 1,176,817 | 5,950,011 |
| VIP Emerging Markets Portfolio Initial Class | 6,276,851 | 5,562,264 | 2,427,827 | 867,372 | 17,498 | 1,912,165 | 11,340,951 |
| VIP Equity-Income Portfolio Initial Class | 4,073,007 | 3,306,829 | 1,347,837 | 274,720 | (47,406) | 294,186 | 6,278,779 |
| VIP Government Money Market Portfolio Initial Class 0.01% | 452,878 | 1,752,322 | 2,068,326 | 2,403 | -- | -- | 136,874 |
| VIP Growth & Income Portfolio Initial Class | 4,643,886 | 3,856,067 | 1,662,250 | 353,924 | (44,292) | 358,486 | 7,151,897 |
| VIP Growth Portfolio Initial Class | 3,941,747 | 2,847,666 | 1,999,255 | 431,717 | (3,467) | 1,276,641 | 6,063,332 |
| VIP High Income Portfolio Initial Class | 906,306 | 830,109 | 346,305 | 59,111 | (9,949) | (10,591) | 1,369,570 |
| VIP Investment Grade Bond Portfolio Initial Class | 1,106,583 | 1,766,295 | 1,262,807 | 32,072 | (886) | 69,770 | 1,678,955 |
| VIP Mid Cap Portfolio Initial Class | 1,131,076 | 791,246 | 497,659 | 8,507 | (8,511) | 318,082 | 1,734,234 |
| VIP Overseas Portfolio Initial Class | 12,222,930 | 7,758,065 | 5,101,271 | 119,686 | (75,012) | 2,201,151 | 17,005,863 |
| VIP Value Portfolio Initial Class | 2,992,189 | 2,708,864 | 1,471,570 | 167,391 | (65,610) | 428,893 | 4,592,766 |
| VIP Value Strategies Portfolio Initial Class | 1,466,200 | 1,345,957 | 774,216 | 98,091 | (48,717) | 257,725 | 2,246,949 |
| | 45,114,821 | 37,452,359 | 22,291,189 | 2,516,589 | (208,363) | 8,433,190 | 68,500,818 |
Amounts in the income column in the above table include any capital gain distributions from underlying funds, which are presented in the corresponding line-item in the Statement of Operations, if applicable.
Investment Valuation
The following is a summary of the inputs used, as of December 31, 2020, involving the Fund's assets and liabilities carried at fair value. The inputs or methodology used for valuing securities may not be an indication of the risk associated with investing in those securities. For more information on valuation inputs, and their aggregation into the levels used below, please refer to the Investment Valuation section in the accompanying Notes to Financial Statements.
| | Valuation Inputs at Reporting Date: |
| Description | Total | Level 1 | Level 2 | Level 3 |
| Investments in Securities: | | | | |
| Domestic Equity Funds | $34,017,968 | $34,017,968 | $-- | $-- |
| International Equity Funds | 28,346,814 | 28,346,814 | -- | -- |
| Bond Funds | 5,999,162 | 5,999,162 | -- | -- |
| Short-Term Funds | 137,490 | 137,490 | -- | -- |
| Total Investments in Securities: | $68,501,434 | $68,501,434 | $-- | $-- |
See accompanying notes which are an integral part of the financial statements.
VIP Freedom 2050 Portfolio℠
Financial Statements
Statement of Assets and Liabilities
| | | December 31, 2020 |
| Assets | | |
Investment in securities, at value — See accompanying schedule:
| | |
| Fidelity Central Funds (cost $616) | $616 | |
| Other affiliated issuers (cost $54,219,888) | 68,500,818 | |
| Total Investment in Securities (cost $54,220,504) | | $68,501,434 |
| Cash | | 1 |
| Receivable for investments sold | | 529,277 |
| Receivable for fund shares sold | | 362,837 |
| Total assets | | 69,393,549 |
| Liabilities | | |
| Payable for investments purchased | $794,360 | |
| Payable for fund shares redeemed | 97,754 | |
| Distribution and service plan fees payable | 8,325 | |
| Total liabilities | | 900,439 |
| Net Assets | | $68,493,110 |
| Net Assets consist of: | | |
| Paid in capital | | $53,535,477 |
| Total accumulated earnings (loss) | | 14,957,633 |
| Net Assets | | $68,493,110 |
| Net Asset Value and Maximum Offering Price | | |
| Initial Class: | | |
| Net Asset Value, offering price and redemption price per share ($13,643,629 ÷ 581,708 shares) | | $23.45 |
| Service Class: | | |
| Net Asset Value, offering price and redemption price per share ($21,593,459 ÷ 923,026 shares) | | $23.39 |
| Service Class 2: | | |
| Net Asset Value, offering price and redemption price per share ($33,256,022 ÷ 1,426,936 shares) | | $23.31 |
See accompanying notes which are an integral part of the financial statements.
Statement of Operations
| | | Year ended December 31, 2020 |
| Investment Income | | |
| Dividends: | | |
| Affiliated issuers | | $561,217 |
| Income from Fidelity Central Funds | | 1 |
| Total income | | 561,218 |
| Expenses | | |
| Distribution and service plan fees | $77,374 | |
| Independent trustees' fees and expenses | 161 | |
| Total expenses before reductions | 77,535 | |
| Expense reductions | (6) | |
| Total expenses after reductions | | 77,529 |
| Net investment income (loss) | | 483,689 |
| Realized and Unrealized Gain (Loss) | | |
| Net realized gain (loss) on: | | |
| Investment securities: | | |
| Affiliated issuers | (208,363) | |
| Capital gain distributions from underlying funds: | | |
| Affiliated issuers | 1,955,372 | |
| Total net realized gain (loss) | | 1,747,009 |
| Change in net unrealized appreciation (depreciation) on: | | |
| Investment securities: | | |
| Affiliated issuers | 8,433,190 | |
| Total change in net unrealized appreciation (depreciation) | | 8,433,190 |
| Net gain (loss) | | 10,180,199 |
| Net increase (decrease) in net assets resulting from operations | | $10,663,888 |
See accompanying notes which are an integral part of the financial statements.
Statement of Changes in Net Assets
| | Year ended December 31, 2020 | Year ended December 31, 2019 |
| Increase (Decrease) in Net Assets | | |
| Operations | | |
| Net investment income (loss) | $483,689 | $667,581 |
| Net realized gain (loss) | 1,747,009 | 2,041,696 |
| Change in net unrealized appreciation (depreciation) | 8,433,190 | 6,094,654 |
| Net increase (decrease) in net assets resulting from operations | 10,663,888 | 8,803,931 |
| Distributions to shareholders | (2,599,691) | (1,709,491) |
| Share transactions - net increase (decrease) | 15,318,743 | 10,495,898 |
| Total increase (decrease) in net assets | 23,382,940 | 17,590,338 |
| Net Assets | | |
| Beginning of period | 45,110,170 | 27,519,832 |
| End of period | $68,493,110 | $45,110,170 |
See accompanying notes which are an integral part of the financial statements.
Financial Highlights
VIP Freedom 2050 Portfolio Initial Class
| Years ended December 31, | 2020 | 2019 | 2018 | 2017 | 2016 |
| Selected Per–Share Data | | | | | |
| Net asset value, beginning of period | $20.68 | $16.88 | $19.50 | $16.55 | $16.42 |
| Income from Investment Operations | | | | | |
| Net investment income (loss)A | .22 | .37 | .26 | .23 | .25 |
| Net realized and unrealized gain (loss) | 3.63 | 4.36 | (2.15) | 3.58 | .75 |
| Total from investment operations | 3.85 | 4.73 | (1.89) | 3.81 | 1.00 |
| Distributions from net investment income | (.20) | (.34) | (.21) | (.24) | (.25) |
| Distributions from net realized gain | (.88) | (.59) | (.52) | (.63) | (.62) |
| Total distributions | (1.08) | (.93) | (.73) | (.86)B | (.87) |
| Net asset value, end of period | $23.45 | $20.68 | $16.88 | $19.50 | $16.55 |
| Total ReturnC,D | 19.28% | 28.51% | (9.89)% | 23.52% | 6.84% |
| Ratios to Average Net AssetsE,F | | | | | |
| Expenses before reductionsG | -% | -% | -% | -% | -% |
| Expenses net of fee waivers, if any | - %G | - %G | - %G | -% | -% |
| Expenses net of all reductions | - %G | - %G | - %G | -% | -% |
| Net investment income (loss) | 1.08% | 1.96% | 1.35% | 1.27% | 1.59% |
| Supplemental Data | | | | | |
| Net assets, end of period (000 omitted) | $13,644 | $10,317 | $7,056 | $5,826 | $4,171 |
| Portfolio turnover rateH | 43% | 30% | 111% | 46% | 26% |
A Calculated based on average shares outstanding during the period.
B Total distributions per share do not sum due to rounding.
C Total returns do not reflect charges attributable to your insurance company's separate account. Inclusion of these charges would reduce the total returns shown.
D Total returns would have been lower if certain expenses had not been reduced during the applicable periods shown.
E Fees and expenses of any underlying mutual funds or exchange-traded funds (ETFs) are not included in the Fund's expense ratio. The Fund indirectly bears its proportionate share of these expenses. For additional expense information related to investments in Fidelity Central Funds, please refer to the "Investments in Fidelity Central Funds" note found in the Notes to Financial Statements section of the most recent Annual or Semi-Annual report.
F Expense ratios reflect operating expenses of the class. Expenses before reductions do not reflect amounts reimbursed, waived, or reduced through arrangements with the investment adviser, brokerage services, or other offset arrangements, if applicable, and do not represent the amount paid by the class during periods when reimbursements, waivers or reductions occur.
G Amount represents less than .005%.
H Amount does not include the portfolio activity of any underlying mutual funds or exchange-traded funds (ETFs).
See accompanying notes which are an integral part of the financial statements.
VIP Freedom 2050 Portfolio Service Class
| Years ended December 31, | 2020 | 2019 | 2018 | 2017 | 2016 |
| Selected Per–Share Data | | | | | |
| Net asset value, beginning of period | $20.63 | $16.84 | $19.47 | $16.52 | $16.39 |
| Income from Investment Operations | | | | | |
| Net investment income (loss)A | .20 | .35 | .24 | .21 | .24 |
| Net realized and unrealized gain (loss) | 3.62 | 4.35 | (2.15) | 3.59 | .74 |
| Total from investment operations | 3.82 | 4.70 | (1.91) | 3.80 | .98 |
| Distributions from net investment income | (.18) | (.32) | (.20) | (.22) | (.23) |
| Distributions from net realized gain | (.88) | (.59) | (.52) | (.63) | (.62) |
| Total distributions | (1.06) | (.91) | (.72) | (.85) | (.85) |
| Net asset value, end of period | $23.39 | $20.63 | $16.84 | $19.47 | $16.52 |
| Total ReturnB,C | 19.17% | 28.39% | (10.03)% | 23.46% | 6.75% |
| Ratios to Average Net AssetsD,E | | | | | |
| Expenses before reductions | .10% | .10% | .10% | .10% | .10% |
| Expenses net of fee waivers, if any | .10% | .10% | .10% | .10% | .10% |
| Expenses net of all reductions | .10% | .10% | .10% | .10% | .10% |
| Net investment income (loss) | .98% | 1.86% | 1.25% | 1.17% | 1.49% |
| Supplemental Data | | | | | |
| Net assets, end of period (000 omitted) | $21,593 | $14,242 | $10,203 | $6,748 | $4,205 |
| Portfolio turnover rateF | 43% | 30% | 111% | 46% | 26% |
A Calculated based on average shares outstanding during the period.
B Total returns do not reflect charges attributable to your insurance company's separate account. Inclusion of these charges would reduce the total returns shown.
C Total returns would have been lower if certain expenses had not been reduced during the applicable periods shown.
D Fees and expenses of any underlying mutual funds or exchange-traded funds (ETFs) are not included in the Fund's expense ratio. The Fund indirectly bears its proportionate share of these expenses. For additional expense information related to investments in Fidelity Central Funds, please refer to the "Investments in Fidelity Central Funds" note found in the Notes to Financial Statements section of the most recent Annual or Semi-Annual report.
E Expense ratios reflect operating expenses of the class. Expenses before reductions do not reflect amounts reimbursed, waived, or reduced through arrangements with the investment adviser, brokerage services, or other offset arrangements, if applicable, and do not represent the amount paid by the class during periods when reimbursements, waivers or reductions occur.
F Amount does not include the portfolio activity of any underlying mutual funds or exchange-traded funds (ETFs).
See accompanying notes which are an integral part of the financial statements.
VIP Freedom 2050 Portfolio Service Class 2
| Years ended December 31, | 2020 | 2019 | 2018 | 2017 | 2016 |
| Selected Per–Share Data | | | | | |
| Net asset value, beginning of period | $20.57 | $16.80 | $19.42 | $16.47 | $16.35 |
| Income from Investment Operations | | | | | |
| Net investment income (loss)A | .17 | .32 | .21 | .18 | .21 |
| Net realized and unrealized gain (loss) | 3.60 | 4.34 | (2.13) | 3.58 | .74 |
| Total from investment operations | 3.77 | 4.66 | (1.92) | 3.76 | .95 |
| Distributions from net investment income | (.15) | (.30) | (.18) | (.18) | (.21) |
| Distributions from net realized gain | (.88) | (.59) | (.52) | (.63) | (.62) |
| Total distributions | (1.03) | (.89) | (.70) | (.81) | (.83) |
| Net asset value, end of period | $23.31 | $20.57 | $16.80 | $19.42 | $16.47 |
| Total ReturnB,C | 18.99% | 28.22% | (10.13)% | 23.30% | 6.56% |
| Ratios to Average Net AssetsD,E | | | | | |
| Expenses before reductions | .25% | .25% | .25% | .25% | .25% |
| Expenses net of fee waivers, if any | .25% | .25% | .25% | .25% | .25% |
| Expenses net of all reductions | .25% | .25% | .25% | .25% | .25% |
| Net investment income (loss) | .83% | 1.71% | 1.10% | 1.02% | 1.34% |
| Supplemental Data | | | | | |
| Net assets, end of period (000 omitted) | $33,256 | $20,551 | $10,262 | $8,285 | $9,472 |
| Portfolio turnover rateF | 43% | 30% | 111% | 46% | 26% |
A Calculated based on average shares outstanding during the period.
B Total returns do not reflect charges attributable to your insurance company's separate account. Inclusion of these charges would reduce the total returns shown.
C Total returns would have been lower if certain expenses had not been reduced during the applicable periods shown.
D Fees and expenses of any underlying mutual funds or exchange-traded funds (ETFs) are not included in the Fund's expense ratio. The Fund indirectly bears its proportionate share of these expenses. For additional expense information related to investments in Fidelity Central Funds, please refer to the "Investments in Fidelity Central Funds" note found in the Notes to Financial Statements section of the most recent Annual or Semi-Annual report.
E Expense ratios reflect operating expenses of the class. Expenses before reductions do not reflect amounts reimbursed, waived, or reduced through arrangements with the investment adviser, brokerage services, or other offset arrangements, if applicable, and do not represent the amount paid by the class during periods when reimbursements, waivers or reductions occur.
F Amount does not include the portfolio activity of any underlying mutual funds or exchange-traded funds (ETFs).
See accompanying notes which are an integral part of the financial statements.
VIP Freedom 2055 Portfolio℠
Investment Summary (Unaudited)
The information in the following tables is based on the direct investments of the Fund.
Top Holdings as of December 31, 2020
| | % of fund's net assets |
| VIP Overseas Portfolio Initial Class | 24.8 |
| VIP Emerging Markets Portfolio Initial Class | 16.6 |
| VIP Growth & Income Portfolio Initial Class | 10.4 |
| VIP Equity-Income Portfolio Initial Class | 9.2 |
| VIP Growth Portfolio Initial Class | 8.9 |
| VIP Contrafund Portfolio Initial Class | 8.7 |
| VIP Value Portfolio Initial Class | 6.7 |
| VIP Value Strategies Portfolio Initial Class | 3.3 |
| VIP Mid Cap Portfolio Initial Class | 2.5 |
| VIP Investment Grade Bond Portfolio Initial Class | 2.4 |
| | 93.5 |
Asset Allocation (% of fund's net assets)
| Period end |
| | Domestic Equity Funds | 49.7% |
| | International Equity Funds | 41.4% |
| | Bond Funds | 8.7% |
| | Short-Term Funds | 0.2% |

VIP Freedom 2055 Portfolio℠
Schedule of Investments December 31, 2020
Showing Percentage of Net Assets
| Domestic Equity Funds - 49.7% | | | |
| | | Shares | Value |
| VIP Contrafund Portfolio Initial Class (a) | | 4,360 | $210,005 |
| VIP Equity-Income Portfolio Initial Class (a) | | 9,272 | 221,608 |
| VIP Growth & Income Portfolio Initial Class (a) | | 11,289 | 252,425 |
| VIP Growth Portfolio Initial Class (a) | | 2,078 | 214,009 |
| VIP Mid Cap Portfolio Initial Class (a) | | 1,581 | 61,211 |
| VIP Value Portfolio Initial Class (a) | | 10,163 | 162,102 |
| VIP Value Strategies Portfolio Initial Class (a) | | 5,853 | 79,305 |
| TOTAL DOMESTIC EQUITY FUNDS | | | |
| (Cost $986,536) | | | 1,200,665 |
|
| International Equity Funds - 41.4% | | | |
| VIP Emerging Markets Portfolio Initial Class (a) | | 27,135 | 400,235 |
| VIP Overseas Portfolio Initial Class (a) | | 22,634 | 600,262 |
| TOTAL INTERNATIONAL EQUITY FUNDS | | | |
| (Cost $810,052) | | | 1,000,497 |
|
| Bond Funds - 8.7% | | | |
| Fidelity Inflation-Protected Bond Index Fund (a) | | 4,387 | 48,435 |
| Fidelity Long-Term Treasury Bond Index Fund (a) | | 3,493 | 55,713 |
| VIP High Income Portfolio Initial Class (a) | | 9,104 | 48,342 |
| VIP Investment Grade Bond Portfolio Initial Class (a) | | 4,206 | 59,263 |
| TOTAL BOND FUNDS | | | |
| (Cost $202,394) | | | 211,753 |
|
| Short-Term Funds - 0.2% | | | |
| VIP Government Money Market Portfolio Initial Class 0.01% (a)(b) | | | |
| (Cost $4,835) | | 4,835 | 4,835 |
| TOTAL INVESTMENT IN SECURITIES - 100.0% | | | |
| (Cost $2,003,817) | | | 2,417,750 |
| NET OTHER ASSETS (LIABILITIES) - 0.0% | | | (267) |
| NET ASSETS - 100% | | | $2,417,483 |
Legend
(a) Affiliated Fund
(b) The rate quoted is the annualized seven-day yield of the fund at period end.
Affiliated Underlying Funds
Fiscal year to date information regarding the Fund's investments in affiliated Underlying Funds, excluding any Money Market Central Funds, is presented below. Exchanges between classes of the same affiliated Underlying Funds may occur. Certain Underlying Funds incurred name changes since their most recent shareholder report. The names of the Underlying Funds are those in effect at period end.
| Affiliate | Value, beginning of period | Purchases | Sales Proceeds | Dividend Income | Realized Gain (loss) | Change in Unrealized appreciation (depreciation) | Value, end of period |
| Fidelity Inflation-Protected Bond Index Fund | $27,161 | $42,535 | $24,109 | $532 | $7 | $2,841 | $48,435 |
| Fidelity Long-Term Treasury Bond Index Fund | 34,259 | 55,483 | 37,815 | 1,754 | 1,443 | 2,343 | 55,713 |
| VIP Contrafund Portfolio Initial Class | 115,869 | 148,438 | 94,919 | 1,047 | 1,279 | 39,338 | 210,005 |
| VIP Emerging Markets Portfolio Initial Class | 188,567 | 280,713 | 144,294 | 27,103 | 3,575 | 71,674 | 400,235 |
| VIP Equity-Income Portfolio Initial Class | 122,369 | 164,611 | 77,764 | 8,548 | (2,105) | 14,497 | 221,608 |
| VIP Government Money Market Portfolio Initial Class 0.01% | 13,605 | 58,259 | 67,029 | 73 | -- | -- | 4,835 |
| VIP Growth & Income Portfolio Initial Class | 139,521 | 191,617 | 94,670 | 11,020 | (2,159) | 18,116 | 252,425 |
| VIP Growth Portfolio Initial Class | 118,429 | 148,493 | 98,254 | 13,216 | 2,302 | 43,039 | 214,009 |
| VIP High Income Portfolio Initial Class | 27,229 | 40,133 | 18,727 | 1,977 | (388) | 95 | 48,342 |
| VIP Investment Grade Bond Portfolio Initial Class | 33,246 | 74,918 | 51,165 | 1,069 | (23) | 2,287 | 59,263 |
| VIP Mid Cap Portfolio Initial Class | 33,982 | 41,236 | 25,411 | 281 | 92 | 11,312 | 61,211 |
| VIP Overseas Portfolio Initial Class | 367,236 | 413,584 | 259,975 | 3,832 | 1,208 | 78,209 | 600,262 |
| VIP Value Portfolio Initial Class | 89,896 | 128,732 | 72,748 | 5,186 | (1,852) | 18,074 | 162,102 |
| VIP Value Strategies Portfolio Initial Class | 44,049 | 63,901 | 37,826 | 3,010 | (890) | 10,071 | 79,305 |
| | 1,355,418 | 1,852,653 | 1,104,706 | 78,648 | 2,489 | 311,896 | 2,417,750 |
Amounts in the income column in the above table include any capital gain distributions from underlying funds, which are presented in the corresponding line-item in the Statement of Operations, if applicable.
Investment Valuation
The following is a summary of the inputs used, as of December 31, 2020, involving the Fund's assets and liabilities carried at fair value. The inputs or methodology used for valuing securities may not be an indication of the risk associated with investing in those securities. For more information on valuation inputs, and their aggregation into the levels used below, please refer to the Investment Valuation section in the accompanying Notes to Financial Statements.
| | Valuation Inputs at Reporting Date: |
| Description | Total | Level 1 | Level 2 | Level 3 |
| Investments in Securities: | | | | |
| Domestic Equity Funds | $1,200,665 | $1,200,665 | $-- | $-- |
| International Equity Funds | 1,000,497 | 1,000,497 | -- | -- |
| Bond Funds | 211,753 | 211,753 | -- | -- |
| Short-Term Funds | 4,835 | 4,835 | -- | -- |
| Total Investments in Securities: | $2,417,750 | $2,417,750 | $-- | $-- |
See accompanying notes which are an integral part of the financial statements.
VIP Freedom 2055 Portfolio℠
Financial Statements
Statement of Assets and Liabilities
| | | December 31, 2020 |
| Assets | | |
Investment in securities, at value — See accompanying schedule:
| | |
| Affiliated issuers (cost $2,003,817) | $2,417,750 | |
| Total Investment in Securities (cost $2,003,817) | | $2,417,750 |
| Cash | | 16 |
| Receivable for investments sold | | 16,622 |
| Receivable for fund shares sold | | 12,674 |
| Total assets | | 2,447,062 |
| Liabilities | | |
| Payable for investments purchased | $29,199 | |
| Payable for fund shares redeemed | 95 | |
| Distribution and service plan fees payable | 285 | |
| Total liabilities | | 29,579 |
| Net Assets | | $2,417,483 |
| Net Assets consist of: | | |
| Paid in capital | | $1,999,179 |
| Total accumulated earnings (loss) | | 418,304 |
| Net Assets | | $2,417,483 |
| Net Asset Value and Maximum Offering Price | | |
| Initial Class: | | |
| Net Asset Value, offering price and redemption price per share ($423,014 ÷ 33,398 shares) | | $12.67 |
| Service Class: | | |
| Net Asset Value, offering price and redemption price per share ($814,151 ÷ 64,306 shares) | | $12.66 |
| Service Class 2: | | |
| Net Asset Value, offering price and redemption price per share ($1,180,318 ÷ 93,316 shares) | | $12.65 |
See accompanying notes which are an integral part of the financial statements.
Statement of Operations
| | | Year ended December 31, 2020 |
| Investment Income | | |
| Dividends: | | |
| Affiliated issuers | | $18,680 |
| Expenses | | |
| Distribution and service plan fees | $2,520 | |
| Independent trustees' fees and expenses | 5 | |
| Total expenses | | 2,525 |
| Net investment income (loss) | | 16,155 |
| Realized and Unrealized Gain (Loss) | | |
| Net realized gain (loss) on: | | |
| Investment securities: | | |
| Affiliated issuers | 2,489 | |
| Capital gain distributions from underlying funds: | | |
| Affiliated issuers | 59,968 | |
| Total net realized gain (loss) | | 62,457 |
| Change in net unrealized appreciation (depreciation) on: | | |
| Investment securities: | | |
| Affiliated issuers | 311,896 | |
| Total change in net unrealized appreciation (depreciation) | | 311,896 |
| Net gain (loss) | | 374,353 |
| Net increase (decrease) in net assets resulting from operations | | $390,508 |
See accompanying notes which are an integral part of the financial statements.
Statement of Changes in Net Assets
| | Year ended December 31, 2020 | For the period
April 11, 2019 (commencement of operations) to December 31, 2019 |
| Increase (Decrease) in Net Assets | | |
| Operations | | |
| Net investment income (loss) | $16,155 | $15,338 |
| Net realized gain (loss) | 62,457 | 7,811 |
| Change in net unrealized appreciation (depreciation) | 311,896 | 102,037 |
| Net increase (decrease) in net assets resulting from operations | 390,508 | 125,186 |
| Distributions to shareholders | (75,641) | (21,749) |
| Share transactions - net increase (decrease) | 747,309 | 1,251,870 |
| Total increase (decrease) in net assets | 1,062,176 | 1,355,307 |
| Net Assets | | |
| Beginning of period | 1,355,307 | – |
| End of period | $2,417,483 | $1,355,307 |
See accompanying notes which are an integral part of the financial statements.
Financial Highlights
VIP Freedom 2055 Portfolio Initial Class
| Years ended December 31, | 2020 | 2019 A |
| Selected Per–Share Data | | |
| Net asset value, beginning of period | $10.98 | $10.00 |
| Income from Investment Operations | | |
| Net investment income (loss)B | .12 | .16 |
| Net realized and unrealized gain (loss) | 1.99 | 1.02 |
| Total from investment operations | 2.11 | 1.18 |
| Distributions from net investment income | (.10) | (.15) |
| Distributions from net realized gain | (.32) | (.06) |
| Total distributions | (.42) | (.20)C |
| Net asset value, end of period | $12.67 | $10.98 |
| Total ReturnD,E | 19.28% | 11.85% |
| Ratios to Average Net AssetsF | | |
| Expenses before reductionsG | -% | - %H |
| Expenses net of fee waivers, if anyG | -% | - %H |
| Expenses net of all reductionsG | -% | - %H |
| Net investment income (loss) | 1.09% | 2.12%H |
| Supplemental Data | | |
| Net assets, end of period (000 omitted) | $423 | $366 |
| Portfolio turnover rateI | 64% | 24%H |
A For the period April 11, 2019 (commencement of operations) to December 31, 2019.
B Calculated based on average shares outstanding during the period.
C Total distributions per share do not sum due to rounding.
D Total returns for periods of less than one year are not annualized.
E Total returns do not reflect charges attributable to your insurance company's separate account. Inclusion of these charges would reduce the total returns shown.
F Expense ratios reflect operating expenses of the class. Expenses before reductions do not reflect amounts reimbursed, waived, or reduced through arrangements with the investment adviser, brokerage services, or other offset arrangements, if applicable, and do not represent the amount paid by the class during periods when reimbursements, waivers or reductions occur.
G Amount represents less than .005%.
H Annualized
I Amount does not include the portfolio activity of any underlying mutual funds or exchange-traded funds (ETFs).
See accompanying notes which are an integral part of the financial statements.
VIP Freedom 2055 Portfolio Service Class
| Years ended December 31, | 2020 | 2019 A |
| Selected Per–Share Data | | |
| Net asset value, beginning of period | $10.98 | $10.00 |
| Income from Investment Operations | | |
| Net investment income (loss)B | .11 | .15 |
| Net realized and unrealized gain (loss) | 1.99 | 1.03 |
| Total from investment operations | 2.10 | 1.18 |
| Distributions from net investment income | (.09) | (.14) |
| Distributions from net realized gain | (.32) | (.06) |
| Total distributions | (.42)C | (.20) |
| Net asset value, end of period | $12.66 | $10.98 |
| Total ReturnD,E | 19.11% | 11.78% |
| Ratios to Average Net AssetsF | | |
| Expenses before reductions | .10% | .10%G |
| Expenses net of fee waivers, if any | .10% | .10%G |
| Expenses net of all reductions | .10% | .10%G |
| Net investment income (loss) | .99% | 2.02%G |
| Supplemental Data | | |
| Net assets, end of period (000 omitted) | $814 | $399 |
| Portfolio turnover rateH | 64% | 24%G |
A For the period April 11, 2019 (commencement of operations) to December 31, 2019.
B Calculated based on average shares outstanding during the period.
C Total distributions per share do not sum due to rounding.
D Total returns for periods of less than one year are not annualized.
E Total returns do not reflect charges attributable to your insurance company's separate account. Inclusion of these charges would reduce the total returns shown.
F Expense ratios reflect operating expenses of the class. Expenses before reductions do not reflect amounts reimbursed, waived, or reduced through arrangements with the investment adviser, brokerage services, or other offset arrangements, if applicable, and do not represent the amount paid by the class during periods when reimbursements, waivers or reductions occur.
G Annualized
H Amount does not include the portfolio activity of any underlying mutual funds or exchange-traded funds (ETFs).
See accompanying notes which are an integral part of the financial statements.
VIP Freedom 2055 Portfolio Service Class 2
| Years ended December 31, | 2020 | 2019 A |
| Selected Per–Share Data | | |
| Net asset value, beginning of period | $10.97 | $10.00 |
| Income from Investment Operations | | |
| Net investment income (loss)B | .09 | .14 |
| Net realized and unrealized gain (loss) | 1.99 | 1.02 |
| Total from investment operations | 2.08 | 1.16 |
| Distributions from net investment income | (.08) | (.13) |
| Distributions from net realized gain | (.32) | (.06) |
| Total distributions | (.40) | (.19) |
| Net asset value, end of period | $12.65 | $10.97 |
| Total ReturnC,D | 19.01% | 11.60% |
| Ratios to Average Net AssetsE | | |
| Expenses before reductions | .25% | .25%F |
| Expenses net of fee waivers, if any | .25% | .25%F |
| Expenses net of all reductions | .25% | .25%F |
| Net investment income (loss) | .84% | 1.87%F |
| Supplemental Data | | |
| Net assets, end of period (000 omitted) | $1,180 | $590 |
| Portfolio turnover rateG | 64% | 24%F |
A For the period April 11, 2019 (commencement of operations) to December 31, 2019.
B Calculated based on average shares outstanding during the period.
C Total returns for periods of less than one year are not annualized.
D Total returns do not reflect charges attributable to your insurance company's separate account. Inclusion of these charges would reduce the total returns shown.
E Expense ratios reflect operating expenses of the class. Expenses before reductions do not reflect amounts reimbursed, waived, or reduced through arrangements with the investment adviser, brokerage services, or other offset arrangements, if applicable, and do not represent the amount paid by the class during periods when reimbursements, waivers or reductions occur.
F Annualized
G Amount does not include the portfolio activity of any underlying mutual funds or exchange-traded funds (ETFs).
See accompanying notes which are an integral part of the financial statements.
VIP Freedom 2060 Portfolio℠
Investment Summary (Unaudited)
The information in the following tables is based on the direct investments of the Fund.
Top Holdings as of December 31, 2020
| | % of fund's net assets |
| VIP Overseas Portfolio Initial Class | 24.8 |
| VIP Emerging Markets Portfolio Initial Class | 16.6 |
| VIP Growth & Income Portfolio Initial Class | 10.4 |
| VIP Equity-Income Portfolio Initial Class | 9.2 |
| VIP Growth Portfolio Initial Class | 8.9 |
| VIP Contrafund Portfolio Initial Class | 8.7 |
| VIP Value Portfolio Initial Class | 6.7 |
| VIP Value Strategies Portfolio Initial Class | 3.3 |
| VIP Mid Cap Portfolio Initial Class | 2.5 |
| VIP Investment Grade Bond Portfolio Initial Class | 2.4 |
| | 93.5 |
Asset Allocation (% of fund's net assets)
| Period end |
| | Domestic Equity Funds | 49.7% |
| | International Equity Funds | 41.4% |
| | Bond Funds | 8.7% |
| | Short-Term Funds | 0.2% |

VIP Freedom 2060 Portfolio℠
Schedule of Investments December 31, 2020
Showing Percentage of Net Assets
| Domestic Equity Funds - 49.7% | | | |
| | | Shares | Value |
| VIP Contrafund Portfolio Initial Class (a) | | 9,221 | $444,197 |
| VIP Equity-Income Portfolio Initial Class (a) | | 19,613 | 468,745 |
| VIP Growth & Income Portfolio Initial Class (a) | | 23,878 | 533,919 |
| VIP Growth Portfolio Initial Class (a) | | 4,395 | 452,658 |
| VIP Mid Cap Portfolio Initial Class (a) | | 3,344 | 129,472 |
| VIP Value Portfolio Initial Class (a) | | 21,497 | 342,874 |
| VIP Value Strategies Portfolio Initial Class (a) | | 12,380 | 167,744 |
| TOTAL DOMESTIC EQUITY FUNDS | | | |
| (Cost $2,110,761) | | | 2,539,609 |
|
| International Equity Funds - 41.4% | | | |
| VIP Emerging Markets Portfolio Initial Class (a) | | 57,392 | 846,529 |
| VIP Overseas Portfolio Initial Class (a) | | 47,874 | 1,269,625 |
| TOTAL INTERNATIONAL EQUITY FUNDS | | | |
| (Cost $1,748,760) | | | 2,116,154 |
|
| Bond Funds - 8.7% | | | |
| Fidelity Inflation-Protected Bond Index Fund (a) | | 9,279 | 102,445 |
| Fidelity Long-Term Treasury Bond Index Fund (a) | | 7,388 | 117,844 |
| VIP High Income Portfolio Initial Class (a) | | 19,256 | 102,247 |
| VIP Investment Grade Bond Portfolio Initial Class (a) | | 8,896 | 125,346 |
| TOTAL BOND FUNDS | | | |
| (Cost $432,818) | | | 447,882 |
|
| Short-Term Funds - 0.2% | | | |
| Fidelity Cash Central Fund 0.11% (b) | | 16 | 16 |
| VIP Government Money Market Portfolio Initial Class 0.01% (a)(c) | | 10,223 | 10,223 |
| TOTAL SHORT-TERM FUNDS | | | |
| (Cost $10,239) | | | 10,239 |
| TOTAL INVESTMENT IN SECURITIES - 100.0% | | | |
| (Cost $4,302,578) | | | 5,113,884 |
| NET OTHER ASSETS (LIABILITIES) - 0.0% | | | (511) |
| NET ASSETS - 100% | | | $5,113,373 |
Legend
(a) Affiliated Fund
(b) Affiliated fund that is generally available only to investment companies and other accounts managed by Fidelity Investments. The rate quoted is the annualized seven-day yield of the fund at period end. A complete unaudited listing of the fund's holdings as of its most recent quarter end is available upon request. In addition, each Fidelity Central Fund's financial statements, which are not covered by the Fund's Report of Independent Registered Public Accounting Firm, are available on the SEC's website or upon request.
(c) The rate quoted is the annualized seven-day yield of the fund at period end.
Affiliated Central Funds
Information regarding fiscal year to date income earned by the Fund from investments in Fidelity Central Funds is as follows:
| Fund | Income earned |
| Fidelity Cash Central Fund | $1 |
| Total | $1 |
Amounts in the income column in the above table include any capital gain distributions from underlying funds, which are presented in the corresponding line-item in the Statement of Operations, if applicable.
Affiliated Underlying Funds
Fiscal year to date information regarding the Fund's investments in affiliated Underlying Funds, excluding any Money Market Central Funds, is presented below. Exchanges between classes of the same affiliated Underlying Funds may occur. Certain Underlying Funds incurred name changes since their most recent shareholder report. The names of the Underlying Funds are those in effect at period end.
| Affiliate | Value, beginning of period | Purchases | Sales Proceeds | Dividend Income | Realized Gain (loss) | Change in Unrealized appreciation (depreciation) | Value, end of period |
| Fidelity Inflation-Protected Bond Index Fund | $25,795 | $123,065 | $52,122 | $1,141 | $90 | $5,617 | $102,445 |
| Fidelity Long-Term Treasury Bond Index Fund | 32,543 | 158,984 | 79,970 | 3,735 | 2,645 | 3,642 | 117,844 |
| VIP Contrafund Portfolio Initial Class | 110,037 | 450,734 | 195,692 | 2,320 | (969) | 80,087 | 444,197 |
| VIP Emerging Markets Portfolio Initial Class | 179,077 | 821,855 | 306,218 | 60,057 | (4,168) | 155,983 | 846,529 |
| VIP Equity-Income Portfolio Initial Class | 116,210 | 495,910 | 169,052 | 18,943 | (12,455) | 38,132 | 468,745 |
| VIP Government Money Market Portfolio Initial Class 0.01% | 12,921 | 141,005 | 143,703 | 141 | -- | -- | 10,223 |
| VIP Growth & Income Portfolio Initial Class | 132,498 | 577,659 | 209,057 | 24,423 | (12,664) | 45,483 | 533,919 |
| VIP Growth Portfolio Initial Class | 112,466 | 459,331 | 205,774 | 29,302 | (2,014) | 88,649 | 452,658 |
| VIP High Income Portfolio Initial Class | 25,858 | 118,026 | 40,562 | 4,374 | (805) | (270) | 102,247 |
| VIP Investment Grade Bond Portfolio Initial Class | 31,573 | 199,255 | 109,561 | 2,365 | (187) | 4,266 | 125,346 |
| VIP Mid Cap Portfolio Initial Class | 32,271 | 126,718 | 53,620 | 622 | (3,086) | 27,189 | 129,472 |
| VIP Overseas Portfolio Initial Class | 348,753 | 1,316,274 | 560,791 | 8,485 | (4,262) | 169,651 | 1,269,625 |
| VIP Value Portfolio Initial Class | 85,372 | 380,444 | 157,855 | 11,492 | (20,817) | 55,730 | 342,874 |
| VIP Value Strategies Portfolio Initial Class | 41,832 | 185,597 | 79,227 | 6,674 | (11,559) | 31,101 | 167,744 |
| | 1,287,206 | 5,554,857 | 2,363,204 | 174,074 | (70,251) | 705,260 | 5,113,868 |
Amounts in the income column in the above table include any capital gain distributions from underlying funds, which are presented in the corresponding line-item in the Statement of Operations, if applicable.
Investment Valuation
The following is a summary of the inputs used, as of December 31, 2020, involving the Fund's assets and liabilities carried at fair value. The inputs or methodology used for valuing securities may not be an indication of the risk associated with investing in those securities. For more information on valuation inputs, and their aggregation into the levels used below, please refer to the Investment Valuation section in the accompanying Notes to Financial Statements.
| | Valuation Inputs at Reporting Date: |
| Description | Total | Level 1 | Level 2 | Level 3 |
| Investments in Securities: | | | | |
| Domestic Equity Funds | $2,539,609 | $2,539,609 | $-- | $-- |
| International Equity Funds | 2,116,154 | 2,116,154 | -- | -- |
| Bond Funds | 447,882 | 447,882 | -- | -- |
| Short-Term Funds | 10,239 | 10,239 | -- | -- |
| Total Investments in Securities: | $5,113,884 | $5,113,884 | $-- | $-- |
See accompanying notes which are an integral part of the financial statements.
VIP Freedom 2060 Portfolio℠
Financial Statements
Statement of Assets and Liabilities
| | | December 31, 2020 |
| Assets | | |
Investment in securities, at value — See accompanying schedule:
| | |
| Fidelity Central Funds (cost $16) | $16 | |
| Other affiliated issuers (cost $4,302,562) | 5,113,868 | |
| Total Investment in Securities (cost $4,302,578) | | $5,113,884 |
| Cash | | 1 |
| Receivable for investments sold | | 43,641 |
| Receivable for fund shares sold | | 3,573 |
| Total assets | | 5,161,099 |
| Liabilities | | |
| Payable for investments purchased | $47,159 | |
| Payable for fund shares redeemed | 53 | |
| Distribution and service plan fees payable | 514 | |
| Total liabilities | | 47,726 |
| Net Assets | | $5,113,373 |
| Net Assets consist of: | | |
| Paid in capital | | $4,376,698 |
| Total accumulated earnings (loss) | | 736,675 |
| Net Assets | | $5,113,373 |
| Net Asset Value and Maximum Offering Price | | |
| Initial Class: | | |
| Net Asset Value, offering price and redemption price per share ($421,894 ÷ 33,347 shares) | | $12.65 |
| Service Class: | | |
| Net Asset Value, offering price and redemption price per share ($3,530,274 ÷ 279,174 shares) | | $12.65 |
| Service Class 2: | | |
| Net Asset Value, offering price and redemption price per share ($1,161,205 ÷ 91,917 shares) | | $12.63 |
See accompanying notes which are an integral part of the financial statements.
Statement of Operations
| | | Year ended December 31, 2020 |
| Investment Income | | |
| Dividends: | | |
| Affiliated issuers | | $41,115 |
| Income from Fidelity Central Funds | | 1 |
| Total income | | 41,116 |
| Expenses | | |
| Distribution and service plan fees | $4,193 | |
| Independent trustees' fees and expenses | 10 | |
| Total expenses | | 4,203 |
| Net investment income (loss) | | 36,913 |
| Realized and Unrealized Gain (Loss) | | |
| Net realized gain (loss) on: | | |
| Investment securities: | | |
| Affiliated issuers | (70,251) | |
| Capital gain distributions from underlying funds: | | |
| Affiliated issuers | 132,959 | |
| Total net realized gain (loss) | | 62,708 |
| Change in net unrealized appreciation (depreciation) on: | | |
| Investment securities: | | |
| Affiliated issuers | 705,260 | |
| Total change in net unrealized appreciation (depreciation) | | 705,260 |
| Net gain (loss) | | 767,968 |
| Net increase (decrease) in net assets resulting from operations | | $804,881 |
See accompanying notes which are an integral part of the financial statements.
Statement of Changes in Net Assets
| | Year ended December 31, 2020 | For the period
April 11, 2019 (commencement of operations) to December 31, 2019 |
| Increase (Decrease) in Net Assets | | |
| Operations | | |
| Net investment income (loss) | $36,913 | $16,110 |
| Net realized gain (loss) | 62,708 | 6,977 |
| Change in net unrealized appreciation (depreciation) | 705,260 | 106,046 |
| Net increase (decrease) in net assets resulting from operations | 804,881 | 129,133 |
| Distributions to shareholders | (175,724) | (21,614) |
| Share transactions - net increase (decrease) | 3,197,125 | 1,179,572 |
| Total increase (decrease) in net assets | 3,826,282 | 1,287,091 |
| Net Assets | | |
| Beginning of period | 1,287,091 | – |
| End of period | $5,113,373 | $1,287,091 |
See accompanying notes which are an integral part of the financial statements.
Financial Highlights
VIP Freedom 2060 Portfolio Initial Class
| Years ended December 31, | 2020 | 2019 A |
| Selected Per–Share Data | | |
| Net asset value, beginning of period | $10.99 | $10.00 |
| Income from Investment Operations | | |
| Net investment income (loss)B | .13 | .16 |
| Net realized and unrealized gain (loss) | 1.99 | 1.02 |
| Total from investment operations | 2.12 | 1.18 |
| Distributions from net investment income | (.11) | (.15) |
| Distributions from net realized gain | (.35) | (.05) |
| Total distributions | (.46) | (.19)C |
| Net asset value, end of period | $12.65 | $10.99 |
| Total ReturnD,E | 19.30% | 11.86% |
| Ratios to Average Net AssetsF,G | | |
| Expenses before reductionsH | -% | - %I |
| Expenses net of fee waivers, if anyH | -% | - %I |
| Expenses net of all reductionsH | -% | - %I |
| Net investment income (loss) | 1.18% | 2.18%I |
| Supplemental Data | | |
| Net assets, end of period (000 omitted) | $422 | $366 |
| Portfolio turnover rateJ | 68% | 23%I |
A For the period April 11, 2019 (commencement of operations) to December 31, 2019.
B Calculated based on average shares outstanding during the period.
C Total distributions per share do not sum due to rounding.
D Total returns for periods of less than one year are not annualized.
E Total returns do not reflect charges attributable to your insurance company's separate account. Inclusion of these charges would reduce the total returns shown.
F Fees and expenses of any underlying mutual funds or exchange-traded funds (ETFs) are not included in the Fund's expense ratio. The Fund indirectly bears its proportionate share of these expenses. For additional expense information related to investments in Fidelity Central Funds, please refer to the "Investments in Fidelity Central Funds" note found in the Notes to Financial Statements section of the most recent Annual or Semi-Annual report.
G Expense ratios reflect operating expenses of the class. Expenses before reductions do not reflect amounts reimbursed, waived, or reduced through arrangements with the investment adviser, brokerage services, or other offset arrangements, if applicable, and do not represent the amount paid by the class during periods when reimbursements, waivers or reductions occur.
H Amount represents less than .005%.
I Annualized
J Amount does not include the portfolio activity of any underlying mutual funds or exchange-traded funds (ETFs).
See accompanying notes which are an integral part of the financial statements.
VIP Freedom 2060 Portfolio Service Class
| Years ended December 31, | 2020 | 2019 A |
| Selected Per–Share Data | | |
| Net asset value, beginning of period | $10.99 | $10.00 |
| Income from Investment Operations | | |
| Net investment income (loss)B | .12 | .15 |
| Net realized and unrealized gain (loss) | 1.99 | 1.03 |
| Total from investment operations | 2.11 | 1.18 |
| Distributions from net investment income | (.10) | (.14) |
| Distributions from net realized gain | (.35) | (.05) |
| Total distributions | (.45) | (.19) |
| Net asset value, end of period | $12.65 | $10.99 |
| Total ReturnC,D | 19.22% | 11.80% |
| Ratios to Average Net AssetsE,F | | |
| Expenses before reductions | .10% | .10%G |
| Expenses net of fee waivers, if any | .10% | .10%G |
| Expenses net of all reductions | .10% | .10%G |
| Net investment income (loss) | 1.08% | 2.08%G |
| Supplemental Data | | |
| Net assets, end of period (000 omitted) | $3,530 | $445 |
| Portfolio turnover rateH | 68% | 23%G |
A For the period April 11, 2019 (commencement of operations) to December 31, 2019.
B Calculated based on average shares outstanding during the period.
C Total returns for periods of less than one year are not annualized.
D Total returns do not reflect charges attributable to your insurance company's separate account. Inclusion of these charges would reduce the total returns shown.
E Fees and expenses of any underlying mutual funds or exchange-traded funds (ETFs) are not included in the Fund's expense ratio. The Fund indirectly bears its proportionate share of these expenses. For additional expense information related to investments in Fidelity Central Funds, please refer to the "Investments in Fidelity Central Funds" note found in the Notes to Financial Statements section of the most recent Annual or Semi-Annual report.
F Expense ratios reflect operating expenses of the class. Expenses before reductions do not reflect amounts reimbursed, waived, or reduced through arrangements with the investment adviser, brokerage services, or other offset arrangements, if applicable, and do not represent the amount paid by the class during periods when reimbursements, waivers or reductions occur.
G Annualized
H Amount does not include the portfolio activity of any underlying mutual funds or exchange-traded funds (ETFs).
See accompanying notes which are an integral part of the financial statements.
VIP Freedom 2060 Portfolio Service Class 2
| Years ended December 31, | 2020 | 2019 A |
| Selected Per–Share Data | | |
| Net asset value, beginning of period | $10.98 | $10.00 |
| Income from Investment Operations | | |
| Net investment income (loss)B | .10 | .14 |
| Net realized and unrealized gain (loss) | 1.99 | 1.02 |
| Total from investment operations | 2.09 | 1.16 |
| Distributions from net investment income | (.09) | (.13) |
| Distributions from net realized gain | (.35) | (.05) |
| Total distributions | (.44) | (.18) |
| Net asset value, end of period | $12.63 | $10.98 |
| Total ReturnC,D | 19.04% | 11.61% |
| Ratios to Average Net AssetsE,F | | |
| Expenses before reductions | .25% | .25%G |
| Expenses net of fee waivers, if any | .25% | .25%G |
| Expenses net of all reductions | .25% | .25%G |
| Net investment income (loss) | .93% | 1.93%G |
| Supplemental Data | | |
| Net assets, end of period (000 omitted) | $1,161 | $475 |
| Portfolio turnover rateH | 68% | 23%G |
A For the period April 11, 2019 (commencement of operations) to December 31, 2019.
B Calculated based on average shares outstanding during the period.
C Total returns for periods of less than one year are not annualized.
D Total returns do not reflect charges attributable to your insurance company's separate account. Inclusion of these charges would reduce the total returns shown.
E Fees and expenses of any underlying mutual funds or exchange-traded funds (ETFs) are not included in the Fund's expense ratio. The Fund indirectly bears its proportionate share of these expenses. For additional expense information related to investments in Fidelity Central Funds, please refer to the "Investments in Fidelity Central Funds" note found in the Notes to Financial Statements section of the most recent Annual or Semi-Annual report.
F Expense ratios reflect operating expenses of the class. Expenses before reductions do not reflect amounts reimbursed, waived, or reduced through arrangements with the investment adviser, brokerage services, or other offset arrangements, if applicable, and do not represent the amount paid by the class during periods when reimbursements, waivers or reductions occur.
G Annualized
H Amount does not include the portfolio activity of any underlying mutual funds or exchange-traded funds (ETFs).
See accompanying notes which are an integral part of the financial statements.
VIP Freedom 2065 Portfolio℠
Investment Summary (Unaudited)
The information in the following tables is based on the direct investments of the Fund.
Top Holdings as of December 31, 2020
| | % of fund's net assets |
| VIP Overseas Portfolio Initial Class | 24.8 |
| VIP Emerging Markets Portfolio Initial Class | 16.6 |
| VIP Growth & Income Portfolio Initial Class | 10.4 |
| VIP Equity-Income Portfolio Initial Class | 9.2 |
| VIP Growth Portfolio Initial Class | 8.9 |
| VIP Contrafund Portfolio Initial Class | 8.7 |
| VIP Value Portfolio Initial Class | 6.7 |
| VIP Value Strategies Portfolio Initial Class | 3.3 |
| VIP Mid Cap Portfolio Initial Class | 2.5 |
| VIP Investment Grade Bond Portfolio Initial Class | 2.4 |
| | 93.5 |
Asset Allocation (% of fund's net assets)
| Period end |
| | Domestic Equity Funds | 49.7% |
| | International Equity Funds | 41.4% |
| | Bond Funds | 8.7% |
| | Short-Term Funds | 0.2% |

VIP Freedom 2065 Portfolio℠
Schedule of Investments December 31, 2020
Showing Percentage of Net Assets
| Domestic Equity Funds - 49.7% | | | |
| | | Shares | Value |
| VIP Contrafund Portfolio Initial Class (a) | | 2,327 | $112,096 |
| VIP Equity-Income Portfolio Initial Class (a) | | 4,949 | 118,290 |
| VIP Growth & Income Portfolio Initial Class (a) | | 6,026 | 134,735 |
| VIP Growth Portfolio Initial Class (a) | | 1,109 | 114,229 |
| VIP Mid Cap Portfolio Initial Class (a) | | 845 | 32,734 |
| VIP Value Portfolio Initial Class (a) | | 5,425 | 86,527 |
| VIP Value Strategies Portfolio Initial Class (a) | | 3,120 | 42,270 |
| TOTAL DOMESTIC EQUITY FUNDS | | | |
| (Cost $515,575) | | | 640,881 |
|
| International Equity Funds - 41.4% | | | |
| VIP Emerging Markets Portfolio Initial Class (a) | | 14,477 | 213,543 |
| VIP Overseas Portfolio Initial Class (a) | | 12,083 | 320,449 |
| TOTAL INTERNATIONAL EQUITY FUNDS | | | |
| (Cost $420,118) | | | 533,992 |
|
| Bond Funds - 8.7% | | | |
| Fidelity Inflation-Protected Bond Index Fund (a) | | 2,342 | 25,854 |
| Fidelity Long-Term Treasury Bond Index Fund (a) | | 1,865 | 29,742 |
| VIP High Income Portfolio Initial Class (a) | | 4,859 | 25,802 |
| VIP Investment Grade Bond Portfolio Initial Class (a) | | 2,245 | 31,633 |
| TOTAL BOND FUNDS | | | |
| (Cost $106,500) | | | 113,031 |
|
| Short-Term Funds - 0.2% | | | |
| VIP Government Money Market Portfolio Initial Class 0.01% (a)(b) | | | |
| (Cost $2,581) | | 2,581 | 2,581 |
| TOTAL INVESTMENT IN SECURITIES - 100.0% | | | |
| (Cost $1,044,774) | | | 1,290,485 |
| NET OTHER ASSETS (LIABILITIES) - 0.0% | | | (114) |
| NET ASSETS - 100% | | | $1,290,371 |
Legend
(a) Affiliated Fund
(b) The rate quoted is the annualized seven-day yield of the fund at period end.
Affiliated Underlying Funds
Fiscal year to date information regarding the Fund's investments in affiliated Underlying Funds, excluding any Money Market Central Funds, is presented below. Exchanges between classes of the same affiliated Underlying Funds may occur. Certain Underlying Funds incurred name changes since their most recent shareholder report. The names of the Underlying Funds are those in effect at period end.
| Affiliate | Value, beginning of period | Purchases | Sales Proceeds | Dividend Income | Realized Gain (loss) | Change in Unrealized appreciation (depreciation) | Value, end of period |
| Fidelity Inflation-Protected Bond Index Fund | $21,972 | $10,939 | $9,005 | $313 | $19 | $1,929 | $25,854 |
| Fidelity Long-Term Treasury Bond Index Fund | 27,720 | 16,525 | 17,836 | 1,098 | 1,963 | 1,370 | 29,742 |
| VIP Contrafund Portfolio Initial Class | 93,727 | 25,661 | 32,064 | 749 | 1,728 | 23,044 | 112,096 |
| VIP Emerging Markets Portfolio Initial Class | 152,539 | 59,530 | 35,714 | 19,221 | 2,398 | 34,790 | 213,543 |
| VIP Equity-Income Portfolio Initial Class | 98,985 | 35,100 | 19,386 | 6,109 | 27 | 3,564 | 118,290 |
| VIP Government Money Market Portfolio Initial Class 0.01% | 11,006 | 33,886 | 42,311 | 55 | -- | -- | 2,581 |
| VIP Growth & Income Portfolio Initial Class | 112,859 | 42,783 | 25,671 | 7,866 | 369 | 4,395 | 134,735 |
| VIP Growth Portfolio Initial Class | 95,796 | 26,933 | 34,685 | 9,730 | 1,074 | 25,111 | 114,229 |
| VIP High Income Portfolio Initial Class | 22,026 | 9,539 | 5,206 | 1,232 | (250) | (307) | 25,802 |
| VIP Investment Grade Bond Portfolio Initial Class | 26,893 | 28,124 | 24,904 | 671 | (75) | 1,595 | 31,633 |
| VIP Mid Cap Portfolio Initial Class | 27,488 | 6,926 | 7,699 | 179 | 119 | 5,900 | 32,734 |
| VIP Overseas Portfolio Initial Class | 297,059 | 62,347 | 80,854 | 2,597 | 283 | 41,614 | 320,449 |
| VIP Value Portfolio Initial Class | 72,718 | 31,993 | 24,021 | 3,738 | (24) | 5,861 | 86,527 |
| VIP Value Strategies Portfolio Initial Class | 35,632 | 16,031 | 12,916 | 2,206 | (486) | 4,009 | 42,270 |
| | 1,096,420 | 406,317 | 372,272 | 55,764 | 7,145 | 152,875 | 1,290,485 |
Amounts in the income column in the above table include any capital gain distributions from underlying funds, which are presented in the corresponding line-item in the Statement of Operations, if applicable.
Investment Valuation
The following is a summary of the inputs used, as of December 31, 2020, involving the Fund's assets and liabilities carried at fair value. The inputs or methodology used for valuing securities may not be an indication of the risk associated with investing in those securities. For more information on valuation inputs, and their aggregation into the levels used below, please refer to the Investment Valuation section in the accompanying Notes to Financial Statements.
| | Valuation Inputs at Reporting Date: |
| Description | Total | Level 1 | Level 2 | Level 3 |
| Investments in Securities: | | | | |
| Domestic Equity Funds | $640,881 | $640,881 | $-- | $-- |
| International Equity Funds | 533,992 | 533,992 | -- | -- |
| Bond Funds | 113,031 | 113,031 | -- | -- |
| Short-Term Funds | 2,581 | 2,581 | -- | -- |
| Total Investments in Securities: | $1,290,485 | $1,290,485 | $-- | $-- |
See accompanying notes which are an integral part of the financial statements.
VIP Freedom 2065 Portfolio℠
Financial Statements
Statement of Assets and Liabilities
| | | December 31, 2020 |
| Assets | | |
Investment in securities, at value — See accompanying schedule:
| | |
| Affiliated issuers (cost $1,044,774) | $1,290,485 | |
| Total Investment in Securities (cost $1,044,774) | | $1,290,485 |
| Cash | | 16 |
| Receivable for investments sold | | 11,663 |
| Total assets | | 1,302,164 |
| Liabilities | | |
| Payable for investments purchased | $11,616 | |
| Payable for fund shares redeemed | 45 | |
| Distribution and service plan fees payable | 132 | |
| Total liabilities | | 11,793 |
| Net Assets | | $1,290,371 |
| Net Assets consist of: | | |
| Paid in capital | | $1,040,593 |
| Total accumulated earnings (loss) | | 249,778 |
| Net Assets | | $1,290,371 |
| Net Asset Value and Maximum Offering Price | | |
| Initial Class: | | |
| Net Asset Value, offering price and redemption price per share ($415,607 ÷ 33,334 shares) | | $12.47 |
| Service Class: | | |
| Net Asset Value, offering price and redemption price per share ($415,502 ÷ 33,334 shares) | | $12.46 |
| Service Class 2: | | |
| Net Asset Value, offering price and redemption price per share ($459,262 ÷ 36,863 shares) | | $12.46 |
See accompanying notes which are an integral part of the financial statements.
Statement of Operations
| | | Year ended December 31, 2020 |
| Investment Income | | |
| Dividends: | | |
| Affiliated issuers | | $11,759 |
| Expenses | | |
| Distribution and service plan fees | $1,298 | |
| Independent trustees' fees and expenses | 4 | |
| Total expenses | | 1,302 |
| Net investment income (loss) | | 10,457 |
| Realized and Unrealized Gain (Loss) | | |
| Net realized gain (loss) on: | | |
| Investment securities: | | |
| Affiliated issuers | 7,145 | |
| Capital gain distributions from underlying funds: | | |
| Affiliated issuers | 44,005 | |
| Total net realized gain (loss) | | 51,150 |
| Change in net unrealized appreciation (depreciation) on: | | |
| Investment securities: | | |
| Affiliated issuers | 152,875 | |
| Total change in net unrealized appreciation (depreciation) | | 152,875 |
| Net gain (loss) | | 204,025 |
| Net increase (decrease) in net assets resulting from operations | | $214,482 |
See accompanying notes which are an integral part of the financial statements.
Statement of Changes in Net Assets
| | Year ended December 31, 2020 | For the period
April 11, 2019 (commencement of operations) to December 31, 2019 |
| Increase (Decrease) in Net Assets | | |
| Operations | | |
| Net investment income (loss) | $10,457 | $14,029 |
| Net realized gain (loss) | 51,150 | 10,333 |
| Change in net unrealized appreciation (depreciation) | 152,875 | 92,836 |
| Net increase (decrease) in net assets resulting from operations | 214,482 | 117,198 |
| Distributions to shareholders | (61,034) | (20,866) |
| Share transactions - net increase (decrease) | 40,591 | 1,000,000 |
| Total increase (decrease) in net assets | 194,039 | 1,096,332 |
| Net Assets | | |
| Beginning of period | 1,096,332 | – |
| End of period | $1,290,371 | $1,096,332 |
See accompanying notes which are an integral part of the financial statements.
Financial Highlights
VIP Freedom 2065 Portfolio Initial Class
| Years ended December 31, | 2020 | 2019 A |
| Selected Per–Share Data | | |
| Net asset value, beginning of period | $10.96 | $10.00 |
| Income from Investment Operations | | |
| Net investment income (loss)B | .12 | .15 |
| Net realized and unrealized gain (loss) | 1.99 | 1.03 |
| Total from investment operations | 2.11 | 1.18 |
| Distributions from net investment income | (.11) | (.15) |
| Distributions from net realized gain | (.49) | (.07) |
| Total distributions | (.60) | (.22) |
| Net asset value, end of period | $12.47 | $10.96 |
| Total ReturnC,D | 19.35% | 11.79% |
| Ratios to Average Net AssetsE | | |
| Expenses before reductionsF | -% | - %G |
| Expenses net of fee waivers, if anyF | -% | - %G |
| Expenses net of all reductionsF | -% | - %G |
| Net investment income (loss) | 1.07% | 2.01%G |
| Supplemental Data | | |
| Net assets, end of period (000 omitted) | $416 | $365 |
| Portfolio turnover rateH | 34% | 24%G |
A For the period April 11, 2019 (commencement of operations) to December 31, 2019.
B Calculated based on average shares outstanding during the period.
C Total returns for periods of less than one year are not annualized.
D Total returns do not reflect charges attributable to your insurance company's separate account. Inclusion of these charges would reduce the total returns shown.
E Expense ratios reflect operating expenses of the class. Expenses before reductions do not reflect amounts reimbursed, waived, or reduced through arrangements with the investment adviser, brokerage services, or other offset arrangements, if applicable, and do not represent the amount paid by the class during periods when reimbursements, waivers or reductions occur.
F Amount represents less than .005%.
G Annualized
H Amount does not include the portfolio activity of any underlying mutual funds or exchange-traded funds (ETFs).
See accompanying notes which are an integral part of the financial statements.
VIP Freedom 2065 Portfolio Service Class
| Years ended December 31, | 2020 | 2019 A |
| Selected Per–Share Data | | |
| Net asset value, beginning of period | $10.96 | $10.00 |
| Income from Investment Operations | | |
| Net investment income (loss)B | .11 | .14 |
| Net realized and unrealized gain (loss) | 1.98 | 1.03 |
| Total from investment operations | 2.09 | 1.17 |
| Distributions from net investment income | (.10) | (.14) |
| Distributions from net realized gain | (.49) | (.07) |
| Total distributions | (.59) | (.21) |
| Net asset value, end of period | $12.46 | $10.96 |
| Total ReturnC,D | 19.16% | 11.72% |
| Ratios to Average Net AssetsE | | |
| Expenses before reductions | .10% | .10%F |
| Expenses net of fee waivers, if any | .10% | .10%F |
| Expenses net of all reductions | .10% | .10%F |
| Net investment income (loss) | .97% | 1.91%F |
| Supplemental Data | | |
| Net assets, end of period (000 omitted) | $416 | $365 |
| Portfolio turnover rateG | 34% | 24%F |
A For the period April 11, 2019 (commencement of operations) to December 31, 2019.
B Calculated based on average shares outstanding during the period.
C Total returns for periods of less than one year are not annualized.
D Total returns do not reflect charges attributable to your insurance company's separate account. Inclusion of these charges would reduce the total returns shown.
E Expense ratios reflect operating expenses of the class. Expenses before reductions do not reflect amounts reimbursed, waived, or reduced through arrangements with the investment adviser, brokerage services, or other offset arrangements, if applicable, and do not represent the amount paid by the class during periods when reimbursements, waivers or reductions occur.
F Annualized
G Amount does not include the portfolio activity of any underlying mutual funds or exchange-traded funds (ETFs).
See accompanying notes which are an integral part of the financial statements.
VIP Freedom 2065 Portfolio Service Class 2
| Years ended December 31, | 2020 | 2019 A |
| Selected Per–Share Data | | |
| Net asset value, beginning of period | $10.96 | $10.00 |
| Income from Investment Operations | | |
| Net investment income (loss)B | .09 | .13 |
| Net realized and unrealized gain (loss) | 1.99 | 1.03 |
| Total from investment operations | 2.08 | 1.16 |
| Distributions from net investment income | (.09) | (.13) |
| Distributions from net realized gain | (.49) | (.07) |
| Total distributions | (.58) | (.20) |
| Net asset value, end of period | $12.46 | $10.96 |
| Total ReturnC,D | 19.03% | 11.61% |
| Ratios to Average Net AssetsE | | |
| Expenses before reductions | .25% | .25%F |
| Expenses net of fee waivers, if any | .25% | .25%F |
| Expenses net of all reductions | .25% | .25%F |
| Net investment income (loss) | .82% | 1.76%F |
| Supplemental Data | | |
| Net assets, end of period (000 omitted) | $459 | $365 |
| Portfolio turnover rateG | 34% | 24%F |
A For the period April 11, 2019 (commencement of operations) to December 31, 2019.
B Calculated based on average shares outstanding during the period.
C Total returns for periods of less than one year are not annualized.
D Total returns do not reflect charges attributable to your insurance company's separate account. Inclusion of these charges would reduce the total returns shown.
E Expense ratios reflect operating expenses of the class. Expenses before reductions do not reflect amounts reimbursed, waived, or reduced through arrangements with the investment adviser, brokerage services, or other offset arrangements, if applicable, and do not represent the amount paid by the class during periods when reimbursements, waivers or reductions occur.
F Annualized
G Amount does not include the portfolio activity of any underlying mutual funds or exchange-traded funds (ETFs).
See accompanying notes which are an integral part of the financial statements.
Notes to Financial Statements
For the period ended December 31, 2020
1. Organization.
VIP Freedom Income Portfolio, VIP Freedom 2005 Portfolio, VIP Freedom 2010 Portfolio, VIP Freedom 2015 Portfolio, VIP Freedom 2020 Portfolio, VIP Freedom 2025 Portfolio, VIP Freedom 2030 Portfolio, VIP Freedom 2035 Portfolio, VIP Freedom 2040 Portfolio, VIP Freedom 2045 Portfolio, VIP Freedom 2050 Portfolio, VIP Freedom 2055 Portfolio, VIP Freedom 2060 Portfolio and VIP Freedom 2065 Portfolio (the Funds) are funds of Variable Insurance Products Fund V (the Trust). The Trust is registered under the Investment Company Act of 1940, as amended (the 1940 Act), as an open-end management investment company organized as a Massachusetts business trust. Each Fund is authorized to issue an unlimited number of shares. Shares of each Fund may only be purchased by insurance companies for the purpose of funding variable annuity or variable life insurance contracts. Each Fund offers three classes of shares: Initial Class shares, Service Class shares and Service Class 2 shares. All classes have equal rights and voting privileges, except for matters affecting a single class.
Effective January 1, 2020:
Investment advisers Fidelity Investments Money Management, Inc., FMR Co., Inc., and Fidelity SelectCo, LLC, merged with and into Fidelity Management & Research Company. In connection with the merger transactions, the resulting, merged investment adviser was then redomiciled from Massachusetts to Delaware, changed its corporate structure from a corporation to a limited liability company, and changed its name to "Fidelity Management & Research Company LLC".
Broker-dealer Fidelity Distributors Corporation merged with and into Fidelity Investments Institutional Services Company, Inc. ("FIISC"). FIISC was then redomiciled from Massachusetts to Delaware, changed its corporate structure from a corporation to a limited liability company, and changed its name to "Fidelity Distributors Company LLC".
2. Investments in Fidelity Central Funds.
The Funds may invest in Fidelity Central Funds, which are open-end investment companies generally available only to other investment companies and accounts managed by the investment adviser and its affiliates. The Funds' Schedules of Investments list each of the Fidelity Central Funds held as of period end, if any, as an investment of each Fund, but do not include the underlying holdings of each Fidelity Central Fund. As an Investing Fund, each Fund indirectly bears its proportionate share of the expenses of the underlying Fidelity Central Funds.
The Money Market Central Funds seek preservation of capital and current income and are managed by the investment adviser. Annualized expenses of the Money Market Central Funds as of their most recent shareholder report date ranged from less than .005% to .01%.
A complete unaudited list of holdings for each Fidelity Central Fund is available upon request or at the Securities and Exchange Commission (the SEC) website at www.sec.gov. In addition, the financial statements of the Fidelity Central Funds, which are not covered by the Funds' Report of Independent Registered Public Accounting Firm, are available on the SEC website or upon request.
3. Significant Accounting Policies.
Each Fund is an investment company and applies the accounting and reporting guidance of the Financial Accounting Standards Board (FASB) Accounting Standards Codification Topic 946 Financial Services - Investment Companies. The financial statements have been prepared in conformity with accounting principles generally accepted in the United States of America (GAAP), which require management to make certain estimates and assumptions at the date of the financial statements. Actual results could differ from those estimates. Subsequent events, if any, through the date that the financial statements were issued have been evaluated in the preparation of the financial statements. The following summarizes the significant accounting policies of the Funds:
Investment Valuation. Investments are valued as of 4:00 p.m. Eastern time on the last calendar day of the period. Each Fund categorizes the inputs to valuation techniques used to value its investments into a disclosure hierarchy consisting of three levels as shown below:
- Level 1 – quoted prices in active markets for identical investments
- Level 2 – other significant observable inputs (including quoted prices for similar investments, interest rates, prepayment speeds, etc.)
- Level 3 – unobservable inputs (including the Fund's own assumptions based on the best information available)
Valuation techniques used to value each Fund's investments by major category are as follows. Investments in open-end mutual funds are valued at their closing net asset value (NAV) each business day and are categorized as Level 1 in the hierarchy. The aggregate value of investments by input level as of December 31, 2020 is included at the end of the Fund's Schedule of Investments.
Investment Transactions and Income. For financial reporting purposes, the Funds' investment holdings and NAV include trades executed through the end of the last business day of the period. The NAV per share for processing shareholder transactions is calculated as of the close of business of the New York Stock Exchange (NYSE), normally 4:00 p.m. Eastern time and includes trades executed through the end of the prior business day. Gains and losses on securities sold are determined on the basis of identified cost. Income and capital gain distributions from any underlying mutual funds or exchange-traded funds (ETFs) are recorded on the ex-dividend date.
Class Allocations and Expenses. Investment income, realized and unrealized capital gains and losses, common expenses of each Fund, and certain fund-level expense reductions, if any, are allocated daily on a pro-rata basis to each class based on the relative net assets of each class to the total net assets of each Fund. Each class differs with respect to distribution and service plan fees incurred. Certain expense reductions may also differ by class. For the reporting period, the allocated portion of income and expenses to each class as a percent of its average net assets may vary due to the timing of recording these transactions in relation to fluctuating net assets of the classes. Expenses directly attributable to a fund are charged to that fund. Expenses attributable to more than one fund are allocated among the respective funds on the basis of relative net assets or other appropriate methods. Expenses included in the accompanying financial statements reflect the expenses of each Fund and do not include any expenses associated with any underlying mutual funds or exchange-traded funds (ETFs). Although not included in each Fund's expenses, each Fund indirectly bears its proportionate share of any underlying mutual funds or exchange-traded funds (ETFs) expenses through the impact of these expenses on each underlying mutual fund's or exchange-traded fund's (ETFs) NAV. Expense estimates are accrued in the period to which they relate and adjustments are made when actual amounts are known.
Income Tax Information and Distributions to Shareholders. Each year, each Fund intends to qualify as a regulated investment company under Subchapter M of the Internal Revenue Code, including distributing substantially all of its taxable income and realized gains. As a result, no provision for U.S. Federal income taxes is required. As of December 31, 2020, each Fund did not have any unrecognized tax benefits in the financial statements; nor is each Fund aware of any tax positions for which it is reasonably possible that the total amounts of unrecognized tax benefits will significantly change in the next twelve months. Each Fund files a U.S. federal tax return, in addition to state and local tax returns as required. Each Fund's federal income tax returns are subject to examination by the Internal Revenue Service (IRS) for a period of three fiscal years after they are filed. State and local tax returns may be subject to examination for an additional fiscal year depending on the jurisdiction.
Distributions are declared and recorded on the ex-dividend date. Income and capital gain distributions are declared separately for each class. Income and capital gain distributions are determined in accordance with income tax regulations, which may differ from GAAP.
Capital accounts within the financial statements are adjusted for permanent book-tax differences. These adjustments have no impact on net assets or the results of operations. Capital accounts are not adjusted for temporary book-tax differences which will reverse in a subsequent period.
Book-tax differences are primarily due to the short-term gain distributions from the underlying mutual funds or exchange-traded funds (ETFs) and losses deferred due to wash sales.
As of period end, the cost and unrealized appreciation (depreciation) in securities, and derivatives if applicable, for federal income tax purposes were as follows for each Fund:
| | Tax cost | Gross unrealized appreciation | Gross unrealized depreciation | Net unrealized appreciation (depreciation) |
| VIP Freedom Income Portfolio | $68,957,303 | $8,332,678 | $(98,849) | $8,233,829 |
| VIP Freedom 2005 Portfolio | 13,954,447 | 2,107,202 | (20,150) | 2,087,052 |
| VIP Freedom 2010 Portfolio | 296,809,142 | 67,114,894 | (404,912) | 66,709,982 |
| VIP Freedom 2015 Portfolio | 74,100,779 | 25,053,553 | (85,779) | 24,967,774 |
| VIP Freedom 2020 Portfolio | 571,606,739 | 210,278,227 | (392,787) | 209,885,440 |
| VIP Freedom 2025 Portfolio | 249,282,747 | 66,689,478 | (299,113) | 66,390,365 |
| VIP Freedom 2030 Portfolio | 403,404,056 | 130,203,963 | (680,099) | 129,523,864 |
| VIP Freedom 2035 Portfolio | 127,561,550 | 29,406,322 | (372,686) | 29,033,636 |
| VIP Freedom 2040 Portfolio | 117,059,148 | 33,769,714 | (274,187) | 33,495,527 |
| VIP Freedom 2045 Portfolio | 65,880,353 | 16,041,769 | (178,762) | 15,863,007 |
| VIP Freedom 2050 Portfolio | 55,196,178 | 13,555,908 | (250,652) | 13,305,256 |
| VIP Freedom 2055 Portfolio | 2,008,434 | 411,298 | (1,982) | 409,316 |
| VIP Freedom 2060 Portfolio | 4,380,788 | 737,867 | (4,771) | 733,096 |
| VIP Freedom 2065 Portfolio | 1,047,543 | 243,612 | (670) | 242,942 |
The tax-based components of distributable earnings as of period end were as follows for each Fund:
| | Undistributed ordinary income | Undistributed long-term capital gain | Net unrealized appreciation (depreciation) on securities and other investments |
| VIP Freedom Income Portfolio | $137,144 | $873,311 | $8,233,829 |
| VIP Freedom 2005 Portfolio | 32,320 | 246,111 | 2,087,052 |
| VIP Freedom 2010 Portfolio | 698,589 | 8,883,609 | 66,709,982 |
| VIP Freedom 2015 Portfolio | 166,767 | 2,919,188 | 24,967,774 |
| VIP Freedom 2020 Portfolio | 1,291,595 | 31,582,243 | 209,885,440 |
| VIP Freedom 2025 Portfolio | 338,398 | 7,009,470 | 66,390,365 |
| VIP Freedom 2030 Portfolio | 314,450 | 15,664,198 | 129,523,864 |
| VIP Freedom 2035 Portfolio | 60,662 | 3,883,076 | 29,033,636 |
| VIP Freedom 2040 Portfolio | 15,880 | 4,281,357 | 33,495,527 |
| VIP Freedom 2045 Portfolio | 14,625 | 2,009,516 | 15,863,007 |
| VIP Freedom 2050 Portfolio | 2,266 | 1,650,112 | 13,305,256 |
| VIP Freedom 2055 Portfolio | 5,226 | 3,763 | 409,316 |
| VIP Freedom 2060 Portfolio | 1,105 | 2,474 | 733,096 |
| VIP Freedom 2065 Portfolio | 1,777 | 5,059 | 242,942 |
Due to large subscriptions in the period, VIP Freedom 2060 Portfolio is subject to an annual limit on its use of some of its unrealized capital losses to offset capital gains in future periods. If those capital losses are realized and the limitation prevents the Fund from using any of those capital losses in a future period, those capital losses will be available to offset capital gains in subsequent periods.
The tax character of distributions paid was as follows:
| December 31, 2020 | | | |
| | Ordinary Income | Long-term Capital Gains | Total |
| VIP Freedom Income Portfolio | $1,148,041 | $828,360 | $1,976,401 |
| VIP Freedom 2005 Portfolio | 276,488 | 300,526 | 577,014 |
| VIP Freedom 2010 Portfolio | 5,642,325 | 12,327,910 | 17,970,235 |
| VIP Freedom 2015 Portfolio | 1,784,373 | 3,862,034 | 5,646,407 |
| VIP Freedom 2020 Portfolio | 11,512,339 | 39,623,551 | 51,135,890 |
| VIP Freedom 2025 Portfolio | 4,908,286 | 9,224,783 | 14,133,069 |
| VIP Freedom 2030 Portfolio | 7,496,261 | 19,055,542 | 26,551,803 |
| VIP Freedom 2035 Portfolio | 2,120,394 | 4,364,860 | 6,485,254 |
| VIP Freedom 2040 Portfolio | 2,002,014 | 5,007,488 | 7,009,502 |
| VIP Freedom 2045 Portfolio | 1,078,074 | 2,225,317 | 3,303,391 |
| VIP Freedom 2050 Portfolio | 904,626 | 1,695,065 | 2,599,691 |
| VIP Freedom 2055 Portfolio | 30,784 | 44,857 | 75,641 |
| VIP Freedom 2060 Portfolio | 76,734 | 98,990 | 175,724 |
| VIP Freedom 2065 Portfolio | 22,794 | 38,240 | 61,034 |
| December 31, 2019 | | | |
| | Ordinary Income | Long-term Capital Gains | Total |
| VIP Freedom Income Portfolio | $1,325,675 | $780,780 | $2,106,455 |
| VIP Freedom 2005 Portfolio | 308,555 | 153,795 | 462,350 |
| VIP Freedom 2010 Portfolio | 7,435,527 | 11,153,162 | 18,588,689 |
| VIP Freedom 2015 Portfolio | 2,213,899 | 5,337,923 | 7,551,822 |
| VIP Freedom 2020 Portfolio | 17,692,390 | 34,177,500 | 51,869,890 |
| VIP Freedom 2025 Portfolio | 4,912,634 | 5,155,772 | 10,068,406 |
| VIP Freedom 2030 Portfolio | 8,840,006 | 11,480,956 | 20,320,962 |
| VIP Freedom 2035 Portfolio | 1,923,138 | 2,229,770 | 4,152,908 |
| VIP Freedom 2040 Portfolio | 1,960,579 | 3,154,787 | 5,115,366 |
| VIP Freedom 2045 Portfolio | 916,480 | 1,287,421 | 2,203,901 |
| VIP Freedom 2050 Portfolio | 868,346 | 841,145 | 1,709,491 |
| VIP Freedom 2055 Portfolio(a) | 21,749 | – | 21,749 |
| VIP Freedom 2060 Portfolio(a) | 21,614 | – | 21,614 |
| VIP Freedom 2065 Portfolio(a) | 20,866 | – | 20,866 |
(a) For the period April 11, 2019 (commencement of operations) to December 31, 2019.
4. Purchases and Sales of Investments.
Purchases and sales of securities, other than short-term securities, are noted in the table below.
| | Purchases ($) | Sales ($) |
| VIP Freedom Income Portfolio | 57,724,992 | 43,474,686 |
| VIP Freedom 2005 Portfolio | 9,120,892 | 8,041,896 |
| VIP Freedom 2010 Portfolio | 141,382,062 | 131,957,796 |
| VIP Freedom 2015 Portfolio | 52,328,529 | 55,617,511 |
| VIP Freedom 2020 Portfolio | 292,398,760 | 339,462,647 |
| VIP Freedom 2025 Portfolio | 201,061,280 | 158,664,029 |
| VIP Freedom 2030 Portfolio | 249,127,237 | 205,981,791 |
| VIP Freedom 2035 Portfolio | 92,517,651 | 68,800,556 |
| VIP Freedom 2040 Portfolio | 77,571,342 | 59,559,241 |
| VIP Freedom 2045 Portfolio | 38,428,002 | 23,717,379 |
| VIP Freedom 2050 Portfolio | 37,452,359 | 22,291,189 |
| VIP Freedom 2055 Portfolio | 1,852,653 | 1,104,706 |
| VIP Freedom 2060 Portfolio | 5,554,857 | 2,363,204 |
| VIP Freedom 2065 Portfolio | 406,317 | 372,272 |
5. Fees and Other Transactions with Affiliates.
Management Fee. Fidelity Management & Research Company LLC (the investment adviser), provides the Funds with investment management related services. The Funds do not pay any fees for these services.
Distribution and Service Plan Fees. In accordance with Rule 12b-1 of the 1940 Act, the Funds have adopted separate 12b-1 Plans for each Service Class of shares. Each Service Class pays Fidelity Distributors Company LLC (FDC), an affiliate of the investment adviser, a service fee. For the period, the service fee is based on an annual rate of .10% of Service Class' average net assets and .25% of Service Class 2's average net assets.
For the period, total fees, all of which were reallowed to insurance companies for the distribution of shares and providing shareholder support services were as follows:
| | Service Class | Service Class 2 | Total |
| VIP Freedom Income Portfolio | $27,663 | $55,813 | $83,476 |
| VIP Freedom 2005 Portfolio | 5,134 | 486 | 5,620 |
| VIP Freedom 2010 Portfolio | 26,044 | 715,541 | 741,585 |
| VIP Freedom 2015 Portfolio | 22,730 | 86,602 | 109,332 |
| VIP Freedom 2020 Portfolio | 168,632 | 1,223,036 | 1,391,668 |
| VIP Freedom 2025 Portfolio | 112,928 | 249,205 | 362,133 |
| VIP Freedom 2030 Portfolio | 177,265 | 427,273 | 604,538 |
| VIP Freedom 2035 Portfolio | 38,609 | 181,820 | 220,429 |
| VIP Freedom 2040 Portfolio | 67,616 | 62,384 | 130,000 |
| VIP Freedom 2045 Portfolio | 9,192 | 122,916 | 132,108 |
| VIP Freedom 2050 Portfolio | 16,944 | 60,430 | 77,374 |
| VIP Freedom 2055 Portfolio | 571 | 1,949 | 2,520 |
| VIP Freedom 2060 Portfolio | 2,384 | 1,809 | 4,193 |
| VIP Freedom 2065 Portfolio | 363 | 935 | 1,298 |
Interfund Trades. Funds may purchase from or sell securities to other Fidelity Funds under procedures adopted by the Board. The procedures have been designed to ensure these interfund trades are executed in accordance with Rule 17a-7 of the 1940 Act. Interfund trades are included within the respective purchases and sales amounts shown in the Purchases and Sales of Investments note.
Other. During the period, the investment adviser reimbursed the Funds for certain losses, which are included in Net Realized Gain (Loss) in each Fund's accompanying Statement of Operations, as follows:
| | Amount |
| VIP Freedom 2010 Portfolio | $312 |
| VIP Freedom 2015 Portfolio | 192 |
| VIP Freedom 2020 Portfolio | 30 |
| VIP Freedom 2025 Portfolio | 3,424 |
| VIP Freedom 2030 Portfolio | 2,673 |
6. Expense Reductions.
Through arrangements with each applicable Fund's custodian, credits realized as a result of certain uninvested cash balances were used to reduce each applicable Fund's or class' expenses. All of the applicable expense reductions are noted in the table below.
| | Custodian credits |
| VIP Freedom 2020 Portfolio | $2 |
| VIP Freedom 2030 Portfolio | 5 |
| VIP Freedom 2040 Portfolio | 24 |
| VIP Freedom 2045 Portfolio | 13 |
| VIP Freedom 2050 Portfolio | 6 |
7. Distributions to Shareholders.
Distributions to shareholders of each class were as follows:
| | Year ended
December 31, 2020 | Year ended
December 31, 2019 |
| VIP Freedom Income Portfolio | | |
| Distributions to shareholders | | |
| Initial Class | $484,012 | $604,382 |
| Service Class | 836,015 | 816,589 |
| Service Class 2 | 656,374 | 685,484 |
| Total | $1,976,401 | $2,106,455 |
| VIP Freedom 2005 Portfolio | | |
| Distributions to shareholders | | |
| Initial Class | $382,732 | $345,629 |
| Service Class | 186,858 | 111,078 |
| Service Class 2 | 7,424 | 5,643 |
| Total | $577,014 | $462,350 |
| VIP Freedom 2010 Portfolio | | |
| Distributions to shareholders | | |
| Initial Class | $1,061,790 | $1,128,631 |
| Service Class | 1,525,398 | 1,532,346 |
| Service Class 2 | 15,383,047 | 15,927,712 |
| Total | $17,970,235 | $18,588,689 |
| VIP Freedom 2015 Portfolio | | |
| Distributions to shareholders | | |
| Initial Class | $2,033,812 | $2,828,757 |
| Service Class | 1,491,165 | 1,385,133 |
| Service Class 2 | 2,121,430 | 3,337,932 |
| Total | $5,646,407 | $7,551,822 |
| VIP Freedom 2020 Portfolio | | |
| Distributions to shareholders | | |
| Initial Class | $5,314,838 | $5,180,915 |
| Service Class | 11,797,061 | 11,014,651 |
| Service Class 2 | 34,023,991 | 35,674,324 |
| Total | $51,135,890 | $51,869,890 |
| VIP Freedom 2025 Portfolio | | |
| Distributions to shareholders | | |
| Initial Class | $2,679,763 | $2,101,976 |
| Service Class | 6,149,457 | 4,196,099 |
| Service Class 2 | 5,303,849 | 3,770,331 |
| Total | $14,133,069 | $10,068,406 |
| VIP Freedom 2030 Portfolio | | |
| Distributions to shareholders | | |
| Initial Class | $5,841,068 | $4,537,966 |
| Service Class | 10,623,238 | 7,768,579 |
| Service Class 2 | 10,087,497 | 8,014,417 |
| Total | $26,551,803 | $20,320,962 |
| VIP Freedom 2035 Portfolio | | |
| Distributions to shareholders | | |
| Initial Class | $747,584 | $499,767 |
| Service Class | 1,949,191 | 982,997 |
| Service Class 2 | 3,788,479 | 2,670,144 |
| Total | $6,485,254 | $4,152,908 |
| VIP Freedom 2040 Portfolio | | |
| Distributions to shareholders | | |
| Initial Class | $1,677,759 | $1,249,046 |
| Service Class | 3,902,093 | 2,907,956 |
| Service Class 2 | 1,429,650 | 958,364 |
| Total | $7,009,502 | $5,115,366 |
| VIP Freedom 2045 Portfolio | | |
| Distributions to shareholders | | |
| Initial Class | $217,739 | $157,330 |
| Service Class | 472,924 | 276,706 |
| Service Class 2 | 2,612,728 | 1,769,865 |
| Total | $3,303,391 | $2,203,901 |
| VIP Freedom 2050 Portfolio | | |
| Distributions to shareholders | | |
| Initial Class | $567,067 | $419,346 |
| Service Class | 867,482 | 591,907 |
| Service Class 2 | 1,165,142 | 698,238 |
| Total | $2,599,691 | $1,709,491 |
| VIP Freedom 2055 Portfolio(a) | | |
| Distributions to shareholders | | |
| Initial Class | $14,159 | $6,767 |
| Service Class | 25,236 | 7,094 |
| Service Class 2 | 36,246 | 7,888 |
| Total | $75,641 | $21,749 |
| VIP Freedom 2060 Portfolio(a) | | |
| Distributions to shareholders | | |
| Initial Class | $15,305 | $6,467 |
| Service Class | 121,297 | 7,556 |
| Service Class 2 | 39,122 | 7,591 |
| Total | $175,724 | $21,614 |
| VIP Freedom 2065 Portfolio(a) | | |
| Distributions to shareholders | | |
| Initial Class | $20,133 | $7,233 |
| Service Class | 19,766 | 7,000 |
| Service Class 2 | 21,135 | 6,633 |
| Total | $61,034 | $20,866 |
(a) For the period April 11, 2019 (commencement of operations) to December 31, 2019.
8. Share Transactions.
Transactions for each class of shares were as follows:
| | Shares | Shares | Dollars | Dollars |
| | Year ended December 31, 2020 | Year ended December 31, 2019 | Year ended December 31, 2020 | Year ended December 31, 2019 |
| VIP Freedom Income Portfolio | | | | |
| Initial Class | | | | |
| Shares sold | 552,815 | 159,690 | $6,628,090 | $1,868,712 |
| Reinvestment of distributions | 39,522 | 52,493 | 484,012 | 604,382 |
| Shares redeemed | (520,401) | (277,763) | (6,242,382) | (3,225,184) |
| Net increase (decrease) | 71,936 | (65,580) | $869,720 | $(752,090) |
| Service Class | | | | |
| Shares sold | 1,968,709 | 1,466,656 | $24,051,604 | $17,186,686 |
| Reinvestment of distributions | 68,376 | 70,561 | 836,015 | 816,589 |
| Shares redeemed | (1,550,110) | (764,665) | (18,791,928) | (8,878,533) |
| Net increase (decrease) | 486,975 | 772,552 | $6,095,691 | $9,124,742 |
| Service Class 2 | | | | |
| Shares sold | 1,794,123 | 425,804 | $21,728,081 | $4,927,277 |
| Reinvestment of distributions | 53,777 | 59,814 | 656,374 | 685,484 |
| Shares redeemed | (1,226,432) | (337,905) | (14,743,655) | (3,912,391) |
| Net increase (decrease) | 621,468 | 147,713 | $7,640,800 | $1,700,370 |
| VIP Freedom 2005 Portfolio | | | | |
| Initial Class | | | | |
| Shares sold | 102,610 | 54,603 | $1,299,891 | $671,263 |
| Reinvestment of distributions | 29,486 | 27,967 | 382,732 | 345,629 |
| Shares redeemed | (126,358) | (51,772) | (1,618,161) | (642,871) |
| Net increase (decrease) | 5,738 | 30,798 | $64,462 | $374,021 |
| Service Class | | | | |
| Shares sold | 310,180 | 161,933 | $4,030,290 | $2,029,549 |
| Reinvestment of distributions | 14,265 | 8,907 | 186,858 | 111,078 |
| Shares redeemed | (241,761) | (34,332) | (3,115,043) | (428,681) |
| Net increase (decrease) | 82,684 | 136,508 | $1,102,105 | $1,711,946 |
| Service Class 2 | | | | |
| Shares sold | 7,829 | 3,735 | $104,515 | $46,278 |
| Reinvestment of distributions | 575 | 457 | 7,424 | 5,643 |
| Shares redeemed | (1,357) | (547) | (16,979) | (6,856) |
| Net increase (decrease) | 7,047 | 3,645 | $94,960 | $45,065 |
| VIP Freedom 2010 Portfolio | | | | |
| Initial Class | | | | |
| Shares sold | 489,835 | 313,315 | $6,415,215 | $4,079,139 |
| Reinvestment of distributions | 79,472 | 88,626 | 1,061,790 | 1,128,631 |
| Shares redeemed | (558,825) | (447,611) | (7,238,865) | (5,835,944) |
| Net increase (decrease) | 10,482 | (45,670) | $238,140 | $(628,174) |
| Service Class | | | | |
| Shares sold | 942,684 | 463,687 | $12,546,994 | $6,018,516 |
| Reinvestment of distributions | 114,589 | 120,448 | 1,525,398 | 1,532,346 |
| Shares redeemed | (1,157,763) | (565,310) | (15,229,370) | (7,362,660) |
| Net increase (decrease) | (100,490) | 18,825 | $(1,156,978) | $188,202 |
| Service Class 2 | | | | |
| Shares sold | 2,770,168 | 1,751,243 | $36,777,945 | $22,712,133�� |
| Reinvestment of distributions | 1,160,404 | 1,259,766 | 15,383,047 | 15,927,712 |
| Shares redeemed | (2,582,942) | (1,871,273) | (33,553,015) | (24,092,194) |
| Net increase (decrease) | 1,347,630 | 1,139,736 | $18,607,977 | $14,547,651 |
| VIP Freedom 2015 Portfolio | | | | |
| Initial Class | | | | |
| Shares sold | 620,726 | 211,337 | $7,918,410 | $2,689,789 |
| Reinvestment of distributions | 154,939 | 229,337 | 2,033,812 | 2,828,757 |
| Shares redeemed | (737,634) | (393,577) | (9,086,686) | (4,973,529) |
| Net increase (decrease) | 38,031 | 47,097 | $865,536 | $545,017 |
| Service Class | | | | |
| Shares sold | 1,369,703 | 1,134,388 | $17,305,188 | $14,610,293 |
| Reinvestment of distributions | 113,838 | 111,590 | 1,491,165 | 1,385,133 |
| Shares redeemed | (1,280,648) | (479,010) | (15,855,790) | (6,033,059) |
| Net increase (decrease) | 202,893 | 766,968 | $2,940,563 | $9,962,367 |
| Service Class 2 | | | | |
| Shares sold | 630,624 | 711,453 | $7,919,327 | $9,128,330 |
| Reinvestment of distributions | 163,109 | 272,435 | 2,121,430 | 3,337,932 |
| Shares redeemed | (1,138,399) | (901,419) | (14,580,444) | (11,430,036) |
| Net increase (decrease) | (344,666) | 82,469 | $(4,539,687) | $1,036,226 |
| VIP Freedom 2020 Portfolio | | | | |
| Initial Class | | | | |
| Shares sold | 1,897,964 | 799,864 | $25,807,646 | $10,748,657 |
| Reinvestment of distributions | 386,522 | 395,520 | 5,314,838 | 5,180,915 |
| Shares redeemed | (2,266,332) | (904,724) | (30,233,566) | (12,078,443) |
| Net increase (decrease) | 18,154 | 290,660 | $888,918 | $3,851,129 |
| Service Class | | | | |
| Shares sold | 3,443,575 | 4,018,718 | $46,267,509 | $54,276,128 |
| Reinvestment of distributions | 862,629 | 842,399 | 11,797,061 | 11,014,651 |
| Shares redeemed | (4,710,547) | (3,088,598) | (63,442,317) | (41,149,520) |
| Net increase (decrease) | (404,343) | 1,772,519 | $(5,377,747) | $24,141,259 |
| Service Class 2 | | | | |
| Shares sold | 1,549,604 | 1,926,331 | $20,817,403 | $25,888,656 |
| Reinvestment of distributions | 2,501,532 | 2,749,311 | 34,023,991 | 35,674,324 |
| Shares redeemed | (5,451,945) | (5,384,582) | (72,848,668) | (71,698,853) |
| Net increase (decrease) | (1,400,809) | (708,940) | $(18,007,274) | $(10,135,873) |
| VIP Freedom 2025 Portfolio | | | | |
| Initial Class | | | | |
| Shares sold | 1,004,460 | 723,281 | $14,982,710 | $10,460,478 |
| Reinvestment of distributions | 173,519 | 145,797 | 2,679,763 | 2,101,976 |
| Shares redeemed | (955,265) | (672,089) | (13,825,370) | (9,746,422) |
| Net increase (decrease) | 222,714 | 196,989 | $3,837,103 | $2,816,032 |
| Service Class | | | | |
| Shares sold | 6,692,712 | 4,293,460 | $101,177,814 | $62,427,141 |
| Reinvestment of distributions | 398,021 | 292,315 | 6,149,457 | 4,196,099 |
| Shares redeemed | (4,584,417) | (4,280,480) | (68,648,010) | (63,073,836) |
| Net increase (decrease) | 2,506,316 | 305,295 | $38,679,261 | $3,549,404 |
| Service Class 2 | | | | |
| Shares sold | 2,139,387 | 2,046,622 | $31,188,910 | $29,722,608 |
| Reinvestment of distributions | 347,604 | 263,268 | 5,303,849 | 3,770,331 |
| Shares redeemed | (2,198,968) | (1,161,929) | (32,598,098) | (16,570,200) |
| Net increase (decrease) | 288,023 | 1,147,961 | $3,894,661 | $16,922,739 |
| VIP Freedom 2030 Portfolio | | | | |
| Initial Class | | | | |
| Shares sold | 1,696,990 | 1,092,904 | $25,110,224 | $15,580,871 |
| Reinvestment of distributions | 382,273 | 319,112 | 5,841,068 | 4,537,966 |
| Shares redeemed | (1,446,224) | (761,460) | (20,699,851) | (10,793,932) |
| Net increase (decrease) | 633,039 | 650,556 | $10,251,441 | $9,324,905 |
| Service Class | | | | |
| Shares sold | 5,313,444 | 3,325,456 | $79,014,310 | $47,373,812 |
| Reinvestment of distributions | 696,027 | 547,589 | 10,623,238 | 7,768,579 |
| Shares redeemed | (3,626,073) | (2,204,045) | (52,784,403) | (31,297,767) |
| Net increase (decrease) | 2,383,398 | 1,669,000 | $36,853,145 | $23,844,624 |
| Service Class 2 | | | | |
| Shares sold | 2,280,063 | 2,185,579 | $33,882,846 | $31,363,433 |
| Reinvestment of distributions | 667,252 | 568,292 | 10,087,497 | 8,014,417 |
| Shares redeemed | (2,755,570) | (1,465,983) | (40,428,678) | (20,860,745) |
| Net increase (decrease) | 191,745 | 1,287,888 | $3,541,665 | $18,517,105 |
| VIP Freedom 2035 Portfolio | | | | |
| Initial Class | | | | |
| Shares sold | 178,793 | 176,462 | $4,206,939 | $4,010,249 |
| Reinvestment of distributions | 30,176 | 22,187 | 747,584 | 499,767 |
| Shares redeemed | (83,516) | (68,425) | (1,915,633) | (1,530,494) |
| Net increase (decrease) | 125,453 | 130,224 | $3,038,890 | $2,979,522 |
| Service Class | | | | |
| Shares sold | 1,688,024 | 857,203 | $39,337,723 | $19,503,745 |
| Reinvestment of distributions | 78,663 | 43,430 | 1,949,191 | 982,997 |
| Shares redeemed | (1,132,662) | (256,281) | (26,455,568) | (5,859,415) |
| Net increase (decrease) | 634,025 | 644,352 | $14,831,346 | $14,627,327 |
| Service Class 2 | | | | |
| Shares sold | 1,205,273 | 924,180 | $28,510,668 | $20,907,712 |
| Reinvestment of distributions | 155,111 | 119,794 | 3,788,479 | 2,670,144 |
| Shares redeemed | (1,100,342) | (348,177) | (25,714,567) | (7,815,871) |
| Net increase (decrease) | 260,042 | 695,797 | $6,584,580 | $15,761,985 |
| VIP Freedom 2040 Portfolio | | | | |
| Initial Class | | | | |
| Shares sold | 365,769 | 266,526 | $8,106,125 | $5,657,672 |
| Reinvestment of distributions | 72,430 | 59,099 | 1,677,759 | 1,249,046 |
| Shares redeemed | (296,826) | (181,077) | (6,410,122) | (3,843,873) |
| Net increase (decrease) | 141,373 | 144,548 | $3,373,762 | $3,062,845 |
| Service Class | | | | |
| Shares sold | 1,690,640 | 952,181 | $36,587,034 | $20,110,832 |
| Reinvestment of distributions | 168,675 | 138,170 | 3,902,093 | 2,907,956 |
| Shares redeemed | (1,313,297) | (909,615) | (28,344,613) | (19,217,406) |
| Net increase (decrease) | 546,018 | 180,736 | $12,144,514 | $3,801,382 |
| Service Class 2 | | | | |
| Shares sold | 341,168 | 312,752 | $7,337,579 | $6,700,932 |
| Reinvestment of distributions | 62,254 | 45,591 | 1,429,650 | 958,364 |
| Shares redeemed | (236,379) | (141,446) | (5,073,237) | (2,956,957) |
| Net increase (decrease) | 167,043 | 216,897 | $3,693,992 | $4,702,339 |
| VIP Freedom 2045 Portfolio | | | | |
| Initial Class | | | | |
| Shares sold | 72,700 | 36,898 | $1,624,920 | $792,652 |
| Reinvestment of distributions | 9,277 | 7,431 | 217,739 | 157,330 |
| Shares redeemed | (39,305) | (21,156) | (840,876) | (446,695) |
| Net increase (decrease) | 42,672 | 23,173 | $1,001,783 | $503,287 |
| Service Class | | | | |
| Shares sold | 457,384 | 153,890 | $10,064,107 | $3,254,776 |
| Reinvestment of distributions | 20,078 | 13,043 | 472,924 | 276,706 |
| Shares redeemed | (284,591) | (54,598) | (6,186,765) | (1,168,975) |
| Net increase (decrease) | 192,871 | 112,335 | $4,350,266 | $2,362,507 |
| Service Class 2 | | | | |
| Shares sold | 658,773 | 629,548 | $14,402,147 | $13,441,555 |
| Reinvestment of distributions | 112,618 | 84,121 | 2,612,728 | 1,769,865 |
| Shares redeemed | (335,205) | (217,786) | (7,310,035) | (4,571,673) |
| Net increase (decrease) | 436,186 | 495,883 | $9,704,840 | $10,639,747 |
| VIP Freedom 2050 Portfolio | | | | |
| Initial Class | | | | |
| Shares sold | 196,020 | 130,991 | $3,974,313 | $2,514,967 |
| Reinvestment of distributions | 26,877 | 21,819 | 567,067 | 419,346 |
| Shares redeemed | (140,058) | (71,971) | (2,740,158) | (1,368,904) |
| Net increase (decrease) | 82,839 | 80,839 | $1,801,222 | $1,565,409 |
| Service Class | | | | |
| Shares sold | 624,475 | 320,425 | $12,445,184 | $6,054,554 |
| Reinvestment of distributions | 41,282 | 30,958 | 867,482 | 591,907 |
| Shares redeemed | (432,979) | (266,946) | (8,367,357) | (5,133,525) |
| Net increase (decrease) | 232,778 | 84,437 | $4,945,309 | $1,512,936 |
| Service Class 2 | | | | |
| Shares sold | 559,721 | 448,417 | $11,067,227 | $8,546,655 |
| Reinvestment of distributions | 55,496 | 36,351 | 1,165,142 | 698,238 |
| Shares redeemed | (187,567) | (96,394) | (3,660,157) | (1,827,340) |
| Net increase (decrease) | 427,650 | 388,374 | $8,572,212 | $7,417,553 |
| VIP Freedom 2055 Portfolio(a) | | | | |
| Initial Class | | | | |
| Shares sold | 63 | 33,334 | $600 | $333,335 |
| Reinvestment of distributions | 2 | – | 26 | – |
| Shares redeemed | (1) | – | (7) | – |
| Net increase (decrease) | 64 | 33,334 | $619 | $333,335 |
| Service Class | | | | |
| Shares sold | 63,050 | 36,994 | $704,283 | $370,685 |
| Reinvestment of distributions | 903 | 52 | 11,403 | 561 |
| Shares redeemed | (35,996) | (697) | (408,422) | (7,241) |
| Net increase (decrease) | 27,957 | 36,349 | $307,264 | $364,005 |
| Service Class 2 | | | | |
| Shares sold | 60,053 | 53,682 | $680,253 | $553,200 |
| Reinvestment of distributions | 1,808 | 149 | 22,813 | 1,621 |
| Shares redeemed | (22,347) | (29) | (263,640) | (291) |
| Net increase (decrease) | 39,514 | 53,802 | $439,426 | $554,530 |
| VIP Freedom 2060 Portfolio(a) | | | | |
| Initial Class | | | | |
| Shares sold | 13 | 33,334 | $125 | $333,335 |
| Reinvestment of distributions | – | – | – | – |
| Shares redeemed | – | – | – | – |
| Net increase (decrease) | 13 | 33,334 | $125 | $333,335 |
| Service Class | | | | |
| Shares sold | 330,217 | 40,799 | $3,653,051 | $410,618 |
| Reinvestment of distributions | 8,429 | 119 | 106,297 | 1,289 |
| Shares redeemed | (100,016) | (374) | (1,097,799) | (3,886) |
| Net increase (decrease) | 238,630 | 40,544 | $2,661,549 | $408,021 |
| Service Class 2 | | | | |
| Shares sold | 64,252 | 43,145 | $683,799 | $436,608 |
| Reinvestment of distributions | 1,942 | 150 | 24,489 | 1,625 |
| Shares redeemed | (17,570) | (2) | (172,837) | (17) |
| Net increase (decrease) | 48,624 | 43,293 | $535,451 | $438,216 |
| VIP Freedom 2065 Portfolio(a) | | | | |
| Initial Class | | | | |
| Shares sold | – | 33,334 | $– | $333,335 |
| Net increase (decrease) | – | 33,334 | $– | $333,335 |
| Service Class | | | | |
| Shares sold | – | 33,334 | $– | $333,335 |
| Net increase (decrease) | – | 33,334 | $– | $333,335 |
| Service Class 2 | | | | |
| Shares sold | 4,923 | 33,333 | $55,767 | $333,330 |
| Reinvestment of distributions | 147 | – | 1,836 | – |
| Shares redeemed | (1,540) | – | (17,012) | – |
| Net increase (decrease) | 3,530 | 33,333 | $40,591 | $333,330 |
(a) For the period April 11, 2019 (commencement of operations) to December 31, 2019.
9. Other.
The Funds' organizational documents provide former and current trustees and officers with a limited indemnification against liabilities arising in connection with the performance of their duties to the Funds. In the normal course of business, the Funds may also enter into contracts that provide general indemnifications. The Funds' maximum exposure under these arrangements is unknown as this would be dependent on future claims that may be made against the Funds. The risk of material loss from such claims is considered remote.
The Funds, in aggregate, were the owners of record of more than 20% of the total outstanding shares of the following Underlying Funds.
| Fund | % of shares held |
| VIP Emerging Markets Portfolio | 30% |
| VIP Overseas Portfolio | 23% |
| VIP Value Portfolio | 32% |
In addition, at the end of the period the investment adviser or its affiliates were owners of record of more than 10% and certain otherwise unaffiliated shareholders each were owners of record of more than 10%, respectively, of the outstanding shares of the following Funds:
| | Affiliated % | Number of
Unaffiliated Shareholders | Unaffiliated Shareholders % |
| VIP Freedom Income | 17% | 3 | 55% |
| VIP Freedom 2005 | 62% | 1 | 28% |
| VIP Freedom 2010 | –% | 1 | 88% |
| VIP Freedom 2015 | 25% | 2 | 37% |
| VIP Freedom 2020 | –% | 1 | 70% |
| VIP Freedom 2025 | –% | 2 | 46% |
| VIP Freedom 2030 | –% | 1 | 45% |
| VIP Freedom 2035 | –% | 4 | 73% |
| VIP Freedom 2040 | –% | 3 | 64% |
| VIP Freedom 2045 | –% | 3 | 68% |
| VIP Freedom 2050 | –% | 4 | 76% |
| VIP Freedom 2055 | 53% | 2 | 42% |
| VIP Freedom 2060 | 25% | 2 | 75% |
| VIP Freedom 2065 | 97% | – | – |
10. Coronavirus (COVID-19) Pandemic.
An outbreak of COVID-19 first detected in China during December 2019 has since spread globally and was declared a pandemic by the World Health Organization during March 2020. Developments that disrupt global economies and financial markets, such as the COVID-19 pandemic, may magnify factors that affect the Funds' performance.
Report of Independent Registered Public Accounting Firm
To the Board of Trustees of Variable Insurance Products Fund V and Shareholders of VIP Freedom Income Portfolio, VIP Freedom 2005 Portfolio, VIP Freedom 2010 Portfolio, VIP Freedom 2015 Portfolio, VIP Freedom 2020 Portfolio, VIP Freedom 2025 Portfolio, VIP Freedom 2030 Portfolio, VIP Freedom 2035 Portfolio, VIP Freedom 2040 Portfolio, VIP Freedom 2045 Portfolio, VIP Freedom 2050 Portfolio, VIP Freedom 2055 Portfolio, VIP Freedom 2060 Portfolio and VIP Freedom 2065 Portfolio
Opinion on the Financial Statements and Financial Highlights
We have audited the accompanying statements of assets and liabilities of VIP Freedom Income Portfolio, VIP Freedom 2005 Portfolio, VIP Freedom 2010 Portfolio, VIP Freedom 2015 Portfolio, VIP Freedom 2020 Portfolio, VIP Freedom 2025 Portfolio, VIP Freedom 2030 Portfolio, VIP Freedom 2035 Portfolio, VIP Freedom 2040 Portfolio, VIP Freedom 2045 Portfolio, VIP Freedom 2050 Portfolio, VIP Freedom 2055 Portfolio, VIP Freedom 2060 Portfolio and VIP Freedom 2065 Portfolio (the "Funds"), each a fund of Variable Insurance Products Fund V, including the schedules of investments, as of December 31, 2020, the related statements of operations for the year then ended, the statements of changes in net assets for each of the two years in the period then ended, the financial highlights for each of the five years in the period then ended, except VIP Freedom 2055 Portfolio, VIP Freedom 2060 Portfolio and VIP Freedom 2065 Portfolio; the statements of changes in net assets and the financial highlights for the year then ended and for the period from April 11, 2019 (commencement of operations) to December 31, 2019 for the VIP Freedom 2055 Portfolio, VIP Freedom 2060 Portfolio and VIP 2065 Portfolio; and the related notes. In our opinion, the financial statements and financial highlights present fairly, in all material respects, the financial position of each of the Funds as of December 31, 2020, and the results of their operations for the year then ended, the changes in their net assets for each of the two years in the period then ended, and the financial highlights for each of the five years in the period then ended (or for the period mentioned above), in conformity with accounting principles generally accepted in the United States of America.
Basis for Opinion
These financial statements and financial highlights are the responsibility of the Funds’ management. Our responsibility is to express an opinion on the Funds’ financial statements and financial highlights based on our audits. We are a public accounting firm registered with the Public Company Accounting Oversight Board (United States) (PCAOB) and are required to be independent with respect to the Funds in accordance with the U.S. federal securities laws and the applicable rules and regulations of the Securities and Exchange Commission and the PCAOB.
We conducted our audits in accordance with the standards of the PCAOB. Those standards require that we plan and perform the audit to obtain reasonable assurance about whether the financial statements and financial highlights are free of material misstatement, whether due to error or fraud. The Funds are not required to have, nor were we engaged to perform, an audit of their internal control over financial reporting. As part of our audits we are required to obtain an understanding of internal control over financial reporting but not for the purpose of expressing an opinion on the effectiveness of the Funds’ internal control over financial reporting. Accordingly, we express no such opinion.
Our audits included performing procedures to assess the risks of material misstatement of the financial statements and financial highlights, whether due to error or fraud, and performing procedures that respond to those risks. Such procedures included examining, on a test basis, evidence regarding the amounts and disclosures in the financial statements and financial highlights. Our audits also included evaluating the accounting principles used and significant estimates made by management, as well as evaluating the overall presentation of the financial statements and financial highlights. Our procedures included confirmation of securities owned as of December 31, 2020, by correspondence with the custodian and brokers; when replies were not received from brokers, we performed other auditing procedures. We believe that our audits provide a reasonable basis for our opinion.
/s/ Deloitte & Touche LLP
Boston, Massachusetts
February 11, 2021
We have served as the auditor of one or more of the Fidelity investment companies since 1999.
Trustees and Officers
The Trustees, Members of the Advisory Board (if any), and officers of the trust and funds, as applicable, are listed below. The Board of Trustees governs each fund and is responsible for protecting the interests of shareholders. The Trustees are experienced executives who meet periodically throughout the year to oversee each fund's activities, review contractual arrangements with companies that provide services to each fund, oversee management of the risks associated with such activities and contractual arrangements, and review each fund's performance. If the interests of a fund and an underlying Fidelity® fund were to diverge, a conflict of interest could arise and affect how the Trustees and Members of the Advisory Board fulfill their fiduciary duties to the affected funds. FMR has structured the funds to avoid these potential conflicts, although there may be situations where a conflict of interest is unavoidable. In such instances, FMR, the Trustees, and Members of the Advisory Board would take reasonable steps to minimize and, if possible, eliminate the conflict. Each of the Trustees oversees 280 funds.
The Trustees hold office without limit in time except that (a) any Trustee may resign; (b) any Trustee may be removed by written instrument, signed by at least two-thirds of the number of Trustees prior to such removal; (c) any Trustee who requests to be retired or who has become incapacitated by illness or injury may be retired by written instrument signed by a majority of the other Trustees; and (d) any Trustee may be removed at any special meeting of shareholders by a two-thirds vote of the outstanding voting securities of the trust. Each Trustee who is not an interested person (as defined in the 1940 Act) of the trust and the funds is referred to herein as an Independent Trustee. Each Independent Trustee shall retire not later than the last day of the calendar year in which his or her 75th birthday occurs. The Independent Trustees may waive this mandatory retirement age policy with respect to individual Trustees. Officers and Advisory Board Members hold office without limit in time, except that any officer or Advisory Board Member may resign or may be removed by a vote of a majority of the Trustees at any regular meeting or any special meeting of the Trustees. Except as indicated, each individual has held the office shown or other offices in the same company for the past five years.
Each fund’s Statement of Additional Information (SAI) includes more information about the Trustees. To request a free copy, call Fidelity at 1-877-208-0098.
Experience, Skills, Attributes, and Qualifications of the Trustees. The Governance and Nominating Committee has adopted a statement of policy that describes the experience, qualifications, attributes, and skills that are necessary and desirable for potential Independent Trustee candidates (Statement of Policy). The Board believes that each Trustee satisfied at the time he or she was initially elected or appointed a Trustee, and continues to satisfy, the standards contemplated by the Statement of Policy. The Governance and Nominating Committee also engages professional search firms to help identify potential Independent Trustee candidates who have the experience, qualifications, attributes, and skills consistent with the Statement of Policy. From time to time, additional criteria based on the composition and skills of the current Independent Trustees, as well as experience or skills that may be appropriate in light of future changes to board composition, business conditions, and regulatory or other developments, have also been considered by the professional search firms and the Governance and Nominating Committee. In addition, the Board takes into account the Trustees' commitment and participation in Board and committee meetings, as well as their leadership of standing and ad hoc committees throughout their tenure.
In determining that a particular Trustee was and continues to be qualified to serve as a Trustee, the Board has considered a variety of criteria, none of which, in isolation, was controlling. The Board believes that, collectively, the Trustees have balanced and diverse experience, qualifications, attributes, and skills, which allow the Board to operate effectively in governing each fund and protecting the interests of shareholders. Information about the specific experience, skills, attributes, and qualifications of each Trustee, which in each case led to the Board's conclusion that the Trustee should serve (or continue to serve) as a trustee of the funds, is provided below.
Board Structure and Oversight Function. Abigail P. Johnson is an interested person and currently serves as Chairman. The Trustees have determined that an interested Chairman is appropriate and benefits shareholders because an interested Chairman has a personal and professional stake in the quality and continuity of services provided to the funds. Independent Trustees exercise their informed business judgment to appoint an individual of their choosing to serve as Chairman, regardless of whether the Trustee happens to be independent or a member of management. The Independent Trustees have determined that they can act independently and effectively without having an Independent Trustee serve as Chairman and that a key structural component for assuring that they are in a position to do so is for the Independent Trustees to constitute a substantial majority for the Board. The Independent Trustees also regularly meet in executive session. Arthur E. Johnson serves as Chairman of the Independent Trustees and as such (i) acts as a liaison between the Independent Trustees and management with respect to matters important to the Independent Trustees and (ii) with management prepares agendas for Board meetings.
Fidelity® funds are overseen by different Boards of Trustees. The funds' Board oversees Fidelity's investment-grade bond, money market, asset allocation and certain equity funds, and other Boards oversee Fidelity's high income and other equity funds. The asset allocation funds may invest in Fidelity® funds that are overseen by such other Boards. The use of separate Boards, each with its own committee structure, allows the Trustees of each group of Fidelity® funds to focus on the unique issues of the funds they oversee, including common research, investment, and operational issues. On occasion, the separate Boards establish joint committees to address issues of overlapping consequences for the Fidelity® funds overseen by each Board.
The Trustees operate using a system of committees to facilitate the timely and efficient consideration of all matters of importance to the Trustees, each fund, and fund shareholders and to facilitate compliance with legal and regulatory requirements and oversight of the funds' activities and associated risks. The Board, acting through its committees, has charged FMR and its affiliates with (i) identifying events or circumstances the occurrence of which could have demonstrably adverse effects on the funds' business and/or reputation; (ii) implementing processes and controls to lessen the possibility that such events or circumstances occur or to mitigate the effects of such events or circumstances if they do occur; and (iii) creating and maintaining a system designed to evaluate continuously business and market conditions in order to facilitate the identification and implementation processes described in (i) and (ii) above. Because the day-to-day operations and activities of the funds are carried out by or through FMR, its affiliates, and other service providers, the funds' exposure to risks is mitigated but not eliminated by the processes overseen by the Trustees. While each of the Board's committees has responsibility for overseeing different aspects of the funds' activities, oversight is exercised primarily through the Operations and Audit Committees. In addition, an ad hoc Board committee of Independent Trustees has worked with FMR to enhance the Board's oversight of investment and financial risks, legal and regulatory risks, technology risks, and operational risks, including the development of additional risk reporting to the Board. Appropriate personnel, including but not limited to the funds' Chief Compliance Officer (CCO), FMR's internal auditor, the independent accountants, the funds' Treasurer and portfolio management personnel, make periodic reports to the Board's committees, as appropriate, including an annual review of Fidelity's risk management program for the Fidelity® funds. The responsibilities of each standing committee, including their oversight responsibilities, are described further under "Standing Committees of the Trustees."
Interested Trustees*:
Correspondence intended for a Trustee who is an interested person may be sent to Fidelity Investments, 245 Summer Street, Boston, Massachusetts 02210.
Name, Year of Birth; Principal Occupations and Other Relevant Experience+
Abigail P. Johnson (1961)
Year of Election or Appointment: 2009
Trustee
Chairman of the Board of Trustees
Ms. Johnson also serves as Trustee of other Fidelity® funds. Ms. Johnson serves as Chairman (2016-present), Chief Executive Officer (2014-present), and Director (2007-present) of FMR LLC (diversified financial services company), President of Fidelity Financial Services (2012-present) and President of Personal, Workplace and Institutional Services (2005-present). Ms. Johnson is Chairman and Director of Fidelity Management & Research Company LLC (investment adviser firm, 2011-present). Previously, Ms. Johnson served as Chairman and Director of FMR Co., Inc. (investment adviser firm, 2011-2019), Vice Chairman (2007-2016) and President (2013-2016) of FMR LLC, President and a Director of Fidelity Management & Research Company (2001-2005), a Trustee of other investment companies advised by Fidelity Management & Research Company, Fidelity Investments Money Management, Inc. (investment adviser firm), and FMR Co., Inc. (2001-2005), Senior Vice President of the Fidelity® funds (2001-2005), and managed a number of Fidelity® funds. Ms. Abigail P. Johnson and Mr. Arthur E. Johnson are not related.
Jennifer Toolin McAuliffe (1959)
Year of Election or Appointment: 2016
Trustee
Ms. McAuliffe also serves as Trustee of other Fidelity® funds. Previously, Ms. McAuliffe served as Co-Head of Fixed Income of Fidelity Investments Limited (now known as FIL Limited (FIL)) (diversified financial services company), Director of Research for FIL’s credit and quantitative teams in London, Hong Kong and Tokyo and Director of Research for taxable and municipal bonds at Fidelity Investments Money Management, Inc. Ms. McAuliffe previously served as a member of the Advisory Board of certain Fidelity® funds (2016). Ms. McAuliffe was previously a lawyer at Ropes & Gray LLP and currently serves as director or trustee of several not-for-profit entities.
* Determined to be an “Interested Trustee” by virtue of, among other things, his or her affiliation with the trust or various entities under common control with FMR.
+ The information includes the Trustee's principal occupation during the last five years and other information relating to the experience, attributes, and skills relevant to the Trustee's qualifications to serve as a Trustee, which led to the conclusion that the Trustee should serve as a Trustee for each fund.
Independent Trustees:
Correspondence intended for an Independent Trustee may be sent to Fidelity Investments, P.O. Box 55235, Boston, Massachusetts 02205-5235.
Name, Year of Birth; Principal Occupations and Other Relevant Experience+
Elizabeth S. Acton (1951)
Year of Election or Appointment: 2013
Trustee
Ms. Acton also serves as Trustee of other Fidelity® funds. Prior to her retirement, Ms. Acton served as Executive Vice President, Finance (2011-2012), Executive Vice President, Chief Financial Officer (2002-2011) and Treasurer (2004-2005) of Comerica Incorporated (financial services). Prior to joining Comerica, Ms. Acton held a variety of positions at Ford Motor Company (1983-2002), including Vice President and Treasurer (2000-2002) and Executive Vice President and Chief Financial Officer of Ford Motor Credit Company (1998-2000). Ms. Acton currently serves as a member of the Board and Audit and Finance Committees of Beazer Homes USA, Inc. (homebuilding, 2012-present). Ms. Acton previously served as a member of the Advisory Board of certain Fidelity® funds (2013-2016).
Ann E. Dunwoody (1953)
Year of Election or Appointment: 2018
Trustee
General Dunwoody also serves as Trustee of other Fidelity® funds. General Dunwoody (United States Army, Retired) was the first woman in U.S. military history to achieve the rank of four-star general and prior to her retirement in 2012 held a variety of positions within the U.S. Army, including Commanding General, U.S. Army Material Command (2008-2012). General Dunwoody currently serves as President of First to Four LLC (leadership and mentoring services, 2012-present), a member of the Board and Nomination and Corporate Governance Committees of Kforce Inc. (professional staffing services, 2016-present) and a member of the Board of Automattic Inc. (software engineering, 2018-present). Previously, General Dunwoody served as a member of the Advisory Board and Nominating and Corporate Governance Committee of L3 Technologies, Inc. (communication, electronic, sensor and aerospace systems, 2013-2019) and a member of the Board and Audit and Sustainability and Corporate Responsibility Committees of Republic Services, Inc. (waste collection, disposal and recycling, 2013-2016). Ms. Dunwoody also serves on several boards for non-profit organizations, including as a member of the Board, Chair of the Nomination and Governance Committee and a member of the Audit Committee of Logistics Management Institute (consulting non-profit, 2012-present), a member of the Council of Trustees for the Association of the United States Army (advocacy non-profit, 2013-present), a member of the Board of Florida Institute of Technology (2015-present) and a member of the Board of ThanksUSA (military family education non-profit, 2014-present). General Dunwoody previously served as a member of the Advisory Board of certain Fidelity® funds (2018).
John Engler (1948)
Year of Election or Appointment: 2014
Trustee
Mr. Engler also serves as Trustee of other Fidelity® funds. Previously, Mr. Engler served as Governor of Michigan (1991-2003), President of the Business Roundtable (2011-2017) and interim President of Michigan State University (2018-2019). Mr. Engler currently serves as a member of the Board of K12 Inc. (technology-based education company, 2012-present). Previously, Mr. Engler served as a member of the Board of Universal Forest Products (manufacturer and distributor of wood and wood-alternative products, 2003-2019) and Trustee of The Munder Funds (2003-2014). Mr. Engler previously served as a member of the Advisory Board of certain Fidelity® funds (2014-2016).
Robert F. Gartland (1951)
Year of Election or Appointment: 2010
Trustee
Mr. Gartland also serves as Trustee of other Fidelity® funds. Prior to his retirement, Mr. Gartland held a variety of positions at Morgan Stanley (financial services, 1979-2007), including Managing Director (1987-2007) and Chase Manhattan Bank (1975-1978). Mr. Gartland previously served as Chairman and an investor in Gartland & Mellina Group Corp. (consulting, 2009-2019), as a member of the Board of National Securities Clearing Corporation (1993-1996) and as Chairman of TradeWeb (2003-2004).
Arthur E. Johnson (1947)
Year of Election or Appointment: 2008
Trustee
Chairman of the Independent Trustees
Mr. Johnson also serves as Trustee of other Fidelity® funds. Prior to his retirement, Mr. Johnson served as Senior Vice President of Corporate Strategic Development of Lockheed Martin Corporation (defense contractor, 1999-2009). Mr. Johnson currently serves as a member of the Board of Booz Allen Hamilton (management consulting, 2011-present). Mr. Johnson previously served as a member of the Board of Eaton Corporation plc (diversified power management, 2009-2019) and a member of the Board of AGL Resources, Inc. (holding company, 2002-2016). Mr. Johnson previously served as Vice Chairman (2015-2018) of the Independent Trustees of certain Fidelity® funds. Mr. Arthur E. Johnson is not related to Ms. Abigail P. Johnson.
Michael E. Kenneally (1954)
Year of Election or Appointment: 2009
Trustee
Vice Chairman of the Independent Trustees
Mr. Kenneally also serves as Trustee of other Fidelity® funds. Prior to his retirement, Mr. Kenneally served as Chairman and Global Chief Executive Officer of Credit Suisse Asset Management and Executive Vice President and Chief Investment Officer of Bank of America Corporation. Earlier roles at Bank of America included Director of Research, Senior Portfolio Manager for various institutional equity accounts and mutual funds and Portfolio Manager for a number of institutional fixed-income clients. Mr. Kenneally began his career as a Research Analyst in 1983 and was awarded the Chartered Financial Analyst (CFA) designation in 1991.
Marie L. Knowles (1946)
Year of Election or Appointment: 2001
Trustee
Ms. Knowles also serves as Trustee of other Fidelity® funds. Prior to her retirement, Ms. Knowles held several positions at Atlantic Richfield Company (diversified energy), including Executive Vice President and Chief Financial Officer (1996-2000), Senior Vice President (1993-1996) and President of ARCO Transportation Company (pipeline and tanker operations, 1993-1996). Ms. Knowles currently serves as a member of the Board of McKesson Corporation (healthcare service, since 2002), a member of the Board of the Santa Catalina Island Company (real estate, 2009-present), a member of the Investment Company Institute Board of Governors and a member of the Governing Council of the Independent Directors Council (2014-present). Ms. Knowles also serves as a member of the Advisory Board for the School of Engineering of the University of Southern California. Ms. Knowles previously served as Chairman (2015-2018) and Vice Chairman (2012-2015) of the Independent Trustees of certain Fidelity® funds.
Mark A. Murray (1954)
Year of Election or Appointment: 2016
Trustee
Mr. Murray also serves as Trustee of other Fidelity® funds. Previously, Mr. Murray served as Co-Chief Executive Officer (2013-2016), President (2006-2013) and Vice Chairman (2013-2020) of Meijer, Inc. Mr. Murray serves as a member of the Board and Nuclear Review and Public Policy and Responsibility Committees of DTE Energy Company (diversified energy company, 2009-present) and a member of the Board and Audit Committee and Chairman of the Nominating and Corporate Governance Committee of Universal Forest Products, Inc. (manufacturer and distributor of wood and wood-alternative products, 2004-2016). Mr. Murray previously served as a member of the Board of Spectrum Health (not-for-profit health system, 2015-2019). Mr. Murray also serves as a member of the Board of many community and professional organizations. Mr. Murray previously served as a member of the Advisory Board of certain Fidelity® funds (2016).
+ The information includes the Trustee's principal occupation during the last five years and other information relating to the experience, attributes, and skills relevant to the Trustee's qualifications to serve as a Trustee, which led to the conclusion that the Trustee should serve as a Trustee for each fund.
Advisory Board Members and Officers:
Correspondence intended for an officer may be sent to Fidelity Investments, 245 Summer Street, Boston, Massachusetts 02210. Officers appear below in alphabetical order.
Name, Year of Birth; Principal Occupation
Craig S. Brown (1977)
Year of Election or Appointment: 2019
Assistant Treasurer
Mr. Brown also serves as Assistant Treasurer of other funds. Mr. Brown is an employee of Fidelity Investments (2013-present).
John J. Burke III (1964)
Year of Election or Appointment: 2018
Chief Financial Officer
Mr. Burke also serves as Chief Financial Officer of other funds. Mr. Burke serves as Head of Investment Operations for Fidelity Fund and Investment Operations (2018-present) and is an employee of Fidelity Investments (1998-present). Previously Mr. Burke served as head of Asset Management Investment Operations (2012-2018).
David J. Carter (1973)
Year of Election or Appointment: 2020
Assistant Secretary
Mr. Carter also serves as Assistant Secretary of other funds. Mr. Carter serves as Vice President, Associate General Counsel (2010-present) and is an employee of Fidelity Investments (2005-present).
Jonathan Davis (1968)
Year of Election or Appointment: 2010
Assistant Treasurer
Mr. Davis also serves as Assistant Treasurer of other funds. Mr. Davis serves as Assistant Treasurer of FMR Capital, Inc. (2017-present) and is an employee of Fidelity Investments. Previously, Mr. Davis served as Vice President and Associate General Counsel of FMR LLC (diversified financial services company, 2003-2010).
Laura M. Del Prato (1964)
Year of Election or Appointment: 2018
President and Treasurer
Ms. Del Prato also serves as an officer of other funds. Ms. Del Prato is an employee of Fidelity Investments (2017-present). Previously, Ms. Del Prato served as President and Treasurer of The North Carolina Capital Management Trust: Cash Portfolio and Term Portfolio (2018-2020). Prior to joining Fidelity Investments, Ms. Del Prato served as a Managing Director and Treasurer of the JPMorgan Mutual Funds (2014-2017). Prior to JPMorgan, Ms. Del Prato served as a partner at Cohen Fund Audit Services (accounting firm, 2012-2013) and KPMG LLP (accounting firm, 2004-2012).
Colm A. Hogan (1973)
Year of Election or Appointment: 2016
Assistant Treasurer
Mr. Hogan also serves as an officer of other funds. Mr. Hogan serves as Assistant Treasurer of FMR Capital, Inc. (2017-present) and is an employee of Fidelity Investments (2005-present). Previously, Mr. Hogan served as Deputy Treasurer of certain Fidelity® funds (2016-2020) and Assistant Treasurer of certain Fidelity® funds (2016-2018).
Cynthia Lo Bessette (1969)
Year of Election or Appointment: 2019
Secretary and Chief Legal Officer (CLO)
Ms. Lo Bessette also serves as an officer of other funds. Ms. Lo Bessette serves as CLO, Secretary, and Senior Vice President of Fidelity Management & Research Company LLC (investment adviser firm, 2019-present); and CLO of Fidelity Management & Research (Hong Kong) Limited, FMR Investment Management (UK) Limited, and Fidelity Management & Research (Japan) Limited (investment adviser firms, 2019-present). She is a Senior Vice President and Deputy General Counsel of FMR LLC (diversified financial services company, 2019-present), and is an employee of Fidelity Investments. Previously, Ms. Lo Bessette served as CLO, Secretary, and Senior Vice President of FMR Co., Inc. (investment adviser firm, 2019); Secretary of Fidelity SelectCo, LLC and Fidelity Investments Money Management, Inc. (investment adviser firms, 2019). Prior to joining Fidelity Investments, Ms. Lo Bessette was Executive Vice President, General Counsel (2016-2019) and Senior Vice President, Deputy General Counsel (2015-2016) of OppenheimerFunds (investment management company) and Deputy Chief Legal Officer (2013-2015) of Jennison Associates LLC (investment adviser firm).
Chris Maher (1972)
Year of Election or Appointment: 2013
Assistant Treasurer
Mr. Maher also serves as an officer of other funds. Mr. Maher serves as Assistant Treasurer of FMR Capital, Inc. (2017-present), and is an employee of Fidelity Investments (2008-present). Previously, Mr. Maher served as Assistant Treasurer of certain funds (2013-2020); Vice President of Asset Management Compliance (2013), Vice President of the Program Management Group of FMR (investment adviser firm, 2010-2013), and Vice President of Valuation Oversight (2008-2010).
Kenneth B. Robins (1969)
Year of Election or Appointment: 2020
Chief Compliance Officer
Mr. Robins also serves as an officer of other funds. Mr. Robins serves as Compliance Officer of Fidelity Management & Research Company LLC (investment adviser firm, 2016-present) and is an employee of Fidelity Investments (2004-present). Previously, Mr. Robins served as Compliance Officer of FMR Co., Inc. (investment adviser firm, 2016-2019), as Executive Vice President of Fidelity Investments Money Management, Inc. (investment adviser firm, 2013-2016) and served in other fund officer roles.
Brett Segaloff (1972)
Year of Election or Appointment: 2021
Anti-Money Laundering (AML) Officer
Mr. Segaloff also serves as an AML Officer of other funds and other related entities. He is Director, Anti-Money Laundering (2007-present) of FMR LLC (diversified financial services company) and is an employee of Fidelity Investments (1996-present).
Stacie M. Smith (1974)
Year of Election or Appointment: 2013
Assistant Treasurer
Ms. Smith also serves as an officer of other funds. Ms. Smith serves as Assistant Treasurer of FMR Capital, Inc. (2017-present), is an employee of Fidelity Investments (2009-present), and has served in other fund officer roles. Prior to joining Fidelity Investments, Ms. Smith served as Senior Audit Manager of Ernst & Young LLP (accounting firm, 1996-2009). Previously, Ms. Smith served as Assistant Treasurer (2013-2019) and Deputy Treasurer (2013-2016) of certain Fidelity® funds.
Marc L. Spector (1972)
Year of Election or Appointment: 2016
Deputy Treasurer
Mr. Spector also serves as an officer of other funds. Mr. Spector serves as Assistant Treasurer of FMR Capital, Inc. (2017-present) and is an employee of Fidelity Investments (2016-present). Prior to joining Fidelity Investments, Mr. Spector served as Director at the Siegfried Group (accounting firm, 2013-2016), and prior to Siegfried Group as audit senior manager at Deloitte & Touche LLP (accounting firm, 2005-2013).
Jim Wegmann (1979)
Year of Election or Appointment: 2019
Assistant Treasurer
Mr. Wegmann also serves as Assistant Treasurer of other funds. Mr. Wegmann is an employee of Fidelity Investments (2011-present).
Vadim Zlotnikov (1962)
Year of Election or Appointment: 2019
Vice President
Mr. Zlotnikov also serves as Vice President of other funds. Mr. Zlotnikov serves as President of FIAM (Fidelity Institutional Asset Management) and is an employee of Fidelity Investments (2018-present). Previously, Mr. Zlotnikov served as President and Chief Investment Officer of Global Asset Allocation (2018-2020). Prior to joining Fidelity Investments, Mr. Zlotnikov served as Co-Head of Multi-Asset Solutions, Chief Market Strategist, and CIO of Systematic Strategies with AllianceBernstein (investment adviser firm, 2002-2018).
Shareholder Expense Example
As a shareholder, you incur two types of costs: (1) transaction costs, which may include sales charges (loads) on purchase payments or redemption proceeds, as applicable and (2) ongoing costs, which generally include management fees, distribution and/or service (12b-1) fees and other Fund expenses. This Example is intended to help you understand your ongoing costs (in dollars) of investing in a fund and to compare these costs with the ongoing costs of investing in other mutual funds.
The Example is based on an investment of $1,000 invested at the beginning of the period and held for the entire period (July 1, 2020 to December 31, 2020).
Actual Expenses
The first line of the accompanying table provides information about actual account values and actual expenses. You may use the information in this line, together with the amount you invested, to estimate the expenses that you paid over the period. Simply divide your account value by $1,000.00 (for example, an $8,600 account value divided by $1,000.00 = 8.6), then multiply the result by the number in the first line for a class/Fund under the heading entitled "Expenses Paid During Period" to estimate the expenses you paid on your account during this period. If any fund is a shareholder of any underlying mutual funds or exchange-traded funds (ETFs) (the Underlying Funds), such fund indirectly bears its proportional share of the expenses of the Underlying Funds in addition to the direct expenses incurred presented in the table. These fees and expenses are not included in the annualized expense ratio used to calculate the expense estimate in the table below. The estimate of expenses does not include any fees or other expenses of any variable annuity or variable life insurance product. If they were, the estimate of expenses you paid during the period would be higher, and your ending account value would be lower.
Hypothetical Example for Comparison Purposes
The second line of the accompanying table provides information about hypothetical account values and hypothetical expenses based on the actual expense ratio and an assumed rate of return of 5% per year before expenses, which is not the actual return. The hypothetical account values and expenses may not be used to estimate the actual ending account balance or expenses you paid for the period. You may use this information to compare the ongoing costs of investing in the Fund and other funds. To do so, compare this 5% hypothetical example with the 5% hypothetical examples that appear in the shareholder reports of the other funds. If any fund is a shareholder of any Underlying Funds, such fund indirectly bears its proportional share of the expenses of the Underlying Funds in addition to the direct expenses as presented in the table. These fees and expenses are not included in the annualized expense ratio used to calculate the expense estimate in the table below. The estimate of expenses does not include any fees or other expenses of any variable annuity or variable life insurance product. If they were, the estimate of expenses you paid during the period would be higher, and your ending account value would be lower.
Please note that the expenses shown in the table are meant to highlight your ongoing costs only and do not reflect any transaction costs. Therefore, the second line of the table is useful in comparing ongoing costs only, and will not help you determine the relative total costs of owning different funds.
| | Annualized Expense Ratio-A | Beginning
Account Value
July 1, 2020 | Ending
Account Value
December 31, 2020 | Expenses Paid
During Period-B
July 1, 2020
to December 31, 2020 |
| VIP Freedom Income Portfolio | | | | |
| Initial Class | - %-C | | | |
| Actual | | $1,000.00 | $1,073.80 | $--D |
| Hypothetical-E | | $1,000.00 | $1,025.14 | $--D |
| Service Class | .10% | | | |
| Actual | | $1,000.00 | $1,073.80 | $.52 |
| Hypothetical-E | | $1,000.00 | $1,024.63 | $.51 |
| Service Class 2 | .25% | | | |
| Actual | | $1,000.00 | $1,072.90 | $1.30 |
| Hypothetical-E | | $1,000.00 | $1,023.88 | $1.27 |
| VIP Freedom 2005 Portfolio | | | | |
| Initial Class | - %-C | | | |
| Actual | | $1,000.00 | $1,086.30 | $--D |
| Hypothetical-E | | $1,000.00 | $1,025.14 | $--D |
| Service Class | .10% | | | |
| Actual | | $1,000.00 | $1,085.60 | $.52 |
| Hypothetical-E | | $1,000.00 | $1,024.63 | $.51 |
| Service Class 2 | .25% | | | |
| Actual | | $1,000.00 | $1,084.90 | $1.31 |
| Hypothetical-E | | $1,000.00 | $1,023.88 | $1.27 |
| VIP Freedom 2010 Portfolio | | | | |
| Initial Class | - %-C | | | |
| Actual | | $1,000.00 | $1,107.60 | $--D |
| Hypothetical-E | | $1,000.00 | $1,025.14 | $--D |
| Service Class | .10% | | | |
| Actual | | $1,000.00 | $1,106.70 | $.53 |
| Hypothetical-E | | $1,000.00 | $1,024.63 | $.51 |
| Service Class 2 | .25% | | | |
| Actual | | $1,000.00 | $1,106.10 | $1.32 |
| Hypothetical-E | | $1,000.00 | $1,023.88 | $1.27 |
| VIP Freedom 2015 Portfolio | | | | |
| Initial Class | - %-C | | | |
| Actual | | $1,000.00 | $1,128.80 | $--D |
| Hypothetical-E | | $1,000.00 | $1,025.14 | $--D |
| Service Class | .10% | | | |
| Actual | | $1,000.00 | $1,128.20 | $.53 |
| Hypothetical-E | | $1,000.00 | $1,024.63 | $.51 |
| Service Class 2 | .25% | | | |
| Actual | | $1,000.00 | $1,127.80 | $1.34 |
| Hypothetical-E | | $1,000.00 | $1,023.88 | $1.27 |
| VIP Freedom 2020 Portfolio | | | | |
| Initial Class | - %-C | | | |
| Actual | | $1,000.00 | $1,150.00 | $--D |
| Hypothetical-E | | $1,000.00 | $1,025.14 | $--D |
| Service Class | .10% | | | |
| Actual | | $1,000.00 | $1,148.70 | $.54 |
| Hypothetical-E | | $1,000.00 | $1,024.63 | $.51 |
| Service Class 2 | .25% | | | |
| Actual | | $1,000.00 | $1,147.60 | $1.35 |
| Hypothetical-E | | $1,000.00 | $1,023.88 | $1.27 |
| VIP Freedom 2025 Portfolio | | | | |
| Initial Class | - %-C | | | |
| Actual | | $1,000.00 | $1,165.20 | $--D |
| Hypothetical-E | | $1,000.00 | $1,025.14 | $--D |
| Service Class | .10% | | | |
| Actual | | $1,000.00 | $1,164.90 | $.54 |
| Hypothetical-E | | $1,000.00 | $1,024.63 | $.51 |
| Service Class 2 | .25% | | | |
| Actual | | $1,000.00 | $1,163.50 | $1.36 |
| Hypothetical-E | | $1,000.00 | $1,023.88 | $1.27 |
| VIP Freedom 2030 Portfolio | | | | |
| Initial Class | - %-C | | | |
| Actual | | $1,000.00 | $1,185.50 | $--D |
| Hypothetical-E | | $1,000.00 | $1,025.14 | $--D |
| Service Class | .10% | | | |
| Actual | | $1,000.00 | $1,185.10 | $.55 |
| Hypothetical-E | | $1,000.00 | $1,024.63 | $.51 |
| Service Class 2 | .25% | | | |
| Actual | | $1,000.00 | $1,184.20 | $1.37 |
| Hypothetical-E | | $1,000.00 | $1,023.88 | $1.27 |
| VIP Freedom 2035 Portfolio | | | | |
| Initial Class | - %-C | | | |
| Actual | | $1,000.00 | $1,220.10 | $--D |
| Hypothetical-E | | $1,000.00 | $1,025.14 | $--D |
| Service Class | .10% | | | |
| Actual | | $1,000.00 | $1,219.30 | $.56 |
| Hypothetical-E | | $1,000.00 | $1,024.63 | $.51 |
| Service Class 2 | .25% | | | |
| Actual | | $1,000.00 | $1,218.10 | $1.39 |
| Hypothetical-E | | $1,000.00 | $1,023.88 | $1.27 |
| VIP Freedom 2040 Portfolio | | | | |
| Initial Class | - %-C | | | |
| Actual | | $1,000.00 | $1,240.60 | $--D |
| Hypothetical-E | | $1,000.00 | $1,025.14 | $--D |
| Service Class | .10% | | | |
| Actual | | $1,000.00 | $1,240.10 | $.56 |
| Hypothetical-E | | $1,000.00 | $1,024.63 | $.51 |
| Service Class 2 | .25% | | | |
| Actual | | $1,000.00 | $1,239.30 | $1.41 |
| Hypothetical-E | | $1,000.00 | $1,023.88 | $1.27 |
| VIP Freedom 2045 Portfolio | | | | |
| Initial Class | - %-C | | | |
| Actual | | $1,000.00 | $1,241.00 | $--D |
| Hypothetical-E | | $1,000.00 | $1,025.14 | $--D |
| Service Class | .10% | | | |
| Actual | | $1,000.00 | $1,240.20 | $.56 |
| Hypothetical-E | | $1,000.00 | $1,024.63 | $.51 |
| Service Class 2 | .25% | | | |
| Actual | | $1,000.00 | $1,239.50 | $1.41 |
| Hypothetical-E | | $1,000.00 | $1,023.88 | $1.27 |
| VIP Freedom 2050 Portfolio | | | | |
| Initial Class | - %-C | | | |
| Actual | | $1,000.00 | $1,240.80 | $--D |
| Hypothetical-E | | $1,000.00 | $1,025.14 | $--D |
| Service Class | .10% | | | |
| Actual | | $1,000.00 | $1,239.90 | $.56 |
| Hypothetical-E | | $1,000.00 | $1,024.63 | $.51 |
| Service Class 2 | .25% | | | |
| Actual | | $1,000.00 | $1,239.60 | $1.41 |
| Hypothetical-E | | $1,000.00 | $1,023.88 | $1.27 |
| VIP Freedom 2055 Portfolio | | | | |
| Initial Class | - %-C | | | |
| Actual | | $1,000.00 | $1,241.00 | $--D |
| Hypothetical-E | | $1,000.00 | $1,025.14 | $--D |
| Service Class | .10% | | | |
| Actual | | $1,000.00 | $1,240.40 | $.56 |
| Hypothetical-E | | $1,000.00 | $1,024.63 | $.51 |
| Service Class 2 | .25% | | | |
| Actual | | $1,000.00 | $1,239.50 | $1.41 |
| Hypothetical-E | | $1,000.00 | $1,023.88 | $1.27 |
| VIP Freedom 2060 Portfolio | | | | |
| Initial Class | - %-C | | | |
| Actual | | $1,000.00 | $1,240.80 | $--D |
| Hypothetical-E | | $1,000.00 | $1,025.14 | $--D |
| Service Class | .10% | | | |
| Actual | | $1,000.00 | $1,241.10 | $.56 |
| Hypothetical-E | | $1,000.00 | $1,024.63 | $.51 |
| Service Class 2 | .25% | | | |
| Actual | | $1,000.00 | $1,239.30 | $1.41 |
| Hypothetical-E | | $1,000.00 | $1,023.88 | $1.27 |
| VIP Freedom 2065 Portfolio | | | | |
| Initial Class | - %-C | | | |
| Actual | | $1,000.00 | $1,241.70 | $--D |
| Hypothetical-E | | $1,000.00 | $1,025.14 | $--D |
| Service Class | .10% | | | |
| Actual | | $1,000.00 | $1,239.70 | $.56 |
| Hypothetical-E | | $1,000.00 | $1,024.63 | $.51 |
| Service Class 2 | .25% | | | |
| Actual | | $1,000.00 | $1,239.50 | $1.41 |
| Hypothetical-E | | $1,000.00 | $1,023.88 | $1.27 |
A Annualized expense ratio reflects expenses net of applicable fee waivers.
B Expenses are equal to the annualized expense ratio, multiplied by the average account value over the period, multiplied by 184/ 366 (to reflect the one-half year period). The fees and expenses of any Underlying Funds are not included in each annualized expense ratio.
C Amount represents less than .005%.
D Amount represents less than $.005.
E 5% return per year before expenses
Distributions (Unaudited)
The Board of Trustees of each fund voted to pay to shareholders of record at the opening of business on record date, the following distributions per share derived from capital gains realized from sales of portfolio securities and dividends derived from net investment income:
| | Pay Date | Record Date | Dividends | Capital Gains |
| VIP Freedom Income Portfolio | | | | |
| Initial Class | 02/05/2021 | 02/05/2021 | $0.001 | $0.161 |
| Service Class | 02/05/2021 | 02/05/2021 | $0.001 | $0.161 |
| Service Class 2 | 02/05/2021 | 02/05/2021 | $0.001 | $0.161 |
| VIP Freedom 2005 Portfolio | | | | |
| Initial Class | 02/05/2021 | 02/05/2021 | $0.002 | $0.238 |
| Service Class | 02/05/2021 | 02/05/2021 | $0.002 | $0.238 |
| Service Class 2 | 02/05/2021 | 02/05/2021 | $0.002 | $0.238 |
| VIP Freedom 2010 Portfolio | | | | |
| Initial Class | 02/05/2021 | 02/05/2021 | $0.001 | $0.367 |
| Service Class | 02/05/2021 | 02/05/2021 | $0.001 | $0.367 |
| Service Class 2 | 02/05/2021 | 02/05/2021 | $0.001 | $0.367 |
| VIP Freedom 2015 Portfolio | | | | |
| Initial Class | 02/05/2021 | 02/05/2021 | $0.001 | $0.447 |
| Service Class | 02/05/2021 | 02/05/2021 | $0.001 | $0.447 |
| Service Class 2 | 02/05/2021 | 02/05/2021 | $0.001 | $0.447 |
| VIP Freedom 2020 Portfolio | | | | |
| Initial Class | 02/05/2021 | 02/05/2021 | $0.002 | $0.635 |
| Service Class | 02/05/2021 | 02/05/2021 | $0.002 | $0.635 |
| Service Class 2 | 02/05/2021 | 02/05/2021 | $0.002 | $0.635 |
| VIP Freedom 2025 Portfolio | | | | |
| Initial Class | 02/05/2021 | 02/05/2021 | $0.001 | $0.390 |
| Service Class | 02/05/2021 | 02/05/2021 | $0.001 | $0.390 |
| Service Class 2 | 02/05/2021 | 02/05/2021 | $0.001 | $0.390 |
| VIP Freedom 2030 Portfolio | | | | |
| Initial Class | 02/05/2021 | 02/05/2021 | $0.001 | $0.497 |
| Service Class | 02/05/2021 | 02/05/2021 | $0.001 | $0.497 |
| Service Class 2 | 02/05/2021 | 02/05/2021 | $0.001 | $0.497 |
| VIP Freedom 2035 Portfolio | | | | |
| Initial Class | 02/05/2021 | 02/05/2021 | $0.002 | $0.678 |
| Service Class | 02/05/2021 | 02/05/2021 | $0.002 | $0.678 |
| Service Class 2 | 02/05/2021 | 02/05/2021 | $0.002 | $0.678 |
| VIP Freedom 2040 Portfolio | | | | |
| Initial Class | 02/05/2021 | 02/05/2021 | $0.002 | $0.737 |
| Service Class | 02/05/2021 | 02/05/2021 | $0.002 | $0.737 |
| Service Class 2 | 02/05/2021 | 02/05/2021 | $0.002 | $0.737 |
| VIP Freedom 2045 Portfolio | | | | |
| Initial Class | 02/05/2021 | 02/05/2021 | $0.002 | $0.636 |
| Service Class | 02/05/2021 | 02/05/2021 | $0.002 | $0.636 |
| Service Class 2 | 02/05/2021 | 02/05/2021 | $0.002 | $0.636 |
| VIP Freedom 2050 Portfolio | | | | |
| Initial Class | 02/05/2021 | 02/05/2021 | $0.001 | $0.559 |
| Service Class | 02/05/2021 | 02/05/2021 | $0.001 | $0.559 |
| Service Class 2 | 02/05/2021 | 02/05/2021 | $0.001 | $0.559 |
| VIP Freedom 2055 Portfolio | | | | |
| Initial Class | 02/05/2021 | 02/05/2021 | $0.000 | $0.043 |
| Service Class | 02/05/2021 | 02/05/2021 | $0.000 | $0.043 |
| Service Class 2 | 02/05/2021 | 02/05/2021 | $0.000 | $0.043 |
| VIP Freedom 2060 Portfolio | | | | |
| Initial Class | 02/05/2021 | 02/05/2021 | $0.000 | $0.010 |
| Service Class | 02/05/2021 | 02/05/2021 | $0.000 | $0.010 |
| Service Class 2 | 02/05/2021 | 02/05/2021 | $0.000 | $0.010 |
| VIP Freedom 2065 Portfolio | | | | |
| Initial Class | 02/05/2021 | 02/05/2021 | $0.000 | $0.067 |
| Service Class | 02/05/2021 | 02/05/2021 | $0.000 | $0.067 |
| Service Class 2 | 02/05/2021 | 02/05/2021 | $0.000 | $0.067 |
|
The funds hereby designate as capital gain dividend the amounts noted below for the taxable year ended December, 31 2020, or, if subsequently determined to be different, the net capital gain of such year.
| VIP Freedom Income Portfolio | $878,119 |
| VIP Freedom 2005 Portfolio | $246,587 |
| VIP Freedom 2010 Portfolio | $8,900,239 |
| VIP Freedom 2015 Portfolio | $2,923,170 |
| VIP Freedom 2020 Portfolio | $31,617,499 |
| VIP Freedom 2025 Portfolio | $7,019,336 |
| VIP Freedom 2030 Portfolio | $15,686,305 |
| VIP Freedom 2035 Portfolio | $3,890,756 |
| VIP Freedom 2040 Portfolio | $4,286,026 |
| VIP Freedom 2045 Portfolio | $2,012,072 |
| VIP Freedom 2050 Portfolio | $1,652,313 |
| VIP Freedom 2055 Portfolio | $48,303 |
| VIP Freedom 2060 Portfolio | $101,132 |
| VIP Freedom 2065 Portfolio | $43,010 |
|
A percentage of the dividends distributed during the fiscal year for the following funds were derived from interest on U.S. Government securities which is generally exempt from state income tax:
| VIP Freedom Income Portfolio | |
| Initial Class | 12.95% |
| Service Class | 12.95% |
| Service Class 2 | 12.95% |
| VIP Freedom 2005 Portfolio | |
| Initial Class | 10.87% |
| Service Class | 10.87% |
| Service Class 2 | 10.87% |
| VIP Freedom 2010 Portfolio | |
| Initial Class | 8.74% |
| Service Class | 8.74% |
| Service Class 2 | 8.74% |
| VIP Freedom 2015 Portfolio | |
| Initial Class | 6.81% |
| Service Class | 6.81% |
| Service Class 2 | 6.81% |
| VIP Freedom 2020 Portfolio | |
| Initial Class | 6.01% |
| Service Class | 6.01% |
| Service Class 2 | 6.01% |
| VIP Freedom 2025 Portfolio | |
| Initial Class | 5.37% |
| Service Class | 5.37% |
| Service Class 2 | 5.37% |
| VIP Freedom 2030 Portfolio | |
| Initial Class | 4.53% |
| Service Class | 4.53% |
| Service Class 2 | 4.53% |
| VIP Freedom 2035 Portfolio | |
| Initial Class | 2.80% |
| Service Class | 2.80% |
| Service Class 2 | 2.80% |
| VIP Freedom 2040 Portfolio | |
| Initial Class | 2.31% |
| Service Class | 2.31% |
| Service Class 2 | 2.31% |
| VIP Freedom 2045 Portfolio | |
| Initial Class | 2.33% |
| Service Class | 2.33% |
| Service Class 2 | 2.33% |
| VIP Freedom 2050 Portfolio | |
| Initial Class | 2.34% |
| Service Class | 2.34% |
| Service Class 2 | 2.34% |
| VIP Freedom 2055 Portfolio | |
| Initial Class | 2.48% |
| Service Class | 2.48% |
| Service Class 2 | 2.48% |
| VIP Freedom 2060 Portfolio | |
| Initial Class | 2.30% |
| Service Class | 2.30% |
| Service Class 2 | 2.30% |
| VIP Freedom 2065 Portfolio | |
| Initial Class | 2.10% |
| Service Class | 2.10% |
| Service Class 2 | 2.10% |
|
A percentage of the dividends distributed during the fiscal year for the following funds qualify for the dividends–received deduction for corporate shareholders:
| | Initial Class | Service Class | Service Class 2 |
| VIP Freedom Income Portfolio | | | |
| February, 2020 | 0% | 0% | 0% |
| December, 2020 | 5% | 5% | 6% |
| VIP Freedom 2005 Portfolio | | | |
| February, 2020 | 0% | 0% | 0% |
| December, 2020 | 6% | 7% | 7% |
| VIP Freedom 2010 Portfolio | | | |
| February, 2020 | 0% | 0% | 0% |
| December, 2020 | 10% | 11% | 12% |
| VIP Freedom 2015 Portfolio | | | |
| February, 2020 | 1% | 1% | 1% |
| December, 2020 | 13% | 13% | 15% |
| VIP Freedom 2020 Portfolio | | | |
| February, 2020 | 1% | 1% | 1% |
| December, 2020 | 18% | 19% | 21% |
| VIP Freedom 2025 Portfolio | | | |
| February, 2020 | 0% | 0% | 0% |
| December, 2020 | 19% | 20% | 22% |
| VIP Freedom 2030 Portfolio | | | |
| February, 2020 | 2% | 2% | 3% |
| December, 2020 | 24% | 25% | 28% |
| VIP Freedom 2035 Portfolio | | | |
| February, 2020 | 2% | 2% | 2% |
| December, 2020 | 28% | 30% | 33% |
| VIP Freedom 2040 Portfolio | | | |
| February, 2020 | 3% | 3% | 4% |
| December, 2020 | 34% | 36% | 39% |
| VIP Freedom 2045 Portfolio | | | |
| February, 2020 | 2% | 2% | 2% |
| December, 2020 | 32% | 34% | 37% |
| VIP Freedom 2050 Portfolio | | | |
| February, 2020 | 3% | 4% | 6% |
| December, 2020 | 32% | 34% | 37% |
| VIP Freedom 2055 Portfolio | | | |
| February, 2020 | 3% | 3% | 3% |
| December, 2020 | 33% | 34% | 37% |
| VIP Freedom 2060 Portfolio | | | |
| February, 2020 | 2% | 2% | 2% |
| December, 2020 | 29% | 30% | 32% |
| VIP Freedom 2065 Portfolio | | | |
| February, 2020 | 0% | 0% | 0% |
| December, 2020 | 32% | 33% | 36% |
|
The amounts per share which represent income derived from sources within, and taxes paid to, foreign countries or possessions of the United States are as follows:
| | Pay Date | Income | Taxes |
| VIP Freedom Income Portfolio | | | |
| Initial Class | 12/16/2020 | $0.0202 | $0.0025 |
| Service Class | 12/16/2020 | $0.0190 | $0.0025 |
| Service Class 2 | 12/16/2020 | $0.0174 | $0.0025 |
| VIP Freedom 2005 Portfolio | | | |
| Initial Class | 12/16/2020 | $0.0223 | $0.0030 |
| Service Class | 12/16/2020 | $0.0211 | $0.0030 |
| Service Class 2 | 12/16/2020 | $0.0191 | $0.0030 |
| VIP Freedom 2010 Portfolio | | | |
| Initial Class | 12/16/2020 | $0.0316 | $0.0038 |
| Service Class | 12/16/2020 | $0.0297 | $0.0038 |
| Service Class 2 | 12/16/2020 | $0.0272 | $0.0038 |
| VIP Freedom 2015 Portfolio | | | |
| Initial Class | 12/16/2020 | $0.0339 | $0.0045 |
| Service Class | 12/16/2020 | $0.0323 | $0.0045 |
| Service Class 2 | 12/16/2020 | $0.0293 | $0.0045 |
| VIP Freedom 2020 Portfolio | | | |
| Initial Class | 12/16/2020 | $0.0431 | $0.0054 |
| Service Class | 12/16/2020 | $0.0404 | $0.0054 |
| Service Class 2 | 12/16/2020 | $0.0365 | $0.0054 |
| VIP Freedom 2025 Portfolio | | | |
| Initial Class | 12/16/2020 | $0.0483 | $0.0065 |
| Service Class | 12/16/2020 | $0.0459 | $0.0065 |
| Service Class 2 | 12/16/2020 | $0.0414 | $0.0065 |
| VIP Freedom 2030 Portfolio | | | |
| Initial Class | 12/16/2020 | $0.0536 | $0.0073 |
| Service Class | 12/16/2020 | $0.0509 | $0.0073 |
| Service Class 2 | 12/16/2020 | $0.0459 | $0.0073 |
| VIP Freedom 2035 Portfolio | | | |
| Initial Class | 12/16/2020 | $0.1017 | $0.0139 |
| Service Class | 12/16/2020 | $0.0969 | $0.0139 |
| Service Class 2 | 12/16/2020 | $0.0880 | $0.0139 |
| VIP Freedom 2040 Portfolio | | | |
| Initial Class | 12/16/2020 | $0.1030 | $0.0146 |
| Service Class | 12/16/2020 | $0.0974 | $0.0146 |
| Service Class 2 | 12/16/2020 | $0.0888 | $0.0146 |
| VIP Freedom 2045 Portfolio | | | |
| Initial Class | 12/16/2020 | $0.1083 | $0.0147 |
| Service Class | 12/16/2020 | $0.1034 | $0.0147 |
| Service Class 2 | 12/16/2020 | $0.0944 | $0.0147 |
| VIP Freedom 2050 Portfolio | | | |
| Initial Class | 12/16/2020 | $0.0920 | $0.0129 |
| Service Class | 12/16/2020 | $0.0871 | $0.0129 |
| Service Class 2 | 12/16/2020 | $0.0806 | $0.0129 |
| VIP Freedom 2055 Portfolio | | | |
| Initial Class | 12/30/2020 | $0.0468 | $0.0066 |
| Service Class | 12/30/2020 | $0.0445 | $0.0066 |
| Service Class 2 | 12/30/2020 | $0.0413 | $0.0066 |
| VIP Freedom 2060 Portfolio | | | |
| Initial Class | 12/30/2020 | $0.0478 | $0.0069 |
| Service Class | 12/30/2020 | $0.0457 | $0.0069 |
| Service Class 2 | 12/30/2020 | $0.0432 | $0.0069 |
| VIP Freedom 2065 Portfolio | | | |
| Initial Class | 12/30/2020 | $0.0513 | $0.0072 |
| Service Class | 12/30/2020 | $0.0485 | $0.0072 |
| Service Class 2 | 12/30/2020 | $0.0451 | $0.0072 |
|
Board Approval of Investment Advisory Contracts and Management Fees
VIP Freedom Funds
Each year, the Board of Trustees, including the Independent Trustees (together, the Board), votes on the renewal of the management contract with Fidelity Management & Research Company LLC (FMR) for each fund (the Advisory Contract). The Board, assisted by the advice of fund counsel and Independent Trustees' counsel, requests and considers a broad range of information relevant to the renewal of the Advisory Contracts throughout the year.
The Board meets regularly and, at each of its meetings, covers an extensive agenda of topics and materials and considers factors that are relevant to its annual consideration of the renewal of each fund's Advisory Contract, including the services and support provided to each fund and its shareholders. The Board has established four standing committees (Committees) — Operations, Audit, Fair Valuation, and Governance and Nominating — each composed of and chaired by Independent Trustees with varying backgrounds, to which the Board has assigned specific subject matter responsibilities in order to enhance effective decision-making by the Board. The Operations Committee, of which all of the Independent Trustees are members, meets regularly throughout the year and considers, among other matters, information specifically related to the annual consideration of the renewal of each fund's Advisory Contract. The Board, acting directly and through its Committees, requests and receives information concerning the annual consideration of the renewal of each fund's Advisory Contract. The Board also meets as needed to review matters specifically related to the Board's annual consideration of the renewal of the Advisory Contracts. Members of the Board may also meet with trustees of other Fidelity funds through joint ad hoc committees to discuss certain matters relevant to all of the Fidelity funds.
At its September 2020 meeting, the Board unanimously determined to renew each fund's Advisory Contract. In reaching its determination, the Board considered all factors it believed relevant and reached a determination, with the assistance of fund counsel and Independent Trustees' counsel and through the exercise of its business judgment, that the renewal of the Advisory Contract was in the best interests of each fund and its shareholders and that the fact that no fees are payable under the Advisory Contracts was fair and reasonable. The Board's decision to renew the Advisory Contracts was not based on any single factor, but rather was based on a comprehensive consideration of all the information provided to the Board at its meetings throughout the year. In reaching its determination, the Board was aware that shareholders of each fund have a broad range of investment choices available to them, including a wide choice among funds offered by Fidelity's competitors, and that each fund's shareholders, who have the opportunity to review and weigh the disclosure provided by the fund in its prospectus and other public disclosures, have chosen to invest in that fund, which is part of the Fidelity family of funds.
Nature, Extent, and Quality of Services Provided. The Board considered Fidelity's staffing as it relates to the funds, including the backgrounds of investment personnel of FMR, and also considered the funds' investment objectives, strategies, and related investment philosophies. The Independent Trustees also had discussions with senior management of Fidelity's investment operations and investment groups with responsibility for the underlying Fidelity funds in which each fund invests. The Board considered the structure of the investment personnel compensation program and whether this structure provides appropriate incentives to act in the best interests of each fund. Additionally, the Board considered the portfolio managers' investments, if any, in the funds that they manage.
Resources Dedicated to Investment Management and Support Services. The Board reviewed the general qualifications and capabilities of Fidelity's investment staff, including its size, education, experience, and resources, as well as Fidelity's approach to recruiting, managing, and compensating investment personnel. The Board noted that Fidelity has continued to increase the resources devoted to non-U.S. offices, including expansion of Fidelity's global investment organization. The Board also noted that Fidelity's analysts have extensive resources, tools and capabilities that allow them to conduct sophisticated quantitative and fundamental analysis, as well as credit analysis of issuers, counterparties and guarantors. Further, the Board considered that Fidelity's investment professionals have sufficient access to global information and data so as to provide competitive investment results over time, and that those professionals also have access to sophisticated tools that permit them to assess portfolio construction and risk and performance attribution characteristics continuously, as well as to transmit new information and research conclusions rapidly around the world. Additionally, in its deliberations, the Board considered Fidelity's risk management, compliance, and technology and operations capabilities and resources, which are integral parts of the investment management process. The Board also considered Fidelity's investments in business continuity planning, and its success in continuously providing services to the funds notwithstanding the severe disruptions caused by the COVID-19 pandemic.
Shareholder and Administrative Services. The Board considered (i) the nature, extent, quality, and cost of advisory, administrative, and shareholder services performed by Fidelity under the Advisory Contract and under separate agreements covering transfer agency, and pricing and bookkeeping services for each fund; (ii) the nature and extent of the supervision of third party service providers, principally custodians, subcustodians, and pricing vendors; and (iii) the resources devoted to, and the record of compliance with, each fund's compliance policies and procedures.
The Board noted that the growth of fund assets over time across the complex allows Fidelity to reinvest in the development of services designed to enhance the value and convenience of the Fidelity funds as investment vehicles. These services include 24-hour access to account information and market information over the Internet and through telephone representatives, investor education materials and asset allocation tools, and the expanded availability of Fidelity Investor Centers.
Investment in a Large Fund Family. The Board considered the benefits to shareholders of investing in a Fidelity fund, including the benefits of investing in a fund that is part of a large family of funds offering a variety of investment disciplines and providing a large variety of mutual fund investor services. The Board noted that Fidelity had taken, or had made recommendations that resulted in the Fidelity funds taking, a number of actions over the previous year that benefited particular funds, including: (i) continuing to dedicate additional resources to Fidelity's investment research process, which includes meetings with management of issuers of securities in which the funds invest, and to the support of the senior management team that oversees asset management; (ii) continuing efforts to enhance Fidelity's global research capabilities; (iii) launching new funds and ETFs with innovative structures, strategies and pricing and making other enhancements to meet client needs; (iv) launching new share classes of existing funds; (v) eliminating purchase minimums and broadening eligibility requirements for certain funds and share classes; (vi) reducing management fees and total expenses for certain target date funds or classes and index funds; (vii) lowering expenses for certain funds and classes by implementing or lowering expense caps; (viii) rationalizing product lines and gaining increased efficiencies from fund mergers, liquidations, and share class consolidations; (ix) continuing to develop, acquire and implement systems and technology to improve services to the funds and shareholders, strengthen information security, and increase efficiency; and (x) continuing to implement enhancements to further strengthen Fidelity's product line to increase investors' probability of success in achieving their investment goals, including retirement income goals.
Investment Performance (for each fund except VIP Freedom 2055 Fund, VIP Freedom 2060 Fund, and VIP Freedom 2065 Fund). The Board considered whether each fund has operated in accordance with its investment objective, as well as its record of compliance with its investment restrictions and its performance history.
The Board took into account discussions that occur at Board meetings throughout the year with representatives of the investment adviser about fund investment performance. In this regard the Board noted that as part of regularly scheduled fund reviews and other reports to the Board on fund performance, the Board considers annualized return information for each fund for different time periods, measured against one or more appropriate securities market indices, including a customized blended index that reflects the respective weights of the fund's asset classes (each a benchmark index). In its evaluation of fund investment performance at meetings throughout the year, the Board gave particular attention to information indicating underperformance of certain Fidelity funds for specific time periods and discussed with the investment adviser the reasons for such underperformance.
In addition to reviewing absolute and relative fund performance, the Independent Trustees periodically consider the appropriateness of fund performance metrics in evaluating the results achieved. In general, the Independent Trustees believe that fund performance should be evaluated based on gross performance (before fees and expenses, including acquired fund fees and expenses, but after transaction costs, if any) compared to appropriate benchmark indices, over appropriate time periods that may include full market cycles, taking into account relevant factors including the following: general market conditions; the extent to which particular underlying funds affected performance; and fund cash flows and other factors. The Independent Trustees generally give greater weight to fund performance over longer time periods than over shorter time periods. Depending on the circumstances, the Independent Trustees may be satisfied with a fund's performance notwithstanding that it lags its benchmark index for certain periods.
The Independent Trustees recognize that shareholders evaluate performance on a net basis over their own holding periods, for which one-, three-, and five-year periods are often used as a proxy. For this reason, the performance information reviewed by the Board also included net cumulative calendar year total return information for each fund and an appropriate benchmark index for the most recent one-, three-, and five-year periods. Due to the characteristics of the funds, no peer group performance information was considered by the Board. The Independent Trustees recognize that shareholders who are not investing through a tax-advantaged retirement account also consider tax consequences in evaluating performance.
Investment Performance (for VIP Freedom 2055 Fund, VIP Freedom 2060 Fund, and VIP Freedom 2065 Fund). The Board considered whether each fund has operated in accordance with its investment objective, as well as its record of compliance with its investment restrictions. As the funds recently commenced operations, the Board did not believe that it was appropriate to assign significant weight to their limited investment performance.
Based on its review, the Board concluded that the nature, extent, and quality of services provided to each fund under the Advisory Contracts should continue to benefit the shareholders of each fund.
Competitiveness of Management Fee and Total Expense Ratio. The Board noted that the funds do not pay FMR a management fee for investment advisory services, and that each fund bears indirectly the fees and expenses, including the management fees, paid by the underlying Fidelity funds in which it invests. The Board considered each fund's management fee and total expense ratio compared to "mapped groups" of competitive funds and classes created for the purpose of facilitating the Trustees' competitive analysis of management fees and total expenses. Fidelity creates "mapped groups" by combining similar Lipper investment objective categories that have comparable investment mandates. Combining Lipper investment objective categories aids the Board's management fee and total expense ratio comparisons by broadening the competitive group used for comparison.
Management Fee. The Board considered two proprietary management fee comparisons for the 12-month (or shorter) periods shown in basis points (BP) in the charts below. The group of Lipper funds used by the Board for management fee comparisons is referred to below as the "Total Mapped Group." The Total Mapped Group comparison focuses on a fund's standing in terms of gross management fees before expense reimbursements or caps relative to the total universe of funds with comparable investment mandates, regardless of whether their management fee structures also are comparable. Funds with comparable investment mandates offer exposure to similar types of securities. Funds with comparable management fee structures have similar management fee contractual arrangements (
e.g., flat rate charged for advisory services, all-inclusive fee rate,
etc.). "TMG %" represents the percentage of funds in the Total Mapped Group that had management fees that were lower than a fund's. For example, a hypothetical TMG % of 20% would mean that 80% of the funds in the Total Mapped Group had higher, and 20% had lower, management fees than a fund. The funds' actual TMG %s and the number of funds in the Total Mapped Group are in the charts below. The "Asset-Sized Peer Group" (ASPG) comparison focuses on a fund's standing relative to a subset of non-Fidelity funds within the Total Mapped Group that are similar in size and management fee structure. For example, if a fund is in the first quartile of the ASPG, the fund's management fee ranks in the least expensive or lowest 25% of funds in the ASPG. The ASPG represents at least 15% of the funds in the Total Mapped Group with comparable asset size and management fee structures, subject to a minimum of 50 funds (or all funds in the Total Mapped Group if fewer than 50). Additional information, such as the ASPG quartile in which a fund's management fee rate ranked, is also included in the charts and was considered by the Board.
VIP Freedom 2005 Portfolio
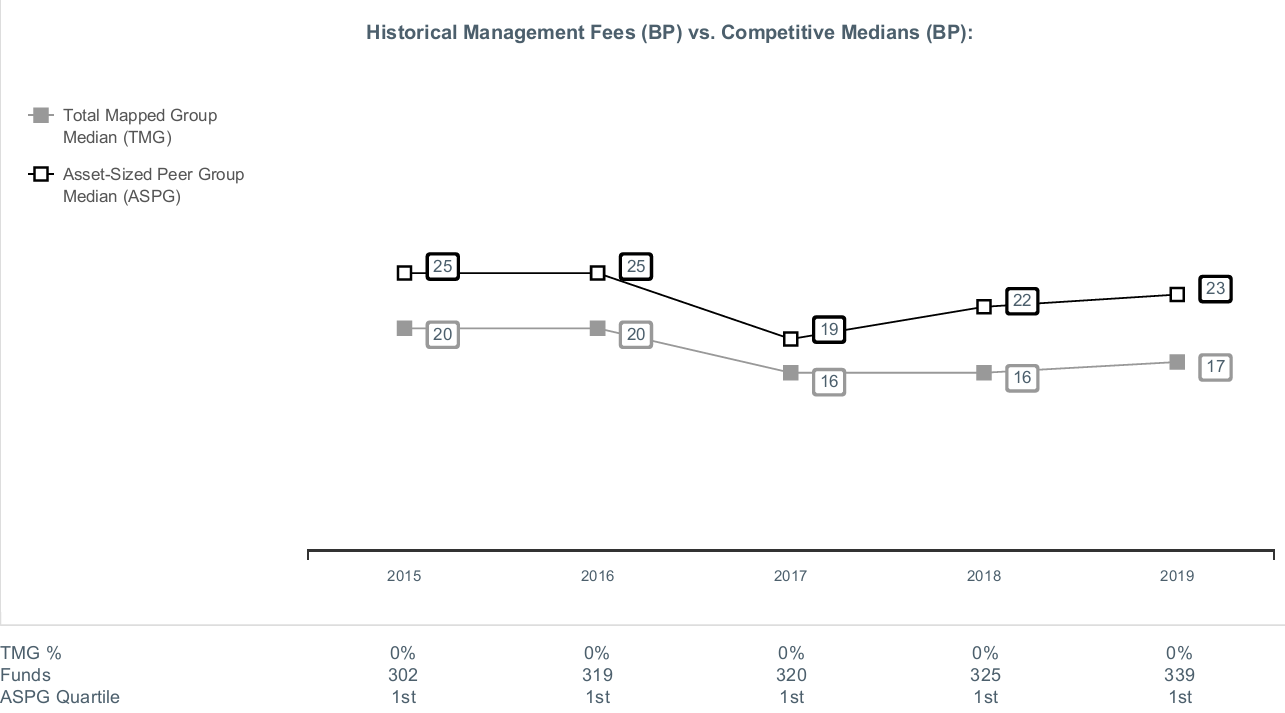
VIP Freedom 2010 Portfolio

VIP Freedom 2015 Portfolio
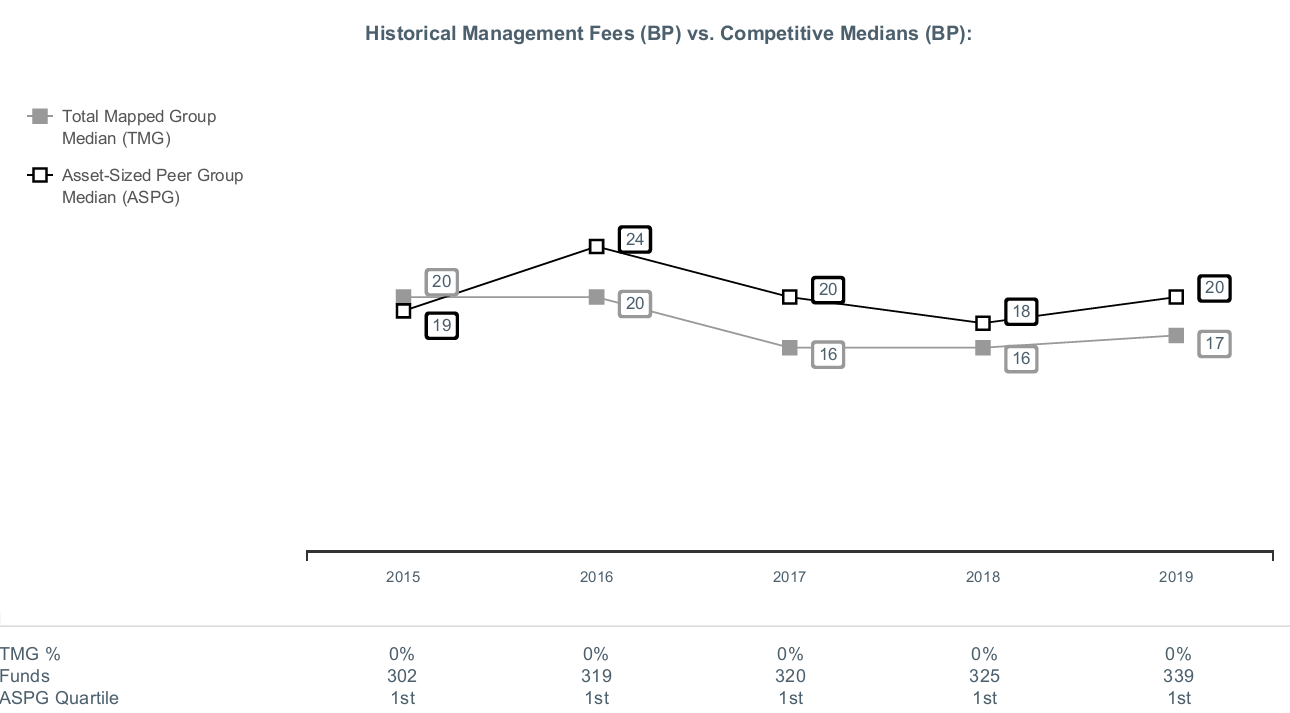
VIP Freedom 2020 Portfolio

VIP Freedom 2025 Portfolio

VIP Freedom 2030 Portfolio
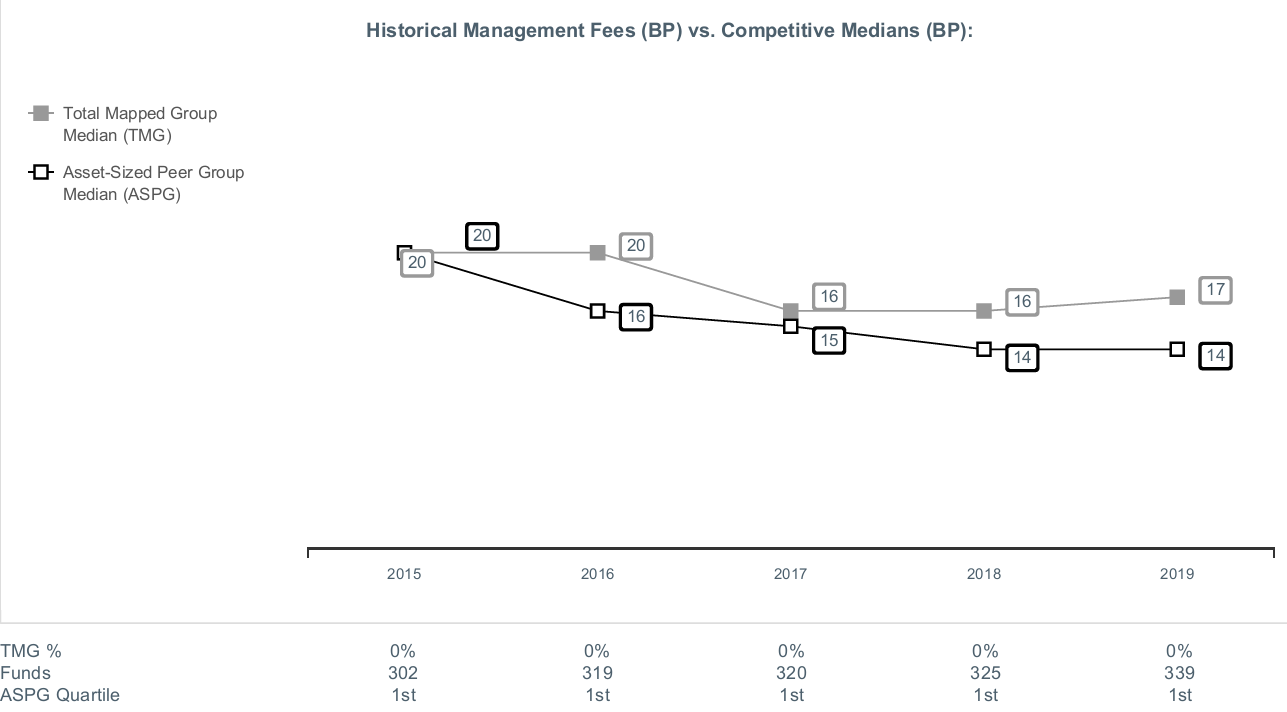
VIP Freedom 2035 Portfolio

VIP Freedom 2040 Portfolio
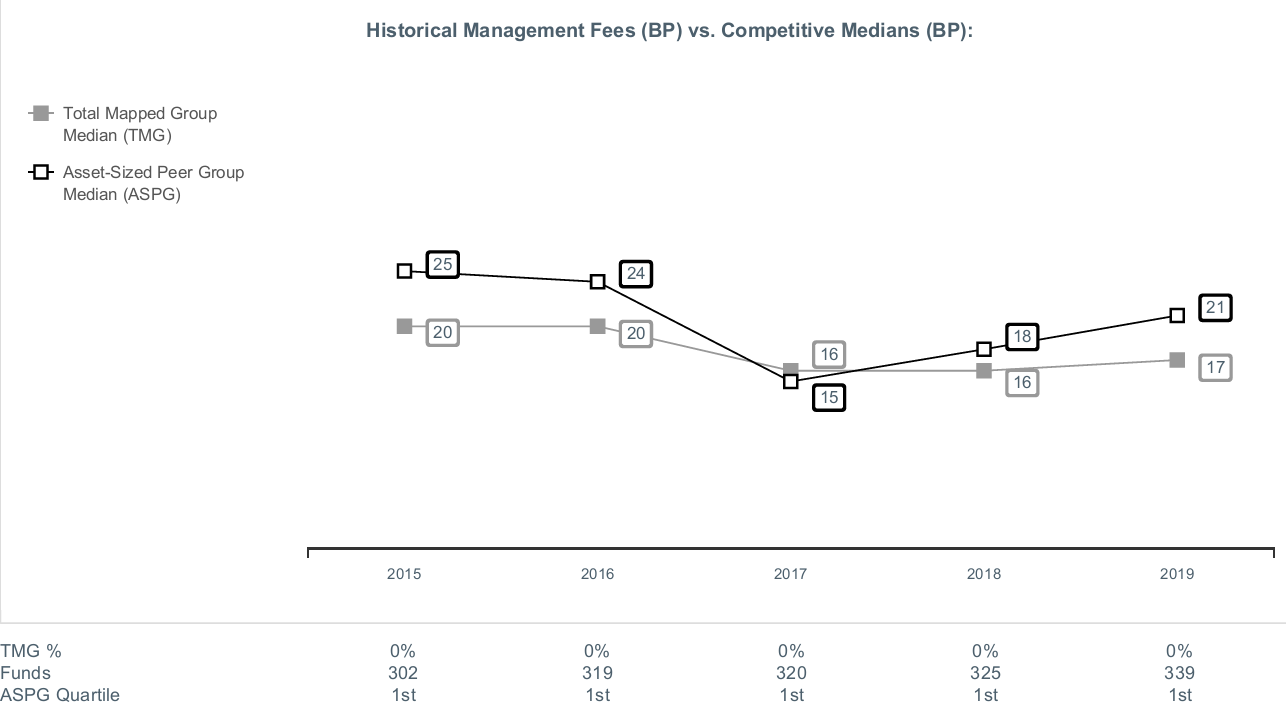
VIP Freedom 2045 Portfolio
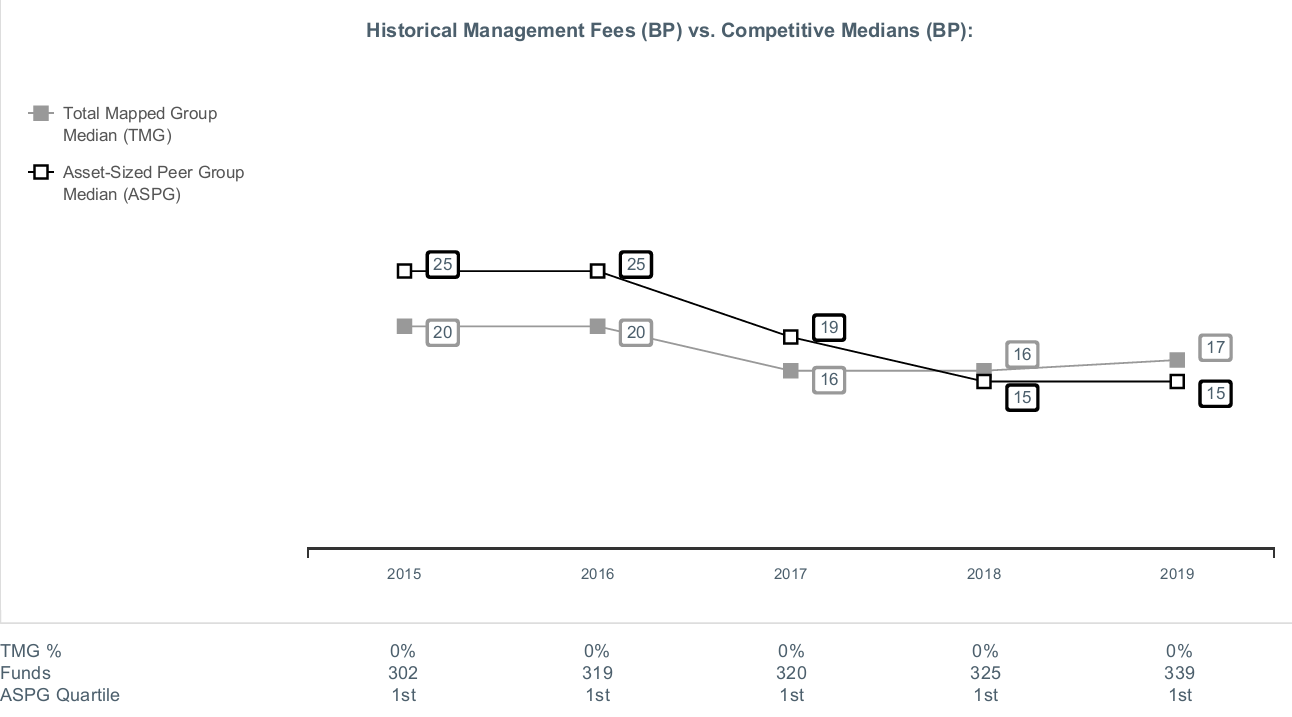
VIP Freedom 2050 Portfolio

VIP Freedom 2055 Portfolio

VIP Freedom 2060 Portfolio
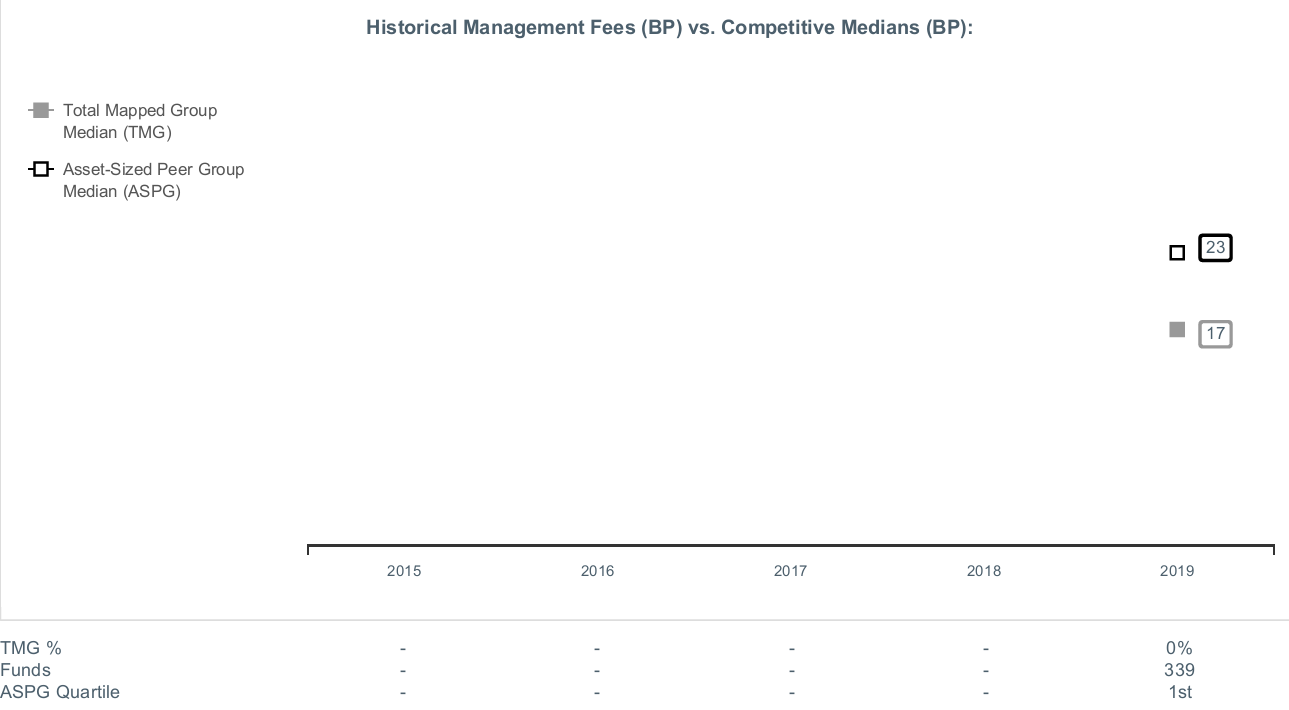
VIP Freedom 2065 Portfolio

VIP Freedom Income Portfolio
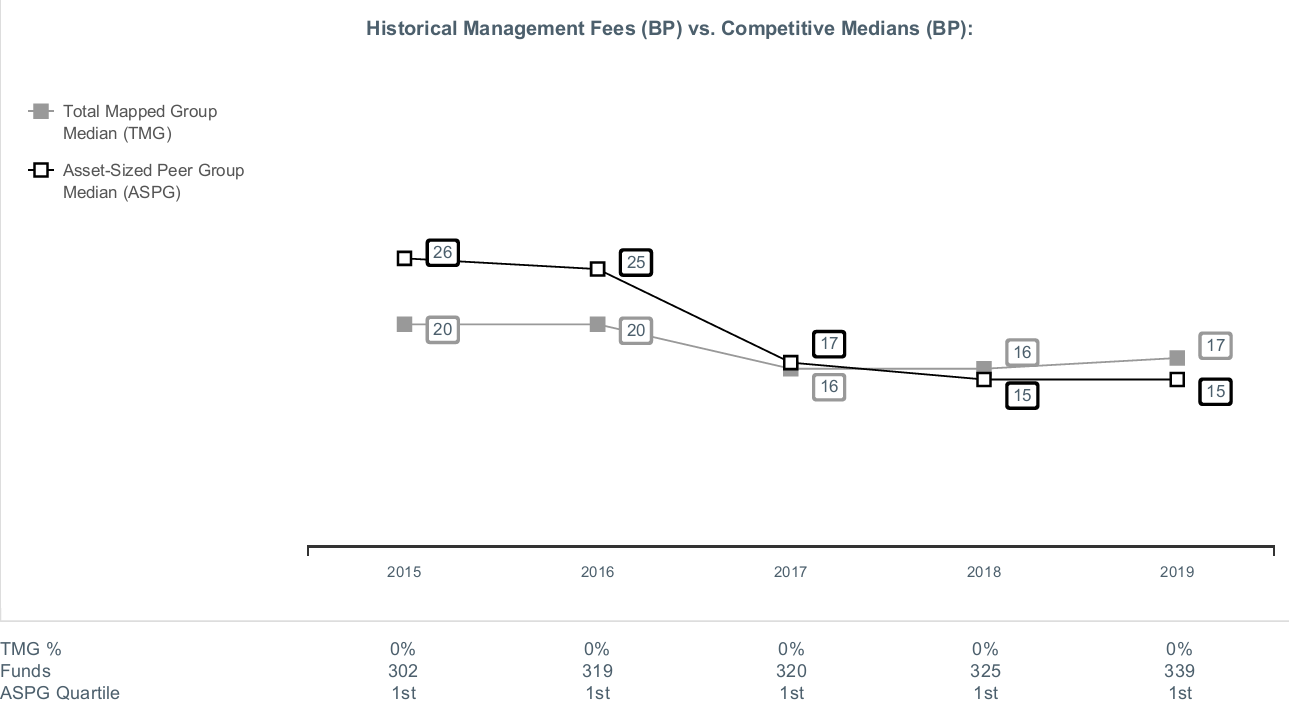
The Board noted that the management fee rate of 0.00% for each fund ranked below the median of its Total Mapped Group and below the median of its ASPG for 2019 (for the period for each of VIP Freedom 2055 Portfolio, VIP Freedom 2060 Portfolio, and VIP Freedom 2065 Portfolio). The Board further noted that many peer funds pay fund-level expenses, including management fees, to which the funds are not subject.
Based on its review, the Board concluded that each fund's management fee is fair and reasonable in light of the services that the fund receives and the other factors considered.
Total Expense Ratio. In its review of the total expense ratio of each class of each fund, the Board considered fund-paid 12b-1 fees and noted that each fund invests in a class of shares of the underlying Fidelity fund that does not charge a 12b-1 fee to avoid charging fund-paid 12b-1 fees at both fund levels. The Board considered that the funds do not pay transfer agent fees. Instead, the applicable class of each underlying Fidelity fund bears its pro rata portion of each fund's transfer agent fee according to the percentage of each fund's assets invested in that underlying fund. The Board further noted that FMR pays all other expenses of each fund, with limited exceptions.
The Board noted that each fund offers multiple classes, each of which has a different 12b-1 fee structure, and that the multiple structures are intended to offer a range of pricing options for the intermediary market. The Board also noted that the total expense ratios of the classes of each fund vary primarily by the level of their 12b-1 fees.
The Board noted that the total expense ratio of each class of each fund ranked below the competitive median for 2019 (for the period for each of VIP Freedom 2055 Portfolio, VIP Freedom 2060 Portfolio, and VIP Freedom 2065 Portfolio).
In considering the total expense ratio of each class of each fund, the Board also considered an alternative competitive analysis that included both top level (
i.e., direct) fund fees and acquired fund fees and expenses for the class and the other funds and classes to which it is compared. The Board noted that, under this alternative competitive analysis, the total expense ratio of each of Initial Class and Service Class of each fund ranked below the competitive median for 2019 (for the period for each of VIP Freedom 2055 Portfolio, VIP Freedom 2060 Portfolio, and VIP Freedom 2065 Portfolio). The Board noted that the total expense ratio of Service Class 2 of each of VIP Freedom 2005 Portfolio, VIP Freedom 2010 Portfolio, VIP Freedom 2015 Portfolio, VIP Freedom 2020 Portfolio, VIP Freedom 2025 Portfolio, VIP Freedom 2030 Portfolio, and VIP Freedom Income Portfolio ranked below the competitive median for 2019, and the total expense ratio of Service Class 2 of VIP Freedom 2035 Portfolio, VIP Freedom 2040 Portfolio, VIP Freedom 2045 Portfolio, VIP Freedom 2050 Portfolio, VIP Freedom 2055 Portfolio, VIP Freedom 2060 Portfolio, and VIP Freedom 2065 Portfolio ranked above the competitive median for 2019 (for the period for each of VIP Freedom 2055 Portfolio, VIP Freedom 2060 Portfolio, and VIP Freedom 2065 Portfolio). The Board considered that, in general, various factors can affect total expense ratios. The Board noted that, for each fund for which Service Class 2 was above the competitive median, the class was above median because of its 12b-1 fees.
Fees Charged to Other Fidelity Clients. The Board also considered Fidelity fee structures and other information with respect to clients of Fidelity, such as other funds advised or subadvised by Fidelity, pension plan clients, and other institutional clients with similar mandates. The Board noted that a joint ad hoc committee created by it and the boards of other Fidelity funds periodically reviews and compares Fidelity's institutional investment advisory business with its business of providing services to the Fidelity funds and also noted the most recent findings of the committee. The Board noted that the committee's review included a consideration of the differences in services provided, fees charged, and costs incurred, as well as competition in the markets serving the different categories of clients.
Based on its review of total expense ratios and fees charged to other Fidelity clients, the Board concluded that the total expense ratio of each class of each fund was reasonable in light of the services that the fund and its shareholders receive and the other factors considered.
Costs of the Services and Profitability. The Board considered the level of Fidelity's profits in respect of all the Fidelity funds, including the Fidelity funds in which the funds invest.
A public accounting firm has been engaged annually by the Board as part of the Board's assessment of Fidelity's profitability analysis. The engagement includes the review and assessment of the methodologies used by Fidelity in determining the revenues and expenses attributable to Fidelity's mutual fund business, and completion of agreed-upon procedures in respect of the mathematical accuracy of certain fund profitability information and its conformity to established allocation methodologies. After considering the reports issued under the engagement and information provided by Fidelity, the Board concluded that while other allocation methods may also be reasonable, Fidelity's profitability methodologies are reasonable in all material respects.
The Board also reviewed Fidelity's non-fund businesses and potential indirect benefits such businesses may have received as a result of their association with Fidelity's mutual fund business (i.e., fall-out benefits) as well as cases where Fidelity's affiliates may benefit from the funds' business. The Board considered areas where potential indirect benefits to the Fidelity funds from their relationships with Fidelity may exist. The Board also considered that in 2019 a joint ad hoc committee created by it and the boards of other Fidelity funds evaluated potential fall-out benefits (PFOB Committee). The Board noted that it considered the PFOB Committee's findings in connection with its consideration of the renewal of the Advisory Contracts.
The Board concluded that the costs of the services provided by and the profits realized by Fidelity in connection with the operation of each fund were not relevant to the renewal of each fund's Advisory Contract because the funds do not pay management fees and FMR pays all other expenses of each fund, with limited exceptions.
Economies of Scale. The Board concluded that because the funds do not pay management fees and FMR pays all other expenses of each fund, with limited exceptions, economies of scale cannot be realized by the funds, but may be realized by the other Fidelity funds in which each fund invests, many of which may benefit from breakpoints under the group fee arrangement.
Additional Information Requested by the Board. In order to develop fully the factual basis for consideration of the Fidelity funds' advisory contracts, the Board requested and received additional information on certain topics, including: (i) Fidelity's fund profitability methodology, profitability trends for certain funds, the allocation of various costs to different funds, and the impact of certain factors on fund profitability results; (ii) portfolio manager changes that have occurred during the past year and the amount of the investment that each portfolio manager has made in the Fidelity fund(s) that he or she manages; (iii) Fidelity's compensation structure for portfolio managers, research analysts, and other key personnel, including its effects on fund profitability, the rationale for the compensation structure, and the extent to which current market conditions have affected retention and recruitment; (iv) the arrangements with and compensation paid to certain fund sub-advisers on behalf of the Fidelity funds and the treatment of such compensation within Fidelity's fund profitability methodology; (v) the terms of the funds' various management fee structures, including the basic group fee and the terms of Fidelity's voluntary expense limitation agreements; (vi) Fidelity's transfer agent fee, expense, and service structures for different funds and classes relative to competitive trends; (vii) the impact on fund profitability of recent industry trends, such as the growth in passively managed funds and outflows from actively managed equity funds; and (viii) explanations regarding the relative total expense ratios of certain funds and classes, total expense competitive trends and methodologies for total expense competitive comparisons, and actions that might be taken by Fidelity to reduce total expense ratios for certain classes. In addition, the Board considered its discussions with Fidelity regarding Fidelity's efforts to maintain the continuous investment and shareholder services necessary for the funds during the current pandemic and economic circumstances.
Based on its evaluation of all of the conclusions noted above, and after considering all factors it believed relevant, the Board concluded that the advisory fee arrangements are fair and reasonable, and that each fund's Advisory Contract should be renewed.
VIPFF2K-ANN-0221
1.826371.116
Fidelity® Variable Insurance Products:
Freedom Lifetime Income Funds - Portfolios I, II & III
Freedom Lifetime Income I Portfolio
Freedom Lifetime Income II Portfolio
Freedom Lifetime Income III Portfolio
Annual Report
December 31, 2020
Contents
To view a fund's proxy voting guidelines and proxy voting record for the 12-month period ended June 30, visit http://www.fidelity.com/proxyvotingresults or visit the Securities and Exchange Commission's (SEC) web site at http://www.sec.gov.
You may also call 1-877-208-0098 to request a free copy of the proxy voting guidelines.
Fidelity® Variable Insurance Products are separate account options which are purchased through a variable insurance contract.
Standard & Poor's, S&P and S&P 500 are registered service marks of The McGraw-Hill Companies, Inc. and have been licensed for use by Fidelity Distributors Corporation.
Other third-party marks appearing herein are the property of their respective owners.
All other marks appearing herein are registered or unregistered trademarks or service marks of FMR LLC or an affiliated company. © 2021 FMR LLC. All rights reserved.
This report and the financial statements contained herein are submitted for the general information of the shareholders of the Funds. This report is not authorized for distribution to prospective investors in the Funds unless preceded or accompanied by an effective prospectus.
A fund files its complete schedule of portfolio holdings with the SEC for the first and third quarters of each fiscal year on Form N-PORT. Forms N-PORT are available on the SEC’s web site at http://www.sec.gov. A fund's Forms N-PORT may be reviewed and copied at the SEC’s Public Reference Room in Washington, DC. Information regarding the operation of the SEC's Public Reference Room may be obtained by calling 1-800-SEC-0330.
For a complete list of a fund's portfolio holdings, view the most recent holdings listing, semiannual report, or annual report on Fidelity's web site at http://www.fidelity.com, http://www.institutional.fidelity.com, or http://www.401k.com, as applicable.
NOT FDIC INSURED •MAY LOSE VALUE •NO BANK GUARANTEE
Neither the Funds nor Fidelity Distributors Corporation is a bank.
Note to Shareholders:
Early in 2020, the outbreak and spread of a new coronavirus emerged as a public health emergency that had a major influence on financial markets, primarily based on its impact on the global economy and the outlook for corporate earnings. The virus causes a respiratory disease known as COVID-19. On March 11, the World Health Organization declared the COVID-19 outbreak a pandemic, citing sustained risk of further global spread.
In the weeks following, as the crisis worsened, we witnessed an escalating human tragedy with wide-scale social and economic consequences from coronavirus-containment measures. The outbreak of COVID-19 prompted a number of measures to limit the spread, including travel and border restrictions, quarantines, and restrictions on large gatherings. In turn, these resulted in lower consumer activity, diminished demand for a wide range of products and services, disruption in manufacturing and supply chains, and – given the wide variability in outcomes regarding the outbreak – significant market uncertainty and volatility. Amid the turmoil, global governments and central banks took unprecedented action to help support consumers, businesses, and the broader economies, and to limit disruption to financial systems.
The situation continues to unfold, and the extent and duration of its impact on financial markets and the economy remain highly uncertain. Extreme events such as the coronavirus crisis are “exogenous shocks” that can have significant adverse effects on mutual funds and their investments. Although multiple asset classes may be affected by market disruption, the duration and impact may not be the same for all types of assets.
Fidelity is committed to helping you stay informed amid news about COVID-19 and during increased market volatility, and we’re taking extra steps to be responsive to customer needs. We encourage you to visit our websites, where we offer ongoing updates, commentary, and analysis on the markets and our funds.
VIP Freedom Lifetime Income® I Portfolio
Performance: The Bottom Line
Average annual total return reflects the change in the value of an investment, assuming reinvestment of distributions from dividend income and capital gains (the profits earned upon the sale of securities that have grown in value, if any) and assuming a constant rate of performance each year. During periods of reimbursement by Fidelity, a fund’s total return will be greater than it would be had the reimbursement not occurred. Performance numbers are net of all underlying fund operating expenses, but do not include any insurance charges imposed by your insurance company’s separate account. If performance information included the effect of these additional charges, the total returns would have been lower. How a fund did yesterday is no guarantee of how it will do tomorrow.
Average Annual Total Returns
| Periods ended December 31, 2020 | Past 1 year | Past 5 years | Past 10 years |
| VIP Freedom Lifetime Income® I Portfolio | 10.44% | 6.43% | 5.68% |
$10,000 Over 10 Years
Let's say hypothetically that $10,000 was invested in VIP Freedom Lifetime Income® I Portfolio on December 31, 2010.
The chart shows how the value of your investment would have changed, and also shows how the Bloomberg Barclays U.S. Aggregate Bond Index performed over the same period.

| Period Ending Values |
| $17,383 | VIP Freedom Lifetime Income® I Portfolio |
| $14,576 | Bloomberg Barclays U.S. Aggregate Bond Index |
VIP Freedom Lifetime Income® II Portfolio
Performance: The Bottom Line
Average annual total return reflects the change in the value of an investment, assuming reinvestment of distributions from dividend income and capital gains (the profits earned upon the sale of securities that have grown in value, if any) and assuming a constant rate of performance each year. During periods of reimbursement by Fidelity, a fund’s total return will be greater than it would be had the reimbursement not occurred. Performance numbers are net of all underlying fund operating expenses, but do not include any insurance charges imposed by your insurance company’s separate account. If performance information included the effect of these additional charges, the total returns would have been lower. How a fund did yesterday is no guarantee of how it will do tomorrow.
Average Annual Total Returns
| Periods ended December 31, 2020 | Past 1 year | Past 5 years | Past 10 years |
| VIP Freedom Lifetime Income® II Portfolio | 12.78% | 8.47% | 7.10% |
$10,000 Over 10 Years
Let's say hypothetically that $10,000 was invested in VIP Freedom Lifetime Income® II Portfolio on December 31, 2010.
The chart shows how the value of your investment would have changed, and also shows how the Bloomberg Barclays U.S. Aggregate Bond Index performed over the same period.

| Period Ending Values |
| $19,855 | VIP Freedom Lifetime Income® II Portfolio |
| $14,576 | Bloomberg Barclays U.S. Aggregate Bond Index |
VIP Freedom Lifetime Income® III Portfolio
Performance: The Bottom Line
Average annual total return reflects the change in the value of an investment, assuming reinvestment of distributions from dividend income and capital gains (the profits earned upon the sale of securities that have grown in value, if any) and assuming a constant rate of performance each year. During periods of reimbursement by Fidelity, a fund’s total return will be greater than it would be had the reimbursement not occurred. Performance numbers are net of all underlying fund operating expenses, but do not include any insurance charges imposed by your insurance company’s separate account. If performance information included the effect of these additional charges, the total returns would have been lower. How a fund did yesterday is no guarantee of how it will do tomorrow.
Average Annual Total Returns
| Periods ended December 31, 2020 | Past 1 year | Past 5 years | Past 10 years |
| VIP Freedom Lifetime Income® III Portfolio | 15.23% | 10.13% | 8.71% |
$10,000 Over 10 Years
Let's say hypothetically that $10,000 was invested in VIP Freedom Lifetime Income® III Portfolio on December 31, 2010.
The chart shows how the value of your investment would have changed, and also shows how the S&P 500® Index performed over the same period.

| Period Ending Values |
| $23,044 | VIP Freedom Lifetime Income® III Portfolio |
| $36,700 | S&P 500® Index |
Management's Discussion of Fund Performance
Market Recap: Global financial markets were highly volatile and unpredictable in 2020, a year that will be remembered by most investors for the impact of the coronavirus pandemic. The early-2020 outbreak and spread of COVID-19 resulted in a sharp decline for risk assets, followed by a historic rebound. The crisis and containment efforts led to broad contraction in economic activity and dislocation in financial markets. Rapid and expansive monetary- and fiscal-policy responses partially offset the economic disruption and fueled the market surge for many assets from late March through the end of the year.
Non-U.S. equities gained 10.81% in 2020, according to the MSCI ACWI (All Country World Index) ex USA Index, despite significant ups and downs related to the pandemic. Emerging markets (+19%) was the top region, followed by Japan (+15%) and Europe ex U.K. (+12%). Conversely, the U.K. (-10%), Canada (+6%) and Asia Pacific ex Japan (+7%) lagged. By sector, information technology (+46%) was by far the top performer, while consumer discretionary (+23%) and materials (+22%) also notably outpaced the index. Energy (-23%), real estate (-9%) and financials (-4%) all underperformed.
The Dow Jones U.S. Total Stock Market Index gained 20.79% for the year. After a sharp decline in the first quarter (-20.96%) due to the coronavirus outbreak, U.S. equities reversed course, driven by resilient corporate earnings and potential for a vaccine breakthrough, and closed the year at an all-time high. Among sectors, consumer discretionary (+47%) and information technology (+46%) led, whereas energy (-33%) fared worst, followed by real estate (-5%). Large-cap stocks performed about on par with smaller-caps, while growth handily outpaced value. Commodities notably lagged equities.
Turning to fixed income, U.S. taxable investment-grade bonds (the Bloomberg Barclays U.S. Aggregate Bond Index) rose 7.51%, as most categories generated a solid gain. Corporate bonds (+9.35%) led the way, along with commercial mortgage backed securities (+8.11%), Treasury securities (+8.00) and government bonds (7.94%). Agency bonds (+5.48%) and mortgage-backed securities (+3.87%) had smaller gains. Extended (non-core) categories outside the index were mixed, including Treasury Inflation-Protected Securities (+10.99%), high-yield bonds (+6.07%), emerging-markets debt (+5.88%) and floating-rate bank loans (+3.50%).
Comments from Co-Portfolio Managers Andrew Dierdorf and Brett Sumsion: For the year, VIP Freedom Lifetime Income I Portfolio (+10.44%), VIP Freedom Lifetime Income II Portfolio (+12.78%) and VIP Freedom Lifetime Income III Portfolio (+15.23%) each posted a positive return and outperformed its Composite benchmark. Versus Composites, favorable returns among underlying investment funds drove the Portfolios’ outperformance in 2020. In particular, active security selection among non-U.S. equities added the most value, while performance among investment-grade bonds and U.S. equities helped to a lesser extent. Among non-U.S. equities, Fidelity
® VIP Emerging Markets Portfolio (+31.17%) and Fidelity
® VIP Overseas Portfolio (+15.50%) led the way, as both funds handily outperformed their benchmark. An allocation to Fidelity
® VIP Investment Grade Bond Portfolio (+9.33%) also helped, as the portfolio outperformed its benchmark, the Bloomberg Barclays U.S. Aggregate Bond Index. Within U.S. equities, Fidelity
® VIP Contrafund Portfolio (+30.48%) contributed most. Top-down, active asset allocation decisions had a modestly negative influence on relative performance that past year, especially an underweighting in U.S. equities – the top-performing asset class. Out-of-composite exposure to high yield bonds also modestly held back the Funds’ relative results. Our stake in Fidelity
® VIP Growth & Income Portfolio (+7.76%) held back relative performance more than any other individual underlying investment, as the fund notably lagged its benchmark, the S&P 500 index.
The views expressed above reflect those of the portfolio manager(s) only through the end of the period as stated on the cover of this report and do not necessarily represent the views of Fidelity or any other person in the Fidelity organization. Any such views are subject to change at any time based upon market or other conditions and Fidelity disclaims any responsibility to update such views. These views may not be relied on as investment advice and, because investment decisions for a Fidelity fund are based on numerous factors, may not be relied on as an indication of trading intent on behalf of any Fidelity fund.
VIP Freedom Lifetime Income® I Portfolio
Investment Summary (Unaudited)
The information in the following tables is based on the direct investments of the Fund.
Top Holdings as of December 31, 2020
| | % of fund's net assets |
| VIP Investment Grade Bond Portfolio Investor Class | 41.0 |
| VIP Government Money Market Portfolio Investor Class 0.01% | 22.7 |
| Fidelity Inflation-Protected Bond Index Fund | 12.0 |
| VIP Emerging Markets Portfolio Investor Class | 7.9 |
| VIP Overseas Portfolio Investor Class | 5.2 |
| Fidelity Long-Term Treasury Bond Index Fund | 2.3 |
| VIP High Income Portfolio Investor Class | 2.0 |
| VIP Growth & Income Portfolio Investor Class | 1.5 |
| VIP Equity-Income Portfolio Investor Class | 1.3 |
| VIP Growth Portfolio Investor Class | 1.2 |
| | 97.1 |
Asset Allocation (% of fund's net assets)
| Period end |
| | Domestic Equity Funds | 6.9% |
| | International Equity Funds | 13.1% |
| | Bond Funds | 57.3% |
| | Short-Term Funds | 22.7% |

VIP Freedom Lifetime Income® I Portfolio
Schedule of Investments December 31, 2020
Showing Percentage of Net Assets
| Domestic Equity Funds - 6.9% | | | |
| | | Shares | Value |
| VIP Contrafund Portfolio Investor Class (a) | | 3,177 | $151,975 |
| VIP Equity-Income Portfolio Investor Class (a) | | 6,754 | 160,339 |
| VIP Growth & Income Portfolio Investor Class (a) | | 8,211 | 182,701 |
| VIP Growth Portfolio Investor Class (a) | | 1,513 | 154,851 |
| VIP Mid Cap Portfolio Investor Class (a) | | 1,152 | 44,288 |
| VIP Value Portfolio Investor Class (a) | | 7,374 | 117,395 |
| VIP Value Strategies Portfolio Investor Class (a) | | 4,271 | 57,401 |
| TOTAL DOMESTIC EQUITY FUNDS | | | |
| (Cost $570,020) | | | 868,950 |
|
| International Equity Funds - 13.1% | | | |
| VIP Emerging Markets Portfolio Investor Class (a) | | 67,318 | 988,235 |
| VIP Overseas Portfolio Investor Class (a) | | 24,887 | 657,511 |
| TOTAL INTERNATIONAL EQUITY FUNDS | | | |
| (Cost $1,125,412) | | | 1,645,746 |
|
| Bond Funds - 57.3% | | | |
| Fidelity Inflation-Protected Bond Index Fund (a) | | 136,651 | 1,508,624 |
| Fidelity Long-Term Treasury Bond Index Fund (a) | | 18,134 | 289,244 |
| VIP High Income Portfolio Investor Class (a) | | 47,527 | 250,467 |
| VIP Investment Grade Bond Portfolio Investor Class (a) | | 366,503 | 5,142,034 |
| TOTAL BOND FUNDS | | | |
| (Cost $6,433,648) | | | 7,190,369 |
|
| Short-Term Funds - 22.7% | | | |
| VIP Government Money Market Portfolio Investor Class 0.01% (a)(b) | | | |
| (Cost $2,848,387) | | 2,848,387 | 2,848,387 |
| TOTAL INVESTMENT IN SECURITIES - 100.0% | | | |
| (Cost $10,977,467) | | | 12,553,452 |
| NET OTHER ASSETS (LIABILITIES) - 0.0% | | | (1) |
| NET ASSETS - 100% | | | $12,553,451 |
Legend
(a) Affiliated Fund
(b) The rate quoted is the annualized seven-day yield of the fund at period end.
Affiliated Underlying Funds
Fiscal year to date information regarding the Fund's investments in affiliated Underlying Funds, excluding any Money Market Central Funds, is presented below. Exchanges between classes of the same affiliated Underlying Funds may occur.
| Affiliate | Value, beginning of period | Purchases | Sales Proceeds | Dividend Income | Realized Gain (loss) | Change in Unrealized appreciation (depreciation) | Value, end of period |
| Fidelity Inflation-Protected Bond Index Fund | $1,513,526 | $169,753 | $310,366 | $18,603 | $11,270 | $124,441 | $1,508,624 |
| Fidelity Long-Term Treasury Bond Index Fund | 318,148 | 85,682 | 157,587 | 11,512 | 22,986 | 20,015 | 289,244 |
| VIP Contrafund Portfolio Investor Class | 140,498 | 116,713 | 143,649 | 1,027 | 15,743 | 22,670 | 151,975 |
| VIP Emerging Markets Portfolio Investor Class | 766,689 | 487,093 | 464,653 | 94,305 | 29,386 | 169,720 | 988,235 |
| VIP Equity-Income Portfolio Investor Class | 148,489 | 146,478 | 142,944 | 9,082 | (3,417) | 11,733 | 160,339 |
| VIP Government Money Market Portfolio Investor Class 0.01% | 2,969,565 | 790,287 | 911,465 | 9,307 | -- | -- | 2,848,387 |
| VIP Growth & Income Portfolio Investor Class | 169,215 | 168,122 | 164,402 | 11,675 | 19,712 | (9,946) | 182,701 |
| VIP Growth Portfolio Investor Class | 143,615 | 125,509 | 154,439 | 14,780 | 40,550 | (384) | 154,851 |
| VIP High Income Portfolio Investor Class | 252,418 | 64,273 | 61,749 | 12,191 | (4,018) | (457) | 250,467 |
| VIP Investment Grade Bond Portfolio Investor Class | 5,160,468 | 656,832 | 1,012,470 | 112,421 | 6,050 | 331,154 | 5,142,034 |
| VIP Mid Cap Portfolio Investor Class | 41,221 | 30,322 | 37,554 | 219 | 627 | 9,672 | 44,288 |
| VIP Overseas Portfolio Investor Class | 820,171 | 265,813 | 510,523 | 5,781 | 17,386 | 64,664 | 657,511 |
| VIP Value Portfolio Investor Class | 109,045 | 100,450 | 104,295 | 5,544 | 1,428 | 10,767 | 117,395 |
| VIP Value Strategies Portfolio Investor Class | 53,397 | 46,255 | 49,100 | 3,341 | (932) | 7,781 | 57,401 |
| Total | $12,606,465 | $3,253,582 | $4,225,196 | $309,788 | $156,771 | $761,830 | $12,553,452 |
Amounts in the income column in the above table include any capital gain distributions from underlying funds, which are presented in the corresponding line-item in the Statement of Operations, if applicable.
Investment Valuation
The following is a summary of the inputs used, as of December 31, 2020, involving the Fund's assets and liabilities carried at fair value. The inputs or methodology used for valuing securities may not be an indication of the risk associated with investing in those securities. For more information on valuation inputs, and their aggregation into the levels used below, please refer to the Investment Valuation section in the accompanying Notes to Financial Statements.
| | Valuation Inputs at Reporting Date: |
| Description | Total | Level 1 | Level 2 | Level 3 |
| Investments in Securities: | | | | |
| Domestic Equity Funds | $868,950 | $868,950 | $-- | $-- |
| International Equity Funds | 1,645,746 | 1,645,746 | -- | -- |
| Bond Funds | 7,190,369 | 7,190,369 | -- | -- |
| Short-Term Funds | 2,848,387 | 2,848,387 | -- | -- |
| Total Investments in Securities: | $12,553,452 | $12,553,452 | $-- | $-- |
See accompanying notes which are an integral part of the financial statements.
VIP Freedom Lifetime Income® I Portfolio
Financial Statements
Statement of Assets and Liabilities
| | | December 31, 2020 |
| Assets | | |
Investment in securities, at value — See accompanying schedule:
| | |
| Affiliated issuers (cost $10,977,467) | $12,553,452 | |
| Total Investment in Securities (cost $10,977,467) | | $12,553,452 |
| Receivable for investments sold | | 96,433 |
| Total assets | | 12,649,885 |
| Liabilities | | |
| Payable for investments purchased | $96,227 | |
| Payable for fund shares redeemed | 207 | |
| Total liabilities | | 96,434 |
| Net Assets | | $12,553,451 |
| Net Assets consist of: | | |
| Paid in capital | | $10,723,705 |
| Total accumulated earnings (loss) | | 1,829,746 |
| Net Assets | | $12,553,451 |
| Net Asset Value, offering price and redemption price per share ($12,553,451 ÷ 1,036,594 shares) | | $12.11 |
See accompanying notes which are an integral part of the financial statements.
Statement of Operations
| | | Year ended December 31, 2020 |
| Investment Income | | |
| Dividends: | | |
| Affiliated issuers | | $158,779 |
| Expenses | | |
| Independent trustees' fees and expenses | $40 | |
| Total expenses | | 40 |
| Net investment income (loss) | | 158,739 |
| Realized and Unrealized Gain (Loss) | | |
| Net realized gain (loss) on: | | |
| Investment securities: | | |
| Affiliated issuers | 156,771 | |
| Capital gain distributions from underlying funds: | | |
| Affiliated issuers | 151,009 | |
| Total net realized gain (loss) | | 307,780 |
| Change in net unrealized appreciation (depreciation) on: | | |
| Investment securities: | | |
| Affiliated issuers | 761,830 | |
| Total change in net unrealized appreciation (depreciation) | | 761,830 |
| Net gain (loss) | | 1,069,610 |
| Net increase (decrease) in net assets resulting from operations | | $1,228,349 |
See accompanying notes which are an integral part of the financial statements.
Statement of Changes in Net Assets
| | Year ended December 31, 2020 | Year ended December 31, 2019 |
| Increase (Decrease) in Net Assets | | |
| Operations | | |
| Net investment income (loss) | $158,739 | $266,879 |
| Net realized gain (loss) | 307,780 | 397,275 |
| Change in net unrealized appreciation (depreciation) | 761,830 | 774,524 |
| Net increase (decrease) in net assets resulting from operations | 1,228,349 | 1,438,678 |
| Distributions to shareholders | (582,531) | (402,000) |
| Share transactions | | |
| Proceeds from sales of shares | 210,852 | 38,744 |
| Reinvestment of distributions | 582,531 | 402,000 |
| Cost of shares redeemed | (1,492,215) | (1,078,502) |
| Net increase (decrease) in net assets resulting from share transactions | (698,832) | (637,758) |
| Total increase (decrease) in net assets | (53,014) | 398,920 |
| Net Assets | | |
| Beginning of period | 12,606,465 | 12,207,545 |
| End of period | $12,553,451 | $12,606,465 |
| Other Information | | |
| Shares | | |
| Sold | 18,572 | 3,369 |
| Issued in reinvestment of distributions | 50,490 | 35,810 |
| Redeemed | (130,019) | (96,399) |
| Net increase (decrease) | (60,957) | (57,220) |
See accompanying notes which are an integral part of the financial statements.
Financial Highlights
VIP Freedom Lifetime Income I Portfolio
| | | | | | |
| Years ended December 31, | 2020 | 2019 | 2018 | 2017 | 2016 |
| Selected Per–Share Data | | | | | |
| Net asset value, beginning of period | $11.49 | $10.57 | $11.21 | $10.76 | $10.65 |
| Income from Investment Operations | | | | | |
| Net investment income (loss)A | .15 | .24 | .19 | .22 | .21 |
| Net realized and unrealized gain (loss) | 1.02 | 1.05 | (.48) | .59 | .31 |
| Total from investment operations | 1.17 | 1.29 | (.29) | .81 | .52 |
| Distributions from net investment income | (.16) | (.25) | (.19) | (.23) | (.21) |
| Distributions from net realized gain | (.39) | (.12) | (.17) | (.13) | (.20) |
| Total distributions | (.55) | (.37) | (.35)B | (.36) | (.41) |
| Net asset value, end of period | $12.11 | $11.49 | $10.57 | $11.21 | $10.76 |
| Total ReturnC,D | 10.44% | 12.28% | (2.58)% | 7.62% | 5.05% |
| Ratios to Average Net AssetsE | | | | | |
| Expenses before reductionsF | -% | -% | -% | -% | -% |
| Expenses net of fee waivers, if any | - %F | - %F | - %F | -% | -% |
| Expenses net of all reductions | - %F | - %F | - %F | -% | -% |
| Net investment income (loss) | 1.29% | 2.13% | 1.69% | 1.97% | 1.90% |
| Supplemental Data | | | | | |
| Net assets, end of period (000 omitted) | $12,553 | $12,606 | $12,208 | $13,690 | $14,178 |
| Portfolio turnover rateG | 26% | 19% | 39% | 9% | 18% |
A Calculated based on average shares outstanding during the period.
B Total distributions per share do not sum due to rounding.
C Total returns do not reflect charges attributable to your insurance company's separate account. Inclusion of these charges would reduce the total returns shown.
D Total returns would have been lower if certain expenses had not been reduced during the applicable periods shown.
E Expense ratios reflect operating expenses of the class. Expenses before reductions do not reflect amounts reimbursed, waived, or reduced through arrangements with the investment advisor, brokerage services, or other offset arrangements, if applicable, and do not represent the amount paid by the class during periods when reimbursements, waivers or reductions occur.
F Amount represents less than .005%.
G Amount does not include the portfolio activity of any underlying mutual funds or exchange-traded funds (ETFs).
See accompanying notes which are an integral part of the financial statements.
VIP Freedom Lifetime Income® II Portfolio
Investment Summary (Unaudited)
The information in the following tables is based on the direct investments of the Fund.
Top Holdings as of December 31, 2020
| | % of fund's net assets |
| VIP Investment Grade Bond Portfolio Investor Class | 35.0 |
| VIP Government Money Market Portfolio Investor Class 0.01% | 15.3 |
| VIP Emerging Markets Portfolio Investor Class | 9.8 |
| VIP Overseas Portfolio Investor Class | 9.7 |
| Fidelity Inflation-Protected Bond Index Fund | 9.3 |
| VIP Growth & Income Portfolio Investor Class | 3.5 |
| VIP Equity-Income Portfolio Investor Class | 3.1 |
| VIP Growth Portfolio Investor Class | 3.0 |
| VIP Contrafund Portfolio Investor Class | 2.9 |
| Fidelity Long-Term Treasury Bond Index Fund | 2.3 |
| | 93.9 |
Asset Allocation (% of fund's net assets)
| Period end |
| | Domestic Equity Funds | 16.6% |
| | International Equity Funds | 19.5% |
| | Bond Funds | 48.6% |
| | Short-Term Funds | 15.3% |

VIP Freedom Lifetime Income® II Portfolio
Schedule of Investments December 31, 2020
Showing Percentage of Net Assets
| Domestic Equity Funds - 16.6% | | | |
| | | Shares | Value |
| VIP Contrafund Portfolio Investor Class (a) | | 20,833 | $996,419 |
| VIP Equity-Income Portfolio Investor Class (a) | | 44,282 | 1,051,244 |
| VIP Growth & Income Portfolio Investor Class (a) | | 53,836 | 1,197,856 |
| VIP Growth Portfolio Investor Class (a) | | 9,917 | 1,015,289 |
| VIP Mid Cap Portfolio Investor Class (a) | | 7,554 | 290,376 |
| VIP Value Portfolio Investor Class (a) | | 48,348 | 769,693 |
| VIP Value Strategies Portfolio Investor Class (a) | | 28,003 | 376,355 |
| TOTAL DOMESTIC EQUITY FUNDS | | | |
| (Cost $3,685,707) | | | 5,697,232 |
|
| International Equity Funds - 19.5% | | | |
| VIP Emerging Markets Portfolio Investor Class (a) | | 229,701 | 3,372,012 |
| VIP Overseas Portfolio Investor Class (a) | | 125,550 | 3,317,040 |
| TOTAL INTERNATIONAL EQUITY FUNDS | | | |
| (Cost $4,535,880) | | | 6,689,052 |
|
| Bond Funds - 48.6% | | | |
| Fidelity Inflation-Protected Bond Index Fund (a) | | 289,101 | 3,191,676 |
| Fidelity Long-Term Treasury Bond Index Fund (a) | | 49,451 | 788,736 |
| VIP High Income Portfolio Investor Class (a) | | 129,605 | 683,019 |
| VIP Investment Grade Bond Portfolio Investor Class (a) | | 852,501 | 11,960,591 |
| TOTAL BOND FUNDS | | | |
| (Cost $15,006,263) | | | 16,624,022 |
|
| Short-Term Funds - 15.3% | | | |
| VIP Government Money Market Portfolio Investor Class 0.01% (a)(b) | | | |
| (Cost $5,221,605) | | 5,221,605 | 5,221,605 |
| TOTAL INVESTMENT IN SECURITIES - 100.0% | | | |
| (Cost $28,449,455) | | | 34,231,911 |
| NET OTHER ASSETS (LIABILITIES) - 0.0% | | | 3 |
| NET ASSETS - 100% | | | $34,231,914 |
Legend
(a) Affiliated Fund
(b) The rate quoted is the annualized seven-day yield of the fund at period end.
Affiliated Underlying Funds
Fiscal year to date information regarding the Fund's investments in affiliated Underlying Funds, excluding any Money Market Central Funds, is presented below. Exchanges between classes of the same affiliated Underlying Funds may occur.
| Affiliate | Value, beginning of period | Purchases | Sales Proceeds | Dividend Income | Realized Gain (loss) | Change in Unrealized appreciation (depreciation) | Value, end of period |
| Fidelity Inflation-Protected Bond Index Fund | $3,047,085 | $606,342 | $732,407 | $38,690 | $14,806 | $255,850 | $3,191,676 |
| Fidelity Long-Term Treasury Bond Index Fund | 848,417 | 286,078 | 456,994 | 31,065 | 60,104 | 51,131 | 788,736 |
| VIP Contrafund Portfolio Investor Class | 1,006,412 | 321,635 | 587,778 | 7,092 | 67,066 | 189,084 | 996,419 |
| VIP Emerging Markets Portfolio Investor Class | 2,712,555 | 1,356,979 | 1,331,498 | 329,557 | 83,884 | 550,092 | 3,372,012 |
| VIP Equity-Income Portfolio Investor Class | 1,063,521 | 511,037 | 550,670 | 62,576 | (11,976) | 39,332 | 1,051,244 |
| VIP Government Money Market Portfolio Investor Class 0.01% | 5,131,760 | 2,093,625 | 2,003,780 | 16,260 | -- | -- | 5,221,605 |
| VIP Growth & Income Portfolio Investor Class | 1,212,011 | 593,956 | 644,703 | 80,431 | 45,114 | (8,522) | 1,197,856 |
| VIP Growth Portfolio Investor Class | 1,028,754 | 373,760 | 651,999 | 102,285 | 169,465 | 95,309 | 1,015,289 |
| VIP High Income Portfolio Investor Class | 673,079 | 159,380 | 133,739 | 33,410 | (5,907) | (9,794) | 683,019 |
| VIP Investment Grade Bond Portfolio Investor Class | 11,482,358 | 2,690,821 | 2,936,251 | 260,589 | (15,201) | 738,864 | 11,960,591 |
| VIP Mid Cap Portfolio Investor Class | 295,228 | 109,531 | 173,213 | 1,480 | 142 | 58,688 | 290,376 |
| VIP Overseas Portfolio Investor Class | 3,937,359 | 1,085,649 | 2,136,264 | 28,277 | 82,494 | 347,802 | 3,317,040 |
| VIP Value Portfolio Investor Class | 780,990 | 396,779 | 454,789 | 38,255 | 7,554 | 39,159 | 769,693 |
| VIP Value Strategies Portfolio Investor Class | 382,420 | 204,519 | 239,067 | 23,105 | (8,458) | 36,941 | 376,355 |
| Total | $33,601,949 | $10,790,091 | $13,033,152 | $1,053,072 | $489,087 | $2,383,936 | $34,231,911 |
Amounts in the income column in the above table include any capital gain distributions from underlying funds, which are presented in the corresponding line-item in the Statement of Operations, if applicable.
Investment Valuation
The following is a summary of the inputs used, as of December 31, 2020, involving the Fund's assets and liabilities carried at fair value. The inputs or methodology used for valuing securities may not be an indication of the risk associated with investing in those securities. For more information on valuation inputs, and their aggregation into the levels used below, please refer to the Investment Valuation section in the accompanying Notes to Financial Statements.
| | Valuation Inputs at Reporting Date: |
| Description | Total | Level 1 | Level 2 | Level 3 |
| Investments in Securities: | | | | |
| Domestic Equity Funds | $5,697,232 | $5,697,232 | $-- | $-- |
| International Equity Funds | 6,689,052 | 6,689,052 | -- | -- |
| Bond Funds | 16,624,022 | 16,624,022 | -- | -- |
| Short-Term Funds | 5,221,605 | 5,221,605 | -- | -- |
| Total Investments in Securities: | $34,231,911 | $34,231,911 | $-- | $-- |
See accompanying notes which are an integral part of the financial statements.
VIP Freedom Lifetime Income® II Portfolio
Financial Statements
Statement of Assets and Liabilities
| | | December 31, 2020 |
| Assets | | |
Investment in securities, at value — See accompanying schedule:
| | |
| Affiliated issuers (cost $28,449,455) | $34,231,911 | |
| Total Investment in Securities (cost $28,449,455) | | $34,231,911 |
| Cash | | 6 |
| Receivable for investments sold | | 444,853 |
| Total assets | | 34,676,770 |
| Liabilities | | |
| Payable for investments purchased | $444,289 | |
| Payable for fund shares redeemed | 567 | |
| Total liabilities | | 444,856 |
| Net Assets | | $34,231,914 |
| Net Assets consist of: | | |
| Paid in capital | | $27,487,498 |
| Total accumulated earnings (loss) | | 6,744,416 |
| Net Assets | | $34,231,914 |
| Net Asset Value, offering price and redemption price per share ($34,231,914 ÷ 2,475,516 shares) | | $13.83 |
See accompanying notes which are an integral part of the financial statements.
Statement of Operations
| | | Year ended December 31, 2020 |
| Investment Income | | |
| Dividends: | | |
| Affiliated issuers | | $419,747 |
| Expenses | | |
| Independent trustees' fees and expenses | $106 | |
| Total expenses | | 106 |
| Net investment income (loss) | | 419,641 |
| Realized and Unrealized Gain (Loss) | | |
| Net realized gain (loss) on: | | |
| Investment securities: | | |
| Affiliated issuers | 489,087 | |
| Capital gain distributions from underlying funds: | | |
| Affiliated issuers | 633,325 | |
| Total net realized gain (loss) | | 1,122,412 |
| Change in net unrealized appreciation (depreciation) on: | | |
| Investment securities: | | |
| Affiliated issuers | 2,383,936 | |
| Total change in net unrealized appreciation (depreciation) | | 2,383,936 |
| Net gain (loss) | | 3,506,348 |
| Net increase (decrease) in net assets resulting from operations | | $3,925,989 |
See accompanying notes which are an integral part of the financial statements.
Statement of Changes in Net Assets
| | Year ended December 31, 2020 | Year ended December 31, 2019 |
| Increase (Decrease) in Net Assets | | |
| Operations | | |
| Net investment income (loss) | $419,641 | $678,626 |
| Net realized gain (loss) | 1,122,412 | 1,448,306 |
| Change in net unrealized appreciation (depreciation) | 2,383,936 | 2,864,828 |
| Net increase (decrease) in net assets resulting from operations | 3,925,989 | 4,991,760 |
| Distributions to shareholders | (1,890,922) | (1,824,394) |
| Share transactions | | |
| Proceeds from sales of shares | 558,789 | 437,250 |
| Reinvestment of distributions | 1,890,922 | 1,824,394 |
| Cost of shares redeemed | (3,854,815) | (2,887,417) |
| Net increase (decrease) in net assets resulting from share transactions | (1,405,104) | (625,773) |
| Total increase (decrease) in net assets | 629,963 | 2,541,593 |
| Net Assets | | |
| Beginning of period | 33,601,951 | 31,060,358 |
| End of period | $34,231,914 | $33,601,951 |
| Other Information | | |
| Shares | | |
| Sold | 41,317 | 34,739 |
| Issued in reinvestment of distributions | 146,034 | 148,009 |
| Redeemed | (300,685) | (230,952) |
| Net increase (decrease) | (113,334) | (48,204) |
See accompanying notes which are an integral part of the financial statements.
Financial Highlights
VIP Freedom Lifetime Income II Portfolio
| | | | | | |
| Years ended December 31, | 2020 | 2019 | 2018 | 2017 | 2016 |
| Selected Per–Share Data | | | | | |
| Net asset value, beginning of period | $12.98 | $11.78 | $12.70 | $11.72 | $11.47 |
| Income from Investment Operations | | | | | |
| Net investment income (loss)A | .16 | .26 | .20 | .21 | .21 |
| Net realized and unrealized gain (loss) | 1.44 | 1.65 | (.70) | 1.22 | .44 |
| Total from investment operations | 1.60 | 1.91 | (.50) | 1.43 | .65 |
| Distributions from net investment income | (.17) | (.27) | (.20) | (.22) | (.20) |
| Distributions from net realized gain | (.58) | (.44) | (.22) | (.23) | (.20) |
| Total distributions | (.75) | (.71) | (.42) | (.45) | (.40) |
| Net asset value, end of period | $13.83 | $12.98 | $11.78 | $12.70 | $11.72 |
| Total ReturnB,C | 12.78% | 16.58% | (3.96)% | 12.29% | 5.90% |
| Ratios to Average Net AssetsD | | | | | |
| Expenses before reductionsE | -% | -% | -% | -% | -% |
| Expenses net of fee waivers, if any | - %E | - %E | - %E | -% | -% |
| Expenses net of all reductions | - %E | - %E | - %E | -% | -% |
| Net investment income (loss) | 1.29% | 2.07% | 1.57% | 1.71% | 1.84% |
| Supplemental Data | | | | | |
| Net assets, end of period (000 omitted) | $34,232 | $33,602 | $31,060 | $34,818 | $33,897 |
| Portfolio turnover rateF | 33% | 24% | 34% | 12% | 16% |
A Calculated based on average shares outstanding during the period.
B Total returns do not reflect charges attributable to your insurance company's separate account. Inclusion of these charges would reduce the total returns shown.
C Total returns would have been lower if certain expenses had not been reduced during the applicable periods shown.
D Expense ratios reflect operating expenses of the class. Expenses before reductions do not reflect amounts reimbursed, waived, or reduced through arrangements with the investment advisor, brokerage services, or other offset arrangements, if applicable, and do not represent the amount paid by the class during periods when reimbursements, waivers or reductions occur.
E Amount represents less than .005%.
F Amount does not include the portfolio activity of any underlying mutual funds or exchange-traded funds (ETFs).
See accompanying notes which are an integral part of the financial statements.
VIP Freedom Lifetime Income® III Portfolio
Investment Summary (Unaudited)
The information in the following tables is based on the direct investments of the Fund.
Top Holdings as of December 31, 2020
| | % of fund's net assets |
| VIP Investment Grade Bond Portfolio Investor Class | 27.8 |
| VIP Overseas Portfolio Investor Class | 14.4 |
| VIP Emerging Markets Portfolio Investor Class | 12.0 |
| VIP Government Money Market Portfolio Investor Class 0.01% | 7.6 |
| Fidelity Inflation-Protected Bond Index Fund | 6.9 |
| VIP Growth & Income Portfolio Investor Class | 5.7 |
| VIP Equity-Income Portfolio Investor Class | 5.0 |
| VIP Growth Portfolio Investor Class | 4.8 |
| VIP Contrafund Portfolio Investor Class | 4.7 |
| VIP Value Portfolio Investor Class | 3.6 |
| | 92.5 |
Asset Allocation (% of fund's net assets)
| Period end |
| | Domestic Equity Funds | 27.0% |
| | International Equity Funds | 26.4% |
| | Bond Funds | 39.0% |
| | Short-Term Funds | 7.6% |

VIP Freedom Lifetime Income® III Portfolio
Schedule of Investments December 31, 2020
Showing Percentage of Net Assets
| Domestic Equity Funds - 27.0% | | | |
| | | Shares | Value |
| VIP Contrafund Portfolio Investor Class (a) | | 34,859 | $1,667,313 |
| VIP Equity-Income Portfolio Investor Class (a) | | 74,093 | 1,758,977 |
| VIP Growth & Income Portfolio Investor Class (a) | | 90,080 | 2,004,288 |
| VIP Growth Portfolio Investor Class (a) | | 16,595 | 1,698,966 |
| VIP Mid Cap Portfolio Investor Class (a) | | 12,640 | 485,890 |
| VIP Value Portfolio Investor Class (a) | | 80,898 | 1,287,895 |
| VIP Value Strategies Portfolio Investor Class (a) | | 46,856 | 629,748 |
| TOTAL DOMESTIC EQUITY FUNDS | | | |
| (Cost $6,329,903) | | | 9,533,077 |
|
| International Equity Funds - 26.4% | | | |
| VIP Emerging Markets Portfolio Investor Class (a) | | 287,357 | 4,218,403 |
| VIP Overseas Portfolio Investor Class (a) | | 192,948 | 5,097,689 |
| TOTAL INTERNATIONAL EQUITY FUNDS | | | |
| (Cost $6,456,594) | | | 9,316,092 |
|
| Bond Funds - 39.0% | | | |
| Fidelity Inflation-Protected Bond Index Fund (a) | | 220,473 | 2,434,020 |
| Fidelity Long-Term Treasury Bond Index Fund (a) | | 50,957 | 812,759 |
| VIP High Income Portfolio Investor Class (a) | | 133,557 | 703,846 |
| VIP Investment Grade Bond Portfolio Investor Class (a) | | 698,911 | 9,805,725 |
| TOTAL BOND FUNDS | | | |
| (Cost $12,522,424) | | | 13,756,350 |
|
| Short-Term Funds - 7.6% | | | |
| VIP Government Money Market Portfolio Investor Class 0.01% (a)(b) | | | |
| (Cost $2,669,226) | | 2,669,226 | 2,669,226 |
| TOTAL INVESTMENT IN SECURITIES - 100.0% | | | |
| (Cost $27,978,147) | | | 35,274,745 |
| NET OTHER ASSETS (LIABILITIES) - 0.0% | | | 3 |
| NET ASSETS - 100% | | | $35,274,748 |
Legend
(a) Affiliated Fund
(b) The rate quoted is the annualized seven-day yield of the fund at period end.
Affiliated Underlying Funds
Fiscal year to date information regarding the Fund's investments in affiliated Underlying Funds, excluding any Money Market Central Funds, is presented below. Exchanges between classes of the same affiliated Underlying Funds may occur.
| Affiliate | Value, beginning of period | Purchases | Sales Proceeds | Dividend Income | Realized Gain (loss) | Change in Unrealized appreciation (depreciation) | Value, end of period |
| Fidelity Inflation-Protected Bond Index Fund | $2,228,202 | $590,537 | $582,895 | $29,151 | $13,131 | $185,045 | $2,434,020 |
| Fidelity Long-Term Treasury Bond Index Fund | 834,019 | 329,698 | 457,813 | 31,005 | 60,577 | 46,278 | 812,759 |
| VIP Contrafund Portfolio Investor Class | 1,567,164 | 389,620 | 698,553 | 11,111 | 72,211 | 336,871 | 1,667,313 |
| VIP Emerging Markets Portfolio Investor Class | 3,273,632 | 1,364,373 | 1,192,232 | 399,625 | 83,465 | 689,165 | 4,218,403 |
| VIP Equity-Income Portfolio Investor Class | 1,655,996 | 632,193 | 577,731 | 98,325 | (2,966) | 51,485 | 1,758,977 |
| VIP Government Money Market Portfolio Investor Class 0.01% | 2,556,913 | 1,623,223 | 1,510,910 | 8,382 | -- | -- | 2,669,226 |
| VIP Growth & Income Portfolio Investor Class | 1,887,240 | 766,949 | 715,130 | 126,416 | 19,259 | 45,970 | 2,004,288 |
| VIP Growth Portfolio Investor Class | 1,601,966 | 406,428 | 735,329 | 159,911 | 137,412 | 288,489 | 1,698,966 |
| VIP High Income Portfolio Investor Class | 661,611 | 173,342 | 116,326 | 33,530 | (2,937) | (11,844) | 703,846 |
| VIP Investment Grade Bond Portfolio Investor Class | 9,010,961 | 2,879,979 | 2,647,959 | 207,794 | (14,213) | 576,957 | 9,805,725 |
| VIP Mid Cap Portfolio Investor Class | 459,688 | 140,699 | 209,440 | 2,378 | (1,360) | 96,303 | 485,890 |
| VIP Overseas Portfolio Investor Class | 5,468,656 | 1,323,627 | 2,370,191 | 40,528 | 80,328 | 595,269 | 5,097,689 |
| VIP Value Portfolio Investor Class | 1,216,058 | 564,423 | 573,835 | 60,019 | 2,461 | 78,788 | 1,287,895 |
| VIP Value Strategies Portfolio Investor Class | 595,444 | 294,924 | 309,819 | 36,150 | (29,268) | 78,467 | 629,748 |
| Total | $33,017,550 | $11,480,015 | $12,698,163 | $1,244,325 | $418,100 | $3,057,243 | $35,274,745 |
Amounts in the income column in the above table include any capital gain distributions from underlying funds, which are presented in the corresponding line-item in the Statement of Operations, if applicable.
Investment Valuation
The following is a summary of the inputs used, as of December 31, 2020, involving the Fund's assets and liabilities carried at fair value. The inputs or methodology used for valuing securities may not be an indication of the risk associated with investing in those securities. For more information on valuation inputs, and their aggregation into the levels used below, please refer to the Investment Valuation section in the accompanying Notes to Financial Statements.
| | Valuation Inputs at Reporting Date: |
| Description | Total | Level 1 | Level 2 | Level 3 |
| Investments in Securities: | | | | |
| Domestic Equity Funds | $9,533,077 | $9,533,077 | $-- | $-- |
| International Equity Funds | 9,316,092 | 9,316,092 | -- | -- |
| Bond Funds | 13,756,350 | 13,756,350 | -- | -- |
| Short-Term Funds | 2,669,226 | 2,669,226 | -- | -- |
| Total Investments in Securities: | $35,274,745 | $35,274,745 | $-- | $-- |
See accompanying notes which are an integral part of the financial statements.
VIP Freedom Lifetime Income® III Portfolio
Financial Statements
Statement of Assets and Liabilities
| | | December 31, 2020 |
| Assets | | |
Investment in securities, at value — See accompanying schedule:
| | |
| Affiliated issuers (cost $27,978,147) | $35,274,745 | |
| Total Investment in Securities (cost $27,978,147) | | $35,274,745 |
| Cash | | 4 |
| Receivable for investments sold | | 459,225 |
| Total assets | | 35,733,974 |
| Liabilities | | |
| Payable for investments purchased | $458,643 | |
| Payable for fund shares redeemed | 583 | |
| Total liabilities | | 459,226 |
| Net Assets | | $35,274,748 |
| Net Assets consist of: | | |
| Paid in capital | | $26,910,287 |
| Total accumulated earnings (loss) | | 8,364,461 |
| Net Assets | | $35,274,748 |
| Net Asset Value, offering price and redemption price per share ($35,274,748 ÷ 2,396,735 shares) | | $14.72 |
See accompanying notes which are an integral part of the financial statements.
Statement of Operations
| | | Year ended December 31, 2020 |
| Investment Income | | |
| Dividends: | | |
| Affiliated issuers | | $403,295 |
| Expenses | | |
| Independent trustees' fees and expenses | $105 | |
| Total expenses | | 105 |
| Net investment income (loss) | | 403,190 |
| Realized and Unrealized Gain (Loss) | | |
| Net realized gain (loss) on: | | |
| Investment securities: | | |
| Affiliated issuers | 418,100 | |
| Capital gain distributions from underlying funds: | | |
| Affiliated issuers | 841,030 | |
| Total net realized gain (loss) | | 1,259,130 |
| Change in net unrealized appreciation (depreciation) on: | | |
| Investment securities: | | |
| Other affiliated issuers | 3,057,243 | |
| Total change in net unrealized appreciation (depreciation) | | 3,057,243 |
| Net gain (loss) | | 4,316,373 |
| Net increase (decrease) in net assets resulting from operations | | $4,719,563 |
See accompanying notes which are an integral part of the financial statements.
Statement of Changes in Net Assets
| | Year ended December 31, 2020 | Year ended December 31, 2019 |
| Increase (Decrease) in Net Assets | | |
| Operations | | |
| Net investment income (loss) | $403,190 | $630,817 |
| Net realized gain (loss) | 1,259,130 | 1,445,798 |
| Change in net unrealized appreciation (depreciation) | 3,057,243 | 3,662,950 |
| Net increase (decrease) in net assets resulting from operations | 4,719,563 | 5,739,565 |
| Distributions to shareholders | (1,910,431) | (1,745,003) |
| Share transactions | | |
| Proceeds from sales of shares | 220,161 | 1,066,578 |
| Reinvestment of distributions | 1,910,431 | 1,745,003 |
| Cost of shares redeemed | (2,682,525) | (2,257,230) |
| Net increase (decrease) in net assets resulting from share transactions | (551,933) | 554,351 |
| Total increase (decrease) in net assets | 2,257,199 | 4,548,913 |
| Net Assets | | |
| Beginning of period | 33,017,549 | 28,468,636 |
| End of period | $35,274,748 | $33,017,549 |
| Other Information | | |
| Shares | | |
| Sold | 17,677 | 82,707 |
| Issued in reinvestment of distributions | 140,641 | 137,425 |
| Redeemed | (201,190) | (175,466) |
| Net increase (decrease) | (42,872) | 44,666 |
See accompanying notes which are an integral part of the financial statements.
Financial Highlights
VIP Freedom Lifetime Income III Portfolio
| | | | | | |
| Years ended December 31, | 2020 | 2019 | 2018 | 2017 | 2016 |
| Selected Per–Share Data | | | | | |
| Net asset value, beginning of period | $13.53 | $11.89 | $13.07 | $11.79 | $11.59 |
| Income from Investment Operations | | | | | |
| Net investment income (loss)A | .16 | .26 | .19 | .22 | .23 |
| Net realized and unrealized gain (loss) | 1.83 | 2.11 | (.92) | 1.62 | .51 |
| Total from investment operations | 1.99 | 2.37 | (.73) | 1.84 | .74 |
| Distributions from net investment income | (.17) | (.27) | (.19) | (.23) | (.21) |
| Distributions from net realized gain | (.62) | (.47) | (.26) | (.33) | (.33) |
| Total distributions | (.80)B | (.73)B | (.45) | (.56) | (.54) |
| Net asset value, end of period | $14.72 | $13.53 | $11.89 | $13.07 | $11.79 |
| Total ReturnC,D | 15.23% | 20.44% | (5.68)% | 15.85% | 6.83% |
| Ratios to Average Net AssetsE | | | | | |
| Expenses before reductionsF | -% | -% | -% | -% | -% |
| Expenses net of fee waivers, if any | - %F | - %F | - %F | -% | -% |
| Expenses net of all reductions | - %F | - %F | - %F | -% | -% |
| Net investment income (loss) | 1.24% | 2.02% | 1.45% | 1.74% | 1.95% |
| Supplemental Data | | | | | |
| Net assets, end of period (000 omitted) | $35,275 | $33,018 | $28,469 | $32,383 | $28,081 |
| Portfolio turnover rateG | 35% | 26% | 35% | 15% | 15% |
A Calculated based on average shares outstanding during the period.
B Total distributions per share do not sum due to rounding.
C Total returns do not reflect charges attributable to your insurance company's separate account. Inclusion of these charges would reduce the total returns shown.
D Total returns would have been lower if certain expenses had not been reduced during the applicable periods shown.
E Expense ratios reflect operating expenses of the class. Expenses before reductions do not reflect amounts reimbursed, waived, or reduced through arrangements with the investment advisor, brokerage services, or other offset arrangements, if applicable, and do not represent the amount paid by the class during periods when reimbursements, waivers or reductions occur.
F Amount represents less than .005%.
G Amount does not include the portfolio activity of any underlying mutual funds or exchange-traded funds (ETFs).
See accompanying notes which are an integral part of the financial statements.
Notes to Financial Statements
For the period ended December 31, 2020
1. Organization.
VIP Freedom Lifetime Income I Portfolio, VIP Freedom Lifetime Income II Portfolio, and VIP Freedom Lifetime Income III Portfolio (the Funds) are funds of Variable Insurance Products Fund V (the Trust). The Trust is registered under the Investment Company Act of 1940, as amended (the 1940 Act), as an open-end management investment company organized as a Massachusetts business trust. Each Fund is authorized to issue an unlimited number of shares. Shares of each Fund may only be purchased by insurance companies for the purpose of funding variable annuity or variable life insurance contracts.
Effective January 1, 2020, investment advisers Fidelity Investments Money Management, Inc., FMR Co., Inc., and Fidelity SelectCo, LLC, merged with and into Fidelity Management & Research Company. In connection with the merger transactions, the resulting, merged investment adviser was then redomiciled from Massachusetts to Delaware, changed its corporate structure from a corporation to a limited liability company, and changed its name to "Fidelity Management & Research Company LLC".
2. Significant Accounting Policies.
Each Fund is an investment company and applies the accounting and reporting guidance of the Financial Accounting Standards Board (FASB) Accounting Standards Codification Topic 946 Financial Services - Investment Companies. The financial statements have been prepared in conformity with accounting principles generally accepted in the United States of America (GAAP), which require management to make certain estimates and assumptions at the date of the financial statements. Actual results could differ from those estimates. Subsequent events, if any, through the date that the financial statements were issued have been evaluated in the preparation of the financial statements. The following summarizes the significant accounting policies of the Funds:
Investment Valuation. Investments are valued as of 4:00 p.m. Eastern time on the last calendar day of the period. Each Fund categorizes the inputs to valuation techniques used to value its investments into a disclosure hierarchy consisting of three levels as shown below:
- Level 1 – quoted prices in active markets for identical investments
- Level 2 – other significant observable inputs (including quoted prices for similar investments, interest rates, prepayment speeds, etc.)
- Level 3 – unobservable inputs (including the Fund's own assumptions based on the best information available)
Valuation techniques used to value each Fund's investments by major category are as follows. Investments in open-end mutual funds are valued at their closing net asset value (NAV) each business day and are categorized as Level 1 in the hierarchy. The aggregate value of investments by input level as of December 31, 2020 is included at the end of each Fund's Schedule of Investments.
Investment Transactions and Income. For financial reporting purposes, the Funds' investment holdings and NAV include trades executed through the end of the last business day of the period. The NAV per share for processing shareholder transactions is calculated as of the close of business of the New York Stock Exchange (NYSE), normally 4:00 p.m. Eastern time and includes trades executed through the end of the prior business day. Gains and losses on securities sold are determined on the basis of identified cost. Income and capital gain distributions from any underlying mutual funds or exchange-traded funds (ETFs) are recorded on the ex-dividend date.
Expenses. Expenses directly attributable to a fund are charged to that fund. Expenses attributable to more than one fund are allocated among the respective funds on the basis of relative net assets or other appropriate methods. Expenses included in the accompanying financial statements reflect the expenses of each Fund and do not include any expenses associated with any underlying mutual funds or exchange-traded funds (ETFs). Although not included in each Fund's expenses, each Fund indirectly bears its proportionate share of any underlying mutual funds or exchange-traded funds (ETFs) expenses through the impact of these expenses on each underlying mutual fund's or exchange-traded fund's (ETFs) NAV. Expense estimates are accrued in the period to which they relate and adjustments are made when actual amounts are known.
Income Tax Information and Distributions to Shareholders. Each year, each Fund intends to qualify as a regulated investment company under Subchapter M of the Internal Revenue Code, including distributing substantially all of its taxable income and realized gains. As a result, no provision for U.S. Federal income taxes is required. As of December 31, 2020, each Fund did not have any unrecognized tax benefits in the financial statements; nor is each Fund aware of any tax positions for which it is reasonably possible that the total amounts of unrecognized tax benefits will significantly change in the next twelve months. Each Fund files a U.S. federal tax return, in addition to state and local tax returns as required. Each Fund's federal income tax returns are subject to examination by the Internal Revenue Service (IRS) for a period of three fiscal years after they are filed. State and local tax returns may be subject to examination for an additional fiscal year depending on the jurisdiction.
Distributions are declared and recorded on the ex-dividend date. Income and capital gain distributions are determined in accordance with income tax regulations, which may differ from GAAP.
Capital accounts within the financial statements are adjusted for permanent book-tax differences. These adjustments have no impact on net assets or the results of operations. Capital accounts are not adjusted for temporary book-tax differences which will reverse in a subsequent period.
Book-tax differences are primarily due to short-term gain distributions from the Underlying Funds and losses deferred due to wash sales.
As of period end, the cost and unrealized appreciation (depreciation) in securities, and derivatives if applicable, for federal income tax purposes were as follows for each Fund:
| | Tax cost | Gross unrealized appreciation | Gross unrealized depreciation | Net unrealized appreciation (depreciation) |
| VIP Freedom Lifetime Income I Portfolio | $10,997,652 | $1,562,168 | $(6,368) | $1,555,800 |
| VIP Freedom Lifetime Income II Portfolio | 28,542,823 | 5,717,790 | (28,702) | 5,689,088 |
| VIP Freedom Lifetime Income III Portfolio | 28,072,979 | 7,226,202 | (24,436) | 7,201,766 |
The tax-based components of distributable earnings as of period end were as follows for each Fund:
| | Undistributed ordinary income | Undistributed long-term capital gain | Net unrealized appreciation (depreciation) on securities and other investments |
| VIP Freedom Lifetime Income I Portfolio | $26,237 | $247,710 | $1,555,800 |
| VIP Freedom Lifetime Income II Portfolio | 51,189 | 1,004,141 | 5,689,088 |
| VIP Freedom Lifetime Income III Portfolio | 27,341 | 1,135,355 | 7,201,766 |
The tax character of distributions paid was as follows:
| December 31, 2020 | | | |
| | Ordinary Income | Long-term Capital Gains | Total |
| VIP Freedom Lifetime Income I Portfolio | $220,220 | $362,311 | $582,531 |
| VIP Freedom Lifetime Income II Portfolio | 570,979 | 1,319,943 | 1,890,922 |
| VIP Freedom Lifetime Income III Portfolio | 565,608 | 1,344,822 | 1,910,430 |
| December 31, 2019 | | | |
| | Ordinary Income | Long-term Capital Gains | Total |
| VIP Freedom Lifetime Income I Portfolio | $306,216 | $95,784 | $402,000 |
| VIP Freedom Lifetime Income II Portfolio | 800,222 | 1,024,172 | 1,824,394 |
| VIP Freedom Lifetime Income III Portfolio | 742,658 | 1,002,345 | 1,745,003 |
3. Purchases and Sales of Investments.
Purchases and sales of securities, other than short-term securities, are noted in the table below.
| | Purchases ($) | Sales ($) |
| VIP Freedom Lifetime Income I Portfolio | 3,253,582 | 4,225,196 |
| VIP Freedom Lifetime Income II Portfolio | 10,790,091 | 13,033,152 |
| VIP Freedom Lifetime Income III Portfolio | 11,480,015 | 12,698,163 |
4. Fees and Other Transactions with Affiliates.
Management Fee. Fidelity Management & Research Company LLC (the investment adviser) provides the Funds with investment management related services. The Funds do not pay any fees for these services.
Interfund Trades. Funds may purchase from or sell securities to other Fidelity Funds under procedures adopted by the Board. The procedures have been designed to ensure these interfund trades are executed in accordance with Rule 17a-7 of the 1940 Act. Interfund trades are included within the respective purchases and sales amounts shown in the Purchases and Sales of Investments note.
5. Other.
The Funds' organizational documents provide former and current trustees and officers with a limited indemnification against liabilities arising in connection with the performance of their duties to the Funds. In the normal course of business, the Funds may also enter into contracts that provide general indemnifications. The Funds' maximum exposure under these arrangements is unknown as this would be dependent on future claims that may be made against the Funds. The risk of material loss from such claims is considered remote.
At the end of the period, the investment adviser or its affiliates were owners of record of all of the outstanding shares of the Funds.
6. Coronavirus (COVID-19) Pandemic.
An outbreak of COVID-19 first detected in China during December 2019 has since spread globally and was declared a pandemic by the World Health Organization during March 2020. Developments that disrupt global economies and financial markets, such as the COVID-19 pandemic, may magnify factors that affect the Funds' performance.
Report of Independent Registered Public Accounting Firm
To the Board of Trustees of Variable Insurance Products Fund V and the Shareholders of VIP Freedom Lifetime Income I Portfolio, VIP Freedom Lifetime Income II Portfolio and VIP Freedom Lifetime Income III Portfolio:
Opinion on the Financial Statements and Financial Highlights
We have audited the accompanying statements of assets and liabilities of VIP Freedom Lifetime Income I Portfolio, VIP Freedom Lifetime Income II Portfolio and VIP Freedom Lifetime Income III Portfolio (the "Funds"), each a fund of Variable Insurance Products Fund V, including the schedules of investments, as of December 31, 2020, the related statements of operations for the year then ended, the statements of changes in net assets for each of the two years in the period then ended, the financial highlights for each of the five years in the period then ended, and the related notes. In our opinion, the financial statements and financial highlights present fairly, in all material respects, the financial position of each of the Funds as of December 31, 2020, and the results of their operations for the year then ended, the changes in their net assets for each of the two years in the period then ended, and the financial highlights for each of the five years in the period then ended in conformity with accounting principles generally accepted in the United States of America.
Basis for Opinion
These financial statements and financial highlights are the responsibility of the Funds’ management. Our responsibility is to express an opinion on the Funds’ financial statements and financial highlights based on our audits. We are a public accounting firm registered with the Public Company Accounting Oversight Board (United States) (PCAOB) and are required to be independent with respect to the Funds in accordance with the U.S. federal securities laws and the applicable rules and regulations of the Securities and Exchange Commission and the PCAOB.
We conducted our audits in accordance with the standards of the PCAOB. Those standards require that we plan and perform the audit to obtain reasonable assurance about whether the financial statements and financial highlights are free of material misstatement, whether due to error or fraud. The Funds are not required to have, nor were we engaged to perform, an audit of their internal control over financial reporting. As part of our audits we are required to obtain an understanding of internal control over financial reporting but not for the purpose of expressing an opinion on the effectiveness of the Funds’ internal control over financial reporting. Accordingly, we express no such opinion.
Our audits included performing procedures to assess the risks of material misstatement of the financial statements and financial highlights, whether due to error or fraud, and performing procedures that respond to those risks. Such procedures included examining, on a test basis, evidence regarding the amounts and disclosures in the financial statements and financial highlights. Our audits also included evaluating the accounting principles used and significant estimates made by management, as well as evaluating the overall presentation of the financial statements and financial highlights. Our procedures included confirmation of securities owned as of December 31, 2020, by correspondence with the custodian and brokers; when replies were not received from brokers, we performed other auditing procedures. We believe that our audits provide a reasonable basis for our opinion.
/s/ Deloitte & Touche LLP
Boston, Massachusetts
February 12, 2021
We have served as the auditor of one or more of the Fidelity investment companies since 1999.
Trustees and Officers
The Trustees, Members of the Advisory Board (if any), and officers of the trusts and funds, as applicable, are listed below. The Board of Trustees governs each fund and is responsible for protecting the interests of shareholders. The Trustees are experienced executives who meet periodically throughout the year to oversee each fund's activities, review contractual arrangements with companies that provide services to each fund, oversee management of the risks associated with such activities and contractual arrangements, and review each fund's performance. If the interests of a fund and an underlying Fidelity® fund were to diverge, a conflict of interest could arise and affect how the Trustees and Members of the Advisory Board fulfill their fiduciary duties to the affected funds. FMR has structured the funds to avoid these potential conflicts, although there may be situations where a conflict of interest is unavoidable. In such instances, FMR, the Trustees, and Members of the Advisory Board would take reasonable steps to minimize and, if possible, eliminate the conflict. Each of the Trustees oversees 280 funds.
The Trustees hold office without limit in time except that (a) any Trustee may resign; (b) any Trustee may be removed by written instrument, signed by at least two-thirds of the number of Trustees prior to such removal; (c) any Trustee who requests to be retired or who has become incapacitated by illness or injury may be retired by written instrument signed by a majority of the other Trustees; and (d) any Trustee may be removed at any special meeting of shareholders by a two-thirds vote of the outstanding voting securities of the trust. Each Trustee who is not an interested person (as defined in the 1940 Act) of the trust and the funds is referred to herein as an Independent Trustee. Each Independent Trustee shall retire not later than the last day of the calendar year in which his or her 75th birthday occurs. The Independent Trustees may waive this mandatory retirement age policy with respect to individual Trustees. Officers and Advisory Board Members hold office without limit in time, except that any officer or Advisory Board Member may resign or may be removed by a vote of a majority of the Trustees at any regular meeting or any special meeting of the Trustees. Except as indicated, each individual has held the office shown or other offices in the same company for the past five years.
Each fund’s Statement of Additional Information (SAI) includes more information about the Trustees. To request a free copy, call Fidelity at 1-877-208-009.
Experience, Skills, Attributes, and Qualifications of the Trustees. The Governance and Nominating Committee has adopted a statement of policy that describes the experience, qualifications, attributes, and skills that are necessary and desirable for potential Independent Trustee candidates (Statement of Policy). The Board believes that each Trustee satisfied at the time he or she was initially elected or appointed a Trustee, and continues to satisfy, the standards contemplated by the Statement of Policy. The Governance and Nominating Committee also engages professional search firms to help identify potential Independent Trustee candidates who have the experience, qualifications, attributes, and skills consistent with the Statement of Policy. From time to time, additional criteria based on the composition and skills of the current Independent Trustees, as well as experience or skills that may be appropriate in light of future changes to board composition, business conditions, and regulatory or other developments, have also been considered by the professional search firms and the Governance and Nominating Committee. In addition, the Board takes into account the Trustees' commitment and participation in Board and committee meetings, as well as their leadership of standing and ad hoc committees throughout their tenure.
In determining that a particular Trustee was and continues to be qualified to serve as a Trustee, the Board has considered a variety of criteria, none of which, in isolation, was controlling. The Board believes that, collectively, the Trustees have balanced and diverse experience, qualifications, attributes, and skills, which allow the Board to operate effectively in governing each fund and protecting the interests of shareholders. Information about the specific experience, skills, attributes, and qualifications of each Trustee, which in each case led to the Board's conclusion that the Trustee should serve (or continue to serve) as a trustee of the funds, is provided below.
Board Structure and Oversight Function. Abigail P. Johnson is an interested person and currently serves as Chairman. The Trustees have determined that an interested Chairman is appropriate and benefits shareholders because an interested Chairman has a personal and professional stake in the quality and continuity of services provided to the funds. Independent Trustees exercise their informed business judgment to appoint an individual of their choosing to serve as Chairman, regardless of whether the Trustee happens to be independent or a member of management. The Independent Trustees have determined that they can act independently and effectively without having an Independent Trustee serve as Chairman and that a key structural component for assuring that they are in a position to do so is for the Independent Trustees to constitute a substantial majority for the Board. The Independent Trustees also regularly meet in executive session. Arthur E. Johnson serves as Chairman of the Independent Trustees and as such (i) acts as a liaison between the Independent Trustees and management with respect to matters important to the Independent Trustees and (ii) with management prepares agendas for Board meetings.
Fidelity® funds are overseen by different Boards of Trustees. The funds' Board oversees Fidelity's investment-grade bond, money market, asset allocation and certain equity funds, and other Boards oversee Fidelity's high income and other equity funds. The asset allocation funds may invest in Fidelity® funds that are overseen by such other Boards. The use of separate Boards, each with its own committee structure, allows the Trustees of each group of Fidelity® funds to focus on the unique issues of the funds they oversee, including common research, investment, and operational issues. On occasion, the separate Boards establish joint committees to address issues of overlapping consequences for the Fidelity® funds overseen by each Board.
The Trustees operate using a system of committees to facilitate the timely and efficient consideration of all matters of importance to the Trustees, each fund, and fund shareholders and to facilitate compliance with legal and regulatory requirements and oversight of the funds' activities and associated risks. The Board, acting through its committees, has charged FMR and its affiliates with (i) identifying events or circumstances the occurrence of which could have demonstrably adverse effects on the funds' business and/or reputation; (ii) implementing processes and controls to lessen the possibility that such events or circumstances occur or to mitigate the effects of such events or circumstances if they do occur; and (iii) creating and maintaining a system designed to evaluate continuously business and market conditions in order to facilitate the identification and implementation processes described in (i) and (ii) above. Because the day-to-day operations and activities of the funds are carried out by or through FMR, its affiliates, and other service providers, the funds' exposure to risks is mitigated but not eliminated by the processes overseen by the Trustees. While each of the Board's committees has responsibility for overseeing different aspects of the funds' activities, oversight is exercised primarily through the Operations and Audit Committees. In addition, an ad hoc Board committee of Independent Trustees has worked with FMR to enhance the Board's oversight of investment and financial risks, legal and regulatory risks, technology risks, and operational risks, including the development of additional risk reporting to the Board. Appropriate personnel, including but not limited to the funds' Chief Compliance Officer (CCO), FMR's internal auditor, the independent accountants, the funds' Treasurer and portfolio management personnel, make periodic reports to the Board's committees, as appropriate, including an annual review of Fidelity's risk management program for the Fidelity® funds. The responsibilities of each standing committee, including their oversight responsibilities, are described further under "Standing Committees of the Trustees."
Interested Trustees*:
Correspondence intended for a Trustee who is an interested person may be sent to Fidelity Investments, 245 Summer Street, Boston, Massachusetts 02210.
Name, Year of Birth; Principal Occupations and Other Relevant Experience+
Abigail P. Johnson (1961)
Year of Election or Appointment: 2009
Trustee
Chairman of the Board of Trustees
Ms. Johnson also serves as Trustee of other Fidelity® funds. Ms. Johnson serves as Chairman (2016-present), Chief Executive Officer (2014-present), and Director (2007-present) of FMR LLC (diversified financial services company), President of Fidelity Financial Services (2012-present) and President of Personal, Workplace and Institutional Services (2005-present). Ms. Johnson is Chairman and Director of Fidelity Management & Research Company LLC (investment adviser firm, 2011-present). Previously, Ms. Johnson served as Chairman and Director of FMR Co., Inc. (investment adviser firm, 2011-2019), Vice Chairman (2007-2016) and President (2013-2016) of FMR LLC, President and a Director of Fidelity Management & Research Company (2001-2005), a Trustee of other investment companies advised by Fidelity Management & Research Company, Fidelity Investments Money Management, Inc. (investment adviser firm), and FMR Co., Inc. (2001-2005), Senior Vice President of the Fidelity® funds (2001-2005), and managed a number of Fidelity® funds. Ms. Abigail P. Johnson and Mr. Arthur E. Johnson are not related.
Jennifer Toolin McAuliffe (1959)
Year of Election or Appointment: 2016
Trustee
Ms. McAuliffe also serves as Trustee of other Fidelity® funds. Previously, Ms. McAuliffe served as Co-Head of Fixed Income of Fidelity Investments Limited (now known as FIL Limited (FIL)) (diversified financial services company), Director of Research for FIL’s credit and quantitative teams in London, Hong Kong and Tokyo and Director of Research for taxable and municipal bonds at Fidelity Investments Money Management, Inc. Ms. McAuliffe previously served as a member of the Advisory Board of certain Fidelity® funds (2016). Ms. McAuliffe was previously a lawyer at Ropes & Gray LLP and currently serves as director or trustee of several not-for-profit entities.
* Determined to be an “Interested Trustee” by virtue of, among other things, his or her affiliation with the trust or various entities under common control with FMR.
+ The information includes the Trustee's principal occupation during the last five years and other information relating to the experience, attributes, and skills relevant to the Trustee's qualifications to serve as a Trustee, which led to the conclusion that the Trustee should serve as a Trustee for each fund.
Independent Trustees:
Correspondence intended for an Independent Trustee may be sent to Fidelity Investments, P.O. Box 55235, Boston, Massachusetts 02205-5235.
Name, Year of Birth; Principal Occupations and Other Relevant Experience+
Elizabeth S. Acton (1951)
Year of Election or Appointment: 2013
Trustee
Ms. Acton also serves as Trustee of other Fidelity® funds. Prior to her retirement, Ms. Acton served as Executive Vice President, Finance (2011-2012), Executive Vice President, Chief Financial Officer (2002-2011) and Treasurer (2004-2005) of Comerica Incorporated (financial services). Prior to joining Comerica, Ms. Acton held a variety of positions at Ford Motor Company (1983-2002), including Vice President and Treasurer (2000-2002) and Executive Vice President and Chief Financial Officer of Ford Motor Credit Company (1998-2000). Ms. Acton currently serves as a member of the Board and Audit and Finance Committees of Beazer Homes USA, Inc. (homebuilding, 2012-present). Ms. Acton previously served as a member of the Advisory Board of certain Fidelity® funds (2013-2016).
Ann E. Dunwoody (1953)
Year of Election or Appointment: 2018
Trustee
General Dunwoody also serves as Trustee of other Fidelity® funds. General Dunwoody (United States Army, Retired) was the first woman in U.S. military history to achieve the rank of four-star general and prior to her retirement in 2012 held a variety of positions within the U.S. Army, including Commanding General, U.S. Army Material Command (2008-2012). General Dunwoody currently serves as President of First to Four LLC (leadership and mentoring services, 2012-present), a member of the Board and Nomination and Corporate Governance Committees of Kforce Inc. (professional staffing services, 2016-present) and a member of the Board of Automattic Inc. (software engineering, 2018-present). Previously, General Dunwoody served as a member of the Advisory Board and Nominating and Corporate Governance Committee of L3 Technologies, Inc. (communication, electronic, sensor and aerospace systems, 2013-2019) and a member of the Board and Audit and Sustainability and Corporate Responsibility Committees of Republic Services, Inc. (waste collection, disposal and recycling, 2013-2016). Ms. Dunwoody also serves on several boards for non-profit organizations, including as a member of the Board, Chair of the Nomination and Governance Committee and a member of the Audit Committee of Logistics Management Institute (consulting non-profit, 2012-present), a member of the Council of Trustees for the Association of the United States Army (advocacy non-profit, 2013-present), a member of the Board of Florida Institute of Technology (2015-present) and a member of the Board of ThanksUSA (military family education non-profit, 2014-present). General Dunwoody previously served as a member of the Advisory Board of certain Fidelity® funds (2018).
John Engler (1948)
Year of Election or Appointment: 2014
Trustee
Mr. Engler also serves as Trustee of other Fidelity® funds. Previously, Mr. Engler served as Governor of Michigan (1991-2003), President of the Business Roundtable (2011-2017) and interim President of Michigan State University (2018-2019). Mr. Engler currently serves as a member of the Board of K12 Inc. (technology-based education company, 2012-present). Previously, Mr. Engler served as a member of the Board of Universal Forest Products (manufacturer and distributor of wood and wood-alternative products, 2003-2019) and Trustee of The Munder Funds (2003-2014). Mr. Engler previously served as a member of the Advisory Board of certain Fidelity® funds (2014-2016).
Robert F. Gartland (1951)
Year of Election or Appointment: 2010
Trustee
Mr. Gartland also serves as Trustee of other Fidelity® funds. Prior to his retirement, Mr. Gartland held a variety of positions at Morgan Stanley (financial services, 1979-2007), including Managing Director (1987-2007) and Chase Manhattan Bank (1975-1978). Mr. Gartland previously served as Chairman and an investor in Gartland & Mellina Group Corp. (consulting, 2009-2019), as a member of the Board of National Securities Clearing Corporation (1993-1996) and as Chairman of TradeWeb (2003-2004).
Arthur E. Johnson (1947)
Year of Election or Appointment: 2008
Trustee
Chairman of the Independent Trustees
Mr. Johnson also serves as Trustee of other Fidelity® funds. Prior to his retirement, Mr. Johnson served as Senior Vice President of Corporate Strategic Development of Lockheed Martin Corporation (defense contractor, 1999-2009). Mr. Johnson currently serves as a member of the Board of Booz Allen Hamilton (management consulting, 2011-present). Mr. Johnson previously served as a member of the Board of Eaton Corporation plc (diversified power management, 2009-2019) and a member of the Board of AGL Resources, Inc. (holding company, 2002-2016). Mr. Johnson previously served as Vice Chairman (2015-2018) of the Independent Trustees of certain Fidelity® funds. Mr. Arthur E. Johnson is not related to Ms. Abigail P. Johnson.
Michael E. Kenneally (1954)
Year of Election or Appointment: 2009
Trustee
Vice Chairman of the Independent Trustees
Mr. Kenneally also serves as Trustee of other Fidelity® funds. Prior to his retirement, Mr. Kenneally served as Chairman and Global Chief Executive Officer of Credit Suisse Asset Management and Executive Vice President and Chief Investment Officer of Bank of America Corporation. Earlier roles at Bank of America included Director of Research, Senior Portfolio Manager for various institutional equity accounts and mutual funds and Portfolio Manager for a number of institutional fixed-income clients. Mr. Kenneally began his career as a Research Analyst in 1983 and was awarded the Chartered Financial Analyst (CFA) designation in 1991.
Marie L. Knowles (1946)
Year of Election or Appointment: 2001
Trustee
Ms. Knowles also serves as Trustee of other Fidelity® funds. Prior to her retirement, Ms. Knowles held several positions at Atlantic Richfield Company (diversified energy), including Executive Vice President and Chief Financial Officer (1996-2000), Senior Vice President (1993-1996) and President of ARCO Transportation Company (pipeline and tanker operations, 1993-1996). Ms. Knowles currently serves as a member of the Board of McKesson Corporation (healthcare service, since 2002), a member of the Board of the Santa Catalina Island Company (real estate, 2009-present), a member of the Investment Company Institute Board of Governors and a member of the Governing Council of the Independent Directors Council (2014-present). Ms. Knowles also serves as a member of the Advisory Board for the School of Engineering of the University of Southern California. Ms. Knowles previously served as Chairman (2015-2018) and Vice Chairman (2012-2015) of the Independent Trustees of certain Fidelity® funds.
Mark A. Murray (1954)
Year of Election or Appointment: 2016
Trustee
Mr. Murray also serves as Trustee of other Fidelity® funds. Previously, Mr. Murray served as Co-Chief Executive Officer (2013-2016), President (2006-2013) and Vice Chairman (2013-2020) of Meijer, Inc. Mr. Murray serves as a member of the Board and Nuclear Review and Public Policy and Responsibility Committees of DTE Energy Company (diversified energy company, 2009-present) and a member of the Board and Audit Committee and Chairman of the Nominating and Corporate Governance Committee of Universal Forest Products, Inc. (manufacturer and distributor of wood and wood-alternative products, 2004-2016). Mr. Murray previously served as a member of the Board of Spectrum Health (not-for-profit health system, 2015-2019). Mr. Murray also serves as a member of the Board of many community and professional organizations. Mr. Murray previously served as a member of the Advisory Board of certain Fidelity® funds (2016).
+ The information includes the Trustee's principal occupation during the last five years and other information relating to the experience, attributes, and skills relevant to the Trustee's qualifications to serve as a Trustee, which led to the conclusion that the Trustee should serve as a Trustee for each fund.
Advisory Board Members and Officers:
Correspondence intended for an officer may be sent to Fidelity Investments, 245 Summer Street, Boston, Massachusetts 02210. Officers appear below in alphabetical order.
Name, Year of Birth; Principal Occupation
Craig S. Brown (1977)
Year of Election or Appointment: 2019
Assistant Treasurer
Mr. Brown also serves as Assistant Treasurer of other funds. Mr. Brown is an employee of Fidelity Investments (2013-present).
John J. Burke III (1964)
Year of Election or Appointment: 2018
Chief Financial Officer
Mr. Burke also serves as Chief Financial Officer of other funds. Mr. Burke serves as Head of Investment Operations for Fidelity Fund and Investment Operations (2018-present) and is an employee of Fidelity Investments (1998-present). Previously Mr. Burke served as head of Asset Management Investment Operations (2012-2018).
David J. Carter (1973)
Year of Election or Appointment: 2020
Assistant Secretary
Mr. Carter also serves as Assistant Secretary of other funds. Mr. Carter serves as Vice President, Associate General Counsel (2010-present) and is an employee of Fidelity Investments (2005-present).
Jonathan Davis (1968)
Year of Election or Appointment: 2010
Assistant Treasurer
Mr. Davis also serves as Assistant Treasurer of other funds. Mr. Davis serves as Assistant Treasurer of FMR Capital, Inc. (2017-present) and is an employee of Fidelity Investments. Previously, Mr. Davis served as Vice President and Associate General Counsel of FMR LLC (diversified financial services company, 2003-2010).
Laura M. Del Prato (1964)
Year of Election or Appointment: 2018
President and Treasurer
Ms. Del Prato also serves as an officer of other funds. Ms. Del Prato is an employee of Fidelity Investments (2017-present). Previously, Ms. Del Prato served as President and Treasurer of The North Carolina Capital Management Trust: Cash Portfolio and Term Portfolio (2018-2020). Prior to joining Fidelity Investments, Ms. Del Prato served as a Managing Director and Treasurer of the JPMorgan Mutual Funds (2014-2017). Prior to JPMorgan, Ms. Del Prato served as a partner at Cohen Fund Audit Services (accounting firm, 2012-2013) and KPMG LLP (accounting firm, 2004-2012).
Colm A. Hogan (1973)
Year of Election or Appointment: 2016
Assistant Treasurer
Mr. Hogan also serves as an officer of other funds. Mr. Hogan serves as Assistant Treasurer of FMR Capital, Inc. (2017-present) and is an employee of Fidelity Investments (2005-present). Previously, Mr. Hogan served as Deputy Treasurer of certain Fidelity® funds (2016-2020) and Assistant Treasurer of certain Fidelity® funds (2016-2018).
Cynthia Lo Bessette (1969)
Year of Election or Appointment: 2019
Secretary and Chief Legal Officer (CLO)
Ms. Lo Bessette also serves as an officer of other funds. Ms. Lo Bessette serves as CLO, Secretary, and Senior Vice President of Fidelity Management & Research Company LLC (investment adviser firm, 2019-present); and CLO of Fidelity Management & Research (Hong Kong) Limited, FMR Investment Management (UK) Limited, and Fidelity Management & Research (Japan) Limited (investment adviser firms, 2019-present). She is a Senior Vice President and Deputy General Counsel of FMR LLC (diversified financial services company, 2019-present), and is an employee of Fidelity Investments. Previously, Ms. Lo Bessette served as CLO, Secretary, and Senior Vice President of FMR Co., Inc. (investment adviser firm, 2019); Secretary of Fidelity SelectCo, LLC and Fidelity Investments Money Management, Inc. (investment adviser firms, 2019). Prior to joining Fidelity Investments, Ms. Lo Bessette was Executive Vice President, General Counsel (2016-2019) and Senior Vice President, Deputy General Counsel (2015-2016) of OppenheimerFunds (investment management company) and Deputy Chief Legal Officer (2013-2015) of Jennison Associates LLC (investment adviser firm).
Chris Maher (1972)
Year of Election or Appointment: 2013
Assistant Treasurer
Mr. Maher also serves as an officer of other funds. Mr. Maher serves as Assistant Treasurer of FMR Capital, Inc. (2017-present), and is an employee of Fidelity Investments (2008-present). Previously, Mr. Maher served as Assistant Treasurer of certain funds (2013-2020); Vice President of Asset Management Compliance (2013), Vice President of the Program Management Group of FMR (investment adviser firm, 2010-2013), and Vice President of Valuation Oversight (2008-2010).
Kenneth B. Robins (1969)
Year of Election or Appointment: 2020
Chief Compliance Officer
Mr. Robins also serves as an officer of other funds. Mr. Robins serves as Compliance Officer of Fidelity Management & Research Company LLC (investment adviser firm, 2016-present) and is an employee of Fidelity Investments (2004-present). Previously, Mr. Robins served as Compliance Officer of FMR Co., Inc. (investment adviser firm, 2016-2019), as Executive Vice President of Fidelity Investments Money Management, Inc. (investment adviser firm, 2013-2016) and served in other fund officer roles.
Brett Segaloff (1972)
Year of Election or Appointment: 2021
Anti-Money Laundering (AML) Officer
Mr. Segaloff also serves as an AML Officer of other funds and other related entities. He is Director, Anti-Money Laundering (2007-present) of FMR LLC (diversified financial services company) and is an employee of Fidelity Investments (1996-present).
Stacie M. Smith (1974)
Year of Election or Appointment: 2013
Assistant Treasurer
Ms. Smith also serves as an officer of other funds. Ms. Smith serves as Assistant Treasurer of FMR Capital, Inc. (2017-present), is an employee of Fidelity Investments (2009-present), and has served in other fund officer roles. Prior to joining Fidelity Investments, Ms. Smith served as Senior Audit Manager of Ernst & Young LLP (accounting firm, 1996-2009). Previously, Ms. Smith served as Assistant Treasurer (2013-2019) and Deputy Treasurer (2013-2016) of certain Fidelity® funds.
Marc L. Spector (1972)
Year of Election or Appointment: 2016
Deputy Treasurer
Mr. Spector also serves as an officer of other funds. Mr. Spector serves as Assistant Treasurer of FMR Capital, Inc. (2017-present) and is an employee of Fidelity Investments (2016-present). Prior to joining Fidelity Investments, Mr. Spector served as Director at the Siegfried Group (accounting firm, 2013-2016), and prior to Siegfried Group as audit senior manager at Deloitte & Touche LLP (accounting firm, 2005-2013).
Jim Wegmann (1979)
Year of Election or Appointment: 2019
Assistant Treasurer
Mr. Wegmann also serves as Assistant Treasurer of other funds. Mr. Wegmann is an employee of Fidelity Investments (2011-present).
Vadim Zlotnikov (1962)
Year of Election or Appointment: 2019
Vice President
Mr. Zlotnikov also serves as Vice President of other funds. Mr. Zlotnikov serves as President of FIAM (Fidelity Institutional Asset Management) and is an employee of Fidelity Investments (2018-present). Previously, Mr. Zlotnikov served as President and Chief Investment Officer of Global Asset Allocation (2018-2020). Prior to joining Fidelity Investments, Mr. Zlotnikov served as Co-Head of Multi-Asset Solutions, Chief Market Strategist, and CIO of Systematic Strategies with AllianceBernstein (investment adviser firm, 2002-2018).
Shareholder Expense Example
As a shareholder, you incur two types of costs: (1) transaction costs, which may include sales charges (loads) on purchase payments or redemption proceeds, as applicable and (2) ongoing costs, which generally include management fees, distribution and/or service (12b-1) fees and other Fund expenses. This Example is intended to help you understand your ongoing costs (in dollars) of investing in a fund and to compare these costs with the ongoing costs of investing in other mutual funds.
The Example is based on an investment of $1,000 invested at the beginning of the period and held for the entire period (July 1, 2020 to December 31, 2020).
Actual Expenses
The first line of the accompanying table provides information about actual account values and actual expenses. You may use the information in this line, together with the amount you invested, to estimate the expenses that you paid over the period. Simply divide your account value by $1,000.00 (for example, an $8,600 account value divided by $1,000.00 = 8.6), then multiply the result by the number in the first line for a class/Fund under the heading entitled "Expenses Paid During Period" to estimate the expenses you paid on your account during this period. If any fund is a shareholder of any underlying mutual funds or exchange-traded funds (ETFs) (the Underlying Funds), such fund indirectly bears its proportional share of the expenses of the Underlying Funds in addition to the direct expenses incurred presented in the table. These fees and expenses are not included in the annualized expense ratio used to calculate the expense estimate in the table below. The estimate of expenses does not include any fees or other expenses of any variable annuity or variable life insurance product. If they were, the estimate of expenses you paid during the period would be higher, and your ending account value would be lower.
Hypothetical Example for Comparison Purposes
The second line of the accompanying table provides information about hypothetical account values and hypothetical expenses based on the actual expense ratio and an assumed rate of return of 5% per year before expenses, which is not the actual return. The hypothetical account values and expenses may not be used to estimate the actual ending account balance or expenses you paid for the period. You may use this information to compare the ongoing costs of investing in the Fund and other funds. To do so, compare this 5% hypothetical example with the 5% hypothetical examples that appear in the shareholder reports of the other funds. If any fund is a shareholder of any Underlying Funds, such fund indirectly bears its proportional share of the expenses of the Underlying Funds in addition to the direct expenses as presented in the table. These fees and expenses are not included in the annualized expense ratio used to calculate the expense estimate in the table below. The estimate of expenses does not include any fees or other expenses of any variable annuity or variable life insurance product. If they were, the estimate of expenses you paid during the period would be higher, and your ending account value would be lower.
Please note that the expenses shown in the table are meant to highlight your ongoing costs only and do not reflect any transaction costs. Therefore, the second line of the table is useful in comparing ongoing costs only, and will not help you determine the relative total costs of owning different funds.
| | Annualized Expense Ratio-A | Beginning
Account Value
July 1, 2020 | Ending
Account Value
December 31, 2020 | Expenses Paid
During Period-B
July 1, 2020
to December 31, 2020 |
| VIP Freedom Lifetime Income I Portfolio | - %-C | | | |
| Actual | | $1,000.00 | $1,074.20 | $--D |
| Hypothetical-E | | $1,000.00 | $1,025.14 | $--D |
| VIP Freedom Lifetime Income II Portfolio | - %-C | | | |
| Actual | | $1,000.00 | $1,112.70 | $--D |
| Hypothetical-E | | $1,000.00 | $1,025.14 | $--D |
| VIP Freedom Lifetime Income III Portfolio | - %-C | | | |
| Actual | | $1,000.00 | $1,152.90 | $--D |
| Hypothetical-E | | $1,000.00 | $1,025.14 | $--D |
A Annualized expense ratio reflects expenses net of applicable fee waivers.
B Expenses are equal to the annualized expense ratio, multiplied by the average account value over the period, multiplied by 184/ 366 (to reflect the one-half year period). The fees and expenses of any Underlying Funds are not included in each annualized expense ratio.
C Amount represent less than .005%.
D Amount represent less than $.01.
E 5% return per year before expenses
Distributions (Unaudited)
The Board of Trustees of each fund voted to pay to shareholders of record at the opening of business on record date, the following distributions per share derived from capital gains realized from sales of portfolio securities, and dividends derived from net investment income:
| | Pay Date | Record Date | Dividends | Capital Gains |
| VIP Freedom Lifetime Income I | 02/12/21 | 02/12/21 | $0.002 | $0.267 |
| VIP Freedom Lifetime Income II | 02/12/21 | 02/12/21 | $0.001 | $0.436 |
| VIP Freedom Lifetime Income III | 02/12/21 | 02/12/21 | $0.001 | $0.485 |
|
The funds hereby designate as capital gain dividend the amounts noted below for the taxable year ended December 31, 2020, or, if subsequently determined to be different, the net capital gain of such year.
| VIP Freedom Lifetime Income I | $249,062 |
| VIP Freedom Lifetime Income II | $1,005,114 |
| VIP Freedom Lifetime Income III | $1,136,872 |
|
A percentage of the dividends distributed during the fiscal year for the following funds were derived from interest on U.S. Government securities which is generally exempt from state income tax:
| VIP Freedom Lifetime Income I | 12.32% |
| VIP Freedom Lifetime Income II | 8.49% |
| VIP Freedom Lifetime Income III | 5.89% |
|
A percentage of the dividends distributed during the fiscal year for the following funds qualify for the dividends–received deduction for corporate shareholders:
| VIP Freedom Lifetime Income I | |
| February 2020 | 0% |
| December 2020 | 5% |
| VIP Freedom Lifetime Income II | |
| February 2020 | 1% |
| December 2020 | 11% |
| VIP Freedom Lifetime Income III | |
| February 2020 | 0% |
| December 2020 | 18% |
|
The amounts per share which represent income derived from sources within, and taxes paid to, foreign countries or possessions of the United States are as follows:
| | Pay Date | Income | Taxes |
| VIP Freedom Lifetime Income I | 12/16/20 | $0.0174 | $0.0024 |
| VIP Freedom Lifetime Income II | 12/16/20 | $0.0274 | $0.0040 |
| VIP Freedom Lifetime Income III | 12/16/20 | $0.0365 | $0.0055 |
|
Board Approval of Investment Advisory Contracts and Management Fees
VIP Freedom Lifetime Income Funds
Each year, the Board of Trustees, including the Independent Trustees (together, the Board), votes on the renewal of the management contract with Fidelity Management & Research Company LLC (FMR) for each fund (the Advisory Contract). The Board, assisted by the advice of fund counsel and Independent Trustees' counsel, requests and considers a broad range of information relevant to the renewal of the Advisory Contracts throughout the year.
The Board meets regularly and, at each of its meetings, covers an extensive agenda of topics and materials and considers factors that are relevant to its annual consideration of the renewal of each fund's Advisory Contract, including the services and support provided to each fund and its shareholders. The Board has established four standing committees (Committees) — Operations, Audit, Fair Valuation, and Governance and Nominating — each composed of and chaired by Independent Trustees with varying backgrounds, to which the Board has assigned specific subject matter responsibilities in order to enhance effective decision-making by the Board. The Operations Committee, of which all of the Independent Trustees are members, meets regularly throughout the year and considers, among other matters, information specifically related to the annual consideration of the renewal of each fund's Advisory Contract. The Board, acting directly and through its Committees, requests and receives information concerning the annual consideration of the renewal of each fund's Advisory Contract. The Board also meets as needed to review matters specifically related to the Board's annual consideration of the renewal of the Advisory Contracts. Members of the Board may also meet with trustees of other Fidelity funds through joint ad hoc committees to discuss certain matters relevant to all of the Fidelity funds.
At its September 2020 meeting, the Board unanimously determined to renew each fund's Advisory Contract. In reaching its determination, the Board considered all factors it believed relevant and reached a determination, with the assistance of fund counsel and Independent Trustees' counsel and through the exercise of its business judgment, that the renewal of the Advisory Contract was in the best interests of each fund and its shareholders and that the fact that no fees are payable under the Advisory Contracts was fair and reasonable. The Board's decision to renew the Advisory Contracts was not based on any single factor, but rather was based on a comprehensive consideration of all the information provided to the Board at its meetings throughout the year. In reaching its determination, the Board was aware that shareholders of each fund have a broad range of investment choices available to them, including a wide choice among funds offered by Fidelity's competitors, and that each fund's shareholders, who have the opportunity to review and weigh the disclosure provided by the fund in its prospectus and other public disclosures, have chosen to invest in that fund, which is part of the Fidelity family of funds.
Nature, Extent, and Quality of Services Provided. The Board considered Fidelity's staffing as it relates to the funds, including the backgrounds of investment personnel of FMR, and also considered the funds' investment objectives, strategies, and related investment philosophies. The Independent Trustees also had discussions with senior management of Fidelity's investment operations and investment groups with responsibility for the underlying Fidelity funds in which each fund invests. The Board considered the structure of the investment personnel compensation program and whether this structure provides appropriate incentives to act in the best interests of each fund. Additionally, the Board considered the portfolio managers' investments, if any, in the funds that they manage.
Resources Dedicated to Investment Management and Support Services. The Board reviewed the general qualifications and capabilities of Fidelity's investment staff, including its size, education, experience, and resources, as well as Fidelity's approach to recruiting, managing, and compensating investment personnel. The Board noted that Fidelity has continued to increase the resources devoted to non-U.S. offices, including expansion of Fidelity's global investment organization. The Board also noted that Fidelity's analysts have extensive resources, tools and capabilities that allow them to conduct sophisticated quantitative and fundamental analysis, as well as credit analysis of issuers, counterparties and guarantors. Further, the Board considered that Fidelity's investment professionals have sufficient access to global information and data so as to provide competitive investment results over time, and that those professionals also have access to sophisticated tools that permit them to assess portfolio construction and risk and performance attribution characteristics continuously, as well as to transmit new information and research conclusions rapidly around the world. Additionally, in its deliberations, the Board considered Fidelity's risk management, compliance, and technology and operations capabilities and resources, which are integral parts of the investment management process. The Board also considered Fidelity's investments in business continuity planning, and its success in continuously providing services to the funds notwithstanding the severe disruptions caused by the COVID-19 pandemic.
Shareholder and Administrative Services. The Board considered (i) the nature, extent, quality, and cost of advisory, administrative, and shareholder services performed by Fidelity under the Advisory Contract and under separate agreements covering transfer agency, and pricing and bookkeeping services for each fund; (ii) the nature and extent of the supervision of third party service providers, principally custodians, subcustodians, and pricing vendors; and (iii) the resources devoted to, and the record of compliance with, each fund's compliance policies and procedures.
The Board noted that the growth of fund assets over time across the complex allows Fidelity to reinvest in the development of services designed to enhance the value and convenience of the Fidelity funds as investment vehicles. These services include 24-hour access to account information and market information over the Internet and through telephone representatives, investor education materials and asset allocation tools, and the expanded availability of Fidelity Investor Centers.
Investment in a Large Fund Family. The Board considered the benefits to shareholders of investing in a Fidelity fund, including the benefits of investing in a fund that is part of a large family of funds offering a variety of investment disciplines and providing a large variety of mutual fund investor services. The Board noted that Fidelity had taken, or had made recommendations that resulted in the Fidelity funds taking, a number of actions over the previous year that benefited particular funds, including: (i) continuing to dedicate additional resources to Fidelity's investment research process, which includes meetings with management of issuers of securities in which the funds invest, and to the support of the senior management team that oversees asset management; (ii) continuing efforts to enhance Fidelity's global research capabilities; (iii) launching new funds and ETFs with innovative structures, strategies and pricing and making other enhancements to meet client needs; (iv) launching new share classes of existing funds; (v) eliminating purchase minimums and broadening eligibility requirements for certain funds and share classes; (vi) reducing management fees and total expenses for certain target date funds or classes and index funds; (vii) lowering expenses for certain funds and classes by implementing or lowering expense caps; (viii) rationalizing product lines and gaining increased efficiencies from fund mergers, liquidations, and share class consolidations; (ix) continuing to develop, acquire and implement systems and technology to improve services to the funds and shareholders, strengthen information security, and increase efficiency; and (x) continuing to implement enhancements to further strengthen Fidelity's product line to increase investors' probability of success in achieving their investment goals, including retirement income goals.
Investment Performance. The Board considered whether each fund has operated in accordance with its investment objective, as well as its record of compliance with its investment restrictions and its performance history.
The Board took into account discussions that occur at Board meetings throughout the year with representatives of the investment adviser about fund investment performance. In this regard the Board noted that as part of regularly scheduled fund reviews and other reports to the Board on fund performance, the Board considers annualized return information for each fund for different time periods, measured against one or more appropriate securities market indices, including a customized blended index that reflects the respective weights of the fund's asset classes (each a benchmark index). In its evaluation of fund investment performance at meetings throughout the year, the Board gave particular attention to information indicating underperformance of certain Fidelity funds for specific time periods and discussed with the investment adviser the reasons for such underperformance.
In addition to reviewing absolute and relative fund performance, the Independent Trustees periodically consider the appropriateness of fund performance metrics in evaluating the results achieved. In general, the Independent Trustees believe that fund performance should be evaluated based on gross performance (before fees and expenses, including acquired fund fees and expenses, but after transaction costs, if any) compared to appropriate benchmark indices, over appropriate time periods that may include full market cycles, taking into account relevant factors including the following: general market conditions; the extent to which particular underlying funds affected performance; and fund cash flows and other factors. The Independent Trustees generally give greater weight to fund performance over longer time periods than over shorter time periods. Depending on the circumstances, the Independent Trustees may be satisfied with a fund's performance notwithstanding that it lags its benchmark index for certain periods.
The Independent Trustees recognize that shareholders evaluate performance on a net basis over their own holding periods, for which one-, three-, and five-year periods are often used as a proxy. For this reason, the performance information reviewed by the Board also included net cumulative calendar year total return information for each fund and an appropriate benchmark index for the most recent one-, three-, and five-year periods. Due to the characteristics of the funds, no peer group performance information was considered by the Board. The Independent Trustees recognize that shareholders who are not investing through a tax-advantaged retirement account also consider tax consequences in evaluating performance.
Based on its review, the Board concluded that the nature, extent, and quality of services provided to each fund under the Advisory Contracts should continue to benefit the shareholders of each fund.
Competitiveness of Management Fee and Total Expense Ratio. The Board noted that the funds do not pay FMR a management fee for investment advisory services, and that each fund bears indirectly the fees and expenses, including the management fees, paid by the underlying Fidelity funds in which it invests. The Board considered each fund's management fee and total expense ratio compared to "mapped groups" of competitive funds and classes created for the purpose of facilitating the Trustees' competitive analysis of management fees and total expenses. Fidelity creates "mapped groups" by combining similar Lipper investment objective categories that have comparable investment mandates. Combining Lipper investment objective categories aids the Board's management fee and total expense ratio comparisons by broadening the competitive group used for comparison.
Management Fee. The Board considered two proprietary management fee comparisons for the 12-month periods shown in basis points (BP) in the charts below. The group of Lipper funds used by the Board for management fee comparisons is referred to below as the "Total Mapped Group." The Total Mapped Group comparison focuses on a fund's standing in terms of gross management fees before expense reimbursements or caps relative to the total universe of funds with comparable investment mandates, regardless of whether their management fee structures also are comparable. Funds with comparable investment mandates offer exposure to similar types of securities. Funds with comparable management fee structures have similar management fee contractual arrangements (
e.g., flat rate charged for advisory services, all-inclusive fee rate,
etc.). "TMG %" represents the percentage of funds in the Total Mapped Group that had management fees that were lower than a fund's. For example, a hypothetical TMG % of 20% would mean that 80% of the funds in the Total Mapped Group had higher, and 20% had lower, management fees than a fund. The funds' actual TMG %s and the number of funds in the Total Mapped Group are in the charts below. The "Asset-Sized Peer Group" (ASPG) comparison focuses on a fund's standing relative to a subset of non-Fidelity funds within the Total Mapped Group that are similar in size and management fee structure. For example, if a fund is in the first quartile of the ASPG, the fund's management fee ranks in the least expensive or lowest 25% of funds in the ASPG. The ASPG represents at least 15% of the funds in the Total Mapped Group with comparable asset size and management fee structures, subject to a minimum of 50 funds (or all funds in the Total Mapped Group if fewer than 50). Additional information, such as the ASPG quartile in which a fund's management fee rate ranked, is also included in the charts and was considered by the Board.
VIP Freedom Lifetime Income I Portfolio

VIP Freedom Lifetime Income II Portfolio
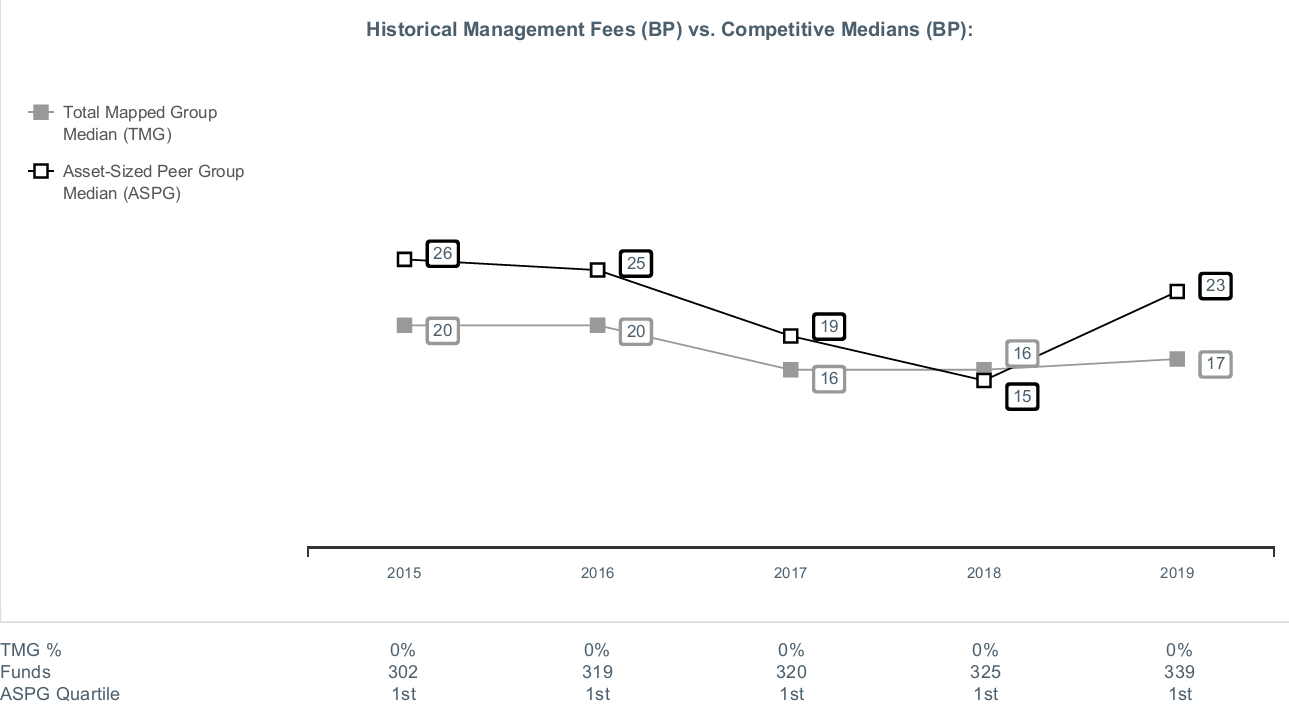
VIP Freedom Lifetime Income III Portfolio

The Board noted that each fund's management fee rate of 0.00% ranked below the median of its Total Mapped Group and below the median of its ASPG for 2019. The Board further noted that many peer funds pay fund-level expenses, including management fees, to which the funds are not subject.
Based on its review, the Board concluded that each fund's management fee is fair and reasonable in light of the services that the fund receives and the other factors considered.
Total Expense Ratio. In its review of each fund's total expense ratio, the Board considered that the funds do not pay transfer agent fees. Instead, the applicable class of each underlying Fidelity fund bears its pro rata portion of each fund's transfer agent fee according to the percentage of each fund's assets invested in that underlying fund. The Board further noted that FMR pays all other expenses of each fund, with limited exceptions.
The Board noted that each fund's total expense ratio ranked below the competitive median for 2019.
In considering each fund's total expense ratio, the Board also considered an alternative competitive analysis that included both top level (
i.e., direct) fund fees and acquired fund fees and expenses for the fund and the other funds and classes to which it is compared. The Board noted that, under this alternative competitive analysis, each fund's total expense ratio ranked below the competitive median for 2019.
Fees Charged to Other Fidelity Clients. The Board also considered Fidelity fee structures and other information with respect to clients of Fidelity, such as other funds advised or subadvised by Fidelity, pension plan clients, and other institutional clients with similar mandates. The Board noted that a joint ad hoc committee created by it and the boards of other Fidelity funds periodically reviews and compares Fidelity's institutional investment advisory business with its business of providing services to the Fidelity funds and also noted the most recent findings of the committee. The Board noted that the committee's review included a consideration of the differences in services provided, fees charged, and costs incurred, as well as competition in the markets serving the different categories of clients.
Based on its review of total expense ratios and fees charged to other Fidelity clients, the Board concluded that each fund's total expense ratio was reasonable in light of the services that the fund and its shareholders receive and the other factors considered.
Costs of the Services and Profitability. The Board considered the level of Fidelity's profits in respect of all the Fidelity funds, including the Fidelity funds in which the funds invest.
A public accounting firm has been engaged annually by the Board as part of the Board's assessment of Fidelity's profitability analysis. The engagement includes the review and assessment of the methodologies used by Fidelity in determining the revenues and expenses attributable to Fidelity's mutual fund business, and completion of agreed-upon procedures in respect of the mathematical accuracy of certain fund profitability information and its conformity to established allocation methodologies. After considering the reports issued under the engagement and information provided by Fidelity, the Board concluded that while other allocation methods may also be reasonable, Fidelity's profitability methodologies are reasonable in all material respects.
The Board also reviewed Fidelity's non-fund businesses and potential indirect benefits such businesses may have received as a result of their association with Fidelity's mutual fund business (i.e., fall-out benefits) as well as cases where Fidelity's affiliates may benefit from the funds' business. The Board considered areas where potential indirect benefits to the Fidelity funds from their relationships with Fidelity may exist. The Board also considered that in 2019 a joint ad hoc committee created by it and the boards of other Fidelity funds evaluated potential fall-out benefits (PFOB Committee). The Board noted that it considered the PFOB Committee's findings in connection with its consideration of the renewal of the Advisory Contracts.
The Board concluded that the costs of the services provided by and the profits realized by Fidelity in connection with the operation of each fund were not relevant to the renewal of each fund's Advisory Contract because the funds do not pay management fees and FMR pays all other expenses of each fund, with limited exceptions.
Economies of Scale. The Board concluded that because the funds do not pay management fees and FMR pays all other expenses of each fund, with limited exceptions, economies of scale cannot be realized by the funds, but may be realized by the other Fidelity funds in which each fund invests, many of which may benefit from breakpoints under the group fee arrangement.
Additional Information Requested by the Board. In order to develop fully the factual basis for consideration of the Fidelity funds' advisory contracts, the Board requested and received additional information on certain topics, including: (i) Fidelity's fund profitability methodology, profitability trends for certain funds, the allocation of various costs to different funds, and the impact of certain factors on fund profitability results; (ii) portfolio manager changes that have occurred during the past year and the amount of the investment that each portfolio manager has made in the Fidelity fund(s) that he or she manages; (iii) Fidelity's compensation structure for portfolio managers, research analysts, and other key personnel, including its effects on fund profitability, the rationale for the compensation structure, and the extent to which current market conditions have affected retention and recruitment; (iv) the arrangements with and compensation paid to certain fund sub-advisers on behalf of the Fidelity funds and the treatment of such compensation within Fidelity's fund profitability methodology; (v) the terms of the funds' various management fee structures, including the basic group fee and the terms of Fidelity's voluntary expense limitation agreements; (vi) Fidelity's transfer agent fee, expense, and service structures for different funds and classes relative to competitive trends; (vii) the impact on fund profitability of recent industry trends, such as the growth in passively managed funds and outflows from actively managed equity funds; and (viii) explanations regarding the relative total expense ratios of certain funds and classes, total expense competitive trends and methodologies for total expense competitive comparisons, and actions that might be taken by Fidelity to reduce total expense ratios for certain classes. In addition, the Board considered its discussions with Fidelity regarding Fidelity's efforts to maintain the continuous investment and shareholder services necessary for the funds during the current pandemic and economic circumstances.
Based on its evaluation of all of the conclusions noted above, and after considering all factors it believed relevant, the Board concluded that the advisory fee arrangements are fair and reasonable, and that each fund's Advisory Contract should be renewed.
VIPFLI-ANN-0221
1.816199.115
Fidelity® Variable Insurance Products:
Investor Freedom® Funds - Income, 2005, 2010, 2015, 2020, 2025, 2030
Investor Freedom Income® Portfolio
Investor Freedom® 2005 Portfolio
Investor Freedom® 2010 Portfolio
Investor Freedom® 2015 Portfolio
Investor Freedom® 2020 Portfolio
Investor Freedom® 2025 Portfolio
Investor Freedom® 2030 Portfolio
Annual Report
December 31, 2020
Contents
To view a fund's proxy voting guidelines and proxy voting record for the 12-month period ended June 30, visit http://www.fidelity.com/proxyvotingresults or visit the Securities and Exchange Commission's (SEC) web site at http://www.sec.gov.
You may also call 1-877-208-0098 to request a free copy of the proxy voting guidelines.
Fidelity® Variable Insurance Products are separate account options which are purchased through a variable insurance contract.
Standard & Poor's, S&P and S&P 500 are registered service marks of The McGraw-Hill Companies, Inc. and have been licensed for use by Fidelity Distributors Corporation.
Other third-party marks appearing herein are the property of their respective owners.
All other marks appearing herein are registered or unregistered trademarks or service marks of FMR LLC or an affiliated company. © 2021 FMR LLC. All rights reserved.
This report and the financial statements contained herein are submitted for the general information of the shareholders of the Funds. This report is not authorized for distribution to prospective investors in the Funds unless preceded or accompanied by an effective prospectus.
A fund files its complete schedule of portfolio holdings with the SEC for the first and third quarters of each fiscal year on Form N-PORT. Forms N-PORT are available on the SEC’s web site at http://www.sec.gov. A fund's Forms N-PORT may be reviewed and copied at the SEC’s Public Reference Room in Washington, DC. Information regarding the operation of the SEC's Public Reference Room may be obtained by calling 1-800-SEC-0330.
For a complete list of a fund's portfolio holdings, view the most recent holdings listing, semiannual report, or annual report on Fidelity's web site at http://www.fidelity.com, http://www.institutional.fidelity.com, or http://www.401k.com, as applicable.
NOT FDIC INSURED •MAY LOSE VALUE •NO BANK GUARANTEE
Neither the Funds nor Fidelity Distributors Corporation is a bank.
Note to Shareholders:
Early in 2020, the outbreak and spread of a new coronavirus emerged as a public health emergency that had a major influence on financial markets, primarily based on its impact on the global economy and the outlook for corporate earnings. The virus causes a respiratory disease known as COVID-19. On March 11, the World Health Organization declared the COVID-19 outbreak a pandemic, citing sustained risk of further global spread.
In the weeks following, as the crisis worsened, we witnessed an escalating human tragedy with wide-scale social and economic consequences from coronavirus-containment measures. The outbreak of COVID-19 prompted a number of measures to limit the spread, including travel and border restrictions, quarantines, and restrictions on large gatherings. In turn, these resulted in lower consumer activity, diminished demand for a wide range of products and services, disruption in manufacturing and supply chains, and – given the wide variability in outcomes regarding the outbreak – significant market uncertainty and volatility. Amid the turmoil, global governments and central banks took unprecedented action to help support consumers, businesses, and the broader economies, and to limit disruption to financial systems.
The situation continues to unfold, and the extent and duration of its impact on financial markets and the economy remain highly uncertain. Extreme events such as the coronavirus crisis are “exogenous shocks” that can have significant adverse effects on mutual funds and their investments. Although multiple asset classes may be affected by market disruption, the duration and impact may not be the same for all types of assets.
Fidelity is committed to helping you stay informed amid news about COVID-19 and during increased market volatility, and we’re taking extra steps to be responsive to customer needs. We encourage you to visit our websites, where we offer ongoing updates, commentary, and analysis on the markets and our funds.
VIP Investor Freedom Income Portfolio℠
Performance: The Bottom Line
Average annual total return reflects the change in the value of an investment, assuming reinvestment of distributions from dividend income and capital gains (the profits earned upon the sale of securities that have grown in value, if any) and assuming a constant rate of performance each year. During periods of reimbursement by Fidelity, a fund’s total return will be greater than it would be had the reimbursement not occurred. Performance numbers are net of all underlying fund operating expenses, but do not include any insurance charges imposed by your insurance company’s separate account. If performance information included the effect of these additional charges, the total returns would have been lower. How a fund did yesterday is no guarantee of how it will do tomorrow.
Average Annual Total Returns
| Periods ended December 31, 2020 | Past 1 year | Past 5 years | Past 10 years |
| VIP Investor Freedom Income Portfolio℠ | 10.40% | 6.53% | 4.93% |
$10,000 Over 10 Years
Let's say hypothetically that $10,000 was invested in VIP Investor Freedom Income Portfolio℠ on December 31, 2010.
The chart shows how the value of your investment would have changed, and also shows how the Bloomberg Barclays U.S. Aggregate Bond Index performed over the same period.

| Period Ending Values |
| $16,185 | VIP Investor Freedom Income Portfolio℠ |
| $14,576 | Bloomberg Barclays U.S. Aggregate Bond Index |
VIP Investor Freedom 2005 Portfolio℠
Performance: The Bottom Line
Average annual total return reflects the change in the value of an investment, assuming reinvestment of distributions from dividend income and capital gains (the profits earned upon the sale of securities that have grown in value, if any) and assuming a constant rate of performance each year. During periods of reimbursement by Fidelity, a fund’s total return will be greater than it would be had the reimbursement not occurred. Performance numbers are net of all underlying fund operating expenses, but do not include any insurance charges imposed by your insurance company’s separate account. If performance information included the effect of these additional charges, the total returns would have been lower. How a fund did yesterday is no guarantee of how it will do tomorrow.
Average Annual Total Returns
| Periods ended December 31, 2020 | Past 1 year | Past 5 years | Past 10 years |
| VIP Investor Freedom 2005 Portfolio℠ | 11.08% | 7.39% | 5.97% |
$10,000 Over 10 Years
Let's say hypothetically that $10,000 was invested in VIP Investor Freedom 2005 Portfolio℠ on December 31, 2010.
The chart shows how the value of your investment would have changed, and also shows how the Bloomberg Barclays U.S. Aggregate Bond Index performed over the same period.
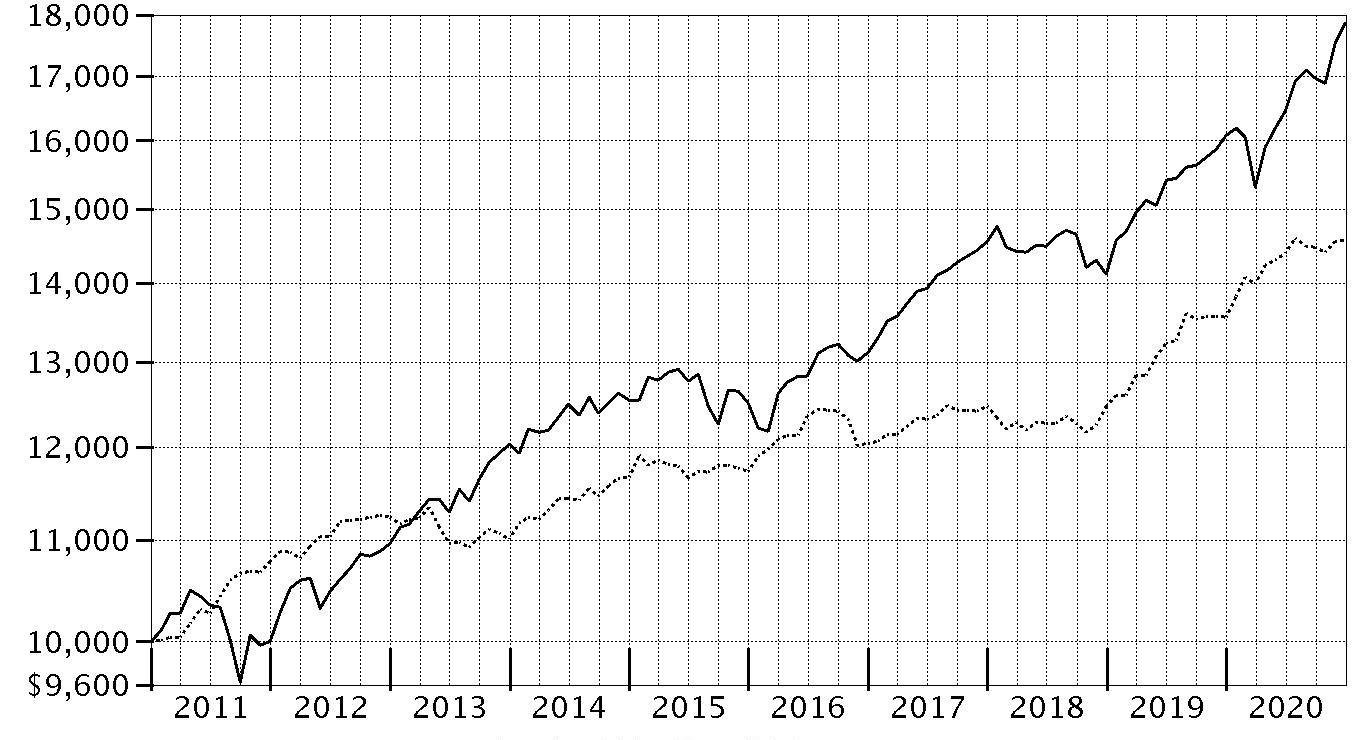
| Period Ending Values |
| $17,857 | VIP Investor Freedom 2005 Portfolio℠ |
| $14,576 | Bloomberg Barclays U.S. Aggregate Bond Index |
VIP Investor Freedom 2010 Portfolio℠
Performance: The Bottom Line
Average annual total return reflects the change in the value of an investment, assuming reinvestment of distributions from dividend income and capital gains (the profits earned upon the sale of securities that have grown in value, if any) and assuming a constant rate of performance each year. During periods of reimbursement by Fidelity, a fund’s total return will be greater than it would be had the reimbursement not occurred. Performance numbers are net of all underlying fund operating expenses, but do not include any insurance charges imposed by your insurance company’s separate account. If performance information included the effect of these additional charges, the total returns would have been lower. How a fund did yesterday is no guarantee of how it will do tomorrow.
Average Annual Total Returns
| Periods ended December 31, 2020 | Past 1 year | Past 5 years | Past 10 years |
| VIP Investor Freedom 2010 Portfolio℠ | 12.40% | 8.32% | 6.98% |
$10,000 Over 10 Years
Let's say hypothetically that $10,000 was invested in VIP Investor Freedom 2010 Portfolio℠ on December 31, 2010.
The chart shows how the value of your investment would have changed, and also shows how the Bloomberg Barclays U.S. Aggregate Bond Index performed over the same period.
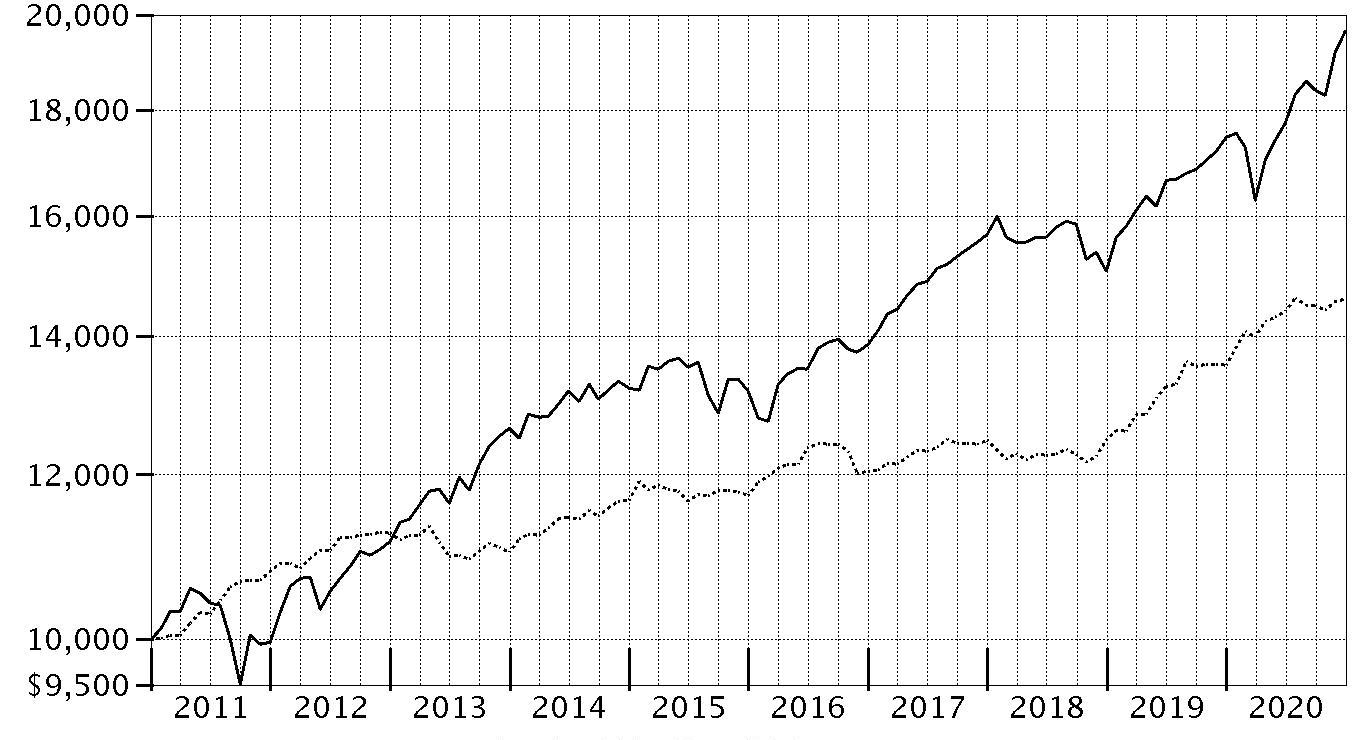
| Period Ending Values |
| $19,632 | VIP Investor Freedom 2010 Portfolio℠ |
| $14,576 | Bloomberg Barclays U.S. Aggregate Bond Index |
VIP Investor Freedom 2015 Portfolio℠
Performance: The Bottom Line
Average annual total return reflects the change in the value of an investment, assuming reinvestment of distributions from dividend income and capital gains (the profits earned upon the sale of securities that have grown in value, if any) and assuming a constant rate of performance each year. During periods of reimbursement by Fidelity, a fund’s total return will be greater than it would be had the reimbursement not occurred. Performance numbers are net of all underlying fund operating expenses, but do not include any insurance charges imposed by your insurance company’s separate account. If performance information included the effect of these additional charges, the total returns would have been lower. How a fund did yesterday is no guarantee of how it will do tomorrow.
Average Annual Total Returns
| Periods ended December 31, 2020 | Past 1 year | Past 5 years | Past 10 years |
| VIP Investor Freedom 2015 Portfolio℠ | 13.70% | 9.21% | 7.55% |
$10,000 Over 10 Years
Let's say hypothetically that $10,000 was invested in VIP Investor Freedom 2015 Portfolio℠ on December 31, 2010.
The chart shows how the value of your investment would have changed, and also shows how the Bloomberg Barclays U.S. Aggregate Bond Index performed over the same period.

| Period Ending Values |
| $20,702 | VIP Investor Freedom 2015 Portfolio℠ |
| $14,576 | Bloomberg Barclays U.S. Aggregate Bond Index |
VIP Investor Freedom 2020 Portfolio℠
Performance: The Bottom Line
Average annual total return reflects the change in the value of an investment, assuming reinvestment of distributions from dividend income and capital gains (the profits earned upon the sale of securities that have grown in value, if any) and assuming a constant rate of performance each year. During periods of reimbursement by Fidelity, a fund’s total return will be greater than it would be had the reimbursement not occurred. Performance numbers are net of all underlying fund operating expenses, but do not include any insurance charges imposed by your insurance company’s separate account. If performance information included the effect of these additional charges, the total returns would have been lower. How a fund did yesterday is no guarantee of how it will do tomorrow.
Average Annual Total Returns
| Periods ended December 31, 2020 | Past 1 year | Past 5 years | Past 10 years |
| VIP Investor Freedom 2020 Portfolio℠ | 14.95% | 9.92% | 8.09% |
$10,000 Over 10 Years
Let's say hypothetically that $10,000 was invested in VIP Investor Freedom 2020 Portfolio℠ on December 31, 2010.
The chart shows how the value of your investment would have changed, and also shows how the S&P 500® Index performed over the same period.
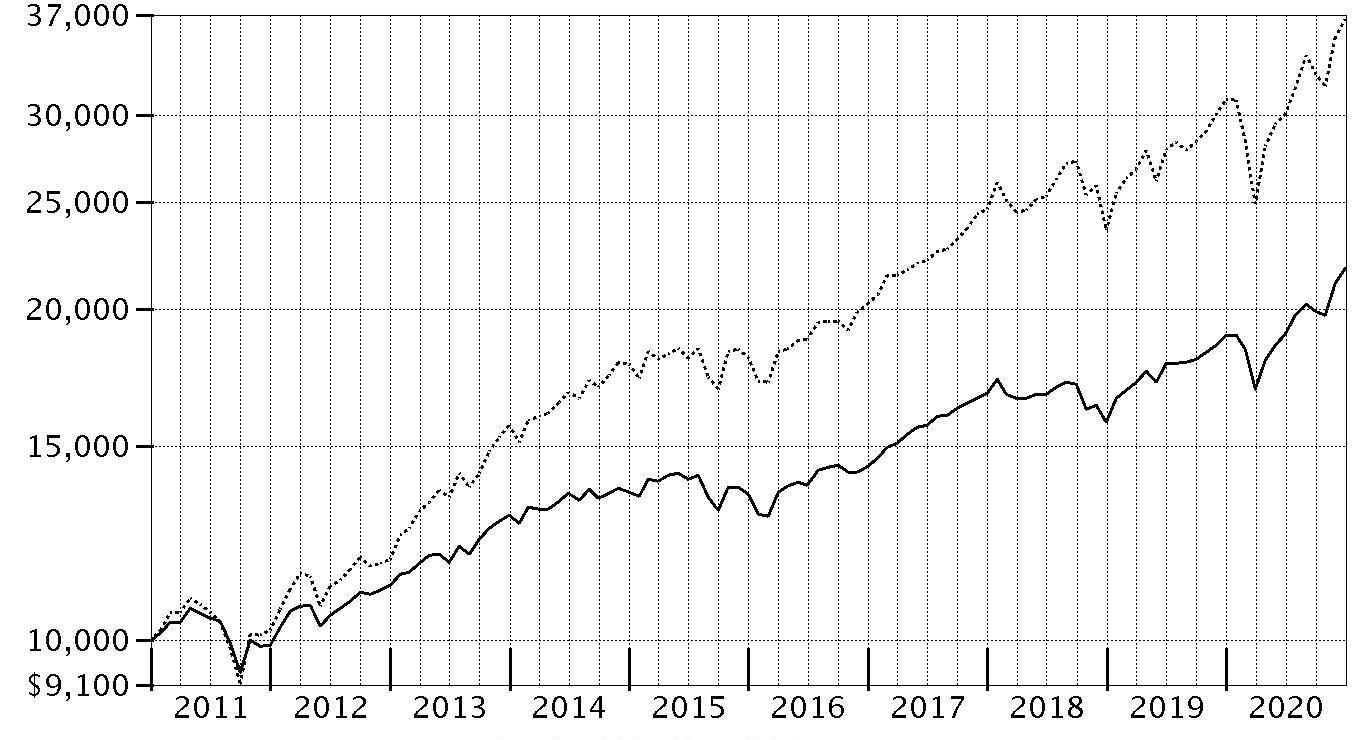
| Period Ending Values |
| $21,767 | VIP Investor Freedom 2020 Portfolio℠ |
| $36,700 | S&P 500® Index |
VIP Investor Freedom 2025 Portfolio℠
Performance: The Bottom Line
Average annual total return reflects the change in the value of an investment, assuming reinvestment of distributions from dividend income and capital gains (the profits earned upon the sale of securities that have grown in value, if any) and assuming a constant rate of performance each year. During periods of reimbursement by Fidelity, a fund’s total return will be greater than it would be had the reimbursement not occurred. Performance numbers are net of all underlying fund operating expenses, but do not include any insurance charges imposed by your insurance company’s separate account. If performance information included the effect of these additional charges, the total returns would have been lower. How a fund did yesterday is no guarantee of how it will do tomorrow.
Average Annual Total Returns
| Periods ended December 31, 2020 | Past 1 year | Past 5 years | Past 10 years |
| VIP Investor Freedom 2025 Portfolio℠ | 15.88% | 10.51% | 8.81% |
$10,000 Over 10 Years
Let's say hypothetically that $10,000 was invested in VIP Investor Freedom 2025 Portfolio℠ on December 31, 2010.
The chart shows how the value of your investment would have changed, and also shows how the S&P 500® Index performed over the same period.
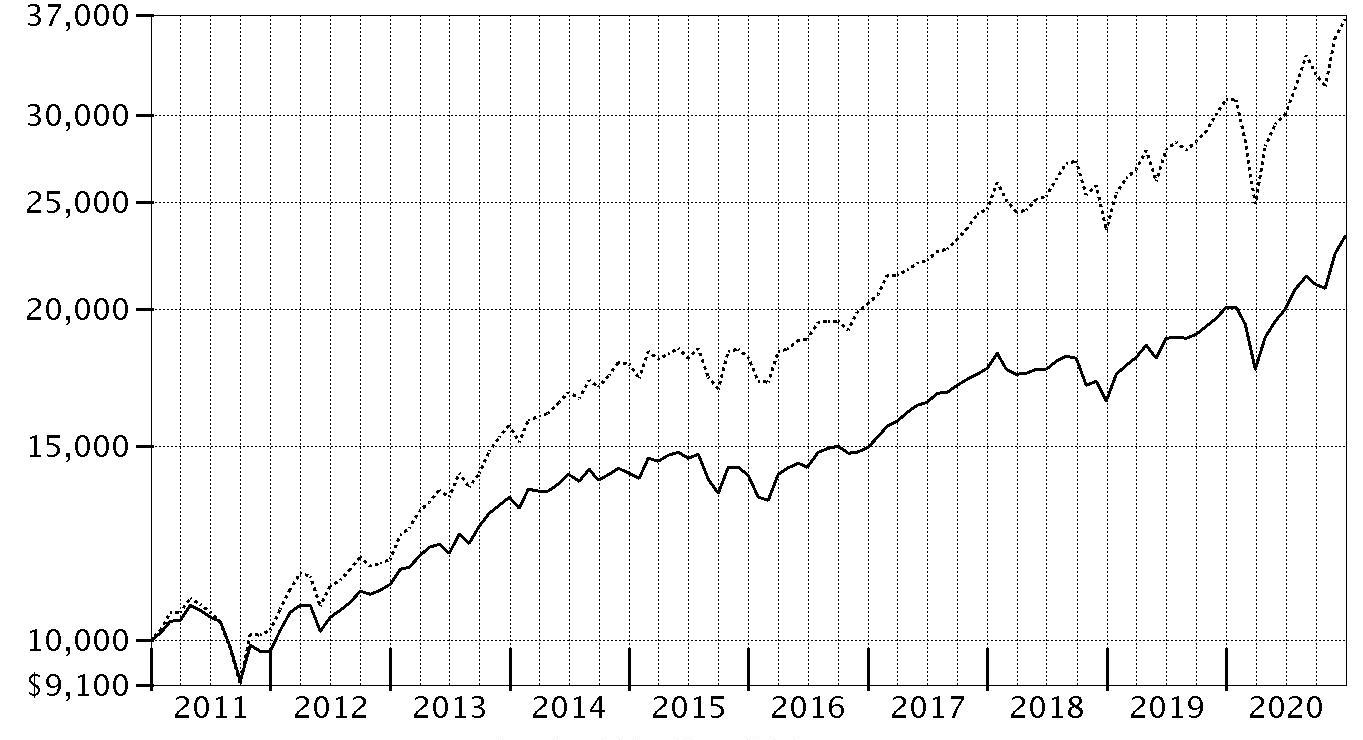
| Period Ending Values |
| $23,270 | VIP Investor Freedom 2025 Portfolio℠ |
| $36,700 | S&P 500® Index |
VIP Investor Freedom 2030 Portfolio℠
Performance: The Bottom Line
Average annual total return reflects the change in the value of an investment, assuming reinvestment of distributions from dividend income and capital gains (the profits earned upon the sale of securities that have grown in value, if any) and assuming a constant rate of performance each year. During periods of reimbursement by Fidelity, a fund’s total return will be greater than it would be had the reimbursement not occurred. Performance numbers are net of all underlying fund operating expenses, but do not include any insurance charges imposed by your insurance company’s separate account. If performance information included the effect of these additional charges, the total returns would have been lower. How a fund did yesterday is no guarantee of how it will do tomorrow.
Average Annual Total Returns
| Periods ended December 31, 2020 | Past 1 year | Past 5 years | Past 10 years |
| VIP Investor Freedom 2030 Portfolio℠ | 16.82% | 11.52% | 9.43% |
$10,000 Over 10 Years
Let's say hypothetically that $10,000 was invested in VIP Investor Freedom 2030 Portfolio℠ on December 31, 2010.
The chart shows how the value of your investment would have changed, and also shows how the S&P 500® Index performed over the same period.

| Period Ending Values |
| $24,631 | VIP Investor Freedom 2030 Portfolio℠ |
| $36,700 | S&P 500® Index |
Management's Discussion of Fund Performance
Market Recap: Global financial markets were highly volatile and unpredictable in 2020, a year that will be remembered by most investors for the impact of the coronavirus pandemic. The early-2020 outbreak and spread of COVID-19 resulted in a sharp decline for risk assets, followed by a historic rebound. The crisis and containment efforts led to broad contraction in economic activity and dislocation in financial markets. Rapid and expansive monetary- and fiscal-policy responses partially offset the economic disruption and fueled the market surge for many assets from late March through the end of the year.
Non-U.S. equities gained 10.81% in 2020, according to the MSCI ACWI (All Country World Index) ex USA Index, despite significant ups and downs related to the pandemic. Emerging markets (+19%) was the top region, followed by Japan (+15%) and Europe ex U.K. (+12%). Conversely, the U.K. (-10%), Canada (+6%) and Asia Pacific ex Japan (+7%) lagged. By sector, information technology (+46%) was by far the top performer, while consumer discretionary (+23%) and materials (+22%) also notably outpaced the index. Energy (-23%), real estate (-9%) and financials (-4%) all underperformed.
The Dow Jones U.S. Total Stock Market Index gained 20.79% for the year. After a sharp decline in the first quarter (-20.96%) due to the coronavirus outbreak, U.S. equities reversed course, driven by resilient corporate earnings and potential for a vaccine breakthrough, and closed the year at an all-time high. Among sectors, consumer discretionary (+47%) and information technology (+46%) led, whereas energy (-33%) fared worst, followed by real estate (-5%). Large-cap stocks performed about on par with smaller-caps, while growth handily outpaced value. Commodities notably lagged equities.
Turning to fixed income, U.S. taxable investment-grade bonds (the Bloomberg Barclays U.S. Aggregate Bond Index) rose 7.51%, as most categories generated a solid gain. Corporate bonds (+9.35%) led the way, along with commercial mortgage backed securities (+8.11%), Treasury securities (+8.00) and government bonds (7.94%). Agency bonds (+5.48%) and mortgage-backed securities (+3.87%) had smaller gains. Extended (non-core) categories outside the index were mixed, including Treasury Inflation-Protected Securities (+10.99%), high-yield bonds (+6.07%), emerging-markets debt (+5.88%) and floating-rate bank loans (+3.50%).
Comments from Co-Portfolio Managers Andrew Dierdorf and Brett Sumsion: For the year, the share classes of each VIP Investor Freedom Fund posted a double-digit gain, ranging from 10.40% for VIP Investor Freedom Income Portfolio to 16.82% for VIP Investor Freedom 2030 Portfolio. Each Portfolio outpaced its Composite index in 2020. Versus Composites, favorable returns among underlying investment funds drove the Portfolios’ outperformance for the year. In particular, active security selection among non-U.S. equities added the most value, while performance among U.S. equities and investment-grade bonds helped to a lesser extent. Among non-U.S. equities, investments in Fidelity
® VIP Emerging Markets Portfolio (+31.17%) and Fidelity
® VIP Overseas Portfolio (+15.49%) led the way, as both funds outperformed their benchmarks. Within U.S. equities, Fidelity
® VIP Contrafund Portfolio (+30.48%) contributed most. An allocation to Fidelity
® VIP Investment Grade Bond Portfolio (+9.33%) also helped, as it outperformed its benchmark, the Bloomberg Barclays U.S. Aggregate Bond Index. Top-down, active asset allocation decisions had mixed results in 2020. On one hand, overweighting emerging-markets equities added notable value the past 12 months, as did an underweighting in investment-grade bonds. Conversely, the Portfolios’ underexposure to U.S. equities detracted, as this was the strongest-performing asset class in 2020. Non-Composite exposure to high-yield bonds and an overweighting in inflation-protected debt securities also detracted from the Funds’ relative results.
The views expressed above reflect those of the portfolio manager(s) only through the end of the period as stated on the cover of this report and do not necessarily represent the views of Fidelity or any other person in the Fidelity organization. Any such views are subject to change at any time based upon market or other conditions and Fidelity disclaims any responsibility to update such views. These views may not be relied on as investment advice and, because investment decisions for a Fidelity fund are based on numerous factors, may not be relied on as an indication of trading intent on behalf of any Fidelity fund.
VIP Investor Freedom Income Portfolio℠
Investment Summary (Unaudited)
The information in the following tables is based on the direct investments of the Fund.
Top Holdings as of December 31, 2020
| | % of fund's net assets |
| VIP Investment Grade Bond Portfolio Investor Class | 41.0 |
| VIP Government Money Market Portfolio Investor Class 0.01% | 22.7 |
| Fidelity Inflation-Protected Bond Index Fund | 12.0 |
| VIP Emerging Markets Portfolio Investor Class | 7.9 |
| VIP Overseas Portfolio Investor Class | 5.2 |
| Fidelity Long-Term Treasury Bond Index Fund | 2.3 |
| VIP High Income Portfolio Investor Class | 2.0 |
| VIP Growth & Income Portfolio Investor Class | 1.5 |
| VIP Equity-Income Portfolio Investor Class | 1.3 |
| VIP Growth Portfolio Investor Class | 1.2 |
| | 97.1 |
Asset Allocation (% of fund's net assets)
| Period end |
| | Domestic Equity Funds | 6.9% |
| | International Equity Funds | 13.1% |
| | Bond Funds | 57.3% |
| | Short-Term Funds | 22.7% |

VIP Investor Freedom Income Portfolio℠
Schedule of Investments December 31, 2020
Showing Percentage of Net Assets
| Domestic Equity Funds - 6.9% | | | |
| | | Shares | Value |
| VIP Contrafund Portfolio Investor Class (a) | | 24,777 | $1,185,070 |
| VIP Equity-Income Portfolio Investor Class (a) | | 52,666 | 1,250,294 |
| VIP Growth & Income Portfolio Investor Class (a) | | 64,030 | 1,424,665 |
| VIP Growth Portfolio Investor Class (a) | | 11,794 | 1,207,492 |
| VIP Mid Cap Portfolio Investor Class (a) | | 8,984 | 345,347 |
| VIP Value Portfolio Investor Class (a) | | 57,501 | 915,421 |
| VIP Value Strategies Portfolio Investor Class (a) | | 33,303 | 447,599 |
| TOTAL DOMESTIC EQUITY FUNDS | | | |
| (Cost $4,239,387) | | | 6,775,888 |
|
| International Equity Funds - 13.1% | | | |
| VIP Emerging Markets Portfolio Investor Class (a) | | 524,933 | 7,706,021 |
| VIP Overseas Portfolio Investor Class (a) | | 194,063 | 5,127,147 |
| TOTAL INTERNATIONAL EQUITY FUNDS | | | |
| (Cost $8,032,284) | | | 12,833,168 |
|
| Bond Funds - 57.3% | | | |
| Fidelity Inflation-Protected Bond Index Fund (a) | | 1,065,575 | 11,763,950 |
| Fidelity Long-Term Treasury Bond Index Fund (a) | | 141,410 | 2,255,485 |
| VIP High Income Portfolio Investor Class (a) | | 370,605 | 1,953,090 |
| VIP Investment Grade Bond Portfolio Investor Class (a) | | 2,857,914 | 40,096,541 |
| TOTAL BOND FUNDS | | | |
| (Cost $50,957,433) | | | 56,069,066 |
|
| Short-Term Funds - 22.7% | | | |
| VIP Government Money Market Portfolio Investor Class 0.01% (a)(b) | | | |
| (Cost $22,211,136) | | 22,211,136 | 22,211,136 |
| TOTAL INVESTMENT IN SECURITIES - 100.0% | | | |
| (Cost $85,440,240) | | | 97,889,258 |
| NET OTHER ASSETS (LIABILITIES) - 0.0% | | | 36 |
| NET ASSETS - 100% | | | $97,889,294 |
Legend
(a) Affiliated Fund
(b) The rate quoted is the annualized seven-day yield of the fund at period end.
Affiliated Underlying Funds
Fiscal year to date information regarding the Fund's investments in affiliated Underlying Funds, excluding any Money Market Central Funds, is presented below. Exchanges between classes of the same affiliated Underlying Funds may occur.
| Affiliate | Value, beginning of period | Purchases | Sales Proceeds | Dividend Income | Realized Gain (loss) | Change in Unrealized appreciation (depreciation) | Value, end of period |
| Fidelity Inflation-Protected Bond Index Fund | $10,293,352 | $4,359,901 | $3,833,441 | $144,010 | $15,327 | $928,811 | $11,763,950 |
| Fidelity Long-Term Treasury Bond Index Fund | 2,163,699 | 1,238,442 | 1,418,593 | 87,210 | 134,362 | 137,575 | 2,255,485 |
| VIP Contrafund Portfolio Investor Class | 955,610 | 1,116,124 | 1,171,546 | 7,168 | 121,371 | 163,511 | 1,185,070 |
| VIP Emerging Markets Portfolio Investor Class | 5,214,146 | 5,333,794 | 4,438,447 | 668,355 | 194,361 | 1,402,167 | 7,706,021 |
| VIP Equity-Income Portfolio Investor Class | 1,009,892 | 1,347,559 | 1,183,258 | 63,963 | (5,570 ) | 81,671 | 1,250,294 |
| VIP Government Money Market Portfolio Investor Class 0.01% | 20,195,721 | 11,911,417 | 9,896,002 | 64,020 | -- | -- | 22,211,136 |
| VIP Growth & Income Portfolio Investor Class | 1,150,863 | 1,546,033 | 1,362,846 | 82,276 | 99,997 | (9,382) | 1,424,665 |
| VIP Growth Portfolio Investor Class | 976,830 | 1,178,309 | 1,253,514 | 102,492 | 267,696 | 38,171 | 1,207,492 |
| VIP High Income Portfolio Investor Class | 1,716,677 | 977,366 | 705,254 | 93,355 | (26,032) | (9,667) | 1,953,090 |
| VIP Investment Grade Bond Portfolio Investor Class | 35,095,954 | 15,493,753 | 12,752,653 | 855,458 | (100,770) | 2,360,257 | 40,096,541 |
| VIP Mid Cap Portfolio Investor Class | 280,352 | 296,577 | 311,537 | 1,648 | 6,851 | 73,104 | 345,347 |
| VIP Overseas Portfolio Investor Class | 5,578,241 | 3,396,252 | 4,477,056 | 41,549 | 71,967 | 557,743 | 5,127,147 |
| VIP Value Portfolio Investor Class | 741,603 | 933,963 | 864,449 | 38,858 | 9,037 | 95,267 | 915,421 |
| VIP Value Strategies Portfolio Investor Class | 363,138 | 434,303 | 408,298 | 23,220 | 2,641 | 55,815 | 447,599 |
| Total | $85,736,078 | $49,563,793 | $44,076,894 | $2,273,582 | $791,238 | $5,875,043 | $97,889,258 |
Amounts in the income column in the above table include any capital gain distributions from underlying funds, which are presented in the corresponding line-item in the Statement of Operations, if applicable.
Investment Valuation
The following is a summary of the inputs used, as of December 31, 2020, involving the Fund's assets and liabilities carried at fair value. The inputs or methodology used for valuing securities may not be an indication of the risk associated with investing in those securities. For more information on valuation inputs, and their aggregation into the levels used below, please refer to the Investment Valuation section in the accompanying Notes to Financial Statements.
| | Valuation Inputs at Reporting Date: |
| Description | Total | Level 1 | Level 2 | Level 3 |
| Investments in Securities: | | | | |
| Domestic Equity Funds | $6,775,888 | $6,775,888 | $-- | $-- |
| International Equity Funds | 12,833,168 | 12,833,168 | -- | -- |
| Bond Funds | 56,069,066 | 56,069,066 | -- | -- |
| Short-Term Funds | 22,211,136 | 22,211,136 | -- | -- |
| Total Investments in Securities: | $97,889,258 | $97,889,258 | $-- | $-- |
See accompanying notes which are an integral part of the financial statements.
VIP Investor Freedom Income Portfolio℠
Financial Statements
Statement of Assets and Liabilities
| | | December 31, 2020 |
| Assets | | |
Investment in securities, at value — See accompanying schedule:
| | |
| Affiliated issuers (cost $85,440,240) | $97,889,258 | |
| Total Investment in Securities (cost $85,440,240) | | $97,889,258 |
| Cash | | 34 |
| Receivable for investments sold | | 757,951 |
| Receivable for fund shares sold | | 7,672 |
| Total assets | | 98,654,915 |
| Liabilities | | |
| Payable for investments purchased | $745,274 | |
| Payable for fund shares redeemed | 20,347 | |
| Total liabilities | | 765,621 |
| Net Assets | | $97,889,294 |
| Net Assets consist of: | | |
| Paid in capital | | $83,973,945 |
| Total accumulated earnings (loss) | | 13,915,349 |
| Net Assets | | $97,889,294 |
| Net Asset Value, offering price and redemption price per share ($97,889,294 ÷ 7,718,104 shares) | | $12.68 |
See accompanying notes which are an integral part of the financial statements.
Statement of Operations
| | | Year ended December 31, 2020 |
| Investment Income | | |
| Dividends: | | |
| Affiliated issuers | | $1,200,143 |
| Expenses | | |
| Independent trustees' fees and expenses | $291 | |
| Total expenses | | 291 |
| Net investment income (loss) | | 1,199,852 |
| Realized and Unrealized Gain (Loss) | | |
| Net realized gain (loss) on: | | |
| Investment securities: | | |
| Affiliated issuers | 791,265 | |
| Capital gain distributions from underlying funds: | | |
| Affiliated issuers | 1,073,439 | |
| Total net realized gain (loss) | | 1,864,704 |
| Change in net unrealized appreciation (depreciation) on: | | |
| Investment securities: | | |
| Affiliated issuers | 5,875,043 | |
| Total change in net unrealized appreciation (depreciation) | | 5,875,043 |
| Net gain (loss) | | 7,739,747 |
| Net increase (decrease) in net assets resulting from operations | | $8,939,599 |
See accompanying notes which are an integral part of the financial statements.
Statement of Changes in Net Assets
| | Year ended December 31, 2020 | Year ended December 31, 2019 |
| Increase (Decrease) in Net Assets | | |
| Operations | | |
| Net investment income (loss) | $1,199,852 | $1,751,802 |
| Net realized gain (loss) | 1,864,704 | 1,993,456 |
| Change in net unrealized appreciation (depreciation) | 5,875,043 | 5,172,459 |
| Net increase (decrease) in net assets resulting from operations | 8,939,599 | 8,917,717 |
| Distributions to shareholders | (3,280,736) | (3,443,933) |
| Share transactions | | |
| Proceeds from sales of shares | 28,611,414 | 11,414,447 |
| Reinvestment of distributions | 3,280,736 | 3,443,933 |
| Cost of shares redeemed | (25,397,808) | (9,344,200) |
| Net increase (decrease) in net assets resulting from share transactions | 6,494,342 | 5,514,180 |
| Total increase (decrease) in net assets | 12,153,205 | 10,987,964 |
| Net Assets | | |
| Beginning of period | 85,736,089 | 74,748,125 |
| End of period | $97,889,294 | $85,736,089 |
| Other Information | | |
| Shares | | |
| Sold | 2,385,584 | 975,757 |
| Issued in reinvestment of distributions | 269,922 | 298,317 |
| Redeemed | (2,138,244) | (805,933) |
| Net increase (decrease) | 517,262 | 468,141 |
See accompanying notes which are an integral part of the financial statements.
Financial Highlights
VIP Investor Freedom Income Portfolio
| | | | | | |
| Years ended December 31, | 2020 | 2019 | 2018 | 2017 | 2016 |
| Selected Per–Share Data | | | | | |
| Net asset value, beginning of period | $11.91 | $11.10 | $11.67 | $11.03 | $10.86 |
| Income from Investment Operations | | | | | |
| Net investment income (loss)A | .16 | .26 | .21 | .18 | .16 |
| Net realized and unrealized gain (loss) | 1.06 | 1.05 | (.45) | .75 | .31 |
| Total from investment operations | 1.22 | 1.31 | (.24) | .93 | .47 |
| Distributions from net investment income | (.16) | (.25) | (.20) | (.18) | (.16) |
| Distributions from net realized gain | (.29) | (.25) | (.13) | (.11) | (.14) |
| Total distributions | (.45) | (.50) | (.33) | (.29) | (.30) |
| Net asset value, end of period | $12.68 | $11.91 | $11.10 | $11.67 | $11.03 |
| Total ReturnB,C | 10.40% | 12.02% | (2.03)% | 8.45% | 4.43% |
| Ratios to Average Net AssetsD | | | | | |
| Expenses before reductionsE | -% | -% | -% | -% | -% |
| Expenses net of fee waivers, if any | - %E | - %E | - %E | -% | -% |
| Expenses net of all reductions | - %E | - %E | - %E | -% | -% |
| Net investment income (loss) | 1.32% | 2.19% | 1.79% | 1.59% | 1.47% |
| Supplemental Data | | | | | |
| Net assets, end of period (000 omitted) | $97,889 | $85,736 | $74,748 | $75,445 | $67,090 |
| Portfolio turnover rateF | 49% | 25% | 42% | 25% | 25% |
A Calculated based on average shares outstanding during the period.
B Total returns do not reflect charges attributable to your insurance company's separate account. Inclusion of these charges would reduce the total returns shown.
C Total returns would have been lower if certain expenses had not been reduced during the applicable periods shown.
D Expense ratios reflect operating expenses of the class. Expenses before reductions do not reflect amounts reimbursed, waived, or reduced through arrangements with the investment advisor, brokerage services, or other offset arrangements, if applicable, and do not represent the amount paid by the class during periods when reimbursements, waivers or reductions occur.
E Amount represents less than .005%.
F Amount does not include the portfolio activity of any underlying mutual funds or exchange-traded funds (ETFs).
See accompanying notes which are an integral part of the financial statements.
VIP Investor Freedom 2005 Portfolio℠
Investment Summary (Unaudited)
The information in the following tables is based on the direct investments of the Fund.
Top Holdings as of December 31, 2020
| | % of fund's net assets |
| VIP Investment Grade Bond Portfolio Investor Class | 39.3 |
| VIP Government Money Market Portfolio Investor Class 0.01% | 20.4 |
| Fidelity Inflation-Protected Bond Index Fund | 11.2 |
| VIP Emerging Markets Portfolio Investor Class | 8.5 |
| VIP Overseas Portfolio Investor Class | 6.5 |
| Fidelity Long-Term Treasury Bond Index Fund | 2.3 |
| VIP Growth & Income Portfolio Investor Class | 2.1 |
| VIP High Income Portfolio Investor Class | 2.0 |
| VIP Equity-Income Portfolio Investor Class | 1.8 |
| VIP Growth Portfolio Investor Class | 1.7 |
| | 95.8 |
Asset Allocation (% of fund's net assets)
| Period end |
| | Domestic Equity Funds | 9.8% |
| | International Equity Funds | 15.0% |
| | Bond Funds | 54.8% |
| | Short-Term Funds | 20.4% |

VIP Investor Freedom 2005 Portfolio℠
Schedule of Investments December 31, 2020
Showing Percentage of Net Assets
| Domestic Equity Funds - 9.8% | | | |
| | | Shares | Value |
| VIP Contrafund Portfolio Investor Class (a) | | 12,939 | $618,852 |
| VIP Equity-Income Portfolio Investor Class (a) | | 27,503 | 652,923 |
| VIP Growth & Income Portfolio Investor Class (a) | | 33,437 | 743,975 |
| VIP Growth Portfolio Investor Class (a) | | 6,159 | 630,549 |
| VIP Mid Cap Portfolio Investor Class (a) | | 4,692 | 180,343 |
| VIP Value Portfolio Investor Class (a) | | 30,028 | 478,042 |
| VIP Value Strategies Portfolio Investor Class (a) | | 17,392 | 233,745 |
| TOTAL DOMESTIC EQUITY FUNDS | | | |
| (Cost $2,241,969) | | | 3,538,429 |
|
| International Equity Funds - 15.0% | | | |
| VIP Emerging Markets Portfolio Investor Class (a) | | 208,271 | 3,057,419 |
| VIP Overseas Portfolio Investor Class (a) | | 89,673 | 2,369,156 |
| TOTAL INTERNATIONAL EQUITY FUNDS | | | |
| (Cost $3,493,676) | | | 5,426,575 |
|
| Bond Funds - 54.8% | | | |
| Fidelity Inflation-Protected Bond Index Fund (a) | | 366,548 | 4,046,691 |
| Fidelity Long-Term Treasury Bond Index Fund (a) | | 52,258 | 833,509 |
| VIP High Income Portfolio Investor Class (a) | | 136,960 | 721,777 |
| VIP Investment Grade Bond Portfolio Investor Class (a) | | 1,013,597 | 14,220,767 |
| TOTAL BOND FUNDS | | | |
| (Cost $18,012,907) | | | 19,822,744 |
|
| Short-Term Funds - 20.4% | | | |
| VIP Government Money Market Portfolio Investor Class 0.01% (a)(b) | | | |
| (Cost $7,387,411) | | 7,387,411 | 7,387,411 |
| TOTAL INVESTMENT IN SECURITIES - 100.0% | | | |
| (Cost $31,135,963) | | | 36,175,159 |
| NET OTHER ASSETS (LIABILITIES) - 0.0% | | | 1 |
| NET ASSETS - 100% | | | $36,175,160 |
Legend
(a) Affiliated Fund
(b) The rate quoted is the annualized seven-day yield of the fund at period end.
Affiliated Underlying Funds
Fiscal year to date information regarding the Fund's investments in affiliated Underlying Funds, excluding any Money Market Central Funds, is presented below. Exchanges between classes of the same affiliated Underlying Funds may occur.
| Affiliate | Value, beginning of period | Purchases | Sales Proceeds | Dividend Income | Realized Gain (loss) | Change in Unrealized appreciation (depreciation) | Value, end of period |
| Fidelity Inflation-Protected Bond Index Fund | $3,620,339 | $1,425,253 | $1,322,704 | $49,014 | $3,774 | $320,029 | $4,046,691 |
| Fidelity Long-Term Treasury Bond Index Fund | 840,932 | 441,231 | 559,951 | 32,282 | 57,093 | 54,204 | 833,509 |
| VIP Contrafund Portfolio Investor Class | 598,859 | 447,040 | 579,077 | 4,377 | 38,405 | 113,625 | 618,852 |
| VIP Emerging Markets Portfolio Investor Class | 2,269,303 | 1,967,123 | 1,738,054 | 287,758 | 38,195 | 520,852 | 3,057,419 |
| VIP Equity-Income Portfolio Investor Class | 632,866 | 568,238 | 564,071 | 38,633 | (12,519) | 28,409 | 652,923 |
| VIP Government Money Market Portfolio Investor Class 0.01% | 6,813,331 | 3,922,505 | 3,348,425 | 22,018 | -- | -- | 7,387,411 |
| VIP Growth & Income Portfolio Investor Class | 721,220 | 647,371 | 643,690 | 49,656 | 28,787 | (9,713) | 743,975 |
| VIP Growth Portfolio Investor Class | 612,148 | 489,862 | 627,608 | 63,118 | 101,278 | 54,869 | 630,549 |
| VIP High Income Portfolio Investor Class | 667,160 | 311,260 | 236,848 | 34,964 | (10,194) | (9,601) | 721,777 |
| VIP Investment Grade Bond Portfolio Investor Class | 12,873,547 | 5,353,589 | 4,812,982 | 307,131 | (32,475) | 839,088 | 14,220,767 |
| VIP Mid Cap Portfolio Investor Class | 175,686 | 127,581 | 158,799 | 916 | (463) | 36,338 | 180,343 |
| VIP Overseas Portfolio Investor Class | 2,797,249 | 1,450,380 | 2,135,150 | 20,494 | 26,577 | 230,100 | 2,369,156 |
| VIP Value Portfolio Investor Class | 464,741 | 405,647 | 420,952 | 23,614 | 1,889 | 26,717 | 478,042 |
| VIP Value Strategies Portfolio Investor Class | 227,569 | 196,693 | 208,384 | 14,259 | (4,036) | 21,903 | 233,745 |
| Total | $33,314,950 | $17,753,773 | $17,356,695 | $948,234 | $236,311 | $2,226,820 | $36,175,159 |
Amounts in the income column in the above table include any capital gain distributions from underlying funds, which are presented in the corresponding line-item in the Statement of Operations, if applicable.
Investment Valuation
The following is a summary of the inputs used, as of December 31, 2020, involving the Fund's assets and liabilities carried at fair value. The inputs or methodology used for valuing securities may not be an indication of the risk associated with investing in those securities. For more information on valuation inputs, and their aggregation into the levels used below, please refer to the Investment Valuation section in the accompanying Notes to Financial Statements.
| | Valuation Inputs at Reporting Date: |
| Description | Total | Level 1 | Level 2 | Level 3 |
| Investments in Securities: | | | | |
| Domestic Equity Funds | $3,538,429 | $3,538,429 | $-- | $-- |
| International Equity Funds | 5,426,575 | 5,426,575 | -- | -- |
| Bond Funds | 19,822,744 | 19,822,744 | -- | -- |
| Short-Term Funds | 7,387,411 | 7,387,411 | -- | -- |
| Total Investments in Securities: | $36,175,159 | $36,175,159 | $-- | $-- |
See accompanying notes which are an integral part of the financial statements.
VIP Investor Freedom 2005 Portfolio℠
Financial Statements
Statement of Assets and Liabilities
| | | December 31, 2020 |
| Assets | | |
Investment in securities, at value — See accompanying schedule:
| | |
| Affiliated issuers (cost $31,135,963) | $36,175,159 | |
| Total Investment in Securities (cost $31,135,963) | | $36,175,159 |
| Receivable for investments sold | | 383,892 |
| Receivable for fund shares sold | | 2,820 |
| Total assets | | 36,561,871 |
| Liabilities | | |
| Payable for investments purchased | $386,695 | |
| Payable for fund shares redeemed | 16 | |
| Total liabilities | | 386,711 |
| Net Assets | | $36,175,160 |
| Net Assets consist of: | | |
| Paid in capital | | $30,543,582 |
| Total accumulated earnings (loss) | | 5,631,578 |
| Net Assets | | $36,175,160 |
| Net Asset Value, offering price and redemption price per share ($36,175,160 ÷ 2,789,048 shares) | | $12.97 |
See accompanying notes which are an integral part of the financial statements.
Statement of Operations
| | | Year ended December 31, 2020 |
| Investment Income | | |
| Dividends: | | |
| Affiliated issuers | | $447,917 |
| Expenses | | |
| Independent trustees' fees and expenses | $109 | |
| Total expenses | | 109 |
| Net investment income (loss) | | 447,808 |
| Realized and Unrealized Gain (Loss) | | |
| Net realized gain (loss) on: | | |
| Investment securities: | | |
| Affiliated issuers | 236,311 | |
| Capital gain distributions from underlying funds: | | |
| Affiliated issuers | 500,317 | |
| Total net realized gain (loss) | | 736,628 |
| Change in net unrealized appreciation (depreciation) on: | | |
| Investment securities: | | |
| Affiliated issuers | 2,226,820 | |
| Total change in net unrealized appreciation (depreciation) | | 2,226,820 |
| Net gain (loss) | | 2,963,448 |
| Net increase (decrease) in net assets resulting from operations | | $3,411,256 |
See accompanying notes which are an integral part of the financial statements.
Statement of Changes in Net Assets
| | Year ended December 31, 2020 | Year ended December 31, 2019 |
| Increase (Decrease) in Net Assets | | |
| Operations | | |
| Net investment income (loss) | $447,808 | $675,788 |
| Net realized gain (loss) | 736,628 | 1,057,330 |
| Change in net unrealized appreciation (depreciation) | 2,226,820 | 2,318,952 |
| Net increase (decrease) in net assets resulting from operations | 3,411,256 | 4,052,070 |
| Distributions to shareholders | (1,502,700) | (1,297,971) |
| Share transactions | | |
| Proceeds from sales of shares | 8,526,425 | 6,571,294 |
| Reinvestment of distributions | 1,502,700 | 1,297,971 |
| Cost of shares redeemed | (9,077,471) | (5,911,366) |
| Net increase (decrease) in net assets resulting from share transactions | 951,654 | 1,957,899 |
| Total increase (decrease) in net assets | 2,860,210 | 4,711,998 |
| Net Assets | | |
| Beginning of period | 33,314,950 | 28,602,952 |
| End of period | $36,175,160 | $33,314,950 |
| Other Information | | |
| Shares | | |
| Sold | 694,985 | 558,684 |
| Issued in reinvestment of distributions | 121,932 | 110,098 |
| Redeemed | (758,959) | (498,567) |
| Net increase (decrease) | 57,958 | 170,215 |
See accompanying notes which are an integral part of the financial statements.
Financial Highlights
VIP Investor Freedom 2005 Portfolio
| | | | | | |
| Years ended December 31, | 2020 | 2019 | 2018 | 2017 | 2016 |
| Selected Per–Share Data | | | | | |
| Net asset value, beginning of period | $12.20 | $11.17 | $11.85 | $10.97 | $10.79 |
| Income from Investment Operations | | | | | |
| Net investment income (loss)A | .16 | .25 | .20 | .20 | .17 |
| Net realized and unrealized gain (loss) | 1.16 | 1.28 | (.56) | 1.00 | .35 |
| Total from investment operations | 1.32 | 1.53 | (.36) | 1.20 | .52 |
| Distributions from net investment income | (.17) | (.26) | (.20) | (.17) | (.16) |
| Distributions from net realized gain | (.38) | (.24) | (.13) | (.14) | (.17) |
| Total distributions | (.55) | (.50) | (.32)B | (.32)B | (.34)B |
| Net asset value, end of period | $12.97 | $12.20 | $11.17 | $11.85 | $10.97 |
| Total ReturnC,D | 11.08% | 13.89% | (3.04)% | 10.97% | 4.94% |
| Ratios to Average Net AssetsE | | | | | |
| Expenses before reductionsF | -% | -% | -% | -% | -% |
| Expenses net of fee waivers, if any | - %F | - %F | - %F | -% | -% |
| Expenses net of all reductions | - %F | - %F | - %F | -% | -% |
| Net investment income (loss) | 1.32% | 2.12% | 1.70% | 1.74% | 1.52% |
| Supplemental Data | | | | | |
| Net assets, end of period (000 omitted) | $36,175 | $33,315 | $28,603 | $28,889 | $20,771 |
| Portfolio turnover rateG | 51% | 35% | 42% | 28% | 35% |
A Calculated based on average shares outstanding during the period.
B Total distributions per share do not sum due to rounding.
C Total returns do not reflect charges attributable to your insurance company's separate account. Inclusion of these charges would reduce the total returns shown.
D Total returns would have been lower if certain expenses had not been reduced during the applicable periods shown.
E Expense ratios reflect operating expenses of the class. Expenses before reductions do not reflect amounts reimbursed, waived, or reduced through arrangements with the investment advisor, brokerage services, or other offset arrangements, if applicable, and do not represent the amount paid by the class during periods when reimbursements, waivers or reductions occur.
F Amount represents less than .005%.
G Amount does not include the portfolio activity of any underlying mutual funds or exchange-traded funds (ETFs).
See accompanying notes which are an integral part of the financial statements.
VIP Investor Freedom 2010 Portfolio℠
Investment Summary (Unaudited)
The information in the following tables is based on the direct investments of the Fund.
Top Holdings as of December 31, 2020
| | % of fund's net assets |
| VIP Investment Grade Bond Portfolio Investor Class | 35.8 |
| VIP Government Money Market Portfolio Investor Class 0.01% | 16.3 |
| Fidelity Inflation-Protected Bond Index Fund | 9.7 |
| VIP Emerging Markets Portfolio Investor Class | 9.6 |
| VIP Overseas Portfolio Investor Class | 9.0 |
| VIP Growth & Income Portfolio Investor Class | 3.2 |
| VIP Equity-Income Portfolio Investor Class | 2.8 |
| VIP Growth Portfolio Investor Class | 2.7 |
| VIP Contrafund Portfolio Investor Class | 2.7 |
| Fidelity Long-Term Treasury Bond Index Fund | 2.3 |
| | 94.1 |
Asset Allocation (% of fund's net assets)
| Period end |
| | Domestic Equity Funds | 15.3% |
| | International Equity Funds | 18.6% |
| | Bond Funds | 49.8% |
| | Short-Term Funds | 16.3% |

VIP Investor Freedom 2010 Portfolio℠
Schedule of Investments December 31, 2020
Showing Percentage of Net Assets
| Domestic Equity Funds - 15.3% | | | |
| | | Shares | Value |
| VIP Contrafund Portfolio Investor Class (a) | | 42,436 | $2,029,729 |
| VIP Equity-Income Portfolio Investor Class (a) | | 90,203 | 2,141,418 |
| VIP Growth & Income Portfolio Investor Class (a) | | 109,666 | 2,440,076 |
| VIP Growth Portfolio Investor Class (a) | | 20,201 | 2,068,156 |
| VIP Mid Cap Portfolio Investor Class (a) | | 15,388 | 591,502 |
| VIP Value Portfolio Investor Class (a) | | 98,485 | 1,567,883 |
| VIP Value Strategies Portfolio Investor Class (a) | | 57,042 | 766,643 |
| TOTAL DOMESTIC EQUITY FUNDS | | | |
| (Cost $7,538,045) | | | 11,605,407 |
|
| International Equity Funds - 18.6% | | | |
| VIP Emerging Markets Portfolio Investor Class (a) | | 495,539 | 7,274,509 |
| VIP Overseas Portfolio Investor Class (a) | | 260,755 | 6,889,145 |
| TOTAL INTERNATIONAL EQUITY FUNDS | | | |
| (Cost $9,259,192) | | | 14,163,654 |
|
| Bond Funds - 49.8% | | | |
| Fidelity Inflation-Protected Bond Index Fund (a) | | 665,356 | 7,345,526 |
| Fidelity Long-Term Treasury Bond Index Fund (a) | | 109,798 | 1,751,278 |
| VIP High Income Portfolio Investor Class (a) | | 287,771 | 1,516,554 |
| VIP Investment Grade Bond Portfolio Investor Class (a) | | 1,941,643 | 27,241,253 |
| TOTAL BOND FUNDS | | | |
| (Cost $34,563,138) | | | 37,854,611 |
|
| Short-Term Funds - 16.3% | | | |
| VIP Government Money Market Portfolio Investor Class 0.01% (a)(b) | | | |
| (Cost $12,384,059) | | 12,384,059 | 12,384,059 |
| TOTAL INVESTMENT IN SECURITIES - 100.0% | | | |
| (Cost $63,744,434) | | | 76,007,731 |
| NET OTHER ASSETS (LIABILITIES) - 0.0% | | | 11 |
| NET ASSETS - 100% | | | $76,007,742 |
Legend
(a) Affiliated Fund
(b) The rate quoted is the annualized seven-day yield of the fund at period end.
Affiliated Underlying Funds
Fiscal year to date information regarding the Fund's investments in affiliated Underlying Funds, excluding any Money Market Central Funds, is presented below. Exchanges between classes of the same affiliated Underlying Funds may occur. [Certain Underlying Funds incurred name changes since their most recent shareholder report. The names of the Underlying Funds are those in effect at period end.]
| Affiliate | Value, beginning of period | Purchases | Sales Proceeds | Dividend Income | Realized Gain (loss) | Change in Unrealized appreciation (depreciation) | Value, end of period |
| Fidelity Inflation-Protected Bond Index Fund | $6,257,222 | $2,044,380 | $1,522,814 | $87,709 | $13,346 | $553,392 | $7,345,526 |
| Fidelity Long-Term Treasury Bond Index Fund | 1,682,695 | 780,868 | 926,166 | 65,997 | 114,958 | 98,923 | 1,751,278 |
| VIP Contrafund Portfolio Investor Class | 1,837,015 | 873,816 | 1,168,782 | 13,255 | 101,745 | 385,935 | 2,029,729 |
| VIP Emerging Markets Portfolio Investor Class | 5,207,343 | 3,480,203 | 2,778,793 | 654,576 | 114,826 | 1,250,930 | 7,274,509 |
| VIP Equity-Income Portfolio Investor Class | 1,941,327 | 1,229,420 | 1,104,261 | 117,509 | (24,485) | 99,417 | 2,141,418 |
| VIP Government Money Market Portfolio Investor Class 0.01% | 10,873,753 | 5,783,582 | 4,273,276 | 34,735 | -- | -- | 12,384,059 |
| VIP Growth & Income Portfolio Investor Class | 2,212,360 | 1,415,384 | 1,284,036 | 151,089 | 56,006 | 40,362 | 2,440,076 |
| VIP Growth Portfolio Investor Class | 1,877,797 | 976,197 | 1,296,420 | 190,490 | 205,642 | 304,940 | 2,068,156 |
| VIP High Income Portfolio Investor Class | 1,335,027 | 488,766 | 276,751 | 71,701 | (14,434) | (16,054) | 1,516,554 |
| VIP Investment Grade Bond Portfolio Investor Class | 23,394,480 | 8,384,405 | 6,028,602 | 571,911 | (31,194) | 1,522,164 | 27,241,253 |
| VIP Mid Cap Portfolio Investor Class | 538,899 | 276,263 | 343,267 | 2,884 | (817) | 120,424 | 591,502 |
| VIP Overseas Portfolio Investor Class | 7,369,450 | 2,985,833 | 4,332,164 | 55,022 | 52,386 | 813,640 | 6,889,145 |
| VIP Value Portfolio Investor Class | 1,425,596 | 933,735 | 906,911 | 71,647 | 19,234 | 96,229 | 1,567,883 |
| VIP Value Strategies Portfolio Investor Class | 698,082 | 469,819 | 469,642 | 43,081 | (12,543) | 80,927 | 766,643 |
| Total | $66,651,046 | $30,122,671 | $26,711,885 | $2,131,606 | $594,670 | $5,351,229 | $76,007,731 |
Amounts in the income column in the above table include any capital gain distributions from underlying funds, which are presented in the corresponding line-item in the Statement of Operations, if applicable.
Investment Valuation
The following is a summary of the inputs used, as of December 31, 2020, involving the Fund's assets and liabilities carried at fair value. The inputs or methodology used for valuing securities may not be an indication of the risk associated with investing in those securities. For more information on valuation inputs, and their aggregation into the levels used below, please refer to the Investment Valuation section in the accompanying Notes to Financial Statements.
| | Valuation Inputs at Reporting Date: |
| Description | Total | Level 1 | Level 2 | Level 3 |
| Investments in Securities: | | | | |
| Domestic Equity Funds | $11,605,407 | $11,605,407 | $-- | $-- |
| International Equity Funds | 14,163,654 | 14,163,654 | -- | -- |
| Bond Funds | 37,854,611 | 37,854,611 | -- | -- |
| Short-Term Funds | 12,384,059 | 12,384,059 | -- | -- |
| Total Investments in Securities: | $76,007,731 | $76,007,731 | $-- | $-- |
See accompanying notes which are an integral part of the financial statements.
VIP Investor Freedom 2010 Portfolio℠
Financial Statements
Statement of Assets and Liabilities
| | | December 31, 2020 |
| Assets | | |
Investment in securities, at value — See accompanying schedule:
| | |
| Affiliated issuers (cost $63,744,434) | $76,007,731 | |
| Total Investment in Securities (cost $63,744,434) | | $76,007,731 |
| Cash | | 11 |
| Receivable for investments sold | | 955,834 |
| Receivable for fund shares sold | | 9,291 |
| Total assets | | 76,972,867 |
| Liabilities | | |
| Payable for investments purchased | $965,090 | |
| Payable for fund shares redeemed | 35 | |
| Total liabilities | | 965,125 |
| Net Assets | | $76,007,742 |
| Net Assets consist of: | | |
| Paid in capital | | $62,333,107 |
| Total accumulated earnings (loss) | | 13,674,635 |
| Net Assets | | $76,007,742 |
| Net Asset Value, offering price and redemption price per share ($76,007,742 ÷ 5,535,565 shares) | | $13.73 |
See accompanying notes which are an integral part of the financial statements.
Statement of Operations
| | | Year ended December 31, 2020 |
| Investment Income | | |
| Dividends: | | |
| Affiliated issuers | | $898,520 |
| Expenses | | |
| Independent trustees' fees and expenses | $218 | |
| Total expenses | | 218 |
| Net investment income (loss) | | 898,302 |
| Realized and Unrealized Gain (Loss) | | |
| Net realized gain (loss) on: | | |
| Investment securities: | | |
| Affiliated issuers | 594,670 | |
| Capital gain distributions from underlying funds: | �� | |
| Affiliated issuers | 1,233,086 | |
| Total net realized gain (loss) | | 1,827,756 |
| Change in net unrealized appreciation (depreciation) on: | | |
| Investment securities: | | |
| Affiliated issuers | 5,351,229 | |
| Total change in net unrealized appreciation (depreciation) | | 5,351,229 |
| Net gain (loss) | | 7,178,985 |
| Net increase (decrease) in net assets resulting from operations | | $8,077,287 |
See accompanying notes which are an integral part of the financial statements.
Statement of Changes in Net Assets
| | Year ended December 31, 2020 | Year ended December 31, 2019 |
| Increase (Decrease) in Net Assets | | |
| Operations | | |
| Net investment income (loss) | $898,302 | $1,317,300 |
| Net realized gain (loss) | 1,827,756 | 2,460,577 |
| Change in net unrealized appreciation (depreciation) | 5,351,229 | 5,235,908 |
| Net increase (decrease) in net assets resulting from operations | 8,077,287 | 9,013,785 |
| Distributions to shareholders | (3,445,905) | (3,875,085) |
| Share transactions | | |
| Proceeds from sales of shares | 9,894,263 | 9,205,670 |
| Reinvestment of distributions | 3,445,905 | 3,875,085 |
| Cost of shares redeemed | (8,614,863) | (8,020,741) |
| Net increase (decrease) in net assets resulting from share transactions | 4,725,305 | 5,060,014 |
| Total increase (decrease) in net assets | 9,356,687 | 10,198,714 |
| Net Assets | | |
| Beginning of period | 66,651,055 | 56,452,341 |
| End of period | $76,007,742 | $66,651,055 |
| Other Information | | |
| Shares | | |
| Sold | 781,480 | 737,286 |
| Issued in reinvestment of distributions | 266,361 | 317,972 |
| Redeemed | (704,241) | (651,567) |
| Net increase (decrease) | 343,600 | 403,691 |
See accompanying notes which are an integral part of the financial statements.
Financial Highlights
VIP Investor Freedom 2010 Portfolio
| | | | | | |
| Years ended December 31, | 2020 | 2019 | 2018 | 2017 | 2016 |
| Selected Per–Share Data | | | | | |
| Net asset value, beginning of period | $12.84 | $11.79 | $12.78 | $11.68 | $11.49 |
| Income from Investment Operations | | | | | |
| Net investment income (loss)A | .17 | .27 | .20 | .19 | .17 |
| Net realized and unrealized gain (loss) | 1.37 | 1.57 | (.71) | 1.32 | .42 |
| Total from investment operations | 1.54 | 1.84 | (.51) | 1.51 | .59 |
| Distributions from net investment income | (.17) | (.26) | (.21) | (.19) | (.18) |
| Distributions from net realized gain | (.49) | (.53) | (.27) | (.22) | (.22) |
| Total distributions | (.65)B | (.79) | (.48) | (.41) | (.40) |
| Net asset value, end of period | $13.73 | $12.84 | $11.79 | $12.78 | $11.68 |
| Total ReturnC,D | 12.40% | 16.10% | (4.06)% | 13.05% | 5.33% |
| Ratios to Average Net AssetsE | | | | | |
| Expenses before reductionsF | -% | -% | -% | -% | -% |
| Expenses net of fee waivers, if any | - %F | - %F | - %F | -% | -% |
| Expenses net of all reductions | - %F | - %F | - %F | -% | -% |
| Net investment income (loss) | 1.33% | 2.15% | 1.57% | 1.55% | 1.47% |
| Supplemental Data | | | | | |
| Net assets, end of period (000 omitted) | $76,008 | $66,651 | $56,452 | $66,993 | $59,504 |
| Portfolio turnover rateG | 39% | 31% | 35% | 25% | 24% |
A Calculated based on average shares outstanding during the period.
B Total distributions per share do not sum due to rounding.
C Total returns do not reflect charges attributable to your insurance company's separate account. Inclusion of these charges would reduce the total returns shown.
D Total returns would have been lower if certain expenses had not been reduced during the applicable periods shown.
E Expense ratios reflect operating expenses of the class. Expenses before reductions do not reflect amounts reimbursed, waived, or reduced through arrangements with the investment advisor, brokerage services, or other offset arrangements, if applicable, and do not represent the amount paid by the class during periods when reimbursements, waivers or reductions occur.
F Amount represents less than .005%.
G Amount does not include the portfolio activity of any underlying mutual funds or exchange-traded funds (ETFs).
See accompanying notes which are an integral part of the financial statements.
VIP Investor Freedom 2015 Portfolio℠
Investment Summary (Unaudited)
The information in the following tables is based on the direct investments of the Fund.
Top Holdings as of December 31, 2020
| | % of fund's net assets |
| VIP Investment Grade Bond Portfolio Investor Class | 32.1 |
| VIP Government Money Market Portfolio Investor Class 0.01% | 12.1 |
| VIP Overseas Portfolio Investor Class | 11.6 |
| VIP Emerging Markets Portfolio Investor Class | 10.7 |
| Fidelity Inflation-Protected Bond Index Fund | 8.4 |
| VIP Growth & Income Portfolio Investor Class | 4.4 |
| VIP Equity-Income Portfolio Investor Class | 3.8 |
| VIP Growth Portfolio Investor Class | 3.7 |
| VIP Contrafund Portfolio Investor Class | 3.6 |
| VIP Value Portfolio Investor Class | 2.8 |
| | 93.2 |
Asset Allocation (% of fund's net assets)
| Period end |
| | Domestic Equity Funds | 20.8% |
| | International Equity Funds | 22.3% |
| | Bond Funds | 44.8% |
| | Short-Term Funds | 12.1% |

VIP Investor Freedom 2015 Portfolio℠
Schedule of Investments December 31, 2020
Showing Percentage of Net Assets
| Domestic Equity Funds - 20.8% | | | |
| | | Shares | Value |
| VIP Contrafund Portfolio Investor Class (a) | | 86,819 | $4,152,536 |
| VIP Equity-Income Portfolio Investor Class (a) | | 184,536 | 4,380,894 |
| VIP Growth & Income Portfolio Investor Class (a) | | 224,354 | 4,991,866 |
| VIP Growth Portfolio Investor Class (a) | | 41,329 | 4,231,281 |
| VIP Mid Cap Portfolio Investor Class (a) | | 31,481 | 1,210,139 |
| VIP Value Portfolio Investor Class (a) | | 201,484 | 3,207,630 |
| VIP Value Strategies Portfolio Investor Class (a) | | 116,699 | 1,568,434 |
| TOTAL DOMESTIC EQUITY FUNDS | | | |
| (Cost $14,994,288) | | | 23,742,780 |
|
| International Equity Funds - 22.3% | | | |
| VIP Emerging Markets Portfolio Investor Class (a) | | 831,788 | 12,210,641 |
| VIP Overseas Portfolio Investor Class (a) | | 501,020 | 13,236,940 |
| TOTAL INTERNATIONAL EQUITY FUNDS | | | |
| (Cost $16,095,539) | | | 25,447,581 |
|
| Bond Funds - 44.8% | | | |
| Fidelity Inflation-Protected Bond Index Fund (a) | | 867,277 | 9,574,743 |
| Fidelity Long-Term Treasury Bond Index Fund (a) | | 165,007 | 2,631,870 |
| VIP High Income Portfolio Investor Class (a) | | 432,476 | 2,279,148 |
| VIP Investment Grade Bond Portfolio Investor Class (a) | | 2,614,995 | 36,688,378 |
| TOTAL BOND FUNDS | | | |
| (Cost $46,509,466) | | | 51,174,139 |
|
| Short-Term Funds - 12.1% | | | |
| VIP Government Money Market Portfolio Investor Class 0.01% (a)(b) | | | |
| (Cost $13,861,313) | | 13,861,313 | 13,861,313 |
| TOTAL INVESTMENT IN SECURITIES - 100.0% | | | |
| (Cost $91,460,606) | | | 114,225,813 |
| NET OTHER ASSETS (LIABILITIES) - 0.0% | | | 8 |
| NET ASSETS - 100% | | | $114,225,821 |
Legend
(a) Affiliated Fund
(b) The rate quoted is the annualized seven-day yield of the fund at period end.
Affiliated Underlying Funds
Fiscal year to date information regarding the Fund's investments in affiliated Underlying Funds, excluding any Money Market Central Funds, is presented below. Exchanges between classes of the same affiliated Underlying Funds may occur.
| Affiliate | Value, beginning of period | Purchases | Sales Proceeds | Dividend Income | Realized Gain (loss) | Change in Unrealized appreciation (depreciation) | Value, end of period |
| Fidelity Inflation-Protected Bond Index Fund | $8,721,790 | $2,692,075 | $2,603,614 | $114,657 | $45,533 | $718,959 | $9,574,743 |
| Fidelity Long-Term Treasury Bond Index Fund | 2,709,637 | 1,178,772 | 1,600,618 | 101,160 | 204,078 | 140,001 | 2,631,870 |
| VIP Contrafund Portfolio Investor Class | 3,988,373 | 1,321,677 | 2,173,374 | 28,337 | 235,473 | 780,387 | 4,152,536 |
| VIP Emerging Markets Portfolio Investor Class | 9,478,046 | 5,153,769 | 4,651,719 | 1,162,163 | 249,831 | 1,980,714 | 12,210,641 |
| VIP Equity-Income Portfolio Investor Class | 4,214,596 | 2,113,866 | 2,061,068 | 250,511 | (27,221) | 140,721 | 4,380,894 |
| VIP Government Money Market Portfolio Investor Class 0.01% | 13,031,660 | 7,316,996 | 6,487,343 | 41,617 | -- | -- | 13,861,313 |
| VIP Growth & Income Portfolio Investor Class | 4,803,075 | 2,497,313 | 2,458,549 | 322,046 | 109,758 | 40,269 | 4,991,866 |
| VIP Growth Portfolio Investor Class | 4,076,924 | 1,543,702 | 2,443,044 | 408,135 | 541,752 | 511,947 | 4,231,281 |
| VIP High Income Portfolio Investor Class | 2,149,607 | 696,784 | 514,734 | 109,488 | (18,618) | (33,891) | 2,279,148 |
| VIP Investment Grade Bond Portfolio Investor Class | 33,634,087 | 11,831,557 | 10,840,803 | 783,353 | (72,191) | 2,135,728 | 36,688,378 |
| VIP Mid Cap Portfolio Investor Class | 1,169,943 | 475,933 | 671,136 | 6,013 | (7,484) | 242,883 | 1,210,139 |
| VIP Overseas Portfolio Investor Class | 14,709,919 | 4,925,094 | 8,070,863 | 108,166 | 268,010 | 1,404,780 | 13,236,940 |
| VIP Value Portfolio Investor Class | 3,094,949 | 1,728,091 | 1,809,585 | 152,990 | 35,221 | 158,954 | 3,207,630 |
| VIP Value Strategies Portfolio Investor Class | 1,515,462 | 891,723 | 957,141 | 92,239 | (13,895) | 132,285 | 1,568,434 |
| Total | $107,298,068 | $44,367,352 | $47,343,591 | $3,680,875 | $1,550,247 | $8,353,737 | $114,225,813 |
Amounts in the income column in the above table include any capital gain distributions from underlying funds, which are presented in the corresponding line-item in the Statement of Operations, if applicable.
Investment Valuation
The following is a summary of the inputs used, as of December 31, 2020, involving the Fund's assets and liabilities carried at fair value. The inputs or methodology used for valuing securities may not be an indication of the risk associated with investing in those securities. For more information on valuation inputs, and their aggregation into the levels used below, please refer to the Investment Valuation section in the accompanying Notes to Financial Statements.
| | Valuation Inputs at Reporting Date: |
| Description | Total | Level 1 | Level 2 | Level 3 |
| Investments in Securities: | | | | |
| Domestic Equity Funds | $23,742,780 | $23,742,780 | $-- | $-- |
| International Equity Funds | 25,447,581 | 25,447,581 | -- | -- |
| Bond Funds | 51,174,139 | 51,174,139 | -- | -- |
| Short-Term Funds | 13,861,313 | 13,861,313 | -- | -- |
| Total Investments in Securities: | $114,225,813 | $114,225,813 | $-- | $-- |
See accompanying notes which are an integral part of the financial statements.
VIP Investor Freedom 2015 Portfolio℠
Financial Statements
Statement of Assets and Liabilities
| | | December 31, 2020 |
| Assets | | |
Investment in securities, at value — See accompanying schedule:
| | |
| Affiliated issuers (cost $91,460,606) | $114,225,813 | |
| Total Investment in Securities (cost $91,460,606) | | $114,225,813 |
| Cash | | 9 |
| Receivable for investments sold | | 1,463,140 |
| Receivable for fund shares sold | | 202,871 |
| Total assets | | 115,891,833 |
| Liabilities | | |
| Payable for investments purchased | $1,665,952 | |
| Payable for fund shares redeemed | 60 | |
| Total liabilities | | 1,666,012 |
| Net Assets | | $114,225,821 |
| Net Assets consist of: | | |
| Paid in capital | | $88,203,756 |
| Total accumulated earnings (loss) | | 26,022,065 |
| Net Assets | | $114,225,821 |
| Net Asset Value, offering price and redemption price per share ($114,225,821 ÷ 8,318,490 shares) | | $13.73 |
See accompanying notes which are an integral part of the financial statements.
Statement of Operations
| | | Year ended December 31, 2020 |
| Investment Income | | |
| Dividends: | | |
| Affiliated issuers | | $1,349,420 |
| Expenses | | |
| Independent trustees' fees and expenses | $340 | |
| Total expenses | | 340 |
| Net investment income (loss) | | 1,349,080 |
| Realized and Unrealized Gain (Loss) | | |
| Net realized gain (loss) on: | | |
| Investment securities: | | |
| Affiliated issuers | 1,550,247 | |
| Capital gain distributions from underlying funds: | | |
| Affiliated issuers | 2,331,455 | |
| Total net realized gain (loss) | | 3,881,702 |
| Change in net unrealized appreciation (depreciation) on: | | |
| Investment securities: | | |
| Affiliated issuers | 8,353,737 | |
| Total change in net unrealized appreciation (depreciation) | | 8,353,737 |
| Net gain (loss) | | 12,235,439 |
| Net increase (decrease) in net assets resulting from operations | | $13,584,519 |
See accompanying notes which are an integral part of the financial statements.
Statement of Changes in Net Assets
| | Year ended December 31, 2020 | Year ended December 31, 2019 |
| Increase (Decrease) in Net Assets | | |
| Operations | | |
| Net investment income (loss) | $1,349,080 | $2,107,485 |
| Net realized gain (loss) | 3,881,702 | 5,351,067 |
| Change in net unrealized appreciation (depreciation) | 8,353,737 | 9,647,971 |
| Net increase (decrease) in net assets resulting from operations | 13,584,519 | 17,106,523 |
| Distributions to shareholders | (6,788,171) | (6,401,129) |
| Share transactions | | |
| Proceeds from sales of shares | 9,643,886 | 6,726,361 |
| Reinvestment of distributions | 6,788,171 | 6,401,129 |
| Cost of shares redeemed | (16,300,658) | (13,315,889) |
| Net increase (decrease) in net assets resulting from share transactions | 131,399 | (188,399) |
| Total increase (decrease) in net assets | 6,927,747 | 10,516,995 |
| Net Assets | | |
| Beginning of period | 107,298,074 | 96,781,079 |
| End of period | $114,225,821 | $107,298,074 |
| Other Information | | |
| Shares | | |
| Sold | 783,193 | 542,979 |
| Issued in reinvestment of distributions | 531,663 | 528,556 |
| Redeemed | (1,341,066) | (1,080,170) |
| Net increase (decrease) | (26,210) | (8,635) |
See accompanying notes which are an integral part of the financial statements.
Financial Highlights
VIP Investor Freedom 2015 Portfolio
| | | | | | |
| Years ended December 31, | 2020 | 2019 | 2018 | 2017 | 2016 |
| Selected Per–Share Data | | | | | |
| Net asset value, beginning of period | $12.86 | $11.59 | $12.72 | $11.48 | $11.34 |
| Income from Investment Operations | | | | | |
| Net investment income (loss)A | .16 | .25 | .19 | .19 | .17 |
| Net realized and unrealized gain (loss) | 1.53 | 1.80 | (.82) | 1.51 | .45 |
| Total from investment operations | 1.69 | 2.05 | (.63) | 1.70 | .62 |
| Distributions from net investment income | (.17) | (.26) | (.19) | (.19) | (.18) |
| Distributions from net realized gain | (.66) | (.52) | (.31) | (.27) | (.31) |
| Total distributions | (.82)B | (.78) | (.50) | (.46) | (.48)B |
| Net asset value, end of period | $13.73 | $12.86 | $11.59 | $12.72 | $11.48 |
| Total ReturnC,D | 13.70% | 18.24% | (5.02)% | 14.99% | 5.82% |
| Ratios to Average Net AssetsE | | | | | |
| Expenses before reductionsF | -% | -% | -% | -% | -% |
| Expenses net of fee waivers, if any | - %F | - %F | - %F | -% | -% |
| Expenses net of all reductions | - %F | - %F | - %F | -% | -% |
| Net investment income (loss) | 1.28% | 2.05% | 1.53% | 1.52% | 1.53% |
| Supplemental Data | | | | | |
| Net assets, end of period (000 omitted) | $114,226 | $107,298 | $96,781 | $110,704 | $97,672 |
| Portfolio turnover rateG | 42% | 30% | 33% | 23% | 23% |
A Calculated based on average shares outstanding during the period.
B Total distributions per share do not sum due to rounding.
C Total returns do not reflect charges attributable to your insurance company's separate account. Inclusion of these charges would reduce the total returns shown.
D Total returns would have been lower if certain expenses had not been reduced during the applicable periods shown.
E Expense ratios reflect operating expenses of the class. Expenses before reductions do not reflect amounts reimbursed, waived, or reduced through arrangements with the investment advisor, brokerage services, or other offset arrangements, if applicable, and do not represent the amount paid by the class during periods when reimbursements, waivers or reductions occur.
F Amount represents less than .005%.
G Amount does not include the portfolio activity of any underlying mutual funds or exchange-traded funds (ETFs).
See accompanying notes which are an integral part of the financial statements.
VIP Investor Freedom 2020 Portfolio℠
Investment Summary (Unaudited)
The information in the following tables is based on the direct investments of the Fund.
Top Holdings as of December 31, 2020
| | % of fund's net assets |
| VIP Investment Grade Bond Portfolio Investor Class | 28.4 |
| VIP Overseas Portfolio Investor Class | 14.0 |
| VIP Emerging Markets Portfolio Investor Class | 11.8 |
| VIP Government Money Market Portfolio Investor Class 0.01% | 8.3 |
| Fidelity Inflation-Protected Bond Index Fund | 7.1 |
| VIP Growth & Income Portfolio Investor Class | 5.5 |
| VIP Equity-Income Portfolio Investor Class | 4.8 |
| VIP Growth Portfolio Investor Class | 4.7 |
| VIP Contrafund Portfolio Investor Class | 4.6 |
| VIP Value Portfolio Investor Class | 3.5 |
| | 92.7 |
Asset Allocation (% of fund's net assets)
| Period end |
| | Domestic Equity Funds | 26.1% |
| | International Equity Funds | 25.8% |
| | Bond Funds | 39.8% |
| | Short-Term Funds | 8.3% |

VIP Investor Freedom 2020 Portfolio℠
Schedule of Investments December 31, 2020
Showing Percentage of Net Assets
| Domestic Equity Funds - 26.1% | | | |
| | | Shares | Value |
| VIP Contrafund Portfolio Investor Class (a) | | 225,710 | $10,795,690 |
| VIP Equity-Income Portfolio Investor Class (a) | | 479,748 | 11,389,219 |
| VIP Growth & Income Portfolio Investor Class (a) | | 583,263 | 12,977,594 |
| VIP Growth Portfolio Investor Class (a) | | 107,449 | 11,000,632 |
| VIP Mid Cap Portfolio Investor Class (a) | | 81,844 | 3,146,092 |
| VIP Value Portfolio Investor Class (a) | | 523,807 | 8,339,012 |
| VIP Value Strategies Portfolio Investor Class (a) | | 303,390 | 4,077,559 |
| TOTAL DOMESTIC EQUITY FUNDS | | | |
| (Cost $39,404,392) | | | 61,725,798 |
|
| International Equity Funds - 25.8% | | | |
| VIP Emerging Markets Portfolio Investor Class (a) | | 1,897,273 | 27,851,973 |
| VIP Overseas Portfolio Investor Class (a) | | 1,255,308 | 33,165,245 |
| TOTAL INTERNATIONAL EQUITY FUNDS | | | |
| (Cost $39,666,046) | | | 61,017,218 |
|
| Bond Funds - 39.8% | | | |
| Fidelity Inflation-Protected Bond Index Fund (a) | | 1,530,666 | 16,898,549 |
| Fidelity Long-Term Treasury Bond Index Fund (a) | | 341,869 | 5,452,806 |
| VIP High Income Portfolio Investor Class (a) | | 896,033 | 4,722,095 |
| VIP Investment Grade Bond Portfolio Investor Class (a) | | 4,793,608 | 67,254,324 |
| TOTAL BOND FUNDS | | | |
| (Cost $86,004,927) | | | 94,327,774 |
|
| Short-Term Funds - 8.3% | | | |
| VIP Government Money Market Portfolio Investor Class 0.01% (a)(b) | | | |
| (Cost $19,587,413) | | 19,587,413 | 19,587,413 |
| TOTAL INVESTMENT IN SECURITIES - 100.0% | | | |
| (Cost $184,662,778) | | | 236,658,203 |
| NET OTHER ASSETS (LIABILITIES) - 0.0% | | | 3,421 |
| NET ASSETS - 100% | | | $236,661,624 |
Legend
(a) Affiliated Fund
(b) The rate quoted is the annualized seven-day yield of the fund at period end.
Affiliated Underlying Funds
Fiscal year to date information regarding the Fund's investments in affiliated Underlying Funds, excluding any Money Market Central Funds, is presented below. Exchanges between classes of the same affiliated Underlying Funds may occur.
| Affiliate | Value, beginning of period | Purchases | Sales Proceeds | Dividend Income | Realized Gain (loss) | Change in Unrealized appreciation (depreciation) | Value, end of period |
| Fidelity Inflation-Protected Bond Index Fund | $15,933,740 | $5,006,477 | $5,399,084 | $201,891 | $103,484 | $1,253,932 | $16,898,549 |
| Fidelity Long-Term Treasury Bond Index Fund | 5,800,318 | 2,481,267 | 3,571,119 | 208,015 | 480,829 | 261,511 | 5,452,806 |
| VIP Contrafund Portfolio Investor Class | 10,507,003 | 3,209,138 | 5,493,790 | 73,508 | 502,174 | 2,071,165 | 10,795,690 |
| VIP Emerging Markets Portfolio Investor Class | 22,355,233 | 10,695,893 | 10,055,782 | 2,684,086 | 466,020 | 4,390,609 | 27,851,973 |
| VIP Equity-Income Portfolio Investor Class | 11,102,718 | 4,837,121 | 4,777,859 | 649,313 | (13,206) | 240,445 | 11,389,219 |
| VIP Government Money Market Portfolio Investor Class 0.01% | 19,648,866 | 12,255,772 | 12,317,225 | 63,039 | -- | -- | 19,587,413 |
| VIP Growth & Income Portfolio Investor Class | 12,653,062 | 5,812,783 | 5,798,435 | 834,696 | 194,266 | 115,918 | 12,977,594 |
| VIP Growth Portfolio Investor Class | 10,740,285 | 3,365,011 | 5,751,091 | 1,059,463 | 1,360,161 | 1,286,266 | 11,000,632 |
| VIP High Income Portfolio Investor Class | 4,601,437 | 1,422,030 | 1,180,208 | 225,188 | (43,177) | (77,987) | 4,722,095 |
| VIP Investment Grade Bond Portfolio Investor Class | 64,117,303 | 22,932,960 | 23,595,364 | 1,429,799 | (151,730) | 3,951,155 | 67,254,324 |
| VIP Mid Cap Portfolio Investor Class | 3,082,015 | 1,109,734 | 1,626,899 | 15,476 | (21,300) | 602,542 | 3,146,092 |
| VIP Overseas Portfolio Investor Class | 36,953,401 | 10,850,444 | 18,714,219 | 268,014 | 399,492 | 3,676,127 | 33,165,245 |
| VIP Value Portfolio Investor Class | 8,153,159 | 4,184,644 | 4,425,124 | 396,759 | 36,360 | 389,973 | 8,339,012 |
| VIP Value Strategies Portfolio Investor Class | 3,992,224 | 2,166,188 | 2,347,379 | 239,394 | (110,022) | 376,548 | 4,077,559 |
| Total | $229,640,764 | $90,329,462 | $105,053,578 | $8,348,641 | $3,203,351 | $18,538,204 | $236,658,203 |
Amounts in the income column in the above table include any capital gain distributions from underlying funds, which are presented in the corresponding line-item in the Statement of Operations, if applicable.
Investment Valuation
The following is a summary of the inputs used, as of December 31, 2020, involving the Fund's assets and liabilities carried at fair value. The inputs or methodology used for valuing securities may not be an indication of the risk associated with investing in those securities. For more information on valuation inputs, and their aggregation into the levels used below, please refer to the Investment Valuation section in the accompanying Notes to Financial Statements.
| | Valuation Inputs at Reporting Date: |
| Description | Total | Level 1 | Level 2 | Level 3 |
| Investments in Securities: | | | | |
| Domestic Equity Funds | $61,725,798 | $61,725,798 | $-- | $-- |
| International Equity Funds | 61,017,218 | 61,017,218 | -- | -- |
| Bond Funds | 94,327,774 | 94,327,774 | -- | -- |
| Short-Term Funds | 19,587,413 | 19,587,413 | -- | -- |
| Total Investments in Securities: | $236,658,203 | $236,658,203 | $-- | $-- |
See accompanying notes which are an integral part of the financial statements.
VIP Investor Freedom 2020 Portfolio℠
Financial Statements
Statement of Assets and Liabilities
| | | December 31, 2020 |
| Assets | | |
Investment in securities, at value — See accompanying schedule:
| | |
| Affiliated issuers (cost $184,662,778) | $236,658,203 | |
| Total Investment in Securities (cost $184,662,778) | | $236,658,203 |
| Cash | | 3,422 |
| Receivable for investments sold | | 3,053,777 |
| Receivable for fund shares sold | | 48,333 |
| Total assets | | 239,763,735 |
| Liabilities | | |
| Payable for investments purchased | $3,101,980 | |
| Payable for fund shares redeemed | 131 | |
| Total liabilities | | 3,102,111 |
| Net Assets | | $236,661,624 |
| Net Assets consist of: | | |
| Paid in capital | | $177,277,611 |
| Total accumulated earnings (loss) | | 59,384,013 |
| Net Assets | | $236,661,624 |
| Net Asset Value, offering price and redemption price per share ($236,661,624 ÷ 16,475,602 shares) | | $14.36 |
See accompanying notes which are an integral part of the financial statements.
Statement of Operations
| | | Year ended December 31, 2020 |
| Investment Income | | |
| Dividends: | | |
| Affiliated issuers | | $2,722,622 |
| Expenses | | |
| Independent trustees' fees and expenses | $706 | |
| Total expenses | | 706 |
| Net investment income (loss) | | 2,721,916 |
| Realized and Unrealized Gain (Loss) | | |
| Net realized gain (loss) on: | | |
| Investment securities: | | |
| Affiliated issuers | 3,206,763 | |
| Capital gain distributions from underlying funds: | | |
| Affiliated issuers | 5,626,019 | |
| Total net realized gain (loss) | | 8,832,782 |
| Change in net unrealized appreciation (depreciation) on: | | |
| Investment securities: | | |
| Affiliated issuers | 18,538,204 | |
| Total change in net unrealized appreciation (depreciation) | | 18,538,204 |
| Net gain (loss) | | 27,370,986 |
| Net increase (decrease) in net assets resulting from operations | | $30,092,902 |
See accompanying notes which are an integral part of the financial statements.
Statement of Changes in Net Assets
| | Year ended December 31, 2020 | Year ended December 31, 2019 |
| Increase (Decrease) in Net Assets | | |
| Operations | | |
| Net investment income (loss) | $2,721,916 | $4,371,016 |
| Net realized gain (loss) | 8,832,782 | 11,156,014 |
| Change in net unrealized appreciation (depreciation) | 18,538,204 | 23,119,412 |
| Net increase (decrease) in net assets resulting from operations | 30,092,902 | 38,646,442 |
| Distributions to shareholders | (14,052,496) | (12,340,794) |
| Share transactions | | |
| Proceeds from sales of shares | 15,202,703 | 22,651,711 |
| Reinvestment of distributions | 14,052,496 | 12,340,794 |
| Cost of shares redeemed | (38,274,750) | (28,184,313) |
| Net increase (decrease) in net assets resulting from share transactions | (9,019,551) | 6,808,192 |
| Total increase (decrease) in net assets | 7,020,855 | 33,113,840 |
| Net Assets | | |
| Beginning of period | 229,640,769 | 196,526,929 |
| End of period | $236,661,624 | $229,640,769 |
| Other Information | | |
| Shares | | |
| Sold | 1,157,047 | 1,772,927 |
| Issued in reinvestment of distributions | 1,061,173 | 988,680 |
| Redeemed | (3,015,863) | (2,240,516) |
| Net increase (decrease) | (797,643) | 521,091 |
See accompanying notes which are an integral part of the financial statements.
Financial Highlights
VIP Investor Freedom 2020 Portfolio
| | | | | | |
| Years ended December 31, | 2020 | 2019 | 2018 | 2017 | 2016 |
| Selected Per–Share Data | | | | | |
| Net asset value, beginning of period | $13.29 | $11.73 | $12.94 | $11.51 | $11.34 |
| Income from Investment Operations | | | | | |
| Net investment income (loss)A | .16 | .26 | .18 | .19 | .17 |
| Net realized and unrealized gain (loss) | 1.75 | 2.04 | (.94) | 1.69 | .47 |
| Total from investment operations | 1.91 | 2.30 | (.76) | 1.88 | .64 |
| Distributions from net investment income | (.17) | (.26) | (.19) | (.18) | (.17) |
| Distributions from net realized gain | (.67) | (.48) | (.26) | (.27) | (.30) |
| Total distributions | (.84) | (.74) | (.45) | (.45) | (.47) |
| Net asset value, end of period | $14.36 | $13.29 | $11.73 | $12.94 | $11.51 |
| Total ReturnB,C | 14.95% | 20.11% | (5.94)% | 16.55% | 6.04% |
| Ratios to Average Net AssetsD | | | | | |
| Expenses before reductionsE | -% | -% | -% | -% | -% |
| Expenses net of fee waivers, if any | - %E | - %E | - %E | -% | -% |
| Expenses net of all reductions | - %E | - %E | - %E | -% | -% |
| Net investment income (loss) | 1.25% | 2.05% | 1.46% | 1.52% | 1.52% |
| Supplemental Data | | | | | |
| Net assets, end of period (000 omitted) | $236,662 | $229,641 | $196,527 | $222,819 | $189,814 |
| Portfolio turnover rateF | 42% | 32% | 33% | 21% | 23% |
A Calculated based on average shares outstanding during the period.
B Total returns do not reflect charges attributable to your insurance company's separate account. Inclusion of these charges would reduce the total returns shown.
C Total returns would have been lower if certain expenses had not been reduced during the applicable periods shown.
D Expense ratios reflect operating expenses of the class. Expenses before reductions do not reflect amounts reimbursed, waived, or reduced through arrangements with the investment advisor, brokerage services, or other offset arrangements, if applicable, and do not represent the amount paid by the class during periods when reimbursements, waivers or reductions occur.
E Amount represents less than .005%.
F Amount does not include the portfolio activity of any underlying mutual funds or exchange-traded funds (ETFs).
See accompanying notes which are an integral part of the financial statements.
VIP Investor Freedom 2025 Portfolio℠
Investment Summary (Unaudited)
The information in the following tables is based on the direct investments of the Fund.
Top Holdings as of December 31, 2020
| | % of fund's net assets |
| VIP Investment Grade Bond Portfolio Investor Class | 25.9 |
| VIP Overseas Portfolio Investor Class | 15.8 |
| VIP Emerging Markets Portfolio Investor Class | 12.6 |
| Fidelity Inflation-Protected Bond Index Fund | 6.3 |
| VIP Growth & Income Portfolio Investor Class | 6.3 |
| VIP Equity-Income Portfolio Investor Class | 5.5 |
| VIP Growth Portfolio Investor Class | 5.3 |
| VIP Contrafund Portfolio Investor Class | 5.3 |
| VIP Government Money Market Portfolio Investor Class 0.01% | 5.1 |
| VIP Value Portfolio Investor Class | 4.1 |
| | 92.2 |
Asset Allocation (% of fund's net assets)
| Period end |
| | Domestic Equity Funds | 30.0% |
| | International Equity Funds | 28.4% |
| | Bond Funds | 36.5% |
| | Short-Term Funds | 5.1% |

VIP Investor Freedom 2025 Portfolio℠
Schedule of Investments December 31, 2020
Showing Percentage of Net Assets
| Domestic Equity Funds - 30.0% | | | |
| | | Shares | Value |
| VIP Contrafund Portfolio Investor Class (a) | | 312,965 | $14,969,137 |
| VIP Equity-Income Portfolio Investor Class (a) | | 665,204 | 15,791,935 |
| VIP Growth & Income Portfolio Investor Class (a) | | 808,733 | 17,994,303 |
| VIP Growth Portfolio Investor Class (a) | | 148,989 | 15,253,498 |
| VIP Mid Cap Portfolio Investor Class (a) | | 113,484 | 4,362,315 |
| VIP Value Portfolio Investor Class (a) | | 726,293 | 11,562,591 |
| VIP Value Strategies Portfolio Investor Class (a) | | 420,673 | 5,653,850 |
| TOTAL DOMESTIC EQUITY FUNDS | | | |
| (Cost $54,599,385) | | | 85,587,629 |
|
| International Equity Funds - 28.4% | | | |
| VIP Emerging Markets Portfolio Investor Class (a) | | 2,444,632 | 35,887,197 |
| VIP Overseas Portfolio Investor Class (a) | | 1,707,963 | 45,124,394 |
| TOTAL INTERNATIONAL EQUITY FUNDS | | | |
| (Cost $54,188,491) | | | 81,011,591 |
|
| Bond Funds - 36.5% | | | |
| Fidelity Inflation-Protected Bond Index Fund (a) | | 1,639,042 | 18,095,023 |
| Fidelity Long-Term Treasury Bond Index Fund (a) | | 412,092 | 6,572,870 |
| VIP High Income Portfolio Investor Class (a) | | 1,079,957 | 5,691,373 |
| VIP Investment Grade Bond Portfolio Investor Class (a) | | 5,266,158 | 73,884,194 |
| TOTAL BOND FUNDS | | | |
| (Cost $96,288,273) | | | 104,243,460 |
|
| Short-Term Funds - 5.1% | | | |
| Fidelity Cash Central Fund 0.11% (b) | | 30,476 | 30,482 |
| VIP Government Money Market Portfolio Investor Class 0.01% (a)(c) | | 14,664,676 | 14,664,676 |
| TOTAL SHORT-TERM FUNDS | | | |
| (Cost $14,695,158) | | | 14,695,158 |
| TOTAL INVESTMENT IN SECURITIES - 100.0% | | | |
| (Cost $219,771,307) | | | 285,537,838 |
| NET OTHER ASSETS (LIABILITIES) - 0.0% | | | 908 |
| NET ASSETS - 100% | | | $285,538,746 |
Legend
(a) Affiliated Fund
(b) Affiliated fund that is generally available only to investment companies and other accounts managed by Fidelity Investments. The rate quoted is the annualized seven-day yield of the fund at period end. A complete unaudited listing of the fund's holdings as of its most recent quarter end is available upon request. In addition, each Fidelity Central Fund's financial statements, are available on the SEC's website or upon request.
(c) The rate quoted is the annualized seven-day yield of the fund at period end.
Affiliated Central Funds
Information regarding fiscal year to date income earned by the Fund from investments in Fidelity Central Funds is as follows:
| Fund | Income earned |
| Fidelity Cash Central Fund | $12 |
| Total | $12 |
Amounts in the income column in the above table include any capital gain distributions from underlying funds, which are presented in the corresponding line-item in the Statement of Operations, if applicable.
Affiliated Underlying Funds
Fiscal year to date information regarding the Fund's investments in affiliated Underlying Funds, excluding any Money Market Central Funds, is presented below. Exchanges between classes of the same affiliated Underlying Funds may occur.
| Affiliate | Value, beginning of period | Purchases | Sales Proceeds | Dividend Income | Realized Gain (loss) | Change in Unrealized appreciation (depreciation) | Value, end of period |
| Fidelity Inflation-Protected Bond Index Fund | $15,396,491 | $6,260,582 | $4,953,249 | $213,743 | $76,682 | $1,314,517 | $18,095,023 |
| Fidelity Long-Term Treasury Bond Index Fund | 6,285,210 | 3,312,659 | 3,824,481 | 244,431 | 486,437 | 313,045 | 6,572,870 |
| VIP Contrafund Portfolio Investor Class | 13,089,778 | 4,421,104 | 6,010,558 | 95,880 | 446,706 | 3,022,107 | 14,969,137 |
| VIP Emerging Markets Portfolio Investor Class | 26,012,776 | 13,672,968 | 10,156,233 | 3,290,348 | 357,762 | 5,999,924 | 35,887,197 |
| VIP Equity-Income Portfolio Investor Class | 13,831,556 | 6,505,218 | 4,974,914 | 850,565 | (21,228) | 451,303 | 15,791,935 |
| VIP Government Money Market Portfolio Investor Class 0.01% | 13,203,462 | 12,839,789 | 11,378,575 | 45,372 | -- | -- | 14,664,676 |
| VIP Growth & Income Portfolio Investor Class | 15,763,085 | 7,834,701 | 6,174,521 | 1,093,763 | 6,920 | 564,118 | 17,994,303 |
| VIP Growth Portfolio Investor Class | 13,380,493 | 4,633,371 | 6,373,983 | 1,377,465 | 750,215 | 2,863,402 | 15,253,498 |
| VIP High Income Portfolio Investor Class | 4,985,872 | 1,964,152 | 1,140,961 | 267,568 | (36,536) | (81,154) | 5,691,373 |
| VIP Investment Grade Bond Portfolio Investor Class | 63,102,157 | 29,466,675 | 22,621,445 | 1,541,402 | (128,193) | 4,065,000 | 73,884,194 |
| VIP Mid Cap Portfolio Investor Class | 3,839,493 | 1,540,402 | 1,839,755 | 20,955 | (78,386) | 900,561 | 4,362,315 |
| VIP Overseas Portfolio Investor Class | 44,771,029 | 15,139,631 | 20,534,830 | 346,934 | 126,596 | 5,621,968 | 45,124,394 |
| VIP Value Portfolio Investor Class | 10,156,996 | 5,705,679 | 5,023,454 | 518,510 | (181,981) | 905,351 | 11,562,591 |
| VIP Value Strategies Portfolio Investor Class | 4,973,366 | 2,961,432 | 2,718,135 | 311,590 | (256,100) | 693,287 | 5,653,850 |
| Total | $248,791,764 | $116,258,363 | $107,725,094 | $10,218,526 | $1,548,894 | $26,633,429 | $285,507,356 |
Amounts in the income column in the above table include any capital gain distributions from underlying funds, which are presented in the corresponding line-item in the Statement of Operations, if applicable.
Investment Valuation
The following is a summary of the inputs used, as of December 31, 2020, involving the Fund's assets and liabilities carried at fair value. The inputs or methodology used for valuing securities may not be an indication of the risk associated with investing in those securities. For more information on valuation inputs, and their aggregation into the levels used below, please refer to the Investment Valuation section in the accompanying Notes to Financial Statements.
| | Valuation Inputs at Reporting Date: |
| Description | Total | Level 1 | Level 2 | Level 3 |
| Investments in Securities: | | | | |
| Domestic Equity Funds | $85,587,629 | $85,587,629 | $-- | $-- |
| International Equity Funds | 81,011,591 | 81,011,591 | -- | -- |
| Bond Funds | 104,243,460 | 104,243,460 | -- | -- |
| Short-Term Funds | 14,695,158 | 14,695,158 | -- | -- |
| Total Investments in Securities: | $285,537,838 | $285,537,838 | $-- | $-- |
See accompanying notes which are an integral part of the financial statements.
VIP Investor Freedom 2025 Portfolio℠
Financial Statements
Statement of Assets and Liabilities
| | | December 31, 2020 |
| Assets | | |
Investment in securities, at value — See accompanying schedule:
| | |
| Fidelity Central Funds (cost $30,482) | $30,482 | |
| Other affiliated issuers (cost $219,740,825) | 285,507,356 | |
| Total Investment in Securities (cost $219,771,307) | | $285,537,838 |
| Cash | | 905 |
| Receivable for investments sold | | 3,475,598 |
| Receivable for fund shares sold | | 302,250 |
| Distributions receivable from Fidelity Central Funds | | 3 |
| Total assets | | 289,316,594 |
| Liabilities | | |
| Payable for investments purchased | $3,777,717 | |
| Payable for fund shares redeemed | 131 | |
| Total liabilities | | 3,777,848 |
| Net Assets | | $285,538,746 |
| Net Assets consist of: | | |
| Paid in capital | | $212,826,791 |
| Total accumulated earnings (loss) | | 72,711,955 |
| Net Assets | | $285,538,746 |
| Net Asset Value, offering price and redemption price per share ($285,538,746 ÷ 18,138,821 shares) | | $15.74 |
See accompanying notes which are an integral part of the financial statements.
Statement of Operations
| | | Year ended December 31, 2020 |
| Investment Income | | |
| Dividends: | | |
| Affiliated issuers | | $3,176,122 |
| Income from Fidelity Central Funds | | 12 |
| Total income | | 3,176,134 |
| Expenses | | |
| Independent trustees' fees and expenses | $806 | |
| Total expenses before reductions | 806 | |
| Expense reductions | (332) | |
| Total expenses after reductions | | 474 |
| Net investment income (loss) | | 3,175,660 |
| Realized and Unrealized Gain (Loss) | | |
| Net realized gain (loss) on: | | |
| Investment securities: | | |
| Affiliated issuers | 1,549,791 | |
| Capital gain distributions from underlying funds: | | |
| Affiliated issuers | 7,042,404 | |
| Total net realized gain (loss) | | 8,592,195 |
| Change in net unrealized appreciation (depreciation) on: | | |
| Investment securities: | | |
| Affiliated issuers | 26,633,429 | |
| Total change in net unrealized appreciation (depreciation) | | 26,633,429 |
| Net gain (loss) | | 35,225,624 |
| Net increase (decrease) in net assets resulting from operations | | $38,401,284 |
See accompanying notes which are an integral part of the financial statements.
Statement of Changes in Net Assets
| | Year ended December 31, 2020 | Year ended December 31, 2019 |
| Increase (Decrease) in Net Assets | | |
| Operations | | |
| Net investment income (loss) | $3,175,660 | $4,653,485 |
| Net realized gain (loss) | 8,592,195 | 11,403,704 |
| Change in net unrealized appreciation (depreciation) | 26,633,429 | 28,219,177 |
| Net increase (decrease) in net assets resulting from operations | 38,401,284 | 44,276,366 |
| Distributions to shareholders | (14,856,510) | (11,838,472) |
| Share transactions | | |
| Proceeds from sales of shares | 28,520,663 | 20,167,839 |
| Reinvestment of distributions | 14,856,510 | 11,838,472 |
| Cost of shares redeemed | (30,205,446) | (19,084,984) |
| Net increase (decrease) in net assets resulting from share transactions | 13,171,727 | 12,921,327 |
| Total increase (decrease) in net assets | 36,716,501 | 45,359,221 |
| Net Assets | | |
| Beginning of period | 248,822,245 | 203,463,024 |
| End of period | $285,538,746 | $248,822,245 |
| Other Information | | |
| Shares | | |
| Sold | 2,068,158 | 1,485,846 |
| Issued in reinvestment of distributions | 1,025,793 | 877,461 |
| Redeemed | (2,252,889) | (1,409,369) |
| Net increase (decrease) | 841,062 | 953,938 |
See accompanying notes which are an integral part of the financial statements.
Financial Highlights
VIP Investor Freedom 2025 Portfolio
| | | | | | |
| Years ended December 31, | 2020 | 2019 | 2018 | 2017 | 2016 |
| Selected Per–Share Data | | | | | |
| Net asset value, beginning of period | $14.38 | $12.45 | $13.78 | $12.15 | $12.04 |
| Income from Investment Operations | | | | | |
| Net investment income (loss)A | .18 | .28 | .20 | .20 | .18 |
| Net realized and unrealized gain (loss) | 2.02 | 2.37 | (1.09) | 1.94 | .50 |
| Total from investment operations | 2.20 | 2.65 | (.89) | 2.14 | .68 |
| Distributions from net investment income | (.18) | (.28) | (.19) | (.19) | (.18) |
| Distributions from net realized gain | (.66) | (.44) | (.25) | (.32) | (.39) |
| Total distributions | (.84) | (.72) | (.44) | (.51) | (.57) |
| Net asset value, end of period | $15.74 | $14.38 | $12.45 | $13.78 | $12.15 |
| Total ReturnB,C | 15.88% | 21.73% | (6.56)% | 17.82% | 6.10% |
| Ratios to Average Net AssetsD,E | | | | | |
| Expenses before reductionsF | -% | -% | -% | -% | -% |
| Expenses net of fee waivers, if any | - %F | - %F | - %F | -% | -% |
| Expenses net of all reductions | - %F | - %F | - %F | -% | -% |
| Net investment income (loss) | 1.26% | 2.03% | 1.44% | 1.53% | 1.54% |
| Supplemental Data | | | | | |
| Net assets, end of period (000 omitted) | $285,539 | $248,822 | $203,463 | $216,200 | $163,933 |
| Portfolio turnover rateG | 43% | 29% | 30% | 17% | 23% |
A Calculated based on average shares outstanding during the period.
B Total returns do not reflect charges attributable to your insurance company's separate account. Inclusion of these charges would reduce the total returns shown.
C Total returns would have been lower if certain expenses had not been reduced during the applicable periods shown.
D Fees and expenses of any underlying mutual funds or exchange-traded funds (ETFs) are not included in the Fund's expense ratio. The Fund indirectly bears its proportionate share of these expenses. For additional expense information related to investments in Fidelity Central Funds, please refer to the "Investments in Fidelity Central Funds" note found in the Notes to Financial Statements section of the most recent Annual or Semi-Annual report.
E Expense ratios reflect operating expenses of the class. Expenses before reductions do not reflect amounts reimbursed, waived, or reduced through arrangements with the investment advisor, brokerage services, or other offset arrangements, if applicable, and do not represent the amount paid by the class during periods when reimbursements, waivers or reductions occur.
F Amount represents less than .005%.
G Amount does not include the portfolio activity of any underlying mutual funds or exchange-traded funds (ETFs).
See accompanying notes which are an integral part of the financial statements.
VIP Investor Freedom 2030 Portfolio℠
Investment Summary (Unaudited)
The information in the following tables is based on the direct investments of the Fund.
Top Holdings as of December 31, 2020
| | % of fund's net assets |
| VIP Investment Grade Bond Portfolio Investor Class | 22.7 |
| VIP Overseas Portfolio Investor Class | 18.0 |
| VIP Emerging Markets Portfolio Investor Class | 13.5 |
| VIP Growth & Income Portfolio Investor Class | 7.3 |
| VIP Equity-Income Portfolio Investor Class | 6.4 |
| VIP Growth Portfolio Investor Class | 6.2 |
| VIP Contrafund Portfolio Investor Class | 6.1 |
| Fidelity Inflation-Protected Bond Index Fund | 5.6 |
| VIP Value Portfolio Investor Class | 4.7 |
| Fidelity Long-Term Treasury Bond Index Fund | 2.3 |
| | 92.8 |
Asset Allocation (% of fund's net assets)
| Period end |
| | Domestic Equity Funds | 34.8% |
| | International Equity Funds | 31.5% |
| | Bond Funds | 32.6% |
| | Short-Term Funds | 1.1% |

VIP Investor Freedom 2030 Portfolio℠
Schedule of Investments December 31, 2020
Showing Percentage of Net Assets
| Domestic Equity Funds - 34.8% | | | |
| | | Shares | Value |
| VIP Contrafund Portfolio Investor Class (a) | | 413,691 | $19,786,827 |
| VIP Equity-Income Portfolio Investor Class (a) | | 879,283 | 20,874,190 |
| VIP Growth & Income Portfolio Investor Class (a) | | 1,069,006 | 23,785,392 |
| VIP Growth Portfolio Investor Class (a) | | 196,942 | 20,162,873 |
| VIP Mid Cap Portfolio Investor Class (a) | | 150,008 | 5,766,321 |
| VIP Value Portfolio Investor Class (a) | | 960,038 | 15,283,810 |
| VIP Value Strategies Portfolio Investor Class (a) | | 556,061 | 7,473,458 |
| TOTAL DOMESTIC EQUITY FUNDS | | | |
| (Cost $78,041,841) | | | 113,132,871 |
|
| International Equity Funds - 31.5% | | | |
| VIP Emerging Markets Portfolio Investor Class (a) | | 3,000,997 | 44,054,636 |
| VIP Overseas Portfolio Investor Class (a) | | 2,217,551 | 58,587,686 |
| TOTAL INTERNATIONAL EQUITY FUNDS | | | |
| (Cost $71,383,981) | | | 102,642,322 |
|
| Bond Funds - 32.6% | | | |
| Fidelity Inflation-Protected Bond Index Fund (a) | | 1,648,444 | 18,198,827 |
| Fidelity Long-Term Treasury Bond Index Fund (a) | | 470,439 | 7,503,497 |
| VIP High Income Portfolio Investor Class (a) | | 1,233,059 | 6,498,220 |
| VIP Investment Grade Bond Portfolio Investor Class (a) | | 5,277,646 | 74,045,368 |
| TOTAL BOND FUNDS | | | |
| (Cost $99,067,094) | | | 106,245,912 |
|
| Short-Term Funds - 1.1% | | | |
| VIP Government Money Market Portfolio Investor Class 0.01% (a)(b) | | | |
| (Cost $3,645,966) | | 3,645,966 | 3,645,966 |
| TOTAL INVESTMENT IN SECURITIES - 100.0% | | | |
| (Cost $252,138,882) | | | 325,667,071 |
| NET OTHER ASSETS (LIABILITIES) - 0.0% | | | 4 |
| NET ASSETS - 100% | | | $325,667,075 |
Legend
(a) Affiliated Fund
(b) The rate quoted is the annualized seven-day yield of the fund at period end.
Affiliated Underlying Funds
Fiscal year to date information regarding the Fund's investments in affiliated Underlying Funds, excluding any Money Market Central Funds, is presented below. Exchanges between classes of the same affiliated Underlying Funds may occur.
| Affiliate | Value, beginning of period | Purchases | Sales Proceeds | Dividend Income | Realized Gain (loss) | Change in Unrealized appreciation (depreciation) | Value, end of period |
| Fidelity Inflation-Protected Bond Index Fund | $12,834,455 | $7,703,776 | $3,599,344 | $210,371 | $24,344 | $1,235,596 | $18,198,827 |
| Fidelity Long-Term Treasury Bond Index Fund | 6,993,520 | 3,901,086 | 4,254,654 | 271,801 | 522,665 | 340,880 | 7,503,497 |
| VIP Contrafund Portfolio Investor Class | 17,368,964 | 5,074,674 | 7,103,178 | 123,048 | 500,980 | 3,945,387 | 19,786,827 |
| VIP Emerging Markets Portfolio Investor Class | 31,901,179 | 15,259,509 | 10,636,282 | 3,923,655 | 362,150 | 7,168,080 | 44,054,636 |
| VIP Equity-Income Portfolio Investor Class | 18,352,571 | 7,484,099 | 5,469,026 | 1,093,144 | (58,405) | 564,951 | 20,874,190 |
| VIP Government Money Market Portfolio Investor Class 0.01% | 2,777,063 | 11,597,946 | 10,729,043 | 13,284 | -- | -- | 3,645,966 |
| VIP Growth & Income Portfolio Investor Class | 20,915,762 | 9,052,810 | 6,870,482 | 1,405,871 | 3,350 | 683,952 | 23,785,392 |
| VIP Growth Portfolio Investor Class | 17,754,769 | 5,500,027 | 7,733,406 | 1,765,861 | 902,262 | 3,739,221 | 20,162,873 |
| VIP High Income Portfolio Investor Class | 5,547,489 | 2,332,782 | 1,238,082 | 299,766 | (46,508) | (97,461) | 6,498,220 |
| VIP Investment Grade Bond Portfolio Investor Class | 59,547,523 | 32,339,921 | 21,457,679 | 1,500,750 | (140,325) | 3,755,928 | 74,045,368 |
| VIP Mid Cap Portfolio Investor Class | 5,094,512 | 1,800,191 | 2,165,425 | 27,225 | (129,348) | 1,166,391 | 5,766,321 |
| VIP Overseas Portfolio Investor Class | 57,600,524 | 17,026,168 | 23,296,982 | 436,762 | (28,409) | 7,286,385 | 58,587,686 |
| VIP Value Portfolio Investor Class | 13,476,998 | 6,885,045 | 5,951,960 | 665,890 | (207,830) | 1,081,557 | 15,283,810 |
| VIP Value Strategies Portfolio Investor Class | 6,599,025 | 3,572,334 | 3,233,383 | 399,597 | (324,778) | 860,260 | 7,473,458 |
| Total | $276,764,354 | $129,530,368 | $113,738,926 | $12,137,025 | $1,380,148 | $31,731,127 | $325,667,071 |
Amounts in the income column in the above table include any capital gain distributions from underlying funds, which are presented in the corresponding line-item in the Statement of Operations, if applicable.
Investment Valuation
The following is a summary of the inputs used, as of December 31, 2020, involving the Fund's assets and liabilities carried at fair value. The inputs or methodology used for valuing securities may not be an indication of the risk associated with investing in those securities. For more information on valuation inputs, and their aggregation into the levels used below, please refer to the Investment Valuation section in the accompanying Notes to Financial Statements.
| | Valuation Inputs at Reporting Date: |
| Description | Total | Level 1 | Level 2 | Level 3 |
| Investments in Securities: | | | | |
| Domestic Equity Funds | $113,132,871 | $113,132,871 | $-- | $-- |
| International Equity Funds | 102,642,322 | 102,642,322 | -- | -- |
| Bond Funds | 106,245,912 | 106,245,912 | -- | -- |
| Short-Term Funds | 3,645,966 | 3,645,966 | -- | -- |
| Total Investments in Securities: | $325,667,071 | $325,667,071 | $-- | $-- |
See accompanying notes which are an integral part of the financial statements.
VIP Investor Freedom 2030 Portfolio℠
Financial Statements
Statement of Assets and Liabilities
| | | December 31, 2020 |
| Assets | | |
Investment in securities, at value — See accompanying schedule:
| | |
| Affiliated issuers (cost $252,138,882) | $325,667,071 | |
| Total Investment in Securities (cost $252,138,882) | | $325,667,071 |
| Cash | | 2 |
| Receivable for investments sold | | 4,025,521 |
| Receivable for fund shares sold | | 447,172 |
| Total assets | | 330,139,766 |
| Liabilities | | |
| Payable for investments purchased | $4,472,569 | |
| Payable for fund shares redeemed | 122 | |
| Total liabilities | | 4,472,691 |
| Net Assets | | $325,667,075 |
| Net Assets consist of: | | |
| Paid in capital | | $244,171,028 |
| Total accumulated earnings (loss) | | 81,496,047 |
| Net Assets | | $325,667,075 |
| Net Asset Value, offering price and redemption price per share ($325,667,075 ÷ 20,741,969 shares) | | $15.70 |
See accompanying notes which are an integral part of the financial statements.
Statement of Operations
| | | Year ended December 31, 2020 |
| Investment Income | | |
| Dividends: | | |
| Affiliated issuers | | $3,478,746 |
| Expenses | | |
| Independent trustees' fees and expenses | $881 | |
| Total expenses | | 881 |
| Net investment income (loss) | | 3,477,865 |
| Realized and Unrealized Gain (Loss) | | |
| Net realized gain (loss) on: | | |
| Investment securities: | | |
| Affiliated issuers | 1,380,148 | |
| Capital gain distributions from underlying funds: | | |
| Affiliated issuers | 8,658,279 | |
| Total net realized gain (loss) | | 10,038,427 |
| Change in net unrealized appreciation (depreciation) on: | | |
| Investment securities: | | |
| Affiliated issuers | 31,731,127 | |
| Total change in net unrealized appreciation (depreciation) | | 31,731,127 |
| Net gain (loss) | | 41,769,554 |
| Net increase (decrease) in net assets resulting from operations | | $45,247,419 |
See accompanying notes which are an integral part of the financial statements.
Statement of Changes in Net Assets
| | Year ended December 31, 2020 | Year ended December 31, 2019 |
| Increase (Decrease) in Net Assets | | |
| Operations | | |
| Net investment income (loss) | $3,477,865 | $4,992,047 |
| Net realized gain (loss) | 10,038,427 | 12,951,831 |
| Change in net unrealized appreciation (depreciation) | 31,731,127 | 34,870,344 |
| Net increase (decrease) in net assets resulting from operations | 45,247,419 | 52,814,222 |
| Distributions to shareholders | (16,904,069) | (13,207,757) |
| Share transactions | | |
| Proceeds from sales of shares | 30,563,323 | 29,079,866 |
| Reinvestment of distributions | 16,904,069 | 13,207,757 |
| Cost of shares redeemed | (26,908,022) | (19,001,005) |
| Net increase (decrease) in net assets resulting from share transactions | 20,559,370 | 23,286,618 |
| Total increase (decrease) in net assets | 48,902,720 | 62,893,083 |
| Net Assets | | |
| Beginning of period | 276,764,355 | 213,871,272 |
| End of period | $325,667,075 | $276,764,355 |
| Other Information | | |
| Shares | | |
| Sold | 2,184,529 | 2,169,283 |
| Issued in reinvestment of distributions | 1,177,393 | 995,777 |
| Redeemed | (2,025,911) | (1,433,376) |
| Net increase (decrease) | 1,336,011 | 1,731,684 |
See accompanying notes which are an integral part of the financial statements.
Financial Highlights
VIP Investor Freedom 2030 Portfolio
| | | | | | |
| Years ended December 31, | 2020 | 2019 | 2018 | 2017 | 2016 |
| Selected Per–Share Data | | | | | |
| Net asset value, beginning of period | $14.26 | $12.10 | $13.61 | $11.76 | $11.68 |
| Income from Investment Operations | | | | | |
| Net investment income (loss)A | .17 | .27 | .18 | .19 | .17 |
| Net realized and unrealized gain (loss) | 2.14 | 2.62 | (1.24) | 2.23 | .51 |
| Total from investment operations | 2.31 | 2.89 | (1.06) | 2.42 | .68 |
| Distributions from net investment income | (.17) | (.27) | (.18) | (.17) | (.17) |
| Distributions from net realized gain | (.69) | (.46) | (.28) | (.39) | (.44) |
| Total distributions | (.87)B | (.73) | (.45)B | (.57)B | (.60)B |
| Net asset value, end of period | $15.70 | $14.26 | $12.10 | $13.61 | $11.76 |
| Total ReturnC,D | 16.82% | 24.42% | (7.87)% | 20.92% | 6.50% |
| Ratios to Average Net AssetsE | | | | | |
| Expenses before reductionsF | -% | -% | -% | -% | -% |
| Expenses net of fee waivers, if any | - %F | - %F | - %F | -% | -% |
| Expenses net of all reductions | - %F | - %F | - %F | -% | -% |
| Net investment income (loss) | 1.26% | 2.03% | 1.36% | 1.46% | 1.48% |
| Supplemental Data | | | | | |
| Net assets, end of period (000 omitted) | $325,667 | $276,764 | $213,871 | $214,597 | $155,533 |
| Portfolio turnover rateG | 41% | 29% | 24% | 19% | 19% |
A Calculated based on average shares outstanding during the period.
B Total distributions per share do not sum due to rounding.
C Total returns do not reflect charges attributable to your insurance company's separate account. Inclusion of these charges would reduce the total returns shown.
D Total returns would have been lower if certain expenses had not been reduced during the applicable periods shown.
E Expense ratios reflect operating expenses of the class. Expenses before reductions do not reflect amounts reimbursed, waived, or reduced through arrangements with the investment advisor, brokerage services, or other offset arrangements, if applicable, and do not represent the amount paid by the class during periods when reimbursements, waivers or reductions occur.
F Amount represents less than .005%.
G Amount does not include the portfolio activity of any underlying mutual funds or exchange-traded funds (ETFs).
See accompanying notes which are an integral part of the financial statements.
Notes to Financial Statements
For the period ended December 31, 2020
1. Organization.
VIP Investor Freedom Income Portfolio, VIP Investor Freedom 2005 Portfolio, VIP Investor Freedom 2010 Portfolio, VIP Investor Freedom 2015 Portfolio, VIP Investor Freedom 2020 Portfolio, VIP Investor Freedom 2025 Portfolio and VIP Investor Freedom 2030 Portfolio (the Funds) are funds of Variable Insurance Products Fund V (the Trust). The Trust is registered under the Investment Company Act of 1940, as amended (the 1940 Act), as an open-end management investment company organized as a Massachusetts business trust. Each Fund is authorized to issue an unlimited number of shares. Shares of each Fund may only be purchased by insurance companies for the purpose of funding variable annuity or variable life insurance contracts.
Effective January 1, 2020, investment advisers Fidelity Investments Money Management, Inc., FMR Co., Inc., and Fidelity SelectCo, LLC, merged with and into Fidelity Management & Research Company. In connection with the merger transactions, the resulting, merged investment adviser was then redomiciled from Massachusetts to Delaware, changed its corporate structure from a corporation to a limited liability company, and changed its name to "Fidelity Management & Research Company LLC".
2. Investments in Fidelity Central Funds.
The Funds may invest in Fidelity Central Funds, which are open-end investment companies generally available only to other investment companies and accounts managed by the investment adviser and its affiliates. The Funds' Schedules of Investments list each of the Fidelity Central Funds held as of period end, if any, as an investment of each Fund, but do not include the underlying holdings of each Fidelity Central Fund. As an Investing Fund, each Fund indirectly bears its proportionate share of the expenses of the underlying Fidelity Central Funds.
The Money Market Central Funds seek preservation of capital and current income and are managed by the investment adviser. Annualized expenses of the Money Market Central Funds as of their most recent shareholder report date ranged from less than .005% to .01%.
A complete unaudited list of holdings for each Fidelity Central Fund is available upon request or at the Securities and Exchange Commission (the SEC) website at www.sec.gov. In addition, the financial statements of the Fidelity Central Funds, which are not covered by the Funds' Report of Independent Registered Public Accounting Firm, are available on the SEC website or upon request.
3. Significant Accounting Policies.
Each Fund is an investment company and applies the accounting and reporting guidance of the Financial Accounting Standards Board (FASB) Accounting Standards Codification Topic 946 Financial Services - Investment Companies. The financial statements have been prepared in conformity with accounting principles generally accepted in the United States of America (GAAP), which require management to make certain estimates and assumptions at the date of the financial statements. Actual results could differ from those estimates. Subsequent events, if any, through the date that the financial statements were issued have been evaluated in the preparation of the financial statements. The following summarizes the significant accounting policies of the Funds:
Investment Valuation. Investments are valued as of 4:00 p.m. Eastern time on the last calendar day of the period. Each Fund categorizes the inputs to valuation techniques used to value its investments into a disclosure hierarchy consisting of three levels as shown below:
- Level 1 – quoted prices in active markets for identical investments
- Level 2 – other significant observable inputs (including quoted prices for similar investments, interest rates, prepayment speeds, etc.)
- Level 3 – unobservable inputs (including the Fund's own assumptions based on the best information available)
Valuation techniques used to value each Fund's investments by major category are as follows. Investments in open-end mutual funds are valued at their closing net asset value (NAV) each business day and are categorized as Level 1 in the hierarchy.
Investment Transactions and Income. For financial reporting purposes, the Funds' investment holdings and NAV include trades executed through the end of the last business day of the period. The NAV per share for processing shareholder transactions is calculated as of the close of business of the New York Stock Exchange (NYSE), normally 4:00 p.m. Eastern time and includes trades executed through the end of the prior business day. Gains and losses on securities sold are determined on the basis of identified cost. Income and capital gain distributions from any underlying mutual funds or exchange-traded funds (ETFs) are recorded on the ex-dividend date.
Expenses. Expenses directly attributable to a fund are charged to that fund. Expenses attributable to more than one fund are allocated among the respective funds on the basis of relative net assets or other appropriate methods. Expenses included in the accompanying financial statements reflect the expenses of each Fund and do not include any expenses associated with any underlying mutual funds or exchange-traded funds (ETFs). Although not included in each Fund's expenses, each Fund indirectly bears its proportionate share of any underlying mutual funds or exchange-traded funds (ETFs) expenses through the impact of these expenses on each underlying mutual fund's or exchange-traded fund's (ETFs) NAV. Expense estimates are accrued in the period to which they relate and adjustments are made when actual amounts are known.
Income Tax Information and Distributions to Shareholders. Each year, each Fund intends to qualify as a regulated investment company under Subchapter M of the Internal Revenue Code, including distributing substantially all of its taxable income and realized gains. As a result, no provision for U.S. Federal income taxes is required. As of December 31, 2020, each Fund did not have any unrecognized tax benefits in the financial statements; nor is each Fund aware of any tax positions for which it is reasonably possible that the total amounts of unrecognized tax benefits will significantly change in the next twelve months. Each Fund files a U.S. federal tax return, in addition to state and local tax returns as required. Each Fund's federal income tax returns are subject to examination by the Internal Revenue Service (IRS) for a period of three fiscal years after they are filed. State and local tax returns may be subject to examination for an additional fiscal year depending on the jurisdiction.
Distributions are declared and recorded on the ex-dividend date. Income and capital gain distributions are determined in accordance with income tax regulations, which may differ from GAAP.
Capital accounts within the financial statements are adjusted for permanent book-tax differences. These adjustments have no impact on net assets or the results of operations. Capital accounts are not adjusted for temporary book-tax differences which will reverse in a subsequent period.
Book-tax differences are primarily due to the short-term gain distributions from the underlying mutual funds or exchange-traded funds (ETFs) and losses deferred due to wash sales.
As of period end, the cost and unrealized appreciation (depreciation) in securities, and derivatives if applicable, for federal income tax purposes were as follows for each Fund:
| | Tax cost | Gross unrealized appreciation | Gross unrealized depreciation | Net unrealized appreciation (depreciation) |
| VIP Investor Freedom Income Portfolio | $85,839,893 | $12,223,608 | $(174,243) | $12,049,365 |
| VIP Investor Freedom 2005 Portfolio | 31,263,959 | 4,967,062 | (55,862) | 4,911,200 |
| VIP Investor Freedom 2010 Portfolio | 64,047,759 | 12,070,169 | (110,197) | 11,959,972 |
| VIP Investor Freedom 2015 Portfolio | 91,881,167 | 22,538,383 | (193,737) | 22,344,646 |
| VIP Investor Freedom 2020 Portfolio | 185,634,116 | 51,311,174 | (287,087) | 51,024,087 |
| VIP Investor Freedom 2025 Portfolio | 221,072,471 | 64,927,520 | (462,153) | 64,465,367 |
| VIP Investor Freedom 2030 Portfolio | 253,805,717 | 72,349,308 | (487,954) | 71,861,354 |
The tax-based components of distributable earnings as of period end were as follows for each Fund:
| | Undistributed ordinary income | Undistributed long-term capital gain | Net unrealized appreciation (depreciation) on securities and other investments |
| VIP Investor Freedom Income Portfolio | $175,605 | $1,690,381 | $12,049,365 |
| VIP Investor Freedom 2005 Portfolio | 45,726 | 674,652 | 4,911,200 |
| VIP Investor Freedom 2010 Portfolio | 164,303 | 1,550,359 | 11,959,972 |
| VIP Investor Freedom 2015 Portfolio | 189,897 | 3,487,523 | 22,344,646 |
| VIP Investor Freedom 2020 Portfolio | 224,067 | 8,135,859 | 51,024,087 |
| VIP Investor Freedom 2025 Portfolio | 195,378 | 8,051,210 | 64,465,367 |
| VIP Investor Freedom 2030 Portfolio | 212,875 | 9,421,816 | 71,861,354 |
The tax character of distributions paid was as follows:
| December 31, 2020 | | | |
| | Ordinary Income | Long-term Capital Gains | Total |
| VIP Investor Freedom Income Portfolio | $1,621,466 | $1,659,270 | $3,280,736 |
| VIP Investor Freedom 2005 Portfolio | 601,474 | 901,226 | 1,502,700 |
| VIP Investor Freedom 2010 Portfolio | 1,270,161 | 2,175,744 | 3,445,905 |
| VIP Investor Freedom 2015 Portfolio | 1,915,368 | 4,872,803 | 6,788,171 |
| VIP Investor Freedom 2020 Portfolio | 3,813,431 | 10,239,065 | 14,052,496 |
| VIP Investor Freedom 2025 Portfolio | 4,474,663 | 10,381,847 | 14,856,510 |
| VIP Investor Freedom 2030 Portfolio | 4,942,881 | 11,961,188 | 16,904,069 |
| December 31, 2019 | | | |
| | Ordinary Income | Long-term Capital Gains | Total |
| VIP Investor Freedom Income Portfolio | $2,068,114 | $1,375,819 | $3,443,933 |
| VIP Investor Freedom 2005 Portfolio | 792,300 | 505,671 | 1,297,971 |
| VIP Investor Freedom 2010 Portfolio | 1,600,791 | 2,274,294 | 3,875,085 |
| VIP Investor Freedom 2015 Portfolio | 2,522,019 | 3,879,110 | 6,401,129 |
| VIP Investor Freedom 2020 Portfolio | 5,228,777 | 7,112,017 | 12,340,794 |
| VIP Investor Freedom 2025 Portfolio | 5,466,413 | 6,372,059 | 11,838,472 |
| VIP Investor Freedom 2030 Portfolio | 5,714,083 | 7,493,674 | 13,207,757 |
4. Purchases and Sales of Investments.
Purchases and sales of securities, other than short-term securities, are noted in the table below.
| | Purchases ($) | Sales ($) |
| VIP Investor Freedom Income Portfolio | 49,563,793 | 44,076,894 |
| VIP Investor Freedom 2005 Portfolio | 17,753,773 | 17,356,695 |
| VIP Investor Freedom 2010 Portfolio | 30,122,671 | 26,711,885 |
| VIP Investor Freedom 2015 Portfolio | 44,367,352 | 47,343,591 |
| VIP Investor Freedom 2020 Portfolio | 90,329,462 | 105,053,578 |
| VIP Investor Freedom 2025 Portfolio | 116,258,363 | 107,725,094 |
| VIP Investor Freedom 2030 Portfolio | 129,530,368 | 113,738,926 |
5. Fees and Other Transactions with Affiliates.
Management Fee. Fidelity Management & Research Company LLC (the investment adviser) provides the Funds with investment management related services. The Funds do not pay any fees for these services.
Interfund Trades. Funds may purchase from or sell securities to other Fidelity Funds under procedures adopted by the Board. The procedures have been designed to ensure these interfund trades are executed in accordance with Rule 17a-7 of the 1940 Act. Interfund trades are included within the respective purchases and sales amounts shown in the Purchases and Sales of Investments note.
Other. During the period, the investment adviser reimbursed the Fund for certain losses as follows:
| | Amount |
| VIP Investor Freedom Income Portfolio | $27 |
| VIP Investor Freedom 2020 Portfolio | 3,412 |
| VIP Investor Freedom 2025 Portfolio | 897 |
6. Expense Reductions.
Through arrangements with each applicable Fund's custodian, credits realized as a result of certain uninvested cash balances were used to reduce each applicable Fund's expenses. All of the applicable expense reductions are noted in the table below.
| | Custodian credits |
| VIP Investor Freedom 2025 Portfolio | $332 |
7. Other.
The Funds' organizational documents provide former and current trustees and officers with a limited indemnification against liabilities arising in connection with the performance of their duties to the Funds. In the normal course of business, the Funds may also enter into contracts that provide general indemnifications. The Funds' maximum exposure under these arrangements is unknown as this would be dependent on future claims that may be made against the Funds. The risk of material loss from such claims is considered remote.
At the end of the period, the investment adviser or its affiliates were owners of record of all of the outstanding shares of the Funds.
8. Coronavirus (COVID-19) Pandemic.
An outbreak of COVID-19 first detected in China during December 2019 has since spread globally and was declared a pandemic by the World Health Organization during March 2020. Developments that disrupt global economies and financial markets, such as the COVID-19 pandemic, may magnify factors that affect the Funds' performance.
Report of Independent Registered Public Accounting Firm
To the Board of Trustees of Variable Insurance Products Fund V and the Shareholders of VIP Investor Freedom Income Portfolio, VIP Investor Freedom 2005 Portfolio, VIP Investor Freedom 2010 Portfolio, VIP Investor Freedom 2015 Portfolio, VIP Investor Freedom 2020 Portfolio, VIP Investor Freedom 2025 Portfolio and VIP Investor Freedom 2030 Portfolio
Opinions on the Financial Statements
We have audited the accompanying statements of assets and liabilities, including the schedules of investments, of VIP Investor Freedom Income Portfolio, VIP Investor Freedom 2005 Portfolio, VIP Investor Freedom 2010 Portfolio, VIP Investor Freedom 2015 Portfolio, VIP Investor Freedom 2020 Portfolio, VIP Investor Freedom 2025 Portfolio and VIP Investor Freedom 2030 Portfolio (seven of the funds constituting Variable Insurance Products Fund V, hereafter collectively referred to as the “Funds”) as of December 31, 2020, the related statements of operations for the year ended December 31, 2020, the statements of changes in net assets for each of the two years in the period ended December 31, 2020, including the related notes, and the financial highlights for each of the five years in the period ended December 31, 2020 (collectively referred to as the “financial statements”). In our opinion, the financial statements present fairly, in all material respects, the financial position of each of the Funds as of December 31, 2020, the results of each of their operations for the year then ended, the changes in each of their net assets for each of the two years in the period ended December 31, 2020 and each of the financial highlights for each of the five years in the period ended December 31, 2020 in conformity with accounting principles generally accepted in the United States of America.
Basis for Opinions
These financial statements are the responsibility of the Funds’ management. Our responsibility is to express an opinion on the Funds’ financial statements based on our audits. We are a public accounting firm registered with the Public Company Accounting Oversight Board (United States) (PCAOB) and are required to be independent with respect to the Funds in accordance with the U.S. federal securities laws and the applicable rules and regulations of the Securities and Exchange Commission and the PCAOB.
We conducted our audits of these financial statements in accordance with the standards of the PCAOB. Those standards require that we plan and perform the audit to obtain reasonable assurance about whether the financial statements are free of material misstatement, whether due to error or fraud.
Our audits included performing procedures to assess the risks of material misstatement of the financial statements, whether due to error or fraud, and performing procedures that respond to those risks. Such procedures included examining, on a test basis, evidence regarding the amounts and disclosures in the financial statements. Our audits also included evaluating the accounting principles used and significant estimates made by management, as well as evaluating the overall presentation of the financial statements. Our procedures included confirmation of securities owned as of December 31, 2020 by correspondence with brokers; when replies were not received from brokers, we performed other auditing procedures. We believe that our audits provide a reasonable basis for our opinions.
/s/ PricewaterhouseCoopers LLP
Boston, Massachusetts
February 12, 2021
We have served as the auditor of one or more investment companies in the Fidelity group of funds since 1932.
Trustees and Officers
The Trustees, Members of the Advisory Board (if any), and officers of the trust and funds, as applicable, are listed below. The Board of Trustees governs each fund and is responsible for protecting the interests of shareholders. The Trustees are experienced executives who meet periodically throughout the year to oversee each fund's activities, review contractual arrangements with companies that provide services to each fund, oversee management of the risks associated with such activities and contractual arrangements, and review each fund's performance. If the interests of a fund and an underlying Fidelity® fund were to diverge, a conflict of interest could arise and affect how the Trustees and Members of the Advisory Board fulfill their fiduciary duties to the affected funds. FMR has structured the funds to avoid these potential conflicts, although there may be situations where a conflict of interest is unavoidable. In such instances, FMR, the Trustees, and Members of the Advisory Board would take reasonable steps to minimize and, if possible, eliminate the conflict. Each of the Trustees oversees 305 funds.
The Trustees hold office without limit in time except that (a) any Trustee may resign; (b) any Trustee may be removed by written instrument, signed by at least two-thirds of the number of Trustees prior to such removal; (c) any Trustee who requests to be retired or who has become incapacitated by illness or injury may be retired by written instrument signed by a majority of the other Trustees; and (d) any Trustee may be removed at any special meeting of shareholders by a two-thirds vote of the outstanding voting securities of the trust. Each Trustee who is not an interested person (as defined in the 1940 Act) of the trust and the funds is referred to herein as an Independent Trustee. Each Independent Trustee shall retire not later than the last day of the calendar year in which his or her 75th birthday occurs. The Independent Trustees may waive this mandatory retirement age policy with respect to individual Trustees. Officers and Advisory Board Members hold office without limit in time, except that any officer or Advisory Board Member may resign or may be removed by a vote of a majority of the Trustees at any regular meeting or any special meeting of the Trustees. Except as indicated, each individual has held the office shown or other offices in the same company for the past five years.
Each fund’s Statement of Additional Information (SAI) includes more information about the Trustees. To request a free copy, call Fidelity at 1-877-208-0098.
Experience, Skills, Attributes, and Qualifications of the Trustees. The Governance and Nominating Committee has adopted a statement of policy that describes the experience, qualifications, attributes, and skills that are necessary and desirable for potential Independent Trustee candidates (Statement of Policy). The Board believes that each Trustee satisfied at the time he or she was initially elected or appointed a Trustee, and continues to satisfy, the standards contemplated by the Statement of Policy. The Governance and Nominating Committee also engages professional search firms to help identify potential Independent Trustee candidates who have the experience, qualifications, attributes, and skills consistent with the Statement of Policy. From time to time, additional criteria based on the composition and skills of the current Independent Trustees, as well as experience or skills that may be appropriate in light of future changes to board composition, business conditions, and regulatory or other developments, have also been considered by the professional search firms and the Governance and Nominating Committee. In addition, the Board takes into account the Trustees' commitment and participation in Board and committee meetings, as well as their leadership of standing and ad hoc committees throughout their tenure.
In determining that a particular Trustee was and continues to be qualified to serve as a Trustee, the Board has considered a variety of criteria, none of which, in isolation, was controlling. The Board believes that, collectively, the Trustees have balanced and diverse experience, qualifications, attributes, and skills, which allow the Board to operate effectively in governing each fund and protecting the interests of shareholders. Information about the specific experience, skills, attributes, and qualifications of each Trustee, which in each case led to the Board's conclusion that the Trustee should serve (or continue to serve) as a trustee of the funds, is provided below.
Board Structure and Oversight Function. Abigail P. Johnson is an interested person and currently serves as Chairman. The Trustees have determined that an interested Chairman is appropriate and benefits shareholders because an interested Chairman has a personal and professional stake in the quality and continuity of services provided to the funds. Independent Trustees exercise their informed business judgment to appoint an individual of their choosing to serve as Chairman, regardless of whether the Trustee happens to be independent or a member of management. The Independent Trustees have determined that they can act independently and effectively without having an Independent Trustee serve as Chairman and that a key structural component for assuring that they are in a position to do so is for the Independent Trustees to constitute a substantial majority for the Board. The Independent Trustees also regularly meet in executive session. Arthur E. Johnson serves as Chairman of the Independent Trustees and as such (i) acts as a liaison between the Independent Trustees and management with respect to matters important to the Independent Trustees and (ii) with management prepares agendas for Board meetings.
Fidelity® funds are overseen by different Boards of Trustees. The funds' Board oversees Fidelity's investment-grade bond, money market, asset allocation and certain equity funds, and other Boards oversee Fidelity's high income and other equity funds. The asset allocation funds may invest in Fidelity® funds that are overseen by such other Boards. The use of separate Boards, each with its own committee structure, allows the Trustees of each group of Fidelity® funds to focus on the unique issues of the funds they oversee, including common research, investment, and operational issues. On occasion, the separate Boards establish joint committees to address issues of overlapping consequences for the Fidelity® funds overseen by each Board.
The Trustees operate using a system of committees to facilitate the timely and efficient consideration of all matters of importance to the Trustees, each fund, and fund shareholders and to facilitate compliance with legal and regulatory requirements and oversight of the funds' activities and associated risks. The Board, acting through its committees, has charged FMR and its affiliates with (i) identifying events or circumstances the occurrence of which could have demonstrably adverse effects on the funds' business and/or reputation; (ii) implementing processes and controls to lessen the possibility that such events or circumstances occur or to mitigate the effects of such events or circumstances if they do occur; and (iii) creating and maintaining a system designed to evaluate continuously business and market conditions in order to facilitate the identification and implementation processes described in (i) and (ii) above. Because the day-to-day operations and activities of the funds are carried out by or through FMR, its affiliates, and other service providers, the funds' exposure to risks is mitigated but not eliminated by the processes overseen by the Trustees. While each of the Board's committees has responsibility for overseeing different aspects of the funds' activities, oversight is exercised primarily through the Operations and Audit Committees. In addition, an ad hoc Board committee of Independent Trustees has worked with FMR to enhance the Board's oversight of investment and financial risks, legal and regulatory risks, technology risks, and operational risks, including the development of additional risk reporting to the Board. Appropriate personnel, including but not limited to the funds' Chief Compliance Officer (CCO), FMR's internal auditor, the independent accountants, the funds' Treasurer and portfolio management personnel, make periodic reports to the Board's committees, as appropriate, including an annual review of Fidelity's risk management program for the Fidelity® funds. The responsibilities of each standing committee, including their oversight responsibilities, are described further under "Standing Committees of the Trustees."
Interested Trustees*:
Correspondence intended for a Trustee who is an interested person may be sent to Fidelity Investments, 245 Summer Street, Boston, Massachusetts 02210.
Name, Year of Birth; Principal Occupations and Other Relevant Experience+
Abigail P. Johnson (1961)
Year of Election or Appointment: 2009
Trustee
Chairman of the Board of Trustees
Ms. Johnson also serves as Trustee of other Fidelity® funds. Ms. Johnson serves as Chairman (2016-present), Chief Executive Officer (2014-present), and Director (2007-present) of FMR LLC (diversified financial services company), President of Fidelity Financial Services (2012-present) and President of Personal, Workplace and Institutional Services (2005-present). Ms. Johnson is Chairman and Director of Fidelity Management & Research Company LLC (investment adviser firm, 2011-present). Previously, Ms. Johnson served as Chairman and Director of FMR Co., Inc. (investment adviser firm, 2011-2019), Vice Chairman (2007-2016) and President (2013-2016) of FMR LLC, President and a Director of Fidelity Management & Research Company (2001-2005), a Trustee of other investment companies advised by Fidelity Management & Research Company, Fidelity Investments Money Management, Inc. (investment adviser firm), and FMR Co., Inc. (2001-2005), Senior Vice President of the Fidelity® funds (2001-2005), and managed a number of Fidelity® funds. Ms. Abigail P. Johnson and Mr. Arthur E. Johnson are not related.
Jennifer Toolin McAuliffe (1959)
Year of Election or Appointment: 2016
Trustee
Ms. McAuliffe also serves as Trustee of other Fidelity® funds. Previously, Ms. McAuliffe served as Co-Head of Fixed Income of Fidelity Investments Limited (now known as FIL Limited (FIL)) (diversified financial services company), Director of Research for FIL’s credit and quantitative teams in London, Hong Kong and Tokyo and Director of Research for taxable and municipal bonds at Fidelity Investments Money Management, Inc. Ms. McAuliffe previously served as a member of the Advisory Board of certain Fidelity® funds (2016). Ms. McAuliffe was previously a lawyer at Ropes & Gray LLP and currently serves as director or trustee of several not-for-profit entities.
* Determined to be an “Interested Trustee” by virtue of, among other things, his or her affiliation with the trust or various entities under common control with FMR.
+ The information includes the Trustee's principal occupation during the last five years and other information relating to the experience, attributes, and skills relevant to the Trustee's qualifications to serve as a Trustee, which led to the conclusion that the Trustee should serve as a Trustee for each fund.
Independent Trustees:
Correspondence intended for an Independent Trustee may be sent to Fidelity Investments, P.O. Box 55235, Boston, Massachusetts 02205-5235.
Name, Year of Birth; Principal Occupations and Other Relevant Experience+
Elizabeth S. Acton (1951)
Year of Election or Appointment: 2013
Trustee
Ms. Acton also serves as Trustee of other Fidelity® funds. Prior to her retirement, Ms. Acton served as Executive Vice President, Finance (2011-2012), Executive Vice President, Chief Financial Officer (2002-2011) and Treasurer (2004-2005) of Comerica Incorporated (financial services). Prior to joining Comerica, Ms. Acton held a variety of positions at Ford Motor Company (1983-2002), including Vice President and Treasurer (2000-2002) and Executive Vice President and Chief Financial Officer of Ford Motor Credit Company (1998-2000). Ms. Acton currently serves as a member of the Board and Audit and Finance Committees of Beazer Homes USA, Inc. (homebuilding, 2012-present). Ms. Acton previously served as a member of the Advisory Board of certain Fidelity® funds (2013-2016).
Ann E. Dunwoody (1953)
Year of Election or Appointment: 2018
Trustee
General Dunwoody also serves as Trustee of other Fidelity® funds. General Dunwoody (United States Army, Retired) was the first woman in U.S. military history to achieve the rank of four-star general and prior to her retirement in 2012 held a variety of positions within the U.S. Army, including Commanding General, U.S. Army Material Command (2008-2012). General Dunwoody currently serves as President of First to Four LLC (leadership and mentoring services, 2012-present), a member of the Board and Nomination and Corporate Governance Committees of Kforce Inc. (professional staffing services, 2016-present) and a member of the Board of Automattic Inc. (software engineering, 2018-present). Previously, General Dunwoody served as a member of the Advisory Board and Nominating and Corporate Governance Committee of L3 Technologies, Inc. (communication, electronic, sensor and aerospace systems, 2013-2019) and a member of the Board and Audit and Sustainability and Corporate Responsibility Committees of Republic Services, Inc. (waste collection, disposal and recycling, 2013-2016). Ms. Dunwoody also serves on several boards for non-profit organizations, including as a member of the Board, Chair of the Nomination and Governance Committee and a member of the Audit Committee of Logistics Management Institute (consulting non-profit, 2012-present), a member of the Council of Trustees for the Association of the United States Army (advocacy non-profit, 2013-present), a member of the Board of Florida Institute of Technology (2015-present) and a member of the Board of ThanksUSA (military family education non-profit, 2014-present). General Dunwoody previously served as a member of the Advisory Board of certain Fidelity® funds (2018).
John Engler (1948)
Year of Election or Appointment: 2014
Trustee
Mr. Engler also serves as Trustee of other Fidelity® funds. Previously, Mr. Engler served as Governor of Michigan (1991-2003), President of the Business Roundtable (2011-2017) and interim President of Michigan State University (2018-2019). Mr. Engler currently serves as a member of the Board of K12 Inc. (technology-based education company, 2012-present). Previously, Mr. Engler served as a member of the Board of Universal Forest Products (manufacturer and distributor of wood and wood-alternative products, 2003-2019) and Trustee of The Munder Funds (2003-2014). Mr. Engler previously served as a member of the Advisory Board of certain Fidelity® funds (2014-2016).
Robert F. Gartland (1951)
Year of Election or Appointment: 2010
Trustee
Mr. Gartland also serves as Trustee of other Fidelity® funds. Prior to his retirement, Mr. Gartland held a variety of positions at Morgan Stanley (financial services, 1979-2007), including Managing Director (1987-2007) and Chase Manhattan Bank (1975-1978). Mr. Gartland previously served as Chairman and an investor in Gartland & Mellina Group Corp. (consulting, 2009-2019), as a member of the Board of National Securities Clearing Corporation (1993-1996) and as Chairman of TradeWeb (2003-2004).
Arthur E. Johnson (1947)
Year of Election or Appointment: 2008
Trustee
Chairman of the Independent Trustees
Mr. Johnson also serves as Trustee of other Fidelity® funds. Prior to his retirement, Mr. Johnson served as Senior Vice President of Corporate Strategic Development of Lockheed Martin Corporation (defense contractor, 1999-2009). Mr. Johnson currently serves as a member of the Board of Booz Allen Hamilton (management consulting, 2011-present). Mr. Johnson previously served as a member of the Board of Eaton Corporation plc (diversified power management, 2009-2019) and a member of the Board of AGL Resources, Inc. (holding company, 2002-2016). Mr. Johnson previously served as Vice Chairman (2015-2018) of the Independent Trustees of certain Fidelity® funds. Mr. Arthur E. Johnson is not related to Ms. Abigail P. Johnson.
Michael E. Kenneally (1954)
Year of Election or Appointment: 2009
Trustee
Vice Chairman of the Independent Trustees
Mr. Kenneally also serves as Trustee of other Fidelity® funds. Prior to his retirement, Mr. Kenneally served as Chairman and Global Chief Executive Officer of Credit Suisse Asset Management and Executive Vice President and Chief Investment Officer of Bank of America Corporation. Earlier roles at Bank of America included Director of Research, Senior Portfolio Manager for various institutional equity accounts and mutual funds and Portfolio Manager for a number of institutional fixed-income clients. Mr. Kenneally began his career as a Research Analyst in 1983 and was awarded the Chartered Financial Analyst (CFA) designation in 1991.
Marie L. Knowles (1946)
Year of Election or Appointment: 2001
Trustee
Ms. Knowles also serves as Trustee of other Fidelity® funds. Prior to her retirement, Ms. Knowles held several positions at Atlantic Richfield Company (diversified energy), including Executive Vice President and Chief Financial Officer (1996-2000), Senior Vice President (1993-1996) and President of ARCO Transportation Company (pipeline and tanker operations, 1993-1996). Ms. Knowles currently serves as a member of the Board of McKesson Corporation (healthcare service, since 2002), a member of the Board of the Santa Catalina Island Company (real estate, 2009-present), a member of the Investment Company Institute Board of Governors and a member of the Governing Council of the Independent Directors Council (2014-present). Ms. Knowles also serves as a member of the Advisory Board for the School of Engineering of the University of Southern California. Ms. Knowles previously served as Chairman (2015-2018) and Vice Chairman (2012-2015) of the Independent Trustees of certain Fidelity® funds.
Mark A. Murray (1954)
Year of Election or Appointment: 2016
Trustee
Mr. Murray also serves as Trustee of other Fidelity® funds. Previously, Mr. Murray served as Co-Chief Executive Officer (2013-2016), President (2006-2013) and Vice Chairman (2013-2020) of Meijer, Inc. Mr. Murray serves as a member of the Board and Nuclear Review and Public Policy and Responsibility Committees of DTE Energy Company (diversified energy company, 2009-present) and a member of the Board and Audit Committee and Chairman of the Nominating and Corporate Governance Committee of Universal Forest Products, Inc. (manufacturer and distributor of wood and wood-alternative products, 2004-2016). Mr. Murray previously served as a member of the Board of Spectrum Health (not-for-profit health system, 2015-2019). Mr. Murray also serves as a member of the Board of many community and professional organizations. Mr. Murray previously served as a member of the Advisory Board of certain Fidelity® funds (2016).
+ The information includes the Trustee's principal occupation during the last five years and other information relating to the experience, attributes, and skills relevant to the Trustee's qualifications to serve as a Trustee, which led to the conclusion that the Trustee should serve as a Trustee for each fund.
Advisory Board Members and Officers:
Correspondence intended for an officer may be sent to Fidelity Investments, 245 Summer Street, Boston, Massachusetts 02210. Officers appear below in alphabetical order.
Name, Year of Birth; Principal Occupation
Craig S. Brown (1977)
Year of Election or Appointment: 2019
Assistant Treasurer
Mr. Brown also serves as Assistant Treasurer of other funds. Mr. Brown is an employee of Fidelity Investments (2013-present).
John J. Burke III (1964)
Year of Election or Appointment: 2018
Chief Financial Officer
Mr. Burke also serves as Chief Financial Officer of other funds. Mr. Burke serves as Head of Investment Operations for Fidelity Fund and Investment Operations (2018-present) and is an employee of Fidelity Investments (1998-present). Previously Mr. Burke served as head of Asset Management Investment Operations (2012-2018).
David J. Carter (1973)
Year of Election or Appointment: 2020
Assistant Secretary
Mr. Carter also serves as Assistant Secretary of other funds. Mr. Carter serves as Vice President, Associate General Counsel (2010-present) and is an employee of Fidelity Investments (2005-present).
Jonathan Davis (1968)
Year of Election or Appointment: 2010
Assistant Treasurer
Mr. Davis also serves as Assistant Treasurer of other funds. Mr. Davis serves as Assistant Treasurer of FMR Capital, Inc. (2017-present) and is an employee of Fidelity Investments. Previously, Mr. Davis served as Vice President and Associate General Counsel of FMR LLC (diversified financial services company, 2003-2010).
Laura M. Del Prato (1964)
Year of Election or Appointment: 2018
President and Treasurer
Ms. Del Prato also serves as an officer of other funds. Ms. Del Prato is an employee of Fidelity Investments (2017-present). Previously, Ms. Del Prato served as President and Treasurer of The North Carolina Capital Management Trust: Cash Portfolio and Term Portfolio (2018-2020). Prior to joining Fidelity Investments, Ms. Del Prato served as a Managing Director and Treasurer of the JPMorgan Mutual Funds (2014-2017). Prior to JPMorgan, Ms. Del Prato served as a partner at Cohen Fund Audit Services (accounting firm, 2012-2013) and KPMG LLP (accounting firm, 2004-2012).
Colm A. Hogan (1973)
Year of Election or Appointment: 2016
Assistant Treasurer
Mr. Hogan also serves as an officer of other funds. Mr. Hogan serves as Assistant Treasurer of FMR Capital, Inc. (2017-present) and is an employee of Fidelity Investments (2005-present). Previously, Mr. Hogan served as Deputy Treasurer of certain Fidelity® funds (2016-2020) and Assistant Treasurer of certain Fidelity® funds (2016-2018).
Cynthia Lo Bessette (1969)
Year of Election or Appointment: 2019
Secretary and Chief Legal Officer (CLO)
Ms. Lo Bessette also serves as an officer of other funds. Ms. Lo Bessette serves as CLO, Secretary, and Senior Vice President of Fidelity Management & Research Company LLC (investment adviser firm, 2019-present); and CLO of Fidelity Management & Research (Hong Kong) Limited, FMR Investment Management (UK) Limited, and Fidelity Management & Research (Japan) Limited (investment adviser firms, 2019-present). She is a Senior Vice President and Deputy General Counsel of FMR LLC (diversified financial services company, 2019-present), and is an employee of Fidelity Investments. Previously, Ms. Lo Bessette served as CLO, Secretary, and Senior Vice President of FMR Co., Inc. (investment adviser firm, 2019); Secretary of Fidelity SelectCo, LLC and Fidelity Investments Money Management, Inc. (investment adviser firms, 2019). Prior to joining Fidelity Investments, Ms. Lo Bessette was Executive Vice President, General Counsel (2016-2019) and Senior Vice President, Deputy General Counsel (2015-2016) of OppenheimerFunds (investment management company) and Deputy Chief Legal Officer (2013-2015) of Jennison Associates LLC (investment adviser firm).
Chris Maher (1972)
Year of Election or Appointment: 2013
Assistant Treasurer
Mr. Maher also serves as an officer of other funds. Mr. Maher serves as Assistant Treasurer of FMR Capital, Inc. (2017-present), and is an employee of Fidelity Investments (2008-present). Previously, Mr. Maher served as Assistant Treasurer of certain funds (2013-2020); Vice President of Asset Management Compliance (2013), Vice President of the Program Management Group of FMR (investment adviser firm, 2010-2013), and Vice President of Valuation Oversight (2008-2010).
Kenneth B. Robins (1969)
Year of Election or Appointment: 2020
Chief Compliance Officer
Mr. Robins also serves as an officer of other funds. Mr. Robins serves as Compliance Officer of Fidelity Management & Research Company LLC (investment adviser firm, 2016-present) and is an employee of Fidelity Investments (2004-present). Previously, Mr. Robins served as Compliance Officer of FMR Co., Inc. (investment adviser firm, 2016-2019), as Executive Vice President of Fidelity Investments Money Management, Inc. (investment adviser firm, 2013-2016) and served in other fund officer roles.
Brett Segaloff (1972)
Year of Election or Appointment: 2021
Anti-Money Laundering (AML) Officer
Mr. Segaloff also serves as an AML Officer of other funds and other related entities. He is Director, Anti-Money Laundering (2007-present) of FMR LLC (diversified financial services company) and is an employee of Fidelity Investments (1996-present).
Stacie M. Smith (1974)
Year of Election or Appointment: 2013
Assistant Treasurer
Ms. Smith also serves as an officer of other funds. Ms. Smith serves as Assistant Treasurer of FMR Capital, Inc. (2017-present), is an employee of Fidelity Investments (2009-present), and has served in other fund officer roles. Prior to joining Fidelity Investments, Ms. Smith served as Senior Audit Manager of Ernst & Young LLP (accounting firm, 1996-2009). Previously, Ms. Smith served as Assistant Treasurer (2013-2019) and Deputy Treasurer (2013-2016) of certain Fidelity® funds.
Marc L. Spector (1972)
Year of Election or Appointment: 2016
Deputy Treasurer
Mr. Spector also serves as an officer of other funds. Mr. Spector serves as Assistant Treasurer of FMR Capital, Inc. (2017-present) and is an employee of Fidelity Investments (2016-present). Prior to joining Fidelity Investments, Mr. Spector served as Director at the Siegfried Group (accounting firm, 2013-2016), and prior to Siegfried Group as audit senior manager at Deloitte & Touche LLP (accounting firm, 2005-2013).
Jim Wegmann (1979)
Year of Election or Appointment: 2019
Assistant Treasurer
Mr. Wegmann also serves as Assistant Treasurer of other funds. Mr. Wegmann is an employee of Fidelity Investments (2011-present).
Vadim Zlotnikov (1962)
Year of Election or Appointment: 2019
Vice President
Mr. Zlotnikov also serves as Vice President of other funds. Mr. Zlotnikov serves as President of FIAM (Fidelity Institutional Asset Management) and is an employee of Fidelity Investments (2018-present). Previously, Mr. Zlotnikov served as President and Chief Investment Officer of Global Asset Allocation (2018-2020). Prior to joining Fidelity Investments, Mr. Zlotnikov served as Co-Head of Multi-Asset Solutions, Chief Market Strategist, and CIO of Systematic Strategies with AllianceBernstein (investment adviser firm, 2002-2018).
Shareholder Expense Example
As a shareholder, you incur two types of costs: (1) transaction costs, which may include sales charges (loads) on purchase payments or redemption proceeds, as applicable and (2) ongoing costs, which generally include management fees, distribution and/or service (12b-1) fees and other Fund expenses. This Example is intended to help you understand your ongoing costs (in dollars) of investing in a fund and to compare these costs with the ongoing costs of investing in other mutual funds.
The Example is based on an investment of $1,000 invested at the beginning of the period and held for the entire period (July 1, 2020 to December 31, 2020).
Actual Expenses
The first line of the accompanying table provides information about actual account values and actual expenses. You may use the information in this line, together with the amount you invested, to estimate the expenses that you paid over the period. Simply divide your account value by $1,000.00 (for example, an $8,600 account value divided by $1,000.00 = 8.6), then multiply the result by the number in the first line for a class/Fund under the heading entitled "Expenses Paid During Period" to estimate the expenses you paid on your account during this period. If any fund is a shareholder of any underlying mutual funds or exchange-traded funds (ETFs) (the Underlying Funds), such fund indirectly bears its proportional share of the expenses of the Underlying Funds in addition to the direct expenses incurred presented in the table. These fees and expenses are not included in the annualized expense ratio used to calculate the expense estimate in the table below. The estimate of expenses does not include any fees or other expenses of any variable annuity or variable life insurance product. If they were, the estimate of expenses you paid during the period would be higher, and your ending account value would be lower.
Hypothetical Example for Comparison Purposes
The second line of the accompanying table provides information about hypothetical account values and hypothetical expenses based on the actual expense ratio and an assumed rate of return of 5% per year before expenses, which is not the actual return. The hypothetical account values and expenses may not be used to estimate the actual ending account balance or expenses you paid for the period. You may use this information to compare the ongoing costs of investing in the Fund and other funds. To do so, compare this 5% hypothetical example with the 5% hypothetical examples that appear in the shareholder reports of the other funds. If any fund is a shareholder of any Underlying Funds, such fund indirectly bears its proportional share of the expenses of the Underlying Funds in addition to the direct expenses as presented in the table. These fees and expenses are not included in the annualized expense ratio used to calculate the expense estimate in the table below. The estimate of expenses does not include any fees or other expenses of any variable annuity or variable life insurance product. If they were, the estimate of expenses you paid during the period would be higher, and your ending account value would be lower.
Please note that the expenses shown in the table are meant to highlight your ongoing costs only and do not reflect any transaction costs. Therefore, the second line of the table is useful in comparing ongoing costs only, and will not help you determine the relative total costs of owning different funds.
| | Annualized Expense Ratio--A,B- | Beginning
Account Value
July 1, 2020 | Ending
Account Value
December 31, 2020 | Expenses Paid
During Period--C,D-
July 1, 2020
to December 31, 2020 |
| VIP Investor Freedom Income Portfolio | - % | | | |
| Actual | | $1,000.00 | $1,073.80 | $- |
| Hypothetical-E | | $1,000.00 | $1,025.14 | $- |
| VIP Investor Freedom 2005 Portfolio | - % | | | |
| Actual | | $1,000.00 | $1,086.00 | $- |
| Hypothetical-E | | $1,000.00 | $1,025.14 | $- |
| VIP Investor Freedom 2010 Portfolio | - % | | | |
| Actual | | $1,000.00 | $1,107.20 | $- |
| Hypothetical-E | | $1,000.00 | $1,025.14 | $- |
| VIP Investor Freedom 2015 Portfolio | - % | | | |
| Actual | | $1,000.00 | $1,128.80 | $- |
| Hypothetical-E | | $1,000.00 | $1,025.14 | $- |
| VIP Investor Freedom 2020 Portfolio | - % | | | |
| Actual | | $1,000.00 | $1,148.50 | $- |
| Hypothetical-E | | $1,000.00 | $1,025.14 | $- |
| VIP Investor Freedom 2025 Portfolio | - % | | | |
| Actual | | $1,000.00 | $1,164.40 | $- |
| Hypothetical-E | | $1,000.00 | $1,025.14 | $- |
| VIP Investor Freedom 2030 Portfolio | - % | | | |
| Actual | | $1,000.00 | $1,185.50 | $- |
| Hypothetical-E | | $1,000.00 | $1,025.14 | $- |
A Annualized expense ratio reflects expenses net of applicable fee waivers.
B Amount represents less than .005%.
C Expenses are equal to the annualized expense ratio, multiplied by the average account value over the period, multiplied by 184/ 366 (to reflect the one-half year period). The fees and expenses of any Underlying Funds are not included in each annualized expense ratio.
D Amount represents less than $.005.
E 5% return per year before expenses
Distributions (Unaudited)
The Board of Trustees of each fund voted to pay to shareholders of record at the opening of business on record date, the following distributions per share derived from capital gains realized from sales of portfolio securities, and dividends derived from net investment income:
| | Pay Date | Record Date | Dividends | Capital Gains |
| VIP Investor Freedom Income Portfolio | 02/12/21 | 02/12/21 | $0.001 | $0.244 |
| VIP Investor Freedom 2005 Portfolio | 02/12/21 | 02/12/21 | $0.001 | $0.254 |
| VIP Investor Freedom 2010 Portfolio | 02/12/21 | 02/12/21 | $0.001 | $0.308 |
| VIP Investor Freedom 2015 Portfolio | 02/12/21 | 02/12/21 | $0.001 | $0.436 |
| VIP Investor Freedom 2020 Portfolio | 02/12/21 | 02/12/21 | $0.002 | $0.523 |
| VIP Investor Freedom 2025 Portfolio | 02/12/21 | 02/12/21 | $0.001 | $0.452 |
| VIP Investor Freedom 2030 Portfolio | 02/12/21 | 02/12/21 | $0.001 | $0.454 |
|
The funds hereby designate as capital gain dividend the amounts noted below for the taxable year ended December 31, 2020, or, if subsequently determined to be different, the net capital gain of such year.
| VIP Investor Freedom Income Portfolio | $1,694,880 |
| VIP Investor Freedom 2005 Portfolio | $677,145 |
| VIP Investor Freedom 2010 Portfolio | $1,556,226 |
| VIP Investor Freedom 2015 Portfolio | $3,490,893 |
| VIP Investor Freedom 2020 Portfolio | $8,147,309 |
| VIP Investor Freedom 2025 Portfolio | $8,062,380 |
| VIP Investor Freedom 2030 Portfolio | $9,440,168 |
|
A percentage of the dividends distributed during the fiscal year for the following funds were derived from interest on U.S. Government securities which is generally exempt from state income tax:
| VIP Investor Freedom Income Portfolio | 12.84% |
| VIP Investor Freedom 2005 Portfolio | 11.06% |
| VIP Investor Freedom 2010 Portfolio | 8.98% |
| VIP Investor Freedom 2015 Portfolio | 7.26% |
| VIP Investor Freedom 2020 Portfolio | 6.03% |
| VIP Investor Freedom 2025 Portfolio | 5.34% |
| VIP Investor Freedom 2030 Portfolio | 4.52% |
|
A percentage of the dividends distributed during the fiscal year for the following funds qualify for the dividends–received deduction for corporate shareholders:
| VIP Investor Freedom Income Portfolio | |
| February 2020 | 0% |
| December 2020 | 5% |
| VIP Investor Freedom 2005 Portfolio | |
| February 2020 | 0% |
| December 2020 | 7% |
| VIP Investor Freedom 2010 Portfolio | |
| February 2020 | 0% |
| December 2020 | 10% |
| VIP Investor Freedom 2015 Portfolio | |
| February 2020 | 0% |
| December 2020 | 14% |
| VIP Investor Freedom 2020 Portfolio | |
| February 2020 | 1% |
| December 2020 | 18% |
| VIP Investor Freedom 2025 Portfolio | |
| February 2020 | 0% |
| December 2020 | 20% |
| VIP Investor Freedom 2030 Portfolio | |
| February 2020 | 0% |
| December 2020 | 23% |
|
The amounts per share which represent income derived from sources within, and taxes paid to, foreign countries or possessions of the United States are as follows:
| | Pay Date | Income | Taxes |
| VIP Investor Freedom Income Portfolio | 12/16/20 | $0.0179 | $0.0025 |
| VIP Investor Freedom 2005 Portfolio | 12/16/20 | $0.0208 | $0.0029 |
| VIP Investor Freedom 2010 Portfolio | 12/16/20 | $0.0254 | $0.0037 |
| VIP Investor Freedom 2015 Portfolio | 12/16/20 | $0.0296 | $0.0044 |
| VIP Investor Freedom 2020 Portfolio | 12/16/20 | $0.0347 | $0.0052 |
| VIP Investor Freedom 2025 Portfolio | 12/16/20 | $0.0410 | $0.0063 |
| VIP Investor Freedom 2030 Portfolio | 12/16/20 | $0.0444 | $0.0069 |
|
Board Approval of Investment Advisory Contracts and Management Fees
VIP Investor Freedom Funds
Each year, the Board of Trustees, including the Independent Trustees (together, the Board), votes on the renewal of the management contract with Fidelity Management & Research Company LLC (FMR) for each fund (the Advisory Contract). The Board, assisted by the advice of fund counsel and Independent Trustees' counsel, requests and considers a broad range of information relevant to the renewal of the Advisory Contracts throughout the year.
The Board meets regularly and, at each of its meetings, covers an extensive agenda of topics and materials and considers factors that are relevant to its annual consideration of the renewal of each fund's Advisory Contract, including the services and support provided to each fund and its shareholders. The Board has established four standing committees (Committees) — Operations, Audit, Fair Valuation, and Governance and Nominating — each composed of and chaired by Independent Trustees with varying backgrounds, to which the Board has assigned specific subject matter responsibilities in order to enhance effective decision-making by the Board. The Operations Committee, of which all of the Independent Trustees are members, meets regularly throughout the year and considers, among other matters, information specifically related to the annual consideration of the renewal of each fund's Advisory Contract. The Board, acting directly and through its Committees, requests and receives information concerning the annual consideration of the renewal of each fund's Advisory Contract. The Board also meets as needed to review matters specifically related to the Board's annual consideration of the renewal of the Advisory Contracts. Members of the Board may also meet with trustees of other Fidelity funds through joint ad hoc committees to discuss certain matters relevant to all of the Fidelity funds.
At its September 2020 meeting, the Board unanimously determined to renew each fund's Advisory Contract. In reaching its determination, the Board considered all factors it believed relevant and reached a determination, with the assistance of fund counsel and Independent Trustees' counsel and through the exercise of its business judgment, that the renewal of the Advisory Contract was in the best interests of each fund and its shareholders and that the fact that no fees are payable under the Advisory Contracts was fair and reasonable. The Board's decision to renew the Advisory Contracts was not based on any single factor, but rather was based on a comprehensive consideration of all the information provided to the Board at its meetings throughout the year. In reaching its determination, the Board was aware that shareholders of each fund have a broad range of investment choices available to them, including a wide choice among funds offered by Fidelity's competitors, and that each fund's shareholders, who have the opportunity to review and weigh the disclosure provided by the fund in its prospectus and other public disclosures, have chosen to invest in that fund, which is part of the Fidelity family of funds.
Nature, Extent, and Quality of Services Provided. The Board considered Fidelity's staffing as it relates to the funds, including the backgrounds of investment personnel of FMR, and also considered the funds' investment objectives, strategies, and related investment philosophies. The Independent Trustees also had discussions with senior management of Fidelity's investment operations and investment groups with responsibility for the underlying Fidelity funds in which each fund invests. The Board considered the structure of the investment personnel compensation program and whether this structure provides appropriate incentives to act in the best interests of each fund. Additionally, the Board considered the portfolio managers' investments, if any, in the funds that they manage.
Resources Dedicated to Investment Management and Support Services. The Board reviewed the general qualifications and capabilities of Fidelity's investment staff, including its size, education, experience, and resources, as well as Fidelity's approach to recruiting, managing, and compensating investment personnel. The Board noted that Fidelity has continued to increase the resources devoted to non-U.S. offices, including expansion of Fidelity's global investment organization. The Board also noted that Fidelity's analysts have extensive resources, tools and capabilities that allow them to conduct sophisticated quantitative and fundamental analysis, as well as credit analysis of issuers, counterparties and guarantors. Further, the Board considered that Fidelity's investment professionals have sufficient access to global information and data so as to provide competitive investment results over time, and that those professionals also have access to sophisticated tools that permit them to assess portfolio construction and risk and performance attribution characteristics continuously, as well as to transmit new information and research conclusions rapidly around the world. Additionally, in its deliberations, the Board considered Fidelity's risk management, compliance, and technology and operations capabilities and resources, which are integral parts of the investment management process. The Board also considered Fidelity's investments in business continuity planning, and its success in continuously providing services to the funds notwithstanding the severe disruptions caused by the COVID-19 pandemic.
Shareholder and Administrative Services. The Board considered (i) the nature, extent, quality, and cost of advisory, administrative, and shareholder services performed by Fidelity under the Advisory Contract and under separate agreements covering transfer agency, and pricing and bookkeeping services for each fund; (ii) the nature and extent of the supervision of third party service providers, principally custodians, subcustodians, and pricing vendors; and (iii) the resources devoted to, and the record of compliance with, each fund's compliance policies and procedures.
The Board noted that the growth of fund assets over time across the complex allows Fidelity to reinvest in the development of services designed to enhance the value and convenience of the Fidelity funds as investment vehicles. These services include 24-hour access to account information and market information over the Internet and through telephone representatives, investor education materials and asset allocation tools, and the expanded availability of Fidelity Investor Centers.
Investment in a Large Fund Family. The Board considered the benefits to shareholders of investing in a Fidelity fund, including the benefits of investing in a fund that is part of a large family of funds offering a variety of investment disciplines and providing a large variety of mutual fund investor services. The Board noted that Fidelity had taken, or had made recommendations that resulted in the Fidelity funds taking, a number of actions over the previous year that benefited particular funds, including: (i) continuing to dedicate additional resources to Fidelity's investment research process, which includes meetings with management of issuers of securities in which the funds invest, and to the support of the senior management team that oversees asset management; (ii) continuing efforts to enhance Fidelity's global research capabilities; (iii) launching new funds and ETFs with innovative structures, strategies and pricing and making other enhancements to meet client needs; (iv) launching new share classes of existing funds; (v) eliminating purchase minimums and broadening eligibility requirements for certain funds and share classes; (vi) reducing management fees and total expenses for certain target date funds or classes and index funds; (vii) lowering expenses for certain funds and classes by implementing or lowering expense caps; (viii) rationalizing product lines and gaining increased efficiencies from fund mergers, liquidations, and share class consolidations; (ix) continuing to develop, acquire and implement systems and technology to improve services to the funds and shareholders, strengthen information security, and increase efficiency; and (x) continuing to implement enhancements to further strengthen Fidelity's product line to increase investors' probability of success in achieving their investment goals, including retirement income goals.
Investment Performance. The Board considered whether each fund has operated in accordance with its investment objective, as well as its record of compliance with its investment restrictions and its performance history.
The Board took into account discussions that occur at Board meetings throughout the year with representatives of the investment adviser about fund investment performance. In this regard the Board noted that as part of regularly scheduled fund reviews and other reports to the Board on fund performance, the Board considers annualized return information for each fund for different time periods, measured against one or more appropriate securities market indices, including a customized blended index that reflects the respective weights of the fund's asset classes (each a benchmark index). In its evaluation of fund investment performance at meetings throughout the year, the Board gave particular attention to information indicating underperformance of certain Fidelity funds for specific time periods and discussed with the investment adviser the reasons for such underperformance.
In addition to reviewing absolute and relative fund performance, the Independent Trustees periodically consider the appropriateness of fund performance metrics in evaluating the results achieved. In general, the Independent Trustees believe that fund performance should be evaluated based on gross performance (before fees and expenses, including acquired fund fees and expenses, but after transaction costs, if any) compared to appropriate benchmark indices, over appropriate time periods that may include full market cycles, taking into account relevant factors including the following: general market conditions; the extent to which particular underlying funds affected performance; and fund cash flows and other factors. The Independent Trustees generally give greater weight to fund performance over longer time periods than over shorter time periods. Depending on the circumstances, the Independent Trustees may be satisfied with a fund's performance notwithstanding that it lags its benchmark index for certain periods.
The Independent Trustees recognize that shareholders evaluate performance on a net basis over their own holding periods, for which one-, three-, and five-year periods are often used as a proxy. For this reason, the performance information reviewed by the Board also included net cumulative calendar year total return information for each fund and an appropriate benchmark index for the most recent one-, three-, and five-year periods. Due to the characteristics of the funds, no peer group performance information was considered by the Board. The Independent Trustees recognize that shareholders who are not investing through a tax-advantaged retirement account also consider tax consequences in evaluating performance.
Based on its review, the Board concluded that the nature, extent, and quality of services provided to each fund under the Advisory Contracts should continue to benefit the shareholders of each fund.
Competitiveness of Management Fee and Total Expense Ratio. The Board noted that the funds do not pay FMR a management fee for investment advisory services, and that each fund bears indirectly the fees and expenses, including the management fees, paid by the underlying Fidelity funds in which it invests. The Board considered each fund's management fee and total expense ratio compared to "mapped groups" of competitive funds and classes created for the purpose of facilitating the Trustees' competitive analysis of management fees and total expenses. Fidelity creates "mapped groups" by combining similar Lipper investment objective categories that have comparable investment mandates. Combining Lipper investment objective categories aids the Board's management fee and total expense ratio comparisons by broadening the competitive group used for comparison.
Management Fee. The Board considered two proprietary management fee comparisons for the 12-month periods shown in basis points (BP) in the charts below. The group of Lipper funds used by the Board for management fee comparisons is referred to below as the "Total Mapped Group." The Total Mapped Group comparison focuses on a fund's standing in terms of gross management fees before expense reimbursements or caps relative to the total universe of funds with comparable investment mandates, regardless of whether their management fee structures also are comparable. Funds with comparable investment mandates offer exposure to similar types of securities. Funds with comparable management fee structures have similar management fee contractual arrangements (
e.g., flat rate charged for advisory services, all-inclusive fee rate,
etc.). "TMG %" represents the percentage of funds in the Total Mapped Group that had management fees that were lower than a fund's. For example, a hypothetical TMG % of 20% would mean that 80% of the funds in the Total Mapped Group had higher, and 20% had lower, management fees than a fund. The funds' actual TMG %s and the number of funds in the Total Mapped Group are in the charts below. The "Asset-Sized Peer Group" (ASPG) comparison focuses on a fund's standing relative to a subset of non-Fidelity funds within the Total Mapped Group that are similar in size and management fee structure. For example, if a fund is in the first quartile of the ASPG, the fund's management fee ranks in the least expensive or lowest 25% of funds in the ASPG. The ASPG represents at least 15% of the funds in the Total Mapped Group with comparable asset size and management fee structures, subject to a minimum of 50 funds (or all funds in the Total Mapped Group if fewer than 50). Additional information, such as the ASPG quartile in which a fund's management fee rate ranked, is also included in the charts and was considered by the Board.
VIP Investor Freedom 2005 Portfolio

VIP Investor Freedom 2010 Portfolio
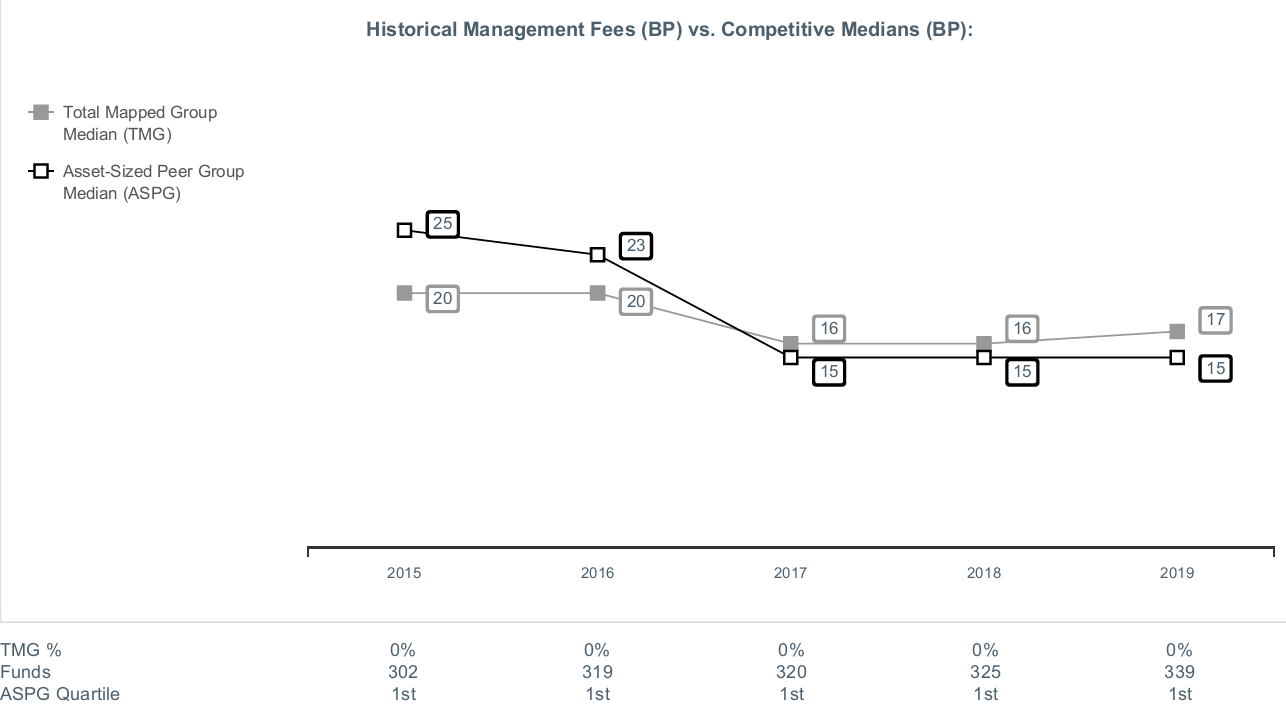
VIP Investor Freedom 2015 Portfolio

VIP Investor Freedom 2020 Portfolio

VIP Investor Freedom 2025 Portfolio
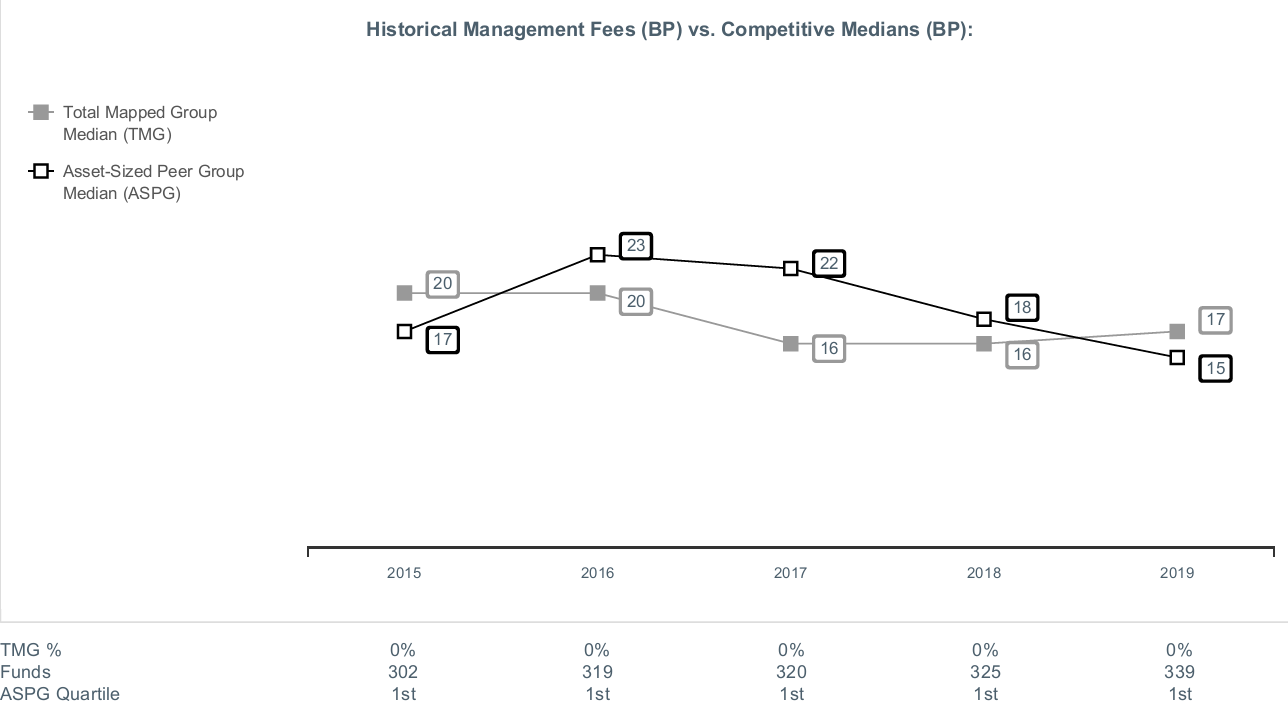
VIP Investor Freedom 2030 Portfolio
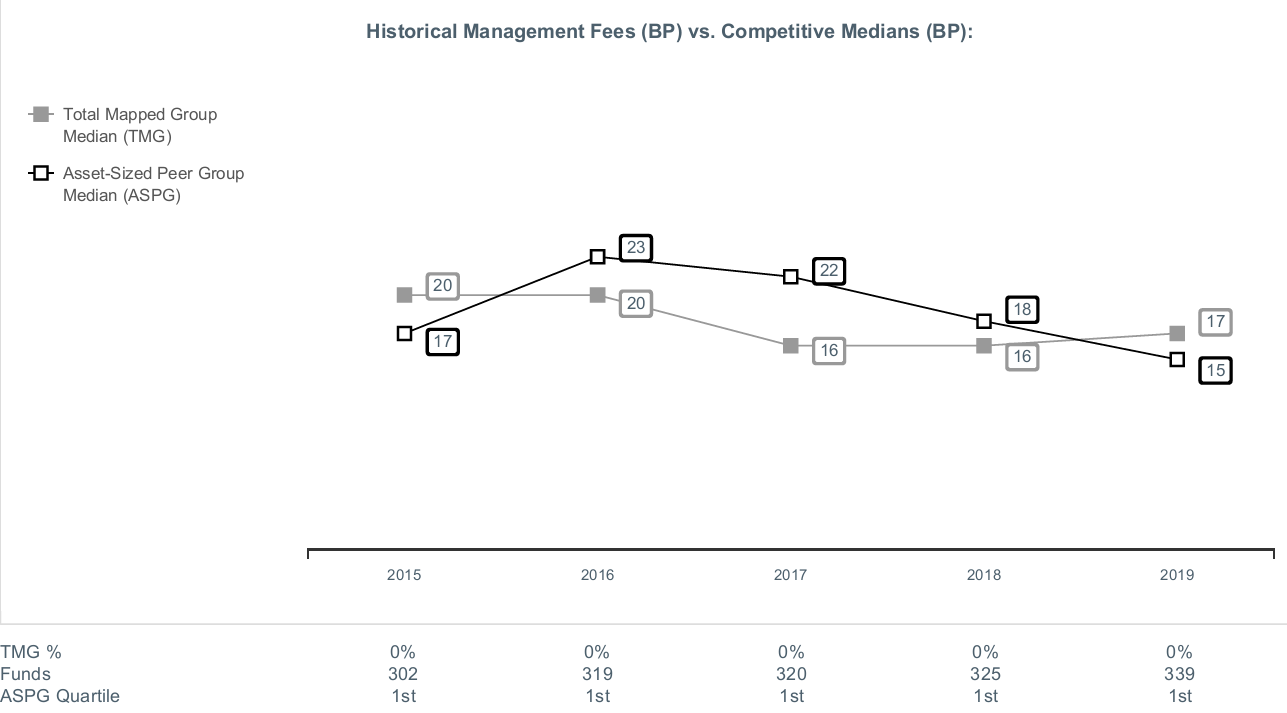
VIP Investor Freedom Income Portfolio

The Board noted that each fund's management fee rate of 0.00% ranked below the median of its Total Mapped Group and below the median of its ASPG for 2019. The Board further noted that many peer funds pay fund-level expenses, including management fees, to which the funds are not subject.
Based on its review, the Board concluded that each fund's management fee is fair and reasonable in light of the services that the fund receives and the other factors considered.
Total Expense Ratio. In its review of each fund's total expense ratio, the Board considered that the funds do not pay transfer agent fees. Instead, the applicable class of each underlying Fidelity fund bears its pro rata portion of each fund's transfer agent fee according to the percentage of each fund's assets invested in that underlying fund. The Board further noted that FMR pays all other expenses of each fund, with limited exceptions.
The Board noted that each fund's total expense ratio ranked below the competitive median for 2019.
In considering each fund's total expense ratio, the Board also considered an alternative competitive analysis that included both top level (
i.e., direct) fund fees and acquired fund fees and expenses for the fund and the other funds and classes to which it is compared. The Board noted that, under this alternative competitive analysis, each fund's total expense ratio ranked below the competitive median for 2019.
Fees Charged to Other Fidelity Clients. The Board also considered Fidelity fee structures and other information with respect to clients of Fidelity, such as other funds advised or subadvised by Fidelity, pension plan clients, and other institutional clients with similar mandates. The Board noted that a joint ad hoc committee created by it and the boards of other Fidelity funds periodically reviews and compares Fidelity's institutional investment advisory business with its business of providing services to the Fidelity funds and also noted the most recent findings of the committee. The Board noted that the committee's review included a consideration of the differences in services provided, fees charged, and costs incurred, as well as competition in the markets serving the different categories of clients.
Based on its review of total expense ratios and fees charged to other Fidelity clients, the Board concluded that each fund's total expense ratio was reasonable in light of the services that the fund and its shareholders receive and the other factors considered.
Costs of the Services and Profitability. The Board considered the level of Fidelity's profits in respect of all the Fidelity funds, including the Fidelity funds in which the funds invest.
A public accounting firm has been engaged annually by the Board as part of the Board's assessment of Fidelity's profitability analysis. The engagement includes the review and assessment of the methodologies used by Fidelity in determining the revenues and expenses attributable to Fidelity's mutual fund business, and completion of agreed-upon procedures in respect of the mathematical accuracy of certain fund profitability information and its conformity to established allocation methodologies. After considering the reports issued under the engagement and information provided by Fidelity, the Board concluded that while other allocation methods may also be reasonable, Fidelity's profitability methodologies are reasonable in all material respects.
The Board also reviewed Fidelity's non-fund businesses and potential indirect benefits such businesses may have received as a result of their association with Fidelity's mutual fund business (i.e., fall-out benefits) as well as cases where Fidelity's affiliates may benefit from the funds' business. The Board considered areas where potential indirect benefits to the Fidelity funds from their relationships with Fidelity may exist. The Board also considered that in 2019 a joint ad hoc committee created by it and the boards of other Fidelity funds evaluated potential fall-out benefits (PFOB Committee). The Board noted that it considered the PFOB Committee's findings in connection with its consideration of the renewal of the Advisory Contracts.
The Board concluded that the costs of the services provided by and the profits realized by Fidelity in connection with the operation of each fund were not relevant to the renewal of each fund's Advisory Contract because the funds do not pay management fees and FMR pays all other expenses of each fund, with limited exceptions.
Economies of Scale. The Board concluded that because the funds do not pay management fees and FMR pays all other expenses of each fund, with limited exceptions, economies of scale cannot be realized by the funds, but may be realized by the other Fidelity funds in which each fund invests, many of which may benefit from breakpoints under the group fee arrangement.
Additional Information Requested by the Board. In order to develop fully the factual basis for consideration of the Fidelity funds' advisory contracts, the Board requested and received additional information on certain topics, including: (i) Fidelity's fund profitability methodology, profitability trends for certain funds, the allocation of various costs to different funds, and the impact of certain factors on fund profitability results; (ii) portfolio manager changes that have occurred during the past year and the amount of the investment that each portfolio manager has made in the Fidelity fund(s) that he or she manages; (iii) Fidelity's compensation structure for portfolio managers, research analysts, and other key personnel, including its effects on fund profitability, the rationale for the compensation structure, and the extent to which current market conditions have affected retention and recruitment; (iv) the arrangements with and compensation paid to certain fund sub-advisers on behalf of the Fidelity funds and the treatment of such compensation within Fidelity's fund profitability methodology; (v) the terms of the funds' various management fee structures, including the basic group fee and the terms of Fidelity's voluntary expense limitation agreements; (vi) Fidelity's transfer agent fee, expense, and service structures for different funds and classes relative to competitive trends; (vii) the impact on fund profitability of recent industry trends, such as the growth in passively managed funds and outflows from actively managed equity funds; and (viii) explanations regarding the relative total expense ratios of certain funds and classes, total expense competitive trends and methodologies for total expense competitive comparisons, and actions that might be taken by Fidelity to reduce total expense ratios for certain classes. In addition, the Board considered its discussions with Fidelity regarding Fidelity's efforts to maintain the continuous investment and shareholder services necessary for the funds during the current pandemic and economic circumstances.
Based on its evaluation of all of the conclusions noted above, and after considering all factors it believed relevant, the Board concluded that the advisory fee arrangements are fair and reasonable, and that each fund's Advisory Contract should be renewed.
VIPIFF-ANN-0221
1.814507.115
Fidelity® Variable Insurance Products:
FundsManager - 20%, 50%, 60%, 70%, 85% Portfolio
FundsManager 20% Portfolio
FundsManager 50% Portfolio
FundsManager 60% Portfolio
FundsManager 70% Portfolio
FundsManager 85% Portfolio
Annual Report
December 31, 2020
Contents
To view a fund's proxy voting guidelines and proxy voting record for the 12-month period ended June 30, visit http://www.fidelity.com/proxyvotingresults or visit the Securities and Exchange Commission's (SEC) web site at http://www.sec.gov.
You may also call 1-877-208-0098 to request a free copy of the proxy voting guidelines.
Fidelity® Variable Insurance Products are separate account options which are purchased through a variable insurance contract.
Standard & Poor's, S&P and S&P 500 are registered service marks of The McGraw-Hill Companies, Inc. and have been licensed for use by Fidelity Distributors Corporation.
Other third-party marks appearing herein are the property of their respective owners.
All other marks appearing herein are registered or unregistered trademarks or service marks of FMR LLC or an affiliated company. © 2021 FMR LLC. All rights reserved.
This report and the financial statements contained herein are submitted for the general information of the shareholders of the Funds. This report is not authorized for distribution to prospective investors in the Funds unless preceded or accompanied by an effective prospectus.
A fund files its complete schedule of portfolio holdings with the SEC for the first and third quarters of each fiscal year on Form N-PORT. Forms N-PORT are available on the SEC’s web site at http://www.sec.gov. A fund's Forms N-PORT may be reviewed and copied at the SEC’s Public Reference Room in Washington, DC. Information regarding the operation of the SEC's Public Reference Room may be obtained by calling 1-800-SEC-0330.
For a complete list of a fund's portfolio holdings, view the most recent holdings listing, semiannual report, or annual report on Fidelity's web site at http://www.fidelity.com, http://www.institutional.fidelity.com, or http://www.401k.com, as applicable.
NOT FDIC INSURED •MAY LOSE VALUE •NO BANK GUARANTEE
Neither the Funds nor Fidelity Distributors Corporation is a bank.
Note to Shareholders:
Early in 2020, the outbreak and spread of a new coronavirus emerged as a public health emergency that had a major influence on financial markets, primarily based on its impact on the global economy and the outlook for corporate earnings. The virus causes a respiratory disease known as COVID-19. On March 11, the World Health Organization declared the COVID-19 outbreak a pandemic, citing sustained risk of further global spread.
In the weeks following, as the crisis worsened, we witnessed an escalating human tragedy with wide-scale social and economic consequences from coronavirus-containment measures. The outbreak of COVID-19 prompted a number of measures to limit the spread, including travel and border restrictions, quarantines, and restrictions on large gatherings. In turn, these resulted in lower consumer activity, diminished demand for a wide range of products and services, disruption in manufacturing and supply chains, and – given the wide variability in outcomes regarding the outbreak – significant market uncertainty and volatility. Amid the turmoil, global governments and central banks took unprecedented action to help support consumers, businesses, and the broader economies, and to limit disruption to financial systems.
The situation continues to unfold, and the extent and duration of its impact on financial markets and the economy remain highly uncertain. Extreme events such as the coronavirus crisis are “exogenous shocks” that can have significant adverse effects on mutual funds and their investments. Although multiple asset classes may be affected by market disruption, the duration and impact may not be the same for all types of assets.
Fidelity is committed to helping you stay informed amid news about COVID-19 and during increased market volatility, and we’re taking extra steps to be responsive to customer needs. We encourage you to visit our websites, where we offer ongoing updates, commentary, and analysis on the markets and our funds.
VIP FundsManager® 20% Portfolio
Performance: The Bottom Line
Average annual total return reflects the change in the value of an investment, assuming reinvestment of distributions from dividend income and capital gains (the profits earned upon the sale of securities that have grown in value, if any) and assuming a constant rate of performance each year. During periods of reimbursement by Fidelity, a fund’s total return will be greater than it would be had the reimbursement not occurred. Performance numbers are net of all underlying fund operating expenses, but do not include any insurance charges imposed by your insurance company’s separate account. If performance information included the effect of these additional charges, the total returns would have been lower. How a fund did yesterday is no guarantee of how it will do tomorrow.
Average Annual Total Returns
| For the periods ended December 31, 2020 | Past 1 year | Past 5 years | Past 10 years |
| Service Class | 8.11% | 5.31% | 4.41% |
| Service Class 2 | 7.97% | 5.16% | 4.26% |
| Investor Class | 8.21% | 5.33% | 4.41% |
$10,000 Over 10 Years
Let's say hypothetically that $10,000 was invested in VIP FundsManager® 20% Portfolio - Investor Class on December 31, 2010.
The chart shows how the value of your investment would have changed, and also shows how the Bloomberg Barclays U.S. Aggregate Bond Index performed over the same period.

| Period Ending Values |
| $15,400 | VIP FundsManager® 20% Portfolio - Investor Class |
| $14,576 | Bloomberg Barclays U.S. Aggregate Bond Index |
VIP FundsManager® 50% Portfolio
Performance: The Bottom Line
Average annual total return reflects the change in the value of an investment, assuming reinvestment of distributions from dividend income and capital gains (the profits earned upon the sale of securities that have grown in value, if any) and assuming a constant rate of performance each year. During periods of reimbursement by Fidelity, a fund’s total return will be greater than it would be had the reimbursement not occurred. Performance numbers are net of all underlying fund operating expenses, but do not include any insurance charges imposed by your insurance company’s separate account. If performance information included the effect of these additional charges, the total returns would have been lower. How a fund did yesterday is no guarantee of how it will do tomorrow.
Average Annual Total Returns
| For the periods ended December 31, 2020 | Past 1 year | Past 5 years | Past 10 years |
| Service Class | 14.06% | 8.74% | 7.26% |
| Service Class 2 | 13.89% | 8.56% | 7.09% |
| Investor Class | 13.98% | 8.73% | 7.26% |
$10,000 Over 10 Years
Let's say hypothetically that $10,000 was invested in VIP FundsManager® 50% Portfolio - Investor Class on December 31, 2010.
The chart shows how the value of your investment would have changed, and also shows how the S&P 500® Index performed over the same period.

| Period Ending Values |
| $20,152 | VIP FundsManager® 50% Portfolio - Investor Class |
| $36,700 | S&P 500® Index |
VIP FundsManager® 60% Portfolio
Performance: The Bottom Line
Average annual total return reflects the change in the value of an investment, assuming reinvestment of distributions from dividend income and capital gains (the profits earned upon the sale of securities that have grown in value, if any) and assuming a constant rate of performance each year. During periods of reimbursement by Fidelity, a fund’s total return will be greater than it would be had the reimbursement not occurred. Performance numbers are net of all underlying fund operating expenses, but do not include any insurance charges imposed by your insurance company’s separate account. If performance information included the effect of these additional charges, the total returns would have been lower. How a fund did yesterday is no guarantee of how it will do tomorrow.
Average Annual Total Returns
| For the periods ended December 31, 2020 | Past 1 year | Past 5 years | Past 10 years |
| Service Class | 15.12% | 9.73% | 8.12% |
| Service Class 2 | 14.92% | 9.56% | 7.96% |
| Investor Class | 15.12% | 9.73% | 8.12% |
$10,000 Over 10 Years
Let's say hypothetically that $10,000 was invested in VIP FundsManager® 60% Portfolio - Investor Class on December 31, 2010.
The chart shows how the value of your investment would have changed, and also shows how the S&P 500® Index performed over the same period.

| Period Ending Values |
| $21,839 | VIP FundsManager® 60% Portfolio - Investor Class |
| $36,700 | S&P 500® Index |
VIP FundsManager® 70% Portfolio
Performance: The Bottom Line
Average annual total return reflects the change in the value of an investment, assuming reinvestment of distributions from dividend income and capital gains (the profits earned upon the sale of securities that have grown in value, if any) and assuming a constant rate of performance each year. During periods of reimbursement by Fidelity, a fund’s total return will be greater than it would be had the reimbursement not occurred. Performance numbers are net of all underlying fund operating expenses, but do not include any insurance charges imposed by your insurance company’s separate account. If performance information included the effect of these additional charges, the total returns would have been lower. How a fund did yesterday is no guarantee of how it will do tomorrow.
Average Annual Total Returns
| For the periods ended December 31, 2020 | Past 1 year | Past 5 years | Past 10 years |
| Service Class | 16.10% | 10.51% | 8.83% |
| Service Class 2 | 15.94% | 10.34% | 8.67% |
| Investor Class | 16.10% | 10.51% | 8.83% |
$10,000 Over 10 Years
Let's say hypothetically that $10,000 was invested in VIP FundsManager® 70% Portfolio - Investor Class on December 31, 2010.
The chart shows how the value of your investment would have changed, and also shows how the S&P 500® Index performed over the same period.

| Period Ending Values |
| $23,314 | VIP FundsManager® 70% Portfolio - Investor Class |
| $36,700 | S&P 500® Index |
VIP FundsManager® 85% Portfolio
Performance: The Bottom Line
Average annual total return reflects the change in the value of an investment, assuming reinvestment of distributions from dividend income and capital gains (the profits earned upon the sale of securities that have grown in value, if any) and assuming a constant rate of performance each year. During periods of reimbursement by Fidelity, a fund’s total return will be greater than it would be had the reimbursement not occurred. Performance numbers are net of all underlying fund operating expenses, but do not include any insurance charges imposed by your insurance company’s separate account. If performance information included the effect of these additional charges, the total returns would have been lower. How a fund did yesterday is no guarantee of how it will do tomorrow.
Average Annual Total Returns
| For the periods ended December 31, 2020 | Past 1 year | Past 5 years | Past 10 years |
| Service Class | 17.93% | 11.98% | 9.91% |
| Service Class 2 | 17.27% | 11.76% | 9.72% |
| Investor Class | 17.46% | 11.93% | 9.87% |
$10,000 Over 10 Years
Let's say hypothetically that $10,000 was invested in VIP FundsManager® 85% Portfolio - Investor Class on December 31, 2010.
The chart shows how the value of your investment would have changed, and also shows how the S&P 500® Index performed over the same period.

| Period Ending Values |
| $25,640 | VIP FundsManager® 85% Portfolio - Investor Class |
| $36,700 | S&P 500® Index |
Management's Discussion of Fund Performance
Market Recap: Global financial markets were highly volatile and unpredictable in 2020, a year that will be remembered by most investors for the impact of the coronavirus pandemic. The early-2020 outbreak and spread of COVID-19 resulted in a sharp decline for risk assets, followed by a historic rebound. The crisis and containment efforts led to broad contraction in economic activity and dislocation in financial markets. Rapid and expansive monetary- and fiscal-policy responses partially offset the economic disruption and fueled the market surge for many assets from late March through the end of the year.
Non-U.S. equities gained 10.81% in 2020, according to the MSCI ACWI (All Country World Index) ex USA Index, despite significant ups and downs related to the pandemic. Emerging markets (+19%) was the top region, followed by Japan (+15%) and Europe ex U.K. (+12%). Conversely, the U.K. (-10%), Canada (+6%) and Asia Pacific ex Japan (+7%) lagged. By sector, information technology (+46%) was by far the top performer, while consumer discretionary (+23%) and materials (+22%) also notably outpaced the index. Energy (-23%), real estate (-9%) and financials (-4%) all underperformed.
The Dow Jones U.S. Total Stock Market Index gained 20.79% for the year. After a sharp decline in the first quarter (-20.96%) due to the coronavirus outbreak, U.S. equities reversed course, driven by resilient corporate earnings and potential for a vaccine breakthrough, and closed the year at an all-time high. Among sectors, consumer discretionary (+47%) and information technology (+46%) led, whereas energy (-33%) fared worst, followed by real estate (-5%). Large-cap stocks performed about on par with smaller-caps, while growth handily outpaced value. Commodities notably lagged equities.
Turning to fixed income, U.S. taxable investment-grade bonds (the Bloomberg Barclays U.S. Aggregate Bond Index) rose 7.51%, as most categories generated a solid gain. Corporate bonds (+9.35%) led the way, along with commercial mortgage backed securities (+8.11%), Treasury securities (+8.00) and government bonds (7.94%). Agency bonds (+5.48%) and mortgage-backed securities (+3.87%) had smaller gains. Extended (non-core) categories outside the index were mixed, including Treasury Inflation-Protected Securities (+10.99%), high-yield bonds (+6.07%), emerging-markets debt (+5.88%) and floating-rate bank loans (+3.50%).
Comments from Lead Portfolio Manager Geoff Stein and Co-Portfolio Manager Avishek Hazrachoudhury: For the year, the Portfolios’ share classes posted gains ranging from about 8% to 18%, and each outpaced their respective Composite benchmarks. Strong security selection, particularly among U.S. and international developed-markets (DM) equities, fueled the Portfolios’ returns versus Composite benchmarks and more than offset negative results from asset class positioning. Exceptional performance from Fidelity
® Stock Selector All Cap Fund – which topped its benchmark, the S&P 500 Index, by a sizable margin – drove U.S. stock selection. The fund benefited from picks in several sectors, most notably information technology, health care and communication services. Fidelity
® Overseas Fund led the way in terms of international DM stock selection, also handily outperforming its benchmark, the MSCI EAFE Index, powered by choices in continental Europe and the U.K. Picks in Japan also helped but were partially offset by an underweighting in that top-performing market. Security selection in emerging markets (EM) provided a further boost to relative performance, thanks to robust stock choices in China via Fidelity Emerging Markets Fund. Turning to asset class positioning, our equity allocation strategy substantially hampered relative performance this past year, mostly due to positioning in late February and March. During that time, we had moderate overweightings in U.S. and EM stocks, when markets around the world fell amid coronavirus pandemic fears. Beginning in late March, we increased the Portfolios' equity exposure, which resulted in modest contributions from foreign DM and EM stocks. The Portfolios' holdings of large-cap and value-oriented U.S. equity funds did not compare favorably to the performance of our all-cap U.S. equity benchmark. This was an additional factor weighing on the relative outcome of our U.S. equity positioning. Out-of-benchmark equity exposure had a mixed impact, with commodities contributing, fueled by strong performance from Fidelity Select Gold Portfolio, whereas REITs (real estate investment trusts) detracted. Our fixed-income positioning had a neutral impact on relative performance. An underweighted allocation in investment-grade bonds, along with an out-of-benchmark stake in long-term U.S. Treasuries, aided performance. Unfortunately, this was mostly negated by adverse results in other market segments. Looking ahead, we are cautiously optimistic, as reflected by the Portfolios’ moderate overweightings in equity and credit risk.
The views expressed above reflect those of the portfolio manager(s) only through the end of the period as stated on the cover of this report and do not necessarily represent the views of Fidelity or any other person in the Fidelity organization. Any such views are subject to change at any time based upon market or other conditions and Fidelity disclaims any responsibility to update such views. These views may not be relied on as investment advice and, because investment decisions for a Fidelity fund are based on numerous factors, may not be relied on as an indication of trading intent on behalf of any Fidelity fund.
VIP FundsManager® 20% Portfolio
Investment Summary (Unaudited)
The information in the following tables is based on the direct investments of the Fund.
Top Holdings as of December 31, 2020
| | % of fund's net assets |
| Fidelity U.S. Bond Index Fund | 42.8 |
| Fidelity Cash Central Fund 0.11% | 22.1 |
| Fidelity Stock Selector All Cap Fund | 14.1 |
| Fidelity Inflation-Protected Bond Index Fund | 4.2 |
| Fidelity Overseas Fund | 2.1 |
| Fidelity Emerging Markets Fund | 1.8 |
| Fidelity Long-Term Treasury Bond Index Fund | 1.5 |
| Fidelity High Income Fund | 1.3 |
| Fidelity Low-Priced Stock Fund | 1.0 |
| Fidelity New Markets Income Fund | 1.0 |
| | 91.9 |
Asset Allocation (% of fund's net assets)
| Period end* |
| | Domestic Equity Funds | 19.4% |
| | International Equity Funds | 7.5% |
| | Bond Funds | 50.8% |
| | Short-Term Funds | 22.1% |
| | Short-Term Investments | 0.3% |
| | Net Other Assets (Liabilities)** | (0.1)% |

* Futures - (3.3)%
** Net Other Assets (Liabilities) are not included in the pie chart
VIP FundsManager® 20% Portfolio
Schedule of Investments December 31, 2020
Showing Percentage of Net Assets
| Equity Funds - 26.9% | | | |
| | | Shares | Value |
| Fidelity Commodity Strategy Fund (a) | | 173,878 | $1,392,764 |
| Fidelity Contrafund (a) | | 267,474 | 4,482,861 |
| Fidelity Emerging Asia Fund (a) | | 43,906 | 2,999,210 |
| Fidelity Emerging Markets Discovery Fund (a) | | 196,430 | 3,303,958 |
| Fidelity Emerging Markets Fund (a) | | 369,479 | 16,877,792 |
| Fidelity Equity-Income Fund (a) | | 124,479 | 7,761,240 |
| Fidelity Europe Fund (a) | | 46,039 | 1,950,677 |
| Fidelity Global Commodity Stock Fund (a) | | 296,923 | 3,960,950 |
| Fidelity Gold Portfolio (a) | | 211,667 | 6,248,402 |
| Fidelity International Capital Appreciation Fund (a) | | 156,695 | 4,338,879 |
| Fidelity International Discovery Fund (a) | | 81,965 | 4,351,505 |
| Fidelity International Enhanced Index Fund (a) | | 357,477 | 3,671,290 |
| Fidelity International Small Cap Fund (a) | | 71,642 | 2,194,409 |
| Fidelity International Small Cap Opportunities Fund (a) | | 102,256 | 2,519,597 |
| Fidelity International Value Fund (a) | | 336,576 | 2,850,801 |
| Fidelity Japan Fund (a) | | 90,399 | 1,813,405 |
| Fidelity Japan Smaller Companies Fund (a) | | 57,275 | 1,017,772 |
| Fidelity Large Cap Value Enhanced Index Fund (a) | | 161,364 | 2,270,392 |
| Fidelity Low-Priced Stock Fund (a) | | 196,736 | 9,567,254 |
| Fidelity Overseas Fund (a) | | 327,815 | 19,485,340 |
| Fidelity Pacific Basin Fund (a) | | 46,338 | 2,032,387 |
| Fidelity Real Estate Investment Portfolio (a) | | 114,391 | 4,510,431 |
| Fidelity Stock Selector All Cap Fund (a) | | 2,315,287 | 131,600,933 |
| Fidelity U.S. Low Volatility Equity Fund (a) | | 596,793 | 6,403,594 |
| Fidelity Value Discovery Fund (a) | | 117,568 | 3,782,177 |
| TOTAL EQUITY FUNDS | | | |
| (Cost $199,688,297) | | | 251,388,020 |
|
| Fixed-Income Funds - 50.8% | | | |
| Fidelity High Income Fund (a) | | 1,411,834 | 12,339,428 |
| Fidelity Inflation-Protected Bond Index Fund (a) | | 3,600,856 | 39,753,453 |
| Fidelity Long-Term Treasury Bond Index Fund (a) | | 855,368 | 13,643,127 |
| Fidelity New Markets Income Fund (a) | | 593,170 | 8,956,865 |
| Fidelity U.S. Bond Index Fund (a) | | 32,148,667 | 400,250,902 |
| TOTAL FIXED-INCOME FUNDS | | | |
| (Cost $435,640,129) | | | 474,943,775 |
|
| Money Market Funds - 22.1% | | | |
| Fidelity Cash Central Fund 0.11% (b) | | | |
| (Cost $206,186,300) | | 206,145,071 | 206,186,300 |
| | | Principal Amount | Value |
|
| U.S. Treasury Obligations - 0.3% | | | |
| U.S. Treasury Bills, yield at date of purchase 0.06% to 0.09% 2/11/21 to 4/1/21 (c) | | | |
| (Cost $2,449,699) | | 2,450,000 | 2,449,751 |
| TOTAL INVESTMENT IN SECURITIES - 100.1% | | | |
| (Cost $843,964,425) | | | 934,967,846 |
| NET OTHER ASSETS (LIABILITIES) - (0.1)% | | | (487,556) |
| NET ASSETS - 100% | | | $934,480,290 |
| Futures Contracts | | | | | |
| | Number of contracts | Expiration Date | Notional Amount | Value | Unrealized Appreciation/(Depreciation) |
| Purchased | | | | | |
| Equity Index Contracts | | | | | |
| ICE E-mini MSCI EAFE Index Contracts (United States) | 46 | March 2021 | $4,900,840 | $85,368 | $85,368 |
| Sold | | | | | |
| Equity Index Contracts | | | | | |
| CME E-mini S&P 500 Index Contracts (United States) | 187 | March 2021 | 35,051,280 | (777,401) | (777,401) |
| TOTAL FUTURES CONTRACTS | | | | | $(692,033) |
The notional amount of futures purchased as a percentage of Net Assets is 0.5%
The notional amount of futures sold as a percentage of Net Assets is 3.8%
For the period, the average monthly notional amount at value for futures contracts in the aggregate was $32,118,139.
Legend
(a) Affiliated Fund
(b) Affiliated fund that is generally available only to investment companies and other accounts managed by Fidelity Investments. The rate quoted is the annualized seven-day yield of the fund at period end. A complete unaudited listing of the fund's holdings as of its most recent quarter end is available upon request. In addition, each Fidelity Central Fund's financial statements, which are not covered by the Fund's Report of Independent Registered Public Accounting Firm, are available on the SEC's website or upon request.
(c) Security or a portion of the security was pledged to cover margin requirements for futures contracts. At period end, the value of securities pledged amounted to $2,449,751.
Affiliated Central Funds
Information regarding fiscal year to date income earned by the Fund from investments in Fidelity Central Funds is as follows:
| Fund | Income earned |
| Fidelity Cash Central Fund | $357,295 |
| Total | $357,295 |
Amounts in the income column in the above table include any capital gain distributions from underlying funds, which are presented in the corresponding line-item in the Statement of Operations, if applicable.
The value, beginning of period, for the Fidelity Cash Central Fund was $71,453,177. Net realized gain (loss) and change in net unrealized appreciation (depreciation) on Fidelity Cash Central Fund is presented in the Statement of Operations, if applicable. Purchases and sales of the Fidelity Cash Central Fund were $223,472,353 and $88,738,829, respectively, during the period.
Affiliated Underlying Funds
Fiscal year to date information regarding the Fund's investments in affiliated Underlying Funds, excluding any Money Market Central Funds, is presented below. Exchanges between classes of the same affiliated Underlying Funds may occur.
| Affiliate | Value, beginning of period | Purchases(a) | Sales Proceeds(a) | Dividend Income | Realized Gain (loss) | Change in Unrealized appreciation (depreciation) | Value, end of period |
| Fidelity Commodity Strategy Fund | $1,448,405 | $-- | $-- | $-- | $-- | $(55,641) | $1,392,764 |
| Fidelity Contrafund | 4,913,777 | 1,149,559 | 2,452,021 | 344,540 | 217,191 | 654,355 | 4,482,861 |
| Fidelity Diversified International Fund | 3,559,565 | 36,879 | 3,127,021 | -- | (173,369) | (296,054) | -- |
| Fidelity Emerging Asia Fund | 1,724,288 | 453,879 | 70,911 | 367,806 | (1,395) | 893,349 | 2,999,210 |
| Fidelity Emerging Markets Discovery Fund | 2,804,685 | 167,839 | 123,899 | 19,353 | (7,120) | 462,453 | 3,303,958 |
| Fidelity Emerging Markets Fund | 12,656,964 | 848,531 | 511,842 | 231,181 | (21,444) | 3,905,583 | 16,877,792 |
| Fidelity Equity-Income Fund | 4,783,665 | 3,438,281 | 943,490 | 226,265 | (36,138) | 518,922 | 7,761,240 |
| Fidelity Europe Fund | 1,639,377 | 458,908 | 434,579 | 22,192 | 3,942 | 283,029 | 1,950,677 |
| Fidelity Global Commodity Stock Fund | -- | 3,481,653 | 106,448 | 62,957 | 5,359 | 580,386 | 3,960,950 |
| Fidelity Gold Portfolio | 5,929,232 | 2,600,654 | 3,929,136 | 270,360 | 641,922 | 1,005,730 | 6,248,402 |
| Fidelity High Income Fund | -- | 11,562,239 | 527,034 | 372,530 | 1,119 | 1,303,104 | 12,339,428 |
| Fidelity Inflation-Protected Bond Index Fund | 45,113,866 | 12,056,045 | 21,914,723 | 515,514 | 1,045,760 | 3,452,505 | 39,753,453 |
| Fidelity International Capital Appreciation Fund | 1,061,688 | 2,995,210 | 783,219 | 54,986 | 46,249 | 1,018,951 | 4,338,879 |
| Fidelity International Discovery Fund | 2,941,018 | 1,489,377 | 812,611 | 155,216 | 45,881 | 687,840 | 4,351,505 |
| Fidelity International Enhanced Index Fund | 3,212,518 | 1,017,039 | 821,217 | 59,084 | (32,701) | 295,651 | 3,671,290 |
| Fidelity International Small Cap Fund | 1,949,728 | 499,367 | 471,075 | 18,001 | 28,733 | 187,656 | 2,194,409 |
| Fidelity International Small Cap Opportunities Fund | 1,893,623 | 472,702 | 228,721 | -- | (1,458) | 383,451 | 2,519,597 |
| Fidelity International Value Fund | 2,280,114 | 1,002,527 | 622,098 | 48,724 | (62,769) | 253,027 | 2,850,801 |
| Fidelity Investments Money Market Prime Reserves Portfolio Institutional Class 0.01% | 149,641,174 | 14,321,930 | 164,022,354 | 684,573 | 71,109 | (11,859) | -- |
| Fidelity Japan Fund | 7,415,567 | 846,160 | 7,187,541 | 73,870 | 1,115,210 | (375,991) | 1,813,405 |
| Fidelity Japan Smaller Companies Fund | 3,373,246 | 15,950 | 2,251,430 | 15,950 | 138,772 | (258,766) | 1,017,772 |
| Fidelity Large Cap Value Enhanced Index Fund | -- | 2,134,771 | 249,414 | 36,994 | 13,970 | 371,065 | 2,270,392 |
| Fidelity Long-Term Treasury Bond Index Fund | 8,167,893 | 18,179,216 | 13,713,521 | 393,238 | 2,438,005 | (1,428,466) | 13,643,127 |
| Fidelity Low-Priced Stock Fund | 4,633,556 | 5,546,654 | 1,077,438 | 785,403 | (122,142) | 586,624 | 9,567,254 |
| Fidelity Mega Cap Stock Fund | 7,094,651 | 232,405 | 6,042,374 | -- | (1,785,033) | 500,351 | -- |
| Fidelity New Markets Income Fund | 8,133,255 | 1,418,258 | 647,501 | 344,976 | (26,456) | 79,309 | 8,956,865 |
| Fidelity Overseas Fund | 11,587,622 | 8,661,038 | 4,109,462 | 102,223 | 109,543 | 3,236,599 | 19,485,340 |
| Fidelity Pacific Basin Fund | 939,343 | 984,311 | 388,682 | 86,551 | 31,957 | 465,458 | 2,032,387 |
| Fidelity Real Estate Investment Portfolio | 8,187,298 | 748,647 | 2,742,686 | 207,139 | (1,223,159) | (459,669) | 4,510,431 |
| Fidelity Stock Selector All Cap Fund | 90,810,513 | 27,384,710 | 7,117,923 | 6,528,055 | (421,461) | 20,945,094 | 131,600,933 |
| Fidelity U.S. Bond Index Fund | 348,364,263 | 101,985,894 | 65,314,921 | 11,411,646 | 312,207 | 14,903,459 | 400,250,902 |
| Fidelity U.S. Low Volatility Equity Fund | -- | 6,470,574 | 915,085 | 39,287 | 45,506 | 802,599 | 6,403,594 |
| Fidelity Value Discovery Fund | 2,303,165 | 1,587,186 | 455,043 | 38,593 | (952) | 347,821 | 3,782,177 |
| | $748,564,059 | $234,248,393 | $314,115,420 | $23,517,207 | $2,396,838 | $55,237,925 | $726,331,795 |
(a) Includes the value of shares purchased or redeemed through in-kind transactions, if applicable.
Amounts in the income column in the above table include any capital gain distributions from underlying funds, which are presented in the corresponding line-item in the Statement of Operations, if applicable.
Investment Valuation
The following is a summary of the inputs used, as of December 31, 2020, involving the Fund's assets and liabilities carried at fair value. The inputs or methodology used for valuing securities may not be an indication of the risk associated with investing in those securities. For more information on valuation inputs, and their aggregation into the levels used below, please refer to the Investment Valuation section in the accompanying Notes to Financial Statements.
| | Valuation Inputs at Reporting Date: |
| Description | Total | Level 1 | Level 2 | Level 3 |
| Investments in Securities: | | | | |
| Equity Funds | $251,388,020 | $251,388,020 | $-- | $-- |
| Fixed-Income Funds | 474,943,775 | 474,943,775 | -- | -- |
| Money Market Funds | 206,186,300 | 206,186,300 | -- | -- |
| Other Short-Term Investments and Net Other Assets | 2,449,751 | -- | 2,449,751 | -- |
| Total Investments in Securities: | $934,967,846 | $932,518,095 | $2,449,751 | $-- |
| Derivative Instruments: | | | | |
| Assets | | | | |
| Futures Contracts | $85,368 | $85,368 | $-- | $-- |
| Total Assets | $85,368 | $85,368 | $-- | $-- |
| Liabilities | | | | |
| Futures Contracts | $(777,401) | $(777,401) | $-- | $-- |
| Total Liabilities | $(777,401) | $(777,401) | $-- | $-- |
| Total Derivative Instruments: | $(692,033) | $(692,033) | $-- | $-- |
Value of Derivative Instruments
The following table is a summary of the Fund's value of derivative instruments by primary risk exposure as of December 31, 2020. For additional information on derivative instruments, please refer to the Derivative Instruments section in the accompanying Notes to Financial Statements.
| Primary Risk Exposure / Derivative Type | Value |
| | Asset | Liability |
| Equity Risk | | |
| Futures Contracts(a) | $85,368 | $(777,401) |
| Total Equity Risk | 85,368 | (777,401) |
| Total Value of Derivatives | $85,368 | $(777,401) |
(a) Reflects gross cumulative appreciation (depreciation) on futures contracts as presented in the Schedule of Investments. In the Statement of Assets and Liabilities, the period end daily variation margin is included in receivable or payable for daily variation margin on futures contracts, and the net cumulative appreciation (depreciation) is included in Total accumulated earnings (loss).
See accompanying notes which are an integral part of the financial statements.
VIP FundsManager® 20% Portfolio
Financial Statements
Statement of Assets and Liabilities
| | | December 31, 2020 |
| Assets | | |
Investment in securities, at value — See accompanying schedule:
Unaffiliated issuers (cost $2,449,699) | $2,449,751 | |
| Fidelity Central Funds (cost $206,186,300) | 206,186,300 | |
| Other affiliated issuers (cost $635,328,426) | 726,331,795 | |
| Total Investment in Securities (cost $843,964,425) | | $934,967,846 |
| Cash | | 30,129 |
| Receivable for investments sold | | 330,987 |
| Receivable for fund shares sold | | 932 |
| Distributions receivable from Fidelity Central Funds | | 17,680 |
| Total assets | | 935,347,574 |
| Liabilities | | |
| Payable for investments purchased | $17,680 | |
| Payable for fund shares redeemed | 424,274 | |
| Accrued management fee | 154,584 | |
| Distribution and service plan fees payable | 1,176 | |
| Payable for daily variation margin on futures contracts | 269,570 | |
| Total liabilities | | 867,284 |
| Net Assets | | $934,480,290 |
| Net Assets consist of: | | |
| Paid in capital | | $841,976,182 |
| Total accumulated earnings (loss) | | 92,504,108 |
| Net Assets | | $934,480,290 |
| Net Asset Value and Maximum Offering Price | | |
| Service Class: | | |
| Net Asset Value, offering price and redemption price per share ($60,793 ÷ 5,111 shares) | | $11.89 |
| Service Class 2: | | |
| Net Asset Value, offering price and redemption price per share ($9,323,453 ÷ 786,112 shares) | | $11.86 |
| Investor Class: | | |
| Net Asset Value, offering price and redemption price per share ($925,096,044 ÷ 77,829,105 shares) | | $11.89 |
See accompanying notes which are an integral part of the financial statements.
Statement of Operations
| | | Year ended December 31, 2020 |
| Investment Income | | |
| Dividends: | | |
| Unaffiliated issuers | | $2,282 |
| Affiliated issuers | | 11,451,149 |
| Interest | | 5,926 |
| Income from Fidelity Central Funds | | 357,295 |
| Total income | | 11,816,652 |
| Expenses | | |
| Management fee | $2,149,405 | |
| Distribution and service plan fees | 22,095 | |
| Independent trustees' fees and expenses | 2,764 | |
| Total expenses before reductions | 2,174,264 | |
| Expense reductions | (439,357) | |
| Total expenses after reductions | | 1,734,907 |
| Net investment income (loss) | | 10,081,745 |
| Realized and Unrealized Gain (Loss) | | |
| Net realized gain (loss) on: | | |
| Investment securities: | | |
| Unaffiliated issuers | 103,419 | |
| Fidelity Central Funds | (401) | |
| Other affiliated issuers | 2,396,838 | |
| Foreign currency transactions | 510 | |
| Futures contracts | (10,876,679) | |
| Capital gain distributions from underlying funds: | | |
| Affiliated issuers | 12,066,058 | |
| Total net realized gain (loss) | | 3,689,745 |
| Change in net unrealized appreciation (depreciation) on: | | |
| Investment securities: | | |
| Unaffiliated issuers | (79) | |
| Affiliated issuers | 55,237,925 | |
| Assets and liabilities in foreign currencies | (11) | |
| Futures contracts | (564,041) | |
| Total change in net unrealized appreciation (depreciation) | | 54,673,794 |
| Net gain (loss) | | 58,363,539 |
| Net increase (decrease) in net assets resulting from operations | | $68,445,284 |
See accompanying notes which are an integral part of the financial statements.
Statement of Changes in Net Assets
| | Year ended December 31, 2020 | Year ended December 31, 2019 |
| Increase (Decrease) in Net Assets | | |
| Operations | | |
| Net investment income (loss) | $10,081,745 | $15,330,350 |
| Net realized gain (loss) | 3,689,745 | 3,695,673 |
| Change in net unrealized appreciation (depreciation) | 54,673,794 | 55,726,922 |
| Net increase (decrease) in net assets resulting from operations | 68,445,284 | 74,752,945 |
| Distributions to shareholders | (15,496,204) | (43,905,467) |
| Share transactions - net increase (decrease) | 60,425,801 | 62,132,859 |
| Total increase (decrease) in net assets | 113,374,881 | 92,980,337 |
| Net Assets | | |
| Beginning of period | 821,105,409 | 728,125,072 |
| End of period | $934,480,290 | $821,105,409 |
See accompanying notes which are an integral part of the financial statements.
Financial Highlights
VIP FundsManager 20% Portfolio Service Class
| Years ended December 31, | 2020 | 2019 | 2018 | 2017 | 2016 |
| Selected Per–Share Data | | | | | |
| Net asset value, beginning of period | $11.19 | $10.75 | $11.63 | $11.04 | $11.02 |
| Income from Investment Operations | | | | | |
| Net investment income (loss)A | .13 | .22 | .21 | .16 | .14 |
| Net realized and unrealized gain (loss) | .77 | .86 | (.40) | .65 | .17 |
| Total from investment operations | .90 | 1.08 | (.19) | .81 | .31 |
| Distributions from net investment income | (.13) | (.21) | (.21) | (.15) | (.14) |
| Distributions from net realized gain | (.07) | (.43) | (.48) | (.07) | (.15) |
| Total distributions | (.20) | (.64) | (.69) | (.22) | (.29) |
| Net asset value, end of period | $11.89 | $11.19 | $10.75 | $11.63 | $11.04 |
| Total ReturnB,C | 8.11% | 10.39% | (1.67)% | 7.33% | 2.83% |
| Ratios to Average Net AssetsD,E | | | | | |
| Expenses before reductions | .35% | .35% | .35% | .35% | .35% |
| Expenses net of fee waivers, if any | .20% | .20% | .20% | .20% | .20% |
| Expenses net of all reductions | .20% | .20% | .20% | .20% | .20% |
| Net investment income (loss) | 1.17% | 2.01% | 1.87% | 1.41% | 1.25% |
| Supplemental Data | | | | | |
| Net assets, end of period (000 omitted) | $61 | $57 | $55 | $59 | $60 |
| Portfolio turnover rateF | 32%G | 33% | 47% | 61% | 58% |
A Calculated based on average shares outstanding during the period.
B Total returns do not reflect charges attributable to your insurance company's separate account. Inclusion of these charges would reduce the total returns shown.
C Total returns would have been lower if certain expenses had not been reduced during the applicable periods shown.
D Fees and expenses of any underlying mutual funds or exchange-traded funds (ETFs) are not included in the Fund's expense ratio. The Fund indirectly bears its proportionate share of these expenses. For additional expense information related to investments in Fidelity Central Funds, please refer to the "Investments in Fidelity Central Funds" note found in the Notes to Financial Statements section of the most recent Annual or Semi-Annual report.
E Expense ratios reflect operating expenses of the class. Expenses before reductions do not reflect amounts reimbursed, waived, or reduced through arrangements with the investment adviser, brokerage services, or other offset arrangements, if applicable, and do not represent the amount paid by the class during periods when reimbursements, waivers or reductions occur.
F Amount does not include the portfolio activity of any underlying mutual funds or exchange-traded funds (ETFs).
G Portfolio turnover rate excludes certain securities received or delivered in-kind.
See accompanying notes which are an integral part of the financial statements.
VIP FundsManager 20% Portfolio Service Class 2
| Years ended December 31, | 2020 | 2019 | 2018 | 2017 | 2016 |
| Selected Per–Share Data | | | | | |
| Net asset value, beginning of period | $11.16 | $10.72 | $11.60 | $11.01 | $11.00 |
| Income from Investment Operations | | | | | |
| Net investment income (loss)A | .12 | .20 | .19 | .14 | .12 |
| Net realized and unrealized gain (loss) | .77 | .87 | (.40) | .65 | .17 |
| Total from investment operations | .89 | 1.07 | (.21) | .79 | .29 |
| Distributions from net investment income | (.11) | (.20) | (.19) | (.13) | (.13) |
| Distributions from net realized gain | (.07) | (.43) | (.48) | (.07) | (.15) |
| Total distributions | (.19)B | (.63) | (.67) | (.20) | (.28) |
| Net asset value, end of period | $11.86 | $11.16 | $10.72 | $11.60 | $11.01 |
| Total ReturnC,D | 7.97% | 10.26% | (1.82)% | 7.19% | 2.66% |
| Ratios to Average Net AssetsE,F | | | | | |
| Expenses before reductions | .50% | .50% | .50% | .50% | .50% |
| Expenses net of fee waivers, if any | .35% | .35% | .35% | .35% | .35% |
| Expenses net of all reductions | .35% | .35% | .35% | .35% | .35% |
| Net investment income (loss) | 1.02% | 1.86% | 1.72% | 1.26% | 1.10% |
| Supplemental Data | | | | | |
| Net assets, end of period (000 omitted) | $9,323 | $8,978 | $8,286 | $8,188 | $7,529 |
| Portfolio turnover rateG | 32%H | 33% | 47% | 61% | 58% |
A Calculated based on average shares outstanding during the period.
B Total distributions per share do not sum due to rounding.
C Total returns do not reflect charges attributable to your insurance company's separate account. Inclusion of these charges would reduce the total returns shown.
D Total returns would have been lower if certain expenses had not been reduced during the applicable periods shown.
E Fees and expenses of any underlying mutual funds or exchange-traded funds (ETFs) are not included in the Fund's expense ratio. The Fund indirectly bears its proportionate share of these expenses. For additional expense information related to investments in Fidelity Central Funds, please refer to the "Investments in Fidelity Central Funds" note found in the Notes to Financial Statements section of the most recent Annual or Semi-Annual report.
F Expense ratios reflect operating expenses of the class. Expenses before reductions do not reflect amounts reimbursed, waived, or reduced through arrangements with the investment adviser, brokerage services, or other offset arrangements, if applicable, and do not represent the amount paid by the class during periods when reimbursements, waivers or reductions occur.
G Amount does not include the portfolio activity of any underlying mutual funds or exchange-traded funds (ETFs).
H Portfolio turnover rate excludes certain securities received or delivered in-kind.
See accompanying notes which are an integral part of the financial statements.
VIP FundsManager 20% Portfolio Investor Class
| Years ended December 31, | 2020 | 2019 | 2018 | 2017 | 2016 |
| Selected Per–Share Data | | | | | |
| Net asset value, beginning of period | $11.18 | $10.74 | $11.62 | $11.04 | $11.01 |
| Income from Investment Operations | | | | | |
| Net investment income (loss)A | .13 | .22 | .21 | .16 | .14 |
| Net realized and unrealized gain (loss) | .78 | .86 | (.40) | .64 | .18 |
| Total from investment operations | .91 | 1.08 | (.19) | .80 | .32 |
| Distributions from net investment income | (.13) | (.21) | (.21) | (.15) | (.14) |
| Distributions from net realized gain | (.07) | (.43) | (.48) | (.07) | (.15) |
| Total distributions | (.20) | (.64) | (.69) | (.22) | (.29) |
| Net asset value, end of period | $11.89 | $11.18 | $10.74 | $11.62 | $11.04 |
| Total ReturnB,C | 8.21% | 10.40% | (1.67)% | 7.24% | 2.93% |
| Ratios to Average Net AssetsD,E | | | | | |
| Expenses before reductions | .25% | .25% | .25% | .25% | .25% |
| Expenses net of fee waivers, if any | .20% | .20% | .20% | .20% | .20% |
| Expenses net of all reductions | .20% | .20% | .20% | .20% | .20% |
| Net investment income (loss) | 1.17% | 2.01% | 1.87% | 1.41% | 1.25% |
| Supplemental Data | | | | | |
| Net assets, end of period (000 omitted) | $925,096 | $812,070 | $719,784 | $777,291 | $739,074 |
| Portfolio turnover rateF | 32%G | 33% | 47% | 61% | 58% |
A Calculated based on average shares outstanding during the period.
B Total returns do not reflect charges attributable to your insurance company's separate account. Inclusion of these charges would reduce the total returns shown.
C Total returns would have been lower if certain expenses had not been reduced during the applicable periods shown.
D Fees and expenses of any underlying mutual funds or exchange-traded funds (ETFs) are not included in the Fund's expense ratio. The Fund indirectly bears its proportionate share of these expenses. For additional expense information related to investments in Fidelity Central Funds, please refer to the "Investments in Fidelity Central Funds" note found in the Notes to Financial Statements section of the most recent Annual or Semi-Annual report.
E Expense ratios reflect operating expenses of the class. Expenses before reductions do not reflect amounts reimbursed, waived, or reduced through arrangements with the investment adviser, brokerage services, or other offset arrangements, if applicable, and do not represent the amount paid by the class during periods when reimbursements, waivers or reductions occur.
F Amount does not include the portfolio activity of any underlying mutual funds or exchange-traded funds (ETFs).
G Portfolio turnover rate excludes certain securities received or delivered in-kind.
See accompanying notes which are an integral part of the financial statements.
VIP FundsManager® 50% Portfolio
Investment Summary (Unaudited)
The information in the following tables is based on the direct investments of the Fund.
Top Holdings as of December 31, 2020
| | % of fund's net assets |
| Fidelity U.S. Bond Index Fund | 30.8 |
| Fidelity Stock Selector All Cap Fund | 30.6 |
| Fidelity Overseas Fund | 6.2 |
| Fidelity Inflation-Protected Bond Index Fund | 4.4 |
| Fidelity Low-Priced Stock Fund | 2.4 |
| Fidelity Equity-Income Fund | 2.2 |
| Fidelity U.S. Low Volatility Equity Fund | 1.8 |
| Fidelity Emerging Markets Fund | 1.4 |
| Fidelity Long-Term Treasury Bond Index Fund | 1.4 |
| Fidelity International Discovery Fund | 1.4 |
| | 82.6 |
Asset Allocation (% of fund's net assets)
| Period end* |
| | Domestic Equity Funds | 42.2% |
| | International Equity Funds | 17.8% |
| | Bond Funds | 38.6% |
| | Short-Term Funds | 1.2% |
| | Short-Term Investments | 0.3% |
| | Net Other Assets (Liabilities)** | (0.1)% |

* Futures - (5.0)%
** Net Other Assets (Liabilities) are not included in the pie chart
VIP FundsManager® 50% Portfolio
Schedule of Investments December 31, 2020
Showing Percentage of Net Assets
| Equity Funds - 60.0% | | | |
| | | Shares | Value |
| Fidelity Commodity Strategy Fund (a) | | 1,226,913 | $9,827,572 |
| Fidelity Contrafund (a) | | 3,806,455 | 63,796,183 |
| Fidelity Emerging Asia Fund (a) | | 349,691 | 23,887,425 |
| Fidelity Emerging Markets Discovery Fund (a) | | 1,523,326 | 25,622,350 |
| Fidelity Emerging Markets Fund (a) | | 1,818,688 | 83,077,667 |
| Fidelity Equity-Income Fund (a) | | 2,025,503 | 126,290,103 |
| Fidelity Europe Fund (a) | | 856,378 | 36,284,732 |
| Fidelity Global Commodity Stock Fund (a) | | 5,215,594 | 69,576,030 |
| Fidelity Gold Portfolio (a) | | 1,395,283 | 41,188,768 |
| Fidelity International Capital Appreciation Fund (a) | | 2,923,543 | 80,952,896 |
| Fidelity International Discovery Fund (a) | | 1,542,194 | 81,875,089 |
| Fidelity International Enhanced Index Fund (a) | | 6,625,691 | 68,045,850 |
| Fidelity International Small Cap Fund (a) | | 1,332,284 | 40,807,848 |
| Fidelity International Small Cap Opportunities Fund (a) | | 1,695,932 | 41,787,756 |
| Fidelity International Value Fund (a) | | 6,240,728 | 52,858,965 |
| Fidelity Japan Fund (a) | | 2,719,641 | 54,555,995 |
| Fidelity Japan Smaller Companies Fund (a) | | 3,259,076 | 57,913,782 |
| Fidelity Large Cap Value Enhanced Index Fund (a) | | 3,678,730 | 51,759,725 |
| Fidelity Low-Priced Stock Fund (a) | | 2,897,625 | 140,911,503 |
| Fidelity Overseas Fund (a) | | 6,061,040 | 360,268,240 |
| Fidelity Pacific Basin Fund (a) | | 865,937 | 37,980,011 |
| Fidelity Real Estate Investment Portfolio (a) | | 192,370 | 7,585,166 |
| Fidelity Stock Selector All Cap Fund (a) | | 31,449,281 | 1,787,577,149 |
| Fidelity U.S. Low Volatility Equity Fund (a) | | 9,819,928 | 105,367,825 |
| Fidelity Value Discovery Fund (a) | | 1,842,043 | 59,258,536 |
| TOTAL EQUITY FUNDS | | | |
| (Cost $2,760,621,030) | | | 3,509,057,166 |
|
| Fixed-Income Funds - 38.6% | | | |
| Fidelity High Income Fund (a) | | 7,769,437 | 67,904,879 |
| Fidelity Inflation-Protected Bond Index Fund (a) | | 23,085,859 | 254,867,888 |
| Fidelity Long-Term Treasury Bond Index Fund (a) | | 5,174,530 | 82,533,756 |
| Fidelity New Markets Income Fund (a) | | 3,270,400 | 49,383,047 |
| Fidelity U.S. Bond Index Fund (a) | | 144,538,232 | 1,799,500,995 |
| TOTAL FIXED-INCOME FUNDS | | | |
| (Cost $2,079,596,438) | | | 2,254,190,565 |
|
| Money Market Funds - 1.2% | | | |
| Fidelity Cash Central Fund 0.11% (b) | | | |
| (Cost $68,297,599) | | 68,284,769 | 68,298,426 |
| | | Principal Amount | Value |
|
| U.S. Treasury Obligations - 0.3% | | | |
| U.S. Treasury Bills, yield at date of purchase 0.07% to 0.08% 3/4/21 to 3/25/21 (c) | | | |
| (Cost $17,397,396) | | 17,400,000 | 17,397,602 |
| TOTAL INVESTMENT IN SECURITIES - 100.1% | | | |
| (Cost $4,925,912,463) | | | 5,848,943,759 |
| NET OTHER ASSETS (LIABILITIES) - (0.1)% | | | (2,936,247) |
| NET ASSETS - 100% | | | $5,846,007,512 |
| Futures Contracts | | | | | |
| | Number of contracts | Expiration Date | Notional Amount | Value | Unrealized Appreciation/(Depreciation) |
| Sold | | | | | |
| Equity Index Contracts | | | | | |
| CME E-mini S&P 500 Index Contracts (United States) | 1,556 | March 2021 | $291,656,640 | $(6,854,309) | $(6,854,309) |
The notional amount of futures sold as a percentage of Net Assets is 5.0%
For the period, the average monthly notional amount at value for futures contracts in the aggregate was $272,330,429.
Legend
(a) Affiliated Fund
(b) Affiliated fund that is generally available only to investment companies and other accounts managed by Fidelity Investments. The rate quoted is the annualized seven-day yield of the fund at period end. A complete unaudited listing of the fund's holdings as of its most recent quarter end is available upon request. In addition, each Fidelity Central Fund's financial statements, which are not covered by the Fund's Report of Independent Registered Public Accounting Firm, are available on the SEC's website or upon request.
(c) Security or a portion of the security was pledged to cover margin requirements for futures contracts. At period end, the value of securities pledged amounted to $17,397,602.
Affiliated Central Funds
Information regarding fiscal year to date income earned by the Fund from investments in Fidelity Central Funds is as follows:
| Fund | Income earned |
| Fidelity Cash Central Fund | $408,964 |
| Total | $408,964 |
Amounts in the income column in the above table include any capital gain distributions from underlying funds, which are presented in the corresponding line-item in the Statement of Operations, if applicable.
Affiliated Underlying Funds
Fiscal year to date information regarding the Fund's investments in affiliated Underlying Funds, excluding any Money Market Central Funds, is presented below. Exchanges between classes of the same affiliated Underlying Funds may occur.
| Affiliate | Value, beginning of period | Purchases(a) | Sales Proceeds(a) | Dividend Income | Realized Gain (loss) | Change in Unrealized appreciation (depreciation) | Value, end of period |
| Fidelity Commodity Strategy Fund | $10,220,184 | $-- | $-- | $-- | $-- | $(392,612) | $9,827,572 |
| Fidelity Contrafund | 82,972,985 | 6,198,033 | 38,960,810 | 5,105,326 | 4,502,902 | 9,083,073 | 63,796,183 |
| Fidelity Emerging Asia Fund | 14,440,302 | 2,969,322 | 762,049 | 2,933,400 | 123,509 | 7,116,341 | 23,887,425 |
| Fidelity Emerging Markets Discovery Fund | 23,240,771 | 209,640 | 1,312,294 | 150,417 | (139,450) | 3,623,683 | 25,622,350 |
| Fidelity Emerging Markets Fund | 96,594,267 | 1,391,176 | 32,948,462 | 1,141,887 | 3,229,275 | 14,811,411 | 83,077,667 |
| Fidelity Equity-Income Fund | 84,762,100 | 53,220,826 | 18,240,499 | 3,718,396 | (1,739,643) | 8,287,319 | 126,290,103 |
| Fidelity Europe Fund | 37,127,713 | 5,452,897 | 9,891,506 | 414,092 | (1,103,669) | 4,699,297 | 36,284,732 |
| Fidelity Global Commodity Stock Fund | 33,832,048 | 34,366,862 | 4,738,181 | 1,108,401 | (900,256) | 7,015,557 | 69,576,030 |
| Fidelity Gold Portfolio | 82,267,597 | 2,389,683 | 69,494,393 | 2,063,770 | 21,786,991 | 4,238,890 | 41,188,768 |
| Fidelity High Income Fund | -- | 66,010,624 | 5,946,227 | 2,163,072 | 213,197 | 7,627,285 | 67,904,879 |
| Fidelity Inflation-Protected Bond Index Fund | 279,161,775 | 46,301,746 | 96,056,854 | 3,224,799 | 3,333,816 | 22,127,405 | 254,867,888 |
| Fidelity International Capital Appreciation Fund | 24,027,130 | 45,592,964 | 6,195,587 | 1,029,043 | 37,342 | 17,491,047 | 80,952,896 |
| Fidelity International Discovery Fund | 31,736,858 | 41,458,867 | 6,639,023 | 2,929,241 | (36,739) | 15,355,126 | 81,875,089 |
| Fidelity International Enhanced Index Fund | 72,171,890 | 10,653,780 | 16,319,260 | 1,099,399 | (3,351,307) | 4,890,747 | 68,045,850 |
| Fidelity International Small Cap Fund | 41,101,797 | 5,819,350 | 8,250,231 | 335,793 | (876,289) | 3,013,221 | 40,807,848 |
| Fidelity International Small Cap Opportunities Fund | 40,064,633 | 5,623,964 | 9,214,584 | -- | 1,175,943 | 4,137,800 | 41,787,756 |
| Fidelity International Value Fund | 52,384,726 | 8,107,477 | 7,832,355 | 906,188 | (1,733,585) | 1,932,702 | 52,858,965 |
| Fidelity Investments Money Market Prime Reserves Portfolio Institutional Class 0.01% | 186,642,484 | 1,478,509 | 188,195,027 | 832,921 | 86,150 | (12,116) | -- |
| Fidelity Japan Fund | 95,382,678 | 1,384,749 | 51,852,226 | 965,861 | 6,018,860 | 3,621,934 | 54,555,995 |
| Fidelity Japan Smaller Companies Fund | 81,639,797 | 907,583 | 25,491,886 | 907,583 | (3,287,647) | 4,145,935 | 57,913,782 |
| Fidelity Large Cap Value Enhanced Index Fund | 15,723,015 | 37,426,251 | 7,367,064 | 848,050 | (790,804) | 6,768,327 | 51,759,725 |
| Fidelity Long-Term Treasury Bond Index Fund | 56,544,597 | 86,955,940 | 68,648,815 | 2,492,144 | 17,036,420 | (9,354,386) | 82,533,756 |
| Fidelity Low-Priced Stock Fund | 75,831,642 | 79,793,049 | 20,210,224 | 11,083,727 | (3,304,252) | 8,801,288 | 140,911,503 |
| Fidelity Mega Cap Stock Fund | 126,409,531 | 180,619 | 104,432,855 | -- | (31,524,882) | 9,367,587 | -- |
| Fidelity New Markets Income Fund | 53,559,909 | 2,357,775 | 6,418,907 | 2,080,952 | (587,817) | 472,087 | 49,383,047 |
| Fidelity Overseas Fund | 327,764,704 | 53,466,277 | 60,834,942 | 1,896,195 | (75,788) | 39,947,989 | 360,268,240 |
| Fidelity Pacific Basin Fund | 21,042,974 | 12,385,295 | 3,305,072 | 1,622,209 | (54,715) | 7,911,529 | 37,980,011 |
| Fidelity Real Estate Investment Portfolio | 55,585,013 | 501,634 | 36,068,628 | 408,970 | (10,111,921) | (2,320,932) | 7,585,166 |
| Fidelity Stock Selector All Cap Fund | 1,682,211,189 | 144,160,924 | 328,490,829 | 90,851,619 | 20,291,411 | 269,404,454 | 1,787,577,149 |
| Fidelity U.S. Bond Index Fund | 1,829,513,098 | 319,789,962 | 429,554,369 | 53,727,874 | 12,923,037 | 66,829,267 | 1,799,500,995 |
| Fidelity U.S. Low Volatility Equity Fund | -- | 102,549,906 | 11,151,632 | 649,349 | 638,901 | 13,330,650 | 105,367,825 |
| Fidelity Value Discovery Fund | 39,745,529 | 23,576,981 | 8,737,704 | 577,184 | (379,360) | 5,053,090 | 59,258,536 |
| | $5,653,702,936 | $1,202,682,665 | $1,683,562,495 | $197,267,862 | $31,399,630 | $559,024,995 | $5,763,247,731 |
(a) Includes the value of shares purchased or redeemed through in-kind transactions, if applicable.
Amounts in the income column in the above table include any capital gain distributions from underlying funds, which are presented in the corresponding line-item in the Statement of Operations, if applicable.
Investment Valuation
The following is a summary of the inputs used, as of December 31, 2020, involving the Fund's assets and liabilities carried at fair value. The inputs or methodology used for valuing securities may not be an indication of the risk associated with investing in those securities. For more information on valuation inputs, and their aggregation into the levels used below, please refer to the Investment Valuation section in the accompanying Notes to Financial Statements.
| | Valuation Inputs at Reporting Date: |
| Description | Total | Level 1 | Level 2 | Level 3 |
| Investments in Securities: | | | | |
| Equity Funds | $3,509,057,166 | $3,509,057,166 | $-- | $-- |
| Fixed-Income Funds | 2,254,190,565 | 2,254,190,565 | -- | -- |
| Money Market Funds | 68,298,426 | 68,298,426 | -- | -- |
| Other Short-Term Investments and Net Other Assets | 17,397,602 | -- | 17,397,602 | -- |
| Total Investments in Securities: | $5,848,943,759 | $5,831,546,157 | $17,397,602 | $-- |
| Derivative Instruments: | | | | |
| Liabilities | | | | |
| Futures Contracts | $(6,854,309) | $(6,854,309) | $-- | $-- |
| Total Liabilities | $(6,854,309) | $(6,854,309) | $-- | $-- |
| Total Derivative Instruments: | $(6,854,309) | $(6,854,309) | $-- | $-- |
Value of Derivative Instruments
The following table is a summary of the Fund's value of derivative instruments by primary risk exposure as of December 31, 2020. For additional information on derivative instruments, please refer to the Derivative Instruments section in the accompanying Notes to Financial Statements.
| Primary Risk Exposure / Derivative Type | Value |
| | Asset | Liability |
| Equity Risk | | |
| Futures Contracts(a) | $0 | $(6,854,309) |
| Total Equity Risk | 0 | (6,854,309) |
| Total Value of Derivatives | $0 | $(6,854,309) |
(a) Reflects gross cumulative appreciation (depreciation) on futures contracts as presented in the Schedule of Investments. In the Statement of Assets and Liabilities, the period end daily variation margin is included in receivable or payable for daily variation margin on futures contracts, and the net cumulative appreciation (depreciation) is included in Total accumulated earnings (loss).
See accompanying notes which are an integral part of the financial statements.
VIP FundsManager® 50% Portfolio
Financial Statements
Statement of Assets and Liabilities
| | | December 31, 2020 |
| Assets | | |
Investment in securities, at value — See accompanying schedule:
Unaffiliated issuers (cost $17,397,396) | $17,397,602 | |
| Fidelity Central Funds (cost $68,297,599) | 68,298,426 | |
| Other affiliated issuers (cost $4,840,217,468) | 5,763,247,731 | |
| Total Investment in Securities (cost $4,925,912,463) | | $5,848,943,759 |
| Receivable for investments sold | | 797,709 |
| Receivable for fund shares sold | | 12,942 |
| Distributions receivable from Fidelity Central Funds | | 2,429 |
| Total assets | | 5,849,756,839 |
| Liabilities | | |
| Payable for investments purchased | $17,841 | |
| Payable for fund shares redeemed | 840,127 | |
| Accrued management fee | 963,322 | |
| Distribution and service plan fees payable | 14,157 | |
| Payable for daily variation margin on futures contracts | 1,913,880 | |
| Total liabilities | | 3,749,327 |
| Net Assets | | $5,846,007,512 |
| Net Assets consist of: | | |
| Paid in capital | | $4,826,968,331 |
| Total accumulated earnings (loss) | | 1,019,039,181 |
| Net Assets | | $5,846,007,512 |
| Net Asset Value and Maximum Offering Price | | |
| Service Class: | | |
| Net Asset Value, offering price and redemption price per share ($64,141 ÷ 4,728 shares) | | $13.57 |
| Service Class 2: | | |
| Net Asset Value, offering price and redemption price per share ($114,211,075 ÷ 8,453,648 shares) | | $13.51 |
| Investor Class: | | |
| Net Asset Value, offering price and redemption price per share ($5,731,732,296 ÷ 422,574,501 shares) | | $13.56 |
See accompanying notes which are an integral part of the financial statements.
Statement of Operations
| | | Year ended December 31, 2020 |
| Investment Income | | |
| Dividends: | | |
| Unaffiliated issuers | | $38,481 |
| Affiliated issuers | | 71,790,437 |
| Interest | | 40,980 |
| Income from Fidelity Central Funds | | 408,964 |
| Total income | | 72,278,862 |
| Expenses | | |
| Management fee | $13,708,206 | |
| Distribution and service plan fees | 264,698 | |
| Independent trustees' fees and expenses | 17,864 | |
| Total expenses before reductions | 13,990,768 | |
| Expense reductions | (2,851,152) | |
| Total expenses after reductions | | 11,139,616 |
| Net investment income (loss) | | 61,139,246 |
| Realized and Unrealized Gain (Loss) | | |
| Net realized gain (loss) on: | | |
| Investment securities: | | |
| Unaffiliated issuers | 1,445,163 | |
| Fidelity Central Funds | (5,598) | |
| Other affiliated issuers | 31,399,630 | |
| Foreign currency transactions | 9,152 | |
| Futures contracts | (51,176,696) | |
| Capital gain distributions from underlying funds: | | |
| Affiliated issuers | 125,477,425 | |
| Total net realized gain (loss) | | 107,149,076 |
| Change in net unrealized appreciation (depreciation) on: | | |
| Investment securities: | | |
| Unaffiliated issuers | (803) | |
| Affiliated issuers | 559,024,995 | |
| Assets and liabilities in foreign currencies | (400) | |
| Futures contracts | (5,290,864) | |
| Total change in net unrealized appreciation (depreciation) | | 553,732,928 |
| Net gain (loss) | | 660,882,004 |
| Net increase (decrease) in net assets resulting from operations | | $722,021,250 |
See accompanying notes which are an integral part of the financial statements.
Statement of Changes in Net Assets
| | Year ended December 31, 2020 | Year ended December 31, 2019 |
| Increase (Decrease) in Net Assets | | |
| Operations | | |
| Net investment income (loss) | $61,139,246 | $96,631,919 |
| Net realized gain (loss) | 107,149,076 | 110,836,085 |
| Change in net unrealized appreciation (depreciation) | 553,732,928 | 739,786,183 |
| Net increase (decrease) in net assets resulting from operations | 722,021,250 | 947,254,187 |
| Distributions to shareholders | (181,171,815) | (640,240,283) |
| Share transactions - net increase (decrease) | (428,725,848) | (199,067,212) |
| Total increase (decrease) in net assets | 112,123,587 | 107,946,692 |
| Net Assets | | |
| Beginning of period | 5,733,883,925 | 5,625,937,233 |
| End of period | $5,846,007,512 | $5,733,883,925 |
See accompanying notes which are an integral part of the financial statements.
Financial Highlights
VIP FundsManager 50% Portfolio Service Class
| Years ended December 31, | 2020 | 2019 | 2018 | 2017 | 2016 |
| Selected Per–Share Data | | | | | |
| Net asset value, beginning of period | $12.28 | $11.68 | $13.53 | $12.03 | $11.85 |
| Income from Investment Operations | | | | | |
| Net investment income (loss)A | .14 | .20 | .19 | .16 | .15 |
| Net realized and unrealized gain (loss) | 1.55 | 1.76 | (.86) | 1.58 | .35 |
| Total from investment operations | 1.69 | 1.96 | (.67) | 1.74 | .50 |
| Distributions from net investment income | (.14) | (.20) | (.18) | (.15) | (.15) |
| Distributions from net realized gain | (.26) | (1.15) | (1.00) | (.08) | (.16) |
| Total distributions | (.40) | (1.36)B | (1.18) | (.24)B | (.32)B |
| Net asset value, end of period | $13.57 | $12.28 | $11.68 | $13.53 | $12.03 |
| Total ReturnC,D | 14.06% | 17.89% | (5.28)% | 14.45% | 4.31% |
| Ratios to Average Net AssetsE,F | | | | | |
| Expenses before reductions | .35% | .35% | .35% | .35% | .35% |
| Expenses net of fee waivers, if any | .20% | .20% | .20% | .20% | .20% |
| Expenses net of all reductions | .20% | .20% | .20% | .20% | .20% |
| Net investment income (loss) | 1.12% | 1.68% | 1.52% | 1.21% | 1.26% |
| Supplemental Data | | | | | |
| Net assets, end of period (000 omitted) | $64 | $58 | $55 | $64 | $62 |
| Portfolio turnover rateG | 24%H | 25% | 80% | 47% | 40% |
A Calculated based on average shares outstanding during the period.
B Total distributions per share do not sum due to rounding.
C Total returns do not reflect charges attributable to your insurance company's separate account. Inclusion of these charges would reduce the total returns shown.
D Total returns would have been lower if certain expenses had not been reduced during the applicable periods shown.
E Fees and expenses of any underlying mutual funds or exchange-traded funds (ETFs) are not included in the Fund's expense ratio. The Fund indirectly bears its proportionate share of these expenses. For additional expense information related to investments in Fidelity Central Funds, please refer to the "Investments in Fidelity Central Funds" note found in the Notes to Financial Statements section of the most recent Annual or Semi-Annual report.
F Expense ratios reflect operating expenses of the class. Expenses before reductions do not reflect amounts reimbursed, waived, or reduced through arrangements with the investment adviser, brokerage services, or other offset arrangements, if applicable, and do not represent the amount paid by the class during periods when reimbursements, waivers or reductions occur.
G Amount does not include the portfolio activity of any underlying mutual funds or exchange-traded funds (ETFs).
H Portfolio turnover rate excludes certain securities received or delivered in-kind.
See accompanying notes which are an integral part of the financial statements.
VIP FundsManager 50% Portfolio Service Class 2
| Years ended December 31, | 2020 | 2019 | 2018 | 2017 | 2016 |
| Selected Per–Share Data | | | | | |
| Net asset value, beginning of period | $12.23 | $11.64 | $13.48 | $11.99 | $11.82 |
| Income from Investment Operations | | | | | |
| Net investment income (loss)A | .12 | .18 | .17 | .14 | .13 |
| Net realized and unrealized gain (loss) | 1.55 | 1.75 | (.85) | 1.57 | .34 |
| Total from investment operations | 1.67 | 1.93 | (.68) | 1.71 | .47 |
| Distributions from net investment income | (.13) | (.19) | (.16) | (.13) | (.13) |
| Distributions from net realized gain | (.26) | (1.15) | (1.00) | (.08) | (.16) |
| Total distributions | (.39) | (1.34) | (1.16) | (.22)B | (.30)B |
| Net asset value, end of period | $13.51 | $12.23 | $11.64 | $13.48 | $11.99 |
| Total ReturnC,D | 13.89% | 17.69% | (5.38)% | 14.24% | 4.08% |
| Ratios to Average Net AssetsE,F | | | | | |
| Expenses before reductions | .50% | .50% | .50% | .50% | .50% |
| Expenses net of fee waivers, if any | .35% | .35% | .35% | .35% | .35% |
| Expenses net of all reductions | .35% | .35% | .35% | .35% | .35% |
| Net investment income (loss) | .97% | 1.53% | 1.37% | 1.06% | 1.11% |
| Supplemental Data | | | | | |
| Net assets, end of period (000 omitted) | $114,211 | $103,031 | $90,234 | $100,867 | $90,983 |
| Portfolio turnover rateG | 24%H | 25% | 80% | 47% | 40% |
A Calculated based on average shares outstanding during the period.
B Total distributions per share do not sum due to rounding.
C Total returns do not reflect charges attributable to your insurance company's separate account. Inclusion of these charges would reduce the total returns shown.
D Total returns would have been lower if certain expenses had not been reduced during the applicable periods shown.
E Fees and expenses of any underlying mutual funds or exchange-traded funds (ETFs) are not included in the Fund's expense ratio. The Fund indirectly bears its proportionate share of these expenses. For additional expense information related to investments in Fidelity Central Funds, please refer to the "Investments in Fidelity Central Funds" note found in the Notes to Financial Statements section of the most recent Annual or Semi-Annual report.
F Expense ratios reflect operating expenses of the class. Expenses before reductions do not reflect amounts reimbursed, waived, or reduced through arrangements with the investment adviser, brokerage services, or other offset arrangements, if applicable, and do not represent the amount paid by the class during periods when reimbursements, waivers or reductions occur.
G Amount does not include the portfolio activity of any underlying mutual funds or exchange-traded funds (ETFs).
H Portfolio turnover rate excludes certain securities received or delivered in-kind.
See accompanying notes which are an integral part of the financial statements.
VIP FundsManager 50% Portfolio Investor Class
| Years ended December 31, | 2020 | 2019 | 2018 | 2017 | 2016 |
| Selected Per–Share Data | | | | | |
| Net asset value, beginning of period | $12.28 | $11.68 | $13.52 | $12.02 | $11.85 |
| Income from Investment Operations | | | | | |
| Net investment income (loss)A | .14 | .20 | .19 | .16 | .15 |
| Net realized and unrealized gain (loss) | 1.54 | 1.76 | (.85) | 1.58 | .34 |
| Total from investment operations | 1.68 | 1.96 | (.66) | 1.74 | .49 |
| Distributions from net investment income | (.14) | (.20) | (.18) | (.15) | (.15) |
| Distributions from net realized gain | (.26) | (1.15) | (1.00) | (.08) | (.16) |
| Total distributions | (.40) | (1.36)B | (1.18) | (.24)B | (.32)B |
| Net asset value, end of period | $13.56 | $12.28 | $11.68 | $13.52 | $12.02 |
| Total ReturnC,D | 13.98% | 17.89% | (5.20)% | 14.46% | 4.22% |
| Ratios to Average Net AssetsE,F | | | | | |
| Expenses before reductions | .25% | .25% | .25% | .25% | .25% |
| Expenses net of fee waivers, if any | .20% | .20% | .20% | .20% | .20% |
| Expenses net of all reductions | .20% | .20% | .20% | .20% | .20% |
| Net investment income (loss) | 1.12% | 1.68% | 1.52% | 1.21% | 1.26% |
| Supplemental Data | | | | | |
| Net assets, end of period (000 omitted) | $5,731,732 | $5,630,795 | $5,535,648 | $6,623,127 | $6,179,579 |
| Portfolio turnover rateG | 24%H | 25% | 80% | 47% | 40% |
A Calculated based on average shares outstanding during the period.
B Total distributions per share do not sum due to rounding.
C Total returns do not reflect charges attributable to your insurance company's separate account. Inclusion of these charges would reduce the total returns shown.
D Total returns would have been lower if certain expenses had not been reduced during the applicable periods shown.
E Fees and expenses of any underlying mutual funds or exchange-traded funds (ETFs) are not included in the Fund's expense ratio. The Fund indirectly bears its proportionate share of these expenses. For additional expense information related to investments in Fidelity Central Funds, please refer to the "Investments in Fidelity Central Funds" note found in the Notes to Financial Statements section of the most recent Annual or Semi-Annual report.
F Expense ratios reflect operating expenses of the class. Expenses before reductions do not reflect amounts reimbursed, waived, or reduced through arrangements with the investment adviser, brokerage services, or other offset arrangements, if applicable, and do not represent the amount paid by the class during periods when reimbursements, waivers or reductions occur.
G Amount does not include the portfolio activity of any underlying mutual funds or exchange-traded funds (ETFs).
H Portfolio turnover rate excludes certain securities received or delivered in-kind.
See accompanying notes which are an integral part of the financial statements.
VIP FundsManager® 60% Portfolio
Investment Summary (Unaudited)
The information in the following tables is based on the direct investments of the Fund.
Top Holdings as of December 31, 2020
| | % of fund's net assets |
| Fidelity Stock Selector All Cap Fund | 35.0 |
| Fidelity U.S. Bond Index Fund | 23.9 |
| Fidelity Overseas Fund | 7.1 |
| Fidelity Inflation-Protected Bond Index Fund | 4.0 |
| Fidelity Low-Priced Stock Fund | 2.8 |
| Fidelity Equity-Income Fund | 2.5 |
| Fidelity U.S. Low Volatility Equity Fund | 2.1 |
| Fidelity Emerging Markets Fund | 1.9 |
| Fidelity International Discovery Fund | 1.6 |
| Fidelity International Capital Appreciation Fund | 1.6 |
| | 82.5 |
Asset Allocation (% of fund's net assets)
| Period end* |
| | Domestic Equity Funds | 48.3% |
| | International Equity Funds | 20.2% |
| | Bond Funds | 31.1% |
| | Short-Term Funds | 0.1% |
| | Short-Term Investments | 0.3% |

* Futures - (3.2)%
VIP FundsManager® 60% Portfolio
Schedule of Investments December 31, 2020
Showing Percentage of Net Assets
| Equity Funds - 68.5% | | | |
| | | Shares | Value |
| Fidelity Commodity Strategy Fund (a) | | 1,258,567 | $10,081,125 |
| Fidelity Contrafund (a) | | 4,536,241 | 76,027,408 |
| Fidelity Emerging Asia Fund (a) | | 383,928 | 26,226,121 |
| Fidelity Emerging Markets Discovery Fund (a) | | 1,691,720 | 28,454,735 |
| Fidelity Emerging Markets Fund (a) | | 2,684,490 | 122,627,500 |
| Fidelity Equity-Income Fund (a) | | 2,691,463 | 167,812,748 |
| Fidelity Europe Fund (a) | | 1,110,914 | 47,069,446 |
| Fidelity Global Commodity Stock Fund (a) | | 6,847,703 | 91,348,355 |
| Fidelity Gold Portfolio (a) | | 1,590,153 | 46,941,330 |
| Fidelity International Capital Appreciation Fund (a) | | 3,786,606 | 104,851,108 |
| Fidelity International Discovery Fund (a) | | 1,991,266 | 105,716,309 |
| Fidelity International Enhanced Index Fund (a) | | 8,612,418 | 88,449,535 |
| Fidelity International Small Cap Fund (a) | | 1,733,474 | 53,096,313 |
| Fidelity International Small Cap Opportunities Fund (a) | | 2,190,470 | 53,973,174 |
| Fidelity International Value Fund (a) | | 8,099,108 | 68,599,445 |
| Fidelity Japan Fund (a) | | 3,346,552 | 67,131,829 |
| Fidelity Japan Smaller Companies Fund (a) | | 3,219,746 | 57,214,885 |
| Fidelity Large Cap Value Enhanced Index Fund (a) | | 4,945,301 | 69,580,383 |
| Fidelity Low-Priced Stock Fund (a) | | 3,804,459 | 185,010,822 |
| Fidelity Overseas Fund (a) | | 7,863,352 | 467,397,648 |
| Fidelity Pacific Basin Fund (a) | | 1,122,295 | 49,223,879 |
| Fidelity Real Estate Investment Portfolio (a) | | 218,363 | 8,610,034 |
| Fidelity Stock Selector All Cap Fund (a) | | 40,619,181 | 2,308,794,252 |
| Fidelity U.S. Low Volatility Equity Fund (a) | | 13,091,720 | 140,474,160 |
| Fidelity Value Discovery Fund (a) | | 2,607,487 | 83,882,870 |
| TOTAL EQUITY FUNDS | | | |
| (Cost $3,573,612,286) | | | 4,528,595,414 |
|
| Fixed-Income Funds - 31.1% | | | |
| Fidelity High Income Fund (a) | | 8,557,526 | 74,792,775 |
| Fidelity Inflation-Protected Bond Index Fund (a) | | 24,015,250 | 265,128,365 |
| Fidelity Long-Term Treasury Bond Index Fund (a) | | 4,932,321 | 78,670,526 |
| Fidelity New Markets Income Fund (a) | | 3,636,194 | 54,906,529 |
| Fidelity U.S. Bond Index Fund (a) | | 126,940,159 | 1,580,404,985 |
| TOTAL FIXED-INCOME FUNDS | | | |
| (Cost $1,869,310,527) | | | 2,053,903,180 |
|
| Money Market Funds - 0.1% | | | |
| Fidelity Cash Central Fund 0.11% (b) | | | |
| (Cost $5,577,174) | | 5,576,059 | 5,577,174 |
| | | Principal Amount | Value |
|
| U.S. Treasury Obligations - 0.3% | | | |
| U.S. Treasury Bills, yield at date of purchase 0.06% to 0.08% 3/11/21 to 4/1/21 (c) | | | |
| (Cost $19,336,866) | | 19,340,000 | 19,336,837 |
| TOTAL INVESTMENT IN SECURITIES - 100.0% | | | |
| (Cost $5,467,836,853) | | | 6,607,412,605 |
| NET OTHER ASSETS (LIABILITIES) - 0.0% | | | (3,283,113) |
| NET ASSETS - 100% | | | $6,604,129,492 |
| Futures Contracts | | | | | |
| | Number of contracts | Expiration Date | Notional Amount | Value | Unrealized Appreciation/(Depreciation) |
| Purchased | | | | | |
| Equity Index Contracts | | | | | |
| ICE E-mini MSCI EAFE Index Contracts (United States) | 469 | March 2021 | $49,967,260 | $870,687 | $870,687 |
| Sold | | | | | |
| Equity Index Contracts | | | | | |
| CME E-mini S&P 500 Index Contracts (United States) | 1,399 | March 2021 | 262,228,560 | (4,832,829) | (4,832,829) |
| TOTAL FUTURES CONTRACTS | | | | | $(3,962,142) |
The notional amount of futures purchased as a percentage of Net Assets is 0.8%
The notional amount of futures sold as a percentage of Net Assets is 4.0%
For the period, the average monthly notional amount at value for futures contracts in the aggregate was $294,963,323.
Legend
(a) Affiliated Fund
(b) Affiliated fund that is generally available only to investment companies and other accounts managed by Fidelity Investments. The rate quoted is the annualized seven-day yield of the fund at period end. A complete unaudited listing of the fund's holdings as of its most recent quarter end is available upon request. In addition, each Fidelity Central Fund's financial statements, which are not covered by the Fund's Report of Independent Registered Public Accounting Firm, are available on the SEC's website or upon request.
(c) Security or a portion of the security was pledged to cover margin requirements for futures contracts. At period end, the value of securities pledged amounted to $19,336,837.
Affiliated Central Funds
Information regarding fiscal year to date income earned by the Fund from investments in Fidelity Central Funds is as follows:
| Fund | Income earned |
| Fidelity Cash Central Fund | $44,792 |
| Total | $44,792 |
Amounts in the income column in the above table include any capital gain distributions from underlying funds, which are presented in the corresponding line-item in the Statement of Operations, if applicable.
Affiliated Underlying Funds
Fiscal year to date information regarding the Fund's investments in affiliated Underlying Funds, excluding any Money Market Central Funds, is presented below. Exchanges between classes of the same affiliated Underlying Funds may occur.
| Affiliate | Value, beginning of period | Purchases(a) | Sales Proceeds(a) | Dividend Income | Realized Gain (loss) | Change in Unrealized appreciation (depreciation) | Value, end of period |
| Fidelity Commodity Strategy Fund | $10,483,867 | $-- | $-- | $-- | $-- | $(402,742) | $10,081,125 |
| Fidelity Contrafund | 101,010,860 | 8,664,731 | 51,049,338 | 5,972,103 | 7,156,249 | 10,244,906 | 76,027,408 |
| Fidelity Emerging Asia Fund | 15,426,199 | 3,371,375 | 469,358 | 3,216,731 | 57,882 | 7,840,023 | 26,226,121 |
| Fidelity Emerging Markets Discovery Fund | 24,898,042 | 430,069 | 811,826 | 166,721 | (56,593) | 3,995,043 | 28,454,735 |
| Fidelity Emerging Markets Fund | 107,379,783 | 2,785,163 | 14,067,527 | 1,680,503 | (539,891) | 27,069,972 | 122,627,500 |
| Fidelity Equity-Income Fund | 103,284,890 | 69,410,331 | 14,503,304 | 4,861,337 | (1,074,922) | 10,695,753 | 167,812,748 |
| Fidelity Europe Fund | 48,427,545 | 5,109,828 | 11,399,769 | 535,871 | (1,861,151) | 6,792,993 | 47,069,446 |
| Fidelity Global Commodity Stock Fund | 50,453,752 | 52,778,093 | 15,984,049 | 1,451,186 | (6,086,162) | 10,186,721 | 91,348,355 |
| Fidelity Gold Portfolio | 88,699,305 | 4,253,226 | 74,725,844 | 2,329,097 | 23,542,181 | 5,172,462 | 46,941,330 |
| Fidelity High Income Fund | -- | 70,068,594 | 3,613,790 | 2,328,454 | 24,456 | 8,313,515 | 74,792,775 |
| Fidelity Inflation-Protected Bond Index Fund | 274,974,190 | 12,490,277 | 47,462,420 | 3,313,699 | 2,225,238 | 22,901,080 | 265,128,365 |
| Fidelity International Capital Appreciation Fund | 31,115,335 | 55,659,047 | 5,611,312 | 1,329,628 | 102,685 | 23,585,353 | 104,851,108 |
| Fidelity International Discovery Fund | 57,317,131 | 36,013,412 | 5,945,647 | 3,773,232 | (82,776) | 18,414,189 | 105,716,309 |
| Fidelity International Enhanced Index Fund | 91,386,612 | 13,321,866 | 18,347,609 | 1,426,858 | (3,244,324) | 5,332,990 | 88,449,535 |
| Fidelity International Small Cap Fund | 52,461,360 | 5,404,098 | 8,051,497 | 435,843 | (1,282,084) | 4,564,436 | 53,096,313 |
| Fidelity International Small Cap Opportunities Fund | 51,011,625 | 4,977,933 | 9,500,450 | -- | 86,771 | 7,397,295 | 53,973,174 |
| Fidelity International Value Fund | 70,182,558 | 7,852,310 | 9,164,671 | 1,173,254 | (2,193,751) | 1,922,999 | 68,599,445 |
| Fidelity Investments Money Market Prime Reserves Portfolio Institutional Class 0.01% | 29,693,508 | 335,602 | 30,032,951 | 55,988 | 3,841 | -- | -- |
| Fidelity Japan Fund | 121,163,757 | 3,334,116 | 68,331,278 | 1,185,768 | 6,843,683 | 4,121,551 | 67,131,829 |
| Fidelity Japan Smaller Companies Fund | 93,342,123 | 896,629 | 37,100,096 | 896,630 | (4,091,781) | 4,168,010 | 57,214,885 |
| Fidelity Large Cap Value Enhanced Index Fund | 30,582,466 | 38,817,372 | 6,076,652 | 1,137,390 | (509,335) | 6,766,532 | 69,580,383 |
| Fidelity Long-Term Treasury Bond Index Fund | 58,531,253 | 83,270,914 | 71,651,308 | 2,447,438 | 17,291,510 | (8,771,843) | 78,670,526 |
| Fidelity Low-Priced Stock Fund | 93,713,561 | 100,782,372 | 15,999,007 | 14,581,933 | (1,401,669) | 7,915,565 | 185,010,822 |
| Fidelity Mega Cap Stock Fund | 154,674,420 | 1,088,581 | 128,455,875 | -- | (39,016,071) | 11,708,945 | -- |
| Fidelity New Markets Income Fund | 55,105,964 | 3,498,199 | 3,813,368 | 2,230,361 | (124,524) | 240,258 | 54,906,529 |
| Fidelity Overseas Fund | 435,083,581 | 48,841,851 | 69,641,042 | 2,453,787 | (4,820,270) | 57,933,528 | 467,397,648 |
| Fidelity Pacific Basin Fund | 27,334,913 | 14,054,345 | 2,896,769 | 2,097,636 | 70,676 | 10,660,714 | 49,223,879 |
| Fidelity Real Estate Investment Portfolio | 57,366,688 | 992,140 | 36,630,647 | 452,833 | (11,579,102) | (1,539,045) | 8,610,034 |
| Fidelity Stock Selector All Cap Fund | 2,066,454,563 | 206,317,852 | 334,237,221 | 114,602,825 | 28,673,059 | 341,585,999 | 2,308,794,252 |
| Fidelity U.S. Bond Index Fund | 1,517,341,000 | 151,881,465 | 156,720,255 | 47,752,794 | 2,856,886 | 65,045,889 | 1,580,404,985 |
| Fidelity U.S. Low Volatility Equity Fund | -- | 130,335,449 | 7,936,961 | 862,378 | 328,666 | 17,747,006 | 140,474,160 |
| Fidelity Value Discovery Fund | 48,739,032 | 35,133,237 | 7,212,189 | 817,798 | (399,624) | 7,622,414 | 83,882,870 |
| | $5,967,639,883 | $1,172,170,477 | $1,267,444,030 | $225,570,076 | $10,899,753 | $699,232,511 | $6,582,498,594 |
(a) Includes the value of shares purchased or redeemed through in-kind transactions, if applicable.
Amounts in the income column in the above table include any capital gain distributions from underlying funds, which are presented in the corresponding line-item in the Statement of Operations, if applicable.
Investment Valuation
The following is a summary of the inputs used, as of December 31, 2020, involving the Fund's assets and liabilities carried at fair value. The inputs or methodology used for valuing securities may not be an indication of the risk associated with investing in those securities. For more information on valuation inputs, and their aggregation into the levels used below, please refer to the Investment Valuation section in the accompanying Notes to Financial Statements.
| | Valuation Inputs at Reporting Date: |
| Description | Total | Level 1 | Level 2 | Level 3 |
| Investments in Securities: | | | | |
| Equity Funds | $4,528,595,414 | $4,528,595,414 | $-- | $-- |
| Fixed-Income Funds | 2,053,903,180 | 2,053,903,180 | -- | -- |
| Money Market Funds | 5,577,174 | 5,577,174 | -- | -- |
| Other Short-Term Investments and Net Other Assets | 19,336,837 | -- | 19,336,837 | -- |
| Total Investments in Securities: | $6,607,412,605 | $6,588,075,768 | $19,336,837 | $-- |
| Derivative Instruments: | | | | |
| Assets | | | | |
| Futures Contracts | $870,687 | $870,687 | $-- | $-- |
| Total Assets | $870,687 | $870,687 | $-- | $-- |
| Liabilities | | | | |
| Futures Contracts | $(4,832,829) | $(4,832,829) | $-- | $-- |
| Total Liabilities | $(4,832,829) | $(4,832,829) | $-- | $-- |
| Total Derivative Instruments: | $(3,962,142) | $(3,962,142) | $-- | $-- |
Value of Derivative Instruments
The following table is a summary of the Fund's value of derivative instruments by primary risk exposure as of December 31, 2020. For additional information on derivative instruments, please refer to the Derivative Instruments section in the accompanying Notes to Financial Statements.
| Primary Risk Exposure / Derivative Type | Value |
| | Asset | Liability |
| Equity Risk | | |
| Futures Contracts(a) | $870,687 | $(4,832,829) |
| Total Equity Risk | 870,687 | (4,832,829) |
| Total Value of Derivatives | $870,687 | $(4,832,829) |
(a) Reflects gross cumulative appreciation (depreciation) on futures contracts as presented in the Schedule of Investments. In the Statement of Assets and Liabilities, the period end daily variation margin is included in receivable or payable for daily variation margin on futures contracts, and the net cumulative appreciation (depreciation) is included in Total accumulated earnings (loss).
See accompanying notes which are an integral part of the financial statements.
VIP FundsManager® 60% Portfolio
Financial Statements
Statement of Assets and Liabilities
| | | December 31, 2020 |
| Assets | | |
Investment in securities, at value — See accompanying schedule:
Unaffiliated issuers (cost $19,336,866) | $19,336,837 | |
| Fidelity Central Funds (cost $5,577,174) | 5,577,174 | |
| Other affiliated issuers (cost $5,442,922,813) | 6,582,498,594 | |
| Total Investment in Securities (cost $5,467,836,853) | | $6,607,412,605 |
| Receivable for investments sold | | 904,870 |
| Receivable for fund shares sold | | 247,197 |
| Distributions receivable from Fidelity Central Funds | | 839 |
| Total assets | | 6,608,565,511 |
| Liabilities | | |
| Payable for investments purchased | $839 | |
| Payable for fund shares redeemed | 1,144,991 | |
| Accrued management fee | 1,085,142 | |
| Distribution and service plan fees payable | 80,937 | |
| Payable for daily variation margin on futures contracts | 2,124,110 | |
| Total liabilities | | 4,436,019 |
| Net Assets | | $6,604,129,492 |
| Net Assets consist of: | | |
| Paid in capital | | $5,360,573,745 |
| Total accumulated earnings (loss) | | 1,243,555,747 |
| Net Assets | | $6,604,129,492 |
| Net Asset Value and Maximum Offering Price | | |
| Service Class: | | |
| Net Asset Value, offering price and redemption price per share ($28,620,955 ÷ 2,521,804 shares) | | $11.35 |
| Service Class 2: | | |
| Net Asset Value, offering price and redemption price per share ($656,401,926 ÷ 58,018,935 shares) | | $11.31 |
| Investor Class: | | |
| Net Asset Value, offering price and redemption price per share ($5,919,106,611 ÷ 521,545,126 shares) | | $11.35 |
See accompanying notes which are an integral part of the financial statements.
Statement of Operations
| | | Year ended December 31, 2020 |
| Investment Income | | |
| Dividends: | | |
| Unaffiliated issuers | | $48,615 |
| Affiliated issuers | | 74,288,583 |
| Interest | | 49,257 |
| Income from Fidelity Central Funds | | 44,792 |
| Total income | | 74,431,247 |
| Expenses | | |
| Management fee | $14,770,582 | |
| Distribution and service plan fees | 1,489,534 | |
| Independent trustees' fees and expenses | 19,055 | |
| Interest | 682 | |
| Total expenses before reductions | 16,279,853 | |
| Expense reductions | (3,564,565) | |
| Total expenses after reductions | | 12,715,288 |
| Net investment income (loss) | | 61,715,959 |
| Realized and Unrealized Gain (Loss) | | |
| Net realized gain (loss) on: | | |
| Investment securities: | | |
| Unaffiliated issuers | 1,750,988 | |
| Fidelity Central Funds | (3,793) | |
| Other affiliated issuers | 10,899,753 | |
| Foreign currency transactions | 10,984 | |
| Futures contracts | (53,533,823) | |
| Capital gain distributions from underlying funds: | | |
| Affiliated issuers | 151,281,493 | |
| Total net realized gain (loss) | | 110,405,602 |
| Change in net unrealized appreciation (depreciation) on: | | |
| Investment securities: | | |
| Unaffiliated issuers | (929) | |
| Affiliated issuers | 699,232,511 | |
| Assets and liabilities in foreign currencies | (537) | |
| Futures contracts | (2,245,857) | |
| Total change in net unrealized appreciation (depreciation) | | 696,985,188 |
| Net gain (loss) | | 807,390,790 |
| Net increase (decrease) in net assets resulting from operations | | $869,106,749 |
See accompanying notes which are an integral part of the financial statements.
Statement of Changes in Net Assets
| | Year ended December 31, 2020 | Year ended December 31, 2019 |
| Increase (Decrease) in Net Assets | | |
| Operations | | |
| Net investment income (loss) | $61,715,959 | $89,734,019 |
| Net realized gain (loss) | 110,405,602 | 134,683,705 |
| Change in net unrealized appreciation (depreciation) | 696,985,188 | 817,976,835 |
| Net increase (decrease) in net assets resulting from operations | 869,106,749 | 1,042,394,559 |
| Distributions to shareholders | (206,697,507) | (972,784,748) |
| Share transactions - net increase (decrease) | (37,703,902) | 599,160,748 |
| Total increase (decrease) in net assets | 624,705,340 | 668,770,559 |
| Net Assets | | |
| Beginning of period | 5,979,424,152 | 5,310,653,593 |
| End of period | $6,604,129,492 | $5,979,424,152 |
See accompanying notes which are an integral part of the financial statements.
Financial Highlights
VIP FundsManager 60% Portfolio Service Class
| Years ended December 31, | 2020 | 2019 | 2018 | 2017 | 2016 |
| Selected Per–Share Data | | | | | |
| Net asset value, beginning of period | $10.20 | $10.22 | $12.50 | $11.03 | $11.06 |
| Income from Investment Operations | | | | | |
| Net investment income (loss)A | .11 | .16 | .16 | .13 | .13 |
| Net realized and unrealized gain (loss) | 1.40 | 1.71 | (.87) | 1.73 | .36 |
| Total from investment operations | 1.51 | 1.87 | (.71) | 1.86 | .49 |
| Distributions from net investment income | (.11) | (.15) | (.14) | (.13) | (.14) |
| Distributions from net realized gain | (.25) | (1.74) | (1.42) | (.25) | (.38) |
| Total distributions | (.36) | (1.89) | (1.57)B | (.39)B | (.52) |
| Net asset value, end of period | $11.35 | $10.20 | $10.22 | $12.50 | $11.03 |
| Total ReturnC,D | 15.12% | 20.49% | (6.44)% | 16.99% | 4.79% |
| Ratios to Average Net AssetsE,F | | | | | |
| Expenses before reductions | .35% | .35% | .35% | .35% | .35% |
| Expenses net of fee waivers, if any | .20% | .20% | .20% | .20% | .20% |
| Expenses net of all reductions | .20% | .20% | .20% | .20% | .20% |
| Net investment income (loss) | 1.06% | 1.61% | 1.40% | 1.11% | 1.19% |
| Supplemental Data | | | | | |
| Net assets, end of period (000 omitted) | $28,621 | $9,951 | $50 | $61 | $59 |
| Portfolio turnover rateG | 22%H | 33% | 91% | 47% | 35% |
A Calculated based on average shares outstanding during the period.
B Total distributions per share do not sum due to rounding.
C Total returns do not reflect charges attributable to your insurance company's separate account. Inclusion of these charges would reduce the total returns shown.
D Total returns would have been lower if certain expenses had not been reduced during the applicable periods shown.
E Fees and expenses of any underlying mutual funds or exchange-traded funds (ETFs) are not included in the Fund's expense ratio. The Fund indirectly bears its proportionate share of these expenses. For additional expense information related to investments in Fidelity Central Funds, please refer to the "Investments in Fidelity Central Funds" note found in the Notes to Financial Statements section of the most recent Annual or Semi-Annual report.
F Expense ratios reflect operating expenses of the class. Expenses before reductions do not reflect amounts reimbursed, waived, or reduced through arrangements with the investment adviser, brokerage services, or other offset arrangements, if applicable, and do not represent the amount paid by the class during periods when reimbursements, waivers or reductions occur.
G Amount does not include the portfolio activity of any underlying mutual funds or exchange-traded funds (ETFs).
H Portfolio turnover rate excludes certain securities received or delivered in-kind.
See accompanying notes which are an integral part of the financial statements.
VIP FundsManager 60% Portfolio Service Class 2
| Years ended December 31, | 2020 | 2019 | 2018 | 2017 | 2016 |
| Selected Per–Share Data | | | | | |
| Net asset value, beginning of period | $10.17 | $10.20 | $12.47 | $11.01 | $11.04 |
| Income from Investment Operations | | | | | |
| Net investment income (loss)A | .09 | .14 | .14 | .11 | .11 |
| Net realized and unrealized gain (loss) | 1.39 | 1.71 | (.86) | 1.72 | .36 |
| Total from investment operations | 1.48 | 1.85 | (.72) | 1.83 | .47 |
| Distributions from net investment income | (.09) | (.14) | (.13) | (.12) | (.12) |
| Distributions from net realized gain | (.25) | (1.74) | (1.42) | (.25) | (.38) |
| Total distributions | (.34) | (1.88) | (1.55) | (.37) | (.50) |
| Net asset value, end of period | $11.31 | $10.17 | $10.20 | $12.47 | $11.01 |
| Total ReturnB,C | 14.92% | 20.25% | (6.51)% | 16.76% | 4.65% |
| Ratios to Average Net AssetsD,E | | | | | |
| Expenses before reductions | .50% | .50% | .50% | .50% | .50% |
| Expenses net of fee waivers, if any | .35% | .35% | .35% | .35% | .35% |
| Expenses net of all reductions | .35% | .35% | .35% | .35% | .35% |
| Net investment income (loss) | .91% | 1.46% | 1.25% | .96% | 1.04% |
| Supplemental Data | | | | | |
| Net assets, end of period (000 omitted) | $656,402 | $594,140 | $533,024 | $585,346 | $507,162 |
| Portfolio turnover rateF | 22%G | 33% | 91% | 47% | 35% |
A Calculated based on average shares outstanding during the period.
B Total returns do not reflect charges attributable to your insurance company's separate account. Inclusion of these charges would reduce the total returns shown.
C Total returns would have been lower if certain expenses had not been reduced during the applicable periods shown.
D Fees and expenses of any underlying mutual funds or exchange-traded funds (ETFs) are not included in the Fund's expense ratio. The Fund indirectly bears its proportionate share of these expenses. For additional expense information related to investments in Fidelity Central Funds, please refer to the "Investments in Fidelity Central Funds" note found in the Notes to Financial Statements section of the most recent Annual or Semi-Annual report.
E Expense ratios reflect operating expenses of the class. Expenses before reductions do not reflect amounts reimbursed, waived, or reduced through arrangements with the investment adviser, brokerage services, or other offset arrangements, if applicable, and do not represent the amount paid by the class during periods when reimbursements, waivers or reductions occur.
F Amount does not include the portfolio activity of any underlying mutual funds or exchange-traded funds (ETFs).
G Portfolio turnover rate excludes certain securities received or delivered in-kind.
See accompanying notes which are an integral part of the financial statements.
VIP FundsManager 60% Portfolio Investor Class
| Years ended December 31, | 2020 | 2019 | 2018 | 2017 | 2016 |
| Selected Per–Share Data | | | | | |
| Net asset value, beginning of period | $10.20 | $10.22 | $12.50 | $11.03 | $11.06 |
| Income from Investment Operations | | | | | |
| Net investment income (loss)A | .11 | .16 | .16 | .13 | .13 |
| Net realized and unrealized gain (loss) | 1.40 | 1.71 | (.87) | 1.73 | .36 |
| Total from investment operations | 1.51 | 1.87 | (.71) | 1.86 | .49 |
| Distributions from net investment income | (.11) | (.15) | (.14) | (.13) | (.14) |
| Distributions from net realized gain | (.25) | (1.74) | (1.42) | (.25) | (.38) |
| Total distributions | (.36) | (1.89) | (1.57)B | (.39)B | (.52) |
| Net asset value, end of period | $11.35 | $10.20 | $10.22 | $12.50 | $11.03 |
| Total ReturnC,D | 15.12% | 20.49% | (6.44)% | 16.99% | 4.79% |
| Ratios to Average Net AssetsE,F | | | | | |
| Expenses before reductions | .25% | .25% | .25% | .25% | .25% |
| Expenses net of fee waivers, if any | .20% | .20% | .20% | .20% | .20% |
| Expenses net of all reductions | .20% | .20% | .20% | .20% | .20% |
| Net investment income (loss) | 1.06% | 1.61% | 1.40% | 1.11% | 1.19% |
| Supplemental Data | | | | | |
| Net assets, end of period (000 omitted) | $5,919,107 | $5,375,333 | $4,777,580 | $5,745,537 | $5,874,515 |
| Portfolio turnover rateG | 22%H | 33% | 91% | 47% | 35% |
A Calculated based on average shares outstanding during the period.
B Total distributions per share do not sum due to rounding.
C Total returns do not reflect charges attributable to your insurance company's separate account. Inclusion of these charges would reduce the total returns shown.
D Total returns would have been lower if certain expenses had not been reduced during the applicable periods shown.
E Fees and expenses of any underlying mutual funds or exchange-traded funds (ETFs) are not included in the Fund's expense ratio. The Fund indirectly bears its proportionate share of these expenses. For additional expense information related to investments in Fidelity Central Funds, please refer to the "Investments in Fidelity Central Funds" note found in the Notes to Financial Statements section of the most recent Annual or Semi-Annual report.
F Expense ratios reflect operating expenses of the class. Expenses before reductions do not reflect amounts reimbursed, waived, or reduced through arrangements with the investment adviser, brokerage services, or other offset arrangements, if applicable, and do not represent the amount paid by the class during periods when reimbursements, waivers or reductions occur.
G Amount does not include the portfolio activity of any underlying mutual funds or exchange-traded funds (ETFs).
H Portfolio turnover rate excludes certain securities received or delivered in-kind.
See accompanying notes which are an integral part of the financial statements.
VIP FundsManager® 70% Portfolio
Investment Summary (Unaudited)
The information in the following tables is based on the direct investments of the Fund.
Top Holdings as of December 31, 2020
| | % of fund's net assets |
| Fidelity Stock Selector All Cap Fund | 40.0 |
| Fidelity U.S. Bond Index Fund | 13.8 |
| Fidelity Overseas Fund | 8.3 |
| Fidelity Inflation-Protected Bond Index Fund | 3.4 |
| Fidelity Low-Priced Stock Fund | 3.3 |
| Fidelity Equity-Income Fund | 2.9 |
| Fidelity U.S. Low Volatility Equity Fund | 2.4 |
| Fidelity International Discovery Fund | 1.9 |
| Fidelity International Capital Appreciation Fund | 1.9 |
| Fidelity Contrafund | 1.6 |
| | 79.5 |
Asset Allocation (% of fund's net assets)
| Period end* |
| | Domestic Equity Funds | 55.6% |
| | International Equity Funds | 23.0% |
| | Bond Funds | 20.2% |
| | Short-Term Funds | 0.9% |
| | Short-Term Investments | 0.3% |

* Futures - (3.5)%
VIP FundsManager® 70% Portfolio
Schedule of Investments December 31, 2020
Showing Percentage of Net Assets
| Equity Funds - 78.6% | | | |
| | | Shares | Value |
| Fidelity Commodity Strategy Fund (a) | | 346,021 | $2,771,627 |
| Fidelity Contrafund (a) | | 1,762,997 | 29,547,831 |
| Fidelity Emerging Asia Fund (a) | | 101,587 | 6,939,423 |
| Fidelity Emerging Markets Discovery Fund (a) | | 420,881 | 7,079,226 |
| Fidelity Emerging Markets Fund (a) | | 550,095 | 25,128,337 |
| Fidelity Equity-Income Fund (a) | | 841,258 | 52,452,406 |
| Fidelity Europe Fund (a) | | 363,599 | 15,405,687 |
| Fidelity Global Commodity Stock Fund (a) | | 1,806,463 | 24,098,218 |
| Fidelity Gold Portfolio (a) | | 573,123 | 16,918,576 |
| Fidelity International Capital Appreciation Fund (a) | | 1,240,021 | 34,336,173 |
| Fidelity International Discovery Fund (a) | | 649,504 | 34,482,157 |
| Fidelity International Enhanced Index Fund (a) | | 2,809,145 | 28,849,917 |
| Fidelity International Small Cap Fund (a) | | 566,871 | 17,363,245 |
| Fidelity International Small Cap Opportunities Fund (a) | | 715,829 | 17,638,017 |
| Fidelity International Value Fund (a) | | 2,651,632 | 22,459,327 |
| Fidelity Japan Fund (a) | | 1,236,643 | 24,807,052 |
| Fidelity Japan Smaller Companies Fund (a) | | 1,002,343 | 17,811,632 |
| Fidelity Large Cap Value Enhanced Index Fund (a) | | 2,088,201 | 29,380,991 |
| Fidelity Low-Priced Stock Fund (a) | | 1,240,010 | 60,301,675 |
| Fidelity Overseas Fund (a) | | 2,571,205 | 152,832,428 |
| Fidelity Pacific Basin Fund (a) | | 367,301 | 16,109,840 |
| Fidelity Real Estate Investment Portfolio (a) | | 59,599 | 2,349,980 |
| Fidelity Stock Selector All Cap Fund (a) | | 12,927,913 | 734,822,564 |
| Fidelity U.S. Low Volatility Equity Fund (a) | | 4,029,408 | 43,235,549 |
| Fidelity Value Discovery Fund (a) | | 808,576 | 26,011,877 |
| TOTAL EQUITY FUNDS | | | |
| (Cost $1,147,419,557) | | | 1,443,133,755 |
|
| Fixed-Income Funds - 20.2% | | | |
| Fidelity High Income Fund (a) | | 2,313,517 | 20,220,136 |
| Fidelity Inflation-Protected Bond Index Fund (a) | | 5,630,923 | 62,165,391 |
| Fidelity Long-Term Treasury Bond Index Fund (a) | | 1,283,850 | 20,477,412 |
| Fidelity New Markets Income Fund (a) | | 990,023 | 14,949,343 |
| Fidelity U.S. Bond Index Fund (a) | | 20,326,646 | 253,066,745 |
| TOTAL FIXED-INCOME FUNDS | | | |
| (Cost $335,704,679) | | | 370,879,027 |
|
| Money Market Funds - 0.9% | | | |
| Fidelity Cash Central Fund 0.11% (b) | | | |
| (Cost $16,877,015) | | 16,873,640 | 16,877,015 |
| | | Principal Amount | Value |
|
| U.S. Treasury Obligations - 0.3% | | | |
| U.S. Treasury Bills, yield at date of purchase 0.06% to 0.09% 2/11/21 to 4/1/21 (c) | | | |
| (Cost $5,589,222) | | 5,590,000 | 5,589,278 |
| TOTAL INVESTMENT IN SECURITIES - 100.0% | | | |
| (Cost $1,505,590,473) | | | 1,836,479,075 |
| NET OTHER ASSETS (LIABILITIES) - 0.0% | | | (870,049) |
| NET ASSETS - 100% | | | $1,835,609,026 |
| Futures Contracts | | | | | |
| | Number of contracts | Expiration Date | Notional Amount | Value | Unrealized Appreciation/(Depreciation) |
| Purchased | | | | | |
| Equity Index Contracts | | | | | |
| ICE E-mini MSCI EAFE Index Contracts (United States) | 120 | March 2021 | $12,784,800 | $222,755 | $222,755 |
| Sold | | | | | |
| Equity Index Contracts | | | | | |
| CME E-mini S&P 500 Index Contracts (United States) | 416 | March 2021 | 77,975,040 | (1,814,688) | (1,814,688) |
| TOTAL FUTURES CONTRACTS | | | | | $(1,591,933) |
The notional amount of futures purchased as a percentage of Net Assets is 0.7%
The notional amount of futures sold as a percentage of Net Assets is 4.2%
For the period, the average monthly notional amount at value for futures contracts in the aggregate was $86,153,309.
Legend
(a) Affiliated Fund
(b) Affiliated fund that is generally available only to investment companies and other accounts managed by Fidelity Investments. The rate quoted is the annualized seven-day yield of the fund at period end. A complete unaudited listing of the fund's holdings as of its most recent quarter end is available upon request. In addition, each Fidelity Central Fund's financial statements, which are not covered by the Fund's Report of Independent Registered Public Accounting Firm, are available on the SEC's website or upon request.
(c) Security or a portion of the security was pledged to cover margin requirements for futures contracts. At period end, the value of securities pledged amounted to $5,589,278.
Affiliated Central Funds
Information regarding fiscal year to date income earned by the Fund from investments in Fidelity Central Funds is as follows:
| Fund | Income earned |
| Fidelity Cash Central Fund | $37,629 |
| Total | $37,629 |
Amounts in the income column in the above table include any capital gain distributions from underlying funds, which are presented in the corresponding line-item in the Statement of Operations, if applicable.
Affiliated Underlying Funds
Fiscal year to date information regarding the Fund's investments in affiliated Underlying Funds, excluding any Money Market Central Funds, is presented below. Exchanges between classes of the same affiliated Underlying Funds may occur.
| Affiliate | Value, beginning of period | Purchases(a) | Sales Proceeds(a) | Dividend Income | Realized Gain (loss) | Change in Unrealized appreciation (depreciation) | Value, end of period |
| Fidelity Commodity Strategy Fund | $2,882,353 | $-- | $-- | $-- | $-- | $(110,726) | $2,771,627 |
| Fidelity Contrafund | 31,563,908 | 3,304,880 | 10,951,398 | 2,300,963 | 1,034,806 | 4,595,635 | 29,547,831 |
| Fidelity Emerging Asia Fund | 5,056,221 | 934,737 | 1,047,903 | 852,739 | (13,296) | 2,009,664 | 6,939,423 |
| Fidelity Emerging Markets Discovery Fund | 8,204,814 | 184,720 | 1,814,680 | 41,611 | (531,462) | 1,035,834 | 7,079,226 |
| Fidelity Emerging Markets Fund | 27,130,006 | 935,149 | 7,534,029 | 345,722 | 59,092 | 4,538,119 | 25,128,337 |
| Fidelity Equity-Income Fund | 32,259,723 | 21,733,199 | 4,418,680 | 1,509,504 | (318,675) | 3,196,839 | 52,452,406 |
| Fidelity Europe Fund | 15,326,274 | 1,834,978 | 3,383,102 | 176,041 | (580,400) | 2,207,937 | 15,405,687 |
| Fidelity Global Commodity Stock Fund | 13,950,313 | 14,168,628 | 4,853,080 | 384,378 | (1,849,695) | 2,682,052 | 24,098,218 |
| Fidelity Gold Portfolio | 24,555,059 | 1,821,390 | 16,571,840 | 786,340 | 4,848,926 | 2,265,041 | 16,918,576 |
| Fidelity High Income Fund | -- | 19,267,090 | 1,302,442 | 628,692 | 15,603 | 2,239,885 | 20,220,136 |
| Fidelity Inflation-Protected Bond Index Fund | 73,633,252 | 6,027,895 | 24,192,575 | 796,202 | 1,439,420 | 5,257,399 | 62,165,391 |
| Fidelity International Capital Appreciation Fund | 9,860,978 | 18,724,163 | 1,968,701 | 437,008 | (22,917) | 7,742,650 | 34,336,173 |
| Fidelity International Discovery Fund | 24,293,262 | 7,279,443 | 2,203,295 | 1,235,224 | (41,927) | 5,154,674 | 34,482,157 |
| Fidelity International Enhanced Index Fund | 28,283,699 | 8,327,402 | 7,891,937 | 462,575 | (1,570,010) | 1,700,763 | 28,849,917 |
| Fidelity International Small Cap Fund | 16,809,087 | 1,954,619 | 2,467,364 | 143,045 | (435,444) | 1,502,347 | 17,363,245 |
| Fidelity International Small Cap Opportunities Fund | 16,365,812 | 1,804,926 | 2,936,952 | -- | (189,667) | 2,593,898 | 17,638,017 |
| Fidelity International Value Fund | 22,132,884 | 2,812,527 | 2,512,217 | 385,452 | (514,861) | 540,994 | 22,459,327 |
| Fidelity Japan Fund | 36,357,727 | 1,550,678 | 16,887,900 | 439,656 | 1,141,589 | 2,644,958 | 24,807,052 |
| Fidelity Japan Smaller Companies Fund | 26,262,226 | 279,131 | 8,709,002 | 279,131 | (1,537,016) | 1,516,293 | 17,811,632 |
| Fidelity Large Cap Value Enhanced Index Fund | 12,550,326 | 16,626,796 | 2,293,623 | 476,729 | (224,172) | 2,721,664 | 29,380,991 |
| Fidelity Long-Term Treasury Bond Index Fund | 16,174,948 | 21,911,899 | 19,962,802 | 651,489 | 4,375,655 | (2,022,288) | 20,477,412 |
| Fidelity Low-Priced Stock Fund | 29,486,047 | 33,527,160 | 4,872,435 | 4,754,496 | (583,525) | 2,744,428 | 60,301,675 |
| Fidelity Mega Cap Stock Fund | 48,368,365 | 492,128 | 40,041,500 | -- | (12,368,483) | 3,549,490 | -- |
| Fidelity New Markets Income Fund | 15,115,710 | 1,176,122 | 1,323,164 | 608,586 | (51,100) | 31,775 | 14,949,343 |
| Fidelity Overseas Fund | 143,675,789 | 17,563,578 | 24,912,234 | 805,440 | (2,069,378) | 18,574,673 | 152,832,428 |
| Fidelity Pacific Basin Fund | 8,654,152 | 5,022,328 | 1,055,878 | 688,916 | (13,766) | 3,503,004 | 16,109,840 |
| Fidelity Real Estate Investment Portfolio | 15,806,856 | 379,105 | 10,127,528 | 122,589 | (3,317,116) | (391,337) | 2,349,980 |
| Fidelity Stock Selector All Cap Fund | 671,994,691 | 67,778,670 | 118,826,189 | 37,142,365 | 4,187,318 | 109,688,074 | 734,822,564 |
| Fidelity U.S. Bond Index Fund | 256,661,866 | 25,546,923 | 40,761,303 | 7,951,198 | 922,097 | 10,697,162 | 253,066,745 |
| Fidelity U.S. Low Volatility Equity Fund | -- | 40,206,903 | 2,506,276 | 263,902 | 97,572 | 5,437,350 | 43,235,549 |
| Fidelity Value Discovery Fund | 15,353,100 | 10,692,681 | 2,186,238 | 253,875 | (173,778) | 2,326,112 | 26,011,877 |
| | $1,648,769,448 | $353,869,848 | $390,516,267 | $64,923,868 | $(8,284,610) | $210,174,363 | $1,814,012,782 |
(a) Includes the value of shares purchased or redeemed through in-kind transactions, if applicable.
Amounts in the income column in the above table include any capital gain distributions from underlying funds, which are presented in the corresponding line-item in the Statement of Operations, if applicable.
Investment Valuation
The following is a summary of the inputs used, as of December 31, 2020, involving the Fund's assets and liabilities carried at fair value. The inputs or methodology used for valuing securities may not be an indication of the risk associated with investing in those securities. For more information on valuation inputs, and their aggregation into the levels used below, please refer to the Investment Valuation section in the accompanying Notes to Financial Statements.
| | Valuation Inputs at Reporting Date: |
| Description | Total | Level 1 | Level 2 | Level 3 |
| Investments in Securities: | | | | |
| Equity Funds | $1,443,133,755 | $1,443,133,755 | $-- | $-- |
| Fixed-Income Funds | 370,879,027 | 370,879,027 | -- | -- |
| Money Market Funds | 16,877,015 | 16,877,015 | -- | -- |
| Other Short-Term Investments and Net Other Assets | 5,589,278 | -- | 5,589,278 | -- |
| Total Investments in Securities: | $1,836,479,075 | $1,830,889,797 | $5,589,278 | $-- |
| Derivative Instruments: | | | | |
| Assets | | | | |
| Futures Contracts | $222,755 | $222,755 | $-- | $-- |
| Total Assets | $222,755 | $222,755 | $-- | $-- |
| Liabilities | | | | |
| Futures Contracts | $(1,814,688) | $(1,814,688) | $-- | $-- |
| Total Liabilities | $(1,814,688) | $(1,814,688) | $-- | $-- |
| Total Derivative Instruments: | $(1,591,933) | $(1,591,933) | $-- | $-- |
Value of Derivative Instruments
The following table is a summary of the Fund's value of derivative instruments by primary risk exposure as of December 31, 2020. For additional information on derivative instruments, please refer to the Derivative Instruments section in the accompanying Notes to Financial Statements.
| Primary Risk Exposure / Derivative Type | Value |
| | Asset | Liability |
| Equity Risk | | |
| Futures Contracts(a) | $222,755 | $(1,814,688) |
| Total Equity Risk | 222,755 | (1,814,688) |
| Total Value of Derivatives | $222,755 | $(1,814,688) |
(a) Reflects gross cumulative appreciation (depreciation) on futures contracts as presented in the Schedule of Investments. In the Statement of Assets and Liabilities, the period end daily variation margin is included in receivable or payable for daily variation margin on futures contracts, and the net cumulative appreciation (depreciation) is included in Total accumulated earnings (loss).
See accompanying notes which are an integral part of the financial statements.
VIP FundsManager® 70% Portfolio
Financial Statements
Statement of Assets and Liabilities
| | | December 31, 2020 |
| Assets | | |
Investment in securities, at value — See accompanying schedule:
Unaffiliated issuers (cost $5,589,222) | $5,589,278 | |
| Fidelity Central Funds (cost $16,877,015) | 16,877,015 | |
| Other affiliated issuers (cost $1,483,124,236) | 1,814,012,782 | |
| Total Investment in Securities (cost $1,505,590,473) | | $1,836,479,075 |
| Receivable for investments sold | | 104,148 |
| Receivable for fund shares sold | | 1,415,744 |
| Distributions receivable from Fidelity Central Funds | | 224 |
| Total assets | | 1,837,999,191 |
| Liabilities | | |
| Payable for investments purchased | $1,306,587 | |
| Payable for fund shares redeemed | 160,003 | |
| Accrued management fee | 300,532 | |
| Distribution and service plan fees payable | 8,163 | |
| Payable for daily variation margin on futures contracts | 614,880 | |
| Total liabilities | | 2,390,165 |
| Net Assets | | $1,835,609,026 |
| Net Assets consist of: | | |
| Paid in capital | | $1,480,239,140 |
| Total accumulated earnings (loss) | | 355,369,886 |
| Net Assets | | $1,835,609,026 |
| Net Asset Value and Maximum Offering Price | | |
| Service Class: | | |
| Net Asset Value, offering price and redemption price per share ($74,885 ÷ 5,386 shares) | | $13.90 |
| Service Class 2: | | |
| Net Asset Value, offering price and redemption price per share ($66,432,597 ÷ 4,802,194 shares) | | $13.83 |
| Investor Class: | | |
| Net Asset Value, offering price and redemption price per share ($1,769,101,544 ÷ 127,284,367 shares) | | $13.90 |
See accompanying notes which are an integral part of the financial statements.
Statement of Operations
| | | Year ended December 31, 2020 |
| Investment Income | | |
| Dividends: | | |
| Unaffiliated issuers | | $14,738 |
| Affiliated issuers | | 18,623,072 |
| Interest | | 13,832 |
| Income from Fidelity Central Funds | | 37,629 |
| Total income | | 18,689,271 |
| Expenses | | |
| Management fee | $4,056,009 | |
| Distribution and service plan fees | 143,543 | |
| Independent trustees' fees and expenses | 5,233 | |
| Total expenses before reductions | 4,204,785 | |
| Expense reductions | (869,705) | |
| Total expenses after reductions | | 3,335,080 |
| Net investment income (loss) | | 15,354,191 |
| Realized and Unrealized Gain (Loss) | | |
| Net realized gain (loss) on: | | |
| Investment securities: | | |
| Unaffiliated issuers | 533,883 | |
| Fidelity Central Funds | (1,012) | |
| Other affiliated issuers | (8,284,610) | |
| Foreign currency transactions | 3,289 | |
| Futures contracts | (14,121,789) | |
| Capital gain distributions from underlying funds: | | |
| Affiliated issuers | 46,300,796 | |
| Total net realized gain (loss) | | 24,430,557 |
| Change in net unrealized appreciation (depreciation) on: | | |
| Investment securities: | | |
| Unaffiliated issuers | (180) | |
| Affiliated issuers | 210,174,363 | |
| Assets and liabilities in foreign currencies | (165) | |
| Futures contracts | (1,085,091) | |
| Total change in net unrealized appreciation (depreciation) | | 209,088,927 |
| Net gain (loss) | | 233,519,484 |
| Net increase (decrease) in net assets resulting from operations | | $248,873,675 |
See accompanying notes which are an integral part of the financial statements.
Statement of Changes in Net Assets
| | Year ended December 31, 2020 | Year ended December 31, 2019 |
| Increase (Decrease) in Net Assets | | |
| Operations | | |
| Net investment income (loss) | $15,354,191 | $22,534,371 |
| Net realized gain (loss) | 24,430,557 | 39,151,527 |
| Change in net unrealized appreciation (depreciation) | 209,088,927 | 248,115,522 |
| Net increase (decrease) in net assets resulting from operations | 248,873,675 | 309,801,420 |
| Distributions to shareholders | (55,277,556) | (209,986,205) |
| Share transactions - net increase (decrease) | (21,002,271) | 181,654,878 |
| Total increase (decrease) in net assets | 172,593,848 | 281,470,093 |
| Net Assets | | |
| Beginning of period | 1,663,015,178 | 1,381,545,085 |
| End of period | $1,835,609,026 | $1,663,015,178 |
See accompanying notes which are an integral part of the financial statements.
Financial Highlights
VIP FundsManager 70% Portfolio Service Class
| Years ended December 31, | 2020 | 2019 | 2018 | 2017 | 2016 |
| Selected Per–Share Data | | | | | |
| Net asset value, beginning of period | $12.37 | $11.71 | $14.04 | $11.97 | $12.05 |
| Income from Investment Operations | | | | | |
| Net investment income (loss)A | .12 | .17 | .17 | .13 | .13 |
| Net realized and unrealized gain (loss) | 1.82 | 2.26 | (1.13) | 2.16 | .41 |
| Total from investment operations | 1.94 | 2.43 | (.96) | 2.29 | .54 |
| Distributions from net investment income | (.12) | (.16) | (.13) | (.12) | (.13) |
| Distributions from net realized gain | (.30) | (1.61) | (1.24) | (.09) | (.49) |
| Total distributions | (.41)B | (1.77) | (1.37) | (.22)B | (.62) |
| Net asset value, end of period | $13.90 | $12.37 | $11.71 | $14.04 | $11.97 |
| Total ReturnC,D | 16.10% | 22.65% | (7.50)% | 19.11% | 5.04% |
| Ratios to Average Net AssetsE,F | | | | | |
| Expenses before reductions | .35% | .35% | .35% | .35% | .35% |
| Expenses net of fee waivers, if any | .20% | .20% | .20% | .20% | .20% |
| Expenses net of all reductions | .20% | .20% | .20% | .20% | .20% |
| Net investment income (loss) | .95% | 1.47% | 1.27% | 1.01% | 1.11% |
| Supplemental Data | | | | | |
| Net assets, end of period (000 omitted) | $75 | $67 | $63 | $76 | $71 |
| Portfolio turnover rateG | 24%H | 39% | 98% | 57% | 45% |
A Calculated based on average shares outstanding during the period.
B Total distributions per share do not sum due to rounding.
C Total returns do not reflect charges attributable to your insurance company's separate account. Inclusion of these charges would reduce the total returns shown.
D Total returns would have been lower if certain expenses had not been reduced during the applicable periods shown.
E Fees and expenses of any underlying mutual funds or exchange-traded funds (ETFs) are not included in the Fund's expense ratio. The Fund indirectly bears its proportionate share of these expenses. For additional expense information related to investments in Fidelity Central Funds, please refer to the "Investments in Fidelity Central Funds" note found in the Notes to Financial Statements section of the most recent Annual or Semi-Annual report.
F Expense ratios reflect operating expenses of the class. Expenses before reductions do not reflect amounts reimbursed, waived, or reduced through arrangements with the investment adviser, brokerage services, or other offset arrangements, if applicable, and do not represent the amount paid by the class during periods when reimbursements, waivers or reductions occur.
G Amount does not include the portfolio activity of any underlying mutual funds or exchange-traded funds (ETFs).
H Portfolio turnover rate excludes certain securities received or delivered in-kind.
See accompanying notes which are an integral part of the financial statements.
VIP FundsManager 70% Portfolio Service Class 2
| Years ended December 31, | 2020 | 2019 | 2018 | 2017 | 2016 |
| Selected Per–Share Data | | | | | |
| Net asset value, beginning of period | $12.31 | $11.67 | $13.99 | $11.93 | $12.02 |
| Income from Investment Operations | | | | | |
| Net investment income (loss)A | .10 | .15 | .15 | .11 | .11 |
| Net realized and unrealized gain (loss) | 1.82 | 2.25 | (1.12) | 2.15 | .41 |
| Total from investment operations | 1.92 | 2.40 | (.97) | 2.26 | .52 |
| Distributions from net investment income | (.10) | (.15) | (.11) | (.10) | (.12) |
| Distributions from net realized gain | (.30) | (1.61) | (1.24) | (.09) | (.49) |
| Total distributions | (.40) | (1.76) | (1.35) | (.20)B | (.61) |
| Net asset value, end of period | $13.83 | $12.31 | $11.67 | $13.99 | $11.93 |
| Total ReturnC,D | 15.94% | 22.39% | (7.60)% | 18.94% | 4.86% |
| Ratios to Average Net AssetsE,F | | | | | |
| Expenses before reductions | .50% | .50% | .50% | .50% | .50% |
| Expenses net of fee waivers, if any | .35% | .35% | .35% | .35% | .35% |
| Expenses net of all reductions | .35% | .35% | .35% | .35% | .35% |
| Net investment income (loss) | .80% | 1.32% | 1.13% | .86% | .96% |
| Supplemental Data | | | | | |
| Net assets, end of period (000 omitted) | $66,433 | $57,129 | $46,406 | $48,977 | $38,443 |
| Portfolio turnover rateG | 24%H | 39% | 98% | 57% | 45% |
A Calculated based on average shares outstanding during the period.
B Total distributions per share do not sum due to rounding.
C Total returns do not reflect charges attributable to your insurance company's separate account. Inclusion of these charges would reduce the total returns shown.
D Total returns would have been lower if certain expenses had not been reduced during the applicable periods shown.
E Fees and expenses of any underlying mutual funds or exchange-traded funds (ETFs) are not included in the Fund's expense ratio. The Fund indirectly bears its proportionate share of these expenses. For additional expense information related to investments in Fidelity Central Funds, please refer to the "Investments in Fidelity Central Funds" note found in the Notes to Financial Statements section of the most recent Annual or Semi-Annual report.
F Expense ratios reflect operating expenses of the class. Expenses before reductions do not reflect amounts reimbursed, waived, or reduced through arrangements with the investment adviser, brokerage services, or other offset arrangements, if applicable, and do not represent the amount paid by the class during periods when reimbursements, waivers or reductions occur.
G Amount does not include the portfolio activity of any underlying mutual funds or exchange-traded funds (ETFs).
H Portfolio turnover rate excludes certain securities received or delivered in-kind.
See accompanying notes which are an integral part of the financial statements.
VIP FundsManager 70% Portfolio Investor Class
| Years ended December 31, | 2020 | 2019 | 2018 | 2017 | 2016 |
| Selected Per–Share Data | | | | | |
| Net asset value, beginning of period | $12.37 | $11.71 | $14.04 | $11.96 | $12.05 |
| Income from Investment Operations | | | | | |
| Net investment income (loss)A | .12 | .17 | .17 | .13 | .13 |
| Net realized and unrealized gain (loss) | 1.82 | 2.26 | (1.13) | 2.17 | .40 |
| Total from investment operations | 1.94 | 2.43 | (.96) | 2.30 | .53 |
| Distributions from net investment income | (.12) | (.16) | (.13) | (.12) | (.13) |
| Distributions from net realized gain | (.30) | (1.61) | (1.24) | (.09) | (.49) |
| Total distributions | (.41)B | (1.77) | (1.37) | (.22)B | (.62) |
| Net asset value, end of period | $13.90 | $12.37 | $11.71 | $14.04 | $11.96 |
| Total ReturnC,D | 16.10% | 22.66% | (7.49)% | 19.21% | 4.96% |
| Ratios to Average Net AssetsE,F | | | | | |
| Expenses before reductions | .25% | .25% | .25% | .25% | .25% |
| Expenses net of fee waivers, if any | .20% | .20% | .20% | .20% | .20% |
| Expenses net of all reductions | .20% | .20% | .20% | .20% | .20% |
| Net investment income (loss) | .95% | 1.47% | 1.28% | 1.01% | 1.11% |
| Supplemental Data | | | | | |
| Net assets, end of period (000 omitted) | $1,769,102 | $1,605,820 | $1,335,076 | $1,426,071 | $1,138,172 |
| Portfolio turnover rateG | 24%H | 39% | 98% | 57% | 45% |
A Calculated based on average shares outstanding during the period.
B Total distributions per share do not sum due to rounding.
C Total returns do not reflect charges attributable to your insurance company's separate account. Inclusion of these charges would reduce the total returns shown.
D Total returns would have been lower if certain expenses had not been reduced during the applicable periods shown.
E Fees and expenses of any underlying mutual funds or exchange-traded funds (ETFs) are not included in the Fund's expense ratio. The Fund indirectly bears its proportionate share of these expenses. For additional expense information related to investments in Fidelity Central Funds, please refer to the "Investments in Fidelity Central Funds" note found in the Notes to Financial Statements section of the most recent Annual or Semi-Annual report.
F Expense ratios reflect operating expenses of the class. Expenses before reductions do not reflect amounts reimbursed, waived, or reduced through arrangements with the investment adviser, brokerage services, or other offset arrangements, if applicable, and do not represent the amount paid by the class during periods when reimbursements, waivers or reductions occur.
G Amount does not include the portfolio activity of any underlying mutual funds or exchange-traded funds (ETFs).
H Portfolio turnover rate excludes certain securities received or delivered in-kind.
See accompanying notes which are an integral part of the financial statements.
VIP FundsManager® 85% Portfolio
Investment Summary (Unaudited)
The information in the following tables is based on the direct investments of the Fund.
Top Holdings as of December 31, 2020
| | % of fund's net assets |
| Fidelity Stock Selector All Cap Fund | 46.8 |
| Fidelity Overseas Fund | 9.2 |
| Fidelity U.S. Bond Index Fund | 4.2 |
| Fidelity Low-Priced Stock Fund | 3.8 |
| Fidelity Equity-Income Fund | 3.2 |
| Fidelity U.S. Low Volatility Equity Fund | 2.6 |
| Fidelity International Capital Appreciation Fund | 2.2 |
| Fidelity International Discovery Fund | 2.2 |
| Fidelity Large Cap Value Enhanced Index Fund | 2.0 |
| Fidelity Value Discovery Fund | 2.0 |
| | 78.2 |
Asset Allocation (% of fund's net assets)
| Period end* |
| | Domestic Equity Funds | 64.6% |
| | International Equity Funds | 25.3% |
| | Bond Funds | 9.3% |
| | Short-Term Funds | 0.6% |
| | Short-Term Investments | 0.3% |
| | Net Other Assets (Liabilities)** | (0.1)% |

* Futures - 0.5%
** Net Other Assets (Liabilities) are not included in the pie chart
VIP FundsManager® 85% Portfolio
Schedule of Investments December 31, 2020
Showing Percentage of Net Assets
| Equity Funds - 89.9% | | | |
| | | Shares | Value |
| Fidelity Commodity Strategy Fund (a) | | 122,729 | $983,062 |
| Fidelity Contrafund (a) | | 628,324 | 10,530,706 |
| Fidelity Emerging Asia Fund (a) | | 33,974 | 2,320,745 |
| Fidelity Emerging Markets Discovery Fund (a) | | 73,407 | 1,234,708 |
| Fidelity Emerging Markets Fund (a) | | 172,039 | 7,858,756 |
| Fidelity Equity-Income Fund (a) | | 343,079 | 21,390,945 |
| Fidelity Europe Fund (a) | | 150,926 | 6,394,729 |
| Fidelity Global Commodity Stock Fund (a) | | 644,845 | 8,602,230 |
| Fidelity Gold Portfolio (a) | | 254,179 | 7,503,351 |
| Fidelity International Capital Appreciation Fund (a) | | 516,064 | 14,289,800 |
| Fidelity International Discovery Fund (a) | | 268,819 | 14,271,596 |
| Fidelity International Enhanced Index Fund (a) | | 1,168,508 | 12,000,581 |
| Fidelity International Small Cap Fund (a) | | 235,481 | 7,212,784 |
| Fidelity International Small Cap Opportunities Fund (a) | | 301,531 | 7,429,735 |
| Fidelity International Value Fund (a) | | 1,097,762 | 9,298,042 |
| Fidelity Japan Fund (a) | | 400,875 | 8,041,544 |
| Fidelity Japan Smaller Companies Fund (a) | | 492,432 | 8,750,519 |
| Fidelity Large Cap Value Enhanced Index Fund (a) | | 954,994 | 13,436,770 |
| Fidelity Low-Priced Stock Fund (a) | | 518,632 | 25,221,078 |
| Fidelity Overseas Fund (a) | | 1,030,366 | 61,244,929 |
| Fidelity Pacific Basin Fund (a) | | 152,758 | 6,699,975 |
| Fidelity Real Estate Investment Portfolio (a) | | 21,138 | 833,482 |
| Fidelity Stock Selector All Cap Fund (a) | | 5,468,068 | 310,804,980 |
| Fidelity U.S. Low Volatility Equity Fund (a) | | 1,608,662 | 17,260,939 |
| Fidelity Value Discovery Fund (a) | | 414,087 | 13,321,192 |
| TOTAL EQUITY FUNDS | | | |
| (Cost $478,963,098) | | | 596,937,178 |
|
| Fixed-Income Funds - 9.3% | | | |
| Fidelity High Income Fund (a) | | 790,881 | 6,912,296 |
| Fidelity Inflation-Protected Bond Index Fund (a) | | 995,838 | 10,994,056 |
| Fidelity Long-Term Treasury Bond Index Fund (a) | | 757,190 | 12,077,176 |
| Fidelity New Markets Income Fund (a) | | 217,140 | 3,278,812 |
| Fidelity U.S. Bond Index Fund (a) | | 2,261,681 | 28,157,930 |
| TOTAL FIXED-INCOME FUNDS | | | |
| (Cost $56,847,821) | | | 61,420,270 |
|
| Money Market Funds - 0.6% | | | |
| Fidelity Cash Central Fund 0.11% (b) | | | |
| (Cost $4,038,670) | | 4,037,863 | 4,038,670 |
| | | Principal Amount | Value |
|
| U.S. Treasury Obligations - 0.3% | | | |
| U.S. Treasury Bills, yield at date of purchase 0.06% to 0.09% 2/11/21 to 4/1/21 (c) | | | |
| (Cost $2,129,718) | | 2,130,000 | 2,129,742 |
| TOTAL INVESTMENT IN SECURITIES - 100.1% | | | |
| (Cost $541,979,307) | | | 664,525,860 |
| NET OTHER ASSETS (LIABILITIES) - (0.1)% | | | (344,388) |
| NET ASSETS - 100% | | | $664,181,472 |
| Futures Contracts | | | | | |
| | Number of contracts | Expiration Date | Notional Amount | Value | Unrealized Appreciation/(Depreciation) |
| Purchased | | | | | |
| Equity Index Contracts | | | | | |
| ICE E-mini MSCI EAFE Index Contracts (United States) | 160 | March 2021 | $17,046,400 | $296,757 | $296,757 |
| Sold | | | | | |
| Equity Index Contracts | | | | | |
| CME E-mini S&P 500 Index Contracts (United States) | 76 | March 2021 | 14,245,440 | (309,829) | (309,829) |
| TOTAL FUTURES CONTRACTS | | | | | $(13,072) |
The notional amount of futures purchased as a percentage of Net Assets is 2.6%
The notional amount of futures sold as a percentage of Net Assets is 2.1%
Legend
(a) Affiliated Fund
(b) Affiliated fund that is generally available only to investment companies and other accounts managed by Fidelity Investments. The rate quoted is the annualized seven-day yield of the fund at period end. A complete unaudited listing of the fund's holdings as of its most recent quarter end is available upon request. In addition, each Fidelity Central Fund's financial statements, which are not covered by the Fund's Report of Independent Registered Public Accounting Firm, are available on the SEC's website or upon request.
(c) Security or a portion of the security was pledged to cover margin requirements for futures contracts. At period end, the value of securities pledged amounted to $2,129,742.
Affiliated Central Funds
Information regarding fiscal year to date income earned by the Fund from investments in Fidelity Central Funds is as follows:
| Fund | Income earned |
| Fidelity Cash Central Fund | $34,333 |
| Total | $34,333 |
Amounts in the income column in the above table include any capital gain distributions from underlying funds, which are presented in the corresponding line-item in the Statement of Operations, if applicable.
Affiliated Underlying Funds
Fiscal year to date information regarding the Fund's investments in affiliated Underlying Funds, excluding any Money Market Central Funds, is presented below. Exchanges between classes of the same affiliated Underlying Funds may occur.
| Affiliate | Value, beginning of period | Purchases(a) | Sales Proceeds(a) | Dividend Income | Realized Gain (loss) | Change in Unrealized appreciation (depreciation) | Value, end of period |
| Fidelity Commodity Strategy Fund | $1,022,335 | $-- | $-- | $-- | $-- | $(39,273) | $983,062 |
| Fidelity Contrafund | 12,817,014 | 1,547,136 | 6,211,532 | 819,145 | 907,182 | 1,470,906 | 10,530,706 |
| Fidelity Emerging Asia Fund | 1,835,875 | 333,913 | 547,305 | 283,591 | 25,592 | 672,670 | 2,320,745 |
| Fidelity Emerging Markets Discovery Fund | 2,048,755 | 92,292 | 904,897 | 7,161 | (160,411) | 158,969 | 1,234,708 |
| Fidelity Emerging Markets Fund | 9,739,835 | 462,521 | 3,814,446 | 106,946 | (71,796) | 1,542,642 | 7,858,756 |
| Fidelity Equity-Income Fund | 13,133,858 | 9,068,858 | 1,984,152 | 619,536 | (134,113) | 1,306,494 | 21,390,945 |
| Fidelity Europe Fund | 6,470,857 | 977,606 | 1,712,304 | 72,246 | (251,113) | 909,683 | 6,394,729 |
| Fidelity Global Commodity Stock Fund | 3,624,269 | 5,672,120 | 1,493,009 | 135,494 | (214,407) | 1,013,257 | 8,602,230 |
| Fidelity Gold Portfolio | 9,121,384 | 2,342,948 | 6,430,015 | 339,385 | 1,375,251 | 1,093,783 | 7,503,351 |
| Fidelity High Income Fund | -- | 6,800,822 | 673,290 | 215,581 | 16,950 | 767,814 | 6,912,296 |
| Fidelity Inflation-Protected Bond Index Fund | 4,364,655 | 21,333,518 | 15,900,828 | 139,699 | 422,611 | 774,100 | 10,994,056 |
| Fidelity International Capital Appreciation Fund | 4,167,722 | 8,003,903 | 1,104,500 | 179,816 | 19,284 | 3,203,391 | 14,289,800 |
| Fidelity International Discovery Fund | 12,382,452 | 2,217,563 | 2,147,774 | 505,472 | (152,296) | 1,971,651 | 14,271,596 |
| Fidelity International Enhanced Index Fund | 12,707,672 | 1,961,599 | 2,910,709 | 193,396 | (456,750) | 698,769 | 12,000,581 |
| Fidelity International Small Cap Fund | 6,676,483 | 1,046,867 | 1,022,711 | 58,760 | (110,534) | 622,679 | 7,212,784 |
| Fidelity International Small Cap Opportunities Fund | 6,490,555 | 975,783 | 1,105,726 | -- | (83,128) | 1,152,251 | 7,429,735 |
| Fidelity International Value Fund | 9,826,822 | 1,471,892 | 1,828,368 | 157,825 | (381,889) | 209,585 | 9,298,042 |
| Fidelity Japan Fund | 7,352,688 | 3,788,837 | 4,959,682 | 140,493 | 397,882 | 1,461,819 | 8,041,544 |
| Fidelity Japan Smaller Companies Fund | 11,400,061 | 137,132 | 2,867,058 | 137,132 | (545,099) | 625,483 | 8,750,519 |
| Fidelity Large Cap Value Enhanced Index Fund | 8,037,110 | 5,798,999 | 1,200,313 | 219,179 | (86,289) | 887,263 | 13,436,770 |
| Fidelity Long-Term Treasury Bond Index Fund | 8,405,881 | 13,063,864 | 10,610,505 | 374,926 | 2,194,283 | (976,347) | 12,077,176 |
| Fidelity Low-Priced Stock Fund | 11,925,022 | 14,632,672 | 2,228,587 | 2,001,060 | (166,487) | 1,058,458 | 25,221,078 |
| Fidelity Mega Cap Stock Fund | 19,642,259 | 502,168 | 16,472,923 | -- | (5,149,045) | 1,477,541 | -- |
| Fidelity New Markets Income Fund | -- | 5,125,273 | 2,726,667 | 162,313 | 319,862 | 560,344 | 3,278,812 |
| Fidelity Overseas Fund | 62,170,629 | 9,251,257 | 16,501,271 | 318,878 | (759,130) | 7,083,444 | 61,244,929 |
| Fidelity Pacific Basin Fund | 3,648,910 | 2,150,883 | 557,083 | 283,435 | 7,856 | 1,449,409 | 6,699,975 |
| Fidelity Real Estate Investment Portfolio | 5,230,414 | 223,577 | 3,389,104 | 43,295 | (1,111,981) | (119,424) | 833,482 |
| Fidelity Stock Selector All Cap Fund | 286,115,059 | 36,985,692 | 58,900,822 | 15,421,965 | 1,269,925 | 45,335,126 | 310,804,980 |
| Fidelity U.S. Bond Index Fund | 32,621,317 | 16,312,263 | 21,992,577 | 826,680 | 877,090 | 339,837 | 28,157,930 |
| Fidelity U.S. Low Volatility Equity Fund | -- | 16,423,650 | 1,386,152 | 105,932 | 57,930 | 2,165,511 | 17,260,939 |
| Fidelity Value Discovery Fund | 6,198,738 | 6,940,325 | 1,146,110 | 131,087 | (68,025) | 1,396,264 | 13,321,192 |
| | $579,178,631 | $195,645,933 | $194,730,420 | $24,000,428 | $(2,010,795) | $80,274,099 | $658,357,448 |
(a) Includes the value of shares purchased or redeemed through in-kind transactions, if applicable.
Amounts in the income column in the above table include any capital gain distributions from underlying funds, which are presented in the corresponding line-item in the Statement of Operations, if applicable.
Investment Valuation
The following is a summary of the inputs used, as of December 31, 2020, involving the Fund's assets and liabilities carried at fair value. The inputs or methodology used for valuing securities may not be an indication of the risk associated with investing in those securities. For more information on valuation inputs, and their aggregation into the levels used below, please refer to the Investment Valuation section in the accompanying Notes to Financial Statements.
| | Valuation Inputs at Reporting Date: |
| Description | Total | Level 1 | Level 2 | Level 3 |
| Investments in Securities: | | | | |
| Equity Funds | $596,937,178 | $596,937,178 | $-- | $-- |
| Fixed-Income Funds | 61,420,270 | 61,420,270 | -- | -- |
| Money Market Funds | 4,038,670 | 4,038,670 | -- | -- |
| Other Short-Term Investments and Net Other Assets | 2,129,742 | -- | 2,129,742 | -- |
| Total Investments in Securities: | $664,525,860 | $662,396,118 | $2,129,742 | $-- |
| Derivative Instruments: | | | | |
| Assets | | | | |
| Futures Contracts | $296,757 | $296,757 | $-- | $-- |
| Total Assets | $296,757 | $296,757 | $-- | $-- |
| Liabilities | | | | |
| Futures Contracts | $(309,829) | $(309,829) | $-- | $-- |
| Total Liabilities | $(309,829) | $(309,829) | $-- | $-- |
| Total Derivative Instruments: | $(13,072) | $(13,072) | $-- | $-- |
Value of Derivative Instruments
The following table is a summary of the Fund's value of derivative instruments by primary risk exposure as of December 31, 2020. For additional information on derivative instruments, please refer to the Derivative Instruments section in the accompanying Notes to Financial Statements.
| Primary Risk Exposure / Derivative Type | Value |
| | Asset | Liability |
| Equity Risk | | |
| Futures Contracts(a) | $296,757 | $(309,829) |
| Total Equity Risk | 296,757 | (309,829) |
| Total Value of Derivatives | $296,757 | $(309,829) |
(a) Reflects gross cumulative appreciation (depreciation) on futures contracts as presented in the Schedule of Investments. In the Statement of Assets and Liabilities, the period end daily variation margin is included in receivable or payable for daily variation margin on futures contracts, and the net cumulative appreciation (depreciation) is included in Total accumulated earnings (loss).
See accompanying notes which are an integral part of the financial statements.
VIP FundsManager® 85% Portfolio
Financial Statements
Statement of Assets and Liabilities
| | | December 31, 2020 |
| Assets | | |
Investment in securities, at value — See accompanying schedule:
Unaffiliated issuers (cost $2,129,718) | $2,129,742 | |
| Fidelity Central Funds (cost $4,038,670) | 4,038,670 | |
| Other affiliated issuers (cost $535,810,919) | 658,357,448 | |
| Total Investment in Securities (cost $541,979,307) | | $664,525,860 |
| Receivable for investments sold | | 11,341 |
| Receivable for fund shares sold | | 129,195 |
| Distributions receivable from Fidelity Central Funds | | 312 |
| Total assets | | 664,666,708 |
| Liabilities | | |
| Payable for investments purchased | $90,449 | |
| Payable for fund shares redeemed | 49,318 | |
| Accrued management fee | 108,463 | |
| Distribution and service plan fees payable | 5,926 | |
| Payable for daily variation margin on futures contracts | 231,080 | |
| Total liabilities | | 485,236 |
| Net Assets | | $664,181,472 |
| Net Assets consist of: | | |
| Paid in capital | | $529,067,543 |
| Total accumulated earnings (loss) | | 135,113,929 |
| Net Assets | | $664,181,472 |
| Net Asset Value and Maximum Offering Price | | |
| Service Class: | | |
| Net Asset Value, offering price and redemption price per share ($47 ÷ 3.385 shares) | | $13.88 |
| Service Class 2: | | |
| Net Asset Value, offering price and redemption price per share ($48,373,336 ÷ 3,516,122.581 shares) | | $13.76 |
| Investor Class: | | |
| Net Asset Value, offering price and redemption price per share ($615,808,089 ÷ 44,432,361.346 shares) | | $13.86 |
See accompanying notes which are an integral part of the financial statements.
Statement of Operations
| | | Year ended December 31, 2020 |
| Investment Income | | |
| Dividends: | | |
| Unaffiliated issuers | | $6,002 |
| Affiliated issuers | | 5,906,732 |
| Interest | | 6,941 |
| Income from Fidelity Central Funds | | 34,333 |
| Total income | | 5,954,008 |
| Expenses | | |
| Management fee | $1,439,982 | |
| Distribution and service plan fees | 102,657 | |
| Independent trustees' fees and expenses | 1,853 | |
| Total expenses before reductions | 1,544,492 | |
| Expense reductions | (329,511) | |
| Total expenses after reductions | | 1,214,981 |
| Net investment income (loss) | | 4,739,027 |
| Realized and Unrealized Gain (Loss) | | |
| Net realized gain (loss) on: | | |
| Investment securities: | | |
| Unaffiliated issuers | 247,673 | |
| Fidelity Central Funds | 906 | |
| Other affiliated issuers | (2,010,795) | |
| Foreign currency transactions | 1,252 | |
| Futures contracts | (4,015,692) | |
| Capital gain distributions from underlying funds: | | |
| Affiliated issuers | 18,093,696 | |
| Total net realized gain (loss) | | 12,317,040 |
| Change in net unrealized appreciation (depreciation) on: | | |
| Investment securities: | | |
| Unaffiliated issuers | (116) | |
| Fidelity Central Funds | (60) | |
| Other affiliated issuers | 80,274,099 | |
| Assets and liabilities in foreign currencies | (50) | |
| Futures contracts | 26,532 | |
| Total change in net unrealized appreciation (depreciation) | | 80,300,405 |
| Net gain (loss) | | 92,617,445 |
| Net increase (decrease) in net assets resulting from operations | | $97,356,472 |
See accompanying notes which are an integral part of the financial statements.
Statement of Changes in Net Assets
| | Year ended December 31, 2020 | Year ended December 31, 2019 |
| Increase (Decrease) in Net Assets | | |
| Operations | | |
| Net investment income (loss) | $4,739,027 | $7,097,030 |
| Net realized gain (loss) | 12,317,040 | 18,587,755 |
| Change in net unrealized appreciation (depreciation) | 80,300,405 | 100,139,500 |
| Net increase (decrease) in net assets resulting from operations | 97,356,472 | 125,824,285 |
| Distributions to shareholders | (23,811,795) | (89,622,619) |
| Share transactions - net increase (decrease) | 782,960 | 62,742,150 |
| Total increase (decrease) in net assets | 74,327,637 | 98,943,816 |
| Net Assets | | |
| Beginning of period | 589,853,835 | 490,910,019 |
| End of period | $664,181,472 | $589,853,835 |
See accompanying notes which are an integral part of the financial statements.
Financial Highlights
VIP FundsManager 85% Portfolio Service Class
| Years ended December 31, | 2020 | 2019 | 2018 | 2017 | 2016 |
| Selected Per–Share Data | | | | | |
| Net asset value, beginning of period | $12.25 | $11.65 | $14.30 | $11.81 | $11.87 |
| Income from Investment Operations | | | | | |
| Net investment income (loss)A | .09 | .15 | .15 | .11 | .11 |
| Net realized and unrealized gain (loss) | 2.04 | 2.58 | (1.29) | 2.61 | .48 |
| Total from investment operations | 2.13 | 2.73 | (1.14) | 2.72 | .59 |
| Distributions from net investment income | (.10) | (.14) | (.10) | (.10) | (.11) |
| Distributions from net realized gain | (.39) | (1.99) | (1.41) | (.13) | (.54) |
| Total distributions | (.50)B | (2.13) | (1.51) | (.23) | (.65) |
| Net asset value, end of period | $13.88 | $12.25 | $11.65 | $14.30 | $11.81 |
| Total ReturnC,D | 17.93% | 26.05% | (8.90)% | 23.05% | 5.66% |
| Ratios to Average Net AssetsE,F | | | | | |
| Expenses before reductions | .25% | .25% | .33%G | .35% | .35% |
| Expenses net of fee waivers, if any | .20% | .20% | .17%G | .20% | .20% |
| Expenses net of all reductions | .20% | .20% | .17%G | .20% | .20% |
| Net investment income (loss) | .82% | 1.26% | 1.11% | .81% | .96% |
| Supplemental Data | | | | | |
| Net assets, end of period (000 omitted) | $– | $– | $– | $2 | $8 |
| Portfolio turnover rateH | 37%I | 38% | 116% | 70% | 59% |
A Calculated based on average shares outstanding during the period.
B Total distributions per share do not sum due to rounding.
C Total returns do not reflect charges attributable to your insurance company's separate account. Inclusion of these charges would reduce the total returns shown.
D Total returns would have been lower if certain expenses had not been reduced during the applicable periods shown.
E Fees and expenses of any underlying mutual funds or exchange-traded funds (ETFs) are not included in the Fund's expense ratio. The Fund indirectly bears its proportionate share of these expenses. For additional expense information related to investments in Fidelity Central Funds, please refer to the "Investments in Fidelity Central Funds" note found in the Notes to Financial Statements section of the most recent Annual or Semi-Annual report.
F Expense ratios reflect operating expenses of the class. Expenses before reductions do not reflect amounts reimbursed, waived, or reduced through arrangements with the investment adviser, brokerage services, or other offset arrangements, if applicable, and do not represent the amount paid by the class during periods when reimbursements, waivers or reductions occur.
G On certain classes, the size and fluctuation of net assets and expense amounts may cause ratios to differ from contractual rates.
H Amount does not include the portfolio activity of any underlying mutual funds or exchange-traded funds (ETFs).
I Portfolio turnover rate excludes certain securities received or delivered in-kind.
See accompanying notes which are an integral part of the financial statements.
VIP FundsManager 85% Portfolio Service Class 2
| Years ended December 31, | 2020 | 2019 | 2018 | 2017 | 2016 |
| Selected Per–Share Data | | | | | |
| Net asset value, beginning of period | $12.20 | $11.59 | $14.24 | $11.76 | $11.83 |
| Income from Investment Operations | | | | | |
| Net investment income (loss)A | .08 | .13 | .12 | .09 | .09 |
| Net realized and unrealized gain (loss) | 1.96 | 2.60 | (1.28) | 2.60 | .47 |
| Total from investment operations | 2.04 | 2.73 | (1.16) | 2.69 | .56 |
| Distributions from net investment income | (.09) | (.13) | (.09) | (.08) | (.09) |
| Distributions from net realized gain | (.39) | (1.99) | (1.41) | (.13) | (.54) |
| Total distributions | (.48) | (2.12) | (1.49)B | (.21) | (.63) |
| Net asset value, end of period | $13.76 | $12.20 | $11.59 | $14.24 | $11.76 |
| Total ReturnC,D | 17.27% | 26.14% | (9.08)% | 22.90% | 5.47% |
| Ratios to Average Net AssetsE,F | | | | | |
| Expenses before reductions | .50% | .50% | .50% | .50%�� | .50% |
| Expenses net of fee waivers, if any | .35% | .35% | .35% | .35% | .35% |
| Expenses net of all reductions | .35% | .35% | .35% | .35% | .35% |
| Net investment income (loss) | .68% | 1.16% | .93% | .66% | .81% |
| Supplemental Data | | | | | |
| Net assets, end of period (000 omitted) | $48,373 | $40,928 | $31,555 | $33,540 | $24,790 |
| Portfolio turnover rateG | 37%H | 38% | 116% | 70% | 59% |
A Calculated based on average shares outstanding during the period.
B Total distributions per share do not sum due to rounding.
C Total returns do not reflect charges attributable to your insurance company's separate account. Inclusion of these charges would reduce the total returns shown.
D Total returns would have been lower if certain expenses had not been reduced during the applicable periods shown.
E Fees and expenses of any underlying mutual funds or exchange-traded funds (ETFs) are not included in the Fund's expense ratio. The Fund indirectly bears its proportionate share of these expenses. For additional expense information related to investments in Fidelity Central Funds, please refer to the "Investments in Fidelity Central Funds" note found in the Notes to Financial Statements section of the most recent Annual or Semi-Annual report.
F Expense ratios reflect operating expenses of the class. Expenses before reductions do not reflect amounts reimbursed, waived, or reduced through arrangements with the investment adviser, brokerage services, or other offset arrangements, if applicable, and do not represent the amount paid by the class during periods when reimbursements, waivers or reductions occur.
G Amount does not include the portfolio activity of any underlying mutual funds or exchange-traded funds (ETFs).
H Portfolio turnover rate excludes certain securities received or delivered in-kind.
See accompanying notes which are an integral part of the financial statements.
VIP FundsManager 85% Portfolio Investor Class
| Years ended December 31, | 2020 | 2019 | 2018 | 2017 | 2016 |
| Selected Per–Share Data | | | | | |
| Net asset value, beginning of period | $12.28 | $11.66 | $14.31 | $11.81 | $11.87 |
| Income from Investment Operations | | | | | |
| Net investment income (loss)A | .10 | .15 | .14 | .11 | .11 |
| Net realized and unrealized gain (loss) | 1.98 | 2.60 | (1.28) | 2.62 | .48 |
| Total from investment operations | 2.08 | 2.75 | (1.14) | 2.73 | .59 |
| Distributions from net investment income | (.10) | (.14) | (.10) | (.10) | (.11) |
| Distributions from net realized gain | (.39) | (1.99) | (1.41) | (.13) | (.54) |
| Total distributions | (.50)B | (2.13) | (1.51) | (.23) | (.65) |
| Net asset value, end of period | $13.86 | $12.28 | $11.66 | $14.31 | $11.81 |
| Total ReturnC,D | 17.46% | 26.21% | (8.89)% | 23.13% | 5.66% |
| Ratios to Average Net AssetsE,F | | | | | |
| Expenses before reductions | .25% | .25% | .25% | .25% | .25% |
| Expenses net of fee waivers, if any | .20% | .20% | .20% | .20% | .20% |
| Expenses net of all reductions | .20% | .20% | .20% | .20% | .20% |
| Net investment income (loss) | .83% | 1.31% | 1.08% | .81% | .96% |
| Supplemental Data | | | | | |
| Net assets, end of period (000 omitted) | $615,808 | $548,925 | $459,354 | $492,831 | $407,244 |
| Portfolio turnover rateG | 37%H | 38% | 116% | 70% | 59% |
A Calculated based on average shares outstanding during the period.
B Total distributions per share do not sum due to rounding.
C Total returns do not reflect charges attributable to your insurance company's separate account. Inclusion of these charges would reduce the total returns shown.
D Total returns would have been lower if certain expenses had not been reduced during the applicable periods shown.
E Fees and expenses of any underlying mutual funds or exchange-traded funds (ETFs) are not included in the Fund's expense ratio. The Fund indirectly bears its proportionate share of these expenses. For additional expense information related to investments in Fidelity Central Funds, please refer to the "Investments in Fidelity Central Funds" note found in the Notes to Financial Statements section of the most recent Annual or Semi-Annual report.
F Expense ratios reflect operating expenses of the class. Expenses before reductions do not reflect amounts reimbursed, waived, or reduced through arrangements with the investment adviser, brokerage services, or other offset arrangements, if applicable, and do not represent the amount paid by the class during periods when reimbursements, waivers or reductions occur.
G Amount does not include the portfolio activity of any underlying mutual funds or exchange-traded funds (ETFs).
H Portfolio turnover rate excludes certain securities received or delivered in-kind.
See accompanying notes which are an integral part of the financial statements.
Notes to Financial Statements
For the period ended December 31, 2020
1. Organization.
VIP FundsManager 20% Portfolio, VIP FundsManager 50% Portfolio, VIP FundsManager 60% Portfolio, VIP FundsManager 70% Portfolio, and VIP FundsManager 85% Portfolio (the Funds) are funds of Variable Insurance Products Fund V (the Trust). The Trust is registered under the Investment Company Act of 1940, as amended (the 1940 Act), as an open-end management investment company organized as a Massachusetts business trust. Each Fund is authorized to issue an unlimited number of shares. Shares of each Fund may only be purchased by insurance companies for the purpose of funding variable annuity or variable life insurance contracts. Each Fund offers three classes of shares: Service Class shares, Service Class 2 shares, and Investor Class shares. All classes have equal rights and voting privileges, except for matters affecting a single class.
Effective January 1, 2020:
Investment advisers Fidelity Investments Money Management, Inc., FMR Co., Inc., and Fidelity SelectCo, LLC, merged with and into Fidelity Management & Research Company. In connection with the merger transactions, the resulting, merged investment adviser was then redomiciled from Massachusetts to Delaware, changed its corporate structure from a corporation to a limited liability company, and changed its name to "Fidelity Management & Research Company LLC".
Broker-dealer Fidelity Distributors Corporation merged with and into Fidelity Investments Institutional Services Company, Inc. ("FIISC"). FIISC was then redomiciled from Massachusetts to Delaware, changed its corporate structure from a corporation to a limited liability company, and changed its name to "Fidelity Distributors Company LLC".
2. Investments in Fidelity Central Funds.
The Funds invest in Fidelity Central Funds, which are open-end investment companies generally available only to other investment companies and accounts managed by the investment adviser and its affiliates. The Funds' Schedules of Investments list each of the Fidelity Central Funds held as of period end, if any, as an investment of each Fund, but does not include the underlying holdings of each Fidelity Central Fund. As an Investing Fund, each Fund indirectly bears its proportionate share of the expenses of the underlying Fidelity Central Funds.
The Money Market Central Funds seek preservation of capital and current income and are managed by the investment adviser. Annualized expenses of the Money Market Central Funds as of their most recent shareholder report date ranged from less than .005% to .01%.
A complete unaudited list of holdings for each Fidelity Central Fund is available upon request or at the Securities and Exchange Commission (the SEC) website at www.sec.gov. In addition, the financial statements of the Fidelity Central Funds, which are not covered by the Funds' Report of Independent Registered Public Accounting Firm, are available on the SEC website or upon request.
3. Significant Accounting Policies.
Each Fund is an investment company and applies the accounting and reporting guidance of the Financial Accounting Standards Board (FASB) Accounting Standards Codification Topic 946 Financial Services - Investment Companies. The financial statements have been prepared in conformity with accounting principles generally accepted in the United States of America (GAAP), which require management to make certain estimates and assumptions at the date of the financial statements. Actual results could differ from those estimates. Subsequent events, if any, through the date that the financial statements were issued have been evaluated in the preparation of the financial statements. The following summarizes the significant accounting policies of the Funds:
Investment Valuation. Investments are valued as of 4:00 p.m. Eastern time on the last calendar day of the period. The Board of Trustees (the Board) has delegated the day to day responsibility for the valuation of each Fund's investments to the Fair Value Committee (the Committee) established by each Fund's investment adviser. In accordance with valuation policies and procedures approved by the Board, each Fund attempts to obtain prices from one or more third party pricing vendors or brokers to value its investments. When current market prices, quotations or currency exchange rates are not readily available or reliable, investments will be fair valued in good faith by the Committee, in accordance with procedures adopted by the Board. Factors used in determining fair value vary by investment type and may include market or investment specific events, changes in interest rates and credit quality. The frequency with which these procedures are used cannot be predicted and they may be utilized to a significant extent. The Committee oversees each Fund's valuation policies and procedures and reports to the Board on the Committee's activities and fair value determinations. The Board monitors the appropriateness of the procedures used in valuing each Fund's investments and ratifies the fair value determinations of the Committee. Each Fund categorizes the inputs to valuation techniques used to value its investments into a disclosure hierarchy consisting of three levels as shown below:
- Level 1 – quoted prices in active markets for identical investments
- Level 2 – other significant observable inputs (including quoted prices for similar investments, interest rates, prepayment speeds, etc.)
- Level 3 – unobservable inputs (including the Fund's own assumptions based on the best information available)
Valuation techniques used to value each Fund's investments by major category are as follows. Investments in open-end mutual funds are valued at their closing net asset value (NAV) each business day and are categorized as Level 1 in the hierarchy. Debt securities, including restricted securities, are valued based on evaluated prices received from third party pricing vendors or from brokers who make markets in such securities. U.S. government and government agency obligations are valued by pricing vendors who utilize matrix pricing which considers yield or price of bonds of comparable quality, coupon, maturity and type or by broker-supplied prices. When independent prices are unavailable or unreliable, debt securities may be valued utilizing pricing methodologies which consider similar factors that would be used by third party pricing vendors. Debt securities are generally categorized as Level 2 in the hierarchy but may be Level 3 depending on the circumstances. The aggregate value of investments by input level as of December 31, 2020 is included at the end of each Fund's Schedule of Investments.
Futures contracts are valued at the settlement price established each day by the board of trade or exchange on which they are traded and are categorized as Level 1 in the hierarchy.
Foreign Currency. Certain Funds may use foreign currency contracts to facilitate transactions in foreign-denominated securities. Gains and losses from these transactions may arise from changes in the value of the foreign currency or if the counterparties do not perform under the contracts' terms.
Foreign-denominated assets, including investment securities, and liabilities are translated into U.S. dollars at the exchange rates at period end. Purchases and sales of investment securities, income and dividends received, and expenses denominated in foreign currencies are translated into U.S. dollars at the exchange rate in effect on the transaction date.
The effects of exchange rate fluctuations on investments are included with the net realized and unrealized gain (loss) on investment securities. Other foreign currency transactions resulting in realized and unrealized gain (loss) are disclosed separately.
Investment Transactions and Income. For financial reporting purposes, the Funds' investment holdings and NAV include trades executed through the end of the last business day of the period. The NAV per share for processing shareholder transactions is calculated as of the close of business of the New York Stock Exchange (NYSE), normally 4:00 p.m. Eastern time and includes trades executed through the end of the prior business day. Gains and losses on securities sold are determined on the basis of identified cost. Dividend income is recorded on the ex-dividend date, except for certain dividends from foreign securities where the ex-dividend date may have passed, which are recorded as soon as the Funds are informed of the ex-dividend date. Income and capital gain distributions from any underlying mutual funds or exchange-traded funds (ETFs) are recorded on the ex-dividend date. Certain distributions received by the Funds represent a return of capital or capital gain. The Funds determine the components of these distributions subsequent to the ex-dividend date, based upon receipt of tax filings or other correspondence relating to the underlying investment. These distributions are recorded as a reduction of cost of investments and/or as a realized gain. Interest income is accrued as earned. Interest income includes coupon interest and amortization of premium and accretion of discount on debt securities as applicable.
Class Allocations and Expenses. Investment income, realized and unrealized capital gains and losses, common expenses of each Fund, and certain fund-level expense reductions, if any, are allocated daily on a pro-rata basis to each class based on the relative net assets of each class to the total net assets of each Fund. Each class differs with respect to distribution and service plan fees incurred. Certain expense reductions may also differ by class. For the reporting period, the allocated portion of income and expenses to each class as a percent of its average net assets may vary due to the timing of recording these transactions in relation to fluctuating net assets of the classes. Expenses directly attributable to a fund are charged to that fund. Expenses attributable to more than one fund are allocated among the respective funds on the basis of relative net assets or other appropriate methods. Expenses included in the accompanying financial statements reflect the expenses of each Fund and do not include any expenses associated with any underlying mutual funds or exchange-traded funds (ETFs). Although not included in each Fund's expenses, each Fund indirectly bears its proportionate share of any underlying mutual funds or exchange-traded funds (ETFs) expenses through the impact of these expenses on each underlying mutual fund's or exchange-traded fund's (ETFs) NAV. Expense estimates are accrued in the period to which they relate and adjustments are made when actual amounts are known.
Income Tax Information and Distributions to Shareholders. Each year, each Fund intends to qualify as a regulated investment company under Subchapter M of the Internal Revenue Code, including distributing substantially all of its taxable income and realized gains. As a result, no provision for U.S. Federal income taxes is required. As of December 31, 2020, each Fund did not have any unrecognized tax benefits in the financial statements; nor is each Fund aware of any tax positions for which it is reasonably possible that the total amounts of unrecognized tax benefits will significantly change in the next twelve months. Each Fund files a U.S. federal tax return, in addition to state and local tax returns as required. Each Fund's federal income tax returns are subject to examination by the Internal Revenue Service (IRS) for a period of three fiscal years after they are filed. State and local tax returns may be subject to examination for an additional fiscal year depending on the jurisdiction. Foreign taxes are provided for based on each Fund's understanding of the tax rules and rates that exist in the foreign markets in which it invests.
Distributions are declared and recorded on the ex-dividend date. Income and capital gain distributions are declared separately for each class. Income and capital gain distributions are determined in accordance with income tax regulations, which may differ from GAAP.
Capital accounts within the financial statements are adjusted for permanent book-tax differences. These adjustments have no impact on net assets or the results of operations. Capital accounts are not adjusted for temporary book-tax differences which will reverse in a subsequent period.
Book-tax differences are primarily due to the short-term gain distributions from the underlying mutual funds or exchange-traded funds (ETFs), futures contracts, foreign currency transactions, market discount and losses deferred due to wash sales.
As of period end, the cost and unrealized appreciation (depreciation) in securities, and derivatives if applicable, for federal income tax purposes were as follows for each Fund:
| | Tax cost | Gross unrealized appreciation | Gross unrealized depreciation | Net unrealized appreciation (depreciation) |
| VIP FundsManager 20% Portfolio | $845,633,305 | $91,041,782 | $(1,707,241) | $89,334,541 |
| VIP FundsManager 50% Portfolio | 4,937,107,303 | 923,913,519 | (12,077,063) | 911,836,456 |
| VIP FundsManager 60% Portfolio | 5,480,588,078 | 1,142,253,967 | (15,429,440) | 1,126,824,527 |
| VIP FundsManager 70% Portfolio | 1,508,369,370 | 332,672,883 | (4,563,178) | 328,109,705 |
| VIP FundsManager 85% Portfolio | 543,771,759 | 122,752,473 | (1,998,372) | 120,754,101 |
The tax-based components of distributable earnings as of period end were as follows for each Fund:
| | Undistributed ordinary income | Undistributed long-term capital gain | Net unrealized appreciation (depreciation) on securities and other investments |
| VIP FundsManager 20% Portfolio | $2,290,797 | $878,770 | $89,334,541 |
| VIP FundsManager 50% Portfolio | 27,829,363 | 79,373,360 | 911,836,456 |
| VIP FundsManager 60% Portfolio | 34,419,451 | 82,311,772 | 1,126,824,527 |
| VIP FundsManager 70% Portfolio | 10,983,278 | 16,276,902 | 328,109,705 |
| VIP FundsManager 85% Portfolio | 4,440,193 | 9,919,634 | 120,754,101 |
The tax character of distributions paid was as follows:
| December 31, 2020 | | | |
| | Ordinary Income | Long-term Capital Gains | Total |
| VIP FundsManager 20% Portfolio | $12,763,590 | $2,732,614 | $15,496,204 |
| VIP FundsManager 50% Portfolio | 81,253,830 | 99,917,985 | 181,171,815 |
| VIP FundsManager 60% Portfolio | 82,029,513 | 124,667,994 | 206,697,507 |
| VIP FundsManager 70% Portfolio | 20,337,323 | 34,940,233 | 55,277,556 |
| VIP FundsManager 85% Portfolio | 6,132,237 | 17,679,558 | 23,811,795 |
| December 31, 2019 | | | |
| | Ordinary Income | Long-term Capital Gains | Total |
| VIP FundsManager 20% Portfolio | $16,052,961 | $27,852,506 | $43,905,467 |
| VIP FundsManager 50% Portfolio | 103,646,449 | 536,593,834 | 640,240,283 |
| VIP FundsManager 60% Portfolio | 96,000,914 | 876,783,834 | 972,784,748 |
| VIP FundsManager 70% Portfolio | 23,875,594 | 186,110,611 | 209,986,205 |
| VIP FundsManager 85% Portfolio | 7,482,007 | 82,140,612 | 89,622,619 |
4. Derivative Instruments.
Risk Exposures and the Use of Derivative Instruments. The Funds' investment objective allows the Funds to enter into various types of derivative contracts, including futures contracts. Derivatives are investments whose value is primarily derived from underlying assets, indices or reference rates and may be transacted on an exchange or over-the-counter (OTC). Derivatives may involve a future commitment to buy or sell a specified asset based on specified terms, to exchange future cash flows at periodic intervals based on a notional principal amount, or for one party to make one or more payments upon the occurrence of specified events in exchange for periodic payments from the other party.
The Funds used derivatives to increase returns and to manage exposure to certain risks as defined below. The success of any strategy involving derivatives depends on analysis of numerous economic factors, and if the strategies for investment do not work as intended, the Funds may not achieve their objectives.
The Funds' use of derivatives increased or decreased their exposure to the following risk:
| Equity Risk | Equity risk relates to the fluctuations in the value of financial instruments as a result of changes in market prices (other than those arising from interest rate risk or foreign exchange risk), whether caused by factors specific to an individual investment, its issuer, or all factors affecting all instruments traded in a market or market segment.
|
The Funds are also exposed to additional risks from investing in derivatives, such as liquidity risk and counterparty credit risk. Liquidity risk is the risk that the Funds will be unable to close out the derivative in the open market in a timely manner. Counterparty credit risk is the risk that the counterparty will not be able to fulfill its obligation to the Funds. Counterparty credit risk related to exchange-traded futures contracts may be mitigated by the protection provided by the exchange on which they trade.
Investing in derivatives may involve greater risks than investing in the underlying assets directly and, to varying degrees, may involve risk of loss in excess of any initial investment and collateral received and amounts recognized in the Statement of Assets and Liabilities. In addition, there may be the risk that the change in value of the derivative contract does not correspond to the change in value of the underlying instrument.
Futures Contracts. A futures contract is an agreement between two parties to buy or sell a specified underlying instrument for a fixed price at a specified future date. The Funds used futures contracts to manage their exposure to the stock market.
Upon entering into a futures contract, a fund is required to deposit either cash or securities (initial margin) with a clearing broker in an amount equal to a certain percentage of the face value of the contract. Futures contracts are marked-to-market daily and subsequent daily payments (variation margin) are made or received by a fund depending on the daily fluctuations in the value of the futures contracts and are recorded as unrealized appreciation or (depreciation). This receivable and/or payable, if any, is included in daily variation margin on futures contracts in the Statement of Assets and Liabilities. Realized gain or (loss) is recorded upon the expiration or closing of a futures contract. The net realized gain (loss) and change in net unrealized appreciation (depreciation) on futures contracts during the period is presented in the Statement of Operations.
Any open futures contracts at period end are presented in the Schedule of Investments under the caption "Futures Contracts". The notional amount at value reflects each contract's exposure to the underlying instrument or index at period end and is representative of volume of activity during the period for VIP FundsManager 85% Portfolio. Securities deposited to meet initial margin requirements are identified in the Schedule of Investments.
5. Purchases and Sales of Investments.
Purchases and sales of securities, other than short-term securities, U.S. government securities and certain in-kind transactions, are noted in the table below.
| | Purchases ($) | Sales ($) |
| VIP FundsManager 20% Portfolio | 239,330,220 | 319,382,062 |
| VIP FundsManager 50% Portfolio | 1,290,216,972 | 1,774,287,622 |
| VIP FundsManager 60% Portfolio | 1,282,197,736 | 1,381,493,895 |
| VIP FundsManager 70% Portfolio | 387,369,234 | 425,223,869 |
| VIP FundsManager 85% Portfolio | 208,786,517 | 209,208,308 |
6. Fees and Other Transactions with Affiliates.
Management Fee. Fidelity Management & Research Company LLC (the investment adviser) provides the Funds with investment management related services. For these services each Fund pays a monthly management fee to the investment adviser. The management fee is based on an annual rate of .25% of each fund's average net assets. The management fee is reduced by an amount equal to the fees and expenses paid by the Funds to the independent Trustees.
The investment adviser has contractually agreed to waive 0.05% of its management fee, thereby limiting each Fund's management fee to an annual rate of 0.20% of average net assets, until April 30, 2022.
Distribution and Service Plan Fees. In accordance with Rule 12b-1 of the 1940 Act, the Funds have adopted separate 12b-1 Plans for each Service Class of shares. Each Service Class pays Fidelity Distributors Company LLC (FDC), an affiliate of the investment adviser, a service fee. For the period, the service fee is based on an annual rate of .10% of Service Class' average net assets and .25% of Service Class 2's average net assets.
For the period, total fees, all of which were reallowed to insurance companies for the distribution of shares and providing shareholder support services were as follows:
| | Service Class | Service Class 2 | Total |
| VIP FundsManager 20% Portfolio | $58 | $22,037 | $22,095 |
| VIP FundsManager 50% Portfolio | 58 | 264,640 | 264,698 |
| VIP FundsManager 60% Portfolio | 18,037 | 1,471,497 | 1,489,534 |
| VIP FundsManager 70% Portfolio | 65 | 143,478 | 143,543 |
| VIP FundsManager 85% Portfolio | – | 102,657 | 102,657 |
Brokerage Commissions. A portion of portfolio transactions were placed with brokerage firms which are affiliates of the investment adviser. Brokerage commissions are included in net realized gain (loss) and change in net unrealized appreciation (depreciation) in the Statement of Operations. The commissions paid to these affiliated firms were as follows:
| | Amount |
| VIP FundsManager 20% Portfolio | $225 |
| VIP FundsManager 50% Portfolio | 3,710 |
| VIP FundsManager 60% Portfolio | 4,676 |
| VIP FundsManager 70% Portfolio | 1,407 |
| VIP FundsManager 85% Portfolio | 586 |
Interfund Lending Program. Pursuant to an Exemptive Order issued by the SEC, each Fund, along with other registered investment companies having management contracts with Fidelity Management & Research Company LLC (FMR), or other affiliated entities of FMR, may participate in an interfund lending program. This program provides an alternative credit facility allowing each Fund to borrow from, or lend money to, other participating affiliated funds. At period end, there were no interfund loans outstanding. Activity in this program during the period for which loans were outstanding was as follows:
| | Borrower or Lender | Average Loan Balance | Weighted Average Interest Rate | Interest Expense |
| VIP FundsManager 60% Portfolio | Borrower | $4,624,929 | .33% | $598 |
Interfund Trades. Funds may purchase from or sell securities to other Fidelity Funds under procedures adopted by the Board. The procedures have been designed to ensure these interfund trades are executed in accordance with Rule 17a-7 of the 1940 Act. Interfund trades are included within the respective purchases and sales amounts shown in the Purchases and Sales of Investments note and are noted in the table below.
| | Purchases ($) | Sales ($) |
| VIP FundsManager 20% Portfolio | 539,307 | 152,506 |
| VIP FundsManager 50% Portfolio | 9,859,011 | 2,781,499 |
| VIP FundsManager 60% Portfolio | 12,365,001 | 3,470,523 |
| VIP FundsManager 70% Portfolio | 3,746,286 | 1,048,419 |
| VIP FundsManager 85% Portfolio | 1,493,021 | 418,612 |
Reallocation of Underlying Fund Investments. During the period, the investment adviser reallocated investments of the Funds. This involved taxable redemptions of each Fund's interest in Fidelity Mega Cap Stock Fund for investments and cash, as shown in the table below.
| | Value of investments and cash redeemed from Fidelity Mega Cap Stock Fund | Shares of Fidelity Mega Cap Stock Fund sold | Net realized loss on redemptions of Fidelity Mega Cap Stock Fund |
| VIP FundsManager 20% | $5,780,254 | 453,353 | $(1,730,419) |
| VIP FundsManager 50% | 99,474,910 | 7,801,954 | (30,614,314) |
| VIP FundsManager 60% | 125,062,846 | 9,808,851 | (38,502,131) |
| VIP FundsManager 70% | 38,077,050 | 2,986,435 | (11,771,557) |
| VIP FundsManager 85% | 15,417,246 | 1,209,196 | (4,791,232) |
In addition, each Fund exchanged investments and cash for shares of Fidelity U.S. Low Volatility Equity Fund, as shown in the table below. This exchange did not recognize any gains or loss for federal income tax purposes.
| | Value of investments and cash delivered to Fidelity U.S. Low Volatility Equity Fund | Shares of Fidelity U.S. Low Volatility Equity Fund received | Net realized gain on redemptions of investments |
| VIP FundsManager 20% | $5,912,068 | 630,957 | $38,663 |
| VIP FundsManager 50% | 101,614,757 | 10,844,691 | 607,195 |
| VIP FundsManager 60% | 127,748,659 | 13,633,795 | 773,494 |
| VIP FundsManager 70% | 38,918,062 | 4,153,475 | 234,071 |
| VIP FundsManager 85% | 15,777,233 | 1,683,803 | 94,531 |
Net realized gain (loss) on the redemptions of Fidelity Mega Cap Stock Fund and the investments in connection with the exchanges into Fidelity U.S. Low Volatility Equity Fund is included in the accompanying Statements of Operations as "Realized gain (loss) on Other affiliated issuers" and "Realized gain (loss) on Unaffiliated issuers", respectively.
Other. During the period, the investment adviser reimbursed the Funds for certain losses as follows:
| | Amount |
| VIP FundsManager 50% Portfolio | $7,260 |
| VIP FundsManager 70% Portfolio | 19,844 |
| VIP FundsManager 85% Portfolio | 4,043 |
7. Bank Borrowings.
Each Fund is permitted to have bank borrowings for temporary or emergency purposes to fund shareholder redemptions or for other short-term liquidity requirements. Each Fund has established borrowing arrangements with certain banks. The interest rate on the borrowings is the bank's base rate, as revised from time to time. Any open loans, including accrued interest, at period end are presented under the caption "Notes payable" in the Statement of Assets and Liabilities, if applicable. Activity in this program during the period for which loans were outstanding was as follows:
| | Average Loan Balance | Weighted Average Interest Rate | Interest Expense |
| VIP FundsManager 60% Portfolio | $5,154 | .59% | $84 |
8. Expense Reductions.
The investment adviser contractually agreed to limit each Funds' management fee to an annual rate of 0.20% of each Funds' average net assets until April 30, 2022. For the period, each Fund's management fees were reduced by the following amounts:
| | Management Fee Waiver |
| VIP FundsManager 20% Portfolio | $430,434 |
| VIP FundsManager 50% Portfolio | $2,745,214 |
| VIP FundsManager 60% Portfolio | $2,957,927 |
| VIP FundsManager 70% Portfolio | $812,248 |
| VIP FundsManager 85% Portfolio | $288,367 |
In addition, FMR has contractually agreed to reimburse 0.10% of class-level expenses for each Fund's Service Class and Service Class 2. During the period, this reimbursement reduced each Fund's Service Class and Service Class 2's expenses by the following amounts:
| | Reimbursement
|
| VIP FundsManager 20% Portfolio | |
| Service Class | $58 |
| Service Class 2 | 8,815 |
| VIP FundsManager 50% Portfolio | |
| Service Class | 58 |
| Service Class 2 | 105,856 |
| VIP FundsManager 60% Portfolio | |
| Service Class | 18,037 |
| Service Class 2 | 588,599 |
| VIP FundsManager 70% Portfolio | |
| Service Class | 65 |
| Service Class 2 | 57,391 |
| VIP FundsManager 85% Portfolio | |
| Service Class 2 | 41,063 |
In addition, through arrangements with each applicable Fund's custodian, credits realized as a result of certain uninvested cash balances were used to reduce each applicable Fund's or class' expenses. All of the applicable expense reductions are noted in the table below.
| | Custodian credits |
| VIP FundsManager 20% Portfolio | $50 |
| VIP FundsManager 50% Portfolio | 24 |
| VIP FundsManager 60% Portfolio | 2 |
| VIP FundsManager 70% Portfolio | 1 |
| VIP FundsManager 85% Portfolio | 81 |
9. Distributions to Shareholders.
Distributions to shareholders of each class were as follows:
| | Year ended
December 31, 2020 | Year ended
December 31, 2019 |
| VIP FundsManager 20% Portfolio | | |
| Distributions to shareholders | | |
| Service Class | $1,039 | $3,296 |
| Service Class 2 | 146,006 | 488,943 |
| Investor Class | 15,349,159 | 43,413,228 |
| Total | $15,496,204 | $43,905,467 |
| VIP FundsManager 50% Portfolio | | |
| Distributions to shareholders | | |
| Service Class | $1,903 | $6,403 |
| Service Class 2 | 3,243,607 | 10,344,271 |
| Investor Class | 177,926,305 | 629,889,609 |
| Total | $181,171,815 | $640,240,283 |
| VIP FundsManager 60% Portfolio | | |
| Distributions to shareholders | | |
| Service Class | $516,871 | $127,381 |
| Service Class 2 | 19,836,963 | 96,838,260 |
| Investor Class | 186,343,673 | 875,819,107 |
| Total | $206,697,507 | $972,784,748 |
| VIP FundsManager 70% Portfolio | | |
| Distributions to shareholders | | |
| Service Class | $2,227 | $9,527 |
| Service Class 2 | 1,850,914 | 7,049,223 |
| Investor Class | 53,424,415 | 202,927,455 |
| Total | $55,277,556 | $209,986,205 |
| VIP FundsManager 85% Portfolio | | |
| Distributions to shareholders | | |
| Service Class | $1 | $32 |
| Service Class 2 | 1,622,496 | 5,887,188 |
| Investor Class | 22,189,298 | 83,735,399 |
| Total | $23,811,795 | $89,622,619 |
10. Share Transactions.
Transactions for each class of shares were as follows:
| | Shares | Shares | Dollars | Dollars |
| | Year ended December 31, 2020 | Year ended December 31, 2019 | Year ended December 31, 2020 | Year ended December 31, 2019 |
| VIP FundsManager 20% Portfolio | | | | |
| Service Class | | | | |
| Shares sold | 474 | 488 | $5,396 | $5,362 |
| Reinvestment of distributions | 2 | 8 | 27 | 85 |
| Shares redeemed | (490) | (475) | (5,557) | (5,200) |
| Net increase (decrease) | (14) | 21 | $(134) | $247 |
| Service Class 2 | | | | |
| Shares sold | 169,733 | 135,277 | $1,946,113 | $1,471,009 |
| Reinvestment of distributions | 12,572 | 45,557 | 146,006 | 488,943 |
| Shares redeemed | (201,004) | (148,943) | (2,234,508) | (1,635,546) |
| Net increase (decrease) | (18,699) | 31,891 | $(142,389) | $324,406 |
| Investor Class | | | | |
| Shares sold | 10,143,883 | 7,333,333 | $115,312,638 | $80,852,963 |
| Reinvestment of distributions | 1,314,979 | 4,030,427 | 15,349,159 | 43,413,228 |
| Shares redeemed | (6,267,515) | (5,729,496) | (70,093,473) | (62,457,985) |
| Net increase (decrease) | 5,191,347 | 5,634,264 | $60,568,324 | $61,808,206 |
| VIP FundsManager 50% Portfolio | | | | |
| Service Class | | | | |
| Shares sold | 47 | 46 | $563 | $522 |
| Reinvestment of distributions | 2 | 6 | 20 | 65 |
| Shares redeemed | (47) | (54) | (573) | (638) |
| Net increase (decrease) | 2 | (2) | $10 | $(51) |
| Service Class 2 | | | | |
| Shares sold | 1,508,761 | 1,236,912 | $17,633,236 | $14,480,294 |
| Reinvestment of distributions | 259,431 | 916,624 | 3,243,607 | 10,344,271 |
| Shares redeemed | (1,735,783) | (1,485,227) | (21,127,010) | (17,356,006) |
| Net increase (decrease) | 32,409 | 668,309 | $(250,167) | $7,468,559 |
| Investor Class | | | | |
| Shares sold | 7,191,277 | 7,577,197 | $88,503,594 | $89,133,018 |
| Reinvestment of distributions | 14,149,900 | 55,620,389 | 177,926,305 | 629,889,609 |
| Shares redeemed | (57,322,537) | (78,756,218) | (694,905,590) | (925,558,347) |
| Net increase (decrease) | (35,981,360) | (15,558,632) | $(428,475,691) | $(206,535,720) |
| VIP FundsManager 60% Portfolio | | | | |
| Service Class | | | | |
| Shares sold | 1,889,668 | 1,033,935 | $18,961,228 | $10,068,520 |
| Reinvestment of distributions | 48,603 | 11,629 | 515,170 | 118,361 |
| Shares redeemed | (392,236) | (74,673) | (4,010,397) | (730,225) |
| Net increase (decrease) | 1,546,035 | 970,891 | $15,466,001 | $9,456,656 |
| Service Class 2 | | | | |
| Shares sold | 4,513,255 | 3,065,647 | $44,802,467 | $30,085,658 |
| Reinvestment of distributions | 1,925,302 | 10,514,925 | 19,836,963 | 96,838,260 |
| Shares redeemed | (6,850,794) | (7,415,863) | (67,756,483) | (72,428,400) |
| Net increase (decrease) | (412,237) | 6,164,709 | $(3,117,053) | $54,495,518 |
| Investor Class | | | | |
| Shares sold | 25,372,444 | 30,000,069 | $250,252,163 | $290,830,504 |
| Reinvestment of distributions | 17,950,984 | 94,708,477 | 186,343,673 | 875,819,107 |
| Shares redeemed | (48,912,797) | (64,915,761) | (486,648,686) | (631,441,037) |
| Net increase (decrease) | (5,589,369) | 59,792,785 | $(50,052,850) | $535,208,574 |
| VIP FundsManager 70% Portfolio | | | | |
| Service Class | | | | |
| Shares sold | 157 | 165 | $1,914 | $1,914 |
| Reinvestment of distributions | 1 | 5 | 16 | 58 |
| Shares redeemed | (160) | (164) | (1,913) | (1,910) |
| Net increase (decrease) | (2) | 6 | $17 | $62 |
| Service Class 2 | | | | |
| Shares sold | 418,359 | 474,575 | $5,024,944 | $5,507,534 |
| Reinvestment of distributions | 148,835 | 637,547 | 1,850,914 | 7,049,223 |
| Shares redeemed | (404,562) | (450,771) | (4,787,224) | (5,257,009) |
| Net increase (decrease) | 162,632 | 661,351 | $2,088,634 | $7,299,748 |
| Investor Class | | | | |
| Shares sold | 4,984,655 | 5,815,873 | $61,889,548 | $67,612,769 |
| Reinvestment of distributions | 4,262,285 | 18,253,747 | 53,424,415 | 202,927,455 |
| Shares redeemed | (11,809,398) | (8,247,223) | (138,404,885) | (96,185,156) |
| Net increase (decrease) | (2,562,458) | 15,822,397 | $(23,090,922) | $174,355,068 |
| VIP FundsManager 85% Portfolio | | | | |
| Service Class | | | | |
| Shares sold | 9 | 31 | $112 | $348 |
| Reinvestment of distributions | – | 3 | 1 | 32 |
| Shares redeemed | (9) | (55) | (105) | (613) |
| Net increase (decrease) | – | (21) | $8 | $(233) |
| Service Class 2 | | | | |
| Shares sold | 371,641 | 386,898 | $4,339,963 | $4,407,152 |
| Reinvestment of distributions | 134,213 | 547,479 | 1,622,496 | 5,887,188 |
| Shares redeemed | (344,935) | (301,364) | (4,070,631) | (3,379,880) |
| Net increase (decrease) | 160,919 | 633,013 | $1,891,828 | $6,914,460 |
| Investor Class | | | | |
| Shares sold | 3,041,695 | 2,367,616 | $35,232,328 | $27,253,129 |
| Reinvestment of distributions | 1,815,313 | 7,724,153 | 22,189,298 | 83,735,399 |
| Shares redeemed | (5,117,966) | (4,808,338) | (58,530,502) | (55,160,605) |
| Net increase (decrease) | (260,958) | 5,283,431 | $(1,108,876) | $55,827,923 |
11. Other.
The Funds' organizational documents provide former and current trustees and officers with a limited indemnification against liabilities arising in connection with the performance of their duties to the Funds. In the normal course of business, the Funds may also enter into contracts that provide general indemnifications. The Funds' maximum exposure under these arrangements is unknown as this would be dependent on future claims that may be made against the Funds. The risk of material loss from such claims is considered remote.
The Funds do not invest in the Underlying Funds for the purpose of exercising management or control; however, investments by the Funds within their principal investment strategies may represent a significant portion of the Underlying Fund's net assets. At the end of the period, the following Funds were the owners of record of 10% or more of the total outstanding shares of the Underlying Funds.
| Fund | VIP FundsManager 50% Portfolio | VIP FundsManager 60% Portfolio | VIP
FundsManager
70% Portfolio |
| Fidelity Global Commodity Stock Fund | 15% | 20% | –% |
| Fidelity Japan Smaller Companies Fund | 10% | 10% | –% |
| Fidelity International Value Fund | –% | 13% | –% |
| Fidelity Stock Selector All Cap Fund | 17% | 21% | –% |
| Fidelity Commodity Strategy Fund | 39% | 40% | 11% |
| Fidelity U.S. Low Volatility Equity Fund | 32% | 43% | 13% |
The Funds, in aggregate, were the owners of record of more than 20% of the total outstanding shares of the following Underlying Funds.
| Fund | % of shares held |
| Fidelity Global Commodity Stock Fund | 44% |
| Fidelity Japan Smaller Companies Fund | 26% |
| Fidelity International Value Fund | 29% |
| Fidelity Stock Selector All Cap Fund | 49% |
| Fidelity U.S. Low Volatility Equity Fund | 95% |
| Fidelity Commodity Strategy Fund | 100% |
| Fidelity Emerging Markets Discovery Fund | 22% |
In addition, at the end of the period the investment adviser or its affiliates were owners of record of more than 10% and certain otherwise unaffiliated shareholders each were owners of record of more than 10%, respectively, of the outstanding shares of the following Funds:
| | Affiliated % | Number of
Unaffiliated Shareholders | Unaffiliated Shareholders % |
| VIP FundsManager 20% Portfolio | 99% | – | –% |
| VIP FundsManager 50% Portfolio | 33% | 1 | 61% |
| VIP FundsManager 60% Portfolio | 34% | 2 | 44% |
| VIP FundsManager 70% Portfolio | 96% | – | –% |
| VIP FundsManager 85% Portfolio | 93% | – | –% |
12. Coronavirus (COVID-19) Pandemic.
An outbreak of COVID-19 first detected in China during December 2019 has since spread globally and was declared a pandemic by the World Health Organization during March 2020. Developments that disrupt global economies and financial markets, such as the COVID-19 pandemic, may magnify factors that affect the Funds' performance.
Report of Independent Registered Public Accounting Firm
To the Board of Trustees of Variable Insurance Products Fund V and the Shareholders of VIP FundsManager 20% Portfolio, VIP FundsManager 50% Portfolio, VIP FundsManager 60% Portfolio, VIP FundsManager 70% Portfolio and VIP FundsManager 85% Portfolio
Opinions on the Financial Statements
We have audited the accompanying statements of assets and liabilities, including the schedules of investments, of VIP FundsManager 20% Portfolio, VIP FundsManager 50% Portfolio, VIP FundsManager 60% Portfolio, VIP FundsManager 70% Portfolio and VIP FundsManager 85% Portfolio (five of the funds constituting Variable Insurance Products Fund V, hereafter collectively referred to as the “Funds”) as of December 31, 2020, the related statements of operations for the year ended December 31, 2020, the statements of changes in net assets for each of the two years in the period ended December 31, 2020, including the related notes, and the financial highlights for each of the five years in the period ended December 31, 2020 (collectively referred to as the “financial statements”). In our opinion, the financial statements present fairly, in all material respects, the financial position of each of the Funds as of December 31, 2020, the results of each of their operations for the year then ended, the changes in each of their net assets for each of the two years in the period ended December 31, 2020 and each of the financial highlights for each of the five years in the period ended December 31, 2020 in conformity with accounting principles generally accepted in the United States of America.
Basis for Opinions
These financial statements are the responsibility of the Funds’ management. Our responsibility is to express an opinion on the Funds’ financial statements based on our audits. We are a public accounting firm registered with the Public Company Accounting Oversight Board (United States) (PCAOB) and are required to be independent with respect to the Funds in accordance with the U.S. federal securities laws and the applicable rules and regulations of the Securities and Exchange Commission and the PCAOB.
We conducted our audits of these financial statements in accordance with the standards of the PCAOB. Those standards require that we plan and perform the audit to obtain reasonable assurance about whether the financial statements are free of material misstatement, whether due to error or fraud.
Our audits included performing procedures to assess the risks of material misstatement of the financial statements, whether due to error or fraud, and performing procedures that respond to those risks. Such procedures included examining, on a test basis, evidence regarding the amounts and disclosures in the financial statements. Our audits also included evaluating the accounting principles used and significant estimates made by management, as well as evaluating the overall presentation of the financial statements. Our procedures included confirmation of securities owned as of December 31, 2020 by correspondence with the custodian and brokers; when replies were not received from brokers, we performed other auditing procedures. We believe that our audits provide a reasonable basis for our opinions.
/s/ PricewaterhouseCoopers LLP
Boston, Massachusetts
February 11, 2021
We have served as the auditor of one or more investment companies in the Fidelity group of funds since 1932.
Trustees and Officers
The Trustees, Members of the Advisory Board (if any), and officers of the trust and funds, as applicable, are listed below. The Board of Trustees governs each fund and is responsible for protecting the interests of shareholders. The Trustees are experienced executives who meet periodically throughout the year to oversee each fund's activities, review contractual arrangements with companies that provide services to each fund, oversee management of the risks associated with such activities and contractual arrangements, and review each fund's performance. If the interests of a fund and an underlying Fidelity® fund were to diverge, a conflict of interest could arise and affect how the Trustees and Members of the Advisory Board fulfill their fiduciary duties to the affected funds. FMR has structured the funds to avoid these potential conflicts, although there may be situations where a conflict of interest is unavoidable. In such instances, FMR, the Trustees, and Members of the Advisory Board would take reasonable steps to minimize and, if possible, eliminate the conflict. Each of the Trustees oversees 280 funds.
The Trustees hold office without limit in time except that (a) any Trustee may resign; (b) any Trustee may be removed by written instrument, signed by at least two-thirds of the number of Trustees prior to such removal; (c) any Trustee who requests to be retired or who has become incapacitated by illness or injury may be retired by written instrument signed by a majority of the other Trustees; and (d) any Trustee may be removed at any special meeting of shareholders by a two-thirds vote of the outstanding voting securities of the trust. Each Trustee who is not an interested person (as defined in the 1940 Act) of the trust and the funds is referred to herein as an Independent Trustee. Each Independent Trustee shall retire not later than the last day of the calendar year in which his or her 75th birthday occurs. The Independent Trustees may waive this mandatory retirement age policy with respect to individual Trustees. Officers and Advisory Board Members hold office without limit in time, except that any officer or Advisory Board Member may resign or may be removed by a vote of a majority of the Trustees at any regular meeting or any special meeting of the Trustees. Except as indicated, each individual has held the office shown or other offices in the same company for the past five years.
Each fund’s Statement of Additional Information (SAI) includes more information about the Trustees. To request a free copy, call Fidelity at 1-877-208-0098.
Experience, Skills, Attributes, and Qualifications of the Trustees. The Governance and Nominating Committee has adopted a statement of policy that describes the experience, qualifications, attributes, and skills that are necessary and desirable for potential Independent Trustee candidates (Statement of Policy). The Board believes that each Trustee satisfied at the time he or she was initially elected or appointed a Trustee, and continues to satisfy, the standards contemplated by the Statement of Policy. The Governance and Nominating Committee also engages professional search firms to help identify potential Independent Trustee candidates who have the experience, qualifications, attributes, and skills consistent with the Statement of Policy. From time to time, additional criteria based on the composition and skills of the current Independent Trustees, as well as experience or skills that may be appropriate in light of future changes to board composition, business conditions, and regulatory or other developments, have also been considered by the professional search firms and the Governance and Nominating Committee. In addition, the Board takes into account the Trustees' commitment and participation in Board and committee meetings, as well as their leadership of standing and ad hoc committees throughout their tenure.
In determining that a particular Trustee was and continues to be qualified to serve as a Trustee, the Board has considered a variety of criteria, none of which, in isolation, was controlling. The Board believes that, collectively, the Trustees have balanced and diverse experience, qualifications, attributes, and skills, which allow the Board to operate effectively in governing each fund and protecting the interests of shareholders. Information about the specific experience, skills, attributes, and qualifications of each Trustee, which in each case led to the Board's conclusion that the Trustee should serve (or continue to serve) as a trustee of the funds, is provided below.
Board Structure and Oversight Function. Abigail P. Johnson is an interested person and currently serves as Chairman. The Trustees have determined that an interested Chairman is appropriate and benefits shareholders because an interested Chairman has a personal and professional stake in the quality and continuity of services provided to the funds. Independent Trustees exercise their informed business judgment to appoint an individual of their choosing to serve as Chairman, regardless of whether the Trustee happens to be independent or a member of management. The Independent Trustees have determined that they can act independently and effectively without having an Independent Trustee serve as Chairman and that a key structural component for assuring that they are in a position to do so is for the Independent Trustees to constitute a substantial majority for the Board. The Independent Trustees also regularly meet in executive session. Arthur E. Johnson serves as Chairman of the Independent Trustees and as such (i) acts as a liaison between the Independent Trustees and management with respect to matters important to the Independent Trustees and (ii) with management prepares agendas for Board meetings.
Fidelity® funds are overseen by different Boards of Trustees. The funds' Board oversees Fidelity's investment-grade bond, money market, asset allocation and certain equity funds, and other Boards oversee Fidelity's high income and other equity funds. The asset allocation funds may invest in Fidelity® funds that are overseen by such other Boards. The use of separate Boards, each with its own committee structure, allows the Trustees of each group of Fidelity® funds to focus on the unique issues of the funds they oversee, including common research, investment, and operational issues. On occasion, the separate Boards establish joint committees to address issues of overlapping consequences for the Fidelity® funds overseen by each Board.
The Trustees operate using a system of committees to facilitate the timely and efficient consideration of all matters of importance to the Trustees, each fund, and fund shareholders and to facilitate compliance with legal and regulatory requirements and oversight of the funds' activities and associated risks. The Board, acting through its committees, has charged FMR and its affiliates with (i) identifying events or circumstances the occurrence of which could have demonstrably adverse effects on the funds' business and/or reputation; (ii) implementing processes and controls to lessen the possibility that such events or circumstances occur or to mitigate the effects of such events or circumstances if they do occur; and (iii) creating and maintaining a system designed to evaluate continuously business and market conditions in order to facilitate the identification and implementation processes described in (i) and (ii) above. Because the day-to-day operations and activities of the funds are carried out by or through FMR, its affiliates, and other service providers, the funds' exposure to risks is mitigated but not eliminated by the processes overseen by the Trustees. While each of the Board's committees has responsibility for overseeing different aspects of the funds' activities, oversight is exercised primarily through the Operations and Audit Committees. In addition, an ad hoc Board committee of Independent Trustees has worked with FMR to enhance the Board's oversight of investment and financial risks, legal and regulatory risks, technology risks, and operational risks, including the development of additional risk reporting to the Board. Appropriate personnel, including but not limited to the funds' Chief Compliance Officer (CCO), FMR's internal auditor, the independent accountants, the funds' Treasurer and portfolio management personnel, make periodic reports to the Board's committees, as appropriate, including an annual review of Fidelity's risk management program for the Fidelity® funds. The responsibilities of each standing committee, including their oversight responsibilities, are described further under "Standing Committees of the Trustees."
Interested Trustees*:
Correspondence intended for a Trustee who is an interested person may be sent to Fidelity Investments, 245 Summer Street, Boston, Massachusetts 02210.
Name, Year of Birth; Principal Occupations and Other Relevant Experience+
Abigail P. Johnson (1961)
Year of Election or Appointment: 2009
Trustee
Chairman of the Board of Trustees
Ms. Johnson also serves as Trustee of other Fidelity® funds. Ms. Johnson serves as Chairman (2016-present), Chief Executive Officer (2014-present), and Director (2007-present) of FMR LLC (diversified financial services company), President of Fidelity Financial Services (2012-present) and President of Personal, Workplace and Institutional Services (2005-present). Ms. Johnson is Chairman and Director of Fidelity Management & Research Company LLC (investment adviser firm, 2011-present). Previously, Ms. Johnson served as Chairman and Director of FMR Co., Inc. (investment adviser firm, 2011-2019), Vice Chairman (2007-2016) and President (2013-2016) of FMR LLC, President and a Director of Fidelity Management & Research Company (2001-2005), a Trustee of other investment companies advised by Fidelity Management & Research Company, Fidelity Investments Money Management, Inc. (investment adviser firm), and FMR Co., Inc. (2001-2005), Senior Vice President of the Fidelity® funds (2001-2005), and managed a number of Fidelity® funds. Ms. Abigail P. Johnson and Mr. Arthur E. Johnson are not related.
Jennifer Toolin McAuliffe (1959)
Year of Election or Appointment: 2016
Trustee
Ms. McAuliffe also serves as Trustee of other Fidelity® funds. Previously, Ms. McAuliffe served as Co-Head of Fixed Income of Fidelity Investments Limited (now known as FIL Limited (FIL)) (diversified financial services company), Director of Research for FIL’s credit and quantitative teams in London, Hong Kong and Tokyo and Director of Research for taxable and municipal bonds at Fidelity Investments Money Management, Inc. Ms. McAuliffe previously served as a member of the Advisory Board of certain Fidelity® funds (2016). Ms. McAuliffe was previously a lawyer at Ropes & Gray LLP and currently serves as director or trustee of several not-for-profit entities.
* Determined to be an “Interested Trustee” by virtue of, among other things, his or her affiliation with the trust or various entities under common control with FMR.
+ The information includes the Trustee's principal occupation during the last five years and other information relating to the experience, attributes, and skills relevant to the Trustee's qualifications to serve as a Trustee, which led to the conclusion that the Trustee should serve as a Trustee for each fund.
Independent Trustees:
Correspondence intended for an Independent Trustee may be sent to Fidelity Investments, P.O. Box 55235, Boston, Massachusetts 02205-5235.
Name, Year of Birth; Principal Occupations and Other Relevant Experience+
Elizabeth S. Acton (1951)
Year of Election or Appointment: 2013
Trustee
Ms. Acton also serves as Trustee of other Fidelity® funds. Prior to her retirement, Ms. Acton served as Executive Vice President, Finance (2011-2012), Executive Vice President, Chief Financial Officer (2002-2011) and Treasurer (2004-2005) of Comerica Incorporated (financial services). Prior to joining Comerica, Ms. Acton held a variety of positions at Ford Motor Company (1983-2002), including Vice President and Treasurer (2000-2002) and Executive Vice President and Chief Financial Officer of Ford Motor Credit Company (1998-2000). Ms. Acton currently serves as a member of the Board and Audit and Finance Committees of Beazer Homes USA, Inc. (homebuilding, 2012-present). Ms. Acton previously served as a member of the Advisory Board of certain Fidelity® funds (2013-2016).
Ann E. Dunwoody (1953)
Year of Election or Appointment: 2018
Trustee
General Dunwoody also serves as Trustee of other Fidelity® funds. General Dunwoody (United States Army, Retired) was the first woman in U.S. military history to achieve the rank of four-star general and prior to her retirement in 2012 held a variety of positions within the U.S. Army, including Commanding General, U.S. Army Material Command (2008-2012). General Dunwoody currently serves as President of First to Four LLC (leadership and mentoring services, 2012-present), a member of the Board and Nomination and Corporate Governance Committees of Kforce Inc. (professional staffing services, 2016-present) and a member of the Board of Automattic Inc. (software engineering, 2018-present). Previously, General Dunwoody served as a member of the Advisory Board and Nominating and Corporate Governance Committee of L3 Technologies, Inc. (communication, electronic, sensor and aerospace systems, 2013-2019) and a member of the Board and Audit and Sustainability and Corporate Responsibility Committees of Republic Services, Inc. (waste collection, disposal and recycling, 2013-2016). Ms. Dunwoody also serves on several boards for non-profit organizations, including as a member of the Board, Chair of the Nomination and Governance Committee and a member of the Audit Committee of Logistics Management Institute (consulting non-profit, 2012-present), a member of the Council of Trustees for the Association of the United States Army (advocacy non-profit, 2013-present), a member of the Board of Florida Institute of Technology (2015-present) and a member of the Board of ThanksUSA (military family education non-profit, 2014-present). General Dunwoody previously served as a member of the Advisory Board of certain Fidelity® funds (2018).
John Engler (1948)
Year of Election or Appointment: 2014
Trustee
Mr. Engler also serves as Trustee of other Fidelity® funds. Previously, Mr. Engler served as Governor of Michigan (1991-2003), President of the Business Roundtable (2011-2017) and interim President of Michigan State University (2018-2019). Mr. Engler currently serves as a member of the Board of K12 Inc. (technology-based education company, 2012-present). Previously, Mr. Engler served as a member of the Board of Universal Forest Products (manufacturer and distributor of wood and wood-alternative products, 2003-2019) and Trustee of The Munder Funds (2003-2014). Mr. Engler previously served as a member of the Advisory Board of certain Fidelity® funds (2014-2016).
Robert F. Gartland (1951)
Year of Election or Appointment: 2010
Trustee
Mr. Gartland also serves as Trustee of other Fidelity® funds. Prior to his retirement, Mr. Gartland held a variety of positions at Morgan Stanley (financial services, 1979-2007), including Managing Director (1987-2007) and Chase Manhattan Bank (1975-1978). Mr. Gartland previously served as Chairman and an investor in Gartland & Mellina Group Corp. (consulting, 2009-2019), as a member of the Board of National Securities Clearing Corporation (1993-1996) and as Chairman of TradeWeb (2003-2004).
Arthur E. Johnson (1947)
Year of Election or Appointment: 2008
Trustee
Chairman of the Independent Trustees
Mr. Johnson also serves as Trustee of other Fidelity® funds. Prior to his retirement, Mr. Johnson served as Senior Vice President of Corporate Strategic Development of Lockheed Martin Corporation (defense contractor, 1999-2009). Mr. Johnson currently serves as a member of the Board of Booz Allen Hamilton (management consulting, 2011-present). Mr. Johnson previously served as a member of the Board of Eaton Corporation plc (diversified power management, 2009-2019) and a member of the Board of AGL Resources, Inc. (holding company, 2002-2016). Mr. Johnson previously served as Vice Chairman (2015-2018) of the Independent Trustees of certain Fidelity® funds. Mr. Arthur E. Johnson is not related to Ms. Abigail P. Johnson.
Michael E. Kenneally (1954)
Year of Election or Appointment: 2009
Trustee
Vice Chairman of the Independent Trustees
Mr. Kenneally also serves as Trustee of other Fidelity® funds. Prior to his retirement, Mr. Kenneally served as Chairman and Global Chief Executive Officer of Credit Suisse Asset Management and Executive Vice President and Chief Investment Officer of Bank of America Corporation. Earlier roles at Bank of America included Director of Research, Senior Portfolio Manager for various institutional equity accounts and mutual funds and Portfolio Manager for a number of institutional fixed-income clients. Mr. Kenneally began his career as a Research Analyst in 1983 and was awarded the Chartered Financial Analyst (CFA) designation in 1991.
Marie L. Knowles (1946)
Year of Election or Appointment: 2001
Trustee
Ms. Knowles also serves as Trustee of other Fidelity® funds. Prior to her retirement, Ms. Knowles held several positions at Atlantic Richfield Company (diversified energy), including Executive Vice President and Chief Financial Officer (1996-2000), Senior Vice President (1993-1996) and President of ARCO Transportation Company (pipeline and tanker operations, 1993-1996). Ms. Knowles currently serves as a member of the Board of McKesson Corporation (healthcare service, since 2002), a member of the Board of the Santa Catalina Island Company (real estate, 2009-present), a member of the Investment Company Institute Board of Governors and a member of the Governing Council of the Independent Directors Council (2014-present). Ms. Knowles also serves as a member of the Advisory Board for the School of Engineering of the University of Southern California. Ms. Knowles previously served as Chairman (2015-2018) and Vice Chairman (2012-2015) of the Independent Trustees of certain Fidelity® funds.
Mark A. Murray (1954)
Year of Election or Appointment: 2016
Trustee
Mr. Murray also serves as Trustee of other Fidelity® funds. Previously, Mr. Murray served as Co-Chief Executive Officer (2013-2016), President (2006-2013) and Vice Chairman (2013-2020) of Meijer, Inc. Mr. Murray serves as a member of the Board and Nuclear Review and Public Policy and Responsibility Committees of DTE Energy Company (diversified energy company, 2009-present) and a member of the Board and Audit Committee and Chairman of the Nominating and Corporate Governance Committee of Universal Forest Products, Inc. (manufacturer and distributor of wood and wood-alternative products, 2004-2016). Mr. Murray previously served as a member of the Board of Spectrum Health (not-for-profit health system, 2015-2019). Mr. Murray also serves as a member of the Board of many community and professional organizations. Mr. Murray previously served as a member of the Advisory Board of certain Fidelity® funds (2016).
+ The information includes the Trustee's principal occupation during the last five years and other information relating to the experience, attributes, and skills relevant to the Trustee's qualifications to serve as a Trustee, which led to the conclusion that the Trustee should serve as a Trustee for each fund.
Advisory Board Members and Officers:
Correspondence intended for an officer may be sent to Fidelity Investments, 245 Summer Street, Boston, Massachusetts 02210. Officers appear below in alphabetical order.
Name, Year of Birth; Principal Occupation
Craig S. Brown (1977)
Year of Election or Appointment: 2019
Assistant Treasurer
Mr. Brown also serves as Assistant Treasurer of other funds. Mr. Brown is an employee of Fidelity Investments (2013-present).
John J. Burke III (1964)
Year of Election or Appointment: 2018
Chief Financial Officer
Mr. Burke also serves as Chief Financial Officer of other funds. Mr. Burke serves as Head of Investment Operations for Fidelity Fund and Investment Operations (2018-present) and is an employee of Fidelity Investments (1998-present). Previously Mr. Burke served as head of Asset Management Investment Operations (2012-2018).
David J. Carter (1973)
Year of Election or Appointment: 2020
Assistant Secretary
Mr. Carter also serves as Assistant Secretary of other funds. Mr. Carter serves as Vice President, Associate General Counsel (2010-present) and is an employee of Fidelity Investments (2005-present).
Jonathan Davis (1968)
Year of Election or Appointment: 2010
Assistant Treasurer
Mr. Davis also serves as Assistant Treasurer of other funds. Mr. Davis serves as Assistant Treasurer of FMR Capital, Inc. (2017-present) and is an employee of Fidelity Investments. Previously, Mr. Davis served as Vice President and Associate General Counsel of FMR LLC (diversified financial services company, 2003-2010).
Laura M. Del Prato (1964)
Year of Election or Appointment: 2018
President and Treasurer
Ms. Del Prato also serves as an officer of other funds. Ms. Del Prato is an employee of Fidelity Investments (2017-present). Previously, Ms. Del Prato served as President and Treasurer of The North Carolina Capital Management Trust: Cash Portfolio and Term Portfolio (2018-2020). Prior to joining Fidelity Investments, Ms. Del Prato served as a Managing Director and Treasurer of the JPMorgan Mutual Funds (2014-2017). Prior to JPMorgan, Ms. Del Prato served as a partner at Cohen Fund Audit Services (accounting firm, 2012-2013) and KPMG LLP (accounting firm, 2004-2012).
Colm A. Hogan (1973)
Year of Election or Appointment: 2016
Assistant Treasurer
Mr. Hogan also serves as an officer of other funds. Mr. Hogan serves as Assistant Treasurer of FMR Capital, Inc. (2017-present) and is an employee of Fidelity Investments (2005-present). Previously, Mr. Hogan served as Deputy Treasurer of certain Fidelity® funds (2016-2020) and Assistant Treasurer of certain Fidelity® funds (2016-2018).
Cynthia Lo Bessette (1969)
Year of Election or Appointment: 2019
Secretary and Chief Legal Officer (CLO)
Ms. Lo Bessette also serves as an officer of other funds. Ms. Lo Bessette serves as CLO, Secretary, and Senior Vice President of Fidelity Management & Research Company LLC (investment adviser firm, 2019-present); and CLO of Fidelity Management & Research (Hong Kong) Limited, FMR Investment Management (UK) Limited, and Fidelity Management & Research (Japan) Limited (investment adviser firms, 2019-present). She is a Senior Vice President and Deputy General Counsel of FMR LLC (diversified financial services company, 2019-present), and is an employee of Fidelity Investments. Previously, Ms. Lo Bessette served as CLO, Secretary, and Senior Vice President of FMR Co., Inc. (investment adviser firm, 2019); Secretary of Fidelity SelectCo, LLC and Fidelity Investments Money Management, Inc. (investment adviser firms, 2019). Prior to joining Fidelity Investments, Ms. Lo Bessette was Executive Vice President, General Counsel (2016-2019) and Senior Vice President, Deputy General Counsel (2015-2016) of OppenheimerFunds (investment management company) and Deputy Chief Legal Officer (2013-2015) of Jennison Associates LLC (investment adviser firm).
Chris Maher (1972)
Year of Election or Appointment: 2013
Assistant Treasurer
Mr. Maher also serves as an officer of other funds. Mr. Maher serves as Assistant Treasurer of FMR Capital, Inc. (2017-present), and is an employee of Fidelity Investments (2008-present). Previously, Mr. Maher served as Assistant Treasurer of certain funds (2013-2020); Vice President of Asset Management Compliance (2013), Vice President of the Program Management Group of FMR (investment adviser firm, 2010-2013), and Vice President of Valuation Oversight (2008-2010).
Kenneth B. Robins (1969)
Year of Election or Appointment: 2020
Chief Compliance Officer
Mr. Robins also serves as an officer of other funds. Mr. Robins serves as Compliance Officer of Fidelity Management & Research Company LLC (investment adviser firm, 2016-present) and is an employee of Fidelity Investments (2004-present). Previously, Mr. Robins served as Compliance Officer of FMR Co., Inc. (investment adviser firm, 2016-2019), as Executive Vice President of Fidelity Investments Money Management, Inc. (investment adviser firm, 2013-2016) and served in other fund officer roles.
Brett Segaloff (1972)
Year of Election or Appointment: 2021
Anti-Money Laundering (AML) Officer
Mr. Segaloff also serves as an AML Officer of other funds and other related entities. He is Director, Anti-Money Laundering (2007-present) of FMR LLC (diversified financial services company) and is an employee of Fidelity Investments (1996-present).
Stacie M. Smith (1974)
Year of Election or Appointment: 2013
Assistant Treasurer
Ms. Smith also serves as an officer of other funds. Ms. Smith serves as Assistant Treasurer of FMR Capital, Inc. (2017-present), is an employee of Fidelity Investments (2009-present), and has served in other fund officer roles. Prior to joining Fidelity Investments, Ms. Smith served as Senior Audit Manager of Ernst & Young LLP (accounting firm, 1996-2009). Previously, Ms. Smith served as Assistant Treasurer (2013-2019) and Deputy Treasurer (2013-2016) of certain Fidelity® funds.
Marc L. Spector (1972)
Year of Election or Appointment: 2016
Deputy Treasurer
Mr. Spector also serves as an officer of other funds. Mr. Spector serves as Assistant Treasurer of FMR Capital, Inc. (2017-present) and is an employee of Fidelity Investments (2016-present). Prior to joining Fidelity Investments, Mr. Spector served as Director at the Siegfried Group (accounting firm, 2013-2016), and prior to Siegfried Group as audit senior manager at Deloitte & Touche LLP (accounting firm, 2005-2013).
Jim Wegmann (1979)
Year of Election or Appointment: 2019
Assistant Treasurer
Mr. Wegmann also serves as Assistant Treasurer of other funds. Mr. Wegmann is an employee of Fidelity Investments (2011-present).
Vadim Zlotnikov (1962)
Year of Election or Appointment: 2019
Vice President
Mr. Zlotnikov also serves as Vice President of other funds. Mr. Zlotnikov serves as President of FIAM (Fidelity Institutional Asset Management) and is an employee of Fidelity Investments (2018-present). Previously, Mr. Zlotnikov served as President and Chief Investment Officer of Global Asset Allocation (2018-2020). Prior to joining Fidelity Investments, Mr. Zlotnikov served as Co-Head of Multi-Asset Solutions, Chief Market Strategist, and CIO of Systematic Strategies with AllianceBernstein (investment adviser firm, 2002-2018).
Shareholder Expense Example
As a shareholder, you incur two types of costs: (1) transaction costs, which may include sales charges (loads) on purchase payments or redemption proceeds, as applicable and (2) ongoing costs, which generally include management fees, distribution and/or service (12b-1) fees and other Fund expenses. This Example is intended to help you understand your ongoing costs (in dollars) of investing in a fund and to compare these costs with the ongoing costs of investing in other mutual funds.
The Example is based on an investment of $1,000 invested at the beginning of the period and held for the entire period (July 1, 2020 to December 31, 2020).
Actual Expenses
The first line of the accompanying table provides information about actual account values and actual expenses. You may use the information in this line, together with the amount you invested, to estimate the expenses that you paid over the period. Simply divide your account value by $1,000.00 (for example, an $8,600 account value divided by $1,000.00 = 8.6), then multiply the result by the number in the first line for a class/Fund under the heading entitled "Expenses Paid During Period" to estimate the expenses you paid on your account during this period. If any fund is a shareholder of any underlying mutual funds or exchange-traded funds (ETFs) (the Underlying Funds), such fund indirectly bears its proportional share of the expenses of the Underlying Funds in addition to the direct expenses incurred presented in the table. These fees and expenses are not included in the annualized expense ratio used to calculate the expense estimate in the table below. The estimate of expenses does not include any fees or other expenses of any variable annuity or variable life insurance product. If they were, the estimate of expenses you paid during the period would be higher, and your ending account value would be lower.
Hypothetical Example for Comparison Purposes
The second line of the accompanying table provides information about hypothetical account values and hypothetical expenses based on the actual expense ratio and an assumed rate of return of 5% per year before expenses, which is not the actual return. The hypothetical account values and expenses may not be used to estimate the actual ending account balance or expenses you paid for the period. You may use this information to compare the ongoing costs of investing in the Fund and other funds. To do so, compare this 5% hypothetical example with the 5% hypothetical examples that appear in the shareholder reports of the other funds. If any fund is a shareholder of any Underlying Funds, such fund indirectly bears its proportional share of the expenses of the Underlying Funds in addition to the direct expenses as presented in the table. These fees and expenses are not included in the annualized expense ratio used to calculate the expense estimate in the table below. The estimate of expenses does not include any fees or other expenses of any variable annuity or variable life insurance product. If they were, the estimate of expenses you paid during the period would be higher, and your ending account value would be lower.
Please note that the expenses shown in the table are meant to highlight your ongoing costs only and do not reflect any transaction costs. Therefore, the second line of the table is useful in comparing ongoing costs only, and will not help you determine the relative total costs of owning different funds.
| | Annualized Expense Ratio-A | Beginning
Account Value
July 1, 2020 | Ending
Account Value
December 31, 2020 | Expenses Paid
During Period-B
July 1, 2020
to December 31, 2020 |
| VIP FundsManager 20% Portfolio | | | | |
| Service Class | .20% | | | |
| Actual | | $1,000.00 | $1,057.50 | $1.03 |
| Hypothetical-C | | $1,000.00 | $1,024.13 | $1.02 |
| Service Class 2 | .35% | | | |
| Actual | | $1,000.00 | $1,057.10 | $1.81 |
| Hypothetical-C | | $1,000.00 | $1,023.38 | $1.78 |
| Investor Class | .20% | | | |
| Actual | | $1,000.00 | $1,057.50 | $1.03 |
| Hypothetical-C | | $1,000.00 | $1,024.13 | $1.02 |
| VIP FundsManager 50% Portfolio | | | | |
| Service Class | .20% | | | |
| Actual | | $1,000.00 | $1,132.00 | $1.07 |
| Hypothetical-C | | $1,000.00 | $1,024.13 | $1.02 |
| Service Class 2 | .35% | | | |
| Actual | | $1,000.00 | $1,131.20 | $1.87 |
| Hypothetical-C | | $1,000.00 | $1,023.38 | $1.78 |
| Investor Class | .20% | | | |
| Actual | | $1,000.00 | $1,131.20 | $1.07 |
| Hypothetical-C | | $1,000.00 | $1,024.13 | $1.02 |
| VIP FundsManager 60% Portfolio | | | | |
| Service Class | .20% | | | |
| Actual | | $1,000.00 | $1,155.50 | $1.08 |
| Hypothetical-C | | $1,000.00 | $1,024.13 | $1.02 |
| Service Class 2 | .35% | | | |
| Actual | | $1,000.00 | $1,154.60 | $1.90 |
| Hypothetical-C | | $1,000.00 | $1,023.38 | $1.78 |
| Investor Class | .20% | | | |
| Actual | | $1,000.00 | $1,155.50 | $1.08 |
| Hypothetical-C | | $1,000.00 | $1,024.13 | $1.02 |
| VIP FundsManager 70% Portfolio | | | | |
| Service Class | .20% | | | |
| Actual | | $1,000.00 | $1,178.10 | $1.10 |
| Hypothetical-C | | $1,000.00 | $1,024.13 | $1.02 |
| Service Class 2 | .35% | | | |
| Actual | | $1,000.00 | $1,176.70 | $1.92 |
| Hypothetical-C | | $1,000.00 | $1,023.38 | $1.78 |
| Investor Class | .20% | | | |
| Actual | | $1,000.00 | $1,178.10 | $1.10 |
| Hypothetical-C | | $1,000.00 | $1,024.13 | $1.02 |
| VIP FundsManager 85% Portfolio | | | | |
| Service Class | .20% | | | |
| Actual | | $1,000.00 | $1,211.70 | $1.11 |
| Hypothetical-C | | $1,000.00 | $1,024.13 | $1.02 |
| Service Class 2 | .35% | | | |
| Actual | | $1,000.00 | $1,212.50 | $1.95 |
| Hypothetical-C | | $1,000.00 | $1,023.38 | $1.78 |
| Investor Class | .20% | | | |
| Actual | | $1,000.00 | $1,213.20 | $1.11 |
| Hypothetical-C | | $1,000.00 | $1,024.13 | $1.02 |
A Annualized expense ratio reflects expenses net of applicable fee waivers.
B Expenses are equal to the annualized expense ratio, multiplied by the average account value over the period, multiplied by 184/ 366 (to reflect the one-half year period). The fees and expenses of any Underlying Funds are not included in each annualized expense ratio.
C 5% return per year before expenses
Distributions (Unaudited)
The Board of Trustees of each fund voted to pay to shareholders of record at the opening of business on record date, the following distributions per share derived from capital gains realized from sales of portfolio securities and dividends derived from net investment income:
| | Pay Date | Record Date | Dividends | Capital Gains |
| VIP FundsManager 20% | | | | |
| Service Class | 02/05/21 | 02/05/21 | $0.018 | $0.024 |
| Service Class 2 | 02/05/21 | 02/05/21 | $0.018 | $0.024 |
| Investor Class | 02/05/21 | 02/05/21 | $0.018 | $0.024 |
| VIP FundsManager 50% | | | | |
| Service Class | 02/05/21 | 02/05/21 | $0.038 | $0.216 |
| Service Class 2 | 02/05/21 | 02/05/21 | $0.037 | $0.216 |
| Investor Class | 02/05/21 | 02/05/21 | $0.038 | $0.216 |
| VIP FundsManager 60% | | | | |
| Service Class | 02/05/21 | 02/05/21 | $0.034 | $0.170 |
| Service Class 2 | 02/05/21 | 02/05/21 | $0.033 | $0.170 |
| Investor Class | 02/05/21 | 02/05/21 | $0.034 | $0.170 |
| VIP FundsManager 70% | | | | |
| Service Class | 02/05/21 | 02/05/21 | $0.047 | $0.162 |
| Service Class 2 | 02/05/21 | 02/05/21 | $0.047 | $0.162 |
| Investor Class | 02/05/21 | 02/05/21 | $0.047 | $0.162 |
| VIP FundsManager 85% | | | | |
| Service Class | 02/05/21 | 02/05/21 | $0.052 | $0.251 |
| Service Class 2 | 02/05/21 | 02/05/21 | $0.051 | $0.251 |
| Investor Class | 02/05/21 | 02/05/21 | $0.052 | $0.251 |
|
The funds hereby designate as capital gain dividend the amounts noted below for the taxable year ended December 31, 2020, or, if subsequently determined to be different, the net capital gain of such year.
| VIP FundsManager 20% | $947,497 |
| VIP FundsManager 50% | $79,398,676 |
| VIP FundsManager 60% | $82,555,536 |
| VIP FundsManager 70% | $16,384,164 |
| VIP FundsManager 85% | $9,931,183 |
|
A percentage of the dividends distributed during the fiscal year for the following funds were derived from interest on U.S. Government securities which is generally exempt from state income tax
| VIP FundsManager 20% | |
| Service Class | 15.26% |
| Service Class 2 | 15.26% |
| Investor Class | 15.26% |
| VIP FundsManager 50% | |
| Service Class | 9.23% |
| Service Class 2 | 9.23% |
| Investor Class | 9.23% |
| VIP FundsManager 60% | |
| Service Class | 7.46% |
| Service Class 2 | 7.46% |
| Investor Class | 7.46% |
| VIP FundsManager 70% | |
| Service Class | 5.05% |
| Service Class 2 | 5.05% |
| Investor Class | 5.05% |
| VIP FundsManager 85% | |
| Service Class | 2.85% |
| Service Class 2 | 2.85% |
| Investor Class | 2.85% |
|
A percentage of the dividends distributed during the fiscal year for the following funds qualify for the dividends–received deduction for corporate shareholders:
| | Service Class | Service Class 2 | Investor Class |
| VIP FundsManager 20% | | | |
| February, 2020 | 0% | 0% | 0% |
| December, 2020 | 14% | 16% | 14% |
| VIP FundsManager 50% | | | |
| February, 2020 | 1% | 1% | 1% |
| December, 2020 | 38% | 44% | 38% |
| VIP FundsManager 60% | | | |
| February, 2020 | 1% | 1% | 1% |
| December, 2020 | 51% | 60% | 51% |
| VIP FundsManager 70% | | | |
| February, 2020 | 1% | 1% | 1% |
| December, 2020 | 76% | 94% | 76% |
| VIP FundsManager 85% | | | |
| February, 2020 | 2% | 2% | 2% |
| December, 2020 | 100% | 100% | 100% |
|
The amounts per share which represent income derived from sources within, and taxes paid to, foreign countries or possessions of the United States are as follows:
| | Pay Date | Income | Taxes |
| VIP FundsManager 20% | | | |
| Service Class | 12/30/2020 | $0.0093 | $0.0013 |
| Service Class 2 | 12/30/2020 | $0.0081 | $0.0013 |
| Investor Class | 12/30/2020 | $0.0093 | $0.0013 |
| VIP FundsManager 50% | | | |
| Service Class | 12/30/2020 | $0.0228 | $0.0035 |
| Service Class 2 | 12/30/2020 | $0.0197 | $0.0035 |
| Investor Class | 12/30/2020 | $0.0228 | $0.0035 |
| VIP FundsManager 60% | | | |
| Service Class | 12/30/2020 | $0.0212 | $0.0033 |
| Service Class 2 | 12/30/2020 | $0.0177 | $0.0033 |
| Investor Class | 12/30/2020 | $0.0212 | $0.0033 |
| VIP FundsManager 70% | | | |
| Service Class | 12/30/2020 | $0.0293 | $0.0045 |
| Service Class 2 | 12/30/2020 | $0.0237 | $0.0045 |
| Investor Class | 12/30/2020 | $0.0293 | $0.0045 |
| VIP FundsManager 85% | | | |
| Service Class | 12/30/2020 | $0.0331 | $0.0049 |
| Service Class 2 | 12/30/2020 | $0.0237 | $0.0049 |
| Investor Class | 12/30/2020 | $0.0331 | $0.0049 |
|
Board Approval of Investment Advisory Contracts and Management Fees
VIP FundsManager Funds
Each year, the Board of Trustees, including the Independent Trustees (together, the Board), votes on the renewal of the management contract with Fidelity Management & Research Company LLC (FMR) for each fund (the Advisory Contract). The Board, assisted by the advice of fund counsel and Independent Trustees' counsel, requests and considers a broad range of information relevant to the renewal of the Advisory Contracts throughout the year.
The Board meets regularly and, at each of its meetings, covers an extensive agenda of topics and materials and considers factors that are relevant to its annual consideration of the renewal of each fund's Advisory Contract, including the services and support provided to each fund and its shareholders. The Board has established four standing committees (Committees) — Operations, Audit, Fair Valuation, and Governance and Nominating — each composed of and chaired by Independent Trustees with varying backgrounds, to which the Board has assigned specific subject matter responsibilities in order to enhance effective decision-making by the Board. The Operations Committee, of which all of the Independent Trustees are members, meets regularly throughout the year and considers, among other matters, information specifically related to the annual consideration of the renewal of each fund's Advisory Contract. The Board, acting directly and through its Committees, requests and receives information concerning the annual consideration of the renewal of each fund's Advisory Contract. The Board also meets as needed to review matters specifically related to the Board's annual consideration of the renewal of the Advisory Contracts. Members of the Board may also meet with trustees of other Fidelity funds through joint ad hoc committees to discuss certain matters relevant to all of the Fidelity funds.
At its September 2020 meeting, the Board unanimously determined to renew each fund's Advisory Contract. In reaching its determination, the Board considered all factors it believed relevant, including (i) the nature, extent, and quality of the services provided to each fund and its shareholders (including the investment performance of each fund); (ii) the competitiveness of each fund's management fee and total expense ratio relative to peer funds; (iii) the total costs of the services provided by and the profits realized by Fidelity from its relationships with each fund; and (iv) the extent to which, if any, economies of scale exist and are realized as each fund grows, and whether any economies of scale are appropriately shared with fund shareholders.
In considering whether to renew the Advisory Contract for each fund, the Board reached a determination, with the assistance of fund counsel and Independent Trustees' counsel and through the exercise of its business judgment, that the renewal of the Advisory Contract was in the best interests of each fund and its shareholders and that the compensation payable under the Advisory Contract was fair and reasonable. The Board's decision to renew the Advisory Contracts was not based on any single factor, but rather was based on a comprehensive consideration of all the information provided to the Board at its meetings throughout the year. The Board, in reaching its determination to renew the Advisory Contracts, was aware that shareholders of each fund have a broad range of investment choices available to them, including a wide choice among funds offered by Fidelity's competitors, and that each fund's shareholders, who have the opportunity to review and weigh the disclosure provided by the fund in its prospectus and other public disclosures, have chosen to invest in that fund, which is part of the Fidelity family of funds.
Nature, Extent, and Quality of Services Provided. The Board considered Fidelity's staffing as it relates to the funds, including the backgrounds of investment personnel of FMR, and also considered the funds' investment objectives, strategies, and related investment philosophies. The Independent Trustees also had discussions with senior management of Fidelity's investment operations and investment groups with responsibility for the underlying Fidelity funds in which each fund invests. The Board considered the structure of the investment personnel compensation program and whether this structure provides appropriate incentives to act in the best interests of each fund. Additionally, the Board considered the portfolio managers' investments, if any, in the funds that they manage.
Resources Dedicated to Investment Management and Support Services. The Board reviewed the general qualifications and capabilities of Fidelity's investment staff, including its size, education, experience, and resources, as well as Fidelity's approach to recruiting, managing, and compensating investment personnel. The Board noted that Fidelity has continued to increase the resources devoted to non-U.S. offices, including expansion of Fidelity's global investment organization. The Board also noted that Fidelity's analysts have extensive resources, tools and capabilities that allow them to conduct sophisticated quantitative and fundamental analysis, as well as credit analysis of issuers, counterparties and guarantors. Further, the Board considered that Fidelity's investment professionals have sufficient access to global information and data so as to provide competitive investment results over time, and that those professionals also have access to sophisticated tools that permit them to assess portfolio construction and risk and performance attribution characteristics continuously, as well as to transmit new information and research conclusions rapidly around the world. Additionally, in its deliberations, the Board considered Fidelity's risk management, compliance, and technology and operations capabilities and resources, which are integral parts of the investment management process. The Board also considered Fidelity's investments in business continuity planning, and its success in continuously providing services to the funds notwithstanding the severe disruptions caused by the COVID-19 pandemic.
Shareholder and Administrative Services. The Board considered (i) the nature, extent, quality, and cost of advisory, administrative, and shareholder services performed by Fidelity under the Advisory Contract and under separate agreements covering transfer agency, and pricing and bookkeeping services for each fund; (ii) the nature and extent of the supervision of third party service providers, principally custodians, subcustodians, and pricing vendors; and (iii) the resources devoted to, and the record of compliance with, each fund's compliance policies and procedures.
The Board noted that the growth of fund assets over time across the complex allows Fidelity to reinvest in the development of services designed to enhance the value and convenience of the Fidelity funds as investment vehicles. These services include 24-hour access to account information and market information over the Internet and through telephone representatives, investor education materials and asset allocation tools, and the expanded availability of Fidelity Investor Centers.
Investment in a Large Fund Family. The Board considered the benefits to shareholders of investing in a Fidelity fund, including the benefits of investing in a fund that is part of a large family of funds offering a variety of investment disciplines and providing a large variety of mutual fund investor services. The Board noted that Fidelity had taken, or had made recommendations that resulted in the Fidelity funds taking, a number of actions over the previous year that benefited particular funds, including: (i) continuing to dedicate additional resources to Fidelity's investment research process, which includes meetings with management of issuers of securities in which the funds invest, and to the support of the senior management team that oversees asset management; (ii) continuing efforts to enhance Fidelity's global research capabilities; (iii) launching new funds and ETFs with innovative structures, strategies and pricing and making other enhancements to meet client needs; (iv) launching new share classes of existing funds; (v) eliminating purchase minimums and broadening eligibility requirements for certain funds and share classes; (vi) reducing management fees and total expenses for certain target date funds or classes and index funds; (vii) lowering expenses for certain funds and classes by implementing or lowering expense caps; (viii) rationalizing product lines and gaining increased efficiencies from fund mergers, liquidations, and share class consolidations; (ix) continuing to develop, acquire and implement systems and technology to improve services to the funds and shareholders, strengthen information security, and increase efficiency; and (x) continuing to implement enhancements to further strengthen Fidelity's product line to increase investors' probability of success in achieving their investment goals, including retirement income goals.
Investment Performance. The Board considered whether each fund has operated in accordance with its investment objective, as well as its record of compliance with its investment restrictions and its performance history.
The Board took into account discussions that occur at Board meetings throughout the year with representatives of the investment adviser about fund investment performance. In this regard the Board noted that as part of regularly scheduled fund reviews and other reports to the Board on fund performance, the Board considers annualized return information for each fund for different time periods, measured against one or more appropriate securities market indices, including a customized blended index that reflects the respective weights of the fund's asset classes (each a benchmark index) and an appropriate peer group of funds with similar objectives (peer group). In its evaluation of fund investment performance at meetings throughout the year, the Board gave particular attention to information indicating underperformance of certain Fidelity funds for specific time periods and discussed with the investment adviser the reasons for such underperformance.
In addition to reviewing absolute and relative fund performance, the Independent Trustees periodically consider the appropriateness of fund performance metrics in evaluating the results achieved. In general, the Independent Trustees believe that fund performance should be evaluated based on gross performance (before fees and expenses, including acquired fund fees and expenses, but after transaction costs, if any) compared to appropriate benchmark indices, over appropriate time periods that may include full market cycles, and on net performance (after fees and expenses, including acquired fund fees and expenses) compared to appropriate peer groups, as applicable, over the same periods, taking into account relevant factors including the following: general market conditions; the extent to which particular underlying funds affected performance; and fund cash flows and other factors. The Independent Trustees generally give greater weight to fund performance over longer time periods than over shorter time periods. Depending on the circumstances, the Independent Trustees may be satisfied with a fund's performance notwithstanding that it lags its benchmark index or peer group for certain periods.
The Independent Trustees recognize that shareholders evaluate performance on a net basis over their own holding periods, for which one-, three-, and five-year periods are often used as a proxy. For this reason, the performance information reviewed by the Board also included net cumulative calendar year total return information for each fund and an appropriate benchmark index and peer group for the most recent one-, three-, and five-year periods. The Independent Trustees recognize that shareholders who are not investing through a tax-advantaged retirement account also consider tax consequences in evaluating performance.
Based on its review, the Board concluded that the nature, extent, and quality of services provided to each fund under the Advisory Contracts should continue to benefit the shareholders of each fund.
Competitiveness of Management Fee and Total Expense Ratio. The Board considered each fund's management fee and total expense ratio compared to "mapped groups" of competitive funds and classes created for the purpose of facilitating the Trustees' competitive analysis of management fees and total expenses, and also considered that each fund bears indirectly the fees and expenses, including the management fees, paid by the underlying Fidelity funds in which it invests. Fidelity creates "mapped groups" by combining similar Lipper investment objective categories that have comparable investment mandates. Combining Lipper investment objective categories aids the Board's management fee and total expense ratio comparisons by broadening the competitive group used for comparison.
Management Fee. The Board considered two proprietary management fee comparisons forthe 12-month periods shown in basis points (BP) in the charts below. The group of Lipper funds used by the Board for management fee comparisons is referred to below as the "Total Mapped Group." The Total Mapped Group comparison focuses on a fund's standing in terms of gross management fees before expense reimbursements or caps relative to the total universe of funds with comparable investment mandates, regardless of whether their management fee structures also are comparable. Funds with comparable investment mandates offer exposure to similar types of securities. Funds with comparable management fee structures have similar management fee contractual arrangements (
e.g., flat rate charged for advisory services, all-inclusive fee rate,
etc.). "TMG %" represents the percentage of funds in the Total Mapped Group that had management fees that were lower than a fund's. For example, a hypothetical TMG % of 20% would mean that 80% of the funds in the Total Mapped Group had higher, and 20% had lower, management fees than a fund. The funds' actual TMG %s and the number of funds in the Total Mapped Group are in the charts below. The "Asset-Sized Peer Group" (ASPG) comparison focuses on a fund's standing relative to a subset of non-Fidelity funds within the Total Mapped Group that are similar in size and management fee structure. For example, if a fund is in the first quartile of the ASPG, the fund's management fee ranks in the least expensive or lowest 25% of funds in the ASPG. The ASPG represents at least 15% of the funds in the Total Mapped Group with comparable asset size and management fee structures, subject to a minimum of 50 funds (or all funds in the Total Mapped Group if fewer than 50). Additional information, such as the ASPG quartile in which a fund's management fee rate ranked, is also included in the charts and was considered by the Board. Because the vast majority of competitor funds' management fees do not cover non-management expenses, in prior years, each fund was compared on the basis of a hypothetical "net management fee," which was derived by subtracting payments made by Fidelity for non-management expenses (including pricing and bookkeeping fees and fees paid to non-affiliated custodians) from the fund's all-inclusive fee. Given the funds' competitive management fee rates, Fidelity no longer calculates hypothetical net management fees for the funds and, as a result, the charts do not include hypothetical net management fees for periods after 2016.
VIP FundsManager 20%

VIP FundsManager 50%
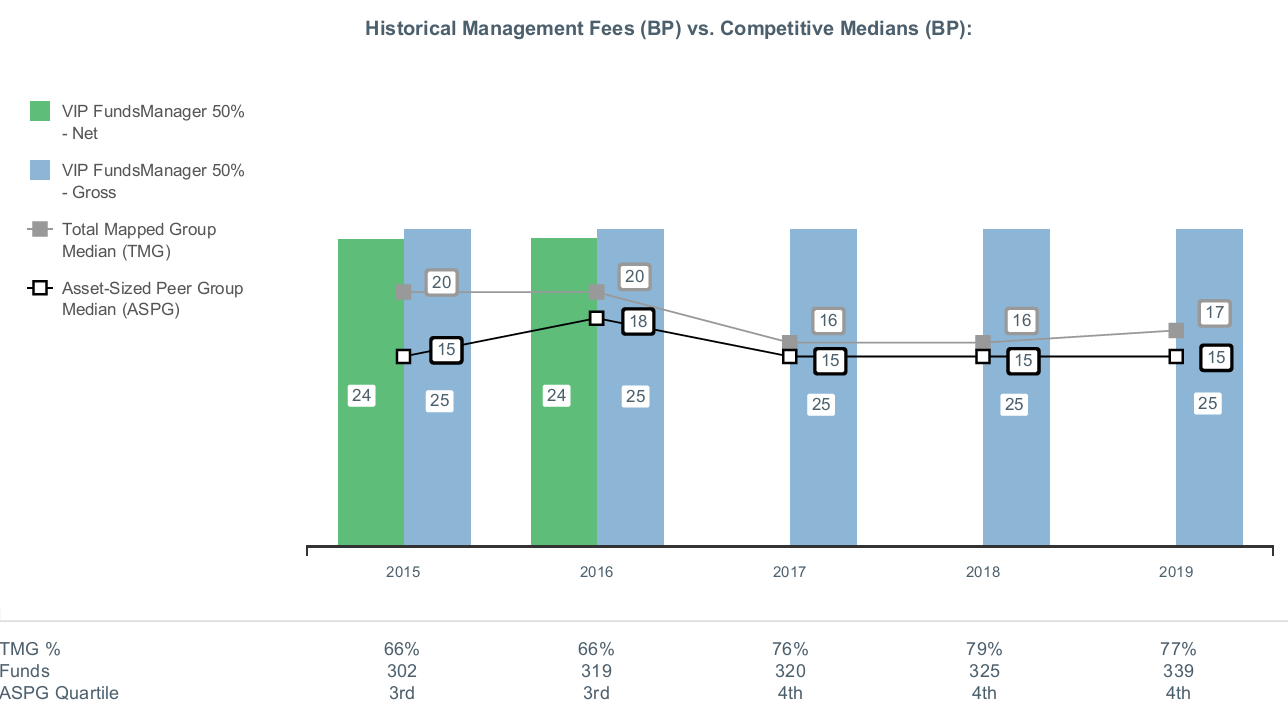
VIP FundsManager 60%
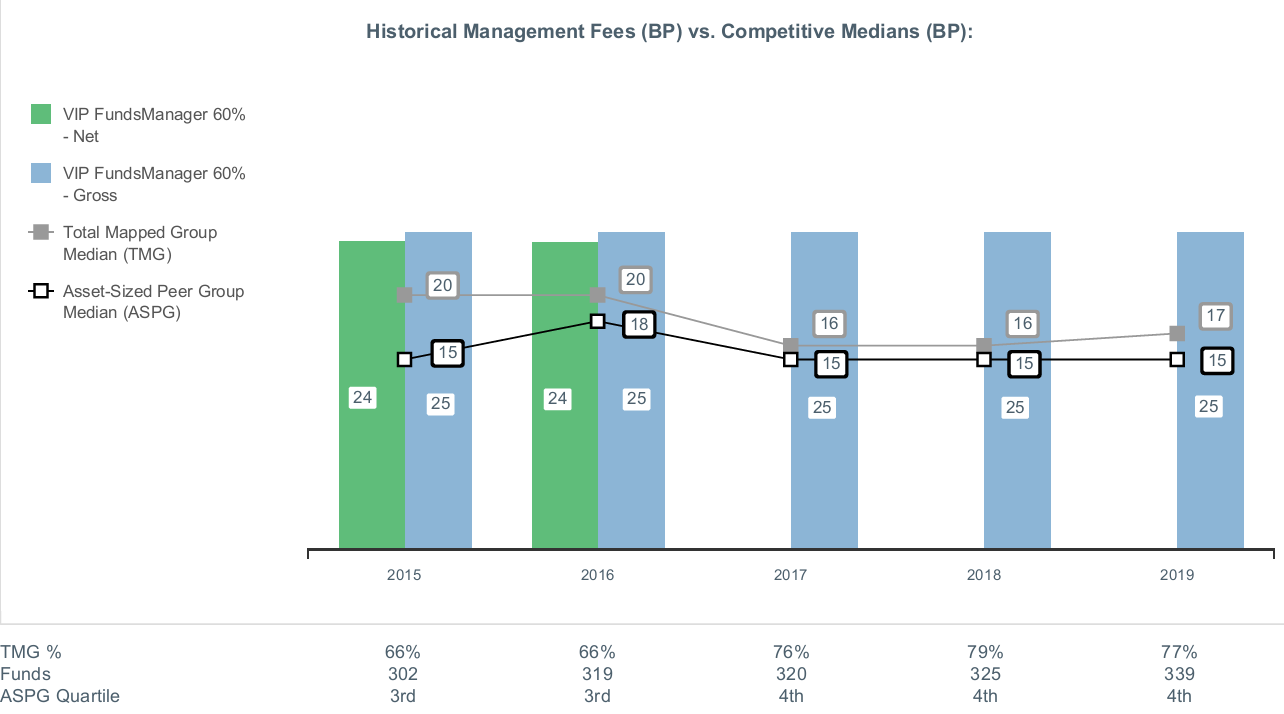
VIP FundsManager 70%

VIP FundsManager 85%
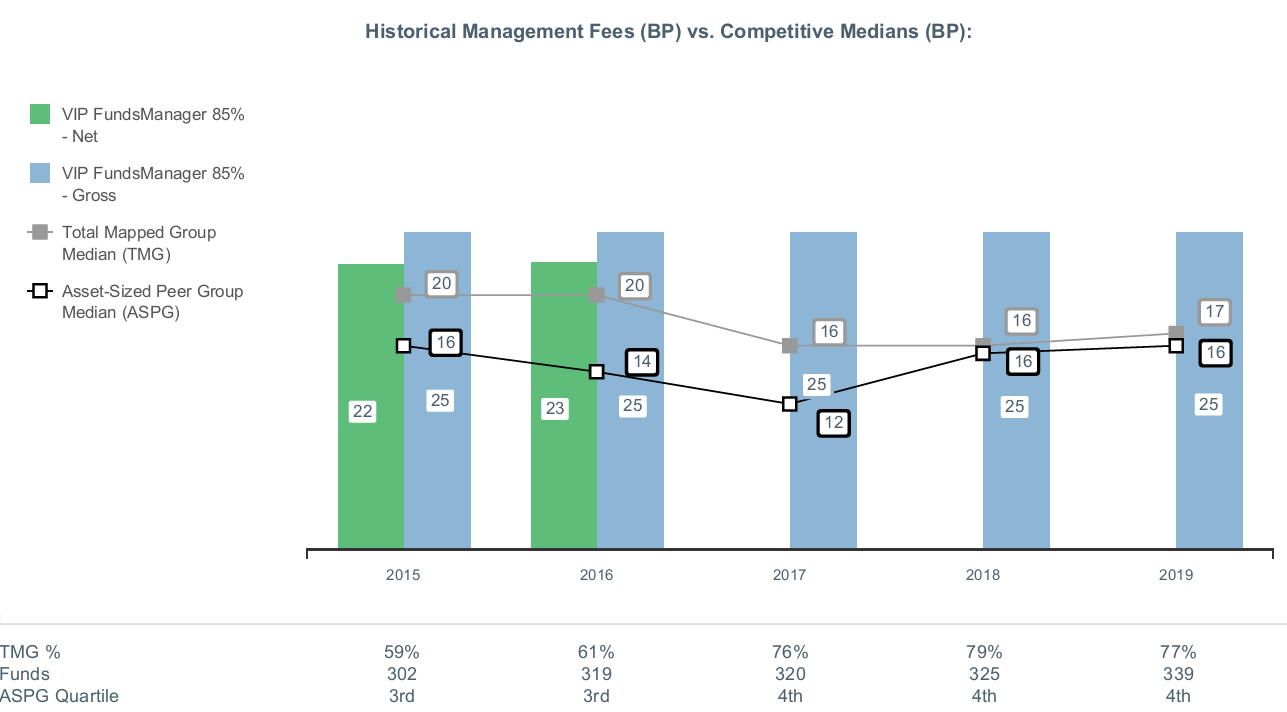
The Board noted that each fund's management fee rate ranked above the median of its Total Mapped Group and above the median of its ASPG for 2019. The Board considered that the funds are more actively managed than most funds in their Total Mapped Group and ASPG and have a larger universe of funds in which to invest.
The Board further considered that FMR has contractually agreed to waive 0.05% of each fund's management fee through April 30, 2021.
Based on its review, the Board concluded that each fund's management fee is fair and reasonable in light of the services that the fund receives and the other factors considered.
Total Expense Ratio. In its review of the total expense ratio of each class of each fund, the Board considered the fund's all-inclusive fee rate. The Board also considered other expenses, such as pricing and bookkeeping fees and custodial, legal, and audit fees, paid by FMR under the all-inclusive arrangement. The Board also considered fund-paid 12b-1 fees. The Board also noted that Fidelity may agree to waive fees or reimburse expenses from time to time, and the extent to which, if any, it has done so for each fund. As part of its review, the Board also considered the current and historical total expense ratios of each class of each fund compared to competitive fund median expenses. Each class of each fund is compared to those funds and classes in the Total Mapped Group (used by the Board for management fee comparisons) that have a similar sales load structure.
The Board noted that the total expense ratio of each of Investor Class and Service Class of each fund ranked below the competitive median for 2019 and the total expense ratio of Service Class 2 of each fund ranked above the competitive median for 2019. The Board considered that, in general, various factors can affect total expense ratios. The Board noted that the total expense ratio of Service Class 2 was above the competitive median because of its 12b-1 fees and that excluding 12b-1 fees of both the class and competitor classes, the total expense ratio of Service Class 2 ranked below the median. The Board noted that each fund offers multiple classes, each of which has a different 12b-1 fee structure, and that the multiple structures are intended to offer a range of pricing options for the intermediary market. The Board also noted that the total expense ratios of the classes of each fund vary primarily by the level of their 12b-1 fees.
In considering the total expense ratio of each class of each fund, the Board also considered an alternative competitive analysis that included both top level (
i.e., direct) fund fees and acquired fund fees and expenses for the class and the other funds and classes to which it is compared. The Board noted that, under this alternative competitive analysis, the total expense ratio of each class of each fund was below the competitive median for 2019, except that the total expense ratio of Service Class 2 of each of VIP FundsManager 70% and VIP FundsManager 85% was above the competitive median for 2019. These classes were above the median because of their 12b-1 fees and because of their higher all-inclusive management fee due to their specialized strategy.
The Board further considered that FMR contractually agreed to reimburse 0.10% of "class-level" expenses for Service Class and Service Class 2 as long as these classes continue to be sold to unaffiliated insurance companies.
Fees Charged to Other Fidelity Clients. The Board also considered Fidelity fee structures and other information with respect to clients of Fidelity, such as other funds advised or subadvised by Fidelity, pension plan clients, and other institutional clients with similar mandates. The Board noted that a joint ad hoc committee created by it and the boards of other Fidelity funds periodically reviews and compares Fidelity's institutional investment advisory business with its business of providing services to the Fidelity funds and also noted the most recent findings of the committee. The Board noted that the committee's review included a consideration of the differences in services provided, fees charged, and costs incurred, as well as competition in the markets serving the different categories of clients.
Based on its review of total expense ratios and fees charged to other Fidelity clients, the Board concluded that the total expense ratio of each class of each fund was reasonable in light of the services that the fund and its shareholders receive and the other factors considered.
Costs of the Services and Profitability. The Board consideredthe revenues earned and the expenses incurred by Fidelity in conducting the business of developing, marketing, distributing, managing, administering and servicing each fund and servicing each fund's shareholders. The Board also considered the level of Fidelity's profits in respect of all the Fidelity funds, including the Fidelity funds in which the funds invest.
On an annual basis, Fidelity presents to the Board information about the profitability of its relationships with each fund. Fidelity calculates profitability information for each fund, as well as aggregate profitability information for groups of Fidelity funds and all Fidelity funds, using a series of detailed revenue and cost allocation methodologies which originate with the books and records of Fidelity on which Fidelity's audited financial statements are based. The Audit Committee of the Board reviews any significant changes from the prior year's methodologies and the full Board approves such changes.
A public accounting firm has been engaged annually by the Board as part of the Board's assessment of Fidelity's profitability analysis. The engagement includes the review and assessment of the methodologies used by Fidelity in determining the revenues and expenses attributable to Fidelity's mutual fund business, and completion of agreed-upon procedures in respect of the mathematical accuracy of certain fund profitability information and its conformity to established allocation methodologies. After considering the reports issued under the engagement and information provided by Fidelity, the Board concluded that while other allocation methods may also be reasonable, Fidelity's profitability methodologies are reasonable in all material respects.
The Board also reviewed Fidelity's non-fund businesses and potential indirect benefits such businesses may have received as a result of their association with Fidelity's mutual fund business (i.e., fall-out benefits) as well as cases where Fidelity's affiliates may benefit from the funds' business. The Board considered areas where potential indirect benefits to the Fidelity funds from their relationships with Fidelity may exist. The Board also considered that in 2019 a joint ad hoc committee created by it and the boards of other Fidelity funds evaluated potential fall-out benefits (PFOB Committee). The Board noted that it considered the PFOB Committee's findings in connection with its consideration of the renewal of the Advisory Contracts.
The Board considered the costs of the services provided by and the profits realized by Fidelity in connection with the operation of each fund, including the conclusions of the PFOB Committee, and was satisfied that the profitability was not excessive.
Economies of Scale. The Board considered whether there have been economies of scale in respect of the management of the Fidelity funds, whether the Fidelity funds (including each fund) have appropriately benefited from any such economies of scale, and whether there is potential for realization of any further economies of scale. The Board considered the extent to which each fund will benefit from economies of scale as assets grow through increased services to the fund, through waivers or reimbursements, or through fee or expense ratio reductions. The Board recognized that, due to each fund's current contractual arrangements, its expense ratio will not decline if the fund's operating costs decrease as assets grow, or rise as assets decrease. The Board also noted that a committee (the Economies of Scale Committee) created by it and the boards of other Fidelity funds periodically analyzes whether Fidelity attains economies of scale in respect of the management and servicing of the Fidelity funds, whether the Fidelity funds have appropriately benefited from such economies of scale, and whether there is potential for realization of any further economies of scale.
The Board concluded, taking into account the analysis of the Economies of Scale Committee, that economies of scale, if any, are being appropriately shared between fund shareholders and Fidelity.
Additional Information Requested by the Board. In order to develop fully the factual basis for consideration of the Fidelity funds' advisory contracts, the Board requested and received additional information on certain topics, including: (i) Fidelity's fund profitability methodology, profitability trends for certain funds, the allocation of various costs to different funds, and the impact of certain factors on fund profitability results; (ii) portfolio manager changes that have occurred during the past year and the amount of the investment that each portfolio manager has made in the Fidelity fund(s) that he or she manages; (iii) Fidelity's compensation structure for portfolio managers, research analysts, and other key personnel, including its effects on fund profitability, the rationale for the compensation structure, and the extent to which current market conditions have affected retention and recruitment; (iv) the arrangements with and compensation paid to certain fund sub-advisers on behalf of the Fidelity funds and the treatment of such compensation within Fidelity's fund profitability methodology; (v) the terms of the funds' various management fee structures, including the basic group fee and the terms of Fidelity's voluntary expense limitation agreements; (vi) Fidelity's transfer agent fee, expense, and service structures for different funds and classes relative to competitive trends; (vii) the impact on fund profitability of recent industry trends, such as the growth in passively managed funds and outflows from actively managed equity funds; and (viii) explanations regarding the relative total expense ratios of certain funds and classes, total expense competitive trends and methodologies for total expense competitive comparisons, and actions that might be taken by Fidelity to reduce total expense ratios for certain classes. In addition, the Board considered its discussions with Fidelity regarding Fidelity's efforts to maintain the continuous investment and shareholder services necessary for the funds during the current pandemic and economic circumstances.
Based on its evaluation of all of the conclusions noted above, and after considering all factors it believed relevant, the Board concluded that the advisory fee arrangements are fair and reasonable, and that each fund's Advisory Contract should be renewed.
VIPFM-ANN-0221
1.843208.114
Fidelity® Variable Insurance Products:
Target Volatility Portfolio
Annual Report
December 31, 2020
Contents
To view a fund's proxy voting guidelines and proxy voting record for the 12-month period ended June 30, visit http://www.fidelity.com/proxyvotingresults or visit the Securities and Exchange Commission's (SEC) web site at http://www.sec.gov.
You may also call 1-877-208-0098 to request a free copy of the proxy voting guidelines.
Fidelity® Variable Insurance Products are separate account options which are purchased through a variable insurance contract.
Standard & Poor's, S&P and S&P 500 are registered service marks of The McGraw-Hill Companies, Inc. and have been licensed for use by Fidelity Distributors Corporation.
Other third-party marks appearing herein are the property of their respective owners.
All other marks appearing herein are registered or unregistered trademarks or service marks of FMR LLC or an affiliated company. © 2021 FMR LLC. All rights reserved.
This report and the financial statements contained herein are submitted for the general information of the shareholders of the Fund. This report is not authorized for distribution to prospective investors in the Fund unless preceded or accompanied by an effective prospectus.
A fund files its complete schedule of portfolio holdings with the SEC for the first and third quarters of each fiscal year on Form N-PORT. Forms N-PORT are available on the SEC’s web site at http://www.sec.gov. A fund's Forms N-PORT may be reviewed and copied at the SEC’s Public Reference Room in Washington, DC. Information regarding the operation of the SEC's Public Reference Room may be obtained by calling 1-800-SEC-0330.
For a complete list of a fund's portfolio holdings, view the most recent holdings listing, semiannual report, or annual report on Fidelity's web site at http://www.fidelity.com, http://www.institutional.fidelity.com, or http://www.401k.com, as applicable.
NOT FDIC INSURED •MAY LOSE VALUE •NO BANK GUARANTEE
Neither the Fund nor Fidelity Distributors Corporation is a bank.
Note to Shareholders:
Early in 2020, the outbreak and spread of a new coronavirus emerged as a public health emergency that had a major influence on financial markets, primarily based on its impact on the global economy and the outlook for corporate earnings. The virus causes a respiratory disease known as COVID-19. On March 11, the World Health Organization declared the COVID-19 outbreak a pandemic, citing sustained risk of further global spread.
In the weeks following, as the crisis worsened, we witnessed an escalating human tragedy with wide-scale social and economic consequences from coronavirus-containment measures. The outbreak of COVID-19 prompted a number of measures to limit the spread, including travel and border restrictions, quarantines, and restrictions on large gatherings. In turn, these resulted in lower consumer activity, diminished demand for a wide range of products and services, disruption in manufacturing and supply chains, and – given the wide variability in outcomes regarding the outbreak – significant market uncertainty and volatility. Amid the turmoil, global governments and central banks took unprecedented action to help support consumers, businesses, and the broader economies, and to limit disruption to financial systems.
The situation continues to unfold, and the extent and duration of its impact on financial markets and the economy remain highly uncertain. Extreme events such as the coronavirus crisis are “exogenous shocks” that can have significant adverse effects on mutual funds and their investments. Although multiple asset classes may be affected by market disruption, the duration and impact may not be the same for all types of assets.
Fidelity is committed to helping you stay informed amid news about COVID-19 and during increased market volatility, and we’re taking extra steps to be responsive to customer needs. We encourage you to visit our websites, where we offer ongoing updates, commentary, and analysis on the markets and our funds.
Performance: The Bottom Line
Average annual total return reflects the change in the value of an investment, assuming reinvestment of distributions from dividend income and capital gains (the profits earned upon the sale of securities that have grown in value, if any) and assuming a constant rate of performance each year. During periods of reimbursement by Fidelity, a fund’s total return will be greater than it would be had the reimbursement not occurred. Performance numbers are net of all underlying fund operating expenses, but do not include any insurance charges imposed by your insurance company’s separate account. If performance information included the effect of these additional charges, the total returns would have been lower. How a fund did yesterday is no guarantee of how it will do tomorrow.
Average Annual Total Returns
| For the periods ended December 31, 2020 | Past 1 year | Past 5 years | Life of fundA |
| Service Class | 9.13% | 8.40% | 7.68% |
| Service Class 2 | 8.99% | 8.23% | 7.52% |
A From February 13, 2013
$10,000 Over Life of Fund
Let's say hypothetically that $10,000 was invested in VIP Target Volatility Portfolio - Service Class on February 13, 2013, when the fund started.
The chart shows how the value of your investment would have changed, and also shows how the S&P 500® Index performed over the same period.
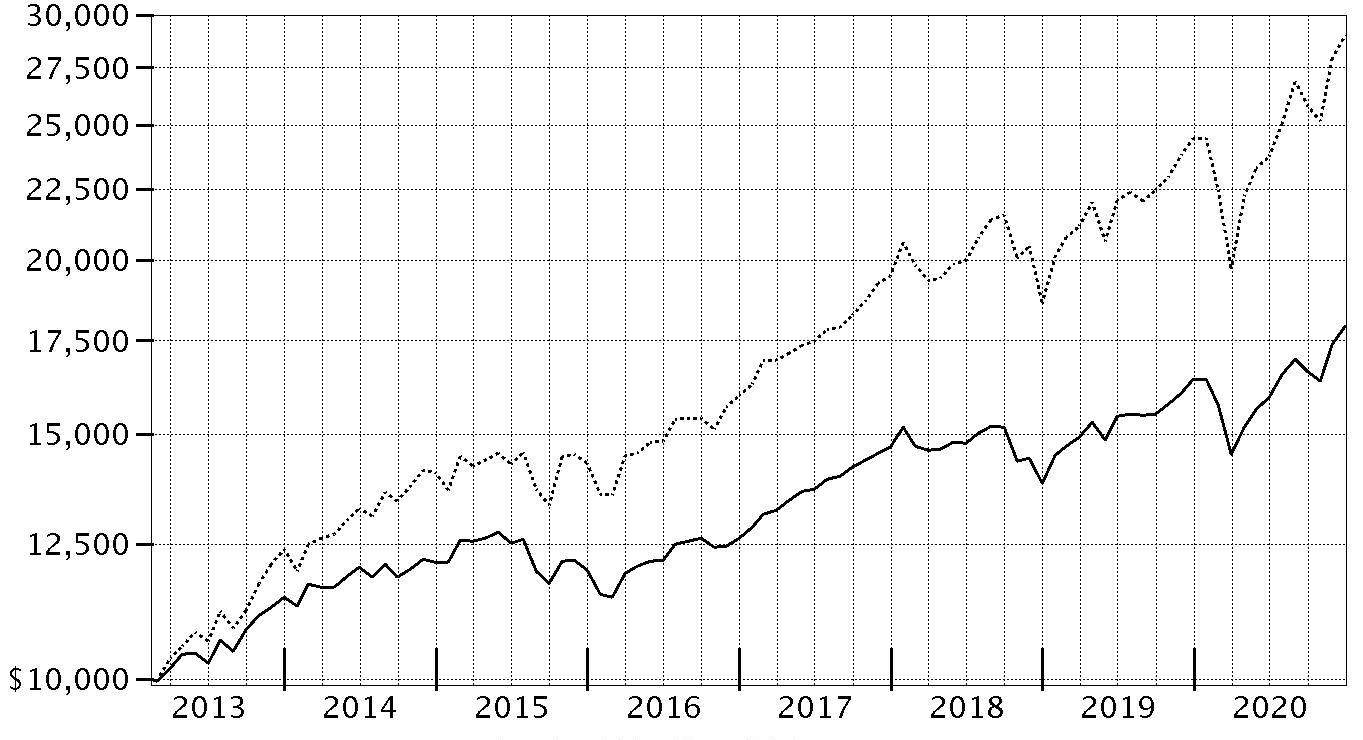
| Period Ending Values |
| $17,926 | VIP Target Volatility Portfolio - Service Class |
| $28,990 | S&P 500® Index |
Management's Discussion of Fund Performance
Market Recap: Global financial markets were highly volatile and unpredictable in 2020, a year that will be remembered by most investors for the impact of the coronavirus pandemic. The early-2020 outbreak and spread of COVID-19 resulted in a sharp decline for risk assets, followed by a historic rebound. The crisis and containment efforts led to broad contraction in economic activity and dislocation in financial markets. Rapid and expansive monetary- and fiscal-policy responses partially offset the economic disruption and fueled the market surge for many assets from late March through the end of the year.
Non-U.S. equities gained 10.81% in 2020, according to the MSCI ACWI (All Country World Index) ex USA Index, despite significant ups and downs related to the pandemic. Emerging markets (+19%) was the top region, followed by Japan (+15%) and Europe ex U.K. (+12%). Conversely, the U.K. (-10%), Canada (+6%) and Asia Pacific ex Japan (+7%) lagged. By sector, information technology (+46%) was by far the top performer, while consumer discretionary (+23%) and materials (+22%) also notably outpaced the index. Energy (-23%), real estate (-9%) and financials (-4%) all underperformed.
The Dow Jones U.S. Total Stock Market Index gained 20.79% for the year. After a sharp decline in the first quarter (-20.96%) due to the coronavirus outbreak, U.S. equities reversed course, driven by resilient corporate earnings and potential for a vaccine breakthrough, and closed the year at an all-time high. Among sectors, consumer discretionary (+47%) and information technology (+46%) led, whereas energy (-33%) fared worst, followed by real estate (-5%). Large-cap stocks performed about on par with smaller-caps, while growth handily outpaced value. Commodities notably lagged equities.
Turning to fixed income, U.S. taxable investment-grade bonds (the Bloomberg Barclays U.S. Aggregate Bond Index) rose 7.51%, as most categories generated a solid gain. Corporate bonds (+9.35%) led the way, along with commercial mortgage backed securities (+8.11%), Treasury securities (+8.00) and government bonds (7.94%). Agency bonds (+5.48%) and mortgage-backed securities (+3.87%) had smaller gains. Extended (non-core) categories outside the index were mixed, including Treasury Inflation-Protected Securities (+10.99%), high-yield bonds (+6.07%), emerging-markets debt (+5.88%) and floating-rate bank loans (+3.50%).
Comments from Lead Portfolio Manager Geoff Stein and Co-Portfolio Manager Avishek Hazrachoudhury: For the year, the fund’s share classes advanced roughly 9%, trailing the 13.57% return of the VIP Target Volatility Composite benchmark. The fund's primary objective is to target a specific level of portfolio volatility over rolling one-year periods. Market volatility rose substantially in late February and March. Consistent with the fund's objective, we quickly reduced the fund's market risk by moving to a large underweighting in U.S. and international stocks. This shift helped to substantially reduce the fund's volatility versus the Composite benchmark. While our volatility management efforts were generally successful, our risk-management efforts detracted from relative performance. This was because the fund was not positioned to fully participate in subsequent market rallies. During the second quarter, we increased the fund's equity exposure, but given our concern about continued volatility, we kept the portfolio underweighted for most of the remainder of the year. As a result, adverse results from the fund's asset class positioning more than offset a positive contribution from security selection. Our smaller-than-benchmark exposure to U.S. stocks was particularly detrimental. Non-benchmark equity allocations had a mixed impact, with commodities contributing, fueled by strong performance from gold, whereas REITs (real estate investment trusts) modestly detracted. Fixed-income positioning also hampered relative performance. Fluctuations in the fund's cash allocation for risk-management purposes accounted for part of the underperformance. Timing adjustments in our allocations to investment-grade bonds, Treasury Inflation-Protected Securities (TIPS) and long-term U.S. Treasuries further detracted from a positioning standpoint. On the plus side, strong security selection, particularly among U.S. stocks, aided the fund's relative performance. Fidelity
® Stock Selector All Cap Fund and Fidelity
® Contrafund each handily outpaced their benchmark, the S&P 500 Index, and were leading contributors. Stock picks in international developed-markets provided a further boost to relative performance, bolstered by strong performance from Fidelity Overseas Fund. Selection among investment-grade bonds also added value, fueled by Fidelity Total Bond Fund. Looking ahead, we anticipate better-than-average economic growth in 2021. We remain cautiously optimistic, as reflected by the Fund's moderate overweightings in equity and credit risk.
The views expressed above reflect those of the portfolio manager(s) only through the end of the period as stated on the cover of this report and do not necessarily represent the views of Fidelity or any other person in the Fidelity organization. Any such views are subject to change at any time based upon market or other conditions and Fidelity disclaims any responsibility to update such views. These views may not be relied on as investment advice and, because investment decisions for a Fidelity fund are based on numerous factors, may not be relied on as an indication of trading intent on behalf of any Fidelity fund.
Investment Summary (Unaudited)
The information in the following tables is based on the direct investments of the Fund.
Portfolio Composition
| % of fund's investments |
| | Domestic Equity Funds | 40.7% |
| | International Equity Funds | 20.3% |
| | Fixed-Income Funds | 33.9% |
| | Cash Equivalents | 4.7% |
| | Short-Term Investments | 0.4% |

Asset Allocation (% of fund's investments)
| As of December 31, 2020 |
| | Equities | 61.0% |
| | Bonds | 33.9% |
| | Short-Term and Other | 5.1% |

Schedule of Investments December 31, 2020
Showing Percentage of Net Assets
| Equity Funds - 61.0% | | | |
| | | Shares | Value |
| Domestic Equity Funds - 40.7% | | | |
| Fidelity Contrafund (a) | | 325,063 | $5,448,052 |
| Fidelity Equity-Income Fund (a) | | 47,607 | 2,968,310 |
| Fidelity Gold Portfolio (a) | | 154,048 | 4,547,494 |
| Fidelity Large Cap Value Enhanced Index Fund (a) | | 444,689 | 6,256,773 |
| Fidelity Low-Priced Stock Fund (a) | | 100,219 | 4,873,637 |
| Fidelity Stock Selector All Cap Fund (a) | | 1,376,216 | 78,224,102 |
| Fidelity U.S. Low Volatility Equity Fund (a) | | 508,510 | 5,456,313 |
| Fidelity Value Discovery Fund (a) | | 71,667 | 2,305,515 |
|
| TOTAL DOMESTIC EQUITY FUNDS | | | 110,080,196 |
|
| International Equity Funds - 20.3% | | | |
| Fidelity International Enhanced Index Fund (a) | | 715,464 | 7,347,816 |
| Fidelity International Value Fund (a) | | 727,896 | 6,165,275 |
| Fidelity Japan Smaller Companies Fund (a) | | 118,628 | 2,108,017 |
| Fidelity Overseas Fund (a) | | 461,929 | 27,457,043 |
| iShares Core MSCI EAFE ETF | | 135,528 | 9,363,630 |
| iShares Core MSCI Emerging Markets ETF | | 42,568 | 2,640,919 |
|
| TOTAL INTERNATIONAL EQUITY FUNDS | | | 55,082,700 |
|
| TOTAL EQUITY FUNDS | | | |
| (Cost $131,791,412) | | | 165,162,896 |
|
| Fixed-Income Funds - 33.9% | | | |
| Fixed-Income Funds - 33.9% | | | |
| Fidelity Inflation-Protected Bond Index Fund (a) | | 580,145 | 6,404,801 |
| Fidelity Long-Term Treasury Bond Index Fund (a) | | 545,713 | 8,704,121 |
| Fidelity Total Bond Fund (a) | | 4,749,770 | 53,767,393 |
| Fidelity U.S. Bond Index Fund (a) | | 1,843,426 | 22,950,650 |
| TOTAL FIXED-INCOME FUNDS | | | |
| (Cost $85,051,121) | | | 91,826,965 |
|
| U.S. Treasury Obligations - 0.4% | | | |
| U.S. Treasury Bills, yield at date of purchase 0.09% to 0.1% 1/7/21 to 1/28/21 | | | |
| (Cost $939,939) | | 940,000 | 939,965 |
|
| Cash Equivalents - 4.7% | | | |
| Fidelity Cash Central Fund 0.11% (b) | | | |
| (Cost $12,824,535) | | 12,821,971 | 12,824,535 |
| TOTAL INVESTMENT IN SECURITIES - 100.0% | | | |
| (Cost $230,607,007) | | | 270,754,361 |
| NET OTHER ASSETS (LIABILITIES) - 0.0% | | | (94,888) |
| NET ASSETS - 100% | | | $270,659,473 |
Security Type Abbreviations
ETF – Exchange-Traded Fund
Legend
(a) Affiliated Fund
(b) Affiliated fund that is generally available only to investment companies and other accounts managed by Fidelity Investments. The rate quoted is the annualized seven-day yield of the fund at period end. A complete unaudited listing of the fund's holdings as of its most recent quarter end is available upon request. In addition, each Fidelity Central Fund's financial statements, which are not covered by the Fund's Report of Independent Registered Public Accounting Firm, are available on the SEC's website or upon request.
Affiliated Central Funds
Information regarding fiscal year to date income earned by the Fund from investments in Fidelity Central Funds is as follows:
| Fund | Income earned |
| Fidelity Cash Central Fund | $75,862 |
| Total | $75,862 |
Amounts in the income column in the above table include any capital gain distributions from underlying funds, which are presented in the corresponding line-item in the Statement of Operations, if applicable.
Affiliated Underlying Funds
Fiscal year to date information regarding the Fund's investments in affiliated Underlying Funds, excluding any Money Market Central Funds, is presented below. Exchanges between classes of the same affiliated Underlying Funds may occur.
| Affiliate | Value, beginning of period | Purchases | Sales Proceeds | Dividend Income | Realized Gain (loss) | Change in Unrealized appreciation (depreciation) | Value, end of period |
| Fidelity Contrafund | $7,771,400 | $1,576,481 | $4,204,995 | $433,177 | $(298,641) | $603,807 | $5,448,052 |
| Fidelity Equity-Income Fund | 3,139,411 | 764,876 | 952,978 | 101,584 | (130,758) | 147,759 | 2,968,310 |
| Fidelity Gold Portfolio | 8,152,153 | 242,587 | 6,267,287 | 222,415 | 1,674,477 | 745,564 | 4,547,494 |
| Fidelity Inflation-Protected Bond Index Fund | 9,866,043 | 2,752,372 | 7,161,115 | 89,457 | 439,890 | 507,611 | 6,404,801 |
| Fidelity International Enhanced Index Fund | 9,191,082 | 3,342,175 | 4,943,613 | 104,672 | (720,688) | 478,860 | 7,347,816 |
| Fidelity International Value Fund | 8,352,228 | 1,690,669 | 3,440,159 | 106,346 | (987,353) | 549,890 | 6,165,275 |
| Fidelity Japan Smaller Companies Fund | 2,011,301 | 33,036 | -- | 33,035 | -- | 63,680 | 2,108,017 |
| Fidelity Large Cap Value Enhanced Index Fund | 5,526,028 | 1,899,976 | 1,394,623 | 102,670 | (124,273) | 349,665 | 6,256,773 |
| Fidelity Long-Term Treasury Bond Index Fund | 6,316,103 | 7,056,756 | 5,362,370 | 350,414 | 145,780 | 547,852 | 8,704,121 |
| Fidelity Low-Priced Stock Fund | 4,237,174 | 1,888,592 | 1,153,914 | 514,412 | (311,252) | 213,037 | 4,873,637 |
| Fidelity Mega Cap Stock Fund | 5,973,890 | 5,256 | 5,156,912 | -- | (775,723) | (46,511) | -- |
| Fidelity Overseas Fund | 23,151,624 | 9,067,797 | 8,409,584 | 136,780 | (220,474) | 3,867,680 | 27,457,043 |
| Fidelity Real Estate Investment Portfolio | 3,128,973 | 3,953 | 2,385,259 | 679 | (633,274) | (114,393) | -- |
| Fidelity Stock Selector All Cap Fund | 81,273,072 | 22,021,427 | 34,530,544 | 3,886,700 | (886,191) | 10,346,338 | 78,224,102 |
| Fidelity Total Bond Fund | 57,987,239 | 3,034,969 | 9,410,070 | 2,886,071 | 314,658 | 1,840,597 | 53,767,393 |
| Fidelity U.S. Bond Index Fund | 10,049,577 | 18,353,899 | 6,109,896 | 624,954 | 64,816 | 592,254 | 22,950,650 |
| Fidelity U.S. Low Volatility Equity Fund | -- | 5,526,319 | 620,314 | 33,804 | 26,570 | 523,738 | 5,456,313 |
| Fidelity Value Discovery Fund | 2,291,273 | 770,489 | 815,936 | 31,071 | (118,772) | 178,461 | 2,305,515 |
| Total | $248,418,571 | $80,031,629 | $102,319,569 | $9,658,241 | $(2,541,208) | $21,395,889 | $244,985,312 |
Amounts in the income column in the above table include any capital gain distributions from underlying funds, which are presented in the corresponding line-item in the Statement of Operations, if applicable.
Investment Valuation
The following is a summary of the inputs used, as of December 31, 2020, involving the Fund's assets and liabilities carried at fair value. The inputs or methodology used for valuing securities may not be an indication of the risk associated with investing in those securities. For more information on valuation inputs, and their aggregation into the levels used below, please refer to the Investment Valuation section in the accompanying Notes to Financial Statements.
| | Valuation Inputs at Reporting Date: |
| Description | Total | Level 1 | Level 2 | Level 3 |
| Investments in Securities: | | | | |
| Equity Funds | $165,162,896 | $165,162,896 | $-- | $-- |
| Fixed-Income Funds | 91,826,965 | 91,826,965 | -- | -- |
| Other Short-Term Investments and Net Other Assets | 939,965 | -- | 939,965 | -- |
| Money Market Funds | 12,824,535 | 12,824,535 | -- | -- |
| Total Investments in Securities: | $270,754,361 | $269,814,396 | $939,965 | $-- |
See accompanying notes which are an integral part of the financial statements.
Financial Statements
Statement of Assets and Liabilities
| | | December 31, 2020 |
| Assets | | |
Investment in securities, at value — See accompanying schedule:
Unaffiliated issuers (cost $11,684,780) | $12,944,514 | |
| Fidelity Central Funds (cost $12,824,535) | 12,824,535 | |
| Other affiliated issuers (cost $206,097,692) | 244,985,312 | |
| Total Investment in Securities (cost $230,607,007) | | $270,754,361 |
| Cash | | 100 |
| Receivable for investments sold | | 113,825 |
| Receivable for fund shares sold | | 10,549 |
| Dividends receivable | | 150,289 |
| Distributions receivable from Fidelity Central Funds | | 1,387 |
| Total assets | | 271,030,511 |
| Liabilities | | |
| Payable for investments purchased | $151,533 | |
| Payable for fund shares redeemed | 129,130 | |
| Accrued management fee | 55,983 | |
| Distribution and service plan fees payable | 33,400 | |
| Other affiliated payables | 992 | |
| Total liabilities | | 371,038 |
| Net Assets | | $270,659,473 |
| Net Assets consist of: | | |
| Paid in capital | | $233,922,365 |
| Total accumulated earnings (loss) | | 36,737,108 |
| Net Assets | | $270,659,473 |
| Net Asset Value and Maximum Offering Price | | |
| Service Class: | | |
| Net Asset Value, offering price and redemption price per share ($1,518,570 ÷ 116,324 shares) | | $13.05 |
| Service Class 2: | | |
| Net Asset Value, offering price and redemption price per share ($269,140,903 ÷ 20,663,896 shares) | | $13.02 |
See accompanying notes which are an integral part of the financial statements.
Statement of Operations
| | | Year ended December 31, 2020 |
| Investment Income | | |
| Dividends: | | |
| Unaffiliated issuers | | $178,273 |
| Affiliated issuers | | 3,431,812 |
| Interest | | 298 |
| Income from Fidelity Central Funds | | 75,862 |
| Total income | | 3,686,245 |
| Expenses | | |
| Management fee | $803,769 | |
| Transfer agent fees | 10,849 | |
| Distribution and service plan fees | 667,710 | |
| Independent trustees' fees and expenses | 881 | |
| Commitment fees | 643 | |
| Total expenses before reductions | 1,483,852 | |
| Expense reductions | (401,941) | |
| Total expenses after reductions | | 1,081,911 |
| Net investment income (loss) | | 2,604,334 |
| Realized and Unrealized Gain (Loss) | | |
| Net realized gain (loss) on: | | |
| Investment securities: | | |
| Unaffiliated issuers | (415,630) | |
| Fidelity Central Funds | (2,147) | |
| Other affiliated issuers | (2,541,208) | |
| Futures contracts | (4,617,958) | |
| Capital gain distributions from underlying funds: | | |
| Affiliated issuers | 6,226,429 | |
| Total net realized gain (loss) | | (1,350,514) |
| Change in net unrealized appreciation (depreciation) on: | | |
| Investment securities: | | |
| Unaffiliated issuers | (487,297) | |
| Affiliated issuers | 21,395,889 | |
| Total change in net unrealized appreciation (depreciation) | | 20,908,592 |
| Net gain (loss) | | 19,558,078 |
| Net increase (decrease) in net assets resulting from operations | | $22,162,412 |
See accompanying notes which are an integral part of the financial statements.
Statement of Changes in Net Assets
| | Year ended December 31, 2020 | Year ended December 31, 2019 |
| Increase (Decrease) in Net Assets | | |
| Operations | | |
| Net investment income (loss) | $2,604,334 | $4,521,161 |
| Net realized gain (loss) | (1,350,514) | 9,400,377 |
| Change in net unrealized appreciation (depreciation) | 20,908,592 | 35,169,618 |
| Net increase (decrease) in net assets resulting from operations | 22,162,412 | 49,091,156 |
| Distributions to shareholders | (9,794,018) | (10,963,044) |
| Share transactions - net increase (decrease) | (33,287,965) | (25,500,892) |
| Total increase (decrease) in net assets | (20,919,571) | 12,627,220 |
| Net Assets | | |
| Beginning of period | 291,579,044 | 278,951,824 |
| End of period | $270,659,473 | $291,579,044 |
See accompanying notes which are an integral part of the financial statements.
Financial Highlights
VIP Target Volatility Portfolio Service Class
| Years ended December 31, | 2020 | 2019 | 2018 | 2017 | 2016 |
| Selected Per–Share Data | | | | | |
| Net asset value, beginning of period | $12.40 | $10.86 | $12.14 | $11.22 | $10.87 |
| Income from Investment Operations | | | | | |
| Net investment income (loss)A | .14 | .20 | .19 | .17 | .15 |
| Net realized and unrealized gain (loss) | .97 | 1.81 | (.90) | 1.67 | .42 |
| Total from investment operations | 1.11 | 2.01 | (.71) | 1.84 | .57 |
| Distributions from net investment income | (.18) | (.19) | (.20)B | (.16) | (.16)B |
| Distributions from net realized gain | (.29) | (.28) | (.37)B | (.76) | (.07)B |
| Total distributions | (.46)C | (.47) | (.57) | (.92) | (.22)C |
| Net asset value, end of period | $13.05 | $12.40 | $10.86 | $12.14 | $11.22 |
| Total ReturnD,E | 9.13% | 18.81% | (5.81)% | 16.39% | 5.30% |
| Ratios to Average Net AssetsF,G | | | | | |
| Expenses before reductions | .40% | .42% | .42% | .42% | .42% |
| Expenses net of fee waivers, if any | .25% | .27% | .27% | .27% | .27% |
| Expenses net of all reductions | .25% | .27% | .27% | .27% | .26% |
| Net investment income (loss) | 1.12% | 1.72% | 1.60% | 1.43% | 1.38% |
| Supplemental Data | | | | | |
| Net assets, end of period (000 omitted) | $1,519 | $1,434 | $1,256 | $1,444 | $1,477 |
| Portfolio turnover rateH | 57% | 65% | 85% | 91% | 91% |
A Calculated based on average shares outstanding during the period.
B The amounts shown reflect certain reclassifications related to book to tax differences that were made in the year shown.
C Total distributions per share do not sum due to rounding.
D Total returns do not reflect charges attributable to your insurance company's separate account. Inclusion of these charges would reduce the total returns shown.
E Total returns would have been lower if certain expenses had not been reduced during the applicable periods shown.
F Fees and expenses of any underlying mutual funds or exchange-traded funds (ETFs) are not included in the Fund's expense ratio. The Fund indirectly bears its proportionate share of these expenses. For additional expense information related to investments in Fidelity Central Funds, please refer to the "Investments in Fidelity Central Funds" note found in the Notes to Financial Statements section of the most recent Annual or Semi-Annual report.
G Expense ratios reflect operating expenses of the class. Expenses before reductions do not reflect amounts reimbursed, waived, or reduced through arrangements with the investment adviser, brokerage services, or other offset arrangements, if applicable, and do not represent the amount paid by the class during periods when reimbursements, waivers or reductions occur.
H Amount does not include the portfolio activity of any underlying mutual funds or exchange-traded funds (ETFs).
See accompanying notes which are an integral part of the financial statements.
VIP Target Volatility Portfolio Service Class 2
| Years ended December 31, | 2020 | 2019 | 2018 | 2017 | 2016 |
| Selected Per–Share Data | | | | | |
| Net asset value, beginning of period | $12.37 | $10.83 | $12.11 | $11.19 | $10.85 |
| Income from Investment Operations | | | | | |
| Net investment income (loss)A | .12 | .18 | .17 | .16 | .13 |
| Net realized and unrealized gain (loss) | .97 | 1.81 | (.90) | 1.66 | .41 |
| Total from investment operations | 1.09 | 1.99 | (.73) | 1.82 | .54 |
| Distributions from net investment income | (.16) | (.16) | (.18)B | (.14) | (.14)B |
| Distributions from net realized gain | (.29) | (.28) | (.37)B | (.76) | (.07)B |
| Total distributions | (.44)C | (.45)C | (.55) | (.90) | (.20)C |
| Net asset value, end of period | $13.02 | $12.37 | $10.83 | $12.11 | $11.19 |
| Total ReturnD,E | 8.99% | 18.65% | (5.99)% | 16.29% | 5.06% |
| Ratios to Average Net AssetsF,G | | | | | |
| Expenses before reductions | .56% | .57% | .57% | .57% | .57% |
| Expenses net of fee waivers, if any | .40% | .42% | .42% | .42% | .42% |
| Expenses net of all reductions | .40% | .42% | .42% | .42% | .41% |
| Net investment income (loss) | .97% | 1.57% | 1.45% | 1.28% | 1.22% |
| Supplemental Data | | | | | |
| Net assets, end of period (000 omitted) | $269,141 | $290,145 | $277,696 | $295,856 | $221,591 |
| Portfolio turnover rateH | 57% | 65% | 85% | 91% | 91% |
A Calculated based on average shares outstanding during the period.
B The amounts shown reflect certain reclassifications related to book to tax differences that were made in the year shown.
C Total distributions per share do not sum due to rounding.
D Total returns do not reflect charges attributable to your insurance company's separate account. Inclusion of these charges would reduce the total returns shown.
E Total returns would have been lower if certain expenses had not been reduced during the applicable periods shown.
F Fees and expenses of any underlying mutual funds or exchange-traded funds (ETFs) are not included in the Fund's expense ratio. The Fund indirectly bears its proportionate share of these expenses. For additional expense information related to investments in Fidelity Central Funds, please refer to the "Investments in Fidelity Central Funds" note found in the Notes to Financial Statements section of the most recent Annual or Semi-Annual report.
G Expense ratios reflect operating expenses of the class. Expenses before reductions do not reflect amounts reimbursed, waived, or reduced through arrangements with the investment adviser, brokerage services, or other offset arrangements, if applicable, and do not represent the amount paid by the class during periods when reimbursements, waivers or reductions occur.
H Amount does not include the portfolio activity of any underlying mutual funds or exchange-traded funds (ETFs).
See accompanying notes which are an integral part of the financial statements.
Notes to Financial Statements
For the period ended December 31, 2020
1. Organization.
VIP Target Volatility Portfolio (the Fund) is a fund of Variable Insurance Products Fund V (the Trust) and is authorized to issue an unlimited number of shares. The Trust is registered under the Investment Company Act of 1940, as amended (the 1940 Act), as an open-end management investment company organized as a Massachusetts business trust. Shares of the Fund may only be purchased by insurance companies for the purpose of funding variable annuity or variable life insurance contracts. The Fund offers the following classes of shares: Service Class shares and Service Class 2 shares. All classes have equal rights and voting privileges, except for matters affecting a single class.
Effective January 1, 2020:
Investment advisers Fidelity Investments Money Management, Inc., FMR Co., Inc., and Fidelity SelectCo, LLC, merged with and into Fidelity Management & Research Company. In connection with the merger transactions, the resulting, merged investment adviser was then redomiciled from Massachusetts to Delaware, changed its corporate structure from a corporation to a limited liability company, and changed its name to "Fidelity Management & Research Company LLC".
Broker-dealer Fidelity Distributors Corporation merged with and into Fidelity Investments Institutional Services Company, Inc. ("FIISC"). FIISC was then redomiciled from Massachusetts to Delaware, changed its corporate structure from a corporation to a limited liability company, and changed its name to "Fidelity Distributors Company LLC".
Fidelity Investments Institutional Operations Company, Inc. converted from a Massachusetts corporation to a Massachusetts LLC, and changed its name to "Fidelity Investments Institutional Operations Company LLC".
2. Investments in Fidelity Central Funds.
The Fund invests in Fidelity Central Funds, which are open-end investment companies generally available only to other investment companies and accounts managed by the investment adviser and its affiliates. The Fund's Schedule of Investments lists each of the Fidelity Central Funds held as of period end, if any, as an investment of the Fund, but does not include the underlying holdings of each Fidelity Central Fund. As an Investing Fund, the Fund indirectly bears its proportionate share of the expenses of the underlying Fidelity Central Funds.
The Money Market Central Funds seek preservation of capital and current income and are managed by the investment adviser. Annualized expenses of the Money Market Central Funds as of their most recent shareholder report date ranged from less than .005% to .01%.
A complete unaudited list of holdings for each Fidelity Central Fund is available upon request or at the Securities and Exchange Commission (the SEC) website at www.sec.gov. In addition, the financial statements of the Fidelity Central Funds, which are not covered by the Fund's Report of Independent Registered Public Accounting Firm, are available on the SEC website or upon request.
3. Significant Accounting Policies.
The Fund is an investment company and applies the accounting and reporting guidance of the Financial Accounting Standards Board (FASB) Accounting Standards Codification Topic 946 Financial Services - Investment Companies. The financial statements have been prepared in conformity with accounting principles generally accepted in the United States of America (GAAP), which require management to make certain estimates and assumptions at the date of the financial statements. Actual results could differ from those estimates. Subsequent events, if any, through the date that the financial statements were issued have been evaluated in the preparation of the financial statements. The Fund's Schedule of Investments lists any underlying mutual funds or exchange-traded funds (ETFs) as an investment of the Fund but does not include the underlying holdings of these funds. The following summarizes the significant accounting policies of the Fund:
Investment Valuation. Investments are valued as of 4:00 p.m. Eastern time on the last calendar day of the period. The Board of Trustees (the Board) has delegated the day to day responsibility for the valuation of the Fund's investments to the Fair Value Committee (the Committee) established by the Fund's investment adviser. In accordance with valuation policies and procedures approved by the Board, the Fund attempts to obtain prices from one or more third party pricing vendors or brokers to value its investments. When current market prices, quotations or currency exchange rates are not readily available or reliable, investments will be fair valued in good faith by the Committee, in accordance with procedures adopted by the Board. Factors used in determining fair value vary by investment type and may include market or investment specific events. The frequency with which these procedures are used cannot be predicted and they may be utilized to a significant extent. The Committee oversees the Fund's valuation policies and procedures and reports to the Board on the Committee's activities and fair value determinations. The Board monitors the appropriateness of the procedures used in valuing the Fund's investments and ratifies the fair value determinations of the Committee. The Fund categorizes the inputs to valuation techniques used to value its investments into a disclosure hierarchy consisting of three levels as shown below:
- Level 1 – quoted prices in active markets for identical investments
- Level 2 – other significant observable inputs (including quoted prices for similar investments, interest rates, prepayment speeds, etc.)
- Level 3 – unobservable inputs (including the Fund's own assumptions based on the best information available)
Valuation techniques used to value the Fund's investments by major category are as follows. Investments in open-end mutual funds are valued at their closing net asset value (NAV) each business day and are categorized as Level 1 in the hierarchy. Exchange-Traded Funds (ETFs) are valued at their last sale price or official closing price as reported by a third party pricing vendor on the primary market or exchange on which they are traded and are categorized as Level 1 in the hierarchy. In the event there were no sales during the day but the exchange reports a closing bid level, ETFs are valued at the closing bid and would be categorized as Level 1 in the hierarchy. In the event there was no closing bid, ETFs may be valued by another method that the Board believes reflects fair value in accordance with the Board's fair value pricing policies and may be categorized as Level 2 in the hierarchy. The aggregate value of investments by input level as of December 31, 2020 is included at the end of the Fund's Schedule of Investments.
Investment Transactions and Income. For financial reporting purposes, the Fund's investment holdings and NAV include trades executed through the end of the last business day of the period. The NAV per share for processing shareholder transactions is calculated as of the close of business of the New York Stock Exchange (NYSE), normally 4:00 p.m. Eastern time and includes trades executed through the end of the prior business day. Gains and losses on securities sold are determined on the basis of identified cost. Income and capital gain distributions from any underlying mutual funds or exchange-traded funds (ETFs) are recorded on the ex-dividend date.
Class Allocations and Expenses. Investment income, realized and unrealized capital gains and losses, common expenses of the Fund, and certain fund-level expense reductions, if any, are allocated daily on a pro-rata basis to each class based on the relative net assets of each class to the total net assets of the Fund. Each class differs with respect to transfer agent and distribution and service plan fees incurred. Certain expense reductions may also differ by class. For the reporting period, the allocated portion of income and expenses to each class as a percent of its average net assets may vary due to the timing of recording these transactions in relation to fluctuating net assets of the classes. Expenses directly attributable to a fund are charged to that fund. Expenses attributable to more than one fund are allocated among the respective funds on the basis of relative net assets or other appropriate methods. Expenses included in the accompanying financial statements reflect the expenses of the Fund and do not include any expenses associated with any underlying mutual funds or exchange-traded funds (ETFs). Although not included in the Fund's expenses, the Fund indirectly bears its proportionate share of any underlying mutual funds or exchange-traded funds (ETFs) expenses through the impact of these expenses on each underlying mutual fund's or exchange-traded fund's (ETFs) NAV. Expense estimates are accrued in the period to which they relate and adjustments are made when actual amounts are known.
Income Tax Information and Distributions to Shareholders. Each year, the Fund intends to qualify as a regulated investment company under Subchapter M of the Internal Revenue Code, including distributing substantially all of its taxable income and realized gains. As a result, no provision for U.S. Federal income taxes is required. As of December 31, 2020, the Fund did not have any unrecognized tax benefits in the financial statements; nor is the Fund aware of any tax positions for which it is reasonably possible that the total amounts of unrecognized tax benefits will significantly change in the next twelve months. The Fund files a U.S. federal tax return, in addition to state and local tax returns as required. The Fund's federal income tax returns are subject to examination by the Internal Revenue Service (IRS) for a period of three fiscal years after they are filed. State and local tax returns may be subject to examination for an additional fiscal year depending on the jurisdiction.
Distributions are declared and recorded on the ex-dividend date. Income and capital gain distributions are declared separately for each class. Income and capital gain distributions are determined in accordance with income tax regulations, which may differ from GAAP.
Capital accounts within the financial statements are adjusted for permanent book-tax differences. These adjustments have no impact on net assets or the results of operations. Capital accounts are not adjusted for temporary book-tax differences which will reverse in a subsequent period.
Book-tax differences are primarily due to the short-term gain distributions from the Underlying Funds, futures contracts, capital loss carryforwards and losses deferred due to wash sales.
As of period end, the cost and unrealized appreciation (depreciation) in securities, and derivatives if applicable, for federal income tax purposes were as follows:
| Gross unrealized appreciation | $39,747,855 |
| Gross unrealized depreciation | (337,614) |
| Net unrealized appreciation (depreciation) | $39,410,241 |
| Tax Cost | $231,344,120 |
The tax-based components of distributable earnings as of period end were as follows:
| Undistributed ordinary income | $22,678 |
| Capital loss carryforward | $(2,695,811) |
| Net unrealized appreciation (depreciation) on securities and other investments | $39,410,241 |
Capital loss carryforwards are only available to offset future capital gains of the Fund to the extent provided by regulations and may be limited. The capital loss carryforward information presented below, including any applicable limitation, is estimated as of fiscal period end and is subject to adjustment.
| No expiration | |
| Short-term | $(2,695,811) |
| Long-term | – |
| Total capital loss carryforward | $(2,695,811) |
The tax character of distributions paid was as follows:
| | December 31, 2020 | December 31, 2019 |
| Ordinary Income | $4,980,120 | $ 4,100,487 |
| Long-term Capital Gains | 4,813,898 | 6,862,557 |
| Total | $9,794,018 | $ 10,963,044 |
4. Derivative Instruments.
Risk Exposures and the Use of Derivative Instruments. The Fund's investment objective allows the Fund to enter into various types of derivative contracts, including futures contracts Derivatives are investments whose value is primarily derived from underlying assets, indices or reference rates and may be transacted on an exchange or over-the-counter (OTC). Derivatives may involve a future commitment to buy or sell a specified asset based on specified terms, to exchange future cash flows at periodic intervals based on a notional principal amount, or for one party to make one or more payments upon the occurrence of specified events in exchange for periodic payments from the other party.
The Fund used derivatives to increase returns and to manage exposure to certain risks as defined below. The success of any strategy involving derivatives depends on analysis of numerous economic factors, and if the strategies for investment do not work as intended, the Fund may not achieve its objectives.
The Fund's use of derivatives increased or decreased its exposure to the following risk:
| Equity Risk | Equity risk relates to the fluctuations in the value of financial instruments as a result of changes in market prices (other than those arising from interest rate risk or foreign exchange risk), whether caused by factors specific to an individual investment, its issuer, or all factors affecting all instruments traded in a market or market segment.
|
The Fund is also exposed to additional risks from investing in derivatives, such as liquidity risk and counterparty credit risk. Liquidity risk is the risk that the Fund will be unable to close out the derivative in the open market in a timely manner. Counterparty credit risk is the risk that the counterparty will not be able to fulfill its obligation to the Fund. Counterparty credit risk related to exchange-traded futures contracts may be mitigated by the protection provided by the exchange on which they trade.
Investing in derivatives may involve greater risks than investing in the underlying assets directly and, to varying degrees, may involve risk of loss in excess of any initial investment and collateral received and amounts recognized in the Statement of Assets and Liabilities. In addition, there may be the risk that the change in value of the derivative contract does not correspond to the change in value of the underlying instrument.
Futures Contracts. A futures contract is an agreement between two parties to buy or sell a specified underlying instrument for a fixed price at a specified future date. The Fund used futures contracts to manage its exposure to the stock market.
Upon entering into a futures contract, a fund is required to deposit either cash or securities (initial margin) with a clearing broker in an amount equal to a certain percentage of the face value of the contract. Futures contracts are marked-to-market daily and subsequent daily payments (variation margin) are made or received by a fund depending on the daily fluctuations in the value of the futures contracts and are recorded as unrealized appreciation or (depreciation). This receivable and/or payable, if any, is included in daily variation margin on futures contracts in the Statement of Assets and Liabilities. Realized gain or (loss) is recorded upon the expiration or closing of a futures contract. The net realized gain (loss) and change in net unrealized appreciation (depreciation) on futures contracts during the period is presented in the Statement of Operations.
Any open futures contracts at period end are presented in the Schedule of Investments under the caption "Futures Contracts". The notional amount at value reflects each contract's exposure to the underlying instrument or index at period end. For the period, the average monthly notional amount at value for futures contracts in the aggregate was $6,943,272.
5. Purchases and Sales of Investments.
Purchases and sales of securities, other than short-term securities, are noted in the table below.
| | Purchases ($) | Sales ($) |
| VIP Target Volatility Portfolio | 138,058,522 | 175,094,228 |
6. Fees and Other Transactions with Affiliates.
Management Fee. Fidelity Management & Research Company LLC (the investment adviser) provides the Fund with investment management related services. For these services the Fund pays a monthly management fee to the investment adviser. The management fee is computed at an annual rate of .30% of the Fund's average net assets.
Distribution and Service Plan Fees. In accordance with Rule 12b-1 of the 1940 Act, the Fund has adopted separate 12b-1 Plans for each Service Class of shares. Each Service Class pays Fidelity Distributors Company LLC (FDC), an affiliate of the investment adviser, a service fee. For the period, the service fee is based on an annual rate of .10% of Service Class' average net assets and .25% of Service Class 2's average net assets.
For the period, total fees, all of which were re-allowed to insurance companies for the distribution of shares and providing shareholder support services, were as follows:
| Service Class | $1,399 |
| Service Class 2 | 666,311 |
| | $667,710 |
Transfer Agent Fees. Fidelity Investments Institutional Operations Company LLC (FIIOC), an affiliate of the investment adviser, is the Fund's transfer, dividend disbursing, and shareholder servicing agent. FIIOC receives an asset-based fee with respect to each class. Each class pays a fee for transfer agent services, typesetting and printing and mailing of shareholder reports, excluding mailing of proxy statements, equal to an annual rate of .14% of class-level average net assets invested in underlying mutual funds or exchange-traded funds (ETFs) that are not managed by the investment adviser or its affiliates. Effective February 1, 2020, the Board approved to change the fee from .145% to .142% for each class. For the period, transfer agent fees for each class were as follows:
| | Amount |
| Service Class | $57 |
| Service Class 2 | 10,792 |
| | $10,849 |
Interfund Trades. Funds may purchase from or sell securities to other Fidelity Funds under procedures adopted by the Board. The procedures have been designed to ensure these interfund trades are executed in accordance with Rule 17a-7 of the 1940 Act. Interfund trades are included within the respective purchases and sales amounts shown in the Purchases and Sales of Investments note.
7. Committed Line of Credit.
Certain Funds participate with other funds managed by the investment adviser or an affiliate in a $4.25 billion credit facility (the "line of credit") to be utilized for temporary or emergency purposes to fund shareholder redemptions or for other short-term liquidity purposes. The participating funds have agreed to pay commitment fees on their pro-rata portion of the line of credit, which are reflected in Commitment fees on the Statement of Operations, and are as follows:
| | Amount |
| VIP Target Volatility Portfolio | $643 |
During the period, there were no borrowings on this line of credit.
8. Expense Reductions.
The investment adviser contractually agreed to waive the Fund's management fee in an amount equal to .05% of the Funds' average net assets until April 30, 2021. During the period, the Fund's management fee was reduced by $133,961.
In addition, FMR has contractually agreed to reimburse .10% of class-level expenses for Service Class and Service Class 2. During the period, this reimbursement reduced the Fund's Service Class and Service Class 2's expenses by the following amounts:
| | Reimbursement |
| Service Class | $1,399 |
| Service Class 2 | 266,524 |
In addition, through arrangements with the Fund's custodian, credits realized as a result of certain uninvested cash balances were used to reduce the Fund's expenses. During the period, custodian credits reduced the Fund's expenses by $57.
9. Distributions to Shareholders.
Distributions to shareholders of each class were as follows:
| | Year ended
December 31, 2020 | Year ended
December 31, 2019 |
| Distributions to shareholders | | |
| Service Class | $53,693 | $54,369 |
| Service Class 2 | 9,740,325 | 10,908,675 |
| Total | $9,794,018 | $10,963,044 |
10. Share Transactions.
Transactions for each class of shares were as follows:
| | Shares | Shares | Dollars | Dollars |
| | Year ended December 31, 2020 | Year ended December 31, 2019 | Year ended December 31, 2020 | Year ended December 31, 2019 |
| Service Class | | | | |
| Shares sold | 644 | – | $7,953 | $– |
| Reinvestment of distributions | 11 | 1 | 143 | 8 |
| Shares redeemed | (6) | (5) | (73) | (58) |
| Net increase (decrease) | 649 | (4) | $8,023 | $(50) |
| Service Class 2 | | | | |
| Shares sold | 759,982 | 1,204,691 | $9,123,947 | $14,054,699 |
| Reinvestment of distributions | 773,350 | 939,001 | 9,740,325 | 10,908,675 |
| Shares redeemed | (4,326,699) | (4,327,733) | (52,160,260) | (50,464,216) |
| Net increase (decrease) | (2,793,367) | (2,184,041) | $(33,295,988) | $(25,500,842) |
11. Other.
The Fund's organizational documents provide former and current trustees and officers with a limited indemnification against liabilities arising in connection with the performance of their duties to the Fund. In the normal course of business, the Fund may also enter into contracts that provide general indemnifications. The Fund's maximum exposure under these arrangements is unknown as this would be dependent on future claims that may be made against the Fund. The risk of material loss from such claims is considered remote.
At the end of the period, one otherwise unaffiliated shareholder was the owner of record of 95% of the total outstanding shares of the Fund.
12. Coronavirus (COVID-19) Pandemic.
An outbreak of COVID-19 first detected in China during December 2019 has since spread globally and was declared a pandemic by the World Health Organization during March 2020. Developments that disrupt global economies and financial markets, such as the COVID-19 pandemic, may magnify factors that affect the Fund's performance.
Report of Independent Registered Public Accounting Firm
To the Board of Trustees of Variable Insurance Products Fund V and Shareholders of VIP Target Volatility Portfolio
Opinion on the Financial Statements
We have audited the accompanying statement of assets and liabilities, including the schedule of investments, of VIP Target Volatility Portfolio (one of the funds constituting Variable Insurance Products Fund V, referred to hereafter as the “Fund”) as of December 31, 2020, the related statement of operations for the year ended December 31, 2020, the statement of changes in net assets for each of the two years in the period ended December 31, 2020, including the related notes, and the financial highlights for each of the five years in the period ended December 31, 2020 (collectively referred to as the “financial statements”). In our opinion, the financial statements present fairly, in all material respects, the financial position of the Fund as of December 31, 2020, the results of its operations for the year then ended, the changes in its net assets for each of the two years in the period ended December 31, 2020 and the financial highlights for each of the five years in the period ended December 31, 2020 in conformity with accounting principles generally accepted in the United States of America.
Basis for Opinion
These financial statements are the responsibility of the Fund’s management. Our responsibility is to express an opinion on the Fund’s financial statements based on our audits. We are a public accounting firm registered with the Public Company Accounting Oversight Board (United States) (PCAOB) and are required to be independent with respect to the Fund in accordance with the U.S. federal securities laws and the applicable rules and regulations of the Securities and Exchange Commission and the PCAOB.
We conducted our audits of these financial statements in accordance with the standards of the PCAOB. Those standards require that we plan and perform the audit to obtain reasonable assurance about whether the financial statements are free of material misstatement, whether due to error or fraud.
Our audits included performing procedures to assess the risks of material misstatement of the financial statements, whether due to error or fraud, and performing procedures that respond to those risks. Such procedures included examining, on a test basis, evidence regarding the amounts and disclosures in the financial statements. Our audits also included evaluating the accounting principles used and significant estimates made by management, as well as evaluating the overall presentation of the financial statements. Our procedures included confirmation of securities owned as of December 31, 2020 by correspondence with the custodian and brokers; when replies were not received from brokers, we performed other auditing procedures. We believe that our audits provide a reasonable basis for our opinion.
/s/ PricewaterhouseCoopers LLP
Boston, Massachusetts
February 12, 2021
We have served as the auditor of one or more investment companies in the Fidelity group of funds since 1932.
Trustees and Officers
The Trustees, Members of the Advisory Board (if any), and officers of the trust and fund, as applicable, are listed below. The Board of Trustees governs the fund and is responsible for protecting the interests of shareholders. The Trustees are experienced executives who meet periodically throughout the year to oversee the fund's activities, review contractual arrangements with companies that provide services to the fund, oversee management of the risks associated with such activities and contractual arrangements, and review the fund's performance. If the interests of the fund and an underlying Fidelity® fund were to diverge, a conflict of interest could arise and affect how the Trustees and Members of the Advisory Board fulfill their fiduciary duties to the affected funds. FMR has structured the fund to avoid these potential conflicts, although there may be situations where a conflict of interest is unavoidable. In such instances, FMR, the Trustees, and Members of the Advisory Board would take reasonable steps to minimize and, if possible, eliminate the conflict. Each of the Trustees oversees 280 funds.
The Trustees hold office without limit in time except that (a) any Trustee may resign; (b) any Trustee may be removed by written instrument, signed by at least two-thirds of the number of Trustees prior to such removal; (c) any Trustee who requests to be retired or who has become incapacitated by illness or injury may be retired by written instrument signed by a majority of the other Trustees; and (d) any Trustee may be removed at any special meeting of shareholders by a two-thirds vote of the outstanding voting securities of the trust. Each Trustee who is not an interested person (as defined in the 1940 Act) of the trust and the fund is referred to herein as an Independent Trustee. Each Independent Trustee shall retire not later than the last day of the calendar year in which his or her 75th birthday occurs. The Independent Trustees may waive this mandatory retirement age policy with respect to individual Trustees. Officers and Advisory Board Members hold office without limit in time, except that any officer or Advisory Board Member may resign or may be removed by a vote of a majority of the Trustees at any regular meeting or any special meeting of the Trustees. Except as indicated, each individual has held the office shown or other offices in the same company for the past five years.
The fund’s Statement of Additional Information (SAI) includes more information about the Trustees. To request a free copy, call Fidelity at 1-877-208-0098.
Experience, Skills, Attributes, and Qualifications of the Trustees. The Governance and Nominating Committee has adopted a statement of policy that describes the experience, qualifications, attributes, and skills that are necessary and desirable for potential Independent Trustee candidates (Statement of Policy). The Board believes that each Trustee satisfied at the time he or she was initially elected or appointed a Trustee, and continues to satisfy, the standards contemplated by the Statement of Policy. The Governance and Nominating Committee also engages professional search firms to help identify potential Independent Trustee candidates who have the experience, qualifications, attributes, and skills consistent with the Statement of Policy. From time to time, additional criteria based on the composition and skills of the current Independent Trustees, as well as experience or skills that may be appropriate in light of future changes to board composition, business conditions, and regulatory or other developments, have also been considered by the professional search firms and the Governance and Nominating Committee. In addition, the Board takes into account the Trustees' commitment and participation in Board and committee meetings, as well as their leadership of standing and ad hoc committees throughout their tenure.
In determining that a particular Trustee was and continues to be qualified to serve as a Trustee, the Board has considered a variety of criteria, none of which, in isolation, was controlling. The Board believes that, collectively, the Trustees have balanced and diverse experience, qualifications, attributes, and skills, which allow the Board to operate effectively in governing the fund and protecting the interests of shareholders. Information about the specific experience, skills, attributes, and qualifications of each Trustee, which in each case led to the Board's conclusion that the Trustee should serve (or continue to serve) as a trustee of the fund, is provided below.
Board Structure and Oversight Function. Abigail P. Johnson is an interested person and currently serves as Chairman. The Trustees have determined that an interested Chairman is appropriate and benefits shareholders because an interested Chairman has a personal and professional stake in the quality and continuity of services provided to the fund. Independent Trustees exercise their informed business judgment to appoint an individual of their choosing to serve as Chairman, regardless of whether the Trustee happens to be independent or a member of management. The Independent Trustees have determined that they can act independently and effectively without having an Independent Trustee serve as Chairman and that a key structural component for assuring that they are in a position to do so is for the Independent Trustees to constitute a substantial majority for the Board. The Independent Trustees also regularly meet in executive session. Arthur E. Johnson serves as Chairman of the Independent Trustees and as such (i) acts as a liaison between the Independent Trustees and management with respect to matters important to the Independent Trustees and (ii) with management prepares agendas for Board meetings.
Fidelity® funds are overseen by different Boards of Trustees. The fund's Board oversees Fidelity's investment-grade bond, money market, asset allocation and certain equity funds, and other Boards oversee Fidelity's high income and other equity funds. The asset allocation funds may invest in Fidelity® funds that are overseen by such other Boards. The use of separate Boards, each with its own committee structure, allows the Trustees of each group of Fidelity® funds to focus on the unique issues of the funds they oversee, including common research, investment, and operational issues. On occasion, the separate Boards establish joint committees to address issues of overlapping consequences for the Fidelity® funds overseen by each Board.
The Trustees operate using a system of committees to facilitate the timely and efficient consideration of all matters of importance to the Trustees, the fund, and fund shareholders and to facilitate compliance with legal and regulatory requirements and oversight of the fund's activities and associated risks. The Board, acting through its committees, has charged FMR and its affiliates with (i) identifying events or circumstances the occurrence of which could have demonstrably adverse effects on the fund's business and/or reputation; (ii) implementing processes and controls to lessen the possibility that such events or circumstances occur or to mitigate the effects of such events or circumstances if they do occur; and (iii) creating and maintaining a system designed to evaluate continuously business and market conditions in order to facilitate the identification and implementation processes described in (i) and (ii) above. Because the day-to-day operations and activities of the fund are carried out by or through FMR, its affiliates, and other service providers, the fund's exposure to risks is mitigated but not eliminated by the processes overseen by the Trustees. While each of the Board's committees has responsibility for overseeing different aspects of the fund's activities, oversight is exercised primarily through the Operations and Audit Committees. In addition, an ad hoc Board committee of Independent Trustees has worked with FMR to enhance the Board's oversight of investment and financial risks, legal and regulatory risks, technology risks, and operational risks, including the development of additional risk reporting to the Board. Appropriate personnel, including but not limited to the fund's Chief Compliance Officer (CCO), FMR's internal auditor, the independent accountants, the fund's Treasurer and portfolio management personnel, make periodic reports to the Board's committees, as appropriate, including an annual review of Fidelity's risk management program for the Fidelity® funds. The responsibilities of each standing committee, including their oversight responsibilities, are described further under "Standing Committees of the Trustees."
Interested Trustees*:
Correspondence intended for a Trustee who is an interested person may be sent to Fidelity Investments, 245 Summer Street, Boston, Massachusetts 02210.
Name, Year of Birth; Principal Occupations and Other Relevant Experience+
Abigail P. Johnson (1961)
Year of Election or Appointment: 2009
Trustee
Chairman of the Board of Trustees
Ms. Johnson also serves as Trustee of other Fidelity® funds. Ms. Johnson serves as Chairman (2016-present), Chief Executive Officer (2014-present), and Director (2007-present) of FMR LLC (diversified financial services company), President of Fidelity Financial Services (2012-present) and President of Personal, Workplace and Institutional Services (2005-present). Ms. Johnson is Chairman and Director of Fidelity Management & Research Company LLC (investment adviser firm, 2011-present). Previously, Ms. Johnson served as Chairman and Director of FMR Co., Inc. (investment adviser firm, 2011-2019), Vice Chairman (2007-2016) and President (2013-2016) of FMR LLC, President and a Director of Fidelity Management & Research Company (2001-2005), a Trustee of other investment companies advised by Fidelity Management & Research Company, Fidelity Investments Money Management, Inc. (investment adviser firm), and FMR Co., Inc. (2001-2005), Senior Vice President of the Fidelity® funds (2001-2005), and managed a number of Fidelity® funds. Ms. Abigail P. Johnson and Mr. Arthur E. Johnson are not related.
Jennifer Toolin McAuliffe (1959)
Year of Election or Appointment: 2016
Trustee
Ms. McAuliffe also serves as Trustee of other Fidelity® funds. Previously, Ms. McAuliffe served as Co-Head of Fixed Income of Fidelity Investments Limited (now known as FIL Limited (FIL)) (diversified financial services company), Director of Research for FIL’s credit and quantitative teams in London, Hong Kong and Tokyo and Director of Research for taxable and municipal bonds at Fidelity Investments Money Management, Inc. Ms. McAuliffe previously served as a member of the Advisory Board of certain Fidelity® funds (2016). Ms. McAuliffe was previously a lawyer at Ropes & Gray LLP and currently serves as director or trustee of several not-for-profit entities.
* Determined to be an “Interested Trustee” by virtue of, among other things, his or her affiliation with the trust or various entities under common control with FMR.
+ The information includes the Trustee's principal occupation during the last five years and other information relating to the experience, attributes, and skills relevant to the Trustee's qualifications to serve as a Trustee, which led to the conclusion that the Trustee should serve as a Trustee for the fund.
Independent Trustees:
Correspondence intended for an Independent Trustee may be sent to Fidelity Investments, P.O. Box 55235, Boston, Massachusetts 02205-5235.
Name, Year of Birth; Principal Occupations and Other Relevant Experience+
Elizabeth S. Acton (1951)
Year of Election or Appointment: 2013
Trustee
Ms. Acton also serves as Trustee of other Fidelity® funds. Prior to her retirement, Ms. Acton served as Executive Vice President, Finance (2011-2012), Executive Vice President, Chief Financial Officer (2002-2011) and Treasurer (2004-2005) of Comerica Incorporated (financial services). Prior to joining Comerica, Ms. Acton held a variety of positions at Ford Motor Company (1983-2002), including Vice President and Treasurer (2000-2002) and Executive Vice President and Chief Financial Officer of Ford Motor Credit Company (1998-2000). Ms. Acton currently serves as a member of the Board and Audit and Finance Committees of Beazer Homes USA, Inc. (homebuilding, 2012-present). Ms. Acton previously served as a member of the Advisory Board of certain Fidelity® funds (2013-2016).
Ann E. Dunwoody (1953)
Year of Election or Appointment: 2018
Trustee
General Dunwoody also serves as Trustee of other Fidelity® funds. General Dunwoody (United States Army, Retired) was the first woman in U.S. military history to achieve the rank of four-star general and prior to her retirement in 2012 held a variety of positions within the U.S. Army, including Commanding General, U.S. Army Material Command (2008-2012). General Dunwoody currently serves as President of First to Four LLC (leadership and mentoring services, 2012-present), a member of the Board and Nomination and Corporate Governance Committees of Kforce Inc. (professional staffing services, 2016-present) and a member of the Board of Automattic Inc. (software engineering, 2018-present). Previously, General Dunwoody served as a member of the Advisory Board and Nominating and Corporate Governance Committee of L3 Technologies, Inc. (communication, electronic, sensor and aerospace systems, 2013-2019) and a member of the Board and Audit and Sustainability and Corporate Responsibility Committees of Republic Services, Inc. (waste collection, disposal and recycling, 2013-2016). Ms. Dunwoody also serves on several boards for non-profit organizations, including as a member of the Board, Chair of the Nomination and Governance Committee and a member of the Audit Committee of Logistics Management Institute (consulting non-profit, 2012-present), a member of the Council of Trustees for the Association of the United States Army (advocacy non-profit, 2013-present), a member of the Board of Florida Institute of Technology (2015-present) and a member of the Board of ThanksUSA (military family education non-profit, 2014-present). General Dunwoody previously served as a member of the Advisory Board of certain Fidelity® funds (2018).
John Engler (1948)
Year of Election or Appointment: 2014
Trustee
Mr. Engler also serves as Trustee of other Fidelity® funds. Previously, Mr. Engler served as Governor of Michigan (1991-2003), President of the Business Roundtable (2011-2017) and interim President of Michigan State University (2018-2019). Mr. Engler currently serves as a member of the Board of K12 Inc. (technology-based education company, 2012-present). Previously, Mr. Engler served as a member of the Board of Universal Forest Products (manufacturer and distributor of wood and wood-alternative products, 2003-2019) and Trustee of The Munder Funds (2003-2014). Mr. Engler previously served as a member of the Advisory Board of certain Fidelity® funds (2014-2016).
Robert F. Gartland (1951)
Year of Election or Appointment: 2010
Trustee
Mr. Gartland also serves as Trustee of other Fidelity® funds. Prior to his retirement, Mr. Gartland held a variety of positions at Morgan Stanley (financial services, 1979-2007), including Managing Director (1987-2007) and Chase Manhattan Bank (1975-1978). Mr. Gartland previously served as Chairman and an investor in Gartland & Mellina Group Corp. (consulting, 2009-2019), as a member of the Board of National Securities Clearing Corporation (1993-1996) and as Chairman of TradeWeb (2003-2004).
Arthur E. Johnson (1947)
Year of Election or Appointment: 2008
Trustee
Chairman of the Independent Trustees
Mr. Johnson also serves as Trustee of other Fidelity® funds. Prior to his retirement, Mr. Johnson served as Senior Vice President of Corporate Strategic Development of Lockheed Martin Corporation (defense contractor, 1999-2009). Mr. Johnson currently serves as a member of the Board of Booz Allen Hamilton (management consulting, 2011-present). Mr. Johnson previously served as a member of the Board of Eaton Corporation plc (diversified power management, 2009-2019) and a member of the Board of AGL Resources, Inc. (holding company, 2002-2016). Mr. Johnson previously served as Vice Chairman (2015-2018) of the Independent Trustees of certain Fidelity® funds. Mr. Arthur E. Johnson is not related to Ms. Abigail P. Johnson.
Michael E. Kenneally (1954)
Year of Election or Appointment: 2009
Trustee
Vice Chairman of the Independent Trustees
Mr. Kenneally also serves as Trustee of other Fidelity® funds. Prior to his retirement, Mr. Kenneally served as Chairman and Global Chief Executive Officer of Credit Suisse Asset Management and Executive Vice President and Chief Investment Officer of Bank of America Corporation. Earlier roles at Bank of America included Director of Research, Senior Portfolio Manager for various institutional equity accounts and mutual funds and Portfolio Manager for a number of institutional fixed-income clients. Mr. Kenneally began his career as a Research Analyst in 1983 and was awarded the Chartered Financial Analyst (CFA) designation in 1991.
Marie L. Knowles (1946)
Year of Election or Appointment: 2001
Trustee
Ms. Knowles also serves as Trustee of other Fidelity® funds. Prior to her retirement, Ms. Knowles held several positions at Atlantic Richfield Company (diversified energy), including Executive Vice President and Chief Financial Officer (1996-2000), Senior Vice President (1993-1996) and President of ARCO Transportation Company (pipeline and tanker operations, 1993-1996). Ms. Knowles currently serves as a member of the Board of McKesson Corporation (healthcare service, since 2002), a member of the Board of the Santa Catalina Island Company (real estate, 2009-present), a member of the Investment Company Institute Board of Governors and a member of the Governing Council of the Independent Directors Council (2014-present). Ms. Knowles also serves as a member of the Advisory Board for the School of Engineering of the University of Southern California. Ms. Knowles previously served as Chairman (2015-2018) and Vice Chairman (2012-2015) of the Independent Trustees of certain Fidelity® funds.
Mark A. Murray (1954)
Year of Election or Appointment: 2016
Trustee
Mr. Murray also serves as Trustee of other Fidelity® funds. Previously, Mr. Murray served as Co-Chief Executive Officer (2013-2016), President (2006-2013) and Vice Chairman (2013-2020) of Meijer, Inc. Mr. Murray serves as a member of the Board and Nuclear Review and Public Policy and Responsibility Committees of DTE Energy Company (diversified energy company, 2009-present) and a member of the Board and Audit Committee and Chairman of the Nominating and Corporate Governance Committee of Universal Forest Products, Inc. (manufacturer and distributor of wood and wood-alternative products, 2004-2016). Mr. Murray previously served as a member of the Board of Spectrum Health (not-for-profit health system, 2015-2019). Mr. Murray also serves as a member of the Board of many community and professional organizations. Mr. Murray previously served as a member of the Advisory Board of certain Fidelity® funds (2016).
+ The information includes the Trustee's principal occupation during the last five years and other information relating to the experience, attributes, and skills relevant to the Trustee's qualifications to serve as a Trustee, which led to the conclusion that the Trustee should serve as a Trustee for the fund.
Advisory Board Members and Officers:
Correspondence intended for an officer may be sent to Fidelity Investments, 245 Summer Street, Boston, Massachusetts 02210. Officers appear below in alphabetical order.
Name, Year of Birth; Principal Occupation
Craig S. Brown (1977)
Year of Election or Appointment: 2019
Assistant Treasurer
Mr. Brown also serves as Assistant Treasurer of other funds. Mr. Brown is an employee of Fidelity Investments (2013-present).
John J. Burke III (1964)
Year of Election or Appointment: 2018
Chief Financial Officer
Mr. Burke also serves as Chief Financial Officer of other funds. Mr. Burke serves as Head of Investment Operations for Fidelity Fund and Investment Operations (2018-present) and is an employee of Fidelity Investments (1998-present). Previously Mr. Burke served as head of Asset Management Investment Operations (2012-2018).
David J. Carter (1973)
Year of Election or Appointment: 2020
Assistant Secretary
Mr. Carter also serves as Assistant Secretary of other funds. Mr. Carter serves as Vice President, Associate General Counsel (2010-present) and is an employee of Fidelity Investments (2005-present).
Jonathan Davis (1968)
Year of Election or Appointment: 2010
Assistant Treasurer
Mr. Davis also serves as Assistant Treasurer of other funds. Mr. Davis serves as Assistant Treasurer of FMR Capital, Inc. (2017-present) and is an employee of Fidelity Investments. Previously, Mr. Davis served as Vice President and Associate General Counsel of FMR LLC (diversified financial services company, 2003-2010).
Laura M. Del Prato (1964)
Year of Election or Appointment: 2018
President and Treasurer
Ms. Del Prato also serves as an officer of other funds. Ms. Del Prato is an employee of Fidelity Investments (2017-present). Previously, Ms. Del Prato served as President and Treasurer of The North Carolina Capital Management Trust: Cash Portfolio and Term Portfolio (2018-2020). Prior to joining Fidelity Investments, Ms. Del Prato served as a Managing Director and Treasurer of the JPMorgan Mutual Funds (2014-2017). Prior to JPMorgan, Ms. Del Prato served as a partner at Cohen Fund Audit Services (accounting firm, 2012-2013) and KPMG LLP (accounting firm, 2004-2012).
Colm A. Hogan (1973)
Year of Election or Appointment: 2016
Assistant Treasurer
Mr. Hogan also serves as an officer of other funds. Mr. Hogan serves as Assistant Treasurer of FMR Capital, Inc. (2017-present) and is an employee of Fidelity Investments (2005-present). Previously, Mr. Hogan served as Deputy Treasurer of certain Fidelity® funds (2016-2020) and Assistant Treasurer of certain Fidelity® funds (2016-2018).
Cynthia Lo Bessette (1969)
Year of Election or Appointment: 2019
Secretary and Chief Legal Officer (CLO)
Ms. Lo Bessette also serves as an officer of other funds. Ms. Lo Bessette serves as CLO, Secretary, and Senior Vice President of Fidelity Management & Research Company LLC (investment adviser firm, 2019-present); and CLO of Fidelity Management & Research (Hong Kong) Limited, FMR Investment Management (UK) Limited, and Fidelity Management & Research (Japan) Limited (investment adviser firms, 2019-present). She is a Senior Vice President and Deputy General Counsel of FMR LLC (diversified financial services company, 2019-present), and is an employee of Fidelity Investments. Previously, Ms. Lo Bessette served as CLO, Secretary, and Senior Vice President of FMR Co., Inc. (investment adviser firm, 2019); Secretary of Fidelity SelectCo, LLC and Fidelity Investments Money Management, Inc. (investment adviser firms, 2019). Prior to joining Fidelity Investments, Ms. Lo Bessette was Executive Vice President, General Counsel (2016-2019) and Senior Vice President, Deputy General Counsel (2015-2016) of OppenheimerFunds (investment management company) and Deputy Chief Legal Officer (2013-2015) of Jennison Associates LLC (investment adviser firm).
Chris Maher (1972)
Year of Election or Appointment: 2013
Assistant Treasurer
Mr. Maher also serves as an officer of other funds. Mr. Maher serves as Assistant Treasurer of FMR Capital, Inc. (2017-present), and is an employee of Fidelity Investments (2008-present). Previously, Mr. Maher served as Assistant Treasurer of certain funds (2013-2020); Vice President of Asset Management Compliance (2013), Vice President of the Program Management Group of FMR (investment adviser firm, 2010-2013), and Vice President of Valuation Oversight (2008-2010).
Kenneth B. Robins (1969)
Year of Election or Appointment: 2020
Chief Compliance Officer
Mr. Robins also serves as an officer of other funds. Mr. Robins serves as Compliance Officer of Fidelity Management & Research Company LLC (investment adviser firm, 2016-present) and is an employee of Fidelity Investments (2004-present). Previously, Mr. Robins served as Compliance Officer of FMR Co., Inc. (investment adviser firm, 2016-2019), as Executive Vice President of Fidelity Investments Money Management, Inc. (investment adviser firm, 2013-2016) and served in other fund officer roles.
Brett Segaloff (1972)
Year of Election or Appointment: 2021
Anti-Money Laundering (AML) Officer
Mr. Segaloff also serves as an AML Officer of other funds and other related entities. He is Director, Anti-Money Laundering (2007-present) of FMR LLC (diversified financial services company) and is an employee of Fidelity Investments (1996-present).
Stacie M. Smith (1974)
Year of Election or Appointment: 2013
Assistant Treasurer
Ms. Smith also serves as an officer of other funds. Ms. Smith serves as Assistant Treasurer of FMR Capital, Inc. (2017-present), is an employee of Fidelity Investments (2009-present), and has served in other fund officer roles. Prior to joining Fidelity Investments, Ms. Smith served as Senior Audit Manager of Ernst & Young LLP (accounting firm, 1996-2009). Previously, Ms. Smith served as Assistant Treasurer (2013-2019) and Deputy Treasurer (2013-2016) of certain Fidelity® funds.
Marc L. Spector (1972)
Year of Election or Appointment: 2016
Deputy Treasurer
Mr. Spector also serves as an officer of other funds. Mr. Spector serves as Assistant Treasurer of FMR Capital, Inc. (2017-present) and is an employee of Fidelity Investments (2016-present). Prior to joining Fidelity Investments, Mr. Spector served as Director at the Siegfried Group (accounting firm, 2013-2016), and prior to Siegfried Group as audit senior manager at Deloitte & Touche LLP (accounting firm, 2005-2013).
Jim Wegmann (1979)
Year of Election or Appointment: 2019
Assistant Treasurer
Mr. Wegmann also serves as Assistant Treasurer of other funds. Mr. Wegmann is an employee of Fidelity Investments (2011-present).
Vadim Zlotnikov (1962)
Year of Election or Appointment: 2019
Vice President
Mr. Zlotnikov also serves as Vice President of other funds. Mr. Zlotnikov serves as President of FIAM (Fidelity Institutional Asset Management) and is an employee of Fidelity Investments (2018-present). Previously, Mr. Zlotnikov served as President and Chief Investment Officer of Global Asset Allocation (2018-2020). Prior to joining Fidelity Investments, Mr. Zlotnikov served as Co-Head of Multi-Asset Solutions, Chief Market Strategist, and CIO of Systematic Strategies with AllianceBernstein (investment adviser firm, 2002-2018).
Shareholder Expense Example
As a shareholder, you incur two types of costs: (1) transaction costs, which may include sales charges (loads) on purchase payments or redemption proceeds, as applicable and (2) ongoing costs, which generally include management fees, distribution and/or service (12b-1) fees and other Fund expenses. This Example is intended to help you understand your ongoing costs (in dollars) of investing in a fund and to compare these costs with the ongoing costs of investing in other mutual funds.
The Example is based on an investment of $1,000 invested at the beginning of the period and held for the entire period (July 1, 2020 to December 31, 2020).
Actual Expenses
The first line of the accompanying table provides information about actual account values and actual expenses. You may use the information in this line, together with the amount you invested, to estimate the expenses that you paid over the period. Simply divide your account value by $1,000.00 (for example, an $8,600 account value divided by $1,000.00 = 8.6), then multiply the result by the number in the first line for a class/Fund under the heading entitled "Expenses Paid During Period" to estimate the expenses you paid on your account during this period. If any fund is a shareholder of any underlying mutual funds or exchange-traded funds (ETFs) (the Underlying Funds), such fund indirectly bears its proportional share of the expenses of the Underlying Funds in addition to the direct expenses incurred presented in the table. These fees and expenses are not included in the annualized expense ratio used to calculate the expense estimate in the table below. The estimate of expenses does not include any fees or other expenses of any variable annuity or variable life insurance product. If they were, the estimate of expenses you paid during the period would be higher, and your ending account value would be lower.
Hypothetical Example for Comparison Purposes
The second line of the accompanying table provides information about hypothetical account values and hypothetical expenses based on the actual expense ratio and an assumed rate of return of 5% per year before expenses, which is not the actual return. The hypothetical account values and expenses may not be used to estimate the actual ending account balance or expenses you paid for the period. You may use this information to compare the ongoing costs of investing in the Fund and other funds. To do so, compare this 5% hypothetical example with the 5% hypothetical examples that appear in the shareholder reports of the other funds. If any fund is a shareholder of any Underlying Funds, such fund indirectly bears its proportional share of the expenses of the Underlying Funds in addition to the direct expenses as presented in the table. These fees and expenses are not included in the annualized expense ratio used to calculate the expense estimate in the table below. The estimate of expenses does not include any fees or other expenses of any variable annuity or variable life insurance product. If they were, the estimate of expenses you paid during the period would be higher, and your ending account value would be lower.
Please note that the expenses shown in the table are meant to highlight your ongoing costs only and do not reflect any transaction costs. Therefore, the second line of the table is useful in comparing ongoing costs only, and will not help you determine the relative total costs of owning different funds.
| | Annualized Expense Ratio-A | Beginning
Account Value
July 1, 2020 | Ending
Account Value
December 31, 2020 | Expenses Paid
During Period-B
July 1, 2020
to December 31, 2020 |
| VIP Target Volatility Portfolio | | | | |
| Service Class | .26% | | | |
| Actual | | $1,000.00 | $1,125.00 | $1.39 |
| Hypothetical-C | | $1,000.00 | $1,023.83 | $1.32 |
| Service Class 2 | .41% | | | |
| Actual | | $1,000.00 | $1,124.60 | $2.19 |
| Hypothetical-C | | $1,000.00 | $1,023.08 | $2.08 |
A Annualized expense ratio reflects expenses net of applicable fee waivers.
B Expenses are equal to the annualized expense ratio, multiplied by the average account value over the period, multiplied by 184/ 366 (to reflect the one-half year period). The fees and expenses of any Underlying Funds are not included in each annualized expense ratio.
C 5% return per year before expenses
Distributions (Unaudited)
A total of 7.66% of the dividends distributed during the fiscal year was derived from interest on U.S. Government securities which is generally exempt from state income tax.
Service Class designates 1%, and 22% and Service Class 2 designates 1% and 24% of the dividends distributed in February and December, respectively during the fiscal year as qualifying for the dividends–received deduction for corporate shareholders.
The amounts per share which represent income derived from sources within, and taxes paid to, foreign countries or possessions of the United States are as follows:
| | Pay Date | Income | Taxes |
| VIP Target Volatility Portfolio | | | |
| Service Class | 12/30/20 | $0.0372 | $0.0038 |
| Service Class 2 | 12/30/20 | $0.0340 | $0.0038 |
|
Board Approval of Investment Advisory Contracts and Management Fees
VIP Target Volatility Portfolio
Each year, the Board of Trustees, including the Independent Trustees (together, the Board), votes on the renewal of the management contract with Fidelity Management & Research Company LLC (FMR) (the Advisory Contract) for the fund. The Board, assisted by the advice of fund counsel and Independent Trustees' counsel, requests and considers a broad range of information relevant to the renewal of the Advisory Contract throughout the year.
The Board meets regularly and, at each of its meetings, covers an extensive agenda of topics and materials and considers factors that are relevant to its annual consideration of the renewal of the fund's Advisory Contract, including the services and support provided to the fund and its shareholders. The Board has established four standing committees (Committees) — Operations, Audit, Fair Valuation, and Governance and Nominating — each composed of and chaired by Independent Trustees with varying backgrounds, to which the Board has assigned specific subject matter responsibilities in order to enhance effective decision-making by the Board. The Operations Committee, of which all of the Independent Trustees are members, meets regularly throughout the year and considers, among other matters, information specifically related to the annual consideration of the renewal of the fund's Advisory Contract. The Board, acting directly and through its Committees, requests and receives information concerning the annual consideration of the renewal of the fund's Advisory Contract. The Board also meets as needed to review matters specifically related to the Board's annual consideration of the renewal of the Advisory Contract. Members of the Board may also meet with trustees of other Fidelity funds through joint ad hoc committees to discuss certain matters relevant to all of the Fidelity funds.
At its September 2020 meeting, the Board unanimously determined to renew the fund's Advisory Contract. In reaching its determination, the Board considered all factors it believed relevant, including (i) the nature, extent, and quality of the services provided to the fund and its shareholders (including the investment performance of the fund); (ii) the competitiveness of the fund's management fee and total expense ratio relative to peer funds; (iii) the total costs of the services provided by and the profits realized by Fidelity from its relationships with the fund; and (iv) the extent to which, if any, economies of scale exist and are realized as the fund grows, and whether any economies of scale are appropriately shared with fund shareholders.
In considering whether to renew the Advisory Contract for the fund, the Board reached a determination, with the assistance of fund counsel and Independent Trustees' counsel and through the exercise of its business judgment, that the renewal of the Advisory Contract was in the best interests of the fund and its shareholders and that the compensation payable under the Advisory Contract was fair and reasonable. The Board's decision to renew the Advisory Contract was not based on any single factor, but rather was based on a comprehensive consideration of all the information provided to the Board at its meetings throughout the year. The Board, in reaching its determination to renew the Advisory Contract, was aware that shareholders of the fund have a broad range of investment choices available to them, including a wide choice among funds offered by Fidelity's competitors, and that the fund's shareholders, who have the opportunity to review and weigh the disclosure provided by the fund in its prospectus and other public disclosures, have chosen to invest in this fund, which is part of the Fidelity family of funds.
Nature, Extent, and Quality of Services Provided. The Board considered Fidelity's staffing as it relates to the fund, including the backgrounds of investment personnel of FMR, and also considered the fund's investment objective, strategies, and related investment philosophy. The Independent Trustees also had discussions with senior management of Fidelity's investment operations and investment groups with responsibility for the underlying Fidelity funds in which the fund invests. The Board considered the structure of the investment personnel compensation program and whether this structure provides appropriate incentives to act in the best interests of the fund. Additionally, the Board considered the portfolio managers' investments, if any, in the funds that they manage.
Resources Dedicated to Investment Management and Support Services. The Board reviewed the general qualifications and capabilities of Fidelity's investment staff, including its size, education, experience, and resources, as well as Fidelity's approach to recruiting, managing, and compensating investment personnel. The Board noted that Fidelity has continued to increase the resources devoted to non-U.S. offices, including expansion of Fidelity's global investment organization. The Board also noted that Fidelity's analysts have extensive resources, tools and capabilities that allow them to conduct sophisticated quantitative and fundamental analysis, as well as credit analysis of issuers, counterparties and guarantors. Further, the Board considered that Fidelity's investment professionals have sufficient access to global information and data so as to provide competitive investment results over time, and that those professionals also have access to sophisticated tools that permit them to assess portfolio construction and risk and performance attribution characteristics continuously, as well as to transmit new information and research conclusions rapidly around the world. Additionally, in its deliberations, the Board considered Fidelity's trading, risk management, compliance, and technology and operations capabilities and resources, which are integral parts of the investment management process. The Board also considered Fidelity's investments in business continuity planning, and its success in continuously providing services to the fund notwithstanding the severe disruptions caused by the COVID-19 pandemic.
Shareholder and Administrative Services. The Board considered (i) the nature, extent, quality, and cost of advisory, administrative, and shareholder services performed by Fidelity under the Advisory Contract and under separate agreements covering transfer agency, pricing and bookkeeping, and securities lending services for the fund; (ii) the nature and extent of the supervision of third party service providers, principally custodians, subcustodians, and pricing vendors; and (iii) the resources devoted to, and the record of compliance with, the fund's compliance policies and procedures. The Board also reviewed the allocation of fund brokerage, including allocations to brokers affiliated with the investment adviser, the use of brokerage commissions to pay fund expenses, and the use of "soft" commission dollars to pay for research services.
The Board noted that the growth of fund assets over time across the complex allows Fidelity to reinvest in the development of services designed to enhance the value and convenience of the Fidelity funds as investment vehicles. These services include 24-hour access to account information and market information over the Internet and through telephone representatives, investor education materials and asset allocation tools, and the expanded availability of Fidelity Investor Centers.
Investment in a Large Fund Family. The Board considered the benefits to shareholders of investing in a Fidelity fund, including the benefits of investing in a fund that is part of a large family of funds offering a variety of investment disciplines and providing a large variety of mutual fund investor services. The Board noted that Fidelity had taken, or had made recommendations that resulted in the Fidelity funds taking, a number of actions over the previous year that benefited particular funds, including: (i) continuing to dedicate additional resources to Fidelity's investment research process, which includes meetings with management of issuers of securities in which the funds invest, and to the support of the senior management team that oversees asset management; (ii) continuing efforts to enhance Fidelity's global research capabilities; (iii) launching new funds and ETFs with innovative structures, strategies and pricing and making other enhancements to meet client needs; (iv) launching new share classes of existing funds; (v) eliminating purchase minimums and broadening eligibility requirements for certain funds and share classes; (vi) reducing management fees and total expenses for certain target date funds or classes and index funds; (vii) lowering expenses for certain funds and classes by implementing or lowering expense caps; (viii) rationalizing product lines and gaining increased efficiencies from fund mergers, liquidations, and share class consolidations; (ix) continuing to develop, acquire and implement systems and technology to improve services to the funds and shareholders, strengthen information security, and increase efficiency; and (x) continuing to implement enhancements to further strengthen Fidelity's product line to increase investors' probability of success in achieving their investment goals, including retirement income goals.
Investment Performance. The Board considered whether the fund has operated in accordance with its investment objective, as well as its record of compliance with its investment restrictions and its performance history.
The Board took into account discussions that occur at Board meetings throughout the year with representatives of the investment adviser about fund investment performance. In this regard the Board noted that as part of regularly scheduled fund reviews and other reports to the Board on fund performance, the Board considers annualized return information for the fund for different time periods, measured against one or more appropriate securities market indices, including a customized blended index that reflects the respective weights of the fund's asset classes (each a benchmark index) and an appropriate peer group of funds with similar objectives (peer group). In its evaluation of fund investment performance at meetings throughout the year, the Board gave particular attention to information indicating underperformance of certain Fidelity funds for specific time periods and discussed with the investment adviser the reasons for such underperformance. The fund underperformed its benchmark and peers for the one- and three-year periods ended May 31, 2020, and as a result, the Board continues to engage in discussions with FMR regarding the steps it is taking to address the fund's performance.
In addition to reviewing absolute and relative fund performance, the Independent Trustees periodically consider the appropriateness of fund performance metrics in evaluating the results achieved. In general, the Independent Trustees believe that fund performance should be evaluated based on gross performance (before fees and expenses, including acquired fund fees and expenses, but after transaction costs, if any) compared to appropriate benchmark indices, over appropriate time periods that may include full market cycles, and on net performance (after fees and expenses, including acquired fund fees and expenses) compared to appropriate peer groups, as applicable, over the same periods, taking into account relevant factors including the following: general market conditions; the extent to which particular underlying funds affected performance; and fund cash flows and other factors. The Independent Trustees generally give greater weight to fund performance over longer time periods than over shorter time periods. Depending on the circumstances, the Independent Trustees may be satisfied with a fund's performance notwithstanding that it lags its benchmark index or peer group for certain periods.
The Independent Trustees recognize that shareholders evaluate performance on a net basis over their own holding periods, for which one-, three-, and five-year periods are often used as a proxy. For this reason, the performance information reviewed by the Board also included net cumulative calendar year total return information for the fund and an appropriate benchmark index and peer group for the most recent one-, three-, and five-year periods. The Independent Trustees recognize that shareholders who are not investing through a tax-advantaged retirement account also consider tax consequences in evaluating performance.
Based on its review, the Board concluded that the nature, extent, and quality of services provided to the fund under the Advisory Contract should continue to benefit the shareholders of the fund.
Competitiveness of Management Fee and Total Expense Ratio. The Board considered the fund's management fee and total expense ratio compared to "mapped groups" of competitive funds and classes created for the purpose of facilitating the Trustees' competitive analysis of management fees and total expenses, and also considered that the fund bears indirectly the fees and expenses, including the management fees, paid by the underlying funds in which it invests. Fidelity creates "mapped groups" by combining similar Lipper investment objective categories that have comparable investment mandates. Combining Lipper investment objective categories aids the Board's management fee and total expense ratio comparisons by broadening the competitive group used for comparison.
Management Fee. The Board considered two proprietary management fee comparisons for the 12-month periods shown in basis points (BP) in the chart below. The group of Lipper funds used by the Board for management fee comparisons is referred to below as the "Total Mapped Group." The Total Mapped Group comparison focuses on a fund's standing in terms of gross management fees before expense reimbursements or caps relative to the total universe of funds with comparable investment mandates, regardless of whether their management fee structures also are comparable. Funds with comparable investment mandates offer exposure to similar types of securities. Funds with comparable management fee structures have similar management fee contractual arrangements (
e.g., flat rate charged for advisory services, all-inclusive fee rate,
etc.). "TMG %" represents the percentage of funds in the Total Mapped Group that had management fees that were lower than the fund's. For example, a hypothetical TMG % of 20% would mean that 80% of the funds in the Total Mapped Group had higher, and 20% had lower, management fees than the fund. The fund's actual TMG %s and the number of funds in the Total Mapped Group are in the chart below. The "Asset-Sized Peer Group" (ASPG) comparison focuses on a fund's standing relative to a subset of non-Fidelity funds within the Total Mapped Group that are similar in size and management fee structure. For example, if a fund is in the first quartile of the ASPG, the fund's management fee ranks in the least expensive or lowest 25% of funds in the ASPG. The ASPG represents at least 15% of the funds in the Total Mapped Group with comparable asset size and management fee structures, subject to a minimum of 50 funds (or all funds in the Total Mapped Group if fewer than 50). Additional information, such as the ASPG quartile in which the fund's management fee rate ranked, is also included in the chart and was considered by the Board. Because the vast majority of competitor funds' management fees do not cover non-management expenses, in prior years, the fund was compared on the basis of a hypothetical "net management fee," which was derived by subtracting payments made by Fidelity for "fund-level" non-management expenses (including pricing and bookkeeping fees and fees paid to non-affiliated custodians) from the fund's management fee. Given the fund's competitive management fee rate, Fidelity no longer calculates a hypothetical net management fee for the fund and, as a result, the chart does not include a hypothetical net management fee for periods after 2016.
VIP Target Volatility Portfolio

The Board noted that the fund's management fee rate ranked above the median of its Total Mapped Group and above the median of its ASPG for 2019. The Board considered that, unlike most funds in its Total Mapped Group and ASPG that have lower management fees because they have a more static allocation to underlying funds, the fund is more actively managed and has a unique investment strategy that attempts to manage the fund's volatility.
The Board further considered that FMR has contractually agreed to waive 0.05% of the fund's management fee through April 30, 2021.
Based on its review, the Board concluded that the fund's management fee is fair and reasonable in light of the services that the fund receives and the other factors considered.
Total Expense Ratio. In its review of each class's total expense ratio, the Board considered the fund's management fee rate as well as other "fund-level" expenses, such as pricing and bookkeeping fees and custodial, legal, and audit fees, paid by FMR under the fund's management contract. The Board also considered other "class-level" expenses, such as transfer agent fees and fund-paid 12b-1 fees. The Board also noted that Fidelity may agree to waive fees or reimburse expenses from time to time, and the extent to which, if any, it has done so for the fund. As part of its review, the Board also considered the current and historical total expense ratios of each class of the fund compared to competitive fund median expenses. Each class of the fund is compared to those funds and classes in the Total Mapped Group (used by the Board for management fee comparisons) that have a similar sales load structure.
The Board noted that the total expense ratio of Service Class ranked below the competitive median for 2019 and the total expense ratio of Service Class 2 ranked above the competitive median for 2019. The Board considered that, in general, various factors can affect total expense ratios. The Board noted that the total expense ratio of Service Class 2 was above the competitive median because of its 12b-1 fees and that excluding 12b-1 fees of both the class and competitor classes, the total expense ratio of Service Class 2 ranked below the median. The Board noted that the fund offers multiple classes, each of which has a different 12b-1 fee structure, and that the multiple structures are intended to offer a range of pricing options for the intermediary market. The Board also noted that the total expense ratios of the classes vary primarily by the level of their 12b-1 fees, although differences in transfer agent fees may also cause expenses to vary from class to class.
In considering the total expense ratio of each class of the fund, the Board also considered an alternative competitive analysis that included both top level (
i.e., direct) fund fees and acquired fund fees and expenses for the fund and the other funds and classes to which it is compared. The Board noted that, under this alternative competitive analysis, the total expense ratio of Service Class ranked below the competitive median for 2019 and the total expense ratio of Service Class 2 ranked above the competitive median for 2019.
The Board further considered that FMR has contractually agreed to reimburse 0.10% of "class-level" expenses for Service Class and Service Class 2 as long as these classes continue to be sold to unaffiliated insurance companies.
Fees Charged to Other Fidelity Clients. The Board also considered Fidelity fee structures and other information with respect to clients of Fidelity, such as other funds advised or subadvised by Fidelity, pension plan clients, and other institutional clients with similar mandates. The Board noted that a joint ad hoc committee created by it and the boards of other Fidelity funds periodically reviews and compares Fidelity's institutional investment advisory business with its business of providing services to the Fidelity funds and also noted the most recent findings of the committee. The Board noted that the committee's review included a consideration of the differences in services provided, fees charged, and costs incurred, as well as competition in the markets serving the different categories of clients.
Based on its review of total expense ratios and fees charged to other Fidelity clients, the Board concluded that the total expense ratio of each class of the fund was reasonable in light of the services that the fund and its shareholders receive and the other factors considered.
Costs of the Services and Profitability. The Board considered the revenues earned and the expenses incurred by Fidelity in conducting the business of developing, marketing, distributing, managing, administering and servicing the fund and servicing the fund's shareholders. The Board also considered the level of Fidelity's profits in respect of all the Fidelity funds, including the Fidelity funds in which the fund invests.
On an annual basis, Fidelity presents to the Board information about the profitability of its relationships with the fund. Fidelity calculates profitability information for each fund, as well as aggregate profitability information for groups of Fidelity funds and all Fidelity funds, using a series of detailed revenue and cost allocation methodologies which originate with the books and records of Fidelity on which Fidelity's audited financial statements are based. The Audit Committee of the Board reviews any significant changes from the prior year's methodologies and the full Board approves such changes.
A public accounting firm has been engaged annually by the Board as part of the Board's assessment of Fidelity's profitability analysis. The engagement includes the review and assessment of the methodologies used by Fidelity in determining the revenues and expenses attributable to Fidelity's mutual fund business, and completion of agreed-upon procedures in respect of the mathematical accuracy of certain fund profitability information and its conformity to established allocation methodologies. After considering the reports issued under the engagement and information provided by Fidelity, the Board concluded that while other allocation methods may also be reasonable, Fidelity's profitability methodologies are reasonable in all material respects.
The Board also reviewed Fidelity's non-fund businesses and potential indirect benefits such businesses may have received as a result of their association with Fidelity's mutual fund business (i.e., fall-out benefits) as well as cases where Fidelity's affiliates may benefit from the funds' business. The Board considered areas where potential indirect benefits to the Fidelity funds from their relationships with Fidelity may exist. The Board also considered that in 2019 a joint ad hoc committee created by it and the boards of other Fidelity funds evaluated potential fall-out benefits (PFOB Committee). The Board noted that it considered the PFOB Committee's findings in connection with its consideration of the renewal of the Advisory Contracts.
The Board considered the costs of the services provided by and the profits realized by Fidelity in connection with the operation of the fund, including the conclusions of the PFOB Committee, and was satisfied that the profitability was not excessive.
Economies of Scale. The Board considered whether there have been economies of scale in respect of the management of the Fidelity funds, whether the Fidelity funds (including the fund) have appropriately benefited from any such economies of scale, and whether there is potential for realization of any further economies of scale. The Board considered the extent to which the fund will benefit from economies of scale as assets grow through increased services to the fund, through waivers or reimbursements, or through fee or expense ratio reductions. The Board also noted that a committee (the Economies of Scale Committee) created by it and the boards of other Fidelity funds periodically analyzes whether Fidelity attains economies of scale in respect of the management and servicing of the Fidelity funds, whether the Fidelity funds have appropriately benefited from such economies of scale, and whether there is potential for realization of any further economies of scale.
The Board concluded, taking into account the analysis of the Economies of Scale Committee, that economies of scale, if any, are being appropriately shared between fund shareholders and Fidelity.
Additional Information Requested by the Board. In order to develop fully the factual basis for consideration of the Fidelity funds' advisory contracts, the Board requested and received additional information on certain topics, including: (i) Fidelity's fund profitability methodology, profitability trends for certain funds, the allocation of various costs to different funds, and the impact of certain factors on fund profitability results; (ii) portfolio manager changes that have occurred during the past year and the amount of the investment that each portfolio manager has made in the Fidelity fund(s) that he or she manages; (iii) Fidelity's compensation structure for portfolio managers, research analysts, and other key personnel, including its effects on fund profitability, the rationale for the compensation structure, and the extent to which current market conditions have affected retention and recruitment; (iv) the arrangements with and compensation paid to certain fund sub-advisers on behalf of the Fidelity funds and the treatment of such compensation within Fidelity's fund profitability methodology; (v) the terms of the funds' various management fee structures, including the basic group fee and the terms of Fidelity's voluntary expense limitation agreements; (vi) Fidelity's transfer agent fee, expense, and service structures for different funds and classes relative to competitive trends; (vii) the impact on fund profitability of recent industry trends, such as the growth in passively managed funds and outflows from actively managed equity funds; and (viii) explanations regarding the relative total expense ratios of certain funds and classes, total expense competitive trends and methodologies for total expense competitive comparisons, and actions that might be taken by Fidelity to reduce total expense ratios for certain classes. In addition, the Board considered its discussions with Fidelity regarding Fidelity's efforts to maintain the continuous investment and shareholder services necessary for the funds during the current pandemic and economic circumstances.
Based on its evaluation of all of the conclusions noted above, and after considering all factors it believed relevant, the Board concluded that the advisory fee arrangements are fair and reasonable, and that the fund's Advisory Contract should be renewed.
VIPTV-ANN-0221
1.955015.107
Fidelity® Variable Insurance Products:
Bond Index Portfolio
Annual Report
December 31, 2020
Contents
To view a fund's proxy voting guidelines and proxy voting record for the 12-month period ended June 30, visit http://www.fidelity.com/proxyvotingresults or visit the Securities and Exchange Commission's (SEC) web site at http://www.sec.gov.
You may also call 1-877-208-0098 to request a free copy of the proxy voting guidelines.
Fidelity® Variable Insurance Products are separate account options which are purchased through a variable insurance contract.
Standard & Poor's, S&P and S&P 500 are registered service marks of The McGraw-Hill Companies, Inc. and have been licensed for use by Fidelity Distributors Corporation.
Other third-party marks appearing herein are the property of their respective owners.
All other marks appearing herein are registered or unregistered trademarks or service marks of FMR LLC or an affiliated company. © 2021 FMR LLC. All rights reserved.
This report and the financial statements contained herein are submitted for the general information of the shareholders of the Fund. This report is not authorized for distribution to prospective investors in the Fund unless preceded or accompanied by an effective prospectus.
A fund files its complete schedule of portfolio holdings with the SEC for the first and third quarters of each fiscal year on Form N-PORT. Forms N-PORT are available on the SEC’s web site at http://www.sec.gov. A fund's Forms N-PORT may be reviewed and copied at the SEC’s Public Reference Room in Washington, DC. Information regarding the operation of the SEC's Public Reference Room may be obtained by calling 1-800-SEC-0330.
For a complete list of a fund's portfolio holdings, view the most recent holdings listing, semiannual report, or annual report on Fidelity's web site at http://www.fidelity.com, http://www.institutional.fidelity.com, or http://www.401k.com, as applicable.
NOT FDIC INSURED •MAY LOSE VALUE •NO BANK GUARANTEE
Neither the Fund nor Fidelity Distributors Corporation is a bank.
Note to Shareholders:
Early in 2020, the outbreak and spread of a new coronavirus emerged as a public health emergency that had a major influence on financial markets, primarily based on its impact on the global economy and the outlook for corporate earnings. The virus causes a respiratory disease known as COVID-19. On March 11, the World Health Organization declared the COVID-19 outbreak a pandemic, citing sustained risk of further global spread.
In the weeks following, as the crisis worsened, we witnessed an escalating human tragedy with wide-scale social and economic consequences from coronavirus-containment measures. The outbreak of COVID-19 prompted a number of measures to limit the spread, including travel and border restrictions, quarantines, and restrictions on large gatherings. In turn, these resulted in lower consumer activity, diminished demand for a wide range of products and services, disruption in manufacturing and supply chains, and – given the wide variability in outcomes regarding the outbreak – significant market uncertainty and volatility. Amid the turmoil, global governments and central banks took unprecedented action to help support consumers, businesses, and the broader economies, and to limit disruption to financial systems.
The situation continues to unfold, and the extent and duration of its impact on financial markets and the economy remain highly uncertain. Extreme events such as the coronavirus crisis are “exogenous shocks” that can have significant adverse effects on mutual funds and their investments. Although multiple asset classes may be affected by market disruption, the duration and impact may not be the same for all types of assets.
Fidelity is committed to helping you stay informed amid news about COVID-19 and during increased market volatility, and we’re taking extra steps to be responsive to customer needs. We encourage you to visit our websites, where we offer ongoing updates, commentary, and analysis on the markets and our funds.
Performance: The Bottom Line
Average annual total return reflects the change in the value of an investment, assuming reinvestment of distributions from dividend income and capital gains (the profits earned upon the sale of securities that have grown in value, if any) and assuming a constant rate of performance each year. During periods of reimbursement by Fidelity, a fund’s total return will be greater than it would be had the reimbursement not occurred. Performance numbers are net of all underlying fund operating expenses, but do not include any insurance charges imposed by your insurance company’s separate account. If performance information included the effect of these additional charges, the total returns would have been lower. How a fund did yesterday is no guarantee of how it will do tomorrow.
Average Annual Total Returns
| For the periods ended December 31, 2020 | Past 1 year | Life of fundA |
| Initial Class | 7.53% | 6.57% |
| Service Class | 7.53% | 6.50% |
| Service Class 2 | 7.26% | 6.31% |
A From April 19, 2018
The initial offering of Service Class shares took place on April 11, 2019. Returns prior to April 11, 2019 are those of Initial Class.
$10,000 Over Life of Fund
Let's say hypothetically that $10,000 was invested in VIP Bond Index Portfolio - Initial Class on April 19, 2018, when the fund started.
The chart shows how the value of your investment would have changed, and also shows how the Bloomberg Barclays U.S. Aggregate Bond Index performed over the same period.
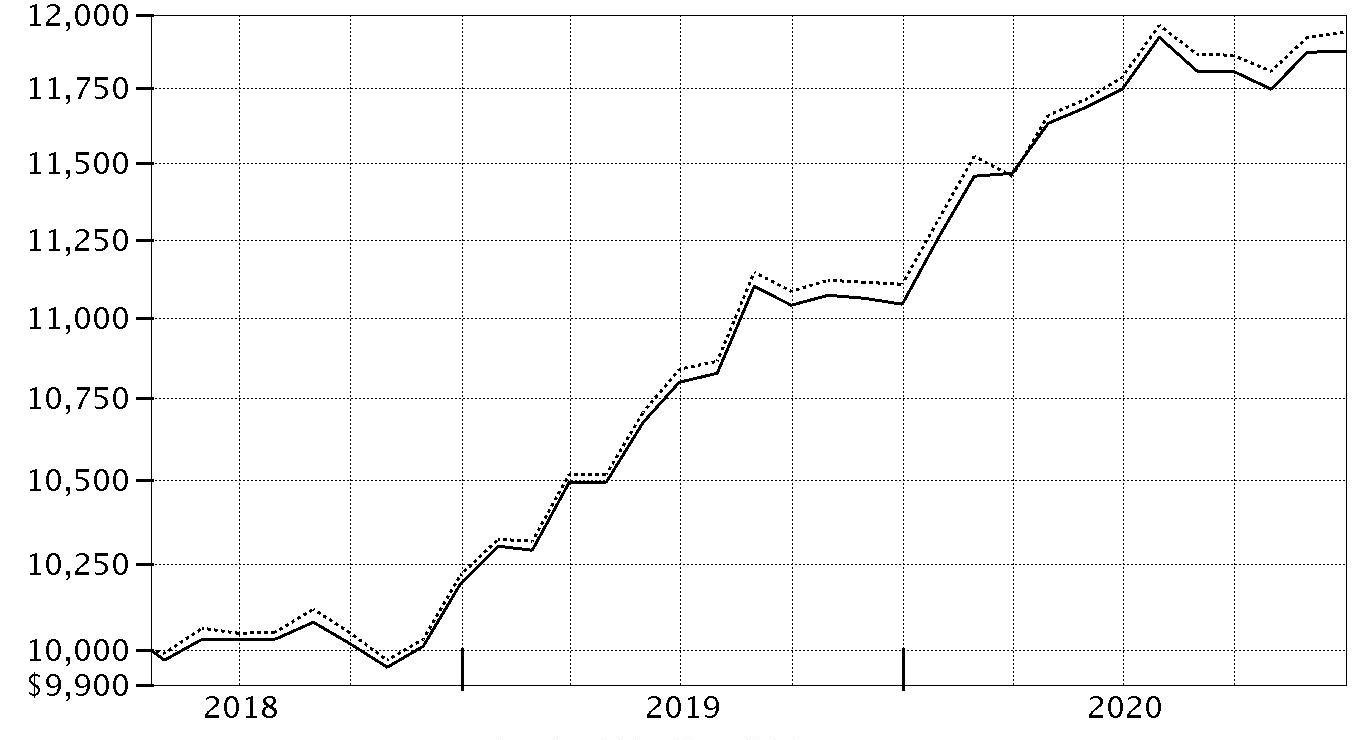
| Period Ending Values |
| $11,876 | VIP Bond Index Portfolio - Initial Class |
| $11,940 | Bloomberg Barclays U.S. Aggregate Bond Index |
Management's Discussion of Fund Performance
Market Recap: U.S. taxable investment-grade bonds rose strongly in 2020, led by corporate bonds early and late in the period, and by U.S. Treasuries in March, as investors sought safer havens amid the market shock of the outbreak and spread of COVID-19. The Bloomberg Barclays U.S. Aggregate Bond Index gained 7.51% for the year. Corporate bonds advanced early on, then plunged in February. At this time, spreads widened due to robust investor demand for relatively safer assets – especially U.S. Treasury bonds – as the coronavirus pandemic and efforts to contain it threatened global economic growth and corporate earnings, leading to pockets of market illiquidity in March. Aggressive intervention by the U.S. Federal Reserve boosted liquidity and led to a broad rally for fixed-income assets from April through July. Spreads widened moderately in August and September, amid healthy issuance of new corporate bonds, then narrowed in the fourth quarter. Within the Bloomberg Barclays index, corporate bonds gained 9.89% for the year, topping the 8.00% advance of U.S. Treasuries. Securitized sectors, meanwhile, lagged the broader market. Outside the index, U.S. corporate high-yield bonds gained 7.11% and Treasury Inflation-Protected Securities (TIPS) rose 10.99%.
Comments from Co-Portfolio Managers Brandon Bettencourt and Richard Munclinger: For 2020, the returns of the fund’s share classes gains ranged from roughly 7.30% to 7.50%, nearly in line with, net of fees, the 7.51% advance of the Bloomberg Barclays U.S. Aggregate Bond Index. These results met our goal of producing monthly returns, before expenses, that closely match the benchmark return. Given the large number of securities in the index (roughly 10,000) and the significant cost and liquidity challenges associated with full replication of the index, we use “stratified sampling techniques” in constructing the portfolio. This approach involves defining and maintaining an “optimal” subset of constituent securities that, in aggregate, mirrors the chief characteristics of the index – including maturity, duration, sector allocation, credit quality and other factors. Although all major categories in the Aggregate index generated a positive return in 2020, the bond market exhibited volatility as investors weighed the impact of the COVID-19 pandemic. Following a broad-based sell-off in risk assets and a flight to safety in March, the bond market began an uptrend that continued through the remainder of the year, spurred by unprecedented monetary and fiscal stimulus.
The views expressed above reflect those of the portfolio manager(s) only through the end of the period as stated on the cover of this report and do not necessarily represent the views of Fidelity or any other person in the Fidelity organization. Any such views are subject to change at any time based upon market or other conditions and Fidelity disclaims any responsibility to update such views. These views may not be relied on as investment advice and, because investment decisions for a Fidelity fund are based on numerous factors, may not be relied on as an indication of trading intent on behalf of any Fidelity fund.
Investment Summary (Unaudited)
Quality Diversification (% of fund's net assets)
| As of December 31, 2020 |
| | U.S. Government and U.S. Government Agency Obligations | 73.4% |
| | AAA | 2.6% |
| | AA | 2.9% |
| | A | 10.9% |
| | BBB | 13.1% |
| | BB and Below | 0.4% |
| | Not Rated | 0.7% |
| | Short-Term Investments and Net Other Assets* | (4.0)% |

* Short-Term Investments and Net Other Assets (Liabilities) are not included in the pie chart
We have used ratings from Moody's Investors Service, Inc. Where Moody's® ratings are not available, we have used S&P® ratings. All ratings are as of the date indicated and do not reflect subsequent changes.
Asset Allocation (% of fund's net assets)
| As of December 31, 2020* |
| | Corporate Bonds | 25.5% |
| | U.S. Government and U.S. Government Agency Obligations | 73.4% |
| | CMOs and Other Mortgage Related Securities | 1.0% |
| | Municipal Bonds | 0.2% |
| | Other Investments | 3.9% |
| | Short-Term Investments and Net Other Assets (Liabilities)** | (4.0)% |

* Foreign investments - 8.0%
** Short-Term Investments and Net Other Assets (Liabilities) are not included in the pie chart
Schedule of Investments December 31, 2020
Showing Percentage of Net Assets
| Nonconvertible Bonds - 25.5% | | | |
| | | Principal Amount | Value |
| COMMUNICATION SERVICES - 2.3% | | | |
| Diversified Telecommunication Services - 0.8% | | | |
| AT&T, Inc.: | | | |
| 1.65% 2/1/28 | | $200,000 | $203,966 |
| 2.25% 2/1/32 | | 50,000 | 50,692 |
| 2.75% 6/1/31 | | 300,000 | 320,491 |
| 3.3% 2/1/52 | | 50,000 | 49,481 |
| 3.5% 6/1/41 | | 1,000,000 | 1,076,577 |
| 3.5% 9/15/53 (a) | | 347,000 | 345,677 |
| 3.55% 9/15/55 (a) | | 340,000 | 338,192 |
| 3.65% 6/1/51 | | 280,000 | 292,661 |
| 3.65% 9/15/59 (a) | | 257,000 | 257,751 |
| 3.8% 2/15/27 | | 43,000 | 49,472 |
| 4.1% 2/15/28 | | 143,000 | 168,052 |
| 4.65% 6/1/44 | | 40,000 | 48,008 |
| Telefonica Emisiones S.A.U.: | | | |
| 4.103% 3/8/27 | | 150,000 | 173,582 |
| 5.213% 3/8/47 | | 250,000 | 322,296 |
| 5.52% 3/1/49 | | 150,000 | 202,093 |
| Verizon Communications, Inc.: | | | |
| 1.5% 9/18/30 | | 270,000 | 265,718 |
| 2.987% 10/30/56 (a) | | 227,000 | 228,020 |
| 3.875% 2/8/29 | | 210,000 | 247,077 |
| 4% 3/22/50 | | 114,000 | 138,046 |
| 4.016% 12/3/29 | | 100,000 | 118,606 |
| 4.125% 8/15/46 | | 54,000 | 66,192 |
| 4.272% 1/15/36 | | 276,000 | 341,933 |
| 4.329% 9/21/28 | | 643,000 | 773,974 |
| 5.012% 8/21/54 | | 38,000 | 53,123 |
| | | | 6,131,680 |
| Entertainment - 0.2% | | | |
| The Walt Disney Co.: | | | |
| 2% 9/1/29 | | 50,000 | 52,231 |
| 2.65% 1/13/31 | | 200,000 | 219,133 |
| 2.75% 9/1/49 | | 100,000 | 105,594 |
| 3% 9/15/22 | | 150,000 | 156,625 |
| 3.5% 5/13/40 | | 30,000 | 35,216 |
| 3.6% 1/13/51 | | 30,000 | 36,345 |
| 3.7% 9/15/24 | | 300,000 | 333,072 |
| 3.8% 3/22/30 | | 110,000 | 131,031 |
| 3.8% 5/13/60 | | 30,000 | 38,033 |
| 4.7% 3/23/50 | | 100,000 | 141,000 |
| | | | 1,248,280 |
| Interactive Media & Services - 0.1% | | | |
| Alphabet, Inc.: | | | |
| 0.45% 8/15/25 | | 100,000 | 100,203 |
| 1.1% 8/15/30 | | 200,000 | 197,034 |
| 1.9% 8/15/40 | | 264,000 | 258,696 |
| 2.05% 8/15/50 | | 170,000 | 161,908 |
| | | | 717,841 |
| Media - 0.9% | | | |
| Charter Communications Operating LLC/Charter Communications Operating Capital Corp.: | | | |
| 3.7% 4/1/51 | | 30,000 | 31,099 |
| 3.75% 2/15/28 | | 100,000 | 112,078 |
| 4.2% 3/15/28 | | 48,000 | 55,364 |
| 5.125% 7/1/49 | | 60,000 | 73,116 |
| 5.375% 4/1/38 | | 42,000 | 52,450 |
| 5.375% 5/1/47 | | 190,000 | 236,789 |
| 6.384% 10/23/35 | | 621,000 | 850,223 |
| Comcast Corp.: | | | |
| 1.5% 2/15/31 | | 135,000 | 134,054 |
| 1.95% 1/15/31 | | 400,000 | 411,321 |
| 2.45% 8/15/52 | | 135,000 | 131,223 |
| 2.65% 2/1/30 | | 220,000 | 240,319 |
| 2.8% 1/15/51 | | 180,000 | 187,107 |
| 3.15% 2/15/28 | | 276,000 | 311,467 |
| 3.4% 4/1/30 | | 87,000 | 100,283 |
| 3.55% 5/1/28 | | 76,000 | 87,576 |
| 3.7% 4/15/24 | | 30,000 | 33,001 |
| 3.75% 4/1/40 | | 31,000 | 37,248 |
| 3.9% 3/1/38 | | 50,000 | 61,108 |
| 4.6% 10/15/38 | | 140,000 | 184,248 |
| 4.6% 8/15/45 | | 72,000 | 97,109 |
| 4.7% 10/15/48 | | 284,000 | 395,046 |
| 4.95% 10/15/58 | | 30,000 | 45,456 |
| Discovery Communications LLC: | | | |
| 3.625% 5/15/30 | | 220,000 | 251,880 |
| 4% 9/15/55 (a) | | 85,000 | 94,960 |
| 4.65% 5/15/50 | | 220,000 | 274,702 |
| 5.2% 9/20/47 | | 18,000 | 23,412 |
| Fox Corp.: | | | |
| 4.709% 1/25/29 | | 34,000 | 41,234 |
| 5.476% 1/25/39 | | 359,000 | 491,715 |
| 5.576% 1/25/49 | | 23,000 | 33,566 |
| Time Warner Cable LLC 5.5% 9/1/41 | | 551,000 | 707,046 |
| TWDC Enterprises 18 Corp. 2.95% 6/15/27 | | 98,000 | 109,127 |
| ViacomCBS, Inc.: | | | |
| 4.2% 6/1/29 | | 210,000 | 251,093 |
| 4.95% 1/15/31 | | 190,000 | 237,845 |
| 5.85% 9/1/43 | | 363,000 | 504,248 |
| | | | 6,888,513 |
| Wireless Telecommunication Services - 0.3% | | | |
| America Movil S.A.B. de CV 3.625% 4/22/29 | | 200,000 | 227,330 |
| T-Mobile U.S.A., Inc.: | | | |
| 3% 2/15/41 (a) | | 649,000 | 672,831 |
| 3.5% 4/15/25 (a) | | 410,000 | 453,042 |
| 3.75% 4/15/27 (a) | | 80,000 | 91,104 |
| 3.875% 4/15/30 (a) | | 80,000 | 92,641 |
| 4.375% 4/15/40 (a) | | 74,000 | 90,307 |
| 4.5% 4/15/50 (a) | | 80,000 | 98,671 |
| Vodafone Group PLC: | | | |
| 4.375% 5/30/28 | | 97,000 | 116,123 |
| 5% 5/30/38 | | 100,000 | 130,686 |
| 5.25% 5/30/48 | | 170,000 | 236,133 |
| 6.15% 2/27/37 | | 392,000 | 564,359 |
| | | | 2,773,227 |
|
| TOTAL COMMUNICATION SERVICES | | | 17,759,541 |
|
| CONSUMER DISCRETIONARY - 1.6% | | | |
| Automobiles - 0.4% | | | |
| American Honda Finance Corp.: | | | |
| 1.2% 7/8/25 | | 840,000 | 859,434 |
| 3.55% 1/12/24 | | 170,000 | 185,152 |
| General Motors Co.: | | | |
| 5.95% 4/1/49 | | 320,000 | 432,122 |
| 6.125% 10/1/25 | | 935,000 | 1,133,899 |
| 6.75% 4/1/46 | | 69,000 | 99,536 |
| General Motors Financial Co., Inc.: | | | |
| 4.35% 4/9/25 | | 84,000 | 93,760 |
| 5.65% 1/17/29 | | 250,000 | 310,384 |
| | | | 3,114,287 |
| Diversified Consumer Services - 0.0% | | | |
| Duke University 2.832% 10/1/55 | | 30,000 | 32,391 |
| Ingersoll-Rand Global Holding Co. Ltd. 3.75% 8/21/28 | | 210,000 | 242,247 |
| | | | 274,638 |
| Hotels, Restaurants & Leisure - 0.3% | | | |
| McDonald's Corp.: | | | |
| 2.625% 9/1/29 | | 150,000 | 164,095 |
| 3.3% 7/1/25 | | 32,000 | 35,627 |
| 3.5% 7/1/27 | | 91,000 | 104,348 |
| 3.6% 7/1/30 | | 340,000 | 398,284 |
| 3.8% 4/1/28 | | 84,000 | 98,150 |
| 4.2% 4/1/50 | | 40,000 | 51,333 |
| 4.7% 12/9/35 | | 109,000 | 140,871 |
| Starbucks Corp.: | | | |
| 2.55% 11/15/30 | | 737,000 | 796,799 |
| 4% 11/15/28 | | 100,000 | 118,701 |
| 4.5% 11/15/48 | | 50,000 | 65,166 |
| | | | 1,973,374 |
| Household Durables - 0.0% | | | |
| Newell Brands, Inc. 4.35% 4/1/23 | | 60,000 | 62,933 |
| Internet & Direct Marketing Retail - 0.2% | | | |
| Amazon.com, Inc.: | | | |
| 0.8% 6/3/25 | | 110,000 | 111,591 |
| 1.5% 6/3/30 | | 140,000 | 142,115 |
| 2.4% 2/22/23 | | 150,000 | 156,532 |
| 2.5% 6/3/50 | | 110,000 | 113,903 |
| 3.875% 8/22/37 | | 440,000 | 548,219 |
| 4.05% 8/22/47 | | 280,000 | 369,096 |
| | | | 1,441,456 |
| Multiline Retail - 0.2% | | | |
| Dollar Tree, Inc. 4% 5/15/25 | | 248,000 | 279,991 |
| Target Corp.: | | | |
| 2.25% 4/15/25 | | 968,000 | 1,037,902 |
| 2.65% 9/15/30 | | 77,000 | 86,455 |
| 3.9% 11/15/47 | | 40,000 | 52,424 |
| 4% 7/1/42 | | 15,000 | 20,136 |
| | | | 1,476,908 |
| Specialty Retail - 0.4% | | | |
| AutoZone, Inc.: | | | |
| 3.625% 4/15/25 | | 62,000 | 69,437 |
| 4% 4/15/30 | | 150,000 | 177,615 |
| Lowe's Companies, Inc.: | | | |
| 3.65% 4/5/29 | | 80,000 | 93,314 |
| 4.05% 5/3/47 | | 53,000 | 66,236 |
| The Home Depot, Inc.: | | | |
| 2.5% 4/15/27 | | 210,000 | 230,359 |
| 2.7% 4/15/30 | | 146,000 | 162,865 |
| 2.8% 9/14/27 | | 84,000 | 93,433 |
| 2.95% 6/15/29 | | 986,000 | 1,120,224 |
| 3.35% 4/15/50 | | 100,000 | 118,783 |
| 3.9% 6/15/47 | | 29,000 | 36,973 |
| 4.25% 4/1/46 | | 104,000 | 137,746 |
| 4.5% 12/6/48 | | 90,000 | 126,124 |
| TJX Companies, Inc. 3.875% 4/15/30 | | 687,000 | 823,919 |
| | | | 3,257,028 |
| Textiles, Apparel & Luxury Goods - 0.1% | | | |
| NIKE, Inc.: | | | |
| 2.4% 3/27/25 | | 38,000 | 40,945 |
| 2.85% 3/27/30 | | 555,000 | 628,407 |
| 3.375% 3/27/50 | | 40,000 | 49,118 |
| | | | 718,470 |
|
| TOTAL CONSUMER DISCRETIONARY | | | 12,319,094 |
|
| CONSUMER STAPLES - 1.4% | | | |
| Beverages - 0.7% | | | |
| Anheuser-Busch Companies LLC / Anheuser-Busch InBev Worldwide, Inc. 4.7% 2/1/36 | | 140,000 | 177,577 |
| Anheuser-Busch InBev Worldwide, Inc.: | | | |
| 3.5% 6/1/30 | | 150,000 | 173,663 |
| 4% 4/13/28 | | 91,000 | 107,241 |
| 4.5% 6/1/50 | | 100,000 | 125,828 |
| 4.6% 4/15/48 | | 78,000 | 98,541 |
| 4.6% 6/1/60 | | 50,000 | 63,838 |
| 4.95% 1/15/42 | | 671,000 | 880,299 |
| 5.45% 1/23/39 | | 270,000 | 364,532 |
| 5.55% 1/23/49 | | 130,000 | 184,509 |
| 5.8% 1/23/59 (Reg. S) | | 170,000 | 261,206 |
| Constellation Brands, Inc.: | | | |
| 3.6% 2/15/28 | | 63,000 | 71,937 |
| 5.25% 11/15/48 | | 50,000 | 70,238 |
| Diageo Capital PLC: | | | |
| 1.375% 9/29/25 | | 200,000 | 205,741 |
| 2% 4/29/30 | | 200,000 | 208,447 |
| Dr. Pepper Snapple Group, Inc.: | | | |
| 2.55% 9/15/26 | | 50,000 | 54,580 |
| 3.8% 5/1/50 | | 190,000 | 227,155 |
| 4.597% 5/25/28 | | 36,000 | 43,798 |
| Molson Coors Beverage Co.: | | | |
| 3% 7/15/26 | | 120,000 | 130,790 |
| 4.2% 7/15/46 | | 92,000 | 105,401 |
| PepsiCo, Inc.: | | | |
| 1.4% 2/25/31 | | 440,000 | 442,829 |
| 1.625% 5/1/30 | | 267,000 | 273,880 |
| 4% 5/2/47 | | 116,000 | 153,182 |
| The Coca-Cola Co.: | | | |
| 1.45% 6/1/27 | | 30,000 | 30,975 |
| 1.65% 6/1/30 | | 30,000 | 30,786 |
| 2.5% 6/1/40 | | 30,000 | 31,906 |
| 2.6% 6/1/50 | | 30,000 | 31,592 |
| 2.75% 6/1/60 | | 30,000 | 32,308 |
| 2.875% 10/27/25 | | 50,000 | 55,430 |
| 3.45% 3/25/30 | | 186,000 | 219,125 |
| 4.2% 3/25/50 | | 150,000 | 207,602 |
| | | | 5,064,936 |
| Food & Staples Retailing - 0.2% | | | |
| Kroger Co. 5.4% 1/15/49 | | 28,000 | 40,521 |
| Sysco Corp.: | | | |
| 3.3% 2/15/50 | | 50,000 | 52,189 |
| 3.55% 3/15/25 | | 50,000 | 55,662 |
| 4.45% 3/15/48 | | 52,000 | 63,368 |
| 6.6% 4/1/50 | | 220,000 | 338,314 |
| Walgreens Boots Alliance, Inc.: | | | |
| 3.2% 4/15/30 | | 130,000 | 141,146 |
| 3.45% 6/1/26 | | 81,000 | 89,566 |
| Walmart, Inc.: | | | |
| 3.05% 7/8/26 | | 470,000 | 529,005 |
| 3.625% 12/15/47 | | 20,000 | 25,317 |
| 3.7% 6/26/28 | | 60,000 | 70,641 |
| 3.95% 6/28/38 | | 150,000 | 191,100 |
| 4.05% 6/29/48 | | 80,000 | 108,373 |
| | | | 1,705,202 |
| Food Products - 0.2% | | | |
| Campbell Soup Co. 4.15% 3/15/28 | | 80,000 | 94,052 |
| Conagra Brands, Inc.: | | | |
| 4.85% 11/1/28 | | 190,000 | 235,854 |
| 5.3% 11/1/38 | | 13,000 | 17,359 |
| 5.4% 11/1/48 | | 60,000 | 85,490 |
| General Mills, Inc.: | | | |
| 2.875% 4/15/30 | | 40,000 | 44,328 |
| 4.2% 4/17/28 | | 89,000 | 106,665 |
| 4.55% 4/17/38 | | 80,000 | 102,758 |
| Kellogg Co. 4.5% 4/1/46 | | 32,000 | 41,075 |
| Kraft Heinz Foods Co.: | | | |
| 3% 6/1/26 | | 20,000 | 20,881 |
| 4.375% 6/1/46 | | 50,000 | 54,016 |
| 4.625% 1/30/29 | | 260,000 | 297,370 |
| Tyson Foods, Inc.: | | | |
| 4% 3/1/26 | | 70,000 | 80,501 |
| 5.1% 9/28/48 | | 50,000 | 71,863 |
| Unilever Capital Corp.: | | | |
| 1.375% 9/14/30 | | 135,000 | 135,521 |
| 3.125% 3/22/23 | | 100,000 | 106,217 |
| | | | 1,493,950 |
| Household Products - 0.0% | | | |
| Kimberly-Clark Corp.: | | | |
| 1.05% 9/15/27 | | 110,000 | 111,446 |
| 3.1% 3/26/30 | | 22,000 | 25,321 |
| Procter & Gamble Co. 3% 3/25/30 | | 105,000 | 121,016 |
| | | | 257,783 |
| Tobacco - 0.3% | | | |
| Altria Group, Inc.: | | | |
| 2.625% 9/16/26 | | 110,000 | 118,713 |
| 3.4% 5/6/30 | | 300,000 | 336,422 |
| 3.875% 9/16/46 | | 38,000 | 40,075 |
| 4.8% 2/14/29 | | 120,000 | 143,894 |
| 5.8% 2/14/39 | | 100,000 | 131,604 |
| 5.95% 2/14/49 | | 30,000 | 41,965 |
| BAT Capital Corp.: | | | |
| 3.557% 8/15/27 | | 130,000 | 144,697 |
| 4.39% 8/15/37 | | 671,000 | 750,292 |
| 4.54% 8/15/47 | | 213,000 | 236,162 |
| Philip Morris International, Inc.: | | | |
| 2.5% 11/2/22 | | 302,000 | 313,395 |
| 2.875% 5/1/24 | | 80,000 | 86,108 |
| 3.125% 3/2/28 | | 154,000 | 172,643 |
| | | | 2,515,970 |
|
| TOTAL CONSUMER STAPLES | | | 11,037,841 |
|
| ENERGY - 2.0% | | | |
| Energy Equipment & Services - 0.0% | | | |
| Baker Hughes Co. 4.08% 12/15/47 | | 172,000 | 194,031 |
| Oil, Gas & Consumable Fuels - 2.0% | | | |
| Apache Corp. 4.375% 10/15/28 | | 112,000 | 116,590 |
| Canadian Natural Resources Ltd.: | | | |
| 3.85% 6/1/27 | | 58,000 | 65,055 |
| 4.95% 6/1/47 | | 19,000 | 24,094 |
| Cenovus Energy, Inc. 5.4% 6/15/47 | | 124,000 | 145,354 |
| Chevron Corp.: | | | |
| 1.141% 5/11/23 | | 80,000 | 81,679 |
| 1.554% 5/11/25 | | 80,000 | 83,091 |
| 1.995% 5/11/27 | | 80,000 | 84,805 |
| 2.236% 5/11/30 | | 80,000 | 85,566 |
| 2.498% 3/3/22 | | 280,000 | 286,851 |
| 2.978% 5/11/40 | | 80,000 | 88,440 |
| 3.078% 5/11/50 | | 80,000 | 88,692 |
| CNOOC Petroleum North America ULC 6.4% 5/15/37 | | 203,000 | 276,496 |
| ConocoPhillips Co. 5.95% 3/15/46 | | 86,000 | 130,694 |
| Devon Energy Corp. 5% 6/15/45 | | 80,000 | 94,431 |
| Ecopetrol SA 5.875% 9/18/23 | | 390,000 | 434,850 |
| Enbridge Energy Partners LP 5.875% 10/15/25 | | 76,000 | 92,887 |
| Enbridge, Inc. 5.5% 12/1/46 | | 60,000 | 80,622 |
| Energy Transfer Partners LP: | | | |
| 4.2% 9/15/23 | | 30,000 | 32,333 |
| 4.5% 4/15/24 | | 50,000 | 54,676 |
| 5% 5/15/50 | | 300,000 | 324,370 |
| 5.8% 6/15/38 | | 70,000 | 80,329 |
| 6% 6/15/48 | | 356,000 | 423,110 |
| 6.25% 4/15/49 | | 30,000 | 36,236 |
| Enterprise Products Operating LP: | | | |
| 3.125% 7/31/29 | | 70,000 | 77,557 |
| 3.95% 2/15/27 | | 85,000 | 97,846 |
| 4.2% 1/31/50 | | 618,000 | 724,787 |
| 4.25% 2/15/48 | | 105,000 | 122,910 |
| EOG Resources, Inc. 4.375% 4/15/30 | | 510,000 | 619,516 |
| Equinor ASA: | | | |
| 3.125% 4/6/30 | | 357,000 | 404,492 |
| 3.625% 9/10/28 | | 120,000 | 139,679 |
| Exxon Mobil Corp.: | | | |
| 2.44% 8/16/29 | | 320,000 | 347,182 |
| 3.452% 4/15/51 | | 330,000 | 376,446 |
| 4.227% 3/19/40 | | 421,000 | 523,292 |
| Kinder Morgan Energy Partners LP 5% 8/15/42 | | 100,000 | 116,277 |
| Kinder Morgan, Inc.: | | | |
| 3.15% 1/15/23 | | 119,000 | 125,203 |
| 4.3% 3/1/28 | | 112,000 | 131,296 |
| 5.2% 3/1/48 | | 30,000 | 38,097 |
| Magellan Midstream Partners LP: | | | |
| 3.95% 3/1/50 | | 75,000 | 84,543 |
| 5% 3/1/26 | | 72,000 | 85,788 |
| Marathon Oil Corp. 4.4% 7/15/27 | | 240,000 | 266,693 |
| Marathon Petroleum Corp.: | | | |
| 4.75% 12/15/23 | | 255,000 | 282,267 |
| 4.75% 9/15/44 | | 21,000 | 24,067 |
| MPLX LP: | | | |
| 4.5% 7/15/23 | | 82,000 | 89,308 |
| 4.5% 4/15/38 | | 143,000 | 163,373 |
| 4.7% 4/15/48 | | 28,000 | 33,153 |
| 4.8% 2/15/29 | | 30,000 | 36,239 |
| 5.5% 2/15/49 | | 410,000 | 539,058 |
| Noble Energy, Inc.: | | | |
| 3.85% 1/15/28 | | 55,000 | 63,932 |
| 4.95% 8/15/47 | | 30,000 | 42,549 |
| ONEOK, Inc.: | | | |
| 4.45% 9/1/49 | | 40,000 | 42,006 |
| 4.55% 7/15/28 | | 59,000 | 67,497 |
| Ovintiv, Inc. 6.5% 2/1/38 | | 50,000 | 55,827 |
| Petroleos Mexicanos: | | | |
| 5.95% 1/28/31 | | 100,000 | 99,750 |
| 6.35% 2/12/48 | | 50,000 | 44,922 |
| 6.5% 1/23/29 | | 50,000 | 51,594 |
| 6.84% 1/23/30 | | 272,000 | 283,152 |
| 7.69% 1/23/50 | | 145,000 | 146,196 |
| Phillips 66 Co. 3.9% 3/15/28 | | 94,000 | 108,367 |
| Phillips 66 Partners LP 3.15% 12/15/29 | | 170,000 | 176,769 |
| Pioneer Natural Resources Co. 1.9% 8/15/30 | | 19,000 | 18,810 |
| Sabine Pass Liquefaction LLC 4.5% 5/15/30 (a) | | 850,000 | 1,006,986 |
| Shell International Finance BV: | | | |
| 2.375% 4/6/25 | | 1,030,000 | 1,104,463 |
| 3.125% 11/7/49 | | 100,000 | 110,253 |
| 3.25% 4/6/50 | | 100,000 | 113,257 |
| 3.5% 11/13/23 | | 300,000 | 326,534 |
| 3.75% 9/12/46 | | 70,000 | 84,480 |
| 4.375% 5/11/45 | | 33,000 | 43,413 |
| Spectra Energy Partners LP 3.375% 10/15/26 | | 158,000 | 177,083 |
| Suncor Energy, Inc. 4% 11/15/47 | | 179,000 | 200,056 |
| The Williams Companies, Inc.: | | | |
| 3.75% 6/15/27 | | 35,000 | 39,921 |
| 4.85% 3/1/48 | | 83,000 | 101,860 |
| Total Capital International SA: | | | |
| 3.127% 5/29/50 | | 220,000 | 237,977 |
| 3.455% 2/19/29 | | 100,000 | 115,725 |
| TransCanada PipeLines Ltd.: | | | |
| 4.1% 4/15/30 | | 530,000 | 625,862 |
| 4.25% 5/15/28 | | 101,000 | 119,246 |
| 7.625% 1/15/39 | | 371,000 | 577,880 |
| Transcontinental Gas Pipe Line Co. LLC: | | | |
| 3.25% 5/15/30 | | 66,000 | 73,919 |
| 3.95% 5/15/50 | | 180,000 | 203,240 |
| Valero Energy Corp. 4.35% 6/1/28 | | 20,000 | 22,754 |
| | | | 15,146,600 |
|
| TOTAL ENERGY | | | 15,340,631 |
|
| FINANCIALS - 8.0% | | | |
| Banks - 4.4% | | | |
| Bank of America Corp.: | | | |
| 0.81% 10/24/24 (b) | | 1,520,000 | 1,534,090 |
| 0.981% 9/25/25 (b) | | 600,000 | 606,421 |
| 1.197% 10/24/26 (b) | | 924,000 | 936,092 |
| 2.676% 6/19/41 (b) | | 100,000 | 104,030 |
| 3.419% 12/20/28 (b) | | 220,000 | 248,744 |
| 3.458% 3/15/25 (b) | | 1,900,000 | 2,068,400 |
| 3.5% 4/19/26 | | 122,000 | 138,234 |
| 3.55% 3/5/24 (b) | | 113,000 | 120,734 |
| 3.946% 1/23/49 (b) | | 23,000 | 28,699 |
| 3.97% 3/5/29 (b) | | 125,000 | 145,623 |
| 3.974% 2/7/30 (b) | | 60,000 | 70,637 |
| 4% 1/22/25 | | 370,000 | 415,754 |
| 4.083% 3/20/51 (b) | | 220,000 | 277,380 |
| 4.271% 7/23/29 (b) | | 80,000 | 95,218 |
| 4.33% 3/15/50 (b) | | 60,000 | 78,582 |
| Bank of Nova Scotia 3.4% 2/11/24 | | 140,000 | 152,327 |
| Barclays PLC: | | | |
| 2.852% 5/7/26 (b) | | 516,000 | 554,044 |
| 3.2% 8/10/21 | | 400,000 | 406,593 |
| 4.337% 1/10/28 | | 200,000 | 229,676 |
| 5.088% 6/20/30 (b) | | 726,000 | 870,490 |
| Citigroup, Inc.: | | | |
| 3 month U.S. LIBOR + 1.020% 4.044% 6/1/24 (b)(c) | | 134,000 | 145,708 |
| 3 month U.S. LIBOR + 1.150% 3.52% 10/27/28 (b)(c) | | 205,000 | 231,669 |
| 2.976% 11/5/30 (b) | | 270,000 | 297,200 |
| 3.106% 4/8/26 (b) | | 500,000 | 546,175 |
| 3.142% 1/24/23 (b) | | 365,000 | 375,317 |
| 3.878% 1/24/39 (b) | | 130,000 | 154,725 |
| 3.98% 3/20/30 (b) | | 160,000 | 188,072 |
| 4.65% 7/23/48 | | 78,000 | 107,328 |
| 5.316% 3/26/41 (b) | | 777,000 | 1,092,670 |
| Citizens Financial Group, Inc. 2.638% 9/30/32 (a) | | 78,000 | 82,463 |
| Fifth Third Bancorp 2.55% 5/5/27 | | 200,000 | 217,575 |
| HSBC Holdings PLC: | | | |
| 4.292% 9/12/26 (b) | | 2,000,000 | 2,278,888 |
| 6.8% 6/1/38 | | 449,000 | 679,343 |
| Japan Bank International Cooperation: | | | |
| 0.625% 7/15/25 | | 750,000 | 750,099 |
| 3.125% 7/20/21 | | 200,000 | 203,088 |
| JPMorgan Chase & Co.: | | | |
| 0.653% 9/16/24 (b) | | 2,140,000 | 2,151,180 |
| 2.083% 4/22/26 (b) | | 200,000 | 211,183 |
| 2.522% 4/22/31 (b) | | 150,000 | 161,140 |
| 2.7% 5/18/23 | | 111,000 | 116,693 |
| 2.739% 10/15/30 (b) | | 720,000 | 783,502 |
| 2.95% 10/1/26 | | 224,000 | 248,454 |
| 2.956% 5/13/31 (b) | | 50,000 | 54,812 |
| 3.109% 4/22/51 (b) | | 100,000 | 111,128 |
| 3.882% 7/24/38 (b) | | 734,000 | 892,774 |
| 4.005% 4/23/29 (b) | | 43,000 | 50,462 |
| 4.203% 7/23/29 (b) | | 30,000 | 35,852 |
| 4.452% 12/5/29 (b) | | 200,000 | 243,910 |
| 4.95% 6/1/45 | | 135,000 | 191,109 |
| Lloyds Banking Group PLC: | | | |
| 4.45% 5/8/25 | | 200,000 | 229,275 |
| 4.582% 12/10/25 | | 1,518,000 | 1,735,769 |
| Mitsubishi UFJ Financial Group, Inc.: | | | |
| 2.801% 7/18/24 | | 400,000 | 428,705 |
| 3.455% 3/2/23 | | 730,000 | 777,765 |
| 3.777% 3/2/25 | | 84,000 | 93,915 |
| Mizuho Financial Group, Inc.: | | | |
| 0.849% 9/8/24 (b) | | 400,000 | 402,272 |
| 2.226% 5/25/26 (b) | | 400,000 | 420,733 |
| Oesterreichische Kontrollbank AG: | | | |
| 0.375% 9/17/25 | | 83,000 | 82,583 |
| 2.875% 9/7/21 | | 50,000 | 50,897 |
| PNC Financial Services Group, Inc. 2.2% 11/1/24 | | 70,000 | 74,380 |
| Rabobank Nederland New York Branch 3.125% 4/26/21 | | 250,000 | 252,205 |
| Royal Bank of Canada: | | | |
| 2.55% 7/16/24 | | 520,000 | 555,970 |
| 4.65% 1/27/26 | | 55,000 | 64,915 |
| Royal Bank of Scotland Group PLC 3.875% 9/12/23 | | 220,000 | 238,692 |
| Santander Holdings U.S.A., Inc. 4.5% 7/17/25 | | 82,000 | 93,016 |
| Sumitomo Mitsui Financial Group, Inc.: | | | |
| 1.474% 7/8/25 | | 400,000 | 409,570 |
| 2.348% 1/15/25 | | 200,000 | 212,181 |
| 2.75% 1/15/30 | | 200,000 | 218,111 |
| 2.934% 3/9/21 | | 189,000 | 189,906 |
| 3.936% 10/16/23 | | 80,000 | 87,643 |
| The Toronto-Dominion Bank: | | | |
| 2.65% 6/12/24 | | 510,000 | 546,389 |
| 3.5% 7/19/23 | | 100,000 | 108,209 |
| Truist Financial Corp. 1.2% 8/5/25 | | 700,000 | 718,355 |
| U.S. Bancorp 1.375% 7/22/30 | | 660,000 | 661,190 |
| Wells Fargo & Co.: | | | |
| 2.188% 4/30/26 (b) | | 340,000 | 357,910 |
| 2.572% 2/11/31 (b) | | 690,000 | 729,848 |
| 2.625% 7/22/22 | | 75,000 | 77,631 |
| 3.068% 4/30/41 (b) | | 100,000 | 108,783 |
| 3.584% 5/22/28 (b) | | 82,000 | 92,919 |
| 3.75% 1/24/24 | | 150,000 | 163,731 |
| 4.1% 6/3/26 | | 1,194,000 | 1,368,410 |
| 4.75% 12/7/46 | | 157,000 | 205,350 |
| 5.013% 4/4/51 (b) | | 130,000 | 184,658 |
| Westpac Banking Corp.: | | | |
| 2.894% 2/4/30 (b) | | 590,000 | 618,402 |
| 3.65% 5/15/23 | | 130,000 | 140,394 |
| 4.11% 7/24/34 (b) | | 320,000 | 365,924 |
| | | | 34,750,893 |
| Capital Markets - 1.1% | | | |
| Bank of New York Mellon Corp.: | | | |
| 0.35% 12/7/23 | | 1,100,000 | 1,101,992 |
| 3.85% 4/28/28 | | 27,000 | 32,360 |
| BlackRock, Inc. 3.375% 6/1/22 | | 37,000 | 38,604 |
| Credit Suisse Group AG 4.55% 4/17/26 | | 250,000 | 294,057 |
| Deutsche Bank AG 4.1% 1/13/26 | | 200,000 | 221,478 |
| Deutsche Bank AG New York Branch: | | | |
| 3.7% 5/30/24 | | 200,000 | 215,110 |
| 3.95% 2/27/23 | | 200,000 | 212,493 |
| 4.1% 1/13/26 | | 200,000 | 222,946 |
| Goldman Sachs Group, Inc.: | | | |
| 3.2% 2/23/23 | | 200,000 | 211,313 |
| 3.691% 6/5/28 (b) | | 440,000 | 507,187 |
| 3.85% 1/26/27 | | 189,000 | 215,637 |
| 4.017% 10/31/38 (b) | | 887,000 | 1,081,101 |
| 4.223% 5/1/29 (b) | | 60,000 | 71,151 |
| 4.411% 4/23/39 (b) | | 100,000 | 127,680 |
| 4.75% 10/21/45 | | 28,000 | 38,935 |
| 6.75% 10/1/37 | | 130,000 | 198,702 |
| Intercontinental Exchange, Inc.: | | | |
| 1.85% 9/15/32 | | 230,000 | 231,727 |
| 2.35% 9/15/22 | | 34,000 | 35,040 |
| 2.65% 9/15/40 | | 230,000 | 236,092 |
| 3% 6/15/50 | | 138,000 | 146,117 |
| 3.75% 9/21/28 | | 50,000 | 58,228 |
| Morgan Stanley: | | | |
| 3 month U.S. LIBOR + 1.430% 4.457% 4/22/39 (b)(c) | | 295,000 | 382,612 |
| 2.188% 4/28/26 (b) | | 330,000 | 348,490 |
| 2.699% 1/22/31 (b) | | 230,000 | 249,547 |
| 3.125% 1/23/23 | | 210,000 | 221,616 |
| 3.625% 1/20/27 | | 96,000 | 110,148 |
| 3.971% 7/22/38 (b) | | 120,000 | 147,716 |
| 4.375% 1/22/47 | | 38,000 | 51,645 |
| 5.597% 3/24/51 (b) | | 90,000 | 144,648 |
| Nomura Holdings, Inc. 3.103% 1/16/30 | | 823,000 | 899,218 |
| Northern Trust Corp. 1.95% 5/1/30 | | 220,000 | 229,187 |
| | | | 8,282,777 |
| Consumer Finance - 0.9% | | | |
| AerCap Ireland Capital Ltd./AerCap Global Aviation Trust: | | | |
| 2.875% 8/14/24 | | 150,000 | 155,955 |
| 4.125% 7/3/23 | | 300,000 | 321,283 |
| 4.45% 4/3/26 | | 150,000 | 168,390 |
| 4.5% 9/15/23 | | 150,000 | 162,623 |
| 4.875% 1/16/24 | | 150,000 | 163,707 |
| Ally Financial, Inc.: | | | |
| 3.05% 6/5/23 | | 300,000 | 316,301 |
| 5.125% 9/30/24 | | 290,000 | 334,267 |
| 5.8% 5/1/25 | | 250,000 | 296,808 |
| American Express Co. 2.5% 7/30/24 | | 399,000 | 425,963 |
| American Express Credit Corp. 3.3% 5/3/27 | | 30,000 | 34,115 |
| Capital One Financial Corp.: | | | |
| 3.2% 1/30/23 | | 176,000 | 185,424 |
| 3.3% 10/30/24 | | 900,000 | 988,513 |
| 3.75% 3/9/27 | | 100,000 | 114,080 |
| 3.8% 1/31/28 | | 251,000 | 290,048 |
| Discover Financial Services 4.5% 1/30/26 | | 142,000 | 164,022 |
| GE Capital International Funding Co.: | | | |
| 3.373% 11/15/25 | | 200,000 | 222,549 |
| 4.418% 11/15/35 | | 200,000 | 238,488 |
| John Deere Capital Corp.: | | | |
| 2.6% 3/7/24 | | 60,000 | 64,229 |
| 2.8% 3/6/23 | | 64,000 | 67,544 |
| 2.8% 7/18/29 | | 120,000 | 133,513 |
| 3.65% 10/12/23 | | 290,000 | 316,577 |
| Synchrony Financial: | | | |
| 3.95% 12/1/27 | | 150,000 | 168,179 |
| 4.375% 3/19/24 | | 45,000 | 49,542 |
| 5.15% 3/19/29 | | 159,000 | 191,619 |
| Toyota Motor Credit Corp.: | | | |
| 0.5% 8/14/23 | | 280,000 | 281,411 |
| 1.15% 8/13/27 | | 300,000 | 301,085 |
| 2.15% 9/8/22 | | 1,000,000 | 1,031,118 |
| 2.25% 10/18/23 | | 113,000 | 118,883 |
| | | | 7,306,236 |
| Diversified Financial Services - 0.9% | | | |
| AB Svensk Exportkredit 0.25% 9/29/23 | | 200,000 | 199,772 |
| Berkshire Hathaway Finance Corp.: | | | |
| 1.45% 10/15/30 | | 120,000 | 121,492 |
| 2.85% 10/15/50 | | 220,000 | 235,441 |
| 4.2% 8/15/48 | | 243,000 | 320,447 |
| Berkshire Hathaway, Inc. 4.5% 2/11/43 | | 33,000 | 45,316 |
| BP Capital Markets America, Inc.: | | | |
| 2.52% 9/19/22 | | 128,000 | 132,390 |
| 3% 2/24/50 | | 240,000 | 245,492 |
| 3.216% 11/28/23 | | 94,000 | 100,775 |
| 3.224% 4/14/24 | | 470,000 | 508,233 |
| Brixmor Operating Partnership LP: | | | |
| 4.05% 7/1/30 | | 41,000 | 47,034 |
| 4.125% 5/15/29 | | 19,000 | 21,846 |
| DH Europe Finance II SARL: | | | |
| 2.2% 11/15/24 | | 70,000 | 74,175 |
| 2.6% 11/15/29 | | 80,000 | 87,447 |
| 3.4% 11/15/49 | | 50,000 | 59,257 |
| Equitable Holdings, Inc. 4.35% 4/20/28 | | 360,000 | 425,445 |
| Export Development Canada: | | | |
| 2.625% 2/21/24 | | 120,000 | 128,657 |
| 2.75% 3/15/23 | | 145,000 | 152,929 |
| Fedex Corp. 2020-1 Class AA pass-thru Trust 1.875% 8/20/35 | | 219,000 | 225,387 |
| KfW: | | | |
| 0.25% 10/19/23 | | 300,000 | 300,227 |
| 0.375% 7/18/25 | | 2,072,000 | 2,066,764 |
| 2.375% 12/29/22 | | 996,000 | 1,038,923 |
| 2.625% 2/28/24 | | 400,000 | 429,752 |
| 2.875% 4/3/28 | | 14,000 | 16,110 |
| Landwirtschaftliche Rentenbank 3.125% 11/14/23 | | 80,000 | 86,548 |
| | | | 7,069,859 |
| Insurance - 0.7% | | | |
| ACE INA Holdings, Inc.: | | | |
| 1.375% 9/15/30 | | 350,000 | 349,152 |
| 4.35% 11/3/45 | | 128,000 | 173,303 |
| AFLAC, Inc. 3.6% 4/1/30 | | 224,000 | 263,516 |
| Allstate Corp.: | | | |
| 1.45% 12/15/30 | | 300,000 | 298,964 |
| 5.55% 5/9/35 | | 156,000 | 228,511 |
| American International Group, Inc.: | | | |
| 2.5% 6/30/25 | | 44,000 | 47,290 |
| 4.25% 3/15/29 | | 100,000 | 119,958 |
| 4.375% 6/30/50 | | 240,000 | 313,696 |
| 4.5% 7/16/44 | | 25,000 | 31,980 |
| 4.75% 4/1/48 | | 100,000 | 133,202 |
| 5.75% 4/1/48 (b) | | 280,000 | 320,074 |
| Aon Corp. 3.75% 5/2/29 | | 120,000 | 139,926 |
| Brighthouse Financial, Inc. 4.7% 6/22/47 | | 28,000 | 29,532 |
| Hartford Financial Services Group, Inc.: | | | |
| 2.8% 8/19/29 | | 200,000 | 217,165 |
| 4.4% 3/15/48 | | 70,000 | 92,174 |
| Lincoln National Corp. 4.35% 3/1/48 | | 160,000 | 200,488 |
| Marsh & McLennan Companies, Inc.: | | | |
| 4.2% 3/1/48 | | 110,000 | 144,462 |
| 4.9% 3/15/49 | | 50,000 | 72,357 |
| MetLife, Inc.: | | | |
| 4.05% 3/1/45 | | 18,000 | 23,042 |
| 4.55% 3/23/30 | | 600,000 | 749,049 |
| Progressive Corp. 4.2% 3/15/48 | | 30,000 | 40,066 |
| Prudential Financial, Inc.: | | | |
| 3.878% 3/27/28 | | 35,000 | 41,137 |
| 3.935% 12/7/49 | | 38,000 | 46,090 |
| 4.35% 2/25/50 | | 285,000 | 373,736 |
| The Travelers Companies, Inc. 4% 5/30/47 | | 32,000 | 41,454 |
| Unum Group 4.5% 3/15/25 | | 460,000 | 520,922 |
| Willis Group North America, Inc. 2.95% 9/15/29 | | 170,000 | 185,907 |
| | | | 5,197,153 |
|
| TOTAL FINANCIALS | | | 62,606,918 |
|
| HEALTH CARE - 2.7% | | | |
| Biotechnology - 0.5% | | | |
| AbbVie, Inc.: | | | |
| 2.6% 11/21/24 | | 60,000 | 64,319 |
| 2.95% 11/21/26 | | 50,000 | 55,309 |
| 3.2% 11/21/29 | | 80,000 | 89,610 |
| 3.8% 3/15/25 | | 61,000 | 68,039 |
| 4.05% 11/21/39 | | 50,000 | 60,325 |
| 4.3% 5/14/36 | | 40,000 | 49,193 |
| 4.55% 3/15/35 | | 80,000 | 101,104 |
| 4.7% 5/14/45 | | 120,000 | 156,738 |
| 4.85% 6/15/44 | | 390,000 | 515,363 |
| 4.875% 11/14/48 | | 100,000 | 135,060 |
| Amgen, Inc.: | | | |
| 1.9% 2/21/25 | | 100,000 | 105,090 |
| 3.15% 2/21/40 | | 710,000 | 780,506 |
| 3.2% 11/2/27 | | 56,000 | 62,851 |
| 3.375% 2/21/50 | | 110,000 | 122,673 |
| 4.4% 5/1/45 | | 102,000 | 129,409 |
| Biogen, Inc. 5.2% 9/15/45 | | 339,000 | 459,641 |
| Gilead Sciences, Inc.: | | | |
| 1.65% 10/1/30 | | 180,000 | 180,481 |
| 2.8% 10/1/50 | | 180,000 | 178,328 |
| 4% 9/1/36 | | 40,000 | 48,253 |
| 4.15% 3/1/47 | | 60,000 | 73,174 |
| 4.5% 2/1/45 | | 311,000 | 396,888 |
| | | | 3,832,354 |
| Health Care Equipment & Supplies - 0.2% | | | |
| Abbott Laboratories: | | | |
| 3.875% 9/15/25 | | 240,000 | 274,878 |
| 4.9% 11/30/46 | | 20,000 | 29,571 |
| Becton, Dickinson & Co.: | | | |
| 2.823% 5/20/30 | | 150,000 | 164,775 |
| 3.7% 6/6/27 | | 52,000 | 59,654 |
| 4.669% 6/6/47 | | 130,000 | 170,424 |
| Boston Scientific Corp.: | | | |
| 3.75% 3/1/26 | | 120,000 | 136,151 |
| 4% 3/1/29 | | 100,000 | 117,797 |
| 4.7% 3/1/49 | | 140,000 | 191,751 |
| Danaher Corp. 2.6% 10/1/50 | | 225,000 | 233,149 |
| Medtronic, Inc. 4.625% 3/15/45 | | 28,000 | 39,663 |
| Stryker Corp.: | | | |
| 1.95% 6/15/30 | | 100,000 | 102,838 |
| 2.9% 6/15/50 | | 100,000 | 105,923 |
| | | | 1,626,574 |
| Health Care Providers & Services - 1.2% | | | |
| Aetna, Inc.: | | | |
| 2.8% 6/15/23 | | 110,000 | 115,730 |
| 4.75% 3/15/44 | | 60,000 | 77,106 |
| Allina Health System, Inc. 3.887% 4/15/49 | | 20,000 | 22,688 |
| Anthem, Inc.: | | | |
| 3.35% 12/1/24 | | 89,000 | 98,045 |
| 3.65% 12/1/27 | | 120,000 | 138,325 |
| 4.101% 3/1/28 | | 50,000 | 59,085 |
| 4.375% 12/1/47 | | 385,000 | 495,414 |
| 4.55% 3/1/48 | | 120,000 | 159,593 |
| Banner Health 2.913% 1/1/51 | | 100,000 | 106,123 |
| Baptist Healthcare System, Inc. 3.54% 8/15/50 | | 100,000 | 111,352 |
| Bon Secours Mercy Health, Inc. 2.095% 6/1/31 | | 71,000 | 73,127 |
| Cardinal Health, Inc. 3.41% 6/15/27 | | 67,000 | 75,625 |
| Children's Hospital of Philadelphia 2.704% 7/1/50 | | 79,000 | 82,666 |
| Cigna Corp.: | | | |
| 3.75% 7/15/23 | | 20,000 | 21,620 |
| 4.125% 11/15/25 | | 25,000 | 28,791 |
| 4.375% 10/15/28 | | 30,000 | 36,245 |
| 4.5% 2/25/26 | | 74,000 | 86,731 |
| 4.8% 8/15/38 | | 80,000 | 104,101 |
| 4.8% 7/15/46 | | 465,000 | 611,957 |
| 4.9% 12/15/48 | | 30,000 | 41,186 |
| CommonSpirit Health 3.91% 10/1/50 | | 125,000 | 139,107 |
| CVS Health Corp.: | | | |
| 2.7% 8/21/40 | | 767,000 | 774,814 |
| 3% 8/15/26 | | 20,000 | 22,148 |
| 3.25% 8/15/29 | | 195,000 | 219,999 |
| 3.75% 4/1/30 | | 380,000 | 442,005 |
| 4.1% 3/25/25 | | 32,000 | 36,232 |
| 4.25% 4/1/50 | | 37,000 | 46,202 |
| 4.3% 3/25/28 | | 264,000 | 314,237 |
| 5.05% 3/25/48 | | 131,000 | 177,266 |
| Franciscan Missionaries of Our Lady Health System, Inc. 3.914% 7/1/49 | | 120,000 | 142,074 |
| HCA Holdings, Inc.: | | | |
| 4.5% 2/15/27 | | 1,013,000 | 1,177,929 |
| 5.25% 6/15/49 | | 100,000 | 131,869 |
| Humana, Inc. 3.95% 3/15/27 | | 585,000 | 673,042 |
| INTEGRIS Baptist Medical Center, Inc. 3.875% 8/15/50 | | 83,000 | 97,197 |
| Kaiser Foundation Hospitals: | | | |
| 3.266% 11/1/49 | | 80,000 | 91,469 |
| 4.15% 5/1/47 | | 30,000 | 39,007 |
| MidMichigan Health 3.409% 6/1/50 | | 33,000 | 36,772 |
| Orlando Health Obligated Group 3.327% 10/1/50 | | 57,000 | 63,194 |
| Sutter Health 3.361% 8/15/50 | | 130,000 | 141,249 |
| UnitedHealth Group, Inc.: | | | |
| 1.25% 1/15/26 | | 81,000 | 83,457 |
| 2% 5/15/30 | | 250,000 | 265,044 |
| 2.375% 8/15/24 | | 90,000 | 95,887 |
| 2.9% 5/15/50 | | 120,000 | 132,599 |
| 3.5% 6/15/23 | | 182,000 | 196,338 |
| 3.5% 8/15/39 | | 772,000 | 917,151 |
| 3.7% 8/15/49 | | 40,000 | 50,057 |
| 3.75% 10/15/47 | | 30,000 | 37,201 |
| 4.45% 12/15/48 | | 102,000 | 140,425 |
| West Virginia University Health System Obligated Group 3.129% 6/1/50 | | 70,000 | 72,298 |
| | | | 9,301,779 |
| Life Sciences Tools & Services - 0.1% | | | |
| Thermo Fisher Scientific, Inc.: | | | |
| 2.6% 10/1/29 | | 150,000 | 164,152 |
| 3.2% 8/15/27 | | 82,000 | 92,142 |
| 4.133% 3/25/25 | | 894,000 | 1,016,333 |
| 4.497% 3/25/30 | | 84,000 | 104,928 |
| | | | 1,377,555 |
| Pharmaceuticals - 0.7% | | | |
| AstraZeneca PLC: | | | |
| 4.375% 11/16/45 | | 45,000 | 60,313 |
| 4.375% 8/17/48 | | 50,000 | 66,858 |
| Bristol-Myers Squibb Co.: | | | |
| 2.9% 7/26/24 | | 70,000 | 75,959 |
| 3.4% 7/26/29 | | 100,000 | 116,368 |
| 3.9% 2/20/28 | | 205,000 | 242,618 |
| 4.125% 6/15/39 | | 100,000 | 127,364 |
| 4.55% 2/20/48 | | 53,000 | 73,917 |
| 5% 8/15/45 | | 435,000 | 629,033 |
| Eli Lilly & Co. 2.25% 5/15/50 | | 200,000 | 196,176 |
| GlaxoSmithKline Capital, Inc. 3.875% 5/15/28 | | 130,000 | 154,769 |
| Johnson & Johnson: | | | |
| 0.55% 9/1/25 | | 110,000 | 110,449 |
| 1.3% 9/1/30 | | 110,000 | 110,419 |
| 2.1% 9/1/40 | | 110,000 | 110,667 |
| 2.45% 9/1/60 | | 110,000 | 113,946 |
| 3.4% 1/15/38 | | 116,000 | 140,143 |
| Merck & Co., Inc.: | | | |
| 2.45% 6/24/50 | | 250,000 | 258,313 |
| 3.7% 2/10/45 | | 45,000 | 56,175 |
| 4.15% 5/18/43 | | 266,000 | 345,449 |
| Mylan NV 4.55% 4/15/28 | | 20,000 | 23,766 |
| Novartis Capital Corp.: | | | |
| 1.75% 2/14/25 | | 100,000 | 104,886 |
| 2.75% 8/14/50 | | 50,000 | 54,684 |
| 3.1% 5/17/27 | | 90,000 | 101,092 |
| 4% 11/20/45 | | 35,000 | 45,774 |
| Pfizer, Inc.: | | | |
| 2.55% 5/28/40 | | 125,000 | 133,380 |
| 2.7% 5/28/50 | | 380,000 | 407,722 |
| 3.2% 9/15/23 | | 200,000 | 215,711 |
| 3.45% 3/15/29 | | 70,000 | 81,776 |
| 4% 12/15/36 | | 36,000 | 45,536 |
| Shire Acquisitions Investments Ireland DAC 3.2% 9/23/26 | | 110,000 | 123,025 |
| Takeda Pharmaceutical Co. Ltd.: | | | |
| 2.05% 3/31/30 | | 200,000 | 204,516 |
| 3.025% 7/9/40 | | 492,000 | 518,308 |
| Viatris, Inc.: | | | |
| 2.7% 6/22/30 (a) | | 100,000 | 106,055 |
| 4% 6/22/50 (a) | | 100,000 | 114,369 |
| Zoetis, Inc. 4.45% 8/20/48 | | 60,000 | 80,415 |
| | | | 5,349,951 |
|
| TOTAL HEALTH CARE | | | 21,488,213 |
|
| INDUSTRIALS - 2.1% | | | |
| Aerospace & Defense - 0.6% | | | |
| General Dynamics Corp.: | | | |
| 2.125% 8/15/26 | | 160,000 | 171,889 |
| 3.375% 5/15/23 | | 81,000 | 86,613 |
| 4.25% 4/1/50 | | 50,000 | 67,891 |
| Lockheed Martin Corp.: | | | |
| 4.09% 9/15/52 | | 70,000 | 92,482 |
| 4.7% 5/15/46 | | 28,000 | 39,372 |
| Northrop Grumman Corp.: | | | |
| 3.25% 1/15/28 | | 80,000 | 90,427 |
| 4.03% 10/15/47 | | 106,000 | 132,776 |
| 5.25% 5/1/50 | | 120,000 | 177,699 |
| Raytheon Technologies Corp.: | | | |
| 3.65% 8/16/23 | | 4,000 | 4,312 |
| 3.75% 11/1/46 | | 30,000 | 35,542 |
| 4.05% 5/4/47 | | 18,000 | 22,386 |
| 4.125% 11/16/28 | | 260,000 | 309,825 |
| 4.35% 4/15/47 | | 50,000 | 65,558 |
| 4.45% 11/16/38 | | 370,000 | 465,972 |
| 4.5% 6/1/42 | | 345,000 | 449,237 |
| The Boeing Co.: | | | |
| 3.2% 3/1/29 | | 126,000 | 132,948 |
| 3.75% 2/1/50 | | 130,000 | 136,471 |
| 4.875% 5/1/25 | | 660,000 | 752,198 |
| 5.705% 5/1/40 | | 836,000 | 1,081,042 |
| 5.805% 5/1/50 | | 130,000 | 179,303 |
| | | | 4,493,943 |
| Air Freight & Logistics - 0.2% | | | |
| FedEx Corp.: | | | |
| 3.8% 5/15/25 | | 470,000 | 530,459 |
| 4.05% 2/15/48 | | 150,000 | 181,007 |
| 4.95% 10/17/48 | | 102,000 | 139,030 |
| United Parcel Service, Inc.: | | | |
| 2.8% 11/15/24 | | 88,000 | 95,088 |
| 3.4% 9/1/49 | | 100,000 | 122,153 |
| 5.3% 4/1/50 | | 170,000 | 255,748 |
| | | | 1,323,485 |
| Airlines - 0.2% | | | |
| Southwest Airlines Co. 5.125% 6/15/27 | | 1,195,000 | 1,421,049 |
| Building Products - 0.1% | | | |
| Carrier Global Corp.: | | | |
| 2.242% 2/15/25 | | 100,000 | 105,873 |
| 2.493% 2/15/27 | | 50,000 | 53,931 |
| 2.722% 2/15/30 | | 100,000 | 106,760 |
| 3.377% 4/5/40 | | 415,000 | 452,784 |
| 3.577% 4/5/50 | | 50,000 | 55,439 |
| | | | 774,787 |
| Commercial Services & Supplies - 0.1% | | | |
| Republic Services, Inc.: | | | |
| 1.45% 2/15/31 | | 500,000 | 489,048 |
| 3.95% 5/15/28 | | 28,000 | 32,822 |
| | | | 521,870 |
| Electrical Equipment - 0.0% | | | |
| Eaton Corp. 2.75% 11/2/22 | | 133,000 | 138,774 |
| Industrial Conglomerates - 0.3% | | | |
| 3M Co.: | | | |
| 2.375% 8/26/29 | | 177,000 | 191,420 |
| 2.65% 4/15/25 | | 24,000 | 26,062 |
| 3.05% 4/15/30 | | 19,000 | 21,589 |
| 3.7% 4/15/50 | | 24,000 | 29,736 |
| General Electric Co.: | | | |
| 3.45% 5/1/27 | | 281,000 | 317,175 |
| 3.625% 5/1/30 | | 120,000 | 137,075 |
| 4.25% 5/1/40 | | 100,000 | 118,066 |
| 4.35% 5/1/50 | | 489,000 | 593,678 |
| 4.5% 3/11/44 | | 105,000 | 128,149 |
| Honeywell International, Inc.: | | | |
| 1.35% 6/1/25 | | 100,000 | 103,483 |
| 1.95% 6/1/30 | | 200,000 | 211,625 |
| 2.8% 6/1/50 | | 150,000 | 164,203 |
| 3.812% 11/21/47 | | 20,000 | 25,558 |
| Roper Technologies, Inc.: | | | |
| 1% 9/15/25 | | 50,000 | 50,592 |
| 1.4% 9/15/27 | | 50,000 | 50,613 |
| 1.75% 2/15/31 | | 50,000 | 49,777 |
| 2% 6/30/30 | | 330,000 | 337,110 |
| 2.8% 12/15/21 | | 108,000 | 110,292 |
| | | | 2,666,203 |
| Machinery - 0.2% | | | |
| Caterpillar Financial Services Corp.: | | | |
| 0.45% 9/14/23 | | 170,000 | 170,643 |
| 1.1% 9/14/27 | | 160,000 | 161,585 |
| 3.45% 5/15/23 | | 182,000 | 195,072 |
| 3.65% 12/7/23 | | 310,000 | 339,881 |
| Caterpillar, Inc. 3.25% 9/19/49 | | 110,000 | 128,793 |
| Deere & Co. 2.875% 9/7/49 | | 130,000 | 144,073 |
| Ingersoll-Rand Luxembourg Finance SA 3.8% 3/21/29 | | 125,000 | 146,252 |
| Otis Worldwide Corp.: | | | |
| 2.056% 4/5/25 | | 48,000 | 50,863 |
| 2.565% 2/15/30 | | 70,000 | 75,128 |
| 3.362% 2/15/50 | | 50,000 | 57,732 |
| Parker Hannifin Corp. 4% 6/14/49 | | 110,000 | 137,427 |
| | | | 1,607,449 |
| Professional Services - 0.0% | | | |
| Thomson Reuters Corp. 3.35% 5/15/26 | | 76,000 | 85,237 |
| Road & Rail - 0.3% | | | |
| Burlington Northern Santa Fe LLC: | | | |
| 3.05% 2/15/51 | | 311,000 | 351,409 |
| 3.25% 6/15/27 | | 160,000 | 181,094 |
| 4.05% 6/15/48 | | 207,000 | 272,046 |
| Canadian National Railway Co. 2.45% 5/1/50 | | 210,000 | 216,903 |
| CSX Corp.: | | | |
| 4.3% 3/1/48 | | 140,000 | 179,523 |
| 4.5% 3/15/49 | | 160,000 | 216,425 |
| 4.75% 11/15/48 | | 70,000 | 95,858 |
| Norfolk Southern Corp.: | | | |
| 3.8% 8/1/28 | | 63,000 | 73,808 |
| 4.05% 8/15/52 | | 90,000 | 114,358 |
| 4.15% 2/28/48 | | 38,000 | 48,195 |
| Union Pacific Corp.: | | | |
| 2.973% 9/16/62 (a) | | 290,000 | 302,222 |
| 3.25% 2/5/50 | | 50,000 | 56,893 |
| 3.5% 6/8/23 | | 270,000 | 289,437 |
| 3.6% 9/15/37 | | 38,000 | 44,276 |
| 3.7% 3/1/29 | | 79,000 | 91,597 |
| 3.839% 3/20/60 | | 70,000 | 86,463 |
| | | | 2,620,507 |
| Trading Companies & Distributors - 0.1% | | | |
| Air Lease Corp.: | | | |
| 3.25% 3/1/25 | | 88,000 | 94,198 |
| 3.75% 6/1/26 | | 158,000 | 173,759 |
| 3.875% 7/3/23 | | 526,000 | 561,615 |
| 4.25% 2/1/24 | | 170,000 | 184,466 |
| | | | 1,014,038 |
|
| TOTAL INDUSTRIALS | | | 16,667,342 |
|
| INFORMATION TECHNOLOGY - 2.1% | | | |
| Communications Equipment - 0.1% | | | |
| Cisco Systems, Inc.: | | | |
| 2.2% 9/20/23 | | 130,000 | 136,082 |
| 2.6% 2/28/23 | | 400,000 | 420,293 |
| | | | 556,375 |
| Electronic Equipment & Components - 0.1% | | | |
| Corning, Inc. 5.35% 11/15/48 | | 10,000 | 14,125 |
| Diamond 1 Finance Corp./Diamond 2 Finance Corp.: | | | |
| 5.3% 10/1/29 (a) | | 390,000 | 477,623 |
| 5.45% 6/15/23 (a) | | 110,000 | 121,655 |
| 8.1% 7/15/36 (a) | | 80,000 | 118,197 |
| 8.35% 7/15/46 (a) | | 287,000 | 433,630 |
| | | | 1,165,230 |
| IT Services - 0.6% | | | |
| Fiserv, Inc.: | | | |
| 2.75% 7/1/24 | | 440,000 | 472,394 |
| 3.5% 7/1/29 | | 80,000 | 91,304 |
| 4.4% 7/1/49 | | 240,000 | 320,919 |
| IBM Corp.: | | | |
| 1.95% 5/15/30 | | 175,000 | 180,276 |
| 2.5% 1/27/22 | | 104,000 | 106,417 |
| 2.95% 5/15/50 | | 175,000 | 186,160 |
| 3% 5/15/24 | | 100,000 | 108,311 |
| 3.5% 5/15/29 | | 843,000 | 975,374 |
| MasterCard, Inc.: | | | |
| 2.95% 6/1/29 | | 50,000 | 56,091 |
| 3.3% 3/26/27 | | 38,000 | 43,337 |
| 3.35% 3/26/30 | | 53,000 | 61,833 |
| 3.85% 3/26/50 | | 265,000 | 341,636 |
| PayPal Holdings, Inc.: | | | |
| 1.65% 6/1/25 | | 70,000 | 73,120 |
| 2.3% 6/1/30 | | 120,000 | 128,428 |
| The Western Union Co. 2.85% 1/10/25 | | 70,000 | 75,185 |
| Visa, Inc.: | | | |
| 1.9% 4/15/27 | | 769,000 | 818,206 |
| 2.05% 4/15/30 | | 350,000 | 374,134 |
| 2.7% 4/15/40 | | 150,000 | 163,507 |
| 4.15% 12/14/35 | | 38,000 | 49,355 |
| | | | 4,625,987 |
| Semiconductors & Semiconductor Equipment - 0.4% | | | |
| Applied Materials, Inc. 4.35% 4/1/47 | | 28,000 | 38,747 |
| Broadcom Corp./Broadcom Cayman LP: | | | |
| 3.125% 1/15/25 | | 82,000 | 88,527 |
| 3.5% 1/15/28 | | 1,134,000 | 1,249,399 |
| Broadcom, Inc.: | | | |
| 4.3% 11/15/32 | | 250,000 | 296,188 |
| 4.75% 4/15/29 | | 50,000 | 59,766 |
| 5% 4/15/30 | | 50,000 | 60,750 |
| Intel Corp.: | | | |
| 3.25% 11/15/49 | | 110,000 | 123,006 |
| 3.734% 12/8/47 | | 617,000 | 736,086 |
| Lam Research Corp. 2.875% 6/15/50 | | 150,000 | 161,315 |
| NVIDIA Corp.: | | | |
| 2.85% 4/1/30 | | 100,000 | 112,434 |
| 3.5% 4/1/50 | | 50,000 | 60,541 |
| Qualcomm, Inc. 1.65% 5/20/32 (a) | | 54,000 | 54,025 |
| Texas Instruments, Inc. 4.15% 5/15/48 | | 70,000 | 93,496 |
| | | | 3,134,280 |
| Software - 0.5% | | | |
| Microsoft Corp.: | | | |
| 2.4% 2/6/22 | | 685,000 | 698,952 |
| 2.525% 6/1/50 | | 326,000 | 343,089 |
| 3.3% 2/6/27 | | 115,000 | 131,169 |
| 3.45% 8/8/36 | | 64,000 | 78,827 |
| 3.7% 8/8/46 | | 430,000 | 544,457 |
| 4.1% 2/6/37 | | 71,000 | 93,073 |
| Oracle Corp.: | | | |
| 2.5% 4/1/25 | | 80,000 | 85,896 |
| 2.95% 4/1/30 | | 150,000 | 167,632 |
| 3.25% 11/15/27 | | 96,000 | 109,433 |
| 3.6% 4/1/50 | | 300,000 | 349,705 |
| 3.8% 11/15/37 | | 110,000 | 132,700 |
| 3.85% 4/1/60 | | 80,000 | 98,167 |
| 4% 11/15/47 | | 187,000 | 230,626 |
| 5.375% 7/15/40 | | 641,000 | 918,796 |
| | | | 3,982,522 |
| Technology Hardware, Storage & Peripherals - 0.4% | | | |
| Apple, Inc.: | | | |
| 0.55% 8/20/25 | | 100,000 | 100,426 |
| 1.125% 5/11/25 | | 872,000 | 896,554 |
| 1.25% 8/20/30 | | 250,000 | 249,902 |
| 2.4% 1/13/23 | | 350,000 | 364,895 |
| 2.4% 5/3/23 | | 156,000 | 163,628 |
| 2.55% 8/20/60 | | 200,000 | 205,198 |
| 2.95% 9/11/49 | | 240,000 | 267,390 |
| 3% 11/13/27 | | 96,000 | 108,176 |
| 3.75% 11/13/47 | | 57,000 | 71,772 |
| 3.85% 5/4/43 | | 369,000 | 465,473 |
| 4.5% 2/23/36 | | 90,000 | 121,026 |
| HP, Inc. 2.2% 6/17/25 | | 160,000 | 169,364 |
| | | | 3,183,804 |
|
| TOTAL INFORMATION TECHNOLOGY | | | 16,648,198 |
|
| MATERIALS - 0.8% | | | |
| Chemicals - 0.5% | | | |
| Air Products & Chemicals, Inc.: | | | |
| 1.5% 10/15/25 | | 100,000 | 104,210 |
| 2.05% 5/15/30 | | 60,000 | 63,969 |
| 2.7% 5/15/40 | | 60,000 | 64,570 |
| 2.8% 5/15/50 | | 100,000 | 109,696 |
| DuPont de Nemours, Inc.: | | | |
| 4.205% 11/15/23 | | 30,000 | 33,095 |
| 4.725% 11/15/28 | | 35,000 | 43,099 |
| 5.319% 11/15/38 | | 679,000 | 918,543 |
| Eastman Chemical Co. 4.5% 12/1/28 | | 174,000 | 209,438 |
| Ecolab, Inc.: | | | |
| 1.3% 1/30/31 | | 300,000 | 296,948 |
| 3.25% 1/14/23 | | 70,000 | 73,665 |
| LYB International Finance II BV 3.5% 3/2/27 | | 166,000 | 185,038 |
| LYB International Finance III LLC: | | | |
| 3.375% 10/1/40 | | 120,000 | 128,047 |
| 3.625% 4/1/51 | | 120,000 | 130,890 |
| 4.2% 10/15/49 | | 100,000 | 116,694 |
| Nutrien Ltd.: | | | |
| 4.2% 4/1/29 | | 13,000 | 15,537 |
| 5% 4/1/49 | | 103,000 | 142,211 |
| Sherwin-Williams Co.: | | | |
| 3.45% 6/1/27 | | 290,000 | 328,938 |
| 3.8% 8/15/49 | | 80,000 | 96,259 |
| 4.5% 6/1/47 | | 50,000 | 66,772 |
| The Dow Chemical Co.: | | | |
| 2.1% 11/15/30 | | 250,000 | 256,365 |
| 3.15% 5/15/24 | | 30,000 | 32,283 |
| 3.5% 10/1/24 | | 64,000 | 70,094 |
| 3.6% 11/15/50 | | 150,000 | 168,225 |
| 4.8% 5/15/49 | | 50,000 | 67,142 |
| 7.375% 11/1/29 | | 100,000 | 142,498 |
| The Mosaic Co. 4.05% 11/15/27 | | 90,000 | 101,870 |
| | | | 3,966,096 |
| Containers & Packaging - 0.0% | | | |
| International Paper Co. 3% 2/15/27 | | 51,000 | 56,131 |
| Metals & Mining - 0.3% | | | |
| Barrick Gold Corp. 5.25% 4/1/42 | | 163,000 | 224,520 |
| BHP Billiton Financial (U.S.A.) Ltd. 5% 9/30/43 | | 36,000 | 52,874 |
| Newmont Corp. 5.45% 6/9/44 | | 80,000 | 113,233 |
| Rio Tinto Finance (U.S.A.) Ltd. 3.75% 6/15/25 | | 1,494,000 | 1,685,997 |
| Southern Copper Corp. 5.875% 4/23/45 | | 30,000 | 43,331 |
| Vale Overseas Ltd. 6.25% 8/10/26 | | 50,000 | 61,969 |
| | | | 2,181,924 |
|
| TOTAL MATERIALS | | | 6,204,151 |
|
| REAL ESTATE - 0.5% | | | |
| Equity Real Estate Investment Trusts (REITs) - 0.5% | | | |
| Alexandria Real Estate Equities, Inc. 4.85% 4/15/49 | | 90,000 | 126,056 |
| American Tower Corp.: | | | |
| 1.3% 9/15/25 | | 120,000 | 122,653 |
| 2.1% 6/15/30 | | 160,000 | 164,128 |
| 3.1% 6/15/50 | | 160,000 | 164,497 |
| 3.6% 1/15/28 | | 32,000 | 36,340 |
| 3.8% 8/15/29 | | 70,000 | 81,345 |
| AvalonBay Communities, Inc. 3.2% 1/15/28 | | 63,000 | 70,108 |
| Crown Castle International Corp.: | | | |
| 1.35% 7/15/25 | | 79,000 | 80,625 |
| 2.25% 1/15/31 | | 100,000 | 103,667 |
| 3.25% 1/15/51 | | 40,000 | 42,125 |
| ERP Operating LP: | | | |
| 3.5% 3/1/28 | | 61,000 | 69,247 |
| 4.15% 12/1/28 | | 330,000 | 393,369 |
| Healthpeak Properties, Inc. 3% 1/15/30 | | 140,000 | 153,151 |
| Kimco Realty Corp.: | | | |
| 1.9% 3/1/28 | | 570,000 | 587,927 |
| 3.3% 2/1/25 | | 180,000 | 196,717 |
| Omega Healthcare Investors, Inc. 5.25% 1/15/26 | | 230,000 | 262,880 |
| Simon Property Group LP 3.375% 12/1/27 | | 935,000 | 1,044,463 |
| Ventas Realty LP: | | | |
| 4.4% 1/15/29 | | 40,000 | 46,892 |
| 4.875% 4/15/49 | | 160,000 | 198,340 |
| Welltower, Inc. 4.95% 9/1/48 | | 76,000 | 98,596 |
| | | | 4,043,126 |
| Real Estate Management & Development - 0.0% | | | |
| Ventas Realty LP/Ventas Capital Corp. 3.25% 8/15/22 | | 161,000 | 167,041 |
|
| TOTAL REAL ESTATE | | | 4,210,167 |
|
| UTILITIES - 2.0% | | | |
| Electric Utilities - 1.2% | | | |
| Alabama Power Co.: | | | |
| 1.45% 9/15/30 | | 400,000 | 402,176 |
| 3.45% 10/1/49 | | 140,000 | 164,585 |
| American Electric Power Co., Inc. 3.25% 3/1/50 | | 121,000 | 127,616 |
| Appalachian Power Co.: | | | |
| 3.3% 6/1/27 | | 110,000 | 122,771 |
| 4.45% 6/1/45 | | 18,000 | 23,095 |
| 4.5% 3/1/49 | | 90,000 | 117,283 |
| Baltimore Gas & Electric Co.: | | | |
| 2.9% 6/15/50 | | 200,000 | 214,927 |
| 3.2% 9/15/49 | | 150,000 | 167,206 |
| Commonwealth Edison Co. 4% 3/1/48 | | 42,000 | 53,103 |
| Duke Energy Carolinas LLC: | | | |
| 2.45% 8/15/29 | | 190,000 | 204,654 |
| 3.05% 3/15/23 | | 150,000 | 158,454 |
| 3.95% 3/15/48 | | 31,000 | 38,761 |
| 4.25% 12/15/41 | | 341,000 | 433,719 |
| Duke Energy Corp.: | | | |
| 2.45% 6/1/30 | | 182,000 | 193,549 |
| 3.15% 8/15/27 | | 314,000 | 350,275 |
| 3.75% 9/1/46 | | 80,000 | 93,085 |
| 3.95% 8/15/47 | | 250,000 | 303,260 |
| 4.2% 6/15/49 | | 90,000 | 113,776 |
| Entergy Corp.: | | | |
| 0.9% 9/15/25 | | 400,000 | 399,776 |
| 4% 7/15/22 | | 130,000 | 136,309 |
| Entergy, Inc. 3.55% 9/30/49 | | 29,000 | 33,393 |
| Eversource Energy: | | | |
| 3.3% 1/15/28 | | 62,000 | 69,547 |
| 3.45% 1/15/50 | | 60,000 | 68,188 |
| Exelon Corp.: | | | |
| 3.4% 4/15/26 | | 150,000 | 168,915 |
| 4.05% 4/15/30 | | 150,000 | 177,402 |
| 4.45% 4/15/46 | | 144,000 | 183,327 |
| FirstEnergy Corp.: | | | |
| 1.6% 1/15/26 | | 85,000 | 83,057 |
| 2.25% 9/1/30 | | 120,000 | 116,010 |
| 4.85% 7/15/47 | | 140,000 | 173,959 |
| Florida Power & Light Co.: | | | |
| 2.85% 4/1/25 | | 167,000 | 181,704 |
| 4.125% 6/1/48 | | 26,000 | 34,340 |
| Interstate Power and Light Co. 2.3% 6/1/30 | | 93,000 | 98,290 |
| MidAmerican Energy Co.: | | | |
| 3.65% 4/15/29 | | 190,000 | 225,564 |
| 3.65% 8/1/48 | | 30,000 | 36,615 |
| NextEra Energy Capital Holdings, Inc. 3.5% 4/1/29 | | 140,000 | 160,213 |
| Northern States Power Co.: | | | |
| 2.6% 6/1/51 | | 100,000 | 105,714 |
| 2.9% 3/1/50 | | 80,000 | 90,031 |
| 3.6% 9/15/47 | | 50,000 | 61,501 |
| Oncor Electric Delivery Co. LLC: | | | |
| 0.55% 10/1/25 (a) | | 239,000 | 238,729 |
| 3.1% 9/15/49 | | 100,000 | 114,837 |
| Pacific Gas & Electric Co. 3.5% 8/1/50 | | 682,000 | 676,873 |
| PacifiCorp 6% 1/15/39 | | 235,000 | 349,074 |
| PECO Energy Co. 3.9% 3/1/48 | | 96,000 | 120,865 |
| PPL Capital Funding, Inc. 4% 9/15/47 | | 20,000 | 23,259 |
| PPL Electric Utilities Corp. 3% 10/1/49 | | 100,000 | 108,887 |
| Public Service Co. of Colorado: | | | |
| 3.7% 6/15/28 | | 87,000 | 101,409 |
| 6.25% 9/1/37 | | 282,000 | 427,304 |
| Public Service Electric & Gas Co.: | | | |
| 2.45% 1/15/30 | | 70,000 | 75,895 |
| 3.15% 1/1/50 | | 70,000 | 79,483 |
| 3.6% 12/1/47 | | 44,000 | 52,880 |
| Puget Sound Energy, Inc. 4.223% 6/15/48 | | 45,000 | 57,433 |
| Southern California Edison Co. 4% 4/1/47 | | 562,000 | 659,043 |
| Southern Co. 3.25% 7/1/26 | | 112,000 | 125,609 |
| Southwestern Electric Power Co. 3.85% 2/1/48 | | 190,000 | 223,423 |
| Tampa Electric Co. 4.45% 6/15/49 | | 100,000 | 130,766 |
| Virginia Electric & Power Co.: | | | |
| 3.3% 12/1/49 | | 60,000 | 70,500 |
| 3.8% 9/15/47 | | 50,000 | 61,611 |
| 4.6% 12/1/48 | | 52,000 | 72,931 |
| Xcel Energy, Inc.: | | | |
| 3.4% 6/1/30 | | 63,000 | 72,290 |
| 4% 6/15/28 | | 76,000 | 89,437 |
| | | | 9,818,688 |
| Gas Utilities - 0.1% | | | |
| Dominion Gas Holdings LLC: | | | |
| 2.5% 11/15/24 | | 50,000 | 53,483 |
| 3.9% 11/15/49 | | 60,000 | 70,310 |
| Southern Co. Gas Capital Corp. 3.95% 10/1/46 | | 308,000 | 362,029 |
| | | | 485,822 |
| Independent Power and Renewable Electricity Producers - 0.0% | | | |
| Southern Power Co. 4.95% 12/15/46 | | 80,000 | 96,002 |
| Multi-Utilities - 0.7% | | | |
| Berkshire Hathaway Energy Co.: | | | |
| 4.05% 4/15/25 (a) | | 668,000 | 756,214 |
| 4.25% 10/15/50 (a) | | 290,000 | 374,994 |
| 4.45% 1/15/49 | | 54,000 | 71,714 |
| CenterPoint Energy, Inc.: | | | |
| 2.5% 9/1/22 | | 44,000 | 45,479 |
| 3.7% 9/1/49 | | 80,000 | 91,482 |
| Consolidated Edison Co. of New York, Inc.: | | | |
| 3.95% 4/1/50 | | 330,000 | 401,450 |
| 4.65% 12/1/48 | | 50,000 | 66,810 |
| 5.5% 12/1/39 | | 256,000 | 350,662 |
| Consolidated Edison, Inc. 2% 5/15/21 | | 176,000 | 176,830 |
| Dominion Energy, Inc.: | | | |
| 3.375% 4/1/30 | | 720,000 | 819,720 |
| 4.6% 3/15/49 | | 50,000 | 66,965 |
| 4.7% 12/1/44 | | 26,000 | 33,983 |
| 7% 6/15/38 | | 130,000 | 198,205 |
| DTE Energy Co. 3.7% 8/1/23 | | 46,000 | 49,674 |
| NiSource, Inc.: | | | |
| 0.95% 8/15/25 | | 280,000 | 281,631 |
| 1.7% 2/15/31 | | 280,000 | 278,428 |
| 2.95% 9/1/29 | | 190,000 | 208,910 |
| 3.49% 5/15/27 | | 50,000 | 56,294 |
| 3.95% 3/30/48 | | 46,000 | 56,410 |
| 5.25% 2/15/43 | | 156,000 | 213,355 |
| Puget Energy, Inc. 4.1% 6/15/30 | | 200,000 | 226,029 |
| San Diego Gas & Electric Co. 2.5% 5/15/26 | | 100,000 | 108,440 |
| Sempra Energy: | | | |
| 3.8% 2/1/38 | | 186,000 | 215,179 |
| 4% 2/1/48 | | 130,000 | 154,639 |
| 6% 10/15/39 | | 274,000 | 392,331 |
| | | | 5,695,828 |
|
| TOTAL UTILITIES | | | 16,096,340 |
|
| TOTAL NONCONVERTIBLE BONDS | | | |
| (Cost $188,910,801) | | | 200,378,436 |
|
| U.S. Government and Government Agency Obligations - 44.1% | | | |
| U.S. Government Agency Obligations - 1.1% | | | |
| Fannie Mae: | | | |
| 0.375% 8/25/25 | | $95,000 | $94,958 |
| 0.5% 6/17/25 | | 2,348,000 | 2,359,963 |
| 0.625% 4/22/25 | | 258,000 | 260,980 |
| 0.75% 10/8/27 | | 200,000 | 200,789 |
| 0.875% 8/5/30 | | 339,000 | 332,742 |
| 1.625% 10/15/24 | | 180,000 | 189,711 |
| 1.75% 7/2/24 | | 100,000 | 105,274 |
| 1.875% 9/24/26 | | 60,000 | 64,858 |
| 2.125% 4/24/26 | | 170,000 | 185,170 |
| 2.375% 1/19/23 | | 200,000 | 209,149 |
| Federal Home Loan Bank: | | | |
| 0.375% 9/4/25 | | 160,000 | 159,909 |
| 0.5% 4/14/25 | | 325,000 | 327,059 |
| 1.5% 8/15/24 | | 100,000 | 104,737 |
| 1.875% 11/29/21 | | 285,000 | 289,549 |
| 2.5% 2/13/24 | | 140,000 | 150,047 |
| 3% 10/12/21 | | 100,000 | 102,218 |
| Freddie Mac: | | | |
| 0.25% 8/24/23 | | 500,000 | 500,552 |
| 0.25% 12/4/23 | | 479,000 | 479,438 |
| 0.375% 7/21/25 | | 448,000 | 448,141 |
| 0.375% 9/23/25 | | 231,000 | 230,553 |
| 2.75% 6/19/23 | | 700,000 | 744,172 |
| Tennessee Valley Authority: | | | |
| 0.75% 5/15/25 | | 600,000 | 608,671 |
| 2.875% 2/1/27 | | 130,000 | 146,442 |
| 4.25% 9/15/65 | | 30,000 | 44,876 |
|
| TOTAL U.S. GOVERNMENT AGENCY OBLIGATIONS | | | 8,339,958 |
|
| U.S. Treasury Obligations - 43.0% | | | |
| U.S. Treasury Bonds: | | | |
| 1.125% 5/15/40 | | 5,406,000 | 5,123,874 |
| 1.125% 8/15/40 | | 9,052,000 | 8,555,554 |
| 1.25% 5/15/50 | | 3,643,000 | 3,297,484 |
| 1.375% 11/15/40 | | 1,590,000 | 1,569,380 |
| 1.375% 8/15/50 | | 12,815,000 | 11,974,016 |
| 1.625% 11/15/50 | | 1,546,000 | 1,536,821 |
| 2% 2/15/50 | | 287,000 | 311,047 |
| 2.25% 8/15/46 | | 110,000 | 125,314 |
| 2.25% 8/15/49 | | 129,000 | 147,322 |
| 2.5% 2/15/45 | | 128,000 | 152,360 |
| 2.5% 2/15/46 | | 342,000 | 407,795 |
| 2.5% 5/15/46 | | 93,000 | 110,888 |
| 2.75% 8/15/42 | | 197,000 | 243,826 |
| 2.75% 11/15/42 | | 587,000 | 726,023 |
| 2.75% 8/15/47 | | 51,000 | 63,814 |
| 2.75% 11/15/47 | | 107,000 | 134,013 |
| 2.875% 5/15/43 | | 190,000 | 239,786 |
| 2.875% 8/15/45 | | 586,000 | 744,197 |
| 2.875% 5/15/49 | | 1,000 | 1,290 |
| 3% 5/15/42 | | 89,000 | 114,278 |
| 3% 11/15/44 | | 2,149,000 | 2,776,239 |
| 3% 5/15/45 | | 5,398,000 | 6,990,832 |
| 3% 11/15/45 | | 744,000 | 966,415 |
| 3% 2/15/47 | | 49,000 | 63,949 |
| 3% 5/15/47 | | 208,000 | 271,871 |
| 3% 2/15/48 | | 87,000 | 113,987 |
| 3% 8/15/48 | | 3,000 | 3,939 |
| 3% 2/15/49 | | 134,000 | 176,409 |
| 3.125% 11/15/41 | | 113,000 | 147,553 |
| 3.125% 2/15/42 | | 65,000 | 85,094 |
| 3.125% 2/15/43 | | 1,664,000 | 2,178,865 |
| 3.125% 8/15/44 | | 687,000 | 904,452 |
| 3.125% 5/15/48 | | 169,000 | 226,420 |
| 3.375% 5/15/44 | | 1,976,000 | 2,697,549 |
| 3.375% 11/15/48 | | 157,000 | 220,094 |
| 3.5% 2/15/39 | | 8,000 | 10,849 |
| 3.625% 8/15/43 | | 971,000 | 1,369,034 |
| 3.625% 2/15/44 | | 2,647,000 | 3,741,886 |
| 3.75% 8/15/41 | | 45,000 | 63,847 |
| 3.75% 11/15/43 | | 2,130,000 | 3,060,710 |
| 3.875% 8/15/40 | | 52,000 | 74,421 |
| 4.375% 2/15/38 | | 12,000 | 17,819 |
| 4.375% 11/15/39 | | 24,000 | 36,247 |
| 4.375% 5/15/41 | | 32,000 | 48,984 |
| 4.5% 5/15/38 | | 92,000 | 138,780 |
| 4.5% 8/15/39 | | 17,000 | 25,977 |
| 4.75% 2/15/41 | | 48,000 | 76,571 |
| 5.5% 8/15/28 | | 4,000 | 5,424 |
| 7.125% 2/15/23 | | 175,000 | 200,908 |
| 7.25% 8/15/22 | | 190,000 | 211,897 |
| U.S. Treasury Notes: | | | |
| 0.125% 4/30/22 | | 1,564,000 | 1,564,367 |
| 0.125% 5/31/22 | | 5,738,000 | 5,739,121 |
| 0.125% 6/30/22 | | 5,420,000 | 5,420,635 |
| 0.125% 7/31/22 | | 2,050,000 | 2,050,240 |
| 0.125% 8/31/22 | | 3,521,000 | 3,521,138 |
| 0.125% 9/30/22 | | 3,991,000 | 3,991,000 |
| 0.125% 10/31/22 | | 23,610,000 | 23,612,767 |
| 0.125% 11/30/22 | | 1,438,000 | 1,438,112 |
| 0.125% 5/15/23 | | 806,000 | 805,717 |
| 0.125% 7/15/23 | | 534,000 | 533,708 |
| 0.125% 9/15/23 | | 23,903,000 | 23,884,326 |
| 0.125% 10/15/23 | | 3,458,000 | 3,455,298 |
| 0.25% 6/15/23 | | 3,323,000 | 3,331,308 |
| 0.25% 5/31/25 | | 2,897,000 | 2,891,002 |
| 0.25% 6/30/25 | | 945,000 | 942,416 |
| 0.25% 7/31/25 | | 3,265,000 | 3,254,797 |
| 0.25% 8/31/25 | | 154,000 | 153,471 |
| 0.25% 9/30/25 | | 24,259,000 | 24,162,307 |
| 0.25% 10/31/25 | | 2,234,000 | 2,223,877 |
| 0.375% 3/31/22 | | 1,044,000 | 1,047,303 |
| 0.375% 4/30/25 | | 1,897,000 | 1,903,595 |
| 0.375% 11/30/25 | | 3,253,000 | 3,256,812 |
| 0.375% 7/31/27 | | 1,259,000 | 1,241,984 |
| 0.375% 9/30/27 | | 17,496,000 | 17,221,258 |
| 0.5% 3/15/23 | | 3,412,000 | 3,439,456 |
| 0.5% 3/31/25 | | 1,366,000 | 1,378,379 |
| 0.5% 4/30/27 | | 3,691,000 | 3,680,475 |
| 0.5% 5/31/27 | | 4,223,000 | 4,206,504 |
| 0.5% 6/30/27 | | 2,827,000 | 2,814,080 |
| 0.625% 3/31/27 | | 2,260,000 | 2,272,713 |
| 0.625% 11/30/27 | | 2,230,000 | 2,228,606 |
| 0.625% 5/15/30 | | 14,187,000 | 13,861,142 |
| 0.625% 8/15/30 | | 2,850,000 | 2,776,969 |
| 0.875% 11/15/30 | | 3,469,000 | 3,455,449 |
| 1.125% 2/28/22 | | 569,000 | 575,712 |
| 1.125% 2/28/25 | | 4,578,000 | 4,738,767 |
| 1.125% 2/28/27 | | 691,000 | 716,319 |
| 1.25% 3/31/21 | | 52,000 | 52,138 |
| 1.25% 8/31/24 | | 1,923,000 | 1,994,587 |
| 1.375% 4/30/21 | | 301,000 | 302,223 |
| 1.375% 1/31/22 | | 1,769,000 | 1,792,771 |
| 1.375% 2/15/23 | | 2,303,000 | 2,363,544 |
| 1.375% 1/31/25 | | 1,386,000 | 1,448,153 |
| 1.375% 8/31/26 | | 253,000 | 266,045 |
| 1.5% 9/30/21 | | 599,000 | 605,177 |
| 1.5% 10/31/21 | | 440,000 | 445,019 |
| 1.5% 11/30/21 | | 11,476,000 | 11,619,450 |
| 1.5% 8/15/22 | | 1,141,000 | 1,166,361 |
| 1.5% 9/15/22 | | 464,000 | 474,821 |
| 1.5% 1/15/23 | | 2,392,000 | 2,458,528 |
| 1.5% 9/30/24 | | 1,783,000 | 1,866,857 |
| 1.5% 10/31/24 | | 2,714,000 | 2,844,081 |
| 1.5% 11/30/24 | | 2,519,000 | 2,641,112 |
| 1.5% 8/15/26 | | 557,000 | 589,637 |
| 1.5% 1/31/27 | | 2,284,000 | 2,420,059 |
| 1.5% 2/15/30 | | 417,000 | 440,896 |
| 1.625% 12/31/21 | | 2,309,000 | 2,343,635 |
| 1.625% 8/31/22 | | 562,000 | 575,940 |
| 1.625% 11/15/22 | | 1,457,000 | 1,497,523 |
| 1.625% 2/15/26 | | 261,000 | 277,537 |
| 1.625% 5/15/26 | | 264,000 | 281,026 |
| 1.625% 9/30/26 | | 1,113,000 | 1,186,215 |
| 1.625% 10/31/26 | | 457,000 | 487,241 |
| 1.625% 11/30/26 | | 180,000 | 191,967 |
| 1.625% 8/15/29 | | 1,000 | 1,069 |
| 1.75% 7/31/21 | | 374,000 | 377,535 |
| 1.75% 2/28/22 | | 441,000 | 449,338 |
| 1.75% 6/15/22 | | 485,000 | 496,386 |
| 1.75% 6/30/22 | | 336,000 | 344,164 |
| 1.75% 7/15/22 | | 1,795,000 | 1,839,805 |
| 1.75% 6/30/24 | | 805,000 | 848,300 |
| 1.75% 7/31/24 | | 2,907,000 | 3,065,863 |
| 1.75% 12/31/24 | | 2,363,000 | 2,502,842 |
| 1.75% 12/31/26 | | 527,000 | 566,154 |
| 1.875% 5/31/22 | | 115,000 | 117,848 |
| 1.875% 9/30/22 | | 358,000 | 368,852 |
| 1.875% 6/30/26 | | 589,000 | 635,384 |
| 1.875% 7/31/26 | | 909,000 | 981,116 |
| 2% 12/31/21 | | 333,000 | 339,218 |
| 2% 10/31/22 | | 48,000 | 49,639 |
| 2% 5/31/24 | | 442,000 | 469,021 |
| 2% 2/15/25 | | 82,000 | 87,782 |
| 2% 8/15/25 | | 50,000 | 53,846 |
| 2% 11/15/26 | | 585,000 | 636,530 |
| 2.125% 5/15/22 | | 2,099,000 | 2,156,395 |
| 2.125% 12/31/22 | | 19,000 | 19,755 |
| 2.125% 3/31/24 | | 1,201,000 | 1,275,875 |
| 2.125% 5/15/25 | | 13,000 | 14,029 |
| 2.25% 4/30/21 | | 428,000 | 430,959 |
| 2.25% 4/30/24 | | 1,443,000 | 1,541,135 |
| 2.25% 10/31/24 | | 279,000 | 300,339 |
| 2.25% 12/31/24 | | 160,000 | 172,650 |
| 2.25% 2/15/27 | | 393,000 | 434,265 |
| 2.25% 8/15/27 | | 639,000 | 708,267 |
| 2.25% 11/15/27 | | 682,000 | 756,967 |
| 2.375% 4/15/21 | | 202,000 | 203,294 |
| 2.375% 3/15/22 | | 1,583,000 | 1,625,605 |
| 2.375% 1/31/23 | | 239,000 | 250,110 |
| 2.375% 2/29/24 | | 2,859,000 | 3,055,780 |
| 2.375% 4/30/26 | | 405,000 | 447,114 |
| 2.375% 5/15/27 | | 46,000 | 51,292 |
| 2.375% 5/15/29 | | 108,000 | 121,989 |
| 2.5% 1/15/22 | | 1,095,000 | 1,121,817 |
| 2.5% 2/15/22 | | 738,000 | 757,632 |
| 2.5% 8/15/23 | | 57,000 | 60,500 |
| 2.5% 1/31/24 | | 3,559,000 | 3,812,718 |
| 2.5% 5/15/24 | | 217,000 | 233,809 |
| 2.5% 1/31/25 | | 238,000 | 259,541 |
| 2.5% 2/28/26 | | 191,000 | 211,697 |
| 2.625% 5/15/21 | | 107,000 | 107,978 |
| 2.625% 6/15/21 | | 503,000 | 508,619 |
| 2.625% 7/15/21 | | 71,000 | 71,943 |
| 2.625% 12/15/21 | | 1,639,000 | 1,677,990 |
| 2.625% 2/28/23 | | 492,000 | 518,349 |
| 2.625% 6/30/23 | | 1,031,000 | 1,094,390 |
| 2.625% 12/31/23 | | 1,205,000 | 1,293,210 |
| 2.625% 12/31/25 | | 331,000 | 368,018 |
| 2.625% 1/31/26 | | 461,000 | 513,331 |
| 2.625% 2/15/29 | | 391,000 | 448,627 |
| 2.75% 8/15/21 | | 295,000 | 299,817 |
| 2.75% 9/15/21 | | 2,000 | 2,037 |
| 2.75% 4/30/23 | | 84,000 | 89,073 |
| 2.75% 5/31/23 | | 176,000 | 187,014 |
| 2.75% 7/31/23 | | 700,000 | 746,813 |
| 2.75% 8/31/23 | | 1,634,000 | 1,746,401 |
| 2.75% 6/30/25 | | 113,000 | 125,280 |
| 2.75% 2/15/28 | | 363,000 | 416,089 |
| 2.875% 10/15/21 | | 575,000 | 587,376 |
| 2.875% 11/15/21 | | 129,000 | 132,064 |
| 2.875% 10/31/23 | | 810,000 | 871,889 |
| 2.875% 11/30/23 | | 1,045,000 | 1,127,090 |
| 2.875% 5/31/25 | | 144,000 | 160,194 |
| 2.875% 5/15/28 | | 216,000 | 250,147 |
| 2.875% 8/15/28 | | 303,000 | 351,800 |
| 3% 9/30/25 | | 148,000 | 166,517 |
| 3% 10/31/25 | | 130,000 | 146,514 |
| 3.125% 11/15/28 | | 940,000 | 1,112,395 |
|
| TOTAL U.S. TREASURY OBLIGATIONS | | | 338,284,968 |
|
| TOTAL U.S. GOVERNMENT AND GOVERNMENT AGENCY OBLIGATIONS | | | |
| (Cost $339,655,486) | | | 346,624,926 |
|
| U.S. Government Agency - Mortgage Securities - 29.3% | | | |
| Fannie Mae - 10.0% | | | |
| 2% 7/1/35 to 12/1/50 | | 15,652,343 | 16,293,568 |
| 2.5% 2/1/23 to 8/1/50 | | 8,655,402 | 9,101,928 |
| 3.5% 1/1/24 to 7/1/50 | | 7,722,379 | 8,203,404 |
| 3.5% 4/1/34 | | 25,533 | 27,118 |
| 4% 10/1/33 to 10/1/49 | | 13,638,950 | 14,589,552 |
| 4.5% 5/1/47 to 4/1/50 | | 4,650,794 | 5,038,055 |
| 5% 11/1/25 to 12/1/49 | | 980,135 | 1,088,194 |
| 5.5% 5/1/44 to 4/1/49 | | 462,754 | 523,824 |
| 3% 4/1/22 to 7/1/50 | | 22,839,726 | 24,085,654 |
|
| TOTAL FANNIE MAE | | | 78,951,297 |
|
| Freddie Mac - 7.3% | | | |
| 2% 10/1/30 to 1/1/51 | | 3,142,520 | 3,273,162 |
| 2% 9/1/35 | | 1,980,635 | 2,072,367 |
| 2% 11/1/35 | | 444,774 | 465,096 |
| 2% 11/1/35 | | 152,085 | 159,034 |
| 2.5% 4/1/27 to 1/1/51 | | 17,927,186 | 18,895,692 |
| 3% 1/1/26 to 4/1/50 | | 2,176,208 | 2,301,719 |
| 3% 8/1/47 | | 55,452 | 58,183 |
| 3.5% 2/1/26 to 3/1/50 | | 18,989,618 | 20,063,504 |
| 4% 11/1/33 to 9/1/49 | | 4,165,081 | 4,454,555 |
| 4.5% 8/1/48 to 4/1/50 | | 2,538,130 | 2,748,570 |
| 5% 4/1/48 to 5/1/50 | | 2,182,354 | 2,412,917 |
| 5.5% 6/1/49 | | 438,165 | 490,023 |
|
| TOTAL FREDDIE MAC | | | 57,394,822 |
|
| Ginnie Mae - 6.5% | | | |
| 2% 1/1/51 (d) | | 1,600,000 | 1,673,728 |
| 2% 1/1/51 (d) | | 800,000 | 836,864 |
| 2.5% 10/20/46 to 10/20/50 | | 4,129,321 | 4,372,613 |
| 2.5% 1/1/51 (d) | | 100,000 | 105,870 |
| 2.5% 1/1/51 (d) | | 1,050,000 | 1,111,632 |
| 2.5% 1/1/51 (d) | | 1,950,000 | 2,064,459 |
| 2.5% 1/1/51 (d) | | 800,000 | 846,958 |
| 2.5% 2/1/51 (d) | | 700,000 | 739,639 |
| 3% 7/20/42 to 6/20/50 | | 13,848,990 | 14,518,872 |
| 3% 1/1/51 (d) | | 300,000 | 313,678 |
| 3.5% 2/20/46 to 4/20/50 | | 12,275,551 | 13,034,563 |
| 3.5% 1/1/51 (d) | | 300,000 | 317,911 |
| 4% 4/20/47 to 2/20/50 | | 6,038,603 | 6,452,235 |
| 4% 1/1/51 (d) | | 100,000 | 106,602 |
| 4.5% 1/20/47 to 4/20/50 | | 2,794,114 | 3,005,189 |
| 4.5% 1/1/51 (d) | | 100,000 | 107,313 |
| 5% 11/20/47 to 4/20/50 | | 1,063,736 | 1,158,914 |
| 5.5% 9/20/47 to 1/20/49 | | 86,390 | 98,533 |
|
| TOTAL GINNIE MAE | | | 50,865,573 |
|
| Uniform Mortgage Backed Securities - 5.5% | | | |
| 2% 1/1/36 (d) | | 1,500,000 | 1,568,771 |
| 2% 1/1/51 (d) | | 2,400,000 | 2,494,864 |
| 2% 1/1/51 (d) | | 700,000 | 727,669 |
| 2% 1/1/51 (d) | | 7,200,000 | 7,484,592 |
| 2% 1/1/51 (d) | | 7,200,000 | 7,484,592 |
| 2% 1/1/51 (d) | | 700,000 | 727,669 |
| 2% 1/1/51 (d) | | 2,400,000 | 2,494,864 |
| 2% 1/1/51 (d) | | 2,350,000 | 2,442,888 |
| 2% 1/1/51 (d) | | 3,250,000 | 3,378,461 |
| 2.5% 1/1/36 (d) | | 600,000 | 625,969 |
| 2.5% 1/1/36 (d) | | 200,000 | 208,656 |
| 2.5% 1/1/51 (d) | | 1,400,000 | 1,476,289 |
| 3% 1/1/36 (d) | | 100,000 | 104,941 |
| 3% 1/1/51 (d) | | 7,250,000 | 7,595,785 |
| 3% 1/1/51 (d) | | 3,050,000 | 3,195,468 |
| 3% 1/1/51 (d) | | 400,000 | 419,078 |
| 3.5% 1/1/51 (d) | | 500,000 | 528,594 |
| 4% 1/1/51 (d) | | 300,000 | 320,367 |
| 4.5% 1/1/51 (d) | | 200,000 | 216,750 |
|
| TOTAL UNIFORM MORTGAGE BACKED SECURITIES | | | 43,496,267 |
|
| TOTAL U.S. GOVERNMENT AGENCY - MORTGAGE SECURITIES | | | |
| (Cost $228,312,023) | | | 230,707,959 |
|
| Asset-Backed Securities - 0.0% | | | |
| CarMax Auto Owner Trust Series 2018-3 Class A3, 3.13% 6/15/23 | | $19,708 | $20,036 |
| Citibank Credit Card Issuance Trust Series 2018-A6 Class A6, 3.21% 12/7/24 | | 100,000 | 105,735 |
| Ford Credit Floorplan Master Owner Trust Series 2018-4 Class A, 4.06% 11/15/30 | | 30,000 | 35,354 |
| TOTAL ASSET-BACKED SECURITIES | | | |
| (Cost $149,680) | | | 161,125 |
|
| Commercial Mortgage Securities - 1.0% | | | |
| BANK sequential payer: | | | |
| Series 2017-BNK4 Class ASB, 3.419% 5/15/50 | | 200,000 | 218,470 |
| Series 2020-BN25 Class A5, 2.649% 1/15/63 | | 220,000 | 240,087 |
| Series 2020-BN28 Class A4, 1.844% 3/15/63 | | 360,000 | 368,317 |
| Benchmark Mortgage Trust: | | | |
| sequential payer Series 2020-B19 Class A5, 1.85% 9/15/53 | | 410,000 | 420,728 |
| Series 2019-B12 Class A5, 3.1156% 8/15/52 | | 95,000 | 107,158 |
| Series 2019-B9 Class A5, 4.0156% 3/15/52 | | 130,000 | 154,392 |
| Citigroup Commercial Mortgage Trust sequential payer: | | | |
| Series 2015-GC29 Class A4, 3.192% 4/10/48 | | 80,000 | 87,303 |
| Series 2016-C1 Class A4, 3.209% 5/10/49 | | 90,000 | 99,680 |
| COMM Mortgage Trust sequential payer Series 2013-CR13 Class A3, 3.928% 11/10/46 | | 44,568 | 48,416 |
| CSAIL Commercial Mortgage Trust sequential payer Series 2019-C17: | | | |
| Class A4, 2.7628% 9/15/52 | | 200,000 | 216,199 |
| Class A5, 3.0161% 9/15/52 | | 200,000 | 222,188 |
| Freddie Mac: | | | |
| sequential payer: | | | |
| Series 2020-K104 Class A2, 2.253% 1/25/30 | | 680,000 | 740,514 |
| Series 2020-K116 Class A2, 1.378% 7/25/30 | | 770,000 | 785,854 |
| Series 2020-K117 Class A2, 1.406% 8/25/30 | | 590,000 | 601,769 |
| Series 2020-K118 Class A2, 1.493% 9/25/30 | | 590,000 | 606,199 |
| Series 2020-K121 Class A2, 1.547% 10/25/30 | | 890,000 | 918,285 |
| Series K057 Class A2, 2.57% 7/25/26 | | 159,400 | 174,403 |
| Series K080 Class A2, 3.926% 7/25/28 | | 80,000 | 96,123 |
| Series K-1510 Class A2, 3.718% 1/25/31 | | 124,000 | 150,014 |
| Series K068 Class A2, 3.244% 8/25/27 | | 130,000 | 149,148 |
| Series K079 Class A2, 3.926% 6/25/28 | | 20,000 | 23,984 |
| Series K094 Class A2, 2.903% 6/25/29 | | 300,000 | 341,599 |
| GS Mortgage Securities Trust sequential payer: | | | |
| Series 2014-GC26 Class A4, 3.364% 11/10/47 | | 110,000 | 118,805 |
| Series 2020-GC45 Class A5, 2.9106% 2/13/53 | | 260,000 | 289,413 |
| JPMBB Commercial Mortgage Securities Trust sequential payer: | | | |
| Series 2014-C21 Class A5, 3.7748% 8/15/47 | | 150,000 | 164,576 |
| Series 2014-C24 Class A5, 3.6385% 11/15/47 | | 150,000 | 164,571 |
| Morgan Stanley Capital I Trust sequential payer Series 2020-L4 Class A3, 2.698% 2/15/53 | | 100,000 | 109,200 |
| Wells Fargo Commercial Mortgage Trust: | | | |
| sequential payer: | | | |
| Series 2019-C52 Class A5, 2.892% 8/15/52 | | 200,000 | 221,619 |
| Series 2020-C55 Class A5, 2.725% 2/15/53 | | 90,000 | 98,634 |
| Series 2018-C48 Class A5, 4.302% 1/15/52 | | 123,000 | 147,102 |
| TOTAL COMMERCIAL MORTGAGE SECURITIES | | | |
| (Cost $7,721,977) | | | 8,084,750 |
|
| Municipal Securities - 0.2% | | | |
| American Muni. Pwr., Inc. Rev. (Combined Hydroelectric Proj.) Series 2010 B, 7.834% 2/15/41 | | 55,000 | 89,383 |
| Bay Area Toll Auth. San Francisco Bay Toll Bridge Rev.: | | | |
| Series 2009 F2, 6.263% 4/1/49 | | $75,000 | $129,193 |
| Series 2010 S1, 7.043% 4/1/50 | | 75,000 | 137,298 |
| California Gen. Oblig.: | | | |
| Series 2009, 7.55% 4/1/39 | | 145,000 | 254,591 |
| Series 2010, 7.6% 11/1/40 | | 150,000 | 271,317 |
| Dallas Fort Worth Int'l. Arpt. Rev. Series 2019 A, 3.144% 11/1/45 | | 20,000 | 21,391 |
| New Jersey Trans. Trust Fund Auth. Series B: | | | |
| 4.081% 6/15/39 | | 80,000 | 84,101 |
| 4.131% 6/15/42 | | 80,000�� | 82,870 |
| New York Metropolitan Trans. Auth. Rev. Series 2010 A, 6.668% 11/15/39 | | 60,000 | 78,311 |
| Univ. of California Regents Med. Ctr. Pool Rev. Series N: | | | |
| 3.006% 5/15/50 | | 175,000 | 185,726 |
| 3.256% 5/15/60 | | 150,000 | 168,714 |
| TOTAL MUNICIPAL SECURITIES | | | |
| (Cost $1,397,955) | | | 1,502,895 |
|
| Foreign Government and Government Agency Obligations - 2.3% | | | |
| Alberta Province: | | | |
| 2.95% 1/23/24 | | $110,000 | $118,553 |
| 3.3% 3/15/28 | | 75,000 | 86,432 |
| Canadian Government 2% 11/15/22 | | 120,000 | 124,102 |
| Chilean Republic: | | | |
| 3.24% 2/6/28 | | 200,000 | 226,625 |
| 3.86% 6/21/47 | | 325,000 | 396,195 |
| Colombian Republic: | | | |
| 4.5% 3/15/29 | | 200,000 | 231,000 |
| 5.2% 5/15/49 | | 733,000 | 926,558 |
| Hungarian Republic: | | | |
| 5.375% 2/21/23 | | 100,000 | 109,452 |
| 5.375% 3/25/24 | | 1,324,000 | 1,507,859 |
| 5.75% 11/22/23 | | 50,000 | 56,859 |
| Indonesian Republic: | | | |
| 2.85% 2/14/30 | | 200,000 | 215,625 |
| 3.5% 2/14/50 | | 200,000 | 216,688 |
| 3.85% 10/15/30 | | 348,000 | 404,006 |
| Israeli State 3.375% 1/15/50 | | 225,000 | 248,742 |
| Italian Republic: | | | |
| 2.375% 10/17/24 | | 200,000 | 210,312 |
| 4% 10/17/49 | | 497,000 | 546,312 |
| Manitoba Province 2.6% 4/16/24 | | 410,000 | 439,221 |
| Ontario Province: | | | |
| 1.05% 5/21/27 | | 1,413,000 | 1,429,136 |
| 1.125% 10/7/30 | | 175,000 | 172,678 |
| 2.3% 6/15/26 | | 50,000 | 54,274 |
| 2.5% 4/27/26 | | 115,000 | 125,958 |
| 3.05% 1/29/24 | | 90,000 | 97,278 |
| Panamanian Republic 3.16% 1/23/30 | | 800,000 | 885,750 |
| Peruvian Republic: | | | |
| 1.862% 12/1/32 | | 340,000 | 343,230 |
| 2.78% 12/1/60 | | 100,000 | 100,650 |
| 2.844% 6/20/30 | | 190,000 | 210,366 |
| 4.125% 8/25/27 | | 50,000 | 58,641 |
| Philippine Republic: | | | |
| 2.65% 12/10/45 | | 500,000 | 503,750 |
| 3% 2/1/28 | | 200,000 | 221,044 |
| Polish Government 3.25% 4/6/26 | | 73,000 | 82,277 |
| Province of Quebec: | | | |
| 1.5% 2/11/25 | | 2,149,000 | 2,238,613 |
| 2.375% 1/31/22 | | 25,000 | 25,582 |
| 2.5% 4/9/24 | | 140,000 | 149,708 |
| 2.75% 4/12/27 | | 95,000 | 106,370 |
| United Mexican States: | | | |
| 3.25% 4/16/30 | | 2,321,000 | 2,515,384 |
| 3.75% 1/11/28 | | 200,000 | 225,313 |
| 4% 10/2/23 | | 160,000 | 175,300 |
| 4.15% 3/28/27 | | 200,000 | 231,500 |
| 4.5% 4/22/29 | | 200,000 | 234,500 |
| 4.75% 4/27/32 | | 387,000 | 465,126 |
| Uruguay Republic: | | | |
| 4.375% 1/23/31 | | 150,000 | 183,984 |
| 7.625% 3/21/36 | | 678,000 | 1,096,241 |
| TOTAL FOREIGN GOVERNMENT AND GOVERNMENT AGENCY OBLIGATIONS | | | |
| (Cost $17,567,619) | | | 17,997,194 |
|
| Supranational Obligations - 1.4% | | | |
| Asian Development Bank: | | | |
| 0.375% 9/3/25 | | 450,000 | 448,419 |
| 0.75% 10/8/30 | | 100,000 | 97,409 |
| 1.5% 10/18/24 | | 200,000 | 208,714 |
| 1.875% 1/24/30 | | 610,000 | 656,597 |
| 2.625% 1/30/24 | | 80,000 | 85,767 |
| 2.75% 3/17/23 | | 700,000 | 739,002 |
| European Investment Bank: | | | |
| 0.75% 9/23/30 | | 250,000 | 243,668 |
| 0.875% 5/17/30 | | 18,000 | 17,839 |
| 1.375% 5/15/23 | | 350,000 | 359,690 |
| 2% 12/15/22 | | 510,000 | 527,973 |
| 2.25% 6/24/24 | | 1,678,000 | 1,791,468 |
| 2.875% 8/15/23 | | 260,000 | 278,066 |
| Inter-American Development Bank: | | | |
| 0.625% 7/15/25 | | 390,000 | 393,089 |
| 1.75% 3/14/25 | | 194,000 | 204,822 |
| 2.25% 6/18/29 | | 1,029,000 | 1,134,469 |
| 4.375% 1/24/44 | | 39,000 | 58,015 |
| International Bank for Reconstruction & Development: | | | |
| 0.375% 7/28/25 | | 270,000 | 269,085 |
| 0.5% 10/28/25 | | 218,000 | 218,310 |
| 0.75% 8/26/30 | | 160,000 | 155,840 |
| 0.875% 5/14/30 | | 176,000 | 173,933 |
| 1.5% 8/28/24 | | 1,012,000 | 1,054,677 |
| 1.625% 1/15/25 | | 155,000 | 162,680 |
| 1.75% 4/19/23 | | 55,000 | 56,929 |
| 1.875% 6/19/23 | | 20,000 | 20,814 |
| 2.5% 3/19/24 | | 130,000 | 139,232 |
| 2.5% 11/22/27 | | 92,000 | 102,502 |
| 3% 9/27/23 | | 100,000 | 107,448 |
| International Finance Corp.: | | | |
| 0.75% 8/27/30 | | 60,000 | 58,529 |
| 1.375% 10/16/24 | | 1,051,000 | 1,092,455 |
| 2.875% 7/31/23 | | 112,000 | 119,516 |
| TOTAL SUPRANATIONAL OBLIGATIONS | | | |
| (Cost $10,827,933) | | | 10,976,957 |
|
| Bank Notes - 0.2% | | | |
| Discover Bank 2.7% 2/6/30 | | 500,000 | 530,034 |
| PNC Bank NA 2.15% 4/29/21 | | 250,000 | 251,173 |
| RBS Citizens NA 2.25% 4/28/25 | | 345,000 | 365,998 |
| Wells Fargo Bank NA 3.55% 8/14/23 | | 250,000 | 269,985 |
| TOTAL BANK NOTES | | | |
| (Cost $1,362,692) | | | 1,417,190 |
| | | Shares | Value |
|
| Money Market Funds - 2.7% | | | |
| Fidelity Cash Central Fund 0.11% (e) | | | |
| (Cost $21,189,402) | | 21,185,172 | 21,189,409 |
| TOTAL INVESTMENT IN SECURITIES - 106.7% | | | |
| (Cost $817,095,568) | | | 839,040,841 |
| NET OTHER ASSETS (LIABILITIES) - (6.7)% | | | (52,920,221) |
| NET ASSETS - 100% | | | $786,120,620 |
| TBA Sale Commitments | | |
| | Principal Amount | Value |
| Ginnie Mae | | |
| 2.5% 1/1/51 | $(700,000) | $(741,087) |
| Uniform Mortgage Backed Securities | | |
| 2% 1/1/51 | (4,950,000) | (5,145,657) |
| 2% 1/1/51 | (5,350,000) | (5,561,467) |
| 2% 1/1/51 | (7,200,000) | (7,484,592) |
| 2% 1/1/51 | (700,000) | (727,669) |
| 2% 1/1/51 | (2,400,000) | (2,494,864) |
|
| TOTAL UNIFORM MORTGAGE BACKED SECURITIES | | (21,414,249) |
|
| TOTAL TBA SALE COMMITMENTS | | |
| (Proceeds $22,049,760) | | $(22,155,336) |
Legend
(a) Security exempt from registration under Rule 144A of the Securities Act of 1933. These securities may be resold in transactions exempt from registration, normally to qualified institutional buyers. At the end of the period, the value of these securities amounted to $6,950,358 or 0.9% of net assets.
(b) Coupon rates for floating and adjustable rate securities reflect the rates in effect at period end.
(c) Coupon is indexed to a floating interest rate which may be multiplied by a specified factor and/or subject to caps or floors.
(d) Security or a portion of the security purchased on a delayed delivery or when-issued basis.
(e) Affiliated fund that is generally available only to investment companies and other accounts managed by Fidelity Investments. The rate quoted is the annualized seven-day yield of the fund at period end. A complete unaudited listing of the fund's holdings as of its most recent quarter end is available upon request. In addition, each Fidelity Central Fund's financial statements, which are not covered by the Fund's Report of Independent Registered Public Accounting Firm, are available on the SEC's website or upon request.
Affiliated Central Funds
Information regarding fiscal year to date income earned by the Fund from investments in Fidelity Central Funds is as follows:
| Fund | Income earned |
| Fidelity Cash Central Fund | $38,752 |
| Fidelity Securities Lending Cash Central Fund | 134 |
| Total | $38,886 |
Amounts in the income column in the above table include any capital gain distributions from underlying funds, which are presented in the corresponding line-item in the Statement of Operations, if applicable. Amount for Fidelity Securities Lending Cash Central Fund represents the income earned on investing cash collateral, less rebates paid to borrowers and any lending agent fees associated with the loan, plus any premium payments received for lending certain types of securities.
Investment Valuation
The following is a summary of the inputs used, as of December 31, 2020, involving the Fund's assets and liabilities carried at fair value. The inputs or methodology used for valuing securities may not be an indication of the risk associated with investing in those securities. For more information on valuation inputs, and their aggregation into the levels used below, please refer to the Investment Valuation section in the accompanying Notes to Financial Statements.
| | Valuation Inputs at Reporting Date: |
| Description | Total | Level 1 | Level 2 | Level 3 |
| Investments in Securities: | | | | |
| Corporate Bonds | $200,378,436 | $-- | $200,378,436 | $-- |
| U.S. Government and Government Agency Obligations | 346,624,926 | -- | 346,624,926 | -- |
| U.S. Government Agency - Mortgage Securities | 230,707,959 | -- | 230,707,959 | -- |
| Asset-Backed Securities | 161,125 | -- | 161,125 | -- |
| Commercial Mortgage Securities | 8,084,750 | -- | 8,084,750 | -- |
| Municipal Securities | 1,502,895 | -- | 1,502,895 | -- |
| Foreign Government and Government Agency Obligations | 17,997,194 | -- | 17,997,194 | -- |
| Supranational Obligations | 10,976,957 | -- | 10,976,957 | -- |
| Bank Notes | 1,417,190 | -- | 1,417,190 | -- |
| Money Market Funds | 21,189,409 | 21,189,409 | -- | -- |
| Total Investments in Securities: | $839,040,841 | $21,189,409 | $817,851,432 | $-- |
| Other Financial Instruments: | | | | |
| TBA Sale Commitments | $(22,155,336) | $-- | $(22,155,336) | $-- |
| Total Other Financial Instruments: | $(22,155,336) | $-- | $(22,155,336) | $-- |
See accompanying notes which are an integral part of the financial statements.
Financial Statements
Statement of Assets and Liabilities
| | | December 31, 2020 |
| Assets | | |
Investment in securities, at value — See accompanying schedule:
Unaffiliated issuers (cost $795,906,166) | $817,851,432 | |
| Fidelity Central Funds (cost $21,189,402) | 21,189,409 | |
| Total Investment in Securities (cost $817,095,568) | | $839,040,841 |
| Cash | | 1,083,439 |
| Receivable for TBA sale commitments | | 22,049,760 |
| Receivable for fund shares sold | | 1,445,970 |
| Interest receivable | | 3,030,737 |
| Distributions receivable from Fidelity Central Funds | | 3,770 |
| Total assets | | 866,654,517 |
| Liabilities | | |
| Payable for investments purchased | | |
| Regular delivery | $6,390,701 | |
| Delayed delivery | 51,532,453 | |
| TBA sale commitments, at value | 22,155,336 | |
| Payable for fund shares redeemed | 321,482 | |
| Accrued management fee | 57,654 | |
| Distribution and service plan fees payable | 44,243 | |
| Other affiliated payables | 32,028 | |
| Total liabilities | | 80,533,897 |
| Net Assets | | $786,120,620 |
| Net Assets consist of: | | |
| Paid in capital | | $764,122,937 |
| Total accumulated earnings (loss) | | 21,997,683 |
| Net Assets | | $786,120,620 |
| Net Asset Value and Maximum Offering Price | | |
| Initial Class: | | |
| Net Asset Value, offering price and redemption price per share ($569,594,011 ÷ 50,183,043 shares) | | $11.35 |
| Service Class: | | |
| Net Asset Value, offering price and redemption price per share ($549,723 ÷ 48,362 shares) | | $11.37 |
| Service Class 2: | | |
| Net Asset Value, offering price and redemption price per share ($215,976,886 ÷ 19,076,575 shares) | | $11.32 |
See accompanying notes which are an integral part of the financial statements.
Statement of Operations
| | | Year ended December 31, 2020 |
| Investment Income | | |
| Interest | | $7,898,987 |
| Income from Fidelity Central Funds (including $134 from security lending) | | 38,886 |
| Total income | | 7,937,873 |
| Expenses | | |
| Management fee | $401,585 | |
| Transfer agent fees | 223,103 | |
| Distribution and service plan fees | 59,122 | |
| Independent trustees' fees and expenses | 1,283 | |
| Commitment fees | 816 | |
| Total expenses before reductions | 685,909 | |
| Expense reductions | (1,103) | |
| Total expenses after reductions | | 684,806 |
| Net investment income (loss) | | 7,253,067 |
| Realized and Unrealized Gain (Loss) | | |
| Net realized gain (loss) on: | | |
| Investment securities: | | |
| Unaffiliated issuers | 1,784,196 | |
| Fidelity Central Funds | (1,513) | |
| Foreign currency transactions | 338 | |
| Total net realized gain (loss) | | 1,783,021 |
| Change in net unrealized appreciation (depreciation) on: | | |
| Investment securities: | | |
| Unaffiliated issuers | 15,752,146 | |
| Fidelity Central Funds | (7) | |
| Delayed delivery commitments | (105,576) | |
| Total change in net unrealized appreciation (depreciation) | | 15,646,563 |
| Net gain (loss) | | 17,429,584 |
| Net increase (decrease) in net assets resulting from operations | | $24,682,651 |
See accompanying notes which are an integral part of the financial statements.
Statement of Changes in Net Assets
| | Year ended December 31, 2020 | Year ended December 31, 2019 |
| Increase (Decrease) in Net Assets | | |
| Operations | | |
| Net investment income (loss) | $7,253,067 | $4,494,138 |
| Net realized gain (loss) | 1,783,021 | 814,677 |
| Change in net unrealized appreciation (depreciation) | 15,646,563 | 5,817,009 |
| Net increase (decrease) in net assets resulting from operations | 24,682,651 | 11,125,824 |
| Distributions to shareholders | (9,090,013) | (5,155,785) |
| Share transactions - net increase (decrease) | 511,007,596 | 161,511,192 |
| Total increase (decrease) in net assets | 526,600,234 | 167,481,231 |
| Net Assets | | |
| Beginning of period | 259,520,386 | 92,039,155 |
| End of period | $786,120,620 | $259,520,386 |
See accompanying notes which are an integral part of the financial statements.
Financial Highlights
VIP Bond Index Portfolio Initial Class
| Years ended December 31, | 2020 | 2019 | 2018 A |
| Selected Per–Share Data | | | |
| Net asset value, beginning of period | $10.68 | $10.06 | $10.00 |
| Income from Investment Operations | | | |
| Net investment income (loss)B | .183 | .283 | .212 |
| Net realized and unrealized gain (loss) | .621 | .560 | (.022) |
| Total from investment operations | .804 | .843 | .190 |
| Distributions from net investment income | (.104) | (.191) | (.130) |
| Distributions from net realized gain | (.030) | (.032) | – |
| Total distributions | (.134) | (.223) | (.130) |
| Net asset value, end of period | $11.35 | $10.68 | $10.06 |
| Total ReturnC,D,E | 7.53% | 8.38% | 1.90% |
| Ratios to Average Net AssetsF,G | | | |
| Expenses before reductions | .14% | .14% | .14%H |
| Expenses net of fee waivers, if any | .14% | .14% | .14%H |
| Expenses net of all reductions | .14% | .14% | .13%H |
| Net investment income (loss) | 1.63% | 2.67% | 3.01%H |
| Supplemental Data | | | |
| Net assets, end of period (000 omitted) | $569,594 | $258,250 | $91,033 |
| Portfolio turnover rateI | 101% | 81% | 168%H |
A For the period April 19, 2018 (commencement of operations) to December 31, 2018.
B Calculated based on average shares outstanding during the period.
C Total returns for periods of less than one year are not annualized.
D Total returns do not reflect charges attributable to your insurance company's separate account. Inclusion of these charges would reduce the total returns shown.
E Total returns would have been lower if certain expenses had not been reduced during the applicable periods shown.
F Fees and expenses of any underlying mutual funds or exchange-traded funds (ETFs) are not included in the Fund's expense ratio. The Fund indirectly bears its proportionate share of these expenses. For additional expense information related to investments in Fidelity Central Funds, please refer to the "Investments in Fidelity Central Funds" note found in the Notes to Financial Statements section of the most recent Annual or Semi-Annual report.
G Expense ratios reflect operating expenses of the class. Expenses before reductions do not reflect amounts reimbursed, waived, or reduced through arrangements with the investment adviser, brokerage services, or other offset arrangements, if applicable, and do not represent the amount paid by the class during periods when reimbursements, waivers or reductions occur.
H Annualized
I Amount does not include the portfolio activity of any underlying mutual funds or exchange-traded funds (ETFs).
See accompanying notes which are an integral part of the financial statements.
VIP Bond Index Portfolio Service Class
| Years ended December 31, | 2020 | 2019 A |
| Selected Per–Share Data | | |
| Net asset value, beginning of period | $10.67 | $10.33 |
| Income from Investment Operations | | |
| Net investment income (loss)B | .171 | .197 |
| Net realized and unrealized gain (loss) | .632 | .359 |
| Total from investment operations | .803 | .556 |
| Distributions from net investment income | (.073) | (.184) |
| Distributions from net realized gain | (.030) | (.032) |
| Total distributions | (.103) | (.216) |
| Net asset value, end of period | $11.37 | $10.67 |
| Total ReturnC,D,E | 7.53% | 5.38% |
| Ratios to Average Net AssetsF,G | | |
| Expenses before reductions | .24% | .24%H |
| Expenses net of fee waivers, if any | .24% | .24%H |
| Expenses net of all reductions | .24% | .24%H |
| Net investment income (loss) | 1.53% | 2.53%H |
| Supplemental Data | | |
| Net assets, end of period (000 omitted) | $550 | $103 |
| Portfolio turnover rateI | 101% | 81% |
A For the period April 11, 2019 (commencement of sale of shares) to December 31, 2019.
B Calculated based on average shares outstanding during the period.
C Total returns for periods of less than one year are not annualized.
D Total returns do not reflect charges attributable to your insurance company's separate account. Inclusion of these charges would reduce the total returns shown.
E Total returns would have been lower if certain expenses had not been reduced during the applicable periods shown.
F Fees and expenses of any underlying mutual funds or exchange-traded funds (ETFs) are not included in the Fund's expense ratio. The Fund indirectly bears its proportionate share of these expenses. For additional expense information related to investments in Fidelity Central Funds, please refer to the "Investments in Fidelity Central Funds" note found in the Notes to Financial Statements section of the most recent Annual or Semi-Annual report.
G Expense ratios reflect operating expenses of the class. Expenses before reductions do not reflect amounts reimbursed, waived, or reduced through arrangements with the investment adviser, brokerage services, or other offset arrangements, if applicable, and do not represent the amount paid by the class during periods when reimbursements, waivers or reductions occur.
H Annualized
I Amount does not include the portfolio activity of any underlying mutual funds or exchange-traded funds (ETFs).
See accompanying notes which are an integral part of the financial statements.
VIP Bond Index Portfolio Service Class 2
| Years ended December 31, | 2020 | 2019 | 2018 A |
| Selected Per–Share Data | | | |
| Net asset value, beginning of period | $10.68 | $10.06 | $10.00 |
| Income from Investment Operations | | | |
| Net investment income (loss)B | .161 | .262 | .195 |
| Net realized and unrealized gain (loss) | .614 | .556 | (.023) |
| Total from investment operations | .775 | .818 | .172 |
| Distributions from net investment income | (.105) | (.166) | (.112) |
| Distributions from net realized gain | (.030) | (.032) | – |
| Total distributions | (.135) | (.198) | (.112) |
| Net asset value, end of period | $11.32 | $10.68 | $10.06 |
| Total ReturnC,D,E | 7.26% | 8.13% | 1.72% |
| Ratios to Average Net AssetsF,G | | | |
| Expenses before reductions | .37% | .39% | .39%H |
| Expenses net of fee waivers, if any | .37% | .39% | .39%H |
| Expenses net of all reductions | .37% | .39% | .38%H |
| Net investment income (loss) | 1.40% | 2.48% | 2.76%H |
| Supplemental Data | | | |
| Net assets, end of period (000 omitted) | $215,977 | $1,167 | $1,006 |
| Portfolio turnover rateI | 101% | 81% | 168%H |
A For the period April 19, 2018 (commencement of operations) to December 31, 2018.
B Calculated based on average shares outstanding during the period.
C Total returns for periods of less than one year are not annualized.
D Total returns do not reflect charges attributable to your insurance company's separate account. Inclusion of these charges would reduce the total returns shown.
E Total returns would have been lower if certain expenses had not been reduced during the applicable periods shown.
F Fees and expenses of any underlying mutual funds or exchange-traded funds (ETFs) are not included in the Fund's expense ratio. The Fund indirectly bears its proportionate share of these expenses. For additional expense information related to investments in Fidelity Central Funds, please refer to the "Investments in Fidelity Central Funds" note found in the Notes to Financial Statements section of the most recent Annual or Semi-Annual report.
G Expense ratios reflect operating expenses of the class. Expenses before reductions do not reflect amounts reimbursed, waived, or reduced through arrangements with the investment adviser, brokerage services, or other offset arrangements, if applicable, and do not represent the amount paid by the class during periods when reimbursements, waivers or reductions occur.
H Annualized
I Amount does not include the portfolio activity of any underlying mutual funds or exchange-traded funds (ETFs).
See accompanying notes which are an integral part of the financial statements.
Notes to Financial Statements
For the period ended December 31, 2020
1. Organization.
VIP Bond Index Portfolio (the Fund) is a fund of Variable Insurance Products Fund V (the Trust) and is authorized to issue an unlimited number of shares. The Trust is registered under the Investment Company Act of 1940, as amended (the 1940 Act), as an open-end management investment company organized as a Massachusetts business trust. Shares of the Fund may only be purchased by insurance companies for the purpose of funding variable annuity or variable life insurance contracts. The Fund offers the following classes of shares: Initial Class shares, Service Class shares and Service Class 2 shares. All classes have equal rights and voting privileges, except for matters affecting a single class.
Effective January 1, 2020:
Investment advisers Fidelity Investments Money Management, Inc., FMR Co., Inc., and Fidelity SelectCo, LLC, merged with and into Fidelity Management & Research Company. In connection with the merger transactions, the resulting, merged investment adviser was then redomiciled from Massachusetts to Delaware, changed its corporate structure from a corporation to a limited liability company, and changed its name to "Fidelity Management & Research Company LLC".
Broker-dealer Fidelity Distributors Corporation merged with and into Fidelity Investments Institutional Services Company, Inc. ("FIISC"). FIISC was then redomiciled from Massachusetts to Delaware, changed its corporate structure from a corporation to a limited liability company, and changed its name to "Fidelity Distributors Company LLC".
Fidelity Investments Institutional Operations Company, Inc. converted from a Massachusetts corporation to a Massachusetts LLC, and changed its name to "Fidelity Investments Institutional Operations Company LLC".
2. Investments in Fidelity Central Funds.
The Fund invests in Fidelity Central Funds, which are open-end investment companies generally available only to other investment companies and accounts managed by the investment adviser and its affiliates. The Fund's Schedule of Investments lists each of the Fidelity Central Funds held as of period end, if any, as an investment of the Fund, but does not include the underlying holdings of each Fidelity Central Fund. As an Investing Fund, the Fund indirectly bears its proportionate share of the expenses of the underlying Fidelity Central Funds.
The Money Market Central Funds seek preservation of capital and current income and are managed by the investment adviser. Annualized expenses of the Money Market Central Funds as of their most recent shareholder report date ranged from less than .005% to .01%.
A complete unaudited list of holdings for each Fidelity Central Fund is available upon request or at the Securities and Exchange Commission (the SEC) website at www.sec.gov. In addition, the financial statements of the Fidelity Central Funds, which are not covered by the Fund's Report of Independent Registered Public Accounting Firm, are available on the SEC website or upon request.
3. Significant Accounting Policies.
The Fund is an investment company and applies the accounting and reporting guidance of the Financial Accounting Standards Board (FASB) Accounting Standards Codification Topic 946 Financial Services - Investment Companies. The financial statements have been prepared in conformity with accounting principles generally accepted in the United States of America (GAAP), which require management to make certain estimates and assumptions at the date of the financial statements. Actual results could differ from those estimates. Subsequent events, if any, through the date that the financial statements were issued have been evaluated in the preparation of the financial statements. The following summarizes the significant accounting policies of the Fund:
Investment Valuation. Investments are valued as of 4:00 p.m. Eastern time on the last calendar day of the period. The Board of Trustees (the Board) has delegated the day to day responsibility for the valuation of the Fund's investments to the Fair Value Committee (the Committee) established by the Fund's investment adviser. In accordance with valuation policies and procedures approved by the Board, the Fund attempts to obtain prices from one or more third party pricing vendors or brokers to value its investments. When current market prices, quotations or currency exchange rates are not readily available or reliable, investments will be fair valued in good faith by the Committee, in accordance with procedures adopted by the Board. Factors used in determining fair value vary by investment type and may include market or investment specific events, changes in interest rates and credit quality. The frequency with which these procedures are used cannot be predicted and they may be utilized to a significant extent. The Committee oversees the Fund's valuation policies and procedures and reports to the Board on the Committee's activities and fair value determinations. The Board monitors the appropriateness of the procedures used in valuing the Fund's investments and ratifies the fair value determinations of the Committee.
The Fund categorizes the inputs to valuation techniques used to value its investments into a disclosure hierarchy consisting of three levels as shown below:
- Level 1 – quoted prices in active markets for identical investments
- Level 2 – other significant observable inputs (including quoted prices for similar investments, interest rates, prepayment speeds, etc.)
- Level 3 – unobservable inputs (including the Fund's own assumptions based on the best information available)
Valuation techniques used to value the Fund's investments by major category are as follows:
Debt securities, including restricted securities, are valued based on evaluated prices received from third party pricing vendors or from brokers who make markets in such securities. Corporate bonds, bank notes, foreign government and government agency obligations, municipal securities, supranational obligations and U.S. government and government agency obligations are valued by pricing vendors who utilize matrix pricing which considers yield or price of bonds of comparable quality, coupon, maturity and type or by broker-supplied prices. Asset backed securities, commercial mortgage securities and U.S. government agency mortgage securities are valued by pricing vendors who utilize matrix pricing which considers prepayment speed assumptions, attributes of the collateral, yield or price of bonds of comparable quality, coupon, maturity and type or by broker-supplied prices. When independent prices are unavailable or unreliable, debt securities may be valued utilizing pricing methodologies which consider similar factors that would be used by third party pricing vendors. For foreign debt securities, when significant market or security specific events arise, valuations may be determined in good faith in accordance with procedures adopted by the Board. Debt securities are generally categorized as Level 2 in the hierarchy but may be Level 3 depending on the circumstances.
Investments in open-end mutual funds, including the Fidelity Central Funds, are valued at their closing net asset value (NAV) each business day and are categorized as Level 1 in the hierarchy.
Changes in valuation techniques may result in transfers in or out of an assigned level within the disclosure hierarchy. The aggregate value of investments by input level as of December 31, 2020 is included at the end of the Fund's Schedule of Investments.
Foreign Currency. Certain Funds may use foreign currency contracts to facilitate transactions in foreign-denominated securities. Gains and losses from these transactions may arise from changes in the value of the foreign currency or if the counterparties do not perform under the contracts' terms.
Foreign-denominated assets, including investment securities, and liabilities are translated into U.S. dollars at the exchange rates at period end. Purchases and sales of investment securities, income and dividends received, and expenses denominated in foreign currencies are translated into U.S. dollars at the exchange rate in effect on the transaction date.
The effects of exchange rate fluctuations on investments are included with the net realized and unrealized gain (loss) on investment securities. Other foreign currency transactions resulting in realized and unrealized gain (loss) are disclosed separately.
Investment Transactions and Income. For financial reporting purposes, the Fund's investment holdings and NAV include trades executed through the end of the last business day of the period. The NAV per share for processing shareholder transactions is calculated as of the close of business of the New York Stock Exchange (NYSE), normally 4:00 p.m. Eastern time and includes trades executed through the end of the prior business day. Gains and losses on securities sold are determined on the basis of identified cost. Income and capital gain distributions from Fidelity Central Funds, if any, are recorded on the ex-dividend date. Interest income is accrued as earned and includes coupon interest and amortization of premium and accretion of discount on debt securities as applicable. Investment income is recorded net of foreign taxes withheld where recovery of such taxes is uncertain. Debt obligations may be placed on non-accrual status and related interest income may be reduced by ceasing current accruals and writing off interest receivables when the collection of all or a portion of interest has become doubtful based on consistently applied procedures. A debt obligation is removed from non-accrual status when the issuer resumes interest payments or when collectability of interest is reasonably assured.
Class Allocations and Expenses. Investment income, realized and unrealized capital gains and losses, common expenses of the Fund, and certain fund-level expense reductions, if any, are allocated daily on a pro-rata basis to each class based on the relative net assets of each class to the total net assets of the Fund. Each class differs with respect to transfer agent and distribution and service plan fees incurred. Certain expense reductions may also differ by class. For the reporting period, the allocated portion of income and expenses to each class as a percent of its average net assets may vary due to the timing of recording these transactions in relation to fluctuating net assets of the classes. Expenses directly attributable to a fund are charged to that fund. Expenses attributable to more than one fund are allocated among the respective funds on the basis of relative net assets or other appropriate methods. Expense estimates are accrued in the period to which they relate and adjustments are made when actual amounts are known.
Income Tax Information and Distributions to Shareholders. Each year, the Fund intends to qualify as a regulated investment company under Subchapter M of the Internal Revenue Code, including distributing substantially all of its taxable income and realized gains. As a result, no provision for U.S. Federal income taxes is required. As of December 31, 2020, the Fund did not have any unrecognized tax benefits in the financial statements; nor is the Fund aware of any tax positions for which it is reasonably possible that the total amounts of unrecognized tax benefits will significantly change in the next twelve months. The Fund files a U.S. federal tax return, in addition to state and local tax returns as required. The Fund's federal income tax returns are subject to examination by the Internal Revenue Service (IRS) for a period of three fiscal years after they are filed. State and local tax returns may be subject to examination for an additional fiscal year depending on the jurisdiction. Foreign taxes are provided for based on the Fund's understanding of the tax rules and rates that exist in the foreign markets in which it invests.
Distributions are declared and recorded on the ex-dividend date. Income and capital gain distributions are declared separately for each class. Income and capital gain distributions are determined in accordance with income tax regulations, which may differ from GAAP.
Capital accounts within the financial statements are adjusted for permanent book-tax differences. These adjustments have no impact on net assets or the results of operations. Capital accounts are not adjusted for temporary book-tax differences which will reverse in a subsequent period.
Book-tax differences are primarily due to foreign currency transactions, market discount and losses deferred due to wash sales.
As of period end, the cost and unrealized appreciation (depreciation) in securities, and derivatives if applicable, for federal income tax purposes were as follows:
| Gross unrealized appreciation | $24,131,930 |
| Gross unrealized depreciation | (2,134,248) |
| Net unrealized appreciation (depreciation) | $21,997,682 |
| Tax Cost | $816,937,583 |
The tax-based components of distributable earnings as of period end were as follows:
| Net unrealized appreciation (depreciation) on securities and other investments | $21,997,682 |
The tax character of distributions paid was as follows:
| | December 31, 2020 | December 31, 2019 |
| Ordinary Income | $8,413,022 | $ 4,970,724 |
| Long-term Capital Gains | 676,991 | 185,061 |
| Total | $9,090,013 | $ 5,155,785 |
Delayed Delivery Transactions and When-Issued Securities. During the period, certain Funds transacted in securities on a delayed delivery or when-issued basis. Payment and delivery may take place after the customary settlement period for that security. The price of the underlying securities and the date when the securities will be delivered and paid for are fixed at the time the transaction is negotiated. Securities purchased on a delayed delivery or when-issued basis are identified as such in the Schedule of Investments. Compensation for interest forgone in the purchase of a delayed delivery or when-issued debt security may be received. With respect to purchase commitments, each applicable Fund identifies securities as segregated in its records with a value at least equal to the amount of the commitment. Payables and receivables associated with the purchases and sales of delayed delivery securities having the same coupon, settlement date and broker are offset. Delayed delivery or when-issued securities that have been purchased from and sold to different brokers are reflected as both payables and receivables in the Statement of Assets and Liabilities under the caption "Delayed delivery", as applicable. Losses may arise due to changes in the value of the underlying securities or if the counterparty does not perform under the contract's terms, or if the issuer does not issue the securities due to political, economic, or other factors.
To-Be-Announced (TBA) Securities and Mortgage Dollar Rolls. During the period, the Fund transacted in TBA securities that involved buying or selling mortgage-backed securities (MBS) on a forward commitment basis. A TBA transaction typically does not designate the actual security to be delivered and only includes an approximate principal amount; however delivered securities must meet specified terms defined by industry guidelines, including issuer, rate and current principal amount outstanding on underlying mortgage pools. The Fund may enter into a TBA transaction with the intent to take possession of or deliver the underlying MBS, or the Fund may elect to extend the settlement by entering into either a mortgage or reverse mortgage dollar roll. Mortgage dollar rolls are transactions where a fund sells TBA securities and simultaneously agrees to repurchase MBS on a later date at a lower price and with the same counterparty. Reverse mortgage dollar rolls involve the purchase and simultaneous agreement to sell TBA securities on a later date at a lower price. Transactions in mortgage dollar rolls and reverse mortgage dollar rolls are accounted for as purchases and sales and may result in an increase to the Fund's portfolio turnover rate.
Purchases and sales of TBA securities involve risks similar to those discussed above for delayed delivery and when-issued securities. Also, if the counterparty in a mortgage dollar roll or a reverse mortgage dollar roll transaction files for bankruptcy or becomes insolvent, the Fund's right to repurchase or sell securities may be limited. Additionally, when a fund sells TBA securities without already owning or having the right to obtain the deliverable securities (an uncovered forward commitment to sell), it incurs a risk of loss because it could have to purchase the securities at a price that is higher than the price at which it sold them. A fund may be unable to purchase the deliverable securities if the corresponding market is illiquid.
TBA securities subject to a forward commitment to sell at period end are included at the end of the Fund's Schedule of Investments under the caption "TBA Sale Commitments." The proceeds and value of these commitments are reflected in the Fund's Statement of Assets and Liabilities as Receivable for TBA sale commitments and TBA sale commitments, at value, respectively.
Restricted Securities (including Private Placements). The Fund may invest in securities that are subject to legal or contractual restrictions on resale. These securities generally may be resold in transactions exempt from registration or to the public if the securities are registered. Disposal of these securities may involve time-consuming negotiations and expense, and prompt sale at an acceptable price may be difficult. Information regarding restricted securities is included at the end of the Fund's Schedule of Investments.
4. Purchases and Sales of Investments.
Purchases and sales of securities, other than short-term securities and U.S. government securities, are noted in the table below.
| | Purchases ($) | Sales ($) |
| VIP Bond Index Portfolio | 400,990,967 | 224,378,912 |
5. Fees and Other Transactions with Affiliates.
Management Fee and Expense Contract. Fidelity Management & Research Company LLC (the investment adviser) and its affiliates provide the Fund with investment management related services for which the Fund pays a monthly management fee. The management fee is based on an annual rate of .09% of the Fund's average net assets. Under the management contract, the investment adviser pays all other fund-level expenses, except the compensation of the independent Trustees and certain miscellaneous expenses such as proxy and shareholder meeting expenses.
In addition, under the expense contract, the investment adviser pays class-level expenses as necessary so that the total expenses do not exceed certain amounts of each class' average net assets on an annual basis with certain exceptions, as noted in the following table:
| Initial Class | .14% |
| Service Class | .24% |
| Service Class 2 | .39% |
Distribution and Service Plan Fees. In accordance with Rule 12b-1 of the 1940 Act, the Fund has adopted separate 12b-1 Plans for each Service Class of shares. Each Service Class pays Fidelity Distributors Company LLC (FDC), an affiliate of the investment adviser, a service fee. For the period, the service fee is based on an annual rate of .10% of Service Class' average net assets and .25% of Service Class 2's average net assets.
For the period, total fees, all of which were re-allowed to insurance companies for the distribution of shares and providing shareholder support services, were as follows:
| Service Class | $239 |
| Service Class 2 | 58,883 |
| | $59,122 |
Transfer Agent Fees. Fidelity Investments Institutional Operations Company LLC (FIIOC), an affiliate of the investment adviser, is the transfer, dividend disbursing, and shareholder servicing agent for each class. FIIOC receives asset-based fees based on each class's average net assets for transfer agent services, typesetting, and printing and mailing of shareholder reports, excluding mailing of proxy statements. Effective February 1, 2020, the Board approved to change the fee from .065% to .064%. Under the expense contract, each class pays a portion of the transfer agent fees equal to an annual rate of .05% of class-level average net assets. For the period, transfer agent fees for each class were as follows:
| Initial Class | $ 211,206 |
| Service Class | 120 |
| Service Class 2 | 11,777 |
| | $223,103 |
Interfund Trades. Funds may purchase from or sell securities to other Fidelity Funds under procedures adopted by the Board. The procedures have been designed to ensure these interfund trades are executed in accordance with Rule 17a-7 of the 1940 Act. Interfund trades are included within the respective purchases and sales amounts shown in the Purchases and Sales of Investments note.
6. Committed Line of Credit.
Certain Funds participate with other funds managed by the investment adviser or an affiliate in a $4.25 billion credit facility (the "line of credit") to be utilized for temporary or emergency purposes to fund shareholder redemptions or for other short-term liquidity purposes. The participating funds have agreed to pay commitment fees on their pro-rata portion of the line of credit, which are reflected in Commitment fees on the Statement of Operations, and are as follows:
| | Amount |
| VIP Bond Index Portfolio | $816 |
During the period, there were no borrowings on this line of credit.
7. Security Lending.
Funds lend portfolio securities from time to time in order to earn additional income. Lending agents are used, including National Financial Services (NFS), an affiliate of the investment adviser. Pursuant to a securities lending agreement, NFS will receive a fee, which is capped at 9.9% of a fund's daily lending revenue, for its services as lending agent. A fund may lend securities to certain qualified borrowers, including NFS. On the settlement date of the loan, a fund receives collateral (in the form of U.S. Treasury obligations, letters of credit and/or cash) against the loaned securities and maintains collateral in an amount not less than 100% of the market value of the loaned securities during the period of the loan. The market value of the loaned securities is determined at the close of business of a fund and any additional required collateral is delivered to a fund on the next business day. A fund or borrower may terminate the loan at any time, and if the borrower defaults on its obligation to return the securities loaned because of insolvency or other reasons, a fund may apply collateral received from the borrower against the obligation. A fund may experience delays and costs in recovering the securities loaned. Any cash collateral received is invested in the Fidelity Securities Lending Cash Central Fund. Any loaned securities are identified as such in the Schedule of Investments, and the value of loaned securities and cash collateral at period end, as applicable, are presented in the Statement of Assets and Liabilities. Security lending income represents the income earned on investing cash collateral, less rebates paid to borrowers and any lending agent fees associated with the loan, plus any premium payments received for lending certain types of securities. Security lending income is presented in the Statement of Operations as a component of income from Fidelity Central Funds. Affiliated security lending activity, if any, was as follows:
| | Total Security Lending Income Fees Paid to NFS | Security Lending Income From Securities Loaned to NFS | Value of Securities Loaned to NFS at Period End |
| VIP Bond Index Portfolio | $12 | $– | $– |
8. Expense Reductions.
Through arrangements with the Fund's custodian, credits realized as a result of certain uninvested cash balances were used to reduce the Fund's expenses. During the period, custodian credits reduced the Fund's expenses by $1,103.
9. Distributions to Shareholders.
Distributions to shareholders of each class were as follows:
| | Year ended
December 31, 2020 | Year ended
December 31, 2019(a) |
| Distributions to shareholders | | |
| Initial Class | $6,573,144 | $5,132,074 |
| Service Class | 1,005 | 2,091 |
| Service Class 2 | 2,515,864 | 21,620 |
| Total | $9,090,013 | $5,155,785 |
(a) Distributions for Service class are for the period April 11, 2019 (commencement of sale of shares) to December 31, 2019.
10. Share Transactions.
Transactions for each class of shares were as follows:
| | Shares | Shares | Dollars | Dollars |
| | Year ended December 31, 2020 | Year ended December 31, 2019(a) | Year ended December 31, 2020 | Year ended December 31, 2019(a) |
| Initial Class | | | | |
| Shares sold | 34,881,109 | 15,672,615 | $393,788,272 | $166,843,088 |
| Reinvestment of distributions | 581,180 | 430,419 | 6,573,144 | 4,596,875 |
| Shares redeemed | (9,465,623) | (965,345) | (106,870,020) | (10,130,462) |
| Net increase (decrease) | 25,996,666 | 15,137,689 | $293,491,396 | $161,309,501 |
| Service Class | | | | |
| Shares sold | 92,115 | 9,681 | $1,044,604 | $100,000 |
| Reinvestment of distributions | 1 | – | 7 | – |
| Shares redeemed | (53,435) | – | (609,812) | – |
| Net increase (decrease) | 38,681 | 9,681 | $434,799 | $100,000 |
| Service Class 2 | | | | |
| Shares sold | 19,105,085 | 9,211 | $218,681,407 | $100,313 |
| Reinvestment of distributions | 222,929 | 170 | 2,514,638 | 1,821 |
| Shares redeemed | (360,779) | (41) | (4,114,644) | (443) |
| Net increase (decrease) | 18,967,235 | 9,340 | $217,081,401 | $101,691 |
(a) Share transactions for Service Class are for the period April 11, 2019 (commencement of sale of shares) to December 31, 2019.
11. Other.
The Fund's organizational documents provide former and current trustees and officers with a limited indemnification against liabilities arising in connection with the performance of their duties to the Fund. In the normal course of business, the Fund may also enter into contracts that provide general indemnifications. The Fund's maximum exposure under these arrangements is unknown as this would be dependent on future claims that may be made against the Fund. The risk of material loss from such claims is considered remote.
At the end of the period, the investment adviser or its affiliates were the owners of record of approximately 61% of the total outstanding shares of the Fund and one otherwise unaffiliated shareholder was the owner of record of 29% of the total outstanding shares of the Fund.
12. Coronavirus (COVID-19) Pandemic.
An outbreak of COVID-19 first detected in China during December 2019 has since spread globally and was declared a pandemic by the World Health Organization during March 2020. Developments that disrupt global economies and financial markets, such as the COVID-19 pandemic, may magnify factors that affect the Fund's performance.
Report of Independent Registered Public Accounting Firm
To the Board of Trustees of Variable Insurance Products Fund V and Shareholders of VIP Bond Index Portfolio:
Opinion on the Financial Statements and Financial Highlights
We have audited the accompanying statement of assets and liabilities of VIP Bond Index Portfolio (the "Fund"), a fund of Variable Insurance Products Fund V, including the schedule of investments, as of December 31, 2020, the related statement of operations for the year then ended, the statement of changes in net assets for each of the two years in the period then ended, the financial highlights for each of the two years in the period then ended and for the period from April 19, 2018 (commencement of operations) through December 31, 2018, and the related notes. In our opinion, the financial statements and financial highlights present fairly, in all material respects, the financial position of the Fund as of December 31, 2020, and the results of its operations for the year then ended, the changes in its net assets for each of the two years in the period then ended, and the financial highlights for each of the two years in the period then ended and for the period from April 19, 2018 (commencement of operations) through December 31, 2018 in conformity with accounting principles generally accepted in the United States of America.
Basis for Opinion
These financial statements and financial highlights are the responsibility of the Fund's management. Our responsibility is to express an opinion on the Fund's financial statements and financial highlights based on our audits. We are a public accounting firm registered with the Public Company Accounting Oversight Board (United States) (PCAOB) and are required to be independent with respect to the Fund in accordance with the U.S. federal securities laws and the applicable rules and regulations of the Securities and Exchange Commission and the PCAOB.
We conducted our audits in accordance with the standards of the PCAOB. Those standards require that we plan and perform the audit to obtain reasonable assurance about whether the financial statements and financial highlights are free of material misstatement, whether due to error or fraud. The Fund is not required to have, nor were we engaged to perform, an audit of its internal control over financial reporting. As part of our audits we are required to obtain an understanding of internal control over financial reporting but not for the purpose of expressing an opinion on the effectiveness of the Fund’s internal control over financial reporting. Accordingly, we express no such opinion.
Our audits included performing procedures to assess the risks of material misstatement of the financial statements and financial highlights, whether due to error or fraud, and performing procedures that respond to those risks. Such procedures included examining, on a test basis, evidence regarding the amounts and disclosures in the financial statements and financial highlights. Our audits also included evaluating the accounting principles used and significant estimates made by management, as well as evaluating the overall presentation of the financial statements and financial highlights. Our procedures included confirmation of securities owned as of December 31, 2020, by correspondence with the custodian and brokers; when replies were not received from brokers, we performed other auditing procedures. We believe that our audits provide a reasonable basis for our opinion.
/s/ Deloitte & Touche LLP
Boston, Massachusetts
February 10, 2021
We have served as the auditor of one or more of the Fidelity investment companies since 1999.
Trustees and Officers
The Trustees, Members of the Advisory Board (if any), and officers of the trust and fund, as applicable, are listed below. The Board of Trustees governs the fund and is responsible for protecting the interests of shareholders. The Trustees are experienced executives who meet periodically throughout the year to oversee the fund's activities, review contractual arrangements with companies that provide services to the fund, oversee management of the risks associated with such activities and contractual arrangements, and review the fund's performance. Each of the Trustees oversees 280 funds.
The Trustees hold office without limit in time except that (a) any Trustee may resign; (b) any Trustee may be removed by written instrument, signed by at least two-thirds of the number of Trustees prior to such removal; (c) any Trustee who requests to be retired or who has become incapacitated by illness or injury may be retired by written instrument signed by a majority of the other Trustees; and (d) any Trustee may be removed at any special meeting of shareholders by a two-thirds vote of the outstanding voting securities of the trust. Each Trustee who is not an interested person (as defined in the 1940 Act) of the trust and the fund is referred to herein as an Independent Trustee. Each Independent Trustee shall retire not later than the last day of the calendar year in which his or her 75th birthday occurs. The Independent Trustees may waive this mandatory retirement age policy with respect to individual Trustees. Officers and Advisory Board Members hold office without limit in time, except that any officer or Advisory Board Member may resign or may be removed by a vote of a majority of the Trustees at any regular meeting or any special meeting of the Trustees. Except as indicated, each individual has held the office shown or other offices in the same company for the past five years.
The fund’s Statement of Additional Information (SAI) includes more information about the Trustees. To request a free copy, call Fidelity at 1-877-208-0098.
Experience, Skills, Attributes, and Qualifications of the Trustees. The Governance and Nominating Committee has adopted a statement of policy that describes the experience, qualifications, attributes, and skills that are necessary and desirable for potential Independent Trustee candidates (Statement of Policy). The Board believes that each Trustee satisfied at the time he or she was initially elected or appointed a Trustee, and continues to satisfy, the standards contemplated by the Statement of Policy. The Governance and Nominating Committee also engages professional search firms to help identify potential Independent Trustee candidates who have the experience, qualifications, attributes, and skills consistent with the Statement of Policy. From time to time, additional criteria based on the composition and skills of the current Independent Trustees, as well as experience or skills that may be appropriate in light of future changes to board composition, business conditions, and regulatory or other developments, have also been considered by the professional search firms and the Governance and Nominating Committee. In addition, the Board takes into account the Trustees' commitment and participation in Board and committee meetings, as well as their leadership of standing and ad hoc committees throughout their tenure.
In determining that a particular Trustee was and continues to be qualified to serve as a Trustee, the Board has considered a variety of criteria, none of which, in isolation, was controlling. The Board believes that, collectively, the Trustees have balanced and diverse experience, qualifications, attributes, and skills, which allow the Board to operate effectively in governing the fund and protecting the interests of shareholders. Information about the specific experience, skills, attributes, and qualifications of each Trustee, which in each case led to the Board's conclusion that the Trustee should serve (or continue to serve) as a trustee of the fund, is provided below.
Board Structure and Oversight Function. Abigail P. Johnson is an interested person and currently serves as Chairman. The Trustees have determined that an interested Chairman is appropriate and benefits shareholders because an interested Chairman has a personal and professional stake in the quality and continuity of services provided to the fund. Independent Trustees exercise their informed business judgment to appoint an individual of their choosing to serve as Chairman, regardless of whether the Trustee happens to be independent or a member of management. The Independent Trustees have determined that they can act independently and effectively without having an Independent Trustee serve as Chairman and that a key structural component for assuring that they are in a position to do so is for the Independent Trustees to constitute a substantial majority for the Board. The Independent Trustees also regularly meet in executive session. Arthur E. Johnson serves as Chairman of the Independent Trustees and as such (i) acts as a liaison between the Independent Trustees and management with respect to matters important to the Independent Trustees and (ii) with management prepares agendas for Board meetings.
Fidelity® funds are overseen by different Boards of Trustees. The fund's Board oversees Fidelity's investment-grade bond, money market, asset allocation and certain equity funds, and other Boards oversee Fidelity's high income and other equity funds. The asset allocation funds may invest in Fidelity® funds that are overseen by such other Boards. The use of separate Boards, each with its own committee structure, allows the Trustees of each group of Fidelity® funds to focus on the unique issues of the funds they oversee, including common research, investment, and operational issues. On occasion, the separate Boards establish joint committees to address issues of overlapping consequences for the Fidelity® funds overseen by each Board.
The Trustees operate using a system of committees to facilitate the timely and efficient consideration of all matters of importance to the Trustees, the fund, and fund shareholders and to facilitate compliance with legal and regulatory requirements and oversight of the fund's activities and associated risks. The Board, acting through its committees, has charged FMR and its affiliates with (i) identifying events or circumstances the occurrence of which could have demonstrably adverse effects on the fund's business and/or reputation; (ii) implementing processes and controls to lessen the possibility that such events or circumstances occur or to mitigate the effects of such events or circumstances if they do occur; and (iii) creating and maintaining a system designed to evaluate continuously business and market conditions in order to facilitate the identification and implementation processes described in (i) and (ii) above. Because the day-to-day operations and activities of the fund are carried out by or through FMR, its affiliates, and other service providers, the fund's exposure to risks is mitigated but not eliminated by the processes overseen by the Trustees. While each of the Board's committees has responsibility for overseeing different aspects of the fund's activities, oversight is exercised primarily through the Operations and Audit Committees. In addition, an ad hoc Board committee of Independent Trustees has worked with FMR to enhance the Board's oversight of investment and financial risks, legal and regulatory risks, technology risks, and operational risks, including the development of additional risk reporting to the Board. Appropriate personnel, including but not limited to the fund's Chief Compliance Officer (CCO), FMR's internal auditor, the independent accountants, the fund's Treasurer and portfolio management personnel, make periodic reports to the Board's committees, as appropriate, including an annual review of Fidelity's risk management program for the Fidelity® funds. The responsibilities of each standing committee, including their oversight responsibilities, are described further under "Standing Committees of the Trustees."
Interested Trustees*:
Correspondence intended for a Trustee who is an interested person may be sent to Fidelity Investments, 245 Summer Street, Boston, Massachusetts 02210.
Name, Year of Birth; Principal Occupations and Other Relevant Experience+
Abigail P. Johnson (1961)
Year of Election or Appointment: 2009
Trustee
Chairman of the Board of Trustees
Ms. Johnson also serves as Trustee of other Fidelity® funds. Ms. Johnson serves as Chairman (2016-present), Chief Executive Officer (2014-present), and Director (2007-present) of FMR LLC (diversified financial services company), President of Fidelity Financial Services (2012-present) and President of Personal, Workplace and Institutional Services (2005-present). Ms. Johnson is Chairman and Director of Fidelity Management & Research Company LLC (investment adviser firm, 2011-present). Previously, Ms. Johnson served as Chairman and Director of FMR Co., Inc. (investment adviser firm, 2011-2019), Vice Chairman (2007-2016) and President (2013-2016) of FMR LLC, President and a Director of Fidelity Management & Research Company (2001-2005), a Trustee of other investment companies advised by Fidelity Management & Research Company, Fidelity Investments Money Management, Inc. (investment adviser firm), and FMR Co., Inc. (2001-2005), Senior Vice President of the Fidelity® funds (2001-2005), and managed a number of Fidelity® funds. Ms. Abigail P. Johnson and Mr. Arthur E. Johnson are not related.
Jennifer Toolin McAuliffe (1959)
Year of Election or Appointment: 2016
Trustee
Ms. McAuliffe also serves as Trustee of other Fidelity® funds. Previously, Ms. McAuliffe served as Co-Head of Fixed Income of Fidelity Investments Limited (now known as FIL Limited (FIL)) (diversified financial services company), Director of Research for FIL’s credit and quantitative teams in London, Hong Kong and Tokyo and Director of Research for taxable and municipal bonds at Fidelity Investments Money Management, Inc. Ms. McAuliffe previously served as a member of the Advisory Board of certain Fidelity® funds (2016). Ms. McAuliffe was previously a lawyer at Ropes & Gray LLP and currently serves as director or trustee of several not-for-profit entities.
* Determined to be an “Interested Trustee” by virtue of, among other things, his or her affiliation with the trust or various entities under common control with FMR.
+ The information includes the Trustee's principal occupation during the last five years and other information relating to the experience, attributes, and skills relevant to the Trustee's qualifications to serve as a Trustee, which led to the conclusion that the Trustee should serve as a Trustee for the fund.
Independent Trustees:
Correspondence intended for an Independent Trustee may be sent to Fidelity Investments, P.O. Box 55235, Boston, Massachusetts 02205-5235.
Name, Year of Birth; Principal Occupations and Other Relevant Experience+
Elizabeth S. Acton (1951)
Year of Election or Appointment: 2013
Trustee
Ms. Acton also serves as Trustee of other Fidelity® funds. Prior to her retirement, Ms. Acton served as Executive Vice President, Finance (2011-2012), Executive Vice President, Chief Financial Officer (2002-2011) and Treasurer (2004-2005) of Comerica Incorporated (financial services). Prior to joining Comerica, Ms. Acton held a variety of positions at Ford Motor Company (1983-2002), including Vice President and Treasurer (2000-2002) and Executive Vice President and Chief Financial Officer of Ford Motor Credit Company (1998-2000). Ms. Acton currently serves as a member of the Board and Audit and Finance Committees of Beazer Homes USA, Inc. (homebuilding, 2012-present). Ms. Acton previously served as a member of the Advisory Board of certain Fidelity® funds (2013-2016).
Ann E. Dunwoody (1953)
Year of Election or Appointment: 2018
Trustee
General Dunwoody also serves as Trustee of other Fidelity® funds. General Dunwoody (United States Army, Retired) was the first woman in U.S. military history to achieve the rank of four-star general and prior to her retirement in 2012 held a variety of positions within the U.S. Army, including Commanding General, U.S. Army Material Command (2008-2012). General Dunwoody currently serves as President of First to Four LLC (leadership and mentoring services, 2012-present), a member of the Board and Nomination and Corporate Governance Committees of Kforce Inc. (professional staffing services, 2016-present) and a member of the Board of Automattic Inc. (software engineering, 2018-present). Previously, General Dunwoody served as a member of the Advisory Board and Nominating and Corporate Governance Committee of L3 Technologies, Inc. (communication, electronic, sensor and aerospace systems, 2013-2019) and a member of the Board and Audit and Sustainability and Corporate Responsibility Committees of Republic Services, Inc. (waste collection, disposal and recycling, 2013-2016). Ms. Dunwoody also serves on several boards for non-profit organizations, including as a member of the Board, Chair of the Nomination and Governance Committee and a member of the Audit Committee of Logistics Management Institute (consulting non-profit, 2012-present), a member of the Council of Trustees for the Association of the United States Army (advocacy non-profit, 2013-present), a member of the Board of Florida Institute of Technology (2015-present) and a member of the Board of ThanksUSA (military family education non-profit, 2014-present). General Dunwoody previously served as a member of the Advisory Board of certain Fidelity® funds (2018).
John Engler (1948)
Year of Election or Appointment: 2014
Trustee
Mr. Engler also serves as Trustee of other Fidelity® funds. Previously, Mr. Engler served as Governor of Michigan (1991-2003), President of the Business Roundtable (2011-2017) and interim President of Michigan State University (2018-2019). Mr. Engler currently serves as a member of the Board of K12 Inc. (technology-based education company, 2012-present). Previously, Mr. Engler served as a member of the Board of Universal Forest Products (manufacturer and distributor of wood and wood-alternative products, 2003-2019) and Trustee of The Munder Funds (2003-2014). Mr. Engler previously served as a member of the Advisory Board of certain Fidelity® funds (2014-2016).
Robert F. Gartland (1951)
Year of Election or Appointment: 2010
Trustee
Mr. Gartland also serves as Trustee of other Fidelity® funds. Prior to his retirement, Mr. Gartland held a variety of positions at Morgan Stanley (financial services, 1979-2007), including Managing Director (1987-2007) and Chase Manhattan Bank (1975-1978). Mr. Gartland previously served as Chairman and an investor in Gartland & Mellina Group Corp. (consulting, 2009-2019), as a member of the Board of National Securities Clearing Corporation (1993-1996) and as Chairman of TradeWeb (2003-2004).
Arthur E. Johnson (1947)
Year of Election or Appointment: 2008
Trustee
Chairman of the Independent Trustees
Mr. Johnson also serves as Trustee of other Fidelity® funds. Prior to his retirement, Mr. Johnson served as Senior Vice President of Corporate Strategic Development of Lockheed Martin Corporation (defense contractor, 1999-2009). Mr. Johnson currently serves as a member of the Board of Booz Allen Hamilton (management consulting, 2011-present). Mr. Johnson previously served as a member of the Board of Eaton Corporation plc (diversified power management, 2009-2019) and a member of the Board of AGL Resources, Inc. (holding company, 2002-2016). Mr. Johnson previously served as Vice Chairman (2015-2018) of the Independent Trustees of certain Fidelity® funds. Mr. Arthur E. Johnson is not related to Ms. Abigail P. Johnson.
Michael E. Kenneally (1954)
Year of Election or Appointment: 2009
Trustee
Vice Chairman of the Independent Trustees
Mr. Kenneally also serves as Trustee of other Fidelity® funds. Prior to his retirement, Mr. Kenneally served as Chairman and Global Chief Executive Officer of Credit Suisse Asset Management and Executive Vice President and Chief Investment Officer of Bank of America Corporation. Earlier roles at Bank of America included Director of Research, Senior Portfolio Manager for various institutional equity accounts and mutual funds and Portfolio Manager for a number of institutional fixed-income clients. Mr. Kenneally began his career as a Research Analyst in 1983 and was awarded the Chartered Financial Analyst (CFA) designation in 1991.
Marie L. Knowles (1946)
Year of Election or Appointment: 2001
Trustee
Ms. Knowles also serves as Trustee of other Fidelity® funds. Prior to her retirement, Ms. Knowles held several positions at Atlantic Richfield Company (diversified energy), including Executive Vice President and Chief Financial Officer (1996-2000), Senior Vice President (1993-1996) and President of ARCO Transportation Company (pipeline and tanker operations, 1993-1996). Ms. Knowles currently serves as a member of the Board of McKesson Corporation (healthcare service, since 2002), a member of the Board of the Santa Catalina Island Company (real estate, 2009-present), a member of the Investment Company Institute Board of Governors and a member of the Governing Council of the Independent Directors Council (2014-present). Ms. Knowles also serves as a member of the Advisory Board for the School of Engineering of the University of Southern California. Ms. Knowles previously served as Chairman (2015-2018) and Vice Chairman (2012-2015) of the Independent Trustees of certain Fidelity® funds.
Mark A. Murray (1954)
Year of Election or Appointment: 2016
Trustee
Mr. Murray also serves as Trustee of other Fidelity® funds. Previously, Mr. Murray served as Co-Chief Executive Officer (2013-2016), President (2006-2013) and Vice Chairman (2013-2020) of Meijer, Inc. Mr. Murray serves as a member of the Board and Nuclear Review and Public Policy and Responsibility Committees of DTE Energy Company (diversified energy company, 2009-present) and a member of the Board and Audit Committee and Chairman of the Nominating and Corporate Governance Committee of Universal Forest Products, Inc. (manufacturer and distributor of wood and wood-alternative products, 2004-2016). Mr. Murray previously served as a member of the Board of Spectrum Health (not-for-profit health system, 2015-2019). Mr. Murray also serves as a member of the Board of many community and professional organizations. Mr. Murray previously served as a member of the Advisory Board of certain Fidelity® funds (2016).
+ The information includes the Trustee's principal occupation during the last five years and other information relating to the experience, attributes, and skills relevant to the Trustee's qualifications to serve as a Trustee, which led to the conclusion that the Trustee should serve as a Trustee for the fund.
Advisory Board Members and Officers:
Correspondence intended for an officer may be sent to Fidelity Investments, 245 Summer Street, Boston, Massachusetts 02210. Officers appear below in alphabetical order.
Name, Year of Birth; Principal Occupation
Craig S. Brown (1977)
Year of Election or Appointment: 2019
Assistant Treasurer
Mr. Brown also serves as Assistant Treasurer of other funds. Mr. Brown is an employee of Fidelity Investments (2013-present).
John J. Burke III (1964)
Year of Election or Appointment: 2018
Chief Financial Officer
Mr. Burke also serves as Chief Financial Officer of other funds. Mr. Burke serves as Head of Investment Operations for Fidelity Fund and Investment Operations (2018-present) and is an employee of Fidelity Investments (1998-present). Previously Mr. Burke served as head of Asset Management Investment Operations (2012-2018).
David J. Carter (1973)
Year of Election or Appointment: 2020
Assistant Secretary
Mr. Carter also serves as Assistant Secretary of other funds. Mr. Carter serves as Vice President, Associate General Counsel (2010-present) and is an employee of Fidelity Investments (2005-present).
Jonathan Davis (1968)
Year of Election or Appointment: 2010
Assistant Treasurer
Mr. Davis also serves as Assistant Treasurer of other funds. Mr. Davis serves as Assistant Treasurer of FMR Capital, Inc. (2017-present) and is an employee of Fidelity Investments. Previously, Mr. Davis served as Vice President and Associate General Counsel of FMR LLC (diversified financial services company, 2003-2010).
Laura M. Del Prato (1964)
Year of Election or Appointment: 2018
President and Treasurer
Ms. Del Prato also serves as an officer of other funds. Ms. Del Prato is an employee of Fidelity Investments (2017-present). Previously, Ms. Del Prato served as President and Treasurer of The North Carolina Capital Management Trust: Cash Portfolio and Term Portfolio (2018-2020). Prior to joining Fidelity Investments, Ms. Del Prato served as a Managing Director and Treasurer of the JPMorgan Mutual Funds (2014-2017). Prior to JPMorgan, Ms. Del Prato served as a partner at Cohen Fund Audit Services (accounting firm, 2012-2013) and KPMG LLP (accounting firm, 2004-2012).
Colm A. Hogan (1973)
Year of Election or Appointment: 2016
Assistant Treasurer
Mr. Hogan also serves as an officer of other funds. Mr. Hogan serves as Assistant Treasurer of FMR Capital, Inc. (2017-present) and is an employee of Fidelity Investments (2005-present). Previously, Mr. Hogan served as Deputy Treasurer of certain Fidelity® funds (2016-2020) and Assistant Treasurer of certain Fidelity® funds (2016-2018).
Cynthia Lo Bessette (1969)
Year of Election or Appointment: 2019
Secretary and Chief Legal Officer (CLO)
Ms. Lo Bessette also serves as an officer of other funds. Ms. Lo Bessette serves as CLO, Secretary, and Senior Vice President of Fidelity Management & Research Company LLC (investment adviser firm, 2019-present); and CLO of Fidelity Management & Research (Hong Kong) Limited, FMR Investment Management (UK) Limited, and Fidelity Management & Research (Japan) Limited (investment adviser firms, 2019-present). She is a Senior Vice President and Deputy General Counsel of FMR LLC (diversified financial services company, 2019-present), and is an employee of Fidelity Investments. Previously, Ms. Lo Bessette served as CLO, Secretary, and Senior Vice President of FMR Co., Inc. (investment adviser firm, 2019); Secretary of Fidelity SelectCo, LLC and Fidelity Investments Money Management, Inc. (investment adviser firms, 2019). Prior to joining Fidelity Investments, Ms. Lo Bessette was Executive Vice President, General Counsel (2016-2019) and Senior Vice President, Deputy General Counsel (2015-2016) of OppenheimerFunds (investment management company) and Deputy Chief Legal Officer (2013-2015) of Jennison Associates LLC (investment adviser firm).
Chris Maher (1972)
Year of Election or Appointment: 2013
Assistant Treasurer
Mr. Maher also serves as an officer of other funds. Mr. Maher serves as Assistant Treasurer of FMR Capital, Inc. (2017-present), and is an employee of Fidelity Investments (2008-present). Previously, Mr. Maher served as Assistant Treasurer of certain funds (2013-2020); Vice President of Asset Management Compliance (2013), Vice President of the Program Management Group of FMR (investment adviser firm, 2010-2013), and Vice President of Valuation Oversight (2008-2010).
Jamie Pagliocco (1964)
Year of Election or Appointment: 2020
Vice President
Mr. Pagliocco also serves as Vice President of other funds. Mr. Pagliocco serves as President of Fixed Income (2020-present), and is an employee of Fidelity Investments (2001-present). Previously, Mr. Pagliocco served as Co-Chief Investment Officer – Bond (2017-2020), Global Head of Bond Trading (2016-2019), and as a portfolio manager.
Kenneth B. Robins (1969)
Year of Election or Appointment: 2020
Chief Compliance Officer
Mr. Robins also serves as an officer of other funds. Mr. Robins serves as Compliance Officer of Fidelity Management & Research Company LLC (investment adviser firm, 2016-present) and is an employee of Fidelity Investments (2004-present). Previously, Mr. Robins served as Compliance Officer of FMR Co., Inc. (investment adviser firm, 2016-2019), as Executive Vice President of Fidelity Investments Money Management, Inc. (investment adviser firm, 2013-2016) and served in other fund officer roles.
Brett Segaloff (1972)
Year of Election or Appointment: 2021
Anti-Money Laundering (AML) Officer
Mr. Segaloff also serves as an AML Officer of other funds and other related entities. He is Director, Anti-Money Laundering (2007-present) of FMR LLC (diversified financial services company) and is an employee of Fidelity Investments (1996-present).
Stacie M. Smith (1974)
Year of Election or Appointment: 2013
Assistant Treasurer
Ms. Smith also serves as an officer of other funds. Ms. Smith serves as Assistant Treasurer of FMR Capital, Inc. (2017-present), is an employee of Fidelity Investments (2009-present), and has served in other fund officer roles. Prior to joining Fidelity Investments, Ms. Smith served as Senior Audit Manager of Ernst & Young LLP (accounting firm, 1996-2009). Previously, Ms. Smith served as Assistant Treasurer (2013-2019) and Deputy Treasurer (2013-2016) of certain Fidelity® funds.
Marc L. Spector (1972)
Year of Election or Appointment: 2016
Deputy Treasurer
Mr. Spector also serves as an officer of other funds. Mr. Spector serves as Assistant Treasurer of FMR Capital, Inc. (2017-present) and is an employee of Fidelity Investments (2016-present). Prior to joining Fidelity Investments, Mr. Spector served as Director at the Siegfried Group (accounting firm, 2013-2016), and prior to Siegfried Group as audit senior manager at Deloitte & Touche LLP (accounting firm, 2005-2013).
Jim Wegmann (1979)
Year of Election or Appointment: 2019
Assistant Treasurer
Mr. Wegmann also serves as Assistant Treasurer of other funds. Mr. Wegmann is an employee of Fidelity Investments (2011-present).
Shareholder Expense Example
As a shareholder, you incur two types of costs: (1) transaction costs, which may include sales charges (loads) on purchase payments or redemption proceeds, as applicable and (2) ongoing costs, which generally include management fees, distribution and/or service (12b-1) fees and other Fund expenses. This Example is intended to help you understand your ongoing costs (in dollars) of investing in a fund and to compare these costs with the ongoing costs of investing in other mutual funds.
The Example is based on an investment of $1,000 invested at the beginning of the period and held for the entire period (July 1, 2020 to December 31, 2020).
Actual Expenses
The first line of the accompanying table provides information about actual account values and actual expenses. You may use the information in this line, together with the amount you invested, to estimate the expenses that you paid over the period. Simply divide your account value by $1,000.00 (for example, an $8,600 account value divided by $1,000.00 = 8.6), then multiply the result by the number in the first line for a class/Fund under the heading entitled "Expenses Paid During Period" to estimate the expenses you paid on your account during this period. If any fund is a shareholder of any underlying mutual funds or exchange-traded funds (ETFs) (the Underlying Funds), such fund indirectly bears its proportional share of the expenses of the Underlying Funds in addition to the direct expenses incurred presented in the table. These fees and expenses are not included in the annualized expense ratio used to calculate the expense estimate in the table below. The estimate of expenses does not include any fees or other expenses of any variable annuity or variable life insurance product. If they were, the estimate of expenses you paid during the period would be higher, and your ending account value would be lower.
Hypothetical Example for Comparison Purposes
The second line of the accompanying table provides information about hypothetical account values and hypothetical expenses based on the actual expense ratio and an assumed rate of return of 5% per year before expenses, which is not the actual return. The hypothetical account values and expenses may not be used to estimate the actual ending account balance or expenses you paid for the period. You may use this information to compare the ongoing costs of investing in the Fund and other funds. To do so, compare this 5% hypothetical example with the 5% hypothetical examples that appear in the shareholder reports of the other funds. If any fund is a shareholder of any Underlying Funds, such fund indirectly bears its proportional share of the expenses of the Underlying Funds in addition to the direct expenses as presented in the table. These fees and expenses are not included in the annualized expense ratio used to calculate the expense estimate in the table below. The estimate of expenses does not include any fees or other expenses of any variable annuity or variable life insurance product. If they were, the estimate of expenses you paid during the period would be higher, and your ending account value would be lower.
Please note that the expenses shown in the table are meant to highlight your ongoing costs only and do not reflect any transaction costs. Therefore, the second line of the table is useful in comparing ongoing costs only, and will not help you determine the relative total costs of owning different funds.
| | Annualized Expense Ratio-A | Beginning
Account Value
July 1, 2020 | Ending
Account Value
December 31, 2020 | Expenses Paid
During Period-B
July 1, 2020
to December 31, 2020 |
| VIP Bond Index Portfolio | | | | |
| Initial Class | .14% | | | |
| Actual | | $1,000.00 | $1,011.00 | $.71 |
| Hypothetical-C | | $1,000.00 | $1,024.43 | $.71 |
| Service Class | .24% | | | |
| Actual | | $1,000.00 | $1,010.90 | $1.21 |
| Hypothetical-C | | $1,000.00 | $1,023.93 | $1.22 |
| Service Class 2 | .37% | | | |
| Actual | | $1,000.00 | $1,009.30 | $1.87 |
| Hypothetical-C | | $1,000.00 | $1,023.28 | $1.88 |
A Annualized expense ratio reflects expenses net of applicable fee waivers.
B Expenses are equal to the annualized expense ratio, multiplied by the average account value over the period, multiplied by 184/ 366 (to reflect the one-half year period). The fees and expenses of any Underlying Funds are not included in each annualized expense ratio.
C 5% return per year before expenses
Distributions (Unaudited)
The fund hereby designates as a capital gain dividend with respect to the taxable year ended December 31, 2020, $647,440, or, if subsequently determined to be different, the net capital gain of such year.
A total of 25.53% of the dividends distributed during the fiscal year was derived from interest on U.S. Government securities which is generally exempt from state income tax.
Board Approval of Investment Advisory Contracts and Management Fees
VIP Bond Index Portfolio
Each year, the Board of Trustees, including the Independent Trustees (together, the Board), votes on the renewal of the management contract with Fidelity Management & Research Company LLC (FMR) and the sub-advisory agreements (together, the Advisory Contracts) for the fund. FMR and the sub-advisers are referred to herein as the Investment Advisers. The Board, assisted by the advice of fund counsel and Independent Trustees' counsel, requests and considers a broad range of information relevant to the renewal of the Advisory Contracts throughout the year.
The Board meets regularly and, at each of its meetings, covers an extensive agenda of topics and materials and considers factors that are relevant to its annual consideration of the renewal of the fund's Advisory Contracts, including the services and support provided to the fund and its shareholders. The Board has established four standing committees (Committees) — Operations, Audit, Fair Valuation, and Governance and Nominating — each composed of and chaired by Independent Trustees with varying backgrounds, to which the Board has assigned specific subject matter responsibilities in order to enhance effective decision-making by the Board. The Operations Committee, of which all of the Independent Trustees are members, meets regularly throughout the year and considers, among other matters, information specifically related to the annual consideration of the renewal of the fund's Advisory Contracts. The Board, acting directly and through its Committees, requests and receives information concerning the annual consideration of the renewal of the fund's Advisory Contracts. The Board also meets as needed to review matters specifically related to the Board's annual consideration of the renewal of the Advisory Contracts. Members of the Board may also meet with trustees of other Fidelity funds through joint ad hoc committees to discuss certain matters relevant to all of the Fidelity funds.
At its September 2020 meeting, the Board unanimously determined to renew the fund's Advisory Contracts. In reaching its determination, the Board considered all factors it believed relevant, including (i) the nature, extent, and quality of the services provided to the fund and its shareholders (including the investment performance of the fund); (ii) the competitiveness of the fund's management fee and total expense ratio relative to peer funds; (iii) the total costs of the services provided by and the profits realized by Fidelity from its relationships with the fund; and (iv) the extent to which, if any, economies of scale exist and are realized as the fund grows, and whether any economies of scale are appropriately shared with fund shareholders.
In considering whether to renew the Advisory Contracts for the fund, the Board reached a determination, with the assistance of fund counsel and Independent Trustees' counsel and through the exercise of its business judgment, that the renewal of the Advisory Contracts was in the best interests of the fund and its shareholders and that the compensation payable under the Advisory Contracts was fair and reasonable. The Board's decision to renew the Advisory Contracts was not based on any single factor, but rather was based on a comprehensive consideration of all the information provided to the Board at its meetings throughout the year. The Board, in reaching its determination to renew the Advisory Contracts, was aware that shareholders of the fund have a broad range of investment choices available to them, including a wide choice among funds offered by Fidelity's competitors, and that the fund's shareholders, who have the opportunity to review and weigh the disclosure provided by the fund in its prospectus and other public disclosures, have chosen to invest in this fund, which is part of the Fidelity family of funds.
Nature, Extent, and Quality of Services Provided. The Board considered Fidelity's staffing as it relates to the fund, including the backgrounds of investment personnel of Fidelity, and also considered the fund's investment objective, strategies, and related investment philosophy. The Independent Trustees also had discussions with senior management of Fidelity's investment operations and investment groups. The Board considered the structure of the investment personnel compensation program and whether this structure provides appropriate incentives to act in the best interests of the fund. Additionally, the Board considered the portfolio managers' investments, if any, in the funds that they manage.
Resources Dedicated to Investment Management and Support Services. The Board reviewed the general qualifications and capabilities of Fidelity's investment staff, including its size, education, experience, and resources, as well as Fidelity's approach to recruiting, managing, and compensating investment personnel. The Board noted that Fidelity has continued to increase the resources devoted to non-U.S. offices, including expansion of Fidelity's global investment organization. The Board also noted that Fidelity's analysts have extensive resources, tools and capabilities that allow them to conduct sophisticated quantitative and fundamental analysis, as well as credit analysis of issuers, counterparties and guarantors. Further, the Board considered that Fidelity's investment professionals have sufficient access to global information and data so as to provide competitive investment results over time, and that those professionals also have access to sophisticated tools that permit them to assess portfolio construction and risk and performance attribution characteristics continuously, as well as to transmit new information and research conclusions rapidly around the world. Additionally, in its deliberations, the Board considered Fidelity's trading, risk management, compliance, and technology and operations capabilities and resources, which are integral parts of the investment management process. The Board also considered Fidelity's investments in business continuity planning, and its success in continuously providing services to the fund notwithstanding the severe disruptions caused by the COVID-19 pandemic.
Shareholder and Administrative Services. The Board considered (i) the nature, extent, quality, and cost of advisory, administrative, and shareholder services performed by the Investment Advisers and their affiliates under the Advisory Contracts and under separate agreements covering transfer agency, pricing and bookkeeping, and securities lending services for the fund; (ii) the nature and extent of the supervision of third party service providers, principally custodians, subcustodians, and pricing vendors; and (iii) the resources devoted to, and the record of compliance with, the fund's compliance policies and procedures.
The Board noted that the growth of fund assets over time across the complex allows Fidelity to reinvest in the development of services designed to enhance the value and convenience of the Fidelity funds as investment vehicles. These services include 24-hour access to account information and market information over the Internet and through telephone representatives, investor education materials and asset allocation tools, and the expanded availability of Fidelity Investor Centers.
Investment in a Large Fund Family. The Board considered the benefits to shareholders of investing in a Fidelity fund, including the benefits of investing in a fund that is part of a large family of funds offering a variety of investment disciplines and providing a large variety of mutual fund investor services. The Board noted that Fidelity had taken, or had made recommendations that resulted in the Fidelity funds taking, a number of actions over the previous year that benefited particular funds, including: (i) continuing to dedicate additional resources to Fidelity's investment research process, which includes meetings with management of issuers of securities in which the funds invest, and to the support of the senior management team that oversees asset management; (ii) continuing efforts to enhance Fidelity's global research capabilities; (iii) launching new funds and ETFs with innovative structures, strategies and pricing and making other enhancements to meet client needs; (iv) launching new share classes of existing funds; (v) eliminating purchase minimums and broadening eligibility requirements for certain funds and share classes; (vi) reducing management fees and total expenses for certain target date funds or classes and index funds; (vii) lowering expenses for certain funds and classes by implementing or lowering expense caps; (viii) rationalizing product lines and gaining increased efficiencies from fund mergers, liquidations, and share class consolidations; (ix) continuing to develop, acquire and implement systems and technology to improve services to the funds and shareholders, strengthen information security, and increase efficiency; and (x) continuing to implement enhancements to further strengthen Fidelity's product line to increase investors' probability of success in achieving their investment goals, including retirement income goals.
Investment Performance. The Board considered whether the fund has operated in accordance with its investment objective, as well as its record of compliance with its investment restrictions and its performance history.
The Board took into account discussions that occur at Board meetings throughout the year with representatives of the Investment Advisers about fund investment performance. In this regard the Board noted that as part of regularly scheduled fund reviews and other reports to the Board on fund performance, the Board considers annualized return information for the fund for different time periods, measured against the securities market index the fund seeks to track. The Board also periodically considers the fund's tracking error versus its benchmark index. In its evaluation of fund investment performance at meetings throughout the year, the Board gave particular attention to information indicating underperformance of certain Fidelity funds for specific time periods and discussed with the Investment Advisers the reasons for such underperformance.
In addition to reviewing absolute and relative fund performance, the Independent Trustees periodically consider the appropriateness of fund performance metrics in evaluating the results achieved. In general, the Independent Trustees believe that an index fund's performance should be evaluated based on gross performance (before fees and expenses but after transaction costs) compared to a fund's benchmark index, over appropriate time periods, taking into account relevant factors including the following: general market conditions; the characteristics of the fund's benchmark index; the extent to which statistical sampling is employed; and fund cash flows and other factors. The Independent Trustees generally give greater weight to fund performance over longer time periods than over shorter time periods. Depending on the circumstances, the Independent Trustees may be satisfied with a fund's performance notwithstanding that it lags its benchmark index for certain periods.
The Independent Trustees recognize that shareholders evaluate performance on a net basis (after fees and expenses) over their own holding periods, for which one-, three-, and five-year periods are often used as a proxy. For this reason, the performance information reviewed by the Board also included net calendar year total return information for the fund and its benchmark index for the most recent one-year period. Due to the characteristics of the fund, no peer group performance information was considered by the Board. The Independent Trustees recognize that shareholders who are not investing through a tax-advantaged retirement account also consider tax consequences in evaluating performance.
Based on its review, the Board concluded that the nature, extent, and quality of services provided to the fund under the Advisory Contracts should continue to benefit the shareholders of the fund.
Competitiveness of Management Fee and Total Expense Ratio. The Board considered the fund's management fee and total expense ratio compared to "mapped groups" of competitive funds and classes created for the purpose of facilitating the Trustees' competitive analysis of management fees and total expenses. Fidelity creates "mapped groups" by combining similar Lipper investment objective categories that have comparable investment mandates. Combining Lipper investment objective categories aids the Board's management fee and total expense ratio comparisons by broadening the competitive group used for comparison.
Management Fee. The Board considered two proprietary management fee comparisons for the 12-month (or shorter) periods shown in basis points (BP) in the chart below. The group of Lipper funds used by the Board for management fee comparisons is referred to below as the "Total Mapped Group." The Total Mapped Group comparison focuses on a fund's standing in terms of gross management fees before expense reimbursements or caps relative to the total universe of funds with comparable investment mandates, regardless of whether their management fee structures also are comparable. Funds with comparable investment mandates offer exposure to similar types of securities. Funds with comparable management fee structures have similar management fee contractual arrangements (
e.g., flat rate charged for advisory services, all-inclusive fee rate,
etc.). "TMG %" represents the percentage of funds in the Total Mapped Group that had management fees that were lower than the fund's. For example, a hypothetical TMG % of 20% would mean that 80% of the funds in the Total Mapped Group had higher, and 20% had lower, management fees than the fund. The fund's actual TMG %s and the number of funds in the Total Mapped Group are in the chart below. The "Asset-Sized Peer Group" (ASPG) comparison focuses on a fund's standing relative to a subset of non-Fidelity funds within the Total Mapped Group that are similar in size and management fee structure. For example, if a fund is in the first quartile of the ASPG, the fund's management fee ranks in the least expensive or lowest 25% of funds in the ASPG. The ASPG represents at least 15% of the funds in the Total Mapped Group with comparable asset size and management fee structures, subject to a minimum of 50 funds (or all funds in the Total Mapped Group if fewer than 50). Additional information, such as the ASPG quartile in which the fund's management fee rate ranked, is also included in the chart and was considered by the Board.
VIP Bond Index Portfolio

The Board noted that the fund's management fee rate ranked below the median of its Total Mapped Group and below the median of its ASPG for 2019.
The Board noted that it and the boards of other Fidelity funds formed an ad hoc Committee on Group Fee, which meets periodically, to conduct an in-depth review of the "group fee" component of the management fee of funds with such management fee structures. The Committee's focus included the mechanics of the group fee, the competitive landscape of group fee structures, Fidelity funds with no group fee component (such as the fund) and investment products not included in group fee assets. The Board also considered that, for funds subject to the group fee, FMR agreed to voluntarily waive fees over a specified period of time in amounts designed to account for assets converted from certain funds to certain collective investment trusts.
Based on its review, the Board concluded that the fund's management fee is fair and reasonable in light of the services that the fund receives and the other factors considered.
Total Expense Ratio. In its review of each class's total expense ratio, the Board considered the fund's management fee rate as well as other "fund-level" expenses, such as pricing and bookkeeping fees and custodial, legal, and audit fees, paid by FMR under the fund's management contract. The Board also considered other "class-level" expenses, such as transfer agent fees and fund-paid 12b-1 fees. The Board also noted that Fidelity may agree to waive fees or reimburse expenses from time to time, and the extent to which, if any, it has done so for the fund. As part of its review, the Board also considered the current and historical total expense ratios of each class of the fund compared to competitive fund median expenses. Each class of the fund is compared to those funds and classes in the Total Mapped Group (used by the Board for management fee comparisons) that have a similar sales load structure.
The Board noted that the total expense ratio of each class ranked below the competitive median for 2019.
The Board considered that current contractual arrangements for the fund oblige FMR to pay all "class-level" expenses of each class of the fund to the extent necessary to limit total operating expenses, with certain exceptions, as follows: Initial Class: 0.14%; Service Class: 0.24%; and Service Class 2: 0.39%. These contractual arrangements may not be amended to increase the fees or expenses payable except by a vote of a majority of the Board.
Fees Charged to Other Fidelity Clients. The Board also considered Fidelity fee structures and other information with respect to clients of Fidelity, such as other funds advised or subadvised by Fidelity, pension plan clients, and other institutional clients with similar mandates. The Board noted that a joint ad hoc committee created by it and the boards of other Fidelity funds periodically reviews and compares Fidelity's institutional investment advisory business with its business of providing services to the Fidelity funds and also noted the most recent findings of the committee. The Board noted that the committee's review included a consideration of the differences in services provided, fees charged, and costs incurred, as well as competition in the markets serving the different categories of clients.
Based on its review of total expense ratios and fees charged to other Fidelity clients, the Board concluded that the total expense ratio of each class of the fund was reasonable in light of the services that the fund and its shareholders receive and the other factors considered.
Costs of the Services and Profitability. The Board considered the revenues earned and the expenses incurred by Fidelity in conducting the business of developing, marketing, distributing, managing, administering and servicing the fund and servicing the fund's shareholders. The Board also considered the level of Fidelity's profits in respect of all the Fidelity funds.
On an annual basis, Fidelity presents to the Board information about the profitability of its relationships with the fund. Fidelity calculates profitability information for each fund, as well as aggregate profitability information for groups of Fidelity funds and all Fidelity funds, using a series of detailed revenue and cost allocation methodologies which originate with the books and records of Fidelity on which Fidelity's audited financial statements are based. The Audit Committee of the Board reviews any significant changes from the prior year's methodologies and the full Board approves such changes.
A public accounting firm has been engaged annually by the Board as part of the Board's assessment of Fidelity's profitability analysis. The engagement includes the review and assessment of the methodologies used by Fidelity in determining the revenues and expenses attributable to Fidelity's mutual fund business, and completion of agreed-upon procedures in respect of the mathematical accuracy of certain fund profitability information and its conformity to established allocation methodologies. After considering the reports issued under the engagement and information provided by Fidelity, the Board concluded that while other allocation methods may also be reasonable, Fidelity's profitability methodologies are reasonable in all material respects.
The Board also reviewed Fidelity's non-fund businesses and potential indirect benefits such businesses may have received as a result of their association with Fidelity's mutual fund business (i.e., fall-out benefits) as well as cases where Fidelity's affiliates may benefit from the funds' business. The Board considered areas where potential indirect benefits to the Fidelity funds from their relationships with Fidelity may exist. The Board also considered that in 2019 a joint ad hoc committee created by it and the boards of other Fidelity funds evaluated potential fall-out benefits (PFOB Committee). The Board noted that it considered the PFOB Committee's findings in connection with its consideration of the renewal of the Advisory Contracts.
The Board considered the costs of the services provided by and the profits realized by Fidelity in connection with the operation of the fund, including the conclusions of the PFOB Committee, and was satisfied that the profitability was not excessive.
Economies of Scale. The Board considered whether there have been economies of scale in respect of the management of the Fidelity funds, whether the Fidelity funds (including the fund) have appropriately benefited from any such economies of scale, and whether there is potential for realization of any further economies of scale. The Board considered the extent to which the fund will benefit from economies of scale as assets grow through increased services to the fund, through waivers or reimbursements, or through fee or expense ratio reductions. The Board recognized that, due to the fund's current contractual arrangements, the expense ratio of each class will not decline if the class's operating costs decrease as assets grow, or rise as assets decrease. The Board also noted that a committee (the Economies of Scale Committee) created by it and the boards of other Fidelity funds periodically analyzes whether Fidelity attains economies of scale in respect of the management and servicing of the Fidelity funds, whether the Fidelity funds have appropriately benefited from such economies of scale, and whether there is potential for realization of any further economies of scale.
The Board concluded, taking into account the analysis of the Economies of Scale Committee, that economies of scale, if any, are being appropriately shared between fund shareholders and Fidelity.
Additional Information Requested by the Board. In order to develop fully the factual basis for consideration of the Fidelity funds' advisory contracts, the Board requested and received additional information on certain topics, including: (i) Fidelity's fund profitability methodology, profitability trends for certain funds, the allocation of various costs to different funds, and the impact of certain factors on fund profitability results; (ii) portfolio manager changes that have occurred during the past year and the amount of the investment that each portfolio manager has made in the Fidelity fund(s) that he or she manages; (iii) Fidelity's compensation structure for portfolio managers, research analysts, and other key personnel, including its effects on fund profitability, the rationale for the compensation structure, and the extent to which current market conditions have affected retention and recruitment; (iv) the arrangements with and compensation paid to certain fund sub-advisers on behalf of the Fidelity funds and the treatment of such compensation within Fidelity's fund profitability methodology; (v) the terms of the funds' various management fee structures, including the basic group fee and the terms of Fidelity's voluntary expense limitation agreements; (vi) Fidelity's transfer agent fee, expense, and service structures for different funds and classes relative to competitive trends; (vii) the impact on fund profitability of recent industry trends, such as the growth in passively managed funds and outflows from actively managed equity funds; and (viii) explanations regarding the relative total expense ratios of certain funds and classes, total expense competitive trends and methodologies for total expense competitive comparisons, and actions that might be taken by Fidelity to reduce total expense ratios for certain classes. In addition, the Board considered its discussions with Fidelity regarding Fidelity's efforts to maintain the continuous investment and shareholder services necessary for the funds during the current pandemic and economic circumstances.
Based on its evaluation of all of the conclusions noted above, and after considering all factors it believed relevant, the Board concluded that the advisory fee arrangements are fair and reasonable, and that the fund's Advisory Contracts should be renewed.
VUSB-ANN-0221
1.9887310.102
Item 2.
Code of Ethics
As of the end of the period, December 31, 2020, Variable Insurance Products Fund V (the trust) has adopted a code of ethics, as defined in Item 2 of Form N-CSR, that applies to its President and Treasurer and its Chief Financial Officer. A copy of the code of ethics is filed as an exhibit to this Form N-CSR.
Item 3.
Audit Committee Financial Expert
The Board of Trustees of the trust has determined that Elizabeth S. Acton is an audit committee financial expert, as defined in Item 3 of Form N-CSR. Ms. Acton is independent for purposes of Item 3 of Form N-CSR.
Item 4.
Principal Accountant Fees and Services
Fees and Services
The following table presents fees billed by Deloitte & Touche LLP, the member firms of Deloitte Touche Tohmatsu, and their respective affiliates (collectively, “Deloitte Entities”) in each of the last two fiscal years for services rendered to VIP Asset Manager Growth Portfolio, VIP Asset Manager Portfolio, VIP Bond Index Portfolio, VIP Freedom 2005 Portfolio, VIP Freedom 2010 Portfolio, VIP Freedom 2015 Portfolio, VIP Freedom 2020 Portfolio, VIP Freedom 2025 Portfolio, VIP Freedom 2030 Portfolio, VIP Freedom 2035 Portfolio, VIP Freedom 2040 Portfolio, VIP Freedom 2045 Portfolio, VIP Freedom 2050 Portfolio, VIP Freedom 2055 Portfolio, VIP Freedom 2060 Portfolio, VIP Freedom 2065 Portfolio, VIP Freedom Income Portfolio, VIP Freedom Lifetime Income I Portfolio, VIP Freedom Lifetime Income II Portfolio, VIP Freedom Lifetime Income III Portfolio and VIP Investment Grade Bond Portfolio (the “Funds”):
Services Billed by Deloitte Entities
December 31, 2020 FeesA
| | | | |
| Audit Fees | Audit-Related Fees | Tax Fees | All Other Fees |
VIP Asset Manager Growth Portfolio | $32,800 | $- | $7,200 | $800 |
VIP Asset Manager Portfolio | $33,500 | $- | $11,400 | $900 |
VIP Bond Index Portfolio | $68,600 | $- | $9,400 | $1,600 |
VIP Freedom 2005 Portfolio | $17,700 | $- | $6,900 | $500 |
VIP Freedom 2010 Portfolio | $17,700 | $- | $6,700 | $500 |
VIP Freedom 2015 Portfolio | $17,700 | $- | $6,900 | $500 |
VIP Freedom 2020 Portfolio | $17,700 | $- | $6,700 | $500 |
VIP Freedom 2025 Portfolio | $17,700 | $- | $6,700 | $500 |
VIP Freedom 2030 Portfolio | $17,700 | $- | $6,700 | $500 |
VIP Freedom 2035 Portfolio | $17,700 | $- | $6,700 | $500 |
VIP Freedom 2040 Portfolio | $17,700 | $- | $6,700 | $500 |
VIP Freedom 2045 Portfolio | $17,700 | $- | $6,700 | $500 |
VIP Freedom 2050 Portfolio | $17,700 | $- | $6,700 | $500 |
VIP Freedom 2055 Portfolio | $17,800 | $- | $7,100 | $500 |
VIP Freedom 2060 Portfolio | $17,800 | $- | $7,100 | $500 |
VIP Freedom 2065 Portfolio | $17,800 | $- | $7,100 | $500 |
VIP Freedom Income Portfolio | $17,700 | $- | $6,700 | $500 |
VIP Freedom Lifetime Income I Portfolio | $15,600 | $- | $6,900 | $500 |
VIP Freedom Lifetime Income II Portfolio | $15,600 | $- | $6,900 | $500 |
VIP Freedom Lifetime Income III Portfolio | $15,600 | $- | $6,900 | $500 |
VIP Investment Grade Bond Portfolio | $36,100 | $- | $9,300 | $900 |
December 31, 2019 FeesA,B
| | | | |
| Audit Fees | Audit-Related Fees | Tax Fees | All Other Fees |
VIP Asset Manager Growth Portfolio | $42,000 | $100 | $5,300 | $900 |
VIP Asset Manager Portfolio | $44,000 | $100 | $7,700 | $1,000 |
VIP Bond Index Portfolio | $71,000 | $100 | $6,600 | $1,600 |
VIP Freedom 2005 Portfolio | $20,000 | $- | $5,000 | $500 |
VIP Freedom 2010 Portfolio | $20,000 | $- | $5,000 | $500 |
VIP Freedom 2015 Portfolio | $20,000 | $- | $5,000 | $500 |
VIP Freedom 2020 Portfolio | $20,000 | $- | $5,000 | $500 |
VIP Freedom 2025 Portfolio | $20,000 | $- | $5,000 | $500 |
VIP Freedom 2030 Portfolio | $20,000 | $- | $5,000 | $500 |
VIP Freedom 2035 Portfolio | $20,000 | $- | $5,000 | $500 |
VIP Freedom 2040 Portfolio | $20,000 | $- | $5,000 | $500 |
VIP Freedom 2045 Portfolio | $20,000 | $- | $5,000 | $500 |
VIP Freedom 2050 Portfolio | $20,000 | $- | $5,000 | $500 |
VIP Freedom 2055 Portfolio | $17,000 | $- | $5,000 | $300 |
VIP Freedom 2060 Portfolio | $17,000 | $- | $5,000 | $300 |
VIP Freedom 2065 Portfolio | $17,000 | $- | $5,000 | $300 |
VIP Freedom Income Portfolio | $20,000 | $- | $5,000 | $500 |
VIP Freedom Lifetime Income I Portfolio | $18,000 | $- | $5,000 | $500 |
VIP Freedom Lifetime Income II Portfolio | $18,000 | $- | $5,000 | $500 |
VIP Freedom Lifetime Income III Portfolio | $18,000 | $- | $5,000 | $500 |
VIP Investment Grade Bond Portfolio | $40,000 | $100 | $6,500 | $1,000 |
A Amounts may reflect rounding.
B VIP Freedom 2055 Portfolio, VIP Freedom 2060 Portfolio and VIP Freedom 2065 Portfolio commenced operations on April 11, 2019.
The following table presents fees billed by PricewaterhouseCoopers LLP (“PwC”) in each of the last two fiscal years for services rendered to VIP FundsManager 20% Portfolio, VIP FundsManager 50% Portfolio, VIP FundsManager 60% Portfolio, VIP FundsManager 70% Portfolio, VIP FundsManager 85% Portfolio, VIP Government Money Market Portfolio, VIP Investor Freedom 2005 Portfolio, VIP Investor Freedom 2010 Portfolio, VIP Investor Freedom 2015 Portfolio, VIP Investor Freedom 2020 Portfolio, VIP Investor Freedom 2025 Portfolio, VIP Investor Freedom 2030 Portfolio, VIP Investor Freedom Income Portfolio, VIP Strategic Income Portfolio and VIP Target Volatility Portfolio (the “Funds”):
Services Billed by PwC
December 31, 2020 FeesA
| | | | |
| Audit Fees | Audit-Related Fees | Tax Fees | All Other Fees |
VIP FundsManager 20% Portfolio | $24,200 | $2,200 | $5,000 | $1,200 |
VIP FundsManager 50% Portfolio | $24,200 | $2,200 | $5,000 | $1,200 |
VIP FundsManager 60% Portfolio | $24,200 | $2,200 | $5,000 | $1,200 |
VIP FundsManager 70% Portfolio | $24,200 | $2,200 | $5,000 | $1,200 |
VIP FundsManager 85% Portfolio | $24,200 | $2,200 | $5,000 | $1,200 |
VIP Government Money Market Portfolio | $40,200 | $3,200 | $1,900 | $1,700 |
VIP Investor Freedom 2005 Portfolio | $14,800 | $1,500 | $5,200 | $800 |
VIP Investor Freedom 2010 Portfolio | $14,800 | $1,500 | $5,200 | $800 |
VIP Investor Freedom 2015 Portfolio | $14,800 | $1,500 | $5,200 | $800 |
VIP Investor Freedom 2020 Portfolio | $14,800 | $1,500 | $5,200 | $800 |
VIP Investor Freedom 2025 Portfolio | $14,800 | $1,500 | $5,200 | $800 |
VIP Investor Freedom 2030 Portfolio | $14,800 | $1,500 | $5,200 | $800 |
VIP Investor Freedom Income Portfolio | $14,800 | $1,500 | $5,200 | $800 |
VIP Strategic Income Portfolio | $86,700 | $7,300 | $10,000 | $4,000 |
VIP Target Volatility Portfolio | $25,700 | $2,400 | $5,400 | $1,300 |
| | | | |
| Audit Fees | Audit-Related Fees | Tax Fees | All Other Fees |
VIP FundsManager 20% Portfolio | $31,000 | $2,400 | $2,600 | $1,300 |
VIP FundsManager 50% Portfolio | $31,000 | $2,400 | $2,600 | $1,300 |
VIP FundsManager 60% Portfolio | $31,000 | $2,400 | $2,600 | $1,300 |
VIP FundsManager 70% Portfolio | $31,000 | $2,400 | $2,600 | $1,300 |
VIP FundsManager 85% Portfolio | $31,000 | $2,400 | $2,600 | $1,300 |
VIP Government Money Market Portfolio | $42,000 | $3,400 | $2,000 | $1,900 |
VIP Investor Freedom 2005 Portfolio | $19,000 | $1,700 | $2,800 | $900 |
VIP Investor Freedom 2010 Portfolio | $19,000 | $1,700 | $2,800 | $900 |
VIP Investor Freedom 2015 Portfolio | $19,000 | $1,700 | $2,800 | $900 |
VIP Investor Freedom 2020 Portfolio | $19,000 | $1,700 | $2,800 | $900 |
VIP Investor Freedom 2025 Portfolio | $19,000 | $1,700 | $2,800 | $900 |
VIP Investor Freedom 2030 Portfolio | $19,000 | $1,700 | $2,800 | $900 |
VIP Investor Freedom Income Portfolio | $19,000 | $1,700 | $2,800 | $900 |
VIP Strategic Income Portfolio | $96,000 | $7,600 | $3,500 | $4,300 |
VIP Target Volatility Portfolio | $30,000 | $2,500 | $3,000 | $1,400 |
A Amounts may reflect rounding.
The following table(s) present(s) fees billed by Deloitte Entities and PwC that were required to be approved by the Audit Committee for services that relate directly to the operations and financial reporting of the Fund(s) and that are rendered on behalf of Fidelity Management & Research Company LLC ("FMR") and entities controlling, controlled by, or under common control with FMR (not including any sub-adviser whose role is primarily portfolio management and is subcontracted with or overseen by another investment adviser) that provide ongoing services to the Fund(s) (“Fund Service Providers”):
Services Billed by Deloitte Entities
| | |
| December 31, 2020A | December 31, 2019A,B |
Audit-Related Fees | $- | $290,000 |
Tax Fees | $- | $5,000 |
All Other Fees | $- | $- |
A Amounts may reflect rounding.
B May include amounts billed prior to the VIP Freedom 2055 Portfolio, VIP Freedom 2060 Portfolio and VIP Freedom 2065 Portfolio’s commencement of operations.
Services Billed by PwC
| | |
| December 31, 2020A | December 31, 2019A |
Audit-Related Fees | $9,377,400 | $7,705,000 |
Tax Fees | $30,000 | $10,000 |
All Other Fees | $- | $- |
A Amounts may reflect rounding.
“Audit-Related Fees” represent fees billed for assurance and related services that are reasonably related to the performance of the fund audit or the review of the fund's financial statements and that are not reported under Audit Fees.
“Tax Fees” represent fees billed for tax compliance, tax advice or tax planning that relate directly to the operations and financial reporting of the fund.
“All Other Fees” represent fees billed for services provided to the fund or Fund Service Provider, a significant portion of which are assurance related, that relate directly to the operations and financial reporting of the fund, excluding those services that are reported under Audit Fees, Audit-Related Fees or Tax Fees.
Assurance services must be performed by an independent public accountant.
* * *
The aggregate non-audit fees billed by Deloitte Entities and PwC for services rendered to the Fund(s), FMR (not including any sub-adviser whose role is primarily portfolio management and is subcontracted with or overseen by another investment adviser), and any Fund Service Provider for each of the last two fiscal years of the Fund(s) are as follows:
| | |
Billed By | December 31, 2020A | December 31, 2019A,B |
Deloitte Entities | $667,700 | $700,000 |
PwC | $14,614,000 | $12,455,000 |
A Amounts may reflect rounding.
B May include amounts billed prior to the VIP Freedom 2055 Portfolio, VIP Freedom 2060 Portfolio and VIP Freedom 2065 Portfolio’s commencement of operations.
The trust's Audit Committee has considered non-audit services that were not pre-approved that were provided by Deloitte Entities and PwC to Fund Service Providers to
be compatible with maintaining the independence of Deloitte Entities and PwC in its(their) audit of the Fund(s), taking into account representations from Deloitte Entities and PwC, in accordance with Public Company Accounting Oversight Board rules, regarding its independence from the Fund(s) and its(their) related entities and FMR’s review of the appropriateness and permissibility under applicable law of such non-audit services prior to their provision to the Fund(s) Service Providers.
Audit Committee Pre-Approval Policies and Procedures
The trust’s Audit Committee must pre-approve all audit and non-audit services provided by a fund’s independent registered public accounting firm relating to the operations or financial reporting of the fund. Prior to the commencement of any audit or non-audit services to a fund, the Audit Committee reviews the services to determine whether they are appropriate and permissible under applicable law.
The Audit Committee has adopted policies and procedures to, among other purposes, provide a framework for the Committee’s consideration of non-audit services by the audit firms that audit the Fidelity funds. The policies and procedures require that any non-audit service provided by a fund audit firm to a Fidelity fund and any non-audit service provided by a fund auditor to a Fund Service Provider that relates directly to the operations and financial reporting of a Fidelity fund (“Covered Service”) are subject to approval by the Audit Committee before such service is provided.
All Covered Services must be approved in advance of provision of the service either: (i) by formal resolution of the Audit Committee, or (ii) by oral or written approval of the service by the Chair of the Audit Committee (or if the Chair is unavailable, such other member of the Audit Committee as may be designated by the Chair to act in the Chair’s absence). The approval contemplated by (ii) above is permitted where the Treasurer determines that action on such an engagement is necessary before the next meeting of the Audit Committee.
Non-audit services provided by a fund audit firm to a Fund Service Provider that do not relate directly to the operations and financial reporting of a Fidelity fund are reported to the Audit Committee periodically.
Non-Audit Services Approved Pursuant to Rule 2-01(c)(7)(i)(C) and (ii) of Regulation S-X (“De Minimis Exception”)
There were no non-audit services approved or required to be approved by the Audit Committee pursuant to the De Minimis Exception during the Fund’s(s’) last two fiscal years relating to services provided to (i) the Fund(s) or (ii) any Fund Service Provider that relate directly to the operations and financial reporting of the Fund(s).
Item 5.
Audit Committee of Listed Registrants
Not applicable.
Item 6.
Investments
(a)
Not applicable.
(b)
Not applicable.
Item 7.
Disclosure of Proxy Voting Policies and Procedures for Closed-End Management Investment Companies
Not applicable.
Item 8.
Portfolio Managers of Closed-End Management Investment Companies
Not applicable.
Item 9.
Purchase of Equity Securities by Closed-End Management Investment Company and Affiliated Purchasers
Not applicable.
Item 10.
Submission of Matters to a Vote of Security Holders
There were no material changes to the procedures by which shareholders may recommend nominees to the trust’s Board of Trustees.
Item 11.
Controls and Procedures
(a)(i) The President and Treasurer and the Chief Financial Officer have concluded that the trust’s disclosure controls and procedures (as defined in Rule 30a-3(c) under the Investment Company Act) provide reasonable assurances that material information relating to the trust is made known to them by the appropriate persons, based on their evaluation of these controls and procedures as of a date within 90 days of the filing date of this report.
(a)(ii) There was no change in the trust’s internal control over financial reporting (as defined in Rule 30a-3(d) under the Investment Company Act) that occurred during the period covered by this report that has materially affected, or is reasonably likely to materially affect, the trust’s internal control over financial reporting.
Item 12.
Disclosure of Securities Lending Activities for Closed-End Management
Investment Companies
Not applicable.
Item 13.
Exhibits
SIGNATURES
Pursuant to the requirements of the Securities Exchange Act of 1934 and the Investment Company Act of 1940, the registrant has duly caused this report to be signed on its behalf by the undersigned, thereunto duly authorized.
Variable Insurance Products Fund V
| |
By: | /s/Laura M. Del Prato |
| Laura M. Del Prato |
| President and Treasurer |
|
|
Date: | February 18, 2021 |
Pursuant to the requirements of the Securities Exchange Act of 1934 and the Investment Company Act of 1940, this report has been signed below by the following persons on behalf of the registrant and in the capacities and on the dates indicated.
| |
By: | /s/Laura M. Del Prato |
| Laura M. Del Prato |
| President and Treasurer |
|
|
Date: | February 18, 2021 |
| |
By: | /s/John J. Burke III |
| John J. Burke III |
| Chief Financial Officer |
|
|
Date: | February 18, 2021 |