OMB APPROVAL
OMB Number:
3235-0570
Expires: August
31, 2020
Estimated average
burden hours per
response: 20.6
UNITED STATES
SECURITIES AND EXCHANGE COMMISSION
Washington, D.C. 20549
FORM N-CSR
CERTIFIED SHAREHOLDER REPORT OF REGISTERED MANAGEMENT
INVESTMENT COMPANIES
Investment Company Act file number: 811-05371
Russell Investment Funds
(Exact name of registrant as specified in charter)
1301 2nd Avenue 18th Floor, Seattle Washington 98101
(Address of principal executive offices) (Zip code)
Mary Beth R. Albaneze, Secretary and Chief Legal Officer
1301 2nd Avenue
18th Floor
Seattle, Washington 98101
206-505-4846
______________________________________________
(Name and address of agent for service)
Registrant's telephone number, including area code: 800-787-7354
Date of fiscal year end: December 31
Date of reporting period: January 1, 2017 to December 31, 2017
Item 1. Reports to Stockholders
Russell Investment Funds
Russell Investment Funds is
a series investment company
with nine different investment
portfolios referred to as Funds.
These financial statements report
on five of these Funds.
Russell Investment Funds
Annual Report
December 31, 2017
Table of Contents
|
| Page |
| To Our Shareholders | 3 |
| Market Summary | 4 |
| U. S. Strategic Equity Fund | 9 |
| U. S. Small Cap Equity Fund | 27 |
| International Developed Markets Fund | 49 |
| Strategic Bond Fund | 77 |
| Global Real Estate Securities Fund | 129 |
| Notes to Schedules of Investments | 151 |
| Notes to Financial Highlights | 154 |
| Notes to Financial Statements | 155 |
| Report of Independent Registered Public Accounting Firm | 174 |
| Tax Information | 175 |
| Affiliated Brokerage Transactions | 176 |
| Basis for Approval of Investment Advisory Contracts | 177 |
| Shareholder Requests for Additional Information | 178 |
| Disclosure of Information about Fund Trustees and Officers | 179 |
| Adviser, Money Managers and Service Providers | 184 |
Russell Investment Funds
Copyright © Russell Investments 2018. All rights reserved.
Russell Investments’ ownership is composed of a majority stake held by funds managed by TA Associates with
minority stakes held by funds managed by Reverence Capital Partners and Russell Investments’ management.
Frank Russell Company is the owner of the Russell trademark contained in this material and all trademark rights
related to the Russell trademarks, which the members of the Russell Investment group of companies are permitted
to use under license from Frank Russell Company. The members of the Russell Investments group of companies
are not affiliated in any manner with Frank Russell Company or any entity operation under the “FTSE RUSSELL”
brand.
Fund objectives, risks, charges and expenses should be carefully considered before in-
vesting. A prospectus containing this and other important information must precede or
accompany this material. Please read the prospectus carefully before investing.
Securities distributed through Russell Investments Financial Services, LLC, member FINRA and part
of Russell Investments.
Indices and benchmarks are unmanaged and cannot be invested in directly. Returns represent past performance,
are not a guarantee of future performance, and are not indicative of any specific investment. Index return
information is provided by vendors and although deemed reliable, is not guaranteed by Russell Investments or its
affiliates.
Performance quoted represents past performance and does not guarantee future results. The investment return and
principal value of an investment will fluctuate so that shares, when redeemed, may be worth more or less than their
original cost. Current performance may be lower or higher than the performance data quoted.
To Our Shareholders
Fellow Investors,
Being an investor isn’t always easy. A long-term view, consistency and commitment can be vitally important to wealth
creation. Daily headlines and speculation move markets on a short-term basis. While seemingly amplified today, this
type of noise has been, and always will be, present. Consequently, it remains critical to have a thoughtful financial plan,
realistic goals and timelines, and regular check-ins with your financial advisor.
That said, the past 12 months ending December 31, 2017 have arguably been a relatively tame period in which to be a
patient and resolute investor. We don’t get to say that often so please consider some of these facts:
• All major asset classes were positive from January 1, 2017 to December 31, 2017. Global equity markets were up
double digits, fixed income shareholders were rewarded with price appreciation across the spectrum, and diversifying
real assets contributed, too.
• Volatility, as measured by the CBOE VIX, has been very low relative to historical averages. The calendar year-to-
date as of December 31 has seen the fewest number of 1% daily moves in the S&P500® Index in 30 years.
• Global growth has been steady.
At Russell Investments, we expect a return of market volatility to levels more consistent with historical norms. After all,
the current U.S. stock market rally became the second longest and third strongest on record since 1936 on December 31,
2017. This has led U.S. stocks to become more fully valued. The Cyclically Adjusted Price to Earnings Ratio (CAPE)
stood at 33.2 as of December 2017, putting the U.S. stock market among the most expensive markets since this data
started being tracked in 1926. As the saying goes, “History doesn’t repeat itself, but often it does rhyme.” In past
periods of expensive U.S. equity markets, prices had very little upward potential left—low single digit returns. The
Federal Reserve has begun the process of raising interest rates and unwinding its balance sheet—reversing the years of
accommodative monetary policy instituted in response to the Global Financial Crisis. Even though fixed income markets
have remained resilient so far, the simple math of fixed income suggests that bond prices will come under pressure as
yields continue to rise.
Of course, it’s important to remember that markets and geopolitical events will test investors’ resolve every single year.
The past 12 months’ uncertainty surrounding important elections in France, the United Kingdom, South Korea, and
mounting geopolitical tensions between North Korea and the U.S. were no exception. Exceptional investors, however, are
those who look past the short-term uncertainties and have the commitment to stick with their long-term plan.
In this type of environment, we believe that investors who work with a trusted financial advisor to develop—and stick
with—a financial plan, realistic goals and timelines, will be most resilient. In addition, although diversification can’t
guarantee a profit or avoid losses, experience suggests that globally-diversified multi-asset portfolios further help
investors stay the course when markets get choppy. The following pages provide additional insights on the markets and
the performance of Russell Investments Funds (RIF) for the fiscal year ending December 31, 2017.
Russell Investments has an extensive, proud heritage of providing multi-asset solutions to help investors like you reach
your financial goals, whether you’re saving for retirement, already there or building a college fund. Thank you for the trust
you have placed in our firm. All of us at Russell Investments appreciate the opportunity to help you achieve financial
security.

President and Chief Executive Officer, Russell Investment Funds
1 Represented by Russell 1000® Index up 21.69%, MSCI EAFE Index up 25.03%, MSCI Emerging Markets Index up 37.28% (as of 12/31/2017)
2 Represented by Bloomberg Barclays U.S. Aggregate Bond Index up 3.54%, ICE BofA Merill Lynch Global High Yield Index up 10.20%, Bloomberg
Barclays 1-10 Year Municipal Blend Index up 3.49% (as of 12/31/2017)
3 Represented by Bloomberg Commodity Index up 1.70%, S&P Global Infrastructure Index up 19.07%, FTSE EPRA/NAREIT Developed Index up
10.36%(as of 12/31/2017)
To Our Shareholders 3
Russell Investment Funds
Market Summary as of December 31, 2017 (Unaudited)
U.S. Equity Markets
Broadly measured by the Russell 3000® Index, U.S. stocks returned 21.13% for the one-year period, which is the ninth
straight fiscal year ending December 31st that the Russell 3000® Index has finished with a positive absolute return. The
Russell 3000® Index finished with a positive absolute return in each of the fiscal year’s twelve months.
Within U.S. large capitalization stocks, factors that were rewarded during the fiscal year included high beta (beta is a
measure of a stock’s sensitivity to the direction of the market), high historical earnings growth, and the largest capitalization
stocks. Factors that trailed the market included high dividend yield, low price-to-book ratios, and high earnings variability.
Additionally, dynamic stocks outperformed defensive stocks and growth stocks outperformed value stocks across all
market capitalization tiers excluding mid cap. From a sector perspective, information technology, materials, and consumer
discretionary outperformed the Russell 1000® Index by 16.83%, 2.02%, and 1.69%, respectively. Sectors that failed to find
traction during the one-year period were energy, telecommunication services, and real estate, trailing by 23.25%, 23.20%,
and 11.76%, respectively.
The U.S. large cap equity market started off 2017 very strong with the Russell 3000® Index gaining 5.74% from January
through March. The Fed raised its benchmark interest rate by another 25 basis points in March on the back of positive
economic data. However, the interest rate hike was accompanied by dovish language from the Fed which put into question
how many additional rate hikes there might be in 2017. Additionally, the post-Trump risk rally lost some steam in the
latter stages of the period after the new health care bill failed to repeal and replace Obama Care. Retail sales slowed down
in February, however inflation ticked upward to 2.7% year-over-year. In addition, the February non-farm payrolls figure
beat expectations yet again and pushed the unemployment rate down to 4.7%. The U.S. GDP growth rate was also revised
slightly higher to 2.1% for the fourth quarter of 2016.
The Russell 3000® Index increased 3.02% from April through June. While U.S. economic data came in slightly softer
than expected over the period, it was enough for the Fed to raise its short-term interest rate in June. Over the period,
oil prices trended lower and the U.S. dollar was weak compared to most major currencies. Retail sales slowed down in
May, while inflation also slipped lower to 1.9%, moderately under the Fed’s 2.0% target rate. Meanwhile, May non-farm
payrolls grew less then consensus and the unemployment rate fell to 4.3%. Additionally, the U.S. economy expanded faster
than initially reported during the first quarter (1.4% quarter-over-quarter), following an upward revision to secondary
estimates of 1.2%. The Fed raised short-term interest rates by a further 25 basis points to 1.25% as widely expected
and maintained its forecast for one more rate hike in 2017. Fed Chair Janet Yellen also added that the bank would start
unwinding its $4.5 trillion balance sheet later in the year by reducing reinvestment of maturing bonds.
The Russell 3000® Index climbed 4.57% from July through September. U.S. political uncertainty, escalating geopolitical
tension in the Korean peninsula and tropical hurricanes rattled investors. However, a strengthening economic backdrop
influenced a risk-on market environment which also contributed to the Fed developing a slightly more hawkish outlook.
Over the period, commodity prices stabilized while a sluggish U.S. dollar lifted a basket of global currencies. In the U.S.,
the latest non-farm payrolls figure continued to point towards a healthy jobs market, although the unemployment rate
ticked higher to 4.4%. Retail sales slowed to 3.2% year-over-year, but inflation edged higher to 1.9% year-over-year, still
under the Fed’s 2.0% target rate. However, the second quarter U.S. economic growth rate was finalized at a strong 3.1%
quarter-over-quarter. Toward the end of the quarter, initial details were released on a potential tax reform plan which was
viewed favorably by market participants.
The Russell 3000® Index continued its upward trend ending the October through December time period up 6.34%.
Investors gravitated toward larger market capitalization growth stocks which outpaced most other groups as the third
quarter reporting season surprised to the upside in terms of earnings growth, sales growth, and profit margins. In the
beginning of December, the Fed raised short-term interest rates by a further 25 basis points to 1.50% as widely expected
and maintained its forecast of three additional rate hikes in 2018. Toward the end of the December, the approval of the
much-anticipated tax package also added to the positive sentiment within equity markets. Additionally, incentives to
4 Market Summary
Russell Investment Funds
Market Summary as of December 31, 2017, continued — (Unaudited)
invest and repatriate overseas profits included in the broader tax legislation were viewed as allowing U.S. companies to
more easily pursue growth strategies.
Non-U.S. Developed Equity Markets
For the fiscal year ended December 31, 2017, developed non-U.S. equity markets, as measured by the Russell Developed
ex-U.S. Large Cap® Index (the “Index”), were up 25.46%. Key drivers of market performance were the U.S. presidential
election, improving global growth, especially in emerging markets and the Eurozone, increases in government bond yields
and the Trump administration’s tax reform bill.
Amid the improving global growth outlook, momentum, growth and quality factors had the strongest outperformance during
the fiscal year followed by a modest outperformance of value factor as investors chased cheaper, cyclical stocks and stocks
with high earnings expectations. Sectors with high growth expectations such as technology, industrials and materials were
rewarded during the period while the more defensive sectors such as consumer staples, utilities and health care suffered.
Energy stocks also underperformed as commodity prices continued to face pressure from excess supply.
In the first quarter of the fiscal year, the Fed met expectations and raised its benchmark rate by another 25 basis points in
light of further positive economic data, following a similar rate increase in December 2016. Additionally, a post-Trump risk
rally lost some steam in the latter stages of the period, after President Trump lost support from his own Republican party for
his health care bill. In Europe, UK Prime Minister Theresa May triggered Article 50 to officially start “Brexit” negotiations,
while investors held caution over electoral developments in the Netherlands, France and Germany. Over the period, oil
prices trended lower while a weaker U.S. dollar lifted emerging market currencies. While markets ground higher during
this period, investor sentiment became more cautionary, avoiding areas like energy and materials.
In the second quarter of the fiscal year, U.S. economic data came in slightly softer than expected. However, it was enough
for the Fed to raise its benchmark rate for the second time in 2017. In Europe, Emmanuel Macron became France’s new
President while the general election in the UK resulted in a challenging “hung Parliament”. Over the period, oil prices
continued their trend lower along with a weakening U.S. dollar against a basket of currencies. The easing political tension
in Europe rewarded the value factor and financial companies in particular.
In the third quarter of the fiscal year, U.S. federal political dysfunction, escalating geopolitical tension in the Korean
peninsula and tropical hurricanes rattled investors. However, a strengthening economic backdrop engendered a risk-on
market environment, and informed developed central banks who became more comfortable with a more hawkish outlook.
Over the period, commodity prices stabilized, rewarding energy stocks. The technology sector continued a strong run as
evidence of disruption in traditional sectors such as retail drove investor sentiment.
In the fourth quarter of the fiscal year, U.S. President Donald Trump experienced his first major legislative victory with
a tax reform deal. Furthermore, strong economic growth in the third quarter paved the way for the Fed to raise its key
interest rate for a third time in December from 1.25% to 1.50%. A combination of strong economic growth and positive
expectations from tax reform led the U.S. markets higher during the quarter. Across the Atlantic, British Prime Minister
Theresa May struck a last-minute deal with the EU to move Brexit talks forward and in November the Bank of England
also raised interest rates for the first time in a decade whilst inflation hit 3.1%. Europe ex-UK and the UK were the biggest
underperformers during the quarter.
Emerging markets and Asia ex-Japan were the stand out non-U.S. markets over the fiscal year, as improving economic
fundamentals along with a weaker U.S. dollar were tailwinds. Conversely, the UK, Europe ex-UK and Canada were the
biggest laggards.
Emerging Markets
The Russell Emerging Markets® Index, as measured in U.S. dollar terms (the “Index”), gained 36.3% over the fiscal year
ended December 31, 2017. The asset class remained buoyant in a period where global growth forecasts were upgraded and
Market Summary 5
Russell Investment Funds
Market Summary as of December 31, 2017, continued — (Unaudited)
inflation remained low. Many emerging countries started to see green shoots as they rebounded from their cyclical lows,
benefiting from lower interest rates and improving economic growth. The U.S. dollar weakened against most emerging
market currencies, despite increasing U.S. interest rates. The U.S. Federal Reserve’s approach was more dovish than
expected by the market which benefited emerging market currencies.
The Index surged 11.7% in the first quarter of 2017, outperforming developed markets as investor appetite for perceived
riskier investments returned. India (19.3%) was the strongest-performing country as Prime Minister Modi’s Party won
key state elections, with the victories demonstrating strong domestic support for Modi’s free-market reform programs.
Mexico (16.4%) rebounded where the peso was among the best-performing currencies against the U.S. dollar as the Trump
administration softened its rhetoric towards the country. South Africa (4.4%) underperformed as speculation surrounding
the independence of the Treasury following the removal of respected finance minister Pravin Gordhan and replacement of
nine other cabinet ministers by President Zuma weighed on sentiment and the value of the rand. After its 2016 rally, Russia
(-2.5%) returned some of its strong performance as hopes of potentially warmer relations and easing of sanctions with the
U.S. following Trump’s election victory partially dissipated.
The Index continued its 2017 rally in the second quarter with a 5.6% climb as sentiment towards the asset class remained
buoyant. A weaker U.S. dollar was a further tailwind, although it was another negative and volatile period for the price
of oil. Emerging Europe (ex-Russia) was the best performing region in emerging markets, following the market-friendly
French Presidential election result. This included Hungary (18.9%), Poland (13.5%) and the Czech Republic (13.1%).
Greece was the strongest-performing country after a 31.9% surge. This came as a deal with its creditors on economic
reforms was agreed after protracted negotiations, which enabled the release of the next bailout tranche. Asian countries
also outperformed over the period. Both India (3.3%) and South Africa (2.6%) lagged the overall benchmark return. In
India, first quarter GDP growth was the weakest in two years at 6.1% year-over-year, as the full impact of Prime Minister
Modi’s demonetisation policy began to come through. The government withdrew the 500 and 1000 rupee notes overnight to
crack down on the black market. South Africa underperformed in a period where President Zuma survived his ANC party
vote of no confidence. Natural resource and energy-driven markets were the weakest performing for the quarter as these
sectors underperformed the market, particularly Russia (-9.7%) and Brazil (-6.7%).
The Index increased 7.4% in the third quarter of 2017. Sentiment towards the asset class remained buoyant amid a tepid
global inflation environment. A weaker U.S. dollar and stable oil prices underpinned investor confidence. However, the
market edged lower in September amid a more hawkish outlook from the U.S. Federal Reserve and increased geopolitical
tensions within the Korean peninsula. Brazil (23.5%) rebounded from a weak second quarter driven by the improved
political environment where congress’ lower house voted down corruption charges against President Temer to keep him in
power. China (13.7%) outperformed, driven by Internet stocks, the strongest-performing sector. Russia climbed 15.5% in
a strong period for the energy sector. Elsewhere, Eastern European countries continued their healthy 2017 performance,
including the Czech Republic (11.3%), Hungary (9.7%) and Poland (8.8%) on robust macro numbers. South Korea (1.6%)
was hampered by heightened political tensions between North Korea and the U.S. Mexico (0.8%) underperformed as
NAFTA renegotiations remained strained. The country was also hit by a series of earthquakes which weighed on investor
confidence. Overall, Greece was the worst-performing country ahead of November’s bailout review with its creditors. The
market slipped 8.8% as banking stocks slumped on possible new European Central Bank and International Monetary Fund
stress tests.
The Index increased 7.7% in the final quarter of 2017. South Africa was the standout performer over the period, as
the market surged 21.4% in reaction to political developments. The South African rand strengthened over the period,
boosted by Moody’s maintaining the country’s Baa3 investment-grade rating. India also surged (13.8%) as the government
announced plans to inject $32 billion into state controlled banks. In Korea (13.1%), the government announced plans to
increase spending and raise the minimum wage, which helped to increase consumer confidence to its highest level since
2010. The market was further buoyed by news that South Korea and China agreed to normalize relations following an
6 Market Summary
Russell Investment Funds
Market Summary as of December 31, 2017, continued — (Unaudited)
earlier fallout over the installation of the U.S. anti-missile system in South Korea. Greece (10.6%) recovered from a weak
third quarter, as the government agreed to additional reforms in the latest bailout review with its creditors, which allowed
the release of the next tranche of funds. Mexico (-8.4%) was the worst-performing country, as it continued to suffer from
peso weakness driven by strained discussions on the future of the North American Free Trade Agreement. Brazil (-2.4%)
suffered from weakness in the real. Investors appeared disappointed that the much-anticipated pension reform bill was
watered down and delayed until February 2018.
U.S./Global Fixed Income Markets
The fiscal year ended December 31, 2017 was characterized by a risk on rally that saw both U.S. and European credit
spreads tighten, global growth improve and conducive monetary policies from central banks. Overall, this proved positive
for fixed income sectors around the globe. The U.S. yield curve saw interest rates rise for the fiscal year with the short end
of the curve rising 88 basis points on a 3-month treasury bill, while the 10-year treasury bond interest rate was flat. The
German Bund saw a parallel shift upwards in interest rates during 2017 and the British Gilt saw interest rates rise on the
short end of the curve and fall on the longer end. The U.S. experienced the largest interest rate moves as the U.S. Federal
Reserve (the “Fed”) raised interest rates three times during the year. Europe had historically low interest rates during the
fiscal year as the European Central Bank (“ECB”) kept rates low and continued with their quantitative easing program,
although it was cut in half to 30 billion euros per month in October. Corporate and high yield spreads grinded tighter on
the back of strong demand and the positive global growth backdrop. A key indicator of global fixed income performance,
the Bloomberg Barclays Global Aggregate Bond Index, returned 7.39% for the fiscal year, in U.S. dollar-hedged terms. The
index had a strong year due to increasing demand, monetary policy remaining accommodative, and the lack of geopolitical
fears being realized.
The Bloomberg Barclays Pan-European Aggregate Bond Index returned 14.21% during the period in U.S. dollar-hedged
terms, but most of that return was due to the euro appreciating 14.15% against the U.S. dollar. The U.S., in comparison,
returned 3.54% during the fiscal year as measured by the Bloomberg Barclays U.S. Aggregate Bond Index. In Europe,
treasuries underperformed the aggregate while financials in the corporate sector was a leading segment. In the U.S.,
the corporate market performed strongly led by lower quality bonds and strong demand from oversees. The U.S. dollar
depreciated against most European currencies, due to improving growth across Europe and the victory of political
candidates that support the European Union.
In the U.S., economic data remained broadly positive, with solid nonfarm payroll gains and a steady decline in the
unemployment rate to decade lows of 4.1%. Gross domestic product (“GDP”) growth had readings over 3.0% for both the
second and third quarter 2017, after it had dipped below 1.5% in the first quarter of 2017. The Consumer Price Index
(“CPI”) started the fiscal year strong at above 2.0% and was a contributing factor as the Fed raised rates, but as the CPI
fell during the year below the Fed’s long-term target of 2.0%, it becomes the Fed’s largest concern.
In Europe, the concerns about a “hard Brexit” diminished over the period, while most of Europe welcomed Emmanuel
Macron’s victory in the French presidential elections. The Bloomberg Barclays Euro Aggregate Corporate Index returned
3.5% over equivalent duration government bonds during the period as financials improved and GDP rose from 1.4% to
2.3% during the fiscal year. The European banking sector had a setback in 2nd quarter 2017 as three banks declared
bankruptcy.
Emerging markets were one of the strongest sectors in 2017 as the U.S. dollar depreciated, global growth was above-
trend and major central bank monetary policy settings were accommodative. Emerging market (“EM”) debt outperformed
developed markets (the Bloomberg Barclays EM Hard Currency Aggregate Bond Index returned 9.61%) as there was
high demand for yield. Local currency EM bonds (those issued in the issuing country’s own currency) were extremely
strong (the Bloomberg Barclays EM Local Currency Government Bond Index returned 14.27%) due to the depreciation of
the U.S. dollar versus a basket of emerging market currencies. The Czech koruna and Polish zloty both appreciated over
Market Summary 7
Russell Investment Funds
Market Summary as of December 31, 2017, continued — (Unaudited)
20% during the year as the koruna was unpegged from the euro and the zloty appreciated on the back of the strong Polish
economy and the appreciation in the euro.
Strong global corporate new issuance volumes continued in the fiscal year along with seemingly endless demand from
overseas buyers. Overall, corporate credit was up globally (the Bloomberg Barclays Global Aggregate Corporate Bond
Index returned 9.09%), with particularly strong performance out of the utilities sector of the market. The best performers
in the index were lower quality issues (BBB cohorts and below), longer maturities (7+ years) and higher beta countries
(Austria and Italy).
High yield corporate credit was among the best-performing segments of the global market (the Bloomberg Barclays Global
High Yield Bond Index returned 10.43%). High yield spreads tightened over the fiscal year due to the strong global
economy and investors searching for the slightest advantage in yields. The interest coverage ratio improved over the year
while the default rate for high yield securities fell, which were both positive factors.
8 Market Summary
Russell Investment Funds
U.S. Strategic Equity Fund
Portfolio Management Discussion and Analysis — December 31, 2017 (Unaudited)
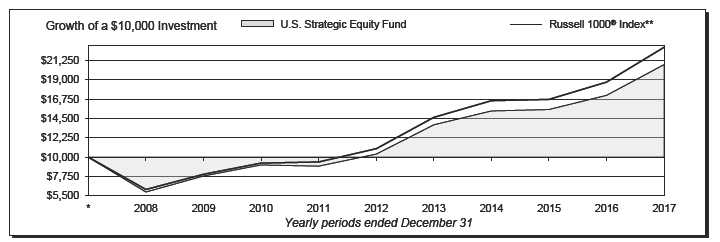
| | | | | | | |
| U. S. Strategic Equity Fund | | | | Russell 1000® Index** | | | |
| | | Total | | | | Total | |
| | | Return | | | | Return | |
| 1 Year | | 20.80 | % | 1 Year | | 21.69 | % |
| 5 Years | | 14.94 | %§ | 5 Years | | 15.71 | %§ |
| 10 Years | | 7.59 | %§ | 10 Years | | 8.59 | %§ |
U.S. Strategic Equity Fund 9
Russell Investment Funds
U.S. Strategic Equity Fund
Portfolio Management Discussion and Analysis, continued — December 31, 2017
(Unaudited)
| |
| The U. S. Strategic Equity Fund (the “Fund”) employs a multi- | value stocks across all market capitalization tiers excluding mid |
| manager approach whereby portions of the Fund are allocated | cap. From a sector perspective, information technology, materials, |
| to different money manager strategies. Fund assets not allocated | and consumer discretionary outperformed the Russell 1000® |
| to money managers are managed by Russell Investment | Index by 16.83%, 2.02%, and 1.69%, respectively. Sectors that |
| Management, LLC (“RIM”), the Fund’s advisor. RIM may change | failed to find traction during the one-year period were energy, |
| the allocation of the Fund’s assets among money managers at | telecommunication services, and real estate, trailing by 23.25%, |
| any time. An exemptive order from the Securities and Exchange | 23.20%, and 11.76%, respectively. |
| Commission (“SEC”) permits RIM to engage or terminate a money | |
| manager at any time, subject to approval by the Fund’s Board, | How did the investment strategies and techniques employed |
| without a shareholder vote. Pursuant to the terms of the exemptive | by the Fund and its money managers affect its benchmark- |
| order, the Fund is required to notify its shareholders within 90 | relative performance? |
| days of when a money manager begins providing services. As of | The Fund’s factor exposures detracted from benchmark-relative |
| December 31, 2017, the Fund had five money managers. | performance over the period, including tilts away from stocks with |
| | high valuations (high price-to-book ratios) and the largest market |
| What is the Fund’s investment objective? | capitalization stocks. However, a tilt away from stocks with high |
| The Fund seeks to provide long term capital growth. | financial leverage (high debt-to-capital ratios) was beneficial and |
| |
| How did the Fund perform relative to its benchmark for the | helped to mitigate some of the underperformance. Industry group |
| fiscal year ended December 31, 2017? | allocation decisions also detracted, including an overweight |
| | to insurance and an underweight to technology hardware & |
| For the fiscal year ended December 31, 2017, the Fund gained | equipment. Stock selection within the industrials, real estate, and |
| 20.80%. This is compared to the Fund’s benchmark, the Russell | consumer staples sectors contributed positively to performance |
| 1000® Index, which gained 21.69% during the same period. The | over the one-year period. |
| Fund’s performance includes operating expenses, whereas index | |
| returns are unmanaged and do not include expenses of any kind. | The Fund employs discretionary and non-discretionary money |
| | managers. The Fund’s discretionary money managers select the |
| For the fiscal year ended December 31, 2017, the Morningstar® | individual portfolio securities for the assets assigned to them. |
| Insurance Large Blend Category, a group of funds that Morningstar | The Fund’s non-discretionary money managers provide a model |
| considers to have investment strategies similar to those of the | portfolio to RIM representing their investment recommendations, |
| Fund, gained 21.28%. This result serves as a peer comparison | based upon which RIM purchases and sells securities for the |
| and is expressed net of operating expenses. | Fund. Fund assets not allocated to discretionary money managers |
| RIM may assign a money manager a specific style or | include assets managed by RIM based upon model portfolios |
| capitalization benchmark other than the Fund’s index. However, | provided by non-discretionary money managers, the Fund’s cash |
| the Fund’s primary index remains the benchmark for the Fund | balances and assets which may be managed directly by RIM to |
| and is representative of the aggregate of each money manager’s | effect the Fund’s investment strategies and/or to actively manage |
| benchmark index. | the Fund’s overall exposures by investing in securities or other |
| | instruments that RIM believes will achieve the desired risk/ |
| How did the market conditions described in the Market | return profile for the Fund. |
| Summary report affect the Fund’s performance? | |
| Broadly measured by the Russell 3000® Index, U. S. stocks | With respect to certain of the Fund’s money managers, William |
| returned 21.13% for the one-year period, which is the ninth | Blair Investment Management, LLC was the best performing |
| straight calendar year that the Russell 3000® Index has finished | manager for the period and outperformed the Russell 1000® |
| with a positive absolute return. The Russell 3000® Index finished | Growth Index. Factor exposures were rewarded, including a tilt |
| with a positive absolute return in each of the calendar year’s | toward high forecasted growth and a tilt away from high financial |
| twelve months. | leverage (high debt-to-capital ratios) . Stock selection within the |
| | information technology, real estate, and health care sectors was |
| Within U. S. large capitalization stocks, factors that were rewarded | notably beneficial. |
| during the calendar year included high beta (beta is a measure of | |
| a stock’s sensitivity to the direction of the market), high historical | Jacobs Levy Equity Management, Inc. had the lowest absolute |
| earnings growth, and the largest capitalization stocks. Factors that | return for the period, although they still outperformed the |
| trailed the market included high dividend yield, low price-to-book | Russell 1000® Value Index. Factor exposures were rewarded, |
| ratios, and high earnings variability. Additionally, dynamic stocks | including a tilt toward high beta stocks and a tilt away from the |
| outperformed defensive stocks and growth stocks outperformed | highest dividend yield stocks. An overweight to the information |
10 U.S. Strategic Equity Fund
Russell Investment Funds
U.S. Strategic Equity Fund
Portfolio Management Discussion and Analysis, continued — December 31, 2017
(Unaudited)
| | |
| technology sector and an underweight to the consumer staples | | |
| sector contributed positively to performance. Stock selection | There were no changes to the Fund’s structure or the money |
| within the financials, health care, and consumer staples sectors | manager line up during the calendar year. |
| detracted. | | |
| | Money Managers as of December 31, |
| RIM manages a 14% (effective December 31, 2017) strategic | 2017 | Styles |
| allocation to a positioning strategy to seek to achieve the desired | | |
| | Barrow, Hanley, Mewhinney & Strauss, LLC Value |
| risk/return profile for the Fund. The positioning strategy utilizes | Jacobs Levy Equity Management, Inc. | Value |
| the output from a quantitative model to seek to position the portfolio | Mar Vista Investment Partners, LLC | Market-Oriented |
| to meet RIM’s overall preferred positioning. The positioning | Suffolk Capital Management LLC | Market-Oriented |
| strategy underperformed the Russell 1000® Index during the | William Blair Investment Management, LLC Growth |
| one-year period. Factor exposures were mixed, as a tilt toward | The views expressed in this report reflect those of the |
| the largest market capitalization stocks was rewarded while a tilt | portfolio managers only through the end of the period |
| away from the highest beta stocks detracted. Overweights to the | covered by the report. These views do not necessarily |
| telecommunication services and consumer staples sectors notably | represent the views of RIM, or any other person in RIM or |
| detracted during the year. | any other affiliated organization. These views are subject to |
| During the period, RIM used index futures contracts to equitize | change at any time based upon market conditions or other |
| the Fund’s cash. The decision to equitize the Fund’s cash was | events, and RIM disclaims any responsibility to update the |
| beneficial to the Fund’s absolute performance for the calendar | views contained herein. These views should not be relied |
| year as the market had a positive absolute return. | on as investment advice and, because investment decisions |
| | for a Russell Investment Funds (“RIF”) Fund are based on |
| Describe any changes to the Fund’s structure or the money | numerous factors, should not be relied on as an indication |
| manager line-up. | of investment decisions of any RIF Fund. |
* Assumes initial investment on January 1, 2008.
** The Russell 1000® Index includes the 1,000 largest companies in the Russell 3000® Index. The Russell 1000® Index represents the universe of stocks from
which most active money managers typically select. The Russell 1000® Index return reflects adjustments from income dividends and capital gain distributions
reinvested as of the ex-dividend dates.
§ Annualized.
The performance shown in this section does not reflect any Insurance Company Separate Account or Policy Charges. Performance is historical and assumes
reinvestment of all dividends and capital gains. Investment return and principal value will fluctuate so that an investor’s shares, when redeemed, may be worth more
or less than when purchased. Past performance is not indicative of future results. Additionally, the returns presented herein may differ from the performance reported
in the Financial Highlights as the returns herein are calculated in a manner consistent with standardized performance in accordance with Securities and Exchange
Commission rules, while the performance in the Financial Highlights has been calculated in accordance with U.S. Generally Accepted Accounting Principles (“U.S.
GAAP”).
U.S. Strategic Equity Fund 11
Russell Investment Funds
U.S. Strategic Equity Fund
Shareholder Expense Example — December 31, 2017 (Unaudited)
| | | | | | | |
| Fund Expenses | Please note that the expenses shown in the table are meant |
| The following disclosure provides important information | to highlight your ongoing costs only and do not reflect any |
| regarding the Fund’s Shareholder Expense Example | transactional costs. Therefore, the information under the heading |
| (“Example”) . | “Hypothetical Performance (5% return before expenses)” is |
| | useful in comparing ongoing costs only, and will not help you |
| Example | determine the relative total costs of owning different funds. In |
| As a shareholder of the Fund, you incur two types of costs: (1) | addition, if these transactional costs were included, your costs |
| transaction costs, and (2) ongoing costs, including advisory and | would have been higher. The fees and expenses shown in this |
| administrative fees and other Fund expenses. The Example is | section do not reflect any Insurance Company Separate Account |
| intended to help you understand your ongoing costs (in dollars) | Policy Charges. | | | | | | |
| of investing in the Fund and to compare these costs with the | | | | | | Hypothetical |
| ongoing costs of investing in other mutual funds. The Example | | | | | | Performance (5% |
| is based on an investment of $1,000 invested at the beginning of | | | | Actual | | return before |
| the period and held for the entire period indicated, which for this | | | Performance | | | expenses) |
| | Beginning Account Value | | | | | | |
| Fund is from July 1, 2017 to December 31, 2017. | July 1, 2017 | | $ | 1,000.00 | | $ | 1,000.00 |
| | Ending Account Value | | | | | | |
| Actual Expenses | December 31, 2017 | | $ | 1,108.30 | | $ | 1,020.97 |
| The information in the table under the heading “Actual | Expenses Paid During Period* | | $ | 4.46 | | $ | 4.28 |
| Performance” provides information about actual account values | | | | | | | |
| and actual expenses. You may use the information in this column, | * Expenses are equal to the Fund's annualized expense ratio of 0.84% |
| | (representing the six month period annualized), multiplied by the average |
| together with the amount you invested, to estimate the expenses | account value over the period, multiplied by 184/365 (to reflect the one-half |
| that you paid over the period. Simply divide your account value by | year period) . | | | | | | |
| $1,000 (for example, an $8,600 account value divided by $1,000 | | | | | | | |
| = 8.6), then multiply the result by the number in the first column | | | | | | | |
| in the row entitled “Expenses Paid During Period” to estimate | | | | | | | |
| the expenses you paid on your account during this period. | | | | | | | |
| |
| Hypothetical Example for Comparison Purposes | | | | | | | |
| The information in the table under the heading “Hypothetical | | | | | | | |
| Performance (5% return before expenses)” provides information | | | | | | | |
| about hypothetical account values and hypothetical expenses | | | | | | | |
| based on the Fund’s actual expense ratio and an assumed rate of | | | | | | | |
| return of 5% per year before expenses, which is not the Fund’s | | | | | | | |
| actual return. The hypothetical account values and expenses | | | | | | | |
| may not be used to estimate the actual ending account balance or | | | | | | | |
| expenses you paid for the period. You may use this information | | | | | | | |
| to compare the ongoing costs of investing in the Fund and other | | | | | | | |
| funds. To do so, compare this 5% hypothetical example with the | | | | | | | |
| 5% hypothetical examples that appear in the shareholder reports | | | | | | | |
| of other funds. | | | | | | | |
12 U.S. Strategic Equity Fund
Russell Investment Funds
U.S. Strategic Equity Fund
Schedule of Investments — December 31, 2017
| | | | | | | |
| Amounts in thousands (except share amounts) | | Amounts in thousands (except share amounts) | |
| | | Principal | Fair | | | Principal | Fair |
| | Amount ($) or | Value | | Amount ($) or | Value |
| | | Shares | $ | | | Shares | $ |
| Common Stocks - 93.8% | | | | Molson Coors Brewing Co. Class B | | 2,827 | 232 |
| Consumer Discretionary - 9.6% | | | | Mondelez International, Inc. Class A | | 70,423 | 3,014 |
| Amazon. com, Inc. (Æ) | | 6,380 | 7,461 | Monster Beverage Corp. (Æ) | | 36,026 | 2,280 |
| Aramark | | 3,161 | 135 | PepsiCo, Inc. | | 26,997 | 3,238 |
| Arconic, Inc. | | 9,900 | 270 | Philip Morris International, Inc. | | 51,187 | 5,408 |
| Brunswick Corp. | | 2,400 | 133 | Procter & Gamble Co. (The) | | 2,500 | 230 |
| Carnival Corp. | | 8,393 | 557 | Tyson Foods, Inc. Class A | | 12,634 | 1,024 |
| Carter's, Inc. | | 315 | 37 | Unilever NV | | 48,476 | 2,729 |
| CBS Corp. Class B | | 20,826 | 1,229 | | | | |
| Cooper-Standard Holdings, Inc. (Æ) | | 3,030 | 371 | | | | 24,311 |
| Dollar Tree, Inc. (Æ) | | 33,020 | 3,543 | | | | |
| DR Horton, Inc. | | 26,561 | 1,357 | Energy - 7.2% | | | |
| | | | | Anadarko Petroleum Corp. | | 10,300 | 552 |
| eBay, Inc. (Æ) | | 13,784 | 520 | Andeavor(Æ) | | 2,041 | 233 |
| Estee Lauder Cos. , Inc. (The) Class A | | 13,187 | 1,678 | Arch Coal, Inc. (Æ) | | 6,000 | 559 |
| Ford Motor Co. | | 104,200 | 1,301 | BP PLC - ADR | | 58,018 | 2,438 |
| Fortune Brands Home & Security, Inc. | | 463 | 32 | Chevron Corp. | | 47,479 | 5,945 |
| GameStop Corp. Class A | | 2,573 | 46 | Cimarex Energy Co. | | 3,130 | 382 |
| Garmin, Ltd. | | 1,124 | 67 | ConocoPhillips | | 17,298 | 949 |
| General Motors Co. | | 38,178 | 1,565 | Core Laboratories NV | | 16,779 | 1,838 |
| Goodyear Tire & Rubber Co. (The) | | 1,155 | 37 | EOG Resources, Inc. | | 12,293 | 1,327 |
| Graham Holdings Co. Class B | | 565 | 315 | Exxon Mobil Corp. | | 57,602 | 4,819 |
| Home Depot, Inc. (The) | | 5,713 | 1,083 | First Solar, Inc. (Æ) | | 9,232 | 623 |
| Hyatt Hotels Corp. Class A(Æ) | | 1,392 | 102 | Kosmos Energy, Ltd. (Æ) | | 10,300 | 71 |
| International Game Technology PLC | | 4,100 | 109 | Marathon Petroleum Corp. | | 20,439 | 1,348 |
| Lear Corp. | | 942 | 166 | National Oilwell Varco, Inc. | | 27,900 | 1,005 |
| Madison Square Garden Co. (The) Class A(Æ) | 4,240 | 894 | Occidental Petroleum Corp. | | 39,685 | 2,924 |
| McDonald's Corp. | | 7,352 | 1,266 | Peabody Energy Corp. (Æ) | | 5,100 | 201 |
| MGM Resorts International | | 36,081 | 1,205 | Phillips 66 | | 26,001 | 2,630 |
| Michael Kors Holdings, Ltd. (Æ) | | 8,800 | 554 | Royal Dutch Shell PLC Class A - ADR | | 18,760 | 1,251 |
| Netflix, Inc. (Æ) | | 4,101 | 787 | Schlumberger, Ltd. | | 26,825 | 1,808 |
| NVR, Inc. (Æ) | | 12 | 42 | Transocean, Ltd. (Æ) | | 16,052 | 171 |
| O'Reilly Automotive, Inc. (Æ) | | 5,492 | 1,321 | Valero Energy Corp. | | 18,246 | 1,677 |
| PulteGroup, Inc. | | 5,088 | 169 | World Fuel Services Corp. | | 11,673 | 328 |
| PVH Corp. | | 1,741 | 239 | | | | |
| Service Corp. International | | 4,222 | 158 | | | | 33,079 |
| Sirius XM Holdings, Inc. | | 76,900 | 412 | | | | |
| Starbucks Corp. | | 74,327 | 4,269 | Financial Services - 21.2% | | | |
| Tapestry, Inc. | | 24,468 | 1,082 | Affiliated Managers Group, Inc. | | 7,564 | 1,553 |
| Target Corp. | | 18,576 | 1,212 | Aflac, Inc. | | 1,759 | 154 |
| Time Warner, Inc. | | 6,729 | 616 | Allstate Corp. (The) | | 12,055 | 1,262 |
| Vail Resorts, Inc. | | 4,377 | 930 | Ally Financial, Inc. | | 7,074 | 206 |
| Wal-Mart Stores, Inc. | | 33,222 | 3,281 | American Express Co. | | 27,138 | 2,695 |
| Walt Disney Co. (The) | | 28,725 | 3,088 | American International Group, Inc. | | 22,200 | 1,323 |
| Whirlpool Corp. | | 3,221 | 543 | American National Insurance Co. | | 1,044 | 134 |
| Yum China Holdings, Inc. | | 7,774 | 311 | American Tower Corp. (ö) | | 27,755 | 3,960 |
| | | | | Aspen Insurance Holdings, Ltd. | | 13,100 | 532 |
| | | | 44,493 | Assured Guaranty, Ltd. | | 3,619 | 123 |
| | | | | Athene Holding, Ltd. Class A(Æ) | | 8,410 | 435 |
| Consumer Staples - 5.3% | | | | Axis Capital Holdings, Ltd. | | 10,980 | 552 |
| Altria Group, Inc. | | 25,163 | 1,797 | Bank of America Corp. | | 187,858 | 5,545 |
| Archer-Daniels-Midland Co. | | 31,532 | 1,264 | Bank of New York Mellon Corp. (The) | | 12,949 | 697 |
| Bunge, Ltd. | | 15,537 | 1,042 | BB&T Corp. | | 823 | 41 |
| Coca-Cola Co. (The) | | 3,242 | 149 | Berkshire Hathaway, Inc. Class B(Æ) | | 31,846 | 6,313 |
| Colgate-Palmolive Co. | | 7,100 | 536 | Broadridge Financial Solutions, Inc. | | 3,297 | 299 |
| Constellation Brands, Inc. Class A | | 3,458 | 790 | Capital One Financial Corp. | | 22,983 | 2,288 |
| Hershey Co. (The) | | 293 | 33 | Cboe Global Markets, Inc. | | 3,020 | 376 |
| Ingredion, Inc. | | 1,485 | 208 | CBRE Group, Inc. Class A(Æ) | | 5,700 | 247 |
| JM Smucker Co. (The) | | 836 | 104 | Citigroup, Inc. | | 30,530 | 2,271 |
| Kraft Heinz Co. (The) | | 2,990 | 233 | Citizens Financial Group, Inc. | | 18,330 | 769 |
See accompanying notes which are an integral part of the financial statements.
U.S. Strategic Equity Fund 13
Russell Investment Funds
U.S. Strategic Equity Fund
Schedule of Investments, continued — December 31, 2017
| | | | | | | |
| Amounts in thousands (except share amounts) | | Amounts in thousands (except share amounts) | |
| | | Principal | Fair | | | Principal | Fair |
| | Amount ($) or | Value | | Amount ($) or | Value |
| | | Shares | $ | | | Shares | $ |
| Comerica, Inc. | | 9,800 | 851 | Align Technology, Inc. (Æ) | | 463 | 103 |
| Discover Financial Services | | 14,200 | 1,092 | Allergan PLC(Æ) | | 13,726 | 2,246 |
| Duke Realty Corp. (ö) | | 16,800 | 457 | Allscripts Healthcare Solutions, Inc. (Æ) | | 27,228 | 396 |
| Dun & Bradstreet Corp. (The) | | 2,290 | 271 | Amgen, Inc. | | 1,385 | 241 |
| E*Trade Financial Corp. (Æ) | | 18,798 | 931 | Anthem, Inc. (Æ) | | 7,903 | 1,778 |
| Equity Residential(ö) | | 15,000 | 957 | Baxter International, Inc. | | 21,144 | 1,367 |
| Essex Property Trust, Inc. (ö) | | 2,810 | 678 | Becton Dickinson and Co. | | 796 | 170 |
| Fidelity National Information Services, Inc. | | 3,151 | 296 | Biogen, Inc. (Æ) | | 3,857 | 1,229 |
| First Republic Bank | | 12,433 | 1,077 | Bio-Rad Laboratories, Inc. Class A(Æ) | | 1,077 | 257 |
| Fiserv, Inc. (Æ) | | 1,154 | 151 | Bio-Techne Corp. (Æ) | | 2,190 | 284 |
| Global Payments, Inc. | | 301 | 30 | Bristol-Myers Squibb Co. | | 17,000 | 1,042 |
| Goldman Sachs Group, Inc. (The) | | 6,024 | 1,535 | Bruker Corp. | | 7,764 | 266 |
| Hartford Financial Services Group, Inc. | | 38,365 | 2,159 | Cardinal Health, Inc. | | 28,250 | 1,731 |
| HCP, Inc. (ö) | | 44,856 | 1,170 | Celgene Corp. (Æ) | | 11,930 | 1,245 |
| Intercontinental Exchange, Inc. | | 23,605 | 1,666 | Centene Corp. (Æ) | | 3,074 | 310 |
| Jack Henry & Associates, Inc. | | 2,035 | 238 | Cerner Corp. (Æ) | | 461 | 31 |
| JPMorgan Chase & Co. | | 73,364 | 7,845 | Charles River Laboratories International, | | | |
| KeyCorp | | 96,386 | 1,944 | Inc. (Æ) | | 440 | 48 |
| Lazard, Ltd. Class A | | 1,027 | 54 | Cigna Corp. | | 2,043 | 415 |
| Leucadia National Corp. | | 2,750 | 73 | Eli Lilly & Co. | | 3,086 | 261 |
| Loews Corp. | | 33,441 | 1,673 | Endo International PLC(Æ) | | 17,300 | 134 |
| M&T Bank Corp. | | 6,996 | 1,196 | Envision Healthcare Corp. (Æ) | | 1,995 | 69 |
| Markel Corp. (Æ) | | 3,724 | 4,241 | Express Scripts Holding Co. (Æ) | | 20,655 | 1,542 |
| MasterCard, Inc. Class A | | 18,140 | 2,745 | Gilead Sciences, Inc. | | 2,536 | 182 |
| MetLife, Inc. | | 7,600 | 384 | Henry Schein, Inc. (Æ) | | 866 | 61 |
| Moody's Corp. | | 15,854 | 2,340 | Humana, Inc. | | 3,008 | 747 |
| Morgan Stanley | | 20,371 | 1,069 | Illumina, Inc. (Æ) | | 388 | 85 |
| Morningstar, Inc. | | 959 | 93 | Intuitive Surgical, Inc. (Æ) | | 525 | 192 |
| Nasdaq, Inc. | | 1,319 | 101 | Johnson & Johnson | | 52,684 | 7,359 |
| New York Community Bancorp, Inc. | | 30,744 | 400 | Laboratory Corp. of America Holdings(Æ) | | 1,642 | 262 |
| Northern Trust Corp. | | 11,300 | 1,129 | LifePoint Health, Inc. (Æ) | | 2,447 | 122 |
| PayPal Holdings, Inc. (Æ) | | 3,501 | 258 | Mallinckrodt PLC(Æ) | | 6,400 | 144 |
| PNC Financial Services Group, Inc. (The) | | 15,219 | 2,196 | McKesson Corp. | | 8,974 | 1,400 |
| Popular, Inc. | | 10,200 | 362 | Medtronic PLC | | 11,354 | 916 |
| Progressive Corp. (The) | | 39,356 | 2,217 | Merck & Co. , Inc. | | 77,999 | 4,387 |
| Prudential Financial, Inc. | | 11,400 | 1,311 | PerkinElmer, Inc. | | 3,848 | 281 |
| Reinsurance Group of America, Inc. Class A | 5,320 | 830 | Pfizer, Inc. | | 71,691 | 2,596 |
| Santander Consumer USA Holdings, Inc. | | 5,900 | 110 | Qiagen NV(Æ) | | 5,854 | 181 |
| SBA Communications Corp. (Æ)(ö) | | 7,655 | 1,251 | Quest Diagnostics, Inc. | | 2,546 | 251 |
| SL Green Realty Corp. (ö) | | 8,500 | 858 | Sage Therapeutics, Inc. (Æ) | | 3,064 | 505 |
| State Street Corp. | | 37,062 | 3,617 | Sanofi - ADR | | 23,603 | 1,015 |
| SunTrust Banks, Inc. | | 18,916 | 1,222 | Steris PLC | | 967 | 85 |
| Total System Services, Inc. | | 1,968 | 156 | Stryker Corp. | | 5,794 | 898 |
| US Bancorp | | 49,974 | 2,678 | Teleflex, Inc. | | 204 | 51 |
| Vantiv, Inc. Class A(Æ) | | 841 | 62 | Thermo Fisher Scientific, Inc. | | 1,442 | 274 |
| Visa, Inc. Class A | | 21,138 | 2,411 | United Therapeutics Corp. (Æ) | | 355 | 53 |
| Voya Financial, Inc. | | 18,600 | 920 | UnitedHealth Group, Inc. | | 21,024 | 4,634 |
| Wells Fargo & Co. | | 84,986 | 5,157 | Universal Health Services, Inc. Class B | | 1,799 | 204 |
| XL Group, Ltd. | | 51,040 | 1,795 | Varian Medical Systems, Inc. (Æ) | | 296 | 33 |
| | | | 98,032 | WellCare Health Plans, Inc. (Æ) | | 2,728 | 549 |
| | | | | West Pharmaceutical Services, Inc. | | 302 | 30 |
| Health Care - 10.6% | | | | Zoetis, Inc. Class A | | 38,184 | 2,750 |
| Abbott Laboratories | | 20,470 | 1,168 | | | | 48,738 |
| AbbVie, Inc. | | 1,025 | 99 | | | | |
| Aerie Pharmaceuticals, Inc. (Æ) | | 20,514 | 1,226 | Materials and Processing - 3.0% | | | |
| Aetna, Inc. | | 1,047 | 189 | Ashland Global Holdings, Inc. | | 11,909 | 848 |
| Agilent Technologies, Inc. | | 3,391 | 227 | Ball Corp. (Æ) | | 1,475 | 56 |
| Akorn, Inc. (Æ) | | 12,929 | 417 | Berry Plastics Group, Inc. (Æ) | | 2,443 | 143 |
See accompanying notes which are an integral part of the financial statements.
14 U.S. Strategic Equity Fund
Russell Investment Funds
U.S. Strategic Equity Fund
Schedule of Investments, continued — December 31, 2017
| | | | | | | |
| Amounts in thousands (except share amounts) | | Amounts in thousands (except share amounts) | |
| | | Principal | Fair | | | Principal | Fair |
| | Amount ($) or | Value | | Amount ($) or | Value |
| | | Shares | $ | | | Shares | $ |
| Celanese Corp. Class A | | 9,350 | 1,001 | IHS Markit, Ltd. (Æ) | | 4,998 | 226 |
| Crown Holdings, Inc. (Æ) | | 1,009 | 57 | Jacobs Engineering Group, Inc. | | 12,500 | 825 |
| Domtar Corp. | | 5,152 | 255 | JB Hunt Transport Services, Inc. | | 291 | 33 |
| DowDuPont, Inc. | | 32,919 | 2,345 | Johnson Controls International PLC(Æ) | | 52,258 | 1,992 |
| Ecolab, Inc. | | 18,173 | 2,439 | Kansas City Southern | | 13,122 | 1,381 |
| Hexcel Corp. | | 14,344 | 887 | Kirby Corp. (Æ) | | 989 | 66 |
| Huntsman Corp. | | 3,100 | 103 | Korn/Ferry International | | 1,600 | 66 |
| International Flavors & Fragrances, Inc. | | 1,272 | 194 | L3 Technologies, Inc. | | 1,795 | 355 |
| LyondellBasell Industries NV Class A | | 652 | 72 | Landstar System, Inc. | | 311 | 32 |
| Monsanto Co. | | 3,476 | 406 | Lockheed Martin Corp. | | 2,452 | 787 |
| NewMarket Corp. | | 76 | 30 | ManpowerGroup, Inc. | | 8,466 | 1,067 |
| Owens Corning | | 11,871 | 1,091 | Mettler-Toledo International, Inc. (Æ) | | 3,217 | 1,993 |
| Packaging Corp. of America | | 266 | 32 | Navistar International Corp. (Æ) | | 1,300 | 56 |
| PPG Industries, Inc. | | 9,970 | 1,165 | Norfolk Southern Corp. | | 14,873 | 2,155 |
| Praxair, Inc. | | 16,479 | 2,549 | Northrop Grumman Corp. | | 1,763 | 541 |
| Sonoco Products Co. | | 1,238 | 66 | Old Dominion Freight Line, Inc. | | 828 | 109 |
| Tahoe Resources, Inc. | | 60,615 | 290 | Orbital ATK, Inc. | | 1,927 | 253 |
| | | | 14,029 | Paychex, Inc. | | 2,275 | 155 |
| | | | | Quanta Services, Inc. (Æ) | | 40,053 | 1,567 |
| Producer Durables - 16.7% | | | | Raytheon Co. | | 28,893 | 5,428 |
| 3M Co. | | 1,561 | 367 | Republic Services, Inc. Class A | | 1,807 | 122 |
| Accenture PLC Class A | | 15,138 | 2,318 | Rockwell Automation, Inc. | | 6,471 | 1,271 |
| Adient PLC | | 11,619 | 914 | Rockwell Collins, Inc. | | 4,166 | 565 |
| AECOM(Æ) | | 32,632 | 1,212 | Roper Technologies, Inc. | | 10,766 | 2,788 |
| AGCO Corp. | | 13,400 | 957 | Rush Enterprises, Inc. Class A(Æ) | | 3,100 | 158 |
| Ametek, Inc. | | 3,201 | 232 | Ryder System, Inc. | | 5,300 | 446 |
| Automatic Data Processing, Inc. | | 1,136 | 133 | Sensata Technologies Holding NV(Æ) | | 48,164 | 2,462 |
| Avery Dennison Corp. | | 2,564 | 295 | Southwest Airlines Co. | | 25,342 | 1,659 |
| Babcock & Wilcox Co. (The) Class W(Æ) | | 3,708 | 224 | Spirit AeroSystems Holdings, Inc. Class A | | 2,829 | 247 |
| Boeing Co. (The) | | 5,182 | 1,529 | Square, Inc. Class A(Æ) | | 2,189 | 76 |
| Booz Allen Hamilton Holding Corp. Class A | | 1,868 | 71 | Stanley Black & Decker, Inc. | | 11,728 | 1,990 |
| Carlisle Cos. , Inc. | | 277 | 31 | Teledyne Technologies, Inc. (Æ) | | 256 | 46 |
| Caterpillar, Inc. | | 4,310 | 679 | Textron, Inc. | | 20,165 | 1,141 |
| Copa Holdings SA Class A | | 1,430 | 192 | TransDigm Group, Inc. | | 12,541 | 3,444 |
| Copart, Inc. (Æ) | | 17,502 | 756 | Union Pacific Corp. | | 18,531 | 2,485 |
| CoStar Group, Inc. (Æ) | | 775 | 230 | United Technologies Corp. | | 19,202 | 2,450 |
| CSX Corp. | | 860 | 47 | Verisk Analytics, Inc. Class A(Æ) | | 17,643 | 1,694 |
| Cummins, Inc. | | 3,885 | 686 | Waters Corp. (Æ) | | 908 | 175 |
| Danaher Corp. | | 16,153 | 1,499 | Werner Enterprises, Inc. | | 800 | 31 |
| Delta Air Lines, Inc. | | 22,483 | 1,259 | Xerox Corp. | | 17,400 | 507 |
| Dover Corp. | | 320 | 32 | XPO Logistics, Inc. (Æ) | | 45,452 | 4,163 |
| Eaton Corp. PLC | | 3,243 | 256 | Xylem, Inc. | | 15,326 | 1,045 |
| EMCOR Group, Inc. | | 7,700 | 629 | | | | 77,041 |
| Evoqua Water Technologies Corp. (Æ) | | 712 | 17 | | | | |
| Expeditors International of Washington, Inc. | | 2,546 | 165 | Technology - 17.3% | | | |
| FedEx Corp. | | 6,282 | 1,568 | Adobe Systems, Inc. (Æ) | | 20,436 | 3,581 |
| Fluor Corp. | | 17,900 | 925 | Alibaba Group Holding, Ltd. - ADR(Æ) | | 6,314 | 1,089 |
| Fortive Corp. | | 44,424 | 3,214 | Alphabet, Inc. Class A(Æ) | | 3,731 | 3,930 |
| General Dynamics Corp. | | 2,105 | 428 | Alphabet, Inc. Class C(Æ) | | 6,757 | 7,070 |
| General Electric Co. | | 54,165 | 945 | Amdocs, Ltd. | | 9,214 | 603 |
| Genpact, Ltd. | | 18,050 | 573 | Amphenol Corp. Class A | | 2,969 | 261 |
| Graco, Inc. | | 1,455 | 66 | Analog Devices, Inc. | | 336 | 30 |
| Heico Corp. Class A | | 2,216 | 175 | Apple, Inc. | | 42,826 | 7,248 |
| HEICO Corp. | | 2,343 | 221 | Applied Materials, Inc. | | 2,883 | 147 |
| Honeywell International, Inc. | | 38,589 | 5,919 | Arista Networks, Inc. (Æ) | | 1,174 | 277 |
| Hubbell, Inc. Class B | | 516 | 70 | ARRIS International PLC(Æ) | | 14,200 | 365 |
| Huntington Ingalls Industries, Inc. | | 300 | 71 | Arrow Electronics, Inc. (Æ) | | 2,556 | 206 |
| IDEX Corp. | | 638 | 84 | Benchmark Electronics, Inc. (Æ) | | 800 | 23 |
See accompanying notes which are an integral part of the financial statements.
U.S. Strategic Equity Fund 15
Russell Investment Funds
U.S. Strategic Equity Fund
Schedule of Investments, continued — December 31, 2017
| | | | | | | | | |
| Amounts in thousands (except share amounts) | | Amounts in thousands (except share amounts) | | |
| | | Principal | Fair | | | | Principal | | Fair |
| | Amount ($) or | Value | | | Amount ($) or | | Value |
| | | Shares | $ | | | | Shares | | $ |
| Broadcom, Ltd. | | 3,587 | 922 | Centennial Resource Development, Inc. Class | | | | | |
| CA, Inc. | | 5,291 | 176 | A(Æ) | | | 17,564 | | 348 |
| Cars. com, Inc. (Æ) | | 8,354 | 241 | CenterPoint Energy, Inc. | | | 2,357 | | 67 |
| Cisco Systems, Inc. | | 51,852 | 1,986 | Consolidated Edison, Inc. | | | 3,518 | | 299 |
| Cognizant Technology Solutions Corp. Class | | | | Edison International | | | 13,889 | | 878 |
| A | | 4,843 | 344 | Entergy Corp. | | | 21,107 | | 1,718 |
| CommScope Holding Co. , Inc. (Æ) | | 28,605 | 1,082 | Exelon Corp. | | | 8,669 | | 342 |
| Conduent, Inc. (Æ) | | 5,500 | 89 | Great Plains Energy, Inc. | | | 8,389 | | 270 |
| Corning, Inc. | | 11,477 | 367 | Hawaiian Electric Industries, Inc. | | | 10,452 | | 378 |
| DST Systems, Inc. | | 525 | 33 | NiSource, Inc. | | | 22,500 | | 578 |
| DXC Technology Co. | | 15,463 | 1,467 | PG&E Corp. | | | 14,600 | | 655 |
| EchoStar Corp. Class A(Æ) | | 4,001 | 240 | Pinnacle West Capital Corp. | | | 3,000 | | 256 |
| Electronic Arts, Inc. (Æ) | | 1,544 | 162 | Southern Co. (The) | | | 4,638 | | 223 |
| F5 Networks, Inc. (Æ) | | 1,012 | 133 | Sprint Corp. (Æ) | | | 21,100 | | 124 |
| Facebook, Inc. Class A(Æ) | | 38,094 | 6,722 | T-Mobile US, Inc. (Æ) | | | 12,703 | | 807 |
| FireEye, Inc. (Æ) | | 4,900 | 70 | US Cellular Corp. (Æ) | | | 6,100 | | 230 |
| Gartner, Inc. (Æ) | | 1,235 | 152 | Verizon Communications, Inc. | | | 35,824 | | 1,895 |
| Hewlett Packard Enterprise Co. | | 87,337 | 1,254 | Vistra Energy Corp. (Æ) | | | 8,000 | | 147 |
| HP, Inc. (Æ) | | 62,763 | 1,318 | | | | | | 13,224 |
| Intel Corp. | | 28,754 | 1,328 | | | | | | |
| |
| International Business Machines Corp. | | 8,493 | 1,303 | Total Common Stocks | | | | | |
| Intuit, Inc. | | 25,708 | 4,056 | | | | | | |
| IPG Photonics Corp. (Æ) | | 1,018 | 218 | (cost $335,466) | | | | | 432,951 |
| Jabil Circuit, Inc. | | 6,700 | 176 | | | | | | |
| Juniper Networks, Inc. | | 37,825 | 1,078 | Short-Term Investments - 6.0% | | | | | |
| Lam Research Corp. | | 817 | 150 | U. S. Cash Management Fund(@) | | | 27,698,287 | (8) | 27,698 |
| Leidos Holdings, Inc. | | 5,210 | 336 | Total Short-Term Investments | | | | | |
| Liberty Expedia Holdings, Inc. Class A(Æ) | | 5,351 | 237 | (cost $27,699) | | | | | 27,698 |
| LogMeIn, Inc. | | 849 | 97 | | | | | | |
| Marvell Technology Group, Ltd. | | 95,567 | 2,051 | Total Investments 99.8% | | | | | |
| Maxim Integrated Products, Inc. | | 3,453 | 181 | | | | | | |
| Micron Technology, Inc. (Æ) | | 11,528 | 474 | (identified cost $363,165) | | | | | 460,649 |
| Microsoft Corp. | | 86,612 | 7,409 | Other Assets and Liabilities, Net | | | | | |
| NetApp, Inc. | | 10,046 | 555 | - 0.2% | | | | | 1,078 |
| Nuance Communications, Inc. (Æ) | | 10,800 | 177 | | | | | | |
| NVIDIA Corp. | | 751 | 145 | Net Assets - 100.0% | | | | | 461,727 |
| Oracle Corp. | | 108,938 | 5,150 | | | | | | |
| Progress Software Corp. | | 4,900 | 209 | | | | | | |
| Qorvo, Inc. (Æ) | | 1,249 | 83 | | | | | | |
| QUALCOMM, Inc. | | 48,782 | 3,123 | | | | | | |
| Red Hat, Inc. (Æ) | | 15,043 | 1,807 | | | | | | |
| Salesforce. com, Inc. (Æ) | | 5,759 | 589 | | | | | | |
| Skyworks Solutions, Inc. | | 1,417 | 135 | | | | | | |
| Synopsys, Inc. (Æ) | | 13,746 | 1,172 | | | | | | |
| Take-Two Interactive Software, Inc. (Æ) | | 1,209 | 133 | | | | | | |
| Tech Data Corp. (Æ) | | 7,260 | 711 | | | | | | |
| Texas Instruments, Inc. | | 20,609 | 2,152 | | | | | | |
| Twitter, Inc. (Æ) | | 31,100 | 747 | | | | | | |
| Tyler Technologies, Inc. (Æ) | | 455 | 81 | | | | | | |
| Viavi Solutions, Inc. Class W(Æ) | | 100,600 | 879 | | | | | | |
| VMware, Inc. Class A(Æ) | | 1,125 | 141 | | | | | | |
| Western Digital Corp. | | 9,700 | 771 | | | | | | |
| Xilinx, Inc. | | 2,259 | 152 | | | | | | |
| Zynga, Inc. Class A(Æ) | | 102,400 | 410 | | | | | | |
| | | | 80,004 | | | | | | |
| |
| Utilities - 2.9% | | | | | | | | | |
| AT&T, Inc. | | 103,149 | 4,009 | | | | | | |
See accompanying notes which are an integral part of the financial statements.
16 U.S. Strategic Equity Fund
Russell Investment Funds
U.S. Strategic Equity Fund
Schedule of Investments, continued — December 31, 2017
| | | | | | | | | | | | | | | |
| Futures Contracts | | | | | | | | | | | | | | | |
| Amounts in thousands (except contract amounts) | | | | | | | | | | | | | |
| | | | | | | | | | | | | | | Value and | |
| | | | | | | | | | | | | | | Unrealized | |
| | | | | | | | | | | | | | Appreciation | |
| | | | | | | Number of | Notional | Expiration | | (Depreciation) | |
| | | | | | | Contracts | Amount | | Date | | | $ | |
| Long Positions | | | | | | | | | | | | | | | |
| S&P 500 E-Mini Index Futures | | | | | | | 138 | USD | 18,464 | | 03/18 | | | (57 | ) |
| Total Value and Unrealized Appreciation (Depreciation) on Open Futures Contracts (å) | | | | | | | | (57 | ) |
| |
| |
| Presentation of Portfolio Holdings | | | | | | | | | | | | | |
| Amounts in thousands | | | | | | | | | | | | | | | |
| | | | | | | | Fair Value | | | | | | | | |
| | | | | | | | | Practical | | | | | | |
| Portfolio Summary | | Level 1 | | | Level 2 | | Level 3 | Expedient (a) | | Total | | % of Net Assets | |
| Common Stocks | | | | | | | | | | | | | | | |
| Consumer Discretionary | $ | 44,493 | | $ | — | $ | — | $ | — | $ | 44,493 | | | 9.6 | |
| Consumer Staples | | 24,311 | | | — | | — | | — | | 24,311 | | | 5.3 | |
| Energy | | 33,079 | | | — | | — | | — | | 33,079 | | | 7.2 | |
| Financial Services | | 98,032 | | | — | | — | | — | | 98,032 | | | 21.2 | |
| Health Care | | 48,738 | | | — | | — | | — | | 48,738 | | | 10.6 | |
| Materials and Processing | | 14,029 | | | — | | — | | — | | 14,029 | | | 3.0 | |
| Producer Durables | | 77,041 | | | — | | — | | — | | 77,041 | | | 16.7 | |
| Technology | | 80,004 | | | — | | — | | — | | 80,004 | | | 17.3 | |
| Utilities | | 13,224 | | | — | | — | | — | | 13,224 | | | 2.9 | |
| Short-Term Investments | | — | | | — | | — | | 27,698 | | 27,698 | | | 6.0 | |
| Total Investments | | 432,951 | | | — | | — | | 27,698 | | 460,649 | | | 99.8 | |
| Other Assets and Liabilities, Net | | | | | | | | | | | | | | 0.2 | |
| | | | | | | | | | | | | | | 100.0 | |
| Other Financial Instruments | | | | | | | | | | | | | | | |
| | | | | | | | | | | | | | | |
| Liabilities | | | | | | | | | | | | | | | |
| Futures Contracts | | (57 | ) | | — | | — | | — | | (57 | ) | | (—)* | |
| Total Other Financial Instruments** | $ | (57 | ) | $ | — | $ | — | $ | — | $ | (57 | ) | | | |
* Less than 0.05% of net assets.
** Futures and foreign currency exchange contract values reflect the unrealized appreciation (depreciation) on the investments.
(a) Certain investments that are measured at fair value using the net asset value per share (or its equivalent) practical expedient have not been classified
in the fair value levels. The fair value amounts presented in the table are intended to permit reconciliation to the amounts presented in the Schedule of
Investments.
For a description of the Levels, see note 2 in the Notes to Financial Statements.
For a disclosure on transfers between Levels 1, 2 and 3 during the period ended December 31, 2017, see note 2 in the Notes to
Financial Statements.
See accompanying notes which are an integral part of the financial statements.
U.S. Strategic Equity Fund 17
Russell Investment Funds
U.S. Strategic Equity Fund
Fair Value of Derivative Instruments — December 31, 2017
Amounts in thousands
| | | |
| | | Equity |
| Derivatives not accounted for as hedging instruments | Contracts |
| |
| Location: Statement of Assets and Liabilities - Liabilities | | |
| Variation margin on futures contracts* | | $ | 57 |
| |
| | | Equity |
| Derivatives not accounted for as hedging instruments | Contracts |
| |
| Location: Statement of Operations - Net realized gain (loss) | | |
| Futures contracts | | $ | 2,697 |
| |
| |
| Location: Statement of Operations - Net change in unrealized appreciation (depreciation) | | |
| Futures contracts | | $ | 132 |
* Includes cumulative appreciation/depreciation of futures contracts as reported in the Schedule of Investments. Only variation margin is reported within the
Statement of Assets and Liabilities.
For further disclosure on derivatives see note 2 in the Notes to Financial Statements.
See accompanying notes which are an integral part of the financial statements.
18 U.S. Strategic Equity Fund
Russell Investment Funds
U.S. Strategic Equity Fund
Balance Sheet Offsetting of Financial and Derivative Instruments —
December 31, 2017
| | | | | | | | | |
| Amounts in thousands | | | | | | | | | |
| |
| Offsetting of Financial Liabilities and Derivative Liabilities | | | | | | | | |
| | | | | Gross | Net Amounts | |
| | | | | Amounts | of Liabilities | |
| | | Gross | Offset in the | Presented in | |
| | | Amounts of | Statement of | the Statement | |
| | | Recognized | Assets and | of Assets and | |
| Description | Location: Statement of Assets and Liabilities - Liabilities | Liabilities | Liabilities | | Liabilities | |
| Futures Contracts | Variation margin on futures contracts | $ | 67 | | $ | — $ | 67 | |
| Total Financial and Derivative Liabilities | | | 67 | | | — | 67 | |
| Financial and Derivative Liabilities not subject to a netting agreement | | (67 | ) | | — | (67 | ) |
| Total Financial and Derivative Liabilities subject to a netting agreement | $ | — | | $ | — $ | — | |
For further disclosure on derivatives and counterparty risk see note 2 in the Notes to Financial Statements.
See accompanying notes which are an integral part of the financial statements.
U.S. Strategic Equity Fund 19
Russell Investment Funds
U.S. Strategic Equity Fund
Statement of Assets and Liabilities — December 31, 2017
| | | |
| Amounts in thousands | | | |
| Assets | | | |
| Investments, at identified cost | $ | 363,165 | |
| Investments, at fair value(>) | | 460,649 | |
| Cash (restricted)(a) | | 720 | |
| Receivables: | | | |
| Dividends and interest | | 502 | |
| Dividends from affiliated funds | | 21 | |
| Investments sold | | 1,224 | |
| Fund shares sold | | 2 | |
| Total assets | | 463,118 | |
| |
| Liabilities | | | |
| Payables: | | | |
| Investments purchased | | 919 | |
| Fund shares redeemed | | 11 | |
| Accrued fees to affiliates | | 308 | |
| Other accrued expenses | | 86 | |
| Variation margin on futures contracts | | 67 | |
| Total liabilities | | 1,391 | |
| |
| |
| Net Assets | $ | 461,727 | |
| | | |
| |
| |
| |
| Net Assets Consist of: | | | |
| Undistributed (overdistributed) net investment income | $ | 999 | |
| Accumulated net realized gain (loss) | | 12,839 | |
| Unrealized appreciation (depreciation) on: | | | |
| Investments | | 97,484 | |
| Futures contracts | | (57 | ) |
| Shares of beneficial interest | | 249 | |
| Additional paid-in capital | | 350,213 | |
| Net Assets | $ | 461,727 | |
| |
| Net Asset Value, offering and redemption price per share: | | | |
| Net asset value per share: (#) | $ | 18.53 | |
| Net assets | $ | 461,727,292 | |
| Shares outstanding ($. 01 par value) | | 24,917,264 | |
| Amounts in thousands | | | |
| (>) Investments in affiliates, U. S. Cash Management Fund | $ | 27,698 | |
| |
| (a) Cash Collateral for Futures | $ | 720 | |
| (#) Net asset value per share equals net assets divided by shares of beneficial interest outstanding. | | | |
See accompanying notes which are an integral part of the financial statements.
20 U.S. Strategic Equity Fund
Russell Investment Funds
U.S. Strategic Equity Fund
Statement of Operations — For the Period Ended December 31, 2017
| | | |
| Amounts in thousands | | | |
| Investment Income | | | |
| Dividends | $ | 7,967 | |
| Dividends from affiliated funds | | 222 | |
| Total investment income | | 8,189 | |
| |
| Expenses | | | |
| Advisory fees | | 3,372 | |
| Administrative fees | | 231 | |
| Custodian fees | | 58 | |
| Transfer agent fees . | | 20 | |
| Professional fees | | 78 | |
| Trustees’ fees | | 12 | |
| Printing fees | | 61 | |
| Miscellaneous | | 25 | |
| Total expenses | | 3,857 | |
| Net investment income (loss) | | 4,332 | |
| |
| Net Realized and Unrealized Gain (Loss) | | | |
| Net realized gain (loss) on: | | | |
| Investments | | 42,951 | |
| Futures contracts | | 2,697 | |
| Net realized gain (loss) | | 45,648 | |
| Net change in unrealized appreciation (depreciation) on: | | | |
| Investments | | 36,833 | |
| Investments in affiliated funds | | (2 | ) |
| Futures contracts | | 132 | |
| Net change in unrealized appreciation (depreciation) | | 36,963 | |
| Net realized and unrealized gain (loss) | | 82,611 | |
| Net Increase (Decrease) in Net Assets from Operations | $ | 86,943 | |
See accompanying notes which are an integral part of the financial statements.
U.S. Strategic Equity Fund 21
Russell Investment Funds
U.S. Strategic Equity Fund
Statements of Changes in Net Assets
| | | | | | |
| | For the Periods Ended December 31, | |
| Amounts in thousands | | 2017 | | | 2016 | |
| Increase (Decrease) in Net Assets | | | | | | |
| Operations | | | | | | |
| Net investment income (loss) | $ | 4,332 | | $ | 5,039 | |
| Net realized gain (loss) | | 45,648 | | | 35,950 | |
| Net change in unrealized appreciation (depreciation) | | 36,963 | | | 3,237 | |
| Net increase (decrease) in net assets from operations | | 86,943 | | | 44,226 | |
| |
| Distributions | | | | | | |
| From net investments income | | (4,792 | ) | | (4,595 | ) |
| From net realized gain | | (44,141 | ) | | (27,937 | ) |
| Net decrease in net assets from distributions | | (48,933 | ) | | (32,532 | ) |
| |
| Share Transactions* | | | | | | |
| Net increase (decrease) in net assets from share transactions | | (19,336 | ) | | (22,982 | ) |
| Total Net Increase (Decrease) in Net Assets | | 18,674 | | | (11,288 | ) |
| |
| Net Assets | | | | | | |
| Beginning of period | | 443,053 | | | 454,341 | |
| End of period | $ | 461,727 | | $ | 443,053 | |
| Undistributed (overdistributed) net investment income included in net assets | $ | 999 | | $ | 1,460 | |
* Share transaction amounts (in thousands) for the periods ended December 31, 2017 and December 31, 2016 were as follows:
| | | | | | | | | | | | |
| | | 2017 | | | | 2016 | | |
| | | Shares | | | Dollars | | | Shares | | | Dollars | |
| |
| Proceeds from shares sold | | 1,301 | | $ | 22,933 | | | 439 | | $ | 7,344 | |
| Proceeds from reinvestment of distributions | | 2,691 | | | 48,933 | | | 1,943 | | | 32,532 | |
| Payments for shares redeemed | | (5,019 | ) | | (91,202 | ) | | (3,735 | ) | | (62,858 | ) |
| Total increase (decrease) | | (1,027 | ) | $ | (19,336 | ) | | (1,353 | ) | $ | (22,982 | ) |
See accompanying notes which are an integral part of the financial statements.
22 U.S. Strategic Equity Fund
(This page intentionally left blank)
Russell Investment Funds
U.S. Strategic Equity Fund
Financial Highlights — For the Periods Ended
For a Share Outstanding Throughout Each Period.
| | | | | | | | | | | | | | |
| | | $ | | $ | | $ | | $ | | $ | | | $ | |
| | Net Asset Value, | | Net | | Net Realized | | Total from | | Distributions | | | Distributions | |
| | Beginning of | Investment | | and Unrealized | | Investment | | from Net | | | from Net | |
| | | Period | Income (Loss)(a)(b) | | Gain (Loss) | | Operations | | Investment Income | | | Realized Gain | |
| December 31, 2017 | | 17.08 | | . 17 | | 3.29 | | 3.46 | | (. 19 | ) | | (1.82 | ) |
| December 31, 2016 | | 16.64 | | . 19 | | 1.53 | | 1.72 | | (. 17 | ) | | (1.11 | ) |
| December 31, 2015 | | 18.11 | | . 15 | | . 05 | | . 20 | | (. 15 | ) | | (1.52 | ) |
| December 31, 2014 | | 18.85 | | . 22 | | 1.94 | | 2.16 | | (. 22 | ) | | (2.68 | ) |
| December 31, 2013 | | 15.15 | | . 19 | | 4.75 | | 4.94 | | (. 22 | ) | | (1.02 | ) |
| | | | | | | | | | | | | | | |
See accompanying notes which are an integral part of the financial statements.
24 U.S. Strategic Equity Fund
| | | | | | | | | | | | | | | | |
| | | | | | | | | | | | % | | % | | % | |
| | | | | $ | | | | $ | | | Ratio of Expenses | | Ratio of Expenses | Ratio of Net | |
| | | | | Net Asset Value, | | % | | Net Assets, | | | to Average | | to Average | Investment Income | % |
| | $ | | | End of | | Total | | End of Period | | | Net Assets, | | Net Assets, | to Average | Portfolio |
| Total Distributions | | | Period | | Return(d) | | (000 | ) | | Gross(e) | | Net(b)(e) | Net Assets(b) | Turnover Rate |
| (2.01 | ) | | 18.53 | | 20.80 | | 461,727 | | | . 83 | | . 83 | | . 94 | 80 |
| (1.28 | ) | | 17.08 | | 10.64 | | 443,053 | | | . 83 | | . 83 | | 1.15 | 101 |
| (1.67 | ) | | 16.64 | | 1.11 | | 454,341 | | | . 84 | | . 84 | | . 84 | 99 |
| (2.90 | ) | | 18.11 | | 11.70 | | 488,531 | | | . 86 | | . 86 | | 1.13 | 101 |
| (1.24 | ) | | 18.85 | | 32.92 | | 475,100 | | | . 84 | | . 84 | | 1.07 | 86 |
See accompanying notes which are an integral part of the financial statements.
U.S. Strategic Equity Fund 25
Russell Investment Funds
U.S. Strategic Equity Fund
Related Party Transactions, Fees and Expenses
Accrued fees payable to affiliates for the period ended December 31, 2017 were as follows:
| | |
| Advisory fees | $ | 285,744 |
| Administration fees | | 19,572 |
| Transfer agent fees | | 1,722 |
| Trustee fees | | 1,028 |
| | $ | 308,066 |
Transactions (amounts in thousands) during the period ended December 31, 2017 with Underlying Funds which are, or were, an
affiliated company are as follows:
| | | | | | | | | | | | | | | | | |
| | | Fair Value, | | | | | | | Change in | | | | | | | | |
| | Beginning of | | | | Realized Gain | Unrealized | Fair Value, End | | | Income | Capital Gains |
| | | Period | | Purchases | | Sales | | (Loss) | Gain (Loss) | of Period | Distributions | Distributions |
| U. S. Cash Management Fund | $ | 23,391 | $ | 129,402 | $ | 125,093 | $ | — | $ (2) | $ | 27,698 | | $ | 222 | | $ | — |
| | $ | 23,391 | $ | 129,402 | $ | 125,093 | $ | — | $ (2) | $ | 27,698 | | $ | 222 | | $ | — |
Federal Income Taxes
At December 31, 2017, the cost of investments and net unrealized appreciation (depreciation), undistributed ordinary income and
undistributed long-term capital gains for income tax purposes were as follows:
| | | | |
| Cost of Investments | $ | | 364,910,093 | |
| Unrealized Appreciation | $ | | 101,493,829 | |
| Unrealized Depreciation | | | (5,755,061 | ) |
| Net Unrealized Appreciation (Depreciation) | $ | | 95,738,768 | |
| Undistributed Ordinary Income | $ | | 5,148,630 | |
| Undistributed Long-Term Capital Gains | | | | |
| (Capital Loss Carryforward) | $ | | 10,377,349 | |
| Tax Composition of Distributions | | | | |
| Ordinary Income | $ | | 19,782,407 | |
| Long-Term Capital Gains | $ | | 29,150,493 | |
Net investment income and net realized gains (losses) in the financial statements may differ from taxable net investment income and
net realized gains (losses). Capital accounts within the financial statements are adjusted for permanent book-tax differences. Book-tax
differences are primarily due to foreign currency gains and losses, reclassifications of dividends, differences in treatment of income
from swaps, net operating losses, investments in partnerships, investments in passive foreign investment companies (PFICs), tax
straddle transaction, use of tax equalization and foreign capital gains taxes. These adjustments have no impact on the net assets. At
December 31, 2017, the Statement of Assets and Liabilities have been adjusted by the following amounts (in thousands):
| | | |
| Undistributed net investment income | $ | (1 | ) |
| Accumulated net realized gain (loss) | | 1 | |
| Additional paid-in capital | | — | |
See accompanying notes which are an integral part of the financial statements.
26 U.S. Strategic Equity Fund
Russell Investment Funds
U.S. Small Cap Equity Fund
Portfolio Management Discussion and Analysis — December 31, 2017 (Unaudited)

| | | | | | | |
| U. S. Small Cap Equity Fund | | | | Russell 2000® Index** | | | |
| | | Total | | | | Total | |
| | | Return | | | | Return | |
| 1 Year | | 15.48 | % | 1 Year | | 14.65 | % |
| 5 Years | | 12.58 | %§ | 5 Years | | 14.12 | %§ |
| 10 Years | | 6.51 | %§ | 10 Years | | 8.71 | %§ |
| |
| | | | | U. S. Small Cap Equity Linked Benchmark *** | | |
| | | | | | | Total | |
| | | | | | | Return | |
| | | | | 1 Year | | 14.65 | % |
| | | | | 5 Years | | 14.12 | %§ |
| | | | | 10 Years | | 9.10 | %§ |
U.S. Small Cap Equity Fund 27
Russell Investment Funds
U.S. Small Cap Equity Fund
Portfolio Management Discussion and Analysis, continued — December 31, 2017
(Unaudited)
| |
| The U. S. Small Cap Equity Fund (the “Fund”) employs a multi- | well as companies with higher quality characteristics such as |
| manager approach whereby Russell Investment Management, | lower financial leverage and higher returns-on-equity. Within the |
| LLC (“RIM”) manages a portion of the Fund's assets based upon | U. S. small cap market, a preference for value over growth stocks |
| model portfolios provided by multiple non-discretionary money | negatively impacted benchmark relative performance given |
| managers. RIM may change the allocation of the Fund's assets at | rotation away from this factor in early 2017. The capitalization tilt |
| any time. An exemptive order from the Securities and Exchange | also detracted due to large cap stocks outperforming small cap |
| Commission (“SEC”) permits RIM to engage or terminate a money | stocks in 2017. The Fund’s quality positioning added value as |
| manager at any time, subject to approval by the Fund’s Board, | companies with low financial leverage outperformed. |
| without a shareholder vote. Pursuant to the terms of the exemptive | From a sector standpoint, the expectation for a slow growth U. S. |
| order, the Fund is required to notify its shareholders within 90 | economic environment led to the Fund’s overweight in sectors such |
| days of when a money manager begins providing services. As of | as financials and industrials. The Fund remained underweight the |
| December 31, 2017, the Fund had seven money managers. | highly volatile biotechnology industry as well as sectors that are |
| What is the Fund’s investment objective? | traditionally considered to be interest rate sensitive such as real |
| The Fund seeks to provide long term capital growth. | estate and utilities. The Fund’s interest rate sensitive positioning |
| | positively impacted Fund performance, while the underweight |
| How did the Fund perform relative to its benchmark for the | to biotechnology detracted. Outperforming holdings within the |
| fiscal year ended December 31, 2017? | technology and financials sectors were the primary driver of |
| For the fiscal year ended December 31, 2017, the Fund gained | positive benchmark relative returns. |
| 15.48%. This is compared to the Fund’s benchmark, the Russell | The Fund’s money managers have non-discretionary assignments |
| 2000® Index, which gained 14.65% during the same period. The | pursuant to which they provide a model portfolio to RIM |
| Fund’s performance includes operating expenses, whereas index | representing their investment recommendations, based upon |
| returns are unmanaged and do not include expenses of any kind. | which RIM purchases and sells securities for the Fund. With |
| For the fiscal year ended December 31, 2017, the Morningstar® | respect to this portion of the Fund, RIM manages the Fund’s |
| Insurance Small Blend Category, a group of funds that Morningstar | assets based upon the model portfolios provided by the Fund’s |
| considers to have investment strategies similar to those of the | money managers. RIM also manages the portion of the Fund's |
| Fund, gained 12.76%. This result serves as a peer comparison | assets that RIM determines not to manage based upon model |
| and is expressed net of operating expenses. | portfolios provided by the Fund's money managers. This includes |
| RIM may assign a money manager a specific style or | assets managed directly by RIM to effect the Fund's investment |
| capitalization benchmark other than the Fund’s index. However, | strategies and/or to actively manage the Fund's overall exposures |
| the Fund’s primary index remains the benchmark for the Fund | to seek to achieve the desired risk/return profile for the Fund. |
| and is representative of the aggregate of each money manager’s | RIM also manages the Fund’s cash balances. |
| benchmark index. | With respect to certain of the Fund’s money managers, Timpani |
| | Capital Management LLC was the best performing money manager |
| How did the market conditions described in the Market | for the fiscal year and outperformed the Russell 2000® Growth |
| Summary report affect the Fund’s performance? | Index. Stock selection within the technology and consumer |
| The fiscal year ended December 31, 2017 saw the Fund outperform | discretionary sectors was a positive contributor. A preference |
| the Russell 2000® Index. Investor sentiment rotated strongly in | for holdings with higher price momentum and lower profitability |
| early 2017 toward high growth and larger cap companies. The | (return-on-equity) also added value. |
| leadership of less profitable growth companies concentrated in | |
| the technology and health care sectors continued for the majority | Snow Capital Management L. P. faced the strongest headwinds |
| of 2017 as earnings growth of these companies was boosted by | over the fiscal year and underperformed the Russell 2000® |
| exposure to international markets and a weaker U. S. dollar. Near | Value Index. Underperforming holdings within the industrial |
| the end of the fiscal year, investors rotated towards value stocks | and technology sectors detracted value. A tilt towards the energy |
| poised to benefit from U. S. tax reform. | sector also negatively impacted performance. |
| | During the period, RIM utilized a positioning strategy to control |
| How did the investment strategies and techniques employed | Fund-level exposures and risks through the purchase of a stock |
| by the Fund and its money managers affect its benchmark- | portfolio. Using the output from a quantitative model, the strategy |
| relative performance? | seeks to position the portfolio to meet RIM’s overall preferred |
| Over the period, the Fund maintained exposure to small and | positioning with respect to Fund exposures along factor and |
| micro capitalization stocks trading at discounted valuations as | |
28 U.S. Small Cap Equity Fund
Russell Investment Funds
U.S. Small Cap Equity Fund
Portfolio Management Discussion and Analysis, continued — December 31, 2017
(Unaudited)
| | |
| industry dimensions. The positioning strategy outperformed the | the incoming managers and RIM’s belief that the more distinct |
| Russell 2000® Index for the fiscal year. The Fund’s positioning | substyles of the new managers will increase Fund diversification. |
| strategy provided the desired exposure to higher value (overweight | | |
| stocks with lower valuations than the benchmark), higher quality | Money Managers as of December 31, |
| (overweight stocks with lower debt and higher profitability), | 2017 | Styles |
| and higher momentum stocks. From a sector perspective, the | Ancora Advisor, LLC | Small Cap Core |
| positioning strategy was overweight health care and underweight | Copeland Capital Management LLC | Small Cap Dividend |
| | | Growth |
| energy. During the fiscal year, the momentum, quality, and sector | DePrince, Race & Zollo, Inc. | Small Cap Value |
| positioning was a tailwind to performance and led the strategy to | Falcon Point Capital, LLC | Micro/Small Cap Growth |
| outperform, while the value exposure detracted. | Penn Capital Management Company, Inc. | Micro/Small Cap Core |
| | Snow Capital Management L. P. | Small Cap Value |
| During the period, RIM partially equitized the Fund’s cash using | Timpani Capital Management, LLC | Small Cap Growth |
| index futures contracts to provide the Fund with greater market | The views expressed in this report reflect those of the |
| exposure. This had a positive impact on the Fund’s absolute | portfolio managers only through the end of the period |
| performance. | covered by the report. These views do not necessarily |
| Describe any changes to the Fund’s structure or the money | represent the views of RIM, or any other person in RIM or |
| manager line-up. | any other affiliated organization. These views are subject to |
| In December 2017, RIM terminated RBC Global Asset | change at any time based upon market conditions or other |
| Management Inc. and Monarch Partners Asset Management | events, and RIM disclaims any responsibility to update the |
| LLC, and hired Falcon Point Capital LLC, Copeland Capital | views contained herein. These views should not be relied |
| Management LLC, Ancora Advisors LLC, and Penn Capital | on as investment advice and, because investment decisions |
| Management Company, Inc. These changes were driven by RIM’s | for a Russell Investment Funds (“RIF”) Fund are based on |
| higher confidence in the prospective excess return potential of | numerous factors, should not be relied on as an indication |
| | of investment decisions of any RIF Fund. |
* Assumes initial investment on January 1, 2008.
** Russell 2000® Index measures the performance of the small-cap segment of the U.S. equity universe. The Russell 2000® Index is a subset of the Russell 3000®
Index representing approximately 10% of the total market capitalization of that index. It includes approximately 2000 of the smallest securities based on a
combination of their market cap and current index membership. The Russell 2000® Index is constructed to provide a comprehensive and unbiased small-cap
opportunity barometer and is completely reconstituted annually to ensure larger stocks do not distort the performance and characteristics of the true small-cap
opportunity set.
*** The U.S. Small Cap Equity Linked Benchmark provides a means to compare the Fund’s average annual returns to a secondary benchmark that takes into
account historical changes in the Fund’s primary benchmark. The Aggressive Equity Linked Benchmark represents the returns of the Russell 2500TM Index
through April 30, 2012 and the returns of the Russell 2000® Index thereafter.
§ Annualized.
The performance shown in this section does not reflect any Insurance Company Separate Account or Policy Charges. Performance is historical and assumes
reinvestment of all dividends and capital gains. Investment return and principal value will fluctuate so that an investor’s shares, when redeemed, may be worth more
or less than when purchased. Past performance is not indicative of future results. Additionally, the returns presented herein may differ from the performance reported
in the Financial Highlights as the returns herein are calculated in a manner consistent with standardized performance in accordance with Securities and Exchange
Commission rules, while the performance in the Financial Highlights has been calculated in accordance with U.S. Generally Accepted Accounting Principles (“U.S.
GAAP”).
U.S. Small Cap Equity Fund 29
Russell Investment Funds
U.S. Small Cap Equity Fund
Shareholder Expense Example — December 31, 2017 (Unaudited)
| | | | | | | |
| Fund Expenses | Please note that the expenses shown in the table are meant |
| The following disclosure provides important information | to highlight your ongoing costs only and do not reflect any |
| regarding the Fund’s Shareholder Expense Example | transactional costs. Therefore, the information under the heading |
| (“Example”) . | “Hypothetical Performance (5% return before expenses)” is |
| | useful in comparing ongoing costs only, and will not help you |
| Example | determine the relative total costs of owning different funds. In |
| As a shareholder of the Fund, you incur two types of costs: (1) | addition, if these transactional costs were included, your costs |
| transaction costs, and (2) ongoing costs, including advisory and | would have been higher. The fees and expenses shown in this |
| administrative fees and other Fund expenses. The Example is | section do not reflect any Insurance Company Separate Account |
| intended to help you understand your ongoing costs (in dollars) | Policy Charges. | | | | | | |
| of investing in the Fund and to compare these costs with the | | | | | | Hypothetical |
| ongoing costs of investing in other mutual funds. The Example | | | | | | Performance (5% |
| is based on an investment of $1,000 invested at the beginning of | | | | Actual | | return before |
| the period and held for the entire period indicated, which for this | | | Performance | | | expenses) |
| | Beginning Account Value | | | | | | |
| Fund is from July 1, 2017 to December 31, 2017. | July 1, 2017 | | $ | 1,000.00 | | $ | 1,000.00 |
| | Ending Account Value | | | | | | |
| Actual Expenses | December 31, 2017 | | $ | 1,102.70 | | $ | 1,020.01 |
| The information in the table under the heading “Actual | Expenses Paid During Period* | | $ | 5.46 | | $ | 5.24 |
| Performance” provides information about actual account values | | | | | | | |
| and actual expenses. You may use the information in this column, | * Expenses are equal to the Fund's annualized expense ratio of 1.03% |
| | (representing the six month period annualized), multiplied by the average |
| together with the amount you invested, to estimate the expenses | account value over the period, multiplied by 184/365 (to reflect the one-half |
| that you paid over the period. Simply divide your account value by | year period) . | | | | | | |
| $1,000 (for example, an $8,600 account value divided by $1,000 | | | | | | | |
| = 8.6), then multiply the result by the number in the first column | | | | | | | |
| in the row entitled “Expenses Paid During Period” to estimate | | | | | | | |
| the expenses you paid on your account during this period. | | | | | | | |
| |
| Hypothetical Example for Comparison Purposes | | | | | | | |
| The information in the table under the heading “Hypothetical | | | | | | | |
| Performance (5% return before expenses)” provides information | | | | | | | |
| about hypothetical account values and hypothetical expenses | | | | | | | |
| based on the Fund’s actual expense ratio and an assumed rate of | | | | | | | |
| return of 5% per year before expenses, which is not the Fund’s | | | | | | | |
| actual return. The hypothetical account values and expenses | | | | | | | |
| may not be used to estimate the actual ending account balance or | | | | | | | |
| expenses you paid for the period. You may use this information | | | | | | | |
| to compare the ongoing costs of investing in the Fund and other | | | | | | | |
| funds. To do so, compare this 5% hypothetical example with the | | | | | | | |
| 5% hypothetical examples that appear in the shareholder reports | | | | | | | |
| of other funds. | | | | | | | |
30 U.S. Small Cap Equity Fund
Russell Investment Funds
U.S. Small Cap Equity Fund
Schedule of Investments — December 31, 2017
| | | | | | | |
| Amounts in thousands (except share amounts) | | Amounts in thousands (except share amounts) | |
| | | Principal | Fair | | | Principal | Fair |
| | Amount ($) or | Value | | Amount ($) or | Value |
| | | Shares | $ | | | Shares | $ |
| Common Stocks - 93.4% | | | | IMAX Corp. (Æ) | | 4,206 | 97 |
| Consumer Discretionary - 14.7% | | | | Instructure, Inc. (Æ) | | 4,605 | 152 |
| 2U, Inc. (Æ) | | 6,191 | 399 | J Alexander's Holdings, Inc. (Æ) | | 44,681 | 433 |
| Acushnet Holdings Corp. | | 35,465 | 748 | Jack in the Box, Inc. | | 4,158 | 408 |
| Adtalem Global Education, Inc. (Æ) | | 3,635 | 153 | Johnson Outdoors, Inc. Class A | | 1,650 | 102 |
| AH Belo Corp. Class A | | 7,237 | 35 | Kirkland's, Inc. (Æ) | | 1,899 | 23 |
| AMC Entertainment Holdings, Inc. Class | | | | LCI Industries | | 2,431 | 316 |
| A(Ñ) | | 3,932 | 59 | Lee Enterprises, Inc. (Æ) | | 59,856 | 141 |
| American Axle & Manufacturing Holdings, | | | | Lithia Motors, Inc. Class A | | 4,711 | 535 |
| Inc. (Æ) | | 4,433 | 75 | Malibu Boats, Inc. Class A(Æ) | | 3,977 | 118 |
| American Eagle Outfitters, Inc. | | 14,202 | 267 | MarineMax, Inc. (Æ) | | 1,507 | 28 |
| American Outdoor Brands Corp. (Æ) | | 8,147 | 105 | MDC Partners, Inc. Class A(Æ) | | 9,081 | 89 |
| B. Riley Financial, Inc. | | 21,781 | 394 | Meredith Corp. | | 7,572 | 500 |
| Big 5 Sporting Goods Corp. (Ñ) | | 14,864 | 113 | Meritor, Inc. (Æ) | | 14,193 | 333 |
| Big Lots, Inc. (Ñ) | | 21,748 | 1,222 | Michael Kors Holdings, Ltd. (Æ) | | 2,347 | 148 |
| Bloomin' Brands, Inc. | | 16,737 | 357 | Monarch Casino & Resort, Inc. (Æ) | | 1,736 | 78 |
| BMC Stock Holdings, Inc. (Æ) | | 27,111 | 686 | Nexstar Media Group, Inc. Class A | | 11,080 | 866 |
| Bojangles', Inc. (Æ) | | 36,021 | 425 | Nutrisystem, Inc. | | 2,432 | 128 |
| Boyd Gaming Corp. | | 3,552 | 124 | Ollie's Bargain Outlet Holdings, Inc. (Æ) | | 8,356 | 445 |
| Canada Goose Holdings, Inc. (Æ) | | 12,644 | 399 | Outfront Media, Inc. (ö) | | 42,455 | 985 |
| Career Education Corp. (Æ) | | 8,358 | 101 | Papa John's International, Inc. | | 4,982 | 280 |
| Carriage Services, Inc. Class A | | 10,968 | 282 | Penn National Gaming, Inc. (Æ) | | 1,053 | 33 |
| Carrols Restaurant Group, Inc. (Æ) | | 2,441 | 30 | Penske Automotive Group, Inc. | | 14,790 | 708 |
| Central Garden & Pet Co. (Æ) | | 10,337 | 402 | Pinnacle Entertainment, Inc. (Æ) | | 1,543 | 51 |
| Central Garden & Pet Co. Class A(Æ) | | 10,403 | 392 | Planet Fitness, Inc. Class A(Æ) | | 22,469 | 778 |
| Century Casinos, Inc. (Æ) | | 4,644 | 42 | Pool Corp. | | 5,730 | 743 |
| Century Communities, Inc. (Æ) | | 5,831 | 181 | QuinStreet, Inc. (Æ) | | 4,670 | 39 |
| Cheesecake Factory, Inc. (The)(Ñ) | | 22,847 | 1,102 | Red Robin Gourmet Burgers, Inc. (Æ) | | 6,767 | 382 |
| Chegg, Inc. (Æ) | | 58,894 | 961 | Red Rock Resorts, Inc. Class A | | 1,522 | 51 |
| Chico's FAS, Inc. | | 6,889 | 61 | Sally Beauty Holdings, Inc. (Æ) | | 10,950 | 205 |
| Children's Place, Inc. (The) | | 4,130 | 600 | Scientific Games Corp. Class A(Æ) | | 1,014 | 52 |
| Chuy's Holdings, Inc. (Æ) | | 7,461 | 209 | SeaWorld Entertainment, Inc. (Æ) | | 2,807 | 38 |
| Columbia Sportswear Co. | | 9,207 | 662 | Signet Jewelers, Ltd. (Ñ) | | 10,433 | 590 |
| Conn's, Inc. (Æ) | | 26,435 | 940 | Sinclair Broadcast Group, Inc. Class A | | 777 | 29 |
| Cooper Tire & Rubber Co. | | 28,700 | 1,015 | Skechers U. S. A. , Inc. Class A(Æ) | | 41,172 | 1,559 |
| Cracker Barrel Old Country Store, Inc. | | 363 | 58 | Standard Motor Products, Inc. | | 8,978 | 403 |
| Dana Holding Corp. | | 6,673 | 214 | Steven Madden, Ltd. (Æ) | | 5,709 | 267 |
| Deckers Outdoor Corp. (Æ) | | 4,688 | 376 | Sturm Ruger & Co. , Inc. (Ñ) | | 4,321 | 241 |
| Delta Apparel, Inc. (Æ) | | 14,628 | 295 | Superior Uniform Group, Inc. | | 27,089 | 724 |
| Eldorado Resorts, Inc. (Æ)(Ñ) | | 32,514 | 1,079 | Tandy Leather Factory, Inc. (Æ)(Å) | | 22,912 | 176 |
| Entravision Communications Corp. Class A | | 12,022 | 86 | Tenneco, Inc. | | 3,468 | 203 |
| Ethan Allen Interiors, Inc. | | 4,449 | 127 | Texas Roadhouse, Inc. Class A | | 1,300 | 68 |
| EW Scripps Co. (The) Class A(Æ) | | 3,547 | 55 | Thor Industries, Inc. | | 5,115 | 771 |
| Five Below, Inc. (Æ) | | 399 | 26 | Tower International, Inc. | | 3,588 | 110 |
| Floor & Decor Holdings, Inc. Class A(Æ) | | 6,852 | 334 | Townsquare Media, Inc. Class A(Æ) | | 3,108 | 24 |
| Fortress Transportation & Infrastructure | | | | TravelCenters of America LLC(Æ) | | 53,117 | 218 |
| Investors LLC | | 42,115 | 839 | TRI Pointe Group, Inc. (Æ) | | 10,305 | 185 |
| Fox Factory Holding Corp. (Æ) | | 7,509 | 292 | Tropicana Entertainment, Inc. (Æ) | | 3,225 | 182 |
| Full House Resorts, Inc. (Æ) | | 39,323 | 154 | Universal Electronics, Inc. (Æ) | | 1,342 | 63 |
| Genesco, Inc. (Æ) | | 24,245 | 788 | Urban One, Inc. (Æ) | | 19,616 | 34 |
| Gentherm, Inc. (Æ) | | 17,162 | 545 | Urban Outfitters, Inc. (Æ) | | 4,035 | 141 |
| G-III Apparel Group, Ltd. (Æ) | | 3,209 | 118 | US Auto Parts Network, Inc. (Æ) | | 52,854 | 133 |
| Grand Canyon Education, Inc. (Æ) | | 6,541 | 586 | Visteon Corp. (Æ) | | 3,658 | 458 |
| Gray Television, Inc. (Æ) | | 16,782 | 281 | William Lyon Homes Class A(Æ) | | 25,522 | 742 |
| Guess?, Inc. | | 6,766 | 114 | Wingstop, Inc. | | 6,704 | 261 |
| Horizon Global Corp. (Æ) | | 18,742 | 263 | Winnebago Industries, Inc. | | 3,451 | 192 |
| HSN, Inc. | | 16,655 | 672 | | | | |
| ILG, Inc. (Æ) | | 4,381 | 125 | | | | |
See accompanying notes which are an integral part of the financial statements.
U.S. Small Cap Equity Fund 31
Russell Investment Funds
U.S. Small Cap Equity Fund
Schedule of Investments, continued — December 31, 2017
| | | | | | | |
| Amounts in thousands (except share amounts) | | Amounts in thousands (except share amounts) | |
| | | Principal | Fair | | | Principal | Fair |
| | Amount ($) or | Value | | Amount ($) or | Value |
| | | Shares | $ | | | Shares | $ |
| ZAGG, Inc. (Æ) | | 17,140 | 316 | Financial Services - 22.6% | | | |
| | | | 37,343 | Acadia Realty Trust(ö) | | 3,004 | 82 |
| | | | | Agree Realty Corp. (ö) | | 1,954 | 101 |
| Consumer Staples - 4.0% | | | | Ambac Financial Group, Inc. (Æ) | | 3,553 | 57 |
| Andersons, Inc. (The) | | 17,546 | 547 | American Assets Trust, Inc. (ö) | | 1,669 | 64 |
| B&G Foods, Inc. Class A(Ñ) | | 22,083 | 776 | American Equity Investment Life Holding | | | |
| Boston Beer Co. , Inc. Class A(Æ) | | 441 | 84 | Co. | | 48,472 | 1,491 |
| Calavo Growers, Inc. | | 8,169 | 689 | Amerisafe, Inc. | | 5,319 | 328 |
| Cal-Maine Foods, Inc. (Æ)(Ñ) | | 2,806 | 125 | AmTrust Financial Services, Inc. (Ñ) | | 7,905 | 80 |
| Casey's General Stores, Inc. | | 3,660 | 410 | Argo Group International Holdings, Ltd. | | 2,005 | 124 |
| Core-Mark Holding Co. , Inc. | | 33,801 | 1,067 | Ashford Hospitality Prime, Inc. (ö) | | 7,470 | 73 |
| Energizer Holdings, Inc. | | 44,635 | 2,141 | Aspen Insurance Holdings, Ltd. | | 29,344 | 1,191 |
| Farmer Brothers Co. (Æ) | | 1,446 | 46 | Banc of California, Inc. | | 2,162 | 45 |
| Flowers Foods, Inc. | | 44,673 | 863 | BancFirst Corp. | | 1,676 | 86 |
| Fresh Del Monte Produce, Inc. | | 2,244 | 107 | Bancorp, Inc. (The)(Æ) | | 30,468 | 301 |
| Freshpet, Inc. (Æ) | | 9,996 | 189 | Bank of Marin Bancorp | | 1,736 | 118 |
| Helen of Troy, Ltd. (Æ) | | 1,199 | 116 | Bank of NT Butterfield & Son, Ltd. (The) | | 3,848 | 140 |
| J&J Snack Foods Corp. | | 3,626 | 551 | Bank of the Ozarks, Inc. | | 13,877 | 672 |
| John B Sanfilippo & Son, Inc. | | 1,326 | 84 | BankUnited, Inc. | | 30,299 | 1,234 |
| Lancaster Colony Corp. | | 650 | 84 | BBCN Bancorp, Inc. | | 5,123 | 93 |
| Medifast, Inc. | | 1,646 | 115 | Berkshire Hills Bancorp, Inc. | | 2,450 | 90 |
| New Age Beverages Corp. (Æ)(Ñ) | | 15,880 | 34 | Blackhawk Network Holdings, Inc. Class | | | |
| Nomad Foods, Ltd. (Æ) | | 60,930 | 1,030 | A(Æ) | | 17,928 | 639 |
| Sanderson Farms, Inc. | | 841 | 117 | Brandywine Realty Trust(ö) | | 30,471 | 554 |
| Tootsie Roll Industries, Inc. (Ñ) | | 1,759 | 64 | Brookline Bancorp, Inc. | | 4,999 | 78 |
| Universal Corp. | | 13,326 | 700 | Cannae Holdings, Inc. (Æ) | | 56,997 | 971 |
| USANA Health Sciences, Inc. (Æ) | | 1,116 | 83 | Capital Southwest Corp. | | 5,593 | 93 |
| Village Super Market, Inc. Class A | | 3,140 | 72 | Capitol Federal Financial, Inc. | | 5,208 | 70 |
| Weis Markets, Inc. | | 2,084 | 86 | Capstar Financial Holdings, Inc. (Æ) | | 3,403 | 71 |
| | | | | Carolina Financial Corp. | | 2,744 | 102 |
| | | | 10,180 | CatchMark Timber Trust, Inc. Class A(ö) | | 36,645 | 481 |
| | | | | Cathay General Bancorp | | 2,829 | 119 |
| Energy - 2.5% | | | | Central Valley Community Bancorp | | 3,937 | 79 |
| Basic Energy Services, Inc. (Æ) | | 2,364 | 55 | Chatham Lodging Trust(ö) | | 4,261 | 97 |
| C&J Energy Services, Inc. (Æ) | | 755 | 25 | Chemical Financial Corp. | | 8,153 | 436 |
| Callon Petroleum Co. (Æ) | | 14,981 | 182 | Chemung Financial Corp. | | 1,765 | 85 |
| Carrizo Oil & Gas, Inc. (Æ) | | 14,582 | 310 | Chesapeake Lodging Trust(ö) | | 4,052 | 110 |
| Civeo Corp. (Æ) | | 17,186 | 47 | Civista Bancshares, Inc. | | 1,600 | 35 |
| CONSOL Energy, Inc. (Æ) | | 7,630 | 301 | CNO Financial Group, Inc. | | 42,747 | 1,055 |
| Gores Holdings, Inc. Class A(Æ) | | 37,652 | 558 | CoBiz Financial, Inc. | | 22,320 | 446 |
| Gulfport Energy Corp. (Æ) | | 74,009 | 944 | Cohen & Steers, Inc. | | 12,736 | 602 |
| Independence Contract Drilling, Inc. (Æ) | | 7,700 | 31 | Columbia Banking System, Inc. | | 3,587 | 156 |
| Keane Group, Inc. (Æ) | | 2,637 | 50 | Community Bank System, Inc. | | 7,180 | 386 |
| Mammoth Energy Services, Inc. (Æ) | | 2,683 | 53 | Cousins Properties, Inc. (ö) | | 64,147 | 593 |
| Newpark Resources, Inc. (Æ) | | 28,158 | 242 | Cowen Group, Inc. Class A(Æ) | | 7,372 | 101 |
| Patterson-UTI Energy, Inc. | | 1,811 | 42 | CyrusOne, Inc. (ö) | | 8,619 | 513 |
| PBF Energy, Inc. Class A | | 31,598 | 1,120 | Diamond Hill Investment Group, Inc. | | 1,275 | 263 |
| Range Resources Corp. | | 14,108 | 241 | DiamondRock Hospitality Co. (ö) | | 9,660 | 109 |
| Ring Energy, Inc. (Æ) | | 6,460 | 90 | EastGroup Properties, Inc. (ö) | | 1,434 | 127 |
| Sanchez Energy Corp. (Æ) | | 5,805 | 31 | Education Realty Trust, Inc. (ö) | | 25,377 | 886 |
| SemGroup Corp. Class A | | 17,244 | 521 | eHealth, Inc. (Æ) | | 4,279 | 74 |
| Southwestern Energy Co. (Æ) | | 154,266 | 861 | Employers Holdings, Inc. | | 3,405 | 151 |
| SunCoke Energy, Inc. (Æ) | | 22,195 | 266 | Enova International, Inc. (Æ) | | 5,729 | 87 |
| Transocean, Ltd. (Æ) | | 6,759 | 72 | Evercore, Inc. Class A | | 7,447 | 670 |
| Unit Corp. (Æ) | | 14,121 | 311 | Everi Holdings, Inc. (Æ) | | 8,067 | 61 |
| WPX Energy, Inc. (Æ) | | 3,835 | 54 | Ezcorp, Inc. Class A(Æ) | | 6,882 | 84 |
| | | | 6,407 | Fair Isaac Corp. | | 570 | 87 |
| | | | | FB Financial Corp. (Æ) | | 1,750 | 73 |
See accompanying notes which are an integral part of the financial statements.
32 U.S. Small Cap Equity Fund
Russell Investment Funds
U.S. Small Cap Equity Fund
Schedule of Investments, continued — December 31, 2017
| | | | | | | |
| Amounts in thousands (except share amounts) | | Amounts in thousands (except share amounts) | |
| | | Principal | Fair | | | Principal | Fair |
| | Amount ($) or | Value | | Amount ($) or | Value |
| | | Shares | $ | | | Shares | $ |
| FBL Financial Group, Inc. Class A | | 1,037 | 72 | Live Oak Bancshares, Inc. | | 3,394 | 81 |
| Financial Institutions, Inc. | | 2,390 | 74 | LPL Financial Holdings, Inc. | | 4,033 | 230 |
| First BanCorp(Æ) | | 23,846 | 425 | Mack-Cali Realty Corp. (ö) | | 3,969 | 86 |
| First Citizens BancShares, Inc. Class A | | 265 | 107 | MB Financial, Inc. | | 2,736 | 122 |
| First Commonwealth Financial Corp. | | 70,745 | 1,013 | Medical Properties Trust, Inc. (ö) | | 23,885 | 329 |
| First Defiance Financial Corp. | | 1,427 | 74 | Mercantile Bank Corp. | | 10,270 | 363 |
| First Financial Bancorp | | 3,462 | 91 | Meridian Bancorp, Inc. | | 4,897 | 101 |
| First Financial Corp. | | 2,207 | 100 | MGIC Investment Corp. (Æ) | | 11,749 | 166 |
| First Horizon National Corp. | | 30,567 | 611 | Midland States Bancorp, Inc. | | 1,992 | 65 |
| First Industrial Realty Trust, Inc. (ö) | | 4,185 | 132 | Morningstar, Inc. | | 5,518 | 535 |
| First Internet Bancorp | | 966 | 37 | National Bankshares, Inc. | | 2,227 | 101 |
| First Merchants Corp. | | 1,930 | 81 | National General Holdings Corp. | | 12,391 | 243 |
| First Midwest Bancorp, Inc. | | 4,888 | 117 | National Health Investors, Inc. (ö) | | 1,054 | 79 |
| FNB Corp. | | 181,444 | 2,509 | National Western Life Group, Inc. Class A | | 375 | 124 |
| Four Corners Property Trust, Inc. (ö) | | 3,841 | 99 | NMI Holdings, Inc. Class A(Æ) | | 14,089 | 240 |
| Fulton Financial Corp. | | 5,790 | 104 | Northrim BanCorp, Inc. | | 10,971 | 371 |
| Genworth Financial, Inc. Class A(Æ) | | 22,972 | 71 | Northwest Bancshares, Inc. | | 7,167 | 120 |
| GEO Group, Inc. (The)(ö) | | 4,723 | 111 | OFG Bancorp(Ñ) | | 110,862 | 1,042 |
| German American Bancorp, Inc. | | 10,335 | 365 | Old National Bancorp | | 24,936 | 435 |
| Glacier Bancorp, Inc. | | 2,702 | 106 | OM Asset Management PLC | | 44,596 | 747 |
| Gladstone Commercial Corp. (ö) | | 3,218 | 68 | Opus Bank(Æ) | | 2,713 | 74 |
| Gramercy Property Trust(ö) | | 7,361 | 196 | Owens Realty Mortgage, Inc. (ö) | | 4,603 | 74 |
| Great Western Bancorp, Inc. | | 26,082 | 1,038 | Pacific Premier Bancorp, Inc. (Æ) | | 9,833 | 393 |
| Green Dot Corp. Class A(Æ) | | 13,939 | 840 | PCSB Financial Corp. (Æ) | | 16,808 | 320 |
| Greenhill & Co. , Inc. | | 15,939 | 311 | Pebblebrook Hotel Trust(ö) | | 3,665 | 136 |
| Guaranty Bancorp | | 2,270 | 63 | People's Utah Bancorp | | 2,792 | 85 |
| Hamilton Lane, Inc. Class A | | 1,895 | 67 | Potlatch Corp. (ö) | | 11,418 | 570 |
| Hancock Holding Co. | | 2,823 | 140 | Preferred Bank | | 9,079 | 534 |
| Hanover Insurance Group, Inc. (The) | | 1,795 | 194 | Primerica, Inc. | | 1,690 | 172 |
| Health Insurance Innovations, Inc. Class | | | | Prosperity Bancshares, Inc. | | 16,724 | 1,172 |
| A(Æ) | | 4,384 | 109 | PS Business Parks, Inc. (ö) | | 1,196 | 150 |
| Healthcare Realty Trust, Inc. (ö) | | 3,181 | 102 | Pzena Investment Management, Inc. Class A | | 18,824 | 201 |
| Heritage Commerce Corp. | | 2,964 | 45 | QTS Realty Trust, Inc. Class A(ö) | | 7,762 | 420 |
| Heritage Financial Corp. | | 15,868 | 489 | Quality Care Properties, Inc. (Æ)(ö) | | 7,750 | 107 |
| Heritage Insurance Holdings, Inc. (Ñ) | | 4,151 | 75 | Radian Group, Inc. | | 7,338 | 151 |
| Hersha Hospitality Trust Class A(ö) | | 4,231 | 74 | Rayonier, Inc. (ö) | | 24,960 | 789 |
| Hilltop Holdings, Inc. | | 3,867 | 98 | Redwood Trust, Inc. (ö) | | 5,433 | 81 |
| Home BancShares, Inc. | | 30,111 | 700 | Retail Opportunity Investments Corp. (ö) | | 72,253 | 1,442 |
| Horace Mann Educators Corp. | | 5,150 | 227 | Rexford Industrial Realty, Inc. (ö) | | 4,133 | 121 |
| Iberiabank Corp. | | 14,969 | 1,160 | RLI Corp. | | 1,093 | 66 |
| Independence Realty Trust, Inc. (ö) | | 39,827 | 402 | RLJ Lodging Trust(ö) | | 35,449 | 779 |
| Independent Bank Corp. | | 17,510 | 391 | Ryman Hospitality Properties, Inc. (ö) | | 9,283 | 641 |
| Infinity Property & Casualty Corp. | | 1,239 | 131 | Sabra Health Care REIT, Inc. (ö) | | 3,483 | 65 |
| InfraREIT, Inc. (ö) | | 4,269 | 79 | Safety Insurance Group, Inc. | | 1,267 | 102 |
| Investment Technology Group, Inc. | | 2,641 | 51 | Selective Insurance Group, Inc. | | 2,548 | 150 |
| Investors Bancorp, Inc. | | 9,233 | 128 | Seritage Growth Properties(Ñ)(ö) | | 1,986 | 80 |
| Invitation Homes, Inc. (ö) | | 4,620 | 109 | Shore Bancshares, Inc. | | 4,749 | 79 |
| iStar, Inc. (Æ)(ö) | | 6,969 | 79 | South State Corp. | | 6,311 | 550 |
| Jack Henry & Associates, Inc. | | 6,016 | 704 | STAG Industrial, Inc. (ö) | | 3,648 | 100 |
| James River Group Holdings, Ltd. | | 1,979 | 79 | State Auto Financial Corp. | | 9,330 | 272 |
| JER Investment Trust, Inc. (Æ)(Š)(Å) | | 1,771 | — | State Bank Financial Corp. | | 13,719 | 409 |
| Kearny Financial Corp. | | 92,965 | 1,343 | Sterling Bancorp | | 1,557 | 38 |
| Kemper Corp. | | 2,000 | 138 | Stewart Information Services Corp. | | 1,430 | 60 |
| Kennedy-Wilson Holdings, Inc. | | 19,407 | 337 | Summit Hotel Properties, Inc. (ö) | | 5,844 | 89 |
| Kite Realty Group Trust(ö) | | 3,642 | 71 | Sunstone Hotel Investors, Inc. (ö) | | 11,743 | 194 |
| LaSalle Hotel Properties(ö) | | 7,603 | 213 | Taubman Centers, Inc. (ö) | | 9,449 | 618 |
| LendingTree, Inc. (Æ) | | 2,562 | 872 | TCF Financial Corp. | | 28,114 | 576 |
| Lexington Realty Trust(ö) | | 9,906 | 96 | Terreno Realty Corp. (ö) | | 3,173 | 111 |
See accompanying notes which are an integral part of the financial statements.
U.S. Small Cap Equity Fund 33
Russell Investment Funds
U.S. Small Cap Equity Fund
Schedule of Investments, continued — December 31, 2017
| | | | | | | |
| Amounts in thousands (except share amounts) | | Amounts in thousands (except share amounts) | |
| | | Principal | Fair | | | Principal | Fair |
| | Amount ($) or | Value | | Amount ($) or | Value |
| | | Shares | $ | | | Shares | $ |
| Texas Capital Bancshares, Inc. (Æ) | | 2,164 | 192 | CryoLife, Inc. (Æ) | | 2,316 | 44 |
| Third Point Reinsurance, Ltd. (Æ) | | 3,826 | 56 | Cutera, Inc. (Æ) | | 2,163 | 98 |
| TriState Capital Holdings, Inc. (Æ) | | 1,557 | 36 | Encompass Health Corp. (Æ) | | 23,213 | 1,147 |
| TrustCo Bank Corp. | | 12,289 | 113 | Ensign Group, Inc. (The) | | 31,959 | 709 |
| Trustmark Corp. | | 2,976 | 95 | Epizyme, Inc. (Æ) | | 5,227 | 66 |
| UMB Financial Corp. | | 7,505 | 540 | Esperion Therapeutics, Inc. (Æ) | | 1,758 | 116 |
| UMH Properties, Inc. (ö) | | 7,201 | 107 | Exactech, Inc. (Æ) | | 6,013 | 297 |
| Umpqua Holdings Corp. | | 92,885 | 1,933 | Flexion Therapeutics, Inc. (Æ) | | 3,390 | 85 |
| Union Bankshares Corp. | | 2,655 | 96 | GenMark Diagnostics, Inc. (Æ) | | 7,815 | 33 |
| United Bankshares, Inc. | | 3,296 | 115 | Glaukos Corp. (Æ)(Ñ) | | 2,851 | 73 |
| United Community Banks, Inc. | | 3,137 | 88 | Global Blood Therapeutics, Inc. (Æ) | | 2,491 | 98 |
| Universal Insurance Holdings, Inc. | | 2,883 | 79 | Globus Medical, Inc. Class A(Æ) | | 6,922 | 284 |
| Urban Edge Properties(ö) | | 3,864 | 98 | Halozyme Therapeutics, Inc. (Æ) | | 25,151 | 510 |
| Valley National Bancorp | | 9,512 | 107 | Halyard Health, Inc. (Æ) | | 2,525 | 117 |
| Veritex Holdings, Inc. (Æ) | | 1,215 | 34 | HealthEquity, Inc. (Æ) | | 1,799 | 84 |
| Waddell & Reed Financial, Inc. Class A | | 3,979 | 89 | Healthways, Inc. (Æ) | | 6,914 | 253 |
| Washington Federal, Inc. | | 3,963 | 136 | Heska Corp. (Æ) | | 1,037 | 83 |
| Washington Real Estate Investment Trust(ö) | | 3,281 | 102 | ICU Medical, Inc. (Æ) | | 977 | 211 |
| WesBanco, Inc. | | 11,809 | 480 | ImmunoGen, Inc. (Æ) | | 6,459 | 41 |
| Westamerica Bancorporation | | 8,574 | 511 | Inogen, Inc. (Æ) | | 3,141 | 374 |
| Wintrust Financial Corp. | | 5,832 | 480 | Inovio Pharmaceuticals, Inc. (Æ) | | 13,249 | 55 |
| WisdomTree Investments, Inc. | | 9,197 | 115 | Insulet Corp. (Æ) | | 1,860 | 128 |
| Xenia Hotels & Resorts, Inc. (ö) | | 5,994 | 129 | Integra LifeSciences Holdings Corp. (Æ) | | 8,237 | 394 |
| | | | 57,714 | Intersect ENT, Inc. (Æ) | | 4,338 | 141 |
| | | | | iRhythm Technologies, Inc. (Æ) | | 576 | 32 |
| Health Care - 11.5% | | | | Ironwood Pharmaceuticals, Inc. Class A(Æ) | | 9,834 | 147 |
| Abaxis, Inc. | | 10,510 | 520 | K2M Group Holdings, Inc. (Æ) | | 3,769 | 68 |
| Acadia Healthcare Co. , Inc. (Æ) | | 16,749 | 547 | Lannett Co. , Inc. (Æ)(Ñ) | | 55,488 | 1,288 |
| Acceleron Pharma, Inc. (Æ) | | 1,874 | 80 | LeMaitre Vascular, Inc. | | 2,307 | 73 |
| Aclaris Therapeutics, Inc. (Æ) | | 2,811 | 69 | Ligand Pharmaceuticals, Inc. Class B(Æ) | | 6,102 | 836 |
| Adamas Pharmaceuticals, Inc. (Æ)(Ñ) | | 3,663 | 124 | LivaNova PLC(Æ) | | 603 | 48 |
| Addus HomeCare Corp. (Æ) | | 8,515 | 296 | Luminex Corp. | | 3,297 | 65 |
| Agile Therapeutics, Inc. (Æ) | | 17,938 | 48 | Magellan Health, Inc. (Æ) | | 1,390 | 134 |
| Aimmune Therapeutics, Inc. (Æ) | | 3,781 | 143 | Masimo Corp. (Æ) | | 1,661 | 141 |
| Alkermes PLC(Æ) | | 7,549 | 413 | Medidata Solutions, Inc. (Æ) | | 1,213 | 77 |
| Allscripts Healthcare Solutions, Inc. (Æ) | | 32,862 | 478 | Merit Medical Systems, Inc. (Æ) | | 20,898 | 903 |
| AMAG Pharmaceuticals, Inc. (Æ) | | 35,463 | 470 | Molina Healthcare, Inc. (Æ) | | 4,234 | 325 |
| Amicus Therapeutics, Inc. (Æ) | | 10,759 | 155 | National HealthCare Corp. | | 1,054 | 64 |
| AMN Healthcare Services, Inc. (Æ) | | 11,897 | 586 | National Research Corp. Class A | | 2,114 | 79 |
| Analogic Corp. | | 890 | 75 | Nektar Therapeutics(Æ) | | 3,857 | 230 |
| Anika Therapeutics, Inc. (Æ) | | 1,260 | 68 | Neogen Corp. (Æ) | | 2,087 | 172 |
| Apollo Endosurgery, Inc. (Æ) | | 19,458 | 109 | NeoGenomics, Inc. (Æ) | | 137,563 | 1,220 |
| Array BioPharma, Inc. (Æ) | | 8,924 | 114 | Neos Therapeutics, Inc. (Æ) | | 27,300 | 278 |
| Atrion Corp. | | 201 | 127 | Nevro Corp. (Æ) | | 648 | 45 |
| AxoGen, Inc. (Æ) | | 14,378 | 407 | NxStage Medical, Inc. (Æ) | | 3,121 | 76 |
| BioTelemetry, Inc. (Æ) | | 10,370 | 310 | Omnicell, Inc. (Æ) | | 10,660 | 517 |
| Bioverativ, Inc. (Æ) | | 9,163 | 494 | OraSure Technologies, Inc. (Æ) | | 5,172 | 98 |
| Cambrex Corp. (Æ) | | 2,257 | 108 | Owens & Minor, Inc. | | 2,384 | 45 |
| Capital Senior Living Corp. (Æ) | | 26,584 | 359 | Oxford Immunotec Global PLC(Æ) | | 4,053 | 57 |
| Cara Therapeutics, Inc. (Æ)(Ñ) | | 4,460 | 55 | Pacira Pharmaceuticals, Inc. (Æ) | | 1,243 | 57 |
| Catalent, Inc. (Æ) | | 3,903 | 160 | Paratek Pharmaceuticals, Inc. (Æ) | | 7,116 | 127 |
| Celldex Therapeutics, Inc. (Æ) | | 28,808 | 82 | Penumbra, Inc. (Æ) | | 4,134 | 389 |
| Chemed Corp. | | 3,848 | 935 | PRA Health Sciences, Inc. (Æ) | | 7,512 | 684 |
| Clearside Biomedical, Inc. (Æ) | | 6,335 | 44 | Prestige Brands Holdings, Inc. (Æ) | | 11,986 | 532 |
| Clovis Oncology, Inc. (Æ) | | 2,402 | 163 | Prothena Corp. PLC(Æ) | | 2,745 | 103 |
| Corcept Therapeutics, Inc. (Æ) | | 23,738 | 429 | Puma Biotechnology, Inc. (Æ) | | 1,499 | 148 |
| CorVel Corp. (Æ) | | 4,578 | 242 | Quality Systems, Inc. (Æ) | | 3,762 | 51 |
| Cross Country Healthcare, Inc. (Æ) | | 17,251 | 220 | Radius Health, Inc. (Æ)(Ñ) | | 2,533 | 80 |
See accompanying notes which are an integral part of the financial statements.
34 U.S. Small Cap Equity Fund
Russell Investment Funds
U.S. Small Cap Equity Fund
Schedule of Investments, continued — December 31, 2017
| | | | | | | |
| Amounts in thousands (except share amounts) | | Amounts in thousands (except share amounts) | |
| | | Principal | Fair | | | Principal | Fair |
| | Amount ($) or | Value | | Amount ($) or | Value |
| | | Shares | $ | | | Shares | $ |
| Repligen Corp. (Æ) | | 3,781 | 137 | Owens-Illinois, Inc. (Æ) | | 15,677 | 348 |
| Sage Therapeutics, Inc. (Æ) | | 2,240 | 369 | Patrick Industries, Inc. (Æ) | | 2,969 | 206 |
| Sangamo BioSciences, Inc. (Æ) | | 7,901 | 130 | PGT Innovations, Inc. (Æ) | | 14,934 | 252 |
| Sarepta Therapeutics, Inc. (Æ) | | 3,189 | 177 | PH Glatfelter Co. | | 2,242 | 48 |
| SeaSpine Holdings Corp. (Æ) | | 18,909 | 191 | Platform Specialty Products Corp. (Æ) | | 54,364 | 539 |
| Select Medical Holdings Corp. (Æ) | | 9,486 | 167 | Quaker Chemical Corp. | | 3,597 | 542 |
| Spark Therapeutics, Inc. (Æ) | | 1,663 | 86 | Quanex Building Products Corp. | | 8,527 | 200 |
| Steris PLC | | 6,378 | 558 | Rayonier Advanced Materials, Inc. | | 16,372 | 335 |
| Supernus Pharmaceuticals, Inc. (Æ) | | 21,432 | 854 | RBC Bearings, Inc. (Æ) | | 2,104 | 266 |
| Surmodics, Inc. (Æ) | | 3,820 | 107 | Silgan Holdings, Inc. | | 31,236 | 918 |
| Syneos Health, Inc. (Æ) | | 1,932 | 84 | Simpson Manufacturing Co. , Inc. | | 2,808 | 161 |
| Tactile Systems Technology, Inc. (Æ) | | 15,993 | 463 | SiteOne Landscape Supply, Inc. (Æ) | | 4,353 | 334 |
| Teladoc, Inc. (Æ) | | 2,310 | 81 | Summit Materials, Inc. Class A(Æ) | | 13,929 | 438 |
| TG Therapeutics, Inc. (Æ)(Ñ) | | 9,743 | 80 | Triton International, Ltd. | | 10,184 | 381 |
| Triple-S Management Corp. Class B(Æ) | | 3,878 | 96 | Tronox, Ltd. Class A | | 7,547 | 155 |
| Ultragenyx Pharmaceutical, Inc. (Æ) | | 2,939 | 136 | United States Steel Corp. | | 27,346 | 962 |
| US Physical Therapy, Inc. | | 5,877 | 424 | US Concrete, Inc. (Æ) | | 12,506 | 1,046 |
| Utah Medical Products, Inc. | | 3,677 | 299 | Venator Materials PLC(Æ) | | 3,015 | 67 |
| Varex Imaging Corp. (Æ) | | 33,340 | 1,340 | Versum Materials, Inc. | | 23,723 | 898 |
| VBI Vaccines, Inc. (Æ) | | 28,482 | 122 | | | | 22,344 |
| ViewRay, Inc. (Æ)(Ñ) | | 22,607 | 209 | | | | |
| Voyager Therapeutics, Inc. (Æ) | | 6,326 | 105 | Producer Durables - 12.9% | | | |
| Wright Medical Group NV(Æ) | | 2,243 | 50 | ACCO Brands Corp. (Æ) | | 100,234 | 1,223 |
| Xencor, Inc. (Æ) | | 4,333 | 95 | Advanced Energy Industries, Inc. (Æ) | | 4,737 | 320 |
| | | | 29,420 | AECOM(Æ) | | 10,511 | 390 |
| | | | | Aerojet Rocketdyne Holdings, Inc. (Æ) | | 1,758 | 55 |
| Materials and Processing - 8.8% | | | | Air Transport Services Group, Inc. (Æ) | | 11,789 | 273 |
| A Schulman, Inc. | | 19,513 | 727 | Allied Motion Technologies, Inc. | | 10,591 | 350 |
| Advanced Drainage Systems, Inc. | | 30,396 | 725 | Atlas Air Worldwide Holdings, Inc. (Æ) | | 14,007 | 822 |
| Apogee Enterprises, Inc. | | 27,173 | 1,244 | AZZ, Inc. | | 2,416 | 123 |
| Armstrong Flooring, Inc. (Æ) | | 33,427 | 566 | Badger Meter, Inc. | | 5,779 | 276 |
| Armstrong World Industries, Inc. (Æ) | | 14,240 | 862 | BMX Technologies, Inc. Class W(Æ) | | 18,128 | 1,097 |
| Beacon Roofing Supply, Inc. (Æ) | | 629 | 40 | Brink's Co. (The) | | 10,097 | 795 |
| Bemis Co. , Inc. | | 15,286 | 731 | Casella Waste Systems, Inc. Class A(Æ) | | 4,376 | 101 |
| Builders FirstSource, Inc. (Æ) | | 16,213 | 353 | Columbus McKinnon Corp. | | 6,125 | 245 |
| Carpenter Technology Corp. | | 5,400 | 275 | Costamare, Inc. | | 5,006 | 29 |
| Comfort Systems USA, Inc. | | 15,383 | 671 | Covanta Holding Corp. | | 86,538 | 1,461 |
| Commercial Metals Co. | | 34,755 | 741 | Covenant Transportation Group, Inc. Class | | | |
| Compass Minerals International, Inc. (Ñ) | | 16,909 | 1,222 | A(Æ) | | 2,408 | 69 |
| Culp, Inc. | | 2,452 | 82 | CPI Aerostructures, Inc. (Æ) | | 1,351 | 12 |
| Emerge Energy Services, LP(Æ) | | 4,757 | 34 | CRA International, Inc. | | 6,735 | 303 |
| Ferroglobe PLC(Æ) | | 61,033 | 989 | Deluxe Corp. | | 7,164 | 550 |
| FutureFuel Corp. | | 7,489 | 106 | Ducommun, Inc. (Æ) | | 2,132 | 61 |
| Global Brass & Copper Holdings, Inc. | | 1,209 | 40 | DXP Enterprises, Inc. (Æ) | | 2,405 | 71 |
| Hi-Crush Partners, LP | | 5,444 | 58 | Dycom Industries, Inc. (Æ) | | 1,702 | 190 |
| Ingevity Corp. (Æ) | | 6,179 | 435 | Ennis, Inc. | | 3,335 | 69 |
| Installed Building Products, Inc. (Æ) | | 9,401 | 714 | ExlService Holdings, Inc. (Æ) | | 1,022 | 62 |
| Insteel Industries, Inc. | | 16,902 | 479 | Exponent, Inc. | | 7,357 | 523 |
| Interface, Inc. Class A | | 22,582 | 568 | Flir Systems, Inc. | | 6,581 | 307 |
| ITT, Inc. | | 14,730 | 786 | Forrester Research, Inc. | | 1,122 | 50 |
| JELD-WEN Holding, Inc. (Æ) | | 670 | 26 | Forward Air Corp. | | 4,935 | 283 |
| KMG Chemicals, Inc. | | 715 | 47 | General Cable Corp. | | 20,531 | 608 |
| Koppers Holdings, Inc. (Æ) | | 1,690 | 86 | GP Strategies Corp. (Æ) | | 9,878 | 229 |
| LB Foster Co. Class A(Æ) | | 10,551 | 286 | Granite Construction, Inc. | | 3,348 | 212 |
| LSB Industries, Inc. (Æ) | | 41,829 | 366 | Great Lakes Dredge & Dock Corp. (Æ) | | 34,613 | 187 |
| Neenah Paper, Inc. | | 6,224 | 564 | Greenbrier Cos. , Inc. (Ñ) | | 5,281 | 281 |
| NewMarket Corp. | | 877 | 349 | H&E Equipment Services, Inc. | | 1,297 | 53 |
| NN, Inc. | | 2,758 | 76 | Harsco Corp. (Æ) | | 3,526 | 66 |
See accompanying notes which are an integral part of the financial statements.
U.S. Small Cap Equity Fund 35
Russell Investment Funds
U.S. Small Cap Equity Fund
Schedule of Investments, continued — December 31, 2017
| | | | | | | |
| Amounts in thousands (except share amounts) | | Amounts in thousands (except share amounts) | |
| | | Principal | Fair | | | Principal | Fair |
| | Amount ($) or | Value | | Amount ($) or | Value |
| | | Shares | $ | | | Shares | $ |
| Healthcare Services Group, Inc. | | 11,882 | 626 | Technology - 12.5% | | | |
| HEICO Corp. | | 11,419 | 1,077 | Acxiom Corp. (Æ) | | 15,513 | 428 |
| HNI Corp. | | 18,633 | 719 | Adesto Technologies Corp. (Æ) | | 23,543 | 152 |
| Hudson Technologies, Inc. (Æ) | | 64,515 | 392 | Alarm. com Holdings, Inc. (Æ) | | 4,926 | 186 |
| Information Services Group, Inc. (Æ) | | 53,611 | 224 | Anixter International, Inc. (Æ) | | 2,044 | 155 |
| InnerWorkings, Inc. (Æ) | | 5,634 | 57 | Apptio, Inc. Class A(Æ) | | 13,582 | 319 |
| JetBlue Airways Corp. (Æ) | | 30,301 | 677 | Aspen Technology, Inc. (Æ) | | 1,647 | 109 |
| John Bean Technologies Corp. | | 3,716 | 412 | Asure Software, Inc. (Æ)(Ñ) | | 15,865 | 224 |
| KBR, Inc. | | 53,424 | 1,059 | AVX Corp. | | 5,301 | 92 |
| Kimball International, Inc. Class B | | 11,881 | 222 | Benchmark Electronics, Inc. (Æ) | | 5,130 | 149 |
| KLX, Inc. (Æ) | | 5,746 | 392 | Blackline, Inc. (Æ) | | 8,190 | 269 |
| Knight-Swift Transportation Holdings, Inc. | | | | Blucora, Inc. (Æ) | | 2,536 | 56 |
| (Æ) | | 16,806 | 735 | CACI International, Inc. Class A(Æ) | | 852 | 113 |
| Kornit Digital, Ltd. (Æ) | | 4,295 | 69 | CalAmp Corp. (Æ) | | 41,171 | 882 |
| Littelfuse, Inc. | | 2,818 | 557 | Callidus Software, Inc. (Æ) | | 28,307 | 811 |
| Lydall, Inc. (Æ) | | 2,699 | 137 | Carbonite, Inc. (Æ) | | 35,719 | 897 |
| Manitowoc Co. , Inc. (The)(Æ) | | 12,929 | 509 | Cars. com, Inc. (Æ)(Ñ) | | 17,575 | 507 |
| Marten Transport, Ltd. | | 9,600 | 195 | CEVA, Inc. (Æ) | | 5,600 | 258 |
| MasTec, Inc. (Æ) | | 18,544 | 908 | Cirrus Logic, Inc. (Æ) | | 2,017 | 105 |
| MAXIMUS, Inc. | | 5,029 | 360 | Coherent, Inc. (Æ) | | 1,121 | 316 |
| McGrath RentCorp | | 12,403 | 583 | CommerceHub, Inc. (Æ) | | 17,081 | 352 |
| Milacron Holdings Corp. (Æ) | | 2,223 | 43 | Conduent, Inc. (Æ) | | 47,383 | 766 |
| Mitek Systems, Inc. (Æ) | | 13,537 | 121 | Cornerstone OnDemand, Inc. (Æ) | | 11,519 | 407 |
| Mobile Mini, Inc. | | 20,733 | 715 | Coupa Software, Inc. (Æ) | | 4,364 | 136 |
| Modine Manufacturing Co. (Æ) | | 2,179 | 44 | Cypress Semiconductor Corp. | | 19,356 | 295 |
| MSC Industrial Direct Co. , Inc. Class A | | 1,557 | 150 | Diebold Nixdorf, Inc. | | 44,312 | 725 |
| NV5 Global, Inc. (Æ) | | 6,850 | 371 | Diodes, Inc. (Æ) | | 13,319 | 382 |
| Old Dominion Freight Line, Inc. | | 5,745 | 756 | Ellie Mae, Inc. (Æ) | | 853 | 76 |
| On Assignment, Inc. (Æ) | | 11,596 | 745 | EPAM Systems, Inc. (Æ) | | 877 | 94 |
| Orion Group Holdings, Inc. (Æ) | | 15,599 | 122 | Everbridge, Inc. (Æ) | | 9,131 | 271 |
| Quanta Services, Inc. (Æ) | | 9,582 | 375 | Fabrinet(Æ) | | 3,556 | 102 |
| Radiant Logistics, Inc. (Æ) | | 13,199 | 61 | Finisar Corp. (Æ) | | 38,424 | 782 |
| Ritchie Bros Auctioneers, Inc. (Ñ) | | 17,532 | 525 | FireEye, Inc. (Æ) | | 51,171 | 727 |
| Ryder System, Inc. | | 6,299 | 530 | Five9, Inc. (Æ) | | 64,932 | 1,616 |
| Saia, Inc. (Æ) | | 8,937 | 632 | Fusion Telecommunications International, | | | |
| Schneider National, Inc. Class B(Ñ) | | 8,766 | 250 | Inc. (Æ) | | 63,920 | 240 |
| SkyWest, Inc. | | 7,172 | 381 | Glu Mobile, Inc. (Æ) | | 33,337 | 121 |
| Spartan Motors, Inc. | | 19,488 | 307 | Groupon, Inc. Class A(Æ) | | 23,583 | 120 |
| SPX FLOW, Inc. (Æ) | | 637 | 30 | GrubHub, Inc. (Æ) | | 4,957 | 356 |
| Square, Inc. Class A(Æ) | | 6,768 | 235 | GSI Group, Inc. (Æ) | | 2,633 | 132 |
| Standex International Corp. | | 5,319 | 542 | GTT Communications, Inc. (Æ) | | 7,585 | 356 |
| Steelcase, Inc. Class A | | 30,572 | 465 | Hortonworks, Inc. (Æ) | | 3,882 | 78 |
| Strattec Security Corp. | | 3,493 | 152 | Insight Enterprises, Inc. (Æ) | | 4,702 | 180 |
| Sun Hydraulics Corp. | | 2,589 | 167 | Integrated Device Technology, Inc. (Æ) | | 27,645 | 822 |
| Sykes Enterprises, Inc. (Æ) | | 3,386 | 106 | InterXion Holding NV(Æ) | | 1,208 | 71 |
| TopBuild Corp. (Æ) | | 2,327 | 176 | Kimball Electronics, Inc. (Æ) | | 17,853 | 326 |
| Triumph Group, Inc. | | 7,572 | 206 | Liberty Expedia Holdings, Inc. Class A(Æ) | | 3,412 | 151 |
| Tutor Perini Corp. (Æ) | | 10,389 | 263 | Liberty Interactive Corp. (Æ) | | 18,711 | 1,015 |
| Vishay Precision Group, Inc. (Æ) | | 3,079 | 77 | LogMeIn, Inc. | | 3,443 | 394 |
| WageWorks, Inc. (Æ) | | 12,318 | 764 | Magnachip Semiconductor Corp. (Æ)(Ñ) | | 13,352 | 133 |
| Watts Water Technologies, Inc. Class A | | 1,778 | 135 | Meet Group, Inc. (Æ) | | 25,706 | 72 |
| Welbilt, Inc. (Æ) | | 13,826 | 325 | Mellanox Technologies, Ltd. (Æ) | | 5,101 | 330 |
| WNS Holdings, Ltd. - ADR(Æ) | | 11,228 | 451 | Mercury Systems, Inc. (Æ) | | 4,781 | 246 |
| YRC Worldwide, Inc. (Æ) | | 51,435 | 740 | Methode Electronics, Inc. | | 4,184 | 168 |
| Zebra Technologies Corp. Class A(Æ) | | 2,789 | 289 | Mimecast, Ltd. (Æ) | | 20,385 | 584 |
| | | | 32,907 | Mindbody Inc. Class A(Æ) | | 1,991 | 61 |
| | | | | MKS Instruments, Inc. | | 1,421 | 134 |
| | | | | Model N, Inc. (Æ) | | 4,627 | 73 |
See accompanying notes which are an integral part of the financial statements.
36 U.S. Small Cap Equity Fund
Russell Investment Funds
U.S. Small Cap Equity Fund
Schedule of Investments, continued — December 31, 2017
| | | | | | | | | | | |
| Amounts in thousands (except share amounts) | | | Amounts in thousands (except share amounts) | | | |
| | | Principal | Fair | | | | | Principal | | Fair | |
| | Amount ($) or | Value | | | | Amount ($) or | | Value | |
| | | Shares | $ | | | | | Shares | | $ | |
| MongoDB, Inc. (Æ) | | 908 | 27 | | Idacorp, Inc. | | | 2,252 | | 206 | |
| Monolithic Power Systems, Inc. | | 2,392 | 269 | | IDT Corp. Class B | | | 4,396 | | 47 | |
| NCR Corp. (Æ) | | 14,261 | 485 | | j2 Global, Inc. | | | 9,735 | | 730 | |
| NETGEAR, Inc. (Æ) | | 3,608 | 212 | | MGE Energy, Inc. | | | 1,173 | | 74 | |
| NetScout Systems, Inc. (Æ) | | 3,368 | 103 | | Midstates Petroleum Co. , Inc. (Æ) | | | 23,153 | | 384 | |
| NIC, Inc. | | 16,743 | 278 | | New Jersey Resources Corp. | | | 4,001 | | 161 | |
| Nice, Ltd. - ADR | | 353 | 32 | | Northwest Natural Gas Co. | | | 1,663 | | 99 | |
| Nutanix, Inc. Class A(Æ) | | 8,878 | 313 | | NorthWestern Corp. | | | 2,016 | | 120 | |
| Oclaro, Inc. (Æ) | | 6,418 | 43 | | NRG Yield, Inc. Class A | | | 31,242 | | 589 | |
| Orbotech, Ltd. (Æ) | | 6,704 | 337 | | NRG Yield, Inc. Class C | | | 8,853 | | 167 | |
| Paycom Software, Inc. (Æ) | | 1,907 | 153 | | ONE Gas, Inc. | | | 2,727 | | 200 | |
| PC Connection, Inc. | | 4,918 | 129 | | Ormat Technologies, Inc. | | | 1,412 | | 90 | |
| PDF Solutions, Inc. (Æ) | | 27,140 | 426 | | Otter Tail Corp. | | | 1,774 | | 79 | |
| Perficient, Inc. (Æ) | | 25,024 | 477 | | Pattern Energy Group, Inc. Class A | | | 2,134 | | 46 | |
| Power Integrations, Inc. | | 8,042 | 591 | | PNM Resources, Inc. | | | 2,407 | | 97 | |
| Proofpoint, Inc. (Æ) | | 5,075 | 451 | | Portland General Electric Co. | | | 2,494 | | 114 | |
| Q2 Holdings, Inc. (Æ) | | 5,610 | 207 | | Pure Cycle Corp. (Æ) | | | 13,964 | | 117 | |
| Quantenna Communications, Inc. (Æ) | | 5,413 | 66 | | Resolute Energy Corp. (Æ) | | | 2,151 | | 68 | |
| RADCOM, Ltd. (Æ) | | 10,892 | 216 | | RingCentral, Inc. Class A(Æ) | | | 11,290 | | 546 | |
| Rapid7, Inc. (Æ) | | 3,100 | 58 | | South Jersey Industries, Inc. | | | 10,471 | | 327 | |
| RealPage, Inc. (Æ) | | 16,769 | 743 | | Southwest Gas Holdings, Inc. | | | 1,881 | | 151 | |
| Rogers Corp. (Æ) | | 2,530 | 410 | | Spark Energy, Inc. Class A(Ñ) | | | 4,334 | | 54 | |
| Sanmina Corp. (Æ) | | 5,308 | 175 | | Spire, Inc. | | | 2,602 | | 196 | |
| Sapiens International Corp. NV | | 13,728 | 158 | | Vistra Energy Corp. (Æ) | | | 34,406 | | 630 | |
| ScanSource, Inc. (Æ) | | 4,699 | 168 | | WGL Holdings, Inc. | | | 1,757 | | 151 | |
| Science Applications International Corp. | | 4,911 | 376 | | Whiting Petroleum Corp. (Æ) | | | 22,171 | | 587 | |
| Semtech Corp. (Æ) | | 1,487 | 51 | | | | | | | 9,907 | |
| ShotSpotter, Inc. (Æ)(Ñ) | | 10,854 | 152 | | | | | | | | |
| |
| Super Micro Computer, Inc. (Æ) | | 29,309 | 613 | | Total Common Stocks | | | | | | |
| Synaptics, Inc. (Æ) | | 8,571 | 342 | | | | | | | | |
| Synchronoss Technologies, Inc. (Æ) | | 8,018 | 72 | | (cost $204,988) | | | | | 238,136 | |
| SYNNEX Corp. | | 792 | 108 | | | | | | | | |
| Tech Data Corp. (Æ) | | 790 | 77 | | Investments in Other Funds - 0.1% | | | | | | |
| Tyler Technologies, Inc. (Æ) | | 243 | 43 | | Financial Services - 0.1% | | | | | | |
| USA Technologies, Inc. (Æ) | | 55,750 | 544 | | SPDR S&P Biotech ETF | | | 3,396 | | 288 | |
| Varonis Systems, Inc. (Æ) | | 17,104 | 830 | | Total Investments in Other Funds | | | | | | |
| VeriFone Systems, Inc. (Æ) | | 75,680 | 1,340 | | (cost $285) | | | | | 288 | |
| Vishay Intertechnology, Inc. | | 9,054 | 188 | | | | | | | | |
| Vocera Communications, Inc. (Æ) | | 8,258 | 250 | Short | -Term Investments - 6.2% | | | | | | |
| Web. com Group, Inc. (Æ) | | 2,764 | 60 | | U. S. Cash Management Fund(@) | | | 15,785,658 | (8) | 15,786 | |
| Xperi Corp. | | 58,147 | 1,419 | | Total Short-Term Investments | | | | | | |
| | | | 31,914 | | (cost $15,787) | | | | | 15,786 | |
| |
| Utilities - 3.9% | | | | | Other Securities - 4.3% | | | | | | |
| Algonquin Power & Utilities Corp. (Ñ) | | 51,046 | 570 | | U. S. Cash Collateral Fund(×)(@) | | | 10,926,795 | (8) | 10,927 | |
| Allete, Inc. | | 2,235 | 166 | | Total Other Securities | | | | | | |
| American States Water Co. | | 14,623 | 847 | | (cost $10,927) | | | | | 10,927 | |
| Antero Midstream GP LP | | 6,791 | 134 | | | | | | | | |
| Avista Corp. | | 2,825 | 145 | | | | | | | | |
| Black Hills Corp. | | 1,284 | 77 | | Total Investments 104.0% | | | | | | |
| Boingo Wireless, Inc. (Æ) | | 41,496 | 934 | | (identified cost $231,987) | | | | | 265,137 | |
| California Water Service Group | | 2,148 | 97 | | | | | | | | |
| Chesapeake Utilities Corp. | | 1,052 | 83 | | Other Assets and Liabilities, Net | | | | | | |
| Cogent Communications Holdings, Inc. | | 8,127 | 368 | - | (4.0%) | | | | | (10,283 | ) |
| Comstock Resources, Inc. (Æ) | | 3,703 | 31 | | Net Assets - 100.0% | | | | | 254,854 | |
| Dynegy, Inc. Class A(Æ) | | 16,075 | 190 | | | | | | | | |
| El Paso Electric Co. | | 2,684 | 149 | | | | | | | | |
| Gogo, Inc. (Æ)(Ñ) | | 7,620 | 86 | | | | | | | | |
See accompanying notes which are an integral part of the financial statements.
U.S. Small Cap Equity Fund 37
Russell Investment Funds
U.S. Small Cap Equity Fund
Schedule of Investments, continued — December 31, 2017
| | | | | | | | | | | | | | | | | | | |
| Restricted Securities | | | | | | | | | | | | | | | | | | | |
| Amounts in thousands (except share and cost per unit amounts) | | | | | | | | | | | | | |
| | | | | | | | | | | Principal | | | Cost per | Cost | | Fair Value | |
| % of Net Assets | | | | | Acquisition | | Amount ($) | | | Unit | (000 | ) | (000 | ) |
| Securities | | | | | | Date | | or shares | | | $ | | $ | | $ | |
| 0.1% | | | | | | | | | | | | | | | | | | | |
| JER Investment Trust, Inc. | | | | | 05/27/04 | | | 1,771 | | | 82.03 | | 145 | | — | |
| Tandy Leather Factory, Inc. | | | | | 03/17/14 | | | 22,912 | | | | 8.65 | | 198 | | 176 | |
| | | | | | | | | | | | | | | | | | | 176 | |
| For a description of restricted securities see note 7 in the Notes to Financial Statements. | | | | | | | | | |
| |
| Futures Contracts | | | | | | | | | | | | | | | | | | | |
| Amounts in thousands (except contract amounts) | | | | | | | | | | | | | | | | |
| | | | | | | | | | | | | | | | | | | Value and | |
| | | | | | | | | | | | | | | | | | | Unrealized | |
| | | | | | | | | | | | | | | | | Appreciation | |
| | | | | | | Number of | | Notional | | Expiration | (Depreciation) | |
| | | | | | | Contracts | | Amount | | | Date | | | $ | |
| Long Positions | | | | | | | | | | | | | | | | | | | |
| Russell 2000 E-Mini Index Futures | | | | | | | | 108 | | USD | 8,297 | | | 03/18 | | | 49 | |
| Total Value and Unrealized Appreciation (Depreciation) on Open Futures Contracts (å) | | | | | | | | | | | | 49 | |
| |
| |
| Presentation of Portfolio Holdings | | | | | | | | | | | | | | | | |
| Amounts in thousands | | | | | | | | | | | | | | | | | | | |
| | | | | | | | Fair Value | | | | | | | | | | | |
| | | | | | | | | | | Practical | | | | | | | | |
| Portfolio Summary | | | Level 1 | | Level 2 | | Level 3 | Expedient (a) | | | Total | % of Net Assets | |
| Common Stocks | | | | | | | | | | | | | | | | | | | |
| Consumer Discretionary | | $ | 37,343 | $ | — | $ | | | — | $ | — | | $ | | 37,343 | | | 14.7 | |
| Consumer Staples | | | 10,180 | | — | | | | — | | — | | | | 10,180 | | | 4.0 | |
| Energy | | | 6,407 | | — | | | | — | | — | | | | 6,407 | | | 2.5 | |
| Financial Services | | | 57,714 | | — | | | | — | | — | | | | 57,714 | | | 22.6 | |
| Health Care | | | 29,420 | | — | | | | — | | — | | | | 29,420 | | | 11.5 | |
| Materials and Processing | | | 22,344 | | — | | | | — | | — | | | | 22,344 | | | 8.8 | |
| Producer Durables | | | 32,907 | | — | | | | — | | — | | | | 32,907 | | | 12.9 | |
| Technology | | | 31,914 | | — | | | | — | | — | | | | 31,914 | | | 12.5 | |
| Utilities | | | 9,907 | | — | | | | — | | — | | | | 9,907 | | | 3.9 | |
| Investments in Other Funds | | | 288 | | — | | | | — | | — | | | | 288 | | | 0.1 | |
| Short-Term Investments | | | — | | — | | | | — | | 15,786 | | | | 15,786 | | | 6.2 | |
| Other Securities | | | — | | — | | | | — | | 10,927 | | | | 10,927 | | | 4.3 | |
| Total Investments | | | 238,424 | | — | | | | — | | 26,713 | | | 265,137 | | | 104.0 | |
| Other Assets and Liabilities, Net | | | | | | | | | | | | | | | | | | (4.0 | ) |
| | | | | | | | | | | | | | | | | | | 100.0 | |
| Other Financial Instruments | | | | | | | | | | | | | | | | | | | |
| Assets | | | | | | | | | | | | | | | | | | | |
| Futures Contracts | | | 49 | | — | | | | — | | — | | | | 49 | | | — * | |
| Total Other Financial Instruments** | | $ | 49 | $ | — | $ | | | — | $ | — | | $ | | 49 | | | | |
See accompanying notes which are an integral part of the financial statements.
38 U.S. Small Cap Equity Fund
Russell Investment Funds
U.S. Small Cap Equity Fund
Schedule of Investments, continued — December 31, 2017
* Less than 0.05% of net assets.
** Futures and foreign currency exchange contract values reflect the unrealized appreciation (depreciation) on the investments.
(a) Certain investments that are measured at fair value using the net asset value per share (or its equivalent) practical expedient have not been classified
in the fair value levels. The fair value amounts presented in the table are intended to permit reconciliation to the amounts presented in the Schedule of
Investments.
For a description of the Levels, see note 2 in the Notes to Financial Statements.
For a disclosure on transfers between Levels 1, 2 and 3 during the period ended December 31, 2017, see note 2 in the Notes to
Financial Statements.
See accompanying notes which are an integral part of the financial statements.
U.S. Small Cap Equity Fund 39
Russell Investment Funds
U.S. Small Cap Equity Fund
Fair Value of Derivative Instruments — December 31, 2017
Amounts in thousands
| | | |
| | | Equity |
| Derivatives not accounted for as hedging instruments | Contracts |
| |
| Location: Statement of Assets and Liabilities - Assets | | |
| Variation margin on futures contracts* | | $ | 49 |
| |
| |
| | | Equity |
| Derivatives not accounted for as hedging instruments | Contracts |
| |
| Location: Statement of Operations - Net realized gain (loss) | | |
| Futures contracts | | $ | 325 |
| |
| |
| Location: Statement of Operations - Net change in unrealized appreciation (depreciation) | | |
| Futures contracts | | $ | 170 |
* Includes cumulative appreciation/depreciation of futures contracts as reported in the Schedule of Investments. Only variation margin is reported within the
Statement of Assets and Liabilities.
For further disclosure on derivatives see note 2 in the Notes to Financial Statements.
See accompanying notes which are an integral part of the financial statements.
40 U.S. Small Cap Equity Fund
Russell Investment Funds
U.S. Small Cap Equity Fund
Balance Sheet Offsetting of Financial and Derivative Instruments —
December 31, 2017
| | | | | | | | | |
| Amounts in thousands | | | | | | | | | |
| |
| Offsetting of Financial Assets and Derivative Assets | | | | | | | | |
| | | | | Gross | Net Amounts | |
| | | | | Amounts | | of Assets | |
| | | | Gross | Offset in the | Presented in | |
| | | Amounts of | Statement of | the Statement | |
| | | Recognized | Assets and | of Assets and | |
| Description | Location: Statement of Assets and Liabilities - Assets | | Assets | Liabilities | | Liabilities | |
| Securities on Loan* | Investments, at fair value | $ | 10,671 | | $ | — $ | 10,671 | |
| Futures Contracts | Variation margin on futures contracts | | 198 | | | — | 198 | |
| Total Financial and Derivative Assets | | | 10,869 | | | — | 10,869 | |
| Financial and Derivative Assets not subject to a netting agreement | | (198 | ) | | — | (198 | ) |
| Total Financial and Derivative Assets subject to a netting agreement | $ | 10,671 | | $ | — $ | 10,671 | |
| | | | | | | | | | |
| Financial Assets, Derivative Assets, and Collateral Held by Counterparty | | | | | | | | | |
| | | | Gross Amounts Not Offset in | | |
| | | | the Statement of Assets and | | |
| | | | | | Liabilities | | | | |
| |
| | Net Amounts | | | | | | | | |
| | | of Assets | | | | | | | | |
| | Presented in | | | | | | | | |
| | the Statement | Financial and | | | | | |
| | of Assets and | Derivative | Collateral | | | |
| Counterparty | | Liabilities | Instruments | Received^ | Net Amount |
| Barclays | $ | 823 | | $ | — | $ | 823 | | $ | — |
| Citigroup | | 462 | | | — | | 462 | | | — |
| Goldman Sachs | | 3,448 | | | — | | 3,448 | | | — |
| JPMorgan Chase | | 107 | | | — | | 107 | | | — |
| Merrill Lynch | | 2,001 | | | — | | 2,001 | | | — |
| Morgan Stanley | | 3,587 | | | — | | 3,587 | | | — |
| UBS | | 243 | | | — | | 243 | | | — |
| Total | $ | 10,671 | | $ | — | $ | 10,671 | | $ | — |
* Fair value of securities on loan as reported in the footnotes to the Statement of Assets and Liabilities.
^ Collateral received or pledged amounts may not reconcile to those disclosed in the Statement of Assets and Liabilities due to the inclusion of off-Balance
Sheet collateral and adjustments made to exclude overcollateralization.
For further disclosure on derivatives and counterparty risk see note 2 in the Notes to Financial Statements.
See accompanying notes which are an integral part of the financial statements.
U.S. Small Cap Equity Fund 41
Russell Investment Funds
U.S. Small Cap Equity Fund
Statement of Assets and Liabilities — December 31, 2017
| | |
| Amounts in thousands | | |
| Assets | | |
| Investments, at identified cost | $ | 231,987 |
| Investments, at fair value(*)(>) | | 265,137 |
| Cash (restricted)(a) | | 49 |
| Receivables: | | |
| Dividends and interest | | 215 |
| Dividends from affiliated funds | | 18 |
| Investments sold | | 2,497 |
| Fund shares sold | | 4 |
| Variation margin on futures contracts | | 198 |
| Total assets | | 268,118 |
| |
| Liabilities | | |
| Payables: | | |
| Investments purchased | | 2,043 |
| Fund shares redeemed | | 17 |
| Accrued fees to affiliates | | 207 |
| Other accrued expenses | | 70 |
| Payable upon return of securities loaned | | 10,927 |
| Total liabilities | | 13,264 |
| |
| Net Assets | $ | 254,854 |
See accompanying notes which are an integral part of the financial statements.
42 U.S. Small Cap Equity Fund
Russell Investment Funds
U.S. Small Cap Equity Fund
Statement of Assets and Liabilities, continued — December 31, 2017
| | | |
| Amounts in thousands | | | |
| Net Assets Consist of: | | | |
| Undistributed (overdistributed) net investment income | $ | 257 | |
| Accumulated net realized gain (loss) | | 16,682 | |
| Unrealized appreciation (depreciation) on: | | | |
| Investments | | 33,151 | |
| Investments in affiliated funds | | (1 | ) |
| Futures contracts | | 49 | |
| Shares of beneficial interest | | 155 | |
| Additional paid-in capital | | 204,561 | |
| Net Assets | $ | 254,854 | |
| |
| Net Asset Value, offering and redemption price per share: | | | |
| Net asset value per share: (#) | $ | 16.40 | |
| Net assets | $ | 254,853,785 | |
| Shares outstanding ($. 01 par value) | | 15,538,321 | |
| Amounts in thousands | | | |
| (*) Securities on loan included in investments | $ | 10,671 | |
| (>) Investments in affiliates, U. S. Cash Management Fund and U. S. Cash Collateral Fund | $ | 26,713 | |
| |
| (a) Cash Collateral for Futures | $ | 49 | |
| (#) Net asset value per share equals net assets divided by shares of beneficial interest outstanding. | | | |
See accompanying notes which are an integral part of the financial statements.
U.S. Small Cap Equity Fund 43
Russell Investment Funds
U.S. Small Cap Equity Fund
Statement of Operations — For the Period Ended December 31, 2017
| | | |
| Amounts in thousands | | | |
| Investment Income | | | |
| Dividends | $ | 2,512 | |
| Dividends from affiliated funds | | 126 | |
| Interest | | 1 | |
| Securities lending income (net) | | 121 | |
| Securities lending income from affiliated funds (net) | | 174 | |
| Total investment income | | 2,934 | |
| |
| Expenses | | | |
| Advisory fees | | 2,194 | |
| Administrative fees | | 122 | |
| Custodian fees | | 60 | |
| Transfer agent fees | | 11 | |
| Professional fees | | 67 | |
| Trustees’ fees | | 6 | |
| Printing fees | | 34 | |
| Miscellaneous | | 16 | |
| Total expenses | | 2,510 | |
| Net investment income (loss) | | 424 | |
| |
| Net Realized and Unrealized Gain (Loss) | | | |
| Net realized gain (loss) on: | | | |
| Investments | | 37,164 | |
| Investments in affiliated funds | | 1 | |
| Futures contracts | | 325 | |
| Net realized gain (loss) | | 37,490 | |
| Net change in unrealized appreciation (depreciation) on: | | | |
| Investments | | (2,184 | ) |
| Investments in affiliated funds | | (2 | ) |
| Futures contracts | | 170 | |
| Net change in unrealized appreciation (depreciation) | | (2,016 | ) |
| Net realized and unrealized gain (loss) | | 35,474 | |
| Net Increase (Decrease) in Net Assets from Operations | $ | 35,898 | |
See accompanying notes which are an integral part of the financial statements.
44 U.S. Small Cap Equity Fund
Russell Investment Funds
U.S. Small Cap Equity Fund
Statements of Changes in Net Assets
| | | | | | |
| | For the Periods Ended December 31, | |
| Amounts in thousands | | 2017 | | | 2016 | |
| Increase (Decrease) in Net Assets | | | | | | |
| Operations | | | | | | |
| Net investment income (loss) | $ | 424 | | $ | 1,610 | |
| Net realized gain (loss) | | 37,490 | | | 3,178 | |
| Net change in unrealized appreciation (depreciation) | | (2,016 | ) | | 32,497 | |
| Net increase (decrease) in net assets from operations | | 35,898 | | | 37,285 | |
| |
| Distributions | | | | | | |
| From net investment income | | (428 | ) | | (1,537 | ) |
| From net realized gain | | (16,588 | ) | | (116 | ) |
| From return of capital | | — | | | (219 | ) |
| Net decrease in net assets from distributions | | (17,016 | ) | | (1,872 | ) |
| |
| Share Transactions* | | | | | | |
| Net increase (decrease) in net assets from share transactions | | 7,257 | | | (24,761 | ) |
| Total Net Increase (Decrease) in Net Assets | | 26,139 | | | 10,652 | |
| |
| Net Assets | | | | | | |
| Beginning of period | | 228,715 | | | 218,063 | |
| End of period | $ | 254,854 | | $ | 228,715 | |
| Undistributed (overdistributed) net investment income included in net assets | $ | 257 | | $ | 261 | |
* Share transaction amounts (in thousands) for the periods ended December 31, 2017 and December 31, 2016 were as follows:
| | | | | | | | | | | | |
| | | 2017 | | | | 2016 | | |
| | | Shares | | | Dollars | | | Shares | | | Dollars | |
| |
| Proceeds from shares sold | | 1,771 | | $ | 27,847 | | | 497 | | $ | 6,506 | |
| Proceeds from reinvestment of distributions | | 1,034 | | | 17,015 | | | 137 | | | 1,872 | |
| Payments for shares redeemed | | (2,300 | ) | | (37,605 | ) | | (2,463 | ) | | (33,139 | ) |
| Total increase (decrease) | | 505 | | $ | 7,257 | | | (1,829 | ) | $ | (24,761 | ) |
See accompanying notes which are an integral part of the financial statements.
U.S. Small Cap Equity Fund 45
Russell Investment Funds
U.S. Small Cap Equity Fund
Financial Highlights — For the Periods Ended
For a Share Outstanding Throughout Each Period.
| | | | | | | | | | | | | | | | | | | |
| | | | | $ | | | | | | | | | | | | | | | |
| | | $ | | Net | | $ | | | $ | | | $ | | | $ | | | | |
| | Net Asset Value, | | Investment | | Net Realized | | | Total from | | | Distributions | | | Distributions | | | $ | |
| | Beginning of | | Income | | and Unrealized | | | Investment | | | from Net | | | from Net | | | Return of | |
| | | Period | | (Loss)(a)(b) | | Gain (Loss) | | | Operations | | | Investment Income | | | Realized Gain | | | Capital | |
| December 31, 2017 | | 15.21 | | . 03 | | 2.33 | | | 2.36 | | | (. 03 | ) | | (1.14 | ) | | — | |
| December 31, 2016 | | 12.93 | | . 10 | | 2.30 | | | 2.40 | | | (. 10 | ) | | (. 01 | ) | | (. 01 | ) |
| December 31, 2015 | | 15.51 | | . 09 | | (1.19 | ) | | (1.10 | ) | | (. 10 | ) | | (1.38 | ) | | — | |
| December 31, 2014 | | 16.88 | | . 06 | | . 18 | | | . 24 | | | (. 04 | ) | | (1.57 | ) | | — | |
| December 31, 2013 | | 13.02 | | . 08 | | 5.11 | | | 5.19 | | | (. 07 | ) | | (1.26 | ) | | — | |
| | | | | | | | | | | | | | | | | | | | |
See accompanying notes which are an integral part of the financial statements.
46 U.S. Small Cap Equity Fund
| | | | | | | | | | | | | | | | | |
| | | | | | | | | | | | | % | | % | | % | |
| | | | | $ | | | | | $ | | | Ratio of Expenses | Ratio of Expenses | | Ratio of Net | |
| | | | | Net Asset Value, | | % | | | Net Assets, | | | to Average | to Average | | Investment Income | % |
| | $ | | | End of | | Total | | | End of Period | | | Net Assets, | Net Assets, | | to Average | Portfolio |
| Total Distributions | | | Period | | Return(d) | | | (000 | ) | | Gross(e) | Net(b)(e) | | Net Assets(b) | Turnover Rate |
| (1.17 | ) | | 16.40 | | 15.48 | | | 254,854 | | | 1.03 | | 1.03 | | . 17 | 135 |
| (. 12 | ) | | 15.21 | | 18.66 | | | 228,715 | | | 1.03 | | 1.03 | | . 76 | 106 |
| (1.48 | ) | | 12.93 | | (7.19 | ) | | 218,063 | | | 1.06 | | 1.04 | | . 61 | 138 |
| (1.61 | ) | | 15.51 | | 1.56 | | | 253,803 | | | 1.06 | | 1.01 | | . 35 | 80 |
| (1.33 | ) | | 16.88 | | 40.00 | | | 237,828 | | | 1.05 | | 1.00 | | . 50 | 77 |
See accompanying notes which are an integral part of the financial statements.
U.S. Small Cap Equity Fund 47
Russell Investment Funds
U.S. Small Cap Equity Fund
Related Party Transactions, Fees and Expenses
| | |
| Accrued fees payable to affiliates for the period ended December 31, 2017 were as follows: |
| Advisory fees | $ | 195,067 |
| Administration fees | | 10,837 |
| Transfer agent fees | | 954 |
| Trustee fees | | 441 |
| | $ | 207,299 |
Transactions (amounts in thousands) during the period ended December 31, 2017 with Underlying Funds which are, or were, an
affiliated company are as follows:
| | | | | | | | | | | | | | | | | | |
| | | Fair Value, | | | | | | | | Change in | | | | | | | | |
| | Beginning of | | | | Realized Gain | | Unrealized | Fair Value, End | | | Income | Capital Gains |
| | | Period | | Purchases | | Sales | | (Loss) | | Gain (Loss) | of Period | Distributions | Distributions |
| U. S. Cash Management Fund | $ | 9,567 | $ | 72,210 | $ | 65,990 | $ | 1 | $ | (2) | $ | 15,786 | | $ | 126 | | $ | — |
| U. S. Cash Collateral Fund | | 12,596 | | 91,586 | | 93,255 | | — | | — | | 10,927 | | | 174 | | | — |
| | $ | 22,163 | $ | 163,796 | $ | 159,245 | $ | 1 | $ | (2) | $ | 26,713 | | $ | 300 | | $ | — |
Federal Income Taxes
At December 31, 2017, the cost of investments and net unrealized appreciation (depreciation), undistributed ordinary income and
undistributed long-term capital gains for income tax purposes were as follows:
| | | | |
| Cost of Investments | $ | | 233,103,420 | |
| Unrealized Appreciation | $ | | 37,175,675 | |
| Unrealized Depreciation | | | (5,142,554 | ) |
| Net Unrealized Appreciation (Depreciation) | $ | | 32,033,121 | |
| Undistributed Ordinary Income | $ | | 4,473,324 | |
| Undistributed Long-Term Capital Gains | | | | |
| (Capital Loss Carryforward) | $ | | 13,630,281 | |
| Tax Composition of Distributions | | | | |
| Ordinary Income | $ | | 5,444,863 | |
| Long-Term Capital Gains | $ | | 11,571,044 | |
Net investment income and net realized gains (losses) in the financial statements may differ from taxable net investment income and
net realized gains (losses). Capital accounts within the financial statements are adjusted for permanent book-tax differences. Book-tax
differences are primarily due to foreign currency gains and losses, reclassifications of dividends, differences in treatment of income
from swaps, net operating losses, investments in partnerships, investments in passive foreign investment companies (PFICs), tax
straddle transaction, use of tax equalization and foreign capital gains taxes. These adjustments have no impact on the net assets. At
December 31, 2017, there were no adjustments to the Statement of Assets and Liabilities.
See accompanying notes which are an integral part of the financial statements.
48 U.S. Small Cap Equity Fund
Russell Investment Funds
International Developed Markets Fund
Portfolio Management Discussion and Analysis — December 31, 2017 (Unaudited)
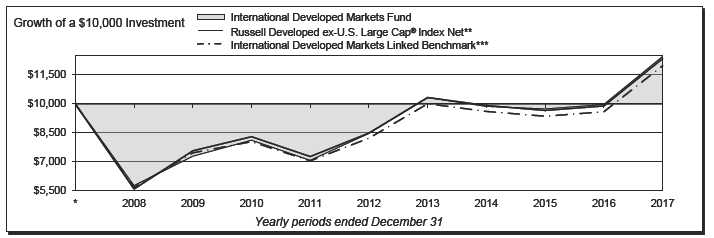
| | | | | | | |
| International Developed Markets Fund | | | | Russell Developed ex-U. S. Large Cap® Index Net** | |
| | | Total | | | | Total | |
| | | Return | | | | Return | |
| 1 Year | | 24.98 | % | 1 Year | | 24.85 | % |
| 5 Years | | 8.02 | %§ | 5 Years | | 7.80 | %§ |
| 10 Years | | 2.22 | %§ | 10 Years | | 2.14 | %§ |
| |
| | | | | International Developed Markets Linked Benchmark *** | |
| | | | | | | Total | |
| | | | | | | Return | |
| | | | | 1 Year | | 24.85 | % |
| | | | | 5 Years | | 7.80 | %§ |
| | | | | 10 Years | | 1.82 | %§ |
International Developed Markets Fund 49
Russell Investment Funds
International Developed Markets Fund
Portfolio Management Discussion and Analysis, continued — December 31, 2017
(Unaudited)
| |
| The International Developed Markets Fund (the “Fund”) employs | fiscal year followed by a modest outperformance of value factor |
| a multi-manager approach whereby portions of the Fund are | as investors chased cheaper, cyclical stocks and stocks with high |
| allocated to different money manager strategies. Fund assets not | earnings expectations. The Fund’s overweight to momentum had |
| allocated to money managers are managed by Russell Investment | a favorable impact during the period. |
| Management, LLC (“RIM”), the Fund’s advisor. RIM may change | |
| the allocation of the Fund’s assets among money managers at | How did the investment strategies and techniques employed |
| any time. An exemptive order from the Securities and Exchange | by the Fund and its money managers affect its benchmark- |
| Commission (“SEC”) permits RIM to engage or terminate a money | relative performance? |
| manager at any time, subject to approval by the Fund’s Board, | The Fund outperformed its benchmark for the one-year period |
| without a shareholder vote. Pursuant to the terms of the exemptive | ending December 31, 2017. The Fund’s ex-benchmark allocation |
| order, the Fund is required to notify its shareholders within 90 | to emerging markets added significant value over the period, |
| days of when a money manager begins providing services. As of | while the Fund’s dynamic value orientation marginally held back |
| December 31, 2017, the Fund had five money managers. | gains. |
| |
| What is the Fund’s investment objective? | The Fund employs discretionary and non-discretionary money |
| The Fund seeks to provide long term capital growth. | managers. The Fund’s discretionary money managers select the |
| | individual portfolio securities for the assets assigned to them. |
| How did the Fund perform relative to its benchmark for the | The Fund’s non-discretionary money managers provide a model |
| fiscal year ended December 31, 2017? | portfolio to RIM representing their investment recommendations, |
| For the fiscal year ended December 31, 2017, the Fund gained | based upon which RIM purchases and sells securities for the |
| 24.98%. This is compared to the Fund’s benchmark, the Russell | Fund. Fund assets not allocated to discretionary money managers |
| Developed ex-U. S. Large Cap® Index (Net), which gained 24.85% | include assets managed by RIM based upon model portfolios |
| during the same period. The Fund’s performance includes | provided by non-discretionary money managers, the Fund’s cash |
| operating expenses, whereas index returns are unmanaged and | balances and assets which may be managed directly by RIM to |
| do not include expenses of any kind. | effect the Fund’s investment strategies and/or to actively manage |
| | the Fund’s overall exposures by investing in securities or other |
| For the fiscal year ended December 31, 2017, the Morningstar® | instruments that RIM believes will achieve the desired risk/ |
| Insurance Foreign Large Blend Category, a group of funds that | return profile for the Fund. |
| Morningstar considers to have investment strategies similar to | |
| those of the Fund, gained 25.53%. This result serves as a peer | With respect to certain of the Fund’s money managers, GQG |
| comparison and is expressed net of operating expenses. | Partners, LLC (“GQG”) was the top performing manager during |
| | the portion of the fiscal year in which they were a manager in the |
| How did the market conditions described in the Market | Fund and outperformed the Fund’s benchmark. Stock selection |
| Summary report affect the Fund’s performance? | was one of the key drivers of excess returns. The manager’s |
| Emerging markets and Asia ex-Japan were the stand out non-U. S. | orientation towards higher quality stocks (as measured by lower |
| markets over the fiscal year, as improving economic fundamentals | leverage) was also additive. |
| along with a weaker U. S. dollar were tailwinds. Conversely, the | Numeric Investors LLC (“Numeric”) faced headwinds and was |
| UK, Europe ex-UK and Canada were the biggest laggards. The | the weakest performing manager for the period. The manager’s |
| Fund’s ex-benchmark allocation to emerging markets significantly | overweight to value detracted during the period. |
| added value over the period. | |
| | RIM manages a multi-factor positioning strategy that aims to |
| In terms of sector returns within the Index for the fiscal year, | increase the Fund’s value exposure while moderating volatility |
| sectors with high growth expectations such as technology, | exposure and expressing RIM’s total preferred positioning across |
| industrials and materials were rewarded during the period while | multiple factors and sectors. The strategy uses the output from a |
| the more defensive sectors such as consumer staples, utilities | quantitative model to purchase a stock portfolio expressing these |
| and health care suffered. Energy stocks also underperformed as | views. The positioning strategy’s benchmark-relative performance |
| commodity prices continued to face pressure from excess supply. | was modestly negative for the period, as the strategy’s overweight |
| The Fund’s overweight to technology contributed positively, | to value and underweight to volatility detracted. |
| but was partly offset by a modest overweight to energy and an | |
| underweight to materials. | In addition, RIM utilized equity futures and currency forward |
| | contracts in order to position the portfolio to meet RIM’s overall |
| Amid the improving global growth outlook, momentum, growth | preferred positioning with respect to country and currency |
| and quality factors had the strongest outperformance during the | |
50 International Developed Markets Fund
Russell Investment Funds
International Developed Markets Fund
Portfolio Management Discussion and Analysis, continued — December 31, 2017
(Unaudited)
| | |
| exposures. This strategy was marginally unfavorable during the | Money Managers as of December 31, | |
| fiscal year. | 2017 | Styles |
| During the period, RIM used index futures contracts to equitize | GQG Partners, LLC | Growth |
| the Fund’s cash. The decision to equitize cash was beneficial to | Janus Capital Management LLC and Perkins | |
| the Fund’s absolute performance for the fiscal year as the market | Investment Management, LLC | Value |
| produced a positive absolute return. | Numeric Investors LLC | Market Oriented |
| | Pzena Investment Management LLC | Value |
| Describe any changes to the Fund’s structure or the money | Wellington Management Company LLP | Growth |
| manager line-up. | The views expressed in this report reflect those of the |
| In March 2017, RIM replaced growth manager MFS Institutional | portfolio managers only through the end of the period |
| Advisors, Inc. with GQG, and replaced momentum growth | covered by the report. These views do not necessarily |
| manager William Blair Investment Management, LLC with | represent the views of RIM or any other person in RIM or |
| Wellington Management Company LLP. RIM also hired Numeric | any other affiliated organization. These views are subject to |
| to provide an increased emphasis on lower volatility. | change at any time based upon market conditions or other |
| | events, and RIM disclaims any responsibility to update the |
| In December 2017, Barrow, Hanley, Mewhinney & Strauss, | views contained herein. These views should not be relied |
| LLC was terminated following a RIM manager rank downgrade | on as investment advice and, because investment decisions |
| and replaced with Janus Capital Management LLC and Perkins | for a Russell Investment Funds (“RIF”) Fund are based on |
| Investment Management, LLC, a defensively oriented value | numerous factors, should not be relied on as an indication |
| manager. | of investment decisions of any RIF Fund. |
| The objective of these changes was to improve the Fund's excess | | |
| return potential. | | |
* Assumes initial investment on January 1, 2008.
** The Russell Developed ex-U.S. Large Cap® Index Net is an index which offers investors access to the large-cap segment of the global equity market, excluding
companies assigned to the United States. It is constructed to provide a comprehensive and unbiased barometer for the large-cap segment and is completely
reconstituted annually to accurately reflect the changes in the market over time and is net of tax on dividends from foreign holdings.
*** The International Developed Markets Linked Benchmark provides a means to compare the Fund’s average annual returns to a secondary benchmark that takes
into account historical changes in the Fund’s primary benchmark. The International Developed Markets Linked Benchmark represents the returns of the MSCI
EAFE Index (net of tax on dividends from foreign holdings) through December 31, 2010 and the returns of the Russell Developed ex-U.S. Large Cap® Index Net
thereafter.
§ Annualized.
The performance shown in this section does not reflect any Insurance Company Separate Account or Policy Charges. Performance is historical and assumes
reinvestment of all dividends and capital gains. Investment return and principal value will fluctuate so that an investor’s shares, when redeemed, may be worth more
or less than when purchased. Past performance is not indicative of future results. Additionally, the returns presented herein may differ from the performance reported
in the Financial Highlights as the returns herein are calculated in a manner consistent with standardized performance in accordance with Securities and Exchange
Commission rules, while the performance in the Financial Highlights has been calculated in accordance with U.S. Generally Accepted Accounting Principles (“U.S.
GAAP”).
International Developed Markets Fund 51
Russell Investment Funds
International Developed Markets Fund
Shareholder Expense Example — December 31, 2017 (Unaudited)
| | | | | | | |
| Fund Expenses | Please note that the expenses shown in the table are meant |
| The following disclosure provides important information | to highlight your ongoing costs only and do not reflect any |
| regarding the Fund’s Shareholder Expense Example | transactional costs. Therefore, the information under the heading |
| (“Example”) . | “Hypothetical Performance (5% return before expenses)” is |
| | useful in comparing ongoing costs only, and will not help you |
| Example | determine the relative total costs of owning different funds. In |
| As a shareholder of the Fund, you incur two types of costs: (1) | addition, if these transactional costs were included, your costs |
| transaction costs, and (2) ongoing costs, including advisory and | would have been higher. The fees and expenses shown in this |
| administrative fees and other Fund expenses. The Example is | section do not reflect any Insurance Company Separate Account |
| intended to help you understand your ongoing costs (in dollars) | Policy Charges. | | | | | | |
| of investing in the Fund and to compare these costs with the | | | | | | Hypothetical |
| ongoing costs of investing in other mutual funds. The Example | | | | | | Performance (5% |
| is based on an investment of $1,000 invested at the beginning of | | | | Actual | | return before |
| the period and held for the entire period indicated, which for this | | | Performance | | | expenses) |
| | Beginning Account Value | | | | | | |
| Fund is from July 1, 2017 to December 31, 2017 | July 1, 2017 | | $ | 1,000.00 | | $ | 1,000.00 |
| | Ending Account Value | | | | | | |
| Actual Expenses | December 31, 2017 | | $ | 1,100.10 | | $ | 1,019.71 |
| The information in the table under the heading “Actual | Expenses Paid During Period* | | $ | 5.77 | | $ | 5.55 |
| Performance” provides information about actual account values | | | | | | | |
| and actual expenses. You may use the information in this column, | * Expenses are equal to the Fund's annualized expense ratio of 1.09% |
| | (representing the six month period annualized), multiplied by the average |
| together with the amount you invested, to estimate the expenses | account value over the period, multiplied by 184/365 (to reflect the one-half |
| that you paid over the period. Simply divide your account value by | year period) . | | | | | | |
| $1,000 (for example, an $8,600 account value divided by $1,000 | | | | | | | |
| = 8.6), then multiply the result by the number in the first column | | | | | | | |
| in the row entitled “Expenses Paid During Period” to estimate | | | | | | | |
| the expenses you paid on your account during this period. | | | | | | | |
| |
| Hypothetical Example for Comparison Purposes | | | | | | | |
| The information in the table under the heading “Hypothetical | | | | | | | |
| Performance (5% return before expenses)” provides information | | | | | | | |
| about hypothetical account values and hypothetical expenses | | | | | | | |
| based on the Fund’s actual expense ratio and an assumed rate of | | | | | | | |
| return of 5% per year before expenses, which is not the Fund’s | | | | | | | |
| actual return. The hypothetical account values and expenses | | | | | | | |
| may not be used to estimate the actual ending account balance or | | | | | | | |
| expenses you paid for the period. You may use this information | | | | | | | |
| to compare the ongoing costs of investing in the Fund and other | | | | | | | |
| funds. To do so, compare this 5% hypothetical example with the | | | | | | | |
| 5% hypothetical examples that appear in the shareholder reports | | | | | | | |
| of other funds. | | | | | | | |
52 International Developed Markets Fund
Russell Investment Funds
International Developed Markets Fund
Schedule of Investments — December 31, 2017
| | | | | | | | | | |
| Amounts in thousands (except share amounts) | | | Amounts in thousands (except share amounts) | | |
| | | | Principal | | Fair | | | Principal | | Fair |
| | | | Amount ($) | | Value | | | Amount ($) | | Value |
| | | | or Shares | | $ | | | or Shares | | $ |
| Common Stocks - 92.0% | | | | | | Brazil - 0.2% | | | | |
| Australia - 3.1% | | | | | | BM&FBovespa SA - Bolsa de Valores | | | | |
| AGL Energy, Ltd. | | | 51,996 | | 987 | Mercadorias e Futuros(Æ) | | 110,284 | | 756 |
| Aristocrat Leisure, Ltd. | | | 99,158 | | 1,827 | | | | | |
| Australia & New Zealand Banking | | | | | | Canada - 4.0% | | | | |
| Group, Ltd. - ADR | | | 8,664 | | 194 | Atco, Ltd. Class I | | 3,900 | | 140 |
| BHP Billiton, Ltd. - ADR | | | 10,496 | | 242 | Bank of Montreal | | 6,917 | | 553 |
| BlueScope Steel, Ltd. | | | 6,000 | | 72 | Bank of Nova Scotia (The) | | 8,599 | | 555 |
| Brambles, Ltd. | | | 13,498 | | 106 | BCE, Inc. | | 5,200 | | 250 |
| Caltex Australia, Ltd. | | | 5,058 | | 134 | Brookfield Asset Management, Inc. | | | | |
| Coca-Cola Amatil, Ltd. | | | 18,700 | | 124 | Class A | | 2,060 | | 90 |
| Commonwealth Bank of Australia - ADR | | 9,701 | | 606 | BRP, Inc. | | 3,700 | | 137 |
| CSL, Ltd. | | | 10,779 | | 1,186 | CAE, Inc. | | 12,100 | | 225 |
| Dexus Property Group(ö) | | | 25,500 | | 194 | Canadian Imperial Bank of Commerce | | 10,858 | | 1,058 |
| Investa Office Fund(ö) | | | 17,500 | | 62 | Canadian Natural Resources, Ltd. | | 9,541 | | 341 |
| Macquarie Group, Ltd. | | | 28,853 | | 2,238 | Canadian Tire Corp. , Ltd. Class A | | 200 | | 26 |
| Metcash, Ltd. | | | 51,600 | | 125 | Cenovus Energy, Inc. | | 16,238 | | 148 |
| Mirvac Group(ö) | | | 176,300 | | 322 | CI Financial Corp. | | 5,400 | | 128 |
| National Australia Bank, Ltd. - ADR | | | 6,643 | | 153 | Constellation Software, Inc. | | 700 | | 424 |
| Newcrest Mining, Ltd. | | | 47,900 | | 851 | Empire Co. , Ltd. Class A | | 10,500 | | 205 |
| Qantas Airways, Ltd. (Æ) | | | 166,458 | | 653 | Encana Corp. | | 70,593 | | 942 |
| Sandfire Resources NL | | | 23,962 | | 129 | Fairfax Financial Holdings, Ltd. | | 400 | | 213 |
| Santos, Ltd. (Æ) | | | 22,800 | | 97 | First Quantum Minerals, Ltd. | | 54,521 | | 764 |
| Star Entertainment Grp, Ltd. (The) | | | 3,800 | | 18 | Genworth MI Canada, Inc. | | 300 | | 10 |
| Stockland(ö) | | | 109,100 | | 382 | George Weston, Ltd. | | 3,000 | | 261 |
| Telstra Corp. , Ltd. | | | 112,179 | | 317 | Great-West Lifeco, Inc. | | 6,241 | | 174 |
| Treasury Wine Estates, Ltd. | | | 15,000 | | 187 | H&R Real Estate Investment Trust(ö) | | 11,500 | | 195 |
| Vicinity Centres(Æ)(ö) | | | 113,900 | | 242 | Intact Financial Corp. | | 7,318 | | 611 |
| Wesfarmers, Ltd. (Æ) | | | 38,983 | | 1,350 | Loblaw Cos. , Ltd. | | 12,800 | | 695 |
| Westpac Banking Corp. | | | 9,071 | | 221 | Magna International, Inc. Class A | | 3,379 | | 192 |
| Whitehaven Coal, Ltd. | | | 42,400 | | 148 | Manulife Financial Corp. | | 42,096 | | 878 |
| Woolworths Group, Ltd. | | | 21,911 | | 466 | Maple Leaf Foods, Inc. | | 4,400 | | 125 |
| | | | | | 13,633 | Martinrea International, Inc. | | 800 | | 10 |
| | | | | | | National Bank of Canada | | 14,000 | | 699 |
| Austria - 0.4% | | | | | | New Flyer Industries, Inc. | | 700 | | 30 |
| Andritz AG | | | 8,879 | | 501 | Norbord, Inc. | | 2,100 | | 71 |
| Erste Group Bank AG(Æ) | | | 5,324 | | 230 | Potash Corp. of Saskatchewan, Inc. | | 30,944 | | 635 |
| Immofinanz AG(Æ) | | | 38,244 | | 98 | RioCan Real Estate Investment Trust(ö) | | 13,500 | | 262 |
| OMV AG | | | 9,111 | | 577 | Rogers Communications, Inc. Class B | | 24,258 | | 1,236 |
| Voestalpine AG | | | 4,135 | | 247 | Royal Bank of Canada - GDR | | 13,612 | | 1,112 |
| | | | | | 1,653 | Saputo, Inc. - ADR | | 5,500 | | 198 |
| | | | | | | Smart Real Estate Investment Trust(ö) | | 3,900 | | 96 |
| Belgium - 1.5% | | | | | | Stantec, Inc. | | 3,900 | | 109 |
| Ageas | | | 18,426 | | 899 | Stars Group, Inc. (The)(Æ) | | 6,400 | | 149 |
| Anheuser-Busch InBev SA | | | 10,283 | | 1,147 | Sun Life Financial, Inc. | | 11,324 | | 467 |
| Cie d'Entreprises CFE | | | 818 | | 119 | TELUS Corp. | | 22,600 | | 856 |
| Colruyt SA | | | 2,318 | | 121 | Toronto Dominion Bank | | 37,578 | | 2,201 |
| Groupe Bruxelles Lambert SA | | | 4,225 | | 456 | West Fraser Timber Co. , Ltd. | | 1,300 | | 80 |
| KBC Groep NV | | | 29,152 | | 2,484 | | | | | 17,551 |
| Proximus | | | 6,902 | | 227 | | | | | |
| Solvay SA | | | 1,464 | | 203 | China - 2.9% | | | | |
| UCB SA | | | 11,439 | | 906 | Alibaba Group Holding, Ltd. - ADR(Æ) | | 17,331 | | 2,989 |
| | | | | | 6,562 | JD. com, Inc. - ADR(Æ) | | 21,290 | | 882 |
| | | | | | | Lenovo Group, Ltd. | | 3,194,000 | | 1,803 |
| Bermuda - 0.2% | | | | | | New Oriental Education & Technology | | | | |
| XL Group, Ltd. | | | 19,709 | | 693 | Group - ADR | | 4,500 | | 423 |
| | | | | | | Ping An Insurance Group Co. of China, | | | | |
| | | | | | | Ltd. Class H | | 140,513 | | 1,462 |
See accompanying notes which are an integral part of the financial statements.
International Developed Markets Fund 53
Russell Investment Funds
International Developed Markets Fund
Schedule of Investments, continued — December 31, 2017
| | | | | | | | | |
| Amounts in thousands (except share amounts) | | | Amounts in thousands (except share amounts) | | |
| | | Principal | | Fair | | | Principal | | Fair |
| | | Amount ($) | | Value | | | Amount ($) | | Value |
| | | or Shares | | $ | | | or Shares | | $ |
| Sunny Optical Technology Group Co. , | | | | | Mercialys SA(ö) | | 5,811 | | 129 |
| Ltd. | | 44,884 | | 569 | Natixis SA | | 34,984 | | 276 |
| Tencent Holdings, Ltd. | | 74,583 | | 3,854 | Orange SA - ADR | | 14,909 | | 259 |
| Weibo Corp. - ADR(Æ) | | 5,828 | | 603 | Peugeot SA | | 20,052 | | 407 |
| | | | | 12,585 | Publicis Groupe SA - ADR | | 31,691 | | 2,153 |
| | | | | | Renault SA | | 4,327 | | 435 |
| Denmark - 1.6% | | | | | Rexel SA Class H | | 104,831 | | 1,901 |
| AP Moller - Maersk A/S Class B | | 91 | | 159 | Safran SA | | 14,122 | | 1,453 |
| Danske Bank A/S | | 63,196 | | 2,456 | Sanofi - ADR | | 29,893 | | 2,574 |
| Dfds A/S | | 1,228 | | 66 | Schneider Electric SE(Æ) | | 28,561 | | 2,422 |
| DSV A/S | | 11,329 | | 892 | SCOR SE - ADR | | 1,918 | | 77 |
| Genmab A/S(Æ) | | 3,276 | | 543 | Societe Generale SA | | 8,291 | | 427 |
| GN Store Nord A/S | | 2,260 | | 73 | Television Francaise 1 | | 5,013 | | 74 |
| H Lundbeck A/S | | 900 | | 46 | Thales SA | | 8,068 | | 869 |
| ISS A/S | | 730 | | 28 | Total SA | | 62,642 | | 3,457 |
| Novo Nordisk A/S Class B | | 26,372 | | 1,418 | Unibail-Rodamco SE(ö) | | 820 | | 207 |
| Pandora A/S | | 2,336 | | 254 | Vallourec SA(Æ)(Ñ) | | 148,982 | | 900 |
| Royal Unibrew A/S | | 2,180 | | 130 | Vicat SA | | 10,296 | | 813 |
| Scandinavian Tobacco Group A/S(Þ) | | 37,618 | | 728 | Vinci SA | | 18,900 | | 1,928 |
| Topdanmark A/S | | 2,551 | | 110 | Vivendi SA - ADR | | 6,246 | | 168 |
| | | | | 6,903 | | | | | 37,337 |
| |
| Finland - 0.4% | | | | | Germany - 6.7% | | | | |
| Fortum OYJ | | 10,176 | | 201 | Adidas AG | | 3,177 | | 634 |
| Kesko OYJ Class B | | 1,502 | | 82 | Allianz SE | | 3,315 | | 759 |
| Neste OYJ | | 5,943 | | 380 | AURELIUS Equity Opportunities SE & | | | | |
| Outokumpu OYJ | | 23,916 | | 222 | Co. KGaA | | 1,210 | | 83 |
| Stora Enso OYJ Class R | | 14,342 | | 227 | BASF SE | | 4,272 | | 469 |
| Tikkurila Oyj | | 11,111 | | 237 | Bayer AG | | 15,478 | | 1,925 |
| UPM-Kymmene OYJ | | 14,035 | | 436 | Bayerische Motoren Werke AG | | 3,043 | | 316 |
| Valmet OYJ | | 6,585 | | 130 | Beiersdorf AG | | 3,180 | | 373 |
| | | | | 1,915 | Commerzbank AG(Æ) | | 11,290 | | 169 |
| | | | | | Continental AG | | 5,999 | | 1,619 |
| France - 8.6% | | | | | Covestro AG(Þ) | | 13,103 | | 1,347 |
| Air Liquide SA Class A | | 11,603 | | 1,459 | Daimler AG | | 30,079 | | 2,554 |
| Amundi SA(Þ) | | 580 | | 49 | Deutsche Bank AG | | 47,693 | | 906 |
| Arkema SA | | 908 | | 110 | Deutsche Boerse AG | | 34,642 | | 4,015 |
| Atos SE | | 5,733 | | 835 | Deutsche Lufthansa AG | | 36,010 | | 1,324 |
| AXA SA | | 13,124 | | 389 | Deutsche Telekom AG | | 19,785 | | 351 |
| bioMerieux | | 330 | | 30 | Deutsche Wohnen SE | | 4,039 | | 176 |
| BNP Paribas SA | | 51,067 | | 3,807 | Deutz AG | | 1,900 | | 17 |
| Bouygues SA - ADR | | 37,956 | | 1,972 | Evonik Industries AG | | 4,920 | | 185 |
| Bureau Veritas SA | | 16,082 | | 440 | GEA Group AG | | 16,996 | | 815 |
| Carrefour SA | | 10,021 | | 217 | Hannover Rueck SE | | 1,868 | | 234 |
| Casino Guichard Perrachon SA | | 460 | | 28 | HeidelbergCement AG | | 15,210 | | 1,647 |
| Cie de Saint-Gobain | | 5,182 | | 285 | Infineon Technologies AG - ADR | | 35,528 | | 970 |
| Credit Agricole SA | | 85,255 | | 1,408 | Metro AG | | 7,789 | | 118 |
| Danone SA | | 15,202 | | 1,274 | Muenchener Rueckversicherungs- | | | | |
| Dassault Aviation SA | | 153 | | 238 | Gesellschaft AG in Muenchen | | 8,856 | | 1,920 |
| Derichebourg SA | | 11,448 | | 125 | Rational AG | | 206 | | 132 |
| Engie SA | | 76,564 | | 1,315 | Rheinmetall AG | | 338 | | 43 |
| Faurecia | | 600 | | 47 | RWE AG | | 6,550 | | 134 |
| Gecina SA(ö) | | 161 | | 30 | SAP SE - ADR(Ñ) | | 9,902 | | 1,113 |
| Hermes International | | 1,613 | | 863 | SAP SE - ADR | | 8,299 | | 931 |
| Ipsen SA | | 469 | | 56 | Siemens AG | | 16,046 | | 2,226 |
| L'Oreal SA | | 5,736 | | 1,270 | Siltronic AG(Æ) | | 1,423 | | 207 |
| LVMH Moet Hennessy Louis Vuitton | | | | | Transportation Components, Inc. | | 19,180 | | 397 |
| SE - ADR | | 549 | | 161 | Vonovia SE | | 3,866 | | 191 |
See accompanying notes which are an integral part of the financial statements.
54 International Developed Markets Fund
Russell Investment Funds
International Developed Markets Fund
Schedule of Investments, continued — December 31, 2017
| | | | | | | | | | |
| Amounts in thousands (except share amounts) | | | Amounts in thousands (except share amounts) | | |
| | | | Principal | | Fair | | | Principal | | Fair |
| | | | Amount ($) | | Value | | | Amount ($) | | Value |
| | | | or Shares | | $ | | | or Shares | | $ |
| Wacker Chemie AG | | | 746 | | 145 | Teva Pharmaceutical Industries, Ltd. | | 14,548 | | 276 |
| Zalando SE(Æ)(Þ) | | | 18,790 | | 990 | | | | | 3,051 |
| | | | | | 29,435 | | | | | |
| | | | | | | Italy - 2.8% | | | | |
| Hong Kong - 2.7% | | | | | | ACEA SpA | | 6,641 | | 123 |
| AIA Group, Ltd. | | | 223,197 | | 1,904 | Assicurazioni Generali SpA | | 8,521 | | 155 |
| China Mobile, Ltd. | | | 88,000 | | 891 | ASTM SpA | | 1,218 | | 35 |
| CK Asset Holdings, Ltd. | | | 139,351 | | 1,218 | Atlantia SpA | | 3,171 | | 100 |
| CK Hutchison Holdings Ltd | | | 73,000 | | 917 | Davide Campari-Milano SpA | | 109,897 | | 850 |
| CLP Holdings, Ltd. | | | 27,000 | | 276 | Enel SpA | | 691,103 | | 4,247 |
| Hang Seng Bank, Ltd. | | | 48,212 | | 1,194 | ENI SpA - ADR | | 150,406 | | 2,488 |
| Henderson Land Development Co. , Ltd. | | | 35,900 | | 237 | FinecoBank Banca Fineco SpA | | 59,830 | | 612 |
| HKT Trust & HKT, Ltd. | | | 204,000 | | 260 | Intesa Sanpaolo SpA | | 54,724 | | 181 |
| Hongkong Land Holdings, Ltd. | | | 46,200 | | 325 | Moncler SpA | | 16,635 | | 520 |
| Hysan Development Co. , Ltd. | | | 45,000 | | 239 | Parmalat SpA | | 40,579 | | 151 |
| Jardine Matheson Holdings, Ltd. | | | 2,600 | | 158 | Snam Rete Gas SpA | | 36,633 | | 179 |
| Kerry Properties, Ltd. | | | 72,500 | | 326 | Telecom Italia SpA(Æ) | | 774,693 | | 669 |
| Link(ö) | | | 111,500 | | 1,033 | Tod's SpA | | 1,650 | | 121 |
| Melco Crown Entertainment, Ltd. - ADR | | 33,709 | | 979 | UniCredit SpA(Æ) | | 91,656 | | 1,707 |
| Sun Hung Kai Properties, Ltd. | | | 11,000 | | 183 | | | | | 12,138 |
| Swire Pacific, Ltd. Class A | | | 26,000 | | 241 | | | | | |
| Swire Properties, Ltd. | | | 29,000 | | 94 | Japan - 16.8% | | | | |
| WH Group, Ltd. (Þ) | | | 648,000 | | 730 | 77 Bank, Ltd. (The) | | 1,800 | | 45 |
| Wharf Holdings, Ltd. (The) | | | 66,000 | | 228 | Advantest Corp. | | 34,482 | | 639 |
| Wheelock & Co. , Ltd. | | | 42,000 | | 300 | Aisin Seiki Co. , Ltd. | | 3,000 | | 169 |
| Yue Yuen Industrial Holdings, Ltd. | | | 27,000 | | 106 | Akatsuki Inc. (Æ) | | 700 | | 41 |
| | | | | | 11,839 | Alfresa Holdings Corp. | | 24,800 | | 582 |
| | | | | | | Alps Electric Co. , Ltd. | | 20,800 | | 592 |
| India - 0.6% | | | | | | Asahi Glass Co. , Ltd. | | 11,800 | | 510 |
| HDFC Bank, Ltd. - ADR | | | 18,034 | | 1,834 | Asahi Group Holdings, Ltd. | | 8,000 | | 397 |
| Infosys, Ltd. - ADR | | | 47,433 | | 769 | Asahi Kasei Corp. | | 18,000 | | 232 |
| | | | | | 2,603 | Astellas Pharma, Inc. | | 79,600 | | 1,011 |
| | | | | | | Benesse Holdings, Inc. | | 1,100 | | 39 |
| Indonesia - 0.2% | | | | | | BML, Inc. | | 12,600 | | 314 |
| Bank Central Asia Tbk PT | | | 644,795 | | 1,039 | Bridgestone Corp. | | 20,000 | | 930 |
| | | | | | | Canon, Inc. | | 16,000 | | 596 |
| Ireland - 0.3% | | | | | | Central Japan Railway Co. | | 1,400 | | 251 |
| Bank of Ireland Group PLC(Æ) | | | 6,600 | | 56 | Century Tokyo Leasing Corp. | | 4,200 | | 203 |
| Medtronic PLC | | | 1,126 | | 91 | Coca-Cola Bottlers Japan, Inc. | | 4,900 | | 179 |
| Ryanair Holdings PLC - ADR(Æ) | | | 4,891 | | 510 | Concordia Financial Group, Ltd. | | 76,800 | | 464 |
| Willis Towers Watson PLC(Æ) | | | 5,106 | | 769 | Cosel Co. , Ltd. | | 28,900 | | 475 |
| | | | | | 1,426 | Credit Saison Co. , Ltd. | | 17,900 | | 326 |
| | | | | | | Dai Nippon Printing Co. , Ltd. | | 18,400 | | 410 |
| Israel - 0.7% | | | | | | Dai-ichi Life Holdings, Inc. | | 57,250 | | 1,181 |
| Azrieli Group, Ltd. | | | 2,891 | | 161 | Daikin Industries, Ltd. | | 3,400 | | 403 |
| Bank Hapoalim BM | | | 66,820 | | 492 | Daiseki Co. , Ltd. | | 9,700 | | 270 |
| Bank Leumi Le-Israel BM | | | 129,007 | | 777 | Daito Trust Construction Co. , Ltd. | | 2,400 | | 489 |
| Bezeq The Israeli Telecommunication | | | | | | Daiwa Securities Group, Inc. | | 31,000 | | 195 |
| Corp. , Ltd. | | | 229,476 | | 347 | Denso Corp. | | 4,000 | | 240 |
| Check Point Software Technologies, Ltd. | | | | | Dip Corp. | | 900 | | 23 |
| (Æ) | | | 4,400 | | 456 | East Japan Railway Co. | | 1,300 | | 127 |
| Elbit Systems, Ltd. | | | 760 | | 102 | Ebara Corp. | | 19,700 | | 751 |
| Mizrahi Tefahot Bank, Ltd. | | | 7,240 | | 133 | Eisai Co. , Ltd. | | 12,100 | | 685 |
| Nice, Ltd. | | | 1,330 | | 121 | FANUC Corp. | | 3,730 | | 896 |
| Plus500, Ltd. | | | 4,811 | | 59 | Fuji Electric Co. , Ltd. | | 32,500 | | 244 |
| Taro Pharmaceutical Industries, Ltd. | | | | | | Fujitsu, Ltd. | | 347,000 | | 2,460 |
| (Æ)(Ñ) | | | 1,211 | | 127 | H2O Retailing Corp. | | 6,800 | | 142 |
| | | | | | | Haseko Corp. | | 1,500 | | 23 |
See accompanying notes which are an integral part of the financial statements.
International Developed Markets Fund 55
Russell Investment Funds
International Developed Markets Fund
Schedule of Investments, continued — December 31, 2017
| | | | | | | | | | |
| Amounts in thousands (except share amounts) | | | Amounts in thousands (except share amounts) | | |
| | | | Principal | | Fair | | | Principal | | Fair |
| | | | Amount ($) | | Value | | | Amount ($) | | Value |
| | | | or Shares | | $ | | | or Shares | | $ |
| Hazama Ando Corp. | | | 1,200 | | 9 | Nippon Telegraph & Telephone Corp. | | 28,603 | | 1,346 |
| Hitachi Capital Corp. | | | 7,200 | | 181 | Nippon Yusen KK | | 15,200 | | 370 |
| Hitachi, Ltd. | | | 202,500 | | 1,576 | Nissan Motor Co. , Ltd. | | 27,100 | | 270 |
| Hokuhoku Financial Group, Inc. | | | 3,500 | | 55 | Nisshinbo Holdings, Inc. | | 4,900 | | 66 |
| Honda Motor Co. , Ltd. | | | 104,600 | | 3,588 | Nomura Holdings, Inc. | | 86,700 | | 512 |
| Hoya Corp. | | | 10,800 | | 540 | NSK, Ltd. | | 15,400 | | 243 |
| Icom, Inc. | | | 6,300 | | 147 | NTT Data Corp. | | 19,900 | | 236 |
| Iida Group Holdings Co. , Ltd. | | | 35,100 | | 661 | NTT DOCOMO, Inc. | | 54,900 | | 1,297 |
| Inpex Corp. | | | 270,000 | | 3,379 | Obayashi Corp. | | 42,900 | | 519 |
| Isuzu Motors, Ltd. | | | 148,900 | | 2,490 | Oji Holdings Corp. | | 39,000 | | 259 |
| ITOCHU Corp. | | | 51,600 | | 964 | OKUMA Corp. | | 200 | | 13 |
| Jafco Co. , Ltd. | | | 2,400 | | 138 | Ono Pharmaceutical Co. , Ltd. | | 31,200 | | 726 |
| Japan Post Bank Co. , Ltd. | | | 5,800 | | 75 | Open House Co. , Ltd. | | 300 | | 16 |
| Japan Post Holdings Co. , Ltd. | | | 89,900 | | 1,030 | Oriental Land Co. , Ltd. | | 4,700 | | 428 |
| Japan Tobacco, Inc. | | | 23,200 | | 747 | ORIX Corp. | | 41,800 | | 707 |
| JFE Holdings, Inc. | | | 11,600 | | 279 | Osaka Gas Co. , Ltd. | | 8,400 | | 162 |
| JX Holdings, Inc. | | | 229,200 | | 1,481 | Penta-Ocean Construction Co. , Ltd. | | 10,700 | | 80 |
| Kajima Corp. | | | 67,000 | | 644 | Pola Orbis Holdings, Inc. | | 5,200 | | 182 |
| Kansai Electric Power Co. , Inc. (The) | | | 17,000 | | 208 | Resona Holdings, Inc. | | 19,800 | | 118 |
| Kao Corp. | | | 4,000 | | 271 | Round One Corp. | | 1,700 | | 28 |
| Kawasaki Heavy Industries, Ltd. | | | 6,000 | | 210 | SBI Holdings, Inc. | | 12,500 | | 261 |
| KDDI Corp. | | | 30,500 | | 759 | Secom Co. , Ltd. | | 6,000 | | 453 |
| Kitagawa Industries Co. , Ltd. | | | 2,300 | | 31 | Secom Joshinetsu Co. , Ltd. | | 2,700 | | 102 |
| Kobe Bussan Co. , Ltd. | | | 400 | | 15 | Seino Holdings Co. , Ltd. | | 1,600 | | 25 |
| Kobe Steel, Ltd. | | | 15,900 | | 148 | Sekisui House, Ltd. | | 16,200 | | 292 |
| Komatsu, Ltd. | | | 24,900 | | 902 | Seven & i Holdings Co. , Ltd. | | 4,700 | | 195 |
| Konica Minolta, Inc. | | | 11,000 | | 106 | Shimamura Co. , Ltd. | | 900 | | 99 |
| Lawson, Inc. | | | 3,200 | | 213 | Shionogi & Co. , Ltd. | | 1,900 | | 103 |
| Makino Milling Machine Co. , Ltd. | | | 1,000 | | 10 | Showa Shell Sekiyu KK | | 30,900 | | 419 |
| Marubeni Corp. | | | 145,300 | | 1,055 | SMC Corp. | | 2,050 | | 844 |
| Mazda Motor Corp. | | | 16,900 | | 227 | SoftBank Group Corp. | | 15,100 | | 1,193 |
| McDonald's Holdings Co. Japan, Ltd. | | | 6,700 | | 295 | Sojitz Corp. | | 86,100 | | 264 |
| Medipal Holdings Corp. | | | 4,600 | | 90 | Sompo Japan Nipponkoa Holdings, Inc. | | 38,500 | | 1,485 |
| Megmilk Snow Brand Co. , Ltd. | | | 2,600 | | 77 | Sony Corp. | | 67,100 | | 3,013 |
| Mitsubishi Chemical Holdings Corp. | | | 43,800 | | 481 | Sumitomo Bakelite Co. , Ltd. | | 1,000 | | 8 |
| Mitsubishi Corp. | | | 10,600 | | 293 | Sumitomo Chemical Co. , Ltd. | | 25,000 | | 180 |
| Mitsubishi Electric Corp. | | | 6,800 | | 113 | Sumitomo Corp. | | 21,300 | | 361 |
| Mitsubishi Heavy Industries, Ltd. | | | 12,400 | | 463 | Sumitomo Electric Industries, Ltd. | | 6,600 | | 111 |
| Mitsubishi Materials Corp. | | | 5,700 | | 203 | Sumitomo Heavy Industries, Ltd. | | 8,300 | | 352 |
| Mitsubishi Tanabe Pharma Corp. | | | 4,800 | | 99 | Sumitomo Metal Mining Co. , Ltd. | | 5,000 | | 229 |
| Mitsubishi UFJ Financial Group, Inc. | | | 273,600 | | 2,008 | Sumitomo Mitsui Financial Group, Inc. | | 42,900 | | 1,853 |
| Mitsubishi UFJ Lease & Finance Co. , | | | | | | Sumitomo Mitsui Trust Holdings, Inc. | | 5,900 | | 234 |
| Ltd. | | | 31,900 | | 190 | Taiheiyo Cement Corp. | | 5,000 | | 216 |
| Mitsui & Co. , Ltd. | | | 22,900 | | 372 | Taisho Pharmaceutical Holdings Co. , | | | | |
| Mitsui Chemicals, Inc. | | | 1,100 | | 35 | Ltd. | | 3,700 | | 295 |
| Mixi, Inc. | | | 11,800 | | 530 | Takashimaya Co. , Ltd. | | 3,000 | | 32 |
| Mizuho Financial Group, Inc. | | | 162,800 | | 296 | Takeda Pharmaceutical Co. , Ltd. | | 5,000 | | 283 |
| Morinaga Milk Industry Co. , Ltd. | | | 3,200 | | 145 | Toho Zinc Co. , Ltd. | | 900 | | 49 |
| MS&AD Insurance Group Holdings, Inc. | | 8,800 | | 298 | Tokio Marine Holdings, Inc. | | 5,100 | | 233 |
| Nakanishi, Inc. | | | 1,300 | | 68 | Tokyo Electric Power Co. Holdings, Inc. | | | | |
| Nexon Co. , Ltd. (Æ) | | | 1,000 | | 29 | (Æ) | | 208,200 | | 824 |
| NH Foods, Ltd. | | | 15,000 | | 365 | Tokyo Electron, Ltd. | | 100 | | 18 |
| Nidec Corp. | | | 5,900 | | 828 | Tomy Co. , Ltd. | | 4,700 | | 64 |
| Nintendo Co. , Ltd. | | | 2,500 | | 910 | Toppan Printing Co. , Ltd. | | 59,000 | | 533 |
| Nippon Electric Glass Co. , Ltd. | | | 2,500 | | 95 | Toray Industries, Inc. | | 17,000 | | 160 |
| Nippon Express Co. , Ltd. | | | 2,100 | | 139 | Toyota Industries Corp. | | 4,100 | | 264 |
| Nippon Steel & Sumitomo Metal Corp. | | | 4,300 | | 110 | Toyota Motor Corp. | | 23,600 | | 1,511 |
| Nippon Suisan Kaisha, Ltd. | | | 22,400 | | 117 | Toyota Tsusho Corp. | | 6,200 | | 249 |
See accompanying notes which are an integral part of the financial statements.
56 International Developed Markets Fund
Russell Investment Funds
International Developed Markets Fund
Schedule of Investments, continued — December 31, 2017
| | | | | | | | | | |
| Amounts in thousands (except share amounts) | | | Amounts in thousands (except share amounts) | | |
| | | Principal | | Fair | | | | Principal | | Fair |
| | | Amount ($) | | Value | | | | Amount ($) | | Value |
| | | or Shares | | $ | | | | or Shares | | $ |
| Transcosmos, Inc. | | 11,000 | | 281 | Yara International ASA | | | 5,054 | | 231 |
| Ulvac, Inc. | | 100 | | 6 | | | | | | 3,932 |
| United Arrows, Ltd. | | 600 | | 24 | | | | | | |
| West Japan Railway Co. | | 9,800 | | 715 | Papua New Guinea - 0.0% | | | | | |
| Yahoo! Japan Corp. | | 139,000 | | 637 | Oil Search, Ltd. | | | 1,658 | | 10 |
| Yamada Denki Co. , Ltd. | | 13,400 | | 74 | | | | | | |
| Ya-Man, Ltd. | | 1,300 | | 22 | Portugal - 0.3% | | | | | |
| | | | | 73,466 | Energias de Portugal SA | | | 41,349 | | 143 |
| | | | | | Galp Energia SGPS SA Class B | | | 42,990 | | 790 |
| Jersey - 0.1% | | | | | Navigator Co. SA (The) - ADR | | | 18,622 | | 95 |
| Randgold Resources, Ltd. | | 1,350 | | 134 | Sonae SGPS SA | | | 103,713 | | 140 |
| Shire PLC - ADR | | 2,900 | | 150 | | | | | | 1,168 |
| | | | | 284 | | | | | | |
| | | | | | Russia - 0.6% | | | | | |
| Luxembourg - 0.1% | | | | | Evraz PLC | | | 29,048 | | 133 |
| Aperam SA | | 2,499 | | 129 | Gazprom PJSC - ADR | | | 206,189 | | 909 |
| ArcelorMittal SA(Æ) | | 7,558 | | 245 | Sberbank of Russia PJSC Class T | | | 437,169 | | 1,704 |
| RTL Group SA | | 1,148 | | 92 | | | | | | 2,746 |
| | | | | 466 | | | | | | |
| | | | | | Singapore - 0.7% | | | | | |
| Macao - 0.2% | | | | | Genting Singapore PLC | | | 134,900 | | 132 |
| Sands China, Ltd. | | 185,200 | | 953 | Oversea-Chinese Banking Corp. , Ltd. | | | 19,000 | | 176 |
| | | | | | Singapore Telecommunications, Ltd. | | | 486,000 | | 1,296 |
| Mexico - 0.4% | | | | | Wilmar International, Ltd. | | | 547,900 | | 1,263 |
| America Movil SAB de CV | | 1,237,728 | | 1,067 | Yangzijiang Shipbuilding Holdings, Ltd. | | 34,300 | | 38 |
| Grupo Televisa SAB - ADR | | 28,296 | | 528 | | | | | | 2,905 |
| | | | | 1,595 | | | | | | |
| | | | | | South Korea - 2.1% | | | | | |
| Netherlands - 3.3% | | | | | CLIO Cosmetics Co. , Ltd. (Æ) | | | 6,652 | | 228 |
| Aalberts Industries NV | | 2,635 | | 134 | Grand Korea Leisure Co. , Ltd. | | | 15,725 | | 429 |
| ABN AMRO Group NV(Þ) | | 29,390 | | 946 | Hana Financial Group, Inc. | | | 24,945 | | 1,161 |
| Aegon NV | | 18,313 | | 117 | Hyundai Motor Co. | | | 4,202 | | 612 |
| AerCap Holdings NV(Æ) | | 4,691 | | 247 | KT&G Corp. | | | 3,370 | | 364 |
| ASML Holding NV | | 3,532 | | 613 | POSCO | | | 6,418 | | 1,993 |
| ASR Nederland NV | | 5,979 | | 246 | Samsung Electronics Co. , Ltd. | | | 1,881 | | 4,469 |
| BE Semiconductor Industries NV | | 1,540 | | 129 | | | | | | 9,256 |
| EXOR NV | | 4,336 | | 266 | | | | | | |
| Heineken NV | | 14,587 | | 1,520 | Spain - 2.0% | | | | | |
| ING Groep NV | | 140,736 | | 2,590 | Aena SA(Þ) | | | 4,316 | | 874 |
| Koninklijke Ahold Delhaize NV | | 29,441 | | 646 | Banco Bilbao Vizcaya Argentaria SA | | | | | |
| Koninklijke KPN NV | | 322,088 | | 1,124 | - ADR | | | 35,121 | | 299 |
| NN Group NV | | 30,733 | | 1,328 | Banco de Sabadell SA - ADR | | | 133,824 | | 265 |
| Royal Dutch Shell PLC Class A | | 90,461 | | 3,016 | Banco Santander SA - ADR | | | 298,240 | | 1,955 |
| Wolters Kluwer NV | | 17,420 | | 907 | Bankia SA | | | 186,756 | | 891 |
| Yandex NV Class A(Æ) | | 22,750 | | 745 | Cellnex Telecom SA(Þ) | | | 28,791 | | 737 |
| | | | | 14,574 | Enagas SA | | | 5,810 | | 166 |
| | | | | | Ence Energia y Celulosa S. A | | | 6,151 | | 41 |
| Norway - 0.9% | | | | | Endesa SA - ADR | | | 12,410 | | 265 |
| Det Norske Oljeselskap ASA | | 410 | | 10 | Gestamp Automocion SA(Æ)(Þ) | | | 14,172 | | 101 |
| DNB ASA | | 10,775 | | 199 | Grupo Catalana Occidente SA | | | 1,840 | | 81 |
| DNO ASA(Æ) | | 15,656 | | 18 | Iberdrola SA | | | 136,607 | | 1,057 |
| Gjensidige Forsikring ASA | | 5,573 | | 105 | Industria de Diseno Textil SA | | | 19,594 | | 682 |
| Grieg Seafood ASA | | 14,860 | | 130 | Repsol SA - ADR | | | 41,651 | | 736 |
| Marine Harvest ASA(Æ) | | 57,068 | | 967 | Telefonica SA - ADR | | | 63,301 | | 617 |
| Norsk Hydro ASA | | 30,072 | | 227 | | | | | | 8,767 |
| Orkla ASA | | 59,605 | | 632 | | | | | | |
| Salmar ASA Class A | | 4,421 | | 132 | Sweden - 2.2% | | | | | |
| Statoil ASA Class N | | 15,803 | | 338 | Assa Abloy AB Class B | | | 37,616 | | 781 |
| Telenor ASA | | 44,014 | | 943 | Atlas Copco AB Class A | | | 21,897 | | 943 |
See accompanying notes which are an integral part of the financial statements.
International Developed Markets Fund 57
Russell Investment Funds
International Developed Markets Fund
Schedule of Investments, continued — December 31, 2017
| | | | | | | | | | |
| Amounts in thousands (except share amounts) | | | Amounts in thousands (except share amounts) | | |
| | | | Principal | | Fair | | | Principal | | Fair |
| | | | Amount ($) | | Value | | | Amount ($) | | Value |
| | | | or Shares | | $ | | | or Shares | | $ |
| Atlas Copco AB Class B | | | 540 | | 21 | United Kingdom - 14.0% | | | | |
| Boliden AB | | | 5,985 | | 204 | 3i Group PLC | | 71,815 | | 885 |
| Electrolux AB | | | 22,900 | | 737 | Abcam PLC Class A | | 2,560 | | 36 |
| Essity Aktiebolag Class B | | | 1,120 | | 32 | Antofagasta PLC | | 25,681 | | 348 |
| ICA Gruppen AB | | | 4,600 | | 167 | Aon PLC | | 12,010 | | 1,609 |
| Nordea Bank AB | | | 65,954 | | 798 | AstraZeneca PLC | | 21,759 | | 1,494 |
| Sandvik AB | | | 9,580 | | 167 | Auto Trader Group PLC(Þ) | | 8,700 | | 41 |
| SAS AB(Æ) | | | 5,400 | | 14 | Aviva PLC | | 202,864 | | 1,386 |
| Skandinaviska Enskilda Banken AB | | | | | | Babcock International Group PLC | | 10,320 | | 98 |
| Class A | | | 16,545 | | 194 | BAE Systems PLC | | 156,806 | | 1,206 |
| Swedbank AB Class A | | | 26,986 | | 650 | Barclays PLC | | 450,344 | | 1,228 |
| Swedish Match AB | | | 36,767 | | 1,446 | Barratt Developments PLC | | 51,000 | | 446 |
| Telefonaktiebolaget LM Ericsson Class B | | 309,020 | | 2,025 | BBA Aviation PLC | | 124,774 | | 589 |
| Telia Co. AB | | | 98,940 | | 440 | Berkeley Group Holdings PLC | | 3,717 | | 210 |
| Volvo AB Class B | | | 57,380 | | 1,068 | BHP Billiton PLC | | 59,116 | | 1,210 |
| | | | | | 9,687 | BP PLC | | 104,638 | | 738 |
| | | | | | | BP PLC - ADR | | 21,795 | | 916 |
| Switzerland - 7.4% | | | | | | British American Tobacco PLC | | 57,994 | | 3,914 |
| ABB, Ltd. | | | 88,827 | | 2,375 | British Land Co. PLC (The)(ö) | | 8,800 | | 82 |
| Adecco SA | | | 5,044 | | 386 | BT Group PLC | | 59,592 | | 218 |
| Baloise Holding AG | | | 2,245 | | 350 | Diageo PLC | | 69,778 | | 2,554 |
| Banque Cantonale Vaudoise | | | 94 | | 71 | Dialog Semiconductor PLC(Æ) | | 2,680 | | 83 |
| Barry Callebaut AG(Æ) | | | 97 | | 202 | Direct Line Insurance Group PLC | | 46,335 | | 239 |
| Chocoladefabriken Lindt & Spruengli | | | | | | Fiat Chrysler Automobiles NV(Æ) | | 43,303 | | 772 |
| AG | | | 20 | | 122 | Foxtons Group PLC | | 227,450 | | 251 |
| Cie Financiere Richemont SA | | | 14,025 | | 1,270 | GlaxoSmithKline PLC - ADR | | 120,766 | | 2,136 |
| Coca-Cola HBC AG - ADR(Æ) | | | 20,308 | | 661 | HSBC Holdings PLC | | 252,955 | | 2,609 |
| Credit Suisse Group AG(Æ) | | | 107,465 | | 1,912 | Imperial Tobacco Group PLC | | 30,500 | | 1,304 |
| Georg Fischer AG | | | 163 | | 215 | International Consolidated Airlines | | | | |
| Glencore PLC(Æ) | | | 56,050 | | 295 | Group SA | | 17,148 | | 149 |
| Julius Baer Group, Ltd. (Æ) | | | 16,269 | | 994 | J Sainsbury PLC | | 516,400 | | 1,682 |
| LafargeHolcim, Ltd. (Æ) | | | 4,129 | | 233 | JD Sports Fashion PLC | | 19,200 | | 87 |
| Lonza Group AG(Æ) | | | 4,820 | | 1,302 | John Wood Group PLC | | 62,976 | | 550 |
| Luzerner Kantonalbank AG | | | 158 | | 75 | Just Eat PLC(Æ) | | 87,541 | | 918 |
| Nestle SA | | | 25,163 | | 2,162 | Kingfisher PLC | | 163,300 | | 744 |
| Novartis AG | | | 47,008 | | 3,975 | Land Securities Group PLC(ö) | | 21,843 | | 297 |
| Oriflame Holding AG | | | 240 | | 10 | Legal & General Group PLC | | 53,111 | | 196 |
| Pargesa Holding SA | | | 560 | | 49 | Lloyds Banking Group PLC | | 1,130,207 | | 1,035 |
| Roche Holding AG | | | 19,311 | | 4,885 | London Stock Exchange Group PLC | | 20,225 | | 1,036 |
| SGS SA | | | 159 | | 414 | Lookers PLC | | 144,915 | | 201 |
| Sika AG | | | 384 | | 3,044 | LSL Property Services PLC(Å) | | 110,360 | | 412 |
| STMicroelectronics NV | | | 24,668 | | 536 | Meggitt PLC | | 84,717 | | 549 |
| Straumann Holding AG | | | 786 | | 555 | Michael Page International PLC | | 64,250 | | 403 |
| Sulzer AG | | | 910 | | 110 | National Grid PLC | | 26,899 | | 316 |
| Swiss Life Holding AG(Æ) | | | 2,777 | | 983 | Old Mutual PLC | | 64,896 | | 203 |
| Swiss Re AG | | | 9,000 | | 842 | Persimmon PLC Class A | | 37,888 | | 1,399 |
| Swisscom AG | | | 507 | | 269 | Reckitt Benckiser Group PLC | | 1,619 | | 151 |
| UBS Group AG(Æ) | | | 185,760 | | 3,413 | Redrow PLC | | 15,556 | | 138 |
| Zurich Insurance Group AG | | | 1,376 | | 418 | Rio Tinto PLC - ADR | | 28,886 | | 1,529 |
| | | | | | 32,128 | Rio Tinto PLC | | 21,950 | | 1,159 |
| | | | | | | Royal Bank of Scotland Group PLC(Æ) | | 991,672 | | 3,699 |
| Taiwan - 0.4% | | | | | | Royal Dutch Shell PLC Class A | | 14,887 | | 499 |
| Catcher Technology Co. , Ltd. | | | 72,000 | | 791 | Royal Dutch Shell PLC Class B | | 53,173 | | 1,793 |
| Compal Electronics, Inc. | | | 542,000 | | 387 | Royal Mail PLC | | 82,300 | | 503 |
| Hon Hai Precision Industry Co. , Ltd. | | | 107,153 | | 341 | Sage Group PLC (The) | | 9,300 | | 100 |
| | | | | | 1,519 | Scottish & Southern Energy PLC | | 5,144 | | 92 |
| | | | | | | Smith & Nephew PLC | | 720 | | 12 |
| | | | | | | SSP Group PLC | | 4,600 | | 42 |
See accompanying notes which are an integral part of the financial statements.
58 International Developed Markets Fund
Russell Investment Funds
International Developed Markets Fund
Schedule of Investments, continued — December 31, 2017
| | | | | | | | | | |
| Amounts in thousands (except share amounts) | | | Amounts in thousands (except share amounts) | | |
| | | Principal | | Fair | | | | Principal | | Fair |
| | | Amount ($) | | Value | | | | Amount ($) | | Value |
| | | or Shares | | $ | | | | or Shares | | $ |
| Standard Chartered PLC(Æ) | | 163,189 | | 1,718 | Total Warrants & Rights | | | | | |
| Standard Life Aberdeen PLC | | 22,412 | | 132 | (cost $10) | | | | | 10 |
| Stock Spirits Group PLC | | 100,540 | | 365 | | | | | | |
| Subsea 7 SA | | 12,081 | | 181 | | | | | | |
| Taylor Wimpey PLC | | 344,406 | | 959 | Short-Term Investments - 4.8% | | | | | |
| Tesco PLC | | 601,371 | | 1,698 | United States - 4.8% | | | | | |
| | | | | | U. S. Cash Management Fund(@) | | | 21,071,392 | (8) | 21,071 |
| |
| Unilever Travis Perkins NV PLC | | 133,669 | 34,040 | 1,912 2,825 | Total Short-Term Investments | | | | | |
| Unilever PLC | | 3,780 | | 209 | (cost $21,073) | | | | | 21,071 |
| Vertu Motors PLC | | 50,927 | | 35 | | | | | | |
| Vodafone Group PLC | | 983,166 | | 3,106 | Other Securities - 0.1% | | | | | |
| Wausau Paper Corp. | | 59,638 | | 1,081 | U. S. Cash Collateral Fund(×)(@) | | | 401,903 | (8) | 402 |
| Wm Morrison Supermarkets PLC | | 97,200 | | 288 | Total Other Securities | | | | | |
| | | | | 61,005 | (cost $402) | | | | | 402 |
| |
| United States - 3.6% | | | | | | | | | | |
| Alphabet, Inc. Class C(Æ) | | 2,891 | | 3,025 | Total Investments 98.2% | | | | | |
| Brookfield Real Estate Services, Inc. (Å) | | 18,232 | | 240 | (identified cost $385,454) | | | | | 428,352 |
| Carnival PLC | | 16,990 | | 1,117 | | | | | | |
| Facebook, Inc. Class A(Æ) | | 14,948 | | 2,638 | Other Assets and Liabilities, Net | | | | | |
| Interfor Corp. (Æ) | | 900 | | 15 | - 1.8% | | | | | 7,958 |
| Lam Research Corp. | | 7,250 | | 1,335 | Net Assets - 100.0% | | | | | 436,310 |
| MasterCard, Inc. Class A | | 4,575 | | 692 | | | | | | |
| Mylan NV(Æ) | | 61,482 | | 2,601 | | | | | | |
| News Corp. Class A | | 66,832 | | 1,083 | | | | | | |
| NVIDIA Corp. | | 8,688 | | 1,681 | | | | | | |
| Thomson Reuters Corp. | | 5,196 | | 227 | | | | | | |
| Visa, Inc. Class A | | 10,138 | | 1,156 | | | | | | |
| | | | | 15,810 | | | | | | |
| |
| Total Common Stocks | | | | | | | | | | |
| (cost $359,699) | | | | 401,390 | | | | | | |
| |
| Preferred Stocks - 1.3% | | | | | | | | | | |
| Germany - 1.3% | | | | | | | | | | |
| Bayerische Motoren Werke AG | | | | | | | | | | |
| 4.274% (Ÿ) | | 12,661 | | 1,131 | | | | | | |
| Porsche Automobil Holding SE | | | | | | | | | | |
| 1.282% (Ÿ) | | 3,041 | | 255 | | | | | | |
| Schaeffler AG | | | | | | | | | | |
| 3.021% (Ÿ) | | 14,430 | | 255 | | | | | | |
| Volkswagen AG | | | | | | | | | | |
| 1.092% (Ÿ) | | 19,140 | | 3,813 | | | | | | |
| | | | | 5,454 | | | | | | |
| |
| Italy - 0.0% | | | | | | | | | | |
| Telecom Italia SpA | | | | | | | | | | |
| 4.432% (Ÿ) | | 35,003 | | 25 | | | | | | |
| |
| Total Preferred Stocks | | | | | | | | | | |
| (cost $4,270) | | | | 5,479 | | | | | | |
| |
| Warrants & Rights - 0.0% | | | | | | | | | | |
| Spain - 0.0% | | | | | | | | | | |
| Repsol SA(Æ) | | | | | | | | | | |
| 2018 Rights | | 21,512 | | 10 | | | | | | |
See accompanying notes which are an integral part of the financial statements.
International Developed Markets Fund 59
Russell Investment Funds
International Developed Markets Fund
Schedule of Investments, continued — December 31, 2017
| | | | | | | | | | | | | | | | |
| Restricted Securities | | | | | | | | | | | | | | | | |
| |
| Amounts in thousands (except share and cost per unit amounts) | | | | | | | | | | | | | |
| | | | | | | | Principal | | Cost per | | Cost | | Fair Value | |
| % of Net Assets | | | Acquisition | | | | Amount ($) | | | Unit | | (000 | ) | (000 | ) |
| Securities | | | Date | | | | or shares | | | $ | | $ | | $ | |
| 0.1% | | | | | | | | | | | | | | | | |
| Brookfield Real Estate Services, Inc. | | | 12/06/17 | | CAD | | 18,232 | | | 12.51 | | 228 | | 240 | |
| LSL Property Services PLC | | | 12/06/17 | | GBP | | 110,360 | | | 3.88 | | 428 | | 412 | |
| | | | | | | | | | | | | | | | 652 | |
| For a description of restricted securities see note 7 in the Notes to Financial Statements. | | | | | | | | |
| |
| Futures Contracts | | | | | | | | | | | | | | | | |
| |
| Amounts in thousands (except contract amounts) | | | | | | | | | | | | | | | | |
| | | | | | | | | | | | | | | | Value and | |
| | | | | | | | | | | | | | | | Unrealized | |
| | | | | | | | | | | | | | Appreciation | |
| | | | | Number of | | Notional | Expiration | (Depreciation) | |
| | | | | Contracts | | Amount | Date | | | $ | |
| Long Positions | | | | | | | | | | | | | | | | |
| CAC40 Euro Index Futures | | | | | | 32 | EUR | | 1,699 | 01/18 | | | (31 | ) |
| DAX Index Futures | | | | | | 5 | EUR | | 1,614 | 03/18 | | | (35 | ) |
| EURO STOXX 50 Index Futures | | | | | | 250 | EUR | | 8,733 | 03/18 | | | (252 | ) |
| FTSE 100 Index Futures | | | | | | 34 | GBP | | 2,597 | 03/18 | | | 97 | |
| Hang Seng Index Futures | | | | | | 3 | HKD | | 4,492 | 01/18 | | | 6 | |
| S&P/TSX 60 Index Futures | | | | | | 37 | CAD | | 7,085 | 03/18 | | | 20 | |
| SPI 200 Index Futures | | | | | | 8 | AUD | | 1,204 | 03/18 | | | 1 | |
| TOPIX Index Futures | | | | | | 209 | JPY | 3,797,530 | 03/18 | | | 525 | |
| Short Positions | | | | | | | | | | | | | | | | |
| Hang Seng Index Futures | | | | | | 25 | HKD | 37,435 | 01/18 | | | (47 | ) |
| MSCI Emerging Markets Mini Index Futures | | | | | | 239 | USD | 13,906 | 03/18 | | | (571 | ) |
| S&P 500 E-Mini Index Futures | | | | | | 162 | USD | 21,676 | 03/18 | | | (264 | ) |
| SPI 200 Index Futures | | | | | | 28 | AUD | | 4,214 | 03/18 | | | (10 | ) |
| Total Value and Unrealized Appreciation (Depreciation) on Open Futures Contracts (å) | | | | | | | | | | | | (561 | ) |
| |
| Foreign Currency Exchange Contracts | | | | | | | | | | | | | | | | |
| Amounts in thousands | | | | | | | | | | | | | | | | |
| | | | | | | | | | | | | | | | Unrealized | |
| | | | | | | | | | | | | | | | Appreciation | |
| | | | Amount | | | Amount | | | | | (Depreciation) | |
| Counterparty | | | Sold | | | Bought | Settlement Date | | | $ | |
| Bank of America | | | USD | | 673 | | AUD | | 895 | 03/22/18 | | | 25 | |
| Bank of America | | | USD | 2,402 | | AUD | | 3,195 | 03/22/18 | | | 91 | |
| Bank of America | | | USD | 3,002 | | AUD | | 4,000 | 03/22/18 | | | 118 | |
| Bank of America | | | USD | 3,002 | | AUD | | 4,000 | 03/22/18 | | | 119 | |
| Bank of America | | | USD | | 976 | | CAD | | 1,254 | 03/22/18 | | | 22 | |
| Bank of America | | | USD | 3,762 | | CAD | | 4,830 | 03/22/18 | | | 85 | |
| Bank of America | | | USD | 6,230 | | CAD | | 8,000 | 03/22/18 | | | 140 | |
| Bank of America | | | USD | | 637 | | DKK | | 4,000 | 03/22/18 | | | 11 | |
| Bank of America | | | USD | 2,272 | | EUR | | 1,914 | 03/22/18 | | | 36 | |
| Bank of America | | | USD | 4,383 | | EUR | | 3,700 | 03/22/18 | | | 77 | |
| Bank of America | | | USD | 5,188 | | EUR | | 4,372 | 03/22/18 | | | 82 | |
| Bank of America | | | USD | 1,628 | | GBP | | 1,210 | 03/22/18 | | | 10 | |
| Bank of America | | | USD | 1,938 | | GBP | | 1,440 | 03/22/18 | | | 11 | |
| Bank of America | | | USD | 3,093 | | GBP | | 2,300 | 03/22/18 | | | 20 | |
| Bank of America | | | USD | | 458 | | HKD | | 3,569 | 03/22/18 | | | — | |
| Bank of America | | | USD | | 513 | | HKD | | 4,000 | 03/22/18 | | | (1 | ) |
| Bank of America | | | USD | | 914 | | HKD | | 7,125 | 03/22/18 | | | (1 | ) |
| Bank of America | | | USD | 5,648 | | HKD | | 44,000 | 03/22/18 | | | (7 | ) |
See accompanying notes which are an integral part of the financial statements.
60 International Developed Markets Fund
Russell Investment Funds
International Developed Markets Fund
Schedule of Investments, continued — December 31, 2017
| | | | | | | |
| Foreign Currency Exchange Contracts | | | | | | | |
| Amounts in thousands | | | | | | | |
| | | | | | | Unrealized | |
| | | | | | | Appreciation | |
| | | Amount | | Amount | | (Depreciation) | |
| Counterparty | | Sold | | Bought | Settlement Date | $ | |
| Bank of America | USD | 2,513 | JPY | 281,650 | 03/22/18 | (3 | ) |
| Bank of America | USD | 7,751 | JPY | 868,866 | 03/22/18 | (10 | ) |
| Bank of America | USD | 446 | SEK | 3,750 | 03/22/18 | 13 | |
| Bank of America | AUD | 1,938 | USD | 1,456 | 03/22/18 | (55 | ) |
| Bank of America | CAD | 650 | USD | 506 | 03/22/18 | (11 | ) |
| Bank of America | CAD | 1,000 | USD | 779 | 03/22/18 | (18 | ) |
| Bank of America | CHF | 988 | USD | 1,002 | 03/22/18 | (17 | ) |
| Bank of America | DKK | 2,275 | USD | 363 | 03/22/18 | (5 | ) |
| Bank of America | EUR | 1,500 | USD | 1,777 | 03/22/18 | (31 | ) |
| Bank of America | EUR | 1,943 | USD | 2,305 | 03/22/18 | (36 | ) |
| Bank of America | GBP | 100 | USD | 134 | 03/22/18 | (1 | ) |
| Bank of America | GBP | 378 | USD | 508 | 03/22/18 | (3 | ) |
| Bank of America | HKD | 400 | USD | 51 | 03/22/18 | — | |
| Bank of America | HKD | 19,350 | USD | 2,482 | 03/22/18 | 2 | |
| Bank of America | JPY | 30,000 | USD | 266 | 03/22/18 | (1 | ) |
| Bank of America | JPY | 350,000 | USD | 3,102 | 03/22/18 | (17 | ) |
| Bank of America | JPY | 380,000 | USD | 3,390 | 03/22/18 | 4 | |
| Bank of America | JPY | 380,000 | USD | 3,368 | 03/22/18 | (18 | ) |
| Bank of America | NOK | 3,800 | USD | 460 | 03/22/18 | (4 | ) |
| Bank of America | NOK | 11,000 | USD | 1,329 | 03/22/18 | (14 | ) |
| Bank of America | NZD | 4,000 | USD | 2,731 | 03/22/18 | (101 | ) |
| Bank of America | SEK | 15,000 | USD | 1,787 | 03/22/18 | (50 | ) |
| BNP Paribas | AUD | 1,000 | USD | 756 | 03/22/18 | (24 | ) |
| BNP Paribas | CAD | 1,300 | USD | 1,017 | 03/22/18 | (18 | ) |
| BNP Paribas | EUR | 5,000 | USD | 5,940 | 03/22/18 | (88 | ) |
| BNP Paribas | GBP | 1,300 | USD | 1,746 | 03/22/18 | (13 | ) |
| BNP Paribas | HKD | 3,700 | USD | 474 | 03/22/18 | — | |
| BNP Paribas | JPY | 300,000 | USD | 2,690 | 03/22/18 | 17 | |
| Brown Brothers Harriman | USD | 33 | GBP | 24 | 01/03/18 | — | |
| Brown Brothers Harriman | USD | 44 | JPY | 4,981 | 01/05/18 | — | |
| Brown Brothers Harriman | AUD | 50 | USD | 38 | 03/22/18 | (1 | ) |
| Brown Brothers Harriman | AUD | 100 | USD | 76 | 03/22/18 | (2 | ) |
| Brown Brothers Harriman | CAD | 100 | USD | 78 | 03/22/18 | (2 | ) |
| Brown Brothers Harriman | CAD | 100 | USD | 78 | 03/22/18 | (1 | ) |
| Brown Brothers Harriman | CHF | 231 | USD | 236 | 01/03/18 | (1 | ) |
| Brown Brothers Harriman | EUR | 300 | USD | 355 | 03/22/18 | (6 | ) |
| Brown Brothers Harriman | EUR | 400 | USD | 475 | 03/22/18 | (8 | ) |
| Brown Brothers Harriman | GBP | 46 | USD | 62 | 01/03/18 | — | |
| Brown Brothers Harriman | GBP | 100 | USD | 134 | 03/22/18 | (1 | ) |
| Brown Brothers Harriman | HKD | 500 | USD | 64 | 03/22/18 | — | |
| Brown Brothers Harriman | JPY | 1,773 | USD | 16 | 01/04/18 | — | |
| Brown Brothers Harriman | JPY | 1,172 | USD | 10 | 01/05/18 | — | |
| Brown Brothers Harriman | JPY | 14,039 | USD | 124 | 01/05/18 | — | |
| Brown Brothers Harriman | JPY | 754 | USD | 7 | 01/09/18 | — | |
| Brown Brothers Harriman | JPY | 40,000 | USD | 358 | 03/22/18 | 2 | |
| Citigroup | USD | 2,401 | AUD | 3,195 | 03/22/18 | 91 | |
| Citigroup | USD | 3,761 | CAD | 4,830 | 03/22/18 | 85 | |
| Citigroup | USD | 2,273 | EUR | 1,914 | 03/22/18 | 34 | |
| Citigroup | USD | 1,939 | GBP | 1,440 | 03/22/18 | 11 | |
| Citigroup | USD | 914 | HKD | 7,125 | 03/22/18 | — | |
| Citigroup | USD | 7,760 | JPY | 868,866 | 03/22/18 | (19 | ) |
| Citigroup | USD | 446 | SEK | 3,750 | 03/22/18 | 13 | |
| Citigroup | AUD | 1,938 | USD | 1,456 | 03/22/18 | (55 | ) |
See accompanying notes which are an integral part of the financial statements.
International Developed Markets Fund 61
Russell Investment Funds
International Developed Markets Fund
Schedule of Investments, continued — December 31, 2017
| | | | | | | |
| Foreign Currency Exchange Contracts | | | | | | | |
| Amounts in thousands | | | | | | | |
| | | | | | | Unrealized | |
| | | | | | | Appreciation | |
| | | Amount | | Amount | | (Depreciation) | |
| Counterparty | | Sold | | Bought | Settlement Date | $ | |
| Citigroup | CAD | 650 | USD | 506 | 03/22/18 | (11 | ) |
| Citigroup | CHF | 988 | USD | 1,004 | 03/22/18 | (15 | ) |
| Citigroup | DKK | 2,275 | USD | 363 | 03/22/18 | (5 | ) |
| Citigroup | EUR | 1,943 | USD | 2,307 | 03/22/18 | (35 | ) |
| Citigroup | GBP | 378 | USD | 509 | 03/22/18 | (3 | ) |
| Citigroup | HKD | 19,350 | USD | 2,482 | 03/22/18 | 1 | |
| Citigroup | JPY | 380,000 | USD | 3,394 | 03/22/18 | 8 | |
| Citigroup | NOK | 3,800 | USD | 460 | 03/22/18 | (4 | ) |
| Commonwealth Bank of Australia | USD | 673 | AUD | 895 | 03/22/18 | 25 | |
| Commonwealth Bank of Australia | USD | 2,402 | AUD | 3,195 | 03/22/18 | 91 | |
| Commonwealth Bank of Australia | USD | 977 | CAD | 1,254 | 03/22/18 | 21 | |
| Commonwealth Bank of Australia | USD | 3,764 | CAD | 4,830 | 03/22/18 | 83 | |
| Commonwealth Bank of Australia | USD | 2,273 | EUR | 1,914 | 03/22/18 | 34 | |
| Commonwealth Bank of Australia | USD | 5,192 | EUR | 4,372 | 03/22/18 | 78 | |
| Commonwealth Bank of Australia | USD | 1,626 | GBP | 1,210 | 03/22/18 | 12 | |
| Commonwealth Bank of Australia | USD | 1,935 | GBP | 1,440 | 03/22/18 | 14 | |
| Commonwealth Bank of Australia | USD | 458 | HKD | 3,569 | 03/22/18 | — | |
| Commonwealth Bank of Australia | USD | 914 | HKD | 7,125 | 03/22/18 | (1 | ) |
| Commonwealth Bank of Australia | USD | 2,515 | JPY | 281,650 | 03/22/18 | (6 | ) |
| Commonwealth Bank of Australia | USD | 7,759 | JPY | 868,866 | 03/22/18 | (18 | ) |
| Commonwealth Bank of Australia | USD | 447 | SEK | 3,750 | 03/22/18 | 13 | |
| Commonwealth Bank of Australia | AUD | 1,938 | USD | 1,456 | 03/22/18 | (55 | ) |
| Commonwealth Bank of Australia | CAD | 650 | USD | 506 | 03/22/18 | (11 | ) |
| Commonwealth Bank of Australia | CHF | 988 | USD | 1,004 | 03/22/18 | (16 | ) |
| Commonwealth Bank of Australia | DKK | 2,275 | USD | 363 | 03/22/18 | (5 | ) |
| Commonwealth Bank of Australia | EUR | 1,943 | USD | 2,307 | 03/22/18 | (35 | ) |
| Commonwealth Bank of Australia | GBP | 378 | USD | 508 | 03/22/18 | (4 | ) |
| Commonwealth Bank of Australia | HKD | 19,350 | USD | 2,482 | 03/22/18 | 2 | |
| Commonwealth Bank of Australia | JPY | 380,000 | USD | 3,394 | 03/22/18 | 8 | |
| Commonwealth Bank of Australia | NOK | 3,800 | USD | 460 | 03/22/18 | (3 | ) |
| State Street | USD | 19 | AUD | 24 | 01/02/18 | — | |
| State Street | USD | 672 | AUD | 895 | 03/22/18 | 26 | |
| State Street | USD | 2,401 | AUD | 3,195 | 03/22/18 | 91 | |
| State Street | USD | 977 | CAD | 1,254 | 03/22/18 | 22 | |
| State Street | USD | 3,763 | CAD | 4,830 | 03/22/18 | 84 | |
| State Street | USD | 49 | EUR | 41 | 01/02/18 | — | |
| State Street | USD | 2,273 | EUR | 1,914 | 03/22/18 | 35 | |
| State Street | USD | 5,191 | EUR | 4,372 | 03/22/18 | 79 | |
| State Street | USD | 402 | GBP | 300 | 03/22/18 | 4 | |
| State Street | USD | 1,626 | GBP | 1,210 | 03/22/18 | 12 | |
| State Street | USD | 1,935 | GBP | 1,440 | 03/22/18 | 15 | |
| State Street | USD | 458 | HKD | 3,569 | 03/22/18 | — | |
| State Street | USD | 914 | HKD | 7,125 | 03/22/18 | (1 | ) |
| State Street | USD | 61 | JPY | 6,866 | 01/04/18 | — | |
| State Street | USD | 2,514 | JPY | 281,650 | 03/22/18 | (5 | ) |
| State Street | USD | 7,756 | JPY | 868,866 | 03/22/18 | (14 | ) |
| State Street | USD | 6 | NOK | 50 | 01/02/18 | — | |
| State Street | USD | 447 | SEK | 3,750 | 03/22/18 | 13 | |
| State Street | USD | 25 | SGD | 33 | 01/02/18 | — | |
| State Street | AUD | 50 | USD | 39 | 03/22/18 | — | |
| State Street | AUD | 300 | USD | 226 | 03/22/18 | (8 | ) |
| State Street | AUD | 1,938 | USD | 1,456 | 03/22/18 | (56 | ) |
| State Street | CAD | 1 | USD | 1 | 01/02/18 | — | |
See accompanying notes which are an integral part of the financial statements.
62 International Developed Markets Fund
Russell Investment Funds
International Developed Markets Fund
Schedule of Investments, continued — December 31, 2017
| | | | | | | | |
| Foreign Currency Exchange Contracts | | | | | | | | |
| Amounts in thousands | | | | | | | | |
| | | | | | | | Unrealized | |
| | | | | | | | Appreciation | |
| | | Amount | | Amount | | (Depreciation) | |
| Counterparty | | Sold | | Bought | Settlement Date | $ | |
| State Street | CAD | 80 | USD | | 63 | 03/22/18 | (1 | ) |
| State Street | CAD | 500 | USD | | 390 | 03/22/18 | (9 | ) |
| State Street | CAD | 650 | USD | | 506 | 03/22/18 | (11 | ) |
| State Street | CHF | 988 | USD | | 1,003 | 03/22/18 | (16 | ) |
| State Street | DKK | 2,275 | USD | | 363 | 03/22/18 | (5 | ) |
| State Street | EUR | 500 | USD | | 596 | 03/22/18 | (6 | ) |
| State Street | EUR | 1,300 | USD | | 1,541 | 03/22/18 | (26 | ) |
| State Street | EUR | 1,943 | USD | | 2,306 | 03/22/18 | (35 | ) |
| State Street | GBP | 10 | USD | | 13 | 01/02/18 | — | |
| State Street | GBP | 378 | USD | | 507 | 03/22/18 | (4 | ) |
| State Street | GBP | 500 | USD | | 669 | 03/22/18 | (7 | ) |
| State Street | HKD | 169 | USD | | 22 | 01/02/18 | — | |
| State Street | HKD | 1,300 | USD | | 167 | 03/22/18 | — | |
| State Street | HKD | 19,350 | USD | | 2,482 | 03/22/18 | 1 | |
| State Street | JPY | 5,810 | USD | | 52 | 01/05/18 | — | |
| State Street | JPY | 100,000 | USD | | 886 | 03/22/18 | (5 | ) |
| State Street | JPY | 380,000 | USD | | 3,392 | 03/22/18 | 6 | |
| State Street | NOK | 3,800 | USD | | 460 | 03/22/18 | (4 | ) |
| Total Unrealized Appreciation (Depreciation) on Open Foreign Currency Exchange Contracts | | | | | 814 | |
| | | | | | | | | | | | | |
| Presentation of Portfolio Holdings | | | | | | | | | | | |
| |
| Amounts in thousands | | | | | | | | | | | | | |
| | | | | Fair Value | | | | | | | | |
| | | | | | | | | Practical | | | | |
| Portfolio Summary | | Level 1 | | Level 2 | | Level 3 | Expedient (a) | | Total | % of Net Assets |
| Common Stocks | | | | | | | | | | | | | |
| Australia | $ | — | $ | 13,633 | $ | | — | $ | — | $ | 13,633 | | 3.1 |
| Austria | | — | | 1,653 | | | — | | — | | 1,653 | | 0.4 |
| Belgium | | — | | 6,562 | | | — | | — | | 6,562 | | 1.5 |
| Bermuda | | 693 | | — | | | — | | — | | 693 | | 0.2 |
| Brazil | | — | | 756 | | | — | | — | | 756 | | 0.2 |
| Canada | | 17,551 | | — | | | — | | — | | 17,551 | | 4.0 |
| China | | 4,897 | | 7,688 | | | — | | — | | 12,585 | | 2.9 |
| Denmark | | — | | 6,903 | | | — | | — | | 6,903 | | 1.6 |
| Finland | | — | | 1,915 | | | — | | — | | 1,915 | | 0.4 |
| France | | — | | 37,337 | | | — | | — | | 37,337 | | 8.6 |
| Germany | | 1,113 | | 28,322 | | | — | | — | | 29,435 | | 6.7 |
| Hong Kong | | 979 | | 10,860 | | | — | | — | | 11,839 | | 2.7 |
| India | | 2,603 | | — | | | — | | — | | 2,603 | | 0.6 |
| Indonesia | | — | | 1,039 | | | — | | — | | 1,039 | | 0.2 |
| Ireland | | 1,370 | | 56 | | | — | | — | | 1,426 | | 0.3 |
| Israel | | 583 | | 2,468 | | | — | | — | | 3,051 | | 0.7 |
| Italy | | — | | 12,138 | | | — | | — | | 12,138 | | 2.8 |
| Japan | | — | | 73,466 | | | — | | — | | 73,466 | | 16.8 |
| Jersey | | — | | 284 | | | — | | — | | 284 | | 0.1 |
See accompanying notes which are an integral part of the financial statements.
International Developed Markets Fund 63
Russell Investment Funds
International Developed Markets Fund
Schedule of Investments, continued — December 31, 2017
| | | | | | | | | | | | | | | | | |
| Presentation of Portfolio Holdings | | | | | | | | | | | | | | | |
| |
| Amounts in thousands | | | | | | | | | | | | | | | | | |
| | | | | | Fair Value | | | | | | | | | | |
| | | | | | | | | | | Practical | | | | | | |
| Portfolio Summary | | Level 1 | | | Level 2 | | | Level 3 | Expedient (a) | | Total | | % of Net Assets | |
| Luxembourg | | — | | | 466 | | | | — | | — | | 466 | | | 0.1 | |
| Macao | | — | | | 953 | | | | — | | — | | 953 | | | 0.2 | |
| Mexico | | 1,595 | | | — | | | | — | | — | | 1,595 | | | 0.4 | |
| Netherlands | | 992 | | | 13,582 | | | | — | | — | | 14,574 | | | 3.3 | |
| Norway | | — | | | 3,932 | | | | — | | — | | 3,932 | | | 0.9 | |
| Papua New Guinea | | — | | | 10 | | | | — | | — | | 10 | | | —* | |
| Portugal | | — | | | 1,168 | | | | — | | — | | 1,168 | | | 0.3 | |
| Russia | | — | | | 2,746 | | | | — | | — | | 2,746 | | | 0.6 | |
| Singapore | | — | | | 2,905 | | | | — | | — | | 2,905 | | | 0.7 | |
| South Korea | | — | | | 9,256 | | | | — | | — | | 9,256 | | | 2.1 | |
| Spain | | — | | | 8,767 | | | | — | | — | | 8,767 | | | 2.0 | |
| Sweden | | — | | | 9,687 | | | | — | | — | | 9,687 | | | 2.2 | |
| Switzerland | | — | | | 32,128 | | | | — | | — | | 32,128 | | | 7.4 | |
| Taiwan | | — | | | 1,519 | | | | — | | — | | 1,519 | | | 0.4 | |
| United Kingdom | | 4,054 | | | 56,951 | | | | — | | — | | 61,005 | | | 14.0 | |
| United States | | 14,693 | | | 1,117 | | | | — | | — | | 15,810 | | | 3.6 | |
| Preferred Stocks | | — | | | 5,479 | | | | — | | — | | 5,479 | | | 1.3 | |
| Warrants & Rights | | 10 | | | — | | | | — | | — | | 10 | | | —* | |
| Short-Term Investments | | — | | | — | | | | — | | 21,071 | | 21,071 | | | 4.8 | |
| Other Securities | | — | | | — | | | | — | | 402 | | 402 | | | 0.1 | |
| Total Investments | | 51,133 | | | 355,746 | | | | — | | 21,473 | | 428,352 | | | 98.2 | |
| Other Assets and Liabilities, Net | | | | | | | | | | | | | | | | 1.8 | |
| | | | | | | | | | | | | | | | | 100.0 | |
| |
| Other Financial Instruments | | | | | | | | | | | | | | | | | |
| Assets | | | | | | | | | | | | | | | | | |
| Futures Contracts | | 649 | | | — | | | | — | | — | | 649 | | | 0.1 | |
| Foreign Currency Exchange Contracts | | — | | | 1,897 | | | | — | | — | | 1,897 | | | 0.4 | |
| | | | | | | | | | | | | | | | | |
| Liabilities | | | | | | | | | | | | | | | | | |
| Futures Contracts | | (1,210 | ) | | — | | | | — | | — | | (1,210 | ) | | (0.3 | ) |
| Foreign Currency Exchange Contracts | | — | | | (1,083 | ) | | | — | | — | | (1,083 | ) | | (0.2 | ) |
| Total Other Financial Instruments** | $ | (561 | ) | $ | 814 | | $ | | — | $ | — | $ | 253 | | | | |
* Less than 0.05% of net assets.
** Futures and foreign currency exchange contract values reflect the unrealized appreciation (depreciation) on the investments.
(a) Certain investments that are measured at fair value using the net asset value per share (or its equivalent) practical expedient have not been classified
in the fair value levels. The fair value amounts presented in the table are intended to permit reconciliation to the amounts presented in the Schedule of
Investments.
For a description of the Levels, see note 2 in the Notes to Financial Statements.
For a disclosure on transfers between Levels 1, 2 and 3 during the period ended December 31, 2017, see note 2 in the Notes to
Financial Statements.
See accompanying notes which are an integral part of the financial statements.
64 International Developed Markets Fund
Russell Investment Funds
International Developed Markets Fund
Schedule of Investments, continued — December 31, 2017
| | | |
| Amounts in thousands | | | |
| | Fair Value | |
| Sector Exposure | | $ | |
| Consumer Discretionary | | 54,253 | |
| Consumer Staples | | 28,110 | |
| Energy | | 22,269 | |
| Financial Services | | 109,762 | |
| Health Care | | 30,578 | |
| Materials and Processing | | 35,041 | |
| Producer Durables | | 44,888 | |
| Technology | | 54,524 | |
| Utilities | | 27,444 | |
| Warrants and Rights | | 10 | |
| Short-Term Investments | | 21,473 | |
| Total Investments | | 428,352 | |
See accompanying notes which are an integral part of the financial statements.
International Developed Markets Fund 65
Russell Investment Funds
International Developed Markets Fund
Fair Value of Derivative Instruments — December 31, 2017
Amounts in thousands
| | | | | | |
| | | | | | Foreign |
| | | Equity | | Currency |
| Derivatives not accounted for as hedging instruments | Contracts | | Contracts |
| |
| Location: Statement of Assets and Liabilities - Assets | | | | | |
| Unrealized appreciation on foreign currency exchange contracts | $ | — | | $ | 1,897 |
| Variation margin on futures contracts* | | | 649 | | | — |
| Total | | $ | 649 | | $ | 1,897 |
| |
| |
| Location: Statement of Assets and Liabilities - Liabilities | | | | | |
| Variation margin on futures contracts* | | $ | 1,210 | | $ | — |
| Unrealized depreciation on foreign currency exchange contracts | | — | | | 1,083 |
| Total | | $ | 1,210 | | $ | 1,083 |
| | | | | | Foreign |
| | | Equity | | Currency |
| Derivatives not accounted for as hedging instruments | Contracts | | Contracts |
| |
| Location: Statement of Operations - Net realized gain (loss) | | | | | |
| Futures contracts | | $ | 810 | | $ | — |
| Options written | | | (922 | ) | | — |
| Foreign currency exchange contracts | | | — | | | 602 |
| Total | | $ | (112 | ) | $ | 602 |
| |
| |
| Location: Statement of Operations - Net change in unrealized appreciation (depreciation) | | | | | |
| Futures contracts | | $ | (834 | ) | $ | — |
| Options written | | | 8 | | | — |
| Foreign currency exchange contracts | | | — | | | 1,195 |
| Total | | $ | (826 | ) | $ | 1,195 |
* Includes cumulative appreciation/depreciation of futures contracts as reported in the Schedule of Investments. Only variation margin is reported within the
Statement of Assets and Liabilities.
For further disclosure on derivatives see note 2 in the Notes to Financial Statements.
See accompanying notes which are an integral part of the financial statements.
66 International Developed Markets Fund
Russell Investment Funds
International Developed Markets Fund
Balance Sheet Offsetting of Financial and Derivative Instruments —
December 31, 2017
| | | | | | | | | | | | | |
| Amounts in thousands | | | | | | | | | | | | | |
| | | | | | | | | | | | | |
| Offsetting of Financial Assets and Derivative Assets | | | | | | | | | | | | |
| | | | | | | | Gross | Net Amounts | |
| | | | | | | | Amounts | | | of Assets | |
| | | | | | | Gross | Offset in the | Presented in | |
| | | | | Amounts of | Statement of | the Statement | |
| | | | | Recognized | Assets and | of Assets and | |
| Description | Location: Statement of Assets and Liabilities - Assets | | | Assets | Liabilities | | | Liabilities | |
| Securities on Loan* | Investments, at fair value | | | $ | | 387 | | $ | — | $ | 387 | |
| Foreign Currency Exchange Contracts | Unrealized appreciation on foreign currency exchange contracts | | | 1,897 | | | — | | 1,897 | |
| Futures Contracts | Variation margin on futures contracts | | | | | 127 | | | — | | 127 | |
| Total Financial and Derivative Assets | | | | | | 2,411 | | | — | | 2,411 | |
| Financial and Derivative Assets not subject to a netting agreement | | | | | (127 | ) | | — | | (127 | ) |
| Total Financial and Derivative Assets subject to a netting agreement | | | $ | | 2,284 | | $ | — | $ | 2,284 | |
| |
| |
| |
| Financial Assets, Derivative Assets, and Collateral Held by Counterparty | | | | | | | | | | | |
| | | | | Gross Amounts Not Offset in | | | | |
| | | | | the Statement of Assets and | | | | |
| | | | | | | Liabilities | | | | | | |
| |
| | | Net Amounts | | | | | | | | | | |
| | | | of Assets | | | | | | | | | | |
| | | Presented in | | | | | | | | | | |
| | | the Statement | | Financial and | | | | | | | |
| | | of Assets and | Derivative | Collateral | | | |
| Counterparty | | | Liabilities | | | Instruments | Received^ | | Net Amount | |
| Bank of America | | $ | 864 | | $ | 402 | | $ | — | $ | 462 | |
| BNP Paribas | | | 17 | | | 17 | | | — | | — | |
| Brown Brothers Harriman | | | 2 | | | 2 | | | — | | — | |
| Citigroup | | | 404 | | | 148 | | | 160 | | 96 | |
| Commonwealth Bank of Australia | | | 381 | | | 153 | | | — | | 228 | |
| Goldman Sachs | | | 115 | | | — | | | 115 | | — | |
| JPMorgan Chase | | | 112 | | | — | | | 112 | | — | |
| State Street | | | 389 | | | 214 | | | — | | 175 | |
| Total | | $ | 2,284 | | $ | 936 | | $ | 387 | $ | 961 | |
See accompanying notes which are an integral part of the financial statements.
International Developed Markets Fund 67
Russell Investment Funds
International Developed Markets Fund
Balance Sheet Offsetting of Financial and Derivative Instruments, continued —
December 31, 2017
| | | | | | | | | |
| Amounts in thousands | | | | | | | | | |
| |
| Offsetting of Financial Liabilities and Derivative Liabilities | | | | | | | | |
| | | | | Gross | Net Amounts | |
| | | | | Amounts | of Liabilities | |
| | | | Gross | Offset in the | Presented in | |
| | | Amounts of | Statement of | the Statement | |
| | | Recognized | Assets and | of Assets and | |
| Description | Location: Statement of Assets and Liabilities - Liabilities | Liabilities | Liabilities | | Liabilities | |
| Futures Contracts | Variation margin on futures contracts | $ | 192 | | $ | — $ | 192 | |
| Foreign Currency Exchange Contracts | Unrealized depreciation on foreign currency exchange contracts | | 1,083 | | | — | 1,083 | |
| Total Financial and Derivative Liabilities | | | 1,275 | | | — | 1,275 | |
| Financial and Derivative Liabilities not subject to a netting agreement | | (192 | ) | | — | (192 | ) |
| Total Financial and Derivative Liabilities subject to a netting agreement | $ | 1,083 | | $ | — $ | 1,083 | |
| | | | | | | | | |
| Financial Liabilities, Derivative Liabilities, and Collateral Pledged by Counterparty | | | | | | | |
| | | | Gross Amounts Not Offset in | |
| | | | the Statement of Assets and | |
| | | | | | Liabilities | | | |
| |
| | Net Amounts | | | | | | | |
| | of Liabilities | | | | | | | |
| | Presented in | | | | | | | |
| | the Statement | Financial and | | | | |
| | of Assets and | Derivative | Collateral | | |
| Counterparty | | Liabilities | Instruments | Pledged^ | | Net Amount |
| Bank of America | $ | 404 | | $ | 402 | $ | — | $ | 2 |
| BNP Paribas | | 143 | | | 17 | | — | | 126 |
| Brown Brothers Harriman | | 21 | | | 2 | | — | | 19 |
| Citigroup | | 148 | | | 148 | | — | | — |
| Commonwealth Bank of Australia | | 153 | | | 153 | | — | | — |
| State Street | | 214 | | | 214 | | — | | — |
| Total | $ | 1,083 | | $ | 936 | $ | — | $ | 147 |
* Fair value of securities on loan as reported in the footnotes to the Statement of Assets and Liabilities.
^ Collateral received or pledged amounts may not reconcile to those disclosed in the Statement of Assets and Liabilities due to the inclusion of off-Balance
Sheet collateral and adjustments made to exclude overcollateralization.
For further disclosure on derivatives and counterparty risk see note 2 in the Notes to Financial Statements.
See accompanying notes which are an integral part of the financial statements.
68 International Developed Markets Fund
Russell Investment Funds
International Developed Markets Fund
Statement of Assets and Liabilities — December 31, 2017
| | |
| Amounts in thousands | | |
| Assets | | |
| Investments, at identified cost | $ | 385,454 |
| Investments, at fair value(*)(>) | | 428,352 |
| Cash | | 13 |
| Cash (restricted)(a) | | 6,200 |
| Foreign currency holdings(^) | | 960 |
| Unrealized appreciation on foreign currency exchange contracts | | 1,897 |
| Receivables: | | |
| Dividends and interest | | 444 |
| Dividends from affiliated funds | | 29 |
| Investments sold | | 733 |
| Fund shares sold | | 4 |
| Foreign capital gains taxes recoverable | | 335 |
| Variation margin on futures contracts | | 127 |
| Total assets | | 439,094 |
| |
| Liabilities | | |
| Payables: | | |
| Investments purchased | | 485 |
| Fund shares redeemed | | 143 |
| Accrued fees to affiliates | | 351 |
| Other accrued expenses | | 128 |
| Variation margin on futures contracts | | 192 |
| Unrealized depreciation on foreign currency exchange contracts | | 1,083 |
| Payable upon return of securities loaned | | 402 |
| Total liabilities | | 2,784 |
| |
| Net Assets | $ | 436,310 |
See accompanying notes which are an integral part of the financial statements.
International Developed Markets Fund 69
Russell Investment Funds
International Developed Markets Fund
Statement of Assets and Liabilities, continued — December 31, 2017
| | | |
| Amounts in thousands | | | |
| Net Assets Consist of: | | | |
| Undistributed (overdistributed) net investment income | $ | (9 | ) |
| Accumulated net realized gain (loss) | | 8,833 | |
| Unrealized appreciation (depreciation) on: | | | |
| Investments | | 42,900 | |
| Investments in affiliated funds | | (2 | ) |
| Futures contracts | | (561 | ) |
| Foreign currency exchange contracts | | 814 | |
| Foreign currency-related transactions | | 28 | |
| Shares of beneficial interest | | 332 | |
| Additional paid-in capital | | 383,975 | |
| Net Assets | $ | 436,310 | |
| |
| Net Asset Value, offering and redemption price per share: | | | |
| Net asset value per share: (#) | $ | 13.12 | |
| Net assets | $ | 436,310,116 | |
| Shares outstanding ($. 01 par value) | | 33,242,972 | |
| Amounts in thousands | | | |
| (^) Foreign currency holdings - cost | $ | 953 | |
| (*) Securities on loan included in investments | $ | 387 | |
| (>) Investments in affiliates, U. S. Cash Management Fund and U. S. Cash Collateral Fund | $ | 21,473 | |
| |
| (a) Cash Collateral for Futures | $ | 6,200 | |
| (#) Net asset value per share equals net assets divided by shares of beneficial interest outstanding. | | | |
See accompanying notes which are an integral part of the financial statements.
70 International Developed Markets Fund
Russell Investment Funds
International Developed Markets Fund
Statement of Operations — For the Period Ended December 31, 2017
| | | |
| Amounts in thousands | | | |
| Investment Income | | | |
| Dividends | $ | 11,172 | |
| Dividends from affiliated funds | | 211 | |
| Securities lending income (net) | | 90 | |
| Securities lending income from affiliated funds (net) | | 39 | |
| Less foreign taxes withheld | | (948 | ) |
| Total investment income | | 10,564 | |
| |
| Expenses | | | |
| Advisory fees | | 3,558 | |
| Administrative fees | | 198 | |
| Custodian fees | | 334 | |
| Transfer agent fees | | 17 | |
| Professional fees | | 84 | |
| Trustees’ fees | | 10 | |
| Printing fees | | 51 | |
| Miscellaneous | | 16 | |
| Total expenses | | 4,268 | |
| Net investment income (loss) | | 6,296 | |
| |
| Net Realized and Unrealized Gain (Loss) | | | |
| Net realized gain (loss) on: | | | |
| Investments (net of deferred tax liability for foreign capital gains taxes) | | 57,179 | |
| Investments in affiliated funds | | (1 | ) |
| Futures contracts | | 810 | |
| Options written | | (922 | ) |
| Foreign currency exchange contracts | | 602 | |
| Foreign currency-related transactions | | 146 | |
| Net realized gain (loss) | | 57,814 | |
| Net change in unrealized appreciation (depreciation) on: | | | |
| Investments | | 22,289 | |
| Investments in affiliated funds | | (3 | ) |
| Futures contracts | | (834 | ) |
| Options written | | 8 | |
| Foreign currency exchange contracts | | 1,195 | |
| Foreign currency-related transactions | | 79 | |
| Net change in unrealized appreciation (depreciation) | | 22,734 | |
| Net realized and unrealized gain (loss) | | 80,548 | |
| Net Increase (Decrease) in Net Assets from Operations | $ | 86,844 | |
See accompanying notes which are an integral part of the financial statements.
International Developed Markets Fund 71
Russell Investment Funds
International Developed Markets Fund
Statements of Changes in Net Assets
| | | | | | |
| | For the Periods Ended December 31, | |
| Amounts in thousands | | 2017 | | | 2016 | |
| Increase (Decrease) in Net Assets | | | | | | |
| Operations | | | | | | |
| Net investment income (loss) | $ | 6,296 | | $ | 6,237 | |
| Net realized gain (loss) | | 57,814 | | | 9,806 | |
| Net change in unrealized appreciation (depreciation) | | 22,734 | | | (7,501 | ) |
| Net increase (decrease) in net assets from operations | | 86,844 | | | 8,542 | |
| |
| Distributions | | | | | | |
| From net investment income . | | (10,619 | ) | | (11,300 | ) |
| From net realized gain . | | (14,486 | ) | | — | |
| Net decrease in net assets from distributions | | (25,105 | ) | | (11,300 | ) |
| |
| Share Transactions* | | | | | | |
| Net increase (decrease) in net assets from share transactions | | 19,197 | | | 7 | |
| Total Net Increase (Decrease) in Net Assets | | 80,936 | | | (2,751 | ) |
| |
| Net Assets | | | | | | |
| Beginning of period | | 355,374 | | | 358,125 | |
| End of period | $ | 436,310 | | $ | 355,374 | |
| Undistributed (overdistributed) net investment income included in net assets | $ | (9 | ) | $ | 2,246 | |
* Share transaction amounts (in thousands) for the periods ended December 31, 2017 and December 31, 2016 were as follows:
| | | | | | | | | | | | |
| | | 2017 | | | | 2016 | | |
| | | Shares | | | Dollars | | | Shares | | | Dollars | |
| |
| Proceeds from shares sold | | 2,608 | | $ | 33,743 | | | 1,527 | | $ | 16,521 | |
| Proceeds from reinvestment of distributions | | 1,946 | | | 25,104 | | | 1,055 | | | 11,301 | |
| Payments for shares redeemed | | (3,173 | ) | | (39,650 | ) | | (2,514 | ) | | (27,815 | ) |
| Total increase (decrease) | | 1,381 | | $ | 19,197 | | | 68 | | $ | 7 | |
See accompanying notes which are an integral part of the financial statements.
72 International Developed Markets Fund
(This page intentionally left blank)
Russell Investment Funds
International Developed Markets Fund
Financial Highlights — For the Periods Ended
For a Share Outstanding Throughout Each Period.
| | | | | | | | | | | | | | | | | |
| | | $ | | $ | | | $ | | | $ | | | $ | | | $ | |
| | Net Asset Value, | | Net | | Net Realized | | | Total from | | | Distributions | | | Distributions | |
| | Beginning of | Investment | | and Unrealized | | | Investment | | | from Net | | | from Net | |
| | | Period | Income (Loss)(a)(b) | | Gain (Loss) | | | Operations | | | Investment Income | | | Realized Gain | |
| December 31, 2017 | | 11.15 | | . 19 | | 2.58 | | | 2.77 | | | (. 34 | ) | | (. 46 | ) |
| December 31, 2016 | | 11.26 | | . 19 | | | . 06 | | | . 25 | | | (. 36 | ) | | — | |
| December 31, 2015 | | 11.54 | | . 19 | | | (. 33 | ) | | (. 14 | ) | | (. 14 | ) | | — | |
| December 31, 2014 | | 12.32 | | . 26 | | | (. 80 | ) | | (. 54 | ) | | (. 24 | ) | | — | |
| December 31, 2013 | | 10.31 | | . 18 | | 2.05 | | | 2.23 | | | (. 22 | ) | | — | |
| | | | | | | | | | | | | | | | | | |
See accompanying notes which are an integral part of the financial statements.
74 International Developed Markets Fund
| | | | | | | | | | | | | | | | | |
| | | | | | | | | | | | | % | | % | | % | |
| | | | | $ | | | | | $ | | | Ratio of Expenses | Ratio of Expenses | Ratio of Net | |
| | | | | Net Asset Value, | | % | | | Net Assets, | | | to Average | to Average | Investment Income | % |
| | $ | | | End of | | Total | | | End of Period | | | Net Assets, | Net Assets, | to Average | Portfolio |
| Total Distributions | | | Period | | Return(d) | | | (000 | ) | | Gross(e) | Net(b)(e) | Net Assets(b) | Turnover Rate |
| (. 80 | ) | | 13.12 | | 24.98 | | | 436,310 | | | 1.08 | | 1.08 | | 1.59 | 117 |
| (. 36 | ) | | 11.15 | | 2.36 | | | 355,374 | | | 1.02 | | 1.02 | | 1.78 | 36 |
| (. 14 | ) | | 11.26 | | (1.31 | ) | | 358,125 | | | 1.06 | | 1.04 | | 1.60 | 35 |
| (. 24 | ) | | 11.54 | | (4.45 | ) | | 379,675 | | | 1.08 | | 1.03 | | 2.13 | 32 |
| (. 22 | ) | | 12.32 | | 21.91 | | | 428,517 | | | 1.04 | | . 99 | | 1.76 | 36 |
See accompanying notes which are an integral part of the financial statements.
International Developed Markets Fund 75
Russell Investment Funds
International Developed Markets Fund
Related Party Transactions, Fees and Expenses
| | |
| Accrued fees payable to affiliates for the period ended December 31, 2017 were as follows: |
| Advisory fees | $ | 330,070 |
| Administration fees | | 18,337 |
| Transfer agent fees | | 1,614 |
| Trustee fees | | 724 |
| | $ | 350,745 |
Transactions (amounts in thousands) during the period ended December 31, 2017 with Underlying Funds which are, or were, an
affiliated company are as follows:
| | | | | | | | | | | | | | | | | |
| | | Fair Value, | | | | | | | Change in | | | | | | | | |
| | Beginning of | | | | Realized Gain | Unrealized | Fair Value, End | | | Income | Capital Gains |
| | | Period | | Purchases | | Sales | | (Loss) | Gain (Loss) | of Period | Distributions | Distributions |
| U. S. Cash Management Fund | $ | 18,922 | $ | 237,422 | $ | 235,269 | $ | (1) | $ (3) | $ | 21,071 | | $ | 211 | | $ | — |
| U. S. Cash Collateral Fund | | 548 | | 70,849 | | 70,995 | | — | — | | 402 | | | 39 | | | — |
| | $ | 19,470 | $ | 308,271 | $ | 306,264 | $ | (1) | $ (3) | $ | 21,473 | | $ | 250 | | $ | — |
Federal Income Taxes
At December 31, 2017, the cost of investments and net unrealized appreciation (depreciation), undistributed ordinary income and
undistributed long-term capital gains for income tax purposes were as follows:
| | | | |
| Cost of Investments | $ | | 389,510,259 | |
| Unrealized Appreciation | $ | | 47,546,343 | |
| Unrealized Depreciation | | | (8,257,239 | ) |
| Net Unrealized Appreciation (Depreciation) | $ | | 39,289,104 | |
| Undistributed Ordinary Income | $ | | 2,332,654 | |
| Undistributed Long-Term Capital Gains | | | | |
| (Capital Loss Carryforward) | $ | | 11,616,846 | |
| Tax Composition of Distributions | | | | |
| Ordinary Income | $ | | 10,619,097 | |
| Long-Term Capital Gains | $ | | 14,485,707 | |
Net investment income and net realized gains (losses) in the financial statements may differ from taxable net investment income and
net realized gains (losses). Capital accounts within the financial statements are adjusted for permanent book-tax differences. Book-tax
differences are primarily due to foreign currency gains and losses, reclassifications of dividends, differences in treatment of income
from swaps, net operating losses, investments in partnerships, investments in passive foreign investment companies (PFICs), tax
straddle transaction, use of tax equalization and foreign capital gains taxes. These adjustments have no impact on the net assets. At
December 31, 2017, the Statement of Assets and Liabilities have been adjusted by the following amounts (in thousands):
| | | |
| Undistributed net investment income | $ | 2,068 | |
| Accumulated net realized gain (loss) | | (2,068 | ) |
| Additional paid-in capital | | — | |
See accompanying notes which are an integral part of the financial statements.
76 International Developed Markets Fund
Russell Investment Funds
Strategic Bond Fund
Portfolio Management Discussion and Analysis — December 31, 2017 (Unaudited)

| | | | | | | |
| Strategic Bond Fund | | | | Bloomberg Barclays U. S. Aggregate Bond Index** | |
| | | Total | | | Total | |
| | | Return | | | Return | |
| 1 Year | | 3.86 | % | 1 Year | | 3.54 | % |
| 5 Years | | 2.13 | %§ | 5 Years | | 2.10 | %§ |
| 10 Years | | 4.47 | %§ | 10 Years | | 4.01 | %§ |
Strategic Bond Fund 77
Russell Investment Funds
Strategic Bond Fund
Portfolio Management Discussion and Analysis, continued — December 31, 2017
(Unaudited)
| |
| The Strategic Bond Fund (the “Fund”) employs a multi-manager | For the fiscal year ended December 31, 2017, strong investor |
| approach whereby portions of the Fund are allocated to different | demand, solid corporate earnings and flattening of the yield |
| money manager strategies. Fund assets not allocated to money | curve all combined to create a favorable environment for Fund |
| managers are managed by Russell Investment Management, LLC | performance. |
| (“RIM”), the Fund’s advisor. RIM may change the allocation of the | |
| Fund’s assets among money managers at any time. An exemptive | How did the investment strategies and techniques employed |
| order from the Securities and Exchange Commission (“SEC”) | by the Fund and its money managers affect its benchmark |
| permits RIM to engage or terminate a money manager at any time, | relative performance? |
| subject to approval by the Fund’s Board, without a shareholder | RIM’s asset allocation for the Fund contributed positively to |
| vote. Pursuant to the terms of the exemptive order, the Fund | benchmark relative performance over the period as a result of |
| is required to notify its shareholders within 90 days of when a | the Fund’s ex-benchmark exposure to high yield corporate debt |
| money manager begins providing services. As of December 31, | and non-agency mortgage backed securities, which outperformed |
| 2017, the Fund had six money managers. | the more traditional Bloomberg Barclays U. S. Aggregate Bond |
| | Index benchmark. RIM’s allocations to ex-benchmark global real |
| What is the Fund’s investment objective? | yield and currency strategies detracted from performance as both |
| The Fund seeks to provide current income, and as a secondary | underperformed the Fund’s benchmark. |
| objective, capital appreciation. | The Fund employs discretionary money managers. The Fund’s |
| How did the Fund perform relative to its benchmark for the | discretionary money managers select the individual portfolio |
| fiscal year ended December 31, 2017? | securities for the assets assigned to them. Fund assets not |
| For the fiscal year ended December 31, 2017, the Fund gained | allocated to discretionary money managers include the Fund’s |
| 3.86%. This is compared to the Fund’s benchmark, the Bloomberg | cash balances and assets which may be managed directly by |
| Barclays U. S. Aggregate Bond Index, which gained 3.54% during | RIM to effect the Fund’s investment strategies and/or to actively |
| the same period. The Fund’s performance includes operating | manage the Fund’s overall exposures by investing in securities or |
| expenses, whereas index returns are unmanaged and do not | other instruments that RIM believes will achieve the desired risk/ |
| include expenses of any kind. | return profile for the Fund. |
| For the fiscal year ended December 31, 2017, the Morningstar® | With respect to certain of the Fund’s money managers, Logan |
| Insurance Intermediate-Term Bond Category, a group of funds | Circle Partners, L. P. (“Logan Circle”) was the best performing |
| that Morningstar considers to have investment strategies similar | manager during the period, outperforming the Fund’s benchmark |
| to those of the Fund, gained 3.88%. This result serves as a peer | and the benchmark assigned to it by RIM, the Bloomberg |
| comparison and is expressed net of operating expenses. | Barclays U. S. Corporate Bond Index. Logan Circle benefited |
| | from a strong corporate rally during the year that saw significant |
| RIM may assign a money manager a benchmark other than the | spread tightening in the U. S. This was beneficial as Logan Circle |
| Fund’s index. However, the Fund’s primary index remains the | held an overweight to investment grade corporates and emerging |
| benchmark for the Fund. | market debt. The manager’s underweights to government and |
| How did the market conditions described in the Market | securitized sectors were positive as these sectors underperformed |
| Summary report affect the Fund’s performance? | the corporate sector. |
| The fiscal year ended December 31, 2017 was characterized by | Pareto Investment Management Limited (“Pareto”), a fully |
| a risk on rally that saw both U. S. and European credit spreads | discretionary currency manager, was the worst performing |
| tighten, global growth improve and conducive monetary policies | manager over the period. Pareto’s long position in the U. S. dollar |
| from central banks. Overall, this proved positive for fixed income | versus a basket of short currencies significantly underperformed |
| sectors around the globe. The U. S. yield curve saw interest rates | during the year as the U. S. dollar significantly depreciated in |
| rise for the fiscal year with the short end of the curve rising 88 | 2017 while non-U. S. dollar currencies rallied. |
| basis points on a 3-month treasury bill, while the 10-year treasury | RIM managed a three-pronged strategy to seek to generate active |
| bond interest rate was flat. The German Bund saw a parallel shift | returns through currency positioning by supplementing the |
| upwards in interest rates during 2017 and the British Gilt saw | Fund’s existing active currency mandate with a more mechanistic |
| interest rates rise on the short end of the curve and fall on the | strategy and to further reduce the Fund’s reliance on traditional |
| longer end. The U. S. experienced the largest interest rate moves | fixed income market risks. This approach incorporates a currency |
| as the U. S. Federal Reserve raised interest rates three times | overlay, an index replication and an enhanced cash strategy. |
| during the year. | The currency overlay utilizes currency forward contracts to take |
78 Strategic Bond Fund
Russell Investment Funds
Strategic Bond Fund
Portfolio Management Discussion and Analysis, continued — December 31, 2017
(Unaudited)
| | |
| long and short positions in global foreign exchange markets. | derivatives and currency forward contracts. RIM’s futures trades |
| Because the currency overlay is an out-of-benchmark position, | had a positive impact on the Fund. | |
| RIM managed an index replication strategy in connection with | | |
| the currency overlay to provide benchmark-like exposure to | Describe any changes to the Fund’s structure or the money |
| its overall strategy. The enhanced cash strategy is designed to | manager line-up. | |
| provide for modest returns on the cash held in connection with the | There were no changes to the Fund’s money manager line-up |
| currency overlay and index replication strategies. Over the fiscal | during the period. | |
| year, the currency overlay strategy was negative for the Fund’s | RIM implemented the new positioning strategy discussed above. |
| benchmark relative performance. | | |
| | Money Managers as of December 31, | |
| RIM also managed a global real yield strategy using global | 2017 | Styles |
| government bond futures to take long positions in high quality | | |
| | Colchester Global Investors Limited | Fully discretionary |
| government bonds whose net-of-inflation yields are expected to be | Logan Circle Partners, L. P. | Sector Specialist |
| relatively high and short positions where net-of-inflation yield is | Pareto Investment Management Limited | Fully discretionary |
| expected to be relatively low. This strategy had a negative impact | Schroder Investment Management North | |
| on Fund performance as the long positions underperformed as | America Inc. | Sector Specialist |
| interest rates rose on those positions, widening compared to the | Scout Investments, Inc. | Fully discretionary |
| | Western Asset Management Company | |
| short positions. | and Western Asset Management Company | |
| In addition, RIM implemented a new positioning strategy that | Limited | Fully discretionary |
| screens securities based on value within the Bloomberg Barclays | | |
| U. S. Corporate Bond Index, and purchases physical bonds | | |
| that RIM believes to be undervalued. The strategy tracked | The views expressed in this report reflect those of the |
| the Bloomberg Barclays U. S. Corporate Bond Index since its | portfolio managers only through the end of the period |
| inception in October 2017. | covered by the report. These views do not necessarily |
| During the period, RIM utilized futures and swaps to seek to | represent the views of RIM, or any other person in RIM or |
| achieve the Fund benchmark’s duration and credit exposures with | any other affiliated organization. These views are subject to |
| respect to the portion of the Fund allocated to cash reserves. This | change at any time based upon market conditions or other |
| performed as intended in terms of absolute return contribution. | events, and RIM disclaims any responsibility to update the |
| RIM also managed tactical ‘tilts’ based on its judgments | views contained herein. These views should not be relied |
| regarding shorter-term opportunities to seek to generate returns | on as investment advice and, because investment decisions |
| and/or mitigate risk by purchasing government futures, credit | for a Russell Investment Funds (“RIF”) Fund are based on |
| | numerous factors, should not be relied on as an indication |
| | of investment decisions of any RIF Fund. |
* Assumes initial investment on January 1, 2008.
** The Bloomberg Barclays U.S. Aggregate Bond Index is an index, with income reinvested, generally representative of intermediate-term government bonds,
investment-grade corporate debt securities and mortgage-backed securities.
§ Annualized.
The performance shown in this section does not reflect any Insurance Company Separate Account or Policy Charges. Performance is historical and assumes
reinvestment of all dividends and capital gains. Investment return and principal value will fluctuate so that an investor’s shares, when redeemed, may be worth more
or less than when purchased. Past performance is not indicative of future results. Additionally, the returns presented herein may differ from the performance reported
in the Financial Highlights as the returns herein are calculated in a manner consistent with standardized performance in accordance with Securities and Exchange
Commission rules, while the performance in the Financial Highlights has been calculated in accordance with U.S. Generally Accepted Accounting Principles (“U.S.
GAAP”).
Strategic Bond Fund 79
Russell Investment Funds
Strategic Bond Fund
Shareholder Expense Example — December 31, 2017 (Unaudited)
| | | | | | |
| Fund Expenses | Please note that the expenses shown in the table are meant |
| The following disclosure provides important information | to highlight your ongoing costs only and do not reflect any |
| regarding the Fund’s Shareholder Expense Example | transactional costs. Therefore, the information under the heading |
| (“Example”) . | “Hypothetical Performance (5% return before expenses)” is |
| | useful in comparing ongoing costs only, and will not help you |
| Example | determine the relative total costs of owning different funds. In |
| As a shareholder of the Fund, you incur two types of costs: (1) | addition, if these transactional costs were included, your costs |
| transaction costs, and (2) ongoing costs, including advisory and | would have been higher. The fees and expenses shown in this on |
| administrative fees and other Fund expenses. The Example is | do not reflect any Insurance Company Separate Account Policy |
| intended to help you understand your ongoing costs (in dollars) | Charges. | | | | | |
| of investing in the Fund and to compare these costs with the | | | | | Hypothetical |
| ongoing costs of investing in other mutual funds. The Example | | | | | Performance (5% |
| is based on an investment of $1,000 invested at the beginning of | | | | Actual | return before |
| the period and held for the entire period indicated, which for this | | | Performance | | expenses) |
| | Beginning Account Value | | | | | |
| Fund is from July 1, 2017 to December 31, 2017. | July 1, 2017 | | $ | 1,000.00 | $ | 1,000.00 |
| | Ending Account Value | | | | | |
| Actual Expenses | December 31, 2017 | | $ | 1,010.00 | $ | 1,021.93 |
| The information in the table under the heading “Actual | Expenses Paid During Period* | | $ | 3.29 | $ | 3.31 |
| Performance” provides information about actual account values | | | | | | |
| and actual expenses. You may use the information in this column, | * Expenses are equal to the Fund's annualized expense ratio of 0.65% |
| | (representing the six month period annualized), multiplied by the average |
| together with the amount you invested, to estimate the expenses | account value over the period, multiplied by 184/365 (to reflect the one-half |
| that you paid over the period. Simply divide your account value by | year period) . May reflect amounts waived and/or reimbursed. Without any |
| $1,000 (for example, an $8,600 account value divided by $1,000 | waivers and/or reimbursements, expenses would have been higher. |
| = 8.6), then multiply the result by the number in the first column | | | | | | |
| in the row entitled “Expenses Paid During Period” to estimate | | | | | | |
| the expenses you paid on your account during this period. | | | | | | |
| |
| Hypothetical Example for Comparison Purposes | | | | | | |
| The information in the table under the heading “Hypothetical | | | | | | |
| Performance (5% return before expenses)” provides information | | | | | | |
| about hypothetical account values and hypothetical expenses | | | | | | |
| based on the Fund’s actual expense ratio and an assumed rate of | | | | | | |
| return of 5% per year before expenses, which is not the Fund’s | | | | | | |
| actual return. The hypothetical account values and expenses | | | | | | |
| may not be used to estimate the actual ending account balance or | | | | | | |
| expenses you paid for the period. You may use this information | | | | | | |
| to compare the ongoing costs of investing in the Fund and other | | | | | | |
| funds. To do so, compare this 5% hypothetical example with the | | | | | | |
| 5% hypothetical examples that appear in the shareholder reports | | | | | | |
| of other funds. | | | | | | |
80 Strategic Bond Fund
Russell Investment Funds
Strategic Bond Fund
Schedule of Investments — December 31, 2017
| | | | | | | |
| Amounts in thousands (except share amounts) | | Amounts in thousands (except share amounts) | |
| | | Principal | Fair | | | Principal | Fair |
| | | Amount ($) | Value | | | Amount ($) | Value |
| | | or Shares | $ | | | or Shares | $ |
| Long-Term Investments - 89.2% | | | | 1.860% due 08/08/22 | | 625 | 619 |
| Asset-Backed Securities - 6.2% | | | | Series 2017-A9 Class A9 | | | |
| Aames Mortgage Investment Trust | | | | 1.800% due 09/20/21 | | 700 | 696 |
| Series 2005-1 Class M6 | | | | Citigroup Mortgage Loan Trust, Inc. | | | |
| 1.793% due 06/25/35 (Ê) | | 1,040 | 792 | Series 2007-WFH2 Class M2 | | | |
| Access Group, Inc. | | | | 1.221% due 03/25/37 (Ê) | | 1,490 | 1,367 |
| Series 2007-1 Class A4 | | | | Conseco Financial Corp. | | | |
| 1.427% due 01/25/23 (Ê) | | 682 | 671 | Series 1998-2 Class M1 | | | |
| ACE Securities Corp. Home Equity Loan | | | | 6.940% due 12/01/28 (~)(Ê) | | 1,410 | 1,331 |
| Trust | | | | Countrywide Asset-Backed Certificates | | | |
| Series 2005-HE3 Class M2 | | | | Series 2005-5 Class M4 | | | |
| 1.657% due 05/25/35 (Ê) | | 585 | 586 | 1.556% due 10/25/35 (Ê) | | 456 | 458 |
| ACE Securities Corp. Mortgage Loan | | | | Series 2005-9 Class M1 | | | |
| Trust | | | | 1.511% due 01/25/36 (Ê) | | 1,062 | 1,059 |
| Series 2007-D1 Class A2 | | | | FFMLT Trust | | | |
| 6.336% due 02/25/38 (~)(Ê)(Þ) | | 670 | 618 | | | | |
| AmeriCredit Automobile Receivables | | | | Series 2005-FF8 Class M2 | | | |
| Trust | | | | 1.112% due 09/25/35 (Ê) | | 760 | 755 |
| Series 2015-3 Class A3 | | | | Fieldstone Mortgage Investment Trust | | | |
| 1.540% due 03/09/20 | | 266 | 266 | Series 2004-4 Class M3 | | | |
| Series 2016-2 Class A2A | | | | 2.438% due 10/25/35 (Ê) | | 561 | 569 |
| 1.420% due 10/08/19 | | 63 | 63 | Ford Credit Auto Owner Trust | | | |
| Ameriquest Mortgage Securities, | | | | Series 2015-B Class A3 | | | |
| Inc. Asset-Backed Pass-Through | | | | 1.160% due 11/15/19 | | 240 | 240 |
| Certificates | | | | Series 2017-B Class A2B | | | |
| Series 2005-R1 Class M4 | | | | 1.130% due 05/15/20 (Ê) | | 225 | 225 |
| 1.307% due 03/25/35 (Ê) | | 830 | 811 | Series 2017-C Class A2A | | | |
| Asset-Backed Funding Trust Certificates | | | | 1.800% due 09/15/20 | | 600 | 599 |
| Series 2005-WF1 Class M1 | | | | GMACM Home Equity Loan Trust | | | |
| 1.132% due 11/25/34 (Ê) | | 1,133 | 1,132 | Series 2007-HE1 Class A4 | | | |
| BCAP LLC Trust | | | | 5.952% due 08/25/37 (~)(Ê) | | 642 | 665 |
| Series 2014-RR3 Class 3A2 | | | | Series 2007-HE1 Class A5 | | | |
| 1.390% due 07/26/36 (~)(Ê)(Þ) | | 1,330 | 1,225 | 5.705% due 08/25/37 (~)(Ê) | | 443 | 454 |
| Series 2014-RR3 Class 5A2 | | | | Greenpoint Manufactured Housing | | | |
| 1.400% due 10/26/36 (~)(Ê)(Þ) | | 780 | 721 | Contract Trust | | | |
| Blackbird Capital Aircraft Lease | | | | Series 2000-4 Class A3 | | | |
| Securitization, Ltd. | | | | 3.010% due 08/21/31 (Ê) | | 1,075 | 1,033 |
| Series 2016-1A Class AA | | | | GSAMP Trust | | | |
| 2.487% due 12/16/41 (~)(Ê)(Þ) | | 1,132 | 1,121 | Series 2006-HE4 Class A1 | | | |
| CAL Funding III, Ltd. | | | | 0.732% due 06/25/36 (Ê) | | 812 | 794 |
| Series 2017-1A Class A | | | | Hertz Vehicle Financing LLC | | | |
| 3.620% due 06/25/42 (Þ) | | 751 | 749 | Series 2015-2A Class A | | | |
| Capital One Multi-Asset Execution Trust | | | | 2.020% due 09/25/19 (Þ) | | 920 | 918 |
| Series 2014-A3 Class A3 | | | | Series 2017-1A Class B | | | |
| 1.857% due 01/18/22 (Ê) | | 250 | 251 | 3.560% due 10/25/21 (Þ) | | 420 | 418 |
| CIT Mortgage Loan Trust | | | | Home Equity Asset Trust | | | |
| Series 2007-1 Class 1M1 | | | | Series 2005-9 Class M1 | | | |
| 2.256% due 10/25/37 (Ê)(Þ) | | 260 | 252 | 0.580% due 04/25/36 (Ê) | | 380 | 368 |
| Citibank Credit Card Issuance Trust | | | | Series 2006-4 Class 2A4 | | | |
| Series 2014-A1 Class A1 | | | | 1.518% due 08/25/36 (Ê) | | 784 | 751 |
| 2.880% due 01/23/23 | | 1,890 | 1,925 | Series 2006-6 Class 2A3 | | | |
| Series 2014-A5 Class A5 | | | | 0.596% due 11/25/36 (Ê) | | 780 | 716 |
| 2.680% due 06/07/23 | | 550 | 556 | Honda Auto Receivables Owner Trust | | | |
| Series 2014-A6 Class A6 | | | | Series 2015-2 Class A3 | | | |
| 2.150% due 07/15/21 | | 415 | 415 | 1.040% due 02/21/19 | | 208 | 208 |
| Series 2016-A2 Class A2 | | | | Series 2015-4 Class A3 | | | |
| 2.190% due 11/20/23 | | 620 | 615 | 1.230% due 09/23/19 | | 523 | 521 |
| Series 2017-A8 Class A8 | | | | | | | |
See accompanying notes which are an integral part of the financial statements.
Strategic Bond Fund 81
Russell Investment Funds
Strategic Bond Fund
Schedule of Investments, continued — December 31, 2017
| | | | | | | |
| Amounts in thousands (except share amounts) | | Amounts in thousands (except share amounts) | |
| | | Principal | Fair | | | Principal | Fair |
| | | Amount ($) | Value | | | Amount ($) | Value |
| | | or Shares | $ | | | or Shares | $ |
| Series 2017-2 Class A2 | | | | Series 2004-WHQ2 Class M2 | | | |
| 1.460% due 10/15/19 | | 370 | 369 | 1.470% due 02/25/35 (Ê) | | 194 | 194 |
| HSI Asset Securitization Corp. Trust | | | | Series 2005-WHQ1 Class M5 | | | |
| Series 2006-OPT3 Class 2A | | | | 1.896% due 03/25/35 (Ê) | | 1,290 | 1,284 |
| 9.611% due 02/25/36 (Ê) | | 427 | 427 | Popular ABS Mortgage Pass-Through | | | |
| Series 2007-OPT1 Class 1A | | | | Trust | | | |
| 0.628% due 12/25/36 (Ê) | | 301 | 251 | Series 2006-C Class A4 | | | |
| Hyundai Auto Receivables Trust | | | | 0.775% due 07/25/36 (Ê) | | 941 | 932 |
| Series 2015-A Class A3 | | | | Series 2006-D Class A3 | | | |
| 1.050% due 04/15/19 | | 44 | 44 | 0.785% due 11/25/46 (Ê) | | 1,500 | 1,462 |
| Series 2015-C Class A3 | | | | RAMP Trust | | | |
| 1.460% due 02/18/20 | | 227 | 227 | Series 2006-RZ1 Class M4 | | | |
| LCM XXII, Ltd. | | | | 1.058% due 03/25/36 (Ê) | | 960 | 884 |
| Series 2016-22A Class A1 | | | | Renaissance Home Equity Loan Trust | | | |
| 2.636% due 10/20/28 (Ê)(Þ) | | 1,133 | 1,151 | Series 2006-1 Class AF6 | | | |
| | | | | 5.746% due 05/25/36 (~)(Ê) | | 101 | 74 |
| LCM XXV, Ltd. | | | | Residential Asset Mortgage Products, | | | |
| Series 2017-25A Class A | | | | Inc. Trust | | | |
| 2.524% due 07/20/30 (Ê)(Þ) | | 1,124 | 1,133 | Series 2005-EFC1 Class M3 | | | |
| Long Beach Mortgage Loan Trust | | | | 1.258% due 05/25/35 (Ê) | | 271 | 271 |
| Series 2004-1 Class M1 | | | | Santander Drive Auto Receivables Trust | | | |
| 1.741% due 02/25/34 (Ê) | | 538 | 538 | Series 2015-2 Class B | | | |
| Series 2004-4 Class M1 | | | | 1.830% due 01/15/20 | | 31 | 31 |
| 1.425% due 10/25/34 (Ê) | | 940 | 936 | SBA Small Business Investment Cos. | | | |
| Madison Park Funding XVIII, Ltd. | | | | Series 2017-10A Class 1 | | | |
| Series 2017-18A Class A1R | | | | 2.845% due 03/10/27 | | 589 | 595 |
| 2.553% due 10/21/30 (Ê)(Å) | | 872 | 879 | Series 2017-10B Class 1 | | | |
| Madison Park Funding XXVI, Ltd. | | | | 2.518% due 09/10/27 | | 320 | 320 |
| Series 2017-26A Class AR | | | | SLM Private Credit Student Loan Trust | | | |
| 2.523% due 07/29/30 (Ê)(Þ) | | 780 | 787 | Series 2005-B Class A4 | | | |
| Magnetite XVIII, Ltd. | | | | 1.180% due 06/15/39 (Ê) | | 650 | 617 |
| Series 2016-18A Class A | | | | Series 2006-A Class A5 | | | |
| 2.715% due 11/15/28 (Ê)(Þ) | | 1,488 | 1,499 | 0.943% due 06/15/39 (Ê) | | 280 | 268 |
| Master Asset-Backed Securities Trust | | | | SLM Student Loan Trust | | | |
| Series 2005-WMC1 Class M4 | | | | Series 2008-6 Class A4 | | | |
| 2.179% due 03/25/35 (Ê) | | 551 | 553 | 2.467% due 07/25/23 (Ê) | | 170 | 172 |
| Mercedes-Benz Auto Receivables Trust | | | | Series 2010-1 Class A | | | |
| Series 2016-1 Class A2A | | | | 0.934% due 03/25/25 (Ê) | | 272 | 269 |
| 1.110% due 03/15/19 | | 268 | 268 | Structured Asset Investment Loan Trust | | | |
| Merrill Lynch Mortgage Investors Trust | | | | Series 2005-HE3 Class M1 | | | |
| Series 2006-FF1 Class M4 | | | | 1.711% due 09/25/35 (Ê) | | 882 | 879 |
| 0.895% due 08/25/36 (Ê) | | 790 | 779 | Textainer Marine Containers, Ltd. | | | |
| Nelnet Student Loan Trust | | | | Series 2017-1A Class A | | | |
| Series 2008-3 Class A4 | | | | 3.720% due 05/20/42 (Þ) | | 939 | 944 |
| 2.967% due 11/25/24 (Ê) | | 381 | 389 | THL Credit Wind River CLO, Ltd. | | | |
| New Century Home Equity Loan Trust | | | | Series 2017-2A Class AR | | | |
| Series 2005-B Class M1 | | | | 2.584% due 10/18/30 (Ê)(Å) | | 1,016 | 1,025 |
| 1.236% due 10/25/35 (Ê) | | 690 | 666 | Towd Point Mortgage Trust | | | |
| Nissan Auto Receivables Owner Trust | | | | Series 2016-3 Class A1 | | | |
| Series 2017-C Class A2A | | | | 2.250% due 08/25/55 (~)(Ê)(Þ) | | 382 | 378 |
| 1.890% due 10/15/20 | | 820 | 819 | Series 2017-1 Class A1 | | | |
| Option One Mortgage Loan Trust | | | | 2.750% due 10/25/56 (~)(Ê)(Þ) | | 1,549 | 1,546 |
| Series 2004-3 Class M1 | | | | Series 2017-2 Class A1 | | | |
| 1.314% due 11/25/34 (Ê) | | 841 | 839 | 2.750% due 04/25/57 (~)(Ê)(Þ) | | 707 | 707 |
| Series 2007-FXD1 Class 3A4 | | | | Series 2017-3 Class A1 | | | |
| 5.860% due 01/25/37 (~)(Ê) | | 390 | 388 | 2.750% due 06/25/57 (~)(Ê)(Þ) | | 712 | 711 |
| Park Place Securities, Inc. Asset-Backed | | | | | | | |
| Pass-Through Certificates | | | | Series 2017-4 Class A1 | | | |
See accompanying notes which are an integral part of the financial statements.
82 Strategic Bond Fund
Russell Investment Funds
Strategic Bond Fund
Schedule of Investments, continued — December 31, 2017
| | | | | | | |
| Amounts in thousands (except share amounts) | | Amounts in thousands (except share amounts) | |
| | | Principal | Fair | | | Principal | Fair |
| | | Amount ($) | Value | | | Amount ($) | Value |
| | | or Shares | $ | | | or Shares | $ |
| 2.750% due 06/25/57 (~)(Ê)(Þ) | | 350 | 349 | 4.375% due 10/01/22 | | 343 | 350 |
| Toyota Auto Receivables Owner Trust | | | | Series 2016-1 Class B | | | |
| Series 2015-A Class A3 | | | | 5.250% due 01/15/24 | | 320 | 338 |
| 1.120% due 02/15/19 | | 58 | 58 | Series 2017-1B Class B | | | |
| Triton Container Finance IV LLC | | | | 4.950% due 02/15/25 | | 210 | 220 |
| Series 2017-2A Class A | | | | American Axle & Manufacturing, Inc. | | | |
| 3.620% due 08/20/42 (Þ) | | 635 | 636 | 6.625% due 10/15/22 | | 50 | 52 |
| Triton Container Finance LLC | | | | American Campus Communities | | | |
| Series 2017-1A Class A | | | | Operating Partnership LP | | | |
| 3.520% due 06/20/42 (Þ) | | 290 | 288 | 3.350% due 10/01/20 | | 247 | 252 |
| USAA Auto Owner Trust | | | | American Express Co. | | | |
| | | | | 2.200% due 10/30/20 | | 1,085 | 1,076 |
| Series 2016-1 Class A2 | | | | 3.000% due 10/30/24 | | 685 | 684 |
| 1.070% due 03/15/19 | | 72 | 72 | | | | |
| Wells Fargo Home Equity Asset-Backed | | | | American Express Credit Corp. | | | |
| Securities Trust | | | | 1.875% due 05/03/19 | | 458 | 456 |
| Series 2005-3 Class M4 | | | | 1.700% due 10/30/19 | | 610 | 604 |
| 1.581% due 11/25/35 (Ê) | | 500 | 503 | Series F | | | |
| | | | 55,944 | 2.600% due 09/14/20 | | 870 | 874 |
| Corporate Bonds and Notes - 19.4% | | | American Honda Finance Corp. | | | |
| 21st Century Fox America, Inc. | | | | Series MTN | | | |
| 8.450% due 08/01/34 | | 160 | 241 | 1.753% due 02/14/20 (Ê) | | 1,000 | 1,003 |
| 6.400% due 12/15/35 | | 125 | 166 | American International Group, Inc. | | | |
| 6.900% due 08/15/39 | | 730 | 1,030 | 6.400% due 12/15/20 | | 825 | 915 |
| Abbott Laboratories | | | | 3.750% due 07/10/25 | | 110 | 113 |
| 2.350% due 11/22/19 | | 595 | 595 | American Tower Trust | | | |
| 2.900% due 11/30/21 | | 400 | 405 | 3.070% due 03/15/23 (Þ) | | 270 | 273 |
| 3.750% due 11/30/26 | | 90 | 92 | AmerisourceBergen Corp. | | | |
| 4.750% due 11/30/36 | | 60 | 67 | 3.450% due 12/15/27 | | 330 | 327 |
| 4.900% due 11/30/46 | | 80 | 92 | Amgen, Inc. | | | |
| AbbVie, Inc. | | | | 3.625% due 05/22/24 | | 10 | 10 |
| 2.500% due 05/14/20 | | 691 | 693 | 4.400% due 05/01/45 | | 100 | 109 |
| 3.600% due 05/14/25 | | 60 | 62 | Anadarko Petroleum Corp. | | | |
| AES Corp. | | | | 4.850% due 03/15/21 | | 100 | 106 |
| 5.500% due 03/15/24 | | 50 | 52 | 5.550% due 03/15/26 | | 240 | 269 |
| Aetna, Inc. | | | | 6.450% due 09/15/36 | | 997 | 1,221 |
| 2.800% due 06/15/23 | | 30 | 30 | 4.500% due 07/15/44 | | 125 | 124 |
| Allison Transmission, Inc. | | | | 6.600% due 03/15/46 | | 90 | 116 |
| 5.000% due 10/01/24 (Þ) | | 90 | 93 | Andeavor | | | |
| Ally Financial, Inc. | | | | 4.750% due 12/15/23 (Þ) | | 209 | 225 |
| 8.000% due 11/01/31 | | 100 | 130 | Andeavor Logistics LP | | | |
| Altria Group, Inc. | | | | 5.250% due 01/15/25 | | 225 | 237 |
| 9.250% due 08/06/19 | | 434 | 481 | Anheuser-Busch Cos. LLC | | | |
| 2.850% due 08/09/22 | | 170 | 171 | 5.000% due 03/01/19 | | 215 | 222 |
| 10.200% due 02/06/39 | | 482 | 839 | Anheuser-Busch InBev Finance, Inc. | | | |
| Amazon. com, Inc. | | | | 1.900% due 02/01/19 | | 250 | 249 |
| 5.200% due 12/03/25 | | 305 | 350 | 2.650% due 02/01/21 | | 160 | 161 |
| 3.150% due 08/22/27 (Þ) | | 160 | 160 | 3.300% due 02/01/23 | | 200 | 205 |
| 3.875% due 08/22/37 (Þ) | | 50 | 53 | 3.650% due 02/01/26 | | 500 | 516 |
| 4.950% due 12/05/44 | | 60 | 73 | 4.900% due 02/01/46 | | 120 | 139 |
| 4.050% due 08/22/47 (Þ) | | 205 | 220 | Anthem, Inc. | | | |
| 4.250% due 08/22/57 (Þ) | | 360 | 392 | 2.500% due 11/21/20 | | 350 | 349 |
| American Airlines, Inc. Pass-Through | | | | 3.700% due 08/15/21 | | 40 | 41 |
| Certificates Trust | | | | 3.125% due 05/15/22 | | 395 | 398 |
| Series 2011-1 Class A | | | | 2.950% due 12/01/22 | | 690 | 690 |
| 5.250% due 01/31/21 | | 183 | 193 | 3.350% due 12/01/24 | | 30 | 30 |
| Series 2013-2 Class A | | | | 3.650% due 12/01/27 | | 625 | 637 |
| 4.950% due 01/15/23 | | 452 | 481 | 4.375% due 12/01/47 | | 405 | 430 |
| Series 2014-1 Class B | | | | | | | |
See accompanying notes which are an integral part of the financial statements.
Strategic Bond Fund 83
Russell Investment Funds
Strategic Bond Fund
Schedule of Investments, continued — December 31, 2017
| | | | | | | |
| Amounts in thousands (except share amounts) | | Amounts in thousands (except share amounts) | |
| | | Principal | Fair | | | Principal | Fair |
| | | Amount ($) | Value | | | Amount ($) | Value |
| | | or Shares | $ | | | or Shares | $ |
| Aon Corp. | | | | 4.450% due 03/03/26 | | 30 | 32 |
| 8.205% due 01/01/27 | | 172 | 224 | 3.500% due 04/19/26 | | 1,295 | 1,323 |
| Apache Corp. | | | | 3.593% due 07/21/28 (Ê) | | 260 | 264 |
| 3.250% due 04/15/22 | | 20 | 20 | Series L | | | |
| 5.100% due 09/01/40 | | 140 | 149 | 2.600% due 01/15/19 | | 8 | 8 |
| 4.750% due 04/15/43 | | 130 | 133 | 2.650% due 04/01/19 | | 243 | 244 |
| 4.250% due 01/15/44 | | 20 | 19 | Bank of New York Mellon Corp. (The) | | | |
| Apollo Management Holdings, LP | | | | 2.600% due 08/17/20 | | 225 | 227 |
| 4.400% due 05/27/26 (Þ) | | 385 | 402 | 2.200% due 08/16/23 | | 355 | 344 |
| Apple, Inc. | | | | Bank One Capital III | | | |
| 2.274% due 02/22/19 (Ê) | | 591 | 596 | 8.750% due 09/01/30 | | 280 | 412 |
| 1.691% due 05/06/19 (Ê) | | 480 | 482 | BankAmerica Capital III | | | |
| 2.000% due 11/13/20 | | 80 | 79 | 1.929% due 01/15/27 (Ê) | | 345 | 323 |
| 2.850% due 05/11/24 | | 185 | 186 | Barrick NA Finance LLC | | | |
| 3.250% due 02/23/26 | | 410 | 418 | 4.400% due 05/30/21 | | 265 | 280 |
| 2.450% due 08/04/26 | | 110 | 105 | 5.700% due 05/30/41 | | 130 | 160 |
| 4.650% due 02/23/46 | | 100 | 117 | BAT Capital Corp. | | | |
| Associated Banc-Corp. | | | | 2.297% due 08/14/20 (Þ) | | 245 | 244 |
| 2.750% due 11/15/19 | | 221 | 222 | 3.557% due 08/15/27 (Þ) | | 410 | 410 |
| AT&T, Inc. | | | | 4.390% due 08/15/37 (Þ) | | 520 | 544 |
| 2.206% due 03/11/19 (Ê) | | 900 | 905 | 4.540% due 08/15/47 (Þ) | | 180 | 189 |
| 3.000% due 02/15/22 | | 40 | 40 | Bayer US Finance LLC | | | |
| 2.850% due 02/14/23 | | 355 | 356 | 2.375% due 10/08/19 (Þ) | | 224 | 224 |
| 3.800% due 03/01/24 | | 295 | 302 | BB&T Corp. | | | |
| 3.400% due 08/14/24 | | 885 | 889 | 5.250% due 11/01/19 | | 232 | 244 |
| 4.250% due 03/01/27 | | 500 | 509 | Beacon Escrow Corp. | | | |
| 3.900% due 08/14/27 | | 130 | 131 | 4.875% due 11/01/25 (Þ) | | 20 | 20 |
| 4.300% due 02/15/30 (Þ) | | 1,839 | 1,838 | Becton Dickinson and Co. | | | |
| 8.250% due 11/15/31 (Þ) | | 350 | 485 | 2.894% due 06/06/22 | | 560 | 556 |
| 4.900% due 08/14/37 | | 490 | 497 | 3.363% due 06/06/24 | | 180 | 180 |
| 4.350% due 06/15/45 | | 90 | 83 | 3.734% due 12/15/24 | | 19 | 19 |
| 4.750% due 05/15/46 | | 190 | 186 | 4.685% due 12/15/44 | | 10 | 11 |
| 5.150% due 11/15/46 (Þ) | | 245 | 250 | Bed Bath & Beyond, Inc. | | | |
| Athene Global Funding | | | | 5.165% due 08/01/44 | | 285 | 251 |
| 2.750% due 04/20/20 (Þ) | | 920 | 920 | BGC Partners, Inc. | | | |
| AutoNation, Inc. | | | | 5.375% due 12/09/19 | | 232 | 243 |
| 3.800% due 11/15/27 | | 760 | 752 | Blue Cube Spinco, Inc. | | | |
| Avnet, Inc. | | | | 10.000% due 10/15/25 | | 235 | 282 |
| 4.625% due 04/15/26 | | 214 | 221 | BMW US Capital LLC | | | |
| BAC Capital Trust XIV | | | | 1.500% due 04/11/19 (Þ) | | 840 | 834 |
| Series G | | | | 1.450% due 09/13/19 (Þ) | | 249 | 246 |
| 4.000% due 09/29/49 (Ê)(ƒ) | | 70 | 63 | 1.727% due 04/06/20 (Ê)(Þ) | | 300 | 301 |
| Baker Hughes, a GE Co. LLC | | | | Boeing Co. (The) | | | |
| 2.773% due 12/15/22 (Þ) | | 240 | 240 | 4.875% due 02/15/20 | | 100 | 106 |
| Ball Corp. | | | | Brighthouse Financial, Inc. | | | |
| 5.250% due 07/01/25 | | 110 | 120 | 3.700% due 06/22/27 (Þ) | | 825 | 811 |
| Bank of America Corp. | | | | 4.700% due 06/22/47 (Þ) | | 50 | 51 |
| 2.328% due 10/01/21 (Ê) | | 340 | 339 | Broadcom Corp. / Broadcom Cayman | | | |
| 3.004% due 12/20/23 (Ê)(Þ) | | 42 | 42 | Finance, Ltd. | | | |
| 4.250% due 10/22/26 | | 170 | 179 | 3.125% due 01/15/25 (Þ) | | 70 | 67 |
| 3.824% due 01/20/28 (Ê) | | 790 | 817 | 3.500% due 01/15/28 (Þ) | | 955 | 910 |
| 3.419% due 12/20/28 (Ê)(Þ) | | 482 | 482 | Buckeye Partners LP | | | |
| 6.110% due 01/29/37 | | 330 | 422 | 5.850% due 11/15/43 | | 230 | 248 |
| Series AA | | | | Bunge, Ltd. Finance Corp. | | | |
| 6.100% due 12/31/49 (Ê)(ƒ) | | 50 | 55 | 8.500% due 06/15/19 | | 234 | 253 |
| Series GMTN | | | | Burlington Northern Santa Fe LLC | | | |
| 3.300% due 01/11/23 | | 460 | 471 | 4.150% due 04/01/45 | | 100 | 109 |
See accompanying notes which are an integral part of the financial statements.
84 Strategic Bond Fund
Russell Investment Funds
Strategic Bond Fund
Schedule of Investments, continued — December 31, 2017
| | | | | | | | |
| Amounts in thousands (except share amounts) | | | Amounts in thousands (except share amounts) | |
| | Principal | | Fair | | | | Principal | Fair |
| | Amount ($) | | Value | | | | Amount ($) | Value |
| | or Shares | | $ | | | | or Shares | $ |
| Capital One Bank USA NA | | | | | Citigroup, Inc. | | | |
| Series BKNT | | | | | 5.375% due 08/09/20 | | 232 | 249 |
| 2.250% due 02/13/19 | | 510 | | 509 | 4.450% due 09/29/27 | | 1,455 | 1,540 |
| Capital One Financial Corp. | | | | | 8.125% due 07/15/39 | | 420 | 671 |
| 2.400% due 10/30/20 | | 240 | | 239 | 5.300% due 05/06/44 | | 101 | 119 |
| Cardinal Health, Inc. | | | | | 4.650% due 07/30/45 | | 147 | 167 |
| 2.616% due 06/15/22 | | 50 | | 49 | 4.750% due 05/18/46 | | 220 | 242 |
| 3.079% due 06/15/24 | | 60 | | 59 | Series P | | | |
| Carlyle Holdings II Finance LLC | | | | | 5.950% due 12/31/49 (Ê)(ƒ) | | 280 | 298 |
| 5.625% due 03/30/43 (Þ) | | 215 | | 246 | Citizens Financial Group, Inc. | | | |
| Caterpillar Financial Services Corp. | | | | | 2.375% due 07/28/21 | | 520 | 513 |
| 1.900% due 03/22/19 | | 265 | | 265 | CME Group, Inc. | | | |
| 1.350% due 05/18/19 | | 230 | | 228 | 5.300% due 09/15/43 | | 30 | 38 |
| 1.931% due 10/01/21 | | 450 | | 440 | CNH Industrial Capital LLC | | | |
| CBL & Associates LP | | | | | 3.875% due 10/15/21 | | 250 | 254 |
| 5.950% due 12/15/26 | | 222 | | 206 | CNOOC Finance USA LLC | | | |
| CCO Holdings LLC / CCO Holdings | | | | | 3.500% due 05/05/25 | | 300 | 302 |
| Capital Corp. | | | | | Comcast Corp. | | | |
| 5.125% due 05/01/23 (Þ) | | 50 | | 51 | 2.350% due 01/15/27 | | 635 | 600 |
| 5.375% due 05/01/25 (Þ) | | 110 | | 113 | 6.500% due 11/15/35 | | 90 | 122 |
| Celgene Corp. | | | | | CommScope Technologies LLC | | | |
| 3.550% due 08/15/22 | | 30 | | 31 | 5.000% due 03/15/27 (Þ) | | 30 | 30 |
| 5.000% due 08/15/45 | | 80 | | 91 | Concho Resources, Inc. | | | |
| CF Industries, Inc. | | | | | 3.750% due 10/01/27 | | 180 | 182 |
| 5.375% due 03/15/44 | | 555 | | 548 | 4.875% due 10/01/47 | | 325 | 356 |
| Charles Schwab Corp. (The) | | | | | Constellation Brands, Inc. | | | |
| 3.200% due 01/25/28 | | 530 | | 531 | 6.000% due 05/01/22 | | 335 | 376 |
| Charter Communications Operating LLC | | | | | 4.750% due 11/15/24 | | 40 | 44 |
| / Charter Communications Operating | | | | | | | | |
| Capital | | | | | Continental Airlines Pass-Through Trust | | | |
| 4.908% due 07/23/25 | | 680 | | 723 | Series 071A Class A | | | |
| 4.200% due 03/15/28 | | 705 | | 698 | 5.983% due 04/19/22 | | 79 | 86 |
| 6.384% due 10/23/35 | | 40 | | 47 | Series 991A Class A | | | |
| 6.484% due 10/23/45 | | 775 | | 903 | 6.545% due 02/02/19 (Š) | | 80 | 82 |
| 6.834% due 10/23/55 | | 206 | | 248 | Continental Resources, Inc. | | | |
| Cheniere Corpus Christi Holdings LLC | | | | | 4.500% due 04/15/23 | | 90 | 92 |
| 5.125% due 06/30/27 | | 60 | | 62 | 4.375% due 01/15/28 (Þ) | | 10 | 10 |
| Cheniere Energy Partners, LP | | | | | Cott Holdings, Inc. | | | |
| 5.250% due 10/01/25 (Þ) | | 585 | | 595 | 5.500% due 04/01/25 (Þ) | | 60 | 62 |
| Chesapeake Energy Corp. | | | | | Cox Communications, Inc. | | | |
| 6.125% due 02/15/21 | | 50 | | 51 | 3.250% due 12/15/22 (Þ) | | 225 | 225 |
| 8.000% due 12/15/22 (Þ) | | 8 | | 9 | 6.450% due 12/01/36 (Þ) | | 425 | 499 |
| Chevron Corp. | | | | | Crown Castle Towers LLC | | | |
| 2.954% due 05/16/26 | | 120 | | 120 | 6.113% due 01/15/20 (Þ) | | 435 | 458 |
| Chubb INA Holdings, Inc. | | | | | CVS Health Corp. | | | |
| 2.300% due 11/03/20 | | 20 | | 20 | 2.750% due 12/01/22 | | 90 | 89 |
| 3.350% due 05/03/26 | | 30 | | 31 | 5.125% due 07/20/45 | | 140 | 160 |
| Cigna Corp. | | | | | DAE Funding LLC | | | |
| 3.050% due 10/15/27 | | 440 | | 432 | 4.500% due 08/01/22 (Þ) | | 22 | 22 |
| Cimarex Energy Co. | | | | | 5.000% due 08/01/24 (Þ) | | 30 | 30 |
| 3.900% due 05/15/27 | | 70 | | 72 | Daimler Finance NA LLC | | | |
| Cintas Corp. No. 2 | | | | | 1.750% due 10/30/19 (Þ) | | 720 | 711 |
| 2.900% due 04/01/22 | | 60 | | 61 | 2.300% due 01/06/20 (Þ) | | 1,189 | 1,186 |
| 3.700% due 04/01/27 | | 70 | | 73 | Darden Restaurants, Inc. | | | |
| Cisco Systems, Inc. | | | | | 6.800% due 10/15/37 | | 395 | 529 |
| 2.450% due 06/15/20 | | 240 | | 242 | DaVita HealthCare Partners, Inc. | | | |
| Citigroup Capital III | | | | | 5.000% due 05/01/25 | | 10 | 10 |
| 7.625% due 12/01/36 | | 350 | | 460 | | | | |
See accompanying notes which are an integral part of the financial statements.
Strategic Bond Fund 85
Russell Investment Funds
Strategic Bond Fund
Schedule of Investments, continued — December 31, 2017
| | | | | | | | |
| Amounts in thousands (except share amounts) | | Amounts in thousands (except share amounts) | | |
| | | Principal | Fair | | | Principal | Fair | |
| | | Amount ($) | Value | | | Amount ($) | Value | |
| | | or Shares | $ | | | or Shares | $ | |
| DDR Corp. | | | | Enable Midstream Partners LP | | | | |
| 3.625% due 02/01/25 | | 256 | 252 | 3.900% due 05/15/24 | | 244 | | 245 |
| Delhaize America, Inc. | | | | Enbridge Energy Partners LP | | | | |
| 9.000% due 04/15/31 | | 154 | 220 | 5.200% due 03/15/20 | | 238 | | 250 |
| Dell International LLC / EMC Corp. | | | | Energy Transfer Partners, LP | | | | |
| 3.480% due 06/01/19 (Þ) | | 150 | 152 | 4.250% due 03/15/23 | | 420 | | 417 |
| 4.420% due 06/15/21 (Þ) | | 479 | 499 | 4.050% due 03/15/25 | | 405 | | 405 |
| 7.125% due 06/15/24 (Þ) | | 100 | 109 | 7.500% due 07/01/38 | | 192 | | 238 |
| 8.350% due 07/15/46 (Þ) | | 710 | 914 | 6.050% due 06/01/41 | | 325 | | 348 |
| Delphi Financial Group, Inc. | | | | Series A | | | | |
| 7.875% due 01/31/20 | | 215 | 237 | 6.250% due 12/31/99 (Ê)(ƒ) | | 290 | | 282 |
| Delta Air Lines Pass-Through Trust | | | | EnLink Midstream Partners, LP | | | | |
| Series 071A Class A | | | | 2.700% due 04/01/19 | | 405 | | 405 |
| 6.821% due 08/10/22 | | 400 | 455 | 4.400% due 04/01/24 | | 237 | | 245 |
| Series 2002-1 Class G-1 | | | | 4.150% due 06/01/25 | | 350 | | 354 |
| 6.718% due 01/02/23 | | 87 | 96 | Series C | | | | |
| Delta Air Lines, Inc. | | | | 6.000% due 12/31/99 (Ê)(ƒ) | | 475 | | 454 |
| 2.875% due 03/13/20 | | 250 | 252 | Enterprise Products Operating LLC | | | | |
| Deutsche Bank AG | | | | Series A | | | | |
| 2.700% due 07/13/20 | | 260 | 259 | 5.084% due 08/01/66 (Ê) | | 360 | | 360 |
| Devon Energy Corp. | | | | Series B | | | | |
| 3.250% due 05/15/22 | | 110 | 112 | 7.034% due 01/15/68 (Ê) | | 290 | | 290 |
| 5.850% due 12/15/25 | | 370 | 432 | EOG Resources, Inc. | | | | |
| 5.000% due 06/15/45 | | 180 | 201 | 2.450% due 04/01/20 | | 135 | | 135 |
| Devon Financing Co. LLC | | | | 4.150% due 01/15/26 | | 30 | | 32 |
| 7.875% due 09/30/31 | | 765 | 1,050 | EP Energy LLC / Everest Acquisition | | | | |
| Diageo Investment Corp. | | | | Finance, Inc. | | | | |
| 2.875% due 05/11/22 | | 90 | 91 | 6.375% due 06/15/23 | | 90 | | 49 |
| Digital Realty Trust LP | | | | EPR Properties Co. | | | | |
| 3.400% due 10/01/20 | | 247 | 252 | 4.750% due 12/15/26 | | 235 | | 241 |
| Discovery Communications LLC | | | | Equifax, Inc. | | | | |
| 5.625% due 08/15/19 | | 258 | 271 | 3.300% due 12/15/22 | | 230 | | 228 |
| 4.900% due 03/11/26 | | 168 | 179 | Exelon Corp. | | | | |
| 6.350% due 06/01/40 | | 505 | 594 | 2.850% due 06/15/20 | | 555 | | 560 |
| DISH DBS Corp. | | | | Exelon Generation Co. LLC | | | | |
| 5.875% due 07/15/22 | | 50 | 50 | 2.950% due 01/15/20 | | 257 | | 260 |
| 5.875% due 11/15/24 | | 100 | 97 | Exxon Mobil Corp. | | | | |
| Dollar Tree, Inc. | | | | 1.739% due 03/15/19 (Ê) | | 800 | | 801 |
| 5.750% due 03/01/23 | | 70 | 73 | 3.043% due 03/01/26 | | 60 | | 61 |
| Dominion Energy, Inc. | | | | 4.114% due 03/01/46 | | 40 | | 45 |
| 2.579% due 07/01/20 | | 243 | 243 | Series FXD | | | | |
| Dominion Resources, Inc. | | | | 1.912% due 03/06/20 | | 257 | | 256 |
| 7.000% due 06/15/38 | | 20 | 28 | Farmers Exchange Capital III | | | | |
| Domtar Corp. | | | | 5.454% due 10/15/54 (Ê)(Þ) | | 420 | | 453 |
| 6.750% due 02/15/44 | | 216 | 250 | FedEx Corp. | | | | |
| Duke Energy Carolinas LLC | | | | 4.500% due 02/01/65 | | 226 | | 228 |
| 5.300% due 02/15/40 | | 30 | 38 | Fifth Third Bank | | | | |
| 4.000% due 09/30/42 | | 100 | 107 | Series BKNT | | | | |
| Eastman Chemical Co. | | | | 2.300% due 03/15/19 | | 223 | | 223 |
| 2.700% due 01/15/20 | | 241 | 243 | 2.875% due 10/01/21 | | 450 | | 454 |
| Eaton Corp. | | | | First Data Corp. | | | | |
| 2.750% due 11/02/22 | | 150 | 150 | 5.375% due 08/15/23 (Þ) | | 140 | | 146 |
| 4.150% due 11/02/42 | | 40 | 42 | First Niagara Financial Group, Inc. | | | | |
| Ecolab, Inc. | | | | 6.750% due 03/19/20 | | 237 | | 258 |
| 4.350% due 12/08/21 | | 8 | 9 | FirstEnergy Corp. | | | | |
| Eli Lilly & Co. | | | | Series B | | | | |
| 3.100% due 05/15/27 | | 50 | 51 | 4.250% due 03/15/23 | | 100 | | 104 |
See accompanying notes which are an integral part of the financial statements.
86 Strategic Bond Fund
Russell Investment Funds
Strategic Bond Fund
Schedule of Investments, continued — December 31, 2017
| | | | | | | | |
| Amounts in thousands (except share amounts) | | Amounts in thousands (except share amounts) | | |
| | | Principal | Fair | | | Principal | Fair | |
| | | Amount ($) | Value | | | Amount ($) | Value | |
| | | or Shares | $ | | | or Shares | $ | |
| 3.900% due 07/15/27 | | 370 | 379 | 3.500% due 11/16/26 | | 90 | | 91 |
| Series C | | | | 3.691% due 06/05/28 (Ê) | | 200 | | 203 |
| 7.375% due 11/15/31 | | 280 | 378 | 6.750% due 10/01/37 | | 410 | | 549 |
| Ford Holdings LLC | | | | 6.250% due 02/01/41 | | 160 | | 215 |
| 9.300% due 03/01/30 | | 175 | 247 | 5.150% due 05/22/45 | | 30 | | 35 |
| Ford Motor Co. | | | | 4.750% due 10/21/45 | | 250 | | 286 |
| 4.750% due 01/15/43 | | 50 | 51 | Series D | | | | |
| Ford Motor Credit Co. LLC | | | | 6.000% due 06/15/20 | | 150 | | 162 |
| 5.875% due 08/02/21 | | 200 | 220 | Series GMTN | | | | |
| 3.096% due 05/04/23 | | 248 | 247 | 7.500% due 02/15/19 | | 300 | | 317 |
| Freeport-McMoRan, Inc. | | | | 3.128% due 10/28/27 (Ê) | | 455 | | 481 |
| 3.550% due 03/01/22 | | 90 | 89 | Goodyear Tire & Rubber Co. (The) | | | | |
| 6.875% due 02/15/23 | | 10 | 11 | 5.125% due 11/15/23 | | 30 | | 31 |
| 5.450% due 03/15/43 | | 1,045 | 1,044 | Great Plains Energy, Inc. | | | | |
| Fresenius Medical Care US Finance II, | | | | 5.292% due 06/15/22 (~)(Ê) | | 660 | | 717 |
| Inc. | | | | Halliburton Co. | | | | |
| 5.875% due 01/31/22 (Þ) | | 236 | 260 | 3.800% due 11/15/25 | | 70 | | 73 |
| 4.750% due 10/15/24 (Þ) | | 110 | 117 | 4.850% due 11/15/35 | | 130 | | 146 |
| GE Capital International Funding Co. | | | | | | | | |
| Unlimited Co. | | | | Harris Corp. | | | | |
| 4.418% due 11/15/35 | | 200 | 216 | 4.854% due 04/27/35 | | 40 | | 45 |
| General Electric Co. | | | | 5.054% due 04/27/45 | | 40 | | 47 |
| 5.300% due 02/11/21 | | 361 | 389 | Hasbro, Inc. | | | | |
| 4.500% due 03/11/44 | | 190 | 210 | 3.500% due 09/15/27 | | 745 | | 728 |
| Series GMTN | | | | HCA, Inc. | | | | |
| 6.875% due 01/10/39 | | 411 | 592 | 4.750% due 05/01/23 | | 50 | | 52 |
| | | | | 5.375% due 02/01/25 | | 100 | | 104 |
| Series NOTZ | | | | 4.500% due 02/15/27 | | 40 | | 40 |
| 2.159% due 04/15/20 (Ê) | | 200 | 202 | | | | | |
| | | | | 5.500% due 06/15/47 | | 405 | | 404 |
| General Motors Co. | | | | | | | | |
| 4.875% due 10/02/23 | | 320 | 346 | Hess Corp. | | | | |
| 4.200% due 10/01/27 | | 385 | 398 | 7.125% due 03/15/33 | | 200 | | 241 |
| 6.250% due 10/02/43 | | 120 | 142 | Hewlett Packard Enterprise Co. | | | | |
| 5.200% due 04/01/45 | | 255 | 269 | 2.100% due 10/04/19 (Þ) | | 435 | | 432 |
| | | | | 6.200% due 10/15/35 | | 860 | | 934 |
| General Motors Financial Co. , Inc. | | | | 6.350% due 10/15/45 | | 236 | | 250 |
| 3.500% due 07/10/19 | | 219 | 222 | | | | | |
| 4.375% due 09/25/21 | | 20 | 21 | HSBC Bank NA | | | | |
| 4.250% due 05/15/23 | | 10 | 10 | Series BKNT | | | �� | |
| Georgia-Pacific LLC | | | | 5.875% due 11/01/34 | | 475 | | 612 |
| 8.875% due 05/15/31 | | 515 | 797 | HSBC Finance Corp. | | | | |
| Gerdau Holdings, Inc. | | | | 6.676% due 01/15/21 | | 29 | | 32 |
| 7.000% due 01/20/20 (Þ) | | 229 | 246 | HSBC USA, Inc. | | | | |
| Gilead Sciences, Inc. | | | | 7.200% due 07/15/97 | | 157 | | 228 |
| 2.550% due 09/01/20 | | 570 | 575 | Humana, Inc. | | | | |
| 3.650% due 03/01/26 | | 90 | 93 | 3.150% due 12/01/22 | | 10 | | 10 |
| 4.750% due 03/01/46 | | 100 | 116 | 3.950% due 03/15/27 | | 100 | | 104 |
| | | | | 4.625% due 12/01/42 | | 20 | | 22 |
| Glencore Funding LLC | | | | 4.950% due 10/01/44 | | 20 | | 23 |
| 4.625% due 04/29/24 (Þ) | | 40 | 42 | | | | | |
| 4.000% due 03/27/27 (Þ) | | 200 | 201 | 4.800% due 03/15/47 | | 10 | | 11 |
| GLP Capital, LP / GLP Financing II, Inc. | | | | IBM Credit LLC | | | | |
| 5.375% due 11/01/23 | | 80 | 85 | 1.623% due 01/20/21 (Ê) | | 800 | | 802 |
| Goldman Sachs Capital II | | | | Intel Corp. | | | | |
| 4.000% due 06/01/43 (Ê)(ƒ) | | 3 | 3 | 2.450% due 07/29/20 | | 248 | | 251 |
| | | | | 2.875% due 05/11/24 | | 460 | | 464 |
| Goldman Sachs Group, Inc. | | | | 3.700% due 07/29/25 | | 20 | | 21 |
| 5.250% due 07/27/21 | | 380 | 412 | | | | | |
| 2.600% due 12/27/20 | | 243 | 243 | 3.734% due 12/08/47 (Þ) | | 10 | | 10 |
| 3.850% due 07/08/24 | | 150 | 156 | International Business Machines Corp. | | | | |
| 3.272% due 09/29/25 (Ê) | | 775 | 772 | 1.783% due 02/12/19 (Ê) | | 220 | | 221 |
| 4.250% due 10/21/25 | | 310 | 324 | 1.875% due 05/15/19 | | 251 | | 250 |
See accompanying notes which are an integral part of the financial statements.
Strategic Bond Fund 87
Russell Investment Funds
Strategic Bond Fund
Schedule of Investments, continued — December 31, 2017
| | | | | | | |
| Amounts in thousands (except share amounts) | | Amounts in thousands (except share amounts) | |
| | | Principal | Fair | | | Principal | Fair |
| | | Amount ($) | Value | | | Amount ($) | Value |
| | | or Shares | $ | | | or Shares | $ |
| International Lease Finance Corp. | | | | Lamb Weston Holdings, Inc. | | | |
| 5.875% due 04/01/19 | | 242 | 252 | 4.875% due 11/01/26 (Þ) | | 60 | 63 |
| 8.625% due 01/15/22 | | 50 | 60 | Land O' Lakes, Inc. | | | |
| 5.875% due 08/15/22 | | 410 | 454 | 6.000% due 11/15/22 (Þ) | | 800 | 892 |
| International Paper Co. | | | | Lennar Corp. | | | |
| 8.700% due 06/15/38 | | 305 | 461 | 4.500% due 04/30/24 | | 40 | 41 |
| JBS USA LUX SA / JBS USA Finance, | | | | Leucadia National Corp. | | | |
| Inc. | | | | 5.500% due 10/18/23 | | 209 | 225 |
| 8.250% due 02/01/20 (Þ) | | 230 | 231 | | | | |
| | | | | Life Technologies Corp. | | | |
| Jefferies Group LLC | | | | 6.000% due 03/01/20 | | 224 | 240 |
| 6.500% due 01/20/43 | | 190 | 224 | | | | |
| | | | | Lockheed Martin Corp. | | | |
| Johnson & Johnson | | | | 3.350% due 09/15/21 | | 220 | 226 |
| 2.250% due 03/03/22 | | 450 | 449 | 4.500% due 05/15/36 | | 10 | 11 |
| 3.625% due 03/03/37 | | 70 | 74 | | | | |
| | | | | Series 10YR | | | |
| JPMorgan Chase & Co. | | | | 3.550% due 01/15/26 | | 90 | 93 |
| 2.750% due 06/23/20 | | 440 | 444 | | | | |
| | | | | Macy's Retail Holdings, Inc. | | | |
| 4.400% due 07/22/20 | | 231 | 243 | 3.450% due 01/15/21 | | 225 | 226 |
| 4.250% due 10/15/20 | | 300 | 315 | | | | |
| 2.550% due 03/01/21 | | 580 | 580 | Marathon Petroleum Corp. | | | |
| 2.086% due 03/09/21 (Ê) | | 1,720 | 1,723 | 5.000% due 09/15/54 | | 234 | 237 |
| 4.350% due 08/15/21 | | 130 | 138 | MassMutual Global Funding II | | | |
| 4.125% due 12/15/26 | | 230 | 243 | 1.950% due 09/22/20 (Þ) | | 1,315 | 1,299 |
| 4.250% due 10/01/27 | | 30 | 32 | Mattel, Inc. | | | |
| 3.782% due 02/01/28 (Ê) | | 325 | 337 | 5.450% due 11/01/41 | | 265 | 219 |
| 6.400% due 05/15/38 | | 170 | 234 | McDonald's Corp. | | | |
| 4.950% due 06/01/45 | | 100 | 116 | 3.700% due 01/30/26 | | 60 | 63 |
| | | | | 3.500% due 03/01/27 | | 70 | 72 |
| JPMorgan Chase Bank NA | | | | | | | |
| | | | | MeadWestvaco Corp. | | | |
| Series BKNT | | | | 7.375% due 09/01/19 | | 310 | 334 |
| 1.650% due 09/23/19 | | 195 | 193 | | | | |
| | | | | Medtronic, Inc. | | | |
| Kerr-McGee Corp. | | | | 3.500% due 03/15/25 | | 150 | 156 |
| 6.950% due 07/01/24 | | 10 | 12 | | | | |
| 7.875% due 09/15/31 | | 30 | 40 | Merck & Co. , Inc. | | | |
| | | | | 2.750% due 02/10/25 | | 40 | 40 |
| Kinder Morgan Energy Partners, LP | | | | | | | |
| 7.500% due 11/15/40 | | 189 | 242 | Mercury General Corp. | | | |
| | | | | 4.400% due 03/15/27 | | 440 | 452 |
| Kinder Morgan, Inc. | | | | | | | |
| 5.550% due 06/01/45 | | 195 | 213 | MetLife, Inc. | | | |
| | | | | 6.400% due 12/15/36 | | 309 | 355 |
| Series GMTN | | | | | | | |
| 7.800% due 08/01/31 | | 176 | 227 | Metropolitan Life Global Funding I | | | |
| | | | | 1.550% due 09/13/19 (Þ) | | 248 | 245 |
| Kindred Healthcare, Inc. | | | | | | | |
| 8.750% due 01/15/23 | | 60 | 64 | Microsoft Corp. | | | |
| | | | | 2.875% due 02/06/24 | | 180 | 183 |
| KKR Group Finance Co. II LLC | | | | 2.700% due 02/12/25 | | 40 | 40 |
| 5.500% due 02/01/43 (Þ) | | 10 | 12 | 2.400% due 08/08/26 | | 200 | 193 |
| KKR Group Finance Co. III LLC | | | | 3.300% due 02/06/27 | | 320 | 330 |
| 5.125% due 06/01/44 (Þ) | | 475 | 526 | 3.750% due 02/12/45 | | 100 | 105 |
| Kohl's Corp. | | | | | | | |
| 5.550% due 07/17/45 | | 605 | 591 | Monsanto Co. | | | |
| | | | | 2.125% due 07/15/19 | | 261 | 260 |
| Kraft Foods Group, Inc. | | | | | | | |
| 3.500% due 06/06/22 | | 60 | 61 | Morgan Stanley | | | |
| | | | | 5.625% due 09/23/19 | | 200 | 211 |
| Kraft Heinz Foods Co. | | | | 2.650% due 01/27/20 | | 225 | 226 |
| 4.875% due 02/15/25 (Þ) | | 1,240 | 1,314 | 2.765% due 10/24/23 (Ê) | | 805 | 828 |
| 3.000% due 06/01/26 | | 40 | 38 | 3.591% due 07/22/28 (Ê) | | 695 | 701 |
| 5.000% due 07/15/35 | | 20 | 22 | | | | |
| 5.000% due 06/04/42 | | 20 | 21 | Series GMTN | | | |
| 5.200% due 07/15/45 | | 20 | 22 | 3.750% due 02/25/23 | | 670 | 694 |
| 4.375% due 06/01/46 | | 20 | 20 | Mosaic Co. (The) | | | |
| | | | | 3.250% due 11/15/22 | | 254 | 252 |
| Kroger Co. (The) | | | | | | | |
| 5.150% due 08/01/43 | | 20 | 22 | | | | |
| 4.650% due 01/15/48 | | 545 | 557 | MPLX LP | | | |
See accompanying notes which are an integral part of the financial statements.
88 Strategic Bond Fund
Russell Investment Funds
Strategic Bond Fund
Schedule of Investments, continued — December 31, 2017
| | | | | | | |
| Amounts in thousands (except share amounts) | | Amounts in thousands (except share amounts) | |
| | | Principal | Fair | | | Principal | Fair |
| | | Amount ($) | Value | | | Amount ($) | Value |
| | | or Shares | $ | | | or Shares | $ |
| 4.875% due 06/01/25 | | 100 | 107 | PACCAR Financial Corp. | | | |
| Mutual of Omaha Insurance Co. | | | | 1.650% due 02/25/19 | | 245 | 244 |
| 4.297% due 07/15/54 (Ê)(Þ) | | 430 | 436 | 1.300% due 05/10/19 | | 204 | 202 |
| Mylan NV | | | | 1.200% due 08/12/19 | | 210 | 207 |
| 3.950% due 06/15/26 | | 365 | 368 | Pacific Gas & Electric Co. | | | |
| 5.250% due 06/15/46 | | 405 | 443 | 6.050% due 03/01/34 | | 200 | 252 |
| Navient Corp. | | | | 5.800% due 03/01/37 | | 60 | 75 |
| Series MTN | | | | Pacific Life Insurance Co. | | | |
| 8.000% due 03/25/20 | | 70 | 76 | 4.300% due 10/24/67 (Ê)(Þ) | | 280 | 281 |
| NBCUniversal Media LLC | | | | Pfizer, Inc. | | | |
| 4.375% due 04/01/21 | | 140 | 148 | 1.700% due 12/15/19 | | 252 | 250 |
| NCL Corp. , Ltd. | | | | Philip Morris International, Inc. | | | |
| 4.750% due 12/15/21 (Þ) | | 30 | 31 | 1.875% due 11/01/19 | | 170 | 169 |
| Netflix, Inc. | | | | 2.000% due 02/21/20 | | 1,255 | 1,247 |
| 5.875% due 02/15/25 | | 60 | 64 | 2.375% due 08/17/22 | | 405 | 399 |
| New York Life Global Funding | | | | 2.500% due 08/22/22 | | 90 | 89 |
| 1.477% due 04/12/19 (Ê)(Þ) | | 1,685 | 1,684 | 6.375% due 05/16/38 | | 70 | 95 |
| Newell Brands, Inc. | | | | 4.500% due 03/20/42 | | 40 | 43 |
| 2.875% due 12/01/19 | | 221 | 223 | Series 5YR | | | |
| 3.150% due 04/01/21 | | 20 | 20 | 2.500% due 11/02/22 | | 60 | 59 |
| 3.850% due 04/01/23 | | 60 | 62 | Pitney Bowes, Inc. | | | |
| 5.000% due 11/15/23 | | 690 | 728 | 4.125% due 05/15/22 | | 265 | 243 |
| 4.200% due 04/01/26 | | 40 | 42 | Plains All American Pipeline, LP / PAA | | | |
| NGPL PipeCo. LLC | | | | Finance Corp. | | | |
| 4.375% due 08/15/22 (Þ) | | 660 | 671 | 2.600% due 12/15/19 | | 261 | 259 |
| | | | | Prime Security Services Borrower LLC / | | | |
| Noble Energy, Inc. | | | | Prime Finance, Inc. | | | |
| 3.900% due 11/15/24 | | 150 | 154 | 9.250% due 05/15/23 (Þ) | | 120 | 133 |
| 3.850% due 01/15/28 | | 80 | 80 | Procter & Gamble Co. (The) | | | |
| 5.250% due 11/15/43 | | 10 | 11 | 1.647% due 11/01/19 (Ê) | | 230 | 231 |
| 4.950% due 08/15/47 | | 40 | 43 | Progress Energy, Inc. | | | |
| Norfolk Southern Corp. | | | | 4.400% due 01/15/21 | | 30 | 31 |
| 1.800% due 02/14/20 | | 525 | 521 | PSEG Power LLC | | | |
| Northrop Grumman Corp. | | | | 8.625% due 04/15/31 | | 170 | 224 |
| 3.250% due 01/15/28 | | 210 | 210 | QUALCOMM, Inc. | | | |
| Northwest Airlines Pass-Through Trust | | | | 2.600% due 01/30/23 | | 530 | 517 |
| Series 07-1 | | | | 4.300% due 05/20/47 | | 120 | 121 |
| 7.027% due 11/01/19 | | 363 | 391 | Quicken Loans, Inc. | | | |
| NVR, Inc. | | | | 5.750% due 05/01/25 (Þ) | | 30 | 31 |
| 3.950% due 09/15/22 | | 445 | 464 | QVC, Inc. | | | |
| Occidental Petroleum Corp. | | | | 4.375% due 03/15/23 | | 230 | 236 |
| 3.125% due 02/15/22 | | 30 | 31 | 4.850% due 04/01/24 | | 233 | 245 |
| 3.400% due 04/15/26 | | 50 | 51 | Qwest Corp. | | | |
| 3.000% due 02/15/27 | | 360 | 358 | 7.250% due 09/15/25 | | 222 | 238 |
| 4.625% due 06/15/45 | | 30 | 34 | Range Resources Corp. | | | |
| 4.400% due 04/15/46 | | 20 | 22 | 5.875% due 07/01/22 | | 30 | 31 |
| 4.100% due 02/15/47 | | 170 | 181 | 4.875% due 05/15/25 | | 70 | 68 |
| Omega Healthcare Investors, Inc. | | | | Regency Energy Partners, LP / Regency | | | |
| 4.750% due 01/15/28 | | 237 | 235 | Energy Finance Corp. | | | |
| ONEOK Partners, LP | | | | 5.875% due 03/01/22 | | 60 | 66 |
| 6.650% due 10/01/36 | | 205 | 251 | 5.000% due 10/01/22 | | 235 | 250 |
| ONEOK, Inc. | | | | Reliance Holdings USA, Inc. | | | |
| 7.500% due 09/01/23 | | 204 | 243 | 4.500% due 10/19/20 (Þ) | | 231 | 241 |
| Oracle Corp. | | | | Reliance Standard Life Global Funding | | | |
| 2.950% due 11/15/24 | | 550 | 554 | II | | | |
| 3.800% due 11/15/37 | | 270 | 283 | 2.500% due 01/15/20 (Þ) | | 425 | 425 |
| Owens & Minor, Inc. | | | | Reynolds American, Inc. | | | |
| 3.875% due 09/15/21 | | 240 | 243 | 6.875% due 05/01/20 | | 190 | 208 |
| | | | | 3.250% due 06/12/20 | | 40 | 41 |
See accompanying notes which are an integral part of the financial statements.
Strategic Bond Fund 89
Russell Investment Funds
Strategic Bond Fund
Schedule of Investments, continued — December 31, 2017
| | | | | | | | |
| Amounts in thousands (except share amounts) | | | Amounts in thousands (except share amounts) | |
| | Principal | | Fair | | | | Principal | Fair |
| | Amount ($) | | Value | | | | Amount ($) | Value |
| | or Shares | | $ | | | | or Shares | $ |
| 4.450% due 06/12/25 | | 580 | | 618 | Teva Pharmaceutical Finance Co. LLC | | | |
| 8.125% due 05/01/40 | | 450 | | 672 | 6.150% due 02/01/36 | | 609 | 609 |
| 5.850% due 08/15/45 | | 70 | | 87 | Thermo Fisher Scientific, Inc. | | | |
| Reynolds Group Issuer, Inc. / Reynolds | | | | | 2.950% due 09/19/26 | | 228 | 221 |
| Group Issuer LLC | | | | | Time Warner Cable LLC | | | |
| 5.750% due 10/15/20 | | 81 | | 83 | 4.125% due 02/15/21 | | 150 | 154 |
| Rockwell Collins, Inc. | | | | | 7.300% due 07/01/38 | | 210 | 263 |
| 1.950% due 07/15/19 | | 240 | | 239 | 5.875% due 11/15/40 | | 120 | 130 |
| Roper Technologies, Inc. | | | | | Time Warner Entertainment Co. , LP | | | |
| 2.800% due 12/15/21 | | 240 | | 240 | 8.375% due 03/15/23 | | 182 | 221 |
| Sabine Pass Liquefaction LLC | | | | | Time Warner, Inc. | | | |
| 6.250% due 03/15/22 | | 590 | | 656 | 4.750% due 03/29/21 | | 620 | 660 |
| 5.625% due 04/15/23 | | 223 | | 245 | 3.800% due 02/15/27 | | 80 | 80 |
| 5.000% due 03/15/27 | | 290 | | 311 | | | | |
| | | | | | TJX Cos. , Inc. (The) | | | |
| Santander Holdings USA, Inc. | | | | | 2.250% due 09/15/26 | | 10 | 9 |
| 2.700% due 05/24/19 | | 221 | | 221 | | | | |
| | | | | | Toyota Motor Credit Corp. | | | |
| 4.500% due 07/17/25 | | 20 | | 21 | 1.400% due 05/20/19 | | 249 | 247 |
| Schlumberger Holdings Corp. | | | | | Series GMTN | | | |
| 4.000% due 12/21/25 (Þ) | | 40 | | 42 | 2.800% due 07/13/22 | | 245 | 248 |
| Select Income REIT | | | | | Series MTN | | | |
| 4.250% due 05/15/24 | | 290 | | 288 | 1.610% due 01/09/19 (Ê) | | 1,200 | 1,201 |
| Sempra Energy | | | | | Transcontinental Gas Pipe Line Co. LLC | | | |
| 1.625% due 10/07/19 | | 226 | | 223 | 7.850% due 02/01/26 | | 220 | 281 |
| Sherwin-Williams Co. | | | | | Union Pacific Railroad Co. Pass-Through | | | |
| 2.250% due 05/15/20 | | 375 | | 374 | Trust | | | |
| Simon Property Group, LP | | | | | Series 06-1 | | | |
| 3.375% due 12/01/27 | | 425 | | 427 | 5.866% due 07/02/30 | | 133 | 150 |
| South Carolina Electric & Gas Co. | | | | | United Parcel Service, Inc. | | | |
| 6.050% due 01/15/38 | | 320 | | 400 | 2.500% due 04/01/23 | | 780 | 776 |
| Southern Natural Gas Co. LLC / | | | | | 3.050% due 11/15/27 | | 370 | 370 |
| Southern Natural Issuing Corp. | | | | | United Rentals NA, Inc. | | | |
| 4.400% due 06/15/21 | | 400 | | 419 | 5.750% due 11/15/24 | | 60 | 63 |
| Southwest Airlines Co. | | | | | United Technologies Corp. | | | |
| 2.650% due 11/05/20 | | 340 | | 341 | 3.100% due 06/01/22 | | 100 | 102 |
| Spectrum Brands, Inc. | | | | | 4.500% due 06/01/42 | | 30 | 33 |
| 5.750% due 07/15/25 | | 50 | | 53 | | | | |
| | | | | | UnitedHealth Group, Inc. | | | |
| Sprint Capital Corp. | | | | | 3.875% due 10/15/20 | | 10 | 10 |
| 8.750% due 03/15/32 | | 190 | | 216 | 2.950% due 10/15/27 | | 295 | 294 |
| Sprint Spectrum Co. LLC / Sprint | | | | | | | | |
| Spectrum Co II LLC / Sprint Spectrum | | | | | 4.625% due 07/15/35 | | 100 | 116 |
| Co III LLC | | | | | 5.700% due 10/15/40 | | 60 | 78 |
| Series A-1 | | | | | Universal Health Services, Inc. | | | |
| 3.360% due 09/20/21 (Þ) | | 356 | | 358 | 4.750% due 08/01/22 (Þ) | | 253 | 258 |
| Sunoco Logistics Partners Operations LP | | | | | Univision Communications, Inc. | | | |
| 6.850% due 02/15/40 | | 217 | | 243 | 5.125% due 05/15/23 (Þ) | | 50 | 50 |
| Sunoco Logistics Partners Operations, | | | | | 5.125% due 02/15/25 (Þ) | | 60 | 59 |
| LP | | | | | US Airways Pass-Through Trust | | | |
| 5.400% due 10/01/47 | | 350 | | 353 | Series 2012-1 Class A | | | |
| Taylor Morrison Communities, Inc. / | | | | | 5.900% due 10/01/24 | | 502 | 557 |
| Taylor Morrison Holdings II, Inc. | | | | | Series A Class A | | | |
| 5.625% due 03/01/24 (Þ) | | 100 | | 105 | 7.125% due 10/22/23 | | 295 | 339 |
| Teachers Insurance & Annuity | | | | | | | | |
| Association of America | | | | | US Bancorp | | | |
| 4.900% due 09/15/44 (Þ) | | 240 | | 274 | Series MTN | | | |
| Tech Data Corp. | | | | | 1.767% due 04/25/19 (Ê) | | 1,000 | 1,003 |
| 4.950% due 02/15/27 | | 228 | | 240 | US Bank NA | | | |
| Tennessee Gas Pipeline Co. LLC | | | | | Series BKNT | | | |
| 7.000% due 03/15/27 | | 204 | | 243 | 2.125% due 10/28/19 | | 250 | 250 |
| 8.375% due 06/15/32 | | 380 | | 495 | 1.505% due 10/23/20 (Ê) | | 600 | 600 |
See accompanying notes which are an integral part of the financial statements.
90 Strategic Bond Fund
Russell Investment Funds
Strategic Bond Fund
Schedule of Investments, continued — December 31, 2017
| | | | | | | |
| Amounts in thousands (except share amounts) | | Amounts in thousands (except share amounts) | |
| | | Principal | Fair | | | Principal | Fair |
| | | Amount ($) | Value | | | Amount ($) | Value |
| | | or Shares | $ | | | or Shares | $ |
| USF&G Capital III | | | | 4.750% due 12/07/46 | | 150 | 167 |
| 8.312% due 07/01/46 (Þ) | | 530 | 797 | Series GMTN | | | |
| Valeant Pharmaceuticals International, | | | | 2.600% due 07/22/20 | | 645 | 649 |
| Inc. | | | | 4.300% due 07/22/27 | | 520 | 554 |
| 9.000% due 12/15/25 (Þ) | | 60 | 63 | 4.900% due 11/17/45 | | 250 | 283 |
| Valero Energy Corp. | | | | Wells Fargo Bank NA | | | |
| 10.500% due 03/15/39 | | 151 | 258 | 1.750% due 05/24/19 | | 250 | 249 |
| VEREIT Operating Partnership LP | | | | Western Gas Partners, LP | | | |
| 4.600% due 02/06/24 | | 229 | 239 | 4.000% due 07/01/22 | | 237 | 242 |
| Verizon Communications, Inc. | | | | 4.650% due 07/01/26 | | 40 | 42 |
| 3.500% due 11/01/24 | | 20 | 20 | Westlake Chemical Corp. | | | |
| 3.376% due 02/15/25 (Þ) | | 705 | 707 | 4.875% due 05/15/23 | | 220 | 227 |
| 2.625% due 08/15/26 | | 40 | 38 | Williams Partners, LP | | | |
| 4.125% due 03/16/27 | | 230 | 240 | 3.600% due 03/15/22 | | 125 | 128 |
| 5.250% due 03/16/37 | | 80 | 88 | 4.300% due 03/04/24 | | 160 | 168 |
| 5.500% due 03/16/47 | | 30 | 34 | 3.750% due 06/15/27 | | 450 | 451 |
| 4.522% due 09/15/48 | | 30 | 30 | 5.800% due 11/15/43 | | 430 | 506 |
| 4.672% due 03/15/55 | | 1,625 | 1,566 | Wyndham Worldwide Corp. | | | |
| Viacom, Inc. | | | | 4.150% due 04/01/24 | | 220 | 221 |
| 3.875% due 04/01/24 | | 20 | 20 | | | | |
| 5.250% due 04/01/44 | | 255 | 249 | Xerox Corp. | | | |
| | | | | 4.070% due 03/17/22 | | 244 | 246 |
| 6.250% due 02/28/57 (Ê) | | 610 | 596 | | | | |
| | | | | | | | 175,954 |
| Virginia Electric & Power Co. | | | | International Debt - 8.4% | | | |
| Series B | | | | 1011778 B. C. Unlimited Liability Co. / | | | |
| 2.950% due 11/15/26 | | 660 | 653 | New Red Finance, Inc. | | | |
| Series C | | | | 5.000% due 10/15/25 (Þ) | | 50 | 50 |
| 4.000% due 11/15/46 | | 225 | 241 | 1011778 B. C. Unlimited Liability Co. | | | |
| Visa, Inc. | | | | 1st Lien Term Loan B4 | | | |
| 3.150% due 12/14/25 | | 150 | 153 | 3.819% due 02/17/24 (Ê) | | 150 | 150 |
| 4.300% due 12/14/45 | | 390 | 443 | 3.943% due 02/17/24 (Ê) | | 97 | 97 |
| Volkswagen Group of America Finance | | | | ABN AMRO Bank NV | | | |
| LLC | | | | 1.800% due 09/20/19 (Þ) | | 244 | 242 |
| 2.450% due 11/20/19 (Þ) | | 425 | 425 | Abu Dhabi Government International | | | |
| Wachovia Capital Trust II | | | | Bond | | | |
| 1.859% due 01/15/27 (Ê) | | 485 | 453 | 2.500% due 10/11/22 (Þ) | | 200 | 196 |
| Walgreens Boots Alliance, Inc. | | | | 4.125% due 10/11/47 (Þ) | | 325 | 321 |
| 2.700% due 11/18/19 | | 256 | 258 | Abu Dhabi National Energy Co. PJSC | | | |
| 4.800% due 11/18/44 | | 100 | 108 | 5.875% due 12/13/21 (Þ) | | 224 | 246 |
| Wal-Mart Stores, Inc. | | | | Actavis Funding SCS | | | |
| 3.250% due 10/25/20 | | 5 | 5 | 3.000% due 03/12/20 (Þ) | | 258 | 260 |
| 6.200% due 04/15/38 | | 10 | 14 | 3.450% due 03/15/22 | | 40 | 41 |
| 4.750% due 10/02/43 | | 100 | 123 | 3.800% due 03/15/25 | | 60 | 61 |
| Walt Disney Co. (The) | | | | 4.550% due 03/15/35 | | 20 | 21 |
| 1.685% due 06/05/20 (Ê) | | 800 | 801 | 4.750% due 03/15/45 | | 21 | 22 |
| | | | | ACWA Power Management and | | | |
| Washington Prime Group, LP | | | | Investments One, Ltd. | | | |
| 5.950% due 08/15/24 | | 221 | 226 | 5.950% due 12/15/39 (Þ) | | 365 | 374 |
| Waste Management, Inc. | | | | | | | |
| 3.500% due 05/15/24 | | 190 | 197 | Alcoa Nederland Holding BV | | | |
| | | | | 6.750% due 09/30/24 (Þ) | | 200 | 218 |
| Wells Fargo & Co. | | | | | | | |
| 2.500% due 03/04/21 | | 400 | 400 | Alibaba Group Holding, Ltd. | | | |
| | | | | 2.500% due 11/28/19 | | 242 | 243 |
| 2.827% due 03/04/21 (Ê) | | 1,100 | 1,130 | 4.200% due 12/06/47 | | 405 | 421 |
| 4.600% due 04/01/21 | | 220 | 234 | | | | |
| 3.069% due 01/24/23 | | 1,150 | 1,158 | Alimentation Couche-Tard, Inc. | | | |
| 2.610% due 10/31/23 (Ê) | | 1,455 | 1,493 | 3.550% due 07/26/27 (Þ) | | 220 | 220 |
| 3.000% due 04/22/26 | | 400 | 392 | America Movil SAB de CV | | | |
| 3.000% due 10/23/26 | | 260 | 255 | 5.000% due 03/30/20 | | 763 | 804 |
| 4.650% due 11/04/44 | | 10 | 11 | Anglo American Capital PLC | | | |
| 4.400% due 06/14/46 | | 230 | 242 | 4.125% due 09/27/22 (Þ) | | 243 | 251 |
| | | | | 3.625% due 09/11/24 (Þ) | | 200 | 199 |
See accompanying notes which are an integral part of the financial statements.
Strategic Bond Fund 91
Russell Investment Funds
Strategic Bond Fund
Schedule of Investments, continued — December 31, 2017
| | | | | | | |
| Amounts in thousands (except share amounts) | | Amounts in thousands (except share amounts) | |
| | | Principal | Fair | | | Principal | Fair |
| | | Amount ($) | Value | | | Amount ($) | Value |
| | | or Shares | $ | | | or Shares | $ |
| AP Moller - Maersk A/S | | | | Brazilian Government International Bond | | | |
| 2.550% due 09/22/19 (Þ) | | 171 | 171 | 2.625% due 01/05/23 | | 220 | 212 |
| ArcelorMittal | | | | 5.625% due 01/07/41 | | 170 | 174 |
| 6.750% due 02/25/22 | | 110 | 122 | BRF SA | | | |
| Aristocrat International Pty, Ltd. Term | | | | 3.950% due 05/22/23 (Þ) | | 254 | 251 |
| Loan B2 | | | | British Telecommunications PLC | | | |
| 3.363% due 10/20/21 (Ê) | | 151 | 152 | 9.125% due 12/15/30 | | 30 | 45 |
| AstraZeneca PLC | | | | Canadian Imperial Bank of Commerce | | | |
| 1.950% due 09/18/19 | | 263 | 261 | | | | |
| 2.375% due 11/16/20 | | 580 | 579 | Series YCD | | | |
| | | | | 1.621% due 02/04/19 (Ê)(~) | | 500 | 500 |
| 2.375% due 06/12/22 | | 490 | 484 | 1.807% due 05/29/19 (Ê)(~) | | 500 | 500 |
| Australia & New Zealand Banking | | | | | | | |
| Group, Ltd. | | | | Canadian Oil Sands, Ltd. | | | |
| 1.936% due 08/19/20 (Ê)(Þ) | | 1,000 | 1,005 | 7.750% due 05/15/19 (Þ) | | 450 | 479 |
| | | | | 4.500% due 04/01/22 (Þ) | | 680 | 696 |
| Banco de Bogota SA | | | | Carlyle Global Market Strategies CLO, | | | |
| 4.375% due 08/03/27 (Þ) | | 223 | 222 | | | | |
| Banco Inbursa SA Institucion de Banca | | | | Ltd. | | | |
| Multiple | | | | Series 2015-2A Class A1 | | | |
| 4.375% due 04/11/27 (Þ) | | 224 | 224 | 2.507% due 04/27/27 (Ê)(Þ) | | 1,400 | 1,403 |
| Bancolombia SA | | | | CBQ Finance, Ltd. | | | |
| 5.950% due 06/03/21 | | 705 | 762 | 7.500% due 11/18/19 (Þ) | | 205 | 219 |
| Banistmo SA | | | | CDP Financial, Inc. | | | |
| 3.650% due 09/19/22 (Þ) | | 250 | 247 | 5.600% due 11/25/39 (Þ) | | 215 | 284 |
| Bank of Montreal | | | | Cenovus Energy, Inc. | | | |
| 1.500% due 07/18/19 | | 249 | 247 | 4.250% due 04/15/27 | | 710 | 708 |
| 2.100% due 12/12/19 | | 230 | 229 | 6.750% due 11/15/39 | | 120 | 145 |
| 1.900% due 08/27/21 | | 420 | 411 | Colombia Government International | | | |
| | | | | Bond | | | |
| Bank of Nova Scotia (The) | | | | 5.625% due 02/26/44 | | 270 | 309 |
| 1.650% due 06/14/19 | | 253 | 251 | | | | |
| | | | | Commonwealth Bank of Australia | | | |
| 2.234% due 06/14/19 (Ê) | | 1,300 | 1,309 | 5.000% due 10/15/19 (Þ) | | 30 | 31 |
| Series BKNT | | | | 3.900% due 07/12/47 (Þ) | | 150 | 153 |
| 2.450% due 09/19/22 | | 380 | 375 | | | | |
| Bank of Tokyo-Mitsubishi UFJ, Ltd. | | | | Cooperatieve Rabobank UA | | | |
| (The) | | | | 4.625% due 12/01/23 | | 250 | 268 |
| 2.350% due 09/08/19 (Þ) | | 242 | 242 | 4.375% due 08/04/25 | | 400 | 422 |
| Barclays Bank PLC | | | | Corp. Andina de Fomento | | | |
| 5.140% due 10/14/20 | | 225 | 238 | 2.750% due 01/06/23 | | 825 | 816 |
| 4.375% due 09/11/24 | | 234 | 240 | Credit Agricole SA | | | |
| 4.836% due 05/09/28 | | 1,245 | 1,296 | 3.250% due 10/04/24 (Þ) | | 730 | 725 |
| BAT International Finance PLC | | | | Credit Suisse | | | |
| 2.750% due 06/15/20 (Þ) | | 257 | 258 | 5.400% due 01/14/20 | | 234 | 247 |
| BBVA Bancomer SA | | | | Credit Suisse Group AG | | | |
| 6.750% due 09/30/22 (Þ) | | 681 | 768 | 6.250% due 12/31/49 (Ê)(ƒ)(Þ) | | 505 | 547 |
| | | | | Credit Suisse Group Funding Guernsey, | | | |
| Bharti Airtel, Ltd. | | | | Ltd. | | | |
| 4.375% due 06/10/25 (Þ) | | 500 | 509 | 4.875% due 05/15/45 | | 300 | 344 |
| BHP Billiton Finance USA, Ltd. | | | | Danone SA | | | |
| 2.875% due 02/24/22 | | 5 | 5 | 1.691% due 10/30/19 (Þ) | | 227 | 224 |
| 5.000% due 09/30/43 | | 320 | 392 | 2.077% due 11/02/21 (Þ) | | 690 | 675 |
| BOC Aviation, Ltd. | | | | Deutsche Bank AG | | | |
| 3.000% due 03/30/20 (Þ) | | 241 | 241 | 2.950% due 08/20/20 | | 242 | 242 |
| BP Capital Markets PLC | | | | Deutsche Telekom International Finance | | | |
| 3.245% due 05/06/22 | | 10 | 10 | BV | | | |
| 3.216% due 11/28/23 | | 700 | 715 | 6.000% due 07/08/19 | | 210 | 221 |
| 3.119% due 05/04/26 | | 120 | 121 | Dryden 34 Senior Loan Fund | | | |
| Braskem Finance, Ltd. | | | | Series 2017-34A Class AR | | | |
| 5.375% due 05/02/22 (Þ) | | 236 | 250 | 2.519% due 10/15/26 (Ê)(Þ) | | 1,220 | 1,226 |
| Braskem Netherlands Finance BV | | | | | | | |
| 3.500% due 01/10/23 (Þ) | | 740 | 726 | | | | |
| 4.500% due 01/10/28 (Þ) | | 305 | 300 | | | | |
See accompanying notes which are an integral part of the financial statements.
92 Strategic Bond Fund
Russell Investment Funds
Strategic Bond Fund
Schedule of Investments, continued — December 31, 2017
| | | | | | | | |
| Amounts in thousands (except share amounts) | | Amounts in thousands (except share amounts) | | |
| | | Principal | Fair | | | Principal | Fair | |
| | | Amount ($) | Value | | | Amount ($) | Value | |
| | | or Shares | $ | | | or Shares | $ | |
| Dryden 37 Senior Loan Fund | | | | Lloyds Banking Group PLC | | | | |
| Series 2017-37A Class AR | | | | 2.907% due 11/07/23 (Ê) | | 650 | | 644 |
| 2.775% due 01/15/31 (Ê)(Š)(Å) | | 1,300 | 1,300 | Lloyds TSB Bank PLC | | | | |
| Dryden 50 Senior Loan Fund | | | | 6.500% due 09/14/20 (Þ) | | 228 | | 249 |
| Series 2017-50A Class A1 | | | | Lukoil International Finance BV | | | | |
| 2.477% due 07/15/30 (Ê)(Þ) | | 1,230 | 1,233 | 6.125% due 11/09/20 (Þ) | | 450 | | 485 |
| Ecopetrol SA | | | | 4.563% due 04/24/23 (Þ) | | 212 | | 220 |
| 5.375% due 06/26/26 | | 60 | 65 | LyondellBasell Industries NV | | | | |
| 5.875% due 05/28/45 | | 250 | 255 | 5.000% due 04/15/19 | | 395 | | 406 |
| Empresa Electrica Angamos SA | | | | Macquarie Bank, Ltd. | | | | |
| 4.875% due 05/25/29 (Þ) | | 219 | 219 | 6.625% due 04/07/21 (Þ) | | 220 | | 243 |
| Enbridge, Inc. | | | | Mallinckrodt International Finance SA | | | | |
| 3.700% due 07/15/27 | | 222 | 223 | 4.750% due 04/15/23 | | 70 | | 55 |
| Ensco PLC | | | | Marks And Spencer PLC | | | | |
| 8.000% due 01/31/24 | | 29 | 29 | 7.125% due 12/01/37 (Þ) | | 207 | | 246 |
| Equate Petrochemical BV | | | | Medtronic Global Holdings SCA | | | | |
| 4.250% due 11/03/26 (Þ) | | 200 | 204 | 3.350% due 04/01/27 | | 160 | | 164 |
| ESAL GmbH | | | | Mexico Generadora de Energia S de rl | | | | |
| 6.250% due 02/05/23 (Þ) | | 445 | 423 | 5.500% due 12/06/32 (Þ) | | 190 | | 200 |
| GlaxoSmithKline Capital PLC | | | | Mexico Government International Bond | | | | |
| 2.850% due 05/08/22 | | 60 | 61 | 6.050% due 01/11/40 | | 30 | | 35 |
| HSBC Bank PLC | | | | 4.750% due 03/08/44 | | 20 | | 20 |
| 7.650% due 05/01/25 | | 375 | 462 | 4.600% due 01/23/46 | | 535 | | 528 |
| Series 1M | | | | 4.600% due 02/10/48 | | 500 | | 494 |
| 1.750% due 06/29/49 (Ê) | | 780 | 686 | Mitsubishi UFJ Financial Group, Inc. | | | | |
| HSBC Holdings PLC | | | | 2.998% due 02/22/22 | | 60 | | 60 |
| 3.262% due 03/13/23 (Ê) | | 600 | 608 | Mitsubishi UFJ Trust and Banking Corp. | | | | |
| 3.900% due 05/25/26 | | 220 | 228 | 2.450% due 10/16/19 (Þ) | | 242 | | 242 |
| 4.041% due 03/13/28 (Ê) | | 410 | 427 | Mizuho Bank, Ltd. | | | | |
| Hyundai Capital Services, Inc. | | | | 2.450% due 04/16/19 (Þ) | | 223 | | 223 |
| 2.625% due 09/29/20 (Þ) | | 244 | 241 | 2.095% due 10/01/19 (Ê)(~) | | 500 | | 500 |
| Indonesia Government International | | | | Mondelez International Holdings | | | | |
| Bond | | | | Netherlands BV | | | | |
| 4.350% due 01/11/48 | | 240 | 243 | 1.625% due 10/28/19 (Þ) | | 658 | | 649 |
| Series REGS | | | | Myriad International Holdings BV | | | | |
| 3.750% due 04/25/22 | | 430 | 443 | 6.000% due 07/18/20 (Þ) | | 206 | | 221 |
| ING Bank NV | | | | 4.850% due 07/06/27 (Þ) | | 250 | | 259 |
| 5.800% due 09/25/23 (Þ) | | 765 | 859 | National Australia Bank, Ltd. | | | | |
| Intesa Sanpaolo Vita SpA | | | | 1.726% due 05/14/19 (Ê)(Þ) | | 650 | | 650 |
| 3.125% due 07/14/22 (Þ) | | 200 | 199 | 1.956% due 05/22/20 (Ê)(Þ) | | 450 | | 452 |
| 3.875% due 07/14/27 (Þ) | | 520 | 520 | National Bank of Canada | | | | |
| Inversiones CMPC SA | | | | 1.750% due 05/08/19 (Ê)(~) | | 650 | | 648 |
| 4.500% due 04/25/22 (Þ) | | 214 | 224 | Newcrest Finance Pty, Ltd. | | | | |
| Itau CorpBanca SA | | | | 4.200% due 10/01/22 (Þ) | | 241 | | 251 |
| 3.875% due 09/22/19 (Þ) | | 218 | 222 | Nokia OYJ | | | | |
| Kia Motors Corp. | | | | 6.625% due 05/15/39 | | 740 | | 818 |
| 3.000% due 04/25/23 (Þ) | | 257 | 252 | Nordea Bank AB | | | | |
| KOC Holding AS | | | | 1.821% due 02/21/19 (Ê)(~) | | 800 | | 800 |
| 3.500% due 04/24/20 (Þ) | | 222 | 222 | 1.625% due 09/30/19 (Þ) | | 250 | | 247 |
| Kookmin Bank | | | | 1.947% due 05/29/20 (Ê)(Þ) | | 450 | | 452 |
| 1.625% due 08/01/19 (Þ) | | 200 | 196 | NOVA Chemicals Corp. | | | | |
| Korea Gas Corp. | | | | 5.250% due 06/01/27 (Þ) | | 420 | | 419 |
| 2.750% due 07/20/22 (Þ) | | 510 | 502 | Numericable Group SA Term Loan B12 | | | | |
| Kuwait International Government Bond | | | | 4.349% due 01/05/26 (Ê) | | 178 | | 171 |
| 3.500% due 03/20/27 (Þ) | | 210 | 213 | NXP BV / NXP Funding LLC | | | | |
| Lions Gate Entertainment Corp. Term | | | | 4.625% due 06/15/22 (Þ) | | 450 | | 471 |
| Loan B | | | | Oleoducto Central SA | | | | |
| 3.819% due 12/08/23 (Ê) | | 64 | 64 | 4.000% due 05/07/21 (Þ) | | 245 | | 251 |
See accompanying notes which are an integral part of the financial statements.
Strategic Bond Fund 93
Russell Investment Funds
Strategic Bond Fund
Schedule of Investments, continued — December 31, 2017
| | | | | | | |
| Amounts in thousands (except share amounts) | | Amounts in thousands (except share amounts) | |
| | | Principal | Fair | | | Principal | Fair |
| | | Amount ($) | Value | | | Amount ($) | Value |
| | | or Shares | $ | | | or Shares | $ |
| | | | | Smurfit Kappa Treasury Funding, Ltd. | | | |
| Orange SA | | | | 7.500% due 11/20/25 | | 200 | 241 |
| 2.750% due 02/06/19 | | 244 | 245 | Sociedad Quimica y Minera de Chile SA | | | |
| Pernod Ricard SA | | | | 5.500% due 04/21/20 (Þ) | | 236 | 250 |
| 4.450% due 01/15/22 (Þ) | | 150 | 159 | Southern Copper Corp. | | | |
| Peru Government International Bond | | | | 6.750% due 04/16/40 | | 10 | 13 |
| 6.550% due 03/14/37 | | 10 | 14 | 5.250% due 11/08/42 | | 440 | 491 |
| 5.625% due 11/18/50 | | 130 | 167 | Standard Chartered PLC | | | |
| Petrobras Global Finance BV | | | | 5.700% due 03/26/44 (Þ) | | 450 | 545 |
| 6.250% due 03/17/24 | | 100 | 106 | Sumitomo Mitsui Banking Corp. | | | |
| 5.299% due 01/27/25 (Þ) | | 1,105 | 1,109 | 1.876% due 05/15/19 (Ê)(~) | | 850 | 851 |
| Petroleos Mexicanos | | | | 2.092% due 10/18/19 | | 253 | 252 |
| 5.375% due 03/13/22 (Þ) | | 750 | 795 | Sumitomo Mitsui Financial Group, Inc. | | | |
| 6.875% due 08/04/26 | | 220 | 249 | Series 5FXD | | | |
| 6.625% due 06/15/35 | | 10 | 11 | 2.058% due 07/14/21 | | 90 | 88 |
| 5.625% due 01/23/46 | | 225 | 208 | Svenska Handelsbanken AB | | | |
| Province of Quebec Canada | | | | 1.795% due 06/07/19 (Ê)(~) | | 1,000 | 1,001 |
| 1.643% due 07/21/19 (Ê) | | 480 | 482 | 2.250% due 06/17/19 | | 243 | 243 |
| Provincia de Buenos Aires | | | | Syngenta Finance NV | | | |
| 6.500% due 02/15/23 (Þ) | | 140 | 150 | 3.125% due 03/28/22 | | 264 | 257 |
| PT Pertamina (Persero) | | | | Talent Yield Investments, Ltd. | | | |
| 4.300% due 05/20/23 (Þ) | | 520 | 543 | 4.500% due 04/25/22 (Þ) | | 239 | 250 |
| Reckitt Benckiser Treasury Services PLC | | | | Telefonica Emisiones SAU | | | |
| 2.235% due 06/24/22 (Ê)(Þ) | | 685 | 685 | 5.134% due 04/27/20 | | 270 | 285 |
| Republic of Argentina Government | | | | Tencent Holdings, Ltd. | | | |
| International Bond | | | | 3.375% due 05/02/19 (Þ) | | 220 | 223 |
| 5.625% due 01/26/22 | | 340 | 359 | | | | |
| | | | | Teva Pharmaceutical Finance Co. BV | | | |
| Series WI | | | | 2.950% due 12/18/22 | | 40 | 36 |
| 7.500% due 04/22/26 | | 170 | 192 | Teva Pharmaceutical Finance | | | |
| Republic of Poland Government | | | | Netherlands III BV | | | |
| International Bond | | | | 1.700% due 07/19/19 | | 30 | 29 |
| 5.125% due 04/21/21 | | 400 | 433 | 2.800% due 07/21/23 | | 294 | 256 |
| Royal Bank of Canada | | | | 3.150% due 10/01/26 | | 20 | 17 |
| Series GMTN | | | | Toronto-Dominion Bank (The) | | | |
| 2.125% due 03/02/20 | | 580 | 578 | 2.250% due 11/05/19 | | 246 | 246 |
| 2.150% due 03/06/20 | | 246 | 245 | 2.125% due 04/07/21 | | 405 | 401 |
| Royal Bank of Scotland Group PLC | | | | Series MTN | | | |
| 6.400% due 10/21/19 | | 180 | 192 | 2.203% due 01/22/19 (Ê) | | 250 | 252 |
| 6.125% due 12/15/22 | | 70 | 77 | | | | |
| 3.875% due 09/12/23 | | 885 | 900 | Trust F/1401 | | | |
| | | | | 5.250% due 01/30/26 (Þ) | | 212 | 223 |
| 5.125% due 05/28/24 | | 220 | 233 | | | | |
| | | | | UBS AG | | | |
| Santander UK Group Holdings PLC | | | | 2.450% due 12/01/20 (Þ) | | 845 | 842 |
| 2.875% due 10/16/20 | | 251 | 252 | | | | |
| | | | | UBS Group Funding Switzerland AG | | | |
| 3.823% due 11/03/28 (Ê) | | 725 | 726 | 3.491% due 05/23/23 (Þ) | | 270 | 274 |
| Santander UK PLC | | | | 4.253% due 03/23/28 (Þ) | | 200 | 211 |
| 2.350% due 09/10/19 | | 252 | 252 | Unitymedia Finance LLC 1st Lien Term | | | |
| Schlumberger Norge AS | | | | Loan D | | | |
| 4.200% due 01/15/21 (Þ) | | 70 | 73 | 0.000% due 01/15/26 (Ê)(v) | | 170 | 170 |
| Seagate HDD Cayman | | | | Vale Overseas, Ltd. | | | |
| 4.250% due 03/01/22 (Þ) | | 244 | 247 | 6.875% due 11/21/36 | | 471 | 577 |
| Shell International Finance BV | | | | Valeant Pharmaceuticals International, | | | |
| 1.375% due 05/10/19 | | 245 | 243 | Inc. | | | |
| 4.375% due 03/25/20 | | 10 | 10 | 6.500% due 03/15/22 (Þ) | | 20 | 21 |
| 2.875% due 05/10/26 | | 40 | 40 | 5.875% due 05/15/23 (Þ) | | 190 | 176 |
| 4.375% due 05/11/45 | | 250 | 281 | 7.000% due 03/15/24 (Þ) | | 70 | 75 |
| 4.000% due 05/10/46 | | 80 | 85 | Validus Holdings, Ltd. | | | |
| | | | | 8.875% due 01/26/40 | | 424 | 627 |
| Shire Acquisitions Investments | | | | Virgin Media Bristol LLC 1st Lien Term | | | |
| 1.900% due 09/23/19 | | 815 | 808 | | | | |
| See accompanying notes which are an integral part of the financial statements. | Loan K | | | |
94 Strategic Bond Fund
Russell Investment Funds
Strategic Bond Fund
Schedule of Investments, continued — December 31, 2017
| | | | | | | | |
| Amounts in thousands (except share amounts) | | Amounts in thousands (except share amounts) | | |
| | | Principal | Fair | | | Principal | Fair | |
| | | Amount ($) | Value | | | Amount ($) | Value | |
| | | or Shares | $ | | | or Shares | $ | |
| 0.000% due 01/15/26 (Ê)(v) | | 147 | 147 | 4.319% due 03/01/24 (Ê) | | 86 | | 86 |
| Vodafone Group PLC | | | | Charter Communications Operating | | | | |
| 5.450% due 06/10/19 | | 526 | 549 | Group, Inc. Term Loan B | | | | |
| 6.150% due 02/27/37 | | 520 | 652 | 0.000% due 04/13/25 (Ê)(v) | | 230 | | 230 |
| Voya CLO, Ltd. | | | | CityCenter Holdings, LLC Term Loan B | | | | |
| Series 2017-2A Class A1R | | | | 4.069% due 04/18/24 (Ê) | | 22 | | 23 |
| 2.408% due 04/17/30 (Ê)(Å) | | 1,428 | 1,438 | CSC Holdings, LLC 1st Lien Term Loan | | | | |
| Westpac Banking Corp. | | | | 3.741% due 07/17/25 (Ê) | | 165 | | 164 |
| 1.600% due 08/19/19 | | 249 | 246 | CWGS Group LLC Term Loan | | | | |
| | | | | 4.392% due 11/08/23 (Ê) | | 69 | | 70 |
| Woori Bank | | | | Dell International LLC 1st Lien Term | | | | |
| 5.875% due 04/13/21 (Þ) | | 232 | 251 | | | | | |
| Ziggo Secured Finance Partnership 1st | | | | Loan A2 | | | | |
| | | | | 3.320% due 09/07/21 (Ê) | | 156 | | 156 |
| Lien Term Loan E | | | | Dell International LLC 1st Lien Term | | | | |
| 3.977% due 04/27/25 (Ê) | | 56 | 56 | Loan B | | | | |
| | | | 76,372 | 3.570% due 09/07/23 (Ê) | | 110 | | 110 |
| Loan Agreements - 1.0% | | | | First Data Corp. 1st Lien Term Loan | | | | |
| Air Medical Group Holdings, Inc. 1st | | | | 3.802% due 04/26/24 (Ê) | | 248 | | 248 |
| Lien Term Loan B | | | | | | | | |
| 4.943% due 04/28/22 (Ê) | | 98 | 98 | Golden Nugget, Inc. 1st Lien Term Loan | | | | |
| Air Medical Group Holdings, Inc. 1st | | | | 4.656% due 10/04/23 (Ê) | | 107 | | 108 |
| Lien Term Loan B1 | | | | 4.857% due 10/04/23 (Ê) | | 141 | | 142 |
| 5.675% due 04/28/22 (Ê) | | 60 | 60 | HCA, Inc. Term Loan B8 | | | | |
| Albertson's LLC Term Loan B4 | | | | 3.819% due 02/15/24 (Ê) | | 189 | | 190 |
| 4.319% due 08/25/21 (Ê) | | 69 | 67 | Hilton Worldwide Finance LLC Term | | | | |
| | | | | Loan B2 | | | | |
| Albertson's LLC Term Loan B6 | | | | 3.552% due 10/25/23 (Ê) | | 253 | | 254 |
| 4.462% due 06/22/23 (Ê) | | 164 | 160 | | | | | |
| | | | | Jaguar Holding Co. II Term Loan | | | | |
| American Airlines, Inc. 2017 Term Loan | | | | 4.319% due 08/18/22 (Ê) | | 117 | | 117 |
| 3.477% due 12/14/23 (Ê) | | 50 | 49 | 4.443% due 08/18/22 (Ê) | | 130 | | 130 |
| American Airlines, Inc. Term Loan B | | | | | | | | |
| 3.552% due 06/27/20 (Ê) | | 198 | 199 | Level 3 Financing, Inc. Term Loan B | | | | |
| American Axle & Manufacturing, Inc. | | | | 3.696% due 02/22/24 (Ê) | | 250 | | 250 |
| | | | | MA Finance Co. LLC 1st Lien Term | | | | |
| 1st Lien Term Loan B | | | | Loan B | | | | |
| 3.620% due 04/06/24 (Ê) | | 12 | 12 | 4.319% due 06/21/24 (Ê) | | 4 | | 4 |
| 3.810% due 04/06/24 (Ê) | | 12 | 12 | | | | | |
| American Builders & Contractors Supply | | | | MacDermid, Inc. Term Loan B6 | | | | |
| Co. , Inc. Term Loan B | | | | 4.569% due 06/07/23 (Ê) | | 414 | | 417 |
| 4.069% due 10/31/23 (Ê) | | 249 | 250 | MGM Growth Properties Operating | | | | |
| | | | | Partnership, LP Term Loan B | | | | |
| Avolon LLC Term Loan B | | | | 3.819% due 04/25/23 (Ê) | | 245 | | 246 |
| 3.751% due 03/20/22 (Ê) | | 249 | 247 | | | | | |
| Beacon Roofing Supply, Inc. Term Loan | | | | Michaels Stores, Inc. Term Loan B1 | | | | |
| B | | | | 4.210% due 01/28/23 (Ê) | | 73 | | 73 |
| 0.000% due 01/02/25 (Ê)(v) | | 251 | 252 | 4.251% due 01/28/23 (Ê) | | 13 | | 13 |
| Berry Plastics Global, Inc. 1st Lien Term | | | | 4.319% due 01/28/23 (Ê) | | 195 | | 195 |
| Loan N | | | | MultiPlan, Inc. Term Loan B | | | | |
| 0.000% due 01/19/24 (Ê)(v) | | 35 | 35 | 4.693% due 05/25/23 (Ê) | | 239 | | 239 |
| Berry Plastics Group, Inc Term Loan M | | | | ON Semiconductor Corp 1st Lien Term | | | | |
| 3.682% due 10/01/22 (Ê) | | 83 | 83 | Loan B2 | | | | |
| 3.819% due 10/01/22 (Ê) | | 129 | 129 | 0.000% due 03/31/23 (Ê)(v) | | 56 | | 56 |
| Boyd Gaming Corp. Term Loan B | | | | Party City Holdings, Inc. Term Loan | | | | |
| 3.975% due 09/15/23 (Ê) | | 93 | 93 | 4.380% due 08/19/22 (Ê) | | 120 | | 121 |
| Caesars Resort Collection LLC 1st Lien | | | | 4.580% due 08/19/22 (Ê) | | 51 | | 51 |
| Term Loan B | | | | 4.700% due 08/19/22 (Ê) | | 11 | | 11 |
| 0.000% due 09/27/24 (Ê)(v) | | 158 | 158 | Petco Animal Supplies, Inc. 1st Lien | | | | |
| Catalent Pharma Solutions, Inc. Term | | | | Term Loan B1 | | | | |
| Loan B | | | | 4.380% due 01/26/23 (Ê) | | 118 | | 89 |
| 3.819% due 05/20/21 (Ê) | | 187 | 188 | PetSmart, Inc. Term Loan B2 | | | | |
| CenturyLink, Inc. Term Loan B | | | | 4.570% due 03/10/22 (Ê) | | 193 | | 154 |
| 4.319% due 01/31/25 (Ê) | | 205 | 198 | Post Holdings, Inc. Incremental Term | | | | |
| Change Healthcare Holdings LLC 1st | | | | Loan | | | | |
| Lien Term Loan B | | | | 3.820% due 05/24/24 (Ê) | | 261 | | 261 |
See accompanying notes which are an integral part of the financial statements.
Strategic Bond Fund 95
Russell Investment Funds
Strategic Bond Fund
Schedule of Investments, continued — December 31, 2017
| | | | | | | |
| Amounts in thousands (except share amounts) | | Amounts in thousands (except share amounts) | |
| | | Principal | Fair | | | Principal | Fair |
| | | Amount ($) | Value | | | Amount ($) | Value |
| | | or Shares | $ | | | or Shares | $ |
| Prime Security Services Borrower LLC | | | | 4.101% due 11/15/34 (Ê)(Þ) | | 1,372 | 1,372 |
| Term Loan B1 | | | | Bayview Commercial Asset Trust | | | |
| 4.319% due 05/02/22 (Ê) | | 248 | 250 | | | | |
| Quikrete Holdings, Inc. 1st Lien Term | | | | Series 2007-2A Class A1 | | | |
| Loan B | | | | 1.507% due 07/25/37 (Ê)(Þ) | | 1,307 | 1,248 |
| 4.319% due 11/15/23 (Ê) | | 164 | 164 | BCAP LLC Trust | | | |
| Reynolds Group Holdings, Inc. 1st Lien | | | | Series 2010-RR7 Class 3A12 | | | |
| Term Loan B | | | | 2.798% due 08/26/35 (~)(Ê)(Þ) | | 976 | 813 |
| 4.319% due 02/05/23 (Ê) | | 229 | 230 | Series 2011-R11 Class 15A1 | | | |
| RPI Finance Trust Term Loan B | | | | 3.400% due 10/26/33 (~)(Ê)(Å) | | 137 | 139 |
| 3.693% due 03/27/23 (Ê) | | 185 | 185 | Series 2011-R11 Class 20A5 | | | |
| Scientific Games International, Inc. 1st | | | | 3.069% due 03/26/35 (~)(Ê)(Þ) | | 63 | 63 |
| Lien Term Loan B4 | | | | Bear Stearns Adjustable Rate Mortgage | | | |
| 4.673% due 08/14/24 (Ê) | | 223 | 224 | Trust | | | |
| 4.819% due 08/14/24 (Ê) | | 61 | 61 | Series 2005-2 Class A1 | | | |
| Seattle SpinCo, Inc. Term Loan B3 | | | | 3.260% due 03/25/35 (Ê) | | 153 | 154 |
| 4.319% due 06/21/24 (Ê) | | 27 | 27 | Bear Stearns Alternative-A Trust | | | |
| Sinclair Television Group, Inc. Term | | | | Series 2005-2 Class 1M1 | | | |
| Loan B | | | | 1.342% due 03/25/35 (Ê) | | 900 | 845 |
| 0.000% due 05/10/24 (Ê)(v) | | 110 | 110 | | | | |
| Sprint Communications, Inc. 1st Lien | | | | Series 2005-4 Class 24A1 | | | |
| Term Loan B | | | | 3.631% due 05/25/35 (~)(Ê) | | 400 | 413 |
| 4.125% due 02/02/24 (Ê) | | 17 | 17 | Bear Stearns ARM Trust | | | |
| Staples, Inc. 1st Lien Term Loan | | | | Series 2004-3 Class 2A | | | |
| 5.488% due 09/12/24 (Ê) | | 75 | 73 | 3.063% due 07/25/34 (~)(Ê) | | 194 | 196 |
| SunGard Availability Services Capital, | | | | Bear Stearns Commercial Mortgage | | | |
| Inc. Term Loan B | | | | Securities Trust | | | |
| 8.569% due 09/17/21 (Ê) | | 393 | 361 | Series 2007-T26 Class AM | | | |
| Trans Union LLC 1st Lien Term Loan B3 | | | | 5.513% due 01/12/45 (~)(Ê) | | 147 | 150 |
| 3.569% due 04/09/23 (Ê) | | 232 | 233 | BXP Trust | | | |
| Univision Communications, Inc. Term | | | | Series 2017-GM Class A | | | |
| Loan C5 | | | | 3.379% due 06/13/39 (Þ) | | 416 | 425 |
| 4.319% due 03/15/24 (Ê) | | 246 | 245 | CFCRE Commercial Mortgage Trust | | | |
| UPC Financing Partnership 1st Lien | | | | | | | |
| Term Loan AR | | | | Series 2016-C3 Class A3 | | | |
| 3.977% due 01/15/26 (Ê) | | 245 | 245 | 3.865% due 01/10/48 | | 1,150 | 1,205 |
| XPO Logistics, Inc. Term Loan B | | | | CHL Mortgage Pass-Through Trust | | | |
| 3.599% due 11/01/21 (Ê) | | 195 | 196 | Series 2005-3 Class 1A2 | | | |
| Zebra Technologies Corp. Term Loan B | | | | 0.815% due 04/25/35 (Ê) | | 10 | 9 |
| 3.371% due 10/27/21 (Ê) | | 66 | 66 | Citigroup Commercial Mortgage Trust | | | |
| | | | | Series 2013-375P Class A | | | |
| |
| Mortgage-Backed Securities - 21.8% | | 9,185 | 3.251% due 05/10/35 (Þ) | | 380 | 387 |
| | | | | Series 2015-GC29 Class C | | | |
| A10 Securitization LLC | | | | 4.293% due 04/10/48 (~)(Ê) | | 100 | 98 |
| Series 2017-AA Class B1 | | | | | | | |
| 0.071% due 05/15/36 (Þ) | | 961 | 949 | Citigroup Mortgage Loan Trust, Inc. | | | |
| American Home Mortgage Investment | | | | Series 2005-2 Class 1A2A | | | |
| Trust | | | | 3.431% due 05/25/35 (~)(Ê) | | 498 | 513 |
| Series 2004-4 Class 4A | | | | Series 2005-11 Class A2A | | | |
| 3.661% due 02/25/45 (Ê) | | 22 | 23 | 2.930% due 10/25/35 (Ê) | | 10 | 10 |
| Banc of America Commercial Mortgage | | | | Series 2006-AR9 Class 1M1 | | | |
| Trust | | | | 0.865% due 11/25/36 (Ê) | | 1,060 | 895 |
| Series 2007-2 Class AJ | | | | Series 2007-AR8 Class 2A1A | | | |
| 5.634% due 04/10/49 (~)(Ê) | | 56 | 42 | 3.534% due 07/25/37 (~)(Ê) | | 212 | 196 |
| Banc of America Funding Trust | | | | Series 2015-2 Class 5A1 | | | |
| Series 2005-D Class A1 | | | | 0.444% due 03/25/47 (Ê)(Þ) | | 357 | 350 |
| 3.413% due 05/25/35 (~)(Ê) | | 523 | 544 | Cold Storage Trust | | | |
| Series 2006-6 Class 2A1 | | | | Series 2017-ICE3 Class D | | | |
| 6.000% due 08/25/36 | | 1,072 | 1,045 | 3.094% due 04/15/24 (Ê)(Þ) | | 510 | 512 |
| Barclays Commercial Mortgage | | | | Commercial Mortgage Trust | | | |
| Securities LLC | | | | Series 2013-300P Class A1 | | | |
| Series 2017-GLKS Class E | | | | | | | |
See accompanying notes which are an integral part of the financial statements.
96 Strategic Bond Fund
Russell Investment Funds
Strategic Bond Fund
Schedule of Investments, continued — December 31, 2017
| | | | | | | |
| Amounts in thousands (except share amounts) | | Amounts in thousands (except share amounts) | |
| | | Principal | Fair | | | Principal | Fair |
| | | Amount ($) | Value | | | Amount ($) | Value |
| | | or Shares | $ | | | or Shares | $ |
| 4.353% due 08/10/30 (Þ) | | 390 | 418 | 6.000% due 2032 | | 34 | 38 |
| Series 2013-CR6 Class B | | | | 3.000% due 2033 | | 1,218 | 1,245 |
| 3.397% due 03/10/46 (Þ) | | 211 | 210 | 3.500% due 2033 | | 930 | 968 |
| Series 2013-CR9 Class ASB | | | | 5.000% due 2033 | | 7 | 7 |
| 3.834% due 07/10/45 | | 840 | 872 | 3.500% due 2034 | | 197 | 205 |
| Series 2014-277P Class A | | | | 5.500% due 2034 | | 24 | 27 |
| 3.732% due 08/10/49 (Ê)(Þ) | | 410 | 426 | 4.500% due 2035 | | 559 | 602 |
| Series 2014-UBS4 Class A1 | | | | 5.500% due 2037 | | 158 | 175 |
| 1.309% due 08/10/47 | | 100 | 99 | 5.500% due 2038 | | 627 | 694 |
| Series 2015-LC19 Class A4 | | | | 6.000% due 2039 | | 61 | 68 |
| 3.183% due 02/10/48 | | 191 | 193 | 4.000% due 2040 | | 362 | 386 |
| Series 2015-LC19 Class B | | | | 5.500% due 2040 | | 783 | 870 |
| 3.829% due 02/10/48 (~)(Ê) | | 100 | 101 | 6.000% due 2040 | | 180 | 203 |
| Series 2016-GCT Class A | | | | 4.000% due 2041 | | 621 | 659 |
| 2.681% due 08/10/29 (Þ) | | 140 | 140 | 6.000% due 2041 | | 193 | 217 |
| Countrywide Alternative Loan Trust | | | | 3.000% due 2042 | | 712 | 716 |
| Series 2007-16CB Class 1A5 | | | | 3.500% due 2043 | | 1,398 | 1,441 |
| 1.171% due 08/25/37 (Ê) | | 569 | 451 | 4.000% due 2044 | | 1,228 | 1,305 |
| Credit Suisse Mortgage Capital | | | | 3.500% due 2045 | | 1,923 | 1,981 |
| Certificates | | | | 3.000% due 2046 | | 645 | 646 |
| Series 2017-CHOP Class G | | | | 4.000% due 2046 | | 2,085 | 2,201 |
| 6.847% due 07/15/32 (Ê)(Þ) | | 600 | 599 | 4.500% due 2046 | | 653 | 709 |
| CSAIL Commercial Mortgage Trust | | | | 3.000% due 2047 | | 761 | 763 |
| Series 2015-C4 Class E | | | | 3.500% due 2047 | | 698 | 717 |
| 3.585% due 11/15/48 (~)(Ê) | | 500 | 372 | 4.000% due 2047 | | 4,538 | 4,753 |
| CSMC Mortgage-Backed Trust | | | | 4.500% due 2047 | | 2,568 | 2,735 |
| Series 2011-4R Class 5A1 | | | | 3.500% due 2048 | | 700 | 720 |
| 3.588% due 05/27/36 (~)(Ê)(Å) | | 65 | 65 | 4.000% due 2056 | | 1,396 | 1,468 |
| DBJPM Mortgage Trust | | | | 4.500% due 2056 | | 371 | 399 |
| Series 2016-C3 Class A5 | | | | 5.500% due 2056 | | 361 | 401 |
| 2.890% due 09/10/49 | | 240 | 237 | 3.500% due 2057 | | 1,060 | 1,087 |
| Deutsche Mortgage Securities, Inc. Re- | | | | 15 Year TBA(Ï) | | | |
| REMIC Trust | | | | 3.000% | | 2,300 | 2,343 |
| Series 2007-WM1 Class A1 | | | | 3.500% | | 900 | 929 |
| 4.078% due 06/27/37 (~)(Ê)(Þ) | | 595 | 604 | 30 Year TBA(Ï) | | | |
| Fannie Mae | | | | 2.500% | | 1,415 | 1,365 |
| 3.950% due 2020 | | 405 | 419 | | | | |
| 4.000% due 2020 | | 192 | 198 | 3.000% | | 15,895 | 15,877 |
| 5.500% due 2020 | | 6 | 6 | 3.500% | | 12,290 | 12,613 |
| 4.250% due 2021 | | 395 | 418 | 4.000% | | 1,900 | 2,028 |
| 4.283% due 2021 | | 559 | 588 | Class 1M2 | | | |
| 2.500% due 2022 | | 319 | 320 | 6.138% due 11/25/24 (Ê) | | 1,046 | 1,197 |
| 5.500% due 2022 | | 41 | 42 | 4.726% due 01/25/29 (Ê) | | 50 | 57 |
| | | | | Fannie Mae Connecticut Avenue | | | |
| 2.000% due 2023 | | 1,141 | 1,134 | Securities | | | |
| 2.500% due 2024 | | 517 | 520 | | | | |
| 4.500% due 2024 | | 6 | 6 | Series 2016-C06 Class 1M1 | | | |
| | | | | 2.538% due 04/25/29 (Ê) | | 1,262 | 1,276 |
| 4.000% due 2025 | | 169 | 176 | | | | |
| 4.500% due 2025 | | 228 | 240 | Fannie Mae REMIC Trust | | | |
| 4.000% due 2026 | | 163 | 169 | Series 2004-W5 Class A1 | | | |
| 6.000% due 2026 | | 50 | 56 | 6.000% due 02/25/47 | | 195 | 219 |
| 2.500% due 2027 | | 388 | 390 | Fannie Mae REMICS | | | |
| 2.940% due 2027 | | 100 | 100 | Series 1999-56 Class Z | | | |
| 4.500% due 2027 | | 89 | 90 | 7.000% due 12/18/29 | | 14 | 15 |
| 6.000% due 2027 | | 31 | 35 | Series 2005-24 Class ZE | | | |
| 2.560% due 2028 | | 370 | 357 | 5.000% due 04/25/35 | | 279 | 303 |
| 3.500% due 2030 | | 172 | 178 | Series 2009-96 Class DB | | | |
| 2.600% due 2031 | | 375 | 359 | 4.000% due 11/25/29 | | 220 | 230 |
| 5.000% due 2031 | | 155 | 167 | Series 2012-35 Class SC | | | |
See accompanying notes which are an integral part of the financial statements.
Strategic Bond Fund 97
Russell Investment Funds
Strategic Bond Fund
Schedule of Investments, continued — December 31, 2017
| | | | | | | |
| Amounts in thousands (except share amounts) | | Amounts in thousands (except share amounts) | |
| | | Principal | Fair | | | Principal | Fair |
| | | Amount ($) | Value | | | Amount ($) | Value |
| | | or Shares | $ | | | or Shares | $ |
| Interest Only STRIP | | | | 4.500% due 2034 | | 199 | 214 |
| 4.948% due 04/25/42 (Ê) | | 30 | 6 | 5.500% due 2038 | | 449 | 507 |
| Series 2012-55 Class PC | | | | 6.000% due 2038 | | 93 | 106 |
| 3.500% due 05/25/42 | | 700 | 719 | 5.000% due 2040 | | 297 | 324 |
| Series 2013-54 Class BS | | | | 4.000% due 2041 | | 1,528 | 1,629 |
| Interest Only STRIP | | | | 4.500% due 2041 | | 292 | 313 |
| 4.918% due 06/25/43 (Ê) | | 132 | 26 | 5.500% due 2041 | | 301 | 335 |
| Series 2013-124 Class SB | | | | 3.500% due 2043 | | 1,175 | 1,218 |
| Interest Only STRIP | | | | 4.000% due 2044 | | 715 | 756 |
| 4.712% due 12/25/43 (Ê) | | 144 | 27 | 3.500% due 2045 | | 2,044 | 2,114 |
| Series 2016-23 Class ST | | | | 4.000% due 2045 | | 1,806 | 1,895 |
| Interest Only STRIP | | | | 3.500% due 2046 | | 2,250 | 2,314 |
| 5.547% due 11/25/45 (Ê) | | 487 | 95 | 4.000% due 2046 | | 2,318 | 2,438 |
| Series 2016-61 Class BS | | | | 4.500% due 2046 | | 399 | 426 |
| | | | | 3.000% due 2047 | | 755 | 759 |
| Interest Only STRIP | | | | 3.500% due 2047 | | 4,684 | 4,821 |
| 5.613% due 09/25/46 (Ê) | | 448 | 66 | | | | |
| | | | | 4.000% due 2047 | | 5,583 | 5,848 |
| Series 2017-6 Class PA | | | | | | | |
| 3.500% due 06/25/46 | | 1,940 | 1,981 | 30 Year TBA(Ï) | | | |
| | | | | 3.000% | | 900 | 901 |
| Series 2017-76 Class SB | | | | 3.500% | | 1,800 | 1,849 |
| Interest Only STRIP | | | | 4.000% | | 2,600 | 2,721 |
| 4.862% due 10/25/57 (Ê) | | 475 | 87 | Freddie Mac Multifamily Structured | | | |
| Series 2017-85 Class SC | | | | Pass-Through Certificates | | | |
| Interest Only STRIP | | | | Series 2013-K024 Class A2 | | | |
| 4.963% due 11/25/47 (Ê) | | 96 | 17 | 2.573% due 09/25/22 | | 1,530 | 1,539 |
| Fannie Mae-Aces | | | | Series 2013-K029 Class A2 | | | |
| Series 2014-M1 Class A1 | | | | 3.320% due 02/25/23 (~)(Ê) | | 1,450 | 1,507 |
| 2.325% due 07/25/23 (~)(Ê) | | 89 | 89 | Series 2015-K045 Class A2 | | | |
| Series 2014-M13 Class AB2 | | | | 3.023% due 01/25/25 | | 1,020 | 1,042 |
| 2.951% due 08/25/24 (~)(Ê) | | 398 | 400 | Series 2015-K046 Class A2 | | | |
| Series 2015-M11 Class A1 | | | | 3.205% due 03/25/25 | | 400 | 413 |
| 2.097% due 04/25/25 | | 425 | 421 | Series 2015-K049 Class A2 | | | |
| Series 2016-M2 Class ABV2 | | | | 3.010% due 08/25/25 | | 1,470 | 1,496 |
| 2.131% due 01/25/23 | | 587 | 578 | Series 2016-K052 Class A2 | | | |
| Series 2016-M3 Class ASQ2 | | | | 3.151% due 11/25/25 | | 1,110 | 1,140 |
| 2.263% due 02/25/23 | | 895 | 888 | Series 2016-K053 Class A2 | | | |
| Series 2016-M6 Class AB2 | | | | 2.995% due 12/25/25 | | 390 | 396 |
| 2.395% due 05/25/26 | | 1,015 | 978 | Series 2016-K058 Class X1 | | | |
| Series 2016-M7 Class A2 | | | | Interest Only STRIP | | | |
| 2.499% due 09/25/26 | | 210 | 204 | 0.930% due 08/25/26 (~)(Ê) | | 4,143 | 279 |
| Series 2016-M7 Class AV2 | | | | Series 2016-KF15 Class A | | | |
| 2.157% due 10/25/23 | | 2,035 | 1,997 | 1.204% due 02/25/23 (Ê) | | 1,764 | 1,771 |
| Series 2017-M15 Class ATS2 | | | | Series 2016-KF17 Class A | | | |
| 3.136% due 11/25/27 (~)(Ê) | | 20 | 20 | 1.084% due 03/25/23 (Ê) | | 1,050 | 1,053 |
| FDIC Trust | | | | Freddie Mac Reference REMIC | | | |
| Series 2010-R1 Class A | | | | Series 2006-R006 Class ZA | | | |
| 2.184% due 05/25/50 (Å) | | 264 | 265 | 6.000% due 04/15/36 | | 371 | 412 |
| First Horizon Mortgage Pass-Through | | | | | | | |
| Trust | | | | Freddie Mac REMICS | | | |
| | | | | Series 2003-2624 Class QH | | | |
| Series 2005-AR4 Class 2A1 | | | | 5.000% due 06/15/33 | | 100 | 108 |
| 3.142% due 10/25/35 (~)(Ê) | | 369 | 352 | | | | |
| | | | | Series 2006-R007 Class ZA | | | |
| Flagstar Mortgage Trust | | | | 6.000% due 05/15/36 | | 318 | 353 |
| Series 2017-2 Class A5 | | | | | | | |
| 3.500% due 10/25/47 (~)(Ê)(Þ) | | 1,177 | 1,190 | Series 2009-3569 Class NY | | | |
| | | | | 5.000% due 08/15/39 | | 1,400 | 1,494 |
| Freddie Mac | | | | | | | |
| 4.500% due 2020 | | 899 | 912 | Series 2010-3632 Class PK | | | |
| 2.000% due 2028 | | 1,545 | 1,513 | 5.000% due 02/15/40 | | 213 | 231 |
| 3.500% due 2030 | | 147 | 152 | Series 2010-3653 Class B | | | |
| | | | | 4.500% due 04/15/30 | | 301 | 322 |
See accompanying notes which are an integral part of the financial statements.
98 Strategic Bond Fund
Russell Investment Funds
Strategic Bond Fund
Schedule of Investments, continued — December 31, 2017
| | | | | | | |
| Amounts in thousands (except share amounts) | | Amounts in thousands (except share amounts) | |
| | | Principal | Fair | | | Principal | Fair |
| | | Amount ($) | Value | | | Amount ($) | Value |
| | | or Shares | $ | | | or Shares | $ |
| Series 2011-3973 Class SA | | | | 3.369% due 06/10/28 (Þ) | | 393 | 403 |
| Interest Only STRIP | | | | GS Mortgage Securities Trust | | | |
| 5.331% due 12/15/41 (Ê) | | 454 | 86 | Series 2012-GCJ7 Class A4 | | | |
| Series 2012-4010 Class KM | | | | 3.377% due 05/10/45 | | 1,176 | 1,203 |
| 3.000% due 01/15/42 | | 152 | 153 | Series 2013-GC14 Class AAB | | | |
| Series 2013-4233 Class MD | | | | 3.817% due 08/10/46 | | 470 | 488 |
| 1.750% due 03/15/25 | | 99 | 99 | Series 2013-GC14 Class AS | | | |
| Freddie Mac Strips | | | | 4.507% due 08/10/46 (Þ) | | 235 | 251 |
| Series 2012-271 Class 30 | | | | Series 2015-GS1 Class C | | | |
| 3.000% due 08/15/42 | | 1,064 | 1,070 | 4.570% due 11/10/48 (~)(Ê) | | 180 | 184 |
| Series 2014-334 Class S7 | | | | Series 2016-GS2 Class A4 | | | |
| Interest Only STRIP | | | | 3.050% due 05/10/49 | | 1,342 | 1,339 |
| 5.592% due 08/15/44 (Ê) | | 214 | 42 | Series 2017-SLP Class E | | | |
| Series 2016-353 Class S1 | | | | 4.591% due 10/10/32 (~)(Ê)(Þ) | | 120 | 116 |
| Interest Only STRIP | | | | Hilton USA Trust | | | |
| 4.773% due 12/15/46 (Ê) | | 92 | 18 | Series 2016-HHV Class D | | | |
| Freddie Mac Structured Agency Credit | | | | 4.194% due 11/05/38 (~)(Ê)(Þ) | | 1,240 | 1,228 |
| Risk Debt Notes | | | | Series 2016-HHV Class E | | | |
| Series 2015-DN1 Class M3 | | | | 4.194% due 11/05/38 (~)(Ê)(Å) | | 600 | 547 |
| 4.331% due 01/25/25 (Ê) | | 1,063 | 1,150 | Series 2016-SFP Class A | | | |
| Series 2015-DNA2 Class M2 | | | | 2.828% due 11/05/35 (Þ) | | 226 | 223 |
| 3.838% due 12/25/27 (Ê) | | 522 | 533 | HMH Trust | | | |
| Series 2017-DNA1 Class M2 | | | | Series 2017-NSS Class E | | | |
| 4.484% due 07/25/29 (Ê) | | 740 | 793 | 6.292% due 07/05/31 (Þ) | | 1,170 | 1,155 |
| Series 2017-DNA2 Class B1 | | | | Hyatt Hotel Portfolio Trust | | | |
| 6.144% due 10/25/29 (Ê) | | 510 | 568 | Series 2017-HYT2 Class C | | | |
| Series 2017-DNA2 Class M1 | | | | 2.289% due 08/09/20 (Ê)(Þ) | | 789 | 785 |
| 2.438% due 10/25/29 (Ê) | | 386 | 392 | | | | |
| Freddie Mac Whole Loan Securities | | | | IndyMac Mortgage Loan Trust | | | |
| Trust | | | | Series 2007-FLX3 Class A1 | | | |
| | | | | 1.474% due 06/25/37 (Ê) | | 289 | 284 |
| Series 2016-SC01 Class M1 | | | | JPMBB Commercial Mortgage Securities | | | |
| 3.854% due 07/25/46 (~)(Ê) | | 158 | 156 | Trust | | | |
| Ginnie Mae | | | | Series 2013-C14 Class D | | | |
| Series 2012-135 Class IO | | | | 4.563% due 08/15/46 (~)(Ê)(Þ) | | 560 | 507 |
| Interest Only STRIP | | | | JPMDB Commercial Mortgage Securities | | | |
| 0.611% due 01/16/53 (~)(Ê) | | 1,992 | 70 | Trust | | | |
| Series 2016-21 Class ST | | | | Series 2017-C5 Class B | | | |
| Interest Only STRIP | | | | 4.009% due 03/15/50 (~)(Ê) | | 150 | 154 |
| 5.638% due 02/20/46 (Ê) | | 308 | 61 | Series 2017-C5 Class C | | | |
| Series 2016-51 Class NS | | | | 4.512% due 03/15/50 (~)(Ê) | | 220 | 228 |
| Interest Only STRIP | | | | JPMorgan Chase Commercial Mortgage | | | |
| 5.518% due 04/20/46 (Ê) | | 152 | 27 | Securities Trust | | | |
| Ginnie Mae I | | | | Series 2004-LN2 Class B | | | |
| 2.140% due 2023 | | 464 | 451 | 5.466% due 07/15/41 (~)(Ê) | | 150 | 134 |
| Ginnie Mae II | | | | Series 2015-MAR7 Class E | | | |
| 3.000% due 2047 | | 1,895 | 1,914 | 5.962% due 06/05/32 (Þ) | | 500 | 504 |
| 3.500% due 2047 | | 398 | 413 | Series 2016-NINE Class A | | | |
| | | | | 2.854% due 10/06/38 (~)(Ê)(Þ) | | 394 | 386 |
| 30 Year TBA(Ï) | | | | | | | |
| 3.000% | | 4,100 | 4,137 | JPMorgan Mortgage Trust | | | |
| 3.500% | | 3,600 | 3,725 | Series 2015-3 Class A5 | | | |
| 4.000% | | 600 | 626 | 3.500% due 05/25/45 (~)(Ê)(Þ) | | 422 | 428 |
| Ginnie Mae REMICS | | | | Series 2016-4 Class A5 | | | |
| Series 2013-53 Class OI | | | | 3.500% due 10/25/46 (~)(Ê)(Þ) | | 488 | 495 |
| Interest Only STRIP | | | | Series 2017-1 Class A4 | | | |
| 3.500% due 04/20/43 | | 1,068 | 174 | 3.500% due 01/25/47 (~)(Ê)(Þ) | | 492 | 499 |
| Grace Mortgage Trust | | | | Series 2017-2 Class A5 | | | |
| | | | | 3.500% due 05/25/47 (~)(Ê)(Þ) | | 554 | 562 |
| Series 2014-GRCE Class A | | | | | | | |
| | | | | Series 2017-3 Class 1A5 | | | |
See accompanying notes which are an integral part of the financial statements.
Strategic Bond Fund 99
Russell Investment Funds
Strategic Bond Fund
Schedule of Investments, continued — December 31, 2017
| | | | | | | |
| Amounts in thousands (except share amounts) | | Amounts in thousands (except share amounts) | |
| | | Principal | Fair | | | Principal | Fair |
| | | Amount ($) | Value | | | Amount ($) | Value |
| | | or Shares | $ | | | or Shares | $ |
| 3.500% due 08/25/47 (~)(Ê)(Þ) | | 1,085 | 1,099 | RBS Commercial Funding, Inc. Trust | | | |
| Series 2017-4 Class A5 | | | | Series 2013-GSP Class A | | | |
| 3.500% due 11/25/47 (~)(Ê)(Þ) | | 1,198 | 1,213 | 3.961% due 01/13/32 (~)(Ê)(Þ) | | 200 | 207 |
| LB-UBS Commercial Mortgage Trust | | | | Residential Accredit Loans, Inc. | | | |
| Series 2005-C7 Class F | | | | Series 2006-QO7 Class 2A1 | | | |
| 5.350% due 11/15/40 (~)(Ê) | | 405 | 415 | 1.464% due 09/25/46 (Ê) | | 1,281 | 1,109 |
| Series 2007-C6 Class AM | | | | Residential Asset Securitization Trust | | | |
| 6.114% due 07/15/40 (~)(Ê) | | 179 | 179 | Series 2003-A15 Class 1A2 | | | |
| ML-CFC Commercial Mortgage Trust | | | | 1.684% due 02/25/34 (Ê) | | 25 | 23 |
| Series 2007-5 Class AJ | | | | Sequoia Mortgage Trust | | | |
| 5.450% due 08/12/48 (~)(Ê) | | 278 | 212 | Series 2013-6 Class A2 | | | |
| Series 2007-5 Class AJFL | | | | 3.000% due 05/25/43 (~)(Ê) | | 704 | 701 |
| 5.450% due 08/12/48 (~)(Ê)(Þ) | | 277 | 212 | Series 2015-1 Class A1 | | | |
| Morgan Stanley Bank of America Merrill | | | | 3.500% due 01/25/45 (~)(Ê)(Þ) | | 714 | 722 |
| Lynch Trust | | | | SG Commercial Mortgage Securities | | | |
| Series 2015-C24 Class A4 | | | | Trust | | | |
| 3.732% due 05/15/48 | | 835 | 875 | Series 2016-C5 Class A4 | | | |
| Series 2015-C26 Class A3 | | | | 3.055% due 10/10/48 | | 475 | 468 |
| 3.211% due 10/15/48 | | 875 | 879 | Structured Adjustable Rate Mortgage | | | |
| Series 2016-C31 Class A1 | | | | Loan Trust | | | |
| 1.511% due 11/15/21 | | 348 | 342 | Series 2006-5 Class 3A | | | |
| | | | | 3.101% due 06/25/36 (~)(Ê) | | 1,507 | 1,256 |
| Morgan Stanley Capital I Trust | | | | Washington Mutual Mortgage Pass- | | | |
| Series 2007-T27 Class B | | | | Through Certificates Trust | | | |
| 5.915% due 06/11/42 (~)(Ê)(Þ) | | 1,104 | 1,206 | Series 2003-AR7 Class A7 | | | |
| Series 2011-C1 Class A3 | | | | 3.130% due 08/25/33 (~)(Ê) | | 93 | 94 |
| 4.700% due 09/15/47 (Þ) | | 41 | 41 | Series 2005-10 Class 3CB1 | | | |
| Series 2011-C3 Class A4 | | | | 6.000% due 11/25/35 | | 1,144 | 1,076 |
| 4.118% due 07/15/49 | | 115 | 120 | Series 2005-AR9 Class A1A | | | |
| Series 2015-MS1 Class A4 | | | | 1.164% due 07/25/45 (Ê) | | 445 | 444 |
| 3.779% due 05/15/48 (~)(Ê) | | 200 | 210 | Series 2005-AR11 Class A1A | | | |
| Series 2016-UBS9 Class A4 | | | | 0.844% due 08/25/45 (Ê) | | 324 | 324 |
| 3.594% due 03/15/49 | | 205 | 212 | | | | |
| Morgan Stanley Mortgage Capital | | | | Series 2006-AR1 Class 2A1A | | | |
| Holdings LLC Trust | | | | 1.577% due 01/25/46 (Ê) | | 538 | 538 |
| Series 2017-237P Class D | | | | Wells Fargo Commercial Mortgage Trust | | | |
| 3.865% due 09/13/39 (Þ) | | 793 | 769 | Series 2016-BNK1 Class A3 | | | |
| Series 2017-237P Class XA | | | | 2.652% due 08/15/49 | | 460 | 445 |
| Interest Only STRIP | | | | Series 2016-C37 Class C | | | |
| 0.343% due 09/13/39 (~)(Ê)(Þ) | | 8,761 | 272 | 4.495% due 12/15/49 (~)(Ê) | | 150 | 154 |
| Series 2017-237P Class XB | | | | Series 2017-RB1 Class XA | | | |
| Interest Only STRIP | | | | Interest Only STRIP | | | |
| 0.051% due 09/13/39 (~)(Ê)(Þ) | | 5,418 | 44 | 1.288% due 03/15/50 (~)(Ê) | | 1,975 | 183 |
| | | | | Wells Fargo Mortgage Backed Securities | | | |
| MSCG Trust | | | | Trust | | | |
| Series 2015-ALDR Class A2 | | | | Series 2004-P Class 2A1 | | | |
| 3.577% due 06/07/35 (~)(Ê)(Þ) | | 255 | 251 | 2.994% due 09/25/34 (~)(Ê) | | 155 | 159 |
| Nomura Resecuritization Trust | | | | Series 2006-AR2 Class 2A1 | | | |
| Series 2015-4R Class 1A14 | | | | 3.257% due 03/25/36 (~)(Ê) | | 70 | 71 |
| 0.590% due 03/26/47 (Ê)(Þ) | | 1,290 | 862 | WFRBS Commercial Mortgage Trust | | | |
| One Market Plaza Trust | | | | Series 2014-C19 Class A3 | | | |
| Series 2017-1MKT Class A | | | | 3.660% due 03/15/47 | | 500 | 513 |
| 3.614% due 02/10/32 (Þ) | | 370 | 381 | Series 2014-C24 Class D | | | |
| Series 2017-1MKT Class C | | | | 3.692% due 11/15/47 (Þ) | | 280 | 192 |
| 4.016% due 02/10/32 (Þ) | | 217 | 223 | WinWater Mortgage Loan Trust | | | |
| Series 2017-1MKT Class D | | | | Series 2014-1 Class A1 | | | |
| 4.146% due 02/10/32 (Þ) | | 400 | 405 | 3.918% due 06/20/44 (~)(Ê)(Þ) | | 762 | 782 |
| Series 2017-1MKT Class E | | | | Worldwide Plaza Trust | | | |
| 4.142% due 02/10/32 (Å) | | 595 | 585 | Series 2017-WWP Class A | | | |
See accompanying notes which are an integral part of the financial statements.
100 Strategic Bond Fund
Russell Investment Funds
Strategic Bond Fund
Schedule of Investments, continued — December 31, 2017
| | | | | | | | | | |
| Amounts in thousands (except share amounts) | | Amounts in thousands (except share amounts) | |
| | | | Principal | Fair | | | Principal | Fair |
| | Amount ($) | Value | | Amount ($) | Value |
| | | | or Shares | $ | | | or Shares | $ |
| 3.526% due 11/10/36 (Þ) | | | | 452 | 464 | Series 0515 | | | | |
| | | | | | 197,929 | 3.759% due 03/15/19 | MYR | | 110 | 27 |
| | | | | | | Series 0613 | | | | |
| | | | | | 3.889% due 07/31/20 | MYR | | 230 | 58 |
| Municipal Bonds - 0.4% | | | | | | | | | | |
| Municipal Electric Authority of Georgia | | | | | | Series 0902 | | | | |
| Revenue Bonds | | | | | | 4.378% due 11/29/19 | MYR | | 220 | 56 |
| 6.637% due 04/01/57 | | | | 750 | 961 | Mexican Bonos | | | | |
| 7.055% due 04/01/57 | | | | 325 | 401 | Series M 20 | | | | |
| Tender Option Bond Trust Receipts | | | | | | 10.000% due 12/05/24 | MXN | | 630 | 36 |
| / Certificates General Obligation | | | | | | 7.500% due 06/03/27 | MXN | | 6,762 | 340 |
| Unlimited | | | | | | Series M 30 | | | | |
| 1.750% due 08/01/49 (~)(Ê)(Þ) | | | | 500 | 500 | 10.000% due 11/20/36 | MXN | | 19,569 | 1,215 |
| Tender Option Bond Trust Receipts / | | | | | | 8.500% due 11/18/38 | MXN | | 9,100 | 496 |
| Certificates Revenue Bonds | | | | | | | | | | |
| 2.250% due 10/29/27 (~)(Ê)(Þ) | | | | 1,400 | 1,400 | Series M | | | | |
| | | | | | | 6.500% due 06/10/21 | MXN | | 740 | 36 |
| | | | | | 3,262 | 7.750% due 05/29/31 | MXN | | 2,940 | 150 |
| Non-US Bonds - 3.6% | | | | | | 7.750% due 11/13/42 | MXN | | 38,400 | 1,941 |
| Australia Government International | | | | | | New Zealand Government International | | | | |
| Bond | | | | | | Bond | | | | |
| Series 126 | | | | | | Series 0423 | | | | |
| 4.500% due 04/15/20 | AUD | | | 2,330 | 1,917 | 5.500% due 04/15/23 | NZD | | 1,710 | 1,407 |
| Series 133 | | | | | | Series 0427 | | | | |
| 5.500% due 04/21/23 | AUD | | | 990 | 892 | 4.500% due 04/15/27 | NZD | | 670 | 543 |
| Series 140 | | | | | | Series 0521 | | | | |
| 4.500% due 04/21/33 | AUD | | | 1,040 | 970 | 6.000% due 05/15/21 | NZD | | 3,120 | 2,493 |
| Brazil Notas do Tesouro Nacional | | | | | | Series 0925 | | | | |
| Series NTNB | | | | | | 2.000% due 09/20/25 | NZD | | 410 | 322 |
| 6.000% due 05/15/45 | BRL | | | 334 | 331 | Norway Government International Bond | | | | |
| Series NTNF | | | | | | Series 473 | | | | |
| 10.000% due 01/01/21 | BRL | | | 3,975 | 1,234 | 4.500% due 05/22/19 (Þ) | NOK | | 5,290 | 680 |
| 10.000% due 01/01/23 | BRL | | | 4,145 | 1,265 | | | | | |
| 10.000% due 01/01/25 | BRL | | | 3,370 | 1,015 | Series 477 | | | | |
| | | | | | | 1.750% due 03/13/25 (Þ) | NOK | | 1,250 | 156 |
| 10.000% due 01/01/27 | BRL | | | 165 | 49 | | | | | |
| | | | | | | Peru Government International Bond | | | | |
| Colombian TES | | | | | | 5.700% due 08/12/24 | PEN | | 3,740 | 1,244 |
| Series B | | | | | | 6.900% due 08/12/37 | PEN | | 2,670 | 926 |
| 10.000% due 07/24/24 | COP | | 6,809,400 | 2,750 | Republic of Argentina Government | | | | |
| 6.000% due 04/28/28 | COP | | | 703,400 | 226 | International Bond | | | | |
| Ireland Government International Bond | | | | | | 18.200% due 10/03/21 | ARS | | 5,600 | 322 |
| 5.400% due 03/13/25 | EUR | | | 1,220 | 1,977 | Series POM | | | | |
| Japan Government 10 Year International | | | | | | 28.750% due 06/21/20 (Ê) | ARS | | 450 | 26 |
| Bond | | | | | | Republic of Poland Government | | | | |
| Series 348 | | | | | | International Bond | | | | |
| 10.000% due 09/20/27 | JPY | | | 73,350 | 655 | Series 0421 | | | | |
| Malaysia Government International Bond | | | | | | 2.000% due 04/25/21 | PLN | | 1,070 | 305 |
| Series 0111 | | | | | | Series 1020 | | | | |
| 4.160% due 07/15/21 | MYR | | | 150 | 38 | 5.250% due 10/25/20 | PLN | | 920 | 288 |
| Series 0114 | | | | | | Series 1021 | | | | |
| 4.181% due 07/15/24 | MYR | | | 540 | 135 | 5.750% due 10/25/21 | PLN | | 1,050 | 340 |
| Series 0116 | | | | | | Series 1023 | | | | |
| 3.800% due 08/17/23 | MYR | | | 3,100 | 766 | 4.000% due 10/25/23 | PLN | | 840 | 257 |
| Series 0215 | | | | | | Russian Federal Bond - OFZ | | | | |
| 3.795% due 09/30/22 | MYR | | | 1,220 | 302 | Series 6207 | | | | |
| Series 0314 | | | | | | 8.150% due 02/03/27 | RUB | | 48,740 | 891 |
| 4.048% due 09/30/21 | MYR | | | 610 | 153 | Series 6219 | | | | |
| Series 0315 | | | | | | 7.750% due 09/16/26 | RUB | | 31,660 | 562 |
| 3.659% due 10/15/20 | MYR | | | 1,274 | 318 | Singapore Government International | | | | |
| Series 0414 | | | | | | Bond | | | | |
| 3.654% due 10/31/19 | MYR | | | 1,060 | 264 | 1.625% due 10/01/19 | SGD | | 90 | 67 |
See accompanying notes which are an integral part of the financial statements.
Strategic Bond Fund 101
Russell Investment Funds
Strategic Bond Fund
Schedule of Investments, continued — December 31, 2017
| | | | | | | | | |
| Amounts in thousands (except share amounts) | | Amounts in thousands (except share amounts) | | |
| | | Principal | Fair | | | Principal | | Fair |
| | | Amount ($) | Value | | Amount ($) | | Value |
| | | or Shares | $ | | | or Shares | | $ |
| 2.000% due 07/01/20 | SGD | | 350 | 264 | 2.125% due 11/30/24 | | 490 | | 483 |
| 2.250% due 06/01/21 | SGD | | 540 | 411 | 2.250% due 12/31/24 | | 1,510 | | 1,514 |
| 1.250% due 10/01/21 | SGD | | 250 | 184 | 2.000% due 08/15/25 | | 4,745 | | 4,625 |
| 3.125% due 09/01/22 | SGD | | 290 | 230 | 1.625% due 05/15/26 | | 3,000 | | 2,825 |
| 2.750% due 07/01/23 | SGD | | 470 | 368 | 2.250% due 02/15/27 | | 2,930 | | 2,891 |
| 3.000% due 09/01/24 | SGD | | 380 | 303 | 2.250% due 08/15/27 | | 8,940 | | 8,812 |
| 2.375% due 06/01/25 | SGD | | 400 | 307 | 1.625% due 11/15/27 | | 1,840 | | 1,737 |
| 2.125% due 06/01/26 | SGD | | 120 | 91 | 2.250% due 11/15/27 | | 8,475 | | 8,353 |
| 3.500% due 03/01/27 | SGD | | 340 | 286 | 5.250% due 02/15/29 | | 1,245 | | 1,585 |
| | | | | 32,885 | 6.250% due 05/15/30 | | 600 | | 843 |
| United States Government Treasuries - 28.4% | | 4.625% due 02/15/40 | | 1,185 | | 1,574 |
| United States Treasury Inflation Indexed | | | | | 2.750% due 08/15/42 | | 2,185 | | 2,198 |
| Bonds | | | | | 2.750% due 11/15/42 | | 2,210 | | 2,222 |
| 2.125% due 01/15/19 | | | 7,864 | 8,027 | 3.750% due 11/15/43 | | 60 | | 71 |
| 0.125% due 04/15/22 | | | 2,160 | 2,146 | 2.500% due 02/15/45 | | 5,300 | | 5,047 |
| 0.375% due 07/15/23 | | | 5,554 | 5,598 | 3.000% due 05/15/45 | | 815 | | 855 |
| 0.375% due 07/15/25 | | | 2,210 | 2,215 | 3.000% due 11/15/45 | | 2,725 | | 2,859 |
| 0.375% due 07/15/27 | | | 1,674 | 1,666 | 2.500% due 05/15/46 | | 1,200 | | 1,140 |
| 3.875% due 04/15/29 | | | 3,601 | 4,913 | 2.875% due 11/15/46 | | 685 | | 702 |
| 2.125% due 02/15/40 | | | 2,750 | 3,583 | 3.000% due 02/15/47 | | 5,720 | | 6,009 |
| 1.040% due 02/15/46 | | | 1,176 | 1,259 | 3.000% due 05/15/47 | | 1,900 | | 1,995 |
| United States Treasury Notes | | | | | 2.750% due 08/15/47 (§) | | 10,235 | | 10,236 |
| 1.000% due 03/15/19 | | | 10,000 | 9,899 | 2.250% due 11/15/47 | | 2,350 | | 2,117 |
| 1.500% due 03/31/19 | | | 1,125 | 1,120 | 2.750% due 11/15/47 | | 520 | | 520 |
| 0.875% due 04/15/19 | | | 1,300 | 1,284 | | | | | 257,311 |
| 1.625% due 06/30/19 | | | 9,400 | 9,367 | Total Long-Term Investments | | | | |
| 1.500% due 10/31/19 | | | 6,780 | 6,733 | | | | | |
| 1.250% due 02/29/20 | | | 10,053 | 9,915 | (cost $805,468) | | | | 808,842 |
| 3.500% due 05/15/20 | | | 1,415 | 1,467 | | | | | |
| 8.750% due 05/15/20 | | | 828 | 960 | | | | | |
| 2.625% due 08/15/20 | | | 1,360 | 1,384 | Options Purchased - 0.0% | | | | |
| 2.125% due 08/31/20 | | | 520 | 522 | (Number of Contracts) | | | | |
| 1.375% due 09/30/20 | | | 11,250 | 11,078 | EURIBOR 1 Year Mid- | | | | |
| 2.625% due 11/15/20 | | | 2,240 | 2,280 | Curve Options | | | | |
| 2.000% due 11/30/20 | | | 650 | 651 | Merrill Lynch Mar 2018 97.75 | | | | |
| 2.375% due 12/31/20 | | | 1,422 | 1,438 | Put (38) | USD | 9,286 | (ÿ) | 6 |
| 2.125% due 01/31/21 | | | 1,453 | 1,458 | Merrill Lynch Feb 2018 97.88 Put | | | | |
| 3.625% due 02/15/21 | | | 2,490 | 2,611 | (25) | USD | 6,117 | (ÿ) | 7 |
| 2.000% due 02/28/21 | | | 1,725 | 1,724 | Eurodollar Futures | | | | |
| 2.250% due 03/31/21 | | | 1,805 | 1,817 | Merrill Lynch Jan 2018 98.50 Call | | | | |
| 3.125% due 05/15/21 | | | 2,422 | 2,506 | (18) | USD | 4,433 | (ÿ) | — |
| 1.125% due 07/31/21 | | | 12,000 | 11,604 | Merrill Lynch Mar 2018 98.25 | | | | |
| 1.250% due 10/31/21 | | | 24,780 | 24,003 | Put (17) | USD | 4,176 | (ÿ) | 2 |
| 1.750% due 11/30/21 | | | 9,655 | 9,520 | United States 10 Year | | | | |
| 1.750% due 02/28/22 | | | 810 | 798 | Treasury Note Futures | | | | |
| 2.000% due 07/31/22 | | | 1,423 | 1,412 | Merrill Lynch Jan 2018 124.00 | | | | |
| 7.625% due 11/15/22 | | | 400 | 501 | Call (15) | USD | 1,860 | (ÿ) | 7 |
| 2.000% due 11/30/22 | | | 955 | 946 | Merrill Lynch Jan 2018 124.25 | | | | |
| 1.250% due 07/31/23 | | | 1,115 | 1,056 | Call (7) | USD | 870 | (ÿ) | 3 |
| 2.500% due 08/15/23 | | | 885 | 897 | Merrill Lynch Jan 2018 123.00 | | | | |
| 1.375% due 08/31/23 | | | 7,900 | 7,530 | Put (17) | USD | 2,091 | (ÿ) | 2 |
| 1.375% due 09/30/23 | | | 1,680 | 1,600 | Merrill Lynch Jan 2018 124.00 | | | | |
| 1.625% due 10/31/23 | | | 10,865 | 10,487 | Put (10) | USD | 1,240 | (ÿ) | 4 |
| 2.750% due 11/15/23 | | | 1,410 | 1,448 | United States 5 Year | | | | |
| 2.750% due 02/15/24 | | | 1,017 | 1,043 | Treasury Note Futures | | | | |
| | | | | | Merrill Lynch Jan 2018 116.50 | | | | |
| 2.125% due 02/29/24 | | | 12,225 | 12,101 | Call (31) | USD | 3,612 | (ÿ) | 4 |
| 2.500% due 05/15/24 | | | 1,155 | 1,168 | Merrill Lynch Jan 2018 116.75 | | | | |
| 2.250% due 10/31/24 | | | 2,375 | 2,363 | Call (27) | USD | 3,152 | (ÿ) | 2 |
See accompanying notes which are an integral part of the financial statements.
102 Strategic Bond Fund
Russell Investment Funds
Strategic Bond Fund
Schedule of Investments, continued — December 31, 2017
| | | | | | | | |
| Amounts in thousands (except share amounts) | | | Amounts in thousands (except share amounts) | |
| | | Principal | | Fair | | | Principal | Fair |
| | Amount ($) | | Value | | | Amount ($) | Value |
| | | or Shares | | $ | | | or Shares | $ |
| Merrill Lynch Jan 2018 115.50 | | | | | 1.790% due 11/16/18 | | 100 | 100 |
| Put (16) | USD | 1,848 | (ÿ) | 1 | | | | |
| United States Treasury | | | | | Citigroup, Inc. | | | |
| Bond Futures | | | | | 1.800% due 02/05/18 | | 1,030 | 1,030 |
| Merrill Lynch Jan 2018 151.00 | | | | | 2.150% due 07/30/18 | | 1,300 | 1,301 |
| Call (5) | USD | 755 | (ÿ) | 13 | Commercial Mortgage Trust | | | |
| Merrill Lynch Jan 2018 154.00 | | | | | Series 2013-CR13 Class A1 | | | |
| Call (10) | USD | 1,540 | (ÿ) | 8 | | | | |
| Merrill Lynch Jan 2018 151.00 | | | | | 1.259% due 11/10/18 | | 209 | 208 |
| Put (14) | USD | 2,114 | (ÿ) | 7 | Commonwealth Bank of Australia | | | |
| Merrill Lynch Jan 2018 152.00 | | | | | 1.282% due 03/23/18 (Ê)(Þ)(~) | | 1,000 | 1,001 |
| Put (7) | USD | 1,064 | (ÿ) | 6 | 1.374% due 07/09/18 (Ê)(~) | | 350 | 350 |
| Merrill Lynch Jan 2018 153.00 | | | | | Credit Suisse AG | | | |
| Put (54) | USD | 8,262 | (ÿ) | 68 | | | | |
| Total Options Purchased | | | | | 1.750% due 01/29/18 | | 755 | 755 |
| (cost $144) | | | | 140 | Daimler Finance NA LLC | | | |
| | | | | | 2.000% due 08/03/18 (Þ) | | 980 | 980 |
| Short-Term Investments - 14.2% | | | | | Danske Corp. | | | |
| | | | | | Series A | | | |
| Ally Financial, Inc. | | | | | 1.745% due 02/16/18 (ç)(Þ)(~) | | 595 | 594 |
| 3.250% due 11/05/18 | | 475 | | 476 | DZ Bank AG | | | |
| Anheuser-Busch InBev Worldwide, Inc. | | | | | 1.811% due 08/16/18 (Ê)(~) | | 765 | 765 |
| 1.638% due 03/05/18 (Þ)(~) | | 500 | | 498 | Energy Future Intermediate Holding Co. | | | |
| Antalis SA | | | | | LLC Term Loan | | | |
| 1.819% due 03/19/18 (~) | | 700 | | 697 | 4.501% due 06/28/18 (Ê) | | 9 | 9 |
| Apache Corp. | | | | | 4.569% due 06/28/18 (Ê) | | 241 | 242 |
| 6.900% due 09/15/18 | | 200 | | 206 | Eni Finance USA, Inc | | | |
| Assurant, Inc. | | | | | 0.834% due 01/09/18 (ç)(~) | | 1,000 | 1,000 |
| 2.500% due 03/15/18 | | 440 | | 441 | Fannie Mae | | | |
| AT&T, Inc. | | | | | 3.170% due 08/01/18 | | 1,141 | 1,131 |
| 2.372% due 11/27/18 (Ê) | | 300 | | 302 | Fannie Mae-Aces | | | |
| Bank of America NA | | | | | Series 2013-M4 Class ASQ2 | | | |
| Series BKNT | | | | | 1.451% due 02/25/18 | | 33 | 33 |
| 1.750% due 06/05/18 | | 915 | | 915 | Series 2015-M1 Class ASQ2 | | | |
| 2.050% due 12/07/18 | | 315 | | 315 | 1.626% due 02/25/18 | | 83 | 83 |
| Bank of Montreal | | | | | Federal Home Loan Bank Discount | | | |
| Series YCD | | | | | Notes | | | |
| 1.749% due 08/16/18 (Ê)(~) | | 1,150 | | 1,151 | 1.190% due 01/17/18 (ç)(~) | | 430 | 430 |
| Barclays Bank PLC | | | | | 1.169% due 01/22/18 (ç)(~) | | 570 | 570 |
| 1.017% due 02/12/18 (ç)(~) | | 1,200 | | 1,198 | 1.213% due 01/24/18 (ç)(~) | | 660 | 659 |
| Barton Capital SA | | | | | 1.108% due 01/26/18 (ç)(~) | | 600 | 600 |
| 1.392% due 01/08/18 (ç)(~) | | 1,100 | | 1,100 | 1.244% due 02/09/18 (ç)(~) | | 810 | 809 |
| BB&T Corp. | | | | | 1.297% due 02/13/18 (ç)(~) | | 1,290 | 1,288 |
| 2.050% due 06/19/18 | | 345 | | 345 | 1.308% due 02/22/18 (ç)(~) | | 720 | 719 |
| Bear Stearns Cos. LLC (The) | | | | | 1.303% due 02/28/18 (~) | | 630 | 629 |
| 7.250% due 02/01/18 | | 195 | | 196 | | | | |
| | | | | | 1.345% due 03/21/18 (~) | | 490 | 489 |
| Capital One NA | | | | | | | | |
| 2.350% due 08/17/18 | | 610 | | 611 | 1.397% due 04/25/18 (~) | | 1,690 | 1,683 |
| Series BKNT | | | | | 1.398% due 04/27/18 (~) | | 460 | 458 |
| 1.650% due 02/05/18 | | 520 | | 520 | Ford Motor Credit Co. LLC | | | |
| Chevron Corp. | | | | | 2.551% due 10/05/18 | | 860 | 863 |
| 1.919% due 05/16/18 (Ê) | | 155 | | 155 | Series FXD | | | |
| | | | | | 2.145% due 01/09/18 | | 1,355 | 1,355 |
See accompanying notes which are an integral part of the financial statements.
Strategic Bond Fund 103
Russell Investment Funds
Strategic Bond Fund
Schedule of Investments, continued — December 31, 2017
| | | | | | | | | |
| Amounts in thousands (except share amounts) | | Amounts in thousands (except share amounts) | | |
| | | Principal | Fair | | | Principal | | Fair |
| | | Amount ($) | Value | | | Amount ($) | | Value |
| | | or Shares | $ | | | or Shares | | $ |
| Freddie Mac | | | | | 6.850% due 07/15/18 (Þ) | | 260 | | 265 |
| 4.500% due 08/01/18 | | | 278 | 282 | Shell International Finance BV | | | | |
| GE Capital Treasury Services LLC | | | | | 1.990% due 11/10/18 (Ê) | | 1,000 | | 1,004 |
| 1.303% due 04/04/18 (Ê)(~) | | | 1,100 | 1,100 | Sky PLC | | | | |
| General Motors Co. | | | | | 6.100% due 02/15/18 (Þ) | | 515 | | 517 |
| 3.500% due 10/02/18 | | | 425 | 429 | Sprint Communications, Inc. | | | | |
| Gotham Funding Corp. | | | | | 9.000% due 11/15/18 (Þ) | | 19 | | 20 |
| 0.910% due 01/03/18 (ç)(~) | | | 500 | 500 | State Street Corp. | | | | |
| Harris Corp. | | | | | 4.956% due 03/15/18 | | 150 | | 151 |
| 1.999% due 04/27/18 | | | 235 | 235 | Teva Pharmaceutical Finance | | | | |
| HBOS PLC | | | | | Netherlands III BV | | | | |
| Series GMTN | | | | | 1.400% due 07/20/18 | | 30 | | 30 |
| 6.750% due 05/21/18 (Þ) | | | 300 | 305 | Toronto-Dominion Bank (The) | | | | |
| Hewlett Packard Enterprise Co. | | | | | 1.681% due 06/20/18 (Ê)(~) | | 800 | | 800 |
| 2.850% due 10/05/18 | | | 355 | 357 | Total Capital Canada, Ltd. | | | | |
| Huntington National Bank (The) | | | | | 1.450% due 01/15/18 | | 1,000 | | 1,000 |
| Series BKNT | | | | | Toyota Motor Credit Corp. | | | | |
| 2.200% due 11/06/18 | | | 465 | 465 | 1.825% due 12/24/18 (Ê) | | 2,095 | | 2,092 |
| JPMorgan Chase & Co. | | | | | U. S. Cash Management Fund(@) | | 57,315,857 | (8) | 57,316 |
| 6.000% due 01/15/18 | | | 100 | 100 | UBS AG | | | | |
| KeyCorp | | | | | Series BKNT | | | | |
| 2.300% due 12/13/18 | | | 460 | 461 | 1.800% due 03/26/18 | | 1,250 | | 1,250 |
| LMA-Americas LLC | | | | | United States Treasury Bills | | | | |
| 1.237% due 03/20/18 (~) | | | 900 | 896 | 0.982% due 01/11/18 (ç)(~) | | 2,101 | | 2,100 |
| Matchpoint Finance PLC | | | | | 1.256% due 03/01/18 (ç)(~) | | 2,020 | | 2,016 |
| 1.934% due 03/27/18 (~) | | | 600 | 597 | 1.394% due 04/12/18 (ç)(~) | | 2,195 | | 2,187 |
| McDonald's Corp. | | | | | 1.520% due 06/21/18 (ç)(~) | | 2,170 | | 2,155 |
| 2.100% due 12/07/18 | | | 470 | 470 | United States Treasury Cash | | | | |
| Merck & Co. , Inc. | | | | | Management Bills | | | | |
| 1.796% due 05/18/18 (Ê) | | | 1,665 | 1,666 | 1.060% due 01/02/18 (ç)(~) | | 300 | | 300 |
| Metropolitan Life Global Funding I | | | | | United States Treasury Notes | | | | |
| 1.875% due 06/22/18 (Þ) | | | 300 | 300 | 0.750% due 02/28/18 | | 3,100 | | 3,097 |
| 1.350% due 09/14/18 (Þ) | | | 1,475 | 1,469 | 0.875% due 03/31/18 | | 3,210 | | 3,206 |
| Mizuho Bank, Ltd. | | | | | 1.250% due 12/15/18 | | 1,875 | | 1,865 |
| 1.672% due 02/14/18 (ç)(Ê)(~) | | | 800 | 800 | UnitedHealth Group, Inc. | | | | |
| Old Line Funding LLC | | | | | 1.900% due 07/16/18 | | 560 | | 560 |
| 1.554% due 03/12/18 (Ê)(Þ)(~) | | | 750 | 750 | Victory Receivables Corp. | | | | |
| Pfizer, Inc. | | | | | 1.117% due 02/14/18 (ç)(~) | | 1,800 | | 1,797 |
| 1.889% due 06/15/18 (Ê) | | | 1,323 | 1,325 | Vodafone Group PLC | | | | |
| Pharmacia LLC | | | | | 2.126% due 09/04/18 (Þ)(~) | | 610 | | 601 |
| 6.500% due 12/01/18 | | | 240 | 250 | 2.165% due 10/04/18 (Þ)(~) | | 640 | | 630 |
| Province of Quebec Canada | | | | | Voya Financial, Inc. | | | | |
| Series MTN | | | | | 2.900% due 02/15/18 | | 208 | | 208 |
| 1.717% due 09/04/18 (Ê) | | | 335 | 335 | Westpac Banking Corp. | | | | |
| PSP Capital, Inc | | | | | 1.769% due 11/29/18 (Ê)(Þ)(~) | | 1,100 | | 1,100 |
| 1.462% due 11/07/18 (Ê)(Þ)(~) | | | 400 | 400 | Total Short-Term Investments | | | | |
| Republic of Argentina Government | | | | | | | | | |
| International Bond | | | | | (cost $129,036) | | | | 129,023 |
| 21.200% due 09/19/18 | ARS | | 90 | 5 | | | | | |
| Rockies Express Pipeline LLC | | | | | | | | | |
See accompanying notes which are an integral part of the financial statements.
104 Strategic Bond Fund
Russell Investment Funds
Strategic Bond Fund
Schedule of Investments, continued — December 31, 2017
| | |
| Amounts in thousands (except share amounts) | | |
| Principal | Fair | |
| Amount ($) | Value | |
| or Shares | $ | |
| Total Investments 103.4% | | |
| (identified cost $934,648) | 938,005 | |
| |
| Other Assets and Liabilities, | | |
| Net - (3.4%) | (30,638 | ) |
| |
| Net Assets - 100.0% | 907,367 | |
See accompanying notes which are an integral part of the financial statements.
Strategic Bond Fund 105
Russell Investment Funds
Strategic Bond Fund
Schedule of Investments, continued — December 31, 2017
| | | | | | | | | | | | |
| Restricted Securities | | | | | | | | | | | | |
| |
| Amounts in thousands (except share and cost per unit amounts) | | | | | | | | | | |
| |
| | | | | | Principal | | Cost per | | Cost | | Fair Value | |
| % of Net Assets | | Acquisition | | | Amount ($) | | Unit | | (000 | ) | (000 | ) |
| Securities | | Date | | | or shares | | $ | | $ | | $ | |
| 0.7% | | | | | | | | | | | | |
| BCAP LLC Trust | | 11/23/13 | | | 137,205 | | 103.90 | | 143 | | 139 | |
| CSMC Mortgage-Backed Trust | | 07/26/13 | | | 65,012 | | 97.57 | | 63 | | 65 | |
| Dryden 37 Senior Loan Fund | | 12/06/17 | | | 1,300,000 | | 100.00 | | 1,300 | | 1,300 | |
| FDIC Trust | | 06/08/12 | | | 264,387 | | 103.82 | | 274 | | 265 | |
| Hilton USA Trust | | 11/22/16 | | | 600,000 | | 81.43 | | 489 | | 547 | |
| Madison Park Funding XVIII, Ltd. | | 12/01/17 | | | 872,000 | | 100.80 | | 879 | | 879 | |
| One Market Plaza Trust | | 02/15/17 | | | 595,000 | | 97.62 | | 581 | | 585 | |
| THL Credit Wind River CLO, Ltd. | | 10/02/17 | | | 1,016,000 | | 100.00 | | 1,016 | | 1,025 | |
| Voya CLO, Ltd. | | 03/31/17 | | | 1,428,000 | | 100.07 | | 1,430 | | 1,438 | |
| | | | | | | | | | | | 6,243 | |
| For a description of restricted securities see note 7 in the Notes to Financial Statements. | | | | | | | |
See accompanying notes which are an integral part of the financial statements.
106 Strategic Bond Fund
Russell Investment Funds
Strategic Bond Fund
Schedule of Investments, continued — December 31, 2017
| | |
| Variable Rate Securities | | |
| |
| |
| Securities | Referenced Rate | Spread % |
| 1011778 B. C. Unlimited Liability Co. 1st Lien Term Loan B4 | USD 3 Month LIBOR | 2.250 |
| Aames Mortgage Investment Trust | USD 1 Month LIBOR | 1.305 |
| Access Group, Inc. | USD 3 Month LIBOR | 0.060 |
| ACE Securities Corp. Home Equity Loan Trust | USD 1 Month LIBOR | 0.675 |
| Air Medical Group Holdings, Inc. 1st Lien Term Loan B | USD 3 Month LIBOR | 3.250 |
| Air Medical Group Holdings, Inc. 1st Lien Term Loan B1 | USD 3 Month LIBOR | 4.000 |
| Albertson's LLC Term Loan B4 | USD 1 Month LIBOR | 2.750 |
| Albertson's LLC Term Loan B6 | USD 3 Month LIBOR | 3.000 |
| American Airlines, Inc. 2017 Term Loan | USD 1 Month LIBOR | 2.000 |
| American Airlines, Inc. Term Loan B | USD 1 Month LIBOR | 2.000 |
| American Axle & Manufacturing, Inc. 1st Lien Term Loan B | USD 3 Month LIBOR | 2.250 |
| American Builders & Contractors Supply Co. , Inc. Term Loan B | USD 1 Month LIBOR | 2.500 |
| American Home Mortgage Investment Trust | USD 6 Month LIBOR | 2.000 |
| American Honda Finance Corp. | USD 3 Month LIBOR | 0.340 |
| Ameriquest Mortgage Securities, Inc. Asset-Backed Pass-Through Certificates | USD 1 Month LIBOR | 1.110 |
| Apple, Inc. | USD 3 Month LIBOR | 0.820 |
| Apple, Inc. | USD 3 Month LIBOR | 0.300 |
| Aristocrat International Pty, Ltd. Term Loan B2 | USD 3 Month LIBOR | 2.000 |
| Asset-Backed Funding Trust Certificates | USD 1 Month LIBOR | 0.540 |
| AT&T, Inc. | USD 3 Month LIBOR | 0.910 |
| AT&T, Inc. | USD 3 Month LIBOR | 0.670 |
| Australia & New Zealand Banking Group, Ltd. | USD 3 Month LIBOR | 0.500 |
| Avolon LLC Term Loan B | USD 1 Month LIBOR | 2.250 |
| BAC Capital Trust XIV | USD 3 Month LIBOR | 0.400 |
| Bank of America Corp. | USD 3 Month LIBOR | 1.370 |
| Bank of America Corp. | USD 3 Month LIBOR | 0.790 |
| Bank of America Corp. | USD 3 Month LIBOR | 1.575 |
| Bank of America Corp. | USD 3 Month LIBOR | 1.040 |
| Bank of America Corp. | USD 3 Month LIBOR | 0.630 |
| Bank of America Corp. | USD 3 Month LIBOR | 3.898 |
| Bank of Montreal | USD 3 Month LIBOR | 0.330 |
| Bank of Nova Scotia (The) | USD 3 Month LIBOR | 0.660 |
| BankAmerica Capital III | USD 3 Month LIBOR | 0.570 |
| Barclays Commercial Mortgage Securities LLC | USD 1 Month LIBOR | 2.850 |
| Bayview Commercial Asset Trust | USD 1 Month LIBOR | 0.270 |
| | U. S. Treasury Yield Curve Rate T Note Constat | |
| Bear Stearns Adjustable Rate Mortgage Trust | Maturity 1 Year | 2.450 |
| Bear Stearns Alternative-A Trust | USD 1 Month LIBOR | 0.750 |
| Berry Plastics Group, Inc Term Loan M | USD 1 Month LIBOR | 2.250 |
| BMW US Capital LLC | USD 3 Month LIBOR | 0.380 |
| Boyd Gaming Corp. Term Loan B | USD 1 Week LIBOR | 2.500 |
| Caesars Resort Collection LLC 1st Lien Term Loan B | USD 1 Month LIBOR | 0.000 |
| Canadian Imperial Bank of Commerce | USD 3 Month LIBOR | 0.330 |
| Canadian Imperial Bank of Commerce | USD 3 Month LIBOR | 0.230 |
See accompanying notes which are an integral part of the financial statements.
Strategic Bond Fund 107
Russell Investment Funds
Strategic Bond Fund
Schedule of Investments, continued — December 31, 2017
| | |
| Variable Rate Securities | | |
| |
| |
| Securities | Referenced Rate | Spread % |
| Capital One Multi-Asset Execution Trust | USD 1 Month LIBOR | 0.380 |
| Carlyle Global Market Strategies CLO, Ltd. | USD 3 Month LIBOR | 1.470 |
| Catalent Pharma Solutions, Inc. Term Loan B | USD 1 Month LIBOR | 2.250 |
| CenturyLink, Inc. Term Loan B | U. S. Prime Rate | 2.750 |
| Change Healthcare Holdings LLC 1st Lien Term Loan B | USD 1 Month LIBOR | 2.750 |
| Chevron Corp. | USD 3 Month LIBOR | 0.500 |
| CHL Mortgage Pass-Through Trust | USD 1 Month LIBOR | 0.580 |
| CIT Mortgage Loan Trust | USD 1 Month LIBOR | 1.500 |
| Citigroup Mortgage Loan Trust, Inc. | USD 1 Month LIBOR | 0.250 |
| Citigroup Mortgage Loan Trust, Inc. | USD 1 Month LIBOR | 0.450 |
| Citigroup Mortgage Loan Trust, Inc. | USD 1 Month LIBOR | 0.340 |
| | U. S. Treasury Yield Curve Rate T Note Constant | |
| Citigroup Mortgage Loan Trust, Inc. | Maturity 1 Year | 2.400 |
| Citigroup, Inc. | USD 3 Month LIBOR | 3.905 |
| CityCenter Holdings, LLC Term Loan B | USD 1 Month LIBOR | 2.500 |
| Cold Storage Trust | USD 1 Month LIBOR | 2.100 |
| Commonwealth Bank of Australia | USD 1 Month LIBOR | 0.150 |
| Commonwealth Bank of Australia | USD 1 Month LIBOR | 0.300 |
| Countrywide Alternative Loan Trust | USD 1 Month LIBOR | 0.400 |
| Countrywide Asset-Backed Certificates | USD 1 Month LIBOR | 0.800 |
| Countrywide Asset-Backed Certificates | USD 1 Month LIBOR | 0.520 |
| | USD Swap Semiannual 30/360 (versus 3 Month | |
| Credit Suisse Group AG | LIBOR) 5 Year Rate | 3.455 |
| Credit Suisse Mortgage Capital Certificates | USD 1 Month LIBOR | 5.620 |
| CSC Holdings, LLC 1st Lien Term Loan | USD 1 Month LIBOR | 2.250 |
| CWGS Group LLC Term Loan | USD 1 Month LIBOR | 3.000 |
| Dell International LLC 1st Lien Term Loan A2 | USD 1 Month LIBOR | 1.750 |
| Dell International LLC 1st Lien Term Loan B | USD 1 Month LIBOR | 2.000 |
| Dryden 34 Senior Loan Fund | USD 3 Month LIBOR | 1.160 |
| Dryden 37 Senior Loan Fund | USD 3 Month LIBOR | 1.100 |
| Dryden 50 Senior Loan Fund | USD 3 Month LIBOR | 1.220 |
| DZ Bank AG | USD 3 Month LIBOR | 0.370 |
| Energy Future Intermediate Holding Co. LLC Term Loan | USD 1 Month LIBOR | 3.000 |
| Energy Transfer Partners LP | USD 3 Month LIBOR | 4.028 |
| EnLink Midstream Partners, LP | USD 3 Month LIBOR | 4.110 |
| Enterprise Products Operating LLC | USD 3 Month LIBOR | 2.680 |
| Enterprise Products Operating LLC | USD 3 Month LIBOR | 3.708 |
| Exxon Mobil Corp. | USD 3 Month LIBOR | 0.150 |
| Fannie Mae | USD 1 Month LIBOR | 4.250 |
| Fannie Mae | USD 1 Month LIBOR | 4.900 |
| Fannie Mae Connecticut Avenue Securities | USD 1 Month LIBOR | 1.300 |
| Fannie Mae REMICS | USD 1 Month LIBOR | 6.100 |
| Fannie Mae REMICS | USD 1 Month LIBOR | 6.150 |
| Fannie Mae REMICS | USD 1 Month LIBOR | 5.950 |
| Fannie Mae REMICS | USD 1 Month LIBOR | 6.000 |
See accompanying notes which are an integral part of the financial statements.
108 Strategic Bond Fund
Russell Investment Funds
Strategic Bond Fund
Schedule of Investments, continued — December 31, 2017
| | |
| Variable Rate Securities | | |
| |
| |
| Securities | Referenced Rate | Spread % |
| Fannie Mae REMICS | USD 1 Month LIBOR | 6.100 |
| Fannie Mae REMICS | USD 1 Month LIBOR | 6.500 |
| Fannie Mae REMICS | USD 1 Month LIBOR | 6.200 |
| Farmers Exchange Capital III | USD 3 Month LIBOR | 3.454 |
| FFMLT Trust | USD 1 Month LIBOR | 0.780 |
| Fieldstone Mortgage Investment Trust | USD 1 Month LIBOR | 1.950 |
| First Data Corp. 1st Lien Term Loan | USD 1 Month LIBOR | 2.250 |
| Ford Credit Auto Owner Trust | USD 1 Month LIBOR | 0.070 |
| Freddie Mac Multifamily Structured Pass-Through Certificates | USD 1 Month LIBOR | 0.670 |
| Freddie Mac Multifamily Structured Pass-Through Certificates | USD 1 Month LIBOR | 0.550 |
| Freddie Mac REMICS | USD 1 Month LIBOR | 6.490 |
| Freddie Mac Strips | USD 1 Month LIBOR | 6.000 |
| Freddie Mac Strips | USD 1 Month LIBOR | 6.100 |
| Freddie Mac Structured Agency Credit Risk Debt Notes | USD 1 Month LIBOR | 5.150 |
| Freddie Mac Structured Agency Credit Risk Debt Notes | USD 1 Month LIBOR | 4.150 |
| Freddie Mac Structured Agency Credit Risk Debt Notes | USD 1 Month LIBOR | 2.600 |
| Freddie Mac Structured Agency Credit Risk Debt Notes | USD 1 Month LIBOR | 1.200 |
| Freddie Mac Structured Agency Credit Risk Debt Notes | USD 1 Month LIBOR | 3.250 |
| GE Capital Treasury Services LLC | USD 1 Month LIBOR | 0.070 |
| General Electric Co. | USD 3 Month LIBOR | 0.800 |
| Ginnie Mae | USD 1 Month LIBOR | 6.150 |
| Ginnie Mae | USD 1 Month LIBOR | 6.050 |
| Golden Nugget, Inc. 1st Lien Term Loan | USD 2 Month LIBOR | 3.250 |
| Goldman Sachs Capital II | USD 3 Month LIBOR | 0.768 |
| Goldman Sachs Group, Inc. (The) | USD 3 Month LIBOR | 1.201 |
| Goldman Sachs Group, Inc. (The) | USD 3 Month LIBOR | 1.750 |
| Goldman Sachs Group, Inc. (The) | USD 3 Month LIBOR | 1.510 |
| Greenpoint Manufactured Housing Contract Trust | USD 1 Month LIBOR | 2.000 |
| GSAMP Trust | USD 1 Month LIBOR | 0.140 |
| HCA, Inc. Term Loan B8 | USD 1 Month LIBOR | 2.250 |
| Hilton Worldwide Finance LLC Term Loan B2 | USD 1 Month LIBOR | 2.000 |
| Home Equity Asset Trust | USD 1 Month LIBOR | 0.410 |
| Home Equity Asset Trust | USD 1 Month LIBOR | 0.280 |
| Home Equity Asset Trust | USD 1 Month LIBOR | 0.150 |
| HSBC Bank PLC | USD 6 Month LIBOR | 0.250 |
| HSBC Holdings PLC | USD 3 Month LIBOR | 1.546 |
| HSBC Holdings PLC | USD 3 Month LIBOR | 1.055 |
| HSI Asset Securitization Corp. Trust | USD 1 Month LIBOR | 0.140 |
| HSI Asset Securitization Corp. Trust | USD 1 Month LIBOR | 0.190 |
| Hyatt Hotel Portfolio Trust | USD 1 Month LIBOR | 1.056 |
| IBM Credit LLC | USD 3 Month LIBOR | 0.260 |
| IndyMac Mortgage Loan Trust | USD 1 Month LIBOR | 0.240 |
| International Business Machines Corp. | USD 3 Month LIBOR | 0.370 |
| Jaguar Holding Co. II Term Loan | USD 1 Month LIBOR | 2.750 |
See accompanying notes which are an integral part of the financial statements.
Strategic Bond Fund 109
Russell Investment Funds
Strategic Bond Fund
Schedule of Investments, continued — December 31, 2017
| | |
| Variable Rate Securities | | |
| |
| |
| Securities | Referenced Rate | Spread % |
| JPMorgan Chase & Co. | USD 3 Month LIBOR | 1.337 |
| JPMorgan Chase & Co. | USD 3 Month LIBOR | 0.550 |
| LCM XXII, Ltd. | USD 3 Month LIBOR | 1.480 |
| LCM XXV, Ltd. | USD 3 Month LIBOR | 1.210 |
| Level 3 Financing, Inc. Term Loan B | USD 3 Month LIBOR | 2.250 |
| Lions Gate Entertainment Corp. Term Loan B | USD 1 Month LIBOR | 2.250 |
| Lloyds Banking Group PLC | USD 3 Month LIBOR | 0.810 |
| Long Beach Mortgage Loan Trust | USD 1 Month LIBOR | 0.900 |
| Long Beach Mortgage Loan Trust | USD 1 Month LIBOR | 0.750 |
| MA Finance Co. LLC 1st Lien Term Loan B | USD 1 Month LIBOR | 2.750 |
| MacDermid, Inc. Term Loan B6 | USD 1 Month LIBOR | 3.000 |
| Madison Park Funding XVIII, Ltd. | USD 3 Month LIBOR | 1.190 |
| Madison Park Funding XXVI, Ltd. | USD 3 Month LIBOR | 1.200 |
| Magnetite XVIII, Ltd. | USD 3 Month LIBOR | 1.400 |
| Master Asset-Backed Securities Trust | USD 1 Month LIBOR | 0.945 |
| Merck & Co. , Inc. | USD 3 Month LIBOR | 0.360 |
| Merrill Lynch Mortgage Investors Trust | USD 1 Month LIBOR | 0.370 |
| MGM Growth Properties Operating Partnership, LP Term Loan B | USD 1 Month LIBOR | 2.250 |
| Michaels Stores, Inc. Term Loan B1 | USD 1 Month LIBOR | 2.750 |
| Mizuho Bank, Ltd. | USD 3 Month LIBOR | 0.400 |
| Mizuho Bank, Ltd. | USD 1 Month LIBOR | 0.200 |
| Morgan Stanley | USD 3 Month LIBOR | 1.400 |
| Morgan Stanley | USD 3 Month LIBOR | 1.340 |
| MultiPlan, Inc. Term Loan B | USD 3 Month LIBOR | 3.000 |
| Mutual of Omaha Insurance Co. | USD 3 Month LIBOR | 2.640 |
| National Australia Bank, Ltd. | USD 3 Month LIBOR | 0.280 |
| National Australia Bank, Ltd. | USD 3 Month LIBOR | 0.510 |
| National Bank of Canada | USD 3 Month LIBOR | 0.200 |
| Nelnet Student Loan Trust | USD 3 Month LIBOR | 1.650 |
| New Century Home Equity Loan Trust | USD 1 Month LIBOR | 0.480 |
| New York Life Global Funding | USD 3 Month LIBOR | 0.120 |
| Nomura Resecuritization Trust | USD 1 Month LIBOR | 0.190 |
| Nordea Bank AB | USD 3 Month LIBOR | 0.470 |
| Nordea Bank AB | USD 3 Month LIBOR | 0.380 |
| Numericable Group SA Term Loan B12 | USD 3 Month LIBOR | 3.000 |
| Old Line Funding LLC | USD 1 Month LIBOR | 0.110 |
| Option One Mortgage Loan Trust | USD 1 Month LIBOR | 0.780 |
| Pacific Life Insurance Co. | USD 3 Month LIBOR | 2.796 |
| Park Place Securities, Inc. Asset-Backed Pass-Through Certificates | USD 1 Month LIBOR | 0.945 |
| Park Place Securities, Inc. Asset-Backed Pass-Through Certificates | USD 1 Month LIBOR | 1.125 |
| Party City Holdings, Inc. Term Loan | USD 3 Month LIBOR | 3.000 |
| Petco Animal Supplies, Inc. 1st Lien Term Loan B1 | USD 3 Month LIBOR | 3.000 |
| PetSmart, Inc. Term Loan B2 | USD 1 Month LIBOR | 3.000 |
| Pfizer, Inc. | USD 3 Month LIBOR | 0.300 |
See accompanying notes which are an integral part of the financial statements.
110 Strategic Bond Fund
Russell Investment Funds
Strategic Bond Fund
Schedule of Investments, continued — December 31, 2017
| | |
| Variable Rate Securities | | |
| |
| |
| Securities | Referenced Rate | Spread % |
| Popular ABS Mortgage Pass-Through Trust | USD 1 Month LIBOR | 0.260 |
| Popular ABS Mortgage Pass-Through Trust | USD 1 Month LIBOR | 0.250 |
| Post Holdings, Inc. Incremental Term Loan | USD 1 Month LIBOR | 2.250 |
| Prime Security Services Borrower LLC Term Loan B1 | USD 1 Month LIBOR | 2.750 |
| Procter & Gamble Co. (The) | USD 3 Month LIBOR | 0.270 |
| Province of Quebec Canada | USD 3 Month LIBOR | 0.230 |
| Province of Quebec Canada | USD 3 Month LIBOR | 0.280 |
| PSP Capital, Inc | USD 3 Month LIBOR | 0.070 |
| Quikrete Holdings, Inc. 1st Lien Term Loan B | USD 1 Month LIBOR | 2.750 |
| RAMP Trust | USD 1 Month LIBOR | 0.570 |
| Reckitt Benckiser Treasury Services PLC | USD 3 Month LIBOR | 0.560 |
| Republic of Argentina Government International Bond | Argentina Central Bank 7-Day Repo Reference Rate | 0.000 |
| | Federal Reserve U. S. 12 Month Cumulative Avg 1 | |
| Residential Accredit Loans, Inc. | Year CMT | 0.850 |
| Residential Asset Mortgage Products, Inc. Trust | USD 1 Month LIBOR | 0.480 |
| Residential Asset Securitization Trust | USD 1 Month LIBOR | 0.450 |
| Reynolds Group Holdings, Inc. 1st Lien Term Loan B | USD 1 Month LIBOR | 2.750 |
| RPI Finance Trust Term Loan B | USD 3 Month LIBOR | 2.000 |
| Santander UK Group Holdings PLC | USD 3 Month LIBOR | 1.400 |
| Scientific Games International, Inc. 1st Lien Term Loan B4 | USD 2 Month LIBOR | 3.250 |
| Seattle SpinCo, Inc. Term Loan B3 | USD 1 Month LIBOR | 2.750 |
| Shell International Finance BV | USD 3 Month LIBOR | 0.580 |
| SLM Private Credit Student Loan Trust | USD 3 Month LIBOR | 0.290 |
| SLM Private Credit Student Loan Trust | USD 3 Month LIBOR | 0.330 |
| SLM Student Loan Trust | USD 1 Month LIBOR | 0.400 |
| SLM Student Loan Trust | USD 3 Month LIBOR | 1.100 |
| Sprint Communications, Inc. 1st Lien Term Loan B | USD 1 Month LIBOR | 2.500 |
| Staples, Inc. 1st Lien Term Loan | USD 3 Month LIBOR | 4.000 |
| Structured Asset Investment Loan Trust | USD 1 Month LIBOR | 0.720 |
| Sumitomo Mitsui Banking Corp. | USD 3 Month LIBOR | 0.460 |
| SunGard Availability Services Capital, Inc. Term Loan B | USD 1 Month LIBOR | 7.000 |
| Svenska Handelsbanken AB | USD 3 Month LIBOR | 0.280 |
| THL Credit Wind River CLO, Ltd. | USD 3 Month LIBOR | 1.230 |
| Toronto-Dominion Bank (The) | USD 3 Month LIBOR | 0.840 |
| Toronto-Dominion Bank (The) | USD 1 Month LIBOR | 0.180 |
| Toyota Motor Credit Corp. | USD 3 Month LIBOR | 0.260 |
| Toyota Motor Credit Corp. | USD 3 Month LIBOR | 0.150 |
| Trans Union LLC 1st Lien Term Loan B3 | USD 1 Month LIBOR | 2.000 |
| Univision Communications, Inc. Term Loan C5 | USD 1 Month LIBOR | 2.750 |
| UPC Financing Partnership 1st Lien Term Loan AR | USD 1 Month LIBOR | 2.500 |
| US Bancorp | USD 3 Month LIBOR | 0.400 |
| US Bank NA | USD 3 Month LIBOR | 0.140 |
| Viacom, Inc. | USD 3 Month LIBOR | 3.899 |
| Voya CLO, Ltd. | USD 3 Month LIBOR | 1.250 |
See accompanying notes which are an integral part of the financial statements.
Strategic Bond Fund 111
Russell Investment Funds
Strategic Bond Fund
Schedule of Investments, continued — December 31, 2017
| | | | | | | |
| Variable Rate Securities | | | | | | | |
| |
| |
| |
| Securities | | | Referenced Rate | Spread % | |
| Wachovia Capital Trust II | | | USD 3 Month LIBOR | 0.500 | |
| Walt Disney Co. (The) | | | USD 3 Month LIBOR | 0.190 | |
| | | | Federal Reserve U. S. 12 Month Cumulative Avg 1 | | |
| Washington Mutual Mortgage Pass-Through Certificates Trust | | | Year CMT | 1.070 | |
| Washington Mutual Mortgage Pass-Through Certificates Trust | | | USD 1 Month LIBOR | 0.320 | |
| Washington Mutual Mortgage Pass-Through Certificates Trust | | | USD 1 Month LIBOR | 0.640 | |
| Wells Fargo & Co. | | | USD 3 Month LIBOR | 1.340 | |
| Wells Fargo & Co. | | | USD 3 Month LIBOR | 1.230 | |
| Wells Fargo Home Equity Asset-Backed Securities Trust | | | USD 1 Month LIBOR | 0.885 | |
| Westpac Banking Corp. | | | USD 1 Month LIBOR | 0.200 | |
| XPO Logistics, Inc. Term Loan B | | | USD 3 Month LIBOR | 2.250 | |
| Zebra Technologies Corp. Term Loan B | | | USD 3 Month LIBOR | 2.000 | |
| Ziggo Secured Finance Partnership 1st Lien Term Loan E | | | USD 1 Month LIBOR | 2.500 | |
| A | | | | | | | |
| For a description of variable, adjustable or floating rate securities see note 2 in the Notes to Financial Statements. | | |
| |
| Futures Contracts | | | | | | | |
| |
| Amounts in thousands (except contract amounts) | | | | | | | |
| | | | | | | Value and | |
| | | | | | | Unrealized | |
| | | | | | | Appreciation | |
| | | Number of | Notional | Expiration | (Depreciation) | |
| | | Contracts | Amount | Date | $ | |
| Long Positions | | | | | | | |
| Australia 10 Year Bond Futures | | 455 | AUD | 58,766 | 03/18 | (383 | ) |
| Euro-BTP Futures | | 60 | EUR | 8,169 | 03/18 | (226 | ) |
| Euro-Bund Futures | | 6 | EUR | 5 | 01/18 | 1 | |
| Euro-Bund Futures | | 39 | EUR | 6,306 | 03/18 | (67 | ) |
| United States 10 Year Treasury Note Futures | | 871 | USD | 108,044 | 03/18 | (608 | ) |
| United States 10 Year Ultra Treasury Bond Futures | | 17 | USD | 2,271 | 03/18 | (6 | ) |
| United States 2 Year Treasury Note Futures | | 169 | USD | 36,185 | 03/18 | (65 | ) |
| United States 5 Year Treasury Note Futures | | 960 | USD | 111,517 | 03/18 | (407 | ) |
| United States Long Bond Futures | | 157 | USD | 24,021 | 03/18 | (4 | ) |
| United States Ultra Treasury Bond Futures | | 147 | USD | 24,646 | 03/18 | 185 | |
| Short Positions | | | | | | | |
| Euro-Bobl Futures | | 35 | EUR | 4,606 | 03/18 | 35 | |
| Euro-Bund Futures | | 4 | EUR | 1 | 01/18 | — | |
| Euro-Bund Futures | | 264 | EUR | 42,683 | 03/18 | 386 | |
| Eurodollar Futures | | 136 | USD | 33,023 | 03/18 | 39 | |
| Eurodollar Futures | | 76 | USD | 18,634 | 06/18 | 21 | |
| Eurodollar Futures | | 12 | USD | 2,939 | 09/18 | 13 | |
| Eurodollar Futures | | 39 | USD | 9,541 | 12/18 | 11 | |
| Eurodollar Futures | | 30 | USD | 7,325 | 12/19 | (6 | ) |
| Euro-OAT Futures | | 17 | EUR | 2,638 | 03/18 | 34 | |
| Euro-Schatz Futures | | 514 | EUR | 57,556 | 03/18 | 96 | |
| Japan Government 10 Year Bond Futures | | 4 | JPY | 603,121 | 03/18 | 6 | |
| Long Gilt Futures | | 279 | GBP | 34,919 | 03/18 | (275 | ) |
| United States 10 Year Treasury Note Futures | | 61 | USD | 7,567 | 03/18 | 50 | |
| United States 10 Year Ultra Treasury Bond Futures | | 25 | USD | 3,340 | 03/18 | 3 | |
| United States 2 Year Treasury Note Futures | | 85 | USD | 18,199 | 03/18 | 29 | |
| United States 5 Year Treasury Note Futures | | 1 | USD | 116 | 03/18 | 1 | |
| United States Long Bond Futures | | 48 | USD | 7,344 | 03/18 | (1 | ) |
See accompanying notes which are an integral part of the financial statements.
112 Strategic Bond Fund
Russell Investment Funds
Strategic Bond Fund
Schedule of Investments, continued — December 31, 2017
| | | | | | | | | | | |
| Futures Contracts | | | | | | | | | | | |
| |
| Amounts in thousands (except contract amounts) | | | | | | | | | |
| |
| Total Value and Unrealized Appreciation (Depreciation) on Open Futures Contracts (å) | | | | | | | (1,138 | ) |
| |
| Options Written | | | | | | | | | | | |
| Amounts in thousands (except contract amounts) | | | | | | | | | |
| | | | Number of | | Strike | Notional | Expiration | Fair Value | |
| Description | Counterparty | Call/Put | Contracts | | Price | Amount | Date | $ | |
| EURIBOR 1 Year Mid-Curve Options | Merrill Lynch | Put | 2 | | 97.75 | USD | 489 | 01/12/18 | — | |
| EURIBOR 1 Year Mid-Curve Options | Merrill Lynch | Put | 25 | | 97.75 | USD | 6,109 | 02/16/18 | (3 | ) |
| United States 10 Year Treasury Note | | | | | | | | | | | |
| Futures | Merrill Lynch | Call | 15 | | 125.50 | USD | 1,883 | 01/26/18 | (1 | ) |
| United States 10 Year Treasury Note | | | | | | | | | | | |
| Futures | Merrill Lynch | Call | 8 | | 126.50 | USD | 1,012 | 01/26/18 | — | |
| United States 10 Year Treasury Note | | | | | | | | | | | |
| Futures | Merrill Lynch | Call | 14 | | 126.00 | USD | 1,764 | 02/23/18 | (2 | ) |
| United States 10 Year Treasury Note | | | | | | | | | | | |
| Futures | Merrill Lynch | Call | 15 | | 126.50 | USD | 1,898 | 02/23/18 | (1 | ) |
| United States 10 Year Treasury Note | | | | | | | | | | | |
| Futures | Merrill Lynch | Put | 8 | | 122.50 | USD | 980 | 01/26/18 | (1 | ) |
| United States 10 Year Treasury Note | | | | | | | | | | | |
| Futures | Merrill Lynch | Put | 15 | | 122.00 | USD | 1,830 | 02/23/18 | (2 | ) |
| United States 5 Year Treasury Note | | | | | | | | | | | |
| Futures | Merrill Lynch | Call | 32 | | 117.75 | USD | 3,768 | 02/23/18 | (2 | ) |
| United States 5 Year Treasury Note | | | | | | | | | | | |
| Futures | Merrill Lynch | Call | 16 | | 118.50 | USD | 1,896 | 02/23/18 | — | |
| United States 5 Year Treasury Note | | | | | | | | | | | |
| Futures | Merrill Lynch | Put | 15 | | 115.75 | USD | 1,736 | 01/26/18 | (1 | ) |
| United States 5 Year Treasury Note | | | | | | | | | | | |
| Futures | Merrill Lynch | Put | 8 | | 116.00 | USD | 928 | 01/26/18 | (1 | ) |
| United States 5 Year Treasury Note | | | | | | | | | | | |
| Futures | Merrill Lynch | Put | 16 | | 115.50 | USD | 1,848 | 02/23/18 | (2 | ) |
| United States Treasury Bond Futures | Merrill Lynch | Call | 10 | | 153.00 | USD | 1,530 | 01/26/18 | (14 | ) |
| United States Treasury Bond Futures | Merrill Lynch | Call | 8 | | 158.00 | USD | 1,264 | 02/23/18 | (3 | ) |
| United States Treasury Bond Futures | Merrill Lynch | Put | 3 | | 148.00 | USD | 444 | 01/26/18 | — | |
| United States Treasury Bond Futures | Merrill Lynch | Put | 9 | | 149.00 | USD | 1,341 | 01/26/18 | (2 | ) |
| Total Liability for Options Written (premiums received $44) | | | | | | | | | (35 | ) |
| |
| Foreign Currency Exchange Contracts | | | | | | | | | | |
| Amounts in thousands | | | | | | | | | | | |
| | | | | | | | | | | Unrealized | |
| | | | | | | | | | | Appreciation | |
| | | | Amount | | | Amount | | | (Depreciation) | |
| Counterparty | | | Sold | | | Bought | Settlement Date | $ | |
| Bank of America | | | USD | 17 | | CZK | 374 | 02/26/18 | — | |
| Bank of America | | | USD | 3,515 | | CZK | 75,782 | 02/26/18 | 53 | |
| Bank of America | | | USD | 35 | | HUF | 9,158 | 02/26/18 | 1 | |
| Bank of America | | | USD | 3,498 | | HUF | 924,334 | 02/26/18 | 81 | |
| Bank of America | | | USD | 11 | MXN | 211 | 02/26/18 | — | |
| Bank of America | | | USD | 1,515 | MXN | 29,461 | 02/26/18 | (31 | ) |
| Bank of America | | | USD | 3,495 | | PLN | 12,562 | 02/26/18 | 114 | |
| Bank of America | | | USD | 1,497 | | TRY | 5,957 | 02/26/18 | 49 | |
| Bank of America | | | USD | 3,369 | | TRY | 13,404 | 02/26/18 | 110 | |
| Bank of America | | | USD | 1,539 | | ZAR | 22,299 | 02/26/18 | 249 | |
| Bank of America | | | USD | 3,462 | | ZAR | 50,172 | 02/26/18 | 561 | |
| Bank of America | | | CZK | 166 | | USD | 8 | 02/26/18 | — | |
| Bank of America | | | CZK | 33,681 | | USD | 1,562 | 02/26/18 | (24 | ) |
| Bank of America | | HKD | 127 | | USD | 16 | 02/26/18 | — | |
| Bank of America | | HKD | 11,989 | | USD | 1,538 | 02/26/18 | 2 | |
| Bank of America | | | HUF | 4,070 | | USD | 15 | 02/26/18 | — | |
See accompanying notes which are an integral part of the financial statements.
Strategic Bond Fund 113
Russell Investment Funds
Strategic Bond Fund
Schedule of Investments, continued — December 31, 2017
| | | | | | | |
| Foreign Currency Exchange Contracts | | | | | | | |
| Amounts in thousands | | | | | | | |
| | | | | | | Unrealized | |
| | | | | | | Appreciation | |
| | | Amount | | Amount | | (Depreciation) | |
| Counterparty | | Sold | | Bought | Settlement Date | $ | |
| Bank of America | HUF | 410,815 | USD | 1,555 | 02/26/18 | (36 | ) |
| Bank of America | JPY | 389,992 | SEK | 28,500 | 01/31/18 | 14 | |
| Bank of America | PLN | 41 | USD | 11 | 02/26/18 | — | |
| Bank of America | SGD | 4 | USD | 3 | 02/26/18 | — | |
| Bank of America | SGD | 2,093 | USD | 1,544 | 02/26/18 | (22 | ) |
| Bank of America | TRY | 15 | USD | 4 | 02/26/18 | — | |
| Bank of America | TRY | 35 | USD | 9 | 02/26/18 | — | |
| Bank of America | ZAR | 1,377 | USD | 103 | 02/26/18 | (7 | ) |
| Bank of America | ZAR | 3,097 | USD | 232 | 02/26/18 | (17 | ) |
| Bank of Montreal | USD | 2,932 | EUR | 2,476 | 01/23/18 | 42 | |
| Bank of Montreal | USD | 4,561 | EUR | 3,851 | 01/23/18 | 64 | |
| Bank of Montreal | CHF | 1,280 | USD | 1,303 | 01/23/18 | (12 | ) |
| Bank of Montreal | CHF | 2,879 | USD | 2,932 | 01/23/18 | (27 | ) |
| Barclays | USD | 1,164 | CAD | 1,450 | 01/19/18 | (10 | ) |
| Barclays | USD | 360 | GBP | 270 | 01/19/18 | 5 | |
| Barclays | USD | 1,130 | INR | 74,500 | 01/19/18 | 36 | |
| Barclays | USD | 361 | JPY | 40,650 | 01/19/18 | — | |
| Barclays | EUR | 788 | USD | 939 | 01/19/18 | (7 | ) |
| Citigroup | USD | 324 | BRL | 1,040 | 01/19/18 | (11 | ) |
| Citigroup | USD | 9,053 | GBP | 6,777 | 01/23/18 | 104 | |
| Citigroup | USD | 834 | JPY | 94,530 | 01/19/18 | 6 | |
| Citigroup | USD | 1,139 | JPY | 128,470 | 01/19/18 | 2 | |
| Citigroup | USD | 2,591 | NZD | 3,699 | 01/23/18 | 30 | |
| Citigroup | CNY | 15,140 | USD | 2,285 | 01/19/18 | (39 | ) |
| Citigroup | JPY | 263,648 | USD | 2,360 | 01/19/18 | 18 | |
| Citigroup | NZD | 12,947 | USD | 9,069 | 01/23/18 | (104 | ) |
| Citigroup | SEK | 21,874 | USD | 2,609 | 01/23/18 | (60 | ) |
| Commonwealth Bank of Australia | USD | 2,933 | EUR | 2,476 | 01/23/18 | 40 | |
| Commonwealth Bank of Australia | USD | 4,563 | EUR | 3,851 | 01/23/18 | 63 | |
| Commonwealth Bank of Australia | CHF | 1,280 | USD | 1,304 | 01/23/18 | (11 | ) |
| Commonwealth Bank of Australia | CHF | 2,879 | USD | 2,933 | 01/23/18 | (25 | ) |
| Goldman Sachs | USD | 496 | SEK | 4,194 | 01/18/18 | 16 | |
| HSBC | USD | 552 | INR | 35,700 | 01/18/18 | 7 | |
| JPMorgan Chase | USD | 1,528 | CAD | 1,957 | 02/08/18 | 29 | |
| JPMorgan Chase | USD | 1,212 | CLP | 769,726 | 01/10/18 | 39 | |
| JPMorgan Chase | USD | 2,798 | GBP | 2,092 | 02/13/18 | 30 | |
| JPMorgan Chase | USD | 1,276 | MXN | 24,311 | 01/19/18 | (43 | ) |
| JPMorgan Chase | USD | 1,445 | NOK | 11,734 | 02/08/18 | (15 | ) |
| JPMorgan Chase | USD | 184 | PLN | 669 | 02/08/18 | 8 | |
| JPMorgan Chase | USD | 3,249 | SEK | 27,113 | 02/08/18 | 63 | |
| JPMorgan Chase | USD | 36 | ZAR | 512 | 02/08/18 | 5 | |
| JPMorgan Chase | USD | 138 | ZAR | 2,009 | 02/08/18 | 24 | |
| JPMorgan Chase | USD | 406 | ZAR | 5,769 | 02/08/18 | 58 | |
| JPMorgan Chase | AUD | 7,388 | USD | 5,556 | 02/13/18 | (208 | ) |
| JPMorgan Chase | BRL | 8,639 | USD | 2,634 | 01/10/18 | 32 | |
| JPMorgan Chase | CHF | 2,069 | USD | 2,085 | 02/08/18 | (43 | ) |
| JPMorgan Chase | COP | 2,620,180 | USD | 873 | 01/10/18 | (5 | ) |
| JPMorgan Chase | CZK | 1,853 | USD | 85 | 02/08/18 | (3 | ) |
| JPMorgan Chase | EUR | 3,413 | USD | 4,041 | 02/13/18 | (64 | ) |
| JPMorgan Chase | HKD | 524 | USD | 67 | 02/08/18 | — | |
| JPMorgan Chase | HUF | 323,200 | USD | 1,217 | 02/08/18 | (33 | ) |
| JPMorgan Chase | IDR | 25,423,879 | USD | 1,874 | 01/10/18 | (5 | ) |
| JPMorgan Chase | JPY | 84,689 | USD | 754 | 02/13/18 | 1 | |
See accompanying notes which are an integral part of the financial statements.
114 Strategic Bond Fund
Russell Investment Funds
Strategic Bond Fund
Schedule of Investments, continued — December 31, 2017
| | | | | | | | | | | | | | | | | | |
| Foreign Currency Exchange Contracts | | | | | | | | | | | | | | |
| Amounts in thousands | | | | | | | | | | | | | | | | | | |
| | | | | | | | | | | | | | | | | | Unrealized | |
| | | | | | | | | | | | | | | | | | Appreciation | |
| | | | | | | | | Amount | | | | Amount | | | | | (Depreciation) | |
| Counterparty | | | | | | | Sold | | | | Bought | Settlement Date | | $ | |
| JPMorgan Chase | | | | MXN | 14,914 | | | USD | 771 | 02/08/18 | | 17 | |
| JPMorgan Chase | | | | | | NZD | 10,274 | | | USD | 7,013 | 02/13/18 | | (266 | ) |
| JPMorgan Chase | | | | | | PEN | 10,383 | | | USD | 3,192 | 01/10/18 | | (9 | ) |
| JPMorgan Chase | | | | | | PHP | 66,059 | | | USD | 1,300 | 01/10/18 | | (23 | ) |
| JPMorgan Chase | | �� | | | | SGD | 3,373 | | | USD | 2,483 | 02/08/18 | | (40 | ) |
| JPMorgan Chase | | | | | | THB | 67,306 | | | USD | 2,058 | 01/10/18 | | (7 | ) |
| JPMorgan Chase | | | | | | ZAR | 8,290 | | | USD | 583 | 02/08/18 | | (83 | ) |
| State Street | | | | | | USD | 2,608 | | | AUD | 3,399 | 01/23/18 | | 44 | |
| State Street | | | | | | USD | 21 | | | BRL | 70 | 02/26/18 | | — | |
| State Street | | | | | | USD | 1,527 | | | BRL | 5,051 | 02/26/18 | | (13 | ) |
| State Street | | | | | | USD | 9,148 | | | ILS | 32,020 | 01/23/18 | | 61 | |
| State Street | | | | | | USD | 5,874 | | | JPY | 658,079 | 01/23/18 | | (28 | ) |
| State Street | | | | | | USD | 5 | | | RUB | 315 | 02/26/18 | | — | |
| State Street | | | | | | USD | 1,504 | | | RUB | 91,365 | 02/26/18 | | 67 | |
| State Street | | | | | | AUD | 11,896 | | | USD | 9,128 | 01/23/18 | | (154 | ) |
| State Street | | | | | | BRL | 157 | | | USD | 47 | 02/26/18 | | — | |
| State Street | | | | | | BRL | 11,365 | | | USD | 3,436 | 02/26/18 | | 30 | |
| State Street | | | | | | CLP | 75,484 | | | USD | 118 | 02/26/18 | | (4 | ) |
| State Street | | | | | | CLP | 2,183,403 | | | USD | 3,441 | 02/26/18 | | (106 | ) |
| State Street | | | | | | DKK | 16,379 | | | USD | 2,612 | 01/23/18 | | (31 | ) |
| State Street | | | | | | IDR | 606,148 | | | USD | 44 | 02/26/18 | | — | |
| State Street | | | | | | IDR | 46,854,507 | | | USD | 3,416 | 02/26/18 | | (36 | ) |
| State Street | | | | | | ILS | 20,584 | | | USD | 5,881 | 01/23/18 | | (39 | ) |
| State Street | | | | | | JPY | 1,023,678 | | | USD | 9,137 | 01/23/18 | | 43 | |
| State Street | | | | | | PEN | 83 | | | USD | 25 | 02/26/18 | | — | |
| State Street | | | | | | PEN | 11,208 | | | USD | 3,425 | 02/26/18 | | (23 | ) |
| State Street | | | | | | RUB | 140 | | | USD | 2 | 02/26/18 | | — | |
| State Street | | | | | | RUB | 205,572 | | | USD | 3,384 | 02/26/18 | | (152 | ) |
| State Street | | | | TWD | 231 | | | USD | 8 | 02/26/18 | | — | |
| State Street | | | | TWD | 46,380 | | | USD | 1,548 | 02/26/18 | | (25 | ) |
| Westpac | | | | | | USD | 5,859 | | | GBP | 4,357 | 01/23/18 | | 27 | |
| Westpac | | | | | | NOK | 48,744 | | | USD | 5,869 | 01/23/18 | | (71 | ) |
| Total Unrealized Appreciation (Depreciation) on Open Foreign Currency Exchange Contracts | | | | | | | | | 273 | |
| |
| Interest Rate Swap Contracts | | | | | | | | | | | | | | | | |
| |
| Amounts in thousands | | | | | | | | | | | | | | | | | | |
| | | | | | | | | | | | | | Premiums | | Unrealized | | | |
| | | | | | | | | | | | | | Paid | | Appreciation | | | |
| | | | | | | | | | | | | Termination | (Received) | | (Depreciation) | | Fair Value | |
| Counterparty | Notional Amount | | Fund Receives | | Fund Pays | | | Date | $ | | $ | | $ | |
| JPMorgan Chase | DKK | 4,200 | | Six Month CIBOR(3) | 0.510%(4) | | | 05/05/25 | — | | 9 | | 9 | |
| JPMorgan Chase | DKK | 10,470 | | Six Month CIBOR(3) | 0.943%(4) | | | 05/05/25 | — | | (34 | ) | (34 | ) |
| JPMorgan Chase | CZK | 15,850 | | Six Month PRIBOR(3) | 0.495%(4) | | | 06/19/25 | — | | 64 | | 64 | |
| JPMorgan Chase | CZK | 36,930 | | Six Month PRIBOR(3) | 1.280%(4) | | | 06/19/25 | — | | 46 | | 46 | |
| Merrill Lynch | USD | 3,744 | | 2.250%(3) | Three Month LIBOR(2) | | | 05/31/22 | 7 | | (10 | ) | (3 | ) |
| Merrill Lynch | USD | 580 | | Three Month LIBOR(2) | 2.630%(3) | | | 11/15/43 | (3 | ) | (4 | ) | (7 | ) |
| Merrill Lynch | USD | 5,490 | | Three Month LIBOR(2) | 2.474%(3) | | | 11/15/43 | 113 | | (14 | ) | 99 | |
| Total Open Interest Rate Swap Contracts (å) | | | | | | | | | | | | 117 | | 57 | | 174 | |
See accompanying notes which are an integral part of the financial statements.
Strategic Bond Fund 115
Russell Investment Funds
Strategic Bond Fund
Schedule of Investments, continued — December 31, 2017
| | | | | | | | | | | | | | |
| Credit Default Swap Contracts | | | | | | | | | | | | | |
| |
| Amounts in thousands | | | | | | | | | | | | | |
| |
| Credit Indices | | | | | | | | | | | | | | |
| | | | | | | | | | Premiums | | Unrealized | | | |
| | | | | | | Fund (Pays)/ | | | Paid/ | | Appreciation | | | |
| | | Purchase/Sell | | | | Receives | | Termination | (Received) | | (Depreciation) | | Fair Value | |
| Reference Entity | Counterparty | Protection | Notional Amount | | Fixed Rate | | Date | $ | | $ | | $ | |
| CDX NA High Yield Index | Merrill Lynch | Purchase | USD | 2,360 | | (5.000%)(2) | | 12/20/22 | (176 | ) | (23 | ) | (199 | ) |
| CDX NA Investment Grade | | | | | | | | | | | | | | |
| Index | Merrill Lynch | Sell | USD | 2,350 | | 1.000%(2) | | 06/20/22 | 43 | | 10 | | 53 | |
| Total Open Credit Indices Contracts (å) | | | | | | | | (133 | ) | (13 | ) | (146 | ) |
| | | | | | | | | | | | | | | | |
| Presentation of Portfolio Holdings | | | | | | | | | | | | | | |
| Amounts in thousands | | | | | | | | | | | | | | | | |
| | | | | | | | | Fair Value | | | | | | | | |
| | | | | | | | | | | Practical | | | | | | |
| Portfolio Summary | | Level 1 | | | Level 2 | | | Level 3 | Expedient (a) | | Total | | % of Net Assets | |
| Long-Term Investments | | | | | | | | | | | | | | | | |
| Asset-Backed Securities | $ | — | | $ | 55,944 | | $ | — | $ | — | $ | 55,944 | | | 6.2 | |
| Corporate Bonds and Notes | | — | | | 175,872 | | | 82 | | — | | 175,954 | | | 19.4 | |
| International Debt | | — | | | 75,072 | | | 1,300 | | — | | 76,372 | | | 8.4 | |
| Loan Agreements | | — | | | 9,185 | | | — | | — | | 9,185 | | | 1.0 | |
| Mortgage-Backed Securities | | — | | | 197,929 | | | — | | — | | 197,929 | | | 21.8 | |
| Municipal Bonds | | — | | | 3,262 | | | — | | — | | 3,262 | | | 0.4 | |
| Non-US Bonds | | — | | | 32,885 | | | — | | — | | 32,885 | | | 3.6 | |
| United States Government Treasuries | | — | | | 257,311 | | | — | | — | | 257,311 | | | 28.4 | |
| Options Purchased | | 140 | | | — | | | — | | — | | 140 | | | —* | |
| Short-Term Investments | | — | | | 71,707 | | | — | | 57,316 | | 129,023 | | | 14.2 | |
| Total Investments | | 140 | | | 879,167 | | | 1,382 | | 57,316 | | 938,005 | | | 103.4 | |
| Other Assets and Liabilities, Net | | | | | | | | | | | | | | | (3.4 | ) |
| | | | | | | | | | | | | | | | 100.0 | |
| Other Financial Instruments | | | | | | | | | | | | | | | | |
| Assets | | | | | | | | | | | | | | | | |
| Futures Contracts | | 910 | | | — | | | — | | — | | 910 | | | 0.1 | |
| Foreign Currency Exchange Contracts | | — | | | 2,245 | | | — | | — | | 2,245 | | | 0.2 | |
| Interest Rate Swap Contracts | | — | | | 218 | | | — | | — | | 218 | | | —* | |
| Credit Default Swap Contracts | | — | | | 53 | | | — | | — | | 53 | | | —* | |
| A | | | | | | | | | | | | | | | | |
| Liabilities | | | | | | | | | | | | | | | | |
| Futures Contracts | | (2,048 | ) | | — | | | — | | — | | (2,048 | ) | | (0.2 | ) |
| Options Written | | (35 | ) | | — | | | — | | — | | (35 | ) | | (—)* | |
| Foreign Currency Exchange Contracts | | — | | | (1,972 | ) | | — | | — | | (1,972 | ) | | (0.2 | ) |
| Interest Rate Swap Contracts | | — | | | (44 | ) | | — | | — | | (44 | ) | | (—)* | |
| Credit Default Swap Contracts | | — | | | (199 | ) | | — | | — | | (199 | ) | | (—)* | |
| Total Other Financial Instruments** | $ | (1,173 | ) | $ | 301 | | $ | — | $ | — | $ | (872 | ) | | | |
See accompanying notes which are an integral part of the financial statements.
116 Strategic Bond Fund
Russell Investment Funds
Strategic Bond Fund
Schedule of Investments, continued — December 31, 2017
* Less than 0.05% of net assets.
** Futures and foreign currency exchange contract values reflect the unrealized appreciation (depreciation) on the investments.
(a) Certain investments that are measured at fair value using the net asset value per share (or its equivalent) practical expedient have not been classified
in the fair value levels. The fair value amounts presented in the table are intended to permit reconciliation to the amounts presented in the Schedule of
Investments.
For a description of the Levels, see note 2 in the Notes to Financial Statements.
For a disclosure on transfers between Levels 1, 2 and 3 during the period ended December 31, 2017, see note 2 in the Notes to
Financial Statements.
Investments in which significant unobservable inputs (Level 3) were used in determining a fair value for the period ended
December 31, 2017, were less than 1% of net assets.
| | | |
| Amounts in thousands | | | |
| | Fair Value | |
| Country Exposure | | $ | |
| Argentina | | 1,055 | |
| Australia | | 8,709 | |
| Austria | | 423 | |
| Bermuda | | 876 | |
| Brazil | | 5,602 | |
| Canada | | 14,166 | |
| Cayman Islands | | 5,194 | |
| Chile | | 915 | |
| China | | 887 | |
| Colombia | | 4,842 | |
| Curacao | | 36 | |
| Denmark | | 171 | |
| Finland | | 818 | |
| France | | 3,300 | |
| Germany | | 1,657 | |
| Guernsey | | 344 | |
| India | | 509 | |
| Indonesia | | 1,230 | |
| Ireland | | 4,086 | |
| Italy | | 718 | |
| Japan | | 3,913 | |
| Kuwait | | 213 | |
| Luxembourg | | 747 | |
| Malaysia | | 2,118 | |
| Mexico | | 8,774 | |
| Netherlands | | 10,282 | |
| New Zealand | | 4,765 | |
| Norway | | 909 | |
| Panama | | 247 | |
| Peru | | 2,854 | |
| Poland | | 1,622 | |
| Russia | | 1,453 | |
| Singapore | | 2,753 | |
| South Korea | | 1,442 | |
| Spain | | 286 | |
| Sweden | | 2,743 | |
| Switzerland | | 4,126 | |
| Turkey | | 222 | |
| United Arab Emirates | | 1,137 | |
| United Kingdom | | 15,571 | |
| United States | | 815,224 | |
See accompanying notes which are an integral part of the financial statements.
Strategic Bond Fund 117
Russell Investment Funds
Strategic Bond Fund
Schedule of Investments, continued — December 31, 2017
| | | |
| Amounts in thousands | | | |
| | Fair Value | |
| Country Exposure | | $ | |
| Venezuela, Bolivarian Republic of | | 816 | |
| Virgin Islands, British | | 250 | |
| Total Investments | | 938,005 | |
See accompanying notes which are an integral part of the financial statements.
118 Strategic Bond Fund
Russell Investment Funds
Strategic Bond Fund
Fair Value of Derivative Instruments — December 31, 2017
Amounts in thousands
| | | | | | | | | | |
| | | | | | Foreign | | | | |
| | | Credit | | Currency | | Interest Rate | |
| Derivatives not accounted for as hedging instruments | Contracts | | Contracts | | Contracts | |
| |
| Location: Statement of Assets and Liabilities - Assets | | | | | | | | | |
| Investments, at fair value* | | $ | — | | $ | — | | $ | 140 | |
| Unrealized appreciation on foreign currency exchange contracts | | — | | | 2,245 | | | — | |
| Variation margin on futures contracts** | | | — | | | — | | | 910 | |
| Interest rate swap contracts, at fair value | | | — | | | — | | | 218 | |
| Credit default swap contracts, at fair value | | | 53 | | | — | | | — | |
| Total | | $ | 53 | | $ | 2,245 | | $ | 1,268 | |
| |
| |
| Location: Statement of Assets and Liabilities - Liabilities | | | | | | | | | |
| Variation margin on futures contracts** | | $ | — | | $ | 10 | | $ | 2,038 | |
| Unrealized depreciation on foreign currency exchange contracts | | — | | | 1,972 | | | — | |
| Options written, at fair value | | | — | | | — | | | 35 | |
| Interest rate swap contracts, at fair value | | | — | | | — | | | 44 | |
| Credit default swap contracts, at fair value | | | 199 | | | — | | | — | |
| Total | | $ | 199 | | $ | 1,982 | | $ | 2,117 | |
| | | | | | Foreign | | | | |
| | | Credit | | Currency | | Interest Rate | |
| Derivatives not accounted for as hedging instruments | Contracts | | Contracts | | Contracts | |
| |
| Location: Statement of Operations - Net realized gain (loss) | | | | | | | | | |
| Investments*** | | $ | — | | $ | — | | $ | (1,123 | ) |
| Futures contracts | | | — | | | — | | | (9 | ) |
| Options written | | | — | | | — | | | 445 | |
| Total return swap contracts | | | — | | | — | | | 761 | |
| Interest rate swap contracts | | | — | | | — | | | 489 | |
| Credit default swap contracts | | | 22 | | | — | | | — | |
| Foreign currency exchange contracts | | | — | | | (3,226 | ) | | — | |
| Total | | $ | 22 | | $ | (3,226 | ) | $ | 563 | |
| |
| |
| Location: Statement of Operations - Net change in unrealized appreciation (depreciation) | | | | | | | | | |
| Investments**** | | $ | — | | $ | (40 | ) | $ | (3 | ) |
| Futures contracts | | | — | | | (76 | ) | | 732 | |
| Options written | | | — | | | 28 | | | 2 | |
| Total return swap contracts | | | — | | | — | | | (36 | ) |
| Interest rate swap contracts | | | — | | | — | | | (637 | ) |
| Credit default swap contracts | | | (13 | ) | | — | | | — | |
| Foreign currency exchange contracts | | | — | | | 675 | | | — | |
| Total | | $ | (13 | ) | $ | 587 | | $ | 58 | |
* Fair value of purchased options.
** Includes cumulative appreciation/depreciation of futures contracts as reported in the Schedule of Investments. Only variation margin is reported within the
Statement of Assets and Liabilities.
*** Includes net realized gain (loss) on purchased options as reported in the Statement of Operations.
**** Includes net change in unrealized appreciation/depreciation on purchased options as reported in the Schedule of Investments.
For further disclosure on derivatives see note 2 in the Notes to Financial Statements.
See accompanying notes which are an integral part of the financial statements.
Strategic Bond Fund 119
Russell Investment Funds
Strategic Bond Fund
Balance Sheet Offsetting of Financial and Derivative Instruments —
December 31, 2017
| | | | | | | | | |
| Amounts in thousands | | | | | | | | | |
| |
| Offsetting of Financial Assets and Derivative Assets | | | | | | | | |
| | | | | Gross | Net Amounts | |
| | | | | Amounts | | of Assets | |
| | | | Gross | Offset in the | Presented in | |
| | | Amounts of | Statement of | the Statement | |
| | | Recognized | Assets and | of Assets and | |
| Description | Location: Statement of Assets and Liabilities - Assets | | Assets | Liabilities | | Liabilities | |
| Options Purchased Contracts | Investments, at fair value | $ | 140 | | $ | — $ | 140 | |
| Foreign Currency Exchange Contracts | Unrealized appreciation on foreign currency exchange contracts | | 2,245 | | | — | 2,245 | |
| Futures Contracts | Variation margin on futures contracts | | 2,089 | | | — | 2,089 | |
| Interest Rate Swap Contracts | Interest rate swap contracts, at fair value | | 218 | | | — | 218 | |
| Credit Default Swap Contracts | Credit default swap contracts, at fair value | | 53 | | | — | 53 | |
| Total Financial and Derivative Assets | | | 4,745 | | | — | 4,745 | |
| Financial and Derivative Assets not subject to a netting agreement | | (2,383 | ) | | — | (2,383 | ) |
| Total Financial and Derivative Assets subject to a netting agreement | $ | 2,362 | | $ | — $ | 2,362 | |
| | | | | | | | | |
| Financial Assets, Derivative Assets, and Collateral Held by Counterparty | | | | | | | | |
| | | | Gross Amounts Not Offset in | |
| | | | the Statement of Assets and | |
| | | | | | Liabilities | | | |
| |
| | Net Amounts | | | | | | | |
| | | of Assets | | | | | | | |
| | Presented in | | | | | | | |
| | the Statement | Financial and | | | | |
| | of Assets and | Derivative | Collateral | |
| Counterparty | | Liabilities | Instruments | | | Received^ | Net Amount |
| Bank of America | $ | 1,232 | | $ | 158 | | $ | — | $ 1,074 |
| Bank of Montreal | | 106 | | | 39 | | | — | 67 |
| Barclays | | 42 | | | 17 | | | — | 25 |
| Citigroup | | 159 | | | 159 | | | — | — |
| Commonwealth Bank of Australia | | 103 | | | 36 | | | — | 67 |
| Goldman Sachs | | 16 | | | — | | | — | 16 |
| HSBC | | 7 | | | — | | | — | 7 |
| JPMorgan Chase | | 425 | | | 425 | | | — | — |
| State Street | | 245 | | | 245 | | | — | — |
| Westpac | | 27 | | | 27 | | | — | — |
| Total | $ | 2,362 | | $ | 1,106 | | $ | — | $ 1,256 |
See accompanying notes which are an integral part of the financial statements.
120 Strategic Bond Fund
Russell Investment Funds
Strategic Bond Fund
Balance Sheet Offsetting of Financial and Derivative Instruments, continued —
December 31, 2017
| | | | | | | | | |
| Amounts in thousands | | | | | | | | | |
| |
| Offsetting of Financial Liabilities and Derivative Liabilities | | | | | | | | |
| | | | | Gross | Net Amounts | |
| | | | | Amounts | of Liabilities | |
| | | | Gross | Offset in the | Presented in | |
| | | Amounts of | Statement of | the Statement | |
| | | Recognized | Assets and | of Assets and | |
| Description | Location: Statement of Assets and Liabilities - Liabilities | Liabilities | Liabilities | | Liabilities | |
| Futures Contracts | Variation margin on futures contracts | $ | 129 | | $ | — $ | 129 | |
| Foreign Currency Exchange Contracts | Unrealized depreciation on foreign currency exchange contracts | | 1,972 | | | — | 1,972 | |
| Options Written Contracts | Options written, at fair value | | 35 | | | — | 35 | |
| Interest Rate Swap Contracts | Interest rate swap contracts, at fair value | | 44 | | | — | 44 | |
| Credit Default Swap Contracts | Credit default swap contracts, at fair value | | 199 | | | — | 199 | |
| Total Financial and Derivative Liabilities | | | 2,379 | | | — | 2,379 | |
| Financial and Derivative Liabilities not subject to a netting agreement | | (373 | ) | | — | (373 | ) |
| Total Financial and Derivative Liabilities subject to a netting agreement | $ | 2,006 | | $ | — $ | 2,006 | |
| | | | | | | | | | |
| Financial Liabilities, Derivative Liabilities, and Collateral Pledged by Counterparty | | | | | | | | |
| | | | Gross Amounts Not Offset in | | |
| | | | the Statement of Assets and | | |
| | | | | | Liabilities | | | | |
| |
| | Net Amounts | | | | | | | | |
| | of Liabilities | | | | | | | | |
| | Presented in | | | | | | | | |
| | the Statement | Financial and | | | | | |
| | of Assets and | Derivative | Collateral | | |
| Counterparty | | Liabilities | Instruments | Pledged^ Net Amount |
| Bank of America | $ | 158 | | $ | 158 | | $ | — | $ | — |
| Bank of Montreal | | 39 | | | 39 | | | — | | — |
| Barclays | | 17 | | | 17 | | | — | | — |
| Citigroup | | 214 | | | 159 | | | 30 | | 25 |
| Commonwealth Bank of Australia | | 36 | | | 36 | | | — | | — |
| JPMorgan Chase | | 860 | | | 425 | | | 410 | | 25 |
| State Street | | 611 | | | 245 | | | — | | 366 |
| Westpac | | 71 | | | 27 | | | — | | 44 |
| Total | $ | 2,006 | | $ | 1,106 | | $ | 440 | $ | 460 |
^ Collateral received or pledged amounts may not reconcile to those disclosed in the Statement of Assets and Liabilities due to the inclusion of off-Balance
Sheet collateral and adjustments made to exclude overcollateralization.
For further disclosure on derivatives and counterparty risk see note 2 in the Notes to Financial Statements.
See accompanying notes which are an integral part of the financial statements.
Strategic Bond Fund 121
Russell Investment Funds
Strategic Bond Fund
Statement of Assets and Liabilities — December 31, 2017
| | |
| Amounts in thousands | | |
| Assets | | |
| Investments, at identified cost | $ | 934,648 |
| Investments, at fair value(>) | | 938,005 |
| Cash | | 9,649 |
| Cash (restricted)(a)(b)(c) | | 7,857 |
| Foreign currency holdings(^) | | 969 |
| Unrealized appreciation on foreign currency exchange contracts | | 2,245 |
| Receivables: | | |
| Dividends and interest | | 4,965 |
| Dividends from affiliated funds | | 61 |
| Investments sold | | 31,994 |
| Fund shares sold | | 156 |
| Variation margin on futures contracts | | 2,089 |
| Interest rate swap contracts, at fair value(•) | | 218 |
| Credit default swap contracts, at fair value(+) | | 53 |
| Total assets | | 998,261 |
| |
| Liabilities | | |
| Payables: | | |
| Due to broker (d) | | 287 |
| Investments purchased | | 87,358 |
| Fund shares redeemed | | 233 |
| Accrued fees to affiliates | | 467 |
| Other accrued expenses | | 167 |
| Variation margin on futures contracts | | 129 |
| Deferred capital gains tax liability | | 3 |
| Unrealized depreciation on foreign currency exchange contracts | | 1,972 |
| Options written, at fair value(x) | | 35 |
| Interest rate swap contracts, at fair value(•) | | 44 |
| Credit default swap contracts, at fair value(+) | | 199 |
| Total liabilities | | 90,894 |
| |
| |
| Net Assets | $ | 907,367 |
See accompanying notes which are an integral part of the financial statements.
122 Strategic Bond Fund
Russell Investment Funds
Strategic Bond Fund
Statement of Assets and Liabilities, continued — December 31, 2017
| | | |
| Amounts in thousands | | | |
| Net Assets Consist of: | | | |
| Undistributed (overdistributed) net investment income | $ | (1,026 | ) |
| Accumulated net realized gain (loss) | | (8,461 | ) |
| Unrealized appreciation (depreciation) on: | | | |
| Investments (net of deferred tax liability for foreign capital gains taxes) | | 3,357 | |
| Investments in affiliated funds | | (3 | ) |
| Futures contracts | | (1,138 | ) |
| Options written | | 9 | |
| Interest rate swap contracts | | 57 | |
| Credit default swap contracts | | (13 | ) |
| Foreign currency exchange contracts | | 273 | |
| Foreign currency-related transactions | | 20 | |
| Shares of beneficial interest | | 875 | |
| Additional paid-in capital | | 913,417 | |
| Net Assets | $ | 907,367 | |
| |
| Net Asset Value, offering and redemption price per share: | | | |
| Net asset value per share: (#) | $ | 10.37 | |
| Net assets | $ | 907,366,586 | |
| Shares outstanding ($. 01 par value) | | 87,498,295 | |
| Amounts in thousands | | | |
| (^) Foreign currency holdings - cost | $ | 973 | |
| (x) Premiums received on options written | $ | 44 | |
| (+) Credit default swap contracts - premiums paid (received) | $ | (133 | ) |
| (•) Interest rate swap contracts - premiums paid (received) | $ | 117 | |
| (>) Investments in affiliates, U. S. Cash Management Fund | $ | 57,316 | |
| |
| (a) Cash Collateral for Futures | $ | 6,127 | |
| (b) Cash Collateral for Swaps | $ | 983 | |
| (c) Cash Collateral for TBAs | $ | 747 | |
| (d) Due to Broker for Futures | $ | 287 | |
| (#) Net asset value per share equals net assets divided by shares of beneficial interest outstanding. | | | |
See accompanying notes which are an integral part of the financial statements.
Strategic Bond Fund 123
Russell Investment Funds
Strategic Bond Fund
Statement of Operations — For the Period Ended December 31, 2017
| | | |
| Amounts in thousands | | | |
| Investment Income | | | |
| Dividends | $ | 28 | |
| Dividends from affiliated funds . | | 769 | |
| Interest | | 21,464 | |
| Total investment income | | 22,261 | |
| |
| Expenses | | | |
| Advisory fees | | 4,804 | |
| Administrative fees | | 437 | |
| Custodian fees | | 262 | |
| Transfer agent fees | | 38 | |
| Professional fees | | 119 | |
| Trustees’ fees | | 23 | |
| Printing fees | | 121 | |
| Miscellaneous | | 25 | |
| Expenses before reductions | | 5,829 | |
| Expense reductions | | (56 | ) |
| Net expenses | | 5,773 | |
| Net investment income (loss) | | 16,488 | |
| |
| Net Realized and Unrealized Gain (Loss) | | | |
| Net realized gain (loss) on: | | | |
| Investments (net of deferred tax liability for foreign capital gains taxes) | | (1,202 | ) |
| Investments in affiliated funds . | | (3 | ) |
| Futures contracts | | (9 | ) |
| Options written | | 445 | |
| Foreign currency exchange contracts | | (3,226 | ) |
| Total return swap contracts | | 761 | |
| Interest rate swap contracts | | 489 | |
| Credit default swap contracts | | 22 | |
| Foreign currency-related transactions | | 228 | |
| Net realized gain (loss) | | (2,495 | ) |
| Net change in unrealized appreciation (depreciation) on: | | | |
| Investments (net of deferred tax liability for foreign capital gains taxes) | | 17,851 | |
| Investments in affiliated funds | | (9 | ) |
| Futures contracts | | 656 | |
| Options written | | 30 | |
| Foreign currency exchange contracts | | 675 | |
| Total return swap contracts | | (36 | ) |
| Interest rate swap contracts | | (637 | ) |
| Credit default swap contracts | | (13 | ) |
| Foreign currency-related transactions | | 61 | |
| Net change in unrealized appreciation (depreciation) | | 18,578 | |
| Net realized and unrealized gain (loss) | | 16,083 | |
| Net Increase (Decrease) in Net Assets from Operations | $ | 32,571 | |
See accompanying notes which are an integral part of the financial statements.
124 Strategic Bond Fund
Russell Investment Funds
Strategic Bond Fund
Statements of Changes in Net Assets
| | | | | | |
| | For the Periods Ended December 31, | |
| Amounts in thousands | | 2017 | | | 2016 | |
| Increase (Decrease) in Net Assets | | | | | | |
| Operations | | | | | | |
| Net investment income (loss) | $ | 16,488 | | $ | 14,984 | |
| Net realized gain (loss) | | (2,495 | ) | | 14,365 | |
| Net change in unrealized appreciation (depreciation) | | 18,578 | | | (2,455 | ) |
| Net increase (decrease) in net assets from operations | | 32,571 | | | 26,894 | |
| |
| Distributions | | | | | | |
| From net investment income | | (11,721 | ) | | (13,853 | ) |
| From net realized gain | | — | | | (24,296 | ) |
| Net decrease in net assets from distributions | | (11,721 | ) | | (38,149 | ) |
| |
| Share Transactions* | | | | | | |
| Net increase (decrease) in net assets from share transactions | | 35,795 | | | 6,068 | |
| Total Net Increase (Decrease) in Net Assets | | 56,645 | | | (5,187 | ) |
| |
| Net Assets | | | | | | |
| Beginning of period | | 850,722 | | | 855,909 | |
| End of period | $ | 907,367 | | $ | 850,722 | |
| Undistributed (overdistributed) net investment income included in net assets | $ | (1,026 | ) | $ | (1,821 | ) |
* Share transaction amounts (in thousands) for the periods ended December 31, 2017 and December 31, 2016 were as follows:
| | | | | | | | | | | | |
| | | 2017 | | | | 2016 | | |
| | | Shares | | | Dollars | | | Shares | | | Dollars | |
| |
| Proceeds from shares sold | | 6,949 | | $ | 71,566 | | | 4,915 | | $ | 52,175 | |
| Proceeds from reinvestment of distributions | | 1,139 | | | 11,721 | | | 3,722 | | | 38,149 | |
| Payments for shares redeemed | | (4,638 | ) | | (47,492 | ) | | (7,908 | ) | | (84,256 | ) |
| Total increase (decrease) | | 3,450 | | $ | 35,795 | | | 729 | | $ | 6,068 | |
See accompanying notes which are an integral part of the financial statements.
Strategic Bond Fund 125
Russell Investment Funds
Strategic Bond Fund
Financial Highlights — For the Periods Ended
For a Share Outstanding Throughout Each Period.
| | | | | | | | | | | | | | | | |
| | | $ | | $ | | $ | | | $ | | | $ | | | $ | |
| | Net Asset Value, | | Net | Net Realized | | | Total from | | | Distributions | | | Distributions | |
| | Beginning of | Investment | and Unrealized | | | Investment | | | from Net | | | from Net | |
| | | Period | Income (Loss)(a)(b) | Gain (Loss) | | | Operations | | | Investment Income | | | Realized Gain | |
| December 31, 2017 | | 10.12 | | . 20 | | . 19 | | | . 39 | | | (. 14 | ) | | — | |
| December 31, 2016 | | 10.27 | | . 18 | | . 14 | | | . 32 | | | (. 17 | ) | | (. 30 | ) |
| December 31, 2015 | | 10.66 | | . 16 | | (. 17 | ) | | (. 01 | ) | | (. 26 | ) | | (. 12 | ) |
| December 31, 2014 | | 10.46 | | . 15 | | . 43 | | | . 58 | | | (. 17 | ) | | (. 21 | ) |
| December 31, 2013 | | 10.81 | | . 18 | | (. 35 | ) | | (. 17 | ) | | (. 15 | ) | | (. 03 | ) |
| | | | | | | | | | | | | | | | | |
See accompanying notes which are an integral part of the financial statements.
126 Strategic Bond Fund
| | | | | | | | | | | | | | | | | |
| | | | | | | | | | | | | % | | % | | % | |
| | | | | $ | | | | | $ | | | Ratio of Expenses | | Ratio of Expenses | Ratio of Net | |
| | | | | Net Asset Value, | | % | | | Net Assets, | | | to Average | | to Average | Investment Income | % |
| | $ | | | End of | | Total | | | End of Period | | | Net Assets, | | Net Assets, | to Average | Portfolio |
| Total Distributions | | | Period | | Return(d) | | | (000 | ) | | Gross | | Net(b) | Net Assets(b) | Turnover Rate |
| (. 14 | ) | | 10.37 | | 3.86 | | | 907,367 | | | . 67 | | . 66 | | 1.89 | 143 |
| (. 47 | ) | | 10.12 | | 3.10 | | | 850,722 | | | . 67 | | . 65 | | 1.72 | 262 |
| (. 38 | ) | | 10.27 | | (. 14 | ) | | 855,909 | | | . 67 | | . 64 | | 1.49 | 225 |
| (. 38 | ) | | 10.66 | | 5.55 | | | 839,458 | | | . 69 | | . 64 | | 1.44 | 173 |
| (. 18 | ) | | 10.46 | | (1.55 | ) | | 763,901 | | | . 67 | | . 62 | | 1.73 | 133 |
See accompanying notes which are an integral part of the financial statements.
Strategic Bond Fund 127
Russell Investment Funds
Strategic Bond Fund
Related Party Transactions, Fees and Expenses
Accrued fees payable to affiliates for the period ended December 31, 2017 were as follows:
| | |
| Advisory fees | $ | 422,733 |
| Administration fees | | 38,430 |
| Transfer agent fees | | 3,382 |
| Trustee fees | | 2,021 |
| | $ | 466,566 |
Transactions (amounts in thousands) during the period ended December 31, 2017 with Underlying Funds which are, or were, an
affiliated company are as follows:
| | | | | | | | | | | | | | | | | |
| | | Fair Value, | | | | | | | Change in | | | | | | | | |
| | Beginning of | | | | Realized Gain | Unrealized | Fair Value, End | | | Income | Capital Gains |
| | | Period | | Purchases | | Sales | | (Loss) | Gain (Loss) | of Period | Distributions | Distributions |
| U. S. Cash Management Fund | $ | 73,380 | $ | 710,503 | $ | 726,555 | $ | (3) | $ (9) | $ | 57,316 | | $ | 769 | | $ | — |
| | $ | 73,380 | $ | 710,503 | $ | 726,555 | $ | (3) | $ (9) | $ | 57,316 | | $ | 769 | | $ | — |
Federal Income Taxes
At December 31, 2017, the cost of investments and net unrealized appreciation (depreciation), undistributed ordinary income and
undistributed long-term capital gains for income tax purposes were as follows:
| | | | |
| Cost of Investments | $ | | 937,497,622 | |
| Unrealized Appreciation | $ | | 366,582 | |
| Unrealized Depreciation | | | (468,365 | ) |
| Net Unrealized Appreciation (Depreciation) | $ | | (101,783 | ) |
| Undistributed Ordinary Income | $ | | 581,567 | |
| Undistributed Long-Term Capital Gains | | | | |
| (Capital Loss Carryforward) | $ | | (7,386,098 | ) |
| Tax Composition of Distributions | | | | |
| Ordinary Income | $ | | 11,720,484 | |
Net investment income and net realized gains (losses) in the financial statements may differ from taxable net investment income and
net realized gains (losses). Capital accounts within the financial statements are adjusted for permanent book-tax differences. Book-tax
differences are primarily due to foreign currency gains and losses, reclassifications of dividends, differences in treatment of income
from swaps, net operating losses, investments in partnerships, investments in passive foreign investment companies (PFICs), tax
straddle transaction, use of tax equalization and foreign capital gains taxes. These adjustments have no impact on the net assets. At
December 31, 2017, the Statement of Assets and Liabilities have been adjusted by the following amounts (in thousands):
| | | |
| Undistributed net investment income | $ | (3,972 | ) |
| Accumulated net realized gain (loss) | | 3,972 | |
| Additional paid-in capital | | — | |
See accompanying notes which are an integral part of the financial statements.
128 Strategic Bond Fund
Russell Investment Funds
Global Real Estate Securities Fund
Portfolio Management Discussion and Analysis — December 31, 2017 (Unaudited)
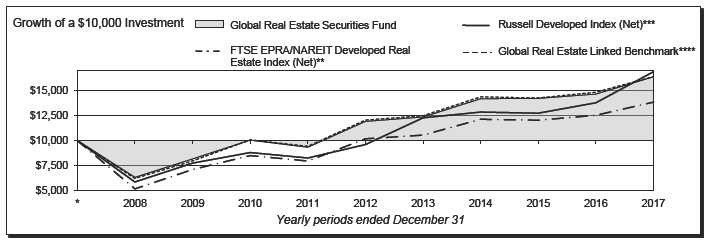
| | | | | | | |
| Global Real Estate Securities Fund | | | | FTSE EPRA/NAREIT Developed Real Estate Index (Net)** | |
| | | Total | | | | Total | |
| | | Return | | | | Return | |
| 1 Year | | 11.80 | % | 1 Year | | 10.36 | % |
| 5 Years | | 6.55 | %§ | 5 Years | | 6.32 | %§ |
| 10 Years | | 5.03 | %§ | 10 Years | | 3.28 | %§ |
| |
| | | | | Russell Developed Index (Net) *** | | | |
| | | | | | | Total | |
| | | | | | | Return | |
| | | | | 1 Year | | 22.39 | % |
| | | | | 5 Years | | 11.90 | %§ |
| | | | | 10 Years | | 5.35 | %§ |
| |
| | | | | Global Real Estate Linked Benchmark **** | | |
| | | | | | | Total | |
| | | | | | | Return | |
| | | | | 1 Year | | 10.36 | % |
| | | | | 5 Years | | 6.32 | %§ |
| | | | | 10 Years | | 5.03 | %§ |
Global Real Estate Securities Fund 129
Russell Investment Funds
Global Real Estate Securities Fund
Portfolio Management Discussion and Analysis, continued — December 31, 2017
(Unaudited)
| |
| The Global Real Estate Securities Fund (the “Fund”) employs | delivered negative returns and continued to display a bifurcated |
| a multi-manager approach whereby portions of the Fund are | performance pattern, with J-REITs struggling due to capital |
| allocated to different money manager strategies. Fund assets not | outflows and concerns over higher global interest rates while |
| allocated to money managers are managed by Russell Investment | Japanese developers fared comparatively better. U. S. REITs |
| Management, LLC (“RIM”), the Fund’s advisor. RIM may change | lagged relative to property companies in most other developed |
| the allocation of the Fund’s assets among money managers at | markets, although there was significant dispersion in performance |
| any time. An exemptive order from the Securities and Exchange | within the U. S. by property type. The Fund was positioned with an |
| Commission (“SEC”) permits RIM to engage or terminate a money | underweight position in North America and Continental Europe |
| manager at any time, subject to approval by the Fund’s Board, | and an overweight to United Kingdom and Japan, resulting in a |
| without a shareholder vote. Pursuant to the terms of the exemptive | neutral contribution from regional allocation. |
| order, the Fund is required to notify its shareholders within 90 | With respect to property sectors, there was an unusually wide |
| days of when a money manager begins providing services. As of | distribution of performance by property type. Data centers and |
| December 31, 2017, the Fund had three money managers. | industrial REITs experienced strong double-digit percentage |
| What is the Fund’s investment objective? | gains, backed by very strong fundamental growth. The retail |
| The Fund seeks to provide current income and long term capital | sector experienced large declines due to ongoing store closures |
| growth. | and concerns around e-commerce, though the sector posted |
| | partial recovery in the fourth quarter propelled upward by several |
| How did the Fund perform relative to its benchmark for the | major M&A announcements. The more bond-like, yield-oriented |
| fiscal year ended December 31, 2017? | health care and net lease sectors were weak performers while |
| For the fiscal year ended December 31, 2017, the Fund gained | property types with shorter lease terms, including self-storage |
| 11.80%. This is compared to the Fund’s benchmark, the FTSE | and residential, finished with positive performance. These |
| EPRA/NAREIT Developed Real Estate Index (Net), which gained | trends in property sector performance posed a tailwind for Fund |
| 10.36% during the same period. The Fund’s performance includes | performance, as the portfolio favors property types with stronger |
| operating expenses, whereas index returns are unmanaged and do | underlying fundamentals and growth potential, rather than |
| not include expenses of any kind. | seeking to maximize yield. |
| |
| For the fiscal year ended December 31, 2017, the Morningstar® | How did the investment strategies and techniques employed |
| Insurance Global Real Estate Category, a group of funds that | by the Fund and its money managers affect its benchmark- |
| Morningstar considers to have investment strategies similar to | relative performance? |
| those of the Fund, gained 11.19%. This result serves as a peer | At the Fund level, stock selection results were positive within |
| comparison and is expressed net of operating expenses. | the U. S. retail, lodging and data center sectors as well as the UK. |
| How did the market conditions described in the Market | From a sector allocation perspective, underweight positions to the |
| Summary report affect the Fund’s performance? | U. S. health care and net lease sectors as well as Japanese REITs |
| For the fiscal year ended December 31, 2017, the global listed | were beneficial. Detracting from performance was an overweight |
| property market, as measured by the FTSE EPRA/NAREIT | to the U. S. office sector and negative stock selection within Hong |
| Developed Real Estate Index (Net), delivered a 10.36% return. | Kong and Japan developers. |
| Underpinned by stable economic growth, the global property | The Fund employs discretionary money managers. The Fund’s |
| market sustained positive momentum during the period, although | discretionary money managers select the individual portfolio |
| real estate investment trusts (“REITs”) underperformed broader | securities for the assets assigned to them. Fund assets not |
| equities. In the U. S. , the Federal Reserve increased interest | allocated to discretionary money managers include the Fund’s |
| rates three times during the fiscal year, though the 10-year U. S. | cash balances and assets which may be managed directly by |
| Treasury yield was roughly flat year-over- year. | RIM to effect the Fund’s investment strategies and/or to actively |
| Within the global property securities market, Asia ex-Japan | manage the Fund’s overall exposures by investing in securities or |
| led the index with strong positive returns, while North America | other instruments that RIM believes will achieve the desired risk/ |
| was the worst performer of the major regions. Singapore was the | return profile for the Fund. |
| best performer globally, helped by a recovery in its residential | With respect to certain of the Fund’s money managers, Cohen & |
| and office markets. Also delivering positive performance was | Steers Capital Management, Inc. , Cohen & Steers UK Limited |
| Europe, which benefited from subsiding political risk and | and Cohen & Steers Asia Limited (together, “Cohen”) strongly |
| strong broader equity market performance. In Japan, the market | outperformed the Fund’s benchmark for the fiscal year. Cohen |
130 Global Real Estate Securities Fund
Russell Investment Funds
Global Real Estate Securities Fund
Portfolio Management Discussion and Analysis, continued — December 31, 2017
(Unaudited)
| | |
| seeks to generate excess returns through a combination of | modestly positive impact on absolute performance, as equity |
| fundamental bottom-up stock selection and top-down regional | markets delivered positive returns ahead of cash. |
| and property type allocation decisions. Stock selection was a key | | |
| contributor to outperformance. Results were positive within U. S. | Describe any changes to the Fund’s structure or the money |
| data center and lodging sectors as well as UK and Continental | manager line-up. | |
| Europe. Underweight positions in the retail sector and J-REITs | There were no changes to the Fund’s structure or money manager |
| were beneficial. Modestly detracting from performance were | line-up during the period. | |
| underweights to the U. S. industrial sector, Hong Kong and | Money Managers as of December 31, | |
| Singapore. | 2017 | Styles |
| Morgan Stanley Investment Management, Inc. , Morgan Stanley | Cohen & Steers Capital Management, Inc. , | |
| Investment Management Limited and Morgan Stanley Investment | Cohen & Steers UK Limited and Cohen & | |
| Management Company (together, “Morgan Stanley”) modestly | Steers Asia Limited | Market-Oriented |
| outperformed the Fund’s benchmark during the fiscal year. Morgan | Morgan Stanley Investment Management | |
| Stanley’s process focuses on identifying listed property companies | Inc. , Morgan Stanley Investment | |
| that trade at discounts relative to underlying asset values. Positive | Management Limited and Morgan Stanley | |
| | Investment Management Company | Value |
| stock selection within the U. S. retail and lodging sectors and an | RREEF America L. L. C. , Deutsche | |
| underweight to the U. S. health care contributed to performance. | Investments Australia Limited and Deutsche |
| An overweight position to the U. K. and an underweight to J-REITs | Alternatives Asset Management (Global) | |
| were beneficial. Detracting from performance were underweights | Limited operating under the brand name | |
| to Singapore and Continental Europe and an overweight to the | Deutsche Asset Management | Market-Oriented |
| U. S. office sector. | The views expressed in this report reflect those of the |
| During the period, RIM continued to utilize a strategy to implement | portfolio managers only through the end of the period |
| regional and property sector tilting through the direct purchase | covered by the report. These views do not necessarily |
| of real estate stocks. The strategy seeks to position the portfolio | represent the views of RIM or any other person in RIM or |
| to meet RIM’s overall preferred positioning with respect to | any other affiliated organization. These views are subject to |
| regional and property type exposures. The strategy outperformed | change at any time based upon market conditions or other |
| relative to the Fund’s benchmark for the one-year period. Positive | events, and RIM disclaims any responsibility to update the |
| performance was driven by underweights to J-REITs and the U. S. | views contained herein. These views should not be relied |
| health care sector as well as an overweight position to Hong Kong. | on as investment advice and, because investment decisions |
| Overweights to Japan developers and U. S. malls had a negative | for a Russell Investment Funds (“RIF”) Fund are based on |
| impact. | numerous factors, should not be relied on as an indication |
| | of investment decisions of any RIF Fund. |
| During the period, the Fund used index futures and swap contracts | | |
| to equitize the Fund’s cash. The use of these derivatives had a | | |
Global Real Estate Securities Fund 131
Russell Investment Funds
Global Real Estate Securities Fund
Portfolio Management Discussion and Analysis, continued — December 31, 2017
(Unaudited)
* Assumes initial investment on January 1, 2008.
** The FTSE EPRA/NAREIT Developed Real Estate Index (Net) is an unmanaged market-weighted total return index, which consists of publicly traded equity
REITs and listed property companies from developed markets whose floats are larger than $100 million and derive more than half of their revenue from property-
related activities and is net of dividend withholding taxes.
*** The Russell Developed Index (Net) measures the performance of the investable securities in developed countries globally and is net of tax on dividends from
foreign holdings.
**** The Global Real Estate Linked Benchmark provides a means to compare the Fund’s average annual returns to a secondary benchmark that takes into account
historical changes in the Fund’s primary benchmark. The Global Real Estate Linked Benchmark represents the returns of the FTSE NAREIT Equity REIT
Index through September 30, 2010 and the returns of the FTSE EPRA/NAREIT Developed Real Estate Index (net) thereafter.
§ Annualized.
The performance shown in this section does not reflect any Insurance Company Separate Account or Policy Charges. Performance is historical and assumes
reinvestment of all dividends and capital gains. Investment return and principal value will fluctuate so that an investor’s shares, when redeemed, may be worth more
or less than when purchased. Past performance is not indicative of future results. Additionally, the returns presented herein may differ from the performance reported
in the Financial Highlights as the returns herein are calculated in a manner consistent with standardized performance in accordance with Securities and Exchange
Commission rules, while the performance in the Financial Highlights has been calculated in accordance with U.S. Generally Accepted Accounting Principles (“U.S.
GAAP”).
132 Global Real Estate Securities Fund
Russell Investment Funds
Global Real Estate Securities Fund
Shareholder Expense Example — December 31, 2017 (Unaudited)
| | | | | | | |
| Fund Expenses | Please note that the expenses shown in the table are meant |
| The following disclosure provides important information | to highlight your ongoing costs only and do not reflect any |
| regarding the Fund’s Shareholder Expense Example | transactional costs. Therefore, the information under the heading |
| (“Example”) . | “Hypothetical Performance (5% return before expenses)” is |
| | useful in comparing ongoing costs only, and will not help you |
| Example | determine the relative total costs of owning different funds. In |
| As a shareholder of the Fund, you incur two types of costs: (1) | addition, if these transactional costs were included, your costs |
| transaction costs, and (2) ongoing costs, including advisory and | would have been higher. The fees and expenses shown in this |
| administrative fees and other Fund expenses. The Example is | section do not reflect any Insurance Company Separate Account |
| intended to help you understand your ongoing costs (in dollars) | Policy Charges. | | | | | | |
| of investing in the Fund and to compare these costs with the | | | | | | Hypothetical |
| ongoing costs of investing in other mutual funds. The Example | | | | | | Performance (5% |
| is based on an investment of $1,000 invested at the beginning of | | | | Actual | | return before |
| the period and held for the entire period indicated, which for this | | | Performance | | | expenses) |
| | Beginning Account Value | | | | | | |
| Fund is from July 1, 2017 to December 31, 2017. | July 1, 2017 | | $ | 1,000.00 | | $ | 1,000.00 |
| | Ending Account Value | | | | | | |
| Actual Expenses | December 31, 2017 | | $ | 1,059.70 | | $ | 1,020.72 |
| The information in the table under the heading “Actual | Expenses Paid During Period* | | $ | 4.62 | | $ | 4.53 |
| Performance” provides information about actual account values | | | | | | | |
| and actual expenses. You may use the information in this column, | * Expenses are equal to the Fund's annualized expense ratio of 0.89% |
| | (representing the six month period annualized), multiplied by the average |
| together with the amount you invested, to estimate the expenses | account value over the period, multiplied by 184/365 (to reflect the one-half |
| that you paid over the period. Simply divide your account value by | year period) . | | | | | | |
| $1,000 (for example, an $8,600 account value divided by $1,000 | | | | | | | |
| = 8.6), then multiply the result by the number in the first column | | | | | | | |
| in the row entitled “Expenses Paid During Period” to estimate | | | | | | | |
| the expenses you paid on your account during this period. | | | | | | | |
| |
| Hypothetical Example for Comparison Purposes | | | | | | | |
| The information in the table under the heading “Hypothetical | | | | | | | |
| Performance (5% return before expenses)” provides information | | | | | | | |
| about hypothetical account values and hypothetical expenses | | | | | | | |
| based on the Fund’s actual expense ratio and an assumed rate of | | | | | | | |
| return of 5% per year before expenses, which is not the Fund’s | | | | | | | |
| actual return. The hypothetical account values and expenses | | | | | | | |
| may not be used to estimate the actual ending account balance or | | | | | | | |
| expenses you paid for the period. You may use this information | | | | | | | |
| to compare the ongoing costs of investing in the Fund and other | | | | | | | |
| funds. To do so, compare this 5% hypothetical example with the | | | | | | | |
| 5% hypothetical examples that appear in the shareholder reports | | | | | | | |
| of other funds. | | | | | | | |
Global Real Estate Securities Fund 133
Russell Investment Funds
Global Real Estate Securities Fund
Schedule of Investments — December 31, 2017
| | | | | | | | | | | |
| Amounts in thousands (except share amounts) | | | Amounts in thousands (except share amounts) | | |
| | | | Principal | | Fair | | | | Principal | | Fair |
| | | | Amount ($) | | Value | | | | Amount ($) | | Value |
| | | | or Shares | | $ | | | | or Shares | | $ |
| Common Stocks - 97.6% | | | | | | Hong Kong - 11.1% | | | | | |
| Australia - 4.9% | | | | | | Champion REIT(ö) | | | 789,433 | | 579 |
| Arena REIT(ö) | | | 134,618 | | 237 | CK Asset Holdings, Ltd. | | | 1,641,406 | | 14,347 |
| Charter Hall Group - ADR(ö) | | | 660,487 | | 3,095 | Hang Lung Properties, Ltd. - ADR | | | 2,684,620 | | 6,552 |
| Dexus Property Group(ö) | | | 1,053,827 | | 8,004 | Henderson Land Development Co. , Ltd. | | | 564,042 | | 3,717 |
| Goodman Group(ö) | | | 1,275,398 | | 8,361 | Hongkong Land Holdings, Ltd. | | | 1,719,600 | | 12,091 |
| GPT Group (The)(ö) | | | 1,184,770 | | 4,716 | Hopewell Holdings, Ltd. | | | 16,500 | | 61 |
| Mirvac Group(ö) | | | 2,636,827 | | 4,821 | Hysan Development Co. , Ltd. | | | 960,028 | | 5,096 |
| Scentre Group(ö) | | | 2,077,469 | | 6,780 | Link Real Estate Investment Trust(ö) | | | 1,303,349 | | 12,078 |
| Viva Energy(ö) | | | 607,884 | | 1,071 | New World Development Co. , Ltd. | | | 2,615,821 | | 3,930 |
| Westfield Corp. (ö) | | | 912,549 | | 6,762 | Sino Land Co. , Ltd. | | | 1,796,677 | | 3,181 |
| | | | | | 43,847 | Sun Hung Kai Properties, Ltd. | | | 1,312,652 | | 21,864 |
| | | | | | | Swire Properties, Ltd. | | | 3,183,713 | | 10,269 |
| Austria - 0.5% | | | | | | Wharf Holdings, Ltd. (The) | | | 274,434 | | 949 |
| Buwog AG | | | 118,481 | | 4,078 | Wharf Real Estate Investment Co. , Ltd. | | | | | |
| | | | | | | (Æ) | | | 562,434 | | 3,744 |
| Belgium - 0.1% | | | | | | Wheelock & Co. , Ltd. | | | 176,000 | | 1,258 |
| Aedifica(ö) | | | 5,288 | | 500 | | | | | | 99,716 |
| VGP NV | | | 7,201 | | 536 | | | | | | |
| | | | | | 1,036 | Ireland - 0.3% | | | | | |
| | | | | | | Green REIT PLC(ö) | | | 553,783 | | 1,033 |
| Brazil - 0.1% | | | | | | Hibernia REIT PLC(ö) | | | 1,091,180 | | 2,003 |
| BR Malls Participacoes SA | | | 334,068 | | 1,281 | | | | | | 3,036 |
| |
| Canada - 2.4% | | | | | | Japan - 8.8% | | | | | |
| Allied Properties Real Estate Investment | | | | | Activia Properties, Inc. (ö) | | | 720 | | 3,013 |
| Trust(ö) | | | 176,921 | | 5,922 | Daiwa House REIT Investment Corp. (ö) | | | 714 | | 1,696 |
| Boardwalk Real Estate Investment | | | | | | Frontier Real Estate Investment Corp. (ö) | | 384 | | 1,492 |
| Trust(Ñ)(ö) | | | 99,845 | | 3,423 | Global One Real Estate Investment | | | | | |
| Canadian Apartment Properties(ö) | | | 154,186 | | 4,578 | Corp. (ö) | | | 929 | | 3,290 |
| Crombie Real Estate Investment Trust(ö) | | 177 | | 2 | GLP J-REIT(ö) | | | 65 | | 70 |
| Dream Office Real Estate Investment | | | | | | Hulic Co. , Ltd. | | | 411,700 | | 4,608 |
| Trust(ö) | | | 148,605 | | 2,620 | Ichigo Hotel REIT Investment Corp. (ö) | | | 215 | | 233 |
| First Capital Realty, Inc. Class A | | | 66,988 | | 1,104 | Invesco Office J-REIT, Inc. (ö) | | | 234 | | 227 |
| Granite Real Estate Investment Trust(ö) | | | 48,634 | | 1,906 | Invincible Investment Corp. (ö) | | | 5,121 | | 2,177 |
| H&R Real Estate Investment Trust(ö) | | | 37 | | 1 | Japan Logistics Fund, Inc. (ö) | | | 923 | | 1,702 |
| RioCan Real Estate Investment Trust(ö) | | | 94,663 | | 1,834 | Japan Real Estate Investment Corp. (ö) | | | 522 | | 2,478 |
| | | | | | 21,390 | Japan Retail Fund Investment Corp. (ö) | | | 1,662 | | 3,046 |
| | | | | | | Kenedix Office Investment Corp. Class | | | | | |
| Finland - 0.1% | | | | | | A(ö) | | | 460 | | 2,611 |
| Citycon OYJ | | | 224,059 | | 580 | Mitsubishi Estate Co. , Ltd. | | | 844,000 | | 14,666 |
| | | | | | | Mitsui Fudosan Co. , Ltd. | | | 837,620 | | 18,779 |
| France - 3.7% | | | | | | Mori Hills REIT Investment Corp. Class | | | | | |
| Fonciere Des Regions(ö) | | | 17,884 | | 2,027 | A(ö) | | | 1,438 | | 1,738 |
| Gecina SA(ö) | | | 58,169 | | 10,733 | Mori Trust Sogo REIT, Inc. (ö) | | | 255 | | 355 |
| Icad, Inc. (ö) | | | 9,884 | | 972 | Nippon Building Fund, Inc. (ö) | | | 702 | | 3,434 |
| Klepierre SA - GDR(ö) | | | 237,157 | | 10,427 | Nippon Healthcare Investment Corp. (ö) | | | 71 | | 103 |
| Unibail-Rodamco SE(ö) | | | 37,194 | | 9,371 | NTT Urban Development Corp. | | | 234,700 | | 2,717 |
| | | | | | 33,530 | Premier Investment Corp. (ö) | | | 2,163 | | 2,047 |
| | | | | | | Sekisui House REIT, Inc. (ö) | | | 1,010 | | 1,179 |
| Germany - 2.9% | | | | | | Sumitomo Realty & Development Co. , | | | | | |
| ADO Properties SA(Þ) | | | 55,568 | | 2,819 | Ltd. | | | 112,000 | | 3,677 |
| Alstria Office REIT-AG(ö) | | | 237,956 | | 3,675 | Tokyo Tatemono Co. , Ltd. | | | 279,194 | | 3,767 |
| Deutsche Wohnen SE | | | 244,441 | | 10,658 | | | | | | 79,105 |
| TLG Immobilien AG | | | 69,888 | | 1,856 | | | | | | |
| Vonovia SE | | | 150,516 | | 7,450 | Netherlands - 0.7% | | | | | |
| | | | | | 26,458 | Eurocommercial Properties NV | | | 56,415 | | 2,457 |
See accompanying notes which are an integral part of the financial statements.
134 Global Real Estate Securities Fund
Russell Investment Funds
Global Real Estate Securities Fund
Schedule of Investments, continued — December 31, 2017
| | | | | | | | | | |
| Amounts in thousands (except share amounts) | | | Amounts in thousands (except share amounts) | | |
| | | Principal | | Fair | | | | Principal | | Fair |
| | | Amount ($) | | Value | | | | Amount ($) | | Value |
| | | or Shares | | $ | | | | or Shares | | $ |
| InterXion Holding NV(Æ) | | 65,756 | | 3,875 | Alexandria Real Estate Equities, Inc. (ö) | | | 59,515 | | 7,772 |
| | | | | 6,332 | American Campus Communities, Inc. (ö) | | 63,466 | | 2,604 |
| | | | | | American Homes 4 Rent Class A(ö) | | | 15,640 | | 342 |
| Norway - 0.3% | | | | | American Tower Corp. (ö) | | | 60,630 | | 8,650 |
| Entra ASA(Å) | | 172,441 | | 2,562 | Apartment Investment & Management | | | | | |
| | | | | | Co. Class A(ö) | | | 110,627 | | 4,835 |
| Singapore - 0.9% | | | | | AvalonBay Communities, Inc. (ö) | | | 60,013 | | 10,707 |
| CapitaLand, Ltd. | | 97,300 | | 256 | Boston Properties, Inc. (ö) | | | 132,889 | | 17,280 |
| CDL Hospitality Trusts(Æ) | | 1,075,821 | | 1,359 | Brixmor Property Group, Inc. (ö) | | | 114,459 | | 2,136 |
| City Developments, Ltd. | | 329,100 | | 3,061 | Camden Property Trust(ö) | | | 107,815 | | 9,926 |
| Frasers Logistics & Industrial Trust(ö) | | 489,200 | | 424 | CareTrust REIT, Inc. (ö) | | | 36,746 | | 616 |
| Mapletree Logistics Trust(ö) | | 483,700 | | 477 | CBL & Associates Properties, Inc. (Ñ)(ö) | | | 5,459 | | 31 |
| Suntec Real Estate Investment Trust(ö) | | 1,319,200 | | 2,118 | CoreSite Realty Corp. Class A(ö) | | | 24,403 | | 2,780 |
| | | | | 7,695 | Corporate Office Properties Trust(ö) | | | 76,398 | | 2,231 |
| | | | | | Cousins Properties, Inc. (ö) | | | 420,815 | | 3,893 |
| Spain - 1.6% | | | | | CubeSmart(ö) | | | 89,858 | | 2,599 |
| Aedas Homes SAU(Æ)(Þ) | | 36,100 | | 1,324 | CyrusOne, Inc. (ö) | | | 25,971 | | 1,546 |
| Hispania Activos Inmobiliarios Socimi | | | | | DDR Corp. (ö) | | | 59,319 | | 532 |
| SA(ö) | | 33,466 | | 629 | Digital Realty Trust, Inc. (ö) | | | 58,263 | | 6,636 |
| Inmobiliaria Colonial Socimi SA(ö) | | 208,779 | | 2,071 | Douglas Emmett, Inc. (ö) | | | 217,892 | | 8,947 |
| Merlin Properties Socimi SA(ö) | | 777,160 | | 10,521 | Duke Realty Corp. (ö) | | | 136,041 | | 3,702 |
| | | | | 14,545 | Empire State Realty Trust, Inc. Class | | | | | |
| | | | | | A(ö) | | | 269,263 | | 5,528 |
| Sweden - 1.0% | | | | | Equinix, Inc. (ö) | | | 7,795 | | 3,533 |
| Atrium Ljungberg AB Class B | | 24,090 | | 382 | Equity LifeStyle Properties, Inc. Class | | | | | |
| Castellum AB | | 169,077 | | 2,852 | A(ö) | | | 112,002 | | 9,971 |
| Fastighets AB Balder Class B(Æ) | | 75,029 | | 2,006 | Equity Residential(ö) | | | 181,625 | | 11,582 |
| Hufvudstaden AB Class A | | 155,780 | | 2,492 | Essex Property Trust, Inc. (ö) | | | 44,273 | | 10,686 |
| Pandox AB | | 84,279 | | 1,628 | Extended Stay America, Inc. | | | 199,626 | | 3,793 |
| | | | | 9,360 | Extra Space Storage, Inc. (ö) | | | 156,096 | | 13,651 |
| | | | | | Federal Realty Investment Trust(ö) | | | 12,539 | | 1,665 |
| Switzerland - 0.3% | | | | | Forest City Realty Trust, Inc. Class A(ö) | | | 52,711 | | 1,271 |
| PSP Swiss Property AG | | 28,599 | | 2,710 | GEO Group, Inc. (The)(ö) | | | 40,799 | | 963 |
| | | | | | GGP, Inc. (ö) | | | 816,132 | | 19,090 |
| United Kingdom - 8.3% | | | | | HCP, Inc. (ö) | | | 143,859 | | 3,752 |
| Assura PLC(ö) | | 3,113,286 | | 2,686 | Healthcare Realty Trust, Inc. (ö) | | | 156,924 | | 5,040 |
| Big Yellow Group PLC(ö) | | 105,332 | | 1,237 | Hilton Worldwide Holdings, Inc. | | | 91,350 | | 7,295 |
| British Land Co. PLC (The)(ö) | | 1,311,293 | | 12,235 | Host Hotels & Resorts, Inc. (ö) | | | 371,818 | | 7,381 |
| Capital & Counties Properties PLC | | 93 | | — | Hudson Pacific Properties, Inc. (ö) | | | 81,168 | | 2,780 |
| Capital & Regional PLC(ö) | | 289,067 | | 228 | Invitation Homes, Inc. (ö) | | | 231,793 | | 5,463 |
| Derwent London PLC(ö) | | 162,869 | | 6,854 | Iron Mountain, Inc. (ö) | | | 24,633 | | 929 |
| Great Portland Estates PLC | | 1,057,765 | | 9,827 | JBG Smith Properties(ö) | | | 74,962 | | 2,603 |
| Hammerson PLC(Ñ)(ö) | | 1,102,757 | | 8,140 | Kilroy Realty Corp. (ö) | | | 105,398 | | 7,868 |
| Intu Properties PLC Class H(ö) | | 228,467 | | 780 | LaSalle Hotel Properties(ö) | | | 157,822 | | 4,430 |
| Land Securities Group PLC(ö) | | 894,474 | | 12,131 | Life Storage, Inc. (ö) | | | 53,859 | | 4,797 |
| LondonMetric Property PLC(ö) | | 810,202 | | 2,033 | Macerich Co. (The)(ö) | | | 156,717 | | 10,293 |
| LXB Retail Properties PLC(Æ)(Å) | | 353,168 | | 109 | Mack-Cali Realty Corp. (ö) | | | 102,523 | | 2,210 |
| PRS REIT PLC (The)(Æ)(ö)(Å) | | 602,462 | | 860 | MGM Growth Properties LLC Class A(Ñ) | | | | |
| Safestore Holdings PLC(ö) | | 247,275 | | 1,667 | (ö) | | | 16,361 | | 477 |
| Segro PLC(ö) | | 901,533 | | 7,141 | Mid-America Apartment Communities, | | | | | |
| St. Modwen Properties PLC | | 312,245 | | 1,708 | Inc. (ö) | | | 16,066 | | 1,615 |
| Tritax Big Box REIT PLC(ö) | | 652,217 | | 1,311 | Omega Healthcare Investors, Inc. (Ñ)(ö) | | | 79,201 | | 2,181 |
| UNITE Group PLC (The)(ö) | | 369,549 | | 4,014 | Paramount Group, Inc. (ö) | | | 182,050 | | 2,886 |
| Warehouse REIT PLC(Æ)(ö) | | 189,837 | | 268 | Pebblebrook Hotel Trust(Ñ)(ö) | | | 94,637 | | 3,517 |
| Workspace Group PLC(ö) | | 75,547 | | 1,022 | Pennsylvania Real Estate Investment | | | | | |
| | | | | 74,251 | Trust(Ñ)(ö) | | | 42,077 | | 500 |
| | | | | | Prologis, Inc. (ö) | | | 276,297 | | 17,824 |
| United States - 49.6% | | | | | Public Storage(ö) | | | 33,907 | | 7,086 |
| Agree Realty Corp. (ö) | | 69,464 | | 3,573 | | | | | | |
See accompanying notes which are an integral part of the financial statements.
Global Real Estate Securities Fund 135
Russell Investment Funds
Global Real Estate Securities Fund
Schedule of Investments, continued — December 31, 2017
| | | | | | | | |
| | Amounts in thousands (except share amounts) | | | |
| | | | | | Principal | | Fair | |
| | | | | | Amount ($) | | Value | |
| | | | | | or Shares | | $ | |
| | Realty Income Corp. (ö) | | | | 154,056 | | 8,785 | |
| | Regency Centers Corp. (ö) | | | | 103,270 | | 7,144 | |
| | Retail Properties of America, Inc. Class | | | | | | | |
| | A(ö) | | | | 265,017 | | 3,562 | |
| | Rexford Industrial Realty, Inc. (ö) | | | | 230,682 | | 6,727 | |
| | RLJ Lodging Trust(ö) | | | | 65,232 | | 1,433 | |
| | Simon Property Group, Inc. (ö) | | | | 253,265 | | 43,495 | |
| | SL Green Realty Corp. (ö) | | | | 113,978 | | 11,504 | |
| | STORE Capital Corp. (ö) | | | | 150,194 | | 3,911 | |
| | Sun Communities, Inc. (ö) | | | | 70,570 | | 6,547 | |
| | Sunstone Hotel Investors, Inc. (ö) | | | | 446,760 | | 7,385 | |
| | Switch, Inc. Class A(Ñ) | | | | 2,784 | | 51 | |
| | Tanger Factory Outlet Centers, Inc. (Ñ)(ö) | | 57,763 | | 1,532 | |
| | Taubman Centers, Inc. (ö) | | | | 57,895 | | 3,788 | |
| | UDR, Inc. (ö) | | | | 261,194 | | 10,060 | |
| | Urban Edge Properties(ö) | | | | 90,190 | | 2,299 | |
| | Ventas, Inc. (ö) | | | | 144,963 | | 8,699 | |
| | Vornado Realty Trust(ö) | | | | 218,809 | | 17,106 | |
| | Washington Prime Group, Inc. (Ñ)(ö) | | | | 23,036 | | 164 | |
| | Weingarten Realty Investors(ö) | | | | 184,583 | | 6,067 | |
| | Welltower, Inc. (ö) | | | | 139,885 | | 8,921 | |
| | Weyerhaeuser Co. (ö) | | | | 88,511 | | 3,120 | |
| | | | | | | | 446,298 | |
| |
| | Total Common Stocks | | | | | | | |
| | (cost $764,173) | | | | | | 877,810 | |
| |
| Short | -Term Investments - 1.7% | | | | | | | |
| | United States - 1.7% | | | | | | | |
| | U. S. Cash Management Fund(@) | | | | 15,820,435 | (8) | 15,820 | |
| | Total Short-Term Investments | | | | | | | |
| | (cost $15,821) | | | | | | 15,820 | |
| |
| | Other Securities - 1.2% | | | | | | | |
| | U. S. Cash Collateral Fund(×)(@) | | | | 10,495,504 | (8) | 10,496 | |
| | Total Other Securities | | | | | | | |
| | (cost $10,496) | | | | | | 10,496 | |
| |
| | Total Investments 100.5% | | | | | | | |
| | (identified cost $790,490) | | | | | | 904,126 | |
| |
| | Other Assets and Liabilities, Net | | | | | | | |
| - | (0.5%) | | | | | | (4,672 | ) |
| | Net Assets - 100.0% | | | | | | 899,454 | |
See accompanying notes which are an integral part of the financial statements.
136 Global Real Estate Securities Fund
Russell Investment Funds
Global Real Estate Securities Fund
Schedule of Investments, continued — December 31, 2017
| | | | | | | | | | | | | | | |
| Restricted Securities | | | | | | | | | | | | | | | |
| |
| Amounts in thousands (except share and cost per unit amounts) | | | | | | | | | | | | |
| | | | | | | Principal | Cost per | | Cost | | Fair Value | |
| % of Net Assets | | | Acquisition | | | Amount ($) | | Unit | | (000 | ) | (000 | ) |
| Securities | | | Date | | | or shares | | $ | | $ | | $ | |
| 0.4% | | | | | | | | �� | | | | | | | |
| Entra ASA | | | 01/06/15 | NOK | | 48,575 | | 8.74 | | 425 | | 722 | |
| Entra ASA | | | 11/01/16 | NOK | | 114,760 | | 10.36 | | 1,188 | | 1,705 | |
| Entra ASA | | | 11/18/16 | NOK | | | 9,106 | | 11.84 | | 108 | | 135 | |
| LXB Retail Properties PLC | | | 05/28/14 | GBP | | 353,168 | | 2.03 | | 717 | | 109 | |
| PRS REIT PLC (The) | | | 05/31/17 | GBP | | 571,559 | | 1.37 | | 783 | | 816 | |
| PRS REIT PLC (The) | | | 07/17/17 | GBP | | 30,903 | | 1.36 | | 42 | | 44 | |
| | | | | | | | | | | | | | | 3,531 | |
| For a description of restricted securities see note 7 in the Notes to Financial Statements. | | | | | | | | | |
| |
| Futures Contracts | | | | | | | | | | | | | | | |
| |
| Amounts in thousands (except contract amounts) | | | | | | | | | | | | | | | |
| | | | | | | | | | | | | | | Value and | |
| | | | | | | | | | | | | | | Unrealized | |
| | | | | | | | | | | | | Appreciation | |
| | | | Number of | | Notional | Expiration | (Depreciation) | |
| | | | Contracts | | Amount | Date | | | $ | |
| Long Positions | | | | | | | | | | | | | | | |
| Dow U. S. Real Estate Index Futures | | | | 314 | USD | 10,092 | 03/18 | | | 27 | |
| FTSE/EPRA Europe Index Future | | | | 108 | EUR | | 2,413 | 03/18 | | | 50 | |
| Hang Seng Index Futures | | | | | 8 | HKD | 11,979 | 01/18 | | | 13 | |
| MSCI Singapore IX ETS Index Futures | | | | | 15 | SGD | | 582 | 01/18 | | | 3 | |
| S&P/TSX 60 Index Futures | | | | | 4 | CAD | | 766 | 03/18 | | | 1 | |
| SPI 200 Index Futures | | | | | 9 | AUD | | 1,355 | 03/18 | | | 2 | |
| TOPIX Index Futures | | | | | 11 | JPY | 199,869 | 03/18 | | | 15 | |
| Total Value and Unrealized Appreciation (Depreciation) on Open Futures Contracts (å) | | | | | | | | | | | 111 | |
| |
| Foreign Currency Exchange Contracts | | | | | | | | | | | | | | | |
| Amounts in thousands | | | | | | | | | | | | | | | |
| | | | | | | | | | | | | | | Unrealized | |
| | | | | | | | | | | | | | | Appreciation | |
| | | | Amount | | Amount | | | | | (Depreciation) | |
| Counterparty | | | Sold | | Bought | Settlement Date | | $ | |
| Bank of America | | USD | | 222 | | AUD | | 290 | 03/22/18 | | 4 | |
| Bank of America | | USD | | 430 | | AUD | | 572 | 03/22/18 | | 16 | |
| Bank of America | | USD | | 59 | | CAD | | | 74 | 01/02/18 | | — | |
| Bank of America | | USD | | 148 | | CAD | | 190 | 03/22/18 | | 4 | |
| Bank of America | | USD | | 252 | | CAD | | 323 | 03/22/18 | | 6 | |
| Bank of America | | USD | | 550 | | EUR | | 460 | 03/22/18 | | 5 | |
| Bank of America | | USD | 1,323 | | EUR | | 1,115 | 03/22/18 | | 20 | |
| Bank of America | | USD | | 371 | | HKD | | 2,900 | 03/22/18 | | — | |
| Bank of America | | USD | | 633 | | HKD | | 4,932 | 03/22/18 | | — | |
| Bank of America | | USD | | 160 | | JPY | | 17,990 | 03/22/18 | | — | |
| Bank of America | | USD | | 322 | | JPY | | 36,220 | 03/22/18 | | 1 | |
| Bank of America | | USD | | 667 | | JPY | | 74,794 | 03/22/18 | | (1 | ) |
| Bank of America | | USD | | 180 | | SGD | | 243 | 03/22/18 | | 2 | |
| Bank of America | | CAD | | 380 | | USD | | 296 | 03/22/18 | | (7 | ) |
| Bank of America | | EUR | | 240 | | USD | | 284 | 03/22/18 | | (5 | ) |
| Bank of America | | SGD | | 80 | | USD | | | 59 | 03/22/18 | | (1 | ) |
| Bank of America | | SGD | | 80 | | USD | | | 59 | 03/22/18 | | (1 | ) |
| Bank of Montreal | | USD | | 117 | | AUD | | 150 | 03/22/18 | | — | |
| Bank of Montreal | | USD | | 195 | | HKD | | 1,520 | 03/22/18 | | — | |
| Bank of Montreal | | USD | | 162 | | JPY | | 18,210 | 03/22/18 | | — | |
| Brown Brothers Harriman | | USD | | 151 | | CAD | | 190 | 03/22/18 | | — | |
See accompanying notes which are an integral part of the financial statements.
Global Real Estate Securities Fund 137
Russell Investment Funds
Global Real Estate Securities Fund
Schedule of Investments, continued — December 31, 2017
| | | | | | | | | | | | | | | | |
| Foreign Currency Exchange Contracts | | | | | | | | | | | | | | |
| Amounts in thousands | | | | | | | | | | | | | | | | |
| | | | | | | | | | | | | | | | Unrealized | |
| | | | | | | | | | | | | | | | Appreciation | |
| | | | | | Amount | | Amount | | | | | (Depreciation) | |
| Counterparty | | | | | Sold | | Bought | Settlement Date | | | $ | |
| Brown Brothers Harriman | | | | | USD | | 53 | HKD | 417 | | 01/03/18 | | | — | |
| Brown Brothers Harriman | | | | | AUD | | 150 | USD | 113 | | 03/22/18 | | | (4 | ) |
| Brown Brothers Harriman | | | | | AUD | | 150 | USD | 115 | | 03/22/18 | | | (2 | ) |
| Brown Brothers Harriman | | | | | EUR | | 56 | USD | 67 | | 01/02/18 | | | — | |
| Brown Brothers Harriman | | | | | EUR | | 250 | USD | 297 | | 03/22/18 | | | (4 | ) |
| Brown Brothers Harriman | | | | | HKD | | 1,430 | USD | 183 | | 03/22/18 | | | — | |
| Brown Brothers Harriman | | | | | HKD | | 1,460 | USD | 187 | | 03/22/18 | | | — | |
| Brown Brothers Harriman | | | | | JPY | | 11,400 | USD | 101 | | 01/04/18 | | | — | |
| Brown Brothers Harriman | | | | | JPY | | 18,060 | USD | 160 | | 03/22/18 | | | (1 | ) |
| Brown Brothers Harriman | | | | | JPY | | 36,170 | USD | 323 | | 03/22/18 | | | 1 | |
| Brown Brothers Harriman | | | | | SEK | | 111 | USD | 14 | | 01/02/18 | | | — | |
| Brown Brothers Harriman | | | | | SEK | | 158 | USD | 19 | | 01/02/18 | | | — | |
| Brown Brothers Harriman | | | | | SEK | | 83 | USD | 10 | | 01/03/18 | | | — | |
| Brown Brothers Harriman | | | | | SEK | | 230 | USD | 28 | | 01/03/18 | | | — | |
| Commonwealth Bank of Australia | | | | | USD | | 430 | AUD | 572 | | 03/22/18 | | | 16 | |
| Commonwealth Bank of Australia | | | | | USD | | 252 | CAD | 323 | | 03/22/18 | | | 6 | |
| Commonwealth Bank of Australia | | | | | USD | | 1,324 | EUR | 1,115 | | 03/22/18 | | | 20 | |
| Commonwealth Bank of Australia | | | | | USD | | 633 | HKD | 4,932 | | 03/22/18 | | | — | |
| Commonwealth Bank of Australia | | | | | USD | | 668 | JPY | 74,794 | | 03/22/18 | | | (2 | ) |
| Commonwealth Bank of Australia | | | | | USD | | 180 | SGD | 243 | | 03/22/18 | | | 2 | |
| Merrill Lynch | | | | | HKD | | 5,056 | USD | 647 | | 01/02/18 | | | — | |
| State Street | | | | | EUR | | 6 | USD | 7 | | 01/02/18 | | | — | |
| Total Unrealized Appreciation (Depreciation) on Open Foreign Currency Exchange Contracts | | | | | | | | 75 | |
| |
| |
| Presentation of Portfolio Holdings | | | | | | | | | | | | | | |
| |
| Amounts in thousands | | | | | | | | | | | | | | | | |
| | | | | | Fair Value | | | | | | | | | |
| | | | | | | | | | Practical | | | | | | |
| Portfolio Summary | | Level 1 | | | Level 2 | | Level 3 | Expedient (a) | | Total | | % of Net Assets | |
| Common Stocks | | | | | | | | | | | | | | | | |
| Australia | $ | — | | $ | 43,847 | | $ | — | $ | — | $ | 43,847 | | | 4.9 | |
| Austria | | — | | | 4,078 | | | — | | — | | 4,078 | | | 0.5 | |
| Belgium | | — | | | 1,036 | | | — | | — | | 1,036 | | | 0.1 | |
| Brazil | | — | | | 1,281 | | | — | | — | | 1,281 | | | 0.1 | |
| Canada | | 21,390 | | | — | | | — | | — | | 21,390 | | | 2.4 | |
| Finland | | — | | | 580 | | | — | | — | | 580 | | | 0.1 | |
| France | | 6,608 | | | 26,922 | | | — | | — | | 33,530 | | | 3.7 | |
| Germany | | — | | | 26,458 | | | — | | — | | 26,458 | | | 2.9 | |
| Hong Kong | | 3,744 | | | 95,972 | | | — | | — | | 99,716 | | | 11.1 | |
| Ireland | | — | | | 3,036 | | | — | | — | | 3,036 | | | 0.3 | |
| Japan | | — | | | 79,105 | | | — | | — | | 79,105 | | | 8.8 | |
| Netherlands | | 3,875 | | | 2,457 | | | — | | — | | 6,332 | | | 0.7 | |
| Norway | | — | | | 2,562 | | | — | | — | | 2,562 | | | 0.3 | |
| Singapore | | — | | | 7,695 | | | — | | — | | 7,695 | | | 0.9 | |
| Spain | | — | | | 14,545 | | | — | | — | | 14,545 | | | 1.6 | |
| Sweden | | — | | | 9,360 | | | — | | — | | 9,360 | | | 1.0 | |
See accompanying notes which are an integral part of the financial statements.
138 Global Real Estate Securities Fund
Russell Investment Funds
Global Real Estate Securities Fund
Schedule of Investments, continued — December 31, 2017
| | | | | | | | | | | | | | | | | | |
| Presentation of Portfolio Holdings | | | | | | | | | | | | | | | | |
| |
| Amounts in thousands | | | | | | | | | | | | | | | | | | |
| | | | | | Fair Value | | | | | | | | | | | |
| | | | | | | | | | | Practical | | | | | | | |
| Portfolio Summary | | Level 1 | | | Level 2 | | | Level 3 | Expedient (a) | | | Total | | % of Net Assets | |
| Switzerland | | — | | | 2,710 | | | | — | | — | | | 2,710 | | | 0.3 | |
| United Kingdom | | — | | | 74,251 | | | | — | | — | | | 74,251 | | | 8.3 | |
| United States | | 446,298 | | | — | | | | — | | — | | | 446,298 | | | 49.6 | |
| Short-Term Investments | | — | | | — | | | | — | | 15,820 | | | 15,820 | | | 1.7 | |
| Other Securities | | — | | | — | | | | — | | 10,496 | | | 10,496 | | | 1.2 | |
| Total Investments | | 481,915 | | | 395,895 | | | | — | | 26,316 | | | 904,126 | | | 100.5 | |
| Other Assets and Liabilities, Net | | | | | | | | | | | | | | | | | (0.5 | ) |
| | | | | | | | | | | | | | | | | | 100.0 | |
| |
| Other Financial Instruments | | | | | | | | | | | | | | | | | | |
| Assets | | | | | | | | | | | | | | | | | | |
| Futures Contracts | | 111 | | | — | | | | — | | — | | | 111 | | | — * | |
| Foreign Currency Exchange Contracts | | — | | | 103 | | | | — | | — | | | 103 | | | — * | |
| A | | | | | | | | | | | | | | | | | | |
| Liabilities | | | | | | | | | | | | | | | | | | |
| Foreign Currency Exchange Contracts | | — | | | (28 | ) | | | — | | — | | | (28 | ) | | (—)* | |
| Total Other Financial Instruments** | $ | 111 | | $ | 75 | | $ | | — | $ | — | | $ | 186 | | | | |
| |
| * | Less than 0.05% of net assets. |
| ** | Futures and foreign currency exchange contract values reflect the unrealized appreciation (depreciation) on the investments. |
| (a) | Certain investments that are measured at fair value using the net asset value per share (or its equivalent) practical expedient have not been classified |
| | in the fair value levels. The fair value amounts presented in the table are intended to permit reconciliation to the amounts presented in the Schedule of |
| | Investments. |
For a description of the Levels, see note 2 in the Notes to Financial Statements.
For a disclosure on transfers between Levels 1, 2 and 3 during the period ended December 31, 2017, see note 2 in the Notes to
Financial Statements.
| | | |
| Amounts in thousands | | | |
| | Fair Value | |
| Property Sector Exposure | | $ | |
| Diversified | | 277,963 | |
| Healthcare | | 31,998 | |
| Industrial | | 50,447 | |
| Lodging/Resorts | | 40,875 | |
| Office | | 147,779 | |
| Residential | | 121,226 | |
| Retail | | 176,485 | |
| Self Storage | | 31,037 | |
| Short-Term Investments | | 15,820 | |
| Other Securities | | 10,496 | |
| Total Investments | | 904,126 | |
See accompanying notes which are an integral part of the financial statements.
Global Real Estate Securities Fund 139
Russell Investment Funds
Global Real Estate Securities Fund
Fair Value of Derivative Instruments — December 31, 2017
Amounts in thousands
| | | | | | |
| | | | | | Foreign |
| | | Equity | | Currency |
| Derivatives not accounted for as hedging instruments | Contracts | | Contracts |
| |
| Location: Statement of Assets and Liabilities - Assets | | | | | |
| Unrealized appreciation on foreign currency exchange contracts | $ | — | | $ | 103 |
| Variation margin on futures contracts* | | | 111 | | | — |
| Total | | $ | 111 | | $ | 103 |
| |
| |
| Location: Statement of Assets and Liabilities - Liabilities | | | | | |
| Unrealized depreciation on foreign currency exchange contracts | $ | — | | $ | 28 |
| | | | | | Foreign |
| | | Equity | | Currency |
| Derivatives not accounted for as hedging instruments | Contracts | | Contracts |
| |
| Location: Statement of Operations - Net realized gain (loss) | | | | | |
| Futures contracts | | $ | 2,428 | | $ | — |
| Foreign currency exchange contracts | | | — | | | 262 |
| Total | | $ | 2,428 | | $ | 262 |
| |
| |
| Location: Statement of Operations - Net change in unrealized appreciation (depreciation) | | | | | |
| Futures contracts | | $ | (321 | ) | $ | — |
| Foreign currency exchange contracts | | | — | | | 395 |
| Total | | $ | (321 | ) | $ | 395 |
* Includes cumulative appreciation/depreciation of futures contracts as reported in the Schedule of Investments. Only variation margin is reported within the
Statement of Assets and Liabilities.
For further disclosure on derivatives see note 2 in the Notes to Financial Statements.
See accompanying notes which are an integral part of the financial statements.
140 Global Real Estate Securities Fund
Russell Investment Funds
Global Real Estate Securities Fund
Balance Sheet Offsetting of Financial and Derivative Instruments —
December 31, 2017
| | | | | | | | | | | | | |
| Amounts in thousands | | | | | | | | | | | | | |
| |
| Offsetting of Financial Assets and Derivative Assets | | | | | | | | | | | | |
| | | | | | | | | | Gross | Net Amounts | |
| | | | | | | | Amounts | | | of Assets | |
| | | | | | | Gross | Offset in the | Presented in | |
| | | | | Amounts of | Statement of | the Statement | |
| | | | | Recognized | | | Assets and | of Assets and | |
| Description | Location: Statement of Assets and Liabilities - Assets | | | Assets | Liabilities | | | Liabilities | |
| Securities on Loan* | Investments, at fair value | | | $ | | 10,146 | | $ | — | | $ | 10,146 | |
| Foreign Currency Exchange Contracts | Unrealized appreciation on foreign currency exchange contracts | | | 103 | | | — | | | 103 | |
| Futures Contracts | Variation margin on futures contracts | | | | | 13 | | | — | | | 13 | |
| Total Financial and Derivative Assets | | | | | | 10,262 | | | — | | | 10,262 | |
| Financial and Derivative Assets not subject to a netting agreement | | | | | (13 | ) | | — | | | (13 | ) |
| Total Financial and Derivative Assets subject to a netting agreement | | | $ | | 10,249 | | $ | — | | $ | 10,249 | |
| |
| |
| |
| Financial Assets, Derivative Assets, and Collateral Held by Counterparty | | | | | | | | | | | |
| | | | | Gross Amounts Not Offset in | | | | |
| | | | | the Statement of Assets and | | | | |
| | | | | | | Liabilities | | | | | | |
| |
| | | Net Amounts | | | | | | | | | |
| | | | of Assets | | | | | | | | | |
| | | Presented in | | | | | | | | | |
| | | the Statement | | Financial and | | | | | | |
| | | of Assets and | | | Derivative | | Collateral | | | |
| Counterparty | | | Liabilities | | | Instruments | | Received^ | | Net Amount | |
| Bank of America | | $ | 58 | $ | 14 | $ | — | $ | 44 | |
| Barclays | | | 4,191 | | — | | 4,191 | | — | |
| Brown Brothers Harriman | | | 1 | | | 1 | | — | | — | |
| Citigroup | | | 798 | | — | | 798 | | — | |
| Commonwealth Bank of Australia | | | 44 | | | 2 | | — | | 42 | |
| Goldman Sachs | | | 1,408 | | — | | 1,408 | | — | |
| ING | | | 55 | | — | | 55 | | — | |
| JPMorgan Chase | | | 434 | | — | | 434 | | — | |
| Merrill Lynch | | | 3,180 | | — | | 3,180 | | — | |
| Morgan Stanley | | | 80 | | — | | 80 | | — | |
| Total | | $ | 10,249 | $ | 17 | $ | 10,146 | $ | 86 | |
See accompanying notes which are an integral part of the financial statements.
Global Real Estate Securities Fund 141
Russell Investment Funds
Global Real Estate Securities Fund
Balance Sheet Offsetting of Financial and Derivative Instruments, continued —
December 31, 2017
| | | | | | | | | |
| Amounts in thousands | | | | | | | | | |
| |
| Offsetting of Financial Liabilities and Derivative Liabilities | | | | | | | | |
| | | | | Gross | Net Amounts | |
| | | | | Amounts | of Liabilities | |
| | | Gross | Offset in the | Presented in | |
| | | Amounts of | Statement of | the Statement | |
| | | Recognized | Assets and | of Assets and | |
| Description | Location: Statement of Assets and Liabilities - Liabilities | Liabilities | Liabilities | | Liabilities | |
| Futures Contracts | Variation margin on futures contracts | $ | 18 | | $ | — $ | 18 | |
| Foreign Currency Exchange Contracts | Unrealized depreciation on foreign currency exchange contracts | | 28 | | | — | 28 | |
| Total Financial and Derivative Liabilities | | | 46 | | | — | 46 | |
| Financial and Derivative Liabilities not subject to a netting agreement | | (18 | ) | | — | (18 | ) |
| Total Financial and Derivative Liabilities subject to a netting agreement | $ | 28 | | $ | — $ | 28 | |
| | | | | | | | | |
| Financial Liabilities, Derivative Liabilities, and Collateral Pledged by Counterparty | | | | | | | | |
| | | | Gross Amounts Not Offset in | |
| | | | the Statement of Assets and | |
| | | | | | Liabilities | | | |
| |
| |
| | Net Amounts | | | | | | | |
| | of Liabilities | | | | | | | |
| | Presented in | | | | | | | |
| | the Statement | Financial and | | | | |
| | of Assets and | Derivative | Collateral | | |
| Counterparty | Liabilities | Instruments | Pledged^ | Net Amount |
| Bank of America | $ | 15 | | $ | 14 | $ | — | $ | 1 |
| Brown Brothers Harriman | | 11 | | | 1 | | — | | 10 |
| Commonwealth Bank of Australia | | 2 | | | 2 | | — | | — |
| Total | $ | 28 | | $ | 17 | $ | — | $ | 11 |
* Fair value of securities on loan as reported in the footnotes to the Statement of Assets and Liabilities.
^ Collateral received or pledged amounts may not reconcile to those disclosed in the Statement of Assets and Liabilities due to the inclusion of off-Balance
Sheet collateral and adjustments made to exclude overcollateralization.
For further disclosure on derivatives and counterparty risk see note 2 in the Notes to Financial Statements.
See accompanying notes which are an integral part of the financial statements.
142 Global Real Estate Securities Fund
Russell Investment Funds
Global Real Estate Securities Fund
Statement of Assets and Liabilities — December 31, 2017
| | |
| Amounts in thousands | | |
| Assets | | |
| Investments, at identified cost | $ | 790,490 |
| Investments, at fair value(*)(>) | | 904,126 |
| Cash (restricted)(a) | | 1,670 |
| Foreign currency holdings(^) | | 477 |
| Unrealized appreciation on foreign currency exchange contracts | | 103 |
| Receivables: | | |
| Dividends and interest | | 3,088 |
| Dividends from affiliated funds | | 16 |
| Investments sold | | 3,824 |
| Fund shares sold | | 31 |
| Foreign capital gains taxes recoverable | | 127 |
| Variation margin on futures contracts | | 13 |
| Total assets | | 913,475 |
| |
| Liabilities | | |
| Payables: | | |
| Investments purchased | | 2,452 |
| Fund shares redeemed | | 228 |
| Accrued fees to affiliates | | 644 |
| Other accrued expenses | | 155 |
| Variation margin on futures contracts | | 18 |
| Unrealized depreciation on foreign currency exchange contracts | | 28 |
| Payable upon return of securities loaned | | 10,496 |
| Total liabilities | | 14,021 |
| |
| Net Assets | $ | 899,454 |
See accompanying notes which are an integral part of the financial statements.
Global Real Estate Securities Fund 143
Russell Investment Funds
Global Real Estate Securities Fund
Statement of Assets and Liabilities, continued — December 31, 2017
| | | |
| Amounts in thousands | | | |
| Net Assets Consist of: | | | |
| Undistributed (overdistributed) net investment income | $ | (17,487 | ) |
| Accumulated net realized gain (loss) | | (13,450 | ) |
| Unrealized appreciation (depreciation) on: | | | |
| Investments | | 113,636 | |
| Futures contracts | | 111 | |
| Foreign currency exchange contracts | | 75 | |
| Foreign currency-related transactions | | 11 | |
| Shares of beneficial interest | | 607 | |
| Additional paid-in capital | | 815,951 | |
| Net Assets | $ | 899,454 | |
| |
| Net Asset Value, offering and redemption price per share: | | | |
| Net asset value per share: (#) | $ | 14.81 | |
| Net assets | $ | 899,453,751 | |
| Shares outstanding ($. 01 par value) | | 60,714,994 | |
| Amounts in thousands | | | |
| (^) Foreign currency holdings - cost | $ | 475 | |
| (*) Securities on loan included in investments | $ | 10,146 | |
| (>) Investments in affiliates, U. S. Cash Management Fund and U. S. Cash Collateral Fund | $ | 26,316 | |
| |
| (a) Cash Collateral for Futures | $ | 1,670 | |
| (#) Net asset value per share equals net assets divided by shares of beneficial interest outstanding. | | | |
See accompanying notes which are an integral part of the financial statements.
144 Global Real Estate Securities Fund
Russell Investment Funds
Global Real Estate Securities Fund
Statement of Operations — For the Period Ended December 31, 2017
| | | |
| Amounts in thousands | | | |
| Investment Income | | | |
| Dividends | $ | 26,222 | |
| Dividends from affiliated funds | | 217 | |
| Securities lending income (net) | | 16 | |
| Securities lending income from affiliated funds (net) | | 68 | |
| Less foreign taxes withheld | | (1,059 | ) |
| Total investment income | | 25,464 | |
| |
| Expenses | | | |
| Advisory fees | | 6,762 | |
| Administrative fees | | 423 | |
| Custodian fees | | 302 | |
| Transfer agent fees | | 37 | |
| Professional fees | | 92 | |
| Trustees’ fees | | 23 | |
| Printing fees | | 112 | |
| Miscellaneous | | 23 | |
| Total expenses | | 7,774 | |
| Net investment income (loss) | | 17,690 | |
| |
| Net Realized and Unrealized Gain (Loss) | | | |
| Net realized gain (loss) on: | | | |
| Investments | | 26,340 | |
| Investments in affiliated funds | | (3 | ) |
| Futures contracts | | 2,428 | |
| Foreign currency exchange contracts | | 262 | |
| Foreign currency-related transactions | | 150 | |
| Net realized gain (loss) | | 29,177 | |
| Net change in unrealized appreciation (depreciation) on: | | | |
| Investments | | 47,741 | |
| Investments in affiliated funds | | (1 | ) |
| Futures contracts | | (321 | ) |
| Foreign currency exchange contracts | | 395 | |
| Foreign currency-related transactions | | 73 | |
| Net change in unrealized appreciation (depreciation) | | 47,887 | |
| Net realized and unrealized gain (loss) | | 77,064 | |
| Net Increase (Decrease) in Net Assets from Operations | $ | 94,754 | |
See accompanying notes which are an integral part of the financial statements.
Global Real Estate Securities Fund 145
Russell Investment Funds
Global Real Estate Securities Fund
Statements of Changes in Net Assets
| | | | | | |
| | For the Periods Ended December 31, | |
| Amounts in thousands | | 2017 | | | 2016 | |
| Increase (Decrease) in Net Assets | | | | | | |
| Operations | | | | | | |
| Net investment income (loss) | $ | 17,690 | | $ | 16,312 | |
| Net realized gain (loss) | | 29,177 | | | 28,621 | |
| Net change in unrealized appreciation (depreciation) | | 47,887 | | | (20,700 | ) |
| Net increase (decrease) in net assets from operations | | 94,754 | | | 24,233 | |
| |
| Distributions | | | | | | |
| From net investment income | | (31,188 | ) | | (29,925 | ) |
| From net realized gain | | (16,441 | ) | | (24,898 | ) |
| From return of capital | | — | | | (6,508 | ) |
| Net decrease in net assets from distributions | | (47,629 | ) | | (61,331 | ) |
| |
| Share Transactions* | | | | | | |
| Net increase (decrease) in net assets from share transactions | | 51,511 | | | 59,825 | |
| Total Net Increase (Decrease) in Net Assets | | 98,636 | | | 22,727 | |
| |
| Net Assets | | | | | | |
| Beginning of period | | 800,818 | | | 778,091 | |
| End of period | $ | 899,454 | | $ | 800,818 | |
| Undistributed (overdistributed) net investment income included in net assets | $ | (17,487 | ) | $ | (12,213 | ) |
* Share transaction amounts (in thousands) for the periods ended December 31, 2017 and December 31, 2016 were as follows:
| | | | | | | | | | | | |
| | | 2017 | | | | 2016 | | |
| | | Shares | | | Dollars | | | Shares | | | Dollars | |
| |
| Proceeds from shares sold | | 2,324 | | $ | 33,928 | | | 2,178 | | $ | 31,955 | |
| Proceeds from reinvestment of distributions | | 3,266 | | | 47,629 | | | 4,337 | | | 61,331 | |
| Payments for shares redeemed | | (2,058 | ) | | (30,046 | ) | | (2,221 | ) | | (33,461 | ) |
| Total increase (decrease) | | 3,532 | | $ | 51,511 | | | 4,294 | | $ | 59,825 | |
See accompanying notes which are an integral part of the financial statements.
146 Global Real Estate Securities Fund
(This page intentionally left blank)
Russell Investment Funds
Global Real Estate Securities Fund
Financial Highlights — For the Periods Ended
For a Share Outstanding Throughout Each Period.
| | | | | | | | | | | | | | | | | | |
| | | | | $ | | | | | | | | | | | | | | |
| | | $ | | Net | | $ | | | $ | | $ | | | $ | | | | |
| | Net Asset Value, | | Investment | | Net Realized | | | Total from | | Distributions | | | Distributions | | | $ | |
| | Beginning of | | Income | | and Unrealized | | | Investment | | from Net | | | from Net | | | Return of | |
| | | Period | | (Loss)(a)(b) | | Gain (Loss) | | | Operations | | Investment Income | | | Realized Gain | | | Capital | |
| December 31, 2017 | | 14.00 | | . 29 | | 1.34 | | | 1.63 | | (. 54 | ) | | (. 28 | ) | | — | |
| December 31, 2016 | | 14.71 | | . 31 | | . 13 | | | . 44 | | (. 57 | ) | | (. 46 | ) | | (. 12 | ) |
| December 31, 2015 | | 15.63 | | . 29 | | (. 25 | ) | | . 04 | | (. 25 | ) | | (. 71 | ) | | — | |
| December 31, 2014 | | 14.68 | | . 28 | | 1.89 | | | 2.17 | | (. 52 | ) | | (. 70 | ) | | — | |
| December 31, 2013 | | 15.37 | | . 31 | | . 24 | | | . 55 | | (. 63 | ) | | (. 61 | ) | | — | |
| | | | | | | | | | | | | | | | | | | |
See accompanying notes which are an integral part of the financial statements.
148 Global Real Estate Securities Fund
| | | | | | | | | | | | | | | | |
| | | | | | | | | | | | % | | % | | % | |
| | | | | $ | | | | $ | | | Ratio of Expenses | | Ratio of Expenses | Ratio of Net | |
| | | | | Net Asset Value, | | % | | Net Assets, | | | to Average | | to Average | Investment Income | % |
| | $ | | | End of | | Total | | End of Period | | | Net Assets, | | Net Assets, | to Average | Portfolio |
| Total Distributions | | | Period | | Return(d) | | (000 | ) | | Gross | | Net(b) | Net Assets(b) | Turnover Rate |
| (. 82 | ) | | 14.81 | | 11.80 | | 899,454 | | | . 92 | | . 92 | | 2.09 | 84 |
| (1.15 | ) | | 14.00 | | 3.02 | | 800,818 | | | . 94 | | . 94 | | 2.06 | 91 |
| (. 96 | ) | | 14.71 | | . 25 | | 778,091 | | | . 93 | | . 93 | | 1.86 | 64 |
| (1.22 | ) | | 15.63 | | 14.75 | | 777,376 | | | . 95 | | . 95 | | 1.76 | 64 |
| (1.24 | ) | | 14.68 | | 3.70 | | 658,413 | | | . 93 | | . 93 | | 1.97 | 72 |
See accompanying notes which are an integral part of the financial statements.
Global Real Estate Securities Fund 149
Russell Investment Funds
Global Real Estate Securities Fund
Related Party Transactions, Fees and Expenses
Accrued fees payable to affiliates for the period ended December 31, 2017 were as follows:
| | |
| Advisory fees | $ | 601,560 |
| Administration fees | | 37,598 |
| Transfer agent fees | | 3,308 |
| Trustee fees | | 1,730 |
| | $ | 644,196 |
Transactions (amounts in thousands) during the period ended December 31, 2017 with Underlying Funds which are, or were, an
affiliated company are as follows:
| | | | | | | | | | | | | | | | | | | |
| | | Fair Value, | | | | | | | | Change in | | | | | | | | | |
| | Beginning of | | | | Realized Gain | | Unrealized | Fair Value, End | | | Income | Capital Gains |
| | | Period | | Purchases | | Sales | | (Loss) | | Gain (Loss) | of Period | Distributions | Distributions |
| U. S. Cash Collateral Fund | $ | 931 | $ | 101,209 | $ | 91,644 | $ | — | $ | — | | $ | 10,496 | | $ | 68 | | $ | — |
| U. S. Cash Management Fund | | 26,925 | | 191,168 | | 202,269 | | (3 | ) | (1 | ) | | 15,820 | | | 217 | | | — |
| | $ | 27,856 | $ | 292,377 | $ | 293,913 | $ | (3 | ) $ | (1 | ) | $ | 26,316 | | $ | 285 | | $ | — |
Federal Income Taxes
At December 31, 2017, the cost of investments and net unrealized appreciation (depreciation), undistributed ordinary income and
undistributed long-term capital gains for income tax purposes were as follows:
| | | | |
| Cost of Investments | $ | | 831,143,738 | |
| Unrealized Appreciation | $ | | 80,726,105 | |
| Unrealized Depreciation | | | (7,653,910 | ) |
| Net Unrealized Appreciation (Depreciation) | $ | | 73,072,195 | |
| Undistributed Ordinary Income | $ | | 9,619,392 | |
| Undistributed Long-Term Capital Gains | | | | |
| (Capital Loss Carryforward) | $ | | 196,320 | |
| Tax Composition of Distributions | | | | |
| Ordinary Income | $ | | 31,187,678 | |
| Long-Term Capital Gains | $ | | 16,441,237 | |
Net investment income and net realized gains (losses) in the financial statements may differ from taxable net investment income and
net realized gains (losses). Capital accounts within the financial statements are adjusted for permanent book-tax differences. Book-tax
differences are primarily due to foreign currency gains and losses, reclassifications of dividends, differences in treatment of income
from swaps, net operating losses, investments in partnerships, investments in passive foreign investment companies (PFICs), tax
straddle transaction, use of tax equalization and foreign capital gains taxes. These adjustments have no impact on the net assets. At
December 31, 2017, the Statement of Assets and Liabilities have been adjusted by the following amounts (in thousands):
| | | |
| Undistributed net investment income | $ | 8,224 | |
| Accumulated net realized gain (loss) | | (8,224 | ) |
| Additional paid-in capital | | — | |
See accompanying notes which are an integral part of the financial statements.
150 Global Real Estate Securities Fund
Russell Investment Funds
Notes to Schedule of Investments — December 31, 2017
Footnotes:
(Æ) Non-income-producing security.
(ö) Real Estate Investment Trust (REIT).
(§) All or a portion of the shares of this security are pledged as collateral in connection with futures contracts purchased (sold), options
written, or swaps entered into by the Fund.
(~ ) Rate noted is yield-to-maturity from date of acquisition.
(ç) At amortized cost, which approximates market.
(Ê) Variable, adjustable or floating rate security. Rate shown reflects rate in effect at period end.
(Ï) Forward commitment.
(ƒ) Perpetual floating rate security. Rate shown reflects rate in effect at period end.
(µ) Bond is insured by a guarantor.
(æ) Pre-refunded: These bonds are collateralized by U.S. Treasury securities, which are held in escrow by a trustee and used to pay
principal and interest in the tax-exempt issue and to retire the bonds in full at the earliest refunding date.
(Ø) In default.
(ß) Illiquid security. See Note 7.
(x) The security is purchased with the cash collateral from the securities loaned.
(Ñ) All or a portion of the shares of this security are on loan.
(~) Rate fluctuates based on various factors such as changes in current rates and prepayments of the underlying assets, changes in the
CPI or other contractual arrangements.
(ì) All or a portion of the shares of this security are pledged as collateral in connection with options written contracts.
(¢) Date shown reflects next contractual call date.
(Þ) Restricted security. Security may have contractual restrictions on resale, may have been offered in a private placement transaction,
and may not be registered under the Securities Act of 1933. See Note 7.
(ÿ) Notional Amount in thousands.
(Š) Value was determined using significant unobservable inputs.
(Å) Illiquid and restricted security. See Note 7.
(@) Affiliate.
(Ÿ) Rate noted is dividend yield at period end.
(å) Currency balances were pledged in connection with futures contracts purchased (sold), options written, or swaps entered into by the
Fund. See Note 2.
(8) Unrounded units.
(v) Loan agreement still pending. Rate not available at period end.
(1) Weekly payment frequency.
(2) Quarterly payment frequency.
(3) Semi-annual payment frequency.
(4) Annual payment frequency.
(5) Payment at termination.
Abbreviations:
144A - Represents private placement security for qualified buyers according to rule 144A of the Securities Act of 1933.
ADR - American Depositary Receipt
ADS - American Depositary Share
BBSW - Bank Bill Swap Reference Rate
CIBOR - Copenhagen Interbank Offered Rate
CME - Chicago Mercantile Exchange
CMO - Collateralized Mortgage Obligation
CVO - Contingent Value Obligation
EMU - European Economic and Monetary Union
EURIBOR - Euro Interbank Offered Rate
FDIC - Federal Deposit Insurance Company
GDR - Global Depositary Receipt
GDS - Global Depositary Share
HIBOR – Hong Kong Interbank Offered Rate
LIBOR - London Interbank Offered Rate
NIBOR - Norwegian Interbank Offered Rate
PIK - Payment in Kind
Notes to Schedule of Investments 151
Russell Investment Funds
Notes to Schedule of Investments, continued — December 31, 2017
PRIBOR – Prague Interbank Offered Rate
REMIC - Real Estate Mortgage Investment Conduit
SIBOR – Singapore Interbank Offered Rate
STRIP - Separate Trading of Registered Interest and Principal of Securities
TBA - To Be Announced Security
UK - United Kingdom
152 Notes to Schedule of Investments
Russell Investment Funds
Notes to Schedule of Investments, continued — December 31, 2017
| | |
| Foreign Currency Abbreviations: | | |
| ARS - Argentine peso | HUF - Hungarian forint | PKR - Pakistani rupee |
| AUD - Australian dollar | IDR - Indonesian rupiah | PLN - Polish zloty |
| BRL - Brazilian real | ILS - Israeli shekel | RUB - Russian ruble |
| CAD - Canadian dollar | INR - Indian rupee | SEK - Swedish krona |
| CHF - Swiss franc | ISK - Icelandic krona | SGD - Singapore dollar |
| CLP - Chilean peso | ITL - Italian lira | SKK - Slovakian koruna |
| CNY - Chinese renminbi yuan | JPY - Japanese yen | THB - Thai baht |
| COP - Colombian peso | KES - Kenyan schilling | TRY - Turkish lira |
| CRC - Costa Rican colon | KRW - South Korean won | TWD - Taiwanese dollar |
| CZK - Czech koruna | MXN - Mexican peso | USD - United States dollar |
| DKK - Danish krone | MYR – Malaysian ringgit | VEB - Venezuelan bolivar |
| EGP - Egyptian pound | NOK - Norwegian krone | VND - Vietnamese dong |
| EUR - Euro | NZD - New Zealand dollar | ZAR - South African rand |
| GBP - British pound sterling | PEN - Peruvian nuevo sol | |
| HKD – Hong Kong dollar | PHP – Philippine peso | |
Notes to Schedule of Investments 153
Russell Investment Funds
Notes to Financial Highlights — December 31, 2017
(a) Average daily shares outstanding were used for this calculation.
(b) May reflect amounts waived and/or reimbursed by Russell Investment Management, LLC (“RIM”).
(c) Less than $.01 per share.
(d) The total return does not reflect any Insurance Company Separate Account or Policy Charges.
(e) Gross and Net Expense Ratios for the period ended December 31, 2016 include a reimbursement from State Street for the overbilling of custody expenses in
prior years. Without the reimbursement, the expense ratios would have been higher by the amount listed below.
| | |
| | Impact of the fee reimbursement on | |
| Fund | gross and net expense ratios | |
| U. S. Strategic Equity Fund | 0.01 | % |
| U. S. Small Cap Equity Fund | 0.01 | % |
| International Developed Markets Fund | 0.05 | % |
See accompanying notes which are an integral part of the financial statements.
154 Notes to Financial Highlights
Russell Investment Funds
Notes to Financial Statements — December 31, 2017
1. Organization
Russell Investment Funds (the “Investment Company” or “RIF”) is a series investment company with nine different investment
portfolios referred to as funds (each a “Fund” and collectively the “Funds”). These financial statements report on five of these
Funds. The Investment Company provides the investment base for one or more variable insurance products issued by one or more
insurance companies. These Funds are offered at net asset value (“NAV”) to qualified insurance company separate accounts offering
variable insurance products. The Investment Company is registered under the Investment Company Act of 1940, as amended
(“Investment Company Act”), as an open-end management investment company. It is organized and operated as a Massachusetts
business trust under an Amended and Restated Master Trust Agreement dated October 1, 2008, as amended (“Master Trust
Agreement”), and the provisions of Massachusetts law governing the operation of a Massachusetts business trust. The Investment
Company’s Master Trust Agreement permits the Board of Trustees (the “Board”) to issue an unlimited number of shares of beneficial
interest. Each of the Funds is diversified. Under the Investment Company Act, a diversified company is defined as a management
company which meets the following requirements: at least 75% of the value of its total assets is represented by cash and cash items
(including receivables), government securities, securities of other investment companies, and other securities for the purposes of
this calculation limited in respect of any one issuer to an amount not greater in value than five percent of the value of the total assets
of such management company and to not more than 10% of the outstanding voting securities of such issuer.
2. Significant Accounting Policies
The Funds’ financial statements are prepared in accordance with U.S. generally accepted accounting principles (“U.S. GAAP”)
which require the use of management estimates and assumptions at the date of the financial statements. Actual results could differ
from those estimates. The Funds are considered investment companies under U.S. GAAP and follow the accounting and reporting
guidance applicable to investment companies. The following is a summary of the significant accounting policies consistently
followed by each Fund in the preparation of its financial statements.
In October 2016, the U.S. Securities and Exchange Commission (“SEC”) adopted new rules and forms, and amendments to certain
current rules and forms, to modernize reporting and disclosure of information by registered investment companies. The amendments
to Regulation S-X require standardized, enhanced disclosure about derivatives in investment company financial statements, and
also change the rules governing the form and content of such financial statements. The amendments to Regulation S-X took effect
on August 1, 2017 and the financial statements have been modified accordingly, as applicable, and had no impact on the Funds'
net assets or results of operations.
Security Valuation
The Funds value portfolio securities according to Board-approved securities valuation procedures which include market and fair
value procedures. The Board has delegated the responsibility for administration of the securities valuation procedures to Russell
Investments Fund Services, LLC ("RIFUS").
U.S. GAAP defines fair value as the price that a Fund would receive to sell an asset or pay to transfer a liability in an orderly
transaction between market participants at the measurement date. It establishes a fair value hierarchy that prioritizes inputs to
valuation methods and requires a separate disclosure of the fair value hierarchy for each major category of assets and liabilities,
that segregates fair value measurements into levels (Level 1, 2, and 3). The inputs or methodology used for valuing securities are
not necessarily an indication of the risk associated with investing in those securities. Levels 1, 2 and 3 of the fair value hierarchy
are defined as follows:
• Level 1 — Quoted prices (unadjusted) in active markets or exchanges for identical assets and liabilities.
• Level 2 — Inputs other than quoted prices included within Level 1 that are observable, which may include, but are not
limited to, quoted prices for similar assets or liabilities in markets that are active, quoted prices for identical or similar assets
or liabilities in markets that are not active, and inputs such as interest rates, yield curves, implied volatilities, credit spreads
or other market corroborated inputs.
• Level 3 — Significant unobservable inputs based on the best information available in the circumstances, to the extent
observable inputs are not available, which may include assumptions made by RIFUS, acting at the discretion of the Board,
that are used in determining the fair value of investments.
The availability of observable inputs can vary from security to security and is affected by a wide variety of factors, including, for
example, the type of security, whether the security is new and not yet established in the marketplace, the liquidity of markets, and
other characteristics particular to the security. To the extent that valuation is based on models or inputs that are less observable or
unobservable in the market, the determination of fair value requires more judgment. Accordingly, the degree of judgment exercised
Notes to Financial Statements 155
Russell Investment Funds
Notes to Financial Statements, continued — December 31, 2017
in determining fair value is greatest for instruments categorized in Level 3. The inputs or methodology used for valuing securities
are not necessarily an indication of the risk associated with investing in those securities.
The inputs used to measure fair value may fall into different levels of the fair value hierarchy. In such cases, for disclosure purposes,
the level in the fair value hierarchy within which the fair value measurement falls is determined based on the lowest level input that
is significant to the fair value measurement in its entirety.
The valuation techniques and significant inputs used in determining the fair market values of financial instruments categorized as
Level 1 and Level 2 of the fair value hierarchy are as follows:
Equity securities, including common and preferred stock, short securities and restricted securities that are traded on a national
securities exchange (or reported on the NASDAQ national market), are stated at the last reported sales price on the day of valuation
or official closing price, as applicable. To the extent these securities are actively traded, and valuation adjustments are not applied,
they are categorized as Level 1 of the fair value hierarchy. Preferred stock and other equities traded on inactive markets or valued
by reference to similar instruments are categorized as Level 2 of the fair value hierarchy. Certain foreign equity securities may
be fair valued using a pricing service that considers the correlation of the trading patterns of the foreign security to the intraday
trading in the U.S. markets for investments such as American Depositary Receipts, financial futures, exchange-traded funds, and
the movement of certain indexes of securities, based on the statistical analysis of historical relationships. Foreign equity securities
prices as described above are categorized as Level 2 of the fair value hierarchy.
Fixed income securities including corporate, convertible, U.S. government agency, municipal bonds and notes, U.S. treasury
obligations, sovereign issues, bank loans, bank notes and non-U.S. bonds are normally valued by pricing service providers that use
broker dealer quotations or valuation estimates from their internal pricing models. The pricing service providers’ internal models
use inputs that are observable such as issuer details, interest rates, yield curves, prepayment speeds, credit risks/spreads and
default rates. Such fixed income securities that use pricing service internal models as described above are categorized as Level
2 of the fair value hierarchy. Such fixed income securities that use broker dealer quotations are categorized as Level 3 of the fair
value hierarchy.
Fixed income securities purchased on a delayed-delivery basis and marked-to-market daily until settlement at the forward settlement
date are categorized as Level 2 of the fair value hierarchy.
Mortgage and asset-backed securities are usually issued as separate tranches, or classes, of securities within each deal. These
securities are also normally valued by pricing service providers that use broker dealer quotations or valuation estimates from their
internal pricing models. The pricing models for these securities usually consider tranche-level attributes, including estimated cash
flows of each tranche, market-based yield spreads for each tranche, and current market data, as well as incorporate deal collateral
performance, as available. Mortgage and asset-backed securities that use these and similar valuation techniques and inputs as
described above are categorized as Level 2 of the fair value hierarchy.
Investments in privately held investment funds will be valued based upon the NAV of such investments. The Funds have adopted
the authoritative guidance under U.S. GAAP for estimating the fair value of investments in funds that have calculated NAV per
share in accordance with the specialized accounting guidance for investment companies. Accordingly, the Funds estimate the
fair value of an investment in a fund using the NAV per share without further adjustment as a practical expedient, if the NAV per
share of the investment is determined in accordance with the specialized accounting guidance for investment companies as of the
reporting entity’s measurement date.
Short-term investments having a maturity of 60 days or less are generally valued at amortized cost, which approximates fair market
value. These investments are categorized as Level 2 of the fair value hierarchy.
Derivative instruments are instruments such as foreign currency contracts, futures contracts, options contracts, or swap agreements
that derive their value from underlying asset prices, indices, reference rates, and other inputs or a combination of these factors.
Derivatives may be classified into two groups depending upon the way that they are traded: privately traded over-the-counter
(“OTC”) derivatives that do not go through an exchange or intermediary and exchange-traded derivatives that are traded through
specialized derivatives exchanges or other regulated exchanges. OTC derivatives are normally valued on the basis of broker dealer
quotations or pricing service providers. Depending on the product and the terms of the transaction, the value of the derivative
instrument can be estimated by a pricing service provider using a series of techniques, including simulation pricing models.
The pricing models use inputs that are observed from actively quoted markets such as issuer details, indices, spreads, interest
rates, yield curves, dividends and exchange rates. OTC derivatives that use these and similar valuation techniques and inputs as
described above are categorized as Level 2 of the fair value hierarchy, with the exception of foreign currency spot contracts which
156 Notes to Financial Statements
Russell Investment Funds
Notes to Financial Statements, continued — December 31, 2017
are categorized as Level 1 of the fair value hierarchy. OTC derivatives that use broker dealer quotations are categorized as level 3 of
the fair value hierarchy. Exchange-traded derivatives are valued based on the last reported sales price on the day of valuation and
are categorized as Level 1 of the fair value hierarchy.
Centrally cleared swaps listed or traded on a multilateral or trade facility platform, such as a registered exchange, are valued at
the daily settlement price determined by the respective exchange. For centrally cleared credit default swaps, the clearing facility
requires its members to provide actionable levels across complete term structures. These levels along with external third party
prices are used to produce daily settlement prices. These securities are categorized as Level 2 of the fair value hierarchy. Centrally
cleared interest rate swaps are valued using a pricing model that references the underlying rates including the overnight index
swap rate and London Interbank Offered Rate (“LIBOR”) forward rate to produce the daily settlement price. These securities are
categorized as Level 2 of the fair value hierarchy.
Events or circumstances affecting the values of Fund securities that occur between the closing of the principal markets on which
they trade and the time the NAV of Fund shares is determined may be reflected in the calculation of NAV for each applicable
Fund when the Fund deems that the particular event or circumstance would materially affect such Fund’s NAV. Funds that invest
primarily in frequently traded exchange-listed securities will use fair value pricing in limited circumstances since reliable market
quotations will often be readily available. Funds that invest in foreign securities use fair value pricing daily as events may occur
between the close of foreign markets and the time of pricing. Although there are observable inputs assigned on a security level,
prices are derived from factors using proprietary models or matrix pricing. For this reason, fair value factors will cause movement
between Levels 1 and 2. Significant events that could trigger fair value pricing of one or more securities include: a company
development such as a material business development; a natural disaster or emergency situation; or an armed conflict.
The NAV of a Fund’s portfolio that includes foreign securities may change on days when shareholders will not be able to purchase
or redeem Fund shares, since foreign securities can trade on non-business days.
For movements between the levels within the fair value hierarchy, the Funds have adopted a policy of recognizing the transfers as
of year-end.
The U.S. Strategic Equity, U.S. Small Cap Equity, International Developed Markets and Global Real Estate Securities Funds had
no transfers between Levels 1, 2, and 3 for the period ended December 31, 2017.
The Strategic Bond Fund had transfers from Level 2 into Level 3 representing financial instruments for which approved vendor
sources became unavailable or inputs became unobservable. The amount transferred was $81,871.
Level 3 Fair Value Investments
The valuation techniques and significant inputs used in determining the fair values of financial instruments classified as Level 3 of
the fair value hierarchy are as follows:
Securities and other assets for which market quotes are not readily available, or are not reliable, are valued at fair value as
determined in good faith by RIFUS and are categorized as Level 3 of the fair value hierarchy. Market quotes are considered not
readily available in circumstances where there is an absence of current or reliable market-based data (e.g., trade information or
broker quotes). When RIFUS applies fair valuation methods that use significant unobservable inputs to determine a Fund’s NAV,
securities will not be priced on the basis of quotes from the primary market in which they are traded, but instead may be priced by
another method that RIFUS believes accurately reflects fair value and will be categorized as Level 3 of the fair value hierarchy. Fair
value pricing may require subjective determinations about the value of a security. While the securities valuation procedures are
intended to result in a calculation of a Fund’s NAV that fairly reflects security values as of the time of pricing, the process cannot
guarantee that fair values determined by RIFUS would accurately reflect the price that a Fund could obtain for a security if it were
to dispose of that security as of the time of pricing (for instance, in a forced or distressed sale). The prices used by a Fund may differ
from the value that would be realized if the security was sold.
RIFUS employs third party pricing vendors to provide fair value measurements. RIFUS oversees third-party pricing service
providers in order to support the valuation process throughout the year.
The significant unobservable input used in fair value measurement of certain of the Funds’ preferred equity securities is the
redemption value calculated on a fully-diluted basis if converted to common stock. Significant increases or decreases in the
redemption value would have a direct and proportional impact to fair value.
The significant unobservable input used in the fair value measurement of certain Funds’ debt securities is the yield to worst ratio.
Significant increases (decreases) in the yield to worst ratio would result in a lower (higher) fair value measurement.
Notes to Financial Statements 157
Russell Investment Funds
Notes to Financial Statements, continued — December 31, 2017
These significant unobservable inputs are further disclosed in the Presentation of Portfolio Holdings for each respective Fund as
applicable.
If third party evaluated vendor pricing is neither available nor deemed to be indicative of fair value, RIFUS may elect to obtain
indicative market quotations (“broker quotes”) directly from the broker or passed through from a third party vendor. In the event
that the source of fair value is from a single source broker quote, these securities are classified as Level 3 per the fair value
hierarchy. Broker quotes are typically received from established market participants. Although independently received on a daily
basis, RIFUS does not have the transparency to view the underlying inputs which support the broker quotes. Significant changes
in the broker quote would have direct and proportional changes in the fair value of the security. There is a third-party pricing
exception to the quantitative disclosure requirement when prices are not determined by the reporting entity. RIFUS is exercising
this exception and has made a reasonable attempt to obtain quantitative information from the third party pricing vendors regarding
the unobservable inputs used.
For fair valuations using significant unobservable inputs, U.S. GAAP requires a reconciliation of the beginning to ending balances
for reported fair values that present changes attributable to total realized and unrealized gains or losses, purchases and sales, and
transfers in/out of the Level 3 category during the period. Additionally, U.S. GAAP requires quantitative information regarding the
significant unobservable inputs used in the determination of fair value of assets categorized as Level 3 in the fair value hierarchy. In
accordance with the requirements of U.S. GAAP, a fair value hierarchy, a Level 3 reconciliation and an additional disclosure about
fair value measurements, if any, has been included in the Presentation of Portfolio Holdings for each respective Fund.
Investment Transactions
Investment transactions are reflected as of the trade date for financial reporting purposes. This may cause the NAV stated in the
financial statements to be different from the NAV at which shareholders may transact. Realized gains and losses from securities
transactions, if applicable, are recorded on the basis of specific identified cost incurred within a particular Fund.
Investment Income
Dividend income is recorded net of applicable withholding taxes on the ex-dividend date, except that certain dividends from
foreign securities are recorded as soon as the Funds are informed of the dividend, subsequent to the ex-dividend date. To the
extent the dividend represents a return of capital or capital gain for tax purposes, reclassifications are made which may be based
on management's estimates. Interest income is recorded daily on the accrual basis. The Strategic Bond Fund classifies gains and
losses realized on prepayments received on mortgage-backed securities as an adjustment to interest income. All premiums and
discounts, including original issue discounts, are amortized/ accreted using the effective interest method. Debt obligation securities
may be placed in a non-accrual status and related interest income may be reduced by stopping current accruals and writing off
interest receivable when the collection of all or a portion of interest has become doubtful.
Federal Income Taxes
Since the Investment Company is a Massachusetts business trust, each Fund is a separate corporate taxpayer and determines its
net investment income and capital gains (or losses) and the amounts to be distributed to each Fund’s shareholders without regard
to the income and capital gains (or losses) of the other Funds.
For each year, each Fund intends to qualify or continue to qualify as a regulated investment company under Subchapter M of the
Internal Revenue Code of 1986, as amended (the “Code”) and intends to distribute all of its taxable income and capital gains.
Therefore, no federal income tax provision is required for the Funds.
The Funds comply with the authoritative guidance for uncertainty in income taxes which requires management to determine whether
a tax position of the Funds is more likely than not to be sustained upon examination, including resolution of any related appeals or
litigation processes, based on the technical merits of the position. For tax positions meeting the more likely than not threshold, the
tax amount recognized in the financial statements is reduced by the largest benefit that has a greater than 50% likelihood of being
realized upon ultimate settlement with the relevant taxing authority. Management determined that no accruals need to be made in
the financial statements due to uncertain tax positions. Management continually reviews and adjusts the Funds’ liability for income
taxes based on analyses of tax laws and regulations, as well as their interpretations, and other relevant factors.
Each Fund files a U.S. tax return. At December 31, 2017, the Funds had recorded no liabilities for net unrecognized tax benefits
relating to uncertain income tax positions they have taken or expect to take in future tax returns. While the statute of limitations
remains open to examine the Funds’ U.S. tax returns filed for the fiscal years ended December 31, 2014 through December 31,
158 Notes to Financial Statements
Russell Investment Funds
Notes to Financial Statements, continued — December 31, 2017
2016, no examinations are in progress or anticipated at this time. The Funds are not aware of any tax positions for which it is
reasonably possible that the total amounts of unrecognized tax benefits will significantly change in the next twelve months.
Dividends and Distributions to Shareholders
For all Funds, income, capital gain distributions and return of capital, if any, are recorded on the ex-dividend date. Income
distributions are generally declared and paid according to the following schedule:
| | |
| Declared | Payable | Funds |
| Quarterly | April, July, October and mid-December | U. S. Strategic Equity, U. S. Small Cap Equity, Strategic Bond and |
| | | Global Real Estate Securities Funds |
| Annually | Mid-December | International Developed Markets Fund |
The Funds intend to distribute substantially all of the distributions they receive from real estate investment trust ("REIT")
investments, less expenses, as well as income from other investments. Such distributions may be comprised of income, return of
capital, and capital gains. The Funds may also realize capital gains on the sale of its REIT shares and other investments.
Capital gain distributions are generally declared and paid annually. An additional distribution may be paid by the Funds to avoid
imposition of federal income and excise tax on any remaining undistributed capital gains and net investment income.
The timing and characterization of certain income and capital gain distributions are determined in accordance with federal tax
regulations which may differ from U.S. GAAP. As a result, net investment income and net realized gain (or loss) on investments
and foreign currency-related transactions for a reporting period may differ significantly from distributions during such period. The
differences between tax regulations and U.S. GAAP primarily relate to investments in options, futures, forward contracts, swap
contracts, passive foreign investment companies, foreign-denominated investments, mortgage-backed securities, certain securities
sold at a loss, wash sale deferrals and capital loss carryforwards. Accordingly, the Funds may periodically make reclassifications
among certain of their capital accounts without impacting their NAVs.
Expenses
The Funds pay their own expenses other than those expressly assumed by Russell Investment Management, LLC ("RIM"), the
Funds’ adviser, or RIFUS. Most expenses can be directly attributed to the individual Funds. Expenses which cannot be directly
attributed to a specific Fund are allocated among all Funds principally based on their relative net assets.
Foreign Currency Translations
The books and records of the Funds are maintained in U.S. dollars. Foreign currency amounts and transactions of the Funds are
translated into U.S. dollars on the following basis:
(a) Fair value of investment securities, other assets and liabilities at the closing rate of exchange on the valuation date.
(b) Purchases and sales of investment securities and income at the closing rate of exchange prevailing on the respective trade
dates of such transactions.
Net realized gains or losses from foreign currency-related transactions arise from: sales and maturities of short-term securities;
sales of foreign currencies; currency gains or losses realized between the trade and settlement dates on securities transactions; the
difference between the amounts of dividends, interest, and foreign withholding taxes recorded on the Funds’ books and the U.S.
dollar equivalent of the amounts actually received or paid. Net unrealized gains or losses from foreign currency-related transactions
arise from changes in the value of assets and liabilities, other than investments in securities, as a result of changes in the exchange
rates.
The Funds do not isolate that portion of the results of operations of the Funds that arises as a result of changes in exchange rates
from that portion that arises from changes in market prices of investments during the year. Such fluctuations are included with the
net realized and unrealized gain or loss from investments. However, for federal income tax purposes, the Funds do isolate the effects
of changes in foreign exchange rates from the fluctuations arising from changes in market prices for realized gain (or loss) on debt
obligations.
Notes to Financial Statements 159
Russell Investment Funds
Notes to Financial Statements, continued — December 31, 2017
Capital Gains Taxes
The International Developed Markets, Strategic Bond and Global Real Estate Securities Funds may be subject to capital gains
taxes and repatriation taxes imposed by certain countries in which they invest. The International Developed Markets, Strategic
Bond Fund and Global Real Estate Securities Funds may record a deferred capital gains tax liability with respect to the unrealized
appreciation on foreign securities for potential capital gains and repatriation taxes at December 31, 2017. The accrual for capital
gains and repatriation taxes is included in net unrealized appreciation (depreciation) on investments in the Statements of Assets
and Liabilities. The amounts related to capital gains and repatriation taxes are included in net realized gain (loss) on investments
in the Statements of Operations. The amounts related to capital gains and repatriation taxes are included in net realized gain (loss)
on investments in the Statements of Operations for the following Funds:
| | | | | |
| | Deferred Capital | | | |
| | | Gains Tax | | Capital Gains | |
| | | Liability | | Taxes | |
| |
| International Developed Markets Fund | $ | — | $ | 3,956 | |
| Strategic Bond Fund | | 2,516 | | — | |
Derivatives
The Funds may invest in derivatives. Derivatives are instruments or agreements whose value is derived from an underlying security
or index. They include options, futures, swaps and forwards. These instruments offer unique characteristics and risks that facilitate
the Funds' investment strategies.
The Funds typically use derivatives in three ways: exposing cash to markets, hedging and return enhancement. In addition, certain
Funds may enter into foreign exchange contracts for trade settlement purposes. The Funds may pursue their strategy of being fully
invested by exposing cash to the performance of appropriate markets by purchasing securities and/or derivatives. This is intended
to cause the Funds to perform as though cash were actually invested in those markets.
Hedging may be used by certain Funds to limit or control risks, such as adverse movements in exchange rates and interest rates.
Return enhancement can be accomplished through the use of derivatives in a Fund, including using derivatives as a substitute for
holding physical securities, and using them to express various macro views (e.g., interest rate movements, currency movements,
and macro credit strategies). By purchasing certain instruments, the Funds may more effectively achieve the desired portfolio
characteristics that assist them in meeting their investment objectives. Depending on how the derivatives are structured and
utilized, the risks associated with them may vary widely. These risks include, but are not limited to, market risk, liquidity risk,
leveraging risk, counterparty risk, basis risk, reinvestment risk, political risk, prepayment risk, extension risk, valuation risk and
credit risk.
Futures, certain options and cleared swaps are traded or cleared on an exchange or central exchange clearing house. Exchange-
traded or exchange-cleared transactions generally present less counterparty risk to a Fund. The exchange’s clearing house stands
between the Fund and the broker to the contract and therefore, credit risk is generally limited to the failure of the clearing
house and the clearing member. Cleared swap contracts are subject to clearing house rules, including initial and variation margin
requirement, daily settlement of obligations and the clearing house guarantee of payments to the broker. There is, however, still
counterparty risk due to the insolvency of the broker with respect to any margin held in the brokers’ customer accounts. While
clearing members are required to segregate customer assets from their own assets, in the event of insolvency, there may be a
shortfall in the amount of margin held by the broker for its clients. Collateral and margin requirements for exchange-traded or
exchange-cleared derivatives are established through regulation, as well as set by the broker or applicable clearing house. Margin
for exchange-traded and exchange-cleared transactions are detailed in the Statements of Assets and Liabilities as cash held at the
broker for futures contracts and cash held at the broker for swap contracts, respectively. Securities pledged by a Fund for exchange-
traded and exchange-cleared transactions are noted as collateral or margin requirements in the Schedule of Investments. Typically,
the Funds and counterparties are not permitted to sell, repledge, rehypothecate or otherwise use collateral pledged by the other
party unless explicitly permitted by each respective governing agreement.
In addition, proposed regulatory changes by the Securities and Exchange Commission ("SEC") relating to a mutual fund's use of
derivatives could potentially limit or impact the Funds' ability to invest in derivatives and adversely affect the value or performance
of the Funds or their derivative investments.
The effects of derivative instruments, categorized by risk exposure, on the Statements of Assets and Liabilities and the Statements of
Operations, for the period ended December 31, 2017, if applicable, are disclosed in the Fair Value of Derivative Instruments table
following each applicable Fund’s Schedule of Investments.
160 Notes to Financial Statements
Russell Investment Funds
Notes to Financial Statements, continued — December 31, 2017
Foreign Currency Exchange Contracts
Certain Funds may enter into foreign currency exchange spot contracts and forward foreign currency exchange contracts (“FX
contracts”). From time to time, certain Funds may enter into FX contracts to hedge certain foreign currency-denominated assets.
FX contracts are recorded at fair value. Certain risks may arise upon entering into these FX contracts from the potential inability
of counterparties to meet the terms of their FX contracts and are generally limited to the amount of unrealized gain on the FX
contracts, if any, that are disclosed in the Statements of Assets and Liabilities.
For the period ended December 31, 2017, the following Funds entered into foreign currency exchange contracts primarily for the
strategies listed below:
| |
| Funds | Strategies |
| International Developed Markets Fund | Return enhancement, hedging and exposing cash to markets |
| Strategic Bond Fund | Return enhancement and hedging |
| Global Real Estate Securities Fund | Exposing cash to markets and trade settlement |
The Funds’ foreign currency contract notional dollar values outstanding fluctuate throughout the fiscal year as required to meet
strategic requirements. The following tables illustrate the quarterly volume of foreign currency contracts. For the purpose of this
disclosure, volume is measured by the amounts bought and sold in USD.
| | | | | | | | | | | |
| | | | | | Outstanding Contract Amounts Sold | | | |
| Quarter Ended | March 31, 2017 | June 30, 2017 | | | September 30, 2017 | December 31, 2017 | |
| International Developed Markets Fund | $ | 146,023,685 | | $ | 99,879,057 | | $ | 137,597,644 | $ | 224,739,400 | |
| Strategic Bond Fund | | 218,330,428 | | | 237,417,308 | | | 254,898,594 | | 219,343,155 | |
| Global Real Estate Securities Fund | | 25,030,348 | | | 13,056,783 | | | 18,033,177 | | 12,469,562 | |
| | | | | | Outstanding Contract Amounts Bought | | | |
| Quarter Ended | March 31, 2017 | June 30, 2017 | | | September 30, 2017 | December 31, 2017 | |
| International Developed Markets Fund | $ | 146,186,436 | | $ | 99,852,328 | | $ | 136,592,041 | $ | 225,435,407 | |
| Strategic Bond Fund | | 219,014,319 | | | 237,813,389 | | | 254,639,578 | | 219,720,412 | |
| Global Real Estate Securities Fund | | 25,197,157 | | | 13,032,856 | | | 17,826,768 | | 12,523,159 | |
Options
Certain Funds may purchase and sell (write) call and put options on securities and securities indices. Such options are traded on
a national securities exchange or in an OTC market. The Funds may also purchase and sell (write) call and put options on foreign
currencies.
When a Fund writes a covered call or a put option, an amount equal to the premium received by the Fund is included in the Fund’s
Statement of Assets and Liabilities as an asset and as an equivalent liability. The amount of the liability is subsequently marked-
to-market to reflect the current fair value of the option written. The Fund receives a premium on the sale of a call option but gives
up the opportunity to profit from any increase in the value of the underlying instrument above the exercise price of the option, and
when the Fund writes a put option it is exposed to a decline in the price of the underlying instrument.
When a Fund sells an uncovered call option, it does not simultaneously have a long position in the underlying security. When a
Fund sells an uncovered put option, it does not simultaneously have a short position in the underlying security. Uncovered options
are riskier than covered options because there is no underlying security held by the Fund that can act as a partial hedge.
Whether an option which the Fund has written expires on its stipulated expiration date or the Fund enters into a closing purchase
transaction, the Fund realizes a gain (or loss, if the cost of a closing purchase transaction exceeds the premium received when the
option was sold) without regard to any unrealized gain or loss on the underlying security, and the liability related to such option is
extinguished. If a call option which the Fund has written is exercised, the Fund realizes a capital gain or loss from the sale of the
underlying security, and the proceeds from such sale are increased by the premium originally received. When a put option which
a Fund has written is exercised, the amount of the premium originally received will reduce the cost of the security which a Fund
purchases upon exercise of the option.
The Funds’ use of written options involves, to varying degrees, elements of market risk in excess of the amount recognized in the
Statements of Assets and Liabilities. The face or contract amounts of these instruments reflect the extent of the Funds’ exposure to
market risk. The risks may be caused by an imperfect correlation between movements in the price of the instrument and the price
of the underlying securities and interest rates.
Notes to Financial Statements 161
Russell Investment Funds
Notes to Financial Statements, continued — December 31, 2017
Certain Funds may enter into a swaption (an option on a swap). In a swaption, in exchange for an option, the buyer gains the right
but not the obligation to enter into a specified swap agreement with the issuer on a specified future date. The writer of the contract
receives the premium and bears the risk of unfavorable changes in the preset rate on the underlying swap.
For the period ended December 31, 2017, the Strategic Bond Fund purchased or sold options primarily for return enhancement
and hedging.
The Strategic Bond Fund’s options contracts notional amounts fluctuate throughout the fiscal year as required to meet strategic
requirements. The following table illustrates the quarterly volume of options contracts measured by notional in USD.
| | | | | | | | | | | |
| | | | Notional of Options Contracts Outstanding | | | |
| Funds | March 31, 2017 | June 30, 2017 | | | September 30, 2017 | December 31, 2017 | |
| Strategic Bond Fund | $ | 74,724,000 | | $ | 69,632,938 | | $ | 92,421,063 | $ | 83,138,438 | |
Futures Contracts
The Funds may invest in futures contracts (i.e., interest rate, foreign currency and index futures contracts). The face or contract
value of these instruments reflect the extent of the Funds’ exposure to off balance sheet risk. The primary risks associated with the
use of futures contracts are an imperfect correlation between the change in fair value of the securities held by the Funds and the
prices of futures contracts, and the possibility of an illiquid market. Upon entering into a futures contract, the Funds are required to
deposit with a broker an amount, termed the initial margin, which typically represents 5% to 10% of the purchase price indicated
in the futures contract. Payments to and from the broker, known as variation margin, are typically required to be made on a daily
basis as the price of the futures contract fluctuates. Changes in initial settlement value are accounted for as unrealized appreciation
(depreciation) until the contracts are terminated, at which time realized gains and losses are recognized.
For the period ended December 31, 2017, the following Funds entered into futures contracts primarily for the strategies listed
below:
| |
| Funds | Strategies |
| U. S. Strategic Equity Fund | Exposing cash to markets |
| U. S. Small Cap Equity Fund | Exposing cash to markets |
| International Developed Markets Fund | Return enhancement, hedging and exposing cash to markets |
| Strategic Bond Fund | Return enhancement, hedging and exposing cash to markets |
| Global Real Estate Securities Fund | Exposing cash to markets |
The Funds’ futures contracts notional amounts fluctuate throughout the fiscal year as required to meet strategic requirements. The
following table illustrates the quarterly volume of futures contracts measured by notional in USD.
| | | | | | | | | | | |
| | | | Notional of Futures Contracts Outstanding | | | |
| Funds | March 31, 2017 | | | June 30, 2017 | | September 30, 2017 | December 31, 2017 | |
| U. S. Strategic Equity Fund | $ | 16,640,480 | $ | 3,268,215 | $ | 14,719,185 | $ | 18,464,400 | |
| U. S. Small Cap Equity Fund | | 6,991,220 | | 2,545,740 | | 447,870 | | 8,297,100 | |
| International Developed Markets Fund | | 86,596,653 | | 80,680,411 | | 94,099,980 | | 102,474,442 | |
| Strategic Bond Fund | | 386,456,924 | | 623,467,704 | | 600,878,343 | | 659,401,468 | |
| Global Real Estate Securities Fund | | 17,933,563 | | 18,574,517 | | 21,408,328 | | 18,395,434 | |
| Swap Agreements | | | | | | | | | | | |
Certain Funds may enter into swap agreements, on either an asset-based or liability-based basis, depending on whether they are
hedging their assets or their liabilities, and will usually enter into swaps on a net basis (i.e., the two payment streams are netted
out, with the Funds receiving or paying only the net amount of the two payments). When a Fund engages in a swap, it exchanges
its obligations to pay or rights to receive payments for the obligations to pay or rights to receive payments of another party (i.e., an
exchange of floating rate payments for fixed rate payments).
Certain Funds may enter into several different types of swap agreements including credit default, interest rate, total return (equity
and/or index) and currency swaps. Credit default swaps are a counterparty agreement which allows the transfer of third party
credit risk (the possibility that an issuer will default on its obligation by failing to pay principal or interest in a timely manner)
from one party to another. The lender faces the credit risk from a third party and the counterparty in the swap agrees to insure this
risk in exchange for regular periodic payments. Interest rate swaps are a counterparty agreement, can be customized to meet each
party’s needs, and involve the exchange of a fixed or variable payment per period for a payment that is not fixed. Equity swaps are
a counterparty agreement where two parties exchange two sets of cash flows on predetermined dates for an agreed upon amount of
162 Notes to Financial Statements
Russell Investment Funds
Notes to Financial Statements, continued — December 31, 2017
time. The cash flows will typically be an equity index value swapped with a floating rate such as LIBOR plus or minus a pre-defined
spread. Total return swap agreements are a counterparty agreement intended to expose cash to markets or to effect investment
transactions consistent with those Funds’ investment objectives and strategies. Currency swaps are a counterparty agreement where
two parties exchange specified amounts of different currencies which are followed by each paying the other a series of interest
payments that are based on the principal cash flow. At maturity the principal amounts are returned.
The Funds generally expect to enter into these transactions primarily to preserve a return or spread on a particular investment or
portion of their portfolios or to protect against any increase in the price of securities they anticipate purchasing at a later date, or for
return enhancement. Under most swap agreements entered into by a Fund, the parties' obligations are determined on a "net basis".
The net amount of the excess, if any, of the Funds’ obligations over their entitlements with respect to each swap will be accrued on a
daily basis and an amount of cash or liquid assets having an aggregate NAV at least equal to the accrued excess will be segregated.
To the extent that the Funds enter into swaps on other than a net basis, the amount maintained in a segregated account will be the
full amount of the Funds’ obligations, if any, with respect to such swaps, accrued on a daily basis. If there is a default by the other
party to such a transaction, the Funds will have contractual remedies pursuant to the agreement related to the transaction.
A Fund may not receive the expected amount under a swap agreement if the other party to the agreement defaults or becomes
bankrupt.
Credit Default Swaps
The Strategic Bond Fund may enter into credit default swaps. A credit default swap can refer to corporate issues, government
issues, asset-backed securities or an index of assets, each known as the reference entity or underlying asset. The Fund may act as
either the buyer or the seller of a credit default swap involving one party making a stream of payments to another party in exchange
for the right to receive a specified return in the event of a default or other credit event. Depending upon the terms of the contract,
the credit default swap may be closed via physical settlement. However, due to the possible or potential instability in the market,
there is a risk that the Fund may be unable to deliver the underlying debt security to the other party to the agreement. Additionally,
the Fund may not receive the expected amount under the swap agreement if the other party to the agreement defaults or becomes
bankrupt. In an unhedged credit default swap, the Fund enters into a credit default swap without owning the underlying asset or
debt issued by the reference entity. Credit default swaps allow the Fund to acquire or reduce credit exposure to a particular issuer,
asset or basket of instruments.
As the seller of protection in a credit default swap, the Fund would be required to pay the par or other agreed-upon value (or
otherwise perform according to the swap contract) of a reference debt obligation to the counterparty in the event of a default (or
other specified credit event) and the counterparty would be required to surrender the reference debt obligation. In return, the Fund
would receive from the counterparty a periodic stream of payments over the term of the contract provided that no credit event has
occurred. If no credit event occurs, the Fund would keep the stream of payments and would have no payment obligations. As a seller
of protection, the Fund would effectively add leverage to its portfolio because in addition to its total net assets, that Fund would be
subject to investment exposure on the notional amount of the swap.
The may also purchase protection via credit default swap contracts in order to offset the risk of default of debt securities held in
their portfolios or to take a short position in a debt security, in which case the Fund would function as the counterparty referenced
in the preceding paragraph.
If a credit event occurs and cash settlement is not elected, a variety of other deliverable obligations may be delivered in lieu of
the specific referenced obligation. The ability to deliver other obligations may result in a cheapest-to-deliver option (the buyer
of protection’s right to choose the deliverable obligation with the lowest value following a credit event). The Fund may use credit
default swaps to provide a measure of protection against defaults of the issuers (i.e., to reduce risk where the Fund owns or has
exposure to the referenced obligation) or to take an active long or short position with respect to the likelihood (as measured by the
credit default swap’s spread) of a particular issuer’s default.
Deliverable obligations for credit default swaps on asset-backed securities in most instances are limited to the specific referenced
obligation as performance for asset-backed securities can vary across deals. Prepayments, principal paydowns, and other writedown
or loss events on the underlying mortgage loans will reduce the outstanding principal balance of the referenced obligation. These
reductions may be temporary or permanent as defined under the terms of the swap agreement and the notional amount for the swap
agreement generally will be adjusted by corresponding amounts. The Strategic Bond Fund may use credit default swaps on asset-
backed securities to provide a measure of protection against defaults (or other defined credit events) of the referenced obligation
Notes to Financial Statements 163
Russell Investment Funds
Notes to Financial Statements, continued — December 31, 2017
or to take an active long or short position with respect to the likelihood of a particular referenced obligation’s default (or another
defined credit event).
Credit default swap agreements on credit indices involve one party making a stream of payments to another party in exchange for
the right to receive a specified return in the event of a write-down, principal shortfall, interest shortfall or default of all or part of
the referenced entities comprising the credit index. A credit index is a basket of credit instruments or exposures designed to be
representative of some part of the credit market as a whole. These indices are made up of reference credits that are judged by a
poll of dealers to be the most liquid entities in the credit default swap market based on the sector of the index. Components of the
indices may include, but are not limited to, investment grade securities, high yield securities, asset-backed securities, emerging
markets, and/or various credit ratings within each sector. Credit indices are traded using credit default swaps with standardized
terms including a fixed spread and standard maturity dates. An index credit default swap references all the names in the index, and
if there is a default, the credit event is settled based on that name’s weight in the index. The composition of the indices changes
periodically, usually every six months, and, for most indices, each name has an equal weight in the index. Traders may use credit
default swaps on indices to speculate on changes in credit quality.
Implied credit spreads, represented in absolute terms, utilized in determining the fair value of credit default swap agreements on
corporate issues as of period-end are disclosed in the Schedules of Investments and generally serve as an indicator of the current
status of the payment/performance risk and represent the likelihood or risk of default (or other defined credit event) for the credit
derivative. The implied credit spread of a particular referenced entity reflects the cost of entering into a credit default swap and
may include upfront payments required to be made to enter into the agreement. For credit default swap agreements on asset-
backed securities and credit indices, the quoted market prices and resulting values serve as the indicator of the current status of
the payment/performance risk. Wider credit spreads and increasing fair values, in absolute terms when compared to the notional
amount of the swap, generally represent a deterioration of the referenced entity’s credit soundness and a greater likelihood or risk
of default or other credit event occurring as defined under the terms of the agreement. The maximum potential amount of future
payments (undiscounted) that the Fund as a seller of protection could be required to make under a credit default swap agreement
equals the notional amount of the agreement. Notional amounts of all credit default swap agreements outstanding as of December
31, 2017, for which a Fund is the seller of protection are disclosed in the Schedules of Investments. These potential amounts would
be partially offset by any recovery values of the respective referenced obligations, upfront payments received upon entering into the
agreement, or net amounts received from the settlement of buy protection credit default swap agreements entered into by the Fund
for the same referenced entity or entities.
Credit default swaps could result in losses if the Fund does not correctly evaluate the creditworthiness of the company or companies
on which the credit default swap is based. Credit default swap agreements may involve greater risks than if the Fund had invested
in the reference obligation directly since, in addition to risks relating to the reference obligation, credit default swaps are subject to
illiquidity and counterparty risk. The Fund will generally incur a greater degree of risk when it sells a credit default swap than when
it purchases a credit default swap. As a buyer of a credit default swap, the Fund may lose its investment and recover nothing should
a credit event fail to occur and the swap is held to its termination date. As seller of a credit default swap, if a credit event were
to occur, the value of any deliverable obligation received by the Fund, coupled with the upfront or periodic payments previously
received, may be less than what it pays to the buyer, resulting in a loss of value to the Fund.
If the creditworthiness of the Fund’s swap counterparty declines, the risk that the counterparty may not perform could increase,
potentially resulting in a loss to the Fund. To limit the counterparty risk involved in swap agreements, the Fund will only enter
into swap agreements with counterparties that meet certain standards of creditworthiness. Although there can be no assurance
that the Fund will be able to do so, the Fund may be able to reduce or eliminate its exposure under a swap agreement either by
assignment or other disposition, or by entering into an offsetting swap agreement with the same party or another creditworthy party.
The Fund may have limited ability to eliminate its exposure under a credit default swap if the credit quality of the reference entity
or underlying asset has declined.
For the period ended December 31, 2017, the Strategic Bond Fund entered into credit default swaps primarily for return
enhancement, hedging and exposing cash to markets.
The Strategic Bond Fund’s credit default swap contract notional amounts outstanding fluctuate throughout the fiscal year as required
to meet strategic requirements. The following table illustrates the quarterly volume of credit default swap contracts. For the purpose
of this disclosure, volume is measured by notional amounts outstanding in USD at each quarter end.
164 Notes to Financial Statements
Russell Investment Funds
Notes to Financial Statements, continued — December 31, 2017
| | | | | | | | | | | |
| | | | Credit Default Swap Notional Amounts Outstanding | | | |
| Quarter Ended | March 31, 2017 | | | June 30, 2017 | | September 30, 2017 | December 31, 2017 | |
| Strategic Bond Fund | $ | 1,955,100 | $ | 5,800,000 | $ | 6,180,000 | $ | 4,710,000 | |
Interest Rate Swaps
The use of interest rate swaps is a highly specialized activity which involves investment techniques and risks different from those
associated with ordinary portfolio securities transactions. If RIM or a money manager using this technique is incorrect in its forecast
of fair values, interest rates and other applicable factors, the investment performance of a Fund might diminish compared to what
it would have been if this investment technique were not used.
Interest rate swaps do not involve the delivery of securities or other underlying assets or principal. Accordingly, the risk of loss
with respect to interest rate swaps is limited to the net amount of interest payments that a Fund is contractually obligated to make.
Interest rate swaps are traded on exchanges and are subject to central clearing. If the clearing house or futures commission merchant
defaults, a Funds' risk of loss consists of the net amount of interest payments that a Fund is contractually entitled to receive. The
counterparty risk for cleared derivatives is generally lower than for uncleared derivatives. However, clearing may subject a Fund to
increased costs or margin requirements.
For the period ended December 31, 2017, the Strategic Bond Fund entered into interest rate swaps primarily for return enhancement,
hedging and exposing cash to markets.
The Strategic Bond Fund’s interest rate swap contract notional amounts outstanding fluctuate throughout the fiscal year as required
to meet strategic requirements. The following table illustrates the quarterly volume of interest rate swap contracts. For the purpose
of this disclosure, volume is measured by the notional amounts outstanding in USD at each quarter end.
| | | | | | | | | | | |
| | | | Interest Rate Swap Notional Amounts Outstanding | | | |
| Quarter Ended | March 31, 2017 | | | June 30, 2017 | | September 30, 2017 | December 31, 2017 | |
| Strategic Bond Fund | $ | 26,329,868 | $ | 24,182,304 | $ | 28,446,687 | $ | 14,656,981 | |
Total Return Swaps
Certain Funds may enter into total return swap agreements to expose cash to markets or to effect investment transactions. Total
return swap agreements are two party contracts entered into primarily by institutional investors for periods ranging from a few weeks
to more than one year. In a standard total return swap transaction, the two parties agree to exchange the returns (or differentials
in rates of return) earned or realized on particular investments or instruments. The returns to be exchanged between the parties
are calculated with respect to a “notional amount” (i.e., a specified dollar amount that is hypothetically invested in a “basket” of
securities representing a particular index).
For the period ended December 31, 2017, the Strategic Bond Fund entered into total return swaps primarily for exposing cash to
markets.
The Strategic Bond Fund’s total return swap contract notional amounts outstanding fluctuate throughout the fiscal year as required
to meet strategic requirements. The following table illustrates the quarterly volume of total return swap contracts. For the purpose
of this disclosure, volume is measured by notional amounts outstanding in USD at each quarter end.
| | | | | | | |
| | | | Total Return Swap Notional Amounts Outstanding | |
| Quarter Ended | March 31, 2017 | June 30, 2017 | | September 30, 2017 | December 31, 2017 | |
| Strategic Bond Fund | $ | 48,659,119 | $ — | | $ — | $ — | |
Currency Swaps
Certain Funds may enter into currency swap agreements to enhance returns or for hedging purposes. Currency swap agreements are
agreements where two parties exchange specified amounts of different currencies which are followed by paying the other a series of
interest payments that are based on the principal cash flow. At maturity, the principal amounts are exchanged.
For the period ended December 31, 2017, the Funds did not enter into currency swap agreements.
Master Agreements
Certain Funds are parties to International Swaps and Derivatives Association, Inc. Master Agreements (“ISDA Master Agreements”)
with counterparties that govern transactions in OTC derivative and foreign exchange contracts entered into by the Funds and
those counterparties. The ISDA Master Agreements contain provisions for general obligations, representations, agreements,
Notes to Financial Statements 165
Russell Investment Funds
Notes to Financial Statements, continued — December 31, 2017
collateral and events of default or termination. Events of termination and default include conditions that may entitle either party
to elect to terminate early and cause settlement of all outstanding transactions under the applicable ISDA Master Agreement.
Any election to terminate early could be material to the financial statements. Since different types of forward and OTC financial
derivative transactions have different mechanics and are sometimes traded out of different legal entities of a particular counterparty
organization, each type of transaction may be covered by a different ISDA Master Agreement, resulting in the need for multiple
agreements with a single counterparty. As the ISDA Master Agreements are specific to unique operations of different asset types,
they allow a Fund to net its total exposure to a counterparty in the event of a default with respect to all the transactions governed
under a single agreement with a counterparty.
Master Repurchase Agreements (“Master Repo Agreements”) govern transactions between a Fund and select counterparties.
The Master Repo Agreements maintain provisions for, among other things, initiation, income payments, events of default, and
maintenance of collateral for repurchase and reverse repurchase agreements.
Master Securities Forward Transaction Agreements (“Master Forward Agreements”) govern the considerations and factors
surrounding the settlement of certain forward settling transactions, such as delayed delivery by and between a Fund and select
counterparties. The Master Forward Agreements maintain provisions for, among other things, initiation and confirmation, payment
and transfer, events of default, termination, and maintenance of collateral.
Disclosure about Offsetting Assets and Liabilities
Balance sheet disclosure is based on various netting agreements between brokers and counterparties, such as ISDA Master
Agreements, Master Repo Agreements and Master Forward Agreements. Certain Funds utilize multiple counterparties. The
quantitative disclosure begins with disaggregation of counterparties by legal entity and the roll up of the data to reflect a single
counterparty in the table within the Funds’ financial statements. Net exposure represents the net receivable (payable) that would be
due from/to the counterparty in the event of default. Exposure from OTC derivatives can only be netted across transactions governed
under the same Master Agreement with the same legal entity.
Loan Agreements
The Strategic Bond Fund may invest in direct debt instruments, which are interests in amounts owed by corporate, governmental,
or other borrowers to lenders or lending syndicates. The Fund’s investments in loans may be in the form of participations in loans
or assignments of all or a portion of loans from third parties. A loan is often administered by a bank or other financial institution
(the “agent”) that acts as agent for all holders. The agent administers the terms of the loan, as specified in the loan agreement.
When investing in a loan participation, the Fund has the right to receive payments of principal, interest and any fees to which it
is entitled only from the agent selling the loan agreement and only upon receipt by the agent of payments from the borrower. The
Fund generally has no right to enforce compliance with the terms of the loan agreement with the borrower. As a result, the Fund
may be subject to the credit risk of both the borrower and the agent that is selling the loan agreement. When the Fund purchases
assignments from agents it acquires direct rights against the borrower on the loan. As of December 31, 2017, the Strategic Bond
Fund had no unfunded loan commitments.
Local Access Products
Certain Funds may invest in local access products, also known as certificates of participation, participation notes or participation
interest notes. Local access products are issued by banks or broker-dealers and are designed to replicate the performance of foreign
companies or foreign securities markets and can be used by the Fund as an alternative means to access the securities market of a
frontier emerging market country. The performance results of local access products will not replicate exactly the performance of
the foreign companies or foreign securities markets that they seek to replicate due to transaction and other expenses. Investments
in local access products involve certain risks in addition to those associated with a direct investment in the underlying foreign
companies or foreign securities markets whose return they seek to replicate. There can be no assurance that there will be a trading
market or that the trading price of local access products will equal the underlying value of the foreign company or foreign securities
market that it seeks to replicate. The Funds rely on the creditworthiness of the counterparty issuing the local access products and
have no rights against the issuer of the underlying security. The Funds minimize this risk by entering into agreements only with
counterparties that RIM deems creditworthy. Due to liquidity and transfer restrictions, the secondary markets on which the local
access products are traded may be less liquid than the markets for other securities, or may be completely illiquid.
166 Notes to Financial Statements
Russell Investment Funds
Notes to Financial Statements, continued — December 31, 2017
Emerging Markets Securities
Certain Funds may invest in emerging markets securities. Investing in emerging markets securities can pose some risks different
from, and greater than, risks of investing in U.S. or developed markets securities. These risks include: a risk of loss due to
exposure to economic structures that are generally less diverse and mature, and to political systems which may have less stability,
than those of more developed countries; smaller market capitalization of securities markets, which may suffer periods of relative
illiquidity; significant price volatility; restrictions on foreign investment; and possible difficulties in the repatriation of investment
income and capital. In addition, foreign investors may be required to register the proceeds of sales and future economic or political
crises could lead to price controls, forced mergers, expropriation or confiscatory taxation, seizure, nationalization, or creation of
government monopolies. The currencies of emerging market countries may experience significant declines against the U.S. dollar,
and devaluation may occur subsequent to investments in these currencies by the Funds. Emerging market securities may be
subject to currency transfer restrictions and may experience delays and disruptions in settlement procedures. Inflation and rapid
fluctuations in inflation rates have had, and may continue to have, negative effects on the economies and securities markets of
certain emerging market countries.
Emerging Markets Debt
The Strategic Bond Fund may invest in emerging markets debt. The Fund's emerging markets debt securities may include obligations
of governments and corporations. As with any fixed income securities, emerging markets debt securities are subject to the risk of
being downgraded in credit rating due to the risk of default. In the event of a default on any investments in foreign debt obligations,
it may be more difficult for the Fund to obtain or to enforce a judgment against the issuers of such securities. With respect to debt
issued by emerging market governments, such issuers may be unwilling to pay interest and repay principal when due, either due
to an inability to pay or submission to political pressure not to pay, and as a result may default, declare temporary suspensions of
interest payments or require that the conditions for payment be renegotiated.
Repurchase Agreements
The Strategic Bond Fund may enter into repurchase agreements. A repurchase agreement is an agreement under which a Fund
acquires a fixed income security from a commercial bank, broker or dealer and simultaneously agrees to resell such security to the
seller at an agreed upon price and date (normally within a few days or weeks). The resale price reflects an agreed upon interest rate
effective for the period the security is held by a Fund and is unrelated to the interest rate on the security. The securities acquired
by a Fund constitute collateral for the repurchase obligation. In these transactions, the securities acquired by a Fund (including
accrued interest earned thereon) must have a total value in excess of the value of the repurchase agreement and must be held by the
custodian bank until repurchased. A Fund will not invest more than 15% of its net assets (taken at current fair value) in repurchase
agreements maturing in more than seven days. There were no repurchase agreements held at year end.
Mortgage-Related and Other Asset-Backed Securities
The Strategic Bond Fund may invest in mortgage or other asset-backed securities (“ABS”). These securities may include mortgage
instruments issued by U.S. government agencies (“agency mortgages”) or those issued by private entities (“non-agency mortgages”).
Specific types of instruments may include reverse mortgages, mortgage pass-through securities, collateralized mortgage obligations
(“CMO”), commercial mortgage-backed securities, mortgage dollar rolls, CMO residuals, stripped mortgage-backed securities and
other securities that directly or indirectly represent a participation in, or are secured by a payable from, mortgage loans on real
property. The value of a Fund’s mortgage-backed securities (“MBS”) may be affected by, among other things, changes or perceived
changes in interest rates, factors concerning the interests in and structure of the issuer or the originator of the mortgage, or the
quality of the underlying assets. The mortgages underlying the securities may default or decline in quality or value. Through its
investments in MBS, a Fund has exposure to subprime loans, Alt-A loans and non-conforming loans as well as to the mortgage
and credit markets generally. Underlying collateral related to subprime, Alt-A and non-conforming mortgage loans has become
increasingly susceptible to defaults and declines in quality or value, especially in a declining residential real estate market. In
addition, regulatory or tax changes may adversely affect the mortgage securities markets as a whole.
Mortgage-Backed Securities
MBS often have stated maturities of up to thirty years when they are issued, depending upon the length of the mortgages underlying
the securities. In practice, however, unscheduled or early payments of principal and interest on the underlying mortgages may make
the securities’ effective maturity shorter than this, and the prevailing interest rates may be higher or lower than the current yield of
a Fund’s portfolio at the time resulting in reinvestment risk.
Notes to Financial Statements 167
Russell Investment Funds
Notes to Financial Statements, continued — December 31, 2017
Rising or high interest rates may result in slower than expected principal payments which may tend to extend the duration of MBS,
making them more volatile and more sensitive to changes in interest rates. This is known as extension risk.
MBS may have less potential for capital appreciation than comparable fixed income securities due to the likelihood of increased
prepayments of mortgages resulting from foreclosures or declining interest rates. These foreclosed or refinanced mortgages are paid
off at face value (par) or less, causing a loss, particularly for any investor who may have purchased the security at a premium or a
price above par. In such an environment, this risk limits the potential price appreciation of these securities.
Agency Mortgage-Backed Securities
Certain MBS may be issued or guaranteed by the U.S. government or a government sponsored entity, such as Fannie Mae (the Federal
National Mortgage Association) or Freddie Mac (the Federal Home Loan Mortgage Corporation). Although these instruments may
be guaranteed by the U.S. government or a government sponsored entity, many such MBS are not backed by the full faith and credit
of the United States and are still exposed to the risk of non-payment.
Privately Issued Mortgage-Backed Securities
MBS held by a Fund may be issued by private issuers including commercial banks, savings associations, mortgage companies,
investment banking firms, finance companies and special purpose finance entities (called special purpose vehicles or SPVs) and
other entities that acquire and package mortgage loans for resale as MBS. These privately issued non-agency MBS may offer higher
yields than those issued by government agencies, but also may be subject to greater price changes than governmental issues.
Subprime loans refer to loans made to borrowers with weakened credit histories or with a lower capacity to make timely payments
on their loans. Alt-A loans refer to loans extended to borrowers who have incomplete documentation of income, assets, or other
variables that are important to the credit underwriting processes. Non-conforming mortgages are loans that do not meet the standards
that allow purchase by government-sponsored enterprises. MBS with exposure to subprime loans, Alt-A loans or nonconforming
loans have had in many cases higher default rates than those loans that meet government underwriting requirements. The risk of
non-payment is greater for MBS that are backed by mortgage pools that contain subprime, Alt-A and non-conforming loans, but a
level of risk exists for all loans.
Unlike agency MBS issued or guaranteed by the U.S. government or a government-sponsored entity (e.g., Fannie Mae and Freddie
Mac), MBS issued by private issuers do not have a government or government-sponsored entity guarantee, but may have credit
enhancements provided by external entities such as banks or financial institutions or achieved through the structuring of the
transaction itself. Examples of such credit support arising out of the structure of the transaction include the issue of senior and
subordinated securities (e.g., the issuance of securities by an SPV in multiple classes or tranches, with one or more classes being
senior to other subordinated classes as to the payment of principal and interest, with the result that defaults on the underlying
mortgage loans are borne first by the holders of the subordinated class); creation of reserve funds (in which case cash or investments,
sometimes funded from a portion of the payments on the underlying mortgage loans, are held in reserve against future losses); and
overcollateralization (in which case the scheduled payments on, or the principal amount of, the underlying mortgage loans exceeds
that required to make payment on the securities and pay any servicing or other fees). However, there can be no guarantee that credit
enhancements, if any, will be sufficient to prevent losses in the event of defaults on the underlying mortgage loans. In addition, MBS
that are issued by private issuers are not subject to the underwriting requirements for the underlying mortgages that are applicable
to those MBS that have a government or government-sponsored entity guarantee. As a result, the mortgage loans underlying private
MBS may, and frequently do, have less favorable collateral, credit risk or other underwriting characteristics than government or
government-sponsored MBS and have wider variances in a number of terms including interest rate, term, size, purpose and borrower
characteristics. Privately issued pools more frequently include second mortgages, high loan-to-value mortgages and manufactured
housing loans. The coupon rates and maturities of the underlying mortgage loans in a private-label MBS pool may vary to a greater
extent than those included in a government guaranteed pool, and the pool may include subprime mortgage loans.
Privately issued MBS are not traded on an exchange and there may be a limited market for the securities, especially when there is a
perceived weakness in the mortgage and real estate market sectors. Without an active trading market, MBS held in a Fund's portfolio
may be particularly difficult to value because of the complexities involved in assessing the value of the underlying mortgage loans.
168 Notes to Financial Statements
Russell Investment Funds
Notes to Financial Statements, continued — December 31, 2017
Asset-Backed Securities
ABS may include MBS, loans, receivables or other assets. The value of the Funds’ ABS may be affected by, among other things,
actual or perceived changes in interest rates, factors concerning the interests in and structure of the issuer or the originator of the
receivables, the market’s assessment of the quality of underlying assets or actual or perceived changes in the credit worthiness of
the individual borrowers, the originator, the servicing agent or the financial institution providing the credit support.
Payment of principal and interest may be largely dependent upon the cash flows generated by the assets backing the securities.
Rising or high interest rates tend to extend the duration of ABS, making them more volatile and more sensitive to changes in interest
rates. The underlying assets are sometimes subject to prepayments which can shorten the security’s weighted average life and may
lower its return. Defaults on loans underlying ABS have become an increasing risk for ABS that are secured by home equity loans
related to sub-prime, Alt-A or non-conforming mortgage loans, especially in a declining residential real estate market.
ABS (other than MBS) present certain risks that are not presented by MBS. Primarily, these securities may not have the benefit
of any security interest in the related assets. Credit card receivables are generally unsecured and the debtors are entitled to the
protection of a number of state and federal consumer credit laws, many of which give such debtors the right to set off certain amounts
owed on the credit cards, thereby reducing the balance due. There is the possibility that recoveries on repossessed collateral may
not, in some cases, be available to support payments on these securities. ABS are often backed by a pool of assets representing the
obligations of a number of different parties. To lessen the effect of failures by obligors on underlying assets to make payments, the
securities may contain elements of credit support which fall into two categories: (i) liquidity protection, and (ii) protection against
losses resulting from ultimate default by an obligor on the underlying assets. Liquidity protection refers to the provision of advances,
generally by the entity administering the pool of assets, to ensure that the receipt of payments on the underlying pool occurs in
a timely fashion. Protection against losses results from payment of the insurance obligations on at least a portion of the assets in
the pool. This protection may be provided through guarantees, policies or letters of credit obtained by the issuer or sponsor from
third parties, through various means of structuring the transaction or through a combination of such approaches. The Fund will not
pay any additional or separate fees for credit support. The degree of credit support provided for each issue is generally based on
historical information respecting the level of credit risk associated with the underlying assets.
Delinquency or loss in excess of that anticipated or failure of the credit support could adversely affect the return on an investment
in such a security. The availability of ABS may be affected by legislative or regulatory developments. It is possible that such
developments may require the Funds to dispose of any then-existing holdings of such securities.
Forward Commitments
The Strategic Bond Fund may contract to purchase securities for a fixed price at a future date beyond customary settlement time.
The price of the underlying securities and the date when the securities will be delivered and paid for are fixed at the time the
transaction is negotiated. The Fund may dispose of a forward commitment transaction prior to settlement if it is appropriate to do
so and may realize short-term gains (or losses) upon such sale. When effecting such transactions, cash or liquid high-grade debt
obligations of the Fund in a dollar amount sufficient to make payment for the portfolio securities to be purchased will be earmarked
on the Fund’s records at the trade date and until the transaction is settled. A forward commitment transaction involves a risk of
loss if the value of the security to be purchased declines prior to the settlement date or the other party to the transaction fails to
complete the transaction.
The Strategic Bond Fund may invest in to-be-announced ("TBA") mortgage-backed securities. A TBA security is a forward
mortgage-backed securities trade in which a seller agrees to issue a TBA mortgage-backed security at a future date. The securities
are purchased and sold on a forward commitment basis with an approximate principal amount and maturity date. The actual
principal amount and maturity date will be determined upon settlement when the specific mortgage pools are assigned. These
securities are within the parameters of industry “good delivery” standards.
As of December 31, 2017, the Strategic Bond Fund had $747,000 cash collateral balances in connection with TBAs.
Inflation-Indexed Bonds
The Strategic Bond Fund may invest in inflation-indexed securities, which are typically bonds or notes designed to provide a return
higher than the rate of inflation (based on a designated index) if held to maturity. A common type of inflation-indexed security is a
U.S. Treasury Inflation-Protected Security (“TIPS”). The principal of a TIPS increases with inflation and decreases with deflation,
as measured by the Consumer Price Index. When a TIPS matures, the adjusted principal or original principal is paid, whichever is
Notes to Financial Statements 169
Russell Investment Funds
Notes to Financial Statements, continued — December 31, 2017
greater. TIPS pay interest twice a year, at a fixed rate. The rate is applied to the adjusted principal; so, like the principal, interest
payments rise with inflation and fall with deflation.
Guarantees
In the normal course of business, the Funds enter into contracts that contain a variety of representations which provide general
indemnifications. The Funds’ maximum exposure under these arrangements is unknown as this would involve future claims that
may be made against the Funds that have not yet occurred. However, the Funds expect the risk of loss to be remote.
Market, Credit and Counterparty Risk
In the normal course of business, the Funds trade financial instruments and enter into financial transactions where risk of potential
loss exists due to changes in the market (market risk) or failure of the other party to a transaction to perform (credit risk). Similar
to credit risk, the Funds may also be exposed to counterparty risk or risk that an institution or other entity with which the Funds
have unsettled or open transactions will default. The potential loss could exceed the value of the relevant assets recorded in the
Funds' financial statements (the “Assets”). The Assets consist principally of cash due from counterparties and investments. The
extent of the Funds’ exposure to market, credit and counterparty risks with respect to the Assets approximates their carrying value
as recorded in the Funds’ Statements of Assets and Liabilities.
Global economies and financial markets are becoming increasingly interconnected and political and economic conditions (including
recent instability and volatility) and events (including natural disasters) in one country, region or financial market may adversely
impact issuers in a different country, region or financial market. As a result, issuers of securities held by a Fund may experience
significant declines in the value of their assets and even cease operations. Such conditions and/or events may not have the same
impact on all types of securities and may expose a Fund to greater market and liquidity risk and potential difficulty in valuing
portfolio instruments held. This could cause a Fund to underperform other types of investments.
3. Investment Transactions
Securities
During the period ended December 31, 2017, purchases and sales of investment securities (excluding U.S. Government and
Agency obligations, short-term investments, options, futures and repurchase agreements) were as follows:
| | | | | | |
| | | Purchases | | | Sales | |
| U. S. Strategic Equity Fund | $ | 353,184,104 | | $ | 417,812,599 | |
| U. S. Small Cap Equity Fund | | 312,943,486 | | | 326,479,226 | |
| International Developed Markets Fund | | 431,400,294 | | | 434,093,620 | |
| Strategic Bond Fund | | 402,968,491 | | | 323,415,542 | |
| Global Real Estate Securities Fund | | 732,072,277 | | | 693,470,833 | |
Purchases and sales of U.S. Government and Agency obligations (excluding short-term investments, options, futures and repurchase
agreements) were as follows:
| | | | | | |
| | | Purchases | | | Sales | |
| Strategic Bond Fund | $ | 945,363,800 | | $ | 831,735,882 | |
Securities Lending
The Investment Company has a securities lending program whereby each Fund can loan securities with a value up to 33 1/3% of
each Fund’s total assets. The maturity associated with these securities is considered continuous. The Fund receives cash (U.S.
currency), U.S. Government or U.S. Government Agency obligations as collateral against the loaned securities. The cash collateral
cannot be resold, repledged or rehypothecated. As of December 31, 2017, to the extent that a loan was collateralized by cash, such
collateral was invested by the securities lending agent, Brown Brothers Harriman & Co. (“BBH”), in the U.S. Cash Collateral Fund,
an unregistered fund advised by RIM. The collateral received is recorded on a lending Fund’s Statement of Assets and Liabilities
along with the related obligation to return the collateral.
Affiliated income generated from the investment of cash collateral, less negotiated rebate fees paid to participating brokers, is
divided between the Fund and BBH and is reported as securities lending income on the Fund's Statement of Operations. To the
extent that a loan is secured by non-cash collateral, brokers pay the Fund negotiated lenders’ fees, which are divided between the
Fund and BBH and are recorded as securities lending income for the Fund. All collateral received will be in an amount at least
170 Notes to Financial Statements
Russell Investment Funds
Notes to Financial Statements, continued — December 31, 2017
equal to 102% (for loans of U.S. securities) or 105% (for loans of non-U.S. securities) of the fair value of the loaned securities at the
inception of each loan. The fair value of the loaned securities is determined at the close of business of the Fund and any additional
required collateral is delivered to the Fund the next day. Should the borrower of the securities fail financially, there is a risk of delay
in recovery of the securities or loss of rights in the collateral.
4. Related Party Transactions, Fees and Expenses
Adviser, Administrator, Transfer and Dividend Disbursing Agent
RIM provides or oversees the provision of all investment advisory and portfolio management services for the Funds, including
developing the investment program for each Fund and managing each Fund's overall exposures. From its advisory fees received
from the Funds, RIM, as agent for RIC, pays all fees to the money managers for their investment advisory services. Each money
manager has agreed that it will look only to RIM for the payment of the money manager’s fee, after RIC has paid RIM. Fees paid
to the money managers are not affected by any voluntary or statutory expense limitations. RIFUS is the Funds' administrator and
transfer agent. RIFUS, in its capacity as the Funds' administrator, provides or oversees the provision of all administrative services
for the Funds. RIFUS, in its capacity as the Funds' transfer agent and dividend disbursing agent, is responsible for providing
transfer agency and dividend disbursing services to the Funds. RIFUS is a wholly-owned subsidiary of RIM. RIM is an indirect,
wholly-owned subsidiary of Russell Investments Group, Ltd., a Cayman company.
The Funds are permitted to invest their cash (i.e., cash awaiting investment or cash held to meet redemption requests or to pay
expenses) in the U.S. Cash Management Fund, an unregistered fund advised by RIM. As of December 31, 2017, the Funds
had invested $137,691,429 in the U.S. Cash Management Fund. In addition, all or a portion of the collateral received from the
Investment Company’s securities lending program in the amount of $21,824,502 is invested in the U.S. Cash Collateral Fund, an
unregistered fund advised by RIM.
The advisory fee is based upon the average daily net assets of each Fund and the administration fee of up to 0.05% is based on the
combined average daily net assets of the Funds. Advisory and administration fees are paid monthly.
| | | | | | |
| | | | Annual Rate |
| Funds | | Adviser (%) | | | Administrator (%) |
| U. S. Strategic Equity Fund | | | 0.73 | | | Up to 0.05 |
| U. S. Small Cap Equity Fund | | | 0.90 | | | Up to 0.05 |
| International Developed Markets Fund | | | 0.90 | | | Up to 0.05 |
| Strategic Bond Fund | | | 0.55 | | | Up to 0.05 |
| Global Real Estate Securities Fund | | | 0.80 | | | Up to 0.05 |
The following table shows the total amount of each of these fees paid by the Funds for the period ended December 31, 2017:
| | | | | | |
| | | Advisory | | | Administrative | |
| U. S. Strategic Equity Fund | $ | 3,372,251 | | $ | 230,976 | |
| U. S. Small Cap Equity Fund | | 2,193,971 | | | 121,888 | |
| International Developed Markets Fund | | 3,557,642 | | | 197,646 | |
| Strategic Bond Fund | | 4,804,404 | | | 436,764 | |
| Global Real Estate Securities Fund | | 6,762,068 | | | 422,630 | |
RIM has agreed to certain waivers of its advisory fees as follows:
For the Strategic Bond Fund, RIM contractually agreed, until April 30, 2017, to waive 0.02% of its 0.55% advisory fee. The total
amount of the waiver for the period ended December 31, 2017 was $55,837.There were no reimbursements during the period.
RIM does not have the ability to recover amounts waived or reimbursed from previous periods.
Transfer and Dividend Disbursing Agent
RIFUS serves as transfer agent and provides dividend disbursing services to the Funds. For this service, RIFUS is paid a fee based
upon the average daily net assets of the Funds for transfer agency and dividend disbursing services. RIFUS retains a portion of this
fee for services provided to the Funds and pays the balance to unaffiliated agents who assist in providing these services. Transfer
agency fees paid by the Funds presented herein for the period ended December 31, 2017 were as follows:
Notes to Financial Statements 171
Russell Investment Funds
Notes to Financial Statements, continued — December 31, 2017
| | | |
| | | Amount | |
| U. S. Strategic Equity Fund | $ | 20,326 | |
| U. S. Small Cap Equity Fund | | 10,726 | |
| International Developed Markets Fund | | 17,393 | |
| Strategic Bond Fund | | 38,435 | |
| Global Real Estate Securities Fund | | 37,191 | |
Distributor
Russell Investments Financial Services, LLC (the “Distributor”), a wholly-owned subsidiary of RIM, is the distributor for the
Investment Company, pursuant to a distribution agreement with the Investment Company. The Distributor receives no compensation
from the Investment Company for its services.
Affiliated Brokerage Commissions
The Funds effect certain transactions through Russell Investments Implementation Services, LLC (“RIIS”). RIIS is a registered
broker and investment adviser and an affiliate of RIM. RIIS uses a multi-venue trade management approach whereby RIIS allocates
trades among RIIS’ network of independent brokers for execution, clearing and other services. Trades placed through RIIS and its
independent brokers are made (i) to manage trading associated with changes in money managers, rebalancing across existing money
managers, cash flows and other portfolio transitions, (ii) to execute portfolio securities transactions for the portion of each Fund’s
assets that RIM determines not to allocate to money managers, including assets RIM may manage to effect a Fund’s investment
strategies and/or to modify a Fund's overall portfolio characteristics and for each Fund’s cash reserves, (iii) to execute portfolio
securities transactions for the portion of a Fund’s assets that RIM manages based upon model portfolios provided by the Fund’s
non-discretionary managers, or (iv) to execute money manager’s portfolio securities transactions for the segment of a Fund’s portfolio
assigned to the money manager. RIM has authorized RIIS to effect certain futures, swaps, OTC derivative transactions, and cleared
swaps, including foreign currency spots, forwards and options trading on behalf of the Funds.
The Funds are permitted to purchase or sell securities from or to certain related affiliated funds under specified conditions outlined
in procedures adopted by the Board. The procedures have been designed to ensure that any purchase or sale of securities by the
Funds from or to another fund or portfolio that are, or could be, considered an affiliate by virtue of having a common investment
adviser (or affiliated investment advisers), common Trustees and/or common officers complies with Rule 17a -7 of the Investment
Company Act. Further, as defined under the procedures each transaction is effected at the current market value.
During the period ended December 31, 2017, the Funds below engaged in purchases and sales of securities pursuant to Rule 17a
-7 of the Investment Company Act as follows (amount in thousands):
| | | | | | |
| | | Purchases | | Sales | |
| International Developed Markets Fund | $ | | - | $ | 265,385 | |
Board of Trustees
The Russell Investments Fund Complex consists of Russell Investment Company ("RIC"), which has 34 funds and RIF, which has
9 funds. Each of the Trustees is a Trustee of RIC and RIF. The Russell Investments Fund Complex compensates each Trustee who
is not an employee of RIM or its affiliates. Trustee compensation and expenses are allocated to each Fund based on its net assets
relative to other funds in the Russell Investments Fund Complex.
For the period ended December 31, 2017, the regular compensation paid to the Trustees by the Russell Investments Fund Complex
was $1,394,250.
5. Federal Income Taxes
At December 31, 2017, the following Funds had net tax basis capital loss carryforwards which may be applied against any net
realized taxable gains in each succeeding year or until their respective expiration dates, whichever occurs first. Available capital
loss carryforwards and expiration dates are as follows:
| | | | | | | | | | | | |
| | | | | | | | | No Expiration | | |
| Funds | | 12/31/2017 | 10/31/2018 | | 10/31/2019 | | Short Term | | Long-Term | | Totals |
| Strategic Bond Fund | $ | — | $ | — | $ | — | $ | 4,638,689 | $ | 2,747,409 | $ | 7,386,098 |
172 Notes to Financial Statements
Russell Investment Funds
Notes to Financial Statements, continued — December 31, 2017
Under the Regulated Investment Company Modernization Act of 2010, the Funds are permitted to carry forward capital losses
incurred in taxable years beginning after December 22, 2010 for an unlimited period. However, any losses incurred in post-
enactment taxable years will be required to be utilized prior to the losses incurred in pre-enactment taxable years. As a result of
this ordering rule, pre-enactment capital loss carryforwards may be more likely to expire unused. Additionally, post-enactment
capital losses that are carried forward will retain their character as either short-term or long-term capital losses rather than being
considered all short-term as under previous law.
6. Record Ownership
At December 31, 2017, the following table includes shareholders of record with greater than 10% of the total outstanding shares
of each respective Fund.
| | | | | | |
| | # of Shareholders | | | % | |
| U. S. Strategic Equity Fund | | 2 | | | 85.9 | |
| U. S. Small Cap Equity Fund | | 3 | | | 80.8 | |
| International Developed Markets Fund | | 2 | | | 71.0 | |
| Strategic Bond Fund | | 1 | | | 69.9 | |
| Global Real Estate Securities Fund | | 2 | | | 91.8 | |
7. Illiquid and Restricted Securities
No more than 15% of a Fund's net assets will be invested in securities, including repurchase agreements of more than seven days'
duration, that are illiquid. This limitation is applied at the time of purchase. A security is illiquid if it cannot be disposed of within
seven days in the ordinary course of business at approximately the amount at which a Fund has valued such security. There may be
delays in selling illiquid securities at prices representing their fair value.
The Board of the Funds has adopted procedures to permit each Fund to deem as liquid the following types of securities that are
otherwise presumed to be illiquid securities: (i) certain restricted securities that are eligible for resale pursuant to Rule 144A
under the Securities Act; (ii) certain commercial paper issued in reliance on the exemption from registration provided by Section
4(a)(2) of the Securities Act; (iii) certain interest-only and principal-only fixed mortgage-backed securities issued by the United
States government or its agencies and instrumentalities; (iv) certain municipal lease obligations and certificates of participation
in municipal lease obligations; and (v) certain restricted debt securities that are subject to unconditional puts or demand features
exercisable within seven days.
A restricted security may have contractual restrictions on resale, may have been offered in a private placement transaction, and may
not be registered under the Securities Act of 1933.
See each Fund’s Schedule of Investments for a list of securities that have been footnoted as an illiquid security, a restricted security
or as an illiquid and restricted security.
8. Commitments and Contingencies
The Strategic Bond Fund may enter into certain credit agreements, all or a portion of which may be unfunded. The Fund is obligated
to fund these loan commitments at the borrowers' discretion. Unfunded loan commitments and funded portions of credit agreements
are marked to market daily and any unrealized appreciation or depreciation is included in the Statements of Assets and Liabilities
and the Statements of Operations. Funded portions of credit agreements are presented in the Schedules of Investments. For the
period ended December 31, 2017, there were no unfunded loan commitments held by the Fund.
9. Subsequent Events
Management has evaluated the events and/or transactions that have occurred through the date the financial statements were issued
and noted no events have occurred that require disclosure.
Notes to Financial Statements 173
Report of Independent Registered Public Accounting Firm
To the Board of Trustees of Russell Investment Funds and Shareholders of U.S. Strategic Equity Fund, U.S. Small Cap Equity Fund,
International Developed Markets Fund, Strategic Bond Fund and Global Real Estate Securities Fund
Opinions on the Financial Statements
We have audited the accompanying statements of assets and liabilities, including the schedules of investments, of U.S. Strategic
Equity Fund (formerly Multi-Style Equity Fund), U.S. Small Cap Equity Fund (formerly Aggressive Equity Fund), International
Developed Markets Fund (formerly Non-U.S. Fund), Strategic Bond Fund (formerly Core Bond Fund) and Global Real Estate
Securities Fund (five of the funds constituting Russell Investment Funds, hereafter collectively referred to as the “Funds”) as of
December 31, 2017, the related statements of operations for the year ended December 31, 2017, the statements of changes in net
assets for each of the two years in the period ended December 31, 2017, including the related notes, and the financial highlights for
each of the five years in the period ended December 31, 2017 (collectively referred to as the “financial statements”). In our opinion,
the financial statements present fairly, in all material respects, the financial position of each of the Funds as of December 31, 2017,
the results of each of their operations for the year then ended, the changes in each of their net assets for each of the two years in the
period ended December 31, 2017 and each of the financial highlights for each of the five years in the period ended December 31,
2017 in conformity with accounting principles generally accepted in the United States of America.
Basis for Opinions
These financial statements are the responsibility of the Funds’ management. Our responsibility is to express an opinion on the
Funds’ financial statements based on our audits. We are a public accounting firm registered with the Public Company Accounting
Oversight Board (United States) (“PCAOB”) and are required to be independent with respect to the Funds in accordance with the
U.S. federal securities laws and the applicable rules and regulations of the Securities and Exchange Commission and the PCAOB.
We conducted our audits of these financial statements in accordance with the standards of the PCAOB. Those standards require
that we plan and perform the audit to obtain reasonable assurance about whether the financial statements are free of material
misstatement, whether due to error or fraud.
Our audits included performing procedures to assess the risks of material misstatement of the financial statements, whether due to
error or fraud, and performing procedures that respond to those risks. Such procedures included examining, on a test basis, evidence
regarding the amounts and disclosures in the financial statements. Our audits also included evaluating the accounting principles
used and significant estimates made by management, as well as evaluating the overall presentation of the financial statements. Our
procedures included confirmation of securities owned as of December 31, 2017 by correspondence with the custodian, transfer
agent and brokers; when replies were not received from brokers, we performed other auditing procedures. We believe that our audits
provide a reasonable basis for our opinions.

We have served as the auditor of one or more investment companies in the Russell Investments family of funds since 1981.
174 Report of Independent Registered Public Accounting Firm
Russell Investment Funds
Tax Information — December 31, 2017 (Unaudited)
For the tax year ended December 31, 2017, the Funds hereby designate 100% or the maximum amount allowable, of its net taxable
income as qualified dividends taxed at individual net capital gain rates.
The Form 1099 you receive in January 2018 will show the tax status of all distributions paid to your account in calendar year 2017.
The Funds designate dividends distributed during the fiscal year as qualifying for the dividends received deduction for corporate
shareholders as follows:
| | |
| U. S. Strategic Equity | 35.7 | % |
| U. S. Small Cap Equity | 18.6 | % |
| International Developed Markets | 0.0 | % |
| Strategic Bond | 0.0 | % |
| Global Real Estate Securities | 0.0 | % |
Pursuant to Section 852 of the Internal Revenue Code, the Funds designate the following amounts as long-term capital gain
dividends for their taxable year ended December 31, 2017:
| | |
| U. S. Strategic Equity | $ | 29,150,493 |
| U. S. Small Cap Equity | $ | 11,571,044 |
| International Developed Markets | $ | 14,485,707 |
| Strategic Bond | $ | — |
| Global Real Estate Securities | $ | 16,441,237 |
The Funds listed below paid foreign taxes and recognized foreign source income during the taxable year ended December 31, 2017.
Pursuant to Section 853 of the Internal Revenue Code, the Funds designate the following per share amounts of foreign taxes paid and
income earned from foreign sources:
| | | | | | | | | |
| | | | | | Foreign | | | | Foreign |
| | | | | | Taxes | | | | Source |
| | | | Foreign | | Paid | | Foreign Source | | Income Per |
| Fund Name | | | Taxes Paid | | Per Share | | Income | | Share |
| |
| International Developed Markets | $ | 819,920 | $ | 0.0247 | $ | 10,757,448 | $ | 0.3236 |
Please consult a tax adviser for any questions about federal or state income tax laws.
Tax Information 175
Russell Investment Funds
Affiliated Brokerage Transactions — December 31, 2017 (Unaudited)
As discussed in the Note 4 in the Notes to Financial Statements contained in this annual report, the Funds utilize RIIS and its
independent brokers. RIIS is a registered broker dealer and investment adviser and an affiliate of RIM. RIIS uses a multi-venue trade
management approach whereby RIIS allocates trades among RIIS’ network of independent brokers for execution, clearing, and other
services. Trades placed through RIIS and its independent brokers are made (i) to manage trading associated with changes in money
managers, rebalancing across existing money managers, cash flows and other portfolio transitions, (ii) to execute portfolio securities
transactions for each Fund’s assets that RIM determines not to allocate to money managers including assets RIM may manage to effect
a Fund’s investment strategies and/or to modify a Fund’s overall portfolio characteristics and for each Fund’s cash reserves, (iii) to
execute portfolio securities transactions for the portion of a Fund’s assets that RIM manages based upon model portfolios provided by
the Funds’ non-discretionary managers or (iv) to execute money manager portfolio securities transactions for the segment of a Fund’s
portfolio assigned to the money manager, or (v) to execute foreign currency transactions on behalf of the Funds. RIM has authorized
RIIS to effect certain futures, swaps, OTC derivative transactions, and cleared swaps, including foreign currency spots, forwards and
options trading on behalf of the Funds.
Amounts retained by RIIS for the period ended December 31, 2017 were as follows:
| | | |
| Affiliated Broker | Fund Name | | 2017 |
| RIIS | | | |
| | U. S. Strategic Equity Fund | $ | 6,900 |
| | U. S. Small Cap Equity Fund | | 48,077 |
| | International Developed Markets Fund | | 121,387 |
| | Strategic Bond Fund | | — |
| | Global Real Estate Securities Fund | | 62,182 |
176 Affiliated Brokerage Transactions
Russell Investment Funds
Basis for Approval of Investment Advisory Contracts — (Unaudited)
Approval of Money Manager Contracts
The Board received the following proposals from RIM: (i) at a meeting held on August 29, 2017, to approve a new portfolio management
contract for an existing Money Manager of the U.S. Strategic Equity Fund and the International Developed Markets Fund, and at
that same meeting to approve new portfolio management contracts for the Strategic Bond Fund resulting from a change of control for
two of the Fund’s Money Managers; and (ii) at a meeting held on December 5, 2017, to effect Money Manager changes for the U.S.
Small Cap Equity Fund and International Developed Markets Fund. In the case of each proposed change, the Trustees approved the
terms of the proposed portfolio management contract based upon RIM’s recommendation to hire the Money Manager at the proposed
fee rate; information as to the reason for the proposed change; information as to the Money Manager’s role in the management of the
Fund’s investment portfolio (including the amount of Fund assets to be allocated to the Money Manager or managed pursuant to the
Money Manager’s strategy) and RIM’s evaluation of the anticipated quality of the investment advisory services to be provided by the
Money Manager; information as to any significant business relationships between the Money Manager and RIM or Russell Investments
Financial Services, LLC, the Fund’s underwriter; the CCO’s evaluation of the Money Manager’s compliance program, policies and
procedures in relation to the Money Manager’s role in the management of the Fund’s investment portfolio, and certification that they
were consistent with applicable legal standards; RIM’s explanation as to the lack of relevance of Money Manager profitability to the
evaluation of portfolio management contracts with Money Managers because the willingness of Money Managers to serve in such
capacity depends upon arm’s-length negotiations with RIM; RIM’s awareness of the standard fee rates charged by the Money Manager
to other clients; RIM’s belief that the proposed Money Manager fees would be reasonable in light of the anticipated quality of investment
advisory services to be rendered; the increase or decrease in aggregate Money Manager fees to be paid by RIM from its advisory fee
as a result of the engagement of the Money Manager; and the expected costs of transitioning Fund assets to the Money Manager or its
strategy. The Trustees’ approval also reflected their findings at prior meetings, including their December 2015 meeting in connection
with their evaluation and approval of the Funds’ existing investment advisory agreements with RIM and then current Money Managers
for the Funds, as well as information received throughout the course of the year regarding, among other things, the quality of services
provided to the Funds in the case of existing Money Managers and the reasonableness of the aggregate investment advisory fees paid by
the Funds, as well as the fact that the aggregate investment advisory fees paid by the Funds would not increase or decrease as a result of
the implementation of the proposed Money Manager changes because the Money Manager’s investment advisory fees are paid by RIM.
Basis for Approval of Investment Advisory Contracts 177
Russell Investment Funds
Shareholder Requests for Additional Information — December 31, 2017 (Unaudited)
A complete unaudited schedule of investments is made available generally no later than 60 days after the end of the first and third
quarters of each fiscal year. These reports are available (i) free of charge, upon request, by calling the Funds at (800) 787-7354, (ii)
on the Securities and Exchange Commission’s website at www.sec.gov, and (iii) at the Securities and Exchange Commission’s Office of
Investor Education and Advocacy (formerly, the Public Reference room).
The Board has delegated to RIM, as RIF’s investment adviser, the primary responsibility for monitoring, evaluating and voting proxies
solicited by or with respect to issuers of securities in which assets of the Funds may be invested. RIM has established a proxy voting
committee and has adopted written proxy voting policies and procedures (“P&P”) and proxy voting guidelines (“Guidelines”). The
Funds maintain a Portfolio Holdings Disclosure Policy that governs the timing and circumstances of disclosure to shareholders and
third parties of information regarding the portfolio investments held by the Funds. A description of the P&P, Guidelines, Portfolio
Holdings Disclosure Policy and additional information about Fund Trustees are contained in the Funds’ Statement of Additional
Information (“SAI”). The SAI and information regarding how the Funds voted proxies relating to portfolio securities during the most
recent 12-month period ended June 30, 2017 are available (i) free of charge, upon request, by calling the Funds at (800) 787-7354,
and (ii) on the Securities and Exchange Commission’s website at www.sec.gov.
If possible, depending on contract owner registration and address information, and unless you have otherwise opted out, only one copy
of the RIF prospectus and each annual and semi-annual report will be sent to contract owners at the same address. If you would like
to receive a separate copy of these documents, please contact your Insurance Company. If you currently receive multiple copies of the
prospectus, annual report and semi-annual report and would like to request to receive a single copy of these documents in the future,
please call your insurance company.
Some insurance companies may offer electronic delivery of the Funds’ prospectuses and annual and semi-annual reports. Please
contact your insurance company for further details.
178 Shareholder Requests for Additional Information
Russell Investment Funds
Disclosure of Information about Fund Trustees and Officers — December 31, 2017
(Unaudited)
The following tables provide information for each officer and trustee of the Russell Investments Fund Complex. The Russell Investments
Fund Complex consists of Russell Investment Company (“RIC”), which has 34 funds and Russell Investment Funds (“RIF”), which
has 9 funds. Each of the trustees is a trustee of RIC and RIF. The first table provides information for the interested trustee. The second
table provides information for the independent trustees. The third table provides information for the Trustee Emeritus. The fourth table
provides information for the officers. Furthermore, each Trustee possesses the following specific attributes: Mr. Alston has business,
financial and investment experience as a senior executive of an international real estate firm and is trained as a lawyer; Ms. Blake has
had experience as a certified public accountant and has had experience as a member of boards of directors/trustees of other investment
companies; Ms. Burgermeister has had experience as a certified public accountant and as a member of boards of directors/trustees of
other investment companies and has been determined by the Board to be an “audit committee financial expert”; Mr. Connealy has had
experience with other investment companies and their investment advisers, first as a partner in the investment management practice of
PricewaterhouseCoopers LLP and, subsequently, as the senior financial executive of two other investment organizations sponsoring and
managing investment companies; Ms. Krysty has had business, financial and investment experience as the founder and senior executive
of a registered investment adviser focusing on high net worth individuals as well as a certified public accountant and a member of the
boards of other corporations and non-profit organizations; Mr. Tennison has had business, financial and investment experience as a senior
executive of a corporation with international activities and was trained as an accountant; and Mr. Thompson has had experience in business,
governance, investment and financial reporting matters as a senior executive of an organization sponsoring and managing other investment
companies, and, subsequently, has served as a board member of other investment companies. Mr. Spina has had experience with other
financial services companies, including companies engaged in the sponsorship, management and distribution of investment companies.
As a senior officer and/or director of the Funds, the Adviser and various affiliates of the Adviser providing services to the Funds, Mr.
Spina is in a position to provide the Board with such parties' perspectives on the management, operations and distribution of the Funds.
| | | | | |
| Name, | Position(s) Held | Term | Principal Occupation(s) | No. of | Other |
| Age, | With Fund and | of | During the | Portfolios | Directorships |
| Address | Length of | Office * | Past 5 Years | in Russell | Held by Trustee |
| | Time Served | | | Investments | During the |
| | | | | Fund | Past 5 Years |
| | | | | Complex | |
| | | | | Overseen | |
| | | | | by Trustee | |
| |
| INTERESTED TRUSTEE | | | | | |
| Mark Spina, # | Trustee since 2017 | Appointed until | • President and CEO, RIC and RIF | 43 | None |
| Born June 8, 1970 | President and Chief | successor is | • Chairman of the Board, President, | | |
| 1301 Second Avenue, | Executive Officer | duly elected and | Russell Investments Financial | | |
| 18th Floor, Seattle, WA | since 2017 | qualified | Services, LLC (“RIFIS”) | | |
| 98101 | | Appointed | • Director, RIM. | | |
| | | until successor | • From 2015-2016, Head of | | |
| | | is chosen and | Intermediary Distribution and | | |
| | | qualified by | President of Pioneer Funds | | |
| | | Trustees | Distributor | | |
| | | | • From 2008-2015 Head of | | |
| | | | Intermediary Distribution, Voya | | |
| | | | Investment Management | | |
| |
| |
| INDEPENDENT TRUSTEES | | | | | |
| Thaddas L. Alston, | Trustee since 2006 | Appointed until | Senior Vice President, Larco | 43 | Until October |
| Born April 7, 1945 | | successor is | Investments, Ltd. (real estate firm) | | 2015, Trustee, |
| 1301 Second Avenue, | | duly elected and | | | Russell |
| 18th Floor, Seattle, WA | | qualified | | | Exchange |
| 98101 | | | | | Traded Funds |
| | | | | | Trust |
Disclosure of Information about Fund Trustees and Officers 179
Russell Investment Funds
Disclosure of Information about Fund Trustees and Officers, continued — December
31, 2017 (Unaudited)
| | | | | | |
| | Name, | Position(s) Held | Term | Principal Occupation(s) | No. of | Other |
| | Age, | With Fund and | of | During the | Portfolios | Directorships |
| | Address | Length of | Office * | Past 5 Years | in Russell | Held by Trustee |
| | | Time Served | | | Investments | During the |
| | | | | | Fund | Past 5 Years |
| | | | | | Complex | |
| | | | | | Overseen | |
| | | | | | by Trustee | |
| |
| Kristianne Blake, | Trustee since 2000 | Appointed until | • Lead Independent Director, | 43 | • Lead |
| Born January 22, 1954 | Chairman since 2005 | successor is | Avista Corp (electric utilities) | | Independent |
| 1301 Second Avenue, | | duly elected and | • Until May 2017, Director | | Director, |
| 18th Floor, Seattle, WA | | qualified | and Chairman of the Audit | | Avista Corp |
| 98101 | | | Approved | Committee, Avista Corp (electric | | (electric |
| | | | annually | utilities) | | utilities) |
| | | | | • Regent, University of Washington | | • Until May |
| | | | | • President, Kristianne Gates | | 2017, |
| | | | | Blake, P. S. (accounting services) | | Director, |
| | | | | • Until June 30, 2014, Director, | | Avista Corp |
| | | | | Ecova (total energy and | | (electric |
| | | | | sustainability management) | | utilities) |
| | | | | • Until December 31, 2013, Trustee | | • Until June |
| | | | | and Chairman of the Operations | | 30, 2014, |
| | | | | Committee, Principal Investors | | Director, |
| | | | | Funds and Principal Variable | | Ecova (total |
| | | | | Contracts Funds (investment | | energy and |
| | | | | company) | | sustainability |
| | | | | | | management) |
| | | | | | | • Until |
| | | | | | | December 31, |
| | | | | | | 2013, Trustee, |
| | | | | | | Principal |
| | | | | | | Investors |
| | | | | | | Funds |
| | | | | | | (investment |
| | | | | | | company) |
| | | | | | | • Until |
| | | | | | | December 31, |
| | | | | | | 2013, Trustee |
| | | | | | | Principal |
| | | | | | | Variable |
| | | | | | | Contracts |
| | | | | | | Funds |
| | | | | | | (investment |
| | | | | | | company) |
| | | | | | | • Until October |
| | | | | | | 2015, Trustee, |
| | | | | | | Russell |
| | | | | | | Exchange |
| | | | | | | Traded Funds |
| | | | | | | Trust |
| |
| |
| |
| * | Each Trustee is subject to mandatory retirement at age 75. | | | |
| # | Mr. Spina is also an officer and/or director of one or more affiliates of RIC and RIF and is therefore an Interested Trustee. | | |
180 Disclosure of Information about Fund Trustees and Officers
Russell Investment Funds
Disclosure of Information about Fund Trustees and Officers, continued — December
31, 2017 (Unaudited)
| | | | | |
| Name, | Position(s) Held | Term | Principal Occupation(s) | No. of | Other |
| Age, | With Fund and | of | During the | Portfolios | Directorships |
| Address | Length of | Office * | Past 5 Years | in Russell | Held by Trustee |
| | Time Served | | | Investments | During the |
| | | | | Fund | Past 5 Years |
| | | | | Complex | |
| | | | | Overseen | |
| | | | | by Trustee | |
| |
| INDEPENDENT TRUSTEES (continued) | | | | |
| Cheryl Burgermeister, | Trustee since 2012 | Appointed until | • Retired | 43 | • Trustee and |
| Born June 26, 1951 | Chairman of the | successor is | • Trustee and Chairperson of | | Chairperson of |
| 1301 Second Avenue, | Audit Committee | duly elected and | Select Sector SPDR Funds | | Select Sector |
| 18th Floor, Seattle, WA | since 2017 | qualified | (investment company) | | SPDR Funds |
| 98101 | | Appointed until | • Until December 31, 2014, | | (investment |
| | | successor is | Chairperson of Audit Committee, | | company) |
| | | duly elected and | Select Sector SPDR Funds | | • From August |
| | | qualified | (investment company) | | 2012 through |
| | | | | | May 2016, |
| | | | | | Trustee, ALPS |
| | | | | | Series Trust |
| | | | | | (investment |
| | | | | | company) |
| | | | | | • Until |
| | | | | | December |
| | | | | | 31, 2014, |
| | | | | | Chairperson |
| | | | | | of Audit |
| | | | | | Committee, |
| | | | | | Select Sector |
| | | | | | SPDR Funds |
| | | | | | (investment |
| | | | | | company) |
| | | | | | • Until October |
| | | | | | 2015, Trustee, |
| | | | | | Russell |
| | | | | | Exchange |
| | | | | | Traded Funds |
| | | | | | Trust |
| |
| |
| Daniel P. Connealy, | Trustee since 2003 | Appointed until | • Retired | 43 | Until October |
| Born June 6, 1946 | | successor is | • June 2004 to June 2014, Senior | | 2015, Trustee, |
| 1301 Second Avenue, | | duly elected and | Vice President and Chief | | Russell |
| 18th Floor, Seattle, WA | | qualified | Financial Officer, Waddell & | | Exchange |
| 98101 | | | Reed Financial, Inc. (investment | | Traded Funds |
| | | | company) | | Trust |
| |
| |
| Katherine W. Krysty, | Trustee since 2014 | Appointed until | • Retired | 43 | Until October |
| Born December 3, 1951 | | successor is | • January 2011 through March | | 2015, Trustee, |
| 1301 Second Avenue | | duly elected and | 2013, President Emerita, Laird | | Russell |
| 18th Floor, Seattle, WA | | qualified | Norton Wealth Management | | Exchange |
| 98101 | | | (investment company) | | Traded Funds |
| | | | | | Trust |
Disclosure of Information about Fund Trustees and Officers 181
Russell Investment Funds
Disclosure of Information about Fund Trustees and Officers, continued — December
31, 2017 (Unaudited)
| | | | | | |
| | | Position(s) Held | Term | Principal Occupation(s) | No. of | Other |
| | Name, | With Fund and | of | During the | Portfolios | Directorships |
| | Age, | Length of | Office * | Past 5 Years | in Russell | Held by Trustee |
| Address | Time Served | | | Investments | During the |
| | | | | | Fund | Past 5 Years |
| | | | | | Complex | |
| | | | | | Overseen | |
| | | | | | by Trustee | |
| |
| INDEPENDENT TRUSTEES (continued) | | | | |
| Raymond P. Tennison, Jr. , | Trustee since 2000 | Appointed until | • Retired | 43 | Until October |
| Born December 21, 1955 | Chairman of | successor is | • From January 2008 to December | | 2015, Trustee, |
| 1301 Second Avenue | the Nominating | duly elected and | 2011, Vice Chairman of the | | Russell |
| 18th Floor, Seattle, WA | and Governance | qualified | Board, Simpson Investment | | Exchange |
| 98101 | | Committee since | Appointed until | Company (paper and forest | | Traded Funds |
| | | 2007 | successor is | products) | | Trust |
| | | | duly elected and | | | |
| | | | qualified | | | |
| |
| |
| Jack R. Thompson, | Trustee since 2005 | Appointed until | • Retired | 43 | • Until October |
| Born March 21, 1949 | Chairman of | successor is | | | 2015, Trustee, |
| 1301 Second Avenue, | the Investment | duly elected and | | | Russell |
| 18th Floor, Seattle, WA | Committee since | qualified | | | Exchange |
| 98101 | | 2015 | Appointed until | | | Traded Funds |
| | | | successor is | | | Trust |
| | | | duly elected and | | | |
| | | | qualified | | | |
| |
| |
| * | Each Trustee is subject to mandatory retirement at age 75. | | | |
| |
| | Name, | Position(s) Held | Term | Principal Occupation(s) | No. of | Other |
| | Age, | With Fund and | of | During the | Portfolios | Directorships |
| Address | Length of | Office | Past 5 Years | in Russell | Held by Trustee |
| | | Time Served | | | Investments | During the |
| | | | | | Fund | Past 5 Years |
| | | | | | Complex | |
| | | | | | Overseen | |
| | | | | | by Trustee | |
| |
| TRUSTEE EMERITUS | | | | | |
| George F. Russell, Jr. , | Trustee Emeritus and | Until resignation | • Director Emeritus, RIM | 43 | None |
| Born July 3, 1932 | Chairman Emeritus | or removal | | | |
| 1301 Second Avenue, | since 1999 | | | | |
| 18th Floor, Seattle, WA | | | | | |
| 98101 | | | | | | |
182 Disclosure of Information about Fund Trustees and Officers
Russell Investment Funds
Disclosure of Information about Fund Trustees and Officers, continued — December
31, 2017 (Unaudited)
| | | |
| Name, | Positions(s) Held | Term | Principal Occupation(s) |
| Age, | With Fund and | of | During the |
| Address | Length of | Office | Past 5 Years |
| | Time Served | | |
| |
| OFFICERS | | | |
| Mark Spina, | President and Chief | Until successor | • President and Chief Executive Officer, RIC and RIF |
| Born June 8, 1970 | Executive Officer | is chosen and | • Chairman of the Board, President, RIFIS. |
| 1301 Second Avenue | since 2017 | qualified by | • Chairman of the Board, RIFUS |
| 18th Floor, Seattle, WA | | Trustees | • Director, RIM |
| 98101 | | | • From 2015 to 2016, Head of Intermediary Distribution and President |
| | | | of Pioneer Funds Distributor |
| | | | • From 2008 to 2015, Head of Intermediary Distribution, Voya |
| | | | Investment Management |
| |
| |
| Cheryl Wichers, | Chief Compliance | Until removed | • Chief Compliance Officer, RIC and RIF |
| Born December 16, 1966 | Officer since 2005 | by Independent | • Chief Compliance Officer, RIFUS |
| 1301 Second Avenue | | Trustees | • 2011 to 2016 Chief Compliance Officer, U. S. One , LLC |
| 18th Floor, Seattle, WA | | | |
| 98101 | | | |
| |
| |
| Mark E. Swanson, | Treasurer, Chief | Until successor | • Global Head of Fund Services, Russell Investments |
| Born November 26, 1963 | Accounting Officer | is chosen and | • Treasurer, Chief Accounting Officer and CFO, RIC and RIF |
| 1301 Second Avenue | and Chief Financial | qualified by | • Director and President, RIFUS |
| 18th Floor, Seattle, WA | Officer since 1998 | Trustees | • Director RIM, Russell Investments Trust Company (“RITC”) and |
| 98101 | | | RIFIS |
| | | | • President and Chief Executive Officer, RIC and RIF, June 2016 to |
| | | | June 2017 |
| | | | • October 2011 to December 2013, Head of North America Operations |
| | | | Russell Investments |
| |
| |
| Jeffrey T. Hussey, | Chief Investment | Until removed by | • Global Chief Investment Officer, Russell Investments |
| Born May 2, 1969 | Officer since 2013 | Trustees | • Chief Investment Officer, RIC and RIF |
| 1301 Second Avenue, | | | • Chairman of the Board and President, RIM |
| 18th Floor, Seattle WA | | | • Director, RITC, Russell Investments Implementation Services, LLC |
| 98101 | | | and Russell Investments Delaware, LLC |
| | | | • Board of Managers, Russell Investments Funds Management, LLC |
| | | | • 2003 to 2013 Chief Investment Officer, Fixed Income, Russell |
| | | | Investments |
| |
| |
| Mary Beth R. Albaneze, | Secretary since 2010 | Until successor | • Associate General Counsel, Russell Investments |
| Born April 25, 1969 | | is chosen and | • Secretary, RIM, RIFUS and RIFIS |
| 1301 Second Avenue, | | qualified by | • Secretary and Chief Legal Officer, RIC and RIF |
| 18th Floor, Seattle, WA | | Trustees | • Assistant Secretary, Russell Investments Insurance Agency, LLC |
| 98101 | | | (“RIIA”)(insurance agency) and U. S. One Inc. |
Disclosure of Information about Fund Trustees and Officers 183
Russell Investment Funds
Adviser, Money Managers and Service Providers — December 31, 2017
| |
| Interested Trustee | |
| Mark Spina | Independent Registered Public Accounting Firm |
| Independent Trustees | PricewaterhouseCoopers LLP |
| Thaddas L. Alston | 1420 5th Avenue, Suite 2800 |
| Kristianne Blake | Seattle, WA 98101 |
| Cheryl Burgermeister | Money Managers |
| Daniel P. Connealy | |
| Katherine W. Krysty | U. S. Strategic Equity Fund |
| Raymond P. Tennison, Jr. | Barrow, Hanley, Mewhinney & Strauss, LLC, Dallas, TX |
| Jack R. Thompson | Jacobs Levy Equity Management, Inc. , Florham Park, NJ |
| | Mar Vista Investment Partners, LLC, Los Angeles, CA |
| Trustee Emeritus | Suffolk Capital Management, LLC, New York, NY |
| George F. Russell, Jr. | William Blair Investment Management, LLC, Chicago, IL |
| Officers | U. S. Small Cap Equity Fund |
| Mark Spina, President and Chief Executive Officer | Ancora Advisors, LLC, Cleveland, OH |
| Mark E. Swanson, Treasurer, Chief Accounting Officer and | Copeland Capital Management, LLC, Conshohocken, PA |
| Chief Financial Officer | DePrince, Race & Zollo, Inc. , Winter Park, FL |
| Cheryl Wichers, Chief Compliance Officer | Falcon Point Capital, LLC, San Francisco, CA |
| Jeffrey T. Hussey, Chief Investment Officer | Penn Capital Management Company, Inc. , Philadelphia, PA |
| Mary Beth R. Albaneze, Secretary | Snow Capital Management L. P. , Sewickley, PA |
| Adviser | Timpani Capital Management LLC, Milwaukee, WI |
| Russell Investment Management, LLC | International Developed Markets Fund |
| 1301 Second Avenue | GQG Partners LLC, Fort Lauderdale, FL |
| Seattle, WA 98101 | Janus Capital Management LLC, Denver, CO and |
| Administrator, Transfer and Dividend Disbursing | Perkins Investment Management LLC, Chicago, IL |
| Agent | Numeric Investors LLC, Boston, MA |
| Russell Investments Fund Services, LLC | Pzena Investment Management, LLC, New York, NY |
| 1301 Second Avenue | Wellington Management LLP, Boston, MA |
| Seattle, WA 98101 | Strategic Bond Fund |
| Custodian | Colchester Global Investors Limited, London, England |
| State Street Bank and Trust Company | Logan Circle Partners, L. P. , Philadelphia, PA |
| 1 Heritage Drive | Pareto Investment Management Limited, London, United |
| North Quincy, MA 02171 | Kingdom |
| | Schroder Investment Management North America Inc. , New |
| Office of Shareholder Inquiries | York, NY |
| 1301 Second Avenue | Scout Investments, Inc. , Kansas City, MO |
| Seattle, WA 98101 | Western Asset Management Company, Pasadena, CA and |
| (800) 787-7354 | Western Asset Management Company Limited, London, |
| Legal Counsel | United Kingdom |
| Dechert LLP | Global Real Estate Securities Fund |
| One International Place, 40th Floor | Cohen & Steers Capital Management, Inc. , New York, NY, |
| 100 Oliver Street | Cohen & Steers UK Limited, London, United Kingdom and |
| Boston, MA 02110 | Cohen & Steers Asia Limited, Hong Kong, China |
| Distributor | Morgan Stanley Investment Management Inc. , New York, NY, |
| Russell Investments Financial Services, LLC | Morgan Stanley Investment Management Limited, New |
| 1301 Second Avenue | York, NY and Morgan Stanley Investment Management |
| Seattle, WA 98101 | Company, New York, NY |
| | RREEF America L. L. C. , Chicago, IL, Deutsche Alternatives |
| | Asset Management (Global) Limited operating under the |
| | brand name Deutsch Asset Management London, United |
| | Kingdom |
This report is prepared from the books and records of the Funds and is submitted for the general information of shareholders and is not
authorized for distribution to prospective investors unless accompanied or preceded by an effective Prospectus. Nothing herein contained
is to be considered an offer of sale or a solicitation of an offer to buy shares of Russell Investment Funds. Such offering is made only by
Prospectus, which includes details as to offering price and other material information.
184 Adviser, Money Managers and Service Providers

Russell Investment Funds
Russell Investment Funds is
a series investment company
with nine different investment
portfolios referred to as Funds.
These financial statements report
on four of these Funds.
Russell Investment Funds
LifePoints® Funds
Variable Target Portfolio Series
Annual Report
December 31, 2017
|
| Table of Contents |
| Page |
| To Our Shareholders | 3 |
| Market Summary | 4 |
| Moderate Strategy Fund | 9 |
| Balanced Strategy Fund | 28 |
| Growth Strategy Fund | 48 |
| Equity Growth Strategy Fund | 68 |
| Notes to Schedule of Investments | 88 |
| Notes to Financial Highlights | 90 |
| Notes to Financial Statements | 91 |
| Report of Independent Registered Public Accounting Firm | 104 |
| Tax Information | 105 |
| Shareholder Requests for Additional Information | 106 |
| Disclosure of Information about Fund Trustees and Officers | 107 |
| Adviser and Service Providers | 112 |
Russell Investment Funds - LifePoints® Funds Variable Target Portfolio Series
Copyright © Russell Investments 2018. All rights reserved.
Russell Investments’ ownership is composed of a majority stake held by funds managed by TA Associates with
minority stakes held by funds managed by Reverence Capital Partners and Russell Investments’ management.
Frank Russell Company is the owner of the Russell trademark contained in this material and all trademark rights
related to the Russell trademarks, which the members of the Russell Investment group of companies are permitted
to use under license from Frank Russell Company. The members of the Russell Investments group of companies
are not affiliated in any manner with Frank Russell Company or any entity operation under the “FTSE RUSSELL”
brand.
Fund objectives, risks, charges and expenses should be carefully considered before in-
vesting. A prospectus containing this and other important information must precede or
accompany this material. Please read the prospectus carefully before investing.
Securities distributed through Russell Investments Financial Services, LLC, member FINRA and part
of Russell Investments.
Indices and benchmarks are unmanaged and cannot be invested in directly. Returns represent past performance,
are not a guarantee of future performance, and are not indicative of any specific investment. Index return
information is provided by vendors and although deemed reliable, is not guaranteed by Russell Investments or its
affiliates.
Performance quoted represents past performance and does not guarantee future results. The investment return and
principal value of an investment will fluctuate so that shares, when redeemed, may be worth more or less than their
original cost. Current performance may be lower or higher than the performance data quoted.
To Our Shareholders
Fellow Investors,
Being an investor isn’t always easy. A long-term view, consistency and commitment can be vitally important to wealth
creation. Daily headlines and speculation move markets on a short-term basis. While seemingly amplified today, this
type of noise has been, and always will be, present. Consequently, it remains critical to have a thoughtful financial plan,
realistic goals and timelines, and regular check-ins with your financial advisor.
That said, the past 12 months ending December 31, 2017 have arguably been a relatively tame period in which to be a
patient and resolute investor. We don’t get to say that often so please consider some of these facts:
• All major asset classes were positive from January 1, 2017 to December 31, 2017. Global equity markets were up
double digits, fixed income shareholders were rewarded with price appreciation across the spectrum, and diversifying
real assets contributed, too.
• Volatility, as measured by the CBOE VIX, has been very low relative to historical averages. The calendar year-to-
date as of December 31 has seen the fewest number of 1% daily moves in the S&P500® Index in 30 years.
• Global growth has been steady.
At Russell Investments, we expect a return of market volatility to levels more consistent with historical norms. After all,
the current U.S. stock market rally became the second longest and third strongest on record since 1936 on December 31,
2017. This has led U.S. stocks to become more fully valued. The Cyclically Adjusted Price to Earnings Ratio (CAPE)
stood at 33.2 as of December 2017, putting the U.S. stock market among the most expensive markets since this data
started being tracked in 1926. As the saying goes, “History doesn’t repeat itself, but often it does rhyme.” In past
periods of expensive U.S. equity markets, prices had very little upward potential left—low single digit returns. The
Federal Reserve has begun the process of raising interest rates and unwinding its balance sheet—reversing the years of
accommodative monetary policy instituted in response to the Global Financial Crisis. Even though fixed income markets
have remained resilient so far, the simple math of fixed income suggests that bond prices will come under pressure as
yields continue to rise.
Of course, it’s important to remember that markets and geopolitical events will test investors’ resolve every single year.
The past 12 months’ uncertainty surrounding important elections in France, the United Kingdom, South Korea, and
mounting geopolitical tensions between North Korea and the U.S. were no exception. Exceptional investors, however, are
those who look past the short-term uncertainties and have the commitment to stick with their long-term plan.
In this type of environment, we believe that investors who work with a trusted financial advisor to develop—and stick
with—a financial plan, realistic goals and timelines, will be most resilient. In addition, although diversification can’t
guarantee a profit or avoid losses, experience suggests that globally-diversified multi-asset portfolios further help
investors stay the course when markets get choppy. The following pages provide additional insights on the markets and
the performance of Russell Investments Funds (RIF) for the fiscal year ending December 31, 2017.
Russell Investments has an extensive, proud heritage of providing multi-asset solutions to help investors like you reach
your financial goals, whether you’re saving for retirement, already there or building a college fund. Thank you for the trust
you have placed in our firm. All of us at Russell Investments appreciate the opportunity to help you achieve financial
security.

President and Chief Executive Officer, Russell Investment Funds
1 Represented by Russell 1000® Index up 21.69%, MSCI EAFE Index up 25.03%, MSCI Emerging Markets Index up 37.28% (as of 12/31/2017)
2 Represented by Bloomberg Barclays U.S. Aggregate Bond Index up 3.54%, ICE BofA Merill Lynch Global High Yield Index up 10.20%, Bloomberg
Barclays 1-10 Year Municipal Blend Index up 3.49% (as of 12/31/2017)
3 Represented by Bloomberg Commodity Index up 1.70%, S&P Global Infrastructure Index up 19.07%, FTSE EPRA/NAREIT Developed Index up
10.36%(as of 12/31/2017)
To Our Shareholders 3
Russell Investment Funds
Market Summary as of December 31, 2017 (Unaudited)
U.S. Equity Markets
Broadly measured by the Russell 3000® Index, U.S. stocks returned 21.13% for the one-year period, which is the ninth
straight fiscal year ending December 31st that the Russell 3000® Index has finished with a positive absolute return. The
Russell 3000® Index finished with a positive absolute return in each of the fiscal year’s twelve months.
Within U.S. large capitalization stocks, factors that were rewarded during the fiscal year included high beta (beta is a
measure of a stock’s sensitivity to the direction of the market), high historical earnings growth, and the largest capitalization
stocks. Factors that trailed the market included high dividend yield, low price-to-book ratios, and high earnings variability.
Additionally, dynamic stocks outperformed defensive stocks and growth stocks outperformed value stocks across all
market capitalization tiers excluding mid cap. From a sector perspective, information technology, materials, and consumer
discretionary outperformed the Russell 1000® Index by 16.83%, 2.02%, and 1.69%, respectively. Sectors that failed to find
traction during the one-year period were energy, telecommunication services, and real estate, trailing by 23.25%, 23.20%,
and 11.76%, respectively.
The U.S. large cap equity market started off 2017 very strong with the Russell 3000® Index gaining 5.74% from January
through March. The Fed raised its benchmark interest rate by another 25 basis points in March on the back of positive
economic data. However, the interest rate hike was accompanied by dovish language from the Fed which put into question
how many additional rate hikes there might be in 2017. Additionally, the post-Trump risk rally lost some steam in the
latter stages of the period after the new health care bill failed to repeal and replace Obama Care. Retail sales slowed down
in February, however inflation ticked upward to 2.7% year-over-year. In addition, the February non-farm payrolls figure
beat expectations yet again and pushed the unemployment rate down to 4.7%. The U.S. GDP growth rate was also revised
slightly higher to 2.1% for the fourth quarter of 2016.
The Russell 3000® Index increased 3.02% from April through June. While U.S. economic data came in slightly softer
than expected over the period, it was enough for the Fed to raise its short-term interest rate in June. Over the period,
oil prices trended lower and the U.S. dollar was weak compared to most major currencies. Retail sales slowed down in
May, while inflation also slipped lower to 1.9%, moderately under the Fed’s 2.0% target rate. Meanwhile, May non-farm
payrolls grew less then consensus and the unemployment rate fell to 4.3%. Additionally, the U.S. economy expanded faster
than initially reported during the first quarter (1.4% quarter-over-quarter), following an upward revision to secondary
estimates of 1.2%. The Fed raised short-term interest rates by a further 25 basis points to 1.25% as widely expected
and maintained its forecast for one more rate hike in 2017. Fed Chair Janet Yellen also added that the bank would start
unwinding its $4.5 trillion balance sheet later in the year by reducing reinvestment of maturing bonds.
The Russell 3000® Index climbed 4.57% from July through September. U.S. political uncertainty, escalating geopolitical
tension in the Korean peninsula and tropical hurricanes rattled investors. However, a strengthening economic backdrop
influenced a risk-on market environment which also contributed to the Fed developing a slightly more hawkish outlook.
Over the period, commodity prices stabilized while a sluggish U.S. dollar lifted a basket of global currencies. In the U.S.,
the latest non-farm payrolls figure continued to point towards a healthy jobs market, although the unemployment rate
ticked higher to 4.4%. Retail sales slowed to 3.2% year-over-year, but inflation edged higher to 1.9% year-over-year, still
under the Fed’s 2.0% target rate. However, the second quarter U.S. economic growth rate was finalized at a strong 3.1%
quarter-over-quarter. Toward the end of the quarter, initial details were released on a potential tax reform plan which was
viewed favorably by market participants.
The Russell 3000® Index continued its upward trend ending the October through December time period up 6.34%.
Investors gravitated toward larger market capitalization growth stocks which outpaced most other groups as the third
quarter reporting season surprised to the upside in terms of earnings growth, sales growth, and profit margins. In the
beginning of December, the Fed raised short-term interest rates by a further 25 basis points to 1.50% as widely expected
and maintained its forecast of three additional rate hikes in 2018. Toward the end of the December, the approval of the
much-anticipated tax package also added to the positive sentiment within equity markets. Additionally, incentives to
4 Market Summary
Russell Investment Funds
Market Summary as of December 31, 2017, continued — (Unaudited)
invest and repatriate overseas profits included in the broader tax legislation were viewed as allowing U.S. companies to
more easily pursue growth strategies.
Non-U.S. Developed Equity Markets
For the fiscal year ended December 31, 2017, developed non-U.S. equity markets, as measured by the Russell Developed
ex-U.S. Large Cap® Index (the “Index”), were up 25.46%. Key drivers of market performance were the U.S. presidential
election, improving global growth, especially in emerging markets and the Eurozone, increases in government bond yields
and the Trump administration’s tax reform bill.
Amid the improving global growth outlook, momentum, growth and quality factors had the strongest outperformance during
the fiscal year followed by a modest outperformance of value factor as investors chased cheaper, cyclical stocks and stocks
with high earnings expectations. Sectors with high growth expectations such as technology, industrials and materials were
rewarded during the period while the more defensive sectors such as consumer staples, utilities and health care suffered.
Energy stocks also underperformed as commodity prices continued to face pressure from excess supply.
In the first quarter of the fiscal year, the Fed met expectations and raised its benchmark rate by another 25 basis points in
light of further positive economic data, following a similar rate increase in December 2016. Additionally, a post-Trump risk
rally lost some steam in the latter stages of the period, after President Trump lost support from his own Republican party for
his health care bill. In Europe, UK Prime Minister Theresa May triggered Article 50 to officially start “Brexit” negotiations,
while investors held caution over electoral developments in the Netherlands, France and Germany. Over the period, oil
prices trended lower while a weaker U.S. dollar lifted emerging market currencies. While markets ground higher during
this period, investor sentiment became more cautionary, avoiding areas like energy and materials.
In the second quarter of the fiscal year, U.S. economic data came in slightly softer than expected. However, it was enough
for the Fed to raise its benchmark rate for the second time in 2017. In Europe, Emmanuel Macron became France’s new
President while the general election in the UK resulted in a challenging “hung Parliament”. Over the period, oil prices
continued their trend lower along with a weakening U.S. dollar against a basket of currencies. The easing political tension
in Europe rewarded the value factor and financial companies in particular.
In the third quarter of the fiscal year, U.S. federal political dysfunction, escalating geopolitical tension in the Korean
peninsula and tropical hurricanes rattled investors. However, a strengthening economic backdrop engendered a risk-on
market environment, and informed developed central banks who became more comfortable with a more hawkish outlook.
Over the period, commodity prices stabilized, rewarding energy stocks. The technology sector continued a strong run as
evidence of disruption in traditional sectors such as retail drove investor sentiment.
In the fourth quarter of the fiscal year, U.S. President Donald Trump experienced his first major legislative victory with
a tax reform deal. Furthermore, strong economic growth in the third quarter paved the way for the Fed to raise its key
interest rate for a third time in December from 1.25% to 1.50%. A combination of strong economic growth and positive
expectations from tax reform led the U.S. markets higher during the quarter. Across the Atlantic, British Prime Minister
Theresa May struck a last-minute deal with the EU to move Brexit talks forward and in November the Bank of England
also raised interest rates for the first time in a decade whilst inflation hit 3.1%. Europe ex-UK and the UK were the biggest
underperformers during the quarter.
Emerging markets and Asia ex-Japan were the stand out non-U.S. markets over the fiscal year, as improving economic
fundamentals along with a weaker U.S. dollar were tailwinds. Conversely, the UK, Europe ex-UK and Canada were the
biggest laggards.
Market Summary 5
Russell Investment Funds
Market Summary as of December 31, 2017, continued — (Unaudited)
Emerging Markets
The Russell Emerging Markets® Index, as measured in U.S. dollar terms (the “Index”), gained 36.3% over the fiscal year
ended December 31, 2017. The asset class remained buoyant in a period where global growth forecasts were upgraded and
inflation remained low. Many emerging countries started to see green shoots as they rebounded from their cyclical lows,
benefiting from lower interest rates and improving economic growth. The U.S. dollar weakened against most emerging
market currencies, despite increasing U.S. interest rates. The U.S. Federal Reserve’s approach was more dovish than
expected by the market which benefited emerging market currencies.
The Index surged 11.7% in the first quarter of 2017, outperforming developed markets as investor appetite for perceived
riskier investments returned. India (19.3%) was the strongest-performing country as Prime Minister Modi’s Party won
key state elections, with the victories demonstrating strong domestic support for Modi’s free-market reform programs.
Mexico (16.4%) rebounded where the peso was among the best-performing currencies against the U.S. dollar as the Trump
administration softened its rhetoric towards the country. South Africa (4.4%) underperformed as speculation surrounding
the independence of the Treasury following the removal of respected finance minister Pravin Gordhan and replacement of
nine other cabinet ministers by President Zuma weighed on sentiment and the value of the rand. After its 2016 rally, Russia
(-2.5%) returned some of its strong performance as hopes of potentially warmer relations and easing of sanctions with the
U.S. following Trump’s election victory partially dissipated.
The Index continued its 2017 rally in the second quarter with a 5.6% climb as sentiment towards the asset class remained
buoyant. A weaker U.S. dollar was a further tailwind, although it was another negative and volatile period for the price
of oil. Emerging Europe (ex-Russia) was the best performing region in emerging markets, following the market-friendly
French Presidential election result. This included Hungary (18.9%), Poland (13.5%) and the Czech Republic (13.1%).
Greece was the strongest-performing country after a 31.9% surge. This came as a deal with its creditors on economic
reforms was agreed after protracted negotiations, which enabled the release of the next bailout tranche. Asian countries
also outperformed over the period. Both India (3.3%) and South Africa (2.6%) lagged the overall benchmark return. In
India, first quarter GDP growth was the weakest in two years at 6.1% year-over-year, as the full impact of Prime Minister
Modi’s demonetisation policy began to come through. The government withdrew the 500 and 1000 rupee notes overnight to
crack down on the black market. South Africa underperformed in a period where President Zuma survived his ANC party
vote of no confidence. Natural resource and energy-driven markets were the weakest performing for the quarter as these
sectors underperformed the market, particularly Russia (-9.7%) and Brazil (-6.7%).
The Index increased 7.4% in the third quarter of 2017. Sentiment towards the asset class remained buoyant amid a tepid
global inflation environment. A weaker U.S. dollar and stable oil prices underpinned investor confidence. However, the
market edged lower in September amid a more hawkish outlook from the U.S. Federal Reserve and increased geopolitical
tensions within the Korean peninsula. Brazil (23.5%) rebounded from a weak second quarter driven by the improved
political environment where congress’ lower house voted down corruption charges against President Temer to keep him in
power. China (13.7%) outperformed, driven by Internet stocks, the strongest-performing sector. Russia climbed 15.5% in
a strong period for the energy sector. Elsewhere, Eastern European countries continued their healthy 2017 performance,
including the Czech Republic (11.3%), Hungary (9.7%) and Poland (8.8%) on robust macro numbers. South Korea (1.6%)
was hampered by heightened political tensions between North Korea and the U.S. Mexico (0.8%) underperformed as
NAFTA renegotiations remained strained. The country was also hit by a series of earthquakes which weighed on investor
confidence. Overall, Greece was the worst-performing country ahead of November’s bailout review with its creditors. The
market slipped 8.8% as banking stocks slumped on possible new European Central Bank and International Monetary Fund
stress tests.
The Index increased 7.7% in the final quarter of 2017. South Africa was the standout performer over the period, as
the market surged 21.4% in reaction to political developments. The South African rand strengthened over the period,
boosted by Moody’s maintaining the country’s Baa3 investment-grade rating. India also surged (13.8%) as the government
6 Market Summary
Russell Investment Funds
Market Summary as of December 31, 2017, continued — (Unaudited)
announced plans to inject $32 billion into state controlled banks. In Korea (13.1%), the government announced plans to
increase spending and raise the minimum wage, which helped to increase consumer confidence to its highest level since
2010. The market was further buoyed by news that South Korea and China agreed to normalize relations following an
earlier fallout over the installation of the U.S. anti-missile system in South Korea. Greece (10.6%) recovered from a weak
third quarter, as the government agreed to additional reforms in the latest bailout review with its creditors, which allowed
the release of the next tranche of funds. Mexico (-8.4%) was the worst-performing country, as it continued to suffer from
peso weakness driven by strained discussions on the future of the North American Free Trade Agreement. Brazil (-2.4%)
suffered from weakness in the real. Investors appeared disappointed that the much-anticipated pension reform bill was
watered down and delayed until February 2018.
U.S./Global Fixed Income Markets
The fiscal year ended December 31, 2017 was characterized by a risk on rally that saw both U.S. and European credit
spreads tighten, global growth improve and conducive monetary policies from central banks. Overall, this proved positive
for fixed income sectors around the globe. The U.S. yield curve saw interest rates rise for the fiscal year with the short end
of the curve rising 88 basis points on a 3-month treasury bill, while the 10-year treasury bond interest rate was flat. The
German Bund saw a parallel shift upwards in interest rates during 2017 and the British Gilt saw interest rates rise on the
short end of the curve and fall on the longer end. The U.S. experienced the largest interest rate moves as the U.S. Federal
Reserve (the “Fed”) raised interest rates three times during the year. Europe had historically low interest rates during the
fiscal year as the European Central Bank (“ECB”) kept rates low and continued with their quantitative easing program,
although it was cut in half to 30 billion euros per month in October. Corporate and high yield spreads grinded tighter on
the back of strong demand and the positive global growth backdrop. A key indicator of global fixed income performance,
the Bloomberg Barclays Global Aggregate Bond Index, returned 7.39% for the fiscal year, in U.S. dollar-hedged terms. The
index had a strong year due to increasing demand, monetary policy remaining accommodative, and the lack of geopolitical
fears being realized.
The Bloomberg Barclays Pan-European Aggregate Bond Index returned 14.21% during the period in U.S. dollar-hedged
terms, but most of that return was due to the euro appreciating 14.15% against the U.S. dollar. The U.S., in comparison,
returned 3.54% during the fiscal year as measured by the Bloomberg Barclays U.S. Aggregate Bond Index. In Europe,
treasuries underperformed the aggregate while financials in the corporate sector was a leading segment. In the U.S.,
the corporate market performed strongly led by lower quality bonds and strong demand from oversees. The U.S. dollar
depreciated against most European currencies, due to improving growth across Europe and the victory of political
candidates that support the European Union.
In the U.S., economic data remained broadly positive, with solid nonfarm payroll gains and a steady decline in the
unemployment rate to decade lows of 4.1%. Gross domestic product (“GDP”) growth had readings over 3.0% for both the
second and third quarter 2017, after it had dipped below 1.5% in the first quarter of 2017. The Consumer Price Index
(“CPI”) started the fiscal year strong at above 2.0% and was a contributing factor as the Fed raised rates, but as the CPI
fell during the year below the Fed’s long-term target of 2.0%, it becomes the Fed’s largest concern.
In Europe, the concerns about a “hard Brexit” diminished over the period, while most of Europe welcomed Emmanuel
Macron’s victory in the French presidential elections. The Bloomberg Barclays Euro Aggregate Corporate Index returned
3.5% over equivalent duration government bonds during the period as financials improved and GDP rose from 1.4% to
2.3% during the fiscal year. The European banking sector had a setback in 2nd quarter 2017 as three banks declared
bankruptcy.
Emerging markets were one of the strongest sectors in 2017 as the U.S. dollar depreciated, global growth was above-
trend and major central bank monetary policy settings were accommodative. Emerging market (“EM”) debt outperformed
developed markets (the Bloomberg Barclays EM Hard Currency Aggregate Bond Index returned 9.61%) as there was
Market Summary 7
Russell Investment Funds
Market Summary as of December 31, 2017, continued — (Unaudited)
high demand for yield. Local currency EM bonds (those issued in the issuing country’s own currency) were extremely
strong (the Bloomberg Barclays EM Local Currency Government Bond Index returned 14.27%) due to the depreciation of
the U.S. dollar versus a basket of emerging market currencies. The Czech koruna and Polish zloty both appreciated over
20% during the year as the koruna was unpegged from the euro and the zloty appreciated on the back of the strong Polish
economy and the appreciation in the euro.
Strong global corporate new issuance volumes continued in the fiscal year along with seemingly endless demand from
overseas buyers. Overall, corporate credit was up globally (the Bloomberg Barclays Global Aggregate Corporate Bond
Index returned 9.09%), with particularly strong performance out of the utilities sector of the market. The best performers
in the index were lower quality issues (BBB cohorts and below), longer maturities (7+ years) and higher beta countries
(Austria and Italy).
High yield corporate credit was among the best-performing segments of the global market (the Bloomberg Barclays Global
High Yield Bond Index returned 10.43%). High yield spreads tightened over the fiscal year due to the strong global
economy and investors searching for the slightest advantage in yields. The interest coverage ratio improved over the year
while the default rate for high yield securities fell, which were both positive factors.
8 Market Summary
Russell Investment Funds
Moderate Strategy Fund
Portfolio Management Discussion and Analysis — December 31, 2017 (Unaudited)

| | | | | | | | |
| Moderate Strategy Fund | | | | Bloomberg Barclays U. S. Aggregate Bond Index** | |
| | | Total | | | | Total | |
| | | Return | | | | Return | |
| 1 Year | | 9.88 | % | 1 Year | | | 3.54 | % |
| 5 Years | | 5.44 | %§ | 5 Years | | | 2.10 | %§ |
| 10 Years | | 4.81 | %§ | 10 Years | | | 4.01 | %§ |
| |
| | | | | Russell 1000® Index*** | | | | |
| | | | | | | Total | |
| | | | | | | Return | |
| | | | | 1 Year | | 21.69 | % |
| | | | | 5 Years | | 15.71 | %§ |
| | | | | 10 Years | | | 8.59 | %§ |
Moderate Strategy Fund 9
Russell Investment Funds
Moderate Strategy Fund
Portfolio Management Discussion and Analysis, continued — December 31, 2017
(Unaudited)
| |
| The Moderate Strategy Fund (the “Fund”) is a fund of funds that | Within equities, overall global equity markets posted very strong |
| invests principally in other Russell Investment Funds (“RIF”) | returns, as the Russell Developed Large Cap® Index (Net) gained |
| and Russell Investment Company (“RIC”) mutual funds (the | 22.39%. Emerging markets were one of the top performing |
| “Underlying Funds”) . The Underlying Funds employ a multi- | segments of global equity markets over the period. The Fund’s |
| manager approach whereby portions of the Underlying Funds | strategic exposure to emerging markets proved beneficial over |
| are allocated to different money manager strategies. Underlying | the period as they rallied, boosted by lower interest rates and |
| Fund assets not allocated to money managers are managed by | improving economic growth. By contrast, non-U. S. developed |
| Russell Investment Management, LLC (“RIM”), the Fund’s | equities slightly lagged U. S. equities, as defensive and commodity |
| and Underlying Funds’ advisor. RIM, as the Underlying Funds’ | sectors, especially consumer staples, health care and energy, |
| advisor, may change the allocation of the Underlying Funds’ | weighed on non-U. S. equity returns. |
| assets among money managers at any time. An exemptive order | |
| from the Securities and Exchange Commission (“SEC”) permits | How did the investment strategies and techniques employed |
| RIM to engage or terminate a money manager in an Underlying | by the Fund and the Underlying Funds affect the Fund’s |
| Fund at any time, subject to approval by the Underlying Fund’s | performance? |
| Board, without a shareholder vote. Pursuant to the terms of the | The Fund is a fund of funds and its performance is based on RIM’s |
| exemptive order, an Underlying Fund is required to notify its | strategic asset allocations, the performance of the Underlying |
| shareholders within 90 days of when a money manager begins | Funds in which the Fund invests, and tactical changes in the |
| providing services. | Fund’s asset allocation throughout the year. In order to seek to |
| | achieve the Fund’s objective during the period, RIM’s strategic |
| What is the Fund’s investment objective? | asset allocation included investments in global equity, fixed |
| The Fund seeks to provide current income and moderate long | income, multi-asset and alternative Underlying Funds. |
| term capital appreciation. | The Fund’s diverse asset allocation contributed positively to |
| How did the Fund perform relative to its benchmark for the | performance during the period. Non-traditional asset classes |
| fiscal year ended December 31, 2017? | such as high yield bonds returned 8.02%, as measured by the ICE |
| For the fiscal year ended December 31, 2017, the Fund gained | BofAML Global High Yield Index Hedged (USD), outperforming |
| 9.88%. This is compared to the Fund’s primary benchmark, the | the Fund’s primary benchmark, the Bloomberg Barclays U. S. |
| Bloomberg Barclays U. S. Aggregate Bond Index, which gained | Aggregate Bond Index. Non-U. S. developed equities and |
| 3.54% during the same period. The Fund’s performance includes | commodities delivered positive returns as well, as measured |
| operating expenses, whereas index returns are unmanaged and do | by the Russell Developed ex-U. S. Large Cap® Index Net and |
| not include expenses of any kind. | Bloomberg Commodity Index Total Return, respectively. |
| For the fiscal year ended December 31, 2017, the Morningstar® | The fixed income portion of the Fund’s portfolio outperformed |
| Insurance Allocation – 30% to 50% Equity Category, a group of | the Fund’s fixed income benchmark. An allocation to the RIF |
| funds that Morningstar considers to have investment strategies | Strategic Bond Fund was positive from a benchmark-relative |
| similar to those of the Fund, gained 9.62%. This result serves as | perspective as a result of its exposure to high yield corporate debt |
| a peer comparison and is expressed net of operating expenses. | and non-agency mortgage backed securities. The excess returns |
| | were partially offset by the RIC Investment Grade Bond Fund |
| How did the market conditions described in the Market | as a result of its allocation to currencies and global government |
| Summary report affect the Fund’s performance? | bond futures. |
| The Fund seeks to achieve its objective by investing in Underlying | Due to the strong performance of equity markets over the |
| Funds that provide exposure to a range of diversified investments, | period, the equity portion of the Fund’s portfolio contributed to |
| and most major asset classes invested in by the Underlying Funds | excess returns. The RIC Global Equity Fund outperformed its |
| produced positive absolute returns during the period. | global equity benchmark, supported by strategic and tactical |
| Within the Fund’s fixed income portfolio, exposure to high yield | overweights to growth. By contrast, the RIC U. S. Defensive |
| debt was beneficial as it was among the best-performing segments | Equity Fund underperformed its benchmark as stock selection |
| of the fixed income market over the one-year period. Rising | detracted, especially within the consumer staples and consumer |
| interest rates posed a challenge to other fixed income assets, as | discretionary sectors. |
| well as more interest rate sensitive real assets such as global real | The alternative assets portion of the Fund’s portfolio positively |
| estate investment trusts (“REITs”) and global infrastructure. | contributed to absolute returns, though the rising rate environment |
| | over the one-year period, that picked up towards end of third |
10 Moderate Strategy Fund
Russell Investment Funds
Moderate Strategy Fund
Portfolio Management Discussion and Analysis, continued — December 31, 2017
(Unaudited)
| |
| quarter 2017, created headwinds for rate-sensitive asset classes | Fund. During third quarter 2017, RIM moved to an underweight |
| such as listed REITs and listed infrastructure. | position in the RIC Global Infrastructure Fund as rising interest |
| | rates and higher valuations became more of a concern for the |
| Describe any changes to the Fund’s structure or allocation | rate-sensitive sector. RIM maintained an underweight to the |
| to the Underlying Funds. | RIF Global Real Estate Securities Fund over the period due to |
| RIM has the discretion to vary the Fund’s actual allocation from | its rate-sensitive nature. During the fourth quarter of 2017, RIM |
| the target strategic asset allocation by up to +/- 5% at the equity, | moved to further underweight listed infrastructure by trimming |
| fixed income, multi-asset or alternative category level based on | the Fund’s exposure to the RIC Global Infrastructure Fund due to |
| RIM’s capital markets research. In addition to investing in the | its relatively expensive valuation. RIM also slightly trimmed the |
| Underlying Funds, RIM may seek to actively manage a Fund’s | underweight to REITs through increasing the Fund’s exposure to |
| overall exposures by investing in derivatives that RIM believes | the RIF Global Real Estate Securities Fund. RIM’s modifications |
| will achieve the desired risk/return profile for the Fund. RIM’s | to the Fund’s asset allocation were additive during the period. |
| asset allocation modifications, implemented through both tactical | |
| changes to Underlying Fund allocations and derivatives-based | The views expressed in this report reflect those of the |
| exposures, benefited the Fund’s performance relative to the | portfolio managers only through the end of the period |
| Fund’s target strategic asset allocation. | covered by the report. These views do not necessarily |
| RIM tactically adapted the Fund’s asset allocation over the period | represent the views of RIM, or any other person in RIM or |
| as market opportunities and risks evolved. RIM continued to | any other affiliated organization. These views are subject to |
| operate the Fund as a risk manager rather than risk taker. The Fund | change at any time based upon market conditions or other |
| maintained an underweight position in U. S. equity by trimming its | events, and RIM disclaims any responsibility to update the |
| exposure to the RIC U. S. Defensive Equity Fund relative to RIM’s | views contained herein. These views should not be relied |
| long-term strategic weights. During the first quarter of 2017, as | on as investment advice and, because investment decisions |
| equity markets ran upwards and credit spreads compressed, RIM | for a Russell Investment Funds (“RIF”) Fund are based on |
| trimmed high yield exposure to an underweight for the first time | numerous factors, should not be relied on as an indication |
| since 2015 by underweighting the RIC Global Opportunistic Credit | of investment decisions of any RIF Fund. |
* Assumes initial investment on January 1, 2008.
** The Bloomberg Barclays U.S. Aggregate Bond Index is an index, with income reinvested, generally representative of intermediate-term government bonds,
investment grade corporate debt securities and mortgage-backed securities.
*** The Russell 1000® Index includes the 1,000 largest companies in the Russell 3000® Index. The Russell 1000® Index represents the universe of stocks from
which most active money managers typically select. The Russell 1000® Index return reflects adjustments from income dividends and capital gain distributions
reinvested as of the ex-dividend dates.
§ Annualized.
The performance shown in this section does not reflect any Insurance Company Separate Account or Policy Charges. Performance is historical and assumes
reinvestment of all dividends and capital gains. Investment return and principal value will fluctuate so that an investor’s shares, when redeemed, may be worth more
or less than when purchased. Past performance is not indicative of future results. Additionally, the returns presented herein may differ from the performance reported
in the Financial Highlights as the returns herein are calculated in a manner consistent with standardized performance in accordance with Securities and Exchange
Commission rules, while the performance in the Financial Highlights has been calculated in accordance with U.S. Generally Accepted Accounting Principles (“U.S.
GAAP”).
Moderate Strategy Fund 11
Russell Investment Funds
Moderate Strategy Fund
Shareholder Expense Example — December 31, 2017 (Unaudited)
| | | | | | | |
| Fund Expenses | Please note that the expenses shown in the table are meant |
| The following disclosure provides important information | to highlight your ongoing costs only and do not reflect any |
| regarding the Fund’s Shareholder Expense Example | transactional costs. Therefore, the information under the heading |
| (“Example”) . | “Hypothetical Performance (5% return before expenses)” is |
| | useful in comparing ongoing costs only, and will not help you |
| Example | determine the relative total costs of owning different funds. In |
| As a shareholder of the Fund, you incur two types of costs: (1) | addition, if these transactional costs were included, your costs |
| transaction costs, and (2) ongoing costs, including advisory and | would have been higher. The fees and expenses shown in this |
| administrative fees and other Fund expenses. The Example is | section do not reflect any Insurance Company Separate Account |
| intended to help you understand your ongoing costs (in dollars) | Policy Charges. | | | | | | |
| of investing in the Fund and to compare these costs with the | | | | | | Hypothetical |
| ongoing costs of investing in other mutual funds. The Example | | | | | | Performance (5% |
| is based on an investment of $1,000 invested at the beginning of | | | | Actual | | return before |
| the period and held for the entire period indicated, which for this | | | Performance | | | expenses) |
| | Beginning Account Value | | | | | | |
| Fund is from July 1, 2017 to December 31, 2017. | July 1, 2017 | | $ | 1,000.00 | | $ | 1,000.00 |
| | Ending Account Value | | | | | | |
| Actual Expenses | December 31, 2017 | | $ | 1,039.30 | | $ | 1,024.50 |
| The information in the table under the heading “Actual | Expenses Paid During Period* | | $ | 0.72 | | $ | 0.71 |
| Performance” provides information about actual account values | | | | | | | |
| and actual expenses. You may use the information in this column, | * Expenses are equal to the Fund's annualized expense ratio of 0.14% |
| | (representing the six month period annualized), multiplied by the average |
| together with the amount you invested, to estimate the expenses | account value over the period, multiplied by 184/365 (to reflect the one-half |
| that you paid over the period. Simply divide your account value by | year period) . May reflect amounts waived and/or reimbursed. Without any |
| $1,000 (for example, an $8,600 account value divided by $1,000 | waivers and/or reimbursements, expenses would have been higher. |
| = 8.6), then multiply the result by the number in the first column | | | | | | | |
| in the row entitled “Expenses Paid During Period” to estimate | | | | | | | |
| the expenses you paid on your account during this period. | | | | | | | |
| |
| Hypothetical Example for Comparison Purposes | | | | | | | |
| The information in the table under the heading “Hypothetical | | | | | | | |
| Performance (5% return before expenses)” provides information | | | | | | | |
| about hypothetical account values and hypothetical expenses | | | | | | | |
| based on the Fund’s actual expense ratio and an assumed rate of | | | | | | | |
| return of 5% per year before expenses, which is not the Fund’s | | | | | | | |
| actual return. The hypothetical account values and expenses | | | | | | | |
| may not be used to estimate the actual ending account balance or | | | | | | | |
| expenses you paid for the period. You may use this information | | | | | | | |
| to compare the ongoing costs of investing in the Fund and other | | | | | | | |
| funds. To do so, compare this 5% hypothetical example with the | | | | | | | |
| 5% hypothetical examples that appear in the shareholder reports | | | | | | | |
| of other funds. | | | | | | | |
12 Moderate Strategy Fund
Russell Investment Funds
Moderate Strategy Fund
Schedule of Investments — December 31, 2017
| | | | | |
| Amounts in thousands (except share amounts) | | | | | |
| | | | | | Fair |
| | | | | | Value |
| | Shares | | $ |
| Investments in Affiliated Funds - 97.4% | | | | | |
| Alternative - 6.1% | | | | | |
| RIC Commodity Strategies Fund Class Y | | | 613,872 | | 3,517 |
| RIC Global Infrastructure Fund Class Y | | | 288,888 | | 3,308 |
| RIF Global Real Estate Securities Fund | | | 10,610 | | 157 |
| | | | | | 6,982 |
| |
| Domestic Equities - 9.4% | | | | | |
| RIC U. S. Defensive Equity Fund Class Y | | | 1,300 | | 67 |
| RIC U. S. Dynamic Equity Fund Class Y | | | 27,978 | | 256 |
| RIF U. S. Small Cap Equity Fund | | | 525,606 | | 8,620 |
| RIF U. S. Strategic Equity Fund | | | 97,957 | | 1,815 |
| | | | | | 10,758 |
| |
| Fixed Income - 51.0% | | | | | |
| RIC Global Opportunistic Credit Fund Class Y | | | 1,431,681 | | 14,102 |
| RIC Investment Grade Bond Fund Class Y | | | 649,315 | | 13,856 |
| RIC Unconstrained Total Return Fund Class Y | | | 574,128 | | 5,690 |
| RIF Strategic Bond Fund | | | 2,412,734 | | 25,021 |
| | | | | | 58,669 |
| |
| International Equities - 19.0% | | | | | |
| RIC Emerging Markets Fund Class Y | | | 348,667 | | 7,378 |
| RIC Global Equity Fund Class Y | | | 714,991 | | 7,721 |
| RIF International Developed Markets Fund | | | 513,766 | | 6,741 |
| | | | | | 21,840 |
| |
| Multi-Asset - 11.9% | | | | | |
| RIC Multi-Strategy Income Fund Class Y | | | 1,340,507 | | 13,646 |
| |
| Total Investments in Affiliated Funds | | | | | |
| (cost $103,475) | | | | | 111,895 |
| |
| Options Purchased - 0.4% | | | | | |
| (Number of Contracts) | | | | | |
| S&P 500 Index | | | | | |
| Goldman Sachs May 2018 2,675.00 Call (61) | USD | | 16,318 | (ÿ) | 477 |
| Total Options Purchased | | | | | |
| (cost $403) | | | | | 477 |
| |
| Total Investments 97.8% | | | | | |
| (identified cost $103,878) | | | | | 112,372 |
| |
| Other Assets and Liabilities, Net - 2.2% | | | | | 2,534 |
| Net Assets - 100.0% | | | | | 114,906 |
See accompanying notes which are an integral part of the financial statements.
Moderate Strategy Fund 13
Russell Investment Funds
Moderate Strategy Fund
Schedule of Investments, continued — December 31, 2017
| | | | | | | | |
| Futures Contracts | | | | | | | | |
| |
| Amounts in thousands (except contract amounts) | | | | | | | | |
| | | | | | | | Value and | |
| | | | | | | | Unrealized | |
| | | | | | | | Appreciation | |
| | | Number of | Notional | Expiration | (Depreciation) | |
| | | Contracts | Amount | Date | $ | |
| Long Positions | | | | | | | | |
| Amsterdam Index Futures | | | 6 | EUR | 653 | 01/18 | (9 | ) |
| CAC 40 Euro Index Futures | | | 29 | EUR | 1,540 | 01/18 | (28 | ) |
| DAX Index Futures | | | 5 | EUR | 1,614 | 03/18 | (35 | ) |
| EURO STOXX 50 Index Futures | | | 27 | EUR | 943 | 03/18 | (27 | ) |
| FTSE/MIB Index Futures | | | 4 | EUR | 435 | 03/18 | (22 | ) |
| IBEX 35 Index Futures | | | 5 | EUR | 501 | 01/18 | (13 | ) |
| MSCI EAFE Index Futures | | | 13 | USD | 1,330 | 03/18 | 28 | |
| OMXS30 Index Futures | | | 23 | SEK | 3,621 | 01/18 | (12 | ) |
| Russell 1000 E-Mini Index Futures | | | 1 | USD | 74 | 03/18 | 1 | |
| S&P 500 E-Mini Index Futures | | | 19 | USD | 2,542 | 03/18 | 25 | |
| Short Positions | | | | | | | | |
| Dow U. S. Real Estate Index Futures | | | 43 | USD | 1,382 | 03/18 | (3 | ) |
| FTSE 100 Index Futures | | | 6 | GBP | 458 | 03/18 | (17 | ) |
| Russell 2000 E-Mini Index Futures | | | 54 | USD | 4,149 | 03/18 | (43 | ) |
| S&P 500 E-Mini Index Futures | | | 31 | USD | 4,148 | 03/18 | (36 | ) |
| S&P/TSX 60 Index Futures | | | 2 | CAD | 383 | 03/18 | (1 | ) |
| SPI 200 Index Futures | | | 1 | AUD | 151 | 03/18 | — | |
| TOPIX Index Futures | | | 1 | JPY | 18,170 | 03/18 | (3 | ) |
| United States 2 Year Treasury Note Futures | | | 8 | USD | 1,713 | 03/18 | 3 | |
| United States 5 Year Treasury Note Futures | | | 25 | USD | 2,904 | 03/18 | 13 | |
| United States 10 Year Treasury Note Futures | | | 16 | USD | 1,985 | 03/18 | 12 | |
| United States Long Bond Futures | | | 2 | USD | 306 | 03/18 | — | |
| Total Value and Unrealized Appreciation (Depreciation) on Open Futures Contracts (å) | | | | | | (167 | ) |
| |
| Foreign Currency Exchange Contracts | | | | | | | | |
| Amounts in thousands | | | | | | | | |
| | | | | | | | Unrealized | |
| | | | | | | | Appreciation | |
| | Amount | | Amount | | | (Depreciation) | |
| Counterparty | Sold | | Bought | | Settlement Date | $ | |
| Bank of America | USD | 384 | | CAD | 494 | 03/22/18 | 9 | |
| Bank of America | USD | 30 | MXN | 575 | 03/22/18 | (1 | ) |
| Bank of America | AUD | 430 | | USD | 323 | 03/22/18 | (12 | ) |
| Bank of America | CHF | 118 | | USD | 120 | 03/22/18 | (2 | ) |
| Bank of America | EUR | 676 | | USD | 802 | 03/22/18 | (13 | ) |
| Bank of America | GBP | 241 | | USD | 324 | 03/22/18 | (2 | ) |
| Bank of America | HKD | 415 | | USD | 53 | 03/22/18 | — | |
| Bank of America | JPY | 11,967 | | USD | 107 | 03/22/18 | — | |
| Bank of America | SEK | 432 | | USD | 51 | 03/22/18 | (2 | ) |
| Bank of America | SGD | 26 | | USD | 19 | 03/22/18 | — | |
| Bank of America | ZAR | 250 | | USD | 18 | 03/22/18 | (2 | ) |
| Commonwealth Bank of Australia | USD | 385 | | CAD | 494 | 03/22/18 | 8 | |
| Commonwealth Bank of Australia | USD | 30 | MXN | 575 | 03/22/18 | (1 | ) |
| Commonwealth Bank of Australia | AUD | 430 | | USD | 323 | 03/22/18 | (12 | ) |
| Commonwealth Bank of Australia | CHF | 118 | | USD | 120 | 03/22/18 | (2 | ) |
| Commonwealth Bank of Australia | EUR | 676 | | USD | 803 | 03/22/18 | (12 | ) |
| Commonwealth Bank of Australia | GBP | 241 | | USD | 323 | 03/22/18 | (2 | ) |
| Commonwealth Bank of Australia | HKD | 415 | | USD | 53 | 03/22/18 | — | |
| Commonwealth Bank of Australia | JPY | 11,967 | | USD | 107 | 03/22/18 | — | |
| Commonwealth Bank of Australia | SEK | 432 | | USD | 51 | 03/22/18 | (1 | ) |
See accompanying notes which are an integral part of the financial statements.
14 Moderate Strategy Fund
Russell Investment Funds
Moderate Strategy Fund
Schedule of Investments, continued — December 31, 2017
| | | | | | | | | | | |
| Foreign Currency Exchange Contracts | | | | | | | | | |
| Amounts in thousands | | | | | | | | | | | |
| | | | | | | | | | | Unrealized | |
| | | | | | | | | | | Appreciation | |
| | | | | Amount | | Amount | | | | (Depreciation) | |
| Counterparty | | | Sold | | Bought | Settlement Date | | $ | |
| Commonwealth Bank of Australia | | | SGD | 26 | USD | 19 | 03/22/18 | | — | |
| Commonwealth Bank of Australia | | | ZAR | 250 | USD | 18 | 03/22/18 | | (2 | ) |
| State Street | | | USD | 457 | CNY | 3,040 | 03/22/18 | | 7 | |
| State Street | | | USD | 22 | RUB | 1,340 | 03/22/18 | | 1 | |
| State Street | | | CNY | 2,030 | USD | 304 | 03/22/18 | | (6 | ) |
| State Street | | | INR | 8,140 | USD | 125 | 03/22/18 | | (2 | ) |
| State Street | | KRW | 349,910 | USD | 321 | 03/22/18 | | (7 | ) |
| State Street | | TWD | 9,520 | USD | 319 | 03/22/18 | | (5 | ) |
| Total Unrealized Appreciation (Depreciation) on Open Foreign Currency Exchange Contracts | | | | | | (61 | ) |
| |
| Total Return Swap Contracts | | | | | | | | | | |
| Amounts in thousands | | | | | | | | | | | |
| | | | | | | | Premiums | Unrealized | | | |
| | | | | | | | Paid | Appreciation | | | |
| | | Notional | | | | Termination | (Received) | (Depreciation) | | Fair Value | |
| Underlying Reference Entity | Counterparty | Amount | | Terms | Date | $ | $ | | $ | |
| Short | | | | | | | | | | | |
| S&P 500 Total Return Index | Goldman Sachs | USD 10,700 | | 3 Month LIBOR + 0.700%(5) | 03/16/18 | — | (14 | ) | (14 | ) |
| Total Open Total Return Swap Contracts (å) | | | | | | — | (14 | ) | (14 | ) |
| | | | | | | | | | | | | | | | |
| Credit Default Swap Contracts | | | | | | | | | | | | | | |
| |
| Amounts in thousands | | | | | | | | | | | | | | | |
| Credit Indices | | | | | | | | | | | | | | | | |
| | | | | | | | | | | | | Premiums | Unrealized | | |
| | | | | | | | | Fund (Pays)/ | | | Paid/ | Appreciation | | |
| | | | Purchase/Sell | | | | | Receives | | Termination | (Received) | | (Depreciation) | | Fair Value |
| Reference Entity | Counterparty | Protection | | | Notional Amount | Fixed Rate | | Date | $ | $ | | $ |
| CDX Emerging Markets | | | | | | | | | | | | | | | | |
| Index | Bank of America | Purchase | | | USD | 4,268 | (1.000%)(2) | | 12/20/22 | 179 | | (143 | ) | 36 |
| CDX Investment Grade | | | | | | | | | | | | | | | | |
| Index | Bank of America | Sell | | | USD | 1,100 | 1.000%(2) | | 12/20/22 | 22 | | 4 | | 26 |
| CDX NA High Yield Index Bank of America | Sell | | | USD | 2,400 | 5.000%(2) | | 12/20/22 | 181 | | 18 | | 199 |
| Total Open Credit Indices Contracts (å) | | | | | | | | | | 382 | | (121 | ) | 261 |
| |
| |
| |
| Presentation of Portfolio Holdings | | | | | | | | | | | | | |
| |
| Amounts in thousands | | | | | | | | | | | | | | | |
| | | | | | | Fair Value | | | | | | | | | |
| | | | | | | | | | | | Practical | | | | | |
| Portfolio Summary | | | Level 1 | | Level 2 | Level 3 | Expedient (a) | Total | % of Net Assets |
| Investments in Affiliated Funds | $ | 111,895 | $ | | — | $ | — | $ | | — | $ | 111,895 | | | 97.4 |
| Options Purchased | | | 477 | | | — | | — | | | — | | 477 | | | 0.4 |
| Total Investments | | | 112,372 | | | — | | — | | | — | | 112,372 | | | 97.8 |
| Other Assets and Liabilities, Net | | | | | | | | | | | | | | | 2.2 |
| | | | | | | | | | | | | | | | | 100.0 |
See accompanying notes which are an integral part of the financial statements.
Moderate Strategy Fund 15
Russell Investment Funds
Moderate Strategy Fund
Schedule of Investments, continued — December 31, 2017
| | | | | | | | | | | | | | | | | | | |
| Presentation of Portfolio Holdings | | | | | | | | | | | | | | | | | |
| Amounts in thousands | | | | | | | | | | | | | | | | | | | |
| | | | | | | Fair Value | | | | | | | | | | | |
| | | | | | | | | | | | | Practical | | | | | | | |
| Portfolio Summary | | Level 1 | | | Level 2 | | | Level 3 | Expedient (a) | | Total | | % of Net Assets | |
| Other Financial Instruments | | | | | | | | | | | | | | | | | | | |
| Assets | | | | | | | | | | | | | | | | | | | |
| Futures Contracts | | 82 | | | | — | | | | — | | — | | | 82 | | | 0.1 | |
| Foreign Currency Exchange Contracts | | — | | | | 25 | | | | — | | — | | | 25 | | | — * | |
| Credit Default Swap Contracts | | — | | | | 261 | | | | — | | — | | | 261 | | | 0.2 | |
| | | | | | | | | | | | | | | | | | | |
| Liabilities | | | | | | | | | | | | | | | | | | | |
| Futures Contracts | | (249 | ) | | | — | | | | — | | — | | | (249 | ) | | (0.2 | ) |
| Foreign Currency Exchange Contracts | | — | | | | (86 | ) | | | — | | — | | | (86 | ) | | (0.1 | ) |
| Total Return Swap Contracts | | — | | | | (14 | ) | | | — | | — | | | (14 | ) | | (—)* | |
| Total Other Financial Instruments** | $ | (167 | ) | $ | | 186 | | $ | | — | $ | — | $ | | 19 | | | | |
* Less than 0.05% of net assets.
** Futures and foreign currency exchange contract values reflect the unrealized appreciation (depreciation) on the investments.
(a) Certain investments that are measured at fair value using the net asset value per share (or its equivalent) practical expedient have not been classified
in the fair value levels. The fair value amounts presented in the table are intended to permit reconciliation to the amounts presented in the Schedule of
Investments.
For a description of the Levels, see note 2 in the Notes to Financial Statements.
For a disclosure on transfers between Levels 1, 2 and 3 during the period ended December 31, 2017, see note 2 in the Notes to
Financial Statements.
See accompanying notes which are an integral part of the financial statements.
16 Moderate Strategy Fund
Russell Investment Funds
Moderate Strategy Fund
Fair Value of Derivative Instruments — December 31, 2017
Amounts in thousands
| | | | | | | | | | | | | |
| | | | | | | | | Foreign | | | | |
| | | Equity | | Credit | | Currency | | Interest Rate | |
| Derivatives not accounted for as hedging instruments | Contracts | | Contracts | | Contracts | | Contracts | |
| |
| Location: Statement of Assets and Liabilities - Assets | | | | | | | | | | | | |
| Investments, at fair value* | | $ | 477 | | $ | — | | $ | — | | $ | — | |
| Unrealized appreciation on foreign currency exchange contracts | | — | | | — | | | 25 | | | — | |
| Variation margin on futures contracts** | | | 54 | | | — | | | — | | | 28 | |
| Credit default swap contracts, at fair value | | | — | | | 261 | | | — | | | — | |
| Total | | $ | 531 | | $ | 261 | | $ | 25 | | $ | 28 | |
| |
| |
| Location: Statement of Assets and Liabilities - Liabilities | | | | | | | | | | | | |
| Variation margin on futures contracts** | | $ | 249 | | $ | — | | $ | — | | $ | — | |
| Unrealized depreciation on foreign currency exchange contracts | | — | | | — | | | 86 | | | — | |
| Total return swap contracts, at fair value | | | 14 | | | — | | | — | | | — | |
| Total | | $ | 263 | | $ | — | | $ | 86 | | $ | — | |
| | | | | | | | | Foreign | | | | |
| | | Equity | | Credit | | Currency | | Interest Rate | |
| Derivatives not accounted for as hedging instruments | Contracts | | Contracts | | Contracts | | Contracts | |
| |
| Location: Statement of Operations - Net realized gain (loss) | | | | | | | | | | | | |
| Investments*** | | $ | 586 | | $ | — | | $ | — | | $ | — | |
| Futures contracts | | | (446 | ) | | — | | | — | | | (8 | ) |
| Options written | | | 105 | | | — | | | — | | | — | |
| Total return swap contracts | | | (1,106 | ) | | — | | | — | | | — | |
| Credit default swap contracts | | | — | | | 138 | | | — | | | — | |
| Foreign currency exchange contracts | | | — | | | — | | | (84 | ) | | — | |
| Total | | $ | (861 | ) | $ | 138 | | $ | (84 | ) | $ | (8 | ) |
| |
| |
| Location: Statement of Operations - Net change in unrealized appreciation | | | | | | | | | | | | |
| (depreciation) | | | | | | | | | | | | | |
| Investments**** | | $ | 170 | | $ | — | | $ | — | | $ | — | |
| Futures contracts | | | (275 | ) | | — | | | — | | | 11 | |
| Options written | | | (23 | ) | | — | | | — | | | — | |
| Total return swap contracts | | | 45 | | | — | | | — | | | — | |
| Credit default swap contracts | | | — | | | (180 | ) | | — | | | — | |
| Foreign currency exchange contracts | | | — | | | — | | | (141 | ) | | — | |
| Total | | $ | (83 | ) | $ | (180 | ) | $ | (141 | ) | $ | 11 | |
* Fair value of purchased options.
** Includes cumulative appreciation/depreciation of futures contracts as reported in the Schedule of Investments. Only variation margin is reported within the
Statement of Assets and Liabilities.
*** Includes net realized gain (loss) on purchased options as reported in the Statement of Operations.
**** Includes net change in unrealized appreciation/depreciation on purchased options as reported in the Schedule of Investments.
For further disclosure on derivatives see note 2 in the Notes to Financial Statements.
See accompanying notes which are an integral part of the financial statements.
Moderate Strategy Fund 17
Russell Investment Funds
Moderate Strategy Fund
Balance Sheet Offsetting of Financial and Derivative Instruments —
December 31, 2017
| | | | | | | | | | |
| Amounts in thousands | | | | | | | | | | |
| |
| Offsetting of Financial Assets and Derivative Assets | | | | | | | | | |
| | | | | | Gross | Net Amounts | |
| | | | | | Amounts | | of Assets | |
| | | | Gross | Offset in the | Presented in | |
| | | Amounts of | Statement of | the Statement | |
| | | Recognized | Assets and | of Assets and | |
| Description | Location: Statement of Assets and Liabilities - Assets | | Assets | Liabilities | | Liabilities | |
| Options Purchased Contracts | Investments, at fair value | $ | | 477 | | $ | — $ | 477 | |
| Foreign Currency Exchange Contracts | Unrealized appreciation on foreign currency exchange contracts | | | 25 | | | — | 25 | |
| Futures Contracts | Variation margin on futures contracts | | | 54 | | | — | 54 | |
| Credit Default Swap Contracts | Credit default swap contracts, at fair value | | | 261 | | | — | 261 | |
| Total Financial and Derivative Assets | | | | 817 | | | — | 817 | |
| Financial and Derivative Assets not subject to a netting agreement | | (792 | ) | | — | (792 | ) |
| Total Financial and Derivative Assets subject to a netting agreement | $ | | 25 | | $ | — $ | 25 | |
| word | | | | | | | | | | |
| | | | | | | | | |
| Financial Assets, Derivative Assets, and Collateral Held by Counterparty | | | | | | | | |
| | | | Gross Amounts Not Offset in | |
| | | | the Statement of Assets and | |
| | | | | | Liabilities | | | |
| |
| |
| | Net Amounts | | | | | | | |
| | of Assets | | | | | | | |
| | Presented in | | | | | | | |
| | the Statement | Financial and | | | | |
| | of Assets and | Derivative | Collateral | | |
| Counterparty | Liabilities | Instruments | Received^ | Net Amount |
| Bank of America | $ | 9 | | $ | 9 | $ | — | $ | — |
| Commonwealth Bank of Australia | | 8 | | | 8 | | — | | — |
| State Street | | 8 | | | 8 | | — | | — |
| Total | $ | 25 | | $ | 25 | $ | — | $ | — |
See accompanying notes which are an integral part of the financial statements.
18 Moderate Strategy Fund
Russell Investment Funds
Moderate Strategy Fund
Balance Sheet Offsetting of Financial and Derivative Instruments, continued —
December 31, 2017
| | | | | | | | | |
| Amounts in thousands | | | | | | | | | |
| |
| Offsetting of Financial Liabilities and Derivative Liabilities | | | | | | | | |
| | | | | Gross | Net Amounts | |
| | | | | Amounts | of Liabilities | |
| | | Gross | Offset in the | Presented in | |
| | | Amounts of | Statement of | the Statement | |
| | | Recognized | Assets and | of Assets and | |
| Description | Location: Statement of Assets and Liabilities - Liabilities | Liabilities | Liabilities | | Liabilities | |
| Futures Contracts | Variation margin on futures contracts | $ | 62 | | $ | — $ | 62 | |
| Foreign Currency Exchange Contracts | Unrealized depreciation on foreign currency exchange contracts | | 86 | | | — | 86 | |
| Total Return Swap Contracts | Total return swap contracts, at fair value | | 14 | | | — | 14 | |
| Total Financial and Derivative Liabilities | | | 162 | | | — | 162 | |
| Financial and Derivative Liabilities not subject to a netting agreement | | (62 | ) | | — | (62 | ) |
| Total Financial and Derivative Liabilities subject to a netting agreement | $ | 100 | | $ | — $ | 100 | |
| | | | | | | | | |
| Financial Liabilities, Derivative Liabilities, and Collateral Pledged by Counterparty | | | | | | | |
| | | | Gross Amounts Not Offset in | |
| | | | the Statement of Assets and | |
| | | | | | Liabilities | | | |
| |
| |
| | Net Amounts | | | | | | | |
| | of Liabilities | | | | | | | |
| | Presented in | | | | | | | |
| | the Statement | Financial and | | | | |
| | of Assets and | Derivative | Collateral | | |
| Counterparty | | Liabilities | Instruments | Pledged^ | Net Amount |
| Bank of America | $ | 33 | | $ | 9 | $ | — | $ | 24 |
| Commonwealth Bank of Australia | | 33 | | | 8 | | — | | 25 |
| Goldman Sachs | | 14 | | | — | | — | | 14 |
| State Street | | 20 | | | 8 | | — | | 12 |
| Total | $ | 100 | | $ | 25 | $ | — | $ | 75 |
^ Collateral received or pledged amounts may not reconcile to those disclosed in the Statement of Assets and Liabilities due to the inclusion of off-Balance
Sheet collateral and adjustments made to exclude overcollateralization.
For further disclosure on derivatives and counterparty risk see note 2 in the Notes to Financial Statements.
See accompanying notes which are an integral part of the financial statements.
Moderate Strategy Fund 19
Russell Investment Funds
Moderate Strategy Fund
Statement of Assets and Liabilities — December 31, 2017
| | |
| Amounts in thousands | | |
| Assets | | |
| Investments, at identified cost | $ | 103,878 |
| Investments, at fair value(>) | | 112,372 |
| Cash | | 663 |
| Cash (restricted)(a)(b)(c) | | 1,739 |
| Unrealized appreciation on foreign currency exchange contracts | | 25 |
| Receivables: | | |
| Investments sold | | 8 |
| From affiliates | | 4 |
| Variation margin on futures contracts | | 54 |
| Credit default swap contracts, at fair value(+) | | 261 |
| Total assets | | 115,126 |
| |
| Liabilities | | |
| Payables: | | |
| Fund shares redeemed | | 7 |
| Accrued fees to affiliates | | 5 |
| Other accrued expenses | | 46 |
| Variation margin on futures contracts | | 62 |
| Unrealized depreciation on foreign currency exchange contracts | | 86 |
| Total return swap contracts, at fair value(8) | | 14 |
| Total liabilities | | 220 |
| |
| Net Assets | $ | 114,906 |
See accompanying notes which are an integral part of the financial statements.
20 Moderate Strategy Fund
Russell Investment Funds
Moderate Strategy Fund
Statement of Assets and Liabilities, continued — December 31, 2017
| | | |
| Amounts in thousands | | | |
| Net Assets Consist of: | | | |
| Undistributed (overdistributed) net investment income | $ | 415 | |
| Accumulated net realized gain (loss) | | (532 | ) |
| Unrealized appreciation (depreciation) on: | | | |
| Investments | | 74 | |
| Investments in affiliated funds | | 8,420 | |
| Futures contracts | | (167 | ) |
| Foreign currency exchange contracts | | (61 | ) |
| Total return swap contracts | | (14 | ) |
| Credit default swap contracts | | (121 | ) |
| Shares of beneficial interest | | 112 | |
| Additional paid-in capital | | 106,780 | |
| Net Assets | $ | 114,906 | |
| |
| Net Asset Value, offering and redemption price per share: | | | |
| Net asset value per share: (#) | $ | 10.29 | |
| Net assets | $ | 114,906,230 | |
| Shares outstanding ($. 01 par value) | | 11,169,650 | |
| Amounts in thousands | | | |
| (+) Credit default swap contracts - premiums paid (received) | $ | 382 | |
| (8) Total return swap contracts - premiums paid (received) | $ | — | |
| (>) Investments in affiliated funds | $ | 111,895 | |
| |
| (a) Cash Collateral for Futures | $ | 1,450 | |
| (b) Cash Collateral for Swaps | $ | 35 | |
| (c) Cash Collateral for Options | $ | 254 | |
| (#) Net asset value per share equals net assets divided by shares of beneficial interest outstanding. | | | |
See accompanying notes which are an integral part of the financial statements.
Moderate Strategy Fund 21
Russell Investment Funds
Moderate Strategy Fund
Statement of Operations — For the Period Ended December 31, 2017
| | | |
| Amounts in thousands | | | |
| Investment Income | | | |
| Income distributions from affiliated funds | $ | 2,975 | |
| |
| Expenses | | | |
| Advisory fees | | 220 | |
| Administrative fees | | 47 | |
| Custodian fees | | 35 | |
| Transfer agent fees | | 5 | |
| Professional fees | | 42 | |
| Trustees’ fees | | 3 | |
| Printing fees | | 28 | |
| Miscellaneous | | 10 | |
| Expenses before reductions | | 390 | |
| Expense reductions | | (246 | ) |
| Net expenses | | 144 | |
| Net investment income (loss) | | 2,831 | |
| |
| Net Realized and Unrealized Gain (Loss) | | | |
| Net realized gain (loss) on: | | | |
| Investments | | 586 | |
| Investments in affiliated funds | | 1,100 | |
| Futures contracts | | (454 | ) |
| Options written | | 105 | |
| Foreign currency exchange contracts | | (84 | ) |
| Total return swap contracts | | (1,106 | ) |
| Credit default swap contracts | | 138 | |
| Foreign currency-related transactions | | 4 | |
| Capital gain distributions from affiliated funds | | 1,548 | |
| Net realized gain (loss) | | 1,837 | |
| Net change in unrealized appreciation (depreciation) on: | | | |
| Investments | | 170 | |
| Investments in affiliated funds | | 6,002 | |
| Futures contracts | | (264 | ) |
| Options written | | (23 | ) |
| Foreign currency exchange contracts | | (141 | ) |
| Total return swap contracts | | 45 | |
| Credit default swap contracts | | (180 | ) |
| Net change in unrealized appreciation (depreciation) | | 5,609 | |
| Net realized and unrealized gain (loss) | | 7,446 | |
| Net Increase (Decrease) in Net Assets from Operations | $ | 10,277 | |
See accompanying notes which are an integral part of the financial statements.
22 Moderate Strategy Fund
Russell Investment Funds
Moderate Strategy Fund
Statements of Changes in Net Assets
| | | | | | |
| | For the Periods Ended December 31, | |
| Amounts in thousands | | 2017 | | | 2016 | |
| Increase (Decrease) in Net Assets | | | | | | |
| Operations | | | | | | |
| Net investment income (loss) | $ | 2,831 | | $ | 3,508 | |
| Net realized gain (loss) | | 1,837 | | | 5,630 | |
| Net change in unrealized appreciation (depreciation) | | 5,609 | | | (779 | ) |
| Net increase (decrease) in net assets from operations | | 10,277 | | | 8,359 | |
| |
| Distributions | | | | | | |
| From net investment income | | (2,453 | ) | | (4,052 | ) |
| From net realized gain | | (1,332 | ) | | (4,815 | ) |
| Net decrease in net assets from distributions | | (3,785 | ) | | (8,867 | ) |
| |
| Share Transactions* | | | | | | |
| Net increase (decrease) in net assets from share transactions | | 782 | | | 95 | |
| Total Net Increase (Decrease) in Net Assets | | 7,274 | | | (413 | ) |
| |
| Net Assets | | | | | | |
| Beginning of period | | 107,632 | | | 108,045 | |
| End of period | $ | 114,906 | | $ | 107,632 | |
| Undistributed (overdistributed) net investment income included in net assets | $ | 415 | | $ | (7 | ) |
* Share transaction amounts (in thousands) for the periods ended December 31, 2017 and December 31, 2016 were as follows:
| | | | | | | | | | | | |
| | | 2017 | | | | 2016 | | |
| | | Shares | | | Dollars | | | Shares | | | Dollars | |
| |
| Proceeds from shares sold | | 1,027 | | $ | 10,475 | | | 1,057 | | $ | 10,402 | |
| Proceeds from reinvestment of distributions | | 377 | | | 3,785 | | | 917 | | | 8,867 | |
| Payments for shares redeemed | | (1,337 | ) | | (13,478 | ) | | (1,921 | ) | | (19,174 | ) |
| Total increase (decrease) | | 67 | | $ | 782 | | | 53 | | $ | 95 | |
See accompanying notes which are an integral part of the financial statements.
Moderate Strategy Fund 23
Russell Investment Funds
Moderate Strategy Fund
Financial Highlights — For the Periods Ended
For a Share Outstanding Throughout Each Period.
| | | | | | | | | | | | | | | | |
| | | | | $ | | | | | | | | | | | | |
| | | $ | | Net | | $ | | | $ | | | $ | | | $ | |
| | Net Asset Value, | | Investment | Net Realized | | | Total from | | | Distributions | | | Distributions | |
| | Beginning of | | Income (Loss) | and Unrealized | | | Investment | | | from Net | | | from Net | |
| | | Period | | (a)(b)(d) | Gain (Loss) | | | Operations | | | Investment Income | | | Realized Gain | |
| December 31, 2017 | | 9.69 | | . 25 | | . 70 | | | . 95 | | | (. 23 | ) | | (. 12 | ) |
| December 31, 2016 | | 9.78 | | . 31 | | . 43 | | | . 74 | | | (. 38 | ) | | (. 45 | ) |
| December 31, 2015 | | 10.45 | | . 26 | | (. 43 | ) | | (. 17 | ) | | (. 25 | ) | | (. 25 | ) |
| December 31, 2014 | | 10.41 | | . 31 | | . 19 | | | . 50 | | | (. 30 | ) | | (. 16 | ) |
| December 31, 2013 | | 10.10 | | . 18 | | . 50 | | | . 68 | | | (. 18 | ) | | (. 19 | ) |
| | | | | | | | | | | | | | | | | |
See accompanying notes which are an integral part of the financial statements.
24 Moderate Strategy Fund
| | | | | | | | | | | | | | | | | |
| | | | | | | | | | | | | % | | % | | % | |
| | | | | $ | | | | | $ | | | Ratio of Expenses | | Ratio of Expenses | Ratio of Net | |
| | | | | Net Asset Value, | | % | | | Net Assets, | | | to Average | | to Average | Investment Income | % |
| | $ | | | End of | | Total | | | End of Period | | | Net Assets, | | Net Assets, | to Average | Portfolio |
| Total Distributions | | | Period | | Return(e) | | | (000 | ) | | Gross(c) | | Net(c)(d) | Net Assets(b)(d) | Turnover Rate |
| (. 35 | ) | | 10.29 | | 9.88 | | | 114,906 | | | . 35 | | . 13 | | 2.57 | 20 |
| (. 83 | ) | | 9.69 | | 7.75 | | | 107,632 | | | . 33 | | . 11 | | 3.17 | 38 |
| (. 50 | ) | | 9.78 | | (1.71 | ) | | 108,045 | | | . 32 | | . 11 | | 2.57 | 29 |
| (. 46 | ) | | 10.45 | | 4.85 | | | 114,918 | | | . 35 | | . 10 | | 2.89 | 18 |
| (. 37 | ) | | 10.41 | | 6.79 | | | 103,093 | | | . 35 | | . 10 | | 1.69 | 18 |
See accompanying notes which are an integral part of the financial statements.
Moderate Strategy Fund 25
Russell Investment Funds
Moderate Strategy Fund
Related Party Transactions, Fees and Expenses
| | |
| Accrued fees payable to affiliates for the period ended December 31, 2017 were as follows: |
| Administration fees | $ | 4,118 |
| Transfer agent fees | | 426 |
| Trustee fees | | 266 |
| | $ | 4,810 |
Transactions (amounts in thousands) during the period ended December 31, 2017 with Underlying Funds which are, or were, an
affiliated company are as follows:
| | | | | | | | | | | | | | | | | | | | | |
| | | Fair Value, | | | | | | | | | Change in | | | | | | | | | |
| | Beginning of | | | | | Realized Gain | | Unrealized | | Fair Value, End | | | Income | Capital Gains | |
| | | Period | Purchases | | Sales | | (Loss) | | Gain (Loss) | | of Period | | | Distributions | | Distributions | |
| RIC Commodity Strategies Fund | $ | 3,224 | $ | 784 | $ | 516 | $ | (148) | $ | | 173 | $ | 3,517 | $ | 53 | $ | — | |
| RIC Global Infrastructure Fund | | 3,159 | | 644 | | 716 | | 13 | | 208 | | 3,308 | | 199 | | 139 | |
| RIF Global Real Estate Securities | | | | | | | | | | | | | | | | | | | | | |
| Fund | | 1,885 | | 68 | | 1,858 | | 365 | | (303 | ) | 157 | | 13 | | 3 | |
| RIC U. S. Defensive Equity Fund | | 83 | | 10 | | 31 | | — | | 5 | | 67 | | | 2 | | 5 | |
| RIC U. S. Dynamic Equity Fund | | 1,864 | | 89 | | 1,732 | | 190 | | (155 | ) | 256 | | 39 | | 30 | |
| RIF U. S. Small Cap Equity Fund | | 4,260 | | 5,404 | | 1,583 | | 70 | | 469 | | 8,620 | | 181 | | 389 | |
| RIF U. S. Strategic Equity Fund | | 104 | | 1,902 | | 302 | | 12 | | 99 | | 1,815 | | 75 | | 112 | |
| RIC Global Opportunistic Credit | | | | | | | | | | | | | | | | | | | | | |
| Fund | | 17,678 | | 1,557 | | 5,990 | | 60 | | 797 | | 14,102 | | 656 | | — | |
| RIC Investment Grade Bond Fund | | 13,244 | | 1,516 | | 1,162 | | (8 | ) | 266 | | 13,856 | | 211 | | — | |
| RIC Unconstrained Total Return | | | | | | | | | | | | | | | | | | | | | |
| Fund | | 5,377 | | 638 | | 331 | | — | | 6 | | 5,690 | | 110 | | — | |
| RIF Strategic Bond Fund | | 23,846 | | 2,674 | | 2,087 | | 2 | | 586 | | 25,021 | | 325 | | — | |
| RIC Emerging Markets Fund | | 6,904 | | 730 | | 2,324 | | 156 | | 1,912 | | 7,378 | | 92 | | — | |
| RIC Global Equity Fund | | 6,918 | | 1,434 | | 1,285 | | 160 | | 494 | | 7,721 | | 325 | | 597 | |
| |
| RIF International Fund Developed Markets | 6,343 | | 825 | | 1,490 | | 220 | | 843 | | 6,741 | | 169 | | 224 | |
| RIC Multi-Strategy Income Fund | | 10,712 | | 3,539 | | 1,215 | | 8 | | 602 | | 13,646 | | 521 | | 49 | |
| U. S. Cash Management Fund | | 516 | | 4,713 | | 5,229 | | — | | — | | — | | | 4 | | — | |
| | $ | 106,117 | $ | 26,527 | $ | 27,851 | $ | 1,100 | $ | 6,002 | $ | | 111,895 | $ | 2,975 | $ | 1,548 | |
Federal Income Taxes
At December 31, 2017, the cost of investments and net unrealized appreciation (depreciation), undistributed ordinary income and
undistributed long-term capital gains for income tax purposes were as follows:
| | | | |
| Cost of Investments | $ | | 105,458,950 | |
| Unrealized Appreciation | $ | | 7,876,513 | |
| Unrealized Depreciation | | | (873,193 | ) |
| Net Unrealized Appreciation (Depreciation) | $ | | 7,003,320 | |
| Undistributed Ordinary Income | $ | | 335,140 | |
| Undistributed Long-Term Capital Gains | | | | |
| (Capital Loss Carryforward) | $ | | 946,643 | |
| Tax Composition of Distributions | | | | |
| Ordinary Income | $ | | 2,722,564 | |
| Long-Term Capital Gains | $ | | 1,062,756 | |
See accompanying notes which are an integral part of the financial statements.
26 Moderate Strategy Fund
Russell Investment Funds
Moderate Strategy Fund
Federal Income Taxes, continued
Net investment income and net realized gains (losses) in the financial statements may differ from taxable net investment income and
net realized gains (losses). Capital accounts within the financial statements are adjusted for permanent differences between book and
tax accounting. Book-tax differences may be due to foreign currency gains and losses, reclassifications of dividends and differences in
treatment of income from swaps. These adjustments have no impact on the net assets. At December 31, 2017, the Statement of Assets
and Liabilities have been adjusted by the following amounts (in thousands):
| | | |
| Undistributed net investment income | $ | 44 | |
| Accumulated net realized gain (loss) | | (45 | ) |
| Additional paid-in capital | | 1 | |
See accompanying notes which are an integral part of the financial statements.
Moderate Strategy Fund 27
Russell Investment Funds
Balanced Strategy Fund
Portfolio Management Discussion and Analysis — December 31, 2017 (Unaudited)
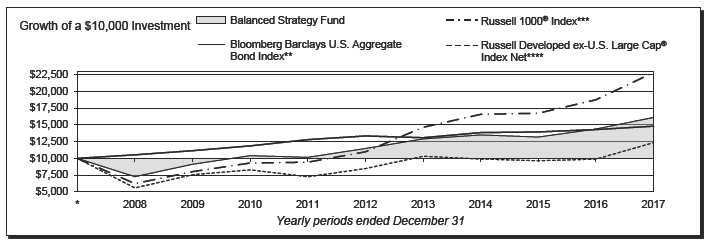
| | | | | | | |
| Balanced Strategy Fund | | | | Bloomberg Barclays U. S. Aggregate Bond Index** | |
| | | Total | | | | Total | |
| | | Return | | | | Return | |
| 1 Year | | 12.00 | % | 1 Year | | 3.54 | % |
| 5 Years | | 7.01 | %§ | 5 Years | | 2.10 | %§ |
| 10 Years | | 4.88 | %§ | 10 Years | | 4.01 | %§ |
| |
| | | | | Russell 1000® Index*** | | | |
| | | | | | | Total | |
| | | | | | | Return | |
| | | | | 1 Year | | 21.69 | % |
| | | | | 5 Years | | 15.71 | %§ |
| | | | | 10 Years | | 8.59 | %§ |
| |
| | | | | Russell Developed ex-U. S. Large Cap® Index Net**** | |
| | | | | | | Total | |
| | | | | | | Return | |
| | | | | 1 Year | | 24.85 | % |
| | | | | 5 Years | | 7.80 | %§ |
| | | | | 10 Years | | 2.14 | %§ |
28 Balanced Strategy Fund
Russell Investment Funds
Balanced Strategy Fund
Portfolio Management Discussion and Analysis, continued — December 31, 2017
(Unaudited)
| |
| The Balanced Strategy Fund (the “Fund”) is a fund of funds that | Within equities, overall global equity markets posted very strong |
| invests principally in other Russell Investment Funds (“RIF”) | returns, as the Russell Developed Large Cap® Index (Net) gained |
| and Russell Investment Company (“RIC”) mutual funds (the | 22.39%. Emerging markets were one of the top performing |
| “Underlying Funds”) . The Underlying Funds employ a multi- | segments of global equity markets over the period. The Fund’s |
| manager approach whereby portions of the Underlying Funds | strategic exposure to emerging markets proved beneficial over |
| are allocated to different money manager strategies. Underlying | the period as they rallied, boosted by lower interest rates and |
| Fund assets not allocated to money managers are managed by | improving economic growth. By contrast, non-U. S. developed |
| Russell Investment Management, LLC (“RIM”), the Fund’s | equities slightly lagged U. S. equities, as defensive and commodity |
| and Underlying Funds’ advisor. RIM, as the Underlying Funds’ | sectors, especially consumer staples, health care and energy, |
| advisor, may change the allocation of the Underlying Funds’ | weighed on non-U. S. equity returns. |
| assets among money managers at any time. An exemptive order | |
| from the Securities and Exchange Commission (“SEC”) permits | How did the investment strategies and techniques employed |
| RIM to engage or terminate a money manager in an Underlying | by the Fund and the Underlying Funds affect the Fund’s |
| Fund at any time, subject to approval by the Underlying Fund’s | performance? |
| Board, without a shareholder vote. Pursuant to the terms of the | The Fund is a fund of funds and its performance is based on RIM’s |
| exemptive order, an Underlying Fund is required to notify its | strategic asset allocations, the performance of the Underlying |
| shareholders within 90 days of when a money manager begins | Funds in which the Fund invests, and tactical changes in the |
| providing services. | Fund’s asset allocation throughout the year. In order to seek to |
| | achieve the Fund’s objective during the period, RIM’s strategic |
| What is the Fund’s investment objective? | asset allocation included investments in global equity, fixed |
| The Fund seeks to provide above average long term capital | income, multi-asset and alternative Underlying Funds. |
| appreciation and a moderate level of current income. | The Fund’s diverse asset allocation contributed positively to |
| How did the Fund perform relative to its benchmark for the | performance during the period. Non-traditional asset classes |
| fiscal year ended December 31, 2017? | such as high yield bonds returned 8.02%, as measured by the ICE |
| For the fiscal year ended December 31, 2017, the Fund gained | BofAML Global High Yield Index Hedged (USD), outperforming |
| 12.00%. This is compared to the Fund’s primary benchmark, the | the Fund’s primary benchmark, the Bloomberg Barclays U. S. |
| Bloomberg Barclays U. S. Aggregate Bond Index, which gained | Aggregate Bond Index. Non-U. S. developed equities and |
| 3.54% during the same period. The Fund’s performance includes | commodities delivered positive returns as well, as measured |
| operating expenses, whereas index returns are unmanaged and do | by the Russell Developed ex-U. S. Large Cap® Index Net and |
| not include expenses of any kind. | Bloomberg Commodity Index Total Return, respectively. |
| For the fiscal year ended December 31, 2017, the Morningstar | The fixed income portion of the Fund’s portfolio outperformed |
| Insurance Allocation – 50% to 70% Equity Category, a group of | the Fund’s fixed income benchmark. An allocation to the RIF |
| funds that Morningstar considers to have investment strategies | Strategic Bond Fund was positive from a benchmark-relative |
| similar to those of the Fund, gained 13.21%. This result serves | perspective as a result of its exposure to high yield corporate debt |
| as a peer comparison and is expressed net of operating expenses. | and non-agency mortgage backed securities. The excess returns |
| | were partially offset by the RIC Global Opportunistic Credit |
| How did the market conditions described in the Market | Fund as a result of its ex-benchmark allocation to investment |
| Summary report affect the Fund’s performance? | grade corporate debt and securitized bonds, which lagged the |
| The Fund seeks to achieve its objective by investing in Underlying | traditional spread sectors of high yield corporate bonds and U. S. |
| Funds that provide exposure to a range of diversified investments, | dollar emerging market debt. |
| and most major asset classes invested in by the Underlying Funds | Due to the strong performance of equity markets over the |
| produced positive absolute returns during the period. | period, the equity portion of the Fund’s portfolio contributed to |
| Within the Fund’s fixed income portfolio, exposure to high yield | excess returns. The RIC Global Equity Fund outperformed its |
| debt was beneficial as it was among the best-performing segments | global equity benchmark, supported by strategic and tactical |
| of the fixed income market over the one-year period. Rising | overweights to growth. By contrast, the RIC U. S. Defensive |
| interest rates posed a challenge to other fixed income assets, as | Equity Fund underperformed its benchmark as stock selection |
| well as more interest rate sensitive real assets such as global real | detracted, especially within the consumer staples and consumer |
| estate investment trusts (“REITs”) and global infrastructure. | discretionary sectors. |
Balanced Strategy Fund 29
Russell Investment Funds
Balanced Strategy Fund
Portfolio Management Discussion and Analysis, continued — December 31, 2017
(Unaudited)
| |
| The alternative assets portion of the Fund’s portfolio positively | trimmed high yield exposure to an underweight for the first time |
| contributed to absolute returns, though the rising rate environment | since 2015 by underweighting the RIC Global Opportunistic Credit |
| over the one-year period, that picked up towards end of third | Fund. During third quarter 2017, RIM moved to an underweight |
| quarter 2017, created headwinds for rate-sensitive asset classes | position in the RIC Global Infrastructure Fund as rising interest |
| such as listed REITs and listed infrastructure. | rates and higher valuations became more of a concern for the |
| | rate-sensitive sector. RIM maintained an underweight to the |
| Describe any changes to the Fund’s structure or allocation | RIF Global Real Estate Securities Fund over the period due to |
| to the Underlying Funds. | its rate-sensitive nature. During the fourth quarter of 2017, RIM |
| RIM has the discretion to vary the Fund’s actual allocation from | moved to further underweight listed infrastructure by trimming |
| the target strategic asset allocation by up to +/- 5% at the equity, | the Fund’s exposure to the RIC Global Infrastructure Fund due to |
| fixed income, multi-asset or alternative category level based on | its relatively expensive valuation. RIM also slightly trimmed the |
| RIM’s capital markets research. In addition to investing in the | underweight to REITs through increasing the Fund’s exposure to |
| Underlying Funds, RIM may seek to actively manage a Fund’s | the RIF Global Real Estate Securities Fund. RIM’s modifications |
| overall exposures by investing in derivatives that RIM believes | to the Fund’s asset allocation were additive during the period. |
| will achieve the desired risk/return profile for the Fund. RIM’s | |
| asset allocation modifications, implemented through both tactical | The views expressed in this report reflect those of the |
| changes to Underlying Fund allocations and derivatives-based | portfolio managers only through the end of the period |
| exposures, benefited the Fund’s performance relative to the | covered by the report. These views do not necessarily |
| Fund’s target strategic asset allocation. | represent the views of RIM, or any other person in RIM or |
| RIM tactically adapted the Fund’s asset allocation over the period | any other affiliated organization. These views are subject to |
| as market opportunities and risks evolved. RIM continued to | change at any time based upon market conditions or other |
| operate the Fund as a risk manager rather than risk taker. The Fund | events, and RIM disclaims any responsibility to update the |
| maintained an underweight position in U. S. equity by trimming its | views contained herein. These views should not be relied |
| exposure to the RIC U. S. Defensive Equity Fund relative to RIM’s | on as investment advice and, because investment decisions |
| long-term strategic weights. During the first quarter of 2017, as | for a Russell Investment Funds (“RIF”) Fund are based on |
| equity markets ran upwards and credit spreads compressed, RIM | numerous factors, should not be relied on as an indication |
| | of investment decisions of any RIF Fund. |
* Assumes initial investment on January 1, 2008.
** The Bloomberg Barclays U.S. Aggregate Bond Index is an index, with income reinvested, generally representative of intermediate-term government bonds,
investment grade corporate debt securities and mortgage-backed securities.
*** The Russell 1000® Index includes the 1,000 largest companies in the Russell 3000® Index. The Russell 1000® Index represents the universe of stocks from
which most active money managers typically select. The Russell 1000® Index return reflects adjustments from income dividends and capital gain distributions
reinvested as of the ex-dividend dates.
**** The Russell Developed ex-U.S. Large Cap® Index Net is an index which offers investors access to the large-cap segment of the global equity market, excluding
companies assigned to the United States. It is constructed to provide a comprehensive and unbiased barometer for the large-cap segment and is completely
reconstituted annually to accurately reflect the changes in the market over time and is net of tax on dividends from foreign holdings.
§ Annualized.
The performance shown in this section does not reflect any Insurance Company Separate Account or Policy Charges. Performance is historical and assumes
reinvestment of all dividends and capital gains. Investment return and principal value will fluctuate so that an investor’s shares, when redeemed, may be worth more
or less than when purchased. Past performance is not indicative of future results. Additionally, the returns presented herein may differ from the performance reported
in the Financial Highlights as the returns herein are calculated in a manner consistent with standardized performance in accordance with Securities and Exchange
Commission rules, while the performance in the Financial Highlights has been calculated in accordance with U.S. Generally Accepted Accounting Principles (“U.S.
GAAP”).
30 Balanced Strategy Fund
Russell Investment Funds
Balanced Strategy Fund
Shareholder Expense Example — December 31, 2017 (Unaudited)
| | | | | | | |
| Fund Expenses | Please note that the expenses shown in the table are meant |
| The following disclosure provides important information | to highlight your ongoing costs only and do not reflect any |
| regarding the Fund’s Shareholder Expense Example | transactional costs. Therefore, the information under the heading |
| (“Example”) . | “Hypothetical Performance (5% return before expenses)” is |
| | useful in comparing ongoing costs only, and will not help you |
| Example | determine the relative total costs of owning different funds. In |
| As a shareholder of the Fund, you incur two types of costs: (1) | addition, if these transactional costs were included, your costs |
| transaction costs, and (2) ongoing costs, including advisory and | would have been higher. The fees and expenses shown in this |
| administrative fees and other Fund expenses. The Example is | section do not reflect any Insurance Company Separate Account |
| intended to help you understand your ongoing costs (in dollars) | Policy Charges. | | | | | | |
| of investing in the Fund and to compare these costs with the | | | | | | Hypothetical |
| ongoing costs of investing in other mutual funds. The Example | | | | | | Performance (5% |
| is based on an investment of $1,000 invested at the beginning of | | | | Actual | | return before |
| the period and held for the entire period indicated, which for this | | | Performance | | | expenses) |
| | Beginning Account Value | | | | | | |
| Fund is from July 1, 2017 to December 31, 2017. | July 1, 2017 | | $ | 1,000.00 | | $ | 1,000.00 |
| | Ending Account Value | | | | | | |
| Actual Expenses | December 31, 2017 | | $ | 1,050.70 | | $ | 1,024.50 |
| The information in the table under the heading “Actual | Expenses Paid During Period* | | $ | 0.72 | | $ | 0.71 |
| Performance” provides information about actual account values | | | | | | | |
| and actual expenses. You may use the information in this column, | * Expenses are equal to the Fund's annualized expense ratio of 0.14% |
| | (representing the six month period annualized), multiplied by the average |
| together with the amount you invested, to estimate the expenses | account value over the period, multiplied by 184/365 (to reflect the one-half |
| that you paid over the period. Simply divide your account value by | year period) . May reflect amounts waived and/or reimbursed. Without any |
| $1,000 (for example, an $8,600 account value divided by $1,000 | waivers and/or reimbursements, expenses would have been higher. |
| = 8.6), then multiply the result by the number in the first column | | | | | | | |
| in the row entitled “Expenses Paid During Period” to estimate | | | | | | | |
| the expenses you paid on your account during this period. | | | | | | | |
| |
| Hypothetical Example for Comparison Purposes | | | | | | | |
| The information in the table under the heading “Hypothetical | | | | | | | |
| Performance (5% return before expenses)” provides information | | | | | | | |
| about hypothetical account values and hypothetical expenses | | | | | | | |
| based on the Fund’s actual expense ratio and an assumed rate of | | | | | | | |
| return of 5% per year before expenses, which is not the Fund’s | | | | | | | |
| actual return. The hypothetical account values and expenses | | | | | | | |
| may not be used to estimate the actual ending account balance or | | | | | | | |
| expenses you paid for the period. You may use this information | | | | | | | |
| to compare the ongoing costs of investing in the Fund and other | | | | | | | |
| funds. To do so, compare this 5% hypothetical example with the | | | | | | | |
| 5% hypothetical examples that appear in the shareholder reports | | | | | | | |
| of other funds. | | | | | | | |
Balanced Strategy Fund 31
Russell Investment Funds
Balanced Strategy Fund
Schedule of Investments — December 31, 2017
| | | | | |
| Amounts in thousands (except share amounts) | | | | | |
| | | | | | Fair |
| | | | | | Value |
| | Shares | | $ |
| Investments in Affiliated Funds - 97.9% | | | | | |
| Alternative - 6.9% | | | | | |
| RIC Commodity Strategies Fund Class Y | | | 1,724,871 | | 9,884 |
| RIC Global Infrastructure Fund Class Y | | | 496,423 | | 5,684 |
| RIF Global Real Estate Securities Fund | | | 331,352 | | 4,907 |
| | | | | | 20,475 |
| |
| Domestic Equities - 9.7% | | | | | |
| RIC U. S. Defensive Equity Fund Class Y | | | 109,948 | | 5,651 |
| RIC U. S. Dynamic Equity Fund Class Y | | | 238,935 | | 2,189 |
| RIF U. S. Small Cap Equity Fund | | | 1,012,242 | | 16,601 |
| RIF U. S. Strategic Equity Fund | | | 233,358 | | 4,324 |
| | | | | | 28,765 |
| |
| Fixed Income - 38.0% | | | | | |
| RIC Global Opportunistic Credit Fund Class Y | | | 2,388,859 | | 23,530 |
| RIC Unconstrained Total Return Fund Class Y | | | 2,090,520 | | 20,717 |
| RIF Strategic Bond Fund | | | 6,542,286 | | 67,844 |
| | | | | | 112,091 |
| |
| International Equities - 39.3% | | | | | |
| RIC Emerging Markets Fund Class Y | | | 1,132,765 | | 23,969 |
| RIC Global Equity Fund Class Y | | | 4,999,820 | | 53,997 |
| RIF International Developed Markets Fund | | | 2,889,761 | | 37,914 |
| | | | | | 115,880 |
| |
| Multi-Asset - 4.0% | | | | | |
| RIC Multi-Strategy Income Fund Class Y | | | 1,173,481 | | 11,946 |
| |
| Total Investments in Affiliated Funds | | | | | |
| (cost $256,201) | | | | | 289,157 |
| |
| Options Purchased - 0.7% | | | | | |
| (Number of Contracts) | | | | | |
| S&P 500 Index | | | | | |
| Goldman Sachs May 2018 2,675.00 Call (246) | USD | | 68,805 | (ÿ) | 1,924 |
| Total Options Purchased | | | | | |
| (cost $1,624) | | | | | 1,924 |
| |
| Short-Term Investments - 0.0% | | | | | |
| U. S. Cash Management Fund(@) | | | 9,627 | (8) | 10 |
| Total Short-Term Investments | | | | | |
| (cost $10) | | | | | 10 |
| |
| Total Investments 98.6% | | | | | |
| (identified cost $257,835) | | | | | 291,091 |
| |
| Other Assets and Liabilities, Net - 1.4% | | | | | 4,168 |
| Net Assets - 100.0% | | | | | 295,259 |
See accompanying notes which are an integral part of the financial statements.
32 Balanced Strategy Fund
Russell Investment Funds
Balanced Strategy Fund
Schedule of Investments, continued — December 31, 2017
| | | | | | | | |
| Futures Contracts | | | | | | | | |
| |
| Amounts in thousands (except contract amounts) | | | | | | | | |
| | | | | | | | Value and | |
| | | | | | | | Unrealized | |
| | | | | | | | Appreciation | |
| | | Number of | Notional | Expiration | (Depreciation) | |
| | | Contracts | Amount | Date | $ | |
| Long Positions | | | | | | | | |
| Amsterdam Index Futures | | | 16 | EUR | 1,742 | 01/18 | (24 | ) |
| CAC40 Euro Index Futures | | | 91 | EUR | 4,833 | 01/18 | (88 | ) |
| DAX Index Futures | | | 14 | EUR | 4,519 | 03/18 | (104 | ) |
| EURO STOXX 50 Index Futures | | | 84 | EUR | 2,934 | 03/18 | (85 | ) |
| FTSE/MIB Index Futures | | | 11 | EUR | 1,197 | 03/18 | (61 | ) |
| IBEX 35 Index Futures | | | 16 | EUR | 1,603 | 01/18 | (42 | ) |
| OMXS 30 Index Futures | | | 66 | SEK | 10,390 | 01/18 | (35 | ) |
| Short Positions | | | | | | | | |
| Dow U. S. Real Estate Index Futures | | | 51 | USD | 1,639 | 03/18 | (4 | ) |
| FTSE 100 Index Futures | | | 21 | GBP | 1,604 | 03/18 | (60 | ) |
| Hang Seng Index Futures | | | 1 | HKD | 1,497 | 01/18 | (2 | ) |
| MSCI Emerging Markets Mini Index Futures | | | 26 | USD | 1,513 | 03/18 | (71 | ) |
| MSCI Singapore Index Futures | | | 1 | SGD | 39 | 01/18 | — | |
| S&P 500 E-Mini Index Futures | | | 31 | USD | 4,148 | 03/18 | (13 | ) |
| S&P/TSX 60 Index Futures | | | 14 | CAD | 2,681 | 03/18 | (8 | ) |
| TOPIX Index Futures | | | 15 | JPY | 272,551 | 03/18 | (52 | ) |
| United States 2 Year Treasury Note Futures | | | 11 | USD | 2,355 | 03/18 | 4 | |
| United States 5 Year Treasury Note Futures | | | 38 | USD | 4,414 | 03/18 | 20 | |
| United States 10 Year Treasury Note Futures | | | 26 | USD | 3,225 | 03/18 | 20 | |
| United States Long Bond Futures | | | 2 | USD | 306 | 03/18 | — | |
| Total Value and Unrealized Appreciation (Depreciation) on Open Futures Contracts (å) | | | | | | (605 | ) |
| |
| |
| Foreign Currency Exchange Contracts | | | | | | | | |
| Amounts in thousands | | | | | | | | |
| | | | | | | | Unrealized | |
| | | | | | | | Appreciation | |
| | Amount | | Amount | | (Depreciation) | |
| Counterparty | Sold | | Bought | Settlement Date | $ | |
| Bank of America | USD | 517 | | CAD | 663 | 03/22/18 | 12 | |
| Bank of America | USD | 228 | | CHF | 224 | 03/22/18 | 4 | |
| Bank of America | USD | 18 | | JPY | 2,006 | 03/22/18 | — | |
| Bank of America | USD | 29 | MXN | 553 | 03/22/18 | (1 | ) |
| Bank of America | USD | 224 | | NOK | 1,850 | 03/22/18 | 2 | |
| Bank of America | AUD | 1,799 | | USD | 1,353 | 03/22/18 | (51 | ) |
| Bank of America | EUR | 3,672 | | USD | 4,358 | 03/22/18 | (70 | ) |
| Bank of America | GBP | 1,169 | | USD | 1,573 | 03/22/18 | (9 | ) |
| Bank of America | HKD | 5,838 | | USD | 749 | 03/22/18 | 1 | |
| Bank of America | SEK | 618 | | USD | 74 | 03/22/18 | (2 | ) |
| Bank of America | SGD | 306 | | USD | 227 | 03/22/18 | (2 | ) |
| Bank of America | ZAR | 70 | | USD | 5 | 03/22/18 | (1 | ) |
| Commonwealth Bank of Australia | USD | 517 | | CAD | 663 | 03/22/18 | 11 | |
| Commonwealth Bank of Australia | USD | 228 | | CHF | 224 | 03/22/18 | 4 | |
| Commonwealth Bank of Australia | USD | 18 | | JPY | 2,006 | 03/22/18 | — | |
| Commonwealth Bank of Australia | USD | 29 | MXN | 553 | 03/22/18 | (1 | ) |
| Commonwealth Bank of Australia | USD | 224 | | NOK | 1,850 | 03/22/18 | 2 | |
| Commonwealth Bank of Australia | AUD | 1,799 | | USD | 1,353 | 03/22/18 | (51 | ) |
| Commonwealth Bank of Australia | EUR | 3,672 | | USD | 4,361 | 03/22/18 | (66 | ) |
| Commonwealth Bank of Australia | GBP | 1,169 | | USD | 1,571 | 03/22/18 | (11 | ) |
| Commonwealth Bank of Australia | HKD | 5,838 | | USD | 749 | 03/22/18 | — | |
| Commonwealth Bank of Australia | SEK | 618 | | USD | 74 | 03/22/18 | (2 | ) |
See accompanying notes which are an integral part of the financial statements.
Balanced Strategy Fund 33
Russell Investment Funds
Balanced Strategy Fund
Schedule of Investments, continued — December 31, 2017
| | | | | | | | |
| Foreign Currency Exchange Contracts | | | | | | | | |
| Amounts in thousands | | | | | | | | |
| | | | | | | | Unrealized | |
| | | | | | | | Appreciation | |
| | | Amount | | Amount | | (Depreciation) | |
| Counterparty | | Sold | | Bought | Settlement Date | $ | |
| Commonwealth Bank of Australia | SGD | 306 | USD | | 227 | 03/22/18 | (2 | ) |
| Commonwealth Bank of Australia | ZAR | 70 | USD | | 5 | 03/22/18 | (1 | ) |
| Royal Bank of Canada | TRY | 1,760 | USD | | 441 | 03/22/18 | (12 | ) |
| State Street | USD | 517 | CAD | | 663 | 03/22/18 | 11 | |
| State Street | USD | 228 | CHF | | 224 | 03/22/18 | 4 | |
| State Street | USD | 1,890 | CNY | | 12,570 | 03/22/18 | 30 | |
| State Street | USD | 18 | JPY | | 2,006 | 03/22/18 | — | |
| State Street | USD | 29 | MXN | | 553 | 03/22/18 | (1 | ) |
| State Street | USD | 224 | NOK | | 1,850 | 03/22/18 | 2 | |
| State Street | USD | 31 | RUB | | 1,880 | 03/22/18 | 1 | |
| State Street | AUD | 1,799 | USD | | 1,352 | 03/22/18 | (52 | ) |
| State Street | BRL | 5,310 | USD | | 1,590 | 03/22/18 | 3 | |
| State Street | CNY | 12,830 | USD | | 1,921 | 03/22/18 | (38 | ) |
| State Street | EUR | 3,672 | USD | | 4,360 | 03/22/18 | (67 | ) |
| State Street | GBP | 1,169 | USD | | 1,571 | 03/22/18 | (12 | ) |
| State Street | HKD | 5,838 | USD | | 749 | 03/22/18 | — | |
| State Street | INR | 49,110 | USD | | 754 | 03/22/18 | (10 | ) |
| State Street | KRW | 1,695,470 | USD | | 1,553 | 03/22/18 | (37 | ) |
| State Street | SEK | 618 | USD | | 74 | 03/22/18 | (2 | ) |
| State Street | SGD | 306 | USD | | 227 | 03/22/18 | (2 | ) |
| State Street | TWD | 28,550 | USD | | 957 | 03/22/18 | (14 | ) |
| State Street | ZAR | 70 | USD | | 5 | 03/22/18 | (1 | ) |
| Total Unrealized Appreciation (Depreciation) on Open Foreign Currency Exchange Contracts | | | | | (431 | ) |
Total Return Swap Contracts
Amounts in thousands
| | | | | | | | | | | | | | |
| | | | | | | | | | | Premiums | Unrealized | | | |
| | | | | | | | | | | Paid | Appreciation | | | |
| | | | | Notional | | | | | Termination | (Received) | (Depreciation) | | Fair Value | |
| Underlying Reference Entity | Counterparty | Amount | | Terms | | Date | $ | $ | | $ | |
| Short | | | | | | | | | | | | | | |
| S&P 500 Total Return Index | | Goldman Sachs | USD 43,300 | 3 Month LIBOR + 0.700%(5) | | 03/16/18 | — | (55 | ) | (55 | ) |
| Total Open Total Return Swap Contracts (å) | | | | | | | | — | (55 | ) | (55 | ) |
| |
| |
| |
| |
| Credit Default Swap Contracts | | | | | | | | | | | | |
| |
| Amounts in thousands | | | | | | | | | | | | | |
| |
| Credit Indices | | | | | | | | | | | | | | |
| | | | | | | | | | | Premiums | Unrealized | | | |
| | | | | | | | Fund (Pays)/ | | Paid/ | Appreciation | | | |
| | | | Purchase/Sell | | | Receives | Termination | (Received) | (Depreciation) | | Fair Value | |
| Reference Entity | | Counterparty | Protection | Notional Amount | Fixed Rate | Date | $ | $ | | $ | |
| CDX Emerging Markets | | | | | | | | | | | | | | |
| Index | Bank of America | Purchase | USD | 6,305 | (1.000%)(2) | 12/20/22 | 264 | (211 | ) | 53 | |
| CDX Investment Grade | | | | | | | | | | | | | | |
| Index | Bank of America | Sell | USD | 1,200 | 1.000%(2) | 12/20/22 | 24 | 5 | | 29 | |
| CDX NA High Yield Index | Bank of America | Sell | USD | 7,600 | 5.000%(2) | 12/20/22 | 573 | 55 | | 628 | |
| Total Open Credit Indices Contracts (å) | | | | | | | | 861 | (151 | ) | 710 | |
See accompanying notes which are an integral part of the financial statements.
34 Balanced Strategy Fund
Russell Investment Funds
Balanced Strategy Fund
Schedule of Investments, continued — December 31, 2017
| | | | | | | | | | | | | | | | | |
| Presentation of Portfolio Holdings | | | | | | | | | | | | | | | |
| Amounts in thousands | | | | | | | | | | | | | | | | | |
| | | | | | Fair Value | | | | | | | | | | |
| | | | | | | | | | | | Practical | | | | | | |
| Portfolio Summary | | Level 1 | | | Level 2 | | | Level 3 | Expedient (a) | | Total | | % of Net Assets | |
| Investments in Affiliated Funds | $ | 289,157 | | $ | — | | $ | | — | $ | — | $ | 289,157 | | | 97.9 | |
| Options Purchased | | 1,924 | | | — | | | | — | | — | | 1,924 | | | 0.7 | |
| Short-Term Investments | | — | | | — | | | | — | | 10 | | 10 | | | — * | |
| Total Investments | | 291,081 | | | — | | | | — | | 10 | | 291,091 | | | 98.6 | |
| Other Assets and Liabilities, Net | | | | | | | | | | | | | | | | 1.4 | |
| | | | | | | | | | | | | | | | | 100.0 | |
| Other Financial Instruments | | | | | | | | | | | | | | | | | |
| Assets | | | | | | | | | | | | | | | | | |
| Futures Contracts | | 44 | | | — | | | | — | | — | | 44 | | | — * | |
| Foreign Currency Exchange Contracts | | — | | | 87 | | | | — | | — | | 87 | | | — * | |
| Credit Default Swap Contracts | | — | | | 710 | | | | — | | — | | 710 | | | 0.2 | |
| ' | | | | | | | | | | | | | | | | | |
| Liabilities | | | | | | | | | | | | | | | | | |
| Futures Contracts | | (649 | ) | | — | | | | — | | — | | (649 | ) | | (0.2 | ) |
| Foreign Currency Exchange Contracts | | — | | | (518 | ) | | | — | | — | | (518 | ) | | (0.2 | ) |
| Total Return Swap Contracts | | — | | | (55 | ) | | | — | | — | | (55 | ) | | (—)* | |
| Total Other Financial Instruments** | $ | (605 | ) | $ | 224 | | $ | | — | $ | — | $ | (381 | ) | | | |
* Less than 0.05% of net assets.
** Futures and foreign currency exchange contract values reflect the unrealized appreciation (depreciation) on the investments.
(a) Certain investments that are measured at fair value using the net asset value per share (or its equivalent) practical expedient have not been classified
in the fair value levels. The fair value amounts presented in the table are intended to permit reconciliation to the amounts presented in the Schedule of
Investments.
For a description of the Levels, see note 2 in the Notes to Financial Statements.
For a disclosure on transfers between Levels 1, 2 and 3 during the period ended December 31, 2017, see note 2 in the Notes to
Financial Statements.
See accompanying notes which are an integral part of the financial statements.
Balanced Strategy Fund 35
Russell Investment Funds
Balanced Strategy Fund
Fair Value of Derivative Instruments — December 31, 2017
Amounts in thousands
| | | | | | | | | | | | |
| | | | | | | | | Foreign | | | |
| | | Equity | | Credit | | Currency | | Interest Rate |
| Derivatives not accounted for as hedging instruments | Contracts | | Contracts | | Contracts | | Contracts | |
| |
| Location: Statement of Assets and Liabilities - Assets | | | | | | | | | | | |
| Investments, at fair value* | | $ | 1,924 | | $ | — | | $ | — | | $ | — |
| Unrealized appreciation on foreign currency exchange contracts | | — | | | — | | | 87 | | | — |
| Variation margin on futures contracts** | | | — | | | — | | | — | | | 44 |
| Credit default swap contracts, at fair value | | | — | | | 710 | | | — | | | — |
| Total | | $ | 1,924 | | $ | 710 | | $ | 87 | | $ | 44 |
| |
| |
| Location: Statement of Assets and Liabilities - Liabilities | | | | | | | | | | | |
| Variation margin on futures contracts** | | $ | 649 | | $ | — | | $ | — | | $ | — |
| Unrealized depreciation on foreign currency exchange contracts | | — | | | — | | | 518 | | | — |
| Total return swap contracts, at fair value | | | 55 | | | — | | | — | | | — |
| Total | | $ | 704 | | $ | — | | $ | 518 | | $ | — |
| | | | | | | | | Foreign | | | |
| | | Equity | | Credit | | Currency | | Interest Rate |
| Derivatives not accounted for as hedging instruments | Contracts | | Contracts | | Contracts | | Contracts | |
| |
| Location: Statement of Operations - Net realized gain (loss) | | | | | | | | | | | |
| Investments*** | | $ | 2,568 | | $ | — | | $ | — | | $ | — |
| Futures contracts | | | (3,071 | ) | | — | | | — | | | 30 |
| Options written | | | 536 | | | — | | | — | | | — |
| Total return swap contracts | | | (4,182 | ) | | — | | | — | | | — |
| Credit default swap contracts | | | — | | | 915 | | | — | | | — |
| Foreign currency exchange contracts | | | — | | | — | | | (723 | ) | | — |
| Total | | $ | (4,149 | ) | $ | 915 | | $ | (723 | ) | $ | 30 |
| |
| |
| Location: Statement of Operations - Net change in unrealized appreciation | | | | | | | | | | | |
| (depreciation) | | | | | | | | | | | | |
| Investments**** | | $ | 776 | | $ | — | | $ | — | | $ | — |
| Futures contracts | | | (1,030 | ) | | — | | | — | | | 44 |
| Options written | | | (115 | ) | | — | | | — | | | — |
| Total return swap contracts | | | 14 | | | — | | | — | | | — |
| Credit default swap contracts | | | — | | | (572 | ) | | — | | | — |
| Foreign currency exchange contracts | | | — | | | — | | | (795 | ) | | — |
| Total | | $ | (355 | ) | $ | (572 | ) | $ | (795 | ) | $ | 44 |
* Fair value of purchased options.
** Includes cumulative appreciation/depreciation of futures contracts as reported in the Schedule of Investments. Only variation margin is reported within the
Statement of Assets and Liabilities.
*** Includes net realized gain (loss) on purchased options as reported in the Statement of Operations.
**** Includes net change in unrealized appreciation/depreciation on purchased options as reported in the Schedule of Investments.
For further disclosure on derivatives see note 2 in the Notes to Financial Statements.
See accompanying notes which are an integral part of the financial statements.
36 Balanced Strategy Fund
Russell Investment Funds
Balanced Strategy Fund
Balance Sheet Offsetting of Financial and Derivative Instruments —
December 31, 2017
| | | | | | | | | |
| Amounts in thousands | | | | | | | | | |
| |
| Offsetting of Financial Assets and Derivative Assets | | | | | | | | |
| | | | | Gross | Net Amounts | |
| | | | | Amounts | | of Assets | |
| | | | Gross | Offset in the | Presented in | |
| | | Amounts of | Statement of | the Statement | |
| | | Recognized | Assets and | of Assets and | |
| Description | Location: Statement of Assets and Liabilities - Assets | | Assets | Liabilities | | Liabilities | |
| Options Purchased Contracts | Investments, at fair value | $ | 1,924 | | $ | — $ | 1,924 | |
| Foreign Currency Exchange Contracts | Unrealized appreciation on foreign currency exchange contracts | | 87 | | | — | 87 | |
| Futures Contracts | Variation margin on futures contracts | | 24 | | | — | 24 | |
| Credit Default Swap Contracts | Credit default swap contracts, at fair value | | 710 | | | — | 710 | |
| Total Financial and Derivative Assets | | | 2,745 | | | — | 2,745 | |
| Financial and Derivative Assets not subject to a netting agreement | | (2,658 | ) | | — | (2,658 | ) |
| Total Financial and Derivative Assets subject to a netting agreement | $ | 87 | | $ | — $ | 87 | |
| | | | | | | | | |
| Financial Assets, Derivative Assets, and Collateral Held by Counterparty | | | | | | | | |
| | | | Gross Amounts Not Offset in | |
| | | | the Statement of Assets and | |
| | | | | | Liabilities | | | |
| |
| |
| | Net Amounts | | | | | | | |
| | of Assets | | | | | | | | |
| | Presented in | | | | | | | |
| | the Statement | Financial and | | | | |
| | of Assets and | Derivative | Collateral | | |
| Counterparty | Liabilities | | Instruments | Received^ | | Net Amount |
| Bank of America | $ | 17 | | $ | 17 | $ | — | $ | — |
| Commonwealth Bank of Australia | | 17 | | | 17 | | — | | — |
| State Street | | 53 | | | 53 | | — | | — |
| Total | $ | 87 | | $ | 87 | $ | — | $ | — |
See accompanying notes which are an integral part of the financial statements.
Balanced Strategy Fund 37
Russell Investment Funds
Balanced Strategy Fund
Balance Sheet Offsetting of Financial and Derivative Instruments, continued —
December 31, 2017
| | | | | | | | | |
| Amounts in thousands | | | | | | | | | |
| |
| Offsetting of Financial Liabilities and Derivative Liabilities | | | | | | | | |
| | | | | Gross | Net Amounts | |
| | | | | Amounts | of Liabilities | |
| | | | Gross | Offset in the | Presented in | |
| | | Amounts of | Statement of | the Statement | |
| | | Recognized | Assets and | of Assets and | |
| Description | Location: Statement of Assets and Liabilities - Liabilities | Liabilities | Liabilities | | Liabilities | |
| Futures Contracts | Variation margin on futures contracts | $ | 154 | | $ | — $ | 154 | |
| Foreign Currency Exchange Contracts | Unrealized depreciation on foreign currency exchange contracts | | 518 | | | — | 518 | |
| Total Return Swap Contracts | Total return swap contracts, at fair value | | 55 | | | — | 55 | |
| Total Financial and Derivative Liabilities | | | 727 | | | — | 727 | |
| Financial and Derivative Liabilities not subject to a netting agreement | | (154 | ) | | — | (154 | ) |
| Total Financial and Derivative Liabilities subject to a netting agreement | $ | 573 | | $ | — $ | 573 | |
| | | | | | | | | |
| Financial Liabilities, Derivative Liabilities, and Collateral Pledged by Counterparty | | | | | | | |
| | | | Gross Amounts Not Offset in | |
| | | | the Statement of Assets and | |
| | | | | | Liabilities | | | |
| |
| | Net Amounts | | | | | | | |
| | of Liabilities | | | | | | | |
| | Presented in | | | | | | | |
| | the Statement | Financial and | | | | |
| | of Assets and | Derivative | Collateral | | |
| Counterparty | | Liabilities | Instruments | Pledged^ | | Net Amount |
| Bank of America | $ | 137 | | $ | 17 | $ | — | $ | 120 |
| Commonwealth Bank of Australia | | 134 | | | 17 | | — | | 117 |
| Goldman Sachs | | 55 | | | — | | — | | 55 |
| Royal Bank of Canada | | 12 | | | — | | — | | 12 |
| State Street | | 235 | | | 53 | | — | | 182 |
| Total | $ | 573 | | $ | 87 | $ | — | $ | 486 |
^ Collateral received or pledged amounts may not reconcile to those disclosed in the Statement of Assets and Liabilities due to the inclusion of off-Balance
Sheet collateral and adjustments made to exclude overcollateralization.
For further disclosure on derivatives and counterparty risk see note 2 in the Notes to Financial Statements.
See accompanying notes which are an integral part of the financial statements.
38 Balanced Strategy Fund
Russell Investment Funds
Balanced Strategy Fund
Statement of Assets and Liabilities — December 31, 2017
| | |
| Amounts in thousands | | |
| Assets | | |
| Investments, at identified cost | $ | 257,835 |
| Investments, at fair value(>) | | 291,091 |
| Cash | | 382 |
| Cash (restricted)(a)(b)(c) | | 3,777 |
| Unrealized appreciation on foreign currency exchange contracts | | 87 |
| Receivables: | | |
| Investments sold | | 43 |
| Variation margin on futures contracts | | 24 |
| Credit default swap contracts, at fair value(+) | | 710 |
| Total assets | | 296,114 |
| |
| Liabilities | | |
| Payables: | | |
| Fund shares redeemed | | 43 |
| Accrued fees to affiliates | | 22 |
| Other accrued expenses | | 63 |
| Variation margin on futures contracts | | 154 |
| Unrealized depreciation on foreign currency exchange contracts | | 518 |
| Total return swap contracts, at fair value(8) | | 55 |
| Total liabilities | | 855 |
| |
| Net Assets | $ | 295,259 |
See accompanying notes which are an integral part of the financial statements.
Balanced Strategy Fund 39
Russell Investment Funds
Balanced Strategy Fund
Statement of Assets and Liabilities, continued — December 31, 2017
| | | |
| Amounts in thousands | | | |
| Net Assets Consist of: | | | |
| Undistributed (overdistributed) net investment income | $ | 1,360 | |
| Accumulated net realized gain (loss) | | 802 | |
| Unrealized appreciation (depreciation) on: | | | |
| Investments | | 300 | |
| Investments in affiliated funds | | 32,956 | |
| Futures contracts | | (605 | ) |
| Foreign currency exchange contracts | | (431 | ) |
| Total return swap contracts | | (55 | ) |
| Credit default swap contracts | | (151 | ) |
| Shares of beneficial interest | | 290 | |
| Additional paid-in capital | | 260,793 | |
| Net Assets | $ | 295,259 | |
| |
| Net Asset Value, offering and redemption price per share: | | | |
| Net asset value per share: (#) | $ | 10.17 | |
| Net assets | $ | 295,258,504 | |
| Shares outstanding ($. 01 par value) | | 29,025,966 | |
| Amounts in thousands | | | |
| (+) Credit default swap contracts - premiums paid (received) | $ | 861 | |
| (8) Total return swap contracts - premiums paid (received) | $ | — | |
| (>) Investments in affiliated funds | $ | 289,167 | |
| |
| (a) Cash Collateral for Futures | $ | 2,600 | |
| (b) Cash Collateral for Swaps | $ | 82 | |
| (c) Cash Collateral for Options | $ | 1,095 | |
| (#) Net asset value per share equals net assets divided by shares of beneficial interest outstanding. | | | |
See accompanying notes which are an integral part of the financial statements.
40 Balanced Strategy Fund
Russell Investment Funds
Balanced Strategy Fund
Statement of Operations — For the Period Ended December 31, 2017
| | | |
| Amounts in thousands | | | |
| Investment Income | | | |
| Income distributions from affiliated funds | $ | 8,366 | |
| |
| Expenses | | | |
| Advisory fees | | 582 | |
| Administrative fees | | 124 | |
| Custodian fees | | 44 | |
| Transfer agent fees | | 13 | |
| Professional fees | | 54 | |
| Trustees’ fees | | 8 | |
| Printing fees | | 55 | |
| Miscellaneous | | 9 | |
| Expenses before reductions | | 889 | |
| Expense reductions | | (510 | ) |
| Net expenses | | 379 | |
| Net investment income (loss) | | 7,987 | |
| |
| Net Realized and Unrealized Gain (Loss) | | | |
| Net realized gain (loss) on: | | | |
| Investments | | 2,568 | |
| Investments in affiliated funds | | 11,358 | |
| Futures contracts | | (3,041 | ) |
| Options written | | 536 | |
| Foreign currency exchange contracts | | (723 | ) |
| Total return swap contracts | | (4,182 | ) |
| Credit default swap contracts | | 915 | |
| Foreign currency-related transactions | | 20 | |
| Capital gain distributions from affiliated funds | | 7,960 | |
| Net realized gain (loss) | | 15,411 | |
| Net change in unrealized appreciation (depreciation) on: | | | |
| Investments | | 776 | |
| Investments in affiliated funds | | 11,224 | |
| Futures contracts | | (986 | ) |
| Options written | | (115 | ) |
| Foreign currency exchange contracts | | (795 | ) |
| Total return swap contracts | | 14 | |
| Credit default swap contracts | | (572 | ) |
| Net change in unrealized appreciation (depreciation) | | 9,546 | |
| Net realized and unrealized gain (loss) | | 24,957 | |
| Net Increase (Decrease) in Net Assets from Operations | $ | 32,944 | |
See accompanying notes which are an integral part of the financial statements.
Balanced Strategy Fund 41
Russell Investment Funds
Balanced Strategy Fund
Statements of Changes in Net Assets
| | | | | | |
| | For the Periods Ended December 31, | |
| Amounts in thousands | | 2017 | | | 2016 | |
| Increase (Decrease) in Net Assets | | | | | | |
| Operations | | | | | | |
| Net investment income (loss) | $ | 7,987 | | $ | 7,181 | |
| Net realized gain (loss) | | 15,411 | | | 12,710 | |
| Net change in unrealized appreciation (depreciation) | | 9,546 | | | 4,474 | |
| Net increase (decrease) in net assets from operations | | 32,944 | | | 24,365 | |
| |
| Distributions | | | | | | |
| From net investment income | | (6,805 | ) | | (9,185 | ) |
| From net realized gain | | (13,379 | ) | | (4,457 | ) |
| Net decrease in net assets from distributions | | (20,184 | ) | | (13,642 | ) |
| |
| Share Transactions* | | | | | | |
| Net increase (decrease) in net assets from share transactions | | 362 | | | (17,261 | ) |
| Total Net Increase (Decrease) in Net Assets | | 13,122 | | | (6,538 | ) |
| |
| Net Assets | | | | | | |
| Beginning of period | | 282,137 | | | 288,675 | |
| End of period | $ | 295,259 | | $ | 282,137 | |
| Undistributed (overdistributed) net investment income included in net assets | $ | 1,360 | | $ | 244 | |
* Share transaction amounts (in thousands) for the periods ended December 31, 2017 and December 31, 2016 were as follows:
| | | | | | | | | | | | |
| | | 2017 | | | | 2016 | | |
| | | Shares | | | Dollars | | | Shares | | | Dollars | |
| |
| Proceeds from shares sold | | 1,004 | | $ | 10,195 | | | 1,008 | | $ | 9,687 | |
| Proceeds from reinvestment of distributions | | 2,006 | | | 20,184 | | | 1,411 | | | 13,642 | |
| Payments for shares redeemed | | (2,951 | ) | | (30,017 | ) | | (4,233 | ) | | (40,590 | ) |
| Total increase (decrease) | | 59 | | $ | 362 | | | (1,814 | ) | $ | (17,261 | ) |
See accompanying notes which are an integral part of the financial statements.
42 Balanced Strategy Fund
(This page intentionally left blank)
Russell Investment Funds
Balanced Strategy Fund
Financial Highlights — For the Periods Ended
For a Share Outstanding Throughout Each Period.
| | | | | | | | | | | | | | | | |
| | | | | $ | | | | | | | | | | | | |
| | | $ | | Net | | $ | | | $ | | | $ | | | $ | |
| | Net Asset Value, | | Investment | Net Realized | | | Total from | | | Distributions | | | Distributions | |
| | Beginning of | | Income (Loss) | and Unrealized | | | Investment | | | from Net | | | from Net | |
| | | Period | | (a)(b)(d) | Gain (Loss) | | | Operations | | | Investment Income | | | Realized Gain | |
| December 31, 2017 | | 9.74 | | . 28 | | . 87 | | | 1.15 | | | (. 25 | ) | | (. 47 | ) |
| December 31, 2016 | | 9.38 | | . 24 | | . 60 | | | . 84 | | | (. 32 | ) | | (. 16 | ) |
| December 31, 2015 | | 10.40 | | . 22 | | (. 44 | ) | | (. 22 | ) | | (. 22 | ) | | (. 58 | ) |
| December 31, 2014 | | 10.44 | | . 31 | | . 17 | | | . 48 | | | (. 31 | ) | | (. 21 | ) |
| December 31, 2013 | | 9.55 | | . 21 | | . 96 | | | 1.17 | | | (. 21 | ) | | (. 07 | ) |
| | | | | | | | | | | | | | | | | |
See accompanying notes which are an integral part of the financial statements.
44 Balanced Strategy Fund
| | | | | | | | | | | | | | | | | |
| | | | | | | | | | | | | % | | % | | % | |
| | | | | $ | | | | | $ | | | Ratio of Expenses | | Ratio of Expenses | Ratio of Net | |
| | | | | Net Asset Value, | | % | | | Net Assets, | | | to Average | | to Average | Investment Income | % |
| | $ | | | End of | | Total | | | End of Period | | | Net Assets, | | Net Assets, | to Average | Portfolio |
| Total Distributions | | | Period | | Return(e) | | | (000 | ) | | Gross(c) | | Net(c)(d) | Net Assets(b)(d) | Turnover Rate |
| (. 72 | ) | | 10.17 | | 12.00 | | | 295,259 | | | . 31 | | . 13 | | 2.74 | 35 |
| (. 48 | ) | | 9.74 | | 9.05 | | | 282,137 | | | . 30 | | . 11 | | 2.55 | 19 |
| (. 80 | ) | | 9.38 | | (2.30 | ) | | 288,675 | | | . 29 | | . 11 | | 2.16 | 23 |
| (. 52 | ) | | 10.40 | | 4.61 | | | 314,127 | | | . 31 | | . 10 | | 2.91 | 22 |
| (. 28 | ) | | 10.44 | | 12.43 | | | 304,103 | | | . 31 | | . 10 | | 2.09 | 11 |
See accompanying notes which are an integral part of the financial statements.
Balanced Strategy Fund 45
Russell Investment Funds
Balanced Strategy Fund
Related Party Transactions, Fees and Expenses
| | |
| Accrued fees payable to affiliates for the period ended December 31, 2017 were as follows: |
| Advisory fees | $ | 9,308 |
| Administration fees | | 10,646 |
| Transfer agent fees | | 1,102 |
| Trustee fees | | 645 |
| | $ | 21,701 |
Transactions (amounts in thousands) during the period ended December 31, 2017 with Underlying Funds which are, or were, an
affiliated company are as follows:
| | | | | | | | | | | | | | | | | | | | |
| | | Fair Value, | | | | | | | | Change in | | | | | | | | | |
| | Beginning of | | | | Realized Gain | | Unrealized | | Fair Value, End | | Income | Capital Gains | |
| | | Period | | Purchases | | Sales | | (Loss) | | Gain (Loss) | | of Period | | Distributions | | Distributions | |
| RIC Commodity Strategies Fund | $ | 9,290 | $ | 1,536 | $ | 1,014 | $ | (323 | ) $ | 395 | $ | 9,884 | $ | 149 | $ | — | |
| RIC Global Infrastructure Fund | | 8,287 | | 878 | | 4,313 | | 606 | | 226 | | 5,684 | | 377 | | 240 | |
| RIF Global Real Estate Securities | | | | | | | | | | | | | | | | | | | | |
| Fund | | 5,725 | | 3,317 | | 4,343 | | 434 | | (226 | ) | 4,907 | | 164 | | 90 | |
| RIC U. S. Defensive Equity Fund | | 5,652 | | 632 | | 1,048 | | 319 | | 96 | | 5,651 | | 152 | | 389 | |
| RIC U. S. Dynamic Equity Fund | | 20,007 | | 743 | | 19,564 | | 2,369 | | (1,366 | ) | 2,189 | | 354 | | 254 | |
| RIF U. S. Small Cap Equity Fund | | 17,444 | | 11,971 | | 15,020 | | 1,259 | | 947 | | 16,601 | | 369 | | 751 | |
| RIF U. S. Strategic Equity Fund | | 19,257 | | 10,295 | | 27,063 | | 6,071 | | (4,236 | ) | 4,324 | | 591 | | 750 | |
| RIC Global Opportunistic Credit | | | | | | | | | | | | | | | | | | | | |
| Fund | | 27,905 | | 1,533 | | 7,288 | | (108 | ) | 1,488 | | 23,530 | | 1,090 | | — | |
| RIC Unconstrained Total Return | | | | | | | | | | | | | | | | | | | | |
| Fund | | 11,279 | | 9,955 | | 502 | | (1 | ) | (14 | ) | 20,717 | | 409 | | — | |
| RIF Strategic Bond Fund | | 62,895 | | 14,553 | | 10,975 | | (246 | ) | 1,617 | | 67,844 | | 747 | | — | |
| RIC Emerging Markets Fund | | 19,254 | | 3,881 | | 5,216 | | 26 | | 6,024 | | 23,969 | | 300 | | — | |
| RIC Global Equity Fund | | 28,972 | | 29,694 | | 6,419 | | 346 | | 1,404 | | 53,997 | | 2,262 | | 4,184 | |
| |
| RIF International Fund Developed Markets | 28,008 | | 10,601 | | 5,546 | | 594 | | 4,257 | | 37,914 | | 900 | | 1,259 | |
| RIC Multi-Strategy Income Fund | | 11,300 | | 711 | | 689 | | 12 | | 612 | | 11,946 | | 482 | | 43 | |
| U. S. Cash Management Fund | | 1,844 | | 23,668 | | 25,502 | | — | | — | | 10 | | 20 | | — | |
| | $ | 277,119 | $ | 123,968 | $ | 134,502 | $ | 11,358 | $ | 11,224 | $ | | 289,167 | $ | 8,366 | $ | 7,960 | |
Federal Income Taxes
At December 31, 2017, the cost of investments and net unrealized appreciation (depreciation), undistributed ordinary income and
undistributed long-term capital gains for income tax purposes were as follows:
| | | | |
| Cost of Investments | $ | | 261,522,994 | |
| Unrealized Appreciation | $ | | 32,105,527 | |
| Unrealized Depreciation | | | (2,495,564 | ) |
| Net Unrealized Appreciation (Depreciation) | $ | | 29,609,963 | |
| Undistributed Ordinary Income | $ | | 838,674 | |
| Undistributed Long-Term Capital Gains | | | | |
| (Capital Loss Carryforward) | $ | | 8,082,978 | |
| Tax Composition of Distributions | | | | |
| Ordinary Income | $ | | 8,136,244 | |
| Long-Term Capital Gains | $ | | 12,048,254 | |
See accompanying notes which are an integral part of the financial statements.
46 Balanced Strategy Fund
Russell Investment Funds
Balanced Strategy Fund
Federal Income Taxes, continued
Net investment income and net realized gains (losses) in the financial statements may differ from taxable net investment income and
net realized gains (losses). Capital accounts within the financial statements are adjusted for permanent differences between book and
tax accounting. Book-tax differences may be due to foreign currency gains and losses, reclassifications of dividends and differences in
treatment of income from swaps. These adjustments have no impact on the net assets. At December 31, 2017, the Statement of Assets
and Liabilities have been adjusted by the following amounts (in thousands):
| | | |
| Undistributed net investment income | $ | (66 | ) |
| Accumulated net realized gain (loss) | | 68 | |
| Additional paid-in capital | | (2 | ) |
As permitted by tax regulations, the Fund intends to defer a net realized capital loss of $2,838,680 incurred from November 1, 2017 to
December 31, 2017, and treat it as arising in the fiscal year 2018.
See accompanying notes which are an integral part of the financial statements.
Balanced Strategy Fund 47
Russell Investment Funds
Growth Strategy Fund
Portfolio Management Discussion and Analysis — December 31, 2017 (Unaudited)

| | | | | | | |
| Growth Strategy Fund | | | | Russell 1000® Index** | | | |
| | | Total | | | | Total | |
| | | Return | | | | Return | |
| 1 Year | | 15.65 | % | 1 Year | | 21.69 | % |
| 5 Years | | 8.21 | %§ | 5 Years | | 15.71 | %§ |
| 10 Years | | 4.61 | %§ | 10 Years | | 8.59 | %§ |
| |
| | | | | Bloomberg Barclays U. S. Aggregate Bond Index*** | |
| | | | | | | Total | |
| | | | | | | Return | |
| | | | | 1 Year | | 3.54 | % |
| | | | | 5 Years | | 2.10 | %§ |
| | | | | 10 Years | | 4.01 | %§ |
| |
| | | | | Russell Developed ex-U. S. Large Cap® Index Net**** | |
| | | | | | | Total | |
| | | | | | | Return | |
| | | | | 1 Year | | 24.85 | % |
| | | | | 5 Years | | 7.80 | %§ |
| | | | | 10 Years | | 2.14 | %§ |
48 Growth Strategy Fund
Russell Investment Funds
Growth Strategy Fund
Portfolio Management Discussion and Analysis, continued — December 31, 2017
(Unaudited)
| |
| The Growth Strategy Fund (the “Fund”) is a fund of funds that | Within equities, overall global equity markets posted very strong |
| invests principally in other Russell Investment Funds (“RIF”) | returns, as the Russell Developed Large Cap® Index (Net) gained |
| and Russell Investment Company (“RIC”) mutual funds (the | 22.39%. Emerging markets were one of the top performing |
| “Underlying Funds”) . The Underlying Funds employ a multi- | segments of global equity markets over the period. The Fund’s |
| manager approach whereby portions of the Underlying Funds | strategic exposure to emerging markets proved beneficial over |
| are allocated to different money manager strategies. Underlying | the period as they rallied, boosted by lower interest rates and |
| Fund assets not allocated to money managers are managed by | improving economic growth. By contrast, non-U. S. developed |
| Russell Investment Management, LLC (“RIM”), the Fund’s | equities slightly lagged U. S. equities, as defensive and commodity |
| and Underlying Funds’ advisor. RIM, as the Underlying Funds’ | sectors, especially consumer staples, health care and energy, |
| advisor, may change the allocation of the Underlying Funds’ | weighed on non-U. S. equity returns. |
| assets among money managers at any time. An exemptive order | |
| from the Securities and Exchange Commission (“SEC”) permits | How did the investment strategies and techniques employed |
| RIM to engage or terminate a money manager in an Underlying | by the Fund and the Underlying Funds affect the Fund’s |
| Fund at any time, subject to approval by the Underlying Fund’s | performance? |
| Board, without a shareholder vote. Pursuant to the terms of the | The Fund is a fund of funds and its performance is based on RIM’s |
| exemptive order, an Underlying Fund is required to notify its | strategic asset allocations, the performance of the Underlying |
| shareholders within 90 days of when a money manager begins | Funds in which the Fund invests, and tactical changes in the |
| providing services. | Fund’s asset allocation throughout the year. In order to seek to |
| | achieve the Fund’s objective during the period, RIM’s strategic |
| What is the Fund’s investment objective? | asset allocation included investments in global equity, fixed |
| The Fund seeks to provide high long term capital appreciation, | income and alternative Underlying Funds. |
| and as a secondary objective, current income. | The Fund’s diverse asset allocation detracted from relative |
| How did the Fund perform relative to its benchmark for the | performance during the period. Non-traditional asset classes |
| fiscal year ended December 31, 2017? | such as high yield bonds returned 8.02%, as measured by |
| For the fiscal year ended December 31, 2017, the Fund gained | the ICE BofAML Global High Yield Index Hedged (USD), |
| 15.65%. This is compared to the Fund’s primary benchmark, | underperforming the Fund’s primary benchmark, the Russell |
| the Russell 1000® Index, which gained 21.69% during the same | 1000® Index. Non-U. S. developed equities and commodities |
| period. The Fund’s performance includes operating expenses, | delivered positive returns as measured by the Russell Developed |
| whereas index returns are unmanaged and do not include | ex-U. S. Large Cap® Index Net and Bloomberg Commodity Index |
| expenses of any kind. | Total Return, but underperformed relative to U. S. equities. |
| For the fiscal year ended December 31, 2017, the Morningstar® | Within the Fund’s fixed income portfolio, allocations to the RIF |
| Insurance Allocation – 70% to 85% Equity Category, a group of | Strategic Bond Fund and RIC Global Opportunistic Credit Fund |
| funds that Morningstar considers to have investment strategies | were positive in terms of absolute returns, but fell short relative |
| similar to those of the Fund, gained 16.21%. This result serves | to the strong U. S. equity market return as tracked by the Fund’s |
| as a peer comparison and is expressed net of operating expenses. | Russell 1000® Index benchmark. |
| | The equity portion of the Fund’s portfolio provided mixed results as |
| How did the market conditions described in the Market | compared to the Russell 1000® Index, though generally benefited |
| Summary report affect the Fund’s performance? | from the strong performance of global equity markets over the |
| The Fund seeks to achieve its objective by investing in Underlying | period. An allocation to the RIC U. S. Defensive Equity Fund was |
| Funds that provide exposure to a range of diversified investments, | a notable detractor as stock selection within the Underlying Fund |
| and most major asset classes invested in by the Underlying Funds | drove underperformance, especially through underperforming |
| produced positive absolute returns during the period. | holdings within the consumer staples and consumer discretionary |
| Within the Fund’s fixed income portfolio, exposure to high yield | sectors. The RIC U. S. Dynamic Equity Fund faced performance |
| debt was beneficial as it was among the best-performing segments | challenges as well, due to its underweight to the largest |
| of the fixed income market over the one-year period. Rising | capitalization stocks. The RIC Global Equity Fund contributed to |
| interest rates posed a challenge to other fixed income assets, as | excess returns, benefiting from strategic and tactical overweights |
| well as more interest rate sensitive real assets such as global real | to growth. |
| estate investment trusts (“REITs”) and global infrastructure. | The alternative assets portion of the Fund’s portfolio also |
| | contributed positively to absolute returns but failed to match the |
Growth Strategy Fund 49
Russell Investment Funds
Growth Strategy Fund
Portfolio Management Discussion and Analysis, continued — December 31, 2017
(Unaudited)
| |
| performance of U. S. equity markets. The rising rate environment | since 2015 by underweighting the RIC Global Opportunistic Credit |
| over the one-year period, that picked up towards end of third | Fund. During third quarter 2017, RIM moved to an underweight |
| quarter 2017, created headwinds for rate-sensitive asset classes | position in the RIC Global Infrastructure Fund as rising interest |
| such as listed REITs and listed infrastructure. | rates and higher valuations became more of a concern for the |
| | rate-sensitive sector. RIM maintained an underweight to the |
| Describe any changes to the Fund’s structure or allocation | RIF Global Real Estate Securities Fund over the period due to |
| to the Underlying Funds. | its rate-sensitive nature. During the fourth quarter of 2017, RIM |
| RIM has the discretion to vary the Fund’s actual allocation from | moved to further underweight listed infrastructure by trimming |
| the target strategic asset allocation by up to +/- 5% at the equity, | the Fund’s exposure to the RIC Global Infrastructure Fund due to |
| fixed income, multi-asset or alternative category level based on | its relatively expensive valuation. RIM also slightly trimmed the |
| RIM’s capital markets research. In addition to investing in the | underweight to REITs through increasing the Fund’s exposure to |
| Underlying Funds, RIM may seek to actively manage a Fund’s | the RIF Global Real Estate Securities Fund. RIM’s modifications |
| overall exposures by investing in derivatives that RIM believes | to the Fund’s asset allocation were additive during the period. |
| will achieve the desired risk/return profile for the Fund. RIM’s | |
| asset allocation modifications, implemented through both tactical | The views expressed in this report reflect those of the |
| changes to Underlying Fund allocations and derivatives-based | portfolio managers only through the end of the period |
| exposures, benefited the Fund’s performance relative to the | covered by the report. These views do not necessarily |
| Fund’s target strategic asset allocation. | represent the views of RIM, or any other person in RIM or |
| RIM tactically adapted the Fund’s asset allocation over the period | any other affiliated organization. These views are subject to |
| as market opportunities and risks evolved. RIM continued to | change at any time based upon market conditions or other |
| operate the Fund as a risk manager rather than risk taker. The Fund | events, and RIM disclaims any responsibility to update the |
| maintained an underweight position in U. S. equity by trimming its | views contained herein. These views should not be relied |
| exposure to the RIC U. S. Defensive Equity Fund relative to RIM’s | on as investment advice and, because investment decisions |
| long-term strategic weights. During the first quarter of 2017, as | for a Russell Investment Funds (“RIF”) Fund are based on |
| equity markets ran upwards and credit spreads compressed, RIM | numerous factors, should not be relied on as an indication |
| trimmed high yield exposure to an underweight for the first time | of investment decisions of any RIF Fund. |
* Assumes initial investment on January 1, 2008.
** The Russell 1000® Index includes the 1,000 largest companies in the Russell 3000® Index. The Russell 1000® Index represents the universe of stocks from
which most active money managers typically select. The Russell 1000® Index return reflects adjustments from income dividends and capital gain distributions
reinvested as of the ex-dividend dates.
*** The Bloomberg Barclays U.S. Aggregate Bond Index is an index, with income reinvested, generally representative of intermediate-term government bonds,
investment grade corporate debt securities and mortgage-backed securities.
**** The Russell Developed ex-U.S. Large Cap® Index Net is an index which offers investors access to the large-cap segment of the global equity market, excluding
companies assigned to the United States. It is constructed to provide a comprehensive and unbiased barometer for the large-cap segment and is completely
reconstituted annually to accurately reflect the changes in the market over time and is net of tax on dividends from foreign holdings.
§ Annualized.
The performance shown in this section does not reflect any Insurance Company Separate Account or Policy Charges. Performance is historical and assumes
reinvestment of all dividends and capital gains. Investment return and principal value will fluctuate so that an investor’s shares, when redeemed, may be worth more
or less than when purchased. Past performance is not indicative of future results. Additionally, the returns presented herein may differ from the performance reported
in the Financial Highlights as the returns herein are calculated in a manner consistent with standardized performance in accordance with Securities and Exchange
Commission rules, while the performance in the Financial Highlights has been calculated in accordance with U.S. Generally Accepted Accounting Principles (“U.S.
GAAP”).
50 Growth Strategy Fund
Russell Investment Funds
Growth Strategy Fund
Shareholder Expense Example — December 31, 2017 (Unaudited)
| | | | | | | |
| Fund Expenses | Please note that the expenses shown in the table are meant |
| The following disclosure provides important information | to highlight your ongoing costs only and do not reflect any |
| regarding the Fund’s Shareholder Expense Example | transactional costs. Therefore, the information under the heading |
| (“Example”) . | “Hypothetical Performance (5% return before expenses)” is |
| | useful in comparing ongoing costs only, and will not help you |
| Example | determine the relative total costs of owning different funds. In |
| As a shareholder of the Fund, you incur two types of costs: (1) | addition, if these transactional costs were included, your costs |
| transaction costs, and (2) ongoing costs, including advisory and | would have been higher. The fees and expenses shown in this |
| administrative fees and other Fund expenses. The Example is | section do not reflect any Insurance Company Separate Account |
| intended to help you understand your ongoing costs (in dollars) | Policy Charges. | | | | | | |
| of investing in the Fund and to compare these costs with the | | | | | | Hypothetical |
| ongoing costs of investing in other mutual funds. The Example | | | | | | Performance (5% |
| is based on an investment of $1,000 invested at the beginning of | | | | Actual | | return before |
| the period and held for the entire period indicated, which for this | | | Performance | | | expenses) |
| | Beginning Account Value | | | | | | |
| Fund is from July 1, 2017 to December 31, 2017. | July 1, 2017 | | $ | 1,000.00 | | $ | 1,000.00 |
| | Ending Account Value | | | | | | |
| Actual Expenses | December 31, 2017 | | $ | 1,071.60 | | $ | 1,024.45 |
| The information in the table under the heading “Actual | Expenses Paid During Period* | | $ | 0.78 | | $ | 0.77 |
| Performance” provides information about actual account values | | | | | | | |
| and actual expenses. You may use the information in this column, | * Expenses are equal to the Fund's annualized expense ratio of 0.15% |
| | (representing the six month period annualized), multiplied by the average |
| together with the amount you invested, to estimate the expenses | account value over the period, multiplied by 184/365 (to reflect the one-half |
| that you paid over the period. Simply divide your account value by | year period) . May reflect amounts waived and/or reimbursed. Without any |
| $1,000 (for example, an $8,600 account value divided by $1,000 | waivers and/or reimbursements, expenses would have been higher. |
| = 8.6), then multiply the result by the number in the first column | | | | | | | |
| in the row entitled “Expenses Paid During Period” to estimate | | | | | | | |
| the expenses you paid on your account during this period. | | | | | | | |
| |
| Hypothetical Example for Comparison Purposes | | | | | | | |
| The information in the table under the heading “Hypothetical | | | | | | | |
| Performance (5% return before expenses)” provides information | | | | | | | |
| about hypothetical account values and hypothetical expenses | | | | | | | |
| based on the Fund’s actual expense ratio and an assumed rate of | | | | | | | |
| return of 5% per year before expenses, which is not the Fund’s | | | | | | | |
| actual return. The hypothetical account values and expenses | | | | | | | |
| may not be used to estimate the actual ending account balance or | | | | | | | |
| expenses you paid for the period. You may use this information | | | | | | | |
| to compare the ongoing costs of investing in the Fund and other | | | | | | | |
| funds. To do so, compare this 5% hypothetical example with the | | | | | | | |
| 5% hypothetical examples that appear in the shareholder reports | | | | | | | |
| of other funds. | | | | | | | |
Growth Strategy Fund 51
Russell Investment Funds
Growth Strategy Fund
Schedule of Investments — December 31, 2017
| | | | | |
| Amounts in thousands (except share amounts) | | | | | |
| | | | | | Fair |
| | | | | | Value |
| | Shares | | $ |
| Investments in Affiliated Funds - 97.7% | | | | | |
| Alternative - 8.6% | | | | | |
| RIC Commodity Strategies Fund Class Y | | | 1,192,779 | | 6,835 |
| RIC Global Infrastructure Fund Class Y | | | 542,675 | | 6,214 |
| RIF Global Real Estate Securities Fund | | | 404,958 | | 5,997 |
| | | | | | 19,046 |
| |
| Domestic Equities - 29.0% | | | | | |
| RIC U. S. Defensive Equity Fund Class Y | | | 208,031 | | 10,693 |
| RIC U. S. Dynamic Equity Fund Class Y | | | 856,271 | | 7,843 |
| RIF U. S. Small Cap Equity Fund | | | 1,560,050 | | 25,585 |
| RIF U. S. Strategic Equity Fund | | | 1,070,748 | | 19,841 |
| | | | | | 63,962 |
| |
| Fixed Income - 18.9% | | | | | |
| RIC Global Opportunistic Credit Fund Class Y | | | 1,285,503 | | 12,662 |
| RIC Unconstrained Total Return Fund Class Y | | | 1,841,248 | | 18,247 |
| RIF Strategic Bond Fund | | | 1,054,790 | | 10,938 |
| | | | | | 41,847 |
| |
| International Equities - 41.2% | | | | | |
| RIC Emerging Markets Fund Class Y | | | 808,537 | | 17,109 |
| RIC Global Equity Fund Class Y | | | 3,244,511 | | 35,040 |
| RIF International Developed Markets Fund | | | 2,956,292 | | 38,786 |
| | | | | | 90,935 |
| |
| Total Investments in Affiliated Funds | | | | | |
| (cost $182,825) | | | | | 215,790 |
| |
| Options Purchased - 0.3% | | | | | |
| (Number of Contracts) | | | | | |
| S&P 500 Index | | | | | |
| Goldman Sachs May 2018 2,675.00 Call (80) | USD | | 21,400 | (ÿ) | 626 |
| Total Options Purchased | | | | | |
| (cost $528) | | | | | 626 |
| |
| Short-Term Investments - 0.0% | | | | | |
| U. S. Cash Management Fund(@) | | | 18,689 | (8) | 19 |
| Total Short-Term Investments | | | | | |
| (cost $19) | | | | | 19 |
| |
| Total Investments 98.0% | | | | | |
| (identified cost $183,372) | | | | | 216,435 |
| |
| Other Assets and Liabilities, Net - 2.0% | | | | | 4,400 |
| Net Assets - 100.0% | | | | | 220,835 |
See accompanying notes which are an integral part of the financial statements.
52 Growth Strategy Fund
Russell Investment Funds
Growth Strategy Fund
Schedule of Investments, continued — December 31, 2017
| | | | | | | | | |
| Futures Contracts | | | | | | | | | |
| |
| Amounts in thousands (except contract amounts) | | | | | | | | | |
| | | | | | | | | Value and | |
| | | | | | | | | Unrealized | |
| | | | | | | | | Appreciation | |
| | | Number of | | Notional | | Expiration | (Depreciation) | |
| | | Contracts | | Amount | | Date | $ | |
| Long Positions | | | | | | | | | |
| Amsterdam Index Futures | | 8 | | EUR | 871 | | 01/18 | (12 | ) |
| CAC40 Euro Index Futures | | 47 | | EUR | 2,496 | | 01/18 | (45 | ) |
| DAX Index Futures | | 6 | | EUR | 1,937 | | 03/18 | (42 | ) |
| EURO STOXX 50 Index Futures | | 44 | | EUR | 1,537 | | 03/18 | (45 | ) |
| FTSE/MIB Index Futures | | 5 | | EUR | 544 | | 03/18 | (28 | ) |
| IBEX 35 Index Futures | | 8 | | EUR | 802 | | 01/18 | (21 | ) |
| MSCI EAFE Mini Index Futures | | 15 | | USD | 1,534 | | 03/18 | 33 | |
| MSCI Emerging Markets Mini Index Futures | | 6 | | USD | 349 | | 03/18 | 15 | |
| OMXS 30 Index Futures | | 34 | | SEK | 5,352 | | 01/18 | (18 | ) |
| Russell 1000 E-Mini Index Futures | | 3 | | USD | 222 | | 03/18 | 2 | |
| United States 2 Year Treasury Note Futures | | 10 | | USD | 2,141 | | 03/18 | (4 | ) |
| United States 5 Year Treasury Note Futures | | 34 | | USD | 3,950 | | 03/18 | (19 | ) |
| United States 10 Year Treasury Note Futures | | 21 | | USD | 2,605 | | 03/18 | (16 | ) |
| United States Long Bond Futures | | 2 | | USD | 306 | | 03/18 | — | |
| Short Positions | | | | | | | | | |
| Dow U. S. Real Estate Index Futures | | 97 | | USD | 3,118 | | 03/18 | (7 | ) |
| FTSE 100 Index Futures | | 27 | | GBP | 2,062 | | 03/18 | (76 | ) |
| Russell 2000 E-Mini Index Futures | | 54 | | USD | 4,149 | | 03/18 | (42 | ) |
| S&P 500 E-Mini Index Futures | | 31 | | USD | 4,148 | | 03/18 | (37 | ) |
| S&P/TSX 60 Index Futures | | 13 | | CAD | 2,489 | | 03/18 | (7 | ) |
| SPI 200 Index Futures | | 14 | | AUD | 2,107 | | 03/18 | (6 | ) |
| TOPIX Index Futures | | 20 | | JPY | 363,400 | | 03/18 | (69 | ) |
| Total Value and Unrealized Appreciation (Depreciation) on Open Futures Contracts (å) | | | | | | | (444 | ) |
| | | | | | | | | |
| Foreign Currency Exchange Contracts | | | | | | | | | |
| Amounts in thousands | | | | | | | | | |
| | | | | | | | | Unrealized | |
| | | | | | | | | Appreciation | |
| | | Amount | | Amount | | (Depreciation) | |
| Counterparty | | Sold | | Bought | Settlement Date | $ | |
| Bank of America | USD | | 177 | CAD | | 227 | 03/22/18 | 4 | |
| Bank of America | AUD | | 1,893 | USD | | 1,423 | 03/22/18 | (54 | ) |
| Bank of America | CHF | | 388 | USD | | 393 | 03/22/18 | (7 | ) |
| Bank of America | EUR | | 2,462 | USD | | 2,922 | 03/22/18 | (46 | ) |
| Bank of America | GBP | | 977 | USD | | 1,315 | 03/22/18 | (8 | ) |
| Bank of America | HKD | | 893 | USD | | 115 | 03/22/18 | — | |
| Bank of America | JPY | | 54,489 | USD | | 486 | 03/22/18 | 1 | |
| Bank of America | MXN | | 760 | USD | | 39 | 03/22/18 | 1 | |
| Bank of America | SEK | | 620 | USD | | 74 | 03/22/18 | (2 | ) |
| Bank of America | SGD | | 55 | USD | | 41 | 03/22/18 | — | |
| Bank of America | ZAR | | 133 | USD | | 10 | 03/22/18 | (1 | ) |
| Commonwealth Bank of Australia | USD | | 177 | CAD | | 227 | 03/22/18 | 4 | |
| Commonwealth Bank of Australia | AUD | | 1,893 | USD | | 1,423 | 03/22/18 | (55 | ) |
| Commonwealth Bank of Australia | CHF | | 388 | USD | | 394 | 03/22/18 | (6 | ) |
| Commonwealth Bank of Australia | EUR | | 2,462 | USD | | 2,924 | 03/22/18 | (44 | ) |
| Commonwealth Bank of Australia | GBP | | 977 | USD | | 1,314 | 03/22/18 | (9 | ) |
| Commonwealth Bank of Australia | HKD | | 893 | USD | | 115 | 03/22/18 | — | |
| Commonwealth Bank of Australia | JPY | | 54,489 | USD | | 487 | 03/22/18 | 1 | |
| Commonwealth Bank of Australia | MXN | | 760 | USD | | 39 | 03/22/18 | 1 | |
| Commonwealth Bank of Australia | SEK | | 620 | USD | | 74 | 03/22/18 | (2 | ) |
See accompanying notes which are an integral part of the financial statements.
Growth Strategy Fund 53
Russell Investment Funds
Growth Strategy Fund
Schedule of Investments, continued — December 31, 2017
| | | | | | | | |
| Foreign Currency Exchange Contracts | | | | | | | | |
| Amounts in thousands | | | | | | | | |
| | | | | | | | Unrealized | |
| | | | | | | | Appreciation | |
| | | Amount | | Amount | | (Depreciation) | |
| Counterparty | | Sold | | Bought | Settlement Date | $ | |
| Commonwealth Bank of Australia | SGD | 55 | USD | | 41 | 03/22/18 | — | |
| Commonwealth Bank of Australia | ZAR | 133 | USD | | 10 | 03/22/18 | (1 | ) |
| State Street | USD | 177 | CAD | | 227 | 03/22/18 | 4 | |
| State Street | USD | 1,194 | CNY | | 7,940 | 03/22/18 | 19 | |
| State Street | USD | 45 | RUB | | 2,680 | 03/22/18 | 1 | |
| State Street | AUD | 1,893 | USD | | 1,422 | 03/22/18 | (54 | ) |
| State Street | CHF | 388 | USD | | 394 | 03/22/18 | (6 | ) |
| State Street | CNY | 4,560 | USD | | 683 | 03/22/18 | (14 | ) |
| State Street | EUR | 2,462 | USD | | 2,924 | 03/22/18 | (45 | ) |
| State Street | GBP | 977 | USD | | 1,313 | 03/22/18 | (10 | ) |
| State Street | HKD | 893 | USD | | 114 | 03/22/18 | — | |
| State Street | JPY | 54,489 | USD | | 486 | 03/22/18 | 1 | |
| State Street | KRW | 233,270 | USD | | 214 | 03/22/18 | (5 | ) |
| State Street | MXN | 760 | USD | | 39 | 03/22/18 | 1 | |
| State Street | SEK | 620 | USD | | 74 | 03/22/18 | (2 | ) |
| State Street | SGD | 55 | USD | | 41 | 03/22/18 | — | |
| State Street | TWD | 28,550 | USD | | 957 | 03/22/18 | (14 | ) |
| State Street | ZAR | 133 | USD | | 10 | 03/22/18 | (1 | ) |
| Total Unrealized Appreciation (Depreciation) on Open Foreign Currency Exchange Contracts | | | | | (348 | ) |
Total Return Swap Contracts
Amounts in thousands
| | | | | | | | | | | | | | | |
| | | | | | | | | | | Premiums | | Unrealized | | | |
| | | | | | | | | | | Paid | | Appreciation | | | |
| | | | | Notional | | | | | Termination | (Received) | | (Depreciation) | | Fair Value | |
| Underlying Reference Entity | Counterparty | Amount | | Terms | | Date | $ | | $ | | $ | |
| Short | | | | | | | | | | | | | | | |
| S&P 500 Total Return Index | | Goldman Sachs | USD 14,000 | 3 Month LIBOR + 0.700%(5) | | 03/16/18 | — | | (18 | ) | (18 | ) |
| Total Open Total Return Swap Contracts (å) | | | | | | | | — | | (18 | ) | (18 | ) |
| |
| |
| |
| |
| Credit Default Swap Contracts | | | | | | | | | | | | | |
| |
| Amounts in thousands | | | | | | | | | | | | | | |
| |
| Credit Indices | | | | | | | | | | | | | | | |
| | | | | | | | | | | Premiums | | Unrealized | | | |
| | | | | | | | Fund (Pays)/ | | Paid/ | | Appreciation | | | |
| | | | Purchase/Sell | | | Receives | Termination | (Received) | | (Depreciation) | | Fair Value | |
| Reference Entity | | Counterparty | Protection | Notional Amount | Fixed Rate | Date | $ | | $ | | $ | |
| CDX Emerging Markets | | | | | | | | | | | | | | | |
| Index | Bank of America | Purchase | USD | 2,231 | (1.000%)(2) | 12/20/22 | 93 | | (74 | ) | 19 | |
| CDX Investment Grade | | | | | | | | | | | | | | | |
| Index | Bank of America | Sell | USD | 17,700 | 1.000%(2) | 12/20/22 | 363 | | 61 | | 424 | |
| CDX NA High Yield Index | Bank of America | Purchase | USD | 6,900 | (5.000%)(2) | 12/20/22 | (520 | ) | (63 | ) | (583 | ) |
| Total Open Credit Indices Contracts (å) | | | | | | | | (64 | ) | (76 | ) | (140 | ) |
See accompanying notes which are an integral part of the financial statements.
54 Growth Strategy Fund
Russell Investment Funds
Growth Strategy Fund
Schedule of Investments, continued — December 31, 2017
| | | | | | | | | | | | | | | | | |
| Presentation of Portfolio Holdings | | | | | | | | | | | | | | | |
| Amounts in thousands | | | | | | | | | | | | | | | | | |
| | | | | | Fair Value | | | | | | | | | | |
| | | | | | | | | | | | Practical | | | | | | |
| Portfolio Summary | | Level 1 | | | Level 2 | | | Level 3 | Expedient (a) | | Total | | % of Net Assets | |
| Investments in Affiliated Funds | $ | 215,790 | | $ | — | | $ | | — | $ | — | $ | 215,790 | | | 97.7 | |
| Options Purchased | | 626 | | | — | | | | — | | — | | 626 | | | 0.3 | |
| Short-Term Investments | | — | | | — | | | | — | | 19 | | 19 | | | — * | |
| Total Investments | | 216,416 | | | — | | | | — | | 19 | | 216,435 | | | 98.0 | |
| Other Assets and Liabilities, Net | | | | | | | | | | | | | | | | 2.0 | |
| | | | | | | | | | | | | | | | | 100.0 | |
| Other Financial Instruments | | | | | | | | | | | | | | | | | |
| Assets | | | | | | | | | | | | | | | | | |
| Futures Contracts | | 50 | | | — | | | | — | | — | | 50 | | | — * | |
| Foreign Currency Exchange Contracts | | — | | | 38 | | | | — | | — | | 38 | | | — * | |
| Credit Default Swap Contracts | | — | | | 443 | | | | — | | — | | 443 | | | 0.2 | |
| ' | | | | | | | | | | | | | | | | | |
| Liabilities | | | | | | | | | | | | | | | | | |
| Futures Contracts | | (494 | ) | | — | | | | — | | — | | (494 | ) | | (0.2 | ) |
| Foreign Currency Exchange Contracts | | — | | | (386 | ) | | | — | | — | | (386 | ) | | (0.2 | ) |
| Total Return Swap Contracts | | — | | | (18 | ) | | | — | | — | | (18 | ) | | (—)* | |
| Credit Default Swap Contracts | | — | | | (583 | ) | | | — | | — | | (583 | ) | | (0.3 | ) |
| Total Other Financial Instruments** | $ | (444 | ) | $ | (506 | ) | $ | | — | $ | — | $ | (950 | ) | | | |
* Less than 0.05% of net assets.
** Futures and foreign currency exchange contract values reflect the unrealized appreciation (depreciation) on the investments.
(a) Certain investments that are measured at fair value using the net asset value per share (or its equivalent) practical expedient have not been classified
in the fair value levels. The fair value amounts presented in the table are intended to permit reconciliation to the amounts presented in the Schedule of
Investments.
For a description of the Levels, see note 2 in the Notes to Financial Statements.
For a disclosure on transfers between Levels 1, 2 and 3 during the period ended December 31, 2017, see note 2 in the Notes to
Financial Statements.
See accompanying notes which are an integral part of the financial statements.
Growth Strategy Fund 55
Russell Investment Funds
Growth Strategy Fund
Fair Value of Derivative Instruments — December 31, 2017
Amounts in thousands
| | | | | | | | | | | | | |
| | | | | | | | | Foreign | | | | |
| | | Equity | | Credit | | Currency | | Interest Rate | |
| Derivatives not accounted for as hedging instruments | Contracts | | Contracts | | Contracts | | Contracts | |
| |
| Location: Statement of Assets and Liabilities - Assets | | | | | | | | | | | | |
| Investments, at fair value* | | $ | 626 | | $ | — | | $ | — | | $ | — | |
| Unrealized appreciation on foreign currency exchange contracts | | — | | | — | | | 38 | | | — | |
| Variation margin on futures contracts** | | | 50 | | | — | | | — | | | — | |
| Credit default swap contracts, at fair value | | | — | | | 443 | | | — | | | — | |
| Total | | $ | 676 | | $ | 443 | | $ | 38 | | $ | — | |
| |
| |
| Location: Statement of Assets and Liabilities - Liabilities | | | | | | | | | | | | |
| Variation margin on futures contracts** | | $ | 455 | | $ | — | | $ | — | | $ | 39 | |
| Unrealized depreciation on foreign currency exchange contracts | | — | | | — | | | 386 | | | — | |
| Total return swap contracts, at fair value | | | 18 | | | — | | | — | | | — | |
| Credit default swap contracts, at fair value | | | — | | | 583 | | | — | | | — | |
| Total | | $ | 473 | | $ | 583 | | $ | 386 | | $ | 39 | |
| | | | | | | | | Foreign | | | | |
| | | Equity | | Credit | | Currency | | Interest Rate | |
| Derivatives not accounted for as hedging instruments | Contracts | | Contracts | | Contracts | | Contracts | |
| |
| Location: Statement of Operations - Net realized gain (loss) | | | | | | | | | | | | |
| Investments*** | | $ | 598 | | $ | — | | $ | — | | $ | — | |
| Futures contracts | | | (1,532 | ) | | — | | | — | | | 77 | |
| Options written | | | 240 | | | — | | | — | | | — | |
| Total return swap contracts | | | (1,527 | ) | | — | | | — | | | — | |
| Credit default swap contracts | | | — | | | 375 | | | — | | | — | |
| Foreign currency exchange contracts | | | — | | | — | | | (266 | ) | | — | |
| Total | | $ | (2,221 | ) | $ | 375 | | $ | (266 | ) | $ | 77 | |
| |
| |
| Location: Statement of Operations - Net change in unrealized appreciation | | | | | | | | | | | | |
| (depreciation) | | | | | | | | | | | | | |
| Investments**** | | $ | 407 | | $ | — | | $ | — | | $ | — | |
| Futures contracts | | | (589 | ) | | — | | | — | | | (39 | ) |
| Options written | | | (122 | ) | | — | | | — | | | — | |
| Total return swap contracts | | | 114 | | | — | | | — | | | — | |
| Credit default swap contracts | | | — | | | (316 | ) | | — | | | — | |
| Foreign currency exchange contracts | | | — | | | — | | | (599 | ) | | — | |
| Total | | $ | (190 | ) | $ | (316 | ) | $ | (599 | ) | $ | (39 | ) |
* Fair value of purchased options.
** Includes cumulative appreciation/depreciation of futures contracts as reported in the Schedule of Investments. Only variation margin is reported within the
Statement of Assets and Liabilities.
*** Includes net realized gain (loss) on purchased options as reported in the Statement of Operations.
**** Includes net change in unrealized appreciation/depreciation on purchased options as reported in the Schedule of Investments.
For further disclosure on derivatives see note 2 in the Notes to Financial Statements.
See accompanying notes which are an integral part of the financial statements.
56 Growth Strategy Fund
Russell Investment Funds
Growth Strategy Fund
Balance Sheet Offsetting of Financial and Derivative Instruments —
December 31, 2017
| | | | | | | | | |
| Amounts in thousands | | | | | | | | | |
| |
| Offsetting of Financial Assets and Derivative Assets | | | | | | | | |
| | | | | Gross | Net Amounts | |
| | | | | Amounts | | of Assets | |
| | | | Gross | Offset in the | Presented in | |
| | | Amounts of | Statement of | the Statement | |
| | | Recognized | Assets and | of Assets and | |
| Description | Location: Statement of Assets and Liabilities - Assets | | Assets | Liabilities | | Liabilities | |
| Options Purchased Contracts | Investments, at fair value | $ | 626 | | $ | — $ | 626 | |
| Foreign Currency Exchange Contracts | Unrealized appreciation on foreign currency exchange contracts | | 38 | | | — | 38 | |
| Futures Contracts | Variation margin on futures contracts | | 76 | | | — | 76 | |
| Credit Default Swap Contracts | Credit default swap contracts, at fair value | | 443 | | | — | 443 | |
| Total Financial and Derivative Assets | | | 1,183 | | | — | 1,183 | |
| Financial and Derivative Assets not subject to a netting agreement | | (1,145 | ) | | — | (1,145 | ) |
| Total Financial and Derivative Assets subject to a netting agreement | $ | 38 | | $ | — $ | 38 | |
| | | | | | | | | |
| Financial Assets, Derivative Assets, and Collateral Held by Counterparty | | | | | | | | |
| | | | Gross Amounts Not Offset in | |
| | | | the Statement of Assets and | |
| | | | | | Liabilities | | | |
| |
| |
| | Net Amounts | | | | | | | |
| | of Assets | | | | | | | |
| | Presented in | | | | | | | |
| | the Statement | Financial and | | | | |
| | of Assets and | Derivative | Collateral | | |
| Counterparty | Liabilities | Instruments | Received^ | Net Amount |
| Bank of America | $ | 6 | | $ | 6 | | $ | — | $ | — |
| Commonwealth Bank of Australia | | 6 | | | 6 | | | — | | — |
| State Street | | 26 | | | 26 | | | — | | — |
| Total | $ | 38 | | $ | 38 | | $ | — | $ | — |
See accompanying notes which are an integral part of the financial statements.
Growth Strategy Fund 57
Russell Investment Funds
Growth Strategy Fund
Balance Sheet Offsetting of Financial and Derivative Instruments, continued —
December 31, 2017
| | | | | | | | | |
| Amounts in thousands | | | | | | | | | |
| |
| Offsetting of Financial Liabilities and Derivative Liabilities | | | | | | | | |
| | | | | Gross | Net Amounts | |
| | | | | Amounts | of Liabilities | |
| | | | Gross | Offset in the | Presented in | |
| | | Amounts of | Statement of | the Statement | |
| | | Recognized | Assets and | of Assets and | |
| Description | Location: Statement of Assets and Liabilities - Liabilities | Liabilities | Liabilities | | Liabilities | |
| Futures Contracts | Variation margin on futures contracts | $ | 85 | | $ | — $ | 85 | |
| Foreign Currency Exchange Contracts | Unrealized depreciation on foreign currency exchange contracts | | 386 | | | — | 386 | |
| Total Return Swap Contracts | Total return swap contracts, at fair value | | 18 | | | — | 18 | |
| Credit Default Swap Contracts | Credit default swap contracts, at fair value | | 583 | | | — | 583 | |
| Total Financial and Derivative Liabilities | | | 1,072 | | | — | 1,072 | |
| Financial and Derivative Liabilities not subject to a netting agreement | | (668 | ) | | — | (668 | ) |
| Total Financial and Derivative Liabilities subject to a netting agreement | $ | 404 | | $ | — $ | 404 | |
| | | | | | | | | |
| Financial Liabilities, Derivative Liabilities, and Collateral Pledged by Counterparty | | | | | | | |
| | | | Gross Amounts Not Offset in | |
| | | | the Statement of Assets and | |
| | | | | | Liabilities | | | |
| |
| |
| | Net Amounts | | | | | | | |
| | of Liabilities | | | | | | | |
| | Presented in | | | | | | | |
| | the Statement | Financial and | | | | |
| | of Assets and | Derivative | Collateral | | |
| Counterparty | | Liabilities | Instruments | Pledged^ | Net Amount |
| Bank of America | $ | 118 | | $ | 6 | $ | — | $ | 112 |
| Commonwealth Bank of Australia | | 117 | | | 6 | | — | | 111 |
| Goldman Sachs | | 18 | | | — | | — | | 18 |
| State Street | | 151 | | | 26 | | — | | 125 |
| Total | $ | 404 | | $ | 38 | $ | — | $ | 366 |
^ Collateral received or pledged amounts may not reconcile to those disclosed in the Statement of Assets and Liabilities due to the inclusion of off-Balance
Sheet collateral and adjustments made to exclude overcollateralization.
For further disclosure on derivatives and counterparty risk see note 2 in the Notes to Financial Statements.
See accompanying notes which are an integral part of the financial statements.
58 Growth Strategy Fund
Russell Investment Funds
Growth Strategy Fund
Statement of Assets and Liabilities — December 31, 2017
| | |
| Amounts in thousands | | |
| Assets | | |
| Investments, at identified cost | $ | 183,372 |
| Investments, at fair value(>) | | 216,435 |
| Cash | | 2,150 |
| Cash (restricted)(a)(b)(c) | | 2,831 |
| Unrealized appreciation on foreign currency exchange contracts | | 38 |
| Receivables: | | |
| Investments sold | | 22 |
| Variation margin on futures contracts | | 76 |
| Credit default swap contracts, at fair value(+) | | 443 |
| Total assets | | 221,995 |
| |
| Liabilities | | |
| Payables: | | |
| Fund shares redeemed | | 21 |
| Accrued fees to affiliates | | 11 |
| Other accrued expenses | | 56 |
| Variation margin on futures contracts | | 85 |
| Unrealized depreciation on foreign currency exchange contracts | | 386 |
| Total return swap contracts, at fair value(8) | | 18 |
| Credit default swap contracts, at fair value(+) | | 583 |
| Total liabilities | | 1,160 |
| |
| Net Assets | $ | 220,835 |
See accompanying notes which are an integral part of the financial statements.
Growth Strategy Fund 59
Russell Investment Funds
Growth Strategy Fund
Statement of Assets and Liabilities, continued — December 31, 2017
| | | |
| Amounts in thousands | | | |
| Net Assets Consist of: | | | |
| Undistributed (overdistributed) net investment income | $ | 406 | |
| Accumulated net realized gain (loss) | | 2,739 | |
| Unrealized appreciation (depreciation) on: | | | |
| Investments | | 98 | |
| Investments in affiliated funds | | 32,965 | |
| Futures contracts | | (444 | ) |
| Foreign currency exchange contracts | | (348 | ) |
| Total return swap contracts | | (18 | ) |
| Credit default swap contracts | | (76 | ) |
| Shares of beneficial interest | | 211 | |
| Additional paid-in capital | | 185,302 | |
| Net Assets | $ | 220,835 | |
| |
| Net Asset Value, offering and redemption price per share: | | | |
| Net asset value per share: (#) | $ | 10.46 | |
| Net assets | $ | 220,834,873 | |
| Shares outstanding ($. 01 par value) | | 21,105,343 | |
| Amounts in thousands | | | |
| (+) Credit default swap contracts - premiums paid (received) | $ | (64 | ) |
| (>) Investments in affiliated funds | $ | 215,809 | |
| (8) Total return swap contracts - premiums paid (received) | $ | — | |
| |
| (a) Cash Collateral for Futures | $ | 1,820 | |
| (b) Cash Collateral for Swaps | $ | 680 | |
| (c) Cash Collateral for Options | $ | 331 | |
| (#) Net asset value per share equals net assets divided by shares of beneficial interest outstanding. | | | |
See accompanying notes which are an integral part of the financial statements.
60 Growth Strategy Fund
Russell Investment Funds
Growth Strategy Fund
Statement of Operations — For the Period Ended December 31, 2017
| | | |
| Amounts in thousands | | | |
| Investment Income | | | |
| Income distributions from affiliated funds | $ | 7,453 | |
| |
| Expenses | | | |
| Advisory fees | | 425 | |
| Administrative fees | | 90 | |
| Custodian fees | | 41 | |
| Transfer agent fees | | 9 | |
| Professional fees | | 50 | |
| Trustees’ fees | | 6 | |
| Printing fees | | 42 | |
| Miscellaneous | | 10 | |
| Expenses before reductions | | 673 | |
| Expense reductions | | (375 | ) |
| Net expenses | | 298 | |
| Net investment income (loss) | | 7,155 | |
| |
| Net Realized and Unrealized Gain (Loss) | | | |
| Net realized gain (loss) on: | | | |
| Investments | | 598 | |
| Investments in affiliated funds | | 2,912 | |
| Futures contracts | | (1,455 | ) |
| Options written | | 240 | |
| Foreign currency exchange contracts | | (266 | ) |
| Total return swap contracts | | (1,527 | ) |
| Credit default swap contracts | | 375 | |
| Foreign currency-related transactions | | 5 | |
| Capital gain distributions from affiliated funds | | 8,623 | |
| Net realized gain (loss) | | 9,505 | |
| Net change in unrealized appreciation (depreciation) on: | | | |
| Investments | | 407 | |
| Investments in affiliated funds | | 15,326 | |
| Futures contracts | | (628 | ) |
| Options written | | (122 | ) |
| Foreign currency exchange contracts | | (599 | ) |
| Total return swap contracts | | 114 | |
| Credit default swap contracts | | (316 | ) |
| Net change in unrealized appreciation (depreciation) | | 14,182 | |
| Net realized and unrealized gain (loss) | | 23,687 | |
| Net Increase (Decrease) in Net Assets from Operations | $ | 30,842 | |
See accompanying notes which are an integral part of the financial statements.
Growth Strategy Fund 61
Russell Investment Funds
Growth Strategy Fund
Statements of Changes in Net Assets
| | | | | | |
| | For the Periods Ended December 31, | |
| Amounts in thousands | | 2017 | | | 2016 | |
| Increase (Decrease) in Net Assets | | | | | | |
| Operations | | | | | | |
| Net investment income (loss) | $ | 7,155 | | $ | 4,270 | |
| Net realized gain (loss) | | 9,505 | | | 5,873 | |
| Net change in unrealized appreciation (depreciation) | | 14,182 | | | 8,563 | |
| Net increase (decrease) in net assets from operations | | 30,842 | | | 18,706 | |
| |
| Distributions | | | | | | |
| From net investment income | | (6,529 | ) | | (5,792 | ) |
| From net realized gain | | (4,634 | ) | | (11 | ) |
| Net decrease in net assets from distributions | | (11,163 | ) | | (5,803 | ) |
| |
| Share Transactions* | | | | | | |
| Net increase (decrease) in net assets from share transactions | | (4,788 | ) | | (7,075 | ) |
| Total Net Increase (Decrease) in Net Assets | | 14,891 | | | 5,828 | |
| |
| Net Assets | | | | | | |
| Beginning of period | | 205,944 | | | 200,116 | |
| End of period | $ | 220,835 | | $ | 205,944 | |
| Undistributed (overdistributed) net investment income included in net assets | $ | 406 | | $ | (85 | ) |
* Share transaction amounts (in thousands) for the periods ended December 31, 2017 and December 31, 2016 were as follows:
| | | | | | | | | | | | |
| | | 2017 | | | | 2016 | | |
| | | Shares | | | Dollars | | | Shares | | | Dollars | |
| |
| Proceeds from shares sold | | 755 | | $ | 7,645 | | | 1,288 | | $ | 11,888 | |
| Proceeds from reinvestment of distributions | | 1,099 | | | 11,163 | | | 617 | | | 5,803 | |
| Payments for shares redeemed | | (2,354 | ) | | (23,596 | ) | | (2,694 | ) | | (24,766 | ) |
| Total increase (decrease) | | (500 | ) | $ | (4,788 | ) | | (789 | ) | $ | (7,075 | ) |
See accompanying notes which are an integral part of the financial statements.
62 Growth Strategy Fund
(This page intentionally left blank)
Russell Investment Funds
Growth Strategy Fund
Financial Highlights — For the Periods Ended
For a Share Outstanding Throughout Each Period.
| | | | | | | | | | | | | | | | | |
| | | | | $ | | | | | | | | | | | | | |
| | | $ | | Net | | | $ | | | $ | | | $ | | | $ | |
| | Net Asset Value, | | Investment | | Net Realized | | | Total from | | | Distributions | | | Distributions | |
| | Beginning of | | Income (Loss) | | and Unrealized | | | Investment | | | from Net | | | from Net | |
| | | Period | | (a)(b)(d) | | Gain (Loss) | | | Operations | | | Investment Income | | | Realized Gain | |
| December 31, 2017 | | 9.53 | | . 34 | | 1.13 | | | 1.47 | | | (. 32 | ) | | (. 22 | ) |
| December 31, 2016 | | 8.94 | | . 20 | | | . 66 | | | . 86 | | | (. 27 | ) | | —(f) | |
| December 31, 2015 | | 10.07 | | . 17 | | | (. 48 | ) | | (. 31 | ) | | (. 18 | ) | | (. 64 | ) |
| December 31, 2014 | | 10.23 | | . 31 | | | . 07 | | | . 38 | | | (. 30 | ) | | (. 24 | ) |
| December 31, 2013 | | 8.97 | | . 22 | | 1.26 | | | 1.48 | | | (. 22 | ) | | — | |
| | | | | | | | | | | | | | | | | | |
See accompanying notes which are an integral part of the financial statements.
64 Growth Strategy Fund
| | | | | | | | | | | | | | | | | |
| | | | | | | | | | | | | % | | % | | % | |
| | | | | $ | | | | | $ | | | Ratio of Expenses | | Ratio of Expenses | Ratio of Net | |
| | | | | Net Asset Value, | | % | | | Net Assets, | | | to Average | | to Average | Investment Income | % |
| | $ | | | End of | | Total | | | End of Period | | | Net Assets, | | Net Assets, | to Average | Portfolio |
| Total Distributions | | | Period | | Return(e) | | | (000 | ) | | Gross(c) | | Net(c)(d) | Net Assets(b)(d) | Turnover Rate |
| (. 54 | ) | | 10.46 | | 15.65 | | | 220,835 | | | . 32 | | . 14 | | 3.37 | 29 |
| (. 27 | ) | | 9.53 | | 9.73 | | | 205,944 | | | . 30 | | . 12 | | 2.14 | 18 |
| (. 82 | ) | | 8.94 | | (3.31 | ) | | 200,116 | | | . 30 | | . 11 | | 1.78 | 23 |
| (. 54 | ) | | 10.07 | | 3.76 | | | 208,321 | | | . 32 | | . 10 | | 2.97 | 20 |
| (. 22 | ) | | 10.23 | | 16.56 | | | 189,956 | | | . 32 | | . 10 | | 2.29 | 12 |
See accompanying notes which are an integral part of the financial statements.
Growth Strategy Fund 65
Russell Investment Funds
Growth Strategy Fund
Related Party Transactions, Fees and Expenses
| | |
| Accrued fees payable to affiliates for the period ended December 31, 2017 were as follows: |
| Advisory fees | $ | 1,577 |
| Administration fees | | 7,940 |
| Transfer agent fees | | 822 |
| Trustee fees | | 459 |
| | $ | 10,798 |
Transactions (amounts in thousands) during the period ended December 31, 2017 with Underlying Funds which are, or were, an
affiliated company are as follows:
| | | | | | | | | | | | | | | | | | | | | |
| | Fair Value, | | | | | | | | | Change in | | | | | | | | | |
| | Beginning of | | | | | Realized Gain | | Unrealized | Fair Value, End | | Income | Capital Gains | |
| | | Period | Purchases | | Sales | | (Loss) | | Gain (Loss) | | of Period | | | Distributions | | Distributions | |
| RIC Commodity Strategies Fund | $ | 6,252 | $ | 1,248 | $ | 728 | $ | (166) | $ | | 229 | $ | 6,835 | $ | 103 | $ | — | |
| RIC Global Infrastructure Fund | | 5,973 | | 884 | | 1,054 | | 75 | | 336 | | 6,214 | | 377 | | 264 | |
| RIF Global Real Estate Securities | | | | | | | | | | | | | | | | | | | | | |
| Fund | | 5,972 | | 591 | | 900 | | 105 | | 229 | | 5,997 | | 210 | | 110 | |
| RIC U. S. Defensive Equity Fund | | 10,154 | | 1,169 | | 1,372 | | 240 | | 502 | | 10,693 | | 286 | | 734 | |
| RIC U. S. Dynamic Equity Fund | | 16,453 | | 2,335 | | 10,807 | | 977 | | (1,115 | ) | 7,843 | | 1,219 | | 906 | |
| RIF U. S. Small Cap Equity Fund | | 19,276 | | 6,803 | | 2,269 | | 80 | | 1,695 | | 25,585 | | 546 | | 1,162 | |
| RIF U. S. Strategic Equity Fund | | 23,283 | | 9,137 | | 14,920 | | 1,341 | | 1,000 | | 19,841 | | 1,016 | | 1,450 | |
| RIC Global Opportunistic Credit | | | | | | | | | | | | | | | | | | | | | |
| Fund | | 16,111 | | 1,030 | | 5,256 | | (87 | ) | 864 | | 12,662 | | 591 | | — | |
| RIC Unconstrained Total Return | | | | | | | | | | | | | | | | | | | | | |
| Fund | | 8,239 | | 10,585 | | 554 | | (3 | ) | (20 | ) | 18,247 | | 357 | | — | |
| RIF Strategic Bond Fund | | 19,597 | | 1,012 | | 9,937 | | (285 | ) | 551 | | 10,938 | | 143 | | — | |
| RIC Emerging Markets Fund | | 17,881 | | 666 | | 6,769 | | 57 | | 5,274 | | 17,109 | | 215 | | — | |
| RIC Global Equity Fund | | 25,207 | | 12,046 | | 4,106 | | 219 | | 1,674 | | 35,040 | | 1,477 | | 2,709 | |
| |
| RIF International Fund Developed Markets | 26,764 | | 12,338 | | 4,782 | | 359 | | 4,107 | | 38,786 | | 902 | | 1,288 | |
| U. S. Cash Management Fund | | 1,371 | | 13,366 | | 14,718 | | — | | — | | 19 | | 11 | | — | |
| | $ | 202,533 | $ | 73,210 | $ | 78,172 | $ | 2,912 | $ | 15,326 | $ | | 215,809 | $ | 7,453 | $ | 8,623 | |
Federal Income Taxes
At December 31, 2017, the cost of investments and net unrealized appreciation (depreciation), undistributed ordinary income and
undistributed long-term capital gains for income tax purposes were as follows:
| | | | |
| Cost of Investments | $ | | 185,996,040 | |
| Unrealized Appreciation | $ | | 33,496,345 | |
| Unrealized Depreciation | | | (3,509,693 | ) |
| Net Unrealized Appreciation (Depreciation) | $ | | 29,986,652 | |
| Undistributed Ordinary Income | $ | | 36,485 | |
| Undistributed Long-Term Capital Gains | | | | |
| (Capital Loss Carryforward) | $ | | 8,297,006 | |
| Tax Composition of Distributions | | | | |
| Ordinary Income | $ | | 7,231,959 | |
| Long-Term Capital Gains | $ | | 3,930,654 | |
Net investment income and net realized gains (losses) in the financial statements may differ from taxable net investment income and
net realized gains (losses). Capital accounts within the financial statements are adjusted for permanent differences between book and
tax accounting. Book-tax differences may be due to foreign currency gains and losses, reclassifications of dividends and differences in
treatment of income from swaps. These adjustments have no impact on the net assets. At December 31, 2017, the Statement of Assets
and Liabilities have been adjusted by the following amounts (in thousands):
See accompanying notes which are an integral part of the financial statements.
66 Growth Strategy Fund
Russell Investment Funds
Growth Strategy Fund
Federal Income Taxes, continued
| | | |
| Undistributed net investment income | $ | (135 | ) |
| Accumulated net realized gain (loss) | | 136 | |
| Additional paid-in capital | | (1 | ) |
As permitted by tax regulations, the Fund intends to defer a net realized capital loss of $1,445, 500 incurred from November
1, 2017 to December 31, 2017 and treat it as arising in the fiscal year 2018 .
See accompanying notes which are an integral part of the financial statements.
Growth Strategy Fund 67
Russell Investment Funds
Equity Growth Strategy Fund
Portfolio Management Discussion and Analysis — December 31, 2017 (Unaudited)

| | | | | | | |
| Equity Growth Strategy Fund | | | | Russell 1000® Index** | | | |
| | | Total | | | | Total | |
| | | Return | | | | Return | |
| 1 Year | | 17.55 | % | 1 Year | | 21.69 | % |
| 5 Years | | 9.20 | %§ | 5 Years | | 15.71 | %§ |
| 10 Years | | 4.16 | %§ | 10 Years | | 8.59 | %§ |
| |
| | | | | Russell Developed ex-U. S. Large Cap® Index Net*** | |
| | | | | | | Total | |
| | | | | | | Return | |
| | | | | 1 Year | | 24.85 | % |
| | | | | 5 Years | | 7.80 | %§ |
| | | | | 10 Years | | 2.14 | %§ |
68 Equity Growth Strategy Fund
Russell Investment Funds
Equity Growth Strategy Fund
Portfolio Management Discussion and Analysis, continued — December 31, 2017
(Unaudited)
| |
| The Equity Growth Strategy Fund (the “Fund”) is a fund of | 22.39%. Emerging markets were one of the top performing |
| funds that invests principally in other Russell Investment Funds | segments of global equity markets over the period. The Fund’s |
| (“RIF”) and Russell Investment Company (“RIC”) mutual funds | strategic exposure to emerging markets proved beneficial over |
| (the “Underlying Funds”) . The Underlying Funds employ a multi- | the period as they rallied, boosted by lower interest rates and |
| manager approach whereby portions of the Underlying Funds | improving economic growth. By contrast, non-U. S. developed |
| are allocated to different money manager strategies. Underlying | equities slightly lagged U. S. equities, as defensive and commodity |
| Fund assets not allocated to money managers are managed by | sectors, especially consumer staples, health care and energy, |
| Russell Investment Management, LLC (“RIM”), the Fund’s | weighed on non-U. S. equity returns. |
| and Underlying Funds’ advisor. RIM, as the Underlying Funds’ | |
| advisor, may change the allocation of the Underlying Funds’ | How did the investment strategies and techniques employed |
| assets among money managers at any time. An exemptive order | by the Fund and the Underlying Funds affect the Fund’s |
| from the Securities and Exchange Commission (“SEC”) permits | performance? |
| RIM to engage or terminate a money manager in an Underlying | The Fund is a fund of funds and its performance is based on RIM’s |
| Fund at any time, subject to approval by the Underlying Fund’s | strategic asset allocations, the performance of the Underlying |
| Board, without a shareholder vote. Pursuant to the terms of the | Funds in which the Fund invests, and tactical changes in the |
| exemptive order, an Underlying Fund is required to notify its | Fund’s asset allocation throughout the year. In order to seek to |
| shareholders within 90 days of when a money manager begins | achieve the Fund’s objective during the period, RIM’s strategic |
| providing services. | asset allocation included investments in global equity, fixed |
| | income and alternative Underlying Funds. |
| What is the Fund’s investment objective? | |
| The Fund seeks to provide high long term capital appreciation. | The Fund’s diverse asset allocation detracted from relative |
| | performance during the period. Non-traditional asset classes |
| How did the Fund perform relative to its benchmark for the | such as high yield bonds returned 8.02%, as measured by |
| fiscal year ended December 31, 2017? | the ICE BofAML Global High Yield Index Hedged (USD), |
| For the fiscal year ended December 31, 2017, the Fund gained | underperforming the Fund’s primary benchmark, the Russell |
| 17.55%. This is compared to the Fund’s primary benchmark, | 1000® Index. Non-U. S. developed equities and commodities |
| the Russell 1000® Index, which gained 21.69% during the same | delivered positive returns as measured by the Russell Developed |
| period. The Fund’s performance includes operating expenses, | ex-U. S. Large Cap® Index Net and Bloomberg Commodity Index |
| whereas index returns are unmanaged and do not include | Total Return, but underperformed relative to U. S. equities. |
| expenses of any kind. | Within the Fund’s fixed income portfolio, an allocation to the |
| For the fiscal year ended December 31, 2017, the Morningstar® | RIC Global Opportunistic Credit Fund was positive in terms of |
| Insurance Allocation – 70 to 85% Equity Category, a group of | absolute returns, but fell short relative to the strong U. S. equity |
| funds that Morningstar considers to have investment strategies | market return as tracked by the Fund’s Russell 1000® Index |
| similar to those of the Fund, gained 16.21%. This result serves | benchmark. |
| as a peer comparison and is expressed net of operating expenses. | The equity portion of the Fund’s portfolio provided mixed results as |
| | compared to the Russell 1000® Index, though generally benefited |
| How did the market conditions described in the Market | from the strong performance of global equity markets over the |
| Summary report affect the Fund’s performance? | period. An allocation to the RIC U. S. Defensive Equity Fund was |
| The Fund seeks to achieve its objective by investing in Underlying | a notable detractor as stock selection within the Underlying Fund |
| Funds that provide exposure to a range of diversified investments, | drove underperformance, especially through underperforming |
| and most major asset classes invested in by the Underlying Funds | holdings within the consumer staples and consumer discretionary |
| produced positive absolute returns during the period. | sectors. The RIC U. S. Dynamic Equity Fund faced performance |
| Within the Fund’s fixed income portfolio, exposure to high yield | challenges as well, due to its underweight to the largest |
| debt was beneficial as it was among the best-performing segments | capitalization stocks. The RIC Global Equity Fund contributed to |
| of the fixed income market over the one-year period. Rising | excess returns, benefiting from strategic and tactical overweights |
| interest rates posed a challenge to other fixed income assets, as | to growth. |
| well as more interest rate sensitive real assets such as global real | The alternative assets portion of the Fund’s portfolio also |
| estate investment trusts (“REITs”) and global infrastructure. | contributed positively to absolute returns but failed to match the |
| Within equities, overall global equity markets posted very strong | performance of U. S. equity markets. The rising rate environment |
| returns, as the Russell Developed Large Cap® Index (Net) gained | over the one-year period, that picked up towards end of third |
Equity Growth Strategy Fund 69
Russell Investment Funds
Equity Growth Strategy Fund
Portfolio Management Discussion and Analysis, continued — December 31, 2017
(Unaudited)
| |
| quarter 2017, created headwinds for rate-sensitive asset classes | Fund. During third quarter 2017, RIM moved to an underweight |
| such as listed REITs and listed infrastructure. | position in the RIC Global Infrastructure Fund as rising interest |
| | rates and higher valuations became more of a concern for the |
| Describe any changes to the Fund’s structure or allocation | rate-sensitive sector. RIM maintained an underweight to the |
| to the Underlying Funds. | RIF Global Real Estate Securities Fund over the period due to |
| RIM has the discretion to vary the Fund’s actual allocation from | its rate-sensitive nature. During the fourth quarter of 2017, RIM |
| the target strategic asset allocation by up to +/- 5% at the equity, | moved to further underweight listed infrastructure by trimming |
| fixed income, multi-asset or alternative category level based on | the Fund’s exposure to the RIC Global Infrastructure Fund due to |
| RIM’s capital markets research. In addition to investing in the | its relatively expensive valuation. RIM also slightly trimmed the |
| Underlying Funds, RIM may seek to actively manage a Fund’s | underweight to REITs through increasing the Fund’s exposure to |
| overall exposures by investing in derivatives that RIM believes | the RIF Global Real Estate Securities Fund. RIM’s modifications |
| will achieve the desired risk/return profile for the Fund. RIM’s | to the Fund’s asset allocation were additive during the period. |
| asset allocation modifications, implemented through both tactical | |
| changes to Underlying Fund allocations and derivatives-based | The views expressed in this report reflect those of the |
| exposures, benefited the Fund’s performance relative to the | portfolio managers only through the end of the period |
| Fund’s target strategic asset allocation. | covered by the report. These views do not necessarily |
| RIM tactically adapted the Fund’s asset allocation over the period | represent the views of RIM, or any other person in RIM or |
| as market opportunities and risks evolved. RIM continued to | any other affiliated organization. These views are subject to |
| operate the Fund as a risk manager rather than risk taker. The Fund | change at any time based upon market conditions or other |
| maintained an underweight position in U. S. equity by trimming its | events, and RIM disclaims any responsibility to update the |
| exposure to the RIC U. S. Defensive Equity Fund relative to RIM’s | views contained herein. These views should not be relied |
| long-term strategic weights. During the first quarter of 2017, as | on as investment advice and, because investment decisions |
| equity markets ran upwards and credit spreads compressed, RIM | for a Russell Investment Funds (“RIF”) Fund are based on |
| trimmed high yield exposure to an underweight for the first time | numerous factors, should not be relied on as an indication |
| since 2015 by underweighting the RIC Global Opportunistic Credit | of investment decisions of any RIF Fund. |
* Assumes initial investment on January 1, 2008.
** The Russell 1000® Index includes the 1,000 largest companies in the Russell 3000® Index. The Russell 1000® Index represents the universe of stocks from
which most active money managers typically select. The Russell 1000® Index return reflects adjustments from income dividends and capital gain distributions
reinvested as of the ex-dividend dates.
*** The Russell Developed ex-U.S. Large Cap® Index Net is an index which offers investors access to the large-cap segment of the global equity market, excluding
companies assigned to the United States. It is constructed to provide a comprehensive and unbiased barometer for the large-cap segment and is completely
reconstituted annually to accurately reflect the changes in the market over time and is net of tax on dividends from foreign holdings.
§ Annualized.
The performance shown in this section does not reflect any Insurance Company Separate Account or Policy Charges. Performance is historical and assumes
reinvestment of all dividends and capital gains. Investment return and principal value will fluctuate so that an investor’s shares, when redeemed, may be worth more
or less than when purchased. Past performance is not indicative of future results. Additionally, the returns presented herein may differ from the performance reported
in the Financial Highlights as the returns herein are calculated in a manner consistent with standardized performance in accordance with Securities and Exchange
Commission rules, while the performance in the Financial Highlights has been calculated in accordance with U.S. Generally Accepted Accounting Principles (“U.S.
GAAP”).
70 Equity Growth Strategy Fund
Russell Investment Funds
Equity Growth Strategy Fund
Shareholder Expense Example — December 31, 2017 (Unaudited)
| | | | | | | |
| Fund Expenses | Please note that the expenses shown in the table are meant |
| The following disclosure provides important information | to highlight your ongoing costs only and do not reflect any |
| regarding the Fund’s Shareholder Expense Example | transactional costs. Therefore, the information under the heading |
| (“Example”) . | “Hypothetical Performance (5% return before expenses)” is |
| | useful in comparing ongoing costs only, and will not help you |
| Example | determine the relative total costs of owning different funds. In |
| As a shareholder of the Fund, you incur two types of costs: (1) | addition, if these transactional costs were included, your costs |
| transaction costs, and (2) ongoing costs, including advisory and | would have been higher. The fees and expenses shown in this |
| administrative fees and other Fund expenses. The Example is | section do not reflect any Insurance Company Separate Account |
| intended to help you understand your ongoing costs (in dollars) | Policy Charges. | | | | | | |
| of investing in the Fund and to compare these costs with the | | | | | | Hypothetical |
| ongoing costs of investing in other mutual funds. The Example | | | | | | Performance (5% |
| is based on an investment of $1,000 invested at the beginning of | | | | Actual | | return before |
| the period and held for the entire period indicated, which for this | | | Performance | | | expenses) |
| | Beginning Account Value | | | | | | |
| Fund is from July 1, 2017 to December 31, 2017. | July 1, 2017 | | $ | 1,000.00 | | $ | 1,000.00 |
| | Ending Account Value | | | | | | |
| Actual Expenses | December 31, 2017 | | $ | 1,079.50 | | $ | 1,024.45 |
| The information in the table under the heading “Actual | Expenses Paid During Period* | | $ | 0.79 | | $ | 0.77 |
| Performance” provides information about actual account values | | | | | | | |
| and actual expenses. You may use the information in this column, | * Expenses are equal to the Fund's annualized expense ratio of 0.15% |
| | (representing the six month period annualized), multiplied by the average |
| together with the amount you invested, to estimate the expenses | account value over the period, multiplied by 184/365 (to reflect the one-half |
| that you paid over the period. Simply divide your account value by | year period) . May reflect amounts waived and/or reimbursed. Without any |
| $1,000 (for example, an $8,600 account value divided by $1,000 | waivers and/or reimbursements, expenses would have been higher. |
| = 8.6), then multiply the result by the number in the first column | | | | | | | |
| in the row entitled “Expenses Paid During Period” to estimate | | | | | | | |
| the expenses you paid on your account during this period. | | | | | | | |
| |
| Hypothetical Example for Comparison Purposes | | | | | | | |
| The information in the table under the heading “Hypothetical | | | | | | | |
| Performance (5% return before expenses)” provides information | | | | | | | |
| about hypothetical account values and hypothetical expenses | | | | | | | |
| based on the Fund’s actual expense ratio and an assumed rate of | | | | | | | |
| return of 5% per year before expenses, which is not the Fund’s | | | | | | | |
| actual return. The hypothetical account values and expenses | | | | | | | |
| may not be used to estimate the actual ending account balance or | | | | | | | |
| expenses you paid for the period. You may use this information | | | | | | | |
| to compare the ongoing costs of investing in the Fund and other | | | | | | | |
| funds. To do so, compare this 5% hypothetical example with the | | | | | | | |
| 5% hypothetical examples that appear in the shareholder reports | | | | | | | |
| of other funds. | | | | | | | |
Equity Growth Strategy Fund 71
Russell Investment Funds
Equity Growth Strategy Fund
Schedule of Investments — December 31, 2017
| | | | | |
| Amounts in thousands (except share amounts) | | | | | |
| | | | | | Fair |
| | | | | | Value |
| | Shares | | $ |
| Investments in Affiliated Funds - 97.3% | | | | | |
| Alternative - 6.5% | | | | | |
| RIC Commodity Strategies Fund Class Y | | | 297,931 | | 1,707 |
| RIC Global Infrastructure Fund Class Y | | | 142,885 | | 1,636 |
| RIF Global Real Estate Securities Fund | | | 20,242 | | 300 |
| | | | | | 3,643 |
| |
| Domestic Equities - 32.6% | | | | | |
| RIC U. S. Defensive Equity Fund Class Y | | | 77,619 | | 3,990 |
| RIC U. S. Dynamic Equity Fund Class Y | | | 322,709 | | 2,956 |
| RIF U. S. Small Cap Equity Fund | | | 492,488 | | 8,076 |
| RIF U. S. Strategic Equity Fund | | | 172,525 | | 3,197 |
| | | | | | 18,219 |
| |
| Fixed Income - 9.4% | | | | | |
| RIC Global Opportunistic Credit Fund Class Y | | | 281,433 | | 2,772 |
| RIC Unconstrained Total Return Fund Class Y | | | 251,663 | | 2,494 |
| | | | | | 5,266 |
| |
| International Equities - 48.8% | | | | | |
| RIC Emerging Markets Fund Class Y | | | 277,185 | | 5,865 |
| RIC Global Equity Fund Class Y | | | 1,058,593 | | 11,434 |
| RIF International Developed Markets Fund | | | 762,504 | | 10,004 |
| | | | | | 27,303 |
| |
| Total Investments in Affiliated Funds | | | | | |
| (cost $44,448) | | | | | 54,431 |
| |
| Options Purchased - 0.3% | | | | | |
| (Number of Contracts) | | | | | |
| S&P 500 Index | | | | | |
| Goldman Sachs May 2018 2,675.00 Call (23) | USD | | 6,153 | (ÿ) | 180 |
| Total Options Purchased | | | | | |
| (cost $152) | | | | | 180 |
| |
| Short-Term Investments - 0.0% | | | | | |
| U. S. Cash Management Fund(@) | | | 19,493 | (8) | 19 |
| Total Short-Term Investments | | | | | |
| (cost $19) | | | | | 19 |
| |
| Total Investments 97.6% | | | | | |
| (identified cost $44,619) | | | | | 54,630 |
| |
| Other Assets and Liabilities, Net - 2.4% | | | | | 1,316 |
| Net Assets - 100.0% | | | | | 55,946 |
See accompanying notes which are an integral part of the financial statements.
72 Equity Growth Strategy Fund
Russell Investment Funds
Equity Growth Strategy Fund
Schedule of Investments, continued — December 31, 2017
| | | | | | | |
| Futures Contracts | | | | | | | |
| |
| Amounts in thousands (except contract amounts) | | | | | | | |
| | | | | | | Value and | |
| | | | | | | Unrealized | |
| | | | | | | Appreciation | |
| | | Number of | Notional | Expiration | (Depreciation) | |
| | | Contracts | Amount | Date | $ | |
| Long Positions | | | | | | | |
| Amsterdam Index Futures | | 3 | EUR | 327 | 01/18 | (5 | ) |
| CAC40 Euro Index Futures | | 20 | EUR | 1,062 | 01/18 | (19 | ) |
| DAX Index Futures | | 2 | EUR | 646 | 03/18 | (14 | ) |
| Dow U. S. Real Estate Index Futures | | 16 | USD | 514 | 03/18 | 3 | |
| EURO STOXX 50 Index Futures | | 19 | EUR | 664 | 03/18 | (19 | ) |
| FTSE/MIB Index Futures | | 2 | EUR | 218 | 03/18 | (11 | ) |
| IBEX 35 Index Futures | | 3 | EUR | 301 | 01/18 | (8 | ) |
| MSCI EAFE Index Futures | | 6 | USD | 614 | 03/18 | 13 | |
| OMXS30 Index Futures | | 14 | SEK | 2,203 | 01/18 | (7 | ) |
| Russell 1000 E-Mini Index Futures | | 2 | USD | 148 | 03/18 | 1 | |
| Short Positions | | | | | | | |
| FTSE 100 Index Futures | | 10 | GBP | 764 | 03/18 | (29 | ) |
| MSCI Emerging Markets Mini Index Futures | | 6 | USD | 349 | 03/18 | (16 | ) |
| Russell 2000 E-Mini Index Futures | | 23 | USD | 1,767 | 03/18 | (18 | ) |
| S&P 500 E-Mini Index Futures | | 16 | USD | 2,142 | 03/18 | (19 | ) |
| S&P/TSX 60 Index Futures | | 5 | CAD | 957 | 03/18 | (3 | ) |
| SPI 200 Index Futures | | 6 | AUD | 903 | 03/18 | (3 | ) |
| Total Value and Unrealized Appreciation (Depreciation) on Open Futures Contracts (å) | | | | | (154 | ) |
| | | | | | | | | |
| Foreign Currency Exchange Contracts | | | | | | | | | |
| Amounts in thousands | | | | | | | | | |
| | | | | | | | | Unrealized | |
| | | | | | | | | Appreciation | |
| | | Amount | | Amount | | (Depreciation) | |
| Counterparty | | Sold | | Bought | Settlement Date | $ | |
| Bank of America | USD | | 177 | CAD | | 227 | 03/22/18 | 4 | |
| Bank of America | USD | | 8 | ZAR | | 115 | 03/22/18 | 1 | |
| Bank of America | AUD | | 63 | USD | | 47 | 03/22/18 | (2 | ) |
| Bank of America | CHF | | 223 | USD | | 226 | 03/22/18 | (4 | ) |
| Bank of America | EUR | | 1,092 | USD | | 1,296 | 03/22/18 | (20 | ) |
| Bank of America | GBP | | 420 | USD | | 565 | 03/22/18 | (3 | ) |
| Bank of America | HKD | | 360 | USD | | 46 | 03/22/18 | — | |
| Bank of America | JPY | | 14,768 | USD | | 132 | 03/22/18 | — | |
| Bank of America | MXN | | 2,025 | USD | | 105 | 03/22/18 | 3 | |
| Bank of America | SEK | | 375 | USD | | 45 | 03/22/18 | (1 | ) |
| Bank of America | SGD | | 22 | USD | | 16 | 03/22/18 | — | |
| Commonwealth Bank of Australia | USD | | 177 | CAD | | 227 | 03/22/18 | 4 | |
| Commonwealth Bank of Australia | USD | | 8 | ZAR | | 115 | 03/22/18 | 1 | |
| Commonwealth Bank of Australia | AUD | | 63 | USD | | 47 | 03/22/18 | (2 | ) |
| Commonwealth Bank of Australia | CHF | | 223 | USD | | 226 | 03/22/18 | (4 | ) |
| Commonwealth Bank of Australia | EUR | | 1,092 | USD | | 1,297 | 03/22/18 | (19 | ) |
| Commonwealth Bank of Australia | GBP | | 420 | USD | | 564 | 03/22/18 | (4 | ) |
| Commonwealth Bank of Australia | HKD | | 360 | USD | | 46 | 03/22/18 | — | |
| Commonwealth Bank of Australia | JPY | | 14,768 | USD | | 132 | 03/22/18 | — | |
| Commonwealth Bank of Australia | MXN | | 2,025 | USD | | 105 | 03/22/18 | 3 | |
| Commonwealth Bank of Australia | SEK | | 375 | USD | | 45 | 03/22/18 | (1 | ) |
| Commonwealth Bank of Australia | SGD | | 22 | USD | | 16 | 03/22/18 | — | |
| State Street | USD | | 437 | CNY | | 2,910 | 03/22/18 | 7 | |
See accompanying notes which are an integral part of the financial statements.
Equity Growth Strategy Fund 73
Russell Investment Funds
Equity Growth Strategy Fund
Schedule of Investments, continued — December 31, 2017
| | | | | | | | |
| Foreign Currency Exchange Contracts | | | | | | | | |
| Amounts in thousands | | | | | | | | |
| | | | | | | | Unrealized | |
| | | | | | | | Appreciation | |
| | | Amount | | Amount | | (Depreciation) | |
| Counterparty | | Sold | | Bought | Settlement Date | $ | |
| State Street | USD | 25 | RUB | | 1,490 | 03/22/18 | 1 | |
| State Street | BRL | 980 | USD | | 294 | 03/22/18 | 1 | |
| State Street | CNY | 2,710 | USD | | 406 | 03/22/18 | (8 | ) |
| State Street | INR | 12,940 | USD | | 199 | 03/22/18 | (3 | ) |
| State Street | KRW | 116,630 | USD | | 107 | 03/22/18 | (3 | ) |
| State Street | TWD | 9,520 | USD | | 319 | 03/22/18 | (5 | ) |
| Total Unrealized Appreciation (Depreciation) on Open Foreign Currency Exchange Contracts | | | | | (54 | ) |
Total Return Swap Contracts
Amounts in thousands
| | | | | | | | | | | | | | | |
| | | | | | | | | | | Premiums | | Unrealized | | | |
| | | | | | | | | | | Paid | | Appreciation | | | |
| | | | | Notional | | | | | Termination | (Received) | | (Depreciation) | | Fair Value | |
| Underlying Reference Entity | Counterparty | Amount | | Terms | | Date | $ | | $ | | $ | |
| Short | | | | | | | | | | | | | | | |
| S&P 500 Total Return Index | | Goldman Sachs | USD 4,000 | 3 Month LIBOR + 0.700%(5) | | 03/16/18 | — | | (5 | ) | (5 | ) |
| Total Open Total Return Swap Contracts (å) | | | | | | | | — | | (5 | ) | (5 | ) |
| |
| |
| |
| |
| Credit Default Swap Contracts | | | | | | | | | | | | | |
| |
| Amounts in thousands | | | | | | | | | | | | | | |
| |
| Credit Indices | | | | | | | | | | | | | | | |
| | | | | | | | | | | Premiums | | Unrealized | | | |
| | | | | | | | Fund (Pays)/ | | Paid/ | | Appreciation | | | |
| | | | Purchase/Sell | | | Receives | Termination | (Received) | | (Depreciation) | | Fair Value | |
| Reference Entity | | Counterparty | Protection | Notional Amount | Fixed Rate | Date | $ | | $ | | $ | |
| CDX Emerging Markets | | | | | | | | | | | | | | | |
| Index | Bank of America | Purchase | USD | 500 | (1.000%)(2) | 12/20/22 | 21 | | (17 | ) | 4 | |
| CDX Investment Grade | | | | | | | | | | | | | | | |
| Index | Bank of America | Sell | USD | 2,000 | 1.000%(2) | 12/20/22 | 41 | | 7 | | 48 | |
| CDX NA High Yield Index | Bank of America | Purchase | USD | 1,400 | (5.000%)(2) | 12/20/22 | (105 | ) | (13 | ) | (118 | ) |
| Total Open Credit Indices Contracts (å) | | | | | | | | (43 | ) | (23 | ) | (66 | ) |
See accompanying notes which are an integral part of the financial statements.
74 Equity Growth Strategy Fund
Russell Investment Funds
Equity Growth Strategy Fund
Schedule of Investments, continued — December 31, 2017
| | | | | | | | | | | | | | | | | |
| Presentation of Portfolio Holdings | | | | | | | | | | | | | | | |
| Amounts in thousands | | | | | | | | | | | | | | | | | |
| | | | | | Fair Value | | | | | | | | | | |
| | | | | | | | | | | | Practical | | | | | | |
| Portfolio Summary | | Level 1 | | | Level 2 | | | Level 3 | Expedient (a) | | Total | | % of Net Assets | |
| Investments in Affiliated Funds | $ | 54,431 | | $ | — | | $ | | — | $ | — | $ | 54,431 | | | 97.3 | |
| Options Purchased | | 180 | | | — | | | | — | | — | | 180 | | | 0.3 | |
| Short-Term Investments | | — | | | — | | | | — | | 19 | | 19 | | | — * | |
| Total Investments | | 54,611 | | | — | | | | — | | 19 | | 54,630 | | | 97.6 | |
| Other Assets and Liabilities, Net | | | | | | | | | | | | | | | | 2.4 | |
| | | | | | | | | | | | | | | | | 100.0 | |
| Other Financial Instruments | | | | | | | | | | | | | | | | | |
| Assets | | | | | | | | | | | | | | | | | |
| Futures Contracts | | 17 | | | — | | | | — | | — | | 17 | | | — * | |
| Foreign Currency Exchange Contracts | | — | | | 25 | | | | — | | — | | 25 | | | — * | |
| Credit Default Swap Contracts | | — | | | 52 | | | | — | | — | | 52 | | | 0.1 | |
| ' | | | | | | | | | | | | | | | | | |
| Liabilities | | | | | | | | | | | | | | | | | |
| Futures Contracts | | (171 | ) | | — | | | | — | | — | | (171 | ) | | (0.3 | ) |
| Foreign Currency Exchange Contracts | | — | | | (79 | ) | | | — | | — | | (79 | ) | | (0.1 | ) |
| Total Return Swap Contracts | | — | | | (5 | ) | | | — | | — | | (5 | ) | | (—)* | |
| Credit Default Swap Contracts | | — | | | (118 | ) | | | — | | — | | (118 | ) | | (0.2 | ) |
| Total Other Financial Instruments** | $ | (154 | ) | $ | (125 | ) | $ | | — | $ | — | $ | (279 | ) | | | |
* Less than 0.05% of net assets.
** Futures and foreign currency exchange contract values reflect the unrealized appreciation (depreciation) on the investments.
(a) Certain investments that are measured at fair value using the net asset value per share (or its equivalent) practical expedient have not been classified
in the fair value levels. The fair value amounts presented in the table are intended to permit reconciliation to the amounts presented in the Schedule of
Investments.
For a description of the Levels, see note 2 in the Notes to Financial Statements.
For a disclosure on transfers between Levels 1, 2 and 3 during the period ended December 31, 2017, see note 2 in the Notes to
Financial Statements.
See accompanying notes which are an integral part of the financial statements.
Equity Growth Strategy Fund 75
Russell Investment Funds
Equity Growth Strategy Fund
Fair Value of Derivative Instruments — December 31, 2017
Amounts in thousands
| | | | | | | | | | |
| | | | | | | | | Foreign | |
| | | Equity | | Credit | | Currency | |
| Derivatives not accounted for as hedging instruments | Contracts | | Contracts | | Contracts | |
| |
| Location: Statement of Assets and Liabilities - Assets | | | | | | | | | |
| Investments, at fair value* | | $ | 180 | | $ | — | | $ | — | |
| Unrealized appreciation on foreign currency exchange contracts | | — | | | — | | | 25 | |
| Variation margin on futures contracts** | | | 17 | | | — | | | — | |
| Credit default swap contracts, at fair value | | | — | | | 52 | | | — | |
| Total | | $ | 197 | | $ | 52 | | $ | 25 | |
| |
| |
| Location: Statement of Assets and Liabilities - Liabilities | | | | | | | | | |
| Variation margin on futures contracts** | | $ | 171 | | $ | — | | $ | — | |
| Unrealized depreciation on foreign currency exchange contracts | | — | | | — | | | 79 | |
| Total return swap contracts, at fair value | | | 5 | | | — | | | — | |
| Credit default swap contracts, at fair value | | | — | | | 118 | | | — | |
| Total | | $ | 176 | | $ | 118 | | $ | 79 | |
| | | | | | | | | Foreign | |
| | | Equity | | Credit | | Currency | |
| Derivatives not accounted for as hedging instruments | Contracts | | Contracts | | Contracts | |
| |
| Location: Statement of Operations - Net realized gain (loss) | | | | | | | | | |
| Investments*** | | $ | 166 | | $ | — | | $ | — | |
| Futures contracts | | | (329 | ) | | — | | | — | |
| Options written | | | 62 | | | — | | | — | |
| Total return swap contracts | | | (383 | ) | | — | | | — | |
| Credit default swap contracts | | | — | | | (33 | ) | | — | |
| Foreign currency exchange contracts** | | | — | | | — | | | (91 | ) |
| Total | | $ | (484 | ) | $ | (33 | ) | $ | (91 | ) |
| |
| |
| Location: Statement of Operations - Net change in unrealized appreciation (depreciation) | | | | | | | | | |
| Investments**** | | $ | 111 | | $ | — | | $ | — | |
| Futures contracts | | | (239 | ) | | — | | | — | |
| Options written | | | (34 | ) | | — | | | — | |
| Total return swap contracts | | | (5 | ) | | — | | | — | |
| Credit default swap contracts | | | — | | | (23 | ) | | — | |
| Foreign currency exchange contracts | | | — | | | — | | | (98 | ) |
| Total | | $ | (167 | ) | $ | (23 | ) | $ | (98 | ) |
* Fair value of purchased options.
** Includes cumulative appreciation/depreciation of futures contracts as reported in the Schedule of Investments. Only variation margin is reported within the
Statement of Assets and Liabilities.
*** Includes net realized gain (loss) on purchased options as reported in the Statement of Operations.
**** Includes net change in unrealized appreciation/depreciation on purchased options as reported in the Schedule of Investments.
For further disclosure on derivatives see note 2 in the Notes to Financial Statements.
See accompanying notes which are an integral part of the financial statements.
76 Equity Growth Strategy Fund
Russell Investment Funds
Equity Growth Strategy Fund
Balance Sheet Offsetting of Financial and Derivative Instruments —
December 31, 2017
| | | | | | | | | | |
| Amounts in thousands | | | | | | | | | | |
| |
| Offsetting of Financial Assets and Derivative Assets | | | | | | | | | |
| | | | | | Gross | Net Amounts | |
| | | | | | Amounts | | of Assets | |
| | | | Gross | Offset in the | Presented in | |
| | | Amounts of | Statement of | the Statement | |
| | | Recognized | Assets and | of Assets and | |
| Description | Location: Statement of Assets and Liabilities - Assets | | Assets | Liabilities | | Liabilities | |
| Options Purchased Contracts | Investments, at fair value | $ | | 180 | | $ | — $ | 180 | |
| Foreign Currency Exchange Contracts | Unrealized appreciation on foreign currency exchange contracts | | | 25 | | | — | 25 | |
| Futures Contracts | Variation margin on futures contracts | | | 26 | | | — | 26 | |
| Credit Default Swap Contracts | Credit default swap contracts, at fair value | | | 52 | | | — | 52 | |
| Total Financial and Derivative Assets | | | | 283 | | | — | 283 | |
| Financial and Derivative Assets not subject to a netting agreement | | (258 | ) | | — | (258 | ) |
| Total Financial and Derivative Assets subject to a netting agreement | $ | | 25 | | $ | — $ | 25 | |
| | | | | | | | | |
| Financial Assets, Derivative Assets, and Collateral Held by Counterparty | | | | | | | | |
| | | | Gross Amounts Not Offset in | |
| | | | the Statement of Assets and | |
| | | | | | Liabilities | | | |
| |
| |
| | Net Amounts | | | | | | | |
| | of Assets | | | | | | | |
| | Presented in | | | | | | | |
| | the Statement | Financial and | | | | |
| | of Assets and | Derivative | | | Collateral | |
| Counterparty | Liabilities | Instruments | | | Received^ | Net Amount |
| Bank of America | $ | 8 | | $ | 8 | | $ | — | $ — |
| Commonwealth Bank of Australia | | 9 | | | 9 | | | — | — |
| State Street | | 8 | | | 8 | | | — | — |
| Total | $ | 25 | | $ | 25 | | $ | — | $ — |
See accompanying notes which are an integral part of the financial statements.
Equity Growth Strategy Fund 77
Russell Investment Funds
Equity Growth Strategy Fund
Balance Sheet Offsetting of Financial and Derivative Instruments, continued —
December 31, 2017
| | | | | | | | | |
| Amounts in thousands | | | | | | | | | |
| |
| Offsetting of Financial Liabilities and Derivative Liabilities | | | | | | | | |
| | | | | Gross | Net Amounts | |
| | | | | Amounts | of Liabilities | |
| | | | Gross | Offset in the | Presented in | |
| | | Amounts of | Statement of | the Statement | |
| | | Recognized | Assets and | of Assets and | |
| Description | Location: Statement of Assets and Liabilities - Liabilities | Liabilities | Liabilities | | Liabilities | |
| Futures Contracts | Variation margin on futures contracts | $ | 36 | | $ | — $ | 36 | |
| Foreign Currency Exchange Contracts | Unrealized depreciation on foreign currency exchange contracts | | 79 | | | — | 79 | |
| Total Return Swap Contracts | Total return swap contracts, at fair value | | 5 | | | — | 5 | |
| Credit Default Swap Contracts | Credit default swap contracts, at fair value | | 118 | | | — | 118 | |
| Total Financial and Derivative Liabilities | | | 238 | | | — | 238 | |
| Financial and Derivative Liabilities not subject to a netting agreement | | (154 | ) | | — | (154 | ) |
| Total Financial and Derivative Liabilities subject to a netting agreement | $ | 84 | | $ | — $ | 84 | |
| | | | | | | | | |
| Financial Liabilities, Derivative Liabilities, and Collateral Pledged by Counterparty | | | | | | | | |
| | | | Gross Amounts Not Offset in | |
| | | | the Statement of Assets and | |
| | | | | | Liabilities | | | |
| |
| |
| | Net Amounts | | | | | | | |
| | of Liabilities | | | | | | | |
| | Presented in | | | | | | | |
| | the Statement | Financial and | | | | |
| | of Assets and | Derivative | | Collateral | |
| Counterparty | Liabilities | Instruments | | Pledged^ | Net Amount |
| Bank of America | $ | 31 | | $ | 8 | | $ | — | $ 23 |
| Commonwealth Bank of Australia | | 30 | | | 9 | | | — | 21 |
| Goldman Sachs | | 5 | | | — | | | — | 5 |
| State Street | | 18 | | | 8 | | | — | 10 |
| Total | $ | 84 | | $ | 25 | | $ | — | $ 59 |
^ Collateral received or pledged amounts may not reconcile to those disclosed in the Statement of Assets and Liabilities due to the inclusion of off-Balance
Sheet collateral and adjustments made to exclude overcollateralization.
For further disclosure on derivatives and counterparty risk see note 2 in the Notes to Financial Statements.
See accompanying notes which are an integral part of the financial statements.
78 Equity Growth Strategy Fund
Russell Investment Funds
Equity Growth Strategy Fund
Statement of Assets and Liabilities — December 31, 2017
| | |
| Amounts in thousands | | |
| Assets | | |
| Investments, at identified cost | $ | 44,619 |
| Investments, at fair value(>) | | 54,630 |
| Cash | | 223 |
| Cash (restricted)(a)(b)(c) | | 1,262 |
| Unrealized appreciation on foreign currency exchange contracts | | 25 |
| Receivables: | | |
| Fund shares sold | | 1 |
| From affiliates | | 6 |
| Variation margin on futures contracts | | 26 |
| Credit default swap contracts, at fair value(+) | | 52 |
| Total assets | | 56,225 |
| |
| Liabilities | | |
| Payables: | | |
| Investments purchased | | 1 |
| Accrued fees to affiliates | | 2 |
| Other accrued expenses | | 38 |
| Variation margin on futures contracts | | 36 |
| Unrealized depreciation on foreign currency exchange contracts | | 79 |
| Total return swap contracts, at fair value(8) | | 5 |
| Credit default swap contracts, at fair value(+) | | 118 |
| Total liabilities | | 279 |
| |
| Net Assets | $ | 55,946 |
See accompanying notes which are an integral part of the financial statements.
Equity Growth Strategy Fund 79
Russell Investment Funds
Equity Growth Strategy Fund
Statement of Assets and Liabilities, continued — December 31, 2017
| | | |
| Amounts in thousands | | | |
| Net Assets Consist of: | | | |
| Undistributed (overdistributed) net investment income | $ | 98 | |
| Accumulated net realized gain (loss) | | (265 | ) |
| Unrealized appreciation (depreciation) on: | | | |
| Investments | | 28 | |
| Investments in affiliated funds | | 9,983 | |
| Futures contracts | | (154 | ) |
| Foreign currency exchange contracts | | (54 | ) |
| Total return swap contracts | | (5 | ) |
| Credit default swap contracts | | (23 | ) |
| Shares of beneficial interest | | 56 | |
| Additional paid-in capital | | 46,282 | |
| Net Assets | $ | 55,946 | |
| |
| Net Asset Value, offering and redemption price per share: | | | |
| Net asset value per share: (#) | $ | 9.97 | |
| Net assets | $ | 55,945,605 | |
| Shares outstanding ($. 01 par value) | | 5,613,000 | |
| Amounts in thousands | | | |
| (+) Credit default swap contracts - premiums paid (received) | $ | (43 | ) |
| (>) Investments in affiliated funds | $ | 54,450 | |
| (8) Total return swap contracts - premiums paid (received) | $ | — | |
| |
| (a) Cash Collateral for Futures | $ | 900 | |
| (b) Cash Collateral for Swaps | $ | 264 | |
| (c) Cash Collateral for Options | $ | 98 | |
| (#) Net asset value per share equals class level net assets divided by class level shares of beneficial interest outstanding. | | | |
See accompanying notes which are an integral part of the financial statements.
80 Equity Growth Strategy Fund
Russell Investment Funds
Equity Growth Strategy Fund
Statement of Operations — For the Period Ended December 31, 2017
| | | |
| Amounts in thousands | | | |
| Investment Income | | | |
| Income distributions from affiliated funds | $ | 2,013 | |
| |
| Expenses | | | |
| Advisory fees | | 104 | |
| Administrative fees | | 22 | |
| Custodian fees | | 31 | |
| Transfer agent fees | | 2 | |
| Professional fees | | 38 | |
| Trustees’ fees | | 1 | |
| Printing fees | | 18 | |
| Miscellaneous | | 8 | |
| Expenses before reductions | | 224 | |
| Expense reductions | | (151 | ) |
| Net expenses | | 73 | |
| Net investment income (loss) | | 1,940 | |
| |
| Net Realized and Unrealized Gain (Loss) | | | |
| Net realized gain (loss) on: | | | |
| Investments | | 166 | |
| Investments in affiliated funds | | 1,590 | |
| Futures contracts | | (329 | ) |
| Options written | | 62 | |
| Foreign currency exchange contracts | | (91 | ) |
| Total return swap contracts | | (383 | ) |
| Credit default swap contracts | | (33 | ) |
| Foreign currency-related transactions | | 1 | |
| Capital gain distributions from affiliated funds | | 2,521 | |
| Net realized gain (loss) | | 3,504 | |
| Net change in unrealized appreciation (depreciation) on: | | | |
| Investments | | 111 | |
| Investments in affiliated funds | | 3,288 | |
| Futures contracts | | (239 | ) |
| Options written | | (34 | ) |
| Foreign currency exchange contracts | | (98 | ) |
| Total return swap contracts | | (5 | ) |
| Credit default swap contracts | | (23 | ) |
| Net change in unrealized appreciation (depreciation) | | 3,000 | |
| Net realized and unrealized gain (loss) | | 6,504 | |
| Net Increase (Decrease) in Net Assets from Operations | $ | 8,444 | |
See accompanying notes which are an integral part of the financial statements.
Equity Growth Strategy Fund 81
Russell Investment Funds
Equity Growth Strategy Fund
Statements of Changes in Net Assets
| | | | | | |
| | For the Periods Ended December 31, | |
| Amounts in thousands | | 2017 | | | 2016 | |
| Increase (Decrease) in Net Assets | | | | | | |
| Operations | | | | | | |
| Net investment income (loss) | $ | 1,940 | | $ | 929 | |
| Net realized gain (loss) | | 3,504 | | | 1,237 | |
| Net change in unrealized appreciation (depreciation) | | 3,000 | | | 2,736 | |
| Net increase (decrease) in net assets from operations | | 8,444 | | | 4,902 | |
| Distributions | | | | | | |
| From net investment income | | (1,736 | ) | | (1,396 | ) |
| From net realized gain | | (1,007 | ) | | — | |
| Net decrease in net assets from distributions | | (2,743 | ) | | (1,396 | ) |
| Share Transactions* | | | | | | |
| Net increase (decrease) in net assets from share transactions | | 2,081 | | | (3,393 | ) |
| Total Net Increase (Decrease) in Net Assets | | 7,782 | | | 113 | |
| Net Assets | | | | | | |
| Beginning of period | | 48,164 | | | 48,051 | |
| End of period | $ | 55,946 | | $ | 48,164 | |
| Undistributed (overdistributed) net investment income included in net assets | $ | 98 | | $ | (35 | ) |
* Share transaction amounts (in thousands) for the periods ended December 31, 2017 and December 31, 2016 were as follows:
| | | | | | | | | | | | |
| | | 2017 | | | | 2016 | | |
| | | Shares | | | Dollars | | | Shares | | | Dollars | |
| |
| Proceeds from shares sold | | 790 | | $ | 7,420 | | | 669 | | $ | 5,721 | |
| Proceeds from reinvestment of distributions | | 283 | | | 2,743 | | | 162 | | | 1,396 | |
| Payments for shares redeemed | | (861 | ) | | (8,082 | ) | | (1,233 | ) | | (10,510 | ) |
| Total increase (decrease) | | 212 | | $ | 2,081 | | | (402 | ) | $ | (3,393 | ) |
See accompanying notes which are an integral part of the financial statements.
82 Equity Growth Strategy Fund
(This page intentionally left blank)
Russell Investment Funds
Equity Growth Strategy Fund
Financial Highlights — For the Periods Ended
For a Share Outstanding Throughout Each Period.
| | | | | | | | | | | | | | | | | |
| | | | | $ | | | | | | | | | | | | | |
| | | $ | | Net | | | $ | | | $ | | | $ | | | $ | |
| | Net Asset Value, | | Investment | | Net Realized | | | Total from | | | Distributions | | | Distributions | |
| | Beginning of | | Income (Loss) | | and Unrealized | | | Investment | | | from Net | | | from Net | |
| | | Period | | (a)(b)(d) | | Gain (Loss) | | | Operations | | | Investment Income | | | Realized Gain | |
| December 31, 2017 | | 8.92 | | . 35 | | 1.21 | | | 1.56 | | | (. 32 | ) | | (. 19 | ) |
| December 31, 2016 | | 8.28 | | . 17 | | | . 72 | | | . 89 | | | (. 25 | ) | | — | |
| December 31, 2015 | | 9.46 | | . 16 | | | (. 50 | ) | | (. 34 | ) | | (. 13 | ) | | (. 71 | ) |
| December 31, 2014 | | 9.60 | | . 30 | | | . 04 | | | . 34 | | | (. 32 | ) | | (. 16 | ) |
| December 31, 2013 | | 8.21 | | . 23 | | 1.39 | | | 1.62 | | | (. 23 | ) | | — | |
| | | | | | | | | | | | | | | | | | |
See accompanying notes which are an integral part of the financial statements.
84 Equity Growth Strategy Fund
| | | | | | | | | | | | | | | | | |
| | | | | | | | | | | | | % | | % | | % | |
| | | | | $ | | | | | $ | | | Ratio of Expenses | | Ratio of Expenses | Ratio of Net | |
| | | | | Net Asset Value, | | % | | | Net Assets, | | | to Average | | to Average | Investment Income | % |
| | $ | | | End of | | Total | | | End of Period | | | Net Assets, | | Net Assets, | to Average | Portfolio |
| Total Distributions | | | Period | | Return(e) | | | (000 | ) | | Gross(c) | | Net(c)(d) | Net Assets(b)(d) | Turnover Rate |
| (. 51 | ) | | 9.97 | | 17.67 | | | 55,946 | | | . 43 | | . 14 | | 3.72 | 35 |
| (. 25 | ) | | 8.92 | | 10.85 | | | 48,164 | | | . 40 | | . 12 | | 1.97 | 21 |
| (. 84 | ) | | 8.28 | | (3.87 | ) | | 48,051 | | | . 39 | | . 11 | | 1.73 | 31 |
| (. 48 | ) | | 9.46 | | 3.48 | | | 52,403 | | | . 40 | | . 10 | | 3.04 | 25 |
| (. 23 | ) | | 9.60 | | 19.81 | | | 50,254 | | | . 41 | | . 10 | | 2.55 | 17 |
See accompanying notes which are an integral part of the financial statements.
Equity Growth Strategy Fund 85
Russell Investment Funds
Equity Growth Strategy Fund
Related Party Transactions, Fees and Expenses
| | |
| Accrued fees payable to affiliates for the period ended December 31, 2017 were as follows: |
| Administration fees | $ | 2,007 |
| Transfer agent fees | | 208 |
| Trustee fees | | 107 |
| | $ | 2,322 |
Transactions (amounts in thousands) during the period ended December 31, 2017 with Underlying Funds which are, or were, an
affiliated company are as follows:
| | | | | | | | | | | | | | | | | | | | |
| | | Fair Value, | | | | | | | | Change in | | | | | | | | | |
| | Beginning of | | | | Realized Gain | | Unrealized | Fair Value, End | | Income | | Capital Gains | |
| | | Period | | Purchases | | Sales | | (Loss) | | Gain (Loss) | | of Period | | | Distributions | | Distributions | |
| RIC Commodity Strategies Fund | $ | 1,455 | $ | 500 | $ | 263 | $ | (51 | ) $ | 66 | $ | 1,707 | $ | 26 | $ | — | |
| RIC Global Infrastructure Fund | | 1,420 | | 437 | | 319 | | 18 | | 80 | | 1,636 | | 97 | | 70 | |
| RIF Global Real Estate Securities | | | | | | | | | | | | | | | | | | | | |
| Fund | | 888 | | 142 | | 767 | | 238 | | (201 | ) | 300 | | 13 | | 5 | |
| RIC U. S. Defensive Equity Fund | | 3,438 | | 881 | | 590 | | 37 | | 224 | | 3,990 | | 106 | | 273 | |
| RIC U. S. Dynamic Equity Fund | | 4,191 | | 1,296 | | 2,395 | | 282 | | (418 | ) | 2,956 | | 458 | | 341 | |
| RIF U. S. Small Cap Equity Fund | | 5,354 | | 3,430 | | 1,248 | | 58 | | 482 | | 8,076 | | 171 | | 365 | |
| RIF U. S. Strategic Equity Fund | | 4,888 | | 1,742 | | 3,900 | | 781 | | (314 | ) | 3,197 | | 179 | | 253 | |
| RIC Global Opportunistic Credit | | | | | | | | | | | | | | | | | | | | |
| Fund | | 4,864 | | 786 | | 3,067 | | (92 | ) | 281 | | 2,772 | | 129 | | — | |
| RIC Unconstrained Total Return | | | | | | | | | | | | | | | | | | | | |
| Fund | | 732 | | 2,023 | | 256 | | (1 | ) | (4 | ) | 2,494 | | 47 | | — | |
| RIC Emerging Markets Fund | | 5,775 | | 794 | | 2,484 | | 65 | | 1,715 | | 5,865 | | 74 | | — | |
| RIC Global Equity Fund | | 7,700 | | 4,538 | | 1,368 | | 115 | | 449 | | 11,434 | | 481 | | 882 | |
| |
| RIF International Fund Developed Markets | 6,251 | | 4,019 | | 1,334 | | 140 | | 928 | | 10,004 | | 229 | | 332 | |
| U. S. Cash Management Fund | | 324 | | 3,889 | | 4,194 | | — | | — | | 19 | | | 3 | | — | |
| | $ | 47,280 | $ | 24,477 | $ | 22,185 | $ | 1,590 | $ | 3,288 | $ | 54,450 | $ | 2,013 | $ | 2,521 | |
Federal Income Taxes
At December 31, 2017, the cost of investments and net unrealized appreciation (depreciation), undistributed ordinary income and
undistributed long-term capital gains for income tax purposes were as follows:
| | | | |
| Cost of Investments | $ | | 46,425,139 | |
| Unrealized Appreciation | $ | | 8,686,861 | |
| Unrealized Depreciation | | | (634,764 | ) |
| Net Unrealized Appreciation (Depreciation) | $ | | 8,052,097 | |
| Undistributed Ordinary Income | $ | | 38,801 | |
| Undistributed Long-Term Capital Gains | | | | |
| (Capital Loss Carryforward) | $ | | 2,402,261 | |
| Tax Composition of Distributions | | | | |
| Ordinary Income | $ | | 1,949,480 | |
| Long-Term Capital Gains | $ | | 793,264 | |
Net investment income and net realized gains (losses) in the financial statements may differ from taxable net investment income and
net realized gains (losses). Capital accounts within the financial statements are adjusted for permanent differences between book and
tax accounting. Book-tax differences may be due to foreign currency gains and losses, reclassifications of dividends and differences
in treatment of income from swaps. These adjustments have no impact on the net assets. At December 31, 2017, the Statement of
Assets and Liabilities have been adjusted by the following amounts (in thousands):
See accompanying notes which are an integral part of the financial statements.
86 Equity Growth Strategy Fund
Russell Investment Funds
Equity Growth Strategy Fund
Federal Income Taxes, continued
| | | |
| Undistributed net investment income | $ | (71 | ) |
| Accumulated net realized gain (loss) | | 71 | |
| Additional paid-in capital | | — | |
As permitted by tax regulations, the Fund intends to defer a net realized capital loss of $384,431 incurred from November 1, 2017
to December 31, 2017, and treat it as arising in the fiscal year 2018.
See accompanying notes which are an integral part of the financial statements.
Equity Growth Strategy Fund 87
Russell Investment Funds
LifePoints® Funds Variable Target Portfolio Series
Notes to Schedule of Investments — December 31, 2017
Footnotes:
(å) Currency balances were pledged in connection with futures contracts purchased (sold), options written, or swaps entered into by the
Fund. See Statement of Assets and Liabilities.
(ÿ) Notional Amount in thousands.
(8) Unrounded units.
(@) Affiliate.
(1) Monthly payment frequency.
(2) Quarterly payment frequency.
(3) Semi-annual payment frequency.
(4) Annual payment frequency.
(5) Payment at termination.
Abbreviations:
144A - Represents private placement security for qualified buyers according to rule 144A of the Securities Act of 1933.
ADR - American Depositary Receipt
ADS - American Depositary Share
BBSW - Bank Bill Swap Reference Rate
CIBOR - Copenhagen Interbank Offered Rate
CME - Chicago Mercantile Exchange
CMO - Collateralized Mortgage Obligation
CVO - Contingent Value Obligation
EMU - European Economic and Monetary Union
EURIBOR - Euro Interbank Offered Rate
FDIC - Federal Deposit Insurance Company
GDR - Global Depositary Receipt
GDS - Global Depositary Share
HIBOR – Hong Kong Interbank Offered Rate
LIBOR - London Interbank Offered Rate
NIBOR - Norwegian Interbank Offered Rate
PIK - Payment in Kind
PRIBOR – Prague Interbank Offered Rate
REMIC - Real Estate Mortgage Investment Conduit
SIBOR – Singapore Interbank Offered Rate
STRIP - Separate Trading of Registered Interest and Principal of Securities
TBA - To Be Announced Security
UK - United Kingdom
88 Notes to Schedule of Investments
Russell Investment Funds
LifePoints® Funds Variable Target Portfolio Series
Notes to Schedule of Investments, continued — December 31, 2017
| | |
| Foreign Currency Abbreviations: | | |
| ARS - Argentine peso | HUF - Hungarian forint | PKR - Pakistani rupee |
| AUD - Australian dollar | IDR - Indonesian rupiah | PLN - Polish zloty |
| BRL - Brazilian real | ILS - Israeli shekel | RUB - Russian ruble |
| CAD - Canadian dollar | INR - Indian rupee | SEK - Swedish krona |
| CHF - Swiss franc | ISK - Icelandic krona | SGD - Singapore dollar |
| CLP - Chilean peso | ITL - Italian lira | SKK - Slovakian koruna |
| CNY - Chinese renminbi yuan | JPY - Japanese yen | THB - Thai baht |
| COP - Colombian peso | KES - Kenyan schilling | TRY - Turkish lira |
| CRC - Costa Rican colon | KRW - South Korean won | TWD - Taiwanese dollar |
| CZK - Czech koruna | MXN - Mexican peso | USD - United States dollar |
| DKK - Danish krone | MYR – Malaysian ringgit | VEB - Venezuelan bolivar |
| EGP - Egyptian pound | NOK - Norwegian krone | VND - Vietnamese dong |
| EUR - Euro | NZD - New Zealand dollar | ZAR - South African rand |
| GBP - British pound sterling | PEN - Peruvian nuevo sol | |
| HKD – Hong Kong dollar | PHP – Philippine peso | |
Notes to Schedule of Investments 89
Russell Investment Funds
LifePoints® Funds Variable Target Portfolio Series
Notes to Financial Highlights — December 31, 2017
(a) Average daily shares outstanding were used for this calculation.
(b) Recognition of net investment income by the Fund is affected by the timing of the declaration of dividends by the Underlying Funds in which the
Fund invests.
(c) The calculation includes only those expenses charged directly to the Fund and does not include expenses charged to the Underlying Funds in which
the Fund invests.
(d) May reflect amounts waived and reimbursed by Russell Investment Management, LLC ( “RIM”).
(e) The total return does not reflect any Insurance Company Separate Account or Policy Charges.
(f) Less than $.01 per share.
90 Notes to Financial Highlights
Russell Investment Funds
LifePoints® Funds Variable Target Portfolio Series
Notes to Financial Statements — December 31, 2017
1. Organization
Russell Investment Funds (the “Investment Company” or “RIF”) is a series investment company with nine different investment
portfolios referred to as funds (each a “Fund” and collectively the “Funds”). These financial statements report on four of these
Funds. The Investment Company provides the investment base for one or more variable insurance products issued by one or more
insurance companies. These Funds are offered at net asset value (“NAV”) to qualified insurance company separate accounts offering
variable insurance products. The Investment Company is registered under the Investment Company Act of 1940, as amended
(“Investment Company Act”), as an open-end management investment company. It is organized and operated as a Massachusetts
business trust under an Amended and Restated Master Trust Agreement dated October 1, 2008, as amended (“Master Trust
Agreement”), and the provisions of Massachusetts law governing the operation of a Massachusetts business trust. The Investment
Company’s Master Trust Agreement permits the Board of Trustees (the “Board”) to issue an unlimited number of shares of beneficial
interest. Each of the Funds is diversified. Under the Investment Company Act, a diversified company is defined as a management
company which meets the following requirements: at least 75% of the value of its total assets is represented by cash and cash items
(including receivables), government securities, securities of other investment companies, and other securities for the purposes of
this calculation limited in respect of any one issuer to an amount not greater in value than five percent of the value of the total assets
of such management company and to not more than 10% of the outstanding voting securities of such issuer.
Each of the Funds is a “fund of funds” and diversifies its assets by investing principally, at present, in shares of several Russell
Investment Company (“RIC”), an affiliated entity. Funds and other of the Investment Company’s Funds (together, the “Underlying
Funds”). Each Fund seeks to achieve its specific investment objective by investing in different combinations of the Underlying
Funds. In addition to investing in the Underlying Funds, Russell Investment Management, LLC (“RIM”), the Funds’ investment
adviser, may seek to actively manage the Funds' overall exposures by investing in derivatives, including futures, options, forwards
and swaps, that RIM believes will achieve the desired risk/return profile for the Funds. The Funds may hold cash in connection
with these investments. The Funds usually, but not always, pursue a strategy of being fully invested by exposing their cash to the
performance of segments of the global equity market by purchasing index futures contracts (also known as "equitization").
Each Fund intends its strategy of investing in combinations of equity, fixed income, multi-asset and alternative Underlying Funds
to result in investment diversification that an investor could otherwise achieve only by holding numerous individual investments.
A Fund’s actual allocation may vary from the target strategic asset allocation at any point in time (1) due to market movements, (2)
by up to +/- 5% at the equity, fixed income, multi-asset or alternative category level based on RIM’s capital markets research, and/
or (3) due to the implementation over a period of time of a change to the target strategic asset allocation including the addition of a
new Underlying Fund. There may be no changes in the asset allocation or to the Underlying Funds in a given year or such changes
may be made one or more times in a year.
The following table shows each Fund’s target strategic asset allocation effective on or about May 1, 2017 to equity, fixed income,
multi-asset, and alternative asset classes. The equity Underlying Funds in which the Funds may invest include the RIC U.S.
Defensive Equity, RIC U.S. Dynamic Equity, RIF U.S. Small Cap Equity, RIF U.S. Strategic Equity, RIC Emerging Markets, RIC
Global Equity, and RIF International Developed Markets Funds. The fixed income Underlying Funds in which the Funds may invest
include the RIC Global Opportunistic Credit, RIC Investment Grade Bond, RIC Unconstrained Total Return, and RIF Strategic
Bond Funds. The multi-asset Underlying Funds in which the Funds may invest include the RIC Multi-Strategy Income Fund. The
alternative Underlying Funds in which the Funds may invest include the RIC Commodity Strategies, RIC Global Infrastructure and
RIF Global Real Estate Securities Funds.
| | | | | | | | |
| | | | Asset Allocation Targets* | | | |
| | Moderate | | Balanced | | Growth | | | |
| | Strategy | | Strategy | | Strategy | | Equity Growth | |
| | Fund | | Fund | | Fund | | Strategy Fund | |
| Alternative ** | 7.5 | % | 7 | % | 8 | % | 8 | % |
| Equity | 29.5 | % | 51 | % | 70 | % | 85 | % |
| Multi-Asset | 10 | % | 4 | % | - | % | - | % |
| Fixed Income | 53 | % | 38 | % | 22 | % | 7 | % |
* Actual asset allocation may vary.
** Alternative Underlying Funds pursue investment strategies that differ from those of traditional broad market equity or fixed income funds.
Notes to Financial Statements 91
Russell Investment Funds
LifePoints® Funds Variable Target Portfolio Series
Notes to Financial Statements, continued — December 31, 2017
2. Significant Accounting Policies
The Funds’ financial statements are prepared in accordance with U.S. generally accepted accounting principles (“U.S. GAAP”)
which require the use of management estimates and assumptions at the date of the financial statements. Actual results could differ
from those estimates. The Funds are considered investment companies under U.S. GAAP and follow the accounting and reporting
guidance applicable to investment companies. The following is a summary of the significant accounting policies consistently
followed by each Fund in the preparation of its financial statements.
In October 2016, the U.S. Securities and Exchange Commission (“SEC”) adopted new rules and forms, and amendments to certain
current rules and forms, to modernize reporting and disclosure of information by registered investment companies. The amendments
to Regulation S-X require standardized, enhanced disclosure about derivatives in investment company financial statements, and
also change the rules governing the form and content of such financial statements. The amendments to Regulation S-X took effect
on August 1, 2017 and the financial statements have been modified accordingly, as applicable, and had no impact on the Funds'
net assets or results of operations.
Security Valuation
The Funds value portfolio securities according to Board-approved securities valuation procedures which include market and fair
value procedures. The Board has delegated the responsibility for administration of the securities valuation procedures to Russell
Investments Fund Services, LLC ("RIFUS"). The Funds value the shares of the Underlying Funds at the current NAV per share
of each Underlying Fund. The Funds have adopted the authoritative guidance under U.S. GAAP for estimating the fair value of
investments in funds that have calculated NAV per share in accordance with the specialized accounting guidance for investment
companies. Accordingly, the Funds estimate the fair value of an investment in a fund using the NAV per share without further
adjustment as a practical expedient, if the NAV per share of the investment is determined in accordance with the specialized
accounting guidance for investment companies as of the reporting entity’s measurement date.
U.S. GAAP defines fair value as the price that a Fund would receive to sell an asset or pay to transfer a liability in an orderly
transaction between market participants at the measurement date. It establishes a fair value hierarchy that prioritizes inputs to
valuation methods and requires a separate disclosure of the fair value hierarchy for each major category of assets and liabilities,
that segregates fair value measurements into levels (Level 1, 2, and 3). The inputs or methodology used for valuing securities are
not necessarily an indication of the risk associated with investing in those securities. Levels 1, 2 and 3 of the fair value hierarchy
are defined as follows:
• Level 1 — Quoted prices (unadjusted) in active markets or exchanges for identical assets and liabilities.
• Level 2 — Inputs other than quoted prices included within Level 1 that are observable, which may include, but are not
limited to, quoted prices for similar assets or liabilities in markets that are active, quoted prices for identical or similar assets
or liabilities in markets that are not active, and inputs such as interest rates, yield curves, implied volatilities, credit spreads
or other market corroborated inputs.
• Level 3 — Significant unobservable inputs based on the best information available in the circumstances, to the extent
observable inputs are not available, which may include assumptions made by RIFUS, acting at the discretion of the Board,
that are used in determining the fair value of investments.
The availability of observable inputs can vary from security to security and is affected by a wide variety of factors, including, for
example, the type of security, whether the security is new and not yet established in the marketplace, the liquidity of markets, and
other characteristics particular to the security. To the extent that valuation is based on models or inputs that are less observable
or unobservable in the market, the determination of fair value requires more judgement. Accordingly, the degree of judgement
exercised in determining fair value is greatest for instruments categorized in Level 3. The inputs or methodology used for valuing
securities are not necessarily an indication of the risk associated with investing in those securities.
The inputs used to measure fair value may fall into different levels of the fair value hierarchy. In such cases, for disclosure purposes,
the level in the fair value hierarchy within which the fair value measurement falls is determined based on the lowest level input that
is significant to the fair value measurement in its entirety.
The valuation techniques and significant inputs used in determining the fair market values of financial instruments categorized as
Level 1 and Level 2 of the fair value hierarchy are as follows:
Derivative instruments are instruments such as foreign currency contracts, futures contracts, options contracts, or swap agreements
that derive their value from underlying asset prices, indices, reference rates, and other inputs or a combination of these factors.
92 Notes to Financial Statements
Russell Investment Funds
LifePoints® Funds Variable Target Portfolio Series
Notes to Financial Statements, continued — December 31, 2017
Derivatives may be classified into two groups depending upon the way that they are traded: privately traded over-the-counter
(“OTC”) derivatives that do not go through an exchange or intermediary and exchange-traded derivatives that are traded through
specialized derivatives exchanges or other regulated exchanges. OTC derivatives are normally valued on the basis of broker dealer
quotations or pricing service providers. Depending on the product and the terms of the transaction, the value of the derivative
instrument can be estimated by a pricing service provider using a series of techniques, including simulation pricing models.
The pricing models use inputs that are observed from actively quoted markets such as issuer details, indices, spreads, interest
rates, yield curves, dividends and exchange rates. OTC derivatives that use these and similar valuation techniques and inputs as
described above are categorized as Level 2 of the fair value hierarchy, with the exception of foreign currency spot contracts which
are categorized as Level 1 of the fair value hierarchy. OTC derivatives that use broker dealer quotations are categorized as level 3 of
the fair value hierarchy. Exchange-traded derivatives are valued based on the last reported sales price on the day of valuation and
are categorized as Level 1 of the fair value hierarchy.
Centrally cleared swaps listed or traded on a multilateral or trade facility platform, such as a registered exchange, are valued at
the daily settlement price determined by the respective exchange. For centrally cleared credit default swaps, the clearing facility
requires its members to provide actionable levels across complete term structures. These levels along with external third party
prices are used to produce daily settlement prices. These securities are categorized as Level 2 of the fair value hierarchy. Centrally
cleared interest rate swaps are valued using a pricing model that references the underlying rates including the overnight index
swap rate and London Interbank Offered Rate (“LIBOR”) forward rate to produce the daily settlement price. These securities are
categorized as Level 2 of the fair value hierarchy.
For movements between the levels within the fair value hierarchy, the Funds have adopted a policy of recognizing the transfers as
of year-end.
For the period ended December 31, 2017, there was no movement between levels of the fair value hierarchy.
Level 3 Fair Value Investments
The valuation techniques and significant inputs used in determining the fair values of financial instruments classified as Level 3 of
the fair value hierarchy are as follows:
Securities and other assets for which market quotes are not readily available, or are not reliable, are valued at fair value as
determined in good faith by RIFUS and are categorized as Level 3 of the fair value hierarchy. Market quotes are considered not
readily available in circumstances where there is an absence of current or reliable market-based data (e.g., trade information or
broker quotes). When RIFUS applies fair valuation methods that use significant unobservable inputs to determine a Fund’s NAV,
securities will not be priced on the basis of quotes from the primary market in which they are traded, but instead may be priced by
another method that RIFUS believes accurately reflects fair value and will be categorized as Level 3 of the fair value hierarchy. Fair
value pricing may require subjective determinations about the value of a security. While the securities valuation procedures are
intended to result in a calculation of a Fund’s NAV that fairly reflects security values as of the time of pricing, the process cannot
guarantee that fair values determined by RIFUS would accurately reflect the price that a Fund could obtain for a security if it were
to dispose of that security as of the time of pricing (for instance, in a forced or distressed sale). The prices used by a Fund may differ
from the value that would be realized if the security was sold.
RIFUS employs third party pricing vendors to provide fair value measurements. RIFUS oversees third-party pricing service
providers in order to support the valuation process throughout the year.
If third party evaluated vendor pricing is neither available nor deemed to be indicative of fair value, RIFUS may elect to obtain
indicative market quotations (“broker quotes”) directly from the broker or passed through from a third party vendor. In the event
that the source of fair value is from a single source broker quote, these securities are classified as Level 3 per the fair value
hierarchy. Broker quotes are typically received from established market participants. Although independently received on a daily
basis, RIFUS does not have the transparency to view the underlying inputs which support the broker quotes. Significant changes
in the broker quote would have direct and proportional changes in the fair value of the security. There is a third-party pricing
exception to the quantitative disclosure requirement when prices are not determined by the reporting entity. RIFUS is exercising
this exception and has made a reasonable attempt to obtain quantitative information from the third party pricing vendors regarding
the unobservable inputs used.
For fair valuations using significant unobservable inputs, U.S. GAAP requires a reconciliation of the beginning to ending balances
for reported fair values that present changes attributable to total realized and unrealized gains or losses, purchases and sales, and
transfers in/out of the Level 3 category during the period. Additionally, U.S. GAAP requires quantitative information regarding the
Notes to Financial Statements 93
Russell Investment Funds
LifePoints® Funds Variable Target Portfolio Series
Notes to Financial Statements, continued — December 31, 2017
significant unobservable inputs used in the determination of fair value of assets categorized as Level 3 in the fair value hierarchy. In
accordance with the requirements of U.S. GAAP, a fair value hierarchy, a Level 3 reconciliation and an additional disclosure about
fair value measurements, if any, has been included in the Presentation of Portfolio Holdings for each respective Fund.
Investment Transactions
Investment transactions are reflected as of the trade date for financial reporting purposes. This may cause the NAV stated in the
financial statements to be different from the NAV at which shareholders may transact. Realized gains and losses from securities
transactions, if applicable, are recorded on the basis of specific identified cost incurred within a particular Fund.
Investment Income
Distributions of income and capital gains from the Underlying Funds are recorded on the ex-dividend date.
Federal Income Taxes
Since the Investment Company is a Massachusetts business trust, each Fund is a separate corporate taxpayer and determines its
net investment income and capital gains (or losses) and the amounts to be distributed to each Fund’s shareholders without regard
to the income and capital gains (or losses) of the other Funds.
For each year, each Fund intends to qualify or continue to qualify as a regulated investment company under Subchapter M of the
Internal Revenue Code of 1986, as amended (the “Code”) and intends to distribute all of its taxable income and capital gains.
Therefore, no federal income tax provision is required for the Funds.
Each Fund files a U.S. tax return. At December 31, 2017, the Funds had recorded no liabilities for net unrecognized tax benefits
relating to uncertain income tax positions they have taken or expect to take in future tax returns. While the statute of limitations
remains open to examine the Funds’ U.S. tax returns filed for the fiscal years ended December 31, 2014 through December 31,
2016, no examinations are in progress or anticipated at this time. The Funds are not aware of any tax positions for which it is
reasonably possible that the total amounts of unrecognized tax benefits will significantly change in the next twelve months.
The Funds comply with the authoritative guidance for uncertainty in income taxes which requires management to determine whether
a tax position of the Funds is more likely than not to be sustained upon examination, including resolution of any related appeals or
litigation processes, based on the technical merits of the position. For tax positions meeting the more likely than not threshold, the
tax amount recognized in the financial statements is reduced by the largest benefit that has a greater than 50% likelihood of being
realized upon ultimate settlement with the relevant taxing authority. Management determined that no accruals need to be made in
the financial statements due to uncertain tax positions. Management continually reviews and adjusts the Funds’ liability for income
taxes based on analyses of tax laws and regulations, as well as their interpretations, and other relevant factors.
Dividends and Distributions to Shareholders
Income dividends, capital gain distributions and return of capital, if any, are recorded on the ex-dividend date. Income dividends
are generally declared and paid quarterly. Capital gain distributions are generally declared and paid annually. An additional
distribution may be paid by the Funds to avoid imposition of federal income and excise tax on any remaining undistributed capital
gains and net investment income.
The timing and characterization of certain income and capital gain distributions are determined in accordance with federal tax
regulations which may differ from U.S. GAAP. As a result, net investment income and net realized gain (or loss) from investment
transactions for a reporting period may differ significantly from distributions during such period. The differences between tax
regulations and U.S. GAAP primarily relate to investments in options, futures, forward contracts, swap contracts, the Underlying
Funds sold at a loss, wash sale deferrals and capital loss carryforwards. Accordingly, the Funds may periodically make reclassifications
among certain of their capital accounts without impacting their NAVs.
Expenses
Expenses included in the accompanying financial statements reflect the expenses of each Fund and do not include those expenses
incurred by the Underlying Funds. Because the Underlying Funds have varied expense and fee levels and the Funds may own
different proportions of the Underlying Funds at different times, the amount of the Underlying Funds’ fees and expenses incurred
indirectly by the Funds will vary.
94 Notes to Financial Statements
Russell Investment Funds
LifePoints® Funds Variable Target Portfolio Series
Notes to Financial Statements, continued — December 31, 2017
The Funds pay their own expenses other than those expressly assumed by RIM, the Funds’ adviser, or RIFUS. Most expenses can
be directly attributed to the individual Funds. Expenses which cannot be directly attributed to a specific Fund are allocated among
all Funds principally based on their relative net assets.
Derivatives
The Funds may invest in derivatives. Derivatives are instruments or agreements whose value is derived from an underlying security
or index. They include options, futures, swaps and forwards. These instruments offer unique characteristics and risks that facilitate
the Funds’ investment strategies.
The Funds typically use derivatives in three ways: exposing cash to markets, hedging and return enhancement. In addition, the
Funds may enter into foreign exchange contracts for trade settlement purposes. The Funds may pursue their strategy of being fully
invested by exposing cash to the performance of segments of the global equity market by purchasing index futures contracts. This
is intended to cause the Funds to perform as though cash were actually invested in the global equity market.
Hedging may be used by the Funds to limit or control risks, such as adverse movements in exchange rates and interest rates. Return
enhancement can be accomplished through the use of derivatives in a Fund, including using derivatives as a substitute for holding
physical securities, and using them to express various macro views (e.g., interest rate movements, currency movements, and macro
credit strategies). By purchasing certain instruments, the Funds may more effectively achieve the desired portfolio characteristics
that assist them in meeting their investment objectives. Depending on how the derivatives are structured and utilized, the risks
associated with them may vary widely. These risks include, but are not limited to, market risk, liquidity risk, leveraging risk,
counterparty risk, basis risk, reinvestment risk, political risk, prepayment risk, extension risk, valuation risk and credit risk.
Futures, certain options and cleared swaps are traded or cleared on an exchange or central exchange clearing house. Exchange-
traded or exchange-cleared transactions generally present less counterparty risk to a Fund. The exchange’s clearing house stands
between the Fund and the broker to the contract and therefore, credit risk is generally limited to the failure of the clearing
house and the clearing member. Cleared swap contracts are subject to clearing house rules, including initial and variation margin
requirement, daily settlement of obligations and the clearing house guarantee of payments to the broker. There is, however, still
counterparty risk due to the insolvency of the broker with respect to any margin held in the brokers’ customer accounts. While
clearing members are required to segregate customer assets from their own assets, in the event of insolvency, there may be a
shortfall in the amount of margin held by the broker for its clients. Collateral and margin requirements for exchange-traded or
exchange-cleared derivatives are established through regulation, as well as set by the broker or applicable clearing house. Margin
for exchange-traded and exchange-cleared transactions are detailed in the Statements of Assets and Liabilities as cash held at the
broker for futures contracts and cash held at the broker for swap contracts, respectively. Securities pledged by a Fund for exchange-
traded and exchange-cleared transactions are noted as collateral or margin requirements in the Schedule of Investments. Typically,
the Funds and counterparties are not permitted to sell, repledge, rehypothecate or otherwise use collateral pledged by the other
party unless explicitly permitted by each respective governing agreement.
In addition, proposed regulatory changes by the Securities and Exchange Commission ("SEC") relating to a mutual fund's use of
derivatives could potentially limit or impact the Funds' ability to invest in derivatives and adversely affect the value or performance
of the Funds or their derivative investments.
The effects of derivative instruments, categorized by risk exposure, on the Statements of Assets and Liabilities and the Statements of
Operations, for the period ended December 31, 2017, if applicable, are disclosed in the Fair Value of Derivative Instruments table
following each applicable Fund’s Schedule of Investments.
Foreign Currency Exchange Contracts
The Funds may enter into foreign currency exchange spot contracts and forward foreign currency exchange contracts (“FX
contracts”). From time to time, the Funds may enter into FX contracts to hedge certain foreign currency-denominated assets. FX
contracts are recorded at fair value. Certain risks may arise upon entering into these FX contracts from the potential inability
of counterparties to meet the terms of their FX contracts and are generally limited to the amount of unrealized gain on the FX
contracts, if any, that are disclosed in the Statements of Assets and Liabilities.
For the period ended December 31, 2017, the following Funds entered into foreign currency exchange contracts primarily for the
strategies listed below:
Notes to Financial Statements 95
Russell Investment Funds
LifePoints® Funds Variable Target Portfolio Series
Notes to Financial Statements, continued — December 31, 2017
| |
| Funds | Strategies |
| Moderate Strategy Fund | Return enhancement and hedging |
| Balanced Strategy Fund | Return enhancement and hedging |
| Growth Strategy Fund | Return enhancement and hedging |
| Equity Growth Strategy Fund | Return enhancement and hedging |
The Funds’ foreign currency contract notional dollar values outstanding fluctuate throughout the fiscal year as required to meet
strategic requirements. The following tables illustrate the quarterly volume of foreign currency contracts. For the purpose of this
disclosure, volume is measured by the amounts bought and sold in USD.
| | | | | | | | | | | |
| | | | | | Outstanding Contract Amounts Sold | | | |
| Quarter Ended | March 31, 2017 | | | June 30, 2017 | | September 30, 2017 | December 31, 2017 | |
| Moderate Strategy Fund | $ | 13,798,537 | $ | 13,799,206 | $ | 14,647,976 | $ | 6,081,175 | |
| Balanced Strategy Fund | | 58,336,356 | | 64,149,195 | | 81,241,095 | | 37,651,194 | |
| Growth Strategy Fund | | 45,759,203 | | 44,289,426 | | 59,124,563 | | 24,383,881 | |
| Equity Growth Strategy Fund | | 11,491,778 | | 12,706,799 | | 16,596,406 | | 7,167,461 | |
| | | | | | Outstanding Contract Amounts Bought | | | |
| Quarter Ended | March 31, 2017 | | | June 30, 2017 | | September 30, 2017 | December 31, 2017 | |
| Moderate Strategy Fund | $ | 13,833,191 | $ | 13,765,445 | $ | 14,631,286 | $ | 6,037,115 | |
| Balanced Strategy Fund | | 58,393,681 | | 63,904,265 | | 81,320,354 | | 37,281,544 | |
| Growth Strategy Fund | | 45,820,232 | | 44,081,474 | | 59,149,517 | | 24,115,034 | |
| Equity Growth Strategy Fund | | 11,514,360 | | 12,649,708 | | 16,589,763 | | 7,130,924 | |
Options
The Funds may purchase and sell (write) call and put options on securities and securities indices. Such options are traded on a
national securities exchange or in an OTC market. The Funds may also purchase and sell (write) call and put options on foreign
currencies.
When a Fund writes a covered call or a put option, an amount equal to the premium received by the Fund is included in the Fund’s
Statement of Assets and Liabilities as an asset and as an equivalent liability. The amount of the liability is subsequently marked-
to-market to reflect the current fair value of the option written. The Fund receives a premium on the sale of a call option but gives
up the opportunity to profit from any increase in the value of the underlying instrument above the exercise price of the option, and
when the Fund writes a put option it is exposed to a decline in the price of the underlying instrument.
When a Fund sells an uncovered call option, it does not simultaneously have a long position in the underlying security. When a
Fund sells an uncovered put option, it does not simultaneously have a short position in the underlying security. Uncovered options
are riskier than covered options because there is no underlying security held by the Fund that can act as a partial hedge.
Whether an option which the Fund has written expires on its stipulated expiration date or the Fund enters into a closing purchase
transaction, the Fund realizes a gain (or loss, if the cost of a closing purchase transaction exceeds the premium received when the
option was sold) without regard to any unrealized gain or loss on the underlying security, and the liability related to such option is
extinguished. If a call option which the Fund has written is exercised, the Fund realizes a capital gain or loss from the sale of the
underlying security, and the proceeds from such sale are increased by the premium originally received. When a put option which
a Fund has written is exercised, the amount of the premium originally received will reduce the cost of the security which a Fund
purchases upon exercise of the option.
The Funds’ use of written options involves, to varying degrees, elements of market risk in excess of the amount recognized in the
Statements of Assets and Liabilities. The face or contract amounts of these instruments reflect the extent of the Funds’ exposure to
market risk. The risks may be caused by an imperfect correlation between movements in the price of the instrument and the price
of the underlying securities and interest rates.
The Funds may enter into a swaption (an option on a swap). In a swaption, in exchange for an option, the buyer gains the right but
not the obligation to enter into a specified swap agreement with the issuer on a specified future date. The writer of the contract
receives the premium and bears the risk of unfavorable changes in the preset rate on the underlying swap.
For the period ended December 31, 2017, the Funds purchased or sold options primarily for the strategies listed below:
96 Notes to Financial Statements
Russell Investment Funds
LifePoints® Funds Variable Target Portfolio Series
Notes to Financial Statements, continued — December 31, 2017
| |
| Funds | Strategies |
| Moderate Strategy Fund | Return enhancement and hedging |
| Balanced Strategy Fund | Return enhancement and hedging |
| Growth Strategy Fund | Return enhancement and hedging |
| Equity Growth Strategy Fund | Return enhancement and hedging |
The Funds’ options contracts notional amounts fluctuate throughout the fiscal year as required to meet strategic requirements. The
following table illustrates the outstanding notional of options contracts measured by notional in USD.
| | | | | | | | | | | |
| | | | Notional of Options Contracts Outstanding | | | |
| Funds | March 31, 2017 | | | June 30, 2017 | | September 30, 2017 | December 31, 2017 | |
| Moderate Strategy Fund | $ | 9,723,277 | $ | 9,393,008 | $ | 10,500,000 | $ | 16,317,500 | |
| Balanced Strategy Fund | | 49,940,648 | | 37,976,742 | | 43,500,000 | | 65,805,000 | |
| Growth Strategy Fund | | 13,725,105 | | 12,120,139 | | 13,750,000 | | 21,400,000 | |
| Equity Growth Strategy Fund | | 3,317,832 | | 3,534,422 | | 4,000,000 | | 6,152,500 | |
Futures Contracts
The Funds may invest in futures contracts (i.e., interest rate, foreign currency and index futures contracts). The face or contract
value of these instruments reflect the extent of the Funds’ exposure to off balance sheet risk. The primary risks associated with the
use of futures contracts are an imperfect correlation between the change in fair value of the securities held by the Funds and the
prices of futures contracts, and the possibility of an illiquid market. Upon entering into a futures contract, the Funds are required to
deposit with a broker an amount, termed the initial margin, which typically represents 5% to 10% of the purchase price indicated
in the futures contract. Payments to and from the broker, known as variation margin, are typically required to be made on a daily
basis as the price of the futures contract fluctuates. Changes in initial settlement value are accounted for as unrealized appreciation
(depreciation) until the contracts are terminated, at which time realized gains and losses are recognized.
For the period ended December 31, 2017, the following Funds entered into futures contracts primarily for the strategies listed
below:
| |
| Funds | Strategies |
| Moderate Strategy Fund | Return enhancement, hedging, and exposing cash to markets |
| Balanced Strategy Fund | Return enhancement, hedging, and exposing cash to markets |
| Growth Strategy Fund | Return enhancement, hedging, and exposing cash to markets |
| Equity Growth Strategy Fund | Return enhancement, hedging, and exposing cash to markets |
The Funds' futures contracts notional amounts fluctuate throughout the fiscal year as required to meet strategic requirements. The
following table illustrates the quarterly volume of futures contracts measured by notional in USD.
| | | | | | | | | | | |
| | | | Notional of Futures Contracts Outstanding | | | |
| Funds | March 31, 2017 | | | June 30, 2017 | | September 30, 2017 | December 31, 2017 | |
| Moderate Strategy Fund | $ | 23,436,061 | $ | 25,226,183 | $ | 28,883,988 | $ | 28,998,395 | |
| Balanced Strategy Fund | | 57,539,789 | | 44,373,491 | | 48,446,094 | | 45,995,345 | |
| Growth Strategy Fund | | 53,861,264 | | 58,906,855 | | 42,266,963 | | 42,629,639 | |
| Equity Growth Strategy Fund | | 12,259,297 | | 13,444,126 | | 11,543,534 | | 12,158,046 | |
| Swap Agreements | | | | | | | | | | | |
The Funds may enter into swap agreements, on either an asset-based or liability-based basis, depending on whether they are
hedging their assets or their liabilities, and will usually enter into swaps on a net basis (i.e., the two payment streams are netted
out, with the Funds receiving or paying only the net amount of the two payments). When a Fund engages in a swap, it exchanges
its obligations to pay or rights to receive payments for the obligations to pay or rights to receive payments of another party (i.e., an
exchange of floating rate payments for fixed rate payments).
The Funds may enter into several different types of swap agreements including credit default, interest rate, total return and currency
swaps. Credit default swaps are a counterparty agreement which allows the transfer of third party credit risk (the possibility that
an issuer will default on its obligation by failing to pay principal or interest in a timely manner) from one party to another. The
lender faces the credit risk from a third party and the counterparty in the swap agrees to insure this risk in exchange for regular
periodic payments. Interest rate swaps are a counterparty agreement, can be customized to meet each party’s needs, and involve
the exchange of a fixed or variable payment per period for a payment that is not fixed. Equity swaps are a counterparty agreement
where two parties exchange two sets of cash flows on predetermined dates for an agreed upon amount of time. The cash flows will
Notes to Financial Statements 97
Russell Investment Funds
LifePoints® Funds Variable Target Portfolio Series
Notes to Financial Statements, continued — December 31, 2017
typically be an equity index value swapped with a floating rate such as LIBOR plus or minus a pre-defined spread. Total return
swap agreements are a counterparty agreement intended to expose cash to markets or to effect investment transactions consistent
with those Funds’ investment objectives and strategies. Currency swaps are a counterparty agreement where two parties exchange
specified amounts of different currencies which are followed by each paying the other a series of interest payments that are based
on the principal cash flow. At maturity the principal amounts are returned.
The Funds generally expect to enter into these transactions primarily to preserve a return or spread on a particular investment or
portion of their portfolios or to protect against any increase in the price of securities they anticipate purchasing at a later date, or for
return enhancement. Under most swap agreements entered into by a Fund, the parties' obligations are determined on a "net basis".
The net amount of the excess, if any, of the Funds’ obligations over their entitlements with respect to each swap will be accrued on a
daily basis and an amount of cash or liquid assets having an aggregate NAV at least equal to the accrued excess will be segregated.
To the extent that the Funds enter into swaps on other than a net basis, the amount maintained in a segregated account will be the
full amount of the Funds’ obligations, if any, with respect to such swaps, accrued on a daily basis. If there is a default by the other
party to such a transaction, the Funds will have contractual remedies pursuant to the agreement related to the transaction.
A Fund may not receive the expected amount under a swap agreement if the other party to the agreement defaults or becomes
bankrupt.
Credit Default Swaps
The Funds may enter into credit default swaps. A credit default swap can refer to corporate issues, government issues, asset-backed
securities or an index of assets, each known as the reference entity or underlying asset. Funds may act as either the buyer or the
seller of a credit default swap involving one party making a stream of payments to another party in exchange for the right to receive a
specified return in the event of a default or other credit event. Depending upon the terms of the contract, the credit default swap may
be closed via physical settlement. However, due to the possible or potential instability in the market, there is a risk that the Funds
may be unable to deliver the underlying debt security to the other party to the agreement. Additionally, the Funds may not receive
the expected amount under the swap agreement if the other party to the agreement defaults or becomes bankrupt. In an unhedged
credit default swap, Funds enter into a credit default swap without owning the underlying asset or debt issued by the reference
entity. Credit default swaps allow Funds to acquire or reduce credit exposure to a particular issuer, asset or basket of instruments.
As the seller of protection in a credit default swap, a Fund would be required to pay the par or other agreed-upon value (or otherwise
perform according to the swap contract) of a reference debt obligation to the counterparty in the event of a default (or other specified
credit event) and the counterparty would be required to surrender the reference debt obligation. In return, the Fund would receive
from the counterparty a periodic stream of payments over the term of the contract provided that no credit event has occurred. If no
credit event occurs, the Fund would keep the stream of payments and would have no payment obligations. As a seller of protection,
the Fund would effectively add leverage to its portfolio because, in addition to its total net assets, that Fund would be subject to
investment exposure on the notional amount of the swap.
The Funds may also purchase protection via credit default swap contracts in order to offset the risk of default of debt securities held
in their portfolios or to take a short position in a debt security, in which case the Fund would function as the counterparty referenced
in the preceding paragraph.
If a credit event occurs and cash settlement is not elected, a variety of other deliverable obligations may be delivered in lieu of
the specific referenced obligation. The ability to deliver other obligations may result in a cheapest-to-deliver option (the buyer of
protection’s right to choose the deliverable obligation with the lowest value following a credit event). The Funds may use credit
default swaps to provide a measure of protection against defaults of the issuers (i.e., to reduce risk where Funds own or have
exposure to the referenced obligation) or to take an active long or short position with respect to the likelihood (as measured by the
credit default swap’s spread) of a particular issuer’s default.
Deliverable obligations for credit default swaps on asset-backed securities in most instances are limited to the specific referenced
obligation as performance for asset-backed securities can vary across deals. Prepayments, principal paydowns, and other writedown
or loss events on the underlying mortgage loans will reduce the outstanding principal balance of the referenced obligation. These
reductions may be temporary or permanent as defined under the terms of the swap agreement and the notional amount for the swap
agreement generally will be adjusted by corresponding amounts. The Funds may use credit default swaps on asset-backed securities
to provide a measure of protection against defaults (or other defined credit events) of the referenced obligation or to take an active
long or short position with respect to the likelihood of a particular referenced obligation’s default (or another defined credit event).
98 Notes to Financial Statements
Russell Investment Funds
LifePoints® Funds Variable Target Portfolio Series
Notes to Financial Statements, continued — December 31, 2017
Credit default swap agreements on credit indices involve one party making a stream of payments to another party in exchange for
the right to receive a specified return in the event of a write-down, principal shortfall, interest shortfall or default of all or part of
the referenced entities comprising the credit index. A credit index is a basket of credit instruments or exposures designed to be
representative of some part of the credit market as a whole. These indices are made up of reference credits that are judged by a
poll of dealers to be the most liquid entities in the credit default swap market based on the sector of the index. Components of the
indices may include, but are not limited to, investment grade securities, high yield securities, asset-backed securities, emerging
markets, and/or various credit ratings within each sector. Credit indices are traded using credit default swaps with standardized
terms including a fixed spread and standard maturity dates. An index credit default swap references all the names in the index, and
if there is a default, the credit event is settled based on that name’s weight in the index. The composition of the indices changes
periodically, usually every six months, and, for most indices, each name has an equal weight in the index. Traders may use credit
default swaps on indices to speculate on changes in credit quality.
Implied credit spreads, represented in absolute terms, utilized in determining the fair value of credit default swap agreements on
corporate issues as of period-end are disclosed in the Schedules of Investments and generally serve as an indicator of the current
status of the payment/performance risk and represent the likelihood or risk of default (or other defined credit event) for the credit
derivative. The implied credit spread of a particular referenced entity reflects the cost of entering into a credit default swap and
may include upfront payments required to be made to enter into the agreement. For credit default swap agreements on asset-
backed securities and credit indices, the quoted market prices and resulting values serve as the indicator of the current status of
the payment/performance risk. Wider credit spreads and increasing fair values, in absolute terms when compared to the notional
amount of the swap, generally represent a deterioration of the referenced entity’s credit soundness and a greater likelihood or risk
of default or other credit event occurring as defined under the terms of the agreement. The maximum potential amount of future
payments (undiscounted) that Funds as a seller of protection could be required to make under a credit default swap agreement
equals the notional amount of the agreement. Notional amounts of all credit default swap agreements outstanding as of December
31, 2017, for which a Fund is the seller of protection are disclosed in the Schedules of Investments. These potential amounts would
be partially offset by any recovery values of the respective referenced obligations, upfront payments received upon entering into the
agreement, or net amounts received from the settlement of buy protection credit default swap agreements entered into by a Fund for
the same referenced entity or entities.
Credit default swaps could result in losses if the Funds do not correctly evaluate the creditworthiness of the company or companies
on which the credit default swap is based. Credit default swap agreements may involve greater risks than if the Funds had invested
in the reference obligation directly since, in addition to risks relating to the reference obligation, credit default swaps are subject
to illiquidity and counterparty risk. A Fund will generally incur a greater degree of risk when it sells a credit default swap than
when it purchases a credit default swap. As a buyer of a credit default swap, a Fund may lose its investment and recover nothing
should a credit event fail to occur and the swap is held to its termination date. As seller of a credit default swap, if a credit event
were to occur, the value of any deliverable obligation received by a Fund, coupled with the upfront or periodic payments previously
received, may be less than what it pays to the buyer, resulting in a loss of value to the Fund.
If the creditworthiness of a Fund’s swap counterparty declines, the risk that the counterparty may not perform could increase,
potentially resulting in a loss to the Fund. To limit the counterparty risk involved in swap agreements, the Funds will only enter
into swap agreements with counterparties that meet certain standards of creditworthiness. Although there can be no assurance that
the Funds will be able to do so, the Funds may be able to reduce or eliminate their exposure under a swap agreement either by
assignment or other disposition, or by entering into an offsetting swap agreement with the same party or another creditworthy party.
The Funds may have limited ability to eliminate their exposure under a credit default swap if the credit quality of the reference
entity or underlying asset has declined.
For the period ended December 31, 2017, the Funds entered into credit default swaps primarily for the strategies listed below:
| |
| Funds | Strategies |
| Moderate Strategy Fund | Return enhancement, hedging and exposing cash to markets |
| Balanced Strategy Fund | Return enhancement, hedging and exposing cash to markets |
| Growth Strategy Fund | Return enhancement, hedging and exposing cash to markets |
| Equity Growth Strategy Fund | Return enhancement, hedging and exposing cash to markets |
The Funds' credit default swap contract notional amounts outstanding fluctuate throughout the fiscal year as required to meet
strategic requirements. The following table illustrates the quarterly volume of credit default swap contracts. For the purpose of this
disclosure, volume is measured by notional amounts outstanding in USD at each quarter end.
Notes to Financial Statements 99
Russell Investment Funds
LifePoints® Funds Variable Target Portfolio Series
Notes to Financial Statements, continued — December 31, 2017
| | | | | | | | | | | |
| | | | Credit Default Swap Notional Amounts Outstanding | | | |
| Quarter Ended | March 31, 2017 | | | June 30, 2017 | | September 30, 2017 | December 31, 2017 | |
| Moderate Strategy Fund | $ | 6,500,000 | $ | 6,500,000 | $ | 7,900,000 | $ | 7,768,000 | |
| Balanced Strategy Fund | | 22,700,061 | | 22,700,000 | | 26,200,000 | | 15,105,000 | |
| Growth Strategy Fund | | 9,900,006 | | 9,900,000 | | 26,900,000 | | 26,831,000 | |
| Equity Growth Strategy Fund | | | — | | | — | | 9,500,000 | | 3,900,000 | |
Total Return Swaps
The Funds may enter into total return swap agreements to expose cash to markets or to effect investment transactions. Total return
swap agreements are two party contracts entered into primarily by institutional investors for periods ranging from a few weeks to
more than one year. In a standard total return swap transaction, the two parties agree to exchange the returns (or differentials in
rates of return) earned or realized on particular investments or instruments.
The returns to be exchanged between the parties are calculated with respect to a “notional amount” (i.e., a specified dollar amount
that is hypothetically invested in a “basket” of securities representing a particular index).
For the period ended December 31, 2017, the Funds entered into total return swaps primarily for the strategies listed below:
| |
| Funds | Strategies |
| Moderate Strategy Fund | Return enhancement and hedging |
| Balanced Strategy Fund | Return enhancement and hedging |
| Growth Strategy Fund | Return enhancement and hedging |
| Equity Growth Strategy Fund | Return enhancement and hedging |
The Funds' total return swap contract notional amounts outstanding fluctuate throughout the fiscal year as required to meet strategic
requirements. The following table illustrates the quarterly volume of total return swap contracts. For the purpose of this disclosure,
volume is measured by notional amounts outstanding in USD at each quarter end.
| | | | | | | | | |
| | | Total Return Swap Notional Amounts Outstanding | | | |
| Quarter Ended | March 31, 2017 | | June 30, 2017 | | September 30, 2017 | December 31, 2017 | |
| Moderate Strategy Fund | $ | — | $ | | 9,295,423 | $ | 10,498,000 | $ | 10,699,981 | |
| Balanced Strategy Fund | | — | 37,599,304 | | 42,999,189 | | 43,299,987 | |
| Growth Strategy Fund | | — | 11,998,180 | | 13,500,196 | | 13,999,992 | |
| Equity Growth Strategy Fund | | — | 3,495,755 | | 3,999,699 | | 3,999,998 | |
Master Agreements
The Funds are parties to International Swaps and Derivatives Association, Inc. Master Agreements (“ISDA Master Agreements”)
with counterparties that govern transactions in OTC derivative and foreign exchange contracts entered into by the Funds and
those counterparties. The ISDA Master Agreements contain provisions for general obligations, representations, agreements,
collateral and events of default or termination. Events of termination and default include conditions that may entitle either party
to elect to terminate early and cause settlement of all outstanding transactions under the applicable ISDA Master Agreement.
Any election to terminate early could be material to the financial statements. Since different types of forward and OTC financial
derivative transactions have different mechanics and are sometimes traded out of different legal entities of a particular counterparty
organization, each type of transaction may be covered by a different ISDA Master Agreement, resulting in the need for multiple
agreements with a single counterparty. As the ISDA Master Agreements are specific to unique operations of different asset types,
they allow a Fund to net its total exposure to a counterparty in the event of a default with respect to all the transactions governed
under a single agreement with a counterparty.
Master Securities Forward Transaction Agreements (“Master Forward Agreements”) govern the considerations and factors
surrounding the settlement of certain forward settling transactions, such as delayed delivery by and between a Fund and select
counterparties. The Master Forward Agreements maintain provisions for, among other things, initiation and confirmation, payment
and transfer, events of default, termination, and maintenance of collateral.
Disclosure about Offsetting Assets and Liabilities
Balance sheet disclosure is based on various netting agreements between brokers and counterparties, such as ISDA Master
Agreements and Master Forward Agreements. The Funds utilize multiple counterparties. The quantitative disclosure begins with
disaggregation of counterparties by legal entity and the roll up of the data to reflect a single counterparty in the table within the
100 Notes to Financial Statements
Russell Investment Funds
LifePoints® Funds Variable Target Portfolio Series
Notes to Financial Statements, continued — December 31, 2017
Funds’ financial statements. Net exposure represents the net receivable (payable) that would be due from/to the counterparty in the
event of default. Exposure from OTC derivatives can only be netted across transactions governed under the same Master Agreement
with the same legal entity.
Guarantees
In the normal course of business, the Funds enter into contracts that contain a variety of representations which provide general
indemnifications. The Funds’ maximum exposure under these arrangements is unknown as this would involve future claims that
may be made against the Funds that have not yet occurred. However, the Funds expect the risk of loss to be remote.
Market, Credit and Counterparty Risk
In the normal course of business, the Funds and Underlying Funds trade financial instruments and enter into financial transactions
where risk of potential loss exists due to changes in the market (market risk) or failure of the other party to a transaction to perform
(credit risk). Similar to credit risk, the Funds and Underlying Funds may also be exposed to counterparty risk or risk that an
institution or other entity with which the Funds or Underlying Funds have unsettled or open transactions will default. The potential
loss could exceed the value of the relevant assets recorded in the Funds' and Underlying Funds' financial statements (the “Assets”).
The Assets consist principally of cash due from counterparties and investments. The extent of the Funds' and Underlying Funds'
exposure to market, credit and counterparty risks with respect to the Assets approximates their carrying value as recorded in the
Funds' and Underlying Funds' Statements of Assets and Liabilities.
Global economies and financial markets are becoming increasingly interconnected and political and economic conditions (including
recent instability and volatility) and events (including natural disasters) in one country, region or financial market may adversely
impact issuers in a different country, region or financial market. As a result, issuers of securities held by a Fund or an Underlying
Fund may experience significant declines in the value of their assets and even cease operations. Such conditions and/or events may
not have the same impact on all types of securities and may expose a Fund or an Underlying Fund to greater market and liquidity
risk and potential difficulty in valuing portfolio instruments held. This could cause a Fund or an Underlying Fund to underperform
other types of investments.
3. Investment Transactions
Securities
During the period ended December 31, 2017, purchases and sales of investment securities (excluding short-term investments,
options and futures) were as follows:
| | | | | | |
| | | Purchases | | | Sales | |
| Moderate Strategy Fund | $ | 21,813,707 | | $ | 22,621,696 | |
| Balanced Strategy Fund | | 100,299,694 | | | 108,999,592 | |
| Growth Strategy Fund | | 59,843,521 | | | 63,454,163 | |
| Equity Growth Strategy Fund | | 20,587,985 | | | 17,991,209 | |
4. Related Party Transactions, Fees and Expenses
Adviser, Administrator, Transfer and Dividend Disbursing Agent
RIM provides or oversees the provision of all investment advisory and portfolio management services for the Funds, including
developing the investment program for each Fund and managing each Fund's overall exposures. RIFUS is the Funds' administrator
and transfer agent. RIFUS, in its capacity as the Funds' administrator, provides or oversees the provision of all administrative
services for the Funds. RIFUS, in its capacity as the Funds' transfer agent and dividend disbursing agent, is responsible for
providing transfer agency and dividend disbursing services to the Funds. RIFUS is a wholly-owned subsidiary of RIM. RIM is an
indirect, wholly-owned subsidiary of Russell Investments Group, Ltd., a Cayman company.
The Funds are permitted to invest their cash (i.e., cash awaiting investment or cash held to meet redemption requests or to pay
expenses) in the U.S. Cash Management Fund, an unregistered fund advised by RIM. As of December 31, 2017, the Funds had
invested $47,809 in the U.S. Cash Management Fund.
Notes to Financial Statements 101
Russell Investment Funds
LifePoints® Funds Variable Target Portfolio Series
Notes to Financial Statements, continued — December 31, 2017
An affiliated company is a company in which a Fund has ownership of at least 5% of the voting securities or which the Fund
controls, is controlled by or is under common control with. See each Fund’s Related Party Transactions, Fees and Expenses for
disclosure of transactions with affiliated companies.
The advisory fee of 0.20% is based upon the average daily net assets of each Fund and the administrative fee of up to 0.0425%
is based on the combined average daily net assets of the Funds. Advisory and administration fees are paid monthly. The following
table shows the total amount of each of these fees paid by the Funds for the period ended December 31, 2017:
| | | | | | |
| | | Advisory | | | Administrative | |
| Moderate Strategy Fund | $ | 220,446 | | $ | 46,845 | |
| Balanced Strategy Fund | | 581,926 | | | 123,659 | |
| Growth Strategy Fund | | 425,041 | | | 90,321 | |
| Equity Growth Strategy Fund | | 104,345 | | | 22,173 | |
RIM has agreed to certain waivers of its advisory fees as follows:
For the Moderate Strategy Fund, RIM has contractually agreed, until April 30, 2018, to waive up to the full amount of its 0.20%
advisory fee and then to reimburse the Fund for other direct Fund-level expenses to the extent that direct Fund-level expenses
exceed 0.14% of the average daily net assets of the Fund on an annual basis. Direct Fund-level expenses do not include extraordinary
expenses or the expenses of other investment companies in which the Fund invests, including the Underlying Funds, which are
borne indirectly by the Fund. This waiver and reimbursement may not be terminated during the relevant period except with Board
approval.
For the Balanced Strategy Fund, RIM has contractually agreed, until April 30, 2018, to waive up to the full amount of its 0.20%
advisory fee and then to reimburse the Fund for other direct Fund-level expenses to the extent that direct Fund-level expenses
exceed 0.14% of the average daily net assets of the Fund on an annual basis. Direct Fund-level expenses do not include extraordinary
expenses or the expenses of other investment companies in which the Fund invests, including the Underlying Funds, which are
borne indirectly by the Fund. This waiver and reimbursement may not be terminated during the relevant period except with Board
approval.
For the Growth Strategy Fund, RIM has contractually agreed, until April 30, 2018, to waive up to the full amount of its 0.20% advisory
fee and then to reimburse the Fund for other direct Fund-level expenses to the extent that direct Fund-level expenses exceed 0.15%
of the average daily net assets of the Fund on an annual basis. Direct Fund-level expenses do not include extraordinary expenses or
the expenses of other investment companies in which the Fund invests, including the Underlying Funds, which are borne indirectly
by the Fund. This waiver and reimbursement may not be terminated during the relevant period except with Board approval.
For the Equity Growth Strategy Fund, RIM has contractually agreed, until April 30, 2018, to waive up to the full amount of its
0.20% advisory fee and then to reimburse the Fund for other direct Fund-level expenses to the extent that direct Fund-level
expenses exceed 0.15% of the average daily net assets of the Fund on an annual basis. Direct Fund-level expenses do not include
extraordinary expenses or the expenses of other investment companies in which the Fund invests, including the Underlying Funds,
which are borne indirectly by the Fund. This waiver and reimbursement may not be terminated during the relevant period except
with Board approval.
For the period ended December 31, 2017, RIM waived/reimbursed the following expenses:
| | | | | | | | | |
| | | Waiver | | Reimbursement | | | Total | |
| Moderate Strategy Fund | $ | 220,446 | | $ | 25,391 | | $ | 245,837 | |
| Balanced Strategy Fund | | 510,347 | | | — | | | 510,347 | |
| Growth Strategy Fund | | 375,147 | | | — | | | 375,147 | |
| Equity Growth Strategy Fund | | 104,345 | | | 47,122 | | | 151,467 | |
RIM does not have the ability to recover amounts waived or reimbursed from previous periods.
102 Notes to Financial Statements
Russell Investment Funds
LifePoints® Funds Variable Target Portfolio Series
Notes to Financial Statements, continued — December 31, 2017
Transfer and Dividend Disbursing Agent
RIFUS serves as transfer agent and provides dividend disbursing services to the Funds. For this service, RIFUS is paid a fee based
upon the average daily net assets of the Funds for transfer agency and dividend disbursing services. RIFUS retains a portion of this
fee for its services provided to the Funds and pays the balance to unaffiliated agents who assist in providing these services. Transfer
agency fees paid by the Funds presented herein for the period ended December 31, 2017 were as follows:
| | | |
| | | Amount | |
| Moderate Strategy Fund | $ | 4,850 | |
| Balanced Strategy Fund | | 12,802 | |
| Growth Strategy Fund | | 9,351 | |
| Equity Growth Strategy Fund | | 2,296 | |
Distributor
Russell Investments Financial Services, LLC (the “Distributor”), a wholly-owned subsidiary of RIM, is the distributor for the
Investment Company pursuant to a distribution agreement with the Investment Company. The Distributor receives no compensation
from the Investment Company for its services.
Affiliated Brokerage Transactions
The Funds effect certain transactions through Russell Investments Implementation Services, LLC (“RIIS”). RIIS is a registered
broker and investment adviser and an affiliate of RIM. RIIS uses a multi-venue trade management approach whereby RIIS allocates
trades among RIIS’ network of independent brokers for execution, clearing and other services. RIM has authorized RIIS to effect
certain futures, swaps, OTC derivative transactions, and cleared swaps, including foreign currency spots, forwards and options
trading on behalf of the Funds.
Board of Trustees
The Russell Investments Fund Complex consists of RIC, which has 34 funds and RIF, which has 9 funds. Each of the Trustees is
a Trustee of RIC and RIF. The Russell Investments Fund Complex compensates each Trustee who is not an employee of RIM or
its affiliates. Trustee compensation and expenses are allocated to each Fund based on its net assets relative to other funds in the
Russell Investments Fund Complex.
For the period ended December 31, 2017, the regular compensation paid to the Trustees by the Russell Investments Fund Complex
was $1,394,250.
5. Federal Income Taxes
At December 31, 2017, none of the Funds had capital losses available for carryforwards.
6. Record Ownership
As of December 31, 2017, the following table includes shareholders of record with greater than 10% of the total outstanding shares
of each respective Fund.
| | | | | | |
| | # of Shareholders | | | % | |
| Moderate Strategy Fund | | 1 | | | 90.1 | |
| Balanced Strategy Fund | | 1 | | | 90.4 | |
| Growth Strategy Fund | | 2 | | | 97.8 | |
| Equity Growth Strategy Fund | | 2 | | | 97.1 | |
7. Subsequent Events
Management has evaluated the events and /or transactions that have occurred through the date the financial statements were issued
and noted no events have occurred that require disclosure.
Notes to Financial Statements 103
Report of Independent Registered Public Accounting Firm
To the Board of Trustees of Russell Investment Funds and Shareholders of Moderate Strategy Fund, Balanced Strategy Fund, Growth
Strategy Fund and Equity Growth Strategy Fund
Opinions on the Financial Statements
We have audited the accompanying statements of assets and liabilities, including the schedules of investments, of Moderate Strategy
Fund, Balanced Strategy Fund, Growth Strategy Fund and Equity Growth Strategy Fund (four of the funds constituting Russell
Investment Funds, hereafter collectively referred to as the “Funds”) as of December 31, 2017, the related statements of operations
for the year ended December 31, 2017, the statements of changes in net assets for each of the two years in the period ended
December 31, 2017, including the related notes, and the financial highlights for each of the five years in the period ended December
31, 2017 (collectively referred to as the “financial statements”). In our opinion, the financial statements present fairly, in all material
respects, the financial position of each of the Funds as of December 31, 2017, the results of each of their operations for the year
then ended, the changes in each of their net assets for each of the two years in the period ended December 31, 2017 and each of
the financial highlights for each of the five years in the period ended December 31, 2017 in conformity with accounting principles
generally accepted in the United States of America.
Basis for Opinions
These financial statements are the responsibility of the Funds’ management. Our responsibility is to express an opinion on the
Funds’ financial statements based on our audits. We are a public accounting firm registered with the Public Company Accounting
Oversight Board (United States) (“PCAOB”) and are required to be independent with respect to the Funds in accordance with the
U.S. federal securities laws and the applicable rules and regulations of the Securities and Exchange Commission and the PCAOB.
We conducted our audits of these financial statements in accordance with the standards of the PCAOB. Those standards require
that we plan and perform the audit to obtain reasonable assurance about whether the financial statements are free of material
misstatement, whether due to error or fraud.
Our audits included performing procedures to assess the risks of material misstatement of the financial statements, whether due to
error or fraud, and performing procedures that respond to those risks. Such procedures included examining, on a test basis, evidence
regarding the amounts and disclosures in the financial statements. Our audits also included evaluating the accounting principles
used and significant estimates made by management, as well as evaluating the overall presentation of the financial statements. Our
procedures included confirmation of securities owned as of December 31, 2017 by correspondence with the transfer agents and
brokers; when replies were not received from brokers, we performed other auditing procedures. We believe that our audits provide a
reasonable basis for our opinions.

We have served as the auditor of one or more investment companies in the Russell Investments family of funds since 1981.
104 Report of Independent Registered Public Accounting Firm
Russell Investment Funds
LifePoints® Funds Variable Target Portfolio Series
Tax Information— December 31, 2017 (Unaudited)
For the tax year ended December 31, 2017, the Funds hereby designate 100% or the maximum amount allowable, of its net taxable
income as qualified dividends taxed at individual net capital gain rates.
The Form 1099 you receive in January 2018 will show the tax status of all distributions paid to your account in calendar year 2017.
The Funds designate dividends distributed during the fiscal year as qualifying for the dividends received deduction for corporate
shareholders as follows:
| | |
| Moderate Strategy | 7.2 | % |
| Balanced Strategy | 11.2 | % |
| Growth Strategy | 15.8 | % |
| Equity Growth Strategy | 16.7 | % |
Pursuant to Section 852 of the Internal Revenue Code, the Funds designate the following amounts as long-term capital gain
dividends for their taxable year ended December 31, 2017:
| | |
| Moderate Strategy | $ | 1,062,756 |
| Balanced Strategy | $ | 12,048,254 |
| Growth Strategy | $ | 3,930,654 |
| Equity Growth Strategy | $ | 793,264 |
Tax Information 105
Russell Investment Funds
LifePoints® Funds Variable Target Portfolio Series
Shareholder Requests for Additional Information — December 31, 2017 (Unaudited)
A complete unaudited schedule of investments is made available generally no later than 60 days after the end of the first and third
quarters of each fiscal year. These reports are available (i) free of charge, upon request, by calling the Funds at (800) 787-7354; (ii)
on the Securities and Exchange Commission's website at www.sec.gov; and (iii) at the Securities and Exchange Commission’s Office of
Investor Education and Advocacy (formerly, the Public Reference room).
The Board has delegated to RIM, as RIF’s investment adviser, the primary responsibility for monitoring, evaluating and voting proxies
solicited by or with respect to issuers of securities in which assets of the Underlying Funds may be invested. RIM has established a proxy
voting committee and has adopted written proxy voting policies and procedures (“P&P”) and proxy voting guidelines (“Guidelines”).
The Funds maintain a Portfolio Holdings Disclosure Policy that governs the timing and circumstances of disclosure to shareholders
and third parties of information regarding the portfolio investments held by the Funds. A description of the P&P, Guidelines, Portfolio
Holdings Disclosure Policy and additional information about Fund Trustees are contained in the Funds’ Statement of Additional
Information (“SAI”). The SAI and information regarding how the Underlying Funds voted proxies relating to portfolio securities during
the most recent 12-month period ended June 30, 2017 are available (i) free of charge, upon request, by calling the Funds at (800) 787-
7354, and (ii) on the Securities and Exchange Commission's website at www.sec.gov.
If possible, depending on contract owner registration and address information, and unless you have otherwise opted out, only one copy
of the RIF prospectus and each annual and semi-annual report will be sent to contract owners at the same address. If you would like
to receive a separate copy of these documents, please contact your Insurance Company. If you currently receive multiple copies of the
prospectus, annual report and semi-annual report and would like to request to receive a single copy of these documents in the future,
please call your Insurance Company.
Some Insurance Companies may offer electronic delivery of the Funds’ prospectuses and annual and semi-annual reports. Please
contact your Insurance Company for further details.
Financial statements of the Underlying Funds can be obtained at no charge by calling the Funds at (800) 787-7354.
106 Shareholder Requests for Additional Information
Russell Investment Funds
LifePoints® Funds Variable Target Portfolio Series
Disclosure of Information about Fund Trustees and Officers — December 31, 2017
(Unaudited)
The following tables provide information for each officer and trustee of the Russell Investments Fund Complex. The Russell Investments
Fund Complex consists of Russell Investment Company (“RIC”), which has 34 funds and Russell Investment Funds (“RIF”), which
has 9 funds. Each of the trustees is a trustee of RIC and RIF. The first table provides information for the interested trustee. The second
table provides information for the independent trustees. The third table provides information for the Trustee Emeritus. The fourth table
provides information for the officers. Furthermore, each Trustee possesses the following specific attributes: Mr. Alston has business,
financial and investment experience as a senior executive of an international real estate firm and is trained as a lawyer; Ms. Blake has
had experience as a certified public accountant and has had experience as a member of boards of directors/trustees of other investment
companies; Ms. Burgermeister has had experience as a certified public accountant and as a member of boards of directors/trustees of
other investment companies and has been determined by the Board to be an “audit committee financial expert”; Mr. Connealy has had
experience with other investment companies and their investment advisers, first as a partner in the investment management practice of
PricewaterhouseCoopers LLP and, subsequently, as the senior financial executive of two other investment organizations sponsoring and
managing investment companies; Ms. Krysty has had business, financial and investment experience as the founder and senior executive
of a registered investment adviser focusing on high net worth individuals as well as a certified public accountant and a member of the
boards of other corporations and non-profit organizations; Mr. Tennison has had business, financial and investment experience as a senior
executive of a corporation with international activities and was trained as an accountant; and Mr. Thompson has had experience in business,
governance, investment and financial reporting matters as a senior executive of an organization sponsoring and managing other investment
companies, and, subsequently, has served as a board member of other investment companies. Mr. Spina has had experience with other
financial services companies, including companies engaged in the sponsorship, management and distribution of investment companies.
As a senior officer and/or director of the Funds, the Adviser and various affiliates of the Adviser providing services to the Funds, Mr.
Spina is in a position to provide the Board with such parties' perspectives on the management, operations and distribution of the Funds.
| | | | | |
| Name, | Position(s) Held | Term | Principal Occupation(s) | No. of | Other |
| Age, | With Fund and | of | During the | Portfolios | Directorships |
| Address | Length of | Office * | Past 5 Years | in Russell | Held by Trustee |
| | Time Served | | | Investments | During the |
| | | | | Fund | Past 5 Years |
| | | | | Complex | |
| | | | | Overseen | |
| | | | | by Trustee | |
| |
| INTERESTED TRUSTEE | | | | | |
| Mark Spina, # | Trustee since 2017 | Appointed until | • President and CEO, RIC and RIF | 43 | None |
| Born June 8, 1970 | President and Chief | successor is | • Chairman of the Board, President, | | |
| 1301 Second Avenue, | Executive Officer | duly elected and | Russell Investments Financial | | |
| 18th Floor, Seattle, WA | since 2017 | qualified | Services, LLC (“RIFIS”) | | |
| 98101 | | Appointed | • Director, RIM. | | |
| | | until successor | • From 2015-2016, Head of | | |
| | | is chosen and | Intermediary Distribution and | | |
| | | qualified by | President of Pioneer Funds | | |
| | | Trustees | Distributor | | |
| | | | • From 2008-2015 Head of | | |
| | | | Intermediary Distribution, Voya | | |
| | | | Investment Management | | |
| |
| |
| INDEPENDENT TRUSTEES | | | | | |
| Thaddas L. Alston, | Trustee since 2006 | Appointed until | Senior Vice President, Larco | 43 | Until October |
| Born April 7, 1945 | | successor is | Investments, Ltd. (real estate firm) | | 2015, Trustee, |
| 1301 Second Avenue, | | duly elected and | | | Russell |
| 18th Floor, Seattle, WA | | qualified | | | Exchange |
| 98101 | | | | | Traded Funds |
| | | | | | Trust |
Disclosure of Information about Fund Trustees and Officers 107
Russell Investment Funds
LifePoints® Funds Variable Target Portfolio Series
Disclosure of Information about Fund Trustees and Officers, continued — December
31, 2017 (Unaudited)
| | | | | | |
| | Name, | Position(s) Held | Term | Principal Occupation(s) | No. of | Other |
| | Age, | With Fund and | of | During the | Portfolios | Directorships |
| | Address | Length of | Office * | Past 5 Years | in Russell | Held by Trustee |
| | | Time Served | | | Investments | During the |
| | | | | | Fund | Past 5 Years |
| | | | | | Complex | |
| | | | | | Overseen | |
| | | | | | by Trustee | |
| |
| Kristianne Blake, | Trustee since 2000 | Appointed until | • Lead Independent Director, | 43 | • Lead |
| Born January 22, 1954 | Chairman since 2005 | successor is | Avista Corp (electric utilities) | | Independent |
| 1301 Second Avenue, | | duly elected and | • Until May 2017, Director | | Director, |
| 18th Floor, Seattle, WA | | qualified | and Chairman of the Audit | | Avista Corp |
| 98101 | | | Approved | Committee, Avista Corp (electric | | (electric |
| | | | annually | utilities) | | utilities) |
| | | | | • Regent, University of Washington | | • Until May |
| | | | | • President, Kristianne Gates | | 2017, |
| | | | | Blake, P. S. (accounting services) | | Director, |
| | | | | • Until June 30, 2014, Director, | | Avista Corp |
| | | | | Ecova (total energy and | | (electric |
| | | | | sustainability management) | | utilities) |
| | | | | • Until December 31, 2013, Trustee | | • Until June |
| | | | | and Chairman of the Operations | | 30, 2014, |
| | | | | Committee, Principal Investors | | Director, |
| | | | | Funds and Principal Variable | | Ecova (total |
| | | | | Contracts Funds (investment | | energy and |
| | | | | company) | | sustainability |
| | | | | | | management) |
| | | | | | | • Until |
| | | | | | | December 31, |
| | | | | | | 2013, Trustee, |
| | | | | | | Principal |
| | | | | | | Investors |
| | | | | | | Funds |
| | | | | | | (investment |
| | | | | | | company) |
| | | | | | | • Until |
| | | | | | | December 31, |
| | | | | | | 2013, Trustee |
| | | | | | | Principal |
| | | | | | | Variable |
| | | | | | | Contracts |
| | | | | | | Funds |
| | | | | | | (investment |
| | | | | | | company) |
| | | | | | | • Until October |
| | | | | | | 2015, Trustee, |
| | | | | | | Russell |
| | | | | | | Exchange |
| | | | | | | Traded Funds |
| | | | | | | Trust |
| |
| |
| |
| * | Each Trustee is subject to mandatory retirement at age 75. | | | |
| # | Mr. Spina is also an officer and/or director of one or more affiliates of RIC and RIF and is therefore an Interested Trustee. | | |
108 Disclosure of Information about Fund Trustees and Officers
Russell Investment Funds
LifePoints® Funds Variable Target Portfolio Series
Disclosure of Information about Fund Trustees and Officers, continued — December
31, 2017 (Unaudited)
| | | | | |
| Name, | Position(s) Held | Term | Principal Occupation(s) | No. of | Other |
| Age, | With Fund and | of | During the | Portfolios | Directorships |
| Address | Length of | Office * | Past 5 Years | in Russell | Held by Trustee |
| | Time Served | | | Investments | During the |
| | | | | Fund | Past 5 Years |
| | | | | Complex | |
| | | | | Overseen | |
| | | | | by Trustee | |
| |
| INDEPENDENT TRUSTEES (continued) | | | | |
| Cheryl Burgermeister, | Trustee since 2012 | Appointed until | • Retired | 43 | • Trustee and |
| Born June 26, 1951 | Chairman of the | successor is | • Trustee and Chairperson of | | Chairperson of |
| 1301 Second Avenue, | Audit Committee | duly elected and | Select Sector SPDR Funds | | Select Sector |
| 18th Floor, Seattle, WA | since 2017 | qualified | (investment company) | | SPDR Funds |
| 98101 | | Appointed until | • Until December 31, 2014, | | (investment |
| | | successor is | Chairperson of Audit Committee, | | company) |
| | | duly elected and | Select Sector SPDR Funds | | • From August |
| | | qualified | (investment company) | | 2012 through |
| | | | | | May 2016, |
| | | | | | Trustee, ALPS |
| | | | | | Series Trust |
| | | | | | (investment |
| | | | | | company) |
| | | | | | • Until |
| | | | | | December |
| | | | | | 31, 2014, |
| | | | | | Chairperson |
| | | | | | of Audit |
| | | | | | Committee, |
| | | | | | Select Sector |
| | | | | | SPDR Funds |
| | | | | | (investment |
| | | | | | company) |
| | | | | | • Until October |
| | | | | | 2015, Trustee, |
| | | | | | Russell |
| | | | | | Exchange |
| | | | | | Traded Funds |
| | | | | | Trust |
| |
| |
| Daniel P. Connealy, | Trustee since 2003 | Appointed until | • Retired | 43 | Until October |
| Born June 6, 1946 | | successor is | • June 2004 to June 2014, Senior | | 2015, Trustee, |
| 1301 Second Avenue, | | duly elected and | Vice President and Chief | | Russell |
| 18th Floor, Seattle, WA | | qualified | Financial Officer, Waddell & | | Exchange |
| 98101 | | | Reed Financial, Inc. (investment | | Traded Funds |
| | | | company) | | Trust |
| |
| |
| Katherine W. Krysty, | Trustee since 2014 | Appointed until | • Retired | 43 | Until October |
| Born December 3, 1951 | | successor is | • January 2011 through March | | 2015, Trustee, |
| 1301 Second Avenue | | duly elected and | 2013, President Emerita, Laird | | Russell |
| 18th Floor, Seattle, WA | | qualified | Norton Wealth Management | | Exchange |
| 98101 | | | (investment company) | | Traded Funds |
| | | | | | Trust |
Disclosure of Information about Fund Trustees and Officers 109
Russell Investment Funds
LifePoints® Funds Variable Target Portfolio Series
Disclosure of Information about Fund Trustees and Officers, continued — December
31, 2017 (Unaudited)
| | | | | | |
| | | Position(s) Held | Term | Principal Occupation(s) | No. of | Other |
| | Name, | With Fund and | of | During the | Portfolios | Directorships |
| | Age, | Length of | Office * | Past 5 Years | in Russell | Held by Trustee |
| Address | Time Served | | | Investments | During the |
| | | | | | Fund | Past 5 Years |
| | | | | | Complex | |
| | | | | | Overseen | |
| | | | | | by Trustee | |
| |
| INDEPENDENT TRUSTEES (continued) | | | | |
| Raymond P. Tennison, Jr. , | Trustee since 2000 | Appointed until | • Retired | 43 | Until October |
| Born December 21, 1955 | Chairman of | successor is | • From January 2008 to December | | 2015, Trustee, |
| 1301 Second Avenue | the Nominating | duly elected and | 2011, Vice Chairman of the | | Russell |
| 18th Floor, Seattle, WA | and Governance | qualified | Board, Simpson Investment | | Exchange |
| 98101 | | Committee since | Appointed until | Company (paper and forest | | Traded Funds |
| | | 2007 | successor is | products) | | Trust |
| | | | duly elected and | | | |
| | | | qualified | | | |
| |
| |
| Jack R. Thompson, | Trustee since 2005 | Appointed until | • Retired | 43 | • Until October |
| Born March 21, 1949 | Chairman of | successor is | | | 2015, Trustee, |
| 1301 Second Avenue, | the Investment | duly elected and | | | Russell |
| 18th Floor, Seattle, WA | Committee since | qualified | | | Exchange |
| 98101 | | 2015 | Appointed until | | | Traded Funds |
| | | | successor is | | | Trust |
| | | | duly elected and | | | |
| | | | qualified | | | |
| |
| |
| * | Each Trustee is subject to mandatory retirement at age 75. | | | |
| |
| | Name, | Position(s) Held | Term | Principal Occupation(s) | No. of | Other |
| | Age, | With Fund and | of | During the | Portfolios | Directorships |
| Address | Length of | Office | Past 5 Years | in Russell | Held by Trustee |
| | | Time Served | | | Investments | During the |
| | | | | | Fund | Past 5 Years |
| | | | | | Complex | |
| | | | | | Overseen | |
| | | | | | by Trustee | |
| |
| TRUSTEE EMERITUS | | | | | |
| George F. Russell, Jr. , | Trustee Emeritus and | Until resignation | • Director Emeritus, RIM | 43 | None |
| Born July 3, 1932 | Chairman Emeritus | or removal | | | |
| 1301 Second Avenue, | since 1999 | | | | |
| 18th Floor, Seattle, WA | | | | | |
| 98101 | | | | | | |
110 Disclosure of Information about Fund Trustees and Officers
Russell Investment Funds
LifePoints® Funds Variable Target Portfolio Series
Disclosure of Information about Fund Trustees and Officers, continued — December
31, 2017 (Unaudited)
| | | |
| Name, | Positions(s) Held | Term | Principal Occupation(s) |
| Age, | With Fund and | of | During the |
| Address | Length of | Office | Past 5 Years |
| | Time Served | | |
| |
| OFFICERS | | | |
| Mark Spina, | President and Chief | Until successor | • President and Chief Executive Officer, RIC and RIF |
| Born June 8, 1970 | Executive Officer | is chosen and | • Chairman of the Board, President, RIFIS. |
| 1301 Second Avenue | since 2017 | qualified by | • Chairman of the Board, RIFUS |
| 18th Floor, Seattle, WA | | Trustees | • Director, RIM |
| 98101 | | | • From 2015 to 2016, Head of Intermediary Distribution and President |
| | | | of Pioneer Funds Distributor |
| | | | • From 2008 to 2015, Head of Intermediary Distribution, Voya |
| | | | Investment Management |
| |
| |
| Cheryl Wichers, | Chief Compliance | Until removed | • Chief Compliance Officer, RIC and RIF |
| Born December 16, 1966 | Officer since 2005 | by Independent | • Chief Compliance Officer, RIFUS |
| 1301 Second Avenue | | Trustees | • 2011 to 2016 Chief Compliance Officer, U. S. One , LLC |
| 18th Floor, Seattle, WA | | | |
| 98101 | | | |
| |
| |
| Mark E. Swanson, | Treasurer, Chief | Until successor | • Global Head of Fund Services, Russell Investments |
| Born November 26, 1963 | Accounting Officer | is chosen and | • Treasurer, Chief Accounting Officer and CFO, RIC and RIF |
| 1301 Second Avenue | and Chief Financial | qualified by | • Director and President, RIFUS |
| 18th Floor, Seattle, WA | Officer since 1998 | Trustees | • Director RIM, Russell Investments Trust Company (“RITC”) and |
| 98101 | | | RIFIS |
| | | | • President and Chief Executive Officer, RIC and RIF, June 2016 to |
| | | | June 2017 |
| | | | • October 2011 to December 2013, Head of North America Operations |
| | | | Russell Investments |
| |
| |
| Jeffrey T. Hussey, | Chief Investment | Until removed by | • Global Chief Investment Officer, Russell Investments |
| Born May 2, 1969 | Officer since 2013 | Trustees | • Chief Investment Officer, RIC and RIF |
| 1301 Second Avenue, | | | • Chairman of the Board and President, RIM |
| 18th Floor, Seattle WA | | | • Director, RITC, Russell Investments Implementation Services, LLC |
| 98101 | | | and Russell Investments Delaware, LLC |
| | | | • Board of Managers, Russell Investments Funds Management, LLC |
| | | | • 2003 to 2013 Chief Investment Officer, Fixed Income, Russell |
| | | | Investments |
| |
| |
| Mary Beth R. Albaneze, | Secretary since 2010 | Until successor | • Associate General Counsel, Russell Investments |
| Born April 25, 1969 | | is chosen and | • Secretary, RIM, RIFUS and RIFIS |
| 1301 Second Avenue, | | qualified by | • Secretary and Chief Legal Officer, RIC and RIF |
| 18th Floor, Seattle, WA | | Trustees | • Assistant Secretary, Russell Investments Insurance Agency, LLC |
| 98101 | | | (“RIIA”)(insurance agency) and U. S. One Inc. |
Disclosure of Information about Fund Trustees and Officers 111
Russell Investment Funds
LifePoints® Funds Variable Target Portfolio Series
Adviser and Service Providers — December 31, 2017 (Unaudited)
| |
| Interested Trustee | |
| Mark Spina | Administrator, Transfer and Dividend Disbursing |
| Independent Trustees | Agent |
| Thaddas L. Alston | Russell Investments Fund Services, LLC |
| Kristianne Blake | 1301 Second Avenue |
| Cheryl Burgermeister | Seattle, WA 98101 |
| Daniel P. Connealy | |
| Katherine W. Krysty | Custodian |
| Raymond P. Tennison, Jr. | State Street Bank and Trust Company |
| Jack R. Thompson | 1 Heritage Drive |
| | North Quincy, MA 02171 |
| |
| Trustee George Emeritus F. Russell, Jr. | Office of Shareholder Inquiries |
| | 1301 Second Avenue |
| Officers | Seattle, WA 98101 |
| Mark Spina, President and Chief Executive Officer | (800) 787-7354 |
| Mark E. Swanson, Treasurer, Chief Accounting Officer and | |
| Chief Financial Officer | Legal Counsel |
| Cheryl Wichers, Chief Compliance Officer | Dechert LLP |
| Jeffrey T. Hussey, Chief Investment Officer | One International Place, 40th Floor |
| Mary Beth R. Albaneze, Secretary | 100 Oliver Street |
| | Boston, MA 02110 |
| |
| Adviser Russell Investment Management, LLC | Distributor |
| 1301 Second Avenue | Russell Investments Financial Services, LLC |
| Seattle, WA 98101 | 1301 Second Avenue |
| | Seattle, WA 98101 |
| | Independent Registered Public Accounting Firm |
| | PricewaterhouseCoopers LLP |
| | 1420 5th Avenue, Suite 2800 |
| | Seattle, WA 98101 |
This report is prepared from the books and records of the Funds and is submitted for the general information of shareholders and is not
authorized for distribution to prospective investors unless accompanied or preceded by an effective Prospectus. Nothing herein contained
is to be considered an offer of sale or a solicitation of an offer to buy shares of Russell Investment Funds. Such offering is made only by
Prospectus, which includes details as to offering price and other material information.
112 Adviser and Service Providers

Item 2. Code of Ethics. [Annual Report Only]
(a) As of the end of the period covered by the report, the registrant has adopted a code of ethics
that applies to the registrant's principal executive officer and principal financial officer
(“Code”).
(b) That Code comprises written standards that are reasonably designed to deter wrongdoing and
to promote:
1) honest and ethical conduct, including the ethical handling of actual or apparent
conflicts of interest between personal and professional relationships;
2) full, fair, accurate, timely and understandable disclosure in reports and documents
that a registrant files with, or submits to, the Securities and Exchange Commission
(“SEC”) and in other public communications made by each Mutual Fund;
3) compliance with applicable laws and governmental rules and regulations;
4) the prompt internal reporting to an appropriate person or persons identified in the
Code of violations of the Code; and
5) accountability for adherence to the Code.
(c) The Code was restated as of August 2015; the restatement did not involve any material
change.
(d) As of the end of the period covered by the report, there have been no waivers granted from a
provision of the Code that applies to the registrant’s principal executive officer and principal
financial officer.
(e) Not applicable.
(f) The registrant has filed with the SEC, pursuant to Item 12(a)(1), a copy of the Code that
applies to the registrant’s principal executive officer, principal financial officer, principal
accounting officer or controller, or persons performing similar functions, as an exhibit to its
annual report on this Form N-CSR.
Item 3. Audit Committee Financial Expert. [Annual Report Only]
Registrant's board of trustees has determined that the Registrant has at least one audit committee
financial expert serving on its audit committee. Cheryl Burgermeister has been determined to be
the Audit Committee Financial Expert and is also determined to be “independent” for purposes
of Item 3, paragraph (a)(2)(i) and (ii) of Form N-CSR.
Item 4. Principal Accountant Fees and Services. [Annual Report Only]
Audit Fees
(a) The aggregate fees billed for each of the last two fiscal years for professional services
rendered by the principal accountant for the audit of the registrant’s annual financial statements
or services that are normally provided by the accountant in connection with statutory and
regulatory filings or engagements for those fiscal years were as follows:
Audit-Related Fees
(b) The aggregate fees billed in each of the last two fiscal years for assurance and related
services by the principal accountant that are reasonably related to the performance of the audit of
the registrant’s financial statements and are not reported under paragraph (a) of this Item and the
nature of the services comprising those fees were as follows:
| | | |
| | | Fees | Nature of Services |
| |
| 2016 | $ | 93,996 | Tax auditing services |
| 2017 | $ | 98,646 | Tax auditing services |
Tax Fees
(c) The aggregate fees billed in each of the last two fiscal years for professional services
rendered by the principal accountant for tax compliance, tax advice, and tax planning and the
nature of the services comprising the fees were as follows:
| | | |
| | | Fees | Nature of Services |
| |
| 2016 | $ | 79,262 | Tax filing services |
| 2017 | $ | 83,225 | Tax filing services |
All Other Fees
(d) The aggregate fees billed in each of the last two fiscal years for products and services
provided by the principal accountant, other than the services reported in paragraphs (a) through
(c) of this Item and the nature of the services comprising those fees were as follows:
| | | |
| | | Fees | Nature of Services |
| |
| |
| 2016 | $ | 0 | |
| 2017 | $ | 0 | |
(e) (1) Registrant’s audit committee has adopted the following pre-approval policies and
procedures for certain services provided by Registrant’s accountants:
Russell Investment Funds
Russell Investment Funds
Audit and Non-Audit Services Pre-Approval Policy
Effective Date: August 25, 2015
I. Statement of Purpose.
This Policy has been adopted by the joint Audit Committee (the “Audit Committee”) of Russell
Investment Company (“RIC”) and Russell Investment Funds (“RIF”) to apply to any and all
engagements of the independent auditor to RIC and RIF, respectively, for audit, non-audit, tax or
other services. The term “Fund” shall collectively refer to each series of RIC and RIF. The
term “Investment Adviser” shall refer to the Funds’ advisor, Russell Investment Management,
LLC (“RIM”). This Policy does not delegate to management the responsibilities set forth herein
for the pre-approval of services performed by the Funds’ independent auditor.
II. Statement of Principles.
Under the Sarbanes-Oxley Act of 2002 (the “Act”), the Audit Committee of the Funds’ Board of
Trustees (the “Audit Committee”) is charged with responsibility for the appointment,
compensation and oversight of the work of the independent auditor for the Funds. As part of
these responsibilities, the Audit Committee is required to pre-approve the audit services and
permissible non-audit services such as audit-related, tax and other services (“non-audit services”)
performed by the independent auditor for the Funds to assure that the independence of the
auditor is not in any way compromised or impaired. In determining whether an auditor is
independent in light of the services it provides to a Fund, there are three guiding principles under
the Act that must be considered. In general, the independence of the auditor to the Funds would
be deemed impaired if the auditor provides a service whereby it:
· Functions in the role of management of the Funds, the adviser of the Funds or any
other affiliate* of the Funds;
· Is in the position of auditing its own work; or
· Serves in an advocacy role for the Funds, the adviser of the Funds or any other
affiliate of the Funds.
Accordingly, it is the Funds’ policy that the independent auditor for the Funds must not be
engaged to perform any service that contravenes any of the three guidelines set forth above, or
which in any way could be deemed to impair or compromise the independence of the auditor for
the Funds. This Policy is designed to accomplish those requirements and will henceforth be
applied to all engagements by the Funds of their independent auditor, whether for audit, audit-
related, tax, or other non-audit services.
* For purposes of this Policy, an affiliate of the Funds is defined as the Funds’ investment adviser (but not a sub-
adviser whose role is primarily portfolio management and whose activities are overseen by the principal investment
adviser), and any entity controlling, controlled by, or under common control with the investment adviser that
provides ongoing services to the Fund.
Rules adopted by the United States Securities and Exchange Commission (the “SEC”) establish
two distinct approaches to the pre-approval of services by the Audit Committee. The proposed
services either may receive general pre-approval through adoption by the Audit Committee of a
list of authorized services for the fund, together with a budget of expected costs for those
services (“general pre-approval”), or specific pre-approval by the Audit Committee of all
services provided to the fund on a case-by-case basis (“specific pre-approval”).
The Funds’ Audit Committee believes that the combination of these two approaches reflected in
this Policy will result in an effective and efficient procedure for the pre-approval of permissible
services performed by the Funds’ independent auditor. The Funds’ Audit and Non-Audit Pre-
Approved Services Schedule lists the audit, audit-related, tax and other services that have the
general pre-approval of the Audit Committee. As set forth in this Policy, unless a particular
service has received general pre-approval, those services will require specific pre-approval by
the Audit Committee before any such services can be provided by the independent auditor. Any
proposed service to the Funds that exceeds the pre-approved budget for those services will also
require specific pre-approval by the appropriate Audit Committee.
In assessing whether a particular audit or non-audit service should be approved, the Audit
Committee will take into account the ratio between the total amounts paid for audit, audit-
related, tax and other services, based on historical patterns, with a view toward assuring that the
level of fees paid for non-audit services as they relate to the fees paid for audit services does not
compromise or impair the independence of the auditor. The Audit Committee will review the list
of general pre-approved services, including the pre-approved budget for those services, at least
annually and more frequently if deemed appropriate by the Audit Committee, and may
implement changes thereto from time to time.
III. Delegation.
As provided in the Act and in the SEC’s rules, the Audit Committee from time to time may
delegate either general or specific pre-approval authority to one or more of its members. Any
member to whom such authority is delegated must report any pre-approval decisions to the Audit
Committee at its next scheduled meeting.
IV. Audit Services.
The annual audit services engagement terms and fees for the independent auditor for the Funds
require specific pre-approval of the Audit Committee. Audit services include the annual
financial statement audit and other procedures required to be performed by the independent
auditor in order to be able to form an opinion on the financial statements for the Funds for that
year. These other procedures include reviews of information systems, procedural reviews and
testing performed in order to understand and rely on the Funds’ systems of internal control, and
consultations relating to the audit. Audit services also include the attestation engagement for the
independent auditor’s report on the report from management on financial reporting internal
controls. The Audit Committee will review the audit services engagement as necessary or
appropriate in the sole judgment of the Audit Committee.
In addition to the pre-approval by the Audit Committee of the annual engagement of the
independent auditor to perform audit services, the Audit Committee may grant general pre-
approval to other audit services, which are those services that only the independent auditor
reasonably can provide. These services are generally related to the issuance of an audit opinion,
and may include statutory audits and services associated with the Funds’ SEC registration
statement on Form N-1A, periodic reports and documents filed with or information requested by
the SEC or other regulatory or self-regulatory organizations, or other documents issued in
connection with the Funds’ securities offerings.
The Audit Committee has pre-approved the audit services set forth in Schedule A of the Audit
and Non-Audit Pre-Approved Services Schedule. All other audit services not listed in Schedule
A of the Audit and Non-Audit Pre-Approved Services Schedule must be specifically pre-
approved by the Audit Committee or its delegate.
V. Audit-Related Services.
Audit-related services are assurance and related services that are reasonably related to the
performance of the audit or review of the financial statements for the Funds, or the separate
financial statements for a series of the Funds that are traditionally performed by the independent
auditor. Because the Audit Committee believes that the provision of audit-related services does
not compromise or impair the independence of the auditor and is consistent with the SEC’s rules
on auditor independence, the Audit Committee may grant pre-approval to audit related services.
“Audit related services” include, among others, accounting consultations related to accounting,
financial reporting or disclosure matters not classified as “audit services;” assistance with
understanding and implementing new accounting and financial reporting or disclosure matters
not classified as “audit services;” assistance with understanding and implementing new
accounting and financial reporting guidance from rulemaking authorities; agreed upon or
expanded audit procedures related to accounting and/or billing records required to respond to or
comply with financial, accounting or regulatory reporting matters; and assistance with internal
reporting requirements, including those under Form N-SAR and Form N-CSR.
The Audit Committee has pre-approved the audit-related services set forth in Schedule B of the
Audit and Non-Audit Pre-Approved Services Schedule. All other audit-related services not
listed in Schedule B of the Audit and Non-Audit Pre-Approved Services Schedule must be
specifically pre-approved by the Audit Committee or its delegate.
VI. Tax Services.
The Audit Committee believes that the independent auditor can provide tax services to the
Funds, such as tax compliance, tax planning and tax advice, without impairing the auditor’s
independence and the SEC has stated that the independent auditor may provide such services.
Consequently, the Audit Committee believes that it may grant general pre-approval to those tax
services that have historically been provided by the auditor, that the Audit Committee has
reviewed and believes would not impair the independence of the auditor, and that are consistent
with the SEC’s rules on auditor independence. However, the Audit Committee will not permit
the retention of the independent auditor to provide tax advice in connection with any transaction
recommended by the independent auditor, the sole business purpose of which may be tax
avoidance and the tax treatment of which may not be supported by the United States Internal
Revenue Code and related regulations or the applicable tax statutes and regulations that apply to
the Funds’ investments outside the United States. The Audit Committee will consult with the
Treasurer of the Funds or outside counsel to determine that the Funds’ tax planning and reporting
positions are consistent with this policy.
The Audit Committee has pre-approved the tax services set forth in Schedule C of the Audit and
Non-Audit Pre-Approved Services Schedule. All other tax services not listed in Schedule C of
the Audit and Non-Audit Pre-Approved Services Schedule must be specifically pre-approved by
the Audit Committee or its delegate.
VII. All Other Services.
The Audit Committee believes, based on the SEC’s rules prohibiting the independent auditor
from providing specific non-audit services, that other types of non-audit services are permitted.
Accordingly, the Audit Committee believes that it may grant general pre-approval to those
permissible non-audit services classified as “all other” services that the Audit Committee
believes are routine and recurring services, would not impair or compromise the independence of
the auditor and are consistent with the SEC’s rules on auditor independence.
The Audit Committee has pre-approved the permissible “all other services” set forth in Schedule
D of the Audit and Non-Audit Pre-Approved Services Schedule. Permissible “all other services”
not listed in Schedule D of the Audit and Non-Audit Pre-Approved Services Schedule must be
specifically pre-approved by the Audit Committee or its delegate.
A list of the SEC’s prohibited non-audit services are as follows:
· Bookkeeping or other services relating to the accounting records or financial statements
of the Funds
· Financial information system design and implementation
· Appraisal or valuation services, fairness opinions or contribution-in-kind reports
· Actuarial services
· Internal audit outsourcing services
· Management functions
· Human resources services
· Broker-dealer, investment adviser or investment banking services
· Legal services unrelated to the audit
· Expert services unrelated to the audit
The SEC’s rules and relevant official interpretations and guidance should be consulted to
determine the scope of these prohibited services and the applicability of any exceptions to certain
of the prohibitions. Under no circumstance may an executive, manager or associate of the
Funds, or the Investment Adviser, authorize the independent auditor for the Funds to provide
prohibited non-audit services.
VIII. De Minimis Waiver.
In accordance with the Act and SEC regulations, notwithstanding anything in this Policy to the
contrary, the pre-approval requirements of this Policy are waived with respect to the provision of
non-audit services that are permissible for an independent auditor to perform, provided:
(a) The aggregate amount of all such services provided constitutes no more than five
percent of the total amount of fees paid by RIC or RIF, as applicable, to the
independent auditor during the fiscal year in which the services were provided;
(b) Such services were not recognized by the Funds at the time of the engagement to
be non-audit services requiring pre-approval by the Audit Committee or its
delegate; and
(c) Such services are promptly brought to the attention of the Audit Committee and
approved by the Audit Committee or its delegate prior to the completion of the
audit, pursuant to the pre-approval provisions of this Policy.
In connection with the approval of any non-audit service pursuant to this de minimis exception, a
record shall be made indicating that each of the conditions for this exception has been satisfied.
IX. Pre-Approval Fee Levels or Budgeted Amounts.
Pre-approved fee levels or budgeted amounts for all services to be provided by the independent
auditor will be established annually by the Audit Committee and shall be subject to periodic
subsequent review during the year if deemed appropriate by the Audit Committee (separate
amounts may be specified for the Funds and for other affiliates in the investment company
complex subject to pre-approval). Any proposed services exceeding these levels or amounts will
require specific pre-approval by the Audit Committee. The Audit Committee will be mindful of
the overall relationship of fees for audit and non-audit services in determining whether to pre-
approve any such services. For each fiscal year, the Audit Committee may determine the
appropriateness of the ratio between the total amount of fees for audit, audit-related, and tax
services for the Funds (including any audit-related or tax services fees for affiliates subject to
pre-approval), and the total amount of fees for certain permissible non-audit services classified as
“all other services” for the Funds (including any such services for affiliates subject to pre-
approval by the Audit Committee or its delegate).
X. Procedures.
All requests or applications for services to be provided by the independent auditor that do not
require specific pre-approval by the Audit Committee will be submitted to the “RIC/RIF
Clearance Committee” (the “Clearance Committee”) (which shall be comprised of not less than
three members, including the Treasurer of the Funds who shall serve as its Chairperson) and
must include a detailed description of the services to be rendered and the estimated costs of those
services. The Clearance Committee will determine whether such services are included within the
list of services that have received general pre-approval by the Audit Committee. The Audit
Committee will be informed not less frequently than quarterly by the Chairperson of the
Clearance Committee of any such services rendered by the independent auditor for the Funds and
the fees paid to the independent auditors for such services.
Requests or applications to provide services that require specific pre-approval by the Audit
Committee will be submitted to the Audit Committee by both the independent auditor and the
Clearance Committee and must include a joint certification by the engagement partner of the
independent auditor and the Chairperson of the Clearing Committee that, in their view, the
request or application does not involve a prohibited non-audit service and is consistent with the
SEC’s rules governing auditor independence.
The Internal Audit Department of Russell Investments Group, Ltd., the parent company of RIM,
and the officers of RIC and RIF will report to the Chairman of the Audit Committee any breach
of this Policy that comes to the attention of the Internal Audit Department of Russell Investments
Group, Ltd. or an officer of RIC or RIF.
XI. Additional Requirements.
The Audit Committee has determined to take additional measures on an annual basis to meet its
responsibility to oversee the work performed by the independent auditor and to assure the
independent auditor’s continuing independence from the Funds and their affiliates, including
Russell Investments Group, Ltd. Such efforts will include, but not be limited to, reviewing a
written annual statement from the independent auditor delineating all relationships between the
independent auditor and RIC, RIF and Russell Investments Group, Ltd. and their subsidiaries and
affiliates, consistent with the Public Company Accounting Oversight Board’s Independence
Standards Board Standard No. 1, and discussing with the independent auditor its methods and
procedures for ensuring its independence.
(e) (2) The percentage of services described in each of paragraphs (b) through (d) of this Item
that were approved by the audit committee pursuant to paragraph (c)(7)(i)(C) of Rule 2-01 of
Regulation S-X is as follows:
| | |
| Audit Fees | 0 | % |
| Audit-Related Fees | 0 | % |
| Tax Fees | 0 | % |
(f) For services, 50 percent or more of which were pre-approved, the percentage of hours
expended on the principal accountant’s engagement to audit the registrant’s financial statements
for the most recent fiscal year that were attributed to work performed by persons other than the
principal accountant’s full-time, permanent employees was 0%.
(g) The aggregate non-audit fees billed by registrant’s accountant for services rendered to the
registrant, and rendered to the registrant’s investment adviser (not including any sub-adviser
whose role is primarily portfolio management and is subcontracted with or overseen by another
investment adviser), and any entity controlling, controlled by, or under common control with the
adviser that provides ongoing services to the registrant for each of the last two fiscal years of the
registrant were as follows:
(h) The registrant’s audit committee of the board of trustees has considered whether the
provision of nonaudit services that were rendered to the registrant’s investment adviser (not
including any subadviser whose role is primarily portfolio management and is subcontracted
with or overseen by another investment adviser), and any entity controlling, controlled by, or
under common control with the investment adviser that provides ongoing services to the
registrant that were not pre-approved pursuant to paragraph (c)(7)(ii) of Rule 2-01 of Regulation
S-X is compatible with maintaining the principal accountant’s independence.
Item 5. Audit Committee of Listed Registrants. [Not Applicable]
Item 6. [Schedules of Investments are included as part of the Report to Shareholders filed
under Item 1 of this form]
Items 7-9. [Not Applicable]
Item 10. Submission of Matters to a Vote of Security Holders
There have been no changes to the procedures by which shareholders may recommend
nominees to the Registrant’s Board of Trustees that would require disclosure herein.
Item 11. Controls and Procedures
(a) Registrant's principal executive officer and principal financial officer have concluded
that Registrant's disclosure controls and procedures (as defined in Rule 30a-2(c) under
the Investment Company Act of 1940 (the “Act”)) are effective, based on their evaluation
of these controls and procedures as of a date within 90 days of the date this report is filed
with the Securities and Exchange Commission.
(b) There were no significant changes in Registrant's internal control over financial
reporting that occurred during the period covered by this report that has materially
affected or is likely to materially affect Registrant's internal control over financial
reporting.
Item 12. Exhibit List
(a) Registrant’s code of ethics described in Item 2
(b) Certification for principal executive officer of Registrant as required by Rule 30a-2(a)
under the Act and certification for principal financial officer of Registrant as required by
Rule 30a-2(a) under the Act.
SIGNATURES
Pursuant to the requirements of the Securities Exchange Act of 1934 and the Investment
Company Act of 1940, the Registrant has duly caused this report to be signed on its behalf by the
undersigned, thereunto duly authorized.
Russell Investment Funds
By: /s/ Mark Spina
Mark Spina
President and Chief Executive Officer, Russell Investment Funds
Date: February 15, 2018
Pursuant to the requirements of the Securities Exchange Act of 1934 and the Investment
Company Act of 1940, the Registrant has duly caused this report to be signed on its behalf by the
undersigned, thereunto duly authorized.
By: /s/ Mark E. Swanson
Mark E. Swanson
Treasurer, Chief Accounting Officer and Chief Financial Officer, Russell Investment
Funds
Date: February 15, 2018