                                  UNITED STATES
                       SECURITIES AND EXCHANGE COMMISSION
                             WASHINGTON, D. C. 20549

                                   FORM N-CSR

Investment Company Act file number 811-5385


                           SCUDDER VALUE SERIES, INC.
                           --------------------------
               (Exact Name of Registrant as Specified in Charter)


                  222 South Riverside Plaza, Chicago, IL 60606
                  --------------------------------------------
               (Address of Principal Executive Offices) (Zip Code)

        Registrant's Telephone Number, including Area Code: (312) 781-1121
                                                            --------------


                   John Millette, Vice President and Secretary
                           Scudder Value Series, Inc.
                             Two International Place
                                Boston, MA 02110
                     ---------------------------------------
                     (Name and Address of Agent for Service)

Date of fiscal year end:        11/30

Date of reporting period:       5/31/03


ITEM 1.  REPORT TO STOCKHOLDERS
[Scudder Investments logo]
Scudder-Dreman
High Return Equity Fund
|
| |
| Semiannual Report to Shareholders |
| May 31, 2003 |
|
Scudder Investments is part of Deutsche Asset Management, which is the marketing name in the US for the asset management activities of Deutsche Bank AG, Deutsche Investment Management Americas Inc., Deutsche Asset Management Inc., Deutsche Asset Management Investment Services Ltd., Deutsche Bank Trust Company Americas and Scudder Trust Company.
This report must be preceded or accompanied by a prospectus. To obtain a prospectus for any of our funds, refer to the Account Management Resources information provided in the back of this booklet. The prospectus contains more complete information, including a description of the risks of investing in the fund, management fees and expenses. Please read it carefully before you invest or send money.
Fund shares are not FDIC-insured and are not deposits or other obligations of, or guaranteed by, any bank. Fund shares involve investment risk, including possible loss of principal.
Performance Summary May 31, 2003 |
|
Average Annual Total Returns* (Unadjusted for Sales Charge) |
Scudder-Dreman High Return Equity Fund | 6-Month** | 1-Year | 3-Year | 5-Year | 10-Year |
Class A
| 9.28% | -12.04% | 7.18% | 3.50% | 12.38% |
Class B
| 8.84% | -12.73% | 6.31% | 2.64% | 11.40%(a) |
Class C
| 8.84% | -12.71% | 6.34% | 2.68% | 11.46%(a) |
S&P 500 Index++
| 3.87%
| -8.06%
| -10.85%
| -1.08%
| 9.93%
|
Scudder-Dreman High Return Equity Fund | 6-Month** | 1-Year | 3-Year | 5-Year | Life of Class*** |
Class I+
| 9.54% | -11.62% | 7.67% | 3.95% | 12.46% |
S&P 500 Index++
| 3.87%
| -8.06%
| -10.85%
| -1.08%
| 8.60%
|
Scudder-Dreman High Return Equity Fund | 6-Month** | Life of Class**** |
Institutional Class+
| 9.43% | 2.76% |
S&P 500 Index++
| 3.87%
| 6.67%
|
Sources: Lipper Inc. and Deutsche Investment Management Americas Inc.
** Total returns shown for periods less than one year are not annualized.Net Asset Value and Distribution Information |
| Class A | Class B | Class C | Class I | Institutional Class |
Net Asset Value:
5/31/03
| $ 32.60 | $ 32.46 | $ 32.50 | $ 32.61 | $ 32.60 |
11/30/02
| $ 30.15 | $ 30.01 | $ 30.04 | $ 30.15 | $ 30.14 |
Distribution Information:
Six Months:
Income Dividends
| $ .30 | $ .18 | $ .18 | $ .37 | $ .34 |
Class A Lipper Rankings* - Equity Income Funds Category |
Period | Rank | | Number of Funds Tracked | Percentile Ranking |
1-Year
| 158 | of | 187 | 85 |
3-Year
| 7 | of | 157 | 5 |
5-Year
| 19 | of | 129 | 15 |
10-Year
| 1 | of | 46 | 3 |
Rankings are historical and do not guarantee future results. Rankings are based on total return unadjusted for sales charges with distributions reinvested. If sales charges had been included, rankings might have been less favorable.
Source: Lipper Inc.
Growth of an Assumed $10,000 Investment(b)* (Adjusted for Sales Charge) |
[] Scudder-Dreman High Return Equity Fund - Class A [] S&P 500 Index++
|
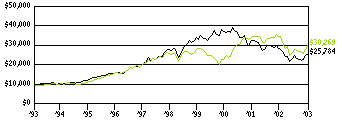 |
Yearly periods ended May 31 |
Comparative Results* (Adjusted for Sales Charge) |
Scudder-Dreman High Return Equity Fund | 1-Year | 3-Year | 5-Year | 10-Year |
Class A(c) | Growth of $10,000
| $8,291 | $11,604 | $11,191 | $30,269 |
Average annual total return
| -17.09% | 5.08% | 2.28% | 11.71% |
Class B(c) | Growth of $10,000
| $8,468 | $11,815 | $11,298 | $29,430 |
Average annual total return
| -15.32% | 5.72% | 2.47% | 11.40%(a) |
Class C(c) | Growth of $10,000
| $8,642 | $11,905 | $11,299 | $29,287 |
Average annual total return
| -13.58% | 5.98% | 2.47% | 11.34%(a) |
S&P 500 Index++
| Growth of $10,000
| $9,194 | $7,085 | $9,473 | $25,784 |
Average annual total return
| -8.06% | -10.85% | -1.08% | 9.93% |
Scudder-Dreman High Return Equity Fund | 1-Year | 3-Year | 5-Year | Life of Class*** |
Class I+ | Growth of $10,000
| $8,838 | $12,483 | $12,140 | $24,345 |
Average annual total return
| -11.62% | 7.67% | 3.95% | 12.46% |
S&P 500 Index++
| Growth of $10,000
| $9,194 | $7,085 | $9,473 | $18,696 |
Average annual total return
| -8.06% | -10.85% | -1.08% | 8.60% |
Notes to Performance Summary |
* Returns and rankings during the 1-year, 3-year, 5-year and 10-year periods shown reflect a fee waiver and/or expense reimbursement. Without this waiver/reimbursement, returns and rankings would have been lower.*** Class I shares commenced operations on November 1, 1995. Index returns begin October 31, 1995.**** Institutional Class shares commenced operations on August 19, 2002. Index returns begin August 31, 2002. Returns shown for periods less than one year are not annualized.a Returns shown for Class B and C shares for the periods prior to their inception date on September 11, 1995 are derived from the historical performance of Class A shares of the Scudder-Dreman High Return Equity Fund during such periods and have been adjusted to reflect the higher gross total annual operating expenses of each specific class. The difference in expenses will affect performance.b The Fund's growth of an assumed $10,000 investment is adjusted for the maximum sales charge of 5.75%. This results in a net initial investment of $9,425.c Returns shown for Class A, B and C shares have been adjusted to reflect the current applicable sales charges of each specific class. Returns for Class A reflect the current maximum initial sales charges of 5.75%. Class B share performance is adjusted for the applicable contingent deferred sales charge ("CDSC"), which is 4% within the first year after purchase, declining to 0% after six years. Returns for Class C shares reflect an initial sales charge of 1%. Redemptions on Class C shares within one year of purchase may be subject to a CDSC of 1%. The difference in expenses will affect performance.+ Class I and Institutional Class shares are not subject to sales charge.++ The Standard & Poor's (S&P) 500 Index is a capitalization-weighted index of 500 stocks. The index is designed to measure performance of the broad domestic economy through changes in the aggregate market value of 500 stocks representing all major industries. Index returns assume reinvestment of dividends and, unlike Fund returns, do not reflect any fees or expenses. It is not possible to invest directly into an index.All performance is historical, assumes reinvestment of all dividends and capital gains, and is not indicative of future results. Investment return and principal value will fluctuate, so an investor's shares, when redeemed, may be worth more or less than when purchased. Performance figures do not reflect the deduction of taxes that a shareholder would pay on fund distributions or the redemption of fund shares. Returns and rankings may differ by share class.
Investments in funds involve risk. Some funds have more risk than others. These include funds that allow exposure to or otherwise concentrate investments in certain sectors, geographic regions, security types, market capitalization or foreign securities (e.g., political or economic instability, which can be accentuated in emerging market countries). Please read this fund's prospectus for specific details regarding its investments and risk profile.
Please call (800) 621-1048 for the fund's most up-to-date performance.
Portfolio Management Review |
|
In the following interview, Lead Portfolio Manager David N. Dreman discusses the strategy of Scudder-Dreman High Return Equity Fund and the market environment during the six-month period ended May 31, 2003.
Q: Will you provide an overview of market conditions during the six months ended May 31, 2003?
A: The stock market continued to struggle during the first half of the period. As of May 31, every area of the domestic stock market, as measured by the S&P 500, posted positive returns for the six-month period. A successful outcome in the war with Iraq, improving corporate earnings, continuing gross domestic product growth and the passage of a tax stimulus package led to renewed investor enthusiasm and higher stock prices.
Q: How did Scudder-Dreman High Return Equity Fund perform?
A: For the six months ended May 31, 2003, the fund's Class A shares (unadjusted for sales charges) posted a cumulative total return of 9.28%, significantly outperforming the 3.87% return, for the same period, posted by the fund's benchmark, the Standard & Poor's 500 index (S&P 500). (Please see pages 4 through 6 for performance of other share classes.) The S&P 500 is an unmanaged index that is generally representative of the US stock market. The fund also outperformed the 4.31% average total return of its peers in the Lipper Equity Income Funds category - a group of mutual funds that seek relatively high current income and growth of income by investing a portion of their portfolios in dividend-paying stocks.
Over the longer term and throughout the recent bear market, the fund has also solidly outperformed - posting strong positive returns, while the S&P 500 has declined significantly. Since the market peaked in March 2000, the fund's Class A shares (unadjusted for sales charges) have posted a positive average annual total return of 9.29%, vs. a loss of 11.75% by the S&P 500 from March 31, 2000 through May 31, 2003. Although past performance doesn't guarantee future results, we're extremely pleased with these results.
An important part of the fund's long-term success is due to a portfolio that is focused on high-dividend-yielding stocks. As of May 31, 2003, 78% of the fund's stock holdings were paying dividends - and many of those stocks had dividend yields well above the average yield of the S&P 500. These high-dividend-yielding stocks had a weighted yield of almost double that of the S&P 500 Index as of May 31, 2003. In this day of increasing emphasis on yield, particularly after the reduction of the maximum tax rate on dividends to 15%, we believe this will continue to be a major benefit for the fund in the future. Keep in mind, dividends are not guaranteed and can vary, sometimes substantially.
Q: What was behind the fund's outperformance?
A: Sticking to our contrarian value investment discipline was critical in the fund's outperformance for this six-month period and longer term. Over the course of the bear market, we added stocks from a wide range of industries that had fallen due to conjecture in the market that we didn't believe to be accurate. Many of those investments - and other long time holdings - contributed with strong gains during this period.
Q: Will you discuss the areas that most helped the fund's performance?
A: Financial stocks, retail stocks - many of which are up 50% or more - and our largest holding, Altria Group, and other tobacco stocks were the primary sources of outperformance.
1. Financials represented the fund's largest position (28.2% of market value as of May 31, 2003). The fund's overweight position relative to the S&P 500 and solid performance from many of its financial holdings led to strong gains. JPMorgan Chase (JPMorgan), Washington Mutual and Fannie Mae were some of the strongest performers.
While all of those stocks posted handsome gains over the last six months, JPMorgan's performance was exceptional. We added JPMorgan to the portfolio last fall after the stock suffered from news of huge write-offs of loans to failed telecommunications and energy trading firms. Believing that these were one-time events and that the company's management was solid, we invested in the stock, and since then, its share price has rebounded sharply. The stock has also continued to pay an attractive dividend.
Washington Mutual, a rapidly growing savings and loan company, continued to gain ground as it posted strong earnings and benefited from high mortgage refinance activity and its successful national retail expansion. Fannie Mae, one of the country's largest home mortgage providers, also continued to post strong earnings. Despite discussion in the media about whether tighter federal regulation of the company is needed, the stock gained ground during the six-month period. Fannie Mae is a long-term holding that we continue to hold based on its low price-to-earnings ratio and a growth rate that is higher than that of the broad market.
2. The fund also benefited from investing in some beaten-up retail stocks early in the period. Electronics retailer Best Buy declined early in the period due to concerns that it was losing market share and its poorly performing Musicland retail division. We owned this stock a couple years ago and began to slowly add it back to the portfolio last fall. Having faith in company management, we continued to add to our position as the stock struggled. The company put its Musicland division up for sale, continued to add retail outlets and grew its share of the consumer electronics market. Its share price rose substantially and benefited the fund. Home improvement retailer Home Depot declined dramatically in January after management announced that it would post lower-than-expected fourth-quarter 2002 earnings. We viewed the setback as temporary and believed good management and large cash reserves would help Home Depot weather the storm. That was indeed the case, and the stock has risen substantially since our purchase in January.
3. Despite some extreme volatility, Altria Group ended the period higher. Altria Group is the fund's largest holding (9.12% of market value as of May 31) and is the parent company of Philip Morris USA, Kraft and Philip Morris International. The stock fell in March, when a judge awarded more than $10 billion in damages to the plaintiffs in an Illinois class-action lawsuit against cigarette company Philip Morris USA. The stock rebounded in April and May when the bond in the Illinois lawsuit was substantially reduced and more important, when a lingering Florida class-action suit worth billions was dismissed on appeal. The case in Florida suggests that the financial risks of future litigation may be reduced. We continue to hold the stock because it trades at what we believe to be a deep discount, while paying an attractive dividend. If its share price continues to rise, we'll look for opportunities to pare back our position somewhat, but we believe it still has a good deal of room to grow.
Q: What about areas that held back performance?
A: Health care was the only fund sector that posted a negative return for the period. Pharmaceutical companies within the portfolio struggled, and the fund's overweight position in these stocks hurt its performance relative to the S&P 500. Schering-Plough Corp. was the primary detractor. The company's earnings and stock price fell due to the patent expiration of its allergy medicine, Claritin. The stock declined further on news that a federal grand jury would be investigating the company's sales, marketing and clinical trials practices. While we're of course unhappy with these events, there are several reasons we're holding on to the stock. First, the company recently hired a new chief executive officer who successfully ran Pharmacia, one of Schering-Plough's competitors. Secondly, the firm has a solid product portfolio and a very strong cash position and we expect the company to weather this storm.
Pharmaceutical stocks represent 11.4% of the fund's market value. Although they struggled during this short period, we believe that over time they have strong growth potential. Each company we own - Bristol-Myers Squibb, Merck & Co., Pfizer and Schering-Plough Corp. - - has strong cash flows to fund continued research and development, capable marketing arms, and large sales forces to drive current earnings.
The views expressed in this report reflect those of the portfolio manager only through the end of the period of the report as stated on the cover. The manager's views are subject to change at any time based on market and other conditions and should not be construed as a recommendation.
Portfolio Summary May 31, 2003 |
|
Asset Allocation | 5/31/03 | 11/30/02 |
|
Common Stocks
| 96%
| 97%
|
Cash Equivalents
| 4%
| 3%
|
| 100%
| 100%
|
Sector Diversification (Excludes Cash Equivalents) | 5/31/03 | 11/30/02 |
|
Financials
| 29%
| 29%
|
Consumer Staples
| 21%
| 21%
|
Consumer Discretionary
| 15%
| 12%
|
Health Care
| 13%
| 15%
|
Energy
| 11%
| 11%
|
Information Technology
| 4%
| 4%
|
Industrials
| 4%
| 6%
|
Utilities
| 3%
| 2%
|
| 100%
| 100%
|
Asset allocation and sector diversification are subject to change.
Ten Largest Equity Holdings at May 31, 2003 (51.9% of Portfolio) |
1. Altria Group, Inc.
Operator of food and tobacco companies
| 9.1% |
2. Washington Mutual, Inc.
Provider of diversified financial services
| 6.0% |
3. Freddie Mac
Supplier of mortgage credit
| 5.7% |
4. Fannie Mae
Facilitator of mortgages and issuer of mortgage-backed securities
| 5.5% |
5. UST, Inc.
Manufacturer and marketer of smokeless tobacco, premium cigars and premium wines
| 5.0% |
6. Bristol-Myers Squibb Co.
Producer of diversified pharmaceuticals and consumer products
| 4.6% |
7. Best Buy Co., Inc.
Retailer of consumer electronics and home office equipment
| 4.4% |
8. ConocoPhillips
Producer of petroleum and other natural gas
| 4.2% |
9. Merck & Co., Inc.
Producer of pharmaceuticals
| 4.0% |
10. Electronic Data Systems Corp.
Provider of computer outsourcing and consulting services
| 3.4% |
Portfolio holdings are subject to change.For more complete details about the fund's investment portfolio, see page 14. A quarterly Fund Summary and Portfolio Holdings are available upon request.
Investment Portfolio as of May 31, 2003 (Unaudited) | |
|
|
Shares
| Value ($) |
|
|
Common Stocks 96.4% |
Consumer Discretionary 14.0%
|
Automobiles 0.6%
|
Ford Motor Co.
| 2,540,675
| 26,677,088 |
Multiline Retail 0.8%
|
Federated Department Stores, Inc.*
| 955,925
| 31,067,563 |
Specialty Retail 12.6%
|
Best Buy Co., Inc.*
| 4,615,570
| 178,622,559
|
Borders Group, Inc.* (b)
| 5,242,150
| 86,233,368
|
Home Depot, Inc.
| 2,987,635
| 97,068,261
|
Lowe's Companies, Inc.
| 331,900
| 14,026,094
|
Staples, Inc.*
| 4,310,505
| 83,580,692
|
The Gap, Inc.
| 3,159,141
| 53,705,397
|
Toys ''R'' Us, Inc.*
| 47,185
| 549,233
|
| 513,785,604 |
Consumer Staples 19.8%
|
Food & Drug Retailing 0.5%
|
Safeway, Inc.*
| 1,090,725
| 20,549,259 |
Tobacco 19.3%
|
Altria Group, Inc.*
| 9,001,175
| 371,748,527
|
Imperial Tobacco Group (ADR)
| 691,750
| 25,318,050
|
R.J. Reynolds Tobacco Holdings, Inc.
| 2,908,331
| 99,145,004
|
Universal Corp. (b)
| 2,110,950
| 88,406,586
|
UST, Inc.
| 5,754,300
| 203,184,333
|
| 787,802,500 |
Energy 10.2%
|
Energy Equipment & Services 0.9%
|
Transocean Sedco Forex, Inc.*
| 1,442,075
| 33,701,293 |
Oil & Gas 9.3%
|
ChevronTexaco Corp.
| 1,639,567
| 116,310,883
|
ConocoPhillips
| 3,193,573
| 172,357,135
|
Devon Energy Corp.
| 942,075
| 48,987,900
|
Kerr-McGee Corp.
| 891,225
| 42,404,486
|
| 380,060,404 |
Financials 28.2%
|
Banks 15.5%
|
Bank of America Corp.
| 661,900
| 49,112,980
|
Bank One Corp.
| 746,768
| 27,899,252
|
FleetBoston Financial Corp.
| 1,253,829
| 37,075,724
|
J.P. Morgan Chase & Co.
| 474,600
| 15,595,356
|
KeyCorp.
| 2,411,450
| 63,662,280
|
PNC Financial Services Group
| 1,647,010
| 81,115,243
|
Sovereign Bancorp, Inc.
| 1,600,300
| 26,116,896
|
US Bancorp.
| 1,884,450
| 44,661,465
|
Wachovia Corp.
| 1,006,400
| 40,437,152
|
Washington Mutual, Inc.
| 5,947,664
| 242,545,738
|
| 628,222,086 |
Diversified Financials 11.5%
|
CIT Group, Inc.
| 646,675
| 15,513,733
|
Fannie Mae
| 3,032,250
| 224,386,500
|
Freddie Mac
| 3,850,950
| 230,325,320
|
| 470,225,553 |
Insurance 1.2%
|
Ohio Casualty Corp.*
| 295,100
| 3,718,260
|
Safeco Corp.
| 611,225
| 22,089,672
|
St. Paul Companies, Inc.
| 663,160
| 24,258,393
|
| 50,066,325 |
Health Care 13.0%
|
Health Care Providers & Services 1.6%
|
HCA, Inc.
| 883,000
| 29,139,000
|
Humana, Inc.*
| 2,808,260
| 36,479,297
|
| 65,618,297 |
Pharmaceuticals 11.4%
|
Bristol-Myers Squibb Co.
| 7,267,850
| 186,056,960
|
Merck & Co., Inc.
| 2,953,880
| 164,176,650
|
Pfizer, Inc.
| 58,800
| 1,823,976
|
Schering-Plough Corp.
| 6,048,995
| 111,603,958
|
| 463,661,544 |
Industrials 3.9%
|
Electrical Equipment 1.6%
|
Emerson Electric Co.
| 1,240,300
| 64,867,690 |
Industrial Conglomerates 2.3%
|
General Electric Co.
| 1,502,125
| 43,110,988
|
Tyco International Ltd.
| 2,963,680
| 52,457,136
|
| 95,568,124 |
Information Technology 4.2%
|
Computers & Peripherals 0.8%
|
Apple Computer, Inc.*
| 1,957,200
| 35,170,884 |
IT Consulting & Services 3.4%
|
Electronic Data Systems Corp.
| 6,827,511
| 137,574,347 |
Utilities 3.1%
|
Gas Utilities 1.4%
|
El Paso Corp.
| 6,053,625
| 52,666,537
|
NiSource, Inc.*
| 1,613,040
| 3,564,818
|
| 56,231,355 |
Multi-Utilities & Unregulated Power 1.7%
|
Williams Companies, Inc.
| 8,628,600
| 68,252,226 |
Total Common Stocks (Cost $3,728,521,962)
| 3,929,102,142 |
|
Cash Equivalents 3.6% |
Scudder Cash Management QP Trust,1.32% (c)
(Cost $146,160,291)
| 146,160,291
| 146,160,291 |
Total Investment Portfolio - 100.0% (Cost $3,874,682,253) (a)
| 4,075,262,433 |
* Non-income producing security.(a) The cost for federal income tax purposes was $3,891,058,796. At May 31, 2003, net unrealized appreciation for all securities based on tax cost was $184,203,637. This consisted of aggregate gross unrealized appreciation for all securities in which there was an excess of value over tax cost of $608,458,087 and aggregate gross unrealized depreciation for all securities in which there was an excess of tax cost over value of $424,254,450.(b) Affiliated issuers (see Notes to Financial Statements).(c) Scudder Cash Management QP Trust is also managed by Deutsche Investment Management Americas Inc. The rate shown is the annualized seven-day yield at period end.The accompanying notes are an integral part of the financial statements.
Statement of Assets and Liabilities as of May 31, 2003 (Unaudited) |
Assets
|
Investments in securities, at value:
Unaffiliated issuers (cost $3,584,572,539) | $ 3,754,462,188 |
Affiliated issuers (cost $143,949,423) | 174,639,954 |
Scudder Cash Management QP Trust (cost $146,160,291) | 146,160,291 |
Total investments (cost $3,874,682,253)
| 4,075,262,433 |
Cash
| 10,000 |
Receivable for investments sold
| 33,009,795 |
Dividends and interest receivable
| 5,065,313 |
Receivable for Fund shares sold
| 9,475,242 |
Total assets
| $ 4,122,822,783 |
Liabilities
|
Payable for investments purchased
| 32,633,465 |
Payable for Fund shares redeemed
| 5,855,823 |
Accrued management fee
| 2,220,865 |
Other accrued expenses and payables
| 2,875,742 |
Total liabilities
| 43,585,895 |
Net assets, at value
| $ 4,079,236,888 |
Net Assets
|
Net assets consist of:
Undistributed net investment income
| 6,481,022 |
Net unrealized appreciation (depreciation) on investments
| 200,580,180 |
Accumulated net realized gain (loss)
| (430,180,293) |
Paid-in capital
| 4,302,355,979 |
Net assets, at value
| $ 4,079,236,888 |
The accompanying notes are an integral part of the financial statements.
Statement of Assets and Liabilities as of May 31, 2003 (Unaudited) (continued) |
Net Asset Value
|
Class A
Net Asset Value and redemption price per share ($2,396,651,512 / 73,520,350 shares of capital stock outstanding, $.01 par value, 560,000,000 shares authorized)
| $ 32.60 |
Maximum offering price per share (100 / 94.25 of $32.60)
| $ 34.59 |
Class B
Net Asset Value, offering and redemption price (subject to contingent deferred sales charge) per share ($1,164,763,631 / 35,882,949 shares of capital stock outstanding, $.01 par value, 560,000,000 shares authorized)
| $ 32.46 |
Class C
Net Asset Value and redemption price (subject to contingent deferred sales charge) per share ($446,083,573 / 13,727,338 shares of capital stock outstanding, $.01 par value, 140,000,000 shares authorized)
| $ 32.50 |
Maximum offering price per share (100 / 99.00 of $32.50)
| $ 32.83 |
Class I
Net Asset Value, offering and redemption price per share ($8,919,840 / 273,515 shares of capital stock outstanding, $.01 par value, 140,000,000 shares authorized)
| $ 32.61 |
Institutional Class
Net Asset Value, offering and redemption price per share ($62,818,332 / 1,926,818 outstanding shares of beneficial interest, $.01 par value, 100,000,000 shares authorized)
| $ 32.60 |
The accompanying notes are an integral part of the financial statements.
Statement of Operations for the six months ended May 31, 2003 (Unaudited) |
Investment Income
|
Income:
Dividends - Unaffiliated issuers (net of foreign taxes withheld of $55,707)
| $ 59,604,466 |
Dividends - Affiliated issuers
| 1,519,884 |
Interest - Scudder Cash Management QP Trust
| 893,064 |
Total Income
| 62,017,414 |
Expenses:
Management fee
| 12,786,100 |
Administrative fee
| 6,685,975 |
Distribution service fees
| 10,200,094 |
Directors' fees and expenses
| 31,912 |
Other
| 86,001 |
Total expenses, before expense reductions
| 29,790,082 |
Expense reductions
| (21) |
Total expenses, after expense reductions
| 29,790,061 |
Net investment income (loss)
| 32,227,353 |
Realized and Unrealized Gain (Loss) on Investment Transactions
|
Net realized gain (loss) from:
Investments - Unaffiliated issuers
| 8,379,277 |
Investments - Affiliated issuers
| (5,555) |
| 8,373,722 |
Net unrealized appreciation (depreciation) during the period on investments
| 297,215,163 |
Net gain (loss) on investment transactions
| 305,588,885 |
Net increase (decrease) in net assets resulting from operations
| $ 337,816,238 |
The accompanying notes are an integral part of the financial statements.
Statement of Changes in Net Assets |
Increase (Decrease) in Net Assets
| Six Months Ended May 31, 2003 (Unaudited) | Year Ended November 30, 2002 |
Operations:
Net investment income (loss)
| $ 32,227,353 | $ 48,257,994 |
Net realized gain (loss) on investment transactions
| 8,373,722 | (405,769,190) |
Net unrealized appreciation (depreciation) on investment transactions during the period
| 297,215,163 | (440,759,854) |
Net increase (decrease) in net assets resulting from operations
| 337,816,238 | (798,271,050) |
Distributions to shareholders from:
Net investment income:
Class A
| (21,000,596) | (31,045,029) |
Class B
| (7,038,448) | (8,871,551) |
Class C
| (2,463,905) | (2,668,340) |
Class I
| (296,237) | (515,285) |
Institutional Class
| (26,590) | (128) |
Fund share transactions:
Proceeds from shares sold
| 607,227,335 | 1,538,686,003 |
Reinvestment of distributions
| 27,035,208 | 38,796,015 |
Cost of shares redeemed
| (584,452,752) | (1,154,361,458) |
Net increase (decrease) in net assets from Fund share transactions
| 49,809,791 | 423,120,560 |
Increase (decrease) in net assets
| 356,800,253 | (418,250,823) |
Net assets at beginning of period
| 3,722,436,635 | 4,140,687,458 |
Net assets at end of period (including undistributed net investment income of $6,481,022 and $5,079,445, respectively)
| $ 4,079,236,888 | $ 3,722,436,635 |
The accompanying notes are an integral part of the financial statements.
Class A |
Years Ended November 30, | 2003a | 2002 | 2001 | 2000 | 1999 | 1998 |
Selected Per Share Data
|
Net asset value, beginning of period
| $ 30.15 | $ 36.74 | $ 33.91 | $ 30.45 | $ 35.69 | $ 33.52 |
Income (loss) from investment operations:
Net investment income
| .31b | .53b | .41b | .65b | .71b | .73 |
Net realized and unrealized gain (loss) on investment transactions
| 2.44 | (6.63) | 2.94 | 5.74 | (3.69) | 3.80 |
Total from investment operations | 2.75 | (6.10) | 3.35 | 6.39 | (2.98) | 4.53 |
Less distributions from:
Net investment income
| (.30) | (.49) | (.52) | (.68) | (.70) | (.86) |
Net realized gains on investment transactions
| - | - | - | (2.25) | (1.56) | (1.50) |
Total distributions | (.30) | (.49) | (.52) | (2.93) | (2.26) | (2.36) |
Net asset value, end of period
| $ 32.60 | $ 30.15 | $ 36.74 | $ 33.91 | $ 30.45 | $ 35.69 |
Total Return (%)c
| 9.28** | (16.77) | 9.94 | 24.06 | (8.88) | 14.25 |
Ratios to Average Net Assets and Supplemental Data
|
Net assets, end of period ($ millions)
| 2,397 | 2,056 | 2,101 | 1,661 | 2,043 | 2,420 |
Ratio of expenses before expense reductions (%)
| 1.31* | 1.27 | 1.27 | 1.30d | 1.20 | 1.19 |
Ratio of expenses after expense reductions (%)
| 1.31* | 1.27 | 1.27 | 1.27d | 1.20 | 1.19 |
Ratio of net investment income (loss) (%)
| 2.09* | 1.54 | 1.13 | 2.34 | 2.09 | 2.28 |
Portfolio turnover rate (%)
| 10* | 25 | 29 | 12 | 33 | 7 |
a For the six months ended May 31, 2003 (Unaudited).
b Based on average shares outstanding during the period.
c Total return does not reflect the effect of any sales charges.
d The ratios of operating expenses excluding costs incurred in connection with a fund complex reorganization before and after expense reductions were 1.27% and 1.24%, respectively.
* Annualized
** Not annualized
|
Class B |
Years Ended November 30, | 2003a | 2002 | 2001 | 2000 | 1999 | 1998 |
Selected Per Share Data
|
Net asset value, beginning of period
| $ 30.01 | $ 36.58 | $ 33.75 | $ 30.31 | $ 35.51 | $ 33.37 |
Income (loss) from investment operations:
Net investment income
| .19b | .25b | .12b | .42b | .42b | .45 |
Net realized and unrealized gain (loss) on investment transactions
| 2.44 | (6.62) | 2.93 | 5.72 | (3.66) | 3.75 |
Total from investment operations | 2.63 | (6.37) | 3.05 | 6.14 | (3.24) | 4.20 |
Less distributions from:
Net investment income
| (.18) | (.20) | (.22) | (.45) | (.40) | (.56) |
Net realized gains on investment transactions
| - | - | - | (2.25) | (1.56) | (1.50) |
Total distributions | (.18) | (.20) | (.22) | (2.70) | (1.96) | (2.06) |
Net asset value, end of period
| $ 32.46 | $ 30.01 | $ 36.58 | $ 33.75 | $ 30.31 | $ 35.51 |
Total Return (%)c
| 8.84** | (17.43) | 9.03 | 23.04 | (9.62) | 13.22 |
Ratios to Average Net Assets and Supplemental Data
|
Net assets, end of period ($ millions)
| 1,165 | 1,243 | 1,609 | 1,375 | 1,865 | 2,276 |
Ratio of expenses before expense reductions (%)
| 2.11* | 2.08 | 2.08 | 2.14d | 2.03 | 2.06 |
Ratio of expenses after expense reductions (%)
| 2.11* | 2.08 | 2.08 | 2.10d | 2.03 | 2.06 |
Ratio of net investment income (loss) (%)
| 1.29* | .73 | .32 | 1.51 | 1.26 | 1.41 |
Portfolio turnover rate (%)
| 10* | 25 | 29 | 12 | 33 | 7 |
a For the six months ended May 31, 2003 (Unaudited).
b Based on average shares outstanding during the period.
c Total return does not reflect the effect of any sales charges.
d The ratios of operating expenses excluding costs incurred in connection with a fund complex reorganization before and after expense reductions were 2.10% and 2.06%, respectively.
* Annualized
** Not annualized
|
Class C |
Years Ended November 30, | 2003a | 2002 | 2001 | 2000 | 1999 | 1998 |
Selected Per Share Data
|
Net asset value, beginning of period
| $ 30.04 | $ 36.61 | $ 33.78 | $ 30.34 | $ 35.54 | $ 33.38 |
Income (loss) from investment operations:
Net investment income
| .20b | .26b | .13b | .42b | .43b | .45 |
Net realized and unrealized gain (loss) on investment transactions
| 2.44 | (6.62) | 2.93 | 5.73 | (3.66) | 3.79 |
Total from investment operations | 2.64 | (6.36) | 3.06 | 6.15 | (3.23) | 4.24 |
Less distributions from:
Net investment income
| (.18) | (.21) | (.23) | (.46) | (.41) | (.58) |
Net realized gains on investment transactions
| - | - | - | (2.25) | (1.56) | (1.50) |
Total distributions | (.18) | (.21) | (.23) | (2.71) | (1.97) | (2.08) |
Net asset value, end of period
| $32.50 | $ 30.04 | $ 36.61 | $ 33.78 | $ 30.34 | $ 35.54 |
Total Return (%)c
| 8.84** | (17.42) | 9.09 | 23.06 | (9.60) | 13.32 |
Ratios to Average Net Assets and Supplemental Data
|
Net assets, end of period ($ millions)
| 446 | 398 | 398 | 285 | 414 | 462 |
Ratio of expenses before expense reductions (%)
| 2.06* | 2.05 | 2.05 | 2.12d | 2.00 | 2.01 |
Ratio of expenses after expense reductions (%)
| 2.06* | 2.05 | 2.05 | 2.08d | 2.00 | 2.01 |
Ratio of net investment income (loss) (%)
| 1.34* | .76 | .35 | 1.54 | 1.29 | 1.46 |
Portfolio turnover rate (%)
| 10* | 25 | 29 | 12 | 33 | 7 |
a For the six months ended May 31, 2003 (Unaudited).
b Based on average shares outstanding during the period.
c Total return does not reflect the effect of any sales charges.
d The ratios of operating expenses excluding costs incurred in connection with a fund complex reorganization before and after expense reductions were 2.08% and 2.04%, respectively.
* Annualized
** Not annualized
|
Class I |
Years Ended November 30, | 2003a | 2002 | 2001 | 2000 | 1999 | 1998 |
Selected Per Share Data
|
Net asset value, beginning of period
| $ 30.15 | $ 36.76 | $ 33.92 | $ 30.45 | $ 35.71 | $ 33.51 |
Income (loss) from investment operations:
Net investment income
| .39b | .68b | .58b | .77b | .84b | .95 |
Net realized and unrealized gain (loss) on investment transactions
| 2.44 | (6.64) | 2.94 | 5.74 | (3.70) | 3.76 |
Total from investment operations | 2.83 | (5.96) | 3.52 | 6.51 | (2.86) | 4.71 |
Less distributions from:
Net investment income
| (.37) | (.65) | (.68) | (.79) | (.84) | (1.01) |
Net realized gains on investment transactions
| - | - | - | (2.25) | (1.56) | (1.50) |
Total distributions | (.37) | (.65) | (.68) | (3.04) | (2.40) | (2.51) |
Net asset value, end of period
| $ 32.61 | $ 30.15 | $ 36.76 | $ 33.92 | $ 30.45 | $ 35.71 |
Total Return (%)
| 9.54** | (16.40) | 10.45 | 24.60 | (8.54) | 14.83 |
Ratios to Average Net Assets and Supplemental Data
|
Net assets, end of period ($ millions)
| 9 | 22 | 33 | 26 | 22 | 31 |
Ratio of expenses before expense reductions (%)
| .81* | .80 | .83 | .86c | .82 | .76 |
Ratio of expenses after expense reductions (%)
| .81* | .80 | .83 | .85c | .82 | .76 |
Ratio of net investment income (loss) (%)
| 2.59* | 2.01 | 1.57 | 2.73 | 2.47 | 2.71 |
Portfolio turnover rate (%)
| 10* | 25 | 29 | 12 | 33 | 7 |
a For the six months ended May 31, 2003 (Unaudited).
b Based on average shares outstanding during the period.
c The ratios of operating expenses excluding costs incurred in connection with a fund complex reorganization before and after expense reductions were .86% and .85%, respectively.
* Annualized
** Not annualized
|
Institutional Class |
| 2003a | 2002b |
Selected Per Share Data
|
Net asset value, beginning of period
| $ 30.14 | $ 32.27 |
Income (loss) from investment operations:
Net investment income (loss)c
| .34 | .13 |
Net realized and unrealized gain (loss) on investment transactions
| 2.46 | (2.11) |
Total from investment operations | 2.80 | (1.98) |
Less distributions from:
Net investment income
| (.34) | (.15) |
Net asset value, end of period
| $ 32.60 | $ 30.14 |
Total Return (%)
| 9.43** | (6.09)** |
Ratios to Average Net Assets and Supplemental Data
|
Net assets, end of period ($ millions)
| 63 | 2 |
Ratio of expenses (%)
| 1.01* | 1.00* |
Ratio of net investment income (loss) (%)
| 2.39* | (1.57)* |
Portfolio turnover rate (%)
| 10* | 25 |
a For the six months ended May 31, 2003 (Unaudited).
b For the period from August 19, 2002, (commencement of sales of Institutional Class shares) to November 30, 2002.
c Based on average shares outstanding during the period.
* Annualized
** Not annualized
|
Notes to Financial Statements (Unaudited) |
|
A. Significant Accounting Policies
Scudder-Dreman High Return Equity Fund (the ``Fund'') is a diversified series of Scudder Value Series, Inc. (the ``Corporation'') which is registered under the Investment Company Act of 1940, as amended (the ``1940 Act''), as an open-end management investment company organized as a Maryland Corporation.
The Fund offers multiple classes of shares which provide investors with different purchase options. Class A shares are offered to investors subject to an initial sales charge. Class B shares are offered without an initial sales charge but are subject to higher ongoing expenses than Class A shares and a contingent deferred sales charge payable upon certain redemptions. Class B shares automatically convert to Class A shares six years after issuance. Class C shares are offered to investors subject to an initial sales charge and are subject to higher ongoing expenses than Class A shares and a contingent deferred sales charge payable upon certain redemptions within one year of purchase. Prior to February 3, 2003, Class C shares were offered without an initial sales charge. Class C shares do not convert into another class. Class I and Institutional Class shares are offered to a limited group of investors, are not subject to initial or contingent deferred sales charges and have lower ongoing expenses than other classes.
Investment income, realized and unrealized gains and losses, and certain fund-level expenses and expense reductions, if any, are borne pro rata on the basis of relative net assets by the holders of all classes of shares, except that each class bears certain expenses unique to that class such as distribution service fees, administrative fees and certain other class-specific expenses. Differences in class-level expenses may result in payment of different per share dividends by class. All shares of the Fund have equal rights with respect to voting subject to class-specific arrangements.
The Fund's financial statements are prepared in accordance with accounting principles generally accepted in the United States of America which require the use of management estimates. Actual results could differ from those estimates. The policies described below are followed consistently by the Fund in the preparation of its financial statements.
Security Valuation. Investments are stated at value determined as of the close of regular trading on the New York Stock Exchange on each day the exchange is open for trading. Equity securities are valued at the most recent sale price reported on the exchange (US or foreign) or over-the-counter market on which the security is traded most extensively. Securities for which no sales are reported are valued at the calculated mean between the most recent bid and asked quotations on the relevant market or, if a mean cannot be determined, at the most recent bid quotation.
Money market instruments purchased with an original or remaining maturity of sixty days or less, maturing at par, are valued at amortized cost. Investments in open-end investment companies and Scudder Cash Management QP Trust are valued at their net asset value each business day.
Securities and other assets for which market quotations are not readily available or for which the above valuation procedures are deemed not to reflect fair value are valued in a manner that is intended to reflect their fair value as determined in accordance with procedures approved by the Directors.
Federal Income Taxes. The Fund's policy is to comply with the requirements of the Internal Revenue Code, as amended, which are applicable to regulated investment companies, and to distribute all of its taxable income to its shareholders. Accordingly, the Fund paid no federal income taxes and no federal income tax provision was required.
At November 30, 2002 the Fund had a net tax basis capital loss carryforward of approximately $286,011,000 which may be applied against any realized net taxable capital gains of each succeeding year until fully utilized or until November 30, 2008 ($15,150,000) and November 30, 2010 ($270,861,000), the respective expiration dates, whichever occurs first.
In addition, from November 1, 2002 through November 30, 2002, the Fund incurred approximately $135,377,000 of net realized capital losses. As permitted by tax regulations, the Fund intends to elect to defer these losses and treat them as arising in the fiscal year ended November 30, 2003.
Distribution of Income and Gains. Distributions of net investment income, if any, are made quarterly. Net realized gains from investment transactions, in excess of available capital loss carryforwards, would be taxable to the Fund if not distributed, and, therefore, will be distributed to shareholders at least annually.
The timing and characterization of certain income and capital gains distributions are determined annually in accordance with federal tax regulations which may differ from accounting principles generally accepted in the United States of America. These differences primarily relate to certain securities sold at a loss. As a result, net investment income (loss) and net realized gain (loss) on investment transactions for a reporting period may differ significantly from distributions during such period. Accordingly, the Fund may periodically make reclassifications among certain of its capital accounts without impacting the net asset value of the Fund.
At November 30, 2002, the Fund's components of distributable earnings (accumulated losses) on a tax-basis were as follows:
Undistributed ordinary income
| $ 5,161,771 |
Undistributed net long-term capital gains
| $ - |
Capital loss carryforwards
| $ (286,011,000) |
Net unrealized appreciation (depreciation) on investments
| $ (113,801,163) |
In addition, during the year ended November 30, 2002 the tax character of distributions paid to shareholders by the Fund is summarized as follows:
Distributions from ordinary income*
| $ 43,100,333 |
* For tax purposes short-term capital gains distributions are considered ordinary income distributions.The tax character of current year distributions, if any, will be determined at the end of the current fiscal year.
Other. Investment transactions are accounted for on the trade date. Interest income is recorded on the accrual basis. Dividend income is recorded on the ex-dividend date net of foreign withholding taxes. Certain dividends from foreign securities may be recorded subsequent to the ex-dividend date as soon as the Fund is informed of such dividends. Realized gains and losses from investment transactions are recorded on an identified cost basis.
B. Purchases and Sales of Securities
During the six months ended May 31, 2003, purchases and sales of investment securities (excluding short-term investments) aggregated $212,066,949 and $184,523,749, respectively.
C. Related Parties
Management Agreement. Under the Management Agreement with Deutsche Investment Management Americas Inc. ("DeIM" or the "Advisor"), the Advisor directs the investments of the Fund in accordance with its investment objectives, policies and restrictions. The Advisor determines the securities, instruments and other contracts relating to investments to be purchased, sold or entered into by the Fund. In addition to portfolio management services, the Advisor provides certain administrative services in accordance with the Management Agreement. The management fee payable under the Management Agreement is equal to an annual rate of 0.75% of the first $250,000,000 of the Fund's average daily net assets, 0.72% of the next $750,000,000 of such net assets, 0.70% of the next $1,500,000,000 of such net assets, 0.68% of the next $2,500,000,000 of such net assets, 0.65% of the next $2,500,000,000 of such net assets, 0.64% of the next $2,500,000,000 of such net assets, 0.63% of the next $2,500,000,000 of such net assets and 0.62% of such net assets in excess of $12,500,000,000, computed and accrued daily and payable monthly. Accordingly, for the six months ended May 31, 2003, the fee pursuant to the Management Agreement was equivalent to an annualized effective rate of 0.70% of the Fund's average daily net assets. Dreman Value Management, LLC ("DVM") serves as subadvisor with respect to the investment and reinvestment of assets in the Fund, and is paid by the Advisor for its services.
Administrative Fee. Under the Administrative Agreement (the "Administrative Agreement"), the Advisor provides or pays others to provide substantially all of the administrative services required by the Fund (other than those provided by the Advisor under its Management Agreement with the Fund, as described above) in exchange for the payment by each class of the Fund of an administrative services fee (the ``Administrative Fee'') of 0.350%, 0.400%, 0.375%, 0.300% and 0.100% of the average daily net assets for Class A, B, C, Institutional and I Class shares, respectively, computed and accrued daily and payable monthly.
Various third-party service providers, some of which are affiliated with the Advisor, provide certain services to the Fund under the Administrative Agreement. Scudder Fund Accounting Corporation, a subsidiary of the Advisor, computes the net asset value for the Fund and maintains the accounting records of the Fund. Scudder Service Corporation, also a subsidiary of the Advisor, is the transfer, shareholder service and dividend-paying agent for the Class A, B, C, I and Institutional Class shares of the Fund. Scudder Trust Company, an affiliate of the Advisor, provides subaccounting and recordkeeping services for the shareholders in certain retirement and employee benefit plans. These affiliated entities have in turn entered into various agreements with third party service providers to provide these services. In addition, other service providers not affiliated with the Advisor provide certain services (i.e., custody, legal and audit) to the Fund under the Administrative Agreement. The Advisor pays the service providers for the provision of their services to the Fund and pays other Fund expenses, including insurance, registration, printing, postage and other costs. Certain expenses of the Fund will not be borne by the Advisor under the Administrative Agreement, such as taxes, brokerage, interest and extraordinary expenses, and the fees and expenses of the Independent Directors (including the fees and expenses of their independent counsel). For the six months ended May 31, 2003, the Administrative Fee was as follows:
Administrative Fee | Total Aggregated | Unpaid at May 31, 2003 |
Class A
| $ 3,638,582 | $ 711,734 |
Class B
| 2,266,558 | 410,397 |
Class C
| 740,328 | 142,543 |
Class I
| 9,479 | 685 |
Institutional Class
| 31,028 | 16,133 |
| $ 6,685,975 | $ 1,281,492 |
The Administrative Agreement between the Advisor and the Fund will terminate effective September 30, 2003 and the Fund will directly bear the cost of those expenses formerly covered under the Administrative Agreement. Effective October 1, 2003 through September 30, 2005, the Advisor has agreed to contractually waive all or a portion of its management fee and reimburse or pay certain operating expenses of each class at 1.20% of average daily net assets for Class A, B and C shares, respectively, and 1.00% of average daily net assets for Class I and Institutional Class shares (excluding certain expenses such as Rule 12b-1 and/or service fees, trustees and trustee counsel fees, extraordinary expenses, taxes, brokerage and interest).
Distribution Service Agreement. Under the Distribution Service Agreement, in accordance with Rule 12b-1 under the 1940 Act, Scudder Distributors, Inc. ("SDI"), a subsidiary of the Advisor, receives a fee ("Distribution Fee") of 0.75% of average daily net assets of Class B and C shares. Pursuant to the agreement, SDI enters into related selling group agreements with various firms at various rates for sales of Class B and C shares. For the six months ended May 31, 2003, the Distribution Fee was as follows:
Distribution Fee | Total Aggregated | Unpaid at May 31, 2003 |
Class B
| $ 4,249,788 | $ 692,426 |
Class C
| 1,480,648 | 290,992 |
| $ 5,730,436 | $ 983,418 |
In addition, SDI provides information and administrative services ("Service Fee") to Class A, B and C shareholders at an annual rate of up to 0.25% of average daily net assets for each such class. SDI in turn has various agreements with financial services firms that provide these services and pays these fees based upon the assets of shareholder accounts the firms service. For the six months ended May 31, 2003, the Service Fee was as follows:
Service Fee | Total Aggregated | Unpaid at May 31, 2003 | Effective Rate |
Class A
| $ 2,598,993 | $ 374,108 | .25% |
Class B
| 1,416,596 | 151,396 | .25% |
Class C
| 454,069 | 74,148 | .23% |
| $ 4,469,658 | $ 599,652 | |
Underwriting Agreement and Contingent Deferred Sales Charge. SDI is the principal underwriter for Class A, B and C shares. Underwriting commissions paid in connection with the distribution of Class A and C shares for the six months ended May 31, 2003 aggregated $173,364 and $78, respectively.
In addition, SDI receives any contingent deferred sales charge ("CDSC") from Class B share redemptions occurring within six years of purchase and Class C share redemptions occurring within one year of purchase. There is no such charge upon redemption of any share appreciation or reinvested dividends. The CDSC is based on declining rates ranging from 4% to 1% for Class B and 1% for Class C, of the value of the shares redeemed. For the six months ended May 31, 2003, the CDSC for Class B and C shares aggregated $1,237,337 and $31,550, respectively. A deferred sales charge of up to 1% is assessed on certain redemptions of Class A shares. For the six months ended May 31, 2003, SDI received $10,854.
Directors' Fees and Expenses. The Fund pays each Director not affiliated with the Advisor retainer fees plus specified amounts for attended board and committee meetings.
Scudder Cash Management QP Trust. Pursuant to an Exemptive Order issued by the SEC, the Fund may invest in the Scudder Cash Management QP Trust (the "QP Trust"), formerly Zurich Scudder Cash Management QP Trust, and other affiliated funds managed by the Advisor. The QP Trust seeks to provide as high a level of current income as is consistent with the preservation of capital and the maintenance of liquidity. The QP Trust does not pay the Advisor a management fee for the affiliated funds' investments in the QP Trust.
D. Expense Off-Set Arrangement
The Fund has entered into an arrangement with its custodian whereby credits realized as a result of uninvested cash balances were used to reduce a portion of the Fund's custodian expenses. During the six months ended May 31, 2003, pursuant to the Administrative Agreement, the Administrative Fee was reduced by $21 for custodian credits earned.
E. Transactions in Securities of Affiliated Issuers
An affiliated issuer includes any company in which the Fund has ownership of at least 5% of the outstanding voting securities. A summary of the Fund's transactions during the six months ended May 31, 2003 with companies which are or were affiliates is as follows:
Affiliate | Shares | Purchases Cost ($) | Sales Cost ($) | Realized Gain/Loss ($) | Dividend Income ($) | Value ($) |
Borders Group, Inc.
| 5,242,150
| -
| 476,513
| (5,555)
| -
| 86,233,368
|
Universal Corp.
| 2,110,950
| -
| -
| -
| 1,519,884
| 88,406,586
|
| | | | (5,555) | 1,519,884 | 174,639,954 |
F. Line of Credit
The Fund and several other affiliated funds (the ``Participants'') share in a $1.25 billion revolving credit facility administered by J.P. Morgan Chase Bank for temporary or emergency purposes, including the meeting of redemption requests that otherwise might require the untimely disposition of securities. The Participants are charged an annual commitment fee which is allocated, pro rata based upon net assets, among each of the Participants. Interest is calculated at the Federal Funds Rate plus 0.5 percent. The Fund may borrow up to a maximum of 33 percent of its net assets under the agreement.
G. Share Transactions
The following table summarizes share and dollar activity in the Fund:
| Six Months Ended May 31, 2003 | Year Ended November 30, 2002 |
| Shares | Dollars | Shares | Dollars |
Shares sold
|
Class A
| 14,211,026 | $ 418,040,669 | 30,334,889 | $ 1,047,843,861 |
Class B
| 2,441,199 | 71,883,235 | 8,408,767 | 294,563,935 |
Class C
| 1,908,423 | 56,068,528 | 5,143,417 | 180,033,076 |
Class I
| 217,301 | 6,410,500 | 412,555 | 14,001,437 |
Institutional Class
| 1,942,024 | 54,824,403 | 77,729* | 2,243,694* |
| | $ 607,227,335 | | $ 1,538,686,003 |
Shares issued to shareholders in reinvestment of distributions
|
Class A
| 638,389 | $ 18,521,779 | 839,753 | $ 28,283,397 |
Class B
| 213,316 | 6,178,254 | 236,683 | 7,814,130 |
Class C
| 69,505 | 2,012,321 | 66,488 | 2,183,076 |
Class I
| 10,235 | 296,322 | 14,884 | 515,284 |
Institutional Class
| 915 | 26,532 | 5* | 128* |
| | $ 27,035,208 | | $ 38,796,015 |
Shares redeemed
|
Class A
| (9,542,708) | $ (279,615,994) | (20,142,882) | $ (672,067,486) |
Class B
| (8,202,287) | (238,557,654) | (11,206,513) | (368,374,573) |
Class C
| (1,496,368) | (43,747,075) | (2,824,272) | (93,033,943) |
Class I
| (694,573) | (19,732,325) | (576,673) | (20,885,456) |
Institutional Class
| (93,855) | (2,799,704) | -* | -* |
| | $ (584,452,752) | | $ (1,154,361,458) |
Net increase (decrease)
|
Class A
| 5,306,707 | $ 156,946,454 | 11,031,760 | $ 404,059,772 |
Class B
| (5,547,772) | (160,496,165) | (2,561,063) | (65,996,508) |
Class C
| 481,560 | 14,333,774 | 2,385,633 | 89,182,209 |
Class I
| (467,037) | (13,025,503) | (149,234) | (6,368,735) |
Institutional Class
| 1,849,084 | 52,051,231 | 77,734* | 2,243,822* |
| | $ 49,809,791 | | $ 423,120,560 |
* For the period August 19, 2002 (commencement of sales of Institutional Class shares) to November 30, 2002.Growth Funds
Scudder 21st Century Growth Fund Scudder Aggressive Growth Fund Scudder Blue Chip Fund Scudder Capital Growth Fund Scudder Development Fund Scudder Dynamic Growth Fund Scudder Flag Investors
Communications Fund Scudder Gold & Precious Metals Fund Scudder Global Biotechnology Fund Scudder Growth Fund Scudder Health Care Fund Scudder Large Company Growth Fund Scudder Micro Cap Fund Scudder Mid Cap Fund Scudder Small Cap Fund Scudder Strategic Growth Fund Scudder Technology Fund Scudder Technology Innovation Fund Scudder Top 50 US Fund Value Funds
Scudder Contrarian Fund Scudder-Dreman Financial Services Fund Scudder-Dreman High Return Equity Fund Scudder-Dreman Small Cap Value Fund Scudder Flag Investors Equity
Partners Fund Scudder Growth and Income Fund Scudder Large Company Value Fund Scudder-RREEF Real Estate Securities Fund Scudder Small Company Stock Fund Scudder Small Company Value Fund Multicategory/Asset Allocation Funds
Scudder Balanced Fund Scudder Flag Investors Value Builder Fund Scudder Focus Value+Growth Fund Scudder Lifecycle Mid Range Fund Scudder Lifecycle Long Range Fund Scudder Lifecycle Short Range Fund Scudder Pathway Conservative Portfolio Scudder Pathway Growth Portfolio Scudder Pathway Moderate Portfolio Scudder Target 2013 Fund Scudder Total Return Fund International/Global Funds
Scudder Emerging Markets Growth Fund Scudder Emerging Markets Income Fund Scudder European Equity Fund Scudder Global Fund Scudder Global Bond Fund Scudder Global Discovery Fund Scudder Greater Europe Growth Fund Scudder International Fund Scudder International Equity Fund Scudder International Select Equity Fund Scudder Japanese Equity Fund Scudder Latin America Fund Scudder New Europe Fund Scudder Pacific Opportunities Fund Income Funds
Scudder Cash Reserves Fund Scudder Fixed Income Fund Scudder GNMA Fund Scudder High Income Plus Fund (formerly Deutsche High Yield Bond Fund) Scudder High Income Fund (formerly Scudder High Yield Fund) Scudder High Income Opportunity Fund (formerly Scudder High Yield Opportunity Fund) Scudder Income Fund Scudder PreservationPlus Fund Scudder PreservationPlus Income Fund Scudder Short Duration Fund (formerly Scudder Short-Term Fixed Income Fund) Scudder Short-Term Bond Fund Scudder Strategic Income Fund Scudder U.S. Government Securities Fund |
Scudder Funds (continued) |
Tax-Free Income Funds
Scudder California Tax-Free Income Fund Scudder Florida Tax-Free Income Fund Scudder High Yield Tax-Free Fund Scudder Managed Municipal Bond Fund Scudder Massachusetts Tax-Free Fund Scudder Medium-Term Tax-Free Fund Scudder Municipal Bond Fund Scudder New York Tax-Free Income Fund Scudder Short-Term Municipal Bond Fund Index-Related Funds
Scudder EAFE ® Equity Index Fund Scudder Equity 500 Index Fund Scudder S&P 500 Index Fund Scudder S&P 500 Stock Fund Scudder Select 500 Fund Scudder US Bond Index Fund Money Market
A large number of money market funds are available through Scudder Investments.
|
Retirement Programs and Education Accounts |
Retirement Programs
Traditional IRA Roth IRA SEP-IRA Inherited IRA Keogh Plan 401(k), 403(b) Plans Variable Annuities Education Accounts
Coverdell Education Savings Account UGMA/UTMA IRA for Minors |
Closed-End Funds |
The Brazil Fund, Inc. The Korea Fund, Inc. Montgomery Street Income Securities, Inc. Scudder Global High Income Fund, Inc. Scudder New Asia Fund, Inc. Scudder High Income Trust Scudder Intermediate Government Trust Scudder Multi-Market Income Trust Scudder Municipal Income Trust Scudder RREEF Real Estate Fund, Inc. Scudder Strategic Income Trust Scudder Strategic Municipal Income Trust The Central European Equity Fund, Inc. The Germany Fund, Inc. The New Germany Fund, Inc. The SMALLCap Fund, Inc. |
Not all funds are available in all share classes.
Scudder open-end funds are offered by prospectus only. For more complete information on any fund or variable annuity registered in your state, including information about a fund's objectives, strategies, risks, advisory fees, distribution charges, and other expenses, please order a free prospectus. Read the prospectus before investing in any fund to ensure the fund is appropriate for your goals and risk tolerance.
A money market mutual fund investment is not insured or guaranteed by the Federal Deposit Insurance Corporation or any other government agency. Although a money market mutual fund seeks to preserve the value of your investment at $1 per share, it is possible to lose money by investing in such a fund.
The products described should not be considered a solicitation to buy or an offer to sell a security to any person in any jurisdiction where such offer, solicitation, purchase, or sale would be unlawful under the securities laws of such jurisdiction.
Account Management Resources |
|
For shareholders of Classes A, B, C and Institutional
Automated Information Lines | ScudderACCESS (800) 972-3060 Personalized account information, information on other Scudder funds and services via touchtone telephone and for Classes A, B, and C only, the ability to exchange or redeem shares.
|
Web Site | scudder.com View your account transactions and balances, trade shares, monitor your asset allocation, and change your address, 24 hours a day.
Obtain prospectuses and applications, blank forms, interactive worksheets, news about Scudder funds, subscription to fund updates by e-mail, retirement planning information, and more.
|
For more information | (800) 621-1048 To speak with a Scudder service representative.
|
Written correspondence | Scudder Investments PO Box 219356
Kansas City, MO
64121-9356
|
Principal Underwriter | If you have questions, comments or complaints, contact:
Scudder Distributors, Inc. 222 South Riverside Plaza
Chicago, IL 60606
(800) 621-1148
|
| Class A | Class B | Class C | Institutional |
Nasdaq Symbol | KDHAX
| KDHBX
| KDHCX
| KDHIX
|
CUSIP Number | 81123U-204
| 81123U-709
| 81123U-808
| 81123U-832
|
Fund Number | 087
| 287
| 387
| 539
|
This privacy statement is issued by Scudder Distributors, Inc., Scudder Financial Services, Inc., Scudder Investor Services, Inc., Scudder Trust Company and the Scudder Funds.
We consider privacy fundamental to our client relationships and adhere to the policies and practices described below to protect current and former clients' information.
We never sell customer lists or individual client information. Internal policies are in place to protect confidentiality, while allowing client needs to be served. Only individuals who need to do so in carrying out their job responsibilities may access client information. We maintain physical, electronic and procedural safeguards that comply with federal standards to protect confidentiality. These safeguards extend to all forms of interaction with us, including the Internet.
In the normal course of business, clients give us nonpublic personal information on applications and other forms, on our Web sites, and through transactions with us or our affiliates. To be able to serve our clients, information is shared with affiliates and other companies. Specifically, we disclose client information to parties that perform various services for us, such as transfer agents, custodians, and broker-dealers. Limited information also may be shared with affiliates, with companies with which we have joint marketing agreements, or with other parties as required by law. Any organization receiving client information may only use it for the purpose designated by the entities listed above.
Questions on this policy may be sent to:
Scudder Investments
Attention: Correspondence - Chicago
P.O. Box 219415
Kansas City, MO 64121-9415
July 2002

ITEM 2.         CODE OF ETHICS.

                        Not currently applicable.

ITEM 3.         AUDIT COMMITTEE FINANCIAL EXPERT.

                        Not currently applicable.

ITEM 4.         PRINCIPAL ACCOUNTANT FEES AND SERVICES.

                        Not currently applicable.

ITEM 5.         [RESERVED]

ITEM 6.         [RESERVED]

ITEM 7.         DISCLOSURE OF PROXY VOTING POLICIERS AND PROCEDURES FOR
                CLOSED-END MANAGEMENT INVESTMENT COMPANIES.

ITEM 8.         [RESERVED]

ITEM 9.         CONTROLS AND PROCEDURES.

(a) The Chief Executive and Financial Officers concluded that the
Registrant's Disclosure Controls and Procedures are effective based on the
evaluation of the Disclosure Controls and Procedures as of a date within 90 days
of the filing date of this report.


(b) During the six month period ended May 31, 2003, management identified
an issue related to a different registrant within the Scudder fund complex.
Management discussed the issue with the Registrant's Audit Committee and
auditors and instituted additional procedures to enhance its internal controls
over financial reporting.


Form N-CSR Item F

                                   SIGNATURES

Pursuant to the requirements of the Securities Exchange Act of 1934 and the
Investment Company Act of 1940, the registrant has duly caused this report to be
signed on its behalf by the undersigned, thereunto duly authorized.

Registrant:                         Scudder-Dreman High Return Fund


By:                                 /s/Richard T. Hale
                                    -----------------------------
                                    Richard T. Hale
                                    Chief Executive Officer

Date:                               July 25, 2003
                                    -----------------------------


Pursuant to the requirements of the Securities Exchange Act of 1934 and the
Investment Company Act of 1940, this report has been signed below by the
following persons on behalf of the registrant and in the capacities and on the
dates indicated.

Registrant:                         Scudder-Dreman High Return Fund


By:                                 /s/Richard T. Hale
                                    -----------------------------
                                    Richard T. Hale
                                    Chief Executive Officer

Date:                               July 25, 2003
                                    -----------------------------


By:                                 /s/Charles A. Rizzo
                                    -----------------------------
                                    Charles A. Rizzo
                                    Chief Financial Officer

Date:                               July 25, 2003
                                    -----------------------------