                                  UNITED STATES
                       SECURITIES AND EXCHANGE COMMISSION
                             WASHINGTON, D. C. 20549

                                   FORM N-CSR

Investment Company Act file number 811-5385

                           SCUDDER VALUE SERIES, INC.
                      ------------------------------------
               (Exact Name of Registrant as Specified in Charter)


                  222 South Riverside Plaza, Chicago, IL 60606
                  --------------------------------------------
               (Address of Principal Executive Offices) (Zip Code)

        Registrant's Telephone Number, including Area Code: (617) 295-2663
                                                            --------------

                               Salvatore Schiavone
                             Two International Place
                           Boston, Massachusetts 02110
                     ---------------------------------------
                     (Name and Address of Agent for Service)

Date of fiscal year end:        11/30

Date of reporting period:       11/30/03


ITEM 1.  REPORT TO STOCKHOLDERS
[Scudder Investments logo]
Scudder-Dreman
High Return Equity Fund
|
| |
| Annual Report to Shareholders |
| November 30, 2003 |
|
This report must be preceded or accompanied by a prospectus. To obtain a prospectus for any of our funds, refer to the Account Management Resources information provided in the back of this booklet. We advise you to consider the fund's objectives, risks, charges and expenses carefully before investing. The prospectus contains this and other important information about the fund. Please read the prospectus carefully before you invest.
Investments in mutual funds involve risks. Some funds have more risk than others. This fund is subject to stock market risks, meaning stocks in the fund may decline in value for extended periods of time due to the activities and financial prospects of individual companies, or due to general market and economic conditions. The fund may also focus its investments on certain economic sectors, thereby increasing its vulnerability to any single economic, political or regulatory development. This may result in greater share price volatility. Please read this fund's prospectus for specific details regarding its investments and risk profile.
Scudder Investments is part of Deutsche Asset Management, which is the marketing name in the US for the asset management activities of Deutsche Bank AG, Deutsche Investment Management Americas Inc., Deutsche Asset Management Inc., Deutsche Asset Management Investment Services Ltd., Deutsche Bank Trust Company Americas and Scudder Trust Company.
Fund shares are not FDIC-insured and are not deposits or other obligations of, or guaranteed by, any bank. Fund shares involve investment risk, including possible loss of principal.
Performance Summary November 30, 2003 |
|
All performance shown is historical and does not guarantee future results. Investment return and principal value fluctuate with changing market conditions so that, when redeemed, shares may be worth more or less than their original cost. Current performance may be lower or higher than the performance quoted. Please visit scudder.com for the product's most recent month-end performance.
The maximum sales charge for Class A shares is 5.75%. For Class B shares, the maximum contingent deferred sales charge (CDSC) is 4%. Class C shares have a 1% front-end sales charge, and redemptions within one year of purchase may be subject to a CDSC of 1%. Unadjusted returns do not reflect sales charges and would have been lower if they had. Class I and Institutional Class shares are not subject to sales charge.
Returns and rankings during the 3-year, 5-year and 10-year periods shown reflect a fee waiver and/or expense reimbursement. Without this waiver/reimbursement, returns and rankings would have been lower.
Performance figures do not reflect the deduction of taxes that a shareholder would pay on fund distributions or the redemption of fund shares. Returns and rankings may differ by share class.
Returns shown for Class B and C shares for the periods prior to their inception date on September 11, 1995 are derived from the historical performance of Class A shares of the Scudder-Dreman High Return Equity Fund during such periods and have been adjusted to reflect the higher gross total annual operating expenses of each specific class. Any difference in expenses will affect performance.
Average Annual Total Returns (Unadjusted for Sales Charge) |
Scudder-Dreman High Return Equity Fund | 1-Year | 3-Year | 5-Year | 10-Year |
Class A
| 23.18% | 4.07% | 4.96% | 13.49% |
Class B
| 22.19% | 3.23% | 4.11% | 12.51% |
Class C
| 22.27% | 3.28% | 4.15% | 12.57% |
S&P 500 Index+
| 15.09%
| -5.52%
| -.47%
| 10.63%
|
Scudder-Dreman High Return Equity Fund | 1-Year | 3-Year | 5-Year | Life of Class** |
Class I*
| 23.76% | 4.55% | 5.42% | 13.35% |
S&P 500 Index+
| 15.09%
| -5.52%
| -.47%
| 9.41%
|
Scudder-Dreman High Return Equity Fund | 1-Year | Life of Class*** |
Institutional Class*
| 23.58% | 12.37% |
S&P 500 Index+
| 15.09%
| 15.27%
|
Sources: Lipper Inc. and Deutsche Investment Management Americas Inc.
* Class I and Institutional Class shares are not subject to sales charge.** Class I shares commenced operations on November 1, 1995. Index returns begin October 31, 1995.*** Institutional Class shares commenced operations on August 19, 2002. Index returns begin August 31, 2002.Net Asset Value and Distribution Information |
| Class A | Class B | Class C | Class I | Class R | Institutional Class |
Net Asset Value:
11/30/03
| $ 36.44 | $ 36.29 | $ 36.34 | $ 36.45 | $ 36.43 | $ 36.46 |
10/1/03 (commencement of sales for Class R)++
| - | - | - | - | $ 33.86 | - |
11/30/02
| $ 30.15 | $ 30.01 | $ 30.04 | $ 30.15 | - | $ 30.14 |
Distribution Information:
Twelve Months:
Income Dividends
| $ .58 | $ .32 | $ .33 | $ .73 | - | $ .67 |
++ Class R commenced operations on October 1, 2003 and are available for investment. Please refer to the Fund's prospectus for more information on Class R share performance.Class A Lipper Rankings - Equity Income Funds Category |
Period | Rank | | Number of Funds Tracked | Percentile Ranking |
1-Year
| 13 | of | 196 | 7 |
3-Year
| 21 | of | 155 | 14 |
5-Year
| 26 | of | 137 | 19 |
10-Year
| 1 | of | 51 | 2 |
Rankings are historical and do not guarantee future results. Rankings are based on total return unadjusted for sales charges with distributions reinvested. If sales charges had been included, rankings might have been less favorable.
Source: Lipper Inc.
Growth of an Assumed $10,000 Investment (Adjusted for Sales Charge) |
[] Scudder-Dreman High Return Equity Fund - Class A [] S&P 500 Index+
|
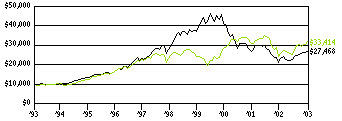 |
Yearly periods ended November 30 |
The Fund's growth of an assumed $10,000 investment is adjusted for the maximum sales charge of 5.75%. This results in a net initial investment of $9,425. The growth of $10,000 is cumulative.
Comparative Results (Adjusted for Sales Charge) |
Scudder-Dreman High Return Equity Fund | 1-Year | 3-Year | 5-Year | 10-Year |
Class A | Growth of $10,000
| $11,609 | $10,623 | $12,009 | $33,414 |
Average annual total return
| 16.09% | 2.03% | 3.73% | 12.82% |
Class B | Growth of $10,000
| $11,919 | $10,800 | $12,132 | $32,516 |
Average annual total return
| 19.19% | 2.60% | 3.94% | 12.51% |
Class C | Growth of $10,000
| $12,105 | $10,905 | $12,132 | $32,358 |
Average annual total return
| 21.05% | 2.93% | 3.94% | 12.46% |
S&P 500 Index+
| Growth of $10,000
| $11,509 | $8,434 | $9,766 | $27,468 |
Average annual total return
| 15.09% | -5.52% | -.47% | 10.63% |
Scudder-Dreman High Return Equity Fund | 1-Year | 3-Year | 5-Year | Life of Class** |
Class I* | Growth of $10,000
| $12,376 | $11,428 | $13,023 | $27,505 |
Average annual total return
| 23.76% | 4.55% | 5.42% | 13.35% |
S&P 500 Index+
| Growth of $10,000
| $11,509 | $8,434 | $9,766 | $20,535 |
Average annual total return
| 15.09% | -5.52% | -.47% | 9.41% |
Scudder-Dreman High Return Equity Fund | 1-Year | Life of Class*** |
Institutional Class* | Growth of $250,000
| $308,950 | $290,125 |
Average annual total return
| 23.58% | 12.37% |
S&P 500 Index+
| Growth of $250,000
| $287,725 | $294,400 |
Average annual total return
| 15.09% | 15.27% |
Returns shown for Class A, B and C shares have been adjusted to reflect the current applicable sales charges of each specific class. The growth of $10,000 and $250,000 is cumulative.
The minimum investment for Institutional Class shares is $250,000.
* Class I and Institutional Class shares are not subject to sales charge.** Class I shares commenced operations on November 1, 1995. Index returns begin October 31, 1995.*** Institutional Class shares commenced operations on August 19, 2002. Index returns begin August 31, 2002.+ The Standard & Poor's (S&P) 500 Index is a capitalization-weighted index of 500 stocks. The index is designed to measure performance of the broad domestic economy through changes in the aggregate market value of 500 stocks representing all major industries. Index returns assume reinvestment of dividends and, unlike Fund returns, do not reflect any fees or expenses. It is not possible to invest directly into an index.Portfolio Management Review |
|
Scudder-Dreman High Return Equity Fund:
A Team Approach to Investing
Deutsche Investment Management Americas Inc. ("DeIM" or the "Advisor"), which is part of Deutsche Asset Management, is the investment advisor for Scudder-Dreman High Return Equity Fund. DeIM and its predecessors have more than 80 years of experience managing mutual funds and DeIM provides a full range of investment advisory services to institutional and retail clients. DeIM is also responsible for selecting brokers and dealers and for negotiating brokerage commissions and dealer charges.
Deutsche Asset Management is a global asset management organization that offers a wide range of investing expertise and resources. This well-resourced global investment platform brings together a wide variety of experience and investment insight across industries, regions, asset classes and investing styles.
DeIM is an indirect, wholly owned subsidiary of Deutsche Bank AG. Deutsche Bank AG is a major global banking institution that is engaged in a wide range of financial services, including investment management, mutual funds, retail, private and commercial banking, investment banking and insurance.
Dreman Value Management L.L.C. ("DVM"), Jersey City, New Jersey, is the subadvisor for the fund. DVM was founded in 1977 and currently manages over $7.5 billion in assets as of December 31, 2003.
Portfolio Management Team
Dreman Value Management, L.L.C. is the subadvisor for the fund.
David N. Dreman
Lead Portfolio Manager.
• Began investment career in 1957.
• Joined the fund team in 1988.
• Founder and Chairman, Dreman Value Management, L.L.C. since 1977.
F. James Hutchinson
Portfolio Manager.
• Began investment career in 1986.
• Joined the fund team in 2001.
• Prior to that, associated with The Bank of New York for over 30 years in both the corporate finance and trust/investment areas, including President of The Bank of New York (NJ).
In the following interview, Lead Portfolio Manager David N. Dreman discusses the strategy of Scudder-Dreman High Return Equity Fund and the market environment during the 12-month period ended November 30, 2003.
Q: Will you provide an overview of market conditions during the 12 months ended November 30, 2003?
A: After three calendar years (2000, 2001, 2002) of losses, the stock market, as measured by the Standard & Poor's 500 index (S&P 500), posted solid gains - up 15.09% for the 12 months ended November 30, 2003. The road to this recovery in stocks, however, was quite volatile - especially in the first half of the fiscal period. At the start of the period, technology stocks rallied and led the S&P 500 to a strong gain. In January, investors became skittish once again, as they speculated about the impending war with Iraq, continued sluggish economic growth and no solid improvement in corporate earnings. In the first quarter of 2003, the S&P 500 lost ground. This backdrop quickly changed for the better once it became apparent that the war would be resolved quickly. After reaching a low in mid-March, stocks staged a rally in the second calendar quarter of 2003, with the S&P 500 gaining 15.39%. Gains continued through the end of the reporting period, but at a more conservative pace. The market gains were broad-based, but value stocks marginally outperformed growth stocks.
Q: How did Scudder-Dreman High Return Equity Fund perform?
A: The fund significantly outperformed in the period. For the 12 months ended November 30, 2003, the fund's Class A shares (unadjusted for sales charges which, if included, would have reduced performance) posted a total return of 23.18%, more than 8 percentage points above the 15.09% return posted by the fund's benchmark, the S&P 500 for the same period. (Please see pages 4 through 6 for performance of other share classes and more complete performance information.) The S&P 500 is an unmanaged index that is generally representative of the US stock market. The fund also outperformed the 14.85% average total return of its peers in the Lipper Equity Income Funds category - a group of mutual funds that seeks relatively high current income and growth of income by investing a portion of their portfolios in dividend-paying stocks.
Over the longer term and throughout the recent bear market, the fund has also solidly outperformed - posting strong positive returns, while the S&P 500 has declined significantly. Since the market peaked in March 2000, the fund's Class A shares (unadjusted for sales charges which, if included, would have reduced performance) have posted a positive average annual total return of 11.56% versus a loss of -7.69% by the S&P 500 from March 31, 2000 through November 30, 2003. Although past performance doesn't guarantee future results, we're extremely pleased with these results.
An important part of the fund's long-term success is due to a portfolio that is focused on high-dividend-yielding stocks. As of November 30, 2003, 84% of the fund's stock holdings paid dividends - and many of those stocks had dividend yields well above the average yield of the S&P 500. In this day of increasing emphasis on yield, particularly after the reduction of the maximum tax rate on dividends to 15%, we believe this will continue to be a major benefit for the fund in the future.
Q: Before discussing the specific factors behind the fund's performance, will you discuss your investment philosophy?
A: We manage with a classic contrarian value approach to investing believing that consensus opinion, especially when it comes to investment decisions, is often wrong. By this, I mean that we focus on companies that we believe are financially solid but that are trading at low prices relative to their earnings (P/E), book value (P/B) and cash flow (P/CF). Typically, these types of companies provide the potential for above-market returns over time. We base our investment decisions on a "bottom-up" stock selection process. By bottom-up, we mean that we choose stocks based solely on thorough analysis of a company, not because we like the stock's market sector or because we believe that the macroeconomic environment will support a certain industry. Industry and sector weightings are always a residual of individual stock selection.
Q: What was behind the fund's outperformance?
A: Sticking to our contrarian value investment discipline was critical in the fund's outperformance for this 12-month period and the longer term. We were patient with several of the fund's holdings that faced difficulties and were rewarded for our patience as those issues posted strong gains.
Q: Will you discuss the areas that most helped the fund's performance?
A: The fund's retail and tobacco stocks added most to fund returns this period.
1. Retail stocks. Electronics retailer Best Buy Co., Inc. declined early in the period due to concerns that it was losing market share and its poorly performing Musicland retail division. The fund owned this stock a couple of years ago and began to slowly add it back to the portfolio last fall. Having faith in company management, we continued to add to the fund's position as the stock struggled. Earlier in the year it was one of the fund's top 10 holdings. The company put its Musicland division up for sale, continued to add retail outlets and grew its share of the consumer electronics market. Its share price rose substantially and benefited the fund. Home improvement retailer Home Depot declined dramatically in January 2003 after management announced that it would post lower-than-expected fourth-quarter 2002 earnings. We viewed the setback as temporary and believed good management and large cash reserves would help Home Depot weather the storm. That was indeed the case, and the stock has risen substantially since the fund's purchase in January 2003. Staples, a national office supply chain, also performed well during the period as it benefited from its expansion model. As these stocks have appreciated, we have trimmed the fund's positions in them to lock in profits.
2. Tobacco stocks. Despite some extreme volatility and a sharp decline early in the period, Altria Group ended the period higher. Altria Group is the fund's largest holding (9.8% of market value as of November 30, 2003) and is the parent company of Philip Morris USA, Kraft and Philip Morris International. The stock fell in March, when a judge awarded more than $10 billion in damages to the plaintiffs in an Illinois class-action lawsuit against cigarette company Philip Morris USA. The stock rebounded in April and May when the bond in the Illinois lawsuit was substantially reduced and more important, when a lingering Florida class-action suit worth billions was dismissed on appeal. The case in Florida suggests that the financial risks of future litigation may be reduced. The stock continued to rise throughout the period as did R.J. Reynolds Tobacco Holdings, Inc., another tobacco stock that benefited from the diminished fears of litigation risk within the industry. The fund continued to hold these stocks because we believed they were still trading at a discount, while paying attractive dividends. If their share prices continue to rise, we'll look for opportunities to pare back the fund's position.
Q: What about areas that held back performance?
A: While the fund's health care holdings gained in the period, they advanced at a much lower rate than the overall market. Pharmaceutical companies within the portfolio struggled, and the fund's overweight position in these stocks hurt its performance relative to the S&P 500. Schering-Plough Corp. was the primary detractor. The company's earnings and stock price fell due to the patent expiration of its allergy medicine, Claritin. The stock declined further on news that a federal grand jury would be investigating the company's sales, marketing and clinical trials practices. We trimmed the fund's position in the stock, but we've kept it in the portfolio for several reasons. First, the company has hired a new chief executive officer who successfully ran Pharmacia, one of Schering-Plough's competitors. Second, the firm has a solid product portfolio and a very strong cash position and while it may take some time, we expect the company to weather this storm.
Pharmaceutical stocks represent about 8.2% of the fund's market value. Although they struggled during this fiscal period, we believe that over time they have strong growth potential. Each company the fund owns - Bristol Myers Squibb Co., Inc., Merck & Co. and Pfizer, Inc. - has strong cash flows to fund continued research and development, capable marketing arms, and large sales forces to drive current earnings. We also expect these companies to be helped by the Medicare legislation that was recently passed, which we anticipate will increase their sales volumes.
A bright spot in the sector was managed care company Humana, Inc. The stock gained substantially as the company has been successful in controlling its operational costs and increasing earnings.
Q: Financial stocks represent the largest position in the fund. How did they perform during the period?
A: The fund's financial sector - 28.7% of the fund's market value as of November 30, 2003 - gained for the 12-month period.
The fund's regional banks posted strong gains. Washington Mutual, Inc., continued to be a strong performer as it posted strong earnings and benefited from high mortgage refinance activity and its successful national retail expansion. JPMorgan Chase, a large financial services conglomerate, also provided strong performance. The stock was added to the portfolio in late 2002 after the stock suffered from news of huge write-offs of loans to failed telecommunications and energy trading firms. Believing that these were one-time events and that the company's management was solid, the fund invested in the stock, and since then, its share price has rebounded sharply. The stock has also continued to pay an attractive dividend. We have eliminated the fund's position in the stock as it has appreciated to close to what we believe is its fair market value.
The fund's financials were hurt by mortgage provider Freddie Mac. The stock declined in June after the company's board of directors dismissed three senior leaders after learning that the company's earnings had been understated. While the stock has made up much of its lost ground, the stock continues to struggle as investors and the media debate the potential impact of increased federal regulation of the company. We have confidence that Freddie Mac will weather this storm. The stock trades at a deep discount, but has continued to grow its earnings consistently.
Q: Do you have any other comments that you'd like to share?
A: I'd like to thank shareholders for their continued investment in the fund. We hope that you're as pleased with the fund's results as we are. The fund's recent outperformance and its outperformance of the market over time, we believe, is due to our unwavering commitment to our contrarian philosophy of investing. As always, we will remain true to our investment discipline in hopes of adding more value for shareholders over time.
The views expressed in this report reflect those of the portfolio managers only through the end of the period of the report as stated on the cover. The managers' views are subject to change at any time based on market and other conditions and should not be construed as a recommendation.
Portfolio Summary November 30, 2003 |
|
Asset Allocation | 11/30/03 | 11/30/02 |
|
Common Stocks
| 91%
| 97%
|
Cash Equivalents
| 9%
| 3%
|
| 100%
| 100%
|
Sector Diversification (Excludes Cash Equivalents) | 11/30/03 | 11/30/02 |
|
Financials
| 31%
| 29%
|
Consumer Staples
| 23%
| 21%
|
Health Care
| 15%
| 15%
|
Consumer Discretionary
| 12%
| 12%
|
Energy
| 10%
| 11%
|
Industrials
| 4%
| 6%
|
Information Technology
| 3%
| 4%
|
Utilities
| 2%
| 2%
|
| 100%
| 100%
|
Asset allocation and sector diversification are subject to change.
Ten Largest Equity Holdings at November 30, 2003 (47.6% of Portfolio) |
1. Altria Group, Inc.
Operator of multi-line companies
| 9.8% |
2. Freddie Mac
Supplier of mortgage credit
| 6.0% |
3. Washington Mutual, Inc.
Provider of diversified financial services
| 5.7% |
4. Fannie Mae
Facilitator of mortgages and issuer of mortgage-backed securities
| 4.9% |
5. UST, Inc.
Manufacturer and marketer of smokeless tobacco, premium cigars and premium wines
| 4.3% |
6. Bristol-Myers Squibb Co.
Producer of diversified pharmaceuticals and consumer products
| 4.0% |
7. ConocoPhillips
Producer of petroleum and natural gas
| 3.8% |
8. R.J. Reynolds Tobacco Holdings, Inc.
Operator of a diversified holding company
| 3.4% |
9. Electronic Data Systems Corp.
Provider of computer outsourcing and consulting services
| 3.1% |
10. ChevronTexaco Corp.
Operator of petroleum exploration, delivery and refining facilities
| 2.6% |
Portfolio holdings are subject to change.For more complete details about the fund's investment portfolio, see page 17. A quarterly Fact Sheet and Portfolio Holdings are available upon request.
Investment Portfolio as of November 30, 2003 | |
|
|
Shares
| Value ($) |
|
|
Common Stocks 90.6% |
Consumer Discretionary 10.7%
|
Automobiles 0.7%
|
Ford Motor Co.
| 2,540,675
| 33,536,910 |
Multiline Retail 1.0%
|
Federated Department Stores, Inc.
| 955,925
| 46,926,358 |
Specialty Retail 9.0%
|
Best Buy Co., Inc.
| 326,270
| 20,228,740
|
Borders Group, Inc.*(b)
| 5,115,100
| 114,987,448
|
Home Depot, Inc.
| 2,798,835
| 102,885,175
|
Lowe's Companies, Inc.
| 398,050
| 23,206,315
|
Staples, Inc.*
| 4,088,105
| 110,992,051
|
The Gap, Inc.
| 2,700,341
| 58,057,331
|
| 430,357,060 |
Consumer Staples 20.4%
|
Food & Drug Retailing 0.5%
|
Safeway, Inc.*
| 1,090,725
| 22,632,544 |
Tobacco 19.9%
|
Altria Group, Inc.
| 9,001,175
| 468,061,100
|
Imperial Tobacco Group (ADR)
| 691,750
| 25,719,265
|
R.J. Reynolds Tobacco Holdings, Inc.
| 2,908,331
| 160,539,871
|
Universal Corp. (b)
| 2,110,950
| 90,179,784
|
UST, Inc.
| 5,754,300
| 207,097,257
|
| 951,597,277 |
Energy 8.7%
|
Energy Equipment & Services 0.6%
|
Transocean Inc.*
| 1,442,075
| 27,947,414 |
Oil & Gas 8.1%
|
ChevronTexaco Corp.
| 1,639,567
| 123,131,481
|
ConocoPhillips
| 3,193,573
| 181,203,332
|
Devon Energy Corp.
| 942,075
| 46,500,822
|
Kerr-McGee Corp.
| 891,225
| 37,422,538
|
| 388,258,173 |
Financials 28.7%
|
Banks 16.3%
|
Bank of America Corp.
| 974,900
| 73,536,707
|
Bank One Corp.
| 746,768
| 32,379,860
|
FleetBoston Financial Corp.
| 1,518,259
| 61,641,315
|
KeyCorp
| 2,411,450
| 67,014,195
|
PNC Financial Services Group
| 1,673,410
| 90,966,568
|
Sovereign Bancorp, Inc.
| 3,566,300
| 80,812,358
|
US Bancorp
| 1,884,450
| 52,218,110
|
Wachovia Corp.
| 1,006,400
| 46,042,800
|
Washington Mutual, Inc.
| 5,947,664
| 272,462,488
|
| 777,074,401 |
Diversified Financials 11.3%
|
CIT Group, Inc.
| 646,675
| 22,549,557
|
Fannie Mae
| 3,329,350
| 233,054,500
|
Freddie Mac
| 5,272,250
| 286,915,845
|
| 542,519,902 |
Insurance 1.1%
|
Ohio Casualty Corp.*
| 295,100
| 5,019,651
|
Safeco Corp.
| 611,225
| 22,878,152
|
St. Paul Companies, Inc.
| 663,160
| 24,603,236
|
| 52,501,039 |
Health Care 13.4%
|
Health Care Providers & Services 5.2%
|
HCA, Inc.
| 1,742,200
| 73,015,602
|
Humana, Inc.*
| 1,495,600
| 33,396,748
|
Labortory Corp. of America Holdings*
| 1,741,300
| 62,895,756
|
Medco Health Solutions, Inc.*
| 356,237
| 12,977,714
|
Quest Diagnostics, Inc.
| 880,100
| 64,220,897
|
| 246,506,717 |
Pharmaceuticals 8.2%
|
Bristol-Myers Squibb Co.
| 7,267,850
| 191,507,847
|
Merck & Co., Inc.
| 2,953,880
| 119,927,528
|
Pfizer, Inc.
| 1,016,900
| 34,116,995
|
Schering-Plough Corp.
| 2,884,135
| 46,290,367
|
| 391,842,737 |
Industrials 3.8%
|
Electrical Equipment 1.5%
|
Emerson Electric Co.
| 1,191,300
| 72,716,952 |
Industrial Conglomerates 2.3%
|
General Electric Co.
| 1,502,125
| 43,065,924
|
Tyco International Ltd.
| 2,963,680
| 68,016,456
|
| 111,082,380 |
Information Technology 3.1%
|
IT Services
|
Electronic Data Systems Corp.
| 6,827,511
| 147,610,788 |
Utilities 1.8%
|
Gas Utilities 0.1%
|
NiSource, Inc.*
| 1,613,040
| 3,839,035 |
Multi-Utilities & Unregulated Power 1.7%
|
El Paso Corp.
| 6,053,625
| 42,980,738
|
Williams Companies, Inc.
| 4,154,800
| 38,972,024
|
| 81,952,762 |
Total Common Stocks (Cost $3,692,173,328)
| 4,328,902,449 |
| Principal Amount ($) | Value ($) |
|
|
US Treasury Obligations 0.4% |
US Treasury Bills:
|
|
|
0.90%, 3/4/2004 (c) | 10,000,000
| 9,975,850
|
0.91%, 3/18/2004 (c) | 10,000,000
| 9,970,300
|
Total US Treasury Obligations (Cost $19,946,017)
| 19,946,150 |
|
Shares
| Value ($) |
|
|
Cash Equivalents 9.0% |
Scudder Cash Management QP Trust, 1.09% (d)
|
|
|
(Cost $428,335,571)
| 428,335,571
| 428,335,571
|
Total Investment Portfolio - 100.0% (Cost $4,140,454,916) (a)
| 4,777,184,170 |
* Non-income producing security.(a) The cost for federal income tax purposes was $4,156,736,103. At November 30, 2003, net unrealized appreciation for all securities based on tax cost was $620,448,067. This consisted of aggregate gross unrealized appreciation for all securities in which there was an excess of value over tax cost of $982,424,703 and aggregate gross unrealized depreciation for all securities in which there was an excess of tax cost over value of $361,976,636.(b) Affiliated issuers (see Notes to Financial Statements).(c) At November 30, 2003, this security has been pledged to cover, in whole or part, initial margin requirements for open futures contracts.(d) Scudder Cash Management QP Trust is also managed by Deutsche Investment Management Americas Inc. The rate shown is the annualized seven-day yield at period end.At November 30, 2003, open futures contracts purchased were as follows:Futures | Expiration Date | Contracts | Aggregated Face Value ($) | Value ($) | Net Unrealized Appreciation ($) |
S&P 500 Index
| 12/18/2003 | 829 | 214,653,141 | 219,229,050 | 4,575,909 |
The accompanying notes are an integral part of the financial statements.
Statement of Assets and Liabilities as of November 30, 2003 |
Assets
|
Investments in securities, at value:
Unaffiliated issuers (cost $3,555,343,067) | $ 4,110,284,619 |
Affiliated issuers (cost $156,776,278) | 238,563,980 |
Scudder Cash Management QP Trust (cost $428,335,571) | 428,335,571 |
Total investments in securities, at value (cost $4,140,454,916)
| 4,777,184,170 |
Cash
| 10,089 |
Receivable for investments sold
| 38,617,542 |
Dividends receivable
| 5,796,092 |
Interest receivable
| 350,227 |
Receivable for Fund shares sold
| 10,746,138 |
Receivable for daily variation on open futures contracts
| 227,975 |
Total assets
| $ 4,832,932,233 |
Liabilities
|
Payable for investments purchased
| 38,345,330 |
Payable for Fund shares redeemed
| 5,727,721 |
Accrued management fee
| 2,729,456 |
Other accrued expenses and payables
| 3,487,454 |
Total liabilities
| 50,289,961 |
Net assets, at value
| $ 4,782,642,272 |
Net Assets
|
Net assets consist of:
Undistributed net investment income
| 7,653,576 |
Net unrealized appreciation (depreciation) on:
Investments
| 636,729,254 |
Futures
| 4,575,909 |
Accumulated net realized gain (loss)
| (374,938,120) |
Paid-in capital
| 4,508,621,653 |
Net assets, at value
| $ 4,782,642,272 |
The accompanying notes are an integral part of the financial statements.
Statement of Assets and Liabilities as of November 30, 2003 (continued) |
Net Asset Value
|
Class A
Net Asset Value and redemption price per share ($2,983,179,549 / 81,858,844 shares of capital stock outstanding, $.01 par value, 560,000,000 shares authorized)
| $ 36.44 |
Maximum offering price per share (100 / 94.25 of $36.44)
| $ 38.66 |
Class B
Net Asset Value, offering and redemption price (subject to contingent deferred sales charge) per share ($1,149,877,331 / 31,685,548 shares of capital stock outstanding, $.01 par value, 560,000,000 shares authorized)
| $ 36.29 |
Class C
Net Asset Value and redemption price (subject to contingent deferred sales charge) per share ($548,973,804 / 15,108,102 shares of capital stock outstanding, $.01 par value, 140,000,000 shares authorized)
| $ 36.34 |
Maximum offering price per share (100 / 99.00 of $36.34)
| $ 36.71 |
Class I
Net Asset Value, offering and redemption price per share ($12,738,002 / 349,499 shares of capital stock outstanding, $.01 par value, 140,000,000 shares authorized)
| $ 36.45 |
Class R
Net Asset Value, offering and redemption price per share ($29,323 / 805 shares of capital stock outstanding, $.01 par value, 100,000,000 shares authorized)
| $ 36.43 |
Institutional Class
Net Asset Value, offering and redemption price per share ($87,844,263 / 2,409,387 outstanding shares of beneficial interest, $.01 par value, 100,000,000 shares authorized)
| $ 36.46 |
The accompanying notes are an integral part of the financial statements.
Statement of Operations for the year ended November 30, 2003 |
Investment Income
|
Income:
Dividends - Unaffiliated issuers (net of foreign taxes withheld of $55,707)
| $ 120,403,276 |
Dividends - Affiliated issuers
| 3,039,768 |
Interest - Scudder Cash Management QP Trust
| 2,370,887 |
Interest
| 47,583 |
Total Income
| 125,861,514 |
Expenses:
Management fee
| 28,014,423 |
Administrative fee
| 11,842,034 |
Services to shareholders
| 1,359,183 |
Distribution service fees
| 21,597,129 |
Directors' fees and expenses
| 110,879 |
Other
| 274,372 |
Total expenses, before expense reductions
| 63,198,020 |
Expense reduction
| (87) |
Total expenses, after expense reductions
| 63,197,933 |
Net investment income (loss)
| 62,663,581 |
Realized and Unrealized Gain (Loss) on Investment Transactions
|
Net realized gain (loss) from:
Investments - Unaffiliated issuers
| 49,765,847 |
Investments - Affiliated issuers
| 13,328,059 |
Futures
| 521,989 |
| 63,615,895 |
Net unrealized appreciation (depreciation) during the period on:
Investments
| 733,364,237 |
Futures
| 4,575,909 |
| 737,940,146 |
Net gain (loss) on investment transactions
| 801,556,041 |
Net increase (decrease) in net assets resulting from operations
| $ 864,219,622 |
The accompanying notes are an integral part of the financial statements.
Statement of Changes in Net Assets |
Increase (Decrease) in Net Assets
| Years Ended November 30, |
2003 | 2002 |
Operations:
Net investment income (loss)
| $ 62,663,581 | $ 48,257,994 |
Net realized gain (loss) on investment transactions
| 63,615,895 | (405,769,190) |
Net unrealized appreciation (depreciation) on investment transactions during the period
| 737,940,146 | (440,759,854) |
Net increase (decrease) in net assets resulting from operations
| 864,219,622 | (798,271,050) |
Distributions to shareholders from:
Net investment income:
Class A
| (42,572,167) | (31,045,029) |
Class B
| (11,815,008) | (8,871,551) |
Class C
| (4,539,592) | (2,668,340) |
Class I
| (431,822) | (515,285) |
Institutional Class
| (730,861) | (128) |
Fund share transactions:
Proceeds from shares sold
| 1,332,204,773 | 1,538,686,003 |
Reinvestment of distributions
| 52,831,867 | 38,796,015 |
Cost of shares redeemed
| (1,128,961,175) | (1,154,361,458) |
Net increase (decrease) in net assets from Fund share transactions
| 256,075,465 | 423,120,560 |
Increase (decrease) in net assets
| 1,060,205,637 | (418,250,823) |
Net assets at beginning of period
| 3,722,436,635 | 4,140,687,458 |
Net assets at end of period (including undistributed net investment income of $7,653,576 and $5,079,445, respectively)
| $ 4,782,642,272 | $ 3,722,436,635 |
The accompanying notes are an integral part of the financial statements.
Class A |
Years Ended November 30, | 2003 | 2002 | 2001 | 2000 | 1999 |
Selected Per Share Data
|
Net asset value, beginning of period
| $ 30.15 | $ 36.74 | $ 33.91 | $ 30.45 | $ 35.69 |
Income (loss) from investment operations:
Net investment incomea
| .59 | .53 | .41 | .65 | .71 |
Net realized and unrealized gain (loss) on investment transactions
| 6.28 | (6.63) | 2.94 | 5.74 | (3.69) |
Total from investment operations | 6.87 | (6.10) | 3.35 | 6.39 | (2.98) |
Less distributions from:
Net investment income
| (.58) | (.49) | (.52) | (.68) | (.70) |
Net realized gains on investment transactions
| - | - | - | (2.25) | (1.56) |
Total distributions | (.58) | (.49) | (.52) | (2.93) | (2.26) |
Net asset value, end of period
| $ 36.44 | $ 30.15 | $ 36.74 | $ 33.91 | $ 30.45 |
Total Return (%)b
| 23.18 | (16.77) | 9.94 | 24.06 | (8.88) |
Ratios to Average Net Assets and Supplemental Data
|
Net assets, end of period ($ millions)
| 2,983 | 2,056 | 2,101 | 1,661 | 2,043 |
Ratio of expenses before expense reductions (%)
| 1.27 | 1.27 | 1.27 | 1.30c | 1.20 |
Ratio of expenses after expense reductions (%)
| 1.27 | 1.27 | 1.27 | 1.27c | 1.20 |
Ratio of net investment income (loss) (%)
| 1.87 | 1.54 | 1.13 | 2.34 | 2.09 |
Portfolio turnover rate (%)
| 14 | 25 | 29 | 12 | 33 |
a Based on average shares outstanding during the period.
b Total return does not reflect the effect of any sales charges.
c The ratios of operating expenses excluding costs incurred in connection with a fund complex reorganization before and after expense reductions were 1.27% and 1.24%, respectively.
|
Class B |
Years Ended November 30, | 2003 | 2002 | 2001 | 2000 | 1999 |
Selected Per Share Data
|
Net asset value, beginning of period
| $ 30.01 | $ 36.58 | $ 33.75 | $ 30.31 | $ 35.51 |
Income (loss) from investment operations:
Net investment incomea
| .34 | .25 | .12 | .42 | .42 |
Net realized and unrealized gain (loss) on investment transactions
| 6.26 | (6.62) | 2.93 | 5.72 | (3.66) |
Total from investment operations | 6.60 | (6.37) | 3.05 | 6.14 | (3.24) |
Less distributions from:
Net investment income
| (.32) | (.20) | (.22) | (.45) | (.40) |
Net realized gains on investment transactions
| - | - | - | (2.25) | (1.56) |
Total distributions | (.32) | (.20) | (.22) | (2.70) | (1.96) |
Net asset value, end of period
| $ 36.29 | $ 30.01 | $ 36.58 | $ 33.75 | $ 30.31 |
Total Return (%)b
| 22.19 | (17.43) | 9.03 | 23.04 | (9.62) |
Ratios to Average Net Assets and Supplemental Data
|
Net assets, end of period ($ millions)
| 1,150 | 1,243 | 1,609 | 1,375 | 1,865 |
Ratio of expenses before expense reductions (%)
| 2.08 | 2.08 | 2.08 | 2.14c | 2.03 |
Ratio of expenses after expense reductions (%)
| 2.08 | 2.08 | 2.08 | 2.10c | 2.03 |
Ratio of net investment income (loss) (%)
| 1.06 | .73 | .32 | 1.51 | 1.26 |
Portfolio turnover rate (%)
| 14 | 25 | 29 | 12 | 33 |
a Based on average shares outstanding during the period.
b Total return does not reflect the effect of any sales charges.
c The ratios of operating expenses excluding costs incurred in connection with a fund complex reorganization before and after expense reductions were 2.10% and 2.06%, respectively.
|
Class C |
Years Ended November 30, | 2003 | 2002 | 2001 | 2000 | 1999 |
Selected Per Share Data
|
Net asset value, beginning of period
| $ 30.04 | $ 36.61 | $ 33.78 | $ 30.34 | $ 35.54 |
Income (loss) from investment operations:
Net investment incomea
| .35 | .26 | .13 | .42 | .43 |
Net realized and unrealized gain (loss) on investment transactions
| 6.28 | (6.62) | 2.93 | 5.73 | (3.66) |
Total from investment operations | 6.63 | (6.36) | 3.06 | 6.15 | (3.23) |
Less distributions from:
Net investment income
| (.33) | (.21) | (.23) | (.46) | (.41) |
Net realized gains on investment transactions
| - | - | - | (2.25) | (1.56) |
Total distributions | (.33) | (.21) | (.23) | (2.71) | (1.97) |
Net asset value, end of period
| $ 36.34 | $ 30.04 | $ 36.61 | $ 33.78 | $ 30.34 |
Total Return (%)b
| 22.27 | (17.42) | 9.09 | 23.06 | (9.60) |
Ratios to Average Net Assets and Supplemental Data
|
Net assets, end of period ($ millions)
| 549 | 398 | 398 | 285 | 414 |
Ratio of expenses before expense reductions (%)
| 2.02 | 2.05 | 2.05 | 2.12c | 2.00 |
Ratio of expenses after expense reductions (%)
| 2.02 | 2.05 | 2.05 | 2.08c | 2.00 |
Ratio of net investment income (loss) (%)
| 1.12 | .76 | .35 | 1.54 | 1.29 |
Portfolio turnover rate (%)
| 14 | 25 | 29 | 12 | 33 |
a Based on average shares outstanding during the period.
b Total return does not reflect the effect of any sales charges.
c The ratios of operating expenses excluding costs incurred in connection with a fund complex reorganization before and after expense reductions were 2.08% and 2.04%, respectively.
|
Class I |
Years Ended November 30, | 2003 | 2002 | 2001 | 2000 | 1999 |
Selected Per Share Data
|
Net asset value, beginning of period
| $ 30.15 | $ 36.76 | $ 33.92 | $ 30.45 | $ 35.71 |
Income (loss) from investment operations:
Net investment incomea
| .74 | .68 | .58 | .77 | .84 |
Net realized and unrealized gain (loss) on investment transactions
| 6.29 | (6.64) | 2.94 | 5.74 | (3.70) |
Total from investment operations | 7.03 | (5.96) | 3.52 | 6.51 | (2.86) |
Less distributions from:
Net investment income
| (.73) | (.65) | (.68) | (.79) | (.84) |
Net realized gains on investment transactions
| - | - | - | (2.25) | (1.56) |
Total distributions | (.73) | (.65) | (.68) | (3.04) | (2.40) |
Net asset value, end of period
| $ 36.45 | $ 30.15 | $ 36.76 | $ 33.92 | $ 30.45 |
Total Return (%)
| 23.76 | (16.40) | 10.45 | 24.60 | (8.54) |
Ratios to Average Net Assets and Supplemental Data
|
Net assets, end of period ($ millions)
| 13 | 22 | 33 | 26 | 22 |
Ratio of expenses before expense reductions (%)
| .81 | .80 | .83 | .86b | .82 |
Ratio of expenses after expense reductions (%)
| .81 | .80 | .83 | .85b | .82 |
Ratio of net investment income (loss) (%)
| 2.33 | 2.01 | 1.57 | 2.73 | 2.47 |
Portfolio turnover rate (%)
| 14 | 25 | 29 | 12 | 33 |
a Based on average shares outstanding during the period.
b The ratios of operating expenses excluding costs incurred in connection with a fund complex reorganization before and after expense reductions were .86% and .85%, respectively.
|
Class R |
| 2003a |
Selected Per Share Data
|
Net asset value, beginning of period
| $ 33.86 |
Income (loss) from investment operations:
Net investment incomeb
| .02 |
Net realized and unrealized gain (loss) on investment transactions
| 2.55 |
Total from investment operations | 2.57 |
Net asset value, end of period
| $ 36.43 |
Total Return (%)
| 7.59* |
Ratios to Average Net Assets and Supplemental Data
|
Net assets, end of period ($ millions)
| .029 |
Ratio of expenses before expense reductions (%)
| 1.30** |
Ratio of net investment income (loss) (%)
| .38** |
Portfolio turnover rate (%)
| 14 |
a For the period from October 1, 2003 (commencement of sales of Class R shares) to November 30, 2003.
b Based on average shares outstanding during the period.
* Not annualized
** Annualized
|
Institutional Class |
Years Ended November 30, | 2003 | 2002a |
Selected Per Share Data
|
Net asset value, beginning of period
| $ 30.14 | $ 32.27 |
Income (loss) from investment operations:
Net investment income (loss)b
| .69 | .13 |
Net realized and unrealized gain (loss) on investment transactions
| 6.30 | (2.11) |
Total from investment operations | 6.99 | (1.98) |
Less distributions from:
Net investment income
| (.67) | (.15) |
Net asset value, end of period
| $ 36.46 | $ 30.14 |
Total Return (%)
| 23.58 | (6.09)* |
Ratios to Average Net Assets and Supplemental Data
|
Net assets, end of period ($ millions)
| 88 | 2 |
Ratio of expenses (%)
| .92 | 1.00** |
Ratio of net investment income (loss) (%)
| 2.22 | (1.57)** |
Portfolio turnover rate (%)
| 14 | 25 |
a For the period from August 19, 2002, (commencement of sales of Institutional Class shares) to November 30, 2002.
b Based on average shares outstanding during the period.
* Not annualized
** Annualized
|
Notes to Financial Statements |
|
A. Significant Accounting Policies
Scudder-Dreman High Return Equity Fund (the ``Fund'') is a diversified series of Scudder Value Series, Inc. (the ``Corporation'') which is registered under the Investment Company Act of 1940, as amended (the ``1940 Act''), as an open-end management investment company and is organized as a Maryland Corporation.
The Fund offers multiple classes of shares which provide investors with different purchase options. Class A shares are offered to investors subject to an initial sales charge. Class B shares are offered without an initial sales charge but are subject to higher ongoing expenses than Class A shares and a contingent deferred sales charge payable upon certain redemptions. Class B shares automatically convert to Class A shares six years after issuance. Class C shares are offered to investors subject to an initial sales charge and are subject to higher ongoing expenses than Class A shares and a contingent deferred sales charge payable upon certain redemptions within one year of purchase. Prior to February 3, 2003, Class C shares were offered without an initial sales charge. Class C shares do not convert into another class. Class I, R and Institutional Class shares are offered to a limited group of investors, are not subject to initial or contingent deferred sales charges and have lower ongoing expenses than other classes.
Investment income, realized and unrealized gains and losses, and certain fund-level expenses and expense reductions, if any, are borne pro rata on the basis of relative net assets by the holders of all classes of shares, except that each class bears certain expenses unique to that class such as distribution service fees, administrative fees and certain other class-specific expenses. Differences in class-level expenses may result in payment of different per share dividends by class. All shares of the Fund have equal rights with respect to voting subject to class-specific arrangements.
The Fund's financial statements are prepared in accordance with accounting principles generally accepted in the United States of America which require the use of management estimates. Actual results could differ from those estimates. The policies described below are followed consistently by the Fund in the preparation of its financial statements.
Security Valuation. Investments are stated at value determined as of the close of regular trading on the New York Stock Exchange on each day the exchange is open for trading. Equity securities are valued at the most recent sale price reported on the exchange (US or foreign) or over-the-counter market on which the security is traded most extensively. Securities for which no sales are reported are valued at the calculated mean between the most recent bid and asked quotations on the relevant market or, if a mean cannot be determined, at the most recent bid quotation.
Money market instruments purchased with an original or remaining maturity of sixty days or less, maturing at par, are valued at amortized cost. Investments in open-end investment companies and Scudder Cash Management QP Trust are valued at their net asset value each business day.
Securities and other assets for which market quotations are not readily available or for which the above valuation procedures are deemed not to reflect fair value are valued in a manner that is intended to reflect their fair value as determined in accordance with procedures approved by the Directors.
Futures Contracts. A futures contract is an agreement between a buyer or seller and an established futures exchange or its clearinghouse in which the buyer or seller agrees to take or make a delivery of a specific amount of a financial instrument at a specified price on a specific date (settlement date). The Fund may enter into futures contracts as a hedge against anticipated interest rate, currency or equity market changes, and for duration management, risk management and return enhancement purposes.
Upon entering into a futures contract, the Fund is required to deposit with a financial intermediary an amount ("initial margin") equal to a certain percentage of the face value indicated in the futures contract. Subsequent payments ("variation margin") are made or received by the Fund dependent upon the daily fluctuations in the value of the underlying security and are recorded for financial reporting purposes as unrealized gains or losses by the Fund. When entering into a closing transaction, the Fund will realize a gain or loss equal to the difference between the value of the futures contract to sell and the futures contract to buy. Futures contracts are valued at the most recent settlement price.
Certain risks may arise upon entering into futures contracts, including the risk that an illiquid secondary market will limit the Fund's ability to close out a futures contract prior to the settlement date and that a change in the value of a futures contract may not correlate exactly with the changes in the value of the securities or currencies hedged. When utilizing futures contracts to hedge, the Fund gives up the opportunity to profit from favorable price movements in the hedged positions during the term of the contract.
Federal Income Taxes. The Fund's policy is to comply with the requirements of the Internal Revenue Code, as amended, which are applicable to regulated investment companies, and to distribute all of its taxable income to its shareholders. Accordingly, the Fund paid no federal income taxes and no federal income tax provision was required.
At November 30, 2003 the Fund had a net tax basis capital loss carryforward of approximately $354,081,000 which may be applied against any realized net taxable capital gains of each succeeding year until fully utilized or until November 30, 2008 ($15,149,000), November 30, 2010 ($270,861,000) and November 30, 2011 ($68,071,000), the respective expiration dates, whichever occurs first.
Distribution of Income and Gains. Distributions of net investment income, if any, are made quarterly. Net realized gains from investment transactions, in excess of available capital loss carryforwards, would be taxable to the Fund if not distributed, and, therefore, will be distributed to shareholders at least annually.
The timing and characterization of certain income and capital gains distributions are determined annually in accordance with federal tax regulations which may differ from accounting principles generally accepted in the United States of America. These differences primarily relate to certain securities sold at a loss. As a result, net investment income (loss) and net realized gain (loss) on investment transactions for a reporting period may differ significantly from distributions during such period. Accordingly, the Fund may periodically make reclassifications among certain of its capital accounts without impacting the net asset value of the Fund.
At November 30, 2003, the Fund's components of distributable earnings (accumulated losses) on a tax-basis were as follows:
Undistributed ordinary income*
| $ 7,733,796 |
Undistributed net long-term capital gains
| $ - |
Capital loss carryforwards
| $ (354,081,000) |
Net unrealized appreciation (depreciation) on investments
| $ 620,448,067 |
In addition, the tax character of distributions paid to shareholders by the Fund are summarized as follows:
| Years Ended November 30, |
2003 | 2002 |
Distributions from ordinary income*
| $ 60,089,450 | $ 43,100,333 |
* For tax purposes short-term capital gains distributions are considered ordinary income distributions.Expenses. Expenses of the Corporation arising in connection with a specific Fund are allocated to that Fund. Other Corporation expenses which cannot be directly attributed to a Fund are apportioned among the funds in the Corporation.
Other. Investment transactions are accounted for on a trade date plus one basis for daily net asset value calculations. However, for financial reporting purposes, investment security transactions are reported on trade date. Interest income is recorded on the accrual basis. Dividend income is recorded on the ex-dividend date net of foreign withholding taxes. Certain dividends from foreign securities may be recorded subsequent to the ex-dividend date as soon as the Fund is informed of such dividends. Realized gains and losses from investment transactions are recorded on an identified cost basis.
B. Purchases and Sales of Securities
During the year ended November 30, 2003, purchases and sales of investment securities (excluding short-term investments) aggregated $534,234,978 and $597,760,596, respectively.
C. Related Parties
Management Agreement. Under the Management Agreement with Deutsche Investment Management Americas Inc. ("DeIM" or the "Advisor"), the Advisor directs the investments of the Fund in accordance with its investment objectives, policies and restrictions. The Advisor determines the securities, instruments and other contracts relating to investments to be purchased, sold or entered into by the Fund. In addition to portfolio management services, the Advisor provides certain administrative services in accordance with the Management Agreement. The management fee payable under the Management Agreement is equal to an annual rate of 0.75% of the first $250,000,000 of the Fund's average daily net assets, 0.72% of the next $750,000,000 of such net assets, 0.70% of the next $1,500,000,000 of such net assets, 0.68% of the next $2,500,000,000 of such net assets, 0.65% of the next $2,500,000,000 of such net assets, 0.64% of the next $2,500,000,000 of such net assets, 0.63% of the next $2,500,000,000 of such net assets and 0.62% of such net assets in excess of $12,500,000,000, computed and accrued daily and payable monthly. Accordingly, for the year ended November 30, 2003, the fee pursuant to the Management Agreement was equivalent to an annual effective rate of 0.70% of the Fund's average daily net assets. Dreman Value Management, LLC ("DVM") serves as subadvisor with respect to the investment and reinvestment of assets in the Fund, and is paid by the Advisor for its services.
Administrative Fee. Under the Administrative Agreement (the "Administrative Agreement"), the Advisor provided or paid others, (affiliated and non-affiliated), to provide substantially all of the administrative services required by the Fund (other than those provided by the Advisor under its Management Agreement with the Fund, as described above) such as transfer agent, custody, legal and audit, in exchange for the payment by each class of the Fund of an administrative services fee (the ``Administrative Fee'') of 0.350%, 0.400%, 0.375%, 0.100% and 0.300% of the average daily net assets for Class A, B, C, I and Institutional Class shares, respectively, computed and accrued daily and payable monthly for the period December 1, 2002 to September 30, 2003.
For the period December 1, 2002 to September 30, 2003, the Administrative Fee was as follows:
Administrative Fee | Total Aggregated |
Class A
| $ 6,615,410 |
Class B
| 3,783,782 |
Class C
| 1,330,475 |
Class I
| 13,582 |
Institutional Class
| 98,785 |
| $ 11,842,034 |
The Administrative Agreement between the Advisor and the Fund terminated on September 30, 2003 and the Fund will directly bear the cost of those expenses formerly covered under the Administrative Agreement.
Effective October 1, 2003 through September 30, 2005, the Advisor has agreed to contractually waive all or a portion of its management fee and reimburse or pay certain operating expenses of each class at 1.20% of average daily net assets for Class A, B and C shares, 1.70% of average daily net assets for Class R shares and 1.00% of average daily net assets for Class I and Institutional Class shares (excluding certain expenses such as Rule 12b-1 and/or service fees, Directors' and Directors' counsel fees, extraordinary expenses, taxes, brokerage and interest).
Service Provider Fees.
Scudder Investments Service Company ("SISC"), an affiliate of the Advisor, is the Fund's transfer agent, dividend-paying agent and shareholder service agent. Pursuant to a sub-transfer agency agreement between SISC and DST Systems, Inc. ("DST"), SISC has delegated certain transfer agent and dividend paying agent functions to DST. The costs and expenses of such delegation are borne by SISC, not by the Fund. For the period October 1, 2003 through November 30, 2003, the amount charged to the Fund by SISC aggregated $1,344,351, all of which is unpaid at November 30, 2003.
Prior to September 30, 2003, the fees outlined above were paid by the Advisor in accordance with the Administrative Agreement.
Distribution Service Agreement. Under the Distribution Service Agreement, in accordance with Rule 12b-1 under the 1940 Act, Scudder Distributors, Inc. ("SDI"), a subsidiary of the Advisor, receives a fee ("Distribution Fee") of 0.75% of average daily net assets of Class B and C shares and 0.25% of average daily net assets of Class R shares. Pursuant to the agreement, SDI enters into related selling group agreements with various firms at various rates for sales of Class B, C and R shares. For the year ended November 30, 2003, the Distribution Fee was as follows:
Distribution Fee | Total Aggregated | Unpaid at November 30, 2003 |
Class B
| $ 8,512,510 | $ 681,524 |
Class C
| 3,315,780 | 353,214 |
Class R
| 4 | 2 |
| $ 11,828,294 | $ 1,034,740 |
In addition, SDI provides information and administrative services ("Service Fee") to Class A, B, C and R shareholders at an annual rate of up to 0.25% of average daily net assets for each such class. SDI in turn has various agreements with financial services firms that provide these services and pays these fees based upon the assets of shareholder accounts the firms service. For the year ended November 30, 2003, the Service Fee was as follows:
Service Fee | Total Aggregated | Unpaid at November 30, 2003 | Effective Rate |
Class A
| $ 5,914,482 | $ 617,654 | .25% |
Class B
| 2,837,503 | 178,325 | .25% |
Class C
| 1,016,846 | 60,005 | .23% |
Class R
| 4 | 2 | .25%* |
| $ 9,768,835 | $ 855,986 | |
* AnnualizedUnderwriting Agreement and Contingent Deferred Sales Charge. SDI is the principal underwriter for Class A, B and C shares. Underwriting commissions paid by the shareholder in connection with the distribution of Class A and C shares for the year ended November 30, 2003 aggregated $435,634 and $481, respectively.
In addition, SDI receives any contingent deferred sales charge ("CDSC") from Class B share redemptions occurring within six years of purchase and Class C share redemptions occurring within one year of purchase. There is no such charge upon redemption of any share appreciation or reinvested dividends. The CDSC is based on declining rates ranging from 4% to 1% for Class B and 1% for Class C, of the value of the shares redeemed. For the year ended November 30, 2003, the CDSC for Class B and C shares aggregated $2,210,834 and $59,334, respectively. A deferred sales charge of up to 1% is assessed on certain redemptions of Class A shares. For the year ended November 30, 2003, SDI received $30,273.
Directors' Fees and Expenses. The Fund pays each Director not affiliated with the Advisor retainer fees plus specified amounts for attended board and committee meetings.
Scudder Cash Management QP Trust. Pursuant to an Exemptive Order issued by the SEC, the Fund may invest in the Scudder Cash Management QP Trust (the "QP Trust"), formerly Zurich Scudder Cash Management QP Trust, and other affiliated funds managed by the Advisor. The QP Trust seeks to provide as high a level of current income as is consistent with the preservation of capital and the maintenance of liquidity. The QP Trust does not pay the Advisor a management fee for the affiliated funds' investments in the QP Trust.
D. Expense Off-Set Arrangement
The Fund has entered into an arrangement with its custodian whereby credits realized as a result of uninvested cash balances were used to reduce a portion of the Fund's custodian expenses. During the year ended November 30, 2003, pursuant to the Administrative Agreement, the Administrative Fee was reduced by $87 for custodian credits earned.
E. Transactions in Securities of Affiliated Issuers
An affiliated issuer includes any company in which the Fund has ownership of at least 5% of the outstanding voting securities. A summary of the Fund's transactions during the year ended November 30, 2003 with companies which are or were affiliates is as follows:
Affiliate | Shares | Purchases Cost ($) | Sales Cost ($) | Realized Gain/Loss ($) | Dividend Income ($) | Value ($) |
Borders Group, Inc.
| 5,115,100 | - | 2,578,632 | 164,443
| -
| 114,987,448
|
Humana, Inc.*
| 1,495,600 | - | 30,928,942 | 13,163,616
| -
| 33,396,748
|
Universal Corp.
| 2,110,950 | - | - | -
| 3,039,768
| 90,179,784
|
| | | | 13,328,059 | 3,039,768 | 238,563,980 |
* Not affiliated issuer at year end.F. Line of Credit
The Fund and several other affiliated funds (the ``Participants'') share in a $1.25 billion revolving credit facility administered by J.P. Morgan Chase Bank for temporary or emergency purposes, including the meeting of redemption requests that otherwise might require the untimely disposition of securities. The Participants are charged an annual commitment fee which is allocated, pro rata based upon net assets, among each of the Participants. Interest is calculated at the Federal Funds Rate plus 0.5 percent. The Fund may borrow up to a maximum of 33 percent of its net assets under the agreement.
G. Share Transactions
The following table summarizes share and dollar activity in the Fund:
| Year Ended
November 30, 2003 | Year Ended
November 30, 2002 |
| Shares | Dollars | Shares | Dollars |
Shares sold
|
Class A
| 29,859,549 | $ 948,106,486 | 30,334,889 | $ 1,047,843,861 |
Class B
| 4,986,043 | 157,692,886 | 8,408,767 | 294,563,935 |
Class C
| 4,374,232 | 139,548,057 | 5,143,417 | 180,033,076 |
Class I
| 336,680 | 10,369,195 | 412,555 | 14,001,437 |
Class R*
| 805 | 28,541 | - | - |
Institutional Class
| 2,580,661 | 76,459,608 | 77,729** | 2,243,694** |
| | $ 1,332,204,773 | | $ 1,538,686,003 |
Shares issued to shareholders in reinvestment of distributions
|
Class A
| 1,205,730 | $ 37,582,184 | 839,753 | $ 28,283,397 |
Class B
| 338,590 | 10,371,917 | 236,683 | 7,814,130 |
Class C
| 120,268 | 3,715,056 | 66,488 | 2,183,076 |
Class I
| 14,275 | 431,906 | 14,884 | 515,284 |
Institutional Class
| 21,862 | 730,804 | 5** | 128** |
| | $ 52,831,867 | | $ 38,796,015 |
Shares redeemed
|
Class A
| (17,420,078) | $ (546,940,784) | (20,142,882) | $ (672,067,486) |
Class B
| (15,069,806) | (469,578,199) | (11,206,513) | (368,374,573) |
Class C
| (2,632,176) | (82,217,860) | (2,824,272) | (93,033,943) |
Class I
| (742,008) | (21,362,153) | (576,673) | (20,885,456) |
Institutional Class
| (270,870) | (8,862,179) | -** | -** |
| | $ (1,128,961,175) | | $ (1,154,361,458) |
Net increase (decrease)
|
Class A
| 13,645,201 | $ 438,747,886 | 11,031,760 | $ 404,059,772 |
Class B
| (9,745,173) | (301,513,396) | (2,561,063) | (65,996,508) |
Class C
| 1,862,324 | 61,045,253 | 2,385,633 | 89,182,209 |
Class I
| (391,053) | (10,561,052) | (149,234) | (6,368,735) |
Class R*
| 805 | 28,541 | - | - |
Institutional Class
| 2,331,653 | 68,328,233 | 77,734** | 2,243,822** |
| | $ 256,075,465 | | $ 423,120,560 |
* For the period October 1, 2003 (commencement of sales of Class R shares) to November 30, 2003.** For the period August 19, 2002 (commencement of sales of Institutional Class shares) to November 30, 2002.Report of Ernst & Young LLP, Independent Auditors |
|
To the Board of Directors and Shareholders of Scudder-Dreman High Return Equity Fund:
We have audited the accompanying statement of assets and liabilities, including the investment portfolio, of the Scudder-Dreman High Return Equity Fund, one of a series of Scudder Value Series, Inc. (the "Corporation"), as of November 30, 2003, and the related statement of operations for the year then ended, the statement of changes in net assets for each of the two years in the period then ended, and the financial highlights for each of the periods indicated therein. These financial statements and financial highlights are the responsibility of the Corporation's management. Our responsibility is to express an opinion on these financial statements and financial highlights based on our audits.
We conducted our audits in accordance with auditing standards generally accepted in the United States. Those standards require that we plan and perform the audit to obtain reasonable assurance about whether the financial statements and financial highlights are free of material misstatement. An audit includes examining, on a test basis, evidence supporting the amounts and disclosures in the financial statements and financial highlights. Our procedures included confirmation of securities owned as of November 30, 2003, by correspondence with the custodian and brokers or by other appropriate auditing procedures where replies from brokers were not received. An audit also includes assessing the accounting principles used and significant estimates made by management, as well as evaluating the overall financial statement presentation. We believe that our audits provide a reasonable basis for our opinion.
In our opinion, the financial statements and financial highlights referred to above present fairly, in all material respects, the financial position of the Scudder-Dreman High Return Equity Fund at November 30, 2003, the results of its operations for the year then ended, the changes in its net assets for each of the two years in the period then ended, and the financial highlights for each of the periods indicated therein, in conformity with accounting principles generally accepted in the United States.
Boston, Massachusetts
January 21, 2004 | /s/ Ernst & Young LLP
|
Tax Information (Unaudited) |
|
For corporate shareholders, 100% of the income dividends paid during the Fund's fiscal year ended November 30, 2003 qualified for the dividends received deduction.
For federal income tax purposes, the Fund designates $123,500,000 or the maximum amount allowable under tax law, as qualified dividend income.
Please consult a tax advisor if you have questions about federal or state income tax laws, or on how to prepare your tax returns. If you have specific questions about your account, please call 1-800-621-1048.
The following table presents certain information regarding the Directors and Officers of the fund as of November 30, 2003. Each individual's age is set forth in parentheses after his or her name. Unless otherwise noted, (i) each individual has engaged in the principal occupation(s) noted in the table for at least the most recent five years, although not necessarily in the same capacity, and (ii) the address of each individual is c/o Deutsche Asset Management, 222 South Riverside Plaza, Chicago, Illinois, 60606. Each Director's term of office extends until the next shareholder's meeting called for the purpose of electing Directors and until the election and qualification of a successor, or until such Director sooner dies, resigns or is removed as provided in the governing documents of the fund.
Independent Directors |
Name, Age, Position(s) Held with the Fund and Length of Time Served1
| Principal Occupation(s) During Past 5 Years and
Other Directorships Held
| Number of Funds in Fund Complex Overseen
|
John W. Ballantine (57)
Director, 1999-present
| Retired; formerly, Executive Vice President and Chief Risk Management Officer, First Chicago NBD Corporation/The First National Bank of Chicago (1996-1998); Executive Vice President and Head of International Banking (1995-1996). Directorships: Enron Corporation (energy trading firm) (effective May 30, 2002); First Oak Brook Bancshares, Inc.; Oak Brook Bank; American Healthways, Inc. (provider of disease and care management services); F.N.B. Corporation (bank holding company); Prisma Energy International (owner and operator of Enron's international energy infrastructure business).
| 82 |
Lewis A. Burnham (70)
Director, 1977-present
| Retired; formerly, Director of Management Consulting, McNulty & Company (1990-1998); prior thereto, Executive Vice President, Anchor Glass Container Corporation.
| 82 |
Donald L. Dunaway (66)
Director, 1980-present
| Retired; formerly, Executive Vice President, A.O. Smith Corporation (diversified manufacturer) (1963-1994).
| 82 |
James R. Edgar (57)
Director, 1999-present
| Distinguished Fellow, University of Illinois, Institute of Government and Public Affairs (1999-present); formerly, Governor, State of Illinois (1991-1999). Directorships: Kemper Insurance Companies; John B. Sanfilippo & Son, Inc. (processor/packager/marketer of nuts, snacks and candy products); Horizon Group Properties, Inc.; Youbet.com (online wagering platform); Alberto-Culver Company (manufactures, distributes and markets health and beauty-care products).
| 82 |
Paul K. Freeman (53)
Director, 2002-present
| President, Cook Street Holdings (consulting); Adjunct Professor, University of Denver; Consultant, World Bank/Inter-American Development Bank; formerly, Project Leader, International Institute for Applied Systems Analysis (1998-2001); Chief Executive Officer, The Eric Group, Inc. (environmental insurance) (1986-1998).
| 82 |
Robert B. Hoffman (66)
Director, 1981-present
| Retired; formerly, Chairman, Harnischfeger Industries, Inc. (machinery for the mining and paper industries) (1999-2000); prior thereto, Vice Chairman and Chief Financial Officer, Monsanto Company (agricultural, pharmaceutical and nutritional/food products) (1994-1999).
| 82 |
Shirley D. Peterson (62)
Director, 1995-present
| Retired; formerly, President, Hood College (1995-2000); prior thereto, Partner, Steptoe & Johnson (law firm); Commissioner, Internal Revenue Service; Assistant Attorney General (Tax), US Department of Justice. Directorships: Federal Mogul Corp. (supplier of automotive components and subsystems); AK Steel (steel production); Trustee, Bryn Mawr College.
| 82 |
Fred B. Renwick (73)
Director, 1988-present
| Retired; Professor Emeritus of Finance, New York University, Stern School of Business (2001-present); formerly, Professor, New York University Stern School of Business (1965-2001). Directorships: The Wartburg Foundation; Chairman, Finance Committee of Morehouse College Board of Trustees; formerly, Director of Board of Pensions, Evangelical Lutheran Church in America; member of the Investment Committee of Atlanta University Board of Trustees; Chair of the Investment Committee, American Bible Society Board of Trustees.
| 82 |
William P. Sommers (70)
Director, 1979- January 1, 2004
| Retired; formerly, President and Chief Executive Officer, SRI International (research and development) (1994-1998); prior thereto, Executive Vice President, lameter (medical information and educational service provider); Senior Vice President and Director, Booz, Allen & Hamilton Inc. (management consulting firm). Directorships: PSI Inc. (satellite engineering and components); Evergreen Solar, Inc. (develop/manufacture solar electric system engines); H2 Gen (manufacture hydrogen generators); Zassi Medical Evolutions, Inc. (specialists in intellectual property opportunities in medical device arena); Guckenheimer Enterprises (executive food services).
| 82 |
John G. Weithers (70)
Director, 1993-present
| Retired; formerly, Chairman of the Board and Chief Executive Officer, Chicago Stock Exchange. Directorships: Federal Life Insurance Company; Chairman of the Members of the Corporation and Trustee, DePaul University; formerly, International Federation of Stock Exchanges; Records Management Systems.
| 82 |
Interested Directors and Officers2 |
Name, Age, Position(s) Held with the Fund and Length of Time Served1
| Principal Occupation(s) During Past 5 Years and
Other Directorships Held
| Number of Funds in Fund Complex Overseen
|
Richard T. Hale3 (58)
Chairman and Director, 2002-present
Chief Executive Officer, 2003-present
| Managing Director, Deutsche Investment Management Americas Inc. (2003-present); Managing Director, Deutsche Bank Securities Inc. (formerly Deutsche Banc Alex. Brown Inc.) and Deutsche Asset Management (1999 to present); Director and President, Investment Company Capital Corp. (registered investment advisor) (1996 to present); Director, Deutsche Global Funds, Ltd. (2000 to present), CABEI Fund (2000 to present), North American Income Fund (2000 to present) (registered investment companies); Director, Scudder Global Opportunities Fund (since 2003); Director/Officer Deutsche/Scudder Mutual Funds (various dates); President, Montgomery Street Income Securities, Inc. (2002 to present) (registered investment companies); Vice President, Deutsche Asset Management, Inc. (2000 to present); formerly, Director, ISI Family of Funds (registered investment companies; 4 funds overseen) (1992-1999)
| 201 |
Brenda Lyons4,6 (40)
President, 2003-present
| Managing Director, Deutsche Asset Management
| n/a |
Philip J. Collora (58)
Vice President and Assistant Secretary, 1986-present
| Director, Deutsche Asset Management
| n/a |
Daniel O. Hirsch3 (49)
Vice President and Assistant Secretary, 2002-present
| Managing Director, Deutsche Asset Management (2002-present) and Director, Deutsche Global Funds Ltd. (2002-present); formerly, Director, Deutsche Asset Management (1999-2002); Principal, BT Alex. Brown Incorporated (now Deutsche Bank Securities Inc.) (1998-1999); Assistant General Counsel, United States Securities and Exchange Commission (1993-1998)
| n/a |
Kenneth Murphy4 (40)
Vice President, 2002-present
| Vice President, Deutsche Asset Management (2000-present); Vice President, Scudder Distributors, Inc. (December 2002-present); formerly, Director, John Hancock Signature Services (1992-2000)
| n/a |
Thomas F. Sassi5 (61)
Vice President, 2001-present
| Managing Director, Deutsche Asset Management
| n/a |
Charles A. Rizzo4 (46)
Treasurer and Chief Financial Officer, 2002-present
| Director, Deutsche Asset Management (April 2000-present). Formerly, Vice President and Department Head, BT Alex. Brown Incorporated (now Deutsche Bank Securities Inc.) (1998-1999); Senior Manager, Coopers & Lybrand L.L.P. (now PricewaterhouseCoopers LLP) (1993-1998)
| n/a |
Salvatore Schiavone4 (38)
Assistant Treasurer, 2003-present
| Director, Deutsche Asset Management
| n/a |
Lucinda H. Stebbins4 (58)
Assistant Treasurer, 2003-present
| Director, Deutsche Asset Management
| n/a |
Kathleen Sullivan D'Eramo4 (46)
Assistant Treasurer, 2003-present
| Director, Deutsche Asset Management
| n/a |
John Millette4 (41)
Secretary, 2001-present
| Director, Deutsche Asset Management
| n/a |
Lisa Hertz5 (33)
Assistant Secretary, 2003-present
| Assistant Vice President, Deutsche Asset Management
| n/a |
Caroline Pearson4 (41)
Assistant Secretary, 1998-present
| Managing Director, Deutsche Asset Management
| n/a |
1 Length of time served represents the date that each Director was first elected to the common board of directors which oversees a number of investment companies, including the fund, managed by the Advisor. For the Officers of the fund, length of time served represents the date that each Officer was first elected to serve as an officer of any fund overseen by the aforementioned common board of directors.2 As a result of their respective positions held with the Advisor, these individuals are considered "interested persons" of the Advisor within the meaning of the 1940 Act. Interested persons receive no compensation from the fund.3 Address: One South Street, Baltimore, Maryland4 Address: Two International Place, Boston, Massachusetts5 Address: 345 Park Avenue, New York, New York6 Ms. Lyons was elected by the Directors as President on November 19, 2003.The fund's Statement of Additional Information ("SAI") includes additional information about the Directors. The SAI is available, without charge, upon request. If you would like to request a copy of the SAI, you may do so by calling the following toll-free number: 1-800-621-1048.
Growth Funds
Scudder 21st Century Growth Fund Scudder Aggressive Growth Fund Scudder Blue Chip Fund Scudder Capital Growth Fund Scudder Development Fund Scudder Dynamic Growth Fund Scudder Flag Investors
Communications Fund Scudder Gold & Precious Metals Fund Scudder Global Biotechnology Fund Scudder Growth Fund Scudder Health Care Fund Scudder Large Company Growth Fund Scudder Micro Cap Fund Scudder Mid Cap Fund Scudder Small Cap Fund Scudder Strategic Growth Fund Scudder Technology Fund Scudder Technology Innovation Fund Scudder Top 50 US Fund Value Funds
Scudder Contrarian Fund Scudder-Dreman Financial Services Fund Scudder-Dreman High Return Equity Fund Scudder-Dreman Small Cap Value Fund Scudder Flag Investors Equity
Partners Fund Scudder Growth and Income Fund Scudder Large Company Value Fund Scudder-RREEF Real Estate Securities Fund Scudder Small Company Stock Fund Scudder Small Company Value Fund Scudder Tax Advantaged Dividend Fund Multicategory/Asset Allocation Funds
Scudder Balanced Fund Scudder Flag Investors Value Builder Fund Scudder Focus Value+Growth Fund Scudder Lifecycle Mid Range Fund Scudder Lifecycle Long Range Fund Scudder Lifecycle Short Range Fund Scudder Pathway Conservative Portfolio Scudder Pathway Growth Portfolio Scudder Pathway Moderate Portfolio Scudder Target 2013 Fund Scudder Total Return Fund International/Global Funds
Scudder Emerging Markets Growth Fund Scudder Emerging Markets Income Fund Scudder European Equity Fund Scudder Global Fund Scudder Global Bond Fund Scudder Global Discovery Fund Scudder Greater Europe Growth Fund Scudder International Fund Scudder International Equity Fund Scudder International Select Equity Fund Scudder Japanese Equity Fund Scudder Latin America Fund Scudder New Europe Fund Scudder Pacific Opportunities Fund Income Funds
Scudder Cash Reserves Fund Scudder Fixed Income Fund Scudder GNMA Fund Scudder High Income Plus Fund Scudder High Income Fund Scudder High Income Opportunity Fund Scudder Income Fund Scudder PreservationPlus Fund Scudder PreservationPlus Income Fund Scudder Short Duration Fund (formerly Scudder Short-Term Fixed Income Fund) Scudder Short-Term Bond Fund Scudder Strategic Income Fund Scudder US Government Securities Fund |  |
Scudder Funds (continued) |
Tax-Free Income Funds
Scudder California Tax-Free Income Fund Scudder Florida Tax-Free Income Fund Scudder High Yield Tax-Free Fund Scudder Intermediate Tax/AMT Free Fund (formerly Scudder Medium Term Tax-Free Fund) Scudder Managed Municipal Bond Fund Scudder Massachusetts Tax-Free Fund Scudder Municipal Bond Fund Scudder New York Tax-Free Income Fund Scudder Short-Term Municipal Bond Fund Index-Related Funds
Scudder EAFE ® Equity Index Fund Scudder Equity 500 Index Fund Scudder S&P 500 Index Fund Scudder S&P 500 Stock Fund Scudder Select 500 Fund Scudder US Bond Index Fund Money Market
A large number of money market funds are available through Scudder Investments.
|  |
Retirement Programs and Education Accounts |
Retirement Programs
Traditional IRA Roth IRA SEP-IRA Inherited IRA Keogh Plan 401(k), 403(b) Plans Variable Annuities Education Accounts
Coverdell Education Savings Account UGMA/UTMA IRA for Minors |
Closed-End Funds |
The Brazil Fund, Inc. The Korea Fund, Inc. Montgomery Street Income Securities, Inc. Scudder Global High Income Fund, Inc. Scudder New Asia Fund, Inc. Scudder High Income Trust Scudder Intermediate Government Trust Scudder Multi-Market Income Trust Scudder Municipal Income Trust Scudder RREEF Real Estate Fund, Inc. Scudder RREEF Real Estate Fund II, Inc. Scudder Strategic Income Trust Scudder Strategic Municipal Income Trust The Central Europe and Russia Fund, Inc. (formerly The Central European Equity Fund, Inc.) The Germany Fund, Inc. The New Germany Fund, Inc. |
Not all funds are available in all share classes.
Scudder open-end funds are offered by prospectus only. For more complete information on any fund or variable annuity registered in your state, including information about a fund's objectives, strategies, risks, advisory fees, distribution charges, and other expenses, please order a free prospectus. Read the prospectus before investing in any fund to ensure the fund is appropriate for your goals and risk tolerance.
A money market mutual fund investment is not insured or guaranteed by the Federal Deposit Insurance Corporation or any other government agency. Although a money market mutual fund seeks to preserve the value of your investment at $1 per share, it is possible to lose money by investing in such a fund.
The products described should not be considered a solicitation to buy or an offer to sell a security to any person in any jurisdiction where such offer, solicitation, purchase, or sale would be unlawful under the securities laws of such jurisdiction.
Account Management Resources |
|
For shareholders of Classes A, B, C and Institutional
Automated Information Lines | ScudderACCESS (800) 972-3060 Personalized account information, information on other Scudder funds and services via touchtone telephone and for Classes A, B, and C only, the ability to exchange or redeem shares.
|
Web Site | scudder.com View your account transactions and balances, trade shares, monitor your asset allocation, and change your address, 24 hours a day.
Obtain prospectuses and applications, blank forms, interactive worksheets, news about Scudder funds, subscription to fund updates by e-mail, retirement planning information, and more.
|
For More Information | (800) 621-1048 To speak with a Scudder service representative.
|
Written Correspondence | Scudder Investments PO Box 219356
Kansas City, MO 64121-9356
|
Proxy Voting | A description of the fund's policies and procedures for voting proxies for portfolio securities can be found on our Web site - scudder.com (type "proxy voting" in the search field) - or on the SEC's Web site - www.sec.gov. To obtain a written copy without charge, call us toll free at (800) 621-1048.
|
Principal Underwriter | If you have questions, comments or complaints, contact:
Scudder Distributors, Inc. 222 South Riverside Plaza
Chicago, IL 60606-5808
(800) 621-1148
|
| Class A | Class B | Class C | Institutional Class |
Nasdaq Symbol | KDHAX
| KDHBX
| KDHCX
| KDHIX
|
CUSIP Number | 81123U-204
| 81123U-709
| 81123U-808
| 81123U-832
|
Fund Number | 087
| 287
| 387
| 539
|
For shareholders of Class R
Automated Information Lines | Scudder Flex Plan Access (800) 532-8411 24-hour access to your retirement plan account.
|
Web Site | scudder.com Click "Retirement Plans" to reallocate assets, process transactions and review your funds through our secure online account access.
Obtain prospectuses and applications, blank forms, interactive worksheets, news about Scudder funds, subscription to fund updates by e-mail, retirement planning information, and more.
|
For More Information | (800) 543-5776 To speak with a Scudder service representative.
|
Written Correspondence | Scudder Retirement Services 222 South Riverside Plaza
Chicago, IL 60606-5806
|
Proxy Voting | A description of the fund's policies and procedures for voting proxies for portfolio securities can be found on our Web site - scudder.com (type "proxy voting" in the search field) - or on the SEC's Web site - www.sec.gov. To obtain a written copy without charge, call us toll free at (800) 543-5776.
|
Principal Underwriter | If you have questions, comments or complaints, contact:
Scudder Distributors, Inc. 222 South Riverside Plaza
Chicago, IL 60606-5808
(800) 621-1148
|
Nasdaq Symbol | KDHRX
|
CUSIP Number | 81123U-790
|
Fund Number | 1506
|

ITEM 2.         CODE OF ETHICS.

As of the end of the period, September 30, 2003, the Scudder Value Series has
adopted a code of ethics, as defined in Item 2 of Form N-CSR, that applies to
its President and Treasurer and its Chief Financial Officer. A copy of the code
of ethics is filed as an exhibit to this Form N-CSR.

ITEM 3.         AUDIT COMMITTEE FINANCIAL EXPERT.

The Fund's Board of Directors/Trustees has determined that the Fund has at least
one "audit committee financial expert" serving on its audit committee: Mr.
Donald L. Dunaway. This audit committee member is "independent," meaning that he
is not an "interested person" of the Fund (as that term is defined in Section
2(a)(19) of the Investment Company Act of 1940) and he does not accept any
consulting, advisory, or other compensatory fee from the Fund (except in the
capacity as a Board or committee member).

An "audit committee financial expert" is not an "expert" for any purpose,
including for purposes of Section 11 of the Securities Act of 1933, as a result
of being designated as an "audit committee financial expert." Further, the
designation of a person as an "audit committee financial expert" does not mean
that the person has any greater duties, obligations, or liability than those
imposed on the person without the "audit committee financial expert"
designation. Similarly, the designation of a person as an "audit committee
financial expert" does not affect the duties, obligations, or liability of any
other member of the audit committee or board of directors.

ITEM 4.         PRINCIPAL ACCOUNTANT FEES AND SERVICES.

                        Not currently applicable.

ITEM 5.         [RESERVED]

ITEM 6.         [RESERVED]

ITEM 7.         DISCLOSURE OF PROXY VOTING POLICIES AND PROCEDURES FOR
                CLOSED-END MANAGEMENT INVESTMENT COMPANIES.

ITEM 8.         [RESERVED]

ITEM 9.         CONTROLS AND PROCEDURES.

(a) The Chief Executive and Financial Officers concluded that the Registrant's
Disclosure Controls and Procedures are effective based on the evaluation of the
Disclosure Controls and Procedures as of a date within 90 days of the filing
date of this report.

(b) During the filing period of the report, management identified issues
relating to the overall fund expense payment and accrual process. Management
discussed these matters with the Registrant's Audit Committee and auditors,
instituted additional procedures to enhance its internal controls and will
continue to develop additional controls and redesign work flow to strengthen the
overall control environment associated with the processing and recording of fund
expenses.

ITEM 10.        EXHIBITS.

(a)(1)   Code of Ethics  pursuant to Item 2 of Form N-CSR is filed and  attached
         hereto as EX-99.CODE ETH.

(a)(2)   Certification  pursuant to Rule 30a-2(a) under the  Investment  Company
         Act of 1940 (17 CFR  270.30a-2(a))  is filed  and  attached  hereto  as
         Exhibit 99.CERT.

(b)      Certification  pursuant to Rule 30a-2(b) under the  Investment  Company
         Act of 1940 (17 CFR  270.30a-2(b))  is furnished and attached hereto as
         Exhibit 99.906CERT.


Form N-CSR Item F

                                   SIGNATURES

Pursuant to the requirements of the Securities Exchange Act of 1934 and the
Investment Company Act of 1940, the registrant has duly caused this report to be
signed on its behalf by the undersigned, thereunto duly authorized.

Registrant:                         Scudder-Dreman High Return Fund


By:                                 /s/Richard T. Hale
                                    ---------------------------
                                    Richard T. Hale
                                    Chief Executive Officer

Date:                               January 16, 2004
                                    ---------------------------


Pursuant to the requirements of the Securities Exchange Act of 1934 and the
Investment Company Act of 1940, this report has been signed below by the
following persons on behalf of the registrant and in the capacities and on the
dates indicated.

Registrant:                         Scudder-Dreman High Return Fund


By:                                 /s/Richard T. Hale
                                    ---------------------------
                                    Richard T. Hale
                                    Chief Executive Officer

Date:                               January 16, 2004
                                    ---------------------------


By:                                 /s/Charles A. Rizzo
                                    ---------------------------
                                    Charles A. Rizzo
                                    Chief Financial Officer

Date:                               January 16, 2004
                                    ---------------------------