WASHINGTON, D. C. 20549
DWS Value Series, Inc.
NOVEMBER 30, 2011 Annual Report to Shareholders |
| |
| DWS Dreman Small Cap Value Fund |
|
Contents
4 Portfolio Management Review 11 Information About Your Fund's Expenses 20 Statement of Assets and Liabilities 22 Statement of Operations 23 Statement of Changes in Net Assets 29 Notes to Financial Statements 38 Report of Independent Registered Public Accounting Firm 40 Investment Management Agreement Approval 45 Summary of Management Fee Evaluation by Independent Fee Consultant 49 Board Members and Officers 54 Account Management Resources |
This report must be preceded or accompanied by a prospectus. To obtain a summary prospectus, if available, or prospectus for any of our funds, refer to the Account Management Resources information provided in the back of this booklet. We advise you to consider the fund's objectives, risks, charges and expenses carefully before investing. The summary prospectus and prospectus contain this and other important information about the fund. Please read the prospectus carefully before you invest.
Any fund that focuses in a particular segment of the market will generally be more volatile than a fund that invests more broadly. Stocks of smaller companies involve greater risk than securities of larger, more established companies. Stocks may decline in value. See the prospectus for details.
DWS Investments is part of Deutsche Bank's Asset Management division and, within the U.S., represents the retail asset management activities of Deutsche Bank AG, Deutsche Bank Trust Company Americas, Deutsche Investment Management Americas Inc. and DWS Trust Company.
NOT FDIC/NCUA INSURED NO BANK GUARANTEE MAY LOSE VALUE NOT A DEPOSIT NOT INSURED BY ANY FEDERAL GOVERNMENT AGENCY
Portfolio Management Review
Market Overview and Fund Performance
Performance is historical and does not guarantee future results. Returns shown are for Class A shares, unadjusted for sales charges. Investment return and principal fluctuate, so your shares may be worth more or less when redeemed. Current performance may differ from performance data shown. Please visit www.dws-investments.com for the most recent month-end performance of all share classes. Fund performance includes reinvestment of all distributions. Unadjusted returns do not reflect sales charges and would have been lower if they had.
Class A shares of DWS Dreman Small Cap Value Fund returned -4.91% (unadjusted for sales charges) during the 12-month period ended November 30, 2011. The fund's benchmark, the Russell 2000® Value Index, returned 0.77%.1 While the fund underperformed during the most recent reporting period, it has outpaced the benchmark in the 5- and 10-year periods ended November 30, 2011. It has also exceeded the average return of its Morningstar peer group — Small Value Funds category — in the 10-year period ended on the same date.2
The past year ended November 30, 2011, brought two very different intervals of performance for small-cap stocks. In the first, which ran from the beginning of the reporting period through the end of April 2011, the investment environment was characterized by improving economic growth, exceptional strength in smaller companies' earnings results and a hearty appetite for risk among investors. This positive backdrop helped small caps return 17.33% through the first five months of the year, which surpassed the return of both their mid- and large-cap counterparts.
The picture changed at mid-year, however, when a string of worse-than-expected economic data and the deterioration of the European debt crisis began to weigh heavily on the markets. Small-cap stocks were hit hard in this environment, as plummeting investor sentiment led to sharp selloffs of asset classes perceived to be higher risk. The Russell 2000 Value Index returned -14.11% in the period from May 1 through November 30, 2011, causing it to finish the year just barely in positive territory.
Positive and Negative Contributors to Performance
The primary reason for the fund's shortfall was the outperformance of the smaller, more richly valued stocks in the index — in other words, the types of stocks we generally seek to avoid — during the past 12 months. This was a key factor in our underperformance in December 2010, during which we suffered about two-thirds of our shortfall for the full period. We manage the portfolio with a focus on outperforming over the full market cycle, and we believe this long-term approach is an important element of our strong 5- and 10-year results.
On a sector basis, our stock selection process worked best in information technology, materials and utilities, but this was more than offset by the weaker showing of our stock picks in the consumer staples, consumer discretionary and financials sectors.3,4
Among individual stocks, our top performer was Healthspring, Inc., which was taken over in late October in a deal worth about $55 per share. This price was well above our cost basis of $15, making the stock a multiyear winner from our original purchase in April 2006. The health care sector was also home to another top-five contributor: AmSurg Corp. An operator of surgical centers that reported rising earnings and profit margins, AmSurg delivered a relatively steady performance throughout a volatile year. We elected to sell the stock starting in May 2011 on the basis of valuation.
In energy, we generated a strong contribution from the oil refiner Tesoro Corp. The stock — which we have owned for quite some time — rose near $30 in mid-November after trading as low as $10.91 in August 2010, reflecting its strong earnings growth and rising profit margins.
Our positions in the gold-related stocks AuRico Gold, Inc., Minefinders Corp., Ltd., and Coeur d'Alene Mines Corp. also added quite a bit of value for the fund. As of the end of the period, we held a 2.9% position in gold-related stocks. The gold price, in its current range of $1,500 to $1,800/ounce, is far above mining companies' average production cost per ounce of $475 — indicating the potential for robust profit margin expansion in the sector.
Outside of these sectors, other notable winners were the electronic contract manufacturer Jabil Circuit, Inc. and the rental/retail company Aaron's, Inc., both of which we elected to sell after they reached our target prices.
On the negative side, the fund's leading detractor for the year was James River Coal Co. Since power companies that consume coal can also use natural gas, the weakness in natural gas prices meant that coal companies such as James River were unable to offset rising costs by hiking prices. The stock plunged, losing 75% of its value during the broader-market selloff of September and October. The energy sector was also home to our fourth-largest detractor, Cal Dive International Inc., an oil services company whose business was hit hard when the BP disaster of 2009 led to a slowdown in drilling activity. When Cal Dive's business did not recover sufficiently upon the resumption of drilling, we saw this as a red flag and opted to sell the position.
We also lost some relative performance through our position in the spirits distributor Central European Distribution Corp. The company's fundamentals showed an unexpected degree of weakness, and we elected to cut our losses and sell the position. Also weighing on performance were the home health care provider Amedisys, Inc. and Pennsylvania Real Estate Investment Trust, both of which we continue to hold.
Outlook and Positioning
Despite small caps' underperformance in the past year, we retain a positive view on the asset class. Valuations, in the aggregate, are much lower than they were six months ago, which means a larger number of potential opportunities for us to investigate. Although the near-term outlook remains clouded by sluggish global growth and the situation in Europe, we believe small caps' valuations are now low enough to provide a measure of support to performance.
We therefore used the downturn to sift through some of the worst-performing sectors — such as industrials, information technology and financials — to find fundamentally sound stocks that were cheap relative to both their industry peers and their own history. We believe our approach of making market volatility work for us — via our willingness to establish core positions at trough valuations — helps us keep the portfolio populated with fresh value opportunities. During the final three months of the period, our largest additions were SPX Corp., Carlisle Companies, Inc. and Energen Corp.
The portfolio continues to feature an attractive valuation relative to the broader small-cap asset class. As of November 30, 2011, the median price-to-earnings ratio of the stocks in the fund (based on 12-month forward earnings estimates) was 11.2x, below the 13.2x P/E ratio of the Russell 2000 Value Index.5 While this very favorable profile did not translate into market-beating returns in the past 12 months, we believe it indicates that there is pent-up value in the portfolio.
At a time in which the markets and financial media continue to place a great deal of emphasis on broad macroeconomic factors, our response to the uncertainty is to do what we have always done — stick to our knitting by focusing on fundamental research and individual stock selection.
Investment Advisor
Deutsche Investment Management Americas Inc.,
Subadvisor
The fund's subadvisor is Dreman Value Management, L.L.C., a renowned investment firm with a 35-year history of style-pure value investing.
Portfolio Management Team
Mark Roach
Managing Director of Dreman Value Management, L.L.C. and Lead Portfolio Manager of the fund. Joined the fund in 2006.
David N. Dreman
Chairman of Dreman Value Management, L.L.C. and Portfolio Manager of the fund. Joined the fund in 2002.
E. Clifton Hoover, Jr.
Chief Investment Officer and Managing Director of Dreman Value Management, L.L.C. and Portfolio Manager of the fund. Joined the fund in 2006.
Mario Tufano
Associate Portfolio Manager of the fund. Joined the fund in 2010.
The views expressed reflect those of the portfolio management team only through the end of the period of the report as stated on the cover. The management team's views are subject to change at any time based on market and other conditions and should not be construed as a recommendation. Past performance is no guarantee of future results. Current and future portfolio holdings are subject to risk.
1 The Russell 2000 Value Index tracks the performance of those Russell 2000® Index companies with lower price-to-book values and lower forecasted growth rates. Index and category returns assume reinvestment of all distributions. Index returns do not reflect fees or expenses and it is not possible to invest directly in an index.
2 Source: Morningstar, Inc. Rankings are historical and do not guarantee future results. As of November 30, 2011, Class A shares of DWS Dreman Small Cap Value Fund were ranked as follows in the Morningstar Small Value Funds category: 329/352, 1-year; 281/304, 3-year; 131/256, 5-year; and 40/144 for 10-year. Rankings are based on a fund's total return.
3 The consumer discretionary sector consists of companies that provide nonessential goods and services. Some examples of companies in this sector include retailers, apparel companies and automobile companies.
4 The consumer staples sector represents essential goods and services such as the food, beverage and prescription industries.
5 The price-to-earnings (P/E) ratio is a formula that compares a company's current share price with its per-share earnings.
Performance Summary November 30, 2011 Average Annual Total Returns as of 11/30/11 |
| Unadjusted for Sales Charge | 1-Year | 3-Year | 5-Year | 10-Year | | |
| Class A | -4.91% | 13.45% | -0.06% | 8.65% | | |
| Class B | -5.66% | 12.48% | -0.90% | 7.73% | | |
| Class C | -5.56% | 12.62% | -0.79% | 7.84% | | |
| Adjusted for the Maximum Sales Charge | | | | | | |
Class A (max 5.75% load) | -10.38% | 11.23% | -1.24% | 8.01% | | |
Class B (max 4.00% CDSC) | -8.49% | 11.95% | -1.07% | 7.73% | | |
Class C (max 1.00% CDSC) | -5.56% | 12.62% | -0.79% | 7.84% | | |
| No Sales Charge | | | | | Life of Class S* | Life of Institutional Class** |
| Class S | -4.76% | 13.63% | 0.11% | N/A | 4.74% | N/A |
| Institutional Class | -4.51% | 13.93% | 0.35% | N/A | N/A | 9.74% |
Russell 2000® Value Index+ | 0.77% | 14.03% | -2.01% | 6.87% | 2.50% | 7.86% |
* Class S commenced operations on February 28, 2005. Index returns began on February 28, 2005.
** Institutional Class commenced operations on August 19, 2002. Index returns began on August 31, 2002.
Performance in the Average Annual Total Returns table(s) above and the Growth of an Assumed $10,000 Investment line graph that follows is historical and does not guarantee future results. Investment return and principal fluctuate, so your shares may be worth more or less when redeemed. Current performance may differ from performance data shown. Please visit www.dws-investments.com for the Fund's most recent month-end performance. Fund performance includes reinvestment of all distributions. Unadjusted returns do not reflect sales charges and would have been lower if they had.
The gross expense ratios of the Fund, as stated in the fee table of the prospectus dated March 1, 2011 are 1.32%, 2.14%, 2.02%, 1.13% and 0.88% for Class A, Class B, Class C, Class S and Institutional Class shares, respectively, and may differ from the expense ratios disclosed in the Financial Highlights tables in this report.
The Fund may charge a 2% fee for redemptions of shares held less than 15 days.
Index returns do not reflect any fees or expenses and it is not possible to invest directly into an index.
Performance figures do not reflect the deduction of taxes that a shareholder would pay on fund distributions or the redemption of fund shares.
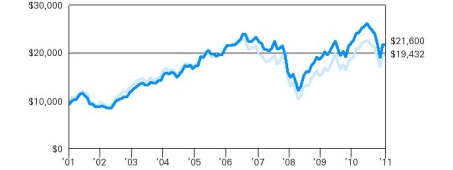
Growth of an Assumed $10,000 Investment (Adjusted for Maximum Sales Charge) |
[] DWS Dreman Small Cap Value Fund — Class A [] Russell 2000 Value Index+ |
|
| Yearly periods ended November 30 |
The Fund's growth of an assumed $10,000 investment is adjusted for the maximum sales charge of 5.75%. This results in a net initial investment of $9,425.
The growth of $10,000 is cumulative.
Performance of other share classes will vary based on the sales charges and the fee structure of those classes.
+ The Russell 2000 Value Index is an unmanaged index measuring the performance of those Russell 2000 companies with lower price-to-book ratios and lower forecasted growth values.
| Net Asset Value and Distribution Information | |
| | | Class A | | | Class B | | | Class C | | | Class S | | | Institutional Class | |
Net Asset Value: 11/30/11 | | $ | 32.95 | | | $ | 29.50 | | | $ | 30.09 | | | $ | 33.25 | | | $ | 33.42 | |
| 11/30/10 | | $ | 34.85 | | | $ | 31.27 | | | $ | 31.86 | | | $ | 35.25 | | | $ | 35.50 | |
Distribution Information: Twelve Months as of 11/30/11: Income Dividends | | $ | .21 | | | $ | — | | | $ | — | | | $ | .36 | | | $ | .54 | |
Morningstar Rankings — Small Value Funds Category as of 11/30/11 |
| Period | Rank | | Number of Fund Classes Tracked | Percentile Ranking (%) |
Class A 1-Year | 329 | of | 352 | 93 |
| 3-Year | 281 | of | 304 | 92 |
| 5-Year | 131 | of | 256 | 51 |
| 10-Year | 40 | of | 144 | 28 |
Class B 1-Year | 333 | of | 352 | 94 |
| 3-Year | 284 | of | 304 | 93 |
| 5-Year | 160 | of | 256 | 62 |
| 10-Year | 74 | of | 144 | 51 |
Class C 1-Year | 332 | of | 352 | 94 |
| 3-Year | 283 | of | 304 | 93 |
| 5-Year | 158 | of | 256 | 61 |
| 10-Year | 72 | of | 144 | 50 |
Class S 1-Year | 328 | of | 352 | 93 |
| 3-Year | 278 | of | 304 | 91 |
| 5-Year | 124 | of | 256 | 48 |
Institutional Class 1-Year | 323 | of | 352 | 91 |
| 3-Year | 274 | of | 304 | 90 |
| 5-Year | 117 | of | 256 | 46 |
Source: Morningstar, Inc. Rankings are historical and do not guarantee future results. Rankings are based on total return unadjusted for sales charges with distributions reinvested. If sales charges had been included, rankings might have been less favorable.
Information About Your Fund's Expenses
As an investor of the Fund, you incur two types of costs: ongoing expenses and transaction costs. Ongoing expenses include management fees, distribution and service (12b-1) fees and other Fund expenses. Examples of transaction costs include sales charges (loads), redemption fees and account maintenance fees, which are not shown in this section. The following tables are intended to help you understand your ongoing expenses (in dollars) of investing in the Fund and to help you compare these expenses with the ongoing expenses of investing in other mutual funds. The example in the table is based on an investment of $1,000 invested at the beginning of the six-month period and held for the entire period (June 1, 2011 to November 30, 2011).
The tables illustrate your Fund's expenses in two ways:
·Actual Fund Return. This helps you estimate the actual dollar amount of ongoing expenses (but not transaction costs) paid on a $1,000 investment in the Fund using the Fund's actual return during the period. To estimate the expenses you paid over the period, simply divide your account value by $1,000 (for example, an $8,600 account value divided by $1,000 = 8.6), then multiply the result by the number in the "Expenses Paid per $1,000" line under the share class you hold.
· Hypothetical 5% Fund Return. This helps you to compare your Fund's ongoing expenses (but not transaction costs) with those of other mutual funds using the Fund's actual expense ratio and a hypothetical rate of return of 5% per year before expenses. Examples using a 5% hypothetical fund return may be found in the shareholder reports of other mutual funds. The hypothetical account values and expenses may not be used to estimate the actual ending account balance or expenses you paid for the period.
Please note that the expenses shown in these tables are meant to highlight your ongoing expenses only and do not reflect any transaction costs. The "Expenses Paid per $1,000" line of the tables is useful in comparing ongoing expenses only and will not help you determine the relative total expense of owning different funds. An account maintenance fee of $6.25 per quarter for Class S shares may apply for certain accounts whose balances do not meet the applicable minimum initial investment. This fee is not included in these tables. If it was, the estimate of expenses paid for Class S shares during the period would be higher, and account value during the period would be lower, by this amount.
Expenses and Value of a $1,000 Investment for the six months ended November 30, 2011 | |
| Actual Fund Return | | Class A | | | Class B | | | Class C | | | Class S | | | Institutional Class | |
| Beginning Account Value 6/1/11 | | $ | 1,000.00 | | | $ | 1,000.00 | | | $ | 1,000.00 | | | $ | 1,000.00 | | | $ | 1,000.00 | |
| Ending Account Value 11/30/11 | | $ | 853.20 | | | $ | 849.90 | | | $ | 850.20 | | | $ | 853.40 | | | $ | 855.00 | |
| Expenses Paid per $1,000* | | $ | 5.81 | | | $ | 9.18 | | | $ | 9.00 | | | $ | 5.25 | | | $ | 3.91 | |
| Hypothetical 5% Fund Return | | Class A | | | Class B | | | Class C | | | Class S | | | Institutional Class | |
| Beginning Account Value 6/1/11 | | $ | 1,000.00 | | | $ | 1,000.00 | | | $ | 1,000.00 | | | $ | 1,000.00 | | | $ | 1,000.00 | |
| Ending Account Value 11/30/11 | | $ | 1,018.80 | | | $ | 1,015.14 | | | $ | 1,015.34 | | | $ | 1,019.40 | | | $ | 1,020.86 | |
| Expenses Paid per $1,000* | | $ | 6.33 | | | $ | 10.00 | | | $ | 9.80 | | | $ | 5.72 | | | $ | 4.26 | |
* Expenses are equal to the Fund's annualized expense ratio for each share class, multiplied by the average account value over the period, multiplied by the number of days in the most recent six-month period, then divided by 365.
| Annualized Expense Ratios | Class A | Class B | Class C | Class S | Institutional Class |
| DWS Dreman Small Cap Value Fund | 1.25% | 1.98% | 1.94% | 1.13% | .84% |
For more information, please refer to the Fund's prospectus.
Asset Allocation (As a % of Investment Portfolio excluding Securities Lending Collateral) | 11/30/11 | 11/30/10 |
| | | |
| Common Stocks | 100% | 94% |
| Cash Equivalents | — | 6% |
| | 100% | 100% |
Sector Diversification (As a % of Common Stocks) | 11/30/11 | 11/30/10 |
| | | |
| Financials | 24% | 21% |
| Industrials | 19% | 16% |
| Consumer Discretionary | 14% | 12% |
| Information Technology | 12% | 13% |
| Health Care | 8% | 10% |
| Materials | 8% | 7% |
| Utilities | 7% | 5% |
| Energy | 6% | 10% |
| Consumer Staples | 2% | 6% |
| | 100% | 100% |
Asset allocation and sector diversification are subject to change.
Ten Largest Equity Holdings at November 30, 2011 (12.8% of Net Assets) |
1. Coeur d'Alene Mines Corp. Through its subsidiaries, explores, develops, operates and/or owns silver and gold mining properties and companies | 1.4% |
2. Teleflex, Inc. Manufactures mechanical and electronic products | 1.3% |
3. Barnes Group, Inc. Manufacturer of precision metal parts and supplies | 1.3% |
4. Vectren Corp. Distributes gas and electricity | 1.3% |
5. IDACORP, Inc. Provider of electricity | 1.3% |
6. SPX Corp. Manufacturer of automotive and heavy-duty engine and chassis parts, repair and maintenance equipment | 1.3% |
7. EnerSys Manufactures, markets and distributes industrial batteries | 1.3% |
8. Healthspring, Inc. Offers managed care services | 1.2% |
9. Ryder System, Inc. Provider of equipment leasing and transportation services | 1.2% |
10. Jarden Corp. Provider of niche consumer products used in home preservation | 1.2% |
Portfolio holdings are subject to change.
For more complete details about the Fund's investment portfolio, see page 15. A quarterly Fact Sheet is available upon request. Please see the Account Management Resources section for contact information.
Following the Fund's fiscal first and third quarter-end, a complete portfolio holdings listing is filed with the SEC on Form N-Q. The form will be available on the SEC's Web site at www.sec.gov, and it also may be reviewed and copied at the SEC's Public Reference Room in Washington, D.C. Information on the operation of the SEC's Public Reference Room may be obtained by calling (800) SEC-0330. The Fund's portfolio holdings are also posted on www.dws-investments.com from time to time. Please see the Fund's current prospectus for more information.
Investment Portfolio as of November 30, 2011 | | | Shares | | | Value ($) | |
| | | | |
| Common Stocks 99.7% | |
| Consumer Discretionary 14.5% | |
| Auto Components 1.8% | |
| American Axle & Manufacturing Holdings, Inc.* (a) | | | 2,010,625 | | | | 17,633,181 | |
| Cooper Tire & Rubber Co. (a) | | | 1,676,185 | | | | 22,460,879 | |
| | | | | | | | 40,094,060 | |
| Hotels Restaurants & Leisure 3.9% | |
| Brinker International, Inc. (a) | | | 940,975 | | | | 22,658,678 | |
| International Speedway Corp. "A" (a) | | | 863,275 | | | | 21,236,565 | |
| LIFE TIME FITNESS, Inc.* (a) | | | 592,284 | | | | 24,123,727 | |
| Sonic Corp.* (a) | | | 2,504,044 | | | | 17,678,551 | |
| | | | | | | | 85,697,521 | |
| Household Durables 2.3% | |
| Helen of Troy Ltd.* (a) | | | 843,475 | | | | 25,194,598 | |
| Jarden Corp. (a) | | | 849,580 | | | | 26,455,921 | |
| | | | | | | | 51,650,519 | |
| Leisure Equipment & Products 1.2% | |
| JAKKS Pacific, Inc. (a) | | | 1,327,830 | | | | 25,348,275 | |
| Media 1.0% | |
| Meredith Corp. (a) | | | 757,350 | | | | 21,963,150 | |
| Specialty Retail 1.3% | |
| Ascena Retail Group, Inc.* (a) | | | 661,034 | | | | 18,191,656 | |
| Collective Brands, Inc.* (a) | | | 812,875 | | | | 11,339,606 | |
| | | | | | | | 29,531,262 | |
| Textiles, Apparel & Luxury Goods 3.0% | |
| Hanesbrands, Inc.* (a) | | | 825,425 | | | | 20,330,218 | |
| The Jones Group, Inc. (a) | | | 1,969,078 | | | | 21,364,496 | |
| Wolverine World Wide, Inc. (a) | | | 683,075 | | | | 25,164,483 | |
| | | | | | | | 66,859,197 | |
| Consumer Staples 2.0% | |
| Food Products 1.0% | |
| Corn Products International, Inc. (a) | | | 418,704 | | | | 21,768,421 | |
| Tobacco 1.0% | |
| Universal Corp. (a) | | | 461,148 | | | | 21,849,192 | |
| Energy 5.9% | |
| Energy Equipment & Services 2.1% | |
| Atwood Oceanics, Inc.* | | | 594,433 | | | | 24,371,753 | |
| Superior Energy Services, Inc.* (a) | | | 767,325 | | | | 22,797,226 | |
| | | | | | | | 47,168,979 | |
| Oil, Gas & Consumable Fuels 3.8% | |
| Energen Corp. | | | 485,960 | | | | 24,647,891 | |
| James River Coal Co.* (a) | | | 1,214,074 | | | | 10,064,673 | |
| Tesoro Corp.* (a) | | | 1,033,657 | | | | 24,694,066 | |
| W&T Offshore, Inc. (a) | | | 1,174,840 | | | | 23,520,297 | |
| | | | | | | | 82,926,927 | |
| Financials 23.7% | |
| Capital Markets 1.3% | |
| Apollo Investment Corp. (a) | | | 611,238 | | | | 4,407,026 | |
| Waddell & Reed Financial, Inc. "A" | | | 846,918 | | | | 23,019,231 | |
| | | | | | | | 27,426,257 | |
| Commercial Banks 9.3% | |
| Associated Banc-Corp. (a) | | | 2,138,350 | | | | 22,238,840 | |
| BancorpSouth, Inc. (a) | | | 1,317,167 | | | | 12,908,237 | |
| Bank of Hawaii Corp. (a) | | | 563,455 | | | | 23,975,010 | |
| Chemical Financial Corp. (a) | | | 125,700 | | | | 2,584,392 | |
| City National Corp. (a) | | | 110,325 | | | | 4,679,987 | |
| East West Bancorp., Inc. (a) | | | 617,150 | | | | 12,077,625 | |
| FirstMerit Corp. (a) | | | 1,604,330 | | | | 23,439,261 | |
| Fulton Financial Corp. (a) | | | 2,651,450 | | | | 24,817,572 | |
| Glacier Bancorp., Inc. (a) | | | 200,752 | | | | 2,411,032 | |
| Hancock Holding Co. (a) | | | 669,225 | | | | 20,434,785 | |
| Independent Bank Corp. (a) | | | 91,250 | | | | 2,385,275 | |
| International Bancshares Corp. (a) | | | 125,007 | | | | 2,235,125 | |
| Lakeland Financial Corp. (a) | | | 99,900 | | | | 2,449,548 | |
| NBT Bancorp., Inc. (a) | | | 107,714 | | | | 2,294,308 | |
| Prosperity Bancshares, Inc. (a) | | | 298,466 | | | | 11,935,655 | |
| TCF Financial Corp. (a) | | | 415,987 | | | | 4,184,829 | |
| Umpqua Holdings Corp. (a) | | | 223,400 | | | | 2,792,500 | |
| Webster Financial Corp. (a) | | | 397,684 | | | | 7,834,375 | |
| WesBanco, Inc. (a) | | | 113,176 | | | | 2,222,777 | |
| Wintrust Financial Corp. (a) | | | 668,221 | | | | 18,569,862 | |
| | | | | | | | 206,470,995 | |
| Insurance 5.4% | |
| Allied World Assurance Co. Holdings AG | | | 442,466 | | | | 26,322,302 | |
| Aspen Insurance Holdings Ltd. (a) | | | 981,350 | | | | 26,025,402 | |
| Hanover Insurance Group, Inc. | | | 590,750 | | | | 21,314,260 | |
| Platinum Underwriters Holdings Ltd. (a) | | | 683,069 | | | | 23,518,066 | |
| Protective Life Corp. | | | 991,533 | | | | 22,002,117 | |
| | | | | | | | 119,182,147 | |
| Real Estate Investment Trusts 6.7% | |
| Brandywine Realty Trust (REIT) (a) | | | 2,490,075 | | | | 21,688,553 | |
| CBL & Associates Properties, Inc. (REIT) (a) | | | 1,645,425 | | | | 23,513,123 | |
| CommonWealth REIT (REIT) (a) | | | 1,129,784 | | | | 18,912,584 | |
| Duke Realty Corp. (REIT) (a) | | | 2,010,239 | | | | 23,318,773 | |
| Hospitality Properties Trust (REIT) (a) | | | 971,971 | | | | 21,412,521 | |
| OMEGA Healthcare Investors, Inc. (REIT) (a) | | | 1,297,225 | | | | 23,259,244 | |
| Pennsylvania Real Estate Investment Trust (REIT) (a) | | | 1,759,075 | | | | 16,412,170 | |
| | | | | | | | 148,516,968 | |
| Thrifts & Mortgage Finance 1.0% | |
| Washington Federal, Inc. | | | 1,711,775 | | | | 22,270,193 | |
| Health Care 7.8% | |
| Health Care Equipment & Supplies 2.3% | |
| STERIS Corp. (a) | | | 705,200 | | | | 21,205,364 | |
| Teleflex, Inc. (a) | | | 483,450 | | | | 29,432,436 | |
| | | | | | | | 50,637,800 | |
| Health Care Providers & Services 3.7% | |
| Amedisys, Inc.* (a) | | | 800,250 | | | | 9,498,967 | |
| Healthspring, Inc.* | | | 501,917 | | | | 27,414,707 | |
| LifePoint Hospitals, Inc.* (a) | | | 577,825 | | | | 22,668,075 | |
| Owens & Minor, Inc. (a) | | | 735,409 | | | | 22,650,597 | |
| | | | | | | | 82,232,346 | |
| Life Sciences Tools & Services 1.8% | |
| Charles River Laboratories International, Inc.* | | | 720,850 | | | | 20,436,098 | |
| PerkinElmer, Inc. | | | 1,090,650 | | | | 20,635,098 | |
| | | | | | | | 41,071,196 | |
| Industrials 19.0% | |
| Aerospace & Defense 3.8% | |
| Alliant Techsystems, Inc. (a) | | | 381,766 | | | | 22,463,112 | |
| Curtiss-Wright Corp. (a) | | | 711,396 | | | | 23,440,498 | |
| Esterline Technologies Corp.* (a) | | | 410,092 | | | | 22,091,656 | |
| ITT Corp. | | | 765,190 | | | | 15,433,882 | |
| | | | | | | | 83,429,148 | |
| Commercial Services & Supplies 1.9% | |
| The Brink's Co. (a) | | | 904,250 | | | | 22,262,635 | |
| The Geo Group, Inc.* (a) | | | 1,111,817 | | | | 19,679,161 | |
| | | | | | | | 41,941,796 | |
| Construction & Engineering 2.3% | |
| EMCOR Group, Inc. (a) | | | 970,975 | | | | 24,886,089 | |
| Tutor Perini Corp.* (a) | | | 1,507,416 | | | | 24,857,290 | |
| | | | | | | | 49,743,379 | |
| Electrical Equipment 2.3% | |
| EnerSys* (a) | | | 1,149,244 | | | | 27,639,318 | |
| General Cable Corp.* (a) | | | 864,668 | | | | 22,913,702 | |
| | | | | | | | 50,553,020 | |
| Industrial Conglomerates 1.1% | |
| Carlisle Companies, Inc. (a) | | | 554,678 | | | | 24,738,639 | |
| Machinery 4.6% | |
| Barnes Group, Inc. (a) | | | 1,179,825 | | | | 29,389,441 | |
| Briggs & Stratton Corp. (a) | | | 1,532,876 | | | | 23,100,441 | |
| Harsco Corp. | | | 1,053,175 | | | | 21,737,532 | |
| SPX Corp. | | | 444,100 | | | | 28,155,940 | |
| | | | | | | | 102,383,354 | |
| Marine 0.7% | |
| Diana Shipping, Inc.* | | | 2,175,734 | | | | 16,296,248 | |
| Road & Rail 1.2% | |
| Ryder System, Inc. (a) | | | 518,600 | | | | 27,112,408 | |
| Trading Companies & Distributors 1.1% | |
| Aircastle Ltd. (a) | | | 2,083,149 | | | | 24,206,191 | |
| Information Technology 11.8% | |
| Communications Equipment 2.2% | |
| Arris Group, Inc.* (a) | | | 2,226,176 | | | | 23,931,392 | |
| Plantronics, Inc. (a) | | | 700,325 | | | | 24,133,200 | |
| | | | | | | | 48,064,592 | |
| Computers & Peripherals 3.6% | |
| Lexmark International, Inc. "A" (a) | | | 630,600 | | | | 21,099,876 | |
| NCR Corp.* | | | 1,209,914 | | | | 21,161,396 | |
| QLogic Corp.* (a) | | | 1,467,985 | | | | 21,902,336 | |
| Synaptics, Inc.* (a) | | | 477,878 | | | | 15,511,920 | |
| | | | | | | | 79,675,528 | |
| IT Services 2.1% | |
| CACI International, Inc. "A"* (a) | | | 383,700 | | | | 21,633,006 | |
| DST Systems, Inc. | | | 536,525 | | | | 25,501,033 | |
| | | | | | | | 47,134,039 | |
| Semiconductors & Semiconductor Equipment 2.7% | |
| Amkor Technology, Inc.* (a) | | | 3,677,808 | | | | 16,329,468 | |
| Microsemi Corp.* (a) | | | 1,240,425 | | | | 22,029,948 | |
| PMC-Sierra, Inc.* | | | 3,803,200 | | | | 21,259,888 | |
| | | | | | | | 59,619,304 | |
| Software 1.2% | |
| JDA Software Group, Inc.* (a) | | | 711,269 | | | | 22,419,199 | |
| Websense, Inc.* (a) | | | 248,460 | | | | 4,499,610 | |
| | | | | | | | 26,918,809 | |
| Materials 8.0% | |
| Chemicals 3.5% | |
| Cabot Corp. | | | 548,275 | | | | 18,191,764 | |
| H.B. Fuller Co. (a) | | | 359,934 | | | | 8,300,078 | |
| Huntsman Corp. | | | 1,098,515 | | | | 12,006,769 | |
| Olin Corp. (a) | | | 1,186,750 | | | | 22,548,250 | |
| OM Group, Inc.* (a) | | | 727,525 | | | | 16,551,194 | |
| | | | | | | | 77,598,055 | |
| Metals & Mining 4.5% | |
| AuRico Gold, Inc.* (a) | | | 2,287,474 | | | | 22,851,865 | |
| Coeur d'Alene Mines Corp.* (a) | | | 1,013,593 | | | | 29,667,867 | |
| Minefinders Corp., Ltd.* (a) | | | 700,138 | | | | 8,394,655 | |
| Thompson Creek Metals Co., Inc.* (a) | | | 2,043,450 | | | | 14,283,716 | |
| Worthington Industries, Inc. (a) | | | 1,376,003 | | | | 24,203,893 | |
| | | | | | | | 99,401,996 | |
| Utilities 7.0% | |
| Electric Utilities 4.6% | |
| ALLETE, Inc. (a) | | | 642,150 | | | | 25,589,678 | |
| IDACORP, Inc. (a) | | | 697,486 | | | | 28,589,951 | |
| NV Energy, Inc. | | | 1,538,968 | | | | 23,607,769 | |
| Portland General Electric Co. (a) | | | 990,399 | | | | 24,809,495 | |
| | | | | | | | 102,596,893 | |
| Multi-Utilities 2.4% | |
| TECO Energy, Inc. (a) | | | 1,276,675 | | | | 23,975,956 | |
| Vectren Corp. (a) | | | 982,890 | | | | 28,602,099 | |
| | | | | | | | 52,578,055 | |
Total Common Stocks (Cost $2,047,460,630) | | | | 2,206,656,859 | |
| | |
| Securities Lending Collateral 45.4% | |
| Daily Assets Fund Institutional, 0.20% (b) (c) (Cost $1,005,505,886) | | | 1,005,505,886 | | | | 1,005,505,886 | |
| | | % of Net Assets | | | Value ($) | |
| | | | |
Total Investment Portfolio (Cost $3,052,966,516)+ | | | 145.1 | | | | 3,212,162,745 | |
| Other Assets and Liabilities, Net (a) | | | (45.1 | ) | | | (998,249,610 | ) |
| Net Assets | | | 100.0 | | | | 2,213,913,135 | |
* Non-income producing security.
+ The cost for federal income tax purposes was $3,059,329,252. At November 30, 2011, net unrealized appreciation for all securities based on tax cost was $152,833,493. This consisted of aggregate gross unrealized appreciation for all securities in which there was an excess of value over tax cost of $381,227,245 and aggregate gross unrealized depreciation for all securities in which there was an excess of tax cost over value of $228,393,752.
(a) All or a portion of these securities were on loan amounting to $1,033,700,498. In addition, included in other assets and liabilities, net are pending sales, amounting to $5,862,363, that are also on loan (see Notes to Financial Statements). The value of all securities loaned at November 30, 2011 amounted to $1,039,562,861, which is 47.0% of net assets.
(b) Affiliated fund managed by Deutsche Investment Management Americas Inc. The rate shown is the annualized seven-day yield at period end.
(c) Represents collateral held in connection with securities lending. Income earned by the Fund is net of borrower rebates.
REIT: Real Estate Investment Trust
Fair Value Measurements
Various inputs are used in determining the value of the Fund's investments. These inputs are summarized in three broad levels. Level 1 includes quoted prices in active markets for identical securities. Level 2 includes other significant observable inputs (including quoted prices for similar securities, interest rates, prepayment speeds and credit risk). Level 3 includes significant unobservable inputs (including the Fund's own assumptions in determining the fair value of investments). The inputs or methodology used for valuing securities are not necessarily an indication of the risk associated with investing in those securities.
The following is a summary of the inputs used as of November 30, 2011 in valuing the Fund's investments. For information on the Fund's policy regarding the valuation of investments, please refer to the Security Valuation section of Note A in the accompanying Notes to Financial Statements.
| Assets | | Level 1 | | | Level 2 | | | Level 3 | | | Total | |
| | |
| Common Stocks (d) | | $ | 2,206,656,859 | | | $ | — | | | $ | — | | | $ | 2,206,656,859 | |
| Short-Term Investments (d) | | | 1,005,505,886 | | | | — | | | | — | | | | 1,005,505,886 | |
| Total | | $ | 3,212,162,745 | | | $ | — | | | $ | — | | | $ | 3,212,162,745 | |
There have been no transfers between Level 1 and Level 2 fair value measurements during the year ended November 30, 2011.
(d) See Investment Portfolio for additional detailed categorizations.
The accompanying notes are an integral part of the financial statements.
Statement of Assets and Liabilities | as of November 30, 2011 | |
| Assets | |
Investments: Investments in securities, at value (cost $2,047,460,630) — including $1,033,700,498 of securities loaned | | $ | 2,206,656,859 | |
| Investment in Daily Assets Fund Institutional (cost $1,005,505,886)* | | | 1,005,505,886 | |
| Total investments in securities, at value (cost $3,052,966,516) | | | 3,212,162,745 | |
| Cash | | | 135 | |
| Receivable for investments sold | | | 16,986,197 | |
| Receivable for Fund shares sold | | | 2,247,179 | |
| Dividends receivable | | | 3,929,441 | |
| Interest receivable | | | 114,073 | |
| Other assets | | | 90,629 | |
| Total assets | | | 3,235,530,399 | |
| Liabilities | |
| Payable upon return of securities loaned | | | 1,005,505,886 | |
| Payable for investments purchased | | | 5,904,315 | |
| Line of credit loan payable | | | 350,000 | |
| Payable for Fund shares redeemed | | | 6,353,261 | |
| Accrued management fee | | | 1,282,486 | |
| Other accrued expenses and payables | | | 2,221,316 | |
| Total liabilities | | | 1,021,617,264 | |
| Net assets, at value | | $ | 2,213,913,135 | |
| Net Assets Consist of | |
| Undistributed net investment income | | | 20,019,904 | |
| Net unrealized appreciation (depreciation) on investments | | | 159,196,229 | |
| Accumulated net realized gain (loss) | | | 3,098,173 | |
| Paid-in capital | | | 2,031,598,829 | |
| Net assets, at value | | $ | 2,213,913,135 | |
* Represents collateral on securities loaned.
The accompanying notes are an integral part of the financial statements.
Statement of Assets and Liabilities as of November 30, 2011 (continued) | |
| Net Asset Value | |
Class A Net Asset Value and redemption price(a) per share ($1,134,265,826 ÷ 34,428,305 shares of capital stock outstanding, $.01 par value, 420,000,000 shares authorized) | | $ | 32.95 | |
| Maximum offering price per share (100 ÷ 94.25 of $32.95) | | $ | 34.96 | |
Class B Net Asset Value, offering and redemption price(a) (subject to contingent deferred sales charge) per share ($11,956,823 ÷ 405,277 shares of capital stock outstanding, $.01 par value, 320,000,000 shares authorized) | | $ | 29.50 | |
Class C Net Asset Value, offering and redemption price(a) (subject to contingent deferred sales charge) per share ($130,090,894 ÷ 4,324,012 shares of capital stock outstanding, $.01 par value, 80,000,000 shares authorized) | | $ | 30.09 | |
Class S Net Asset Value, offering and redemption price(a) per share ($359,883,830 ÷ 10,822,916 shares of capital stock outstanding, $.01 par value, 150,000,000 shares authorized) | | $ | 33.25 | |
Institutional Class Net Asset Value, offering and redemption price(a) per share ($577,715,762 ÷ 17,287,829 shares of capital stock outstanding, $.01 par value, 180,000,000 shares authorized) | | $ | 33.42 | |
(a) Redemption price per share for shares held less than 15 days is equal to net asset value less a 2% redemption fee.
The accompanying notes are an integral part of the financial statements.
| for the year ended November 30, 2011 | |
| Investment Income | |
Income: Dividends — Unaffiliated issuers | | $ | 49,196,169 | |
| Dividends — Affiliated issuers | | | 334,598 | |
| Income distributions — Central Cash Management Fund | | | 126,261 | |
| Securities lending income, including income from Daily Assets Fund Institutional, net of borrower rebates | | | 889,326 | |
| Total income | | | 50,546,354 | |
Expenses: Management fee | | | 18,915,212 | |
| Services to shareholders | | | 5,070,133 | |
| Distribution and service fees | | | 5,098,815 | |
| Custodian fee | | | 37,943 | |
| Professional fees | | | 119,856 | |
| Reports to shareholders | | | 566,908 | |
| Registration fees | | | 207,919 | |
| Directors' fees and expenses | | | 77,070 | |
| Interest expense | | | 19,275 | |
| Other | | | 94,260 | |
| Total expenses | | | 30,207,391 | |
| Net investment income (loss) | | | 20,338,963 | |
| Realized and Unrealized Gain (Loss) | |
| Net realized gain (loss) from: | | | | |
| Investments — Unaffiliated issuers | | | 151,170,137 | |
| Investments — Affilated issuers | | | (2,395,777 | ) |
| | | | 148,774,360 | |
| Change in net unrealized appreciation (depreciation) on investments | | | (292,458,448 | ) |
| Net gain (loss) | | | (143,684,088 | ) |
| Net increase (decrease) in net assets resulting from operations | | $ | (123,345,125 | ) |
The accompanying notes are an integral part of the financial statements.
Statement of Changes in Net Assets | | | Years Ended November 30, | |
| Increase (Decrease) in Net Assets | | 2011 | | | 2010 | |
Operations: Net investment income (loss) | | $ | 20,338,963 | | | $ | 22,038,406 | |
| Net realized gain (loss) | | | 148,774,360 | | | | 161,143,123 | |
| Change in net unrealized appreciation (depreciation) | | | (292,458,448 | ) | | | 206,833,989 | |
| Net increase (decrease) in net assets resulting from operations | | | (123,345,125 | ) | | | 390,015,518 | |
Distributions to shareholders from: Net investment income: Class A | | | (8,299,067 | ) | | | (3,360,875 | ) |
| Class S | | | (5,370,489 | ) | | | (1,097,047 | ) |
| Institutional Class | | | (8,835,378 | ) | | | (3,246,975 | ) |
| Total distributions | | | (22,504,934 | ) | | | (7,704,897 | ) |
Fund share transactions: Proceeds from shares sold | | | 685,750,693 | | | | 1,062,151,409 | |
| Reinvestment of distributions | | | 19,390,588 | | | | 6,408,710 | |
| Payments for shares redeemed | | | (982,005,683 | ) | | | (775,307,719 | ) |
| Redemption fees | | | 21,919 | �� | | | 15,804 | |
| Net increase (decrease) in net assets from Fund share transactions | | | (276,842,483 | ) | | | 293,268,204 | |
| Increase from regulatory settlements (see Note G) | | | — | | | | 502,878 | |
| Increase (decrease) in net assets | | | (422,692,542 | ) | | | 676,081,703 | |
| Net assets at beginning of period | | | 2,636,605,677 | | | | 1,960,523,974 | |
| Net assets at end of period (including undistributed net investment income of $20,019,904 and $22,185,875, respectively) | | $ | 2,213,913,135 | | | $ | 2,636,605,677 | |
The accompanying notes are an integral part of the financial statements.
| | | Years Ended November 30, | |
| Class A | | | 2011 | | | 2010 | | | 2009 | | | 2008 | | | 2007 | |
| Selected Per Share Data | |
| Net asset value, beginning of period | | $ | 34.85 | | | $ | 29.47 | | | $ | 22.95 | | | $ | 39.01 | | | $ | 40.05 | |
Income (loss) from investment operations: Net investment income (loss)a | | | .25 | | | | .30 | | | | .20 | | | | .19 | | | | .16 | |
| Net realized and unrealized gain (loss) | | | (1.94 | ) | | | 5.16 | | | | 6.51 | | | | (11.92 | ) | | | .91 | |
| Total from investment operations | | | (1.69 | ) | | | 5.46 | | | | 6.71 | | | | (11.73 | ) | | | 1.07 | |
Less distributions from: Net investment income | | | (.21 | ) | | | (.09 | ) | | | (.19 | ) | | | (.36 | ) | | | — | |
| Net realized gains | | | — | | | | — | | | | — | | | | (3.97 | ) | | | (2.11 | ) |
| Total distributions | | | (.21 | ) | | | (.09 | ) | | | (.19 | ) | | | (4.33 | ) | | | (2.11 | ) |
| Increase from regulatory settlements | | | — | | | | .01 | d | | | — | | | | — | | | | — | |
| Redemption fees | | | .00 | * | | | .00 | * | | | .00 | * | | | .00 | * | | | .00 | * |
| Net asset value, end of period | | $ | 32.95 | | | $ | 34.85 | | | $ | 29.47 | | | $ | 22.95 | | | $ | 39.01 | |
Total Return (%)b | | | (4.91 | ) | | | 18.59 | d | | | 29.47 | | | | (33.57 | )c | | | 2.79 | |
| Ratios to Average Net Assets and Supplemental Data | |
| Net assets, end of period ($ millions) | | | 1,134 | | | | 1,365 | | | | 1,154 | | | | 829 | | | | 1,405 | |
| Ratio of expenses before expense reductions (%) | | | 1.21 | | | | 1.24 | | | | 1.25 | | | | 1.31 | | | | 1.20 | |
| Ratio of expenses after expense reductions (%) | | | 1.21 | | | | 1.24 | | | | 1.25 | | | | 1.30 | | | | 1.20 | |
| Ratio of net investment income (loss) (%) | | | .68 | | | | .93 | | | | .80 | | | | .61 | | | | .42 | |
| Portfolio turnover rate (%) | | | 47 | | | | 33 | | | | 59 | | | | 62 | | | | 60 | |
a Based on average shares outstanding during the period. b Total return does not reflect the effect of any sales charges. c Total return would have been lower had certain expenses not been reduced. d Includes a non-recurring payment from the Advisor which amounted to $0.004 per share recorded as a result of the Advisor's settlement with the SEC and NY Attorney General in connection with certain trading arrangements (see Note G). The Fund also received $0.003 per share of non-affiliated regulatory settlements. Excluding these non-recurring payments, total return would have been 0.02% lower. * Amount is less than $.005. | |
| | | Years Ended November 30, | |
| Class B | | | 2011 | | | 2010 | | | 2009 | | | 2008 | | | 2007 | |
| Selected Per Share Data | |
| Net asset value, beginning of period | | $ | 31.27 | | | $ | 26.59 | | | $ | 20.72 | | | $ | 35.59 | | | $ | 37.03 | |
Income (loss) from investment operations: Net investment income (loss)a | | | (.04 | ) | | | .10 | | | | (.02 | ) | | | (.03 | ) | | | (.10 | ) |
| Net realized and unrealized gain (loss) | | | (1.73 | ) | | | 4.57 | | | | 5.89 | | | | (10.83 | ) | | | .77 | |
| Total from investment operations | | | (1.77 | ) | | | 4.67 | | | | 5.87 | | | | (10.86 | ) | | | .67 | |
Less distributions from: Net investment income | | | — | | | | — | | | | — | | | | (.04 | ) | | | — | |
| Net realized gains | | | — | | | | — | | | | — | | | | (3.97 | ) | | | (2.11 | ) |
| Total distributions | | | — | | | | — | | | | — | | | | (4.01 | ) | | | (2.11 | ) |
| Increase from regulatory settlements | | | — | | | | .01 | d | | | — | | | | — | | | | — | |
| Redemption fees | | | .00 | * | | | .00 | * | | | .00 | * | | | .00 | * | | | .00 | * |
| Net asset value, end of period | | $ | 29.50 | | | $ | 31.27 | | | $ | 26.59 | | | $ | 20.72 | | | $ | 35.59 | |
Total Return (%)b | | | (5.66 | ) | | | 17.60 | d | | | 28.33 | | | | (34.10 | )c | | | 1.92 | |
| Ratios to Average Net Assets and Supplemental Data | |
| Net assets, end of period ($ millions) | | | 12 | | | | 22 | | | | 28 | | | | 33 | | | | 92 | |
| Ratio of expenses before expense reductions (%) | | | 2.01 | | | | 2.06 | | | | 2.16 | | | | 2.14 | | | | 2.02 | |
| Ratio of expenses after expense reductions (%) | | | 2.01 | | | | 2.06 | | | | 2.16 | | | | 2.14 | | | | 2.02 | |
| Ratio of net investment income (loss) (%) | | | (.13 | ) | | | .10 | | | | (.09 | ) | | | (.23 | ) | | | (.40 | ) |
| Portfolio turnover rate (%) | | | 47 | | | | 33 | | | | 59 | | | | 62 | | | | 60 | |
a Based on average shares outstanding during the period. b Total return does not reflect the effect of any sales charges. c Total return would have been lower had certain expenses not been reduced. d Includes a non-recurring payment from the Advisor which amounted to $0.003 per share recorded as a result of the Advisor's settlement with the SEC and NY Attorney General in connection with certain trading arrangements (see Note G). The Fund also received $0.003 per share of non-affiliated regulatory settlements. Excluding these non-recurring payments, total return would have been 0.02% lower. * Amount is less than $.005. | |
| | | Years Ended November 30, | |
| Class C | | | 2011 | | | 2010 | | | 2009 | | | 2008 | | | 2007 | |
| Selected Per Share Data | |
| Net asset value, beginning of period | | $ | 31.86 | | | $ | 27.06 | | | $ | 21.07 | | | $ | 36.11 | | | $ | 37.51 | |
Income (loss) from investment operations: Net investment income (loss)a | | | (.01 | ) | | | .12 | | | | .01 | | | | (.00 | )* | | | (.08 | ) |
| Net realized and unrealized gain (loss) | | | (1.76 | ) | | | 4.67 | | | | 5.99 | | | | (11.00 | ) | | | .79 | |
| Total from investment operations | | | (1.77 | ) | | | 4.79 | | | | 6.00 | | | | (11.00 | ) | | | .71 | |
Less distributions from: Net investment income | | | — | | | | — | | | | (.01 | ) | | | (.07 | ) | | | — | |
| Net realized gains | | | — | | | | — | | | | — | | | | (3.97 | ) | | | (2.11 | ) |
| Total distributions | | | — | | | | — | | | | (.01 | ) | | | (4.04 | ) | | | (2.11 | ) |
| Increase from regulatory settlements | | | — | | | | .01 | d | | | — | | | | — | | | | — | |
| Redemption fees | | | .00 | * | | | .00 | * | | | .00 | * | | | .00 | * | | | .00 | * |
| Net asset value, end of period | | $ | 30.09 | | | $ | 31.86 | | | $ | 27.06 | | | $ | 21.07 | | | $ | 36.11 | |
Total Return (%)b | | | (5.56 | ) | | | 17.74 | d | | | 28.45 | | | | (34.03 | )c | | | 2.00 | |
| Ratios to Average Net Assets and Supplemental Data | |
| Net assets, end of period ($ millions) | | | 130 | | | | 168 | | | | 143 | | | | 120 | | | | 249 | |
| Ratio of expenses before expense reductions (%) | | | 1.92 | | | | 1.94 | | | | 2.01 | | | | 2.03 | | | | 1.95 | |
| Ratio of expenses after expense reductions (%) | | | 1.92 | | | | 1.94 | | | | 2.01 | | | | 2.03 | | | | 1.95 | |
| Ratio of net investment income (loss) (%) | | | (.03 | ) | | | .22 | | | | .04 | | | | (.11 | ) | | | (.33 | ) |
| Portfolio turnover rate (%) | | | 47 | | | | 33 | | | | 59 | | | | 62 | | | | 60 | |
a Based on average shares outstanding during the period. b Total return does not reflect the effect of any sales charges. c Total return would have been lower had certain expenses not been reduced. d Includes a non-recurring payment from the Advisor which amounted to $0.004 per share recorded as a result of the Advisor's settlement with the SEC and NY Attorney General in connection with certain trading arrangements (see Note G). The Fund also received $0.003 per share of non-affiliated regulatory settlements. Excluding these non-recurring payments, total return would have been 0.02% lower. * Amount is less than $.005. | |
| | | Years Ended November 30, | |
| Class S | | | 2011 | | | 2010 | | | 2009 | | | 2008 | | | 2007 | |
| Selected Per Share Data | |
| Net asset value, beginning of period | | $ | 35.25 | | | $ | 29.80 | | | $ | 23.21 | | | $ | 39.39 | | | $ | 40.37 | |
Income (loss) from investment operations: Net investment income (loss)a | | | .30 | | | | .35 | | | | .24 | | | | .24 | | | | .21 | |
| Net realized and unrealized gain (loss) | | | (1.94 | ) | | | 5.23 | | | | 6.59 | | | | (12.05 | ) | | | .94 | |
| Total from investment operations | | | (1.64 | ) | | | 5.58 | | | | 6.83 | | | | (11.81 | ) | | | 1.15 | |
Less distributions from: Net investment income | | | (.36 | ) | | | (.14 | ) | | | (.24 | ) | | | (.40 | ) | | | (.02 | ) |
| Net realized gains | | | — | | | | — | | | | — | | | | (3.97 | ) | | | (2.11 | ) |
| Total distributions | | | (.36 | ) | | | (.14 | ) | | | (.24 | ) | | | (4.37 | ) | | | (2.13 | ) |
| Increase from regulatory settlements | | | — | | | | .01 | c | | | — | | | | — | | | | — | |
| Redemption fees | | | .00 | * | | | .00 | * | | | .00 | * | | | .00 | * | | | .00 | * |
| Net asset value, end of period | | $ | 33.25 | | | $ | 35.25 | | | $ | 29.80 | | | $ | 23.21 | | | $ | 39.39 | |
| Total Return (%) | | | (4.76 | ) | | | 18.82 | c | | | 29.65 | | | | (33.44 | )b | | | 2.99 | |
| Ratios to Average Net Assets and Supplemental Data | |
| Net assets, end of period ($ millions) | | | 360 | | | | 522 | | | | 230 | | | | 190 | | | | 216 | |
| Ratio of expenses before expense reductions (%) | | | 1.04 | | | | 1.05 | | | | 1.07 | | | | 1.14 | | | | 1.05 | |
| Ratio of expenses after expense reductions (%) | | | 1.04 | | | | 1.05 | | | | 1.07 | | | | 1.14 | | | | 1.05 | |
| Ratio of net investment income (loss) (%) | | | .83 | | | | 1.11 | | | | .98 | | | | .78 | | | | .56 | |
| Portfolio turnover rate (%) | | | 47 | | | | 33 | | | | 59 | | | | 62 | | | | 60 | |
a Based on average shares outstanding during the period. b Total return would have been lower had certain expenses not been reduced. c Includes a non-recurring payment from the Advisor which amounted to $0.004 per share recorded as a result of the Advisor's settlement with the SEC and NY Attorney General in connection with certain trading arrangements (see Note G). The Fund also received $0.003 per share of non-affiliated regulatory settlements. Excluding these non-recurring payments, total return would have been 0.02% lower. * Amount is less than $.005. | |
| | | Years Ended November 30, | |
| Institutional Class | | | 2011 | | | 2010 | | | 2009 | | | 2008 | | | 2007 | |
| Selected Per Share Data | |
| Net asset value, beginning of period | | $ | 35.50 | | | $ | 30.03 | | | $ | 23.39 | | | $ | 39.64 | | | $ | 40.58 | |
Income (loss) from investment operations: Net investment income (loss)a | | | .40 | | | | .43 | | | | .31 | | | | .32 | | | | .28 | |
| Net realized and unrealized gain (loss) | | | (1.94 | ) | | | 5.27 | | | | 6.62 | | | | (12.12 | ) | | | .93 | |
| Total from investment operations | | | (1.54 | ) | | | 5.70 | | | | 6.93 | | | | (11.80 | ) | | | 1.21 | |
Less distributions from: Net investment income | | | (.54 | ) | | | (.24 | ) | | | (.29 | ) | | | (.48 | ) | | | (.04 | ) |
| Net realized gains | | | — | | | | — | | | | — | | | | (3.97 | ) | | | (2.11 | ) |
| Total distributions | | | (.54 | ) | | | (.24 | ) | | | (.29 | ) | | | (4.45 | ) | | | (2.15 | ) |
| Increase from regulatory settlements | | | — | | | | .01 | c | | | — | | | | — | | | | — | |
| Redemption fees | | | .00 | * | | | .00 | * | | | .00 | * | | | .00 | * | | | .00 | * |
| Net asset value, end of period | | $ | 33.42 | | | $ | 35.50 | | | $ | 30.03 | | | $ | 23.39 | | | $ | 39.64 | |
| Total Return (%) | | | (4.51 | ) | | | 19.12 | c | | | 30.01 | | | | (33.29 | )b | | | 3.14 | |
| Ratios to Average Net Assets and Supplemental Data | |
| Net assets, end of period ($ millions) | | | 578 | | | | 560 | | | | 405 | | | | 178 | | | | 123 | |
| Ratio of expenses before expense reductions (%) | | | .80 | | | | .80 | | | | .80 | | | | .89 | | | | .86 | |
| Ratio of expenses after expense reductions (%) | | | .80 | | | | .80 | | | | .80 | | | | .88 | | | | .86 | |
| Ratio of net investment income (loss) (%) | | | 1.10 | | | | 1.37 | | | | 1.23 | | | | 1.03 | | | | .75 | |
| Portfolio turnover rate (%) | | | 47 | | | | 33 | | | | 59 | | | | 62 | | | | 60 | |
a Based on average shares outstanding during the period. b Total return would have been lower had certain expenses not been reduced. c Includes a non-recurring payment from the Advisor which amounted to $0.004 per share recorded as a result of the Advisor's settlement with the SEC and NY Attorney General in connection with certain trading arrangements (see Note G). The Fund also received $0.003 per share of non-affiliated regulatory settlements. Excluding these non-recurring payments, total return would have been 0.02% lower. * Amount is less than $.005. | |
Notes to Financial Statements
A. Organization and Significant Accounting Policies
DWS Dreman Small Cap Value Fund (the "Fund") is a diversified series of DWS Value Series, Inc. (the "Corporation"), which is registered under the Investment Company Act of 1940, as amended (the "1940 Act"), as an open-end management investment company organized as a Maryland corporation. Effective February 1, 2012, the Fund will re-open for investment to all investors.
The Fund offers multiple classes of shares which provide investors with different purchase options. Class A shares are offered to investors subject to an initial sales charge. Class B shares of the Fund are closed to new purchases, except exchanges or the reinvestment of dividends or other distributions. Class B shares were offered to investors without an initial sales charge and are subject to higher ongoing expenses than Class A shares and a contingent deferred sales charge payable upon certain redemptions. Class B shares automatically convert to Class A shares six years after issuance. Class C shares are offered to investors without an initial sales charge but are subject to higher ongoing expenses than Class A shares and a contingent deferred sales charge payable upon certain redemptions within one year of purchase. Class C shares do not automatically convert into another class. Institutional Class shares are offered to a limited group of investors, are not subject to initial or contingent deferred sales charges and have lower ongoing expenses than other classes. Class S shares are not subject to initial or contingent deferred sales charges and are generally not available to new investors except under certain circumstances.
Investment income, realized and unrealized gains and losses, and certain fund-level expenses and expense reductions, if any, are borne pro rata on the basis of relative net assets by the holders of all classes of shares, except that each class bears certain expenses unique to that class such as distribution and service fees, services to shareholders and certain other class-specific expenses. Differences in class-level expenses may result in payment of different per share dividends by class. All shares of the Fund have equal rights with respect to voting subject to class-specific arrangements.
The Fund's financial statements are prepared in accordance with accounting principles generally accepted in the United States of America which require the use of management estimates. Actual results could differ from those estimates. The policies described below are followed consistently by the Fund in the preparation of its financial statements.
Security Valuation. Investments are stated at value determined as of the close of regular trading on the New York Stock Exchange on each day the exchange is open for trading.
Various inputs are used in determining the value of the Fund's investments. These inputs are summarized in three broad levels. Level 1 includes quoted prices in active markets for identical securities. Level 2 includes other significant observable inputs (including quoted prices for similar securities, interest rates, prepayment speeds, and credit risk). Level 3 includes significant unobservable inputs (including the Fund's own assumptions in determining the fair value of investments). The inputs or methodology used for valuing securities are not necessarily an indication of the risk associated with investing in those securities.
Equity securities are valued at the most recent sale price or official closing price reported on the exchange (U.S. or foreign) or over-the-counter market on which they trade and are categorized as Level 1 securities. Securities for which no sales are reported are valued at the calculated mean between the most recent bid and asked quotations on the relevant market or, if a mean cannot be determined, at the most recent bid quotation.
Money market instruments purchased with an original or remaining maturity of sixty days or less, maturing at par, are valued at amortized cost, which approximates value, and are categorized as Level 2. Investments in open-end investment companies are valued at their net asset value each business day and are categorized as Level 1.
Securities and other assets for which market quotations are not readily available or for which the above valuation procedures are deemed not to reflect fair value are valued in a manner that is intended to reflect their fair value as determined in accordance with procedures approved by the Board and are generally categorized as Level 3. In accordance with the Fund's valuation procedures, factors used in determining value may include, but are not limited to, the type of the security; the size of the holding; the initial cost of the security; the existence of any contractual restrictions on the security's disposition; the price and extent of public trading in similar securities of the issuer or of comparable companies; quotations or evaluated prices from broker-dealers and/or pricing services; information obtained from the issuer, analysts, and/or the appropriate stock exchange (for exchange-traded securities); an analysis of the company's or issuer's financial statements; an evaluation of the forces that influence the issuer and the market(s) in which the security is purchased and sold and with respect to debt securities; the maturity, coupon, creditworthiness, currency denomination and the movement of the market in which the security is normally traded. The value determined under these procedures may differ from published values for the same securities.
Disclosure about the classification of fair value measurements is included in a table following the Fund's Investment Portfolio.
New Accounting Pronouncement. In May 2011, Accounting Standards Update 2011-04 (ASU 2011-04), Amendments to Achieve Common Fair Value Measurement and Disclosure Requirements in U.S. GAAP and IFRSs, was issued and is effective during interim and annual periods beginning after December 15, 2011. ASU 2011-04 amends Accounting Standards Codification (ASC) Topic 820, Fair Value Measurement. The amendments are the result of the work by the Financial Accounting Standards Board and the International Accounting Standards Board to develop common requirements for measuring fair value and for disclosing information about fair value measurements in accordance with GAAP. Management is currently evaluating the application of ASU 2011-04 and its impact, if any, on the Fund's financial statements.
Securities Lending. The Fund lends securities to certain financial institutions. The Fund retains beneficial ownership of the securities it has loaned and continues to receive interest and dividends paid by the issuer of securities and to participate in any changes in their market value. The Fund requires the borrowers of the securities to maintain collateral with the Fund consisting of either cash or liquid, unencumbered assets having a value at least equal to the value of the securities loaned. When the collateral falls below specified amounts, the lending agent will use its best effort to obtain additional collateral on the next business day to meet required amounts under the security lending agreement. The Fund may invest the cash collateral into a joint trading account in an affiliated money market fund pursuant to Exemptive Orders issued by the SEC. The Fund receives compensation for lending its securities either in the form of fees or by earning interest on invested cash collateral net of borrower rebates and fees paid to a lending agent. Either the Fund or the borrower may terminate the loan. There may be risks of delay and costs in recovery of securities or even loss of rights in the collateral should the borrower of the securities fail financially. The Fund is also subject to all investment risks associated with the reinvestment of any cash collateral received, including, but not limited to, interest rate, credit and liquidity risk associated with such investments.
Federal Income Taxes. The Fund's policy is to comply with the requirements of the Internal Revenue Code, as amended, which are applicable to regulated investment companies, and to distribute all of its taxable income to its shareholders.
During the year ended November 30, 2011, the Fund utilized approximately $134,339,000 of prior year capital loss carryforward.
In addition, from November 1, 2011 through November 30, 2011, the Fund incurred approximately $11,016,000 of net realized capital losses. As permitted by tax regulations, the Fund intends to elect to defer these losses and treat them as arising in the fiscal year ending November 30, 2012.
On December 22, 2010, the Regulated Investment Company Modernization Act of 2010 (the "Act") was enacted. Under the Act, net capital losses may be carried forward indefinitely, and their character is retained as short-term and/or long-term losses. Previously, net capital losses were carried forward for eight years and treated as short-term losses. As a transition rule, the Act requires that post-enactment net capital losses be used before pre-enactment net capital losses. As a result of this ordering rule, pre-enactment capital loss carryforwards may expire unused, whereas under the previous rules these losses may have been utilized. This change is effective for fiscal years beginning after the date of enactment.
The Fund has reviewed the tax positions for the open tax years as of November 30, 2011 and has determined that no provision for income tax is required in the Fund's financial statements. The Fund's federal tax returns for the prior three fiscal years remain open subject to examination by the Internal Revenue Service.
Distribution of Income and Gains. Net investment income of the Fund, if any, is declared and distributed to shareholders annually. Net realized gains from investment transactions, in excess of available capital loss carryforwards, would be taxable to the Fund if not distributed, and, therefore, will be distributed to shareholders at least annually.
The timing and characterization of certain income and capital gains distributions are determined annually in accordance with federal tax regulations which may differ from accounting principles generally accepted in the United States of America. These differences primarily relate to income received from Real Estate Investment Trusts and certain securities sold at a loss. As a result, net investment income (loss) and net realized gain (loss) on investment transactions for a reporting period may differ significantly from distributions during such period. Accordingly, the Fund may periodically make reclassifications among certain of its capital accounts without impacting the net asset value of the Fund.
At November 30, 2011, the Fund's components of distributable earnings (accumulated losses) on a tax basis were as follows:
Undistributed ordinary income* | | $ | 20,805,983 | |
| Undistributed long-term capital gains | | $ | 19,690,555 | |
| Net unrealized appreciation (depreciation) on investments | | $ | 152,833,493 | |
In addition, the tax character of distributions paid to shareholders by the Fund is summarized as follows:
| | | Years Ended November 30, | |
| | | 2011 | | | 2010 | |
| Distributions from ordinary income* | | $ | 22,504,934 | | | $ | 7,704,897 | |
* For tax purposes, short-term capital gains distributions are considered ordinary income distributions.
Redemption Fees. The Fund imposes a redemption fee of 2% of the total redemption amount on all Fund shares redeemed or exchanged within 15 days of buying them, either by purchase or exchange. This fee is assessed and retained by the Fund for the benefit of the remaining shareholders. The redemption fee is accounted for as an addition to paid-in-capital.
Expenses. Expenses of the Corporation arising in connection with a specific fund are allocated to that fund. Other Corporation expenses which cannot be directly attributed to a fund are apportioned among the funds in the Corporation.
Contingencies. In the normal course of business, the Fund may enter into contracts with service providers that contain general indemnification clauses. The Fund's maximum exposure under these arrangements is unknown as this would involve future claims that may be made against the Fund that have not yet been made. However, based on experience, the Fund expects the risk of loss to be remote.
Real Estate Investment Trusts. The Fund periodically recharacterizes distributions received from a Real Estate Investment Trust ("REIT") investment based on information provided by the REIT into the following categories: ordinary income, long-term and short-term capital gains, and return of capital. If information is not available timely from a REIT, the recharacterization will be estimated and a recharacterization will be made in the following year when such information becomes available. Distributions received from REITs in excess of income are recorded as either a reduction of cost of investments or realized gains. The Fund distinguishes between dividends on a tax basis and a financial reporting basis and only distributions in excess of tax basis earnings and profits are reported in the financial statements as a tax return of capital.
Other. Investment transactions are accounted for on a trade date plus one basis for daily net asset valuation calculations. However, for financial reporting purposes, investment transactions are reported on trade date. Interest income is recorded on the accrual basis. Dividend income is recorded on the ex-dividend date net of foreign withholding taxes. Realized gains and losses from investment transactions are recorded on an identified cost basis and may include proceeds from litigation.
B. Purchases and Sales of Securities
During the year ended November 30, 2011, purchases and sales of investment securities (excluding short-term investments) aggregated $1,214,885,216 and $1,341,432,027, respectively.
C. Related Parties
Management Agreement. Under the Investment Management Agreement with Deutsche Investment Management Americas Inc. ("DIMA" or the "Advisor"), an indirect, wholly owned subsidiary of Deutsche Bank AG, the Advisor directs the investments of the Fund in accordance with its investment objectives, policies and restrictions. The Advisor determines the securities, instruments and other contracts relating to investments to be purchased, sold or entered into by the Fund or delegates such responsibilities to the Fund's subadvisor. In addition to portfolio management services, the Advisor provides certain administrative services in accordance with the Investment Management Agreement.
Dreman Value Management, L.L.C. ("DVM" or the "Subadvisor") serves as subadvisor with respect to the investment and reinvestment of assets of the Fund, and is paid by the Advisor for its services.
Under the Investment Management Agreement with the Advisor, the Fund pays a monthly management fee based on the Fund's average daily net assets, computed and accrued daily and payable monthly, at the following annual rates:
| First $250 million of the Fund's average daily net assets | | | .750 | % |
| Next $750 million of such net assets | | | .720 | % |
| Next $1.5 billion of such net assets | | | .700 | % |
| Next $2.5 billion of such net assets | | | .680 | % |
| Next $2.5 billion of such net assets | | | .650 | % |
| Next $2.5 billion of such net assets | | | .640 | % |
| Next $2.5 billion of such net assets | | | .630 | % |
| Over $12.5 billion of such net assets | | | .620 | % |
For the year ended November 30, 2011, the fee pursuant to the Investment Management Agreement was equivalent to an annual effective rate of 0.71% of the Fund's average daily net assets.
Service Provider Fees. DWS Investments Service Company ("DISC"), an affiliate of the Advisor, is the transfer agent, dividend-paying agent and shareholder service agent for the Fund. Pursuant to a sub-transfer agency agreement between DISC and DST Systems, Inc. ("DST"), DISC has delegated certain transfer agent, dividend-paying agent and shareholder service agent functions to DST. DISC compensates DST out of the shareholder servicing fee it receives from the Fund. For the year ended November 30, 2011, the amounts charged to the Fund by DISC were as follows:
| Services to Shareholders | | Total Aggregated | | | Unpaid at November 30, 2011 | |
| Class A | | $ | 938,125 | | | $ | 194,647 | |
| Class B | | | 22,792 | | | | 4,590 | |
| Class C | | | 111,623 | | | | 23,007 | |
| Class S | | | 225,631 | | | | 45,905 | |
| Institutional Class | | | 49,365 | | | | 12,406 | |
| | | $ | 1,347,536 | | | $ | 280,555 | |
Distribution and Service Fees. Under the Fund's Class B and Class C 12b-1 Plans, DWS Investments Distributors, Inc. ("DIDI"), an affiliate of the Advisor, receives a fee ("Distribution Fee") of 0.75% of average daily net assets of each of Class B and C shares. In accordance with the Fund's Underwriting and Distribution Services Agreement, DIDI enters into related selling group agreements with various firms at various rates for sales of Class B and C shares. For the year ended November 30, 2011, the Distribution Fee was as follows:
| Distribution Fee | | Total Aggregated | | | Unpaid at November 30, 2011 | |
| Class B | | $ | 130,368 | | | $ | 7,399 | |
| Class C | | | 1,209,949 | | | | 79,687 | |
| | | $ | 1,340,317 | | | $ | 87,086 | |
In addition, DIDI provides information and administrative services for a fee ("Service Fee") to Class A, B and C shareholders at an annual rate of up to 0.25% of average daily net assets for each such class. DIDI in turn has various agreements with financial services firms that provide these services and pays these fees based upon the assets of shareholder accounts the firms service. For the year ended November 30, 2011, the Service Fee was as follows:
| Service Fee | | Total Aggregated | | | Unpaid at November 30, 2011 | | | Annual Effective Rate | |
| Class A | | $ | 3,312,519 | | | $ | 461,776 | | | | .25 | % |
| Class B | | | 43,075 | | | | 5,430 | | | | .25 | % |
| Class C | | | 402,904 | | | | 25,063 | | | | .25 | % |
| | | $ | 3,758,498 | | | $ | 492,269 | | | | | |
Underwriting Agreement and Contingent Deferred Sales Charge. DIDI is the principal underwriter for the Fund. Underwriting commissions paid in connection with the distribution of Class A shares for the year ended November 30, 2011, aggregated $34,252.
In addition, DIDI receives any contingent deferred sales charge ("CDSC") from Class B share redemptions occurring within six years of purchase and Class C share redemptions occurring within one year of purchase. There is no such charge upon redemption of any share appreciation or reinvested dividends. The CDSC is based on declining rates, ranging from 4% to 1% for Class B and 1% for Class C, of the value of the shares redeemed. For the year ended November 30, 2011, the CDSC for Class B and C shares aggregated $36,983 and $15,286, respectively. A deferred sales charge of up to 1% is assessed on certain redemptions of Class A shares. For the year ended November 30, 2011, DIDI received $16,305 for Class A shares.
Typesetting and Filing Service Fees. Under an agreement with DIMA, DIMA is compensated for providing typesetting and certain regulatory filing services to the Fund. For the year ended November 30, 2011, the amount charged to the Fund by DIMA included in the Statement of Operations under "reports to shareholders" aggregated $17,329, of which $7,173 is unpaid.
Directors' Fees and Expenses. The Fund paid each Director not affiliated with the Advisor retainer fees plus specified amounts for various committee services and for the Board Chairperson.
Affiliated Cash Management Vehicle. The Fund may invest uninvested cash balances in Central Cash Management Fund, which is managed by the Advisor. The Fund indirectly bears its proportionate share of the expenses of Central Cash Management Fund. Central Cash Management Fund does not pay the Advisor an investment management fee. Central Cash Management Fund seeks a high level of current income consistent with liquidity and the preservation of capital.
D. Transactions in Securities of Affiliated Issuers
An affiliated issuer includes any company in which the Fund has ownership of at least 5% of the outstanding voting securities. A summary of the Fund's transactions during the year ended November 30, 2011 with companies which are or were affiliates is as follows:
| Affiliate | | Value ($) at 11/30/2010 | | | Purchases Cost ($) | | | Sales Cost ($) | | | Realized Gain/ (Loss) ($) | | | Dividend Income ($) | | | Shares at 11/30/2011 | | | Value ($) at 11/30/2011 | |
| Nash Finch Co.* | | | 22,127,508 | | | | 1,303,751 | | | | 19,307,017 | | | | (2,395,777 | ) | | | 334,598 | | | | — | | | | — | |
* Not an affiliate at November 30, 2010.
E. Line of Credit
The Fund and other affiliated funds (the "Participants") share in a $450 million revolving credit facility provided by a syndication of banks. The Fund may borrow for temporary or emergency purposes, including the meeting of redemption requests that otherwise might require the untimely disposition of securities. The Participants are charged an annual commitment fee which is allocated based on net assets, among each of the Participants. Interest is calculated at a rate per annum equal to the sum of the Federal Funds Rate plus 1.25 percent plus if LIBOR exceeds the Federal Funds Rate the amount of such excess. The Fund may borrow up to a maximum of 33 percent of its net assets under the agreement.
At November 30, 2011, the Fund had a $350,000 outstanding loan. Interest expense incurred on the borrowing was $19,275 for the year ended November 30, 2011. The average dollar amount of the borrowings was $12,142,647, the weighted average interest rate on these borrowings was 1.47% and the Fund had a loan outstanding for thirty-four days throughout the period. The borrowings were valued at cost, which approximates fair value.
F. Share Transactions
The following table summarizes share and dollar activity in the Fund:
| | | Year Ended November 30, 2011 | | | Year Ended November 30, 2010 | |
| | | Shares | | | Dollars | | | Shares | | | Dollars | |
| Shares sold | |
| Class A | | | 7,898,837 | | | $ | 283,591,194 | | | | 13,185,956 | | | $ | 425,798,893 | |
| Class B | | | 11,309 | | | | 379,663 | | | | 37,556 | | | | 1,070,852 | |
| Class C | | | 330,559 | | | | 11,069,943 | | | | 1,109,300 | | | | 32,693,244 | |
| Class S | | | 3,748,727 | | | | 137,955,591 | | | | 10,345,958 | | | | 331,956,660 | |
| Institutional Class | | | 6,924,896 | | | | 252,754,302 | | | | 8,349,885 | | | | 270,631,760 | |
| | | | | | | $ | 685,750,693 | | | | | | | $ | 1,062,151,409 | |
| Shares issued to shareholders in reinvestment of distributions | |
| Class A | | | 211,112 | | | $ | 7,773,653 | | | | 100,729 | | | $ | 3,074,235 | |
| Class S | | | 137,699 | | | | 5,136,836 | | | | 33,706 | | | | 1,038,480 | |
| Institutional Class | | | 172,432 | | | | 6,480,099 | | | | 74,160 | | | | 2,295,995 | |
| | | | | | | $ | 19,390,588 | | | | | | | $ | 6,408,710 | |
| Shares redeemed | |
| Class A | | | (12,845,844 | ) | | $ | (458,541,287 | ) | | | (13,278,426 | ) | | $ | (423,495,505 | ) |
| Class B | | | (301,935 | ) | | | (9,716,714 | ) | | | (406,285 | ) | | | (11,723,843 | ) |
| Class C | | | (1,269,805 | ) | | | (41,154,849 | ) | | | (1,143,900 | ) | | | (33,574,202 | ) |
| Class S | | | (7,868,102 | ) | | | (271,132,269 | ) | | | (3,301,042 | ) | | | (106,380,526 | ) |
| Institutional Class | | | (5,597,483 | ) | | | (201,460,564 | ) | | | (6,116,277 | ) | | | (200,133,643 | ) |
| | | | | | | $ | (982,005,683 | ) | | | | | | $ | (775,307,719 | ) |
| Redemption fees | | | | | | $ | 21,919 | | | | | | | $ | 15,804 | |
| Net increase (decrease) | |
| Class A | | | (4,735,895 | ) | | $ | (167,161,783 | ) | | | 8,259 | | | $ | 5,388,017 | |
| Class B | | | (290,626 | ) | | | (9,337,051 | ) | | | (368,729 | ) | | | (10,652,991 | ) |
| Class C | | | (939,246 | ) | | | (30,083,138 | ) | | | (34,600 | ) | | | (880,439 | ) |
| Class S | | | (3,981,676 | ) | | | (128,039,269 | ) | | | 7,078,622 | | | | 226,618,267 | |
| Institutional Class | | | 1,499,845 | | | | 57,778,758 | | | | 2,307,768 | | | | 72,795,350 | |
| | | | | | | $ | (276,842,483 | ) | | | | | | $ | 293,268,204 | |
G. Regulatory Settlements
On December 21, 2006, the Advisor settled proceedings with the SEC and the New York Attorney General regarding alleged improper trading of fund shares. In accordance with the distribution plan, developed by a distribution consultant, settlement proceeds were distributed to affected shareholders of the Fund, and unclaimed proceeds were then paid to the Fund in the amount of $275,799. In addition, the Fund received $227,079 of non-affiliated regulatory settlements. These payments are included in "Increase from regulatory settlements" in the Statement of Changes in Net Assets for the year ended November 30, 2010. The amounts of the payments were 0.02% of the Fund's average net assets.
Report of Independent Registered Public Accounting Firm
To the Board of Directors of DWS Value Series, Inc. and Shareholders of DWS Dreman Small Cap Value Fund:
We have audited the accompanying statement of assets and liabilities of DWS Dreman Small Cap Value Fund (the "Fund"), including the investment portfolio, as of November 30, 2011, and the related statement of operations for the year then ended, the statement of changes in net assets for each of the two years in the period then ended, and the financial highlights for each of the five years in the period then ended. These financial statements and financial highlights are the responsibility of the Fund's management. Our responsibility is to express an opinion on these financial statements and financial highlights based on our audits.
We conducted our audits in accordance with the standards of the Public Company Accounting Oversight Board (United States). Those standards require that we plan and perform the audit to obtain reasonable assurance about whether the financial statements and financial highlights are free of material misstatement. We were not engaged to perform an audit of the Fund's internal control over financial reporting. Our audits included consideration of internal control over financial reporting as a basis for designing audit procedures that are appropriate in the circumstances, but not for the purpose of expressing an opinion on the effectiveness of the Fund's internal control over financial reporting. Accordingly, we express no such opinion. An audit also includes examining, on a test basis, evidence supporting the amounts and disclosures in the financial statements and financial highlights, assessing the accounting principles used and significant estimates made by management, and evaluating the overall financial statement presentation. Our procedures included confirmation of securities owned as of November 30, 2011, by correspondence with the custodian and brokers or by other appropriate auditing procedures where replies from brokers were not received. We believe that our audits provide a reasonable basis for our opinion.
In our opinion, the financial statements and financial highlights referred to above present fairly, in all material respects, the financial position of DWS Dreman Small Cap Value Fund at November 30, 2011, the results of its operations for the year then ended, the changes in its net assets for each of the two years in the period then ended, and the financial highlights for each of the five years in the period then ended, in conformity with U.S. generally accepted accounting principles.
| | | |
Boston, Massachusetts January 24, 2012 | | |
Tax Information (Unaudited)
Pursuant to Section 852 of the Internal Revenue Code, the Fund designates $21,660,000 as capital gains dividends for its year ended November 30, 2011, of which 100% represents 15% rate gains.
For corporate shareholders, 100% of the income dividends paid during the Fund's fiscal year ended November 30, 2011 qualified for the dividends received deduction.
For federal income tax purposes, the Fund designates approximately $57,200,000, or the maximum amount allowable under tax law, as qualified dividend income.
Please contact a tax advisor if you have questions about federal or state income tax laws, or on how to prepare your tax returns. If you have specific questions about our account, please call (800) 621-1048.
Investment Management Agreement Approval
The Board of Directors approved the renewal of DWS Dreman Small Cap Value Fund's investment management agreement (the "Agreement") with Deutsche Investment Management Americas Inc. ("DWS") and sub-advisory agreement (the "Sub-Advisory Agreement" and together with the Agreement, the "Agreements") between DWS and Dreman Value Management L.L.C. ("DVM") in September 2011.
In terms of the process that the Board followed prior to approving the Agreements, shareholders should know that:
· In September 2011, all of the Fund's Directors were independent of DWS and its affiliates.
· The Directors met frequently during the past year to discuss fund matters and dedicated a substantial amount of time to contract review matters. Over the course of several months, the Board's Contract Committee, in coordination with the Board's Equity Oversight Committee, reviewed comprehensive materials received from DWS, independent third parties and independent counsel. These materials included an analysis of the Fund's performance, fees and expenses, and profitability compiled by the Fund's independent fee consultant. The Board also received extensive information throughout the year regarding performance of the Fund.
· The Independent Directors regularly meet privately with their independent counsel to discuss contract review and other matters. In addition, the Independent Directors were also advised by the Fund's independent fee consultant in the course of their review of the Fund's contractual arrangements and considered a comprehensive report prepared by the independent fee consultant in connection with their deliberations (the "IFC Report").
· In connection with reviewing the Agreements, the Board also reviewed the terms of the Fund's Rule 12b-1 plan, distribution agreement, transfer agency agreement and other material service agreements.
· Based on its evaluation of the information provided, the Contract Committee presented its findings and recommendations to the Board. The Board then reviewed the Contract Committee's findings and recommendations.
In connection with the contract review process, the Contract Committee and the Board considered the factors discussed below, among others. The Board also considered that DWS and its predecessors have managed the Fund since its inception, and the Board believes that a long-term relationship with a capable, conscientious advisor is in the best interests of the Fund. The Board considered, generally, that shareholders chose to invest or remain invested in the Fund knowing that DWS managed the Fund. DWS is part of Deutsche Bank, a major global banking institution that is engaged in a wide range of financial services. The Board believes that there are significant advantages to being part of a global asset management business that offers a wide range of investing expertise and resources, including hundreds of portfolio managers and analysts with research capabilities in many countries throughout the world.
While shareholders may focus primarily on fund performance and fees, the Fund's Board considers these and many other factors, including the quality and integrity of DWS's and DVM's personnel and such other issues as back-office operations, fund valuations, and compliance policies and procedures.
Nature, Quality and Extent of Services. The Board considered the terms of the Agreements, including the scope of advisory services provided under the Agreements. The Board noted that, under the Agreements, DWS and DVM provide portfolio management services to the Fund and that DWS also provides administrative services to the Fund. The Board considered the experience and skills of senior management and investment personnel, the resources made available to such personnel, the ability of DWS to attract and retain high-quality personnel, and the organizational depth and stability of DWS. The Board also requested and received information regarding DWS's oversight of Fund sub-advisors, including DVM. The Board reviewed the Fund's performance over short-term and long-term periods and compared those returns to various agreed-upon performance measures, including market indices and a peer universe compiled by the independent fee consultant using information supplied by Lipper Inc. ("Lipper"). The Board also noted that it has put into place a process of identifying "Focus Funds" (e.g., funds performing poorly relative to their benchmark or a peer universe compiled by an independent fund data service), and receives more frequent reporting and information from DWS regarding such funds, along with DWS's remedial plans to address underperformance. The Board believes this process is an effective manner of identifying and addressing underperforming funds. Based on the information provided, the Board noted that for the one-, three- and five-year periods ended December 31, 2010, the Fund's performance (Class A shares) was in the 4th quartile, 2nd quartile and 1st quartile, respectively, of the applicable Lipper universe (the 1st quartile being the best performers and the 4th quartile being the worst performers). The Board also observed that the Fund has outperformed its benchmark in the three- and five-year periods and underperformed its benchmark in the one-year period ended December 31, 2010. The Board noted the disappointing investment performance of the Fund in recent periods and continued to discuss with senior management of DWS and DVM the factors contributing to such underperformance and actions being taken to improve performance. The Board recognized that DWS has made significant changes in its investment personnel and processes in recent years in an effort to improve long-term performance.
On the basis of this evaluation and the ongoing review of investment results by the Board, the Board concluded that the nature, quality and extent of services provided by DWS and DVM historically have been and continue to be satisfactory.
Fees and Expenses. The Board considered the Fund's investment management fee schedule, sub-advisory fee schedule, operating expenses, and total expense ratios, and comparative information provided by Lipper and the independent fee consultant regarding investment management fee rates paid to other investment advisors by similar funds (1st quartile being the most favorable and 4th quartile being the least favorable). With respect to management fees paid to other investment advisors by similar funds, the Board noted that the contractual fee rates paid by the Fund were lower than the median (2nd quartile) of the applicable Lipper peer group (based on Lipper data provided as of December 31, 2010). With respect to the sub-advisory fee paid to DVM, the Board noted that the fee is paid by DWS out of its fee and not directly by the Fund. The Board noted that the Fund's Class A shares total (net) operating expenses (excluding 12b-1 fees) were expected to be lower than the median (1st quartile) of the applicable Lipper expense universe (based on Lipper data provided as of December 31, 2010, and analyzing Lipper expense universe Class A expenses less any applicable 12b-1 fees) ("Lipper Universe Expenses"). The Board also reviewed data comparing each share class's total (net) operating expenses to the applicable Lipper Universe Expenses. The Board considered the Fund's management fee rate as compared to fees charged by DWS and certain of its affiliates for comparable mutual funds and considered differences in fund and fee structures between the DWS Funds. The Board also considered how the Fund's total (net) operating expenses compared to the total (net) operating expenses of a more customized peer group selected by Lipper (based on such factors as asset size).
The information considered by the Board as part of its review of management fees included information regarding fees charged by DWS and its affiliates to similar institutional accounts and to similar funds offered primarily to European investors ("DWS Europe funds"), in each case as applicable. The Board observed that advisory fee rates for institutional accounts generally were lower than the management fees charged by similarly managed DWS U.S. mutual funds ("DWS Funds"), but also took note of the differences in services provided to DWS Funds as compared to institutional accounts. In the case of DWS Europe funds, the Board observed that fee rates for DWS Europe funds generally were higher than for similarly managed DWS Funds, but noted that differences in the types of services provided to DWS Funds relative to DWS Europe funds made it difficult to compare such fees.
On the basis of the information provided, the Board concluded that management fees were reasonable and appropriate in light of the nature, quality and extent of services provided by DWS and DVM.
Profitability. The Board reviewed detailed information regarding revenues received by DWS under the Agreement. The Board considered the estimated costs and pre-tax profits realized by DWS from advising the DWS Funds, as well as estimates of the pre-tax profits attributable to managing the Fund in particular. The Board also received information regarding the estimated enterprise-wide profitability of DWS and its affiliates with respect to all fund services in totality and by fund. The Board and the independent fee consultant reviewed DWS's methodology in allocating its costs to the management of the Fund. Based on the information provided, the Board concluded that the pre-tax profits realized by DWS in connection with the management of the Fund were not unreasonable. The Board also reviewed information regarding the profitability of certain similar investment management firms. The Board noted that while information regarding the profitability of such firms is limited (and in some cases is not necessarily prepared on a comparable basis), DWS and its affiliates' overall profitability with respect to the DWS fund complex (after taking into account distribution and other services provided to the funds by DWS and its affiliates) was lower than the overall profitability levels of many comparable firms for which such data was available. The Board did not consider the profitability of DVM with respect to the Fund. The Board noted that DWS pays DVM's fee out of its management fee, and its understanding that the Fund's sub-advisory fee schedule was the product of an arm's length negotiation with DWS.
Economies of Scale. The Board considered whether there are economies of scale with respect to the management of the Fund and whether the Fund benefits from any economies of scale. The Board noted that the Fund's management fee schedule includes fee breakpoints. The Board concluded that the Fund's fee schedule represents an appropriate sharing between the Fund and DWS of such economies of scale as may exist in the management of the Fund at current asset levels.
Other Benefits to DWS and DVM and Their Affiliates. The Board also considered the character and amount of other incidental benefits received by DWS and DVM and their affiliates, including any fees received by an affiliate of DWS for distribution services. The Board also considered the incidental public relations benefits to DWS and DVM related to DWS Funds advertising and cross-selling opportunities among DWS products and services. The Board concluded that management fees were reasonable in light of these fallout benefits.
Compliance. The Board considered the significant attention and resources dedicated by DWS to documenting and enhancing its compliance processes in recent years. The Board noted in particular (i) the experience and seniority of both DWS's chief compliance officer and the Fund's chief compliance officer; (ii) the large number of DWS compliance personnel; and (iii) the substantial commitment of resources by DWS and its affiliates to compliance matters. The Board also considered the attention and resources dedicated by DWS to the oversight of the investment sub-advisor's compliance program and compliance with the applicable fund policies and procedures.
Based on all of the information considered and the conclusions reached, the Board unanimously determined that the continuation of the Agreements is in the best interests of the Fund. In making this determination, the Board did not give particular weight to any single factor identified above. The Board considered these factors over the course of numerous meetings, certain of which were in executive session with only the Independent Directors and their counsel present. It is possible that individual Directors may have weighed these factors differently in reaching their individual decisions to approve the continuation of the Agreements.
Summary of Management Fee Evaluation by Independent Fee Consultant
September 26, 2011
Pursuant to an Order entered into by Deutsche Investment Management Americas and affiliates (collectively, "DeAM") with the Attorney General of New York, I, Thomas H. Mack, have been appointed the Independent Fee Consultant for the DWS Funds (formerly the DWS Scudder Funds). My duties include preparing an annual written evaluation of the management fees DeAM charges the Funds, considering among other factors the management fees charged by other mutual fund companies for like services, management fees DeAM charges other clients for like services, DeAM's costs of supplying services under the management agreements and related profit margins, possible economies of scale if a Fund grows larger, and the nature and quality of DeAM's services, including fund performance. This report summarizes my evaluation for 2011, including my qualifications, the evaluation process for each of the DWS Funds, consideration of certain complex-level factors, and my conclusions. I served in substantially the same capacity in 2007, 2008, 2009 and 2010.
Qualifications
For more than 35 years I have served in various professional capacities within the investment management business. I have held investment analysis and advisory positions, including securities analyst, portfolio strategist and director of investment policy with a large investment firm. I have also performed business management functions, including business development, financial management and marketing research and analysis.
Since 1991, I have been an independent consultant within the asset management industry. I have provided services to over 125 client organizations, including investment managers, mutual fund boards, product distributors and related organizations. Over the past ten years I have completed a number of assignments for mutual fund boards, specifically including assisting boards with management contract renewal.
I hold a Master of Business Administration degree, with highest honors, from Harvard University and Master of Science and Bachelor of Science (highest honors) degrees from the University of California at Berkeley. I am an independent director and audit committee financial expert for two closed-end mutual funds and have served in various leadership and financial oversight capacities with non-profit organizations.
Evaluation of Fees for each DWS Fund
My work focused primarily on evaluating, fund-by-fund, the fees charged to each of the 109 mutual fund portfolios in the DWS Fund family. For each Fund, I considered each of the key factors mentioned above, as well as any other relevant information. In doing so I worked closely with the Funds' Independent Directors in their annual contract renewal process, as well as in their approval of contracts for several new funds (documented separately).
In evaluating each Fund's fees, I reviewed comprehensive materials provided by or on behalf of DeAM, including expense information prepared by Lipper Analytical, comparative performance information, profitability data, manager histories, and other materials. I also accessed certain additional information from the Lipper and Morningstar databases and drew on my industry knowledge and experience.
To facilitate evaluating this considerable body of information, I prepared for each Fund a document summarizing the key data elements in each area as well as additional analytics discussed below. This made it possible to consider each key data element in the context of the others.
In the course of contract renewal, DeAM agreed to implement a number of fee and expense adjustments requested by the Independent Directors which will favorably impact future fees and expenses, and my evaluation includes the effects of these changes.
Fees and Expenses Compared with Other Funds
The competitive fee and expense evaluation for each fund focused on two primary comparisons:
The Fund's contractual management fee (the advisory fee plus the administration fee where applicable) compared with those of a group of typically 12-15 funds in the same Lipper investment category (e.g. Large Capitalization Growth) having similar distribution arrangements and being of similar size.
The Fund's total expenses compared with a broader universe of funds from the same Lipper investment category and having similar distribution arrangements.
These two comparisons provide a view of not only the level of the fee compared with funds of similar scale but also the total expense the Fund bears for all the services it receives, in comparison with the investment choices available in the Fund's investment category and distribution channel. The principal figure-of-merit used in these comparisons was the subject Fund's percentile ranking against peers.
DeAM's Fees for Similar Services to Others
DeAM provided management fee schedules for all of its US domiciled fund and non-fund investment management accounts in any of the investment categories where there is a DWS Fund. These similar products included the other DWS Funds, non-fund pooled accounts, institutional accounts and sub-advisory accounts. Using this information, I calculated for each Fund the fee that would be charged to each similar product, at the subject Fund's asset level.
Evaluating information regarding non-fund products is difficult because there are varying levels of services required for different types of accounts, with mutual funds generally requiring considerably more regulatory and administrative types of service as well as having more frequent cash flows than other types of accounts. Also, while mutual fund fees for similar fund products can be expected to be similar, there will be some differences due to different pricing conditions in different distribution channels (e.g. retail funds versus those used in variable insurance products), differences in underlying investment processes and other factors.
Costs and Profit Margins
DeAM provided a detailed profitability analysis for each Fund. After making some adjustments so that the presentation would be more comparable to the available industry figures, I reviewed profit margins from investment management alone, from investment management plus other fund services (excluding distribution) provided to the Funds by DeAM (principally shareholder services), and DeAM profits from all sources, including distribution. A later section comments on overall profitability.
Economies of Scale
Economies of scale — an expected decline in management cost per dollar of fund assets as fund assets grow — are very rarely quantified and documented because of inherent difficulties in collecting and analyzing relevant data. However, in virtually every investment category that I reviewed, larger funds tend to have lower fees and lower total expenses than smaller funds. To see how each DWS Fund compares with this industry observation, I reviewed:
The trend in Fund assets over the last five years and the accompanying trend in total expenses. This shows if the Fund has grown and, if so, whether total expense (management fees as well as other expenses) have declined as a percent of assets.
Whether the Fund has break-points in its management fee schedule, the extent of the fee reduction built into the schedule and the asset levels where the breaks take effect, and in the case of a sub-advised Fund how the Fund's break-points compare with those of the sub-advisory fee schedule.
How the Fund's contractual fee schedule compares with trends in the industry data. To accomplish this, I constructed a chart showing how actual latest-fiscal-year contractual fees of the Fund and of other similar funds relate to average fund assets, with the subject Fund's contractual fee schedule superimposed.
Quality of Service — Performance
The quality-of-service evaluation focused on investment performance, which is the principal result of the investment management service. Each Fund's performance was reviewed over the past 1, 3, 5 and 10 years, as applicable, and compared with that of other funds in the same investment category and with a suitable market index.
In addition, I calculated and reviewed risk-adjusted returns relative to an index of similar mutual funds' returns and a suitable market index. The risk-adjusted returns analysis provides a way of determining the extent to which the Fund's return comparisons are mainly the product of investment value-added (or lack thereof) or alternatively taking considerably more or less risk than is typical in its investment category.
I also received and considered the history of portfolio manager changes for each Fund, as this provided an important context for evaluating the performance results.
Complex-Level Considerations
While this evaluation was conducted mainly at the individual fund level, there are some issues relating to the reasonableness of fees that can alternatively be considered across the whole fund complex:
I reviewed DeAM's profitability analysis for all DWS Funds, with a view toward determining if the allocation procedures used were reasonable and how profit levels compared with public data for other investment managers.
I considered whether DeAM and affiliates receive any significant ancillary or "fall-out" benefits that should be considered in interpreting the direct profitability results. These would be situations where serving as the investment manager of the Funds is beneficial to another part of the Deutsche Bank organization.
I considered how aggregated DWS Fund expenses had varied over the years, by asset class and in the context of trends in asset levels.
I reviewed the structure of the DeAM organization, trends in staffing levels, and information on compensation of investment management and other professionals compared with industry data.
Findings
Based on the process and analysis discussed above, which included reviewing a wide range of information from management and external data sources and considering among other factors the fees DeAM charges other clients, the fees charged by other fund managers, DeAM's costs and profits associated with managing the Funds, economies of scale, possible fall-out benefits, and the nature and quality of services provided, in my opinion the management fees charged the DWS Funds are reasonable.
Thomas H. Mack
President, Thomas H. Mack & Co., Inc.
Board Members and Officers
The following table presents certain information regarding the Board Members and Officers of the fund as of November 30, 2011. Each Board Member's year of birth is set forth in parentheses after his or her name. Unless otherwise noted, (i) each Board Member has engaged in the principal occupation(s) noted in the table for at least the most recent five years, although not necessarily in the same capacity; and (ii) the address of each Independent Board Member is c/o Paul K. Freeman, Independent Chairman, DWS Funds, PO Box 101833, Denver, CO 80250-1833. Except as otherwise noted below, the term of office for each Board Member is until the election and qualification of a successor, or until such Board Member sooner dies, resigns, is removed or as otherwise provided in the governing documents of the fund. Because the fund does not hold an annual meeting of shareholders, each Board Member will hold office for an indeterminate period. The Board Members may also serve in similar capacities with other funds in the fund complex. The Length of Time Served represents the year in which the Board Member joined the Board of one or more DWS funds now overseen by the Board.
| Independent Board Members |
Name, Year of Birth, Position with the Fund and Length of Time Served1 | Business Experience and Directorships During the Past Five Years | Number of Funds in DWS Fund Complex Overseen |
Other Directorships Held by Board Member |
Paul K. Freeman (1950) Chairperson since 2009 Board Member since 1993 | Consultant, World Bank/Inter-American Development Bank; Executive and Governing Council of the Independent Directors Council (education committees); formerly: Project Leader, International Institute for Applied Systems Analysis (1998-2001); Chief Executive Officer, The Eric Group, Inc. (environmental insurance) (1986-1998) | 112 | — |
John W. Ballantine (1946) Board Member since 1999 | Retired; formerly, Executive Vice President and Chief Risk Management Officer, First Chicago NBD Corporation/The First National Bank of Chicago (1996-1998); Executive Vice President and Head of International Banking (1995-1996). Directorships: Chairman of the Board, Healthways, Inc. (provider of disease and care management services); Portland General Electric (utility company); Stockwell Capital Investments PLC (private equity); former Directorships: First Oak Brook Bancshares, Inc. and Oak Brook Bank; Prisma Energy International | 112 | — |
Henry P. Becton, Jr. (1943) Board Member since 1990 | Vice Chair and former President, WGBH Educational Foundation. Directorships: Association of Public Television Stations; Public Radio International; Public Radio Exchange (PRX); The PBS Foundation; former Directorships: Boston Museum of Science; American Public Television; Concord Academy; New England Aquarium; Mass. Corporation for Educational Telecommunications; Committee for Economic Development; Public Broadcasting Service | 112 | Lead Director, Becton Dickinson and Company2 (medical technology company); Lead Director, Belo Corporation2 (media company) |
Dawn-Marie Driscoll (1946) Board Member since 1987 | President, Driscoll Associates (consulting firm); Executive Fellow, Center for Business Ethics, Bentley University; formerly, Partner, Palmer & Dodge (1988-1990); Vice President of Corporate Affairs and General Counsel, Filene's (1978-1988). Directorships: Director of ICI Mutual Insurance Company (since 2007); Advisory Board, Center for Business Ethics, Bentley University; Trustee, Southwest Florida Community Foundation (charitable organization); former Directorships: Investment Company Institute (audit, executive, nominating committees) and Independent Directors Council (governance, executive committees) | 112 | Trustee, Sun Capital Advisers, Inc. (22 open-end mutual funds advised by Sun Capital Advisers, Inc.) (since 2007) |
Keith R. Fox, CFA (1954) Board Member since 1996 | Managing General Partner, Exeter Capital Partners (a series of private investment funds) (since 1986). Directorships: Progressive International Corporation (kitchen goods importer and distributor); BoxTop Media Inc. (advertising); The Kennel Shop (retailer); former Chairman, National Association of Small Business Investment Companies | 112 | Trustee, Sun Capital Advisers, Inc. (22 open-end mutual funds advised by Sun Capital Advisers, Inc.) (since 2011) |
Kenneth C. Froewiss (1945) Board Member since 2001 | Adjunct Professor of Finance, NYU Stern School of Business (September 2009-present; Clinical Professor from 1997-September 2009); Member, Finance Committee, Association for Asian Studies (2002-present); Director, Mitsui Sumitomo Insurance Group (US) (2004-present); prior thereto, Managing Director, J.P. Morgan (investment banking firm) (until 1996) | 112 | — |
Richard J. Herring (1946) Board Member since 1990 | Jacob Safra Professor of International Banking and Professor, Finance Department, The Wharton School, University of Pennsylvania (since July 1972); Co-Director, Wharton Financial Institutions Center (since July 2000); Co-Chair, U.S. Shadow Financial Regulatory Committee; Executive Director, Financial Economists Roundtable; formerly: Vice Dean and Director, Wharton Undergraduate Division (July 1995-June 2000); Director, Lauder Institute of International Management Studies (July 2000-June 2006) | 112 | Director, Japan Equity Fund, Inc. (since September 2007), Thai Capital Fund, Inc. (since September 2007), Singapore Fund, Inc. (since September 2007), Independent Director of Barclays Bank Delaware (since September 2010) |
William McClayton (1944) Board Member since 2004 | Private equity investor (since October 2009); previously, Managing Director, Diamond Management & Technology Consultants, Inc. (global consulting firm) (2001-2009); Directorship: Board of Managers, YMCA of Metropolitan Chicago; formerly: Senior Partner, Arthur Andersen LLP (accounting) (1966-2001); Trustee, Ravinia Festival | 112 | — |
Rebecca W. Rimel (1951) Board Member since 1995 | President and Chief Executive Officer, The Pew Charitable Trusts (charitable organization) (1994 to present); Trustee, Thomas Jefferson Foundation (charitable organization) (1994 to present); Trustee, Executive Committee, Philadelphia Chamber of Commerce (2001-2007); formerly: Executive Vice President, The Glenmede Trust Company (investment trust and wealth management) (1983-2004); Board Member, Investor Education (charitable organization) (2004-2005); Trustee, Pro Publica (charitable organization) (2007-2010) | 112 | Director, CardioNet, Inc. (health care) (2009- present); Director, Viasys Health Care2 (January 2007- June 2007) |
William N. Searcy, Jr. (1946) Board Member since 1993 | Private investor since October 2003; formerly: Pension & Savings Trust Officer, Sprint Corporation2 (telecommunications) (November 1989-September 2003) | 112 | Trustee, Sun Capital Advisers, Inc. (22 open-end mutual funds advised by Sun Capital Advisers, Inc.) (since 1998) |
Jean Gleason Stromberg (1943) Board Member since 1997 | Retired. Formerly, Consultant (1997-2001); Director, Financial Markets US Government Accountability Office (1996-1997); Partner, Fulbright & Jaworski, L.L.P. (law firm) (1978-1996). Directorships: The William and Flora Hewlett Foundation; former Directorships: Service Source, Inc., Mutual Fund Directors Forum (2002-2004), American Bar Retirement Association (funding vehicle for retirement plans) (1987-1990 and 1994-1996) | 112 | — |
Robert H. Wadsworth (1940) Board Member since 1999 | President, Robert H. Wadsworth & Associates, Inc. (consulting firm) (1983 to present); Director, The Phoenix Boys Choir Association | 115 | — |
Officers4 |
Name, Year of Birth, Position with the Fund and Length of Time Served5 | Principal Occupation(s) During Past 5 Years and Other Directorships Held |
W. Douglas Beck, CFA6 (1967) President, 2011-present | Managing Director3, Deutsche Asset Management (2006-present); President of DWS family of funds and Head of Product Management, U.S. for DWS Investments; formerly, Executive Director, Head of Product Management (2002-2006) and President (2005-2006) of the UBS Funds at UBS Global Asset Management; Co-Head of Manager Research/Managed Solutions Group, Merrill Lynch (1998-2002) |
John Millette7 (1962) Vice President and Secretary, 1999-present | Director3, Deutsche Asset Management |
Paul H. Schubert6 (1963) Chief Financial Officer, 2004-present Treasurer, 2005-present | Managing Director3, Deutsche Asset Management (since July 2004); formerly, Executive Director, Head of Mutual Fund Services and Treasurer for UBS Family of Funds (1998-2004); Vice President and Director of Mutual Fund Finance at UBS Global Asset Management (1994-1998) |
Caroline Pearson7 (1962) Chief Legal Officer, 2010-present | Managing Director3, Deutsche Asset Management; formerly, Assistant Secretary for DWS family of funds (1997-2010) |
Rita Rubin6 (1970) Assistant Secretary, 2009-present | Director3 and Senior Counsel, Deutsche Asset Management (since October 2007); formerly, Vice President, Morgan Stanley Investment Management (2004-2007) |
Paul Antosca7 (1957) Assistant Treasurer, 2007-present | Director3, Deutsche Asset Management (since 2006); Vice President, The Manufacturers Life Insurance Company (U.S.A.) (1990-2006) |
Jack Clark7 (1967) Assistant Treasurer, 2007-present | Director3, Deutsche Asset Management (since 2007); formerly, Vice President, State Street Corporation (2002-2007) |
Diane Kenneally7 (1966) Assistant Treasurer, 2007-present | Director3, Deutsche Asset Management |
John Caruso6 (1965) Anti-Money Laundering Compliance Officer, 2010-present | Managing Director3, Deutsche Asset Management |
Robert Kloby6 (1962) Chief Compliance Officer, 2006-present | Managing Director3, Deutsche Asset Management |
1 The length of time served represents the year in which the Board Member joined the board of one or more DWS funds currently overseen by the Board.
2 A publicly held company with securities registered pursuant to Section 12 of the Securities Exchange Act of 1934.
3 Executive title, not a board directorship.
4 As a result of their respective positions held with the Advisor, these individuals are considered "interested persons" of the Advisor within the meaning of the 1940 Act. Interested persons receive no compensation from the fund.
5 The length of time served represents the year in which the officer was first elected in such capacity for one or more DWS funds.
6 Address: 60 Wall Street, New York, NY 10005.
7 Address: One Beacon Street, Boston, MA 02108.
The fund's Statement of Additional Information ("SAI") includes additional information about the Board Members. The SAI is available, without charge, upon request. If you would like to request a copy of the SAI, you may do so by calling the following toll-free number: (800) 621-1048.
Account Management Resources | |
| For More Information | | The automated telephone system allows you to access personalized account information and obtain information on other DWS funds using either your voice or your telephone keypad. Certain account types within Classes A, B, C and S also have the ability to purchase, exchange or redeem shares using this system. For more information, contact your financial advisor. You may also access our automated telephone system or speak with a DWS Investments representative by calling the appropriate number below: For shareholders of Classes A, B, C and Institutional Class: (800) 621-1048 For shareholders of Class S: (800) 728-3337 |
| Web Site | | www.dws-investments.com View your account transactions and balances, trade shares, monitor your asset allocation, and change your address, 24 hours a day. Obtain prospectuses and applications, blank forms, interactive worksheets, news about DWS funds, subscription to fund updates by e-mail, retirement planning information, and more. |
| Written Correspondence | | DWS Investments PO Box 219151 Kansas City, MO 64121-9151 |
| Proxy Voting | | The fund's policies and procedures for voting proxies for portfolio securities and information about how the fund voted proxies related to its portfolio securities during the 12-month period ended June 30 are available on our Web site — www.dws-investments.com (click on "proxy voting"at the bottom of the page) — or on the SEC's Web site — www.sec.gov. To obtain a written copy of the fund's policies and procedures without charge, upon request, call us toll free at (800) 621-1048. |
| Principal Underwriter | | If you have questions, comments or complaints, contact: DWS Investments Distributors, Inc. 222 South Riverside Plaza Chicago, IL 60606-5808 (800) 621-1148 |
| Investment Advisor | | Deutsche Investment Management Americas Inc. ("DIMA" or the "Advisor"), which is part of Deutsche Asset Management, is the investment advisor for the fund. DIMA and its predecessors have more than 80 years of experience managing mutual funds and DIMA provides a full range of investment advisory services to both institutional and retail clients. DIMA is an indirect, wholly owned subsidiary of Deutsche Bank AG. Deutsche Bank AG is a major global banking institution engaged in a wide variety of financial services, including investment management, retail, private and commercial banking, investment banking and insurance. DWS Investments is the retail brand name in the U.S. for the asset management activities of Deutsche Bank AG and DIMA. As such, DWS is committed to delivering the investing expertise, insight and resources of this global investment platform to American investors. |
| | | Class A | Class B | Class C | Class S | Institutional Class |
| Nasdaq Symbol | | KDSAX | KDSBX | KDSCX | KDSSX | KDSIX |
| CUSIP Number | | 23338F-820 | 23338F-812 | 23338F-796 | 23338F-762 | 23338F-754 |
| Fund Number | | 088 | 288 | 388 | 2389 | 545 |
Notes
Notes
Notes
Notes
Notes
Notes
Pursuant to the requirements of the Securities Exchange Act of 1934 and the Investment Company Act of 1940, the registrant has duly caused this report to be signed on its behalf by the undersigned, thereunto duly authorized.
Pursuant to the requirements of the Securities Exchange Act of 1934 and the Investment Company Act of 1940, this report has been signed below by the following persons on behalf of the registrant and in the capacities and on the dates indicated.