WASHINGTON, D. C. 20549
DWS Value Series, Inc.
NOVEMBER 30, 2012 Annual Report to Shareholders |
| |
| DWS Dreman Mid Cap Value Fund |
|
Contents
4 Portfolio Management Review 17 Statement of Assets and Liabilities 19 Statement of Operations 20 Statement of Changes in Net Assets 27 Notes to Financial Statements 37 Report of Independent Registered Public Accounting Firm 38 Information About Your Fund's Expenses 40 Investment Management Agreement Approval 45 Summary of Management Fee Evaluation by Independent Fee Consultant 49 Board Members and Officers 54 Account Management Resources |
This report must be preceded or accompanied by a prospectus. To obtain a summary prospectus, if available, or prospectus for any of our funds, refer to the Account Management Resources information provided in the back of this booklet. We advise you to consider the fund's objectives, risks, charges and expenses carefully before investing. The summary prospectus and prospectus contain this and other important information about the fund. Please read the prospectus carefully before you invest.
Any fund that focuses in a particular segment of the market will generally be more volatile than a fund that invests more broadly. Stocks of medium-sized companies involve greater risk than securities of larger, more-established companies. The fund may lend securities to approved institutions. Stocks may decline in value. See the prospectus for details.
DWS Investments is part of the Asset & Wealth Management division of Deutsche Bank AG.
NOT FDIC/NCUA INSURED NO BANK GUARANTEE MAY LOSE VALUE NOT A DEPOSIT NOT INSURED BY ANY FEDERAL GOVERNMENT AGENCY
Portfolio Management Review (Unaudited)
Market Overview and Fund Performance
All performance information below is historical and does not guarantee future results. Returns shown are for Class A shares, unadjusted for sales charges. Investment return and principal fluctuate, so your shares may be worth more or less when redeemed. Current performance may differ from performance data shown. Please visit www.dws-investments.com for the most recent month-end performance of all share classes. Fund performance includes reinvestment of all distributions. Unadjusted returns do not reflect sales charges and would have been lower if they had. Please refer to pages 10 through 12 for more complete performance information.
DWS Dreman Mid Cap Value Fund returned 13.34% during the 12-month period ended November 30, 2012. The fund's benchmark, the Russell Midcap® Value Index, returned 16.90%.
Management Process We begin by screening stocks of mid-cap companies with below-market price-to-earnings (P/E) ratios. Next, we compare the company's stock price to such measures as book value, cash flow and yield, and analyze individual companies to identify those that are fundamentally sound and appear to have strong potential for earnings and dividend growth over the index. We then assemble the fund's portfolio from among the most attractive stocks, drawing, in addition, on an analysis of economic outlooks for various industries. |
Mid-cap equities performed very well during the past 12 months. The U.S. stock market benefited from an environment of slow, but steady, economic growth, healthy corporate earnings and the improving housing market. In addition, investor sentiment was buoyed by Federal Reserve Chairman Ben Bernanke's announcement that the U.S. Federal Reserve Board (the Fed) would provide aggressive economic stimulus and maintain its near-zero interest rate policy through 2015. Although mid caps delivered an uneven performance during the period — with sell-offs in April to May 2012 and again in the autumn — the asset class nonetheless finished the period with a healthy, double-digit gain.
Performance Attribution
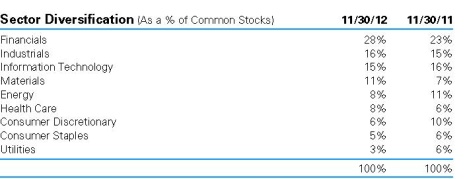
During the past 12 months ended November 30, 2012, both our stock selection and our sector allocations detracted slightly from performance. The largest negative impact came from our stock picks in the consumer discretionary sector, but we also lost some ground through stock selection in industrials and an overweight position in information technology. On the plus side, we added value through stock selection and an underweight in the utilities sector, as well as our underweight in materials and overweight in consumer staples.
In terms of individual stocks, the largest contribution came from our position in the Canadian oil producer Nexen, Inc., which was bid for by the Chinese company CNOOC Ltd. We sold the position soon after the bid was announced in order to book profits. Our weighting in energy also benefited from the strong performance of the oil refiner Valero Energy Corp., which delivered excellent returns on the strength of the rising gap between its primary input cost (crude oil) and its major outputs (unleaded gasoline, diesel fuel, etc). Outside of energy, our performance was helped by the rally in Dean Foods Co.,* which we held through its downturn in 2011 on the belief that its scale and premium brands would help it overcome short-term competitive pressures. Other top contributors were Whirlpool Corp.,* which gained ground behind its strong international sales, and Allstate Corp., which capitalized on an improved pricing environment.
* Not held in the portfolio as of November 30, 2012.
The fund's largest detractor was Best Buy Co., Inc., which suffered as rising competition and a lower-margin product mix is having a significant impact on its bottom line. We continue to hold a small position in the electronics retailer, but we have not added on weakness. Our position in Ultra Petroleum Corp., which was hurt by falling natural gas prices, also took a bite out of our return. We continue to hold the stock on the belief that its market value doesn't reflect the full value of the company's underlying assets, and that its strong balance sheet will enable it to emerge as a survivor. Our holdings in Arch Coal, Inc. and Chesapeake Energy Corp. also were hurt by the falling price of natural gas. We sold our position in Arch Coal, but we continue to hold a small position in Chesapeake. Outside of energy, shares of Lexmark International, Inc. were hit by the growing preference among corporations for a "paperless environment," and we elected to eliminate the stock from the portfolio.
We remain optimistic on the overall outlook for mid-cap stocks because the Fed's pledge to provide open-ended, unlimited stimulus to the economy is likely to cushion any significant downturn in stock prices. It's important to keep in mind that the stock market has surged off of its 2008 lows even as $400 billion in cash has moved out of equity funds and into bond funds. If this trend were to reverse or even stabilize — an outcome that becomes more likely given the current Fed policy — it could provide further energy for the rally in stock prices to continue.
This would be a positive for mid-cap stocks, since — while not as low as they were in 2008, or even one year ago — they are still attractive at these levels. We believe that once investors move past the various uncertainties that currently overhang the market, such as the debt crisis in Europe, the U.S. elections and the possible impact of the fiscal cliff, the compelling valuations in the mid-cap space should begin to receive more attention.
With this as background, we continue to like the materials sector as a source of compelling investment ideas. The materials segment is rich with companies whose market capitalization is less than their assets, a type of value opportunity typically referred to as an "asset play." In general, we believe materials stocks continue to offer favorable prospects at a time of positive global growth and the possibility of revived investor concerns about inflation.
| "We believe the portfolio's underlying characteristics remain very attractive in terms of both fundamentals and valuations." |
We also continue to like the banking sector, which is benefiting from improving home sales and rising loan growth. The improvement is occurring at a faster rate in some regions than others, however, so we are maintaining a focus on owning only those banks that have a favorable geographic footprint. We are less enthusiastic on real estate investment trusts (REITs) and we are maintaining a large underweight in the sector.
Ten Largest Equity Holdings at November 30, 2012 (18.3% of Net Assets) |
1. Yamana Gold, Inc. An intermediate gold producer with production, development stage and exploration properties | 1.9% |
2. Fifth Third Bancorp. Provider of retail and commercial banking services | 1.9% |
3. SunTrust Banks, Inc. Bank holding company | 1.9% |
4. Ameriprise Financial, Inc. A financial planning and services firm | 1.9% |
5. Huntsman Corp. Manufactures differentiated and commodity chemical products | 1.8% |
6. Lincoln National Corp. Owns and operates wealth accumulation and protection businesses | 1.8% |
7. Energizer Holdings, Inc. Manufacturer of dry cell batteries and flashlights | 1.8% |
8. Eaton Corp. Manufactures engineered products that serve industrial, vehicle, construction, commercial and aerospace markets | 1.8% |
9. Hartford Financial Services Group, Inc. Provides a range of insurance products | 1.8% |
10. Symantec Corp. Producer of software products | 1.7% |
Portfolio holdings and characteristics are subject to change. For more complete details about the fund's investment portfolio, see page 13. A quarterly Fact Sheet is available on www.dws-investments.com or upon request. Please see the Account Management Resources section on page 54 for contact information. |
The fund remains overweight in the industrials sector, but we have been gradually trimming our position. Industrials are more exposed to global growth trends than most market segments, and economic trends outside of the United States have been much weaker than they have been here at home. At the same time, we have begun to look more closely at the energy sector for opportunities, where valuations have begun to look increasingly attractive.
We believe the portfolio's underlying characteristics remain very attractive in terms of both fundamentals and valuations. The price-to-earnings (P/E) ratio of the stocks in the fund is 10.4 times forward 12-month earnings estimates, compared with 13.8 for the stocks in the Russell 2000® Midcap Index. This sort of disparity is typical for the fund, as we are always working to trim our winning positions and reseed the fund with new, undervalued stocks, thereby maintaining a portfolio that compares favorably with the index.
Investment Advisor
Deutsche Investment Management Americas Inc.
Subadvisor
The fund's subadvisor is Dreman Value Management, L.L.C., a renowned investment firm with a 35-year history of style-pure value investing.
Portfolio Management Team
Mark Roach, Managing Director of Dreman Value Management, L.L.C.
Lead Portfolio Manager of the fund. Joined the fund in 2006.
• Joined Dreman Value Management, L.L.C. in 2006.
• Prior to that, Portfolio Manager at Vaughan Nelson Investment Management since 2002.
• Over 19 years of investment industry experience.
• BS, Baldwin Wallace College; MBA, University of Chicago.
David N. Dreman, Chairman of Dreman Value Management, L.L.C.
Portfolio Manager of the fund. Joined the fund in 2005.
• Began investment career in 1957.
• Founder, Dreman Value Management, L.L.C.
E. Clifton Hoover, Jr., CFA, Chief Investment Officer and Managing Director of Dreman Value Management, L.L.C.
Portfolio Manager of the fund. Joined the fund in 2009.
• Joined Dreman Value Management, L.L.C. in 2006.
• Prior to joining Dreman Value Management, L.L.C., Managing Director and a Portfolio Manager at NFJ Investment Group since 1997.
• Over 26 years of investment industry experience.
• MS, Texas Tech University.
Mario Tufano
Associate Portfolio Manager of the fund. Joined the fund in 2010.
• Joined Dreman Value Management, L.L.C. in 2007.
• Prior to that, Associate Director and Equity Analyst at UBS Investment Bank.
• Over 9 years of investment industry experience.
The views expressed reflect those of the portfolio management team only through the end of the period of the report as stated on the cover. The management team's views are subject to change at any time based on market and other conditions and should not be construed as a recommendation. Past performance is no guarantee of future results. Current and future portfolio holdings are subject to risk.
Terms to Know
The Russell Midcap Value Index tracks the performance of those Russell Midcap Index companies with lower price-to-book ratios and lower forecasted growth values. Index and category returns assume reinvestment of all distributions. Index returns do not reflect fees or expenses and it is not possible to invest directly in an index.
The price-to-earnings (P/E) ratio is a formula that compares a company's current share price with its per-share earnings.
The consumer discretionary sector consists of companies that provide nonessential goods and services. Some examples of companies in this sector include retailers, apparel companies and automobile companies.
The consumer staples sector represents essential goods and services such as the food, beverage and prescription industries.
Contribution incorporates both a stock's total return and its weighting in the fund.
Return on equity is the amount of net income returned as a percentage of shareholders' equity.
Overweight means the fund holds a higher weighting in a given sector or security than the benchmark. Underweight means the fund holds a lower weighting.
Performance Summary November 30, 2012 (Unaudited) Average Annual Total Returns as of 11/30/12 |
| Unadjusted for Sales Charge | 1-Year | 3-Year | 5-Year | Life of Fund* |
| Class A | 13.34% | 10.30% | 1.09% | 4.27% |
| Class B | 12.44% | 9.40% | 0.34% | 3.53% |
| Class C | 12.42% | 9.44% | 0.36% | 3.53% |
Russell Midcap® Value Index† | 16.90% | 14.34% | 3.02% | 4.87% |
| Adjusted for the Maximum Sales Charge | | | | |
Class A (max 5.75% load) | 6.83% | 8.15% | -0.10% | 3.43% |
Class B (max 4.00% CDSC) | 9.44% | 8.84% | 0.15% | 3.53% |
Class C (max 1.00% CDSC) | 12.42% | 9.44% | 0.36% | 3.53% |
Russell Midcap® Value Index† | 16.90% | 14.34% | 3.02% | 4.87% |
| No Sales Charges | | | | |
| Class R | 13.08% | 10.03% | 0.81% | 3.97% |
| Class S | 13.56% | 10.53% | 1.38% | 4.61% |
| Institutional Class | 13.67% | 10.62% | 1.44% | 4.69% |
Russell Midcap® Value Index† | 16.90% | 14.34% | 3.02% | 4.87% |
* The Fund commenced operations on August 2, 2005. The performance shown for the index is for the time period of July 31, 2005 through November 30, 2012, which is based on the performance period of the life of the Fund.
Performance in the Average Annual Total Returns table(s) above and the Growth of an Assumed $10,000 Investment line graph that follows is historical and does not guarantee future results. Investment return and principal fluctuate, so your shares may be worth more or less when redeemed. Current performance may differ from performance data shown. Please visit www.dws-investments.com for the Fund's most recent month-end performance. Fund performance includes reinvestment of all distributions. Unadjusted returns do not reflect sales charges and would have been lower if they had.
The gross expense ratios of the Fund, as stated in the fee table of the prospectus dated March 1, 2012 are 1.43%, 2.26%, 2.16%, 6.35%, 1.19% and 1.10% for Class A, Class B, Class C, Class R, Class S and Institutional Class shares, respectively, and may differ from the expense ratios disclosed in the Financial Highlights tables in this report.
Index returns do not reflect any fees or expenses and it is not possible to invest directly into an index.
Performance figures do not reflect the deduction of taxes that a shareholder would pay on fund distributions or the redemption of fund shares.
The returns for Class R shares for periods prior to inception on March 1, 2011 are derived from the historical performance of Class A shares of DWS Dreman Mid Cap Value Fund during such periods and have been adjusted to reflect higher total annual operating expenses of Class R. Any difference in expenses will affect performance.
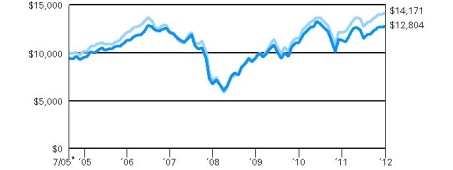
Growth of an Assumed $10,000 Investment (Adjusted for Maximum Sales Charge) |
|
|
| Yearly periods ended November 30 |
The Fund's growth of an assumed $10,000 investment is adjusted for the maximum sales charge of 5.75%. This results in a net initial investment of $9,425.
The growth of $10,000 is cumulative.
Performance of other share classes will vary based on the sales charges and the fee structure of those classes.
* The Fund commenced operations on August 2, 2005. The performance shown for the index is for the time period of July 31, 2005 through November 30, 2012, which is based on the performance period of the life of the Fund.
† Russell Midcap Value Index is an unmanaged index measuring the performance of those Russell Midcap companies with lower price-to-book ratios and lower forecasted growth values.
| Net Asset Value and Distribution Information | |
| | | Class A | | | Class B | | | Class C | | | Class R | | | Class S | | | Institutional Class | |
Net Asset Value: 11/30/12 | | $ | 11.87 | | | $ | 11.78 | | | $ | 11.77 | | | $ | 11.87 | | | $ | 11.87 | | | $ | 11.89 | |
| 11/30/11 | | $ | 10.56 | | | $ | 10.48 | | | $ | 10.48 | | | $ | 10.55 | | | $ | 10.57 | | | $ | 10.59 | |
Distribution Information: Twelve Months as of 11/30/12: Income Dividends | | $ | .08 | | | $ | .003 | | | $ | .01 | | | $ | .05 | | | $ | .11 | | | $ | .12 | |
Morningstar Rankings — Mid-Cap Value Funds Category as of 11/30/12 |
| Period | Rank | | Number of Fund Classes Tracked | Percentile Ranking (%) |
Class A 1-Year | 253 | of | 400 | 63 |
| 3-Year | 263 | of | 347 | 75 |
| 5-Year | 208 | of | 296 | 70 |
Class B 1-Year | 294 | of | 400 | 73 |
| 3-Year | 289 | of | 347 | 83 |
| 5-Year | 232 | of | 296 | 78 |
Class C 1-Year | 298 | of | 400 | 74 |
| 3-Year | 287 | of | 347 | 82 |
| 5-Year | 231 | of | 296 | 78 |
Class R 1-Year | 266 | of | 400 | 66 |
Class S 1-Year | 239 | of | 400 | 60 |
| 3-Year | 254 | of | 347 | 73 |
| 5-Year | 188 | of | 296 | 63 |
Institutional Class 1-Year | 232 | of | 400 | 58 |
| 3-Year | 248 | of | 347 | 71 |
| 5-Year | 186 | of | 296 | 63 |
Source: Morningstar, Inc. Rankings are historical and do not guarantee future results. Rankings are based on total return unadjusted for sales charges with distributions reinvested. If sales charges had been included, rankings might have been less favorable.
Investment Portfolio as of November 30, 2012 | | | Shares | | | Value ($) | |
| | | | |
| Common Stocks 98.8% | |
| Consumer Discretionary 5.3% | |
| Auto Components 1.7% | |
| Lear Corp. | | | 76,830 | | | | 3,355,166 | |
| Hotels, Restaurants & Leisure 1.4% | |
| Darden Restaurants, Inc. (a) | | | 55,120 | | | | 2,914,745 | |
| Specialty Retail 2.2% | |
| Best Buy Co., Inc. (a) | | | 99,035 | | | | 1,298,349 | |
| Staples, Inc. (a) | | | 260,930 | | | | 3,052,881 | |
| | | | | | | | 4,351,230 | |
| Consumer Staples 4.6% | |
| Beverages 1.4% | |
| Molson Coors Brewing Co. "B" (a) | | | 67,840 | | | | 2,812,646 | |
| Household Products 1.8% | |
| Energizer Holdings, Inc. (a) | | | 44,810 | | | | 3,574,046 | |
| Tobacco 1.4% | |
| Lorillard, Inc. (a) | | | 23,150 | | | | 2,804,854 | |
| Energy 8.2% | |
| Energy Equipment & Services 1.6% | |
| Ensco PLC "A" (a) | | | 55,240 | | | | 3,216,625 | |
| Oil, Gas & Consumable Fuels 6.6% | |
| Chesapeake Energy Corp. (a) | | | 135,662 | | | | 2,310,324 | |
| Marathon Oil Corp. (a) | | | 110,230 | | | | 3,400,596 | |
| Murphy Oil Corp. | | | 54,230 | | | | 3,077,010 | |
| Ultra Petroleum Corp.* (a) | | | 73,896 | | | | 1,481,615 | |
| Valero Energy Corp. (a) | | | 95,170 | | | | 3,070,184 | |
| | | | | | | | 13,339,729 | |
| Financials 27.6% | |
| Capital Markets 3.5% | |
| Ameriprise Financial, Inc. | | | 61,840 | | | | 3,751,832 | |
| Invesco Ltd. | | | 128,920 | | | | 3,221,711 | |
| | | | | | | | 6,973,543 | |
| Commercial Banks 6.7% | |
| Comerica, Inc. (a) | | | 92,920 | | | | 2,749,503 | |
| Fifth Third Bancorp. (a) | | | 263,970 | | | | 3,864,521 | |
| KeyCorp (a) | | | 370,720 | | | | 2,995,418 | |
| SunTrust Banks, Inc. (a) | | | 141,930 | | | | 3,853,399 | |
| | | | | | | | 13,462,841 | |
| Diversified Financial Services 1.5% | |
| The NASDAQ OMX Group, Inc. (a) | | | 127,360 | | | | 3,085,933 | |
| Insurance 10.0% | |
| Allstate Corp. (a) | | | 83,070 | | | | 3,362,674 | |
| Axis Capital Holdings Ltd. | | | 90,850 | | | | 3,267,874 | |
| Hartford Financial Services Group, Inc. (a) | | | 166,749 | | | | 3,531,744 | |
| Lincoln National Corp. (a) | | | 145,440 | | | | 3,592,368 | |
| PartnerRe Ltd. (a) | | | 39,461 | | | | 3,270,528 | |
| Unum Group (a) | | | 148,070 | | | | 3,019,147 | |
| | | | | | | | 20,044,335 | |
| Real Estate Investment Trusts 5.9% | |
| Duke Realty Corp. (REIT) | | | 221,014 | | | | 2,983,689 | |
| Hospitality Properties Trust (REIT) (a) | | | 123,710 | | | | 2,808,217 | |
| Mack-Cali Realty Corp. (REIT) (a) | | | 116,720 | | | | 2,950,681 | |
| Senior Housing Properties Trust (REIT) | | | 141,905 | | | | 3,171,577 | |
| | | | | | | | 11,914,164 | |
| Health Care 7.9% | |
| Health Care Equipment & Supplies 3.0% | |
| St. Jude Medical, Inc. (a) | | | 76,360 | | | | 2,617,621 | |
| Zimmer Holdings, Inc. (a) | | | 49,870 | | | | 3,289,924 | |
| | | | | | | | 5,907,545 | |
| Health Care Providers & Services 3.4% | |
| Cardinal Health, Inc. | | | 82,580 | | | | 3,340,361 | |
| CIGNA Corp. (a) | | | 65,980 | | | | 3,448,774 | |
| | | | | | | | 6,789,135 | |
| Life Sciences Tools & Services 1.5% | |
| Agilent Technologies, Inc. | | | 79,900 | | | | 3,059,371 | |
| Industrials 16.1% | |
| Aerospace & Defense 1.6% | |
| L-3 Communications Holdings, Inc. (a) | | | 41,430 | | | | 3,183,896 | |
| Commercial Services & Supplies 1.5% | |
| Waste Management, Inc. (a) | | | 89,970 | | | | 2,930,323 | |
| Construction & Engineering 1.4% | |
| URS Corp. (a) | | | 75,190 | | | | 2,833,159 | |
| Electrical Equipment 3.1% | |
| General Cable Corp.* | | | 93,121 | | | | 2,673,504 | |
| Eaton Corp. (a) | | | 68,390 | | | | 3,567,222 | |
| | | | | | | | 6,240,726 | |
| Machinery 5.5% | |
| Crane Co. | | | 78,340 | | | | 3,324,750 | |
| Ingersoll-Rand PLC (a) | | | 66,300 | | | | 3,234,114 | |
| Joy Global, Inc. (a) | | | 26,620 | | | | 1,517,074 | |
| Oshkosh Corp.* (a) | | | 102,810 | | | | 3,017,473 | |
| | | | | | | | 11,093,411 | |
| Road & Rail 3.0% | |
| Norfolk Southern Corp. | | | 50,210 | | | | 3,031,680 | |
| Ryder System, Inc. | | | 64,400 | | | | 3,031,308 | |
| | | | | | | | 6,062,988 | |
| Information Technology 15.0% | |
| Communications Equipment 1.6% | |
| Harris Corp. | | | 67,510 | | | | 3,181,746 | |
| Computers & Peripherals 1.6% | |
| NCR Corp.* | | | 128,824 | | | | 3,082,759 | |
| Electronic Equipment, Instruments & Components 1.3% | |
| Arrow Electronics, Inc.* (a) | | | 71,310 | | | | 2,657,011 | |
| IT Services 2.2% | |
| Computer Sciences Corp. (a) | | | 61,510 | | | | 2,341,070 | |
| Western Union Co. | | | 165,260 | | | | 2,083,929 | |
| | | | | | | | 4,424,999 | |
| Semiconductors & Semiconductor Equipment 3.7% | |
| Applied Materials, Inc. | | | 245,650 | | | | 2,635,825 | |
| KLA-Tencor Corp. | | | 61,450 | | | | 2,794,131 | |
| Marvell Technology Group Ltd. | | | 237,940 | | | | 2,017,731 | |
| | | | | | | | 7,447,687 | |
| Software 4.6% | |
| CA, Inc. | | | 111,850 | | | | 2,478,596 | |
| Symantec Corp.* | | | 187,431 | | | | 3,516,205 | |
| Synopsys, Inc.* | | | 99,012 | | | | 3,247,594 | |
| | | | | | | | 9,242,395 | |
| Materials 11.2% | |
| Chemicals 3.4% | |
| Agrium, Inc. | | | 30,798 | | | | 3,142,012 | |
| Huntsman Corp. | | | 222,980 | | | | 3,665,791 | |
| | | | | | | | 6,807,803 | |
| Containers & Packaging 3.0% | |
| Owens-Illinois, Inc.* (a) | | | 158,090 | | | | 3,166,543 | |
| Rock-Tenn Co. "A" (a) | | | 44,910 | | | | 2,920,946 | |
| | | | | | | | 6,087,489 | |
| Metals & Mining 4.8% | |
| Kinross Gold Corp. | | | 288,700 | | | | 2,910,096 | |
| Nucor Corp. (a) | | | 65,980 | | | | 2,717,057 | |
| Yamana Gold, Inc. | | | 207,910 | | | | 3,908,708 | |
| | | | | | | | 9,535,861 | |
| Utilities 2.9% | |
| Electric Utilities | |
| American Electric Power Co., Inc. (a) | | | 66,750 | | | | 2,846,887 | |
| PPL Corp. (a) | | | 104,405 | | | | 3,064,287 | |
| | | | | | | | 5,911,174 | |
Total Common Stocks (Cost $183,293,717) | | | | 198,329,335 | |
| Securities Lending Collateral 36.4% | |
| Daily Assets Fund Institutional, 0.19% (b) (c) (Cost $73,082,910) | | | 73,082,910 | | | | 73,082,910 | |
| | |
| Cash Equivalents 1.1% | |
| Central Cash Management Fund, 0.17% (b) (Cost $2,267,437) | | | 2,267,437 | | | | 2,267,437 | |
| | | % of Net Assets | | | Value ($) | |
| | | | |
Total Investment Portfolio (Cost $258,644,064)† | | | 136.3 | | | | 273,679,682 | |
| Other Assets and Liabilities, Net | | | (36.3 | ) | | | (72,894,491 | ) |
| Net Assets | | | 100.0 | | | | 200,785,191 | |
* Non-income producing security.
† The cost for federal income tax purposes was $258,711,537. At November 30, 2012, net unrealized appreciation for all securities based on tax cost was $14,968,145. This consisted of aggregate gross unrealized appreciation for all securities in which there was an excess of value over tax cost of $27,961,137 and aggregate gross unrealized depreciation for all securities in which there was an excess of tax cost over value of $12,992,992.
(a) All or a portion of these securities were on loan (see Notes to Financial Statements). The value of all securities loaned at November 30, 2012 amounted to $71,466,113, which is 35.6% of net assets.
(b) Affiliated fund managed by Deutsche Investment Management Americas Inc. The rate shown is the annualized seven-day yield at period end.
(c) Represents collateral held in connection with securities lending. Income earned by the Fund is net of borrower rebates.
REIT: Real Estate Investment Trust
Fair Value Measurements
Various inputs are used in determining the value of the Fund's investments. These inputs are summarized in three broad levels. Level 1 includes quoted prices in active markets for identical securities. Level 2 includes other significant observable inputs (including quoted prices for similar securities, interest rates, prepayment speeds and credit risk). Level 3 includes significant unobservable inputs (including the Fund's own assumptions in determining the fair value of investments). The inputs or methodology used for valuing securities are not necessarily an indication of the risk associated with investing in those securities.
The following is a summary of the inputs used as of November 30, 2012 in valuing the Fund's investments. For information on the Fund's policy regarding the valuation of investments, please refer to the Security Valuation section of Note A in the accompanying Notes to Financial Statements.
| Assets | | Level 1 | | | Level 2 | | | Level 3 | | | Total | |
| | |
| Common Stocks (d) | | $ | 198,329,335 | | | $ | — | | | $ | — | | | $ | 198,329,335 | |
| Short-Term Investments (d) | | | 75,350,347 | | | | — | | | | — | | | | 75,350,347 | |
| Total | | $ | 273,679,682 | | | $ | — | | | $ | — | | | $ | 273,679,682 | |
There have been no transfers between fair value measurement levels during the period ended November 30, 2012.
(d) See Investment Portfolio for additional detailed categorizations.
The accompanying notes are an integral part of the financial statements.
Statement of Assets and Liabilities | as of November 30, 2012 | |
| Assets | |
Investments: Investments in non-affiliated securities, at value (cost $183,293,717) — including $71,466,113 of securities loaned | | $ | 198,329,335 | |
| Investment in Daily Assets Fund Institutional (cost $73,082,910)* | | | 73,082,910 | |
| Investment in Central Cash Management Fund (cost $2,267,437) | | | 2,267,437 | |
| Total investments in securities, at value (cost $258,644,064) | | | 273,679,682 | |
| Cash | | | 10,000 | |
| Receivable for Fund shares sold | | | 179,113 | |
| Dividends receivable | | | 606,727 | |
| Interest receivable | | | 4,071 | |
| Due from Advisor | | | 1,456 | |
| Other assets | | | 23,517 | |
| Total assets | | | 274,504,566 | |
| Liabilities | |
| Payable upon return of securities loaned | | | 73,082,910 | |
| Payable for Fund shares redeemed | | | 381,166 | |
| Accrued management fee | | | 123,780 | |
| Accrued Directors' fees | | | 2,148 | |
| Other accrued expenses and payables | | | 129,371 | |
| Total liabilities | | | 73,719,375 | |
| Net assets, at value | | $ | 200,785,191 | |
| Net Assets Consist of | |
| Undistributed net investment income | | | 2,257,529 | |
| Net unrealized appreciation (depreciation) on investments | | | 15,035,618 | |
| Accumulated net realized gain (loss) | | | (55,562,109 | ) |
| Paid-in capital | | | 239,054,153 | |
| Net assets, at value | | $ | 200,785,191 | |
* Represents collateral on securities loaned.
The accompanying notes are an integral part of the financial statements.
Statement of Assets and Liabilities as of November 30, 2012 (continued) | |
| Net Asset Value | |
Class A Net Asset Value and redemption price per share ($38,206,003 ÷ 3,219,291 shares of capital stock outstanding, $.01 par value, 75,000,000 shares authorized) | | $ | 11.87 | |
| Maximum offering price per share (100 ÷ 94.25 of $11.87) | | $ | 12.59 | |
Class B Net Asset Value, offering and redemption price (subject to contingent deferred sales charge) per share ($1,247,413 ÷ 105,935 shares of capital stock outstanding, $.01 par value, 75,000,000 shares authorized) | | $ | 11.78 | |
Class C Net Asset Value, offering and redemption price (subject to contingent deferred sales charge) per share ($13,474,356 ÷ 1,144,794 shares of capital stock outstanding, $.01 par value, 75,000,000 shares authorized) | | $ | 11.77 | |
Class R Net Asset Value, offering and redemption price per share ($228,752 ÷ 19,263.4 shares of capital stock outstanding, $.01 par value, 100,000,000 shares authorized) | | $ | 11.87 | |
Class S Net Asset Value, offering and redemption price per share ($121,072,336 ÷ 10,196,832 shares of capital stock outstanding, $.01 par value, 75,000,000 shares authorized) | | $ | 11.87 | |
Institutional Class Net Asset Value, offering and redemption price per share ($26,556,331 ÷ 2,233,228 shares of capital stock outstanding, $.01 par value, 75,000,000 shares authorized) | | $ | 11.89 | |
The accompanying notes are an integral part of the financial statements.
| for the year ended November 30, 2012 | |
| Investment Income | |
Income: Dividends (net of foreign taxes withheld of $17,379) | | $ | 4,532,444 | |
| Income distributions — Central Cash Management Fund | | | 3,366 | |
| Securities lending income, including income from Daily Assets Fund Institutional, net of borrower rebates | | | 86,495 | |
| Total income | | | 4,622,305 | |
Expenses: Management fee | | | 1,470,851 | |
| Services to shareholders | | | 392,634 | |
| Distribution and service fees | | | 263,623 | |
| Custodian and accounting fees | | | 35,408 | |
| Professional fees | | | 69,473 | |
| Reports to shareholders | | | 44,836 | |
| Registration fees | | | 81,650 | |
| Directors' fees and expenses | | | 10,033 | |
| Other | | | 13,449 | |
| Total expenses before expense reductions | | | 2,381,957 | |
| Expense reductions | | | (43,751 | ) |
| Total expenses after expense reductions | | | 2,338,206 | |
| Net investment income | | | 2,284,099 | |
| Realized and Unrealized Gain (Loss) | |
Net realized gain (loss) from: Investments | | | 6,091,473 | |
| Foreign currency | | | 2,129 | |
| | | | 6,093,602 | |
| Change in net unrealized appreciation (depreciation) on investments | | | 16,438,563 | |
| Net gain (loss) | | | 22,532,165 | |
| Net increase (decrease) in net assets resulting from operations | | $ | 24,816,264 | |
The accompanying notes are an integral part of the financial statements.
Statement of Changes in Net Assets | | | Years Ended November 30, | |
| Increase (Decrease) in Net Assets | | 2012 | | | 2011 | |
Operations: Net investment income (loss) | | $ | 2,284,099 | | | $ | 1,840,474 | |
| Net realized gain (loss) | | | 6,093,602 | | | | 21,071,294 | |
| Change in net unrealized appreciation (depreciation) | | | 16,438,563 | | | | (18,312,619 | ) |
| Net increase (decrease) in net assets resulting from operations | | | 24,816,264 | | | | 4,599,149 | |
Distributions to shareholders from: Net investment income: Class A | | | (307,663 | ) | | | (367,592 | ) |
| Class B | | | (602 | ) | | | (2,014 | ) |
| Class C | | | (14,075 | ) | | | (16,795 | ) |
| Class R | | | (6 | ) | | | — | |
| Class S | | | (1,092,550 | ) | | | (1,269,526 | ) |
| Institutional Class | | | (285,641 | ) | | | (254,855 | ) |
| Total distributions | | | (1,700,537 | ) | | | (1,910,782 | ) |
Fund share transactions: Proceeds from shares sold | | | 40,922,928 | | | | 38,075,132 | |
| Reinvestment of distributions | | | 1,529,442 | | | | 1,755,764 | |
| Payments for shares redeemed | | | (50,409,021 | ) | | | (48,968,430 | ) |
| Net increase (decrease) in net assets from Fund share transactions | | | (7,956,651 | ) | | | (9,137,534 | ) |
| Increase (decrease) in net assets | | | 15,159,076 | | | | (6,449,167 | ) |
| Net assets at beginning of period | | | 185,626,115 | | | | 192,075,282 | |
| Net assets at end of period (including undistributed net investment income of $2,257,529 and $1,671,838, respectively) | | $ | 200,785,191 | | | $ | 185,626,115 | |
The accompanying notes are an integral part of the financial statements.
| | | Years Ended November 30, | |
| Class A | | | 2012 | | | 2011 | | | 2010 | | | 2009 | | | 2008 | |
| Selected Per Share Data | |
| Net asset value, beginning of period | | $ | 10.56 | | | $ | 10.43 | | | $ | 9.12 | | | $ | 6.54 | | | $ | 12.61 | |
Income (loss) from investment operations: Net investment income (loss)a | | | .12 | | | | .09 | | | | .10 | | | | .13 | | | | .13 | |
| Net realized and unrealized gain (loss) | | | 1.27 | | | | .13 | | | | 1.34 | | | | 2.54 | | | | (5.37 | ) |
| Total from investment operations | | | 1.39 | | | | .22 | | | | 1.44 | | | | 2.67 | | | | (5.24 | ) |
Less distributions from: Net investment income | | | (.08 | ) | | | (.09 | ) | | | (.13 | ) | | | (.09 | ) | | | (.09 | ) |
| Net realized gains | | | — | | | | — | | | | — | | | | — | | | | (.74 | ) |
| Total distributions | | | (.08 | ) | | | (.09 | ) | | | (.13 | ) | | | (.09 | ) | | | (.83 | ) |
| Net asset value, end of period | | $ | 11.87 | | | $ | 10.56 | | | $ | 10.43 | | | $ | 9.12 | | | $ | 6.54 | |
Total Return (%)b | | | 13.34 | c | | | 2.08 | | | | 15.99 | c | | | 41.27 | c | | | (44.33 | )c |
| Ratios to Average Net Assets and Supplemental Data | |
| Net assets, end of period ($ millions) | | | 38 | | | | 40 | | | | 43 | | | | 42 | | | | 33 | |
| Ratio of expenses before expense reductions (%) | | | 1.33 | | | | 1.32 | | | | 1.40 | | | | 1.52 | | | | 1.55 | |
| Ratio of expenses after expense reductions (%) | | | 1.31 | | | | 1.32 | | | | 1.37 | | | | 1.34 | | | | 1.40 | |
| Ratio of net investment income (loss) (%) | | | 1.03 | | | | .81 | | | | 1.01 | | | | 1.76 | | | | 1.40 | |
| Portfolio turnover rate (%) | | | 28 | | | | 47 | | | | 40 | | | | 67 | | | | 60 | |
a Based on average shares outstanding during period. b Total return does not reflect the effect of any sales charges. c Total return would have been lower had certain expenses not been reduced. | |
| | | Years Ended November 30, | |
| Class B | | | 2012 | | | 2011 | | | 2010 | | | 2009 | | | 2008 | |
| Selected Per Share Data | |
| Net asset value, beginning of period | | $ | 10.48 | | | $ | 10.35 | | | $ | 9.07 | | | $ | 6.50 | | | $ | 12.52 | |
Income (loss) from investment operations: Net investment income (loss)a | | | .02 | | | | .00 | * | | | .03 | | | | .08 | | | | .06 | |
| Net realized and unrealized gain (loss) | | | 1.28 | | | | .14 | | | | 1.32 | | | | 2.53 | | | | (5.33 | ) |
| Total from investment operations | | | 1.30 | | | | .14 | | | | 1.35 | | | | 2.61 | | | | (5.27 | ) |
Less distributions from: Net investment income | | | (.00 | )* | | | (.01 | ) | | | (.07 | ) | | | (.04 | ) | | | (.01 | ) |
| Net realized gains | | | — | | | | — | | | | — | | | | — | | | | (.74 | ) |
| Total distributions | | | (.00 | )* | | | (.01 | ) | | | (.07 | ) | | | (.04 | ) | | | (.75 | ) |
| Net asset value, end of period | | $ | 11.78 | | | $ | 10.48 | | | $ | 10.35 | | | $ | 9.07 | | | $ | 6.50 | |
Total Return (%)b,c | | | 12.44 | | | | 1.33 | | | | 14.93 | | | | 40.34 | | | | (44.66 | ) |
| Ratios to Average Net Assets and Supplemental Data | |
| Net assets, end of period ($ millions) | | | 1 | | | | 2 | | | | 3 | | | | 3 | | | | 2 | |
| Ratio of expenses before expense reductions (%) | | | 2.19 | | | | 2.15 | | | | 2.27 | | | | 2.54 | | | | 2.44 | |
| Ratio of expenses after expense reductions (%) | | | 2.11 | | | | 2.12 | | | | 2.11 | | | | 2.04 | | | | 2.10 | |
| Ratio of net investment income (loss) (%) | | | .20 | | | | .01 | | | | .27 | | | | 1.06 | | | | .70 | |
| Portfolio turnover rate (%) | | | 28 | | | | 47 | | | | 40 | | | | 67 | | | | 60 | |
a Based on average shares outstanding during the period. b Total return does not reflect the effect of any sales charges. c Total return would have been lower had certain expenses not been reduced. * Amount is less than $.005. | |
| | | Years Ended November 30, | |
| Class C | | | 2012 | | | 2011 | | | 2010 | | | 2009 | | | 2008 | |
| Selected Per Share Data | |
| Net asset value, beginning of period | | $ | 10.48 | | | $ | 10.34 | | | $ | 9.06 | | | $ | 6.49 | | | $ | 12.51 | |
Income (loss) from investment operations: Net investment income (loss)a | | | .03 | | | | .01 | | | | .03 | | | | .08 | | | | .06 | |
| Net realized and unrealized gain (loss) | | | 1.27 | | | | .14 | | | | 1.32 | | | | 2.53 | | | | (5.33 | ) |
| Total from investment operations | | | 1.30 | | | | .15 | | | | 1.35 | | | | 2.61 | | | | (5.27 | ) |
Less distributions from: Net investment income | | | (.01 | ) | | | (.01 | ) | | | (.07 | ) | | | (.04 | ) | | | (.01 | ) |
| Net realized gains | | | — | | | | — | | | | — | | | | — | | | | (.74 | ) |
| Total distributions | | | (.01 | ) | | | (.01 | ) | | | (.07 | ) | | | (.04 | ) | | | (.75 | ) |
| Net asset value, end of period | | $ | 11.77 | | | $ | 10.48 | | | $ | 10.34 | | | $ | 9.06 | | | $ | 6.49 | |
Total Return (%)b | | | 12.42 | c | | | 1.45 | | | | 14.94 | c | | | 40.40 | c | | | (44.69 | )c |
| Ratios to Average Net Assets and Supplemental Data | |
| Net assets, end of period ($ millions) | | | 13 | | | | 16 | | | | 17 | | | | 15 | | | | 12 | |
| Ratio of expenses before expense reductions (%) | | | 2.08 | | | | 2.05 | | | | 2.15 | | | | 2.30 | | | | 2.31 | |
| Ratio of expenses after expense reductions (%) | | | 2.07 | | | | 2.05 | | | | 2.11 | | | | 2.04 | | | | 2.10 | |
| Ratio of net investment income (loss) (%) | | | .27 | | | | .08 | | | | .27 | | | | 1.06 | | | | .70 | |
| Portfolio turnover rate (%) | | | 28 | | | | 47 | | | | 40 | | | | 67 | | | | 60 | |
a Based on average shares outstanding during the period. b Total return does not reflect the effect of any sales charges. c Total return would have been lower had certain expenses not been reduced. | |
| Class R | | Year Ended 11/30/12 | | | Period Ended 11/30/11a | |
| Selected Per Share Data | |
| Net asset value, beginning of period | | $ | 10.55 | | | $ | 11.66 | |
Income (loss) from investment operations: Net investment income (loss)b | | | .11 | | | | .05 | |
| Net realized and unrealized gain (loss) | | | 1.26 | | | | (1.16 | ) |
| Total from investment operations | | | 1.37 | | | | (1.11 | ) |
Less distributions from: Net investment income | | | (.05 | ) | | | — | |
| Total distributions | | | (.05 | ) | | | — | |
| Net asset value, end of period | | $ | 11.87 | | | $ | 10.55 | |
Total Return (%)c | | | 13.08 | | | | (9.52 | )** |
| Ratios to Average Net Assets and Supplemental Data | |
| Net assets, end of period ($ thousands) | | | 229 | | | | 1 | |
| Ratio of expenses before expense reductions (%) | | | 1.64 | | | | 6.24 | * |
| Ratio of expenses after expense reductions (%) | | | 1.59 | | | | 1.57 | * |
| Ratio of net investment income (loss) (%) | | | .96 | | | | .57 | * |
| Portfolio turnover rate (%) | | | 28 | | | | 47 | |
a For the period from March 1, 2011 (commencement of Class R shares) to November 30, 2011. b Based on average shares outstanding during the period. c Total return would have been lower had certain expenses not been reduced. * Annualized ** Not annualized | |
| | | Years Ended November 30, | |
| Class S | | | 2012 | | | 2011 | | | 2010 | | | 2009 | | | 2008 | |
| Selected Per Share Data | |
| Net asset value, beginning of period | | $ | 10.57 | | | $ | 10.44 | | | $ | 9.15 | | | $ | 6.56 | | | $ | 12.64 | |
Income (loss) from investment operations: Net investment income (loss)a | | | .15 | | | | .12 | | | | .12 | | | | .16 | | | | .18 | |
| Net realized and unrealized gain (loss) | | | 1.26 | | | | .13 | | | | 1.33 | | | | 2.54 | | | | (5.39 | ) |
| Total from investment operations | | | 1.41 | | | | .25 | | | | 1.45 | | | | 2.70 | | | | (5.21 | ) |
Less distributions from: Net investment income | | | (.11 | ) | | | (.12 | ) | | | (.16 | ) | | | (.11 | ) | | | (.13 | ) |
| Net realized gains | | | — | | | | — | | | | — | | | | — | | | | (.74 | ) |
| Total distributions | | | (.11 | ) | | | (.12 | ) | | | (.16 | ) | | | (.11 | ) | | | (.87 | ) |
| Net asset value, end of period | | $ | 11.87 | | | $ | 10.57 | | | $ | 10.44 | | | $ | 9.15 | | | $ | 6.56 | |
| Total Return (%) | | | 13.56 | b | | | 2.38 | | | | 16.13 | b | | | 41.83 | b | | | (44.09 | )b |
| Ratios to Average Net Assets and Supplemental Data | |
| Net assets, end of period ($ millions) | | | 121 | | | | 104 | | | | 110 | | | | 97 | | | | 74 | |
| Ratio of expenses before expense reductions (%) | | | 1.10 | | | | 1.08 | | | | 1.13 | | | | 1.23 | | | | 1.27 | |
| Ratio of expenses after expense reductions (%) | | | 1.07 | | | | 1.08 | | | | 1.10 | | | | .99 | | | | 1.02 | |
| Ratio of net investment income (loss) (%) | | | 1.29 | | | | 1.05 | | | | 1.28 | | | | 2.11 | | | | 1.78 | |
| Portfolio turnover rate (%) | | | 28 | | | | 47 | | | | 40 | | | | 67 | | | | 60 | |
a Based on average shares outstanding during the period. b Total return would have been lower had certain expenses not been reduced. | |
| | | Years Ended November 30, | |
| Institutional Class | | | 2012 | | | 2011 | | | 2010 | | | 2009 | | | 2008 | |
| Selected Per Share Data | |
| Net asset value, beginning of period | | $ | 10.59 | | | $ | 10.46 | | | $ | 9.16 | | | $ | 6.57 | | | $ | 12.66 | |
Income (loss) from investment operations: Net investment income (loss)a | | | .16 | | | | .13 | | | | .13 | | | | .16 | | | | .17 | |
| Net realized and unrealized gain (loss) | | | 1.26 | | | | .13 | | | | 1.33 | | | | 2.54 | | | | (5.39 | ) |
| Total from investment operations | | | 1.42 | | | | .26 | | | | 1.46 | | | | 2.70 | | | | (5.22 | ) |
Less distributions from: Net investment income | | | (.12 | ) | | | (.13 | ) | | | (.16 | ) | | | (.11 | ) | | | (.13 | ) |
| Net realized gains | | | — | | | | — | | | | — | | | | — | | | | (.74 | ) |
| Total distributions | | | (.12 | ) | | | (.13 | ) | | | (.16 | ) | | | (.11 | ) | | | (.87 | ) |
| Net asset value, end of period | | $ | 11.89 | | | $ | 10.59 | | | $ | 10.46 | | | $ | 9.16 | | | $ | 6.57 | |
| Total Return (%) | | | 13.67 | b | | | 2.46 | | | | 16.23 | | | | 41.84 | b | | | (44.05 | )b |
| Ratios to Average Net Assets and Supplemental Data | |
| Net assets, end of period ($ millions) | | | 27 | | | | 25 | | | | 21 | | | | 18 | | | | 14 | |
| Ratio of expenses before expense reductions (%) | | | .97 | | | | .99 | | | | 1.02 | | | | 1.02 | | | | 1.08 | |
| Ratio of expenses after expense reductions (%) | | | .97 | | | | .99 | | | | 1.02 | | | | .99 | | | | 1.02 | |
| Ratio of net investment income (loss) (%) | | | 1.39 | | | | 1.14 | | | | 1.36 | | | | 2.11 | | | | 1.78 | |
| Portfolio turnover rate (%) | | | 28 | | | | 47 | | | | 40 | | | | 67 | | | | 60 | |
a Based on average shares outstanding during the period. b Total return would have been lower had certain expenses not been reduced. | |
Notes to Financial Statements
A. Organization and Significant Accounting Policies
DWS Dreman Mid Cap Value Fund (the "Fund") is a diversified series of DWS Value Series, Inc. (the "Corporation"), which is registered under the Investment Company Act of 1940, as amended (the "1940 Act"), as an open-end management investment company organized as a Maryland corporation.
The Fund offers multiple classes of shares which provide investors with different purchase options. Class A shares are offered to investors subject to an initial sales charge. Class B shares of the Fund are closed to new purchases, except exchanges or the reinvestment of dividends or other distributions. Class B shares were offered to investors without an initial sales charge and are subject to higher ongoing expenses than Class A shares and a contingent deferred sales charge payable upon certain redemptions. Class B shares automatically convert to Class A shares six years after issuance. Class C shares are offered to investors without an initial sales charge but are subject to higher ongoing expenses than Class A shares and a contingent deferred sales charge payable upon certain redemptions within one year of purchase. Class C shares do not automatically convert into another class. Class R shares are only available to participants in certain retirement plans and are offered to investors without an initial sales charge. Institutional Class shares are offered to a limited group of investors, are not subject to initial or contingent deferred sales charges and have lower ongoing expenses than other classes. Class S shares are not subject to initial or contingent deferred sales charges and are generally not available to new investors except under certain circumstances.
Investment income, realized and unrealized gains and losses, and certain fund-level expenses and expense reductions, if any, are borne pro rata on the basis of relative net assets by the holders of all classes of shares, except that each class bears certain expenses unique to that class such as distribution and service fees, service to shareholders and certain other class-specific expenses. Differences in class-level expenses may result in payment of different per share dividends by class. All shares of the Fund have equal rights with respect to voting subject to class-specific arrangements.
The Fund's financial statements are prepared in accordance with accounting principles generally accepted in the United States of America which require the use of management estimates. Actual results could differ from those estimates. The policies described below are followed consistently by the Fund in the preparation of its financial statements.
Security Valuation. Investments are stated at value determined as of the close of regular trading on the New York Stock Exchange on each day the exchange is open for trading.
Various inputs are used in determining the value of the Fund's investments. These inputs are summarized in three broad levels. Level 1 includes quoted prices in active markets for identical securities. Level 2 includes other significant observable inputs (including quoted prices for similar securities, interest rates, prepayment speeds, and credit risk). Level 3 includes significant unobservable inputs (including the Fund's own assumptions in determining the fair value of investments). The inputs or methodology used for valuing securities are not necessarily an indication of the risk associated with investing in those securities.
Equity securities are valued at the most recent sale price or official closing price reported on the exchange (U.S. or foreign) or over-the-counter market on which they trade and are categorized as Level 1 securities. Securities for which no sales are reported are valued at the calculated mean between the most recent bid and asked quotations on the relevant market or, if a mean cannot be determined, at the most recent bid quotation.
Investments in open-end investment companies are valued at their net asset value each business day and are categorized as Level 1.
Securities and other assets for which market quotations are not readily available or for which the above valuation procedures are deemed not to reflect fair value are valued in a manner that is intended to reflect their fair value as determined in accordance with procedures approved by the Board and are generally categorized as Level 3. In accordance with the Fund's valuation procedures, factors used in determining value may include, but are not limited to, the type of the security; the size of the holding; the initial cost of the security; the existence of any contractual restrictions on the security's disposition; the price and extent of public trading in similar securities of the issuer or of comparable companies; quotations or evaluated prices from broker-dealers and/or pricing services; information obtained from the issuer, analysts, and/or the appropriate stock exchange (for exchange-traded securities); an analysis of the company's or issuer's financial statements; an evaluation of the forces that influence the issuer and the market(s) in which the security is purchased and sold and with respect to debt securities; the maturity, coupon, creditworthiness, currency denomination and the movement of the market in which the security is normally traded. The value determined under these procedures may differ from published values for the same securities.
Disclosure about the classification of fair value measurements is included in a table following the Fund's Investment Portfolio.
New Accounting Pronouncement. In December 2011, Accounting Standards Update 2011-11 (ASU 2011-11), Disclosures about Offsetting Assets and Liabilities, was issued and is effective for fiscal years beginning on or after January 1, 2013, and interim periods within those annual periods. ASU 2011-11 is intended to enhance disclosure requirements on the offsetting of financial assets and liabilities. Management is currently evaluating the application of ASU 2011-11 and its impact, if any, on the Fund's financial statements.
Foreign Currency Translations. The books and records of the Fund are maintained in U.S. dollars. Investment securities and other assets and liabilities denominated in a foreign currency are translated into U.S. dollars at the prevailing exchange rates at period end. Purchases and sales of investment securities, income and expenses are translated into U.S. dollars at the prevailing exchange rates on the respective dates of the transactions.
Net realized and unrealized gains and losses on foreign currency transactions represent net gains and losses between trade and settlement dates on securities transactions, the acquisition and disposition of foreign currencies, and the difference between the amount of net investment income accrued and the U.S. dollar amount actually received. That portion of both realized and unrealized gains and losses on investments that results from fluctuations in foreign currency exchange rates is not separately disclosed but is included with net realized and unrealized gain/appreciation and loss/depreciation on investments.
Securities Lending. The Fund lends securities to certain financial institutions. The Fund retains beneficial ownership of the securities it has loaned and continues to receive interest and dividends paid by the issuer of securities and to participate in any changes in their market value. The Fund requires the borrowers of the securities to maintain collateral with the Fund consisting of either cash or liquid, unencumbered assets having a value at least equal to the value of the securities loaned. When the collateral falls below specified amounts, the lending agent will use its best effort to obtain additional collateral on the next business day to meet required amounts under the security lending agreement. The Fund may invest the cash collateral into a joint trading account in an affiliated money market fund pursuant to Exemptive Orders issued by the SEC. The Fund receives compensation for lending its securities either in the form of fees or by earning interest on invested cash collateral net of borrower rebates and fees paid to a lending agent. Either the Fund or the borrower may terminate the loan. There may be risks of delay and costs in recovery of securities or even loss of rights in the collateral should the borrower of the securities fail financially. The Fund is also subject to all investment risks associated with the reinvestment of any cash collateral received, including, but not limited to, interest rate, credit and liquidity risk associated with such investments.
Federal Income Taxes. The Fund's policy is to comply with the requirements of the Internal Revenue Code, as amended, which are applicable to regulated investment companies, and to distribute all of its taxable income to its shareholders.
Under the Regulated Investment Company Modernization Act of 2010, net capital losses may be carried forward indefinitely, and their character is retained as short-term and/or long-term. Previously, net capital losses were carried forward for eight years and treated as short-term losses. As a transition rule, the Act requires that post-enactment net capital losses be used before pre-enactment net capital losses.
At November 30, 2012, the Fund had a net tax basis capital loss carryforward of approximately $55,495,000 including of pre-enactment losses, of which $8,175,000 was inherited from its merger with affiliated Fund in fiscal year 2008 and may be applied against any realized net taxable capital gains of each succeeding year until fully utilized or until November 30, 2015 ($8,175,000), November 30, 2016 ($14,425,000) and November 30, 2017 ($32,895,000), the respective expiration dates, whichever occurs first, and which may be subject to certain limitations under Sections 382-384 of the Internal Revenue Code.
The Fund has reviewed the tax positions for the open tax years as of November 30, 2012 and has determined that no provision for income tax is required in the Fund's financial statements. The Fund's federal tax returns for the prior three fiscal years remain open subject to examination by the Internal Revenue Service.
Distribution of Income and Gains. Net investment income of the Fund, if any, is declared and distributed to shareholders annually. Net realized gains from investment transactions, in excess of available capital loss carryforwards, would be taxable to the Fund if not distributed, and, therefore, will be distributed to shareholders at least annually.
The timing and characterization of certain income and capital gain distributions are determined annually in accordance with federal tax regulations which may differ from accounting principles generally accepted in the United States of America. These differences primarily relate to securities sold at a loss. As a result, net investment income (loss) and net realized gain (loss) on investment transactions for a reporting period may differ significantly from distributions during such period. Accordingly, the Fund may periodically make reclassifications among certain of its capital accounts without impacting the net asset value of the Fund.
At November 30, 2012, the Fund's components of distributable earnings (accumulated losses) on a tax basis were as follows:
Undistributed ordinary income* | | $ | 2,257,529 | |
| Capital loss carryforwards | | $ | (55,495,000 | ) |
| Net unrealized appreciation (depreciation) on investments | | $ | 14,968,145 | |
In addition, the tax character of distributions paid to shareholders by the Fund is summarized as follows:
| | | Years Ended November 30, | |
| | | 2012 | | | 2011 | |
Distributions from ordinary income* | | $ | 1,700,537 | | | $ | 1,910,782 | |
* For tax purposes, short-term capital gain distributions are considered ordinary income distributions.
Expenses. Expenses of the Corporation arising in connection with a specific fund are allocated to that fund. Other Corporation expenses which cannot be directly attributed to a fund are apportioned among the funds in the Corporation based upon the relative net assets or other appropriate measures.
Contingencies. In the normal course of business, the Fund may enter into contracts with service providers that contain general indemnification clauses. The Fund's maximum exposure under these arrangements is unknown as this would involve future claims that may be made against the Fund that have not yet been made. However, based on experience, the Fund expects the risk of loss to be remote.
Real Estate Investment Trusts. The Fund periodically recharacterizes distributions received from a Real Estate Investment Trust ("REIT") investment based on information provided by the REIT into the following categories: ordinary income, long-term and short-term capital gains, and return of capital. If information is not available timely from a REIT, the recharacterization will be estimated and a recharacterization will be made in the following year when such information becomes available. Distributions received from REITs in excess of income are recorded as either a reduction of cost of investments or realized gains. The Fund distinguishes between dividends received on a tax basis and a financial reporting basis and only distributions in excess of tax basis earnings and profits are reported in the financial statements as a tax return of capital.
Other. Investment transactions are accounted for on a trade date plus one basis for daily net asset valuation calculations. However, for financial reporting purposes, investment transactions are reported on trade date. Interest income is recorded on the accrual basis. Dividend income is recorded on the ex-dividend date net of foreign withholding taxes. Certain dividends from foreign securities may be recorded subsequent to the ex-dividend date as soon as the Fund is informed of such dividends. Realized gains and losses from investment transactions are recorded on an identified cost basis and may include proceeds from litigation.
B. Purchases and Sales of Securities
During the year ended November 30, 2012, purchases and sales of investment securities (excluding short-term investments) aggregated $54,968,955 and $59,688,793, respectively.
C. Related Parties
Management Agreement. Under the Investment Management Agreement with Deutsche Investment Management Americas Inc. ("DIMA" or the "Advisor"), an indirect, wholly owned subsidiary of Deutsche Bank AG, the Advisor directs the investments of the Fund in accordance with its investment objectives, policies and restrictions. The Advisor determines the securities, instruments and other contracts relating to investments to be purchased, sold or entered into by the Fund or delegates such responsibility to the Fund's subadvisor. In addition to portfolio management services, the Advisor provides certain administrative services in accordance with the Investment Management Agreement.
Dreman Value Management, L.L.C. ("DVM" or the "Subadvisor") serves as subadvisor with respect to the investment and reinvestment of assets of the Fund, and is paid by the Advisor for its services.
Under the Investment Management Agreement with the Advisor, the Fund pays a monthly management fee based on the Fund's average daily net assets, computed and accrued daily and payable monthly, at the following annual rates:
| First $250 million of the Fund's average daily net assets | | | .750 | % |
| Next $250 million of such net assets | | | .720 | % |
| Next $2.0 billion of such net assets | | | .700 | % |
| Next $1.5 billion of such net assets | | | .680 | % |
| Over $4.0 billion of such assets | | | .660 | % |
Accordingly, for the year ended November 30, 2012, the fee pursuant to the Investment Management Agreement was equivalent to an annual effective rate of 0.75% of the Fund's average daily net assets.
For the period from December 1, 2011 through September 30, 2012, the Advisor had contractually agreed to waive its fees and/or reimburse certain operating expenses of the Fund to the extent necessary to maintain the operating expenses (excluding certain expenses such as extraordinary expenses, taxes, brokerage and interest) for certain classes as follows:
Effective October 1, 2012 through September 30, 2013, the Advisor has contractually agreed to waive its fees and/or reimburse certain operating expenses of the Fund to the extent necessary to maintain the operating expenses (excluding certain expenses such as extraordinary expenses, taxes, brokerage and interest) of each class as follows:
| Class A | 1.21% |
| Class B | 1.96% |
| Class C | 1.96% |
| Class R | 1.46% |
| Class S | .96% |
| Institutional Class | .96% |
Service Provider Fees. DWS Investments Service Company ("DISC"), an affiliate of the Advisor, is the transfer agent, dividend-paying agent and shareholder service agent of the Fund. Pursuant to a sub-transfer agency agreement between DISC and DST Systems, Inc. ("DST"), DISC has delegated certain transfer agent, dividend-paying agent and shareholder service agent functions to DST. DISC compensates DST out of the shareholder servicing fee it receives from the Fund. For the year ended November 30, 2012, the amounts charged to the Fund by DISC were as follows:
| Services to Shareholders | | Total Aggregated | | | Waived | | | Unpaid at November 30, 2012 | |
| Class A | | $ | 49,813 | | | $ | 6,615 | | | $ | 5,568 | |
| Class B | | | 3,724 | | | | 1,262 | | | | 654 | |
| Class C | | | 9,357 | | | | 2,611 | | | | — | |
| Class R | | | 348 | | | | 81 | | | | 47 | |
| Class S | | | 164,960 | | | | 31,358 | | | | 9,163 | |
| Institutional Class | | | 2,565 | | | | 1,824 | | | | — | |
| | | $ | 230,767 | | | $ | 43,751 | | | $ | 15,432 | |
Pursuant to a fund accounting agreement, DIMA is responsible for computing the daily net asset value per share and maintaining the portfolio and general accounting records of the Fund. DIMA has delegated certain fund accounting and record-keeping services to State Street Bank and Trust Company. The costs and expenses of such delegation are paid by DIMA. For the year ended November 30, 2012, the amount charged to the Fund for accounting services under the fund accounting agreement aggregated $29,417, of which $2,410 is unpaid.
Distribution and Service Fees. Under the Fund's Class B, C and R 12b-1 Plans, DWS Investments Distributors, Inc. ("DIDI"), an affiliate of the Advisor, receives a fee ("Distribution Fee") of 0.75% of average daily net assets of each of Class B and C shares, and 0.25% of the average daily net assets of Class R shares. In accordance with the Fund's Underwriting and Distribution Services Agreement, DIDI enters into related selling group agreements with various firms at various rates for sales of Class B and C shares, respectively. For the year ended November 30, 2012, the Distribution Fee was as follows:
| Distribution Fee | | Total Aggregated | | | Unpaid at November 30, 2012 | |
| Class B | | $ | 11,847 | | | $ | 790 | |
| Class C | | | 113,564 | | | | 8,239 | |
| Class R | | | 354 | | | | 47 | |
| | | $ | 125,765 | | | $ | 9,076 | |
In addition, DIDI provides information and administrative services for a fee ("Service Fee") to Class A, B, C and R shareholders at an annual rate of up to 0.25% of average daily net assets for each such class. DIDI in turn has various agreements with financial services firms that provide these services and pays these fees based upon the assets of shareholder accounts the firms service. For the year ended November 30, 2012, the Service Fee was as follows:
| Service Fee | | Total Aggregated | | | Unpaid at November 30, 2012 | | | Annual Effective Rate | |
| Class A | | $ | 95,810 | | | $ | 16,813 | | | | .24 | % |
| Class B | | | 3,926 | | | | 556 | | | | .25 | % |
| Class C | | | 37,771 | | | | 5,986 | | | | .25 | % |
| Class R | | | 351 | | | | 153 | | | | .25 | % |
| | | $ | 137,858 | | | $ | 23,508 | | | | | |
Underwriting and Contingent Deferred Sales Charge. DIDI is the principal underwriter for the Fund. Underwriting commissions paid in connection with the distribution of Class A shares for the year ended November 30, 2012 aggregated $4,470.
In addition, DIDI receives any contingent deferred sales charge ("CDSC") from Class B share redemptions occurring within six years of purchase and Class C share redemptions occurring within one year of purchase. There is no such charge upon redemption of any share appreciation or reinvested dividends. The CDSC is based on declining rates, ranging from 4% to 1% for Class B and 1% for Class C, of the value of the shares redeemed. For the year ended November 30, 2012, the CDSC for Class B and C shares aggregated $2,637 and $2,051, respectively. A deferred sales charge of up to 1% is assessed on certain redemptions of Class A shares. For the year ended November 30, 2012, DIDI received $568 for Class A shares.
Typesetting and Filing Service Fees. Under an agreement with DIMA, DIMA is compensated for providing typesetting and certain regulatory filing services to the Fund. For the year ended November 30, 2012, the amount charged to the Fund by DIMA included in the Statement of Operations under "reports to shareholders" aggregated $18,251, of which $7,516 is unpaid.
Directors' Fees and Expenses. The Fund paid retainer fees to each Director not affiliated with the Advisor, plus specified amounts to the Board Chairperson and to each committee Chairperson.
Affiliated Cash Management Vehicle. The Fund may invest uninvested cash balances in Central Cash Management Fund, which is managed by the Advisor. The Fund indirectly bears its proportionate share of the expenses of Central Cash Management Fund. Central Cash Management Fund does not pay the Advisor an investment management fee. Central Cash Management Fund seeks a high level of current income consistent with liquidity and the preservation of capital.
D. Line of Credit
The Fund and other affiliated funds (the "Participants") share in a $375 million revolving credit facility provided by a syndication of banks. The Fund may borrow for temporary or emergency purposes, including the meeting of redemption requests that otherwise might require the untimely disposition of securities. The Participants are charged an annual commitment fee which is allocated based on net assets, among each of the Participants. Interest is calculated at a rate per annum equal to the sum of the Federal Funds Rate plus 1.25 percent plus if LIBOR exceeds the Federal Funds Rate the amount of such excess. The Fund may borrow up to a maximum of 33 percent of its net assets under the agreement. The Fund had no outstanding loans at November 30, 2012.
E. Share Transactions
The following table summarizes share and dollar activity in the Fund:
| | | Year Ended November 30, 2012 | | | Year Ended November 30, 2011 | |
| | | Shares | | | Dollars | | | Shares | | | Dollars | |
| Shares sold | |
| Class A | | | 663,652 | | | $ | 7,408,041 | | | | 1,042,087 | | | $ | 11,828,674 | |
| Class B | | | 943 | | | | 10,191 | | | | 8,287 | | | | 93,618 | |
| Class C | | | 175,908 | | | | 1,976,786 | | | | 391,573 | | | | 4,418,705 | |
| Class R | | | 20,227 | | | | 227,789 | | | | 125 | * | | | 1,397 | * |
| Class S | | | 2,498,727 | | | | 28,012,806 | | | | 1,032,687 | | | | 11,536,113 | |
| Institutional Class | | | 294,665 | | | | 3,287,315 | | | | 914,558 | | | | 10,196,625 | |
| | | | | | | $ | 40,922,928 | | | | | | | $ | 38,075,132 | |
| Shares issued to shareholders in reinvestment of distributions | |
| Class A | | | 30,480 | | | $ | 300,231 | | | | 32,435 | | | $ | 353,540 | |
| Class B | | | 53 | | | | 527 | | | | 166 | | | | 1,808 | |
| Class C | | | 1,195 | | | | 11,757 | | | | 1,182 | | | | 12,876 | |
| Class R | | | 1 | | | | 6 | | | | — | | | | — | |
| Class S | | | 102,380 | | | | 1,006,391 | | | | 111,979 | | | | 1,218,327 | |
| Institutional Class | | | 21,395 | | | | 210,530 | | | | 15,538 | | | | 169,213 | |
| | | | | | | $ | 1,529,442 | | | | | | | $ | 1,755,764 | |
| Shares redeemed | |
| Class A | | | (1,225,363 | ) | | $ | (13,779,227 | ) | | | (1,403,406 | ) | | $ | (15,656,698 | ) |
| Class B | | | (82,281 | ) | | | (918,093 | ) | | | (71,622 | ) | | | (789,394 | ) |
| Class C | | | (530,801 | ) | | | (5,968,532 | ) | | | (524,134 | ) | | | (5,740,212 | ) |
| Class R | | | (1,089 | ) | | | (12,456 | ) | | | — | | | | — | |
| Class S | | | (2,197,305 | ) | | | (24,923,141 | ) | | | (1,843,530 | ) | | | (20,755,683 | ) |
| Institutional Class | | | (424,605 | ) | | | (4,807,572 | ) | | | (551,145 | ) | | | (6,026,443 | ) |
| | | | | | | $ | (50,409,021 | ) | | | | | | $ | (48,968,430 | ) |
| Net increase (decrease) | |
| Class A | | | (531,231 | ) | | $ | (6,070,955 | ) | | | (328,884 | ) | | $ | (3,474,484 | ) |
| Class B | | | (81,285 | ) | | | (907,375 | ) | | | (63,169 | ) | | | (693,968 | ) |
| Class C | | | (353,698 | ) | | | (3,979,989 | ) | | | (131,379 | ) | | | (1,308,631 | ) |
| Class R | | | 19,139 | | | | 215,339 | | | | 125 | * | | | 1,397 | * |
| Class S | | | 403,802 | | | | 4,096,056 | | | | (698,864 | ) | | | (8,001,243 | ) |
| Institutional Class | | | (108,545 | ) | | | (1,309,727 | ) | | | 378,951 | | | | 4,339,395 | |
| | | | | | | $ | (7,956,651 | ) | | | | | | $ | (9,137,534 | ) |
* For the period from March 1, 2011 (commencement of Class R shares) through November 30, 2011.
Report of Independent Registered Public Accounting Firm
To the Board of Directors of DWS Value Series, Inc. and Shareholders of DWS Dreman Mid Cap Value Fund:
We have audited the accompanying statement of assets and liabilities of DWS Dreman Mid Cap Value Fund (one of the series constituting DWS Value Series, Inc.) (the "Fund"), including the investment portfolio, as of November 30, 2012, and the related statement of operations for the year then ended, the statement of changes in net assets for each of the two years in the period then ended, and the financial highlights for each of the periods indicated therein. These financial statements and financial highlights are the responsibility of the Fund's management. Our responsibility is to express an opinion on these financial statements and financial highlights based on our audits.
We conducted our audits in accordance with the standards of the Public Company Accounting Oversight Board (United States). Those standards require that we plan and perform the audit to obtain reasonable assurance about whether the financial statements and financial highlights are free of material misstatement. We were not engaged to perform an audit of the Fund's internal control over financial reporting. Our audits included consideration of internal control over financial reporting as a basis for designing audit procedures that are appropriate in the circumstances, but not for the purpose of expressing an opinion on the effectiveness of the Fund's internal control over financial reporting. Accordingly, we express no such opinion. An audit also includes examining, on a test basis, evidence supporting the amounts and disclosures in the financial statements and financial highlights, assessing the accounting principles used and significant estimates made by management, and evaluating the overall financial statement presentation. Our procedures included confirmation of securities owned as of November 30, 2012, by correspondence with the custodian and brokers. We believe that our audits provide a reasonable basis for our opinion.
In our opinion, the financial statements and financial highlights referred to above present fairly, in all material respects, the financial position of DWS Dreman Mid Cap Value Fund at November 30, 2012, the results of its operations for the year then ended, the changes in its net assets for each of the two years in the period then ended, and the financial highlights for each of the periods indicated therein, in conformity with U.S. generally accepted accounting principles.
| | | |
Boston, Massachusetts January 25, 2013 | | |
Information About Your Fund's Expenses
As an investor of the Fund, you incur two types of costs: ongoing expenses and transaction costs. Ongoing expenses include management fees, distribution and service (12b-1) fees and other Fund expenses. Examples of transaction costs include sales charges (loads) and account maintenance fees, which are not shown in this section. The following tables are intended to help you understand your ongoing expenses (in dollars) of investing in the Fund and to help you compare these expenses with the ongoing expenses of investing in other mutual funds. In the most recent six-month period, the Fund limited these expenses; had it not done so, expenses would have been higher. The example in the table is based on an investment of $1,000 invested at the beginning of the six-month period and held for the entire period (June 1, 2012 to November 30, 2012).
The tables illustrate your Fund's expenses in two ways:
•Actual Fund Return. This helps you estimate the actual dollar amount of ongoing expenses (but not transaction costs) paid on a $1,000 investment in the Fund using the Fund's actual return during the period. To estimate the expenses you paid over the period, simply divide your account value by $1,000 (for example, an $8,600 account value divided by $1,000 = 8.6), then multiply the result by the number in the "Expenses Paid per $1,000" line under the share class you hold.
•Hypothetical 5% Fund Return. This helps you to compare your Fund's ongoing expenses (but not transaction costs) with those of other mutual funds using the Fund's actual expense ratio and a hypothetical rate of return of 5% per year before expenses. Examples using a 5% hypothetical fund return may be found in the shareholder reports of other mutual funds. The hypothetical account values and expenses may not be used to estimate the actual ending account balance or expenses you paid for the period.
Please note that the expenses shown in these tables are meant to highlight your ongoing expenses only and do not reflect any transaction costs. The "Expenses Paid per $1,000" line of the tables is useful in comparing ongoing expenses only and will not help you determine the relative total expense of owning different funds. Subject to certain exceptions, an account maintenance fee of $20.00 assessed once per calendar year for Classes A, B, C and S shares may apply for accounts with balances less than $10,000. This fee is not included in these tables. If it was, the estimate of expenses paid for Classes A, B, C and S shares during the period would be higher, and account value during the period would be lower, by this amount.
Expenses and Value of a $1,000 Investment for the six months ended November 30, 2012 (Unaudited) | |
| Actual Fund Return | | Class A | | | Class B | | | Class C | | | Class R | | | Class S | | | Institutional Class | |
| Beginning Account Value 6/1/12 | | $ | 1,000.00 | | | $ | 1,000.00 | | | $ | 1,000.00 | | | $ | 1,000.00 | | | $ | 1,000.00 | | | $ | 1,000.00 | |
| Ending Account Value 11/30/12 | | $ | 1,116.70 | | | $ | 1,113.40 | | | $ | 1,112.50 | | | $ | 1,116.70 | | | $ | 1,117.70 | | | $ | 1,118.50 | |
| Expenses paid per $1,000* | | $ | 6.88 | | | $ | 10.99 | | | $ | 10.93 | | | $ | 8.26 | | | $ | 5.61 | | | $ | 5.08 | |
| Hypothetical 5% Fund Return | | Class A | | | Class B | | | Class C | | | Class R | | | Class S | | | Institutional Class | |
| Beginning Account Value 6/1/12 | | $ | 1,000.00 | | | $ | 1,000.00 | | | $ | 1,000.00 | | | $ | 1,000.00 | | | $ | 1,000.00 | | | $ | 1,000.00 | |
| Ending Account Value 11/30/12 | | $ | 1,018.50 | | | $ | 1,014.60 | | | $ | 1,014.65 | | | $ | 1,017.20 | | | $ | 1,019.70 | | | $ | 1,020.20 | |
| Expenses Paid per $1,000* | | $ | 6.56 | | | $ | 10.48 | | | $ | 10.43 | | | $ | 7.87 | | | $ | 5.35 | | | $ | 4.85 | |
* Expenses are equal to the Fund's annualized expense ratio for each share class, multiplied by the average account value over the period, multiplied by 183 (the number of days in the most recent six-month period), then divided by 366.
| Annualized Expense Ratios | Class A | Class B | Class C | Class R | Class S | Institutional Class |
| DWS Dreman Mid Cap Value Fund | 1.30% | 2.08 | 2.07% | 1.56% | 1.06% | .96% |
For more information, please refer to the Fund's prospectus.
Tax Information (Unaudited)
For corporate shareholders, 100% of the income dividends paid during the Fund's fiscal year ended November 30, 2012, qualified for the dividends received deduction.
For federal income tax purposes, the Fund designates approximately $5,320,000, or the maximum amount allowable under law, as qualified dividends income.
Please contact a tax advisor if you have questions about federal or state income tax laws, or on how to prepare your tax returns. If you have specific questions about your account, please call (800) 728-3337.
Investment Management Agreement Approval
The Board of Directors approved the renewal of DWS Dreman Mid Cap Value Fund's investment management agreement (the "Agreement") with Deutsche Investment Management Americas Inc. ("DWS") and sub-advisory agreement (the "Sub-Advisory Agreement" and together with the Agreement, the "Agreements") between DWS and Dreman Value Management, L.L.C. ("DVM") in September 2012.
In terms of the process that the Board followed prior to approving the Agreements, shareholders should know that:
• In September 2012, all of the Fund's Directors were independent of DWS and its affiliates.
• The Directors met frequently during the past year to discuss fund matters and dedicated a substantial amount of time to contract review matters. Over the course of several months, the Board's Contract Committee, in coordination with the Board's Equity Oversight Committee, reviewed comprehensive materials received from DWS, independent third parties and independent counsel. These materials included an analysis of the Fund's performance, fees and expenses, and profitability compiled by the Fund's independent fee consultant. The Board also received extensive information throughout the year regarding performance of the Fund.
• The Independent Directors regularly meet privately with their independent counsel to discuss contract review and other matters. In addition, the Independent Directors were also advised by the Fund's independent fee consultant in the course of their review of the Fund's contractual arrangements and considered a comprehensive report prepared by the independent fee consultant in connection with their deliberations (the "IFC Report").
• In connection with reviewing the Agreements, the Board also reviewed the terms of the Fund's Rule 12b-1 plan, distribution agreement, transfer agency agreement and other material service agreements.
• Based on its evaluation of the information provided, the Contract Committee presented its findings and recommendations to the Board. The Board then reviewed the Contract Committee's findings and recommendations.
In connection with the contract review process, the Contract Committee and the Board considered the factors discussed below, among others. The Board also considered that DWS and its predecessors have managed the Fund since its inception, and the Board believes that a long-term relationship with a capable, conscientious advisor is in the best interests of the Fund. The Board considered, generally, that shareholders chose to invest or remain invested in the Fund knowing that DWS managed the Fund. DWS is part of Deutsche Bank, a major global banking institution that is engaged in a wide range of financial services. The Board believes that there are advantages to being part of a global asset management business that offers a wide range of investing expertise and resources, including hundreds of portfolio managers and analysts with research capabilities in many countries throughout the world.
As part of the contract review process, the Board carefully considered the fees and expenses of each DWS fund overseen by the Board in light of the fund's performance. In many cases, this led to a negotiation with DWS of lower expense caps for the coming year than had previously been in place. As part of these negotiations, the Board indicated that it would consider relaxing these new lower caps in future years following sustained improvements in performance, among other considerations.
In June 2012, Deutsche Bank ("DB"), DWS's parent company, announced that DB's new management team had concluded the strategic review of its global asset management business announced in late 2011 by DB's prior management team, and would combine its Asset Management (of which DWS is a part) and Wealth Management divisions. Prior to approving the investment management agreements, the Independent Directors were apprised of the expected management and structure of the new combined Asset & Wealth Management division ("AWM") and DWS. DB also advised the Independent Directors that the U.S. asset management business is a critical and integral part of DB and AWM, and that DB would be reinvesting a significant portion of the substantial savings it expects to realize by combining its Asset Management and Wealth Management divisions into a combined AWM division, including enhancements to its investment capabilities. DB also confirmed its commitment to maintaining strong legal and compliance groups within the combined division.
While shareholders may focus primarily on fund performance and fees, the Fund's Board considers these and many other factors, including the quality and integrity of DWS's and DVM's personnel and such other issues as back-office operations, fund valuations, and compliance policies and procedures.
Nature, Quality and Extent of Services. The Board considered the terms of the Agreements, including the scope of advisory services provided under the Agreements. The Board noted that, under the Agreements, DWS and DVM provide portfolio management services to the Fund and that DWS also provides administrative services to the Fund. The Board considered the experience and skills of senior management and investment personnel, the resources made available to such personnel, the ability of DWS to attract and retain high-quality personnel, and the organizational depth and stability of DWS. The Board also requested and received information regarding DWS's oversight of Fund sub-advisors, including DVM. The Board reviewed the Fund's performance over short-term and long-term periods and compared those returns to various agreed-upon performance measures, including market indices and a peer universe compiled by the independent fee consultant using information supplied by Lipper Inc. ("Lipper"), an independent fund data service. The Board also noted that it has put into place a process of identifying "Focus Funds" (e.g., funds performing poorly relative to their benchmark or a peer universe compiled by an independent fund data service), and receives more frequent reporting and information from DWS regarding such funds, along with DWS's remedial plans to address underperformance. The Board believes this process is an effective manner of identifying and addressing underperforming funds. Based on the information provided, the Board noted that for the one-, three- and five-year periods ended December 31, 2011, the Fund's performance (Class A shares) was in the 3rd quartile, 2nd quartile and 1st quartile, respectively, of the applicable Lipper universe (the 1st quartile being the best performers and the 4th quartile being the worst performers). The Board also observed that the Fund has underperformed its benchmark in the one-, three- and five-year periods ended December 31, 2011.
Fees and Expenses. The Board considered the Fund's investment management fee schedule, sub-advisory fee schedule, operating expenses and total expense ratios, and comparative information provided by Lipper and the independent fee consultant regarding investment management fee rates paid to other investment advisors by similar funds (1st quartile being the most favorable and 4th quartile being the least favorable). With respect to management fees paid to other investment advisors by similar funds, the Board noted that the contractual fee rates paid by the Fund were lower than the median (1st quartile) of the applicable Lipper peer group (based on Lipper data provided as of December 31, 2011). With respect to the sub-advisory fee paid to DVM, the Board noted that the fee is paid by DWS out of its fee and not directly by the Fund. The Board noted that the Fund's Class A shares total (net) operating expenses (excluding 12b-1 fees) were expected to be higher than the median (3rd quartile) of the applicable Lipper expense universe (based on Lipper data provided as of December 31, 2011, and analyzing Lipper expense universe Class A (net) expenses less any applicable 12b-1 fees) ("Lipper Universe Expenses"). The Board also reviewed data comparing each share class's total (net) operating expenses to the applicable Lipper Universe Expenses. The Board considered the Fund's management fee rate as compared to fees charged by DWS and certain of its affiliates for comparable mutual funds and considered differences in fund and fee structures between the DWS Funds. The Board also considered how the Fund's total (net) operating expenses compared to the total (net) operating expenses of a more customized peer group selected by Lipper (based on such factors as asset size). The Board also noted that the expense limitations agreed to by DWS helped to ensure that the Fund's total (net) operating expenses would remain competitive.
The information considered by the Board as part of its review of management fees included information regarding fees charged by DWS and its affiliates to similar institutional accounts and to similar funds offered primarily to European investors ("DWS Europe funds"), in each case as applicable. The Board observed that advisory fee rates for institutional accounts generally were lower than the management fees charged by similarly managed DWS U.S. mutual funds ("DWS Funds"), but also took note of the differences in services provided to DWS Funds as compared to institutional accounts. In the case of DWS Europe funds, the Board observed that fee rates for DWS Europe funds generally were higher than for similarly managed DWS Funds, but noted that differences in the types of services provided to DWS Funds relative to DWS Europe funds made it difficult to compare such fees.
On the basis of the information provided, the Board concluded that management fees were reasonable and appropriate in light of the nature, quality and extent of services provided by DWS and DVM.
Profitability. The Board reviewed detailed information regarding revenues received by DWS under the Agreement. The Board considered the estimated costs and pre-tax profits realized by DWS from advising the DWS Funds, as well as estimates of the pre-tax profits attributable to managing the Fund in particular. The Board also received information regarding the estimated enterprise-wide profitability of DWS and its affiliates with respect to all fund services in totality and by fund. The Board and the independent fee consultant reviewed DWS's methodology in allocating its costs to the management of the Fund. Based on the information provided, the Board concluded that the pre-tax profits realized by DWS in connection with the management of the Fund were not unreasonable. The Board also reviewed information regarding the profitability of certain similar investment management firms. The Board noted that while information regarding the profitability of such firms is limited (and in some cases is not necessarily prepared on a comparable basis), DWS and its affiliates' overall profitability with respect to the DWS fund complex (after taking into account distribution and other services provided to the funds by DWS and its affiliates) was lower than the overall profitability levels of many comparable firms for which such data was available. The Board did not consider the profitability of DVM with respect to the Fund. The Board noted that DWS pays DVM's fee out of its management fee, and its understanding that the Fund's sub-advisory fee schedule was the product of an arm's length negotiation with DWS.
Economies of Scale. The Board considered whether there are economies of scale with respect to the management of the Fund and whether the Fund benefits from any economies of scale. The Board noted that the Fund's management fee schedule includes fee breakpoints. The Board concluded that the Fund's fee schedule represents an appropriate sharing between the Fund and DWS of such economies of scale as may exist in the management of the Fund at current asset levels.
Other Benefits to DWS and DVM and Their Affiliates. The Board also considered the character and amount of other incidental benefits received by DWS and DVM and their affiliates, including any fees received by an affiliate of DWS for distribution services. The Board also considered benefits to DWS related to brokerage and soft-dollar allocations, including allocating brokerage to pay for research generated by parties other than the executing broker dealers, which pertain primarily to funds investing in equity securities, along with the incidental public relations benefits to DWS and DVM related to DWS Funds advertising and cross-selling opportunities among DWS products and services. The Board concluded that management fees were reasonable in light of these fallout benefits.
Compliance. The Board considered the significant attention and resources dedicated by DWS to documenting and enhancing its compliance processes in recent years. The Board noted in particular (i) the experience and seniority of both DWS's chief compliance officer and the Fund's chief compliance officer; (ii) the large number of DWS compliance personnel; and (iii) the substantial commitment of resources by DWS and its affiliates to compliance matters. The Board also considered the attention and resources dedicated by DWS to the oversight of the investment sub-advisor's compliance program and compliance with the applicable fund policies and procedures.
Based on all of the information considered and the conclusions reached, the Board unanimously determined that the continuation of the Agreements is in the best interests of the Fund. In making this determination, the Board did not give particular weight to any single factor identified above. The Board considered these factors over the course of numerous meetings, certain of which were in executive session with only the Independent Directors and their counsel present. It is possible that individual Directors may have weighed these factors differently in reaching their individual decisions to approve the continuation of the Agreements.
Summary of Management Fee Evaluation by Independent Fee Consultant
September 17, 2012
Pursuant to an Order entered into by Deutsche Investment Management Americas and affiliates (collectively, "DeAM") with the Attorney General of New York, I, Thomas H. Mack, have been appointed the Independent Fee Consultant for the DWS Funds (formerly the DWS Scudder Funds). My duties include preparing an annual written evaluation of the management fees DeAM charges the Funds, considering among other factors the management fees charged by other mutual fund companies for like services, management fees DeAM charges other clients for like services, DeAM's costs of supplying services under the management agreements and related profit margins, possible economies of scale if a Fund grows larger, and the nature and quality of DeAM's services, including fund performance. This report summarizes my evaluation for 2012, including my qualifications, the evaluation process for each of the DWS Funds, consideration of certain complex-level factors, and my conclusions. I served in substantially the same capacity in 2007, 2008, 2009, 2010 and 2011.
Qualifications
For more than 35 years I have served in various professional capacities within the investment management business. I have held investment analysis and advisory positions, including securities analyst, portfolio strategist and director of investment policy with a large investment firm. I have also performed business management functions, including business development, financial management and marketing research and analysis.
Since 1991, I have been an independent consultant within the asset management industry. I have provided services to over 125 client organizations, including investment managers, mutual fund boards, product distributors and related organizations. Over the past ten years I have completed a number of assignments for mutual fund boards, specifically including assisting boards with management contract renewal.
I hold a Master of Business Administration degree, with highest honors, from Harvard University and Master of Science and Bachelor of Science (highest honors) degrees from the University of California at Berkeley. I am an independent director and audit committee financial expert for two closed-end mutual funds and have served in various leadership and financial oversight capacities with non-profit organizations.
Evaluation of Fees for each DWS Fund
My work focused primarily on evaluating, fund-by-fund, the fees charged to each of the 103 mutual fund portfolios in the DWS Fund family. For each Fund, I considered each of the key factors mentioned above, as well as any other relevant information. In doing so I worked closely with the Funds' Independent Directors in their annual contract renewal process, as well as in their approval of contracts for several new funds (documented separately).
In evaluating each Fund's fees, I reviewed comprehensive materials provided by or on behalf of DeAM, including expense information prepared by Lipper Analytical, comparative performance information, profitability data, manager histories, and other materials. I also accessed certain additional information from the Lipper and Morningstar databases and drew on my industry knowledge and experience.
To facilitate evaluating this considerable body of information, I prepared for each Fund a document summarizing the key data elements in each area as well as additional analytics discussed below. This made it possible to consider each key data element in the context of the others.
In the course of contract renewal, DeAM agreed to implement a number of fee and expense adjustments requested by the Independent Directors which will favorably impact future fees and expenses, and my evaluation includes the effects of these changes.
Fees and Expenses Compared with Other Funds
The competitive fee and expense evaluation for each fund focused on two primary comparisons:
The Fund's contractual management fee (the advisory fee plus the administration fee where applicable) compared with those of a group of typically 12-15 funds in the same Lipper investment category (e.g. Large Capitalization Growth) having similar distribution arrangements and being of similar size.
The Fund's total expenses compared with a broader universe of funds from the same Lipper investment category and having similar distribution arrangements.
These two comparisons provide a view of not only the level of the fee compared with funds of similar scale but also the total expense the Fund bears for all the services it receives, in comparison with the investment choices available in the Fund's investment category and distribution channel. The principal figure-of-merit used in these comparisons was the subject Fund's percentile ranking against peers.
DeAM's Fees for Similar Services to Others
DeAM provided management fee schedules for all of its US domiciled fund and non-fund investment management accounts in any of the investment categories where there is a DWS Fund. These similar products included the other DWS Funds, non-fund pooled accounts, institutional accounts and sub-advisory accounts. Using this information, I calculated for each Fund the fee that would be charged to each similar product, at the subject Fund's asset level.
Evaluating information regarding non-fund products is difficult because there are varying levels of services required for different types of accounts, with mutual funds generally requiring considerably more regulatory and administrative types of service as well as having more frequent cash flows than other types of accounts. Also, while mutual fund fees for similar fund products can be expected to be similar, there will be some differences due to different pricing conditions in different distribution channels (e.g. retail funds versus those used in variable insurance products), differences in underlying investment processes and other factors.
Costs and Profit Margins
DeAM provided a detailed profitability analysis for each Fund. After making some adjustments so that the presentation would be more comparable to the available industry figures, I reviewed profit margins from investment management alone, from investment management plus other fund services (excluding distribution) provided to the Funds by DeAM (principally shareholder services), and DeAM profits from all sources, including distribution. A later section comments on overall profitability.
Economies of Scale
Economies of scale — an expected decline in management cost per dollar of fund assets as fund assets grow — are very rarely quantified and documented because of inherent difficulties in collecting and analyzing relevant data. However, in virtually every investment category that I reviewed, larger funds tend to have lower fees and lower total expenses than smaller funds. To see how each DWS Fund compares with this industry observation, I reviewed:
The trend in Fund assets over the last five years and the accompanying trend in total expenses. This shows if the Fund has grown and, if so, whether total expense (management fees as well as other expenses) have declined as a percent of assets.
Whether the Fund has break-points in its management fee schedule, the extent of the fee reduction built into the schedule and the asset levels where the breaks take effect, and in the case of a sub-advised Fund how the Fund's break-points compare with those of the sub-advisory fee schedule.
How the Fund's contractual fee schedule compares with trends in the industry data. To accomplish this, I constructed a chart showing how actual latest-fiscal-year contractual fees of the Fund and of other similar funds relate to average fund assets, with the subject Fund's contractual fee schedule superimposed.
Quality of Service — Performance
The quality-of-service evaluation focused on investment performance, which is the principal result of the investment management service. Each Fund's performance was reviewed over the past 1, 3, 5 and 10 years, as applicable, and compared with that of other funds in the same investment category and with a suitable market index.
In addition, I calculated and reviewed risk-adjusted returns relative to an index of similar mutual funds' returns and a suitable market index. The risk-adjusted returns analysis provides a way of determining the extent to which the Fund's return comparisons are mainly the product of investment value-added (or lack thereof) or alternatively taking considerably more or less risk than is typical in its investment category.
I also received and considered the history of portfolio manager changes for each Fund, as this provided an important context for evaluating the performance results.
Complex-Level Considerations
While this evaluation was conducted mainly at the individual fund level, there are some issues relating to the reasonableness of fees that can alternatively be considered across the whole fund complex:
I reviewed DeAM's profitability analysis for all DWS Funds, with a view toward determining if the allocation procedures used were reasonable and how profit levels compared with public data for other investment managers.
I considered whether DeAM and affiliates receive any significant ancillary or "fallout" benefits that should be considered in interpreting the direct profitability results. These would be situations where serving as the investment manager of the Funds is beneficial to another part of the Deutsche Bank organization.
I considered how aggregated DWS Fund expenses had varied over the years, by asset class and in the context of trends in asset levels.
I considered how aggregated DWS Fund performance measures relative to appropriate peers had varied by asset class and over time.
I reviewed the structure of the DeAM organization, trends in staffing levels, and information on compensation of investment management and other professionals compared with industry data.
Findings
Based on the process and analysis discussed above, which included reviewing a wide range of information from management and external data sources and considering among other factors the fees DeAM charges other clients, the fees charged by other fund managers, DeAM's costs and profits associated with managing the Funds, economies of scale, possible fall-out benefits, and the nature and quality of services provided, in my opinion the management fees charged the DWS Funds are reasonable.
Thomas H. Mack
President, Thomas H. Mack & Co., Inc.
Board Members and Officers
The following table presents certain information regarding the Board Members and Officers of the fund. Each Board Member's year of birth is set forth in parentheses after his or her name. Unless otherwise noted, (i) each Board Member has engaged in the principal occupation(s) noted in the table for at least the most recent five years, although not necessarily in the same capacity; and (ii) the address of each Independent Board Member is c/o Kenneth C. Froewiss, Chairman, DWS Mutual Funds, P.O. Box 78, Short Hills, NJ 07078. Except as otherwise noted below, the term of office for each Board Member is until the election and qualification of a successor, or until such Board Member sooner dies, resigns, is removed or as otherwise provided in the governing documents of the fund. Because the fund does not hold an annual meeting of shareholders, each Board Member will hold office for an indeterminate period. The Board Members may also serve in similar capacities with other funds in the fund complex.
| Independent Board Members |
Name, Year of Birth, Position with the Fund and Length of Time Served1 | | Business Experience and Directorships During the Past Five Years | Number of Funds in DWS Fund Complex Overseen |
Other Directorships Held by Board Member |
Kenneth C. Froewiss (1945) Chairperson since 2013,9 and Board Member since 2001 | | Adjunct Professor of Finance, NYU Stern School of Business (September 2009-present; Clinical Professor from 1997-September 2009); Member, Finance Committee, Association for Asian Studies (2002-present); Director, Mitsui Sumitomo Insurance Group (US) (2004-present); prior thereto, Managing Director, J.P. Morgan (investment banking firm) (until 1996) | 103 | — |
William McClayton (1944) Vice Chairperson since 2013,9 and Board Member since 2004 | | Private equity investor (since October 2009); previously, Managing Director, Diamond Management & Technology Consultants, Inc. (global consulting firm) (2001-2009); Directorship: Board of Managers, YMCA of Metropolitan Chicago; formerly: Senior Partner, Arthur Andersen LLP (accounting) (1966-2001); Trustee, Ravinia Festival | 103 | — |
John W. Ballantine (1946) Board Member since 1999 | | Retired; formerly, Executive Vice President and Chief Risk Management Officer, First Chicago NBD Corporation/The First National Bank of Chicago (1996-1998); Executive Vice President and Head of International Banking (1995-1996). Directorships: Stockwell Capital Investments PLC (private equity); former Directorships: First Oak Brook Bancshares, Inc. and Oak Brook Bank; Prisma Energy International | 103 | Chairman of the Board, Healthways, Inc.2 (provider of disease and care management services) (2003- present); Portland General Electric2 (utility company) (2003- present) |
Henry P. Becton, Jr. (1943) Board Member since 1990 | | Vice Chair and former President, WGBH Educational Foundation. Directorships: Public Radio International; Public Radio Exchange (PRX); The PBS Foundation; North Bennett Street School (Boston); former Directorships: Association of Public Television Stations; Boston Museum of Science; American Public Television; Concord Academy; New England Aquarium; Mass. Corporation for Educational Telecommunications; Committee for Economic Development; Public Broadcasting Service; Connecticut College | 103 | Lead Director, Becton Dickinson and Company2 (medical technology company); Lead Director, Belo Corporation2 (media company) |
Dawn-Marie Driscoll (1946) Board Member since 1987 | | President, Driscoll Associates (consulting firm); Emeritus Executive Fellow, Center for Business Ethics, Bentley University; formerly, Partner, Palmer & Dodge (1988-1990); Vice President of Corporate Affairs and General Counsel, Filene's (1978-1988). Directorships: Director of ICI Mutual Insurance Company (since 2007); Advisory Board, Center for Business Ethics, Bentley University; Trustee, Southwest Florida Community Foundation (charitable organization); former Directorships: Sun Capital Advisers Trust (mutual funds) (2007-2012), Investment Company Institute (audit, executive, nominating committees) and Independent Directors Council (governance, executive committees) | 103 | — |
Keith R. Fox, CFA (1954) Board Member since 1996 | | Managing General Partner, Exeter Capital Partners (a series of private investment funds) (since 1986). Directorships: Progressive International Corporation (kitchen goods importer and distributor); The Kennel Shop (retailer); former Chairman, National Association of Small Business Investment Companies; former Directorships: BoxTop Media Inc. (advertising); Sun Capital Advisers Trust (mutual funds) (2011-2012) | 103 | — |
Paul K. Freeman (1950) Board Member since 1993, and Chairperson (2009-Jan. 8, 2013) | | Consultant, World Bank/Inter-American Development Bank; Executive and Governing Council of the Independent Directors Council (Chairman of Education Committee); formerly: Project Leader, International Institute for Applied Systems Analysis (1998-2001); Chief Executive Officer, The Eric Group, Inc. (environmental insurance) (1986-1998); Directorships: Denver Zoo Foundation (December 2012-present); former Directorships: Prisma Energy International | 103 | — |
Richard J. Herring (1946) Board Member since 1990 | | Jacob Safra Professor of International Banking and Professor, Finance Department, The Wharton School, University of Pennsylvania (since July 1972); Co-Director, Wharton Financial Institutions Center (since July 2000); Co-Chair, U.S. Shadow Financial Regulatory Committee; Executive Director, Financial Economists Roundtable; formerly: Vice Dean and Director, Wharton Undergraduate Division (July 1995-June 2000); Director, Lauder Institute of International Management Studies (July 2000-June 2006) | 103 | Director, Japan Equity Fund, Inc. (since September 2007), Thai Capital Fund, Inc. (since 2007), Singapore Fund, Inc. (since September 2007), Independent Director of Barclays Bank Delaware (since September 2010) |
Rebecca W. Rimel (1951) Board Member since 1995 | | President and Chief Executive Officer, The Pew Charitable Trusts (charitable organization) (1994 to present); Trustee, Washington College (2011-2013); formerly: Executive Vice President, The Glenmede Trust Company (investment trust and wealth management) (1983-2004); Board Member, Investor Education (charitable organization) (2004-2005); Trustee, Executive Committee, Philadelphia Chamber of Commerce (2001-2007); Director, Viasys Health Care2 (January 2007-June 2007); Trustee, Pro Publica (charitable organization) (2007-2010); Trustee, Thomas Jefferson Foundation (charitable organization) (1994-2012) | 103 | Director, Becton Dickinson and Company2 (medical technology company) (2012- present); Director, CardioNet, Inc.2 (health care) (2009- present) |
William N. Searcy, Jr. (1946) Board Member since 1993 | | Private investor since October 2003; formerly: Pension & Savings Trust Officer, Sprint Corporation2 (telecommunications) (November 1989-September 2003); Trustee, Sun Capital Advisers Trust (mutual funds) (1998-2012) | 103 | — |
Jean Gleason Stromberg (1943) Board Member since 1997 | | Retired. Formerly, Consultant (1997-2001); Director, Financial Markets U.S. Government Accountability Office (1996-1997); Partner, Fulbright & Jaworski, L.L.P. (law firm) (1978-1996). Directorships: The William and Flora Hewlett Foundation; former Directorships: Service Source, Inc., Mutual Fund Directors Forum (2002-2004), American Bar Retirement Association (funding vehicle for retirement plans) (1987-1990 and 1994-1996) | 103 | — |
Robert H. Wadsworth (1940) Board Member since 1999 | | President, Robert H. Wadsworth & Associates, Inc. (consulting firm) (1983 to present); Director, National Horizon, Inc. (non-profit organization); Director and Treasurer, The Phoenix Boys Choir Association | 106 | — |
Interested Board Member and Officer4 |
Name, Year of Birth, Position with the Fund and Length of Time Served1,6 | | Business Experience and Directorships During the Past Five Years | Number of Funds in DWS Fund Complex Overseen |
Other Directorships Held by Board Member |
Michael J. Woods5 (1967) Board Member since 2013,9 and Executive Vice President since 20139 | | Managing Director,3 Deutsche Asset Management (2009-present); Head of the Americas Asset Management Business for Deutsche Bank, Member of the Asset and Wealth Management ("AWM") Extended Executive Committee, AWM Global Client Group Executive Committee and the AWM Active Asset Management Executive Committee; CEO and US Regional Head of DWS Investments; formerly: Sr. VP, Head of the Financial Intermediaries and Investments Group of Evergreen Investments (2007-2009), CEO and Vice Chairman of Board of Directors of XTF Global Asset Management (2006-2007), Managing Director — US Head of Sub-Advisory and Investment Only Business at Citigroup Asset Management (2000-2006). Mr. Woods is currently a board member of The Children's Village, The Big Brothers Big Sisters Organization, and The Mutual Fund Education Alliance. | 39 | — |
Officers4 |
Name, Year of Birth, Position with the Fund and Length of Time Served6 | | Business Experience and Directorships During the Past Five Years |
W. Douglas Beck, CFA7 (1967) President, 2011-present | | Managing Director,3 Deutsche Asset Management (2006-present); President of DWS family of funds and Head of Product Management, U.S. for DWS Investments; formerly: Executive Director, Head of Product Management (2002-2006) and President (2005-2006) of the UBS Funds at UBS Global Asset Management; Co-Head of Manager Research/Managed Solutions Group, Merrill Lynch (1998-2002) |
John Millette8 (1962) Vice President and Secretary, 1999-present | | Director,3 Deutsche Asset Management |
Paul H. Schubert7 (1963) Chief Financial Officer, 2004-present Treasurer, 2005-present | | Managing Director,3 Deutsche Asset Management (since July 2004); formerly: Executive Director, Head of Mutual Fund Services and Treasurer for UBS Family of Funds (1998-2004); Vice President and Director of Mutual Fund Finance at UBS Global Asset Management (1994-1998) |
Caroline Pearson8 (1962) Chief Legal Officer, 2010-present | | Managing Director,3 Deutsche Asset Management; formerly: Assistant Secretary for DWS family of funds (1997-2010) |
Melinda Morrow7 (1970) Vice President, 2012-present | | Director,3 Deutsche Asset Management |
Hepsen Uzcan8 (1974) Assistant Secretary, since 20139 | | Vice President, Deutsche Asset Management |
Paul Antosca8 (1957) Assistant Treasurer, 2007-present | | Director,3 Deutsche Asset Management |
Jack Clark8 (1967) Assistant Treasurer, 2007-present | | Director,3 Deutsche Asset Management |
Diane Kenneally8 (1966) Assistant Treasurer, 2007-present | | Director,3 Deutsche Asset Management |
John Caruso7 (1965) Anti-Money Laundering Compliance Officer, 2010-present | | Managing Director,3 Deutsche Asset Management |
Robert Kloby7 (1962) Chief Compliance Officer, 2006-present | | Managing Director,3 Deutsche Asset Management |
1 The length of time served represents the year in which the Board Member joined the board of one or more DWS funds currently overseen by the Board.
2 A publicly held company with securities registered pursuant to Section 12 of the Securities Exchange Act of 1934.
3 Executive title, not a board directorship.
4 As a result of their respective positions held with the Advisor, these individuals are considered "interested persons" of the Advisor within the meaning of the 1940 Act. Interested persons receive no compensation from the fund.
5 The mailing address of Mr. Woods is 60 Wall Street, New York, New York 10005. Mr. Woods is an interested Board Member by virtue of his positions with Deutsche Asset Management. As an interested person, Mr. Woods receives no compensation from the fund. Mr. Woods is a board member of the following trusts and corporations: Cash Account Trust, DWS Market Trust, DWS Money Funds, DWS State Tax-Free Income Series, DWS Target Fund, DWS Value Series, Inc., DWS Variable Series II, Investors Cash Trust, Tax-Exempt California Money Market Fund, DWS Global High Income Fund, Inc., DWS High Income Opportunities Fund, Inc., DWS High Income Trust, DWS Multi-Market Income Trust, DWS Municipal Income Trust, DWS Strategic Income Trust and DWS Strategic Municipal Income Trust.
6 The length of time served represents the year in which the officer was first elected in such capacity for one or more DWS funds.
7 Address: 60 Wall Street, New York, NY 10005.
8 Address: One Beacon Street, Boston, MA 02108.
9 Effective as of January 9, 2013.
The fund's Statement of Additional Information ("SAI") includes additional information about the Board Members. The SAI is available, without charge, upon request. If you would like to request a copy of the SAI, you may do so by calling the following toll-free number: (800) 728-3337.
Account Management Resources | |
| For More Information | | The automated telephone system allows you to access personalized account information and obtain information on other DWS funds using either your voice or your telephone keypad. Certain account types within Classes A, B, C and S also have the ability to purchase, exchange or redeem shares using this system. For more information, contact your financial advisor. You may also access our automated telephone system or speak with a DWS Investments representative by calling: (800) 728-3337 |
| Web Site | | www.dws-investments.com View your account transactions and balances, trade shares, monitor your asset allocation, and change your address, 24 hours a day. Obtain prospectuses and applications, blank forms, interactive worksheets, news about DWS funds, subscription to fund updates by e-mail, retirement planning information, and more. |
| Written Correspondence | | DWS Investments PO Box 219151 Kansas City, MO 64121-9151 |
| Proxy Voting | | The fund's policies and procedures for voting proxies for portfolio securities and information about how the fund voted proxies related to its portfolio securities during the 12-month period ended June 30 are available on our Web site — www.dws-investments.com (click on "proxy voting"at the bottom of the page) — or on the SEC's Web site — www.sec.gov. To obtain a written copy of the fund's policies and procedures without charge, upon request, call us toll free at (800) 728-3337. |
| Portfolio Holdings | | Following the fund's fiscal first and third quarter-end, a complete portfolio holdings listing is filed with the SEC on Form N-Q. This form will be available on the SEC's Web site at www.sec.gov, and it also may be reviewed and copied at the SEC's Public Reference Room in Washington, D.C. Information on the operation of the SEC's Public Reference Room may be obtained by calling (800) SEC-0330. The fund's portfolio holdings are also posted on www.dws-investments.com from time to time. Please see the fund's current prospectus for more information. |
| Principal Underwriter | | If you have questions, comments or complaints, contact: DWS Investments Distributors, Inc. 222 South Riverside Plaza Chicago, IL 60606-5808 (800) 621-1148 |
| Investment Advisor | | Deutsche Investment Management Americas Inc. ("DIMA" or the "Advisor"), which is part of Deutsche Asset Management, is the investment advisor for the fund. DIMA and its predecessors have more than 80 years of experience managing mutual funds and DIMA provides a full range of investment advisory services to both institutional and retail clients. DIMA is an indirect, wholly owned subsidiary of Deutsche Bank AG. Deutsche Bank AG is a major global banking institution engaged in a wide variety of financial services, including investment management, retail, private and commercial banking, investment banking and insurance. DWS Investments is the retail brand name in the U.S. for the asset management activities of Deutsche Bank AG and DIMA. As such, DWS is committed to delivering the investing expertise, insight and resources of this global investment platform to American investors. |
| | | Class A | Class B | Class C | Class S | Institutional Class |
| Nasdaq Symbol | | MIDVX | MIDYX | MIDZX | MIDTX | MIDIX |
| CUSIP Number | | 23338F 747 | 23338F 739 | 23338F 721 | 23338F 713 | 23338F 697 |
| Fund Number | | 417 | 617 | 717 | 2117 | 1417 |
| For shareholders of Class R |
| Automated Information Line | | DWS Investments Flex Plan Access (800) 728-3337 24-hour access to your retirement plan account. |
| Web Site | | www.dws-investments.com Click "Retirement Plans" to reallocate assets, process transactions and review your funds through our secure online account access. Obtain prospectuses and applications, blank forms, interactive worksheets, news about DWS funds, subscription to fund updates by e-mail, retirement planning information, and more. |
| For More Information | | (800) 728-3337 To speak with a service representative. |
| Written Correspondence | | DWS Investments Service Company 222 South Riverside Plaza Chicago, IL 60606-5806 |
| Nasdaq Symbol | | MIDQX |
| CUSIP Number | | 23338F 648 |
| Fund Number | | 517 |
Pursuant to the requirements of the Securities Exchange Act of 1934 and the Investment Company Act of 1940, the registrant has duly caused this report to be signed on its behalf by the undersigned, thereunto duly authorized.
Pursuant to the requirements of the Securities Exchange Act of 1934 and the Investment Company Act of 1940, this report has been signed below by the following persons on behalf of the registrant and in the capacities and on the dates indicated.