WASHINGTON, D. C. 20549
DWS Value Series, Inc.
November 30, 2013
Annual Report
to Shareholders
DWS Mid Cap Value Fund
(formerly DWS Dreman Mid Cap Value Fund)
Contents
4 Portfolio Management Review 15 Statement of Assets and Liabilities 17 Statement of Operations 18 Statement of Changes in Net Assets 24 Notes to Financial Statements 35 Report of Independent Registered Public Accounting Firm 36 Information About Your Fund's Expenses 39 Advisory Agreement Board Considerations and Fee Evaluation 44 Board Members and Officers 50 Account Management Resources |
This report must be preceded or accompanied by a prospectus. To obtain a summary prospectus, if available, or prospectus for any of our funds, refer to the Account Management Resources information provided in the back of this booklet. We advise you to consider the fund's objectives, risks, charges and expenses carefully before investing. The summary prospectus and prospectus contain this and other important information about the fund. Please read the prospectus carefully before you invest.
Any fund that focuses in a particular segment of the market will generally be more volatile than a fund that invests more broadly. Stocks of medium-sized companies involve greater risk than securities of larger, more-established companies. The fund may lend securities to approved institutions. Stocks may decline in value. See the prospectus for details.
Deutsche Asset & Wealth Management represents the asset management and wealth management activities conducted by Deutsche Bank AG or any of its subsidiaries, including the Advisor and DWS Investments Distributors, Inc.
NOT FDIC/NCUA INSURED NO BANK GUARANTEE MAY LOSE VALUE NOT A DEPOSIT NOT INSURED BY ANY FEDERAL GOVERNMENT AGENCY
Dear Shareholder:
Having recently joined Deutsche Asset & Wealth Management as president of the DWS funds and head of Fund Administration, I'd like to take this opportunity to introduce myself. I come with 20 years of experience in asset management and the mutual fund industry. My job is to work closely with your fund board to ensure optimal oversight of the DWS funds' management and operations. I look forward to serving in this role on your behalf.
As for the economy, experts seem to agree that both the U.S. and global economies are recovering. Interest rates, while destined to rise to a level more in line with historical "normal" at some point, will likely remain relatively low for the foreseeable future. The stock markets continue to demonstrate strength as housing rebounds, American manufacturing strengthens, the U.S. budget deficit improves and unemployment continues to move lower. However, uncertainty persists regarding the pace of the recovery, the eventual tapering of government bond purchases, the potential for further political gridlock around the fiscal impasse and lingering effects of the financial crisis. All this uncertainty may well contribute to volatility in both the bond and stock markets.
It may help to remember that market fluctuations are not unusual. However, significant market swings may also reflect behavior that is driven more by investor emotion than any fundamental factors relating to the securities in question. If volatility is making you nervous, it may be time to review your investments. A trusted financial advisor can help you determine if a strategy change is appropriate and identify risk management strategies that serve your specific goals and situation.
Best regards,
Brian Binder
President, DWS Funds
Portfolio Management Review (Unaudited)
Market Overview and Fund Performance
All performance information below is historical and does not guarantee future results. Returns shown are for Class A shares, unadjusted for sales charges. Investment return and principal fluctuate, so your shares may be worth more or less when redeemed. Current performance may differ from performance data shown. Please visit dws-investments.com for the most recent month-end performance of all share classes. Fund performance includes reinvestment of all distributions. Unadjusted returns do not reflect sales charges and would have been lower if they had. Please refer to pages 9 through 11 for more complete performance information.
DWS Mid Cap Value Fund returned 34.54% during the 12-month period ended November 30, 2013. The fund's benchmark, the Russell Midcap® Value Index, returned 33.33%.
Investment Process In choosing stocks, we focus on individual security selection rather than industry selection. We use an active process that combines financial analysis with company visits to evaluate management and strategies. Company research lies at the heart of the investment process. We emphasize individual selection of stocks across all economic sectors, focusing on companies that we believe have strong management, identifiable catalysts (e.g., acquisitions or new products) and valuations that offer an attractive risk/reward trade-off. We utilize multiple sources for idea generation, as we believe quantitative screens by themselves are not robust enough to consistently source attractive investment ideas. |
As the return of the benchmark would indicate, mid-cap stocks delivered a strong performance during the past year ended November 30, 2013. The asset class was helped by the combination of improving economic conditions, favorable U.S. Federal Reserve Board (the Fed) policy and elevated investor risk appetites. Mid caps were also boosted by the fact that their business tends to have a more domestic focus than their large-cap counterparts, which enabled them to take advantage of the strength in the U.S. economy in comparison to its global peers. Investors were also encouraged by the robust financial health and steady earnings growth of mid-sized companies.
Performance Attribution
On September 3, 2013, the fund's management team changed. At that point, we began the process of transitioning the portfolio. Due to this change, the fund's 12-month results incorporate the results of two management teams.
Prior to the change in management, the fund outperformed its benchmark. The fund's return benefited from management's strong stock selection in the financial sector, where top individual performers included Lincoln National Corp.,* Unum Group* and Hartford Financial Services Group, Inc. Stock selection in the consumer discretionary sector, as well as an underweight in the underperforming utilities sector, also aided returns. On the negative side, relative performance was hurt by the fund's stock selection in the materials sector, where the mining stocks Yamana Gold, Inc.* and Kinross Gold Corp.* underperformed the rest of the sector by a wide margin.
From the time our team took over the fund through the end of the period ending November 30, 2013, we outperformed the benchmark by a narrow margin. Our performance in this interval was helped by both our sector allocations — namely, an underweight in utilities and an overweight in industrials — and our individual stock selection. With regard to selection, our process was most effective in the financial sector. Notable winners included CNO Financial Group, Inc., PartnerRe Ltd. and Hartford Financial Services Group, Inc. Our process was least effective in health care, where the largest detractor was Questcor Pharmaceuticals, Inc.*
* Not held in the portfolio as of November 30, 2013.
Outlook and Positioning
We employ a "classic value" approach founded in the belief that investor biases can cause quality mid-cap companies to trade below their intrinsic values. We seek to exploit these inefficiencies through intensive, bottom-up fundamental research and a focus on companies with not just attractive valuations, but also catalysts that will cause the value to be recognized by the market. Among these catalysts may be important shifts such as a new product cycle, or changes in industry dynamics or management.
We seek to run a fully invested, diversified portfolio that takes meaningful positions based on our level of conviction and the trade-off of volatility and return potential for each individual stock. Our process tends to construct a portfolio that preserves capital in down markets while trying to capture the majority of the return in up markets.
| "We employ a 'classic value' approach founded in the belief that investor biases can cause quality mid-cap companies to trade below their intrinsic values." |
Following the changeover to the portfolio, we reduced the fund's weightings in financial stocks to about two-thirds of their previous size. We believe banks, real estate investment trusts and diversified financials to be unattractive based on valuation, compared to their historical levels and their limited growth prospects in an environment of heavier regulation. On the other hand, we find insurance stocks to be more compelling based on the favorable pricing environment.
We also made modest reductions to the fund's positions in the energy, information technology and the consumer staples sectors. On the other side of the ledger, we made the largest additions to the consumer discretionary and industrials sectors. This doesn't reflect a top-down view, but rather the fact that we are identifying many of the most attractive individual stocks in these areas. Specifically, we are finding that these sectors are home to a high representation of companies that have attractive balance sheets, strong cash flows and positive catalysts for performance.
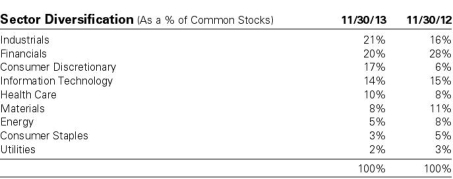
In comparison to the benchmark, the fund's largest overweights as of November 30, 2013 were in the industrials and consumer discretionary sectors, while its largest underweights were in financials and utilities.
Ten Largest Equity Holdings at November 30, 2013 (30.3% of Net Assets) |
1. Newell Rubbermaid, Inc. Manufacturer and marketer of consumer products | 3.3% |
2. Reinsurance Group of America, Inc. Provides life reinsurance in North America | 3.2% |
3. Dolby Laboratories, Inc. Develops audio signal processing systems | 3.2% |
4. Expedia, Inc. Provides branded online travel services for leisure and small business travelers | 3.1% |
5. Global Payments, Inc. Provides electronic transaction processing, information systems and services | 3.1% |
6. Ingredion, Inc. Refines corn and produces sweeteners and starches | 3.0% |
7. Visteon Corp. Supplies automotive systems, modules and components to vehicle manufacturers | 3.0% |
8. Ashland, Inc. Maker and distributor of bulk and specialty chemicals | 2.9% |
9. Hartford Financial Services Group, Inc. Provides a range of insurance products | 2.8% |
10. PartnerRe Ltd. Provides multi-line reinsurance to insurance companies | 2.7% |
Portfolio holdings and characteristics are subject to change. For more complete details about the fund's investment portfolio, see page 12. A quarterly Fact Sheet is available on dws-investments.com or upon request. Please see the Account Management Resources section on page 50 for contact information. |
In terms of our outlook, we would describe the current U.S. economic environment as "fair." While we do not believe the economy is in danger of slipping into a recession, the improvement in the U.S. growth outlook continues to be slow. This is both exemplified and exacerbated by the cautious tone that companies are striking right now. Inventories are very lean, hiring is occurring at a modest pace and overall investment on the company level is limited. This could continue for some time given that government policy largely serves to undermine confidence on both Main Street and Wall Street.
Given this backdrop, the markets in general — and mid-cap stocks in particular — have moved far and fast over the past year. Valuations aren't extreme in any sense, but new investment opportunities have been more difficult to come by. Nevertheless, the fund owns many reasonably valued companies with excellent long-term opportunities. We therefore remain optimistic on the outlooks for the individual companies we hold in the portfolio, despite the potentially challenging near-term environment.
Portfolio Manager
Richard Glass, CFA, Managing Director
Portfolio Manager of the fund. Joined the fund in 2013.
— Joined Deutsche Asset & Wealth Management in 2013 with 22 years of industry experience. Previously, he was lead portfolio manager and Managing Partner of Lockwell Investments, LLC, managing US Small Cap Value and US Small Mid Cap Value strategies. Prior to founding Lockwell in August of 2010, he was a Managing Director and portfolio manager for small- and mid-cap value strategies at Morgan Stanley Investment Management from November 2002 to July 2010. Before joining Morgan Stanley, he held positions with Neuberger Berman and with Wood, Struthers and Winthrop.
— BS in Economics, University of Pennsylvania.
The views expressed reflect those of the portfolio management team only through the end of the period of the report as stated on the cover. The management team's views are subject to change at any time based on market and other conditions and should not be construed as a recommendation. Past performance is no guarantee of future results. Current and future portfolio holdings are subject to risk.
Terms to Know
The Russell Midcap Value Index tracks the performance of those Russell Midcap Index companies with lower price-to-book ratios and lower forecasted growth values. Index returns do not reflect any fees or expenses and it is not possible to invest directly into an index.
The consumer discretionary sector consists of companies that provide nonessential goods and services. Some examples of companies in this sector include retailers, apparel companies and automobile companies.
Overweight means the fund holds a higher weighting in a given sector or security than the benchmark. Underweight means the fund holds a lower weighting.
The consumer staples sector represents essential goods and services such as the food, beverage and prescription industries.
Performance Summary November 30, 2013 (Unaudited) | Class A | 1-Year | 5-Year | Life of Fund* |
Average Annual Total Returns as of 11/30/13 |
| Unadjusted for Sales Charge | 34.54% | 20.59% | 7.51% |
| Adjusted for the Maximum Sales Charge (max 5.75% load) | 26.80% | 19.18% | 6.75% |
Russell Midcap® Value Index† | 33.33% | 21.66% | 7.93% |
| Class B | 1-Year | 5-Year | Life of Fund* |
Average Annual Total Returns as of 11/30/13 |
| Unadjusted for Sales Charge | 33.53% | 19.67% | 6.74% |
| Adjusted for the Maximum Sales Charge (max 4.00% CDSC) | 30.53% | 19.57% | 6.74% |
Russell Midcap® Value Index† | 33.33% | 21.66% | 7.93% |
| Class C | 1-Year | 5-Year | Life of Fund* |
Average Annual Total Returns as of 11/30/13 |
| Unadjusted for Sales Charge | 33.57% | 19.71% | 6.75% |
| Adjusted for the Maximum Sales Charge (max 1.00% CDSC) | 33.57% | 19.71% | 6.75% |
Russell Midcap® Value Index† | 33.33% | 21.66% | 7.93% |
| Class R | 1-Year | 5-Year | Life of Fund* |
Average Annual Total Returns as of 11/30/13 |
| No Sales Charges | 34.30% | 20.30% | 7.21% |
Russell Midcap® Value Index† | 33.33% | 21.66% | 7.93% |
| Class S | 1-Year | 5-Year | Life of Fund* |
Average Annual Total Returns as of 11/30/13 |
| No Sales Charges | 34.95% | 20.91% | 7.86% |
Russell Midcap® Value Index† | 33.33% | 21.66% | 7.93% |
| Institutional Class | 1-Year | 5-Year | Life of Fund* |
Average Annual Total Returns as of 11/30/13 |
| No Sales Charges | 34.89% | 20.96% | 7.93% |
Russell Midcap® Value Index† | 33.33% | 21.66% | 7.93% |
Performance in the Average Annual Total Returns table(s) above and the Growth of an Assumed $10,000 Investment line graph that follows is historical and does not guarantee future results. Investment return and principal fluctuate, so your shares may be worth more or less when redeemed. Current performance may differ from performance data shown. Please visit dws-investments.com for the Fund's most recent month-end performance. Fund performance includes reinvestment of all distributions. Unadjusted returns do not reflect sales charges and would have been lower if they had.
The gross expense ratios of the Fund, as stated in the fee table of the prospectus dated March 1, 2013 are 1.33%, 2.19%, 2.08%, 1.64%, 1.10% and 0.97% for Class A, Class B, Class C, Class R, Class S and Institutional Class shares, respectively, and may differ from the expense ratios disclosed in the Financial Highlights tables in this report.
Index returns do not reflect any fees or expenses and it is not possible to invest directly into an index.
Performance figures do not reflect the deduction of taxes that a shareholder would pay on fund distributions or the redemption of fund shares.
The returns for Class R shares for periods prior to inception on March 1, 2011 are derived from the historical performance of Class A shares of DWS Mid Cap Value Fund during such periods and have been adjusted to reflect higher total annual operating expenses of Class R. Any difference in expenses will affect performance.
Growth of an Assumed $10,000 Investment (Adjusted for Maximum Sales Charge) |
|
|
| Yearly periods ended November 30 |
The Fund's growth of an assumed $10,000 investment is adjusted for the maximum sales charge of 5.75%. This results in a net initial investment of $9,425.
The growth of $10,000 is cumulative.
Performance of other share classes will vary based on the sales charges and the fee structure of those classes.
* The Fund commenced operations on August 2, 2005. The performance shown for the index is for the time period of July 31, 2005 through November 30, 2013 which is based on the performance period of the life of the Fund.
† Russell Midcap Value Index is an unmanaged index measuring the performance of those Russell Midcap companies with lower price-to-book ratios and lower forecasted growth values.
| | | Class A | | | Class B | | | Class C | | | Class R | | | Class S | | | Institutional Class | |
| Net Asset Value | |
| 11/30/13 | | $ | 15.80 | | | $ | 15.69 | | | $ | 15.67 | | | $ | 15.82 | | | $ | 15.81 | | | $ | 15.81 | |
| 11/30/12 | | $ | 11.87 | | | $ | 11.78 | | | $ | 11.77 | | | $ | 11.87 | | | $ | 11.87 | | | $ | 11.89 | |
Distribution Information as of 11/30/13 | |
| Income Dividends, Twelve Months | | $ | .13 | | | $ | .03 | | | $ | .04 | | | $ | .09 | | | $ | .16 | | | $ | .17 | |
Investment Portfolio as of November 30, 2013 | | | Shares | | | Value ($) | |
| | | | |
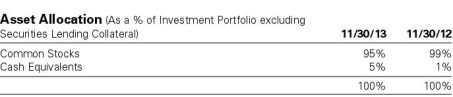
| Common Stocks 95.7% | |
| Consumer Discretionary 16.3% | |
| Auto Components 3.1% | |
| Visteon Corp.* | | | 81,640 | | | | 6,420,170 | |
| Hotels, Restaurants & Leisure 1.4% | |
| The Wendy's Co. | | | 350,308 | | | | 3,016,152 | |
| Household Durables 3.3% | |
| Newell Rubbermaid, Inc. | | | 231,070 | | | | 7,012,974 | |
| Internet & Catalog Retail 3.2% | |
| Expedia, Inc. | | | 104,190 | | | | 6,635,861 | |
| Specialty Retail 2.6% | |
| Ross Stores, Inc. | | | 72,430 | | | | 5,537,998 | |
| Textiles, Apparel & Luxury Goods 2.7% | |
| Hanesbrands, Inc. | | | 81,910 | | | | 5,741,891 | |
| Consumer Staples 3.0% | |
| Food Products | |
| Ingredion, Inc. | | | 92,880 | | | | 6,423,581 | |
| Energy 5.0% | |
| Oil, Gas & Consumable Fuels | |
| Pioneer Natural Resources Co. | | | 27,840 | | | | 4,948,560 | |
| QEP Resources, Inc. | | | 178,320 | | | | 5,709,806 | |
| | | | | | | | 10,658,366 | |
| Financials 19.4% | |
| Commercial Banks 2.0% | |
| M&T Bank Corp. | | | 36,472 | | | | 4,207,410 | |
| Insurance 16.5% | |
| CNO Financial Group, Inc. | | | 324,462 | | | | 5,489,897 | |
| Hartford Financial Services Group, Inc. | | | 165,865 | | | | 5,909,770 | |
| PartnerRe Ltd. | | | 56,335 | | | | 5,796,871 | |
| Reinsurance Group of America, Inc. | | | 90,200 | | | | 6,763,196 | |
| Validus Holdings Ltd. | | | 140,760 | | | | 5,637,438 | |
| XL Group PLC | | | 164,810 | | | | 5,272,272 | |
| | | | | | | | 34,869,444 | |
| Real Estate Investment Trusts 0.9% | |
| Plum Creek Timber Co., Inc. (REIT) | | | 45,304 | | | | 1,981,597 | |
| Health Care 9.2% | |
| Health Care Equipment & Supplies 2.6% | |
| CareFusion Corp.* | | | 135,890 | | | | 5,415,217 | |
| Health Care Providers & Services 5.0% | |
| HealthSouth Corp. | | | 154,850 | | | | 5,542,081 | |
| Omnicare, Inc. | | | 89,600 | | | | 5,132,288 | |
| | | | | | | | 10,674,369 | |
| Life Sciences Tools & Services 1.6% | |
| PerkinElmer, Inc. | | | 88,080 | | | | 3,350,563 | |
| Industrials 19.8% | |
| Building Products 2.7% | |
| Owens Corning* | | | 143,825 | | | | 5,632,187 | |
| Commercial Services & Supplies 4.8% | |
| ADT Corp. | | | 127,903 | | | | 5,187,745 | |
| Covanta Holding Corp. | | | 270,553 | | | | 4,842,899 | |
| | | | | | | | 10,030,644 | |
| Electrical Equipment 2.4% | |
| The Babcock & Wilcox Co. | | | 157,200 | | | | 5,104,284 | |
| Machinery 4.5% | |
| Crane Co. | | | 85,518 | | | | 5,328,627 | |
| Xylem, Inc. | | | 122,726 | | | | 4,241,410 | |
| | | | | | | | 9,570,037 | |
| Marine 2.7% | |
| Kirby Corp.* | | | 60,570 | | | | 5,720,837 | |
| Trading Companies & Distributors 2.7% | |
| AerCap Holdings NV* | | | 271,560 | | | | 5,710,907 | |
| Information Technology 13.1% | |
| Communications Equipment 4.6% | |
| Harris Corp. | | | 86,696 | | | | 5,592,759 | |
| Juniper Networks, Inc.* | | | 206,210 | | | | 4,179,877 | |
| | | | | | | | 9,772,636 | |
| Computers & Peripherals 2.3% | |
| NCR Corp.* | | | 137,988 | | | | 4,822,680 | |
| Electronic Equipment, Instruments & Components 3.2% | |
| Dolby Laboratories, Inc. "A" | | | 186,000 | | | | 6,682,980 | |
| IT Services 3.0% | |
| Global Payments, Inc. | | | 102,240 | | | | 6,446,232 | |
| Materials 7.6% | |
| Chemicals 5.0% | |
| Ashland, Inc. | | | 67,030 | | | | 6,105,092 | |
| Celanese Corp. "A" | | | 80,311 | | | | 4,507,857 | |
| | | | | | | | 10,612,949 | |
| Containers & Packaging 2.6% | |
| Sealed Air Corp. | | | 171,540 | | | | 5,508,149 | |
| Utilities 2.3% | |
| Electric Utilities | |
| Northeast Utilities | | | 118,910 | | | | 4,884,824 | |
Total Common Stocks (Cost $177,965,319) | | | | 202,444,939 | |
| | |
| Cash Equivalents 5.3% | |
| Central Cash Management Fund, 0.07% (a) (Cost $11,325,600) | | | 11,325,600 | | | | 11,325,600 | |
| | | % of Net Assets | | | Value ($) | |
| | | | |
Total Investment Portfolio (Cost $189,290,919)† | | | 101.0 | | | | 213,770,539 | |
| Other Assets and Liabilities, Net | | | (1.0 | ) | | | (2,162,069 | ) |
| Net Assets | | | 100.0 | | | | 211,608,470 | |
* Non-income producing security.
† The cost for federal income tax purposes was $189,290,919. At November 30, 2013, net unrealized appreciation for all securities based on tax cost was $24,479,620. This consisted of aggregate gross unrealized appreciation for all securities in which there was an excess of value over tax cost of $25,432,886 and aggregate gross unrealized depreciation for all securities in which there was an excess of tax cost over value of $953,266.
(a) Affiliated fund managed by Deutsche Investment Management Americas Inc. The rate shown is the annualized seven-day yield at period end.
REIT: Real Estate Investment Trust
Fair Value Measurements
Various inputs are used in determining the value of the Fund's investments. The inputs or methodology used for valuing securities are not necessarily an indication of the risk associated with investing in those securities. These inputs are summarized in three broad levels. Level 1 includes quoted prices in active markets for identical securities. Level 2 includes other significant observable inputs (including quoted prices for similar securities, interest rates, prepayment speeds and credit risk). Level 3 includes significant unobservable inputs (including the Fund's own assumptions in determining the fair value of investments).
The following is a summary of the inputs used as of November 30, 2013 in valuing the Fund's investments. For information on the Fund's policy regarding the valuation of investments, please refer to the Security Valuation section of Note A in the accompanying Notes to Financial Statements.
| Assets | | Level 1 | | | Level 2 | | | Level 3 | | | Total | |
| | |
| Common Stocks (b) | | $ | 202,444,939 | | | $ | — | | | $ | — | | | $ | 202,444,939 | |
| Short-Term Investments | | | 11,325,600 | | | | — | | | | — | | | | 11,325,600 | |
| Total | | $ | 213,770,539 | | | $ | — | | | $ | — | | | $ | 213,770,539 | |
There have been no transfers between fair value measurement levels during the year ended November 30, 2013.
(b) See Investment Portfolio for additional detailed categorizations.
The accompanying notes are an integral part of the financial statements.
Statement of Assets and Liabilities | as of November 30, 2013 | |
| Assets | |
Investments: Investments in non-affiliated securities, at value (cost $177,965,319) | | $ | 202,444,939 | |
| Investment in Central Cash Management Fund (cost $11,325,600) | | | 11,325,600 | |
| Total investments in securities, at value (cost $189,290,919) | | | 213,770,539 | |
| Cash | | | 429,947 | |
| Receivable for Fund shares sold | | | 227,453 | |
| Dividends receivable | | | 238,741 | |
| Interest receivable | | | 606 | |
| Foreign taxes recoverable | | | 2,584 | |
| Due from Advisor | | | 3,185 | |
| Other assets | | | 32,078 | |
| Total assets | | | 214,705,133 | |
| Liabilities | |
| Payable for investments purchased | | | 1,735,931 | |
| Payable for Fund shares redeemed | | | 1,051,662 | |
| Accrued management fee | | | 130,870 | |
| Accrued Directors' fees | | | 3,329 | |
| Other accrued expenses and payables | | | 174,871 | |
| Total liabilities | | | 3,096,663 | |
| Net assets, at value | | $ | 211,608,470 | |
| Net Assets Consist of | |
| Undistributed net investment income | | | 1,610,461 | |
| Net unrealized appreciation (depreciation) on investments | | | 24,479,620 | |
| Accumulated net realized gain (loss) | | | (5,187,531 | ) |
| Paid-in capital | | | 190,705,920 | |
| Net assets, at value | | $ | 211,608,470 | |
The accompanying notes are an integral part of the financial statements.
Statement of Assets and Liabilities as of November 30, 2013 (continued) | |
| Net Asset Value | |
Class A Net Asset Value and redemption price per share ($49,552,584 ÷ 3,136,136 shares of capital stock outstanding, $.01 par value, 75,000,000 shares authorized) | | $ | 15.80 | |
| Maximum offering price per share (100 ÷ 94.25 of $15.80) | | $ | 16.76 | |
Class B Net Asset Value, offering and redemption price (subject to contingent deferred sales charge) per share ($667,096 ÷ 42,525 shares of capital stock outstanding, $.01 par value, 75,000,000 shares authorized) | | $ | 15.69 | |
Class C Net Asset Value, offering and redemption price (subject to contingent deferred sales charge) per share ($17,311,465 ÷ 1,104,777 shares of capital stock outstanding, $.01 par value, 75,000,000 shares authorized) | | $ | 15.67 | |
Class R Net Asset Value, offering and redemption price per share ($1,042,668 ÷ 65,907 shares of capital stock outstanding, $.01 par value, 100,000,000 shares authorized) | | $ | 15.82 | |
Class S Net Asset Value, offering and redemption price per share ($136,188,657 ÷ 8,614,361 shares of capital stock outstanding, $.01 par value, 75,000,000 shares authorized) | | $ | 15.81 | |
Institutional Class Net Asset Value, offering and redemption price per share ($6,846,000 ÷ 432,909 shares of capital stock outstanding, $.01 par value, 75,000,000 shares authorized) | | $ | 15.81 | |
The accompanying notes are an integral part of the financial statements.
| for the year ended November 30, 2013 | |
| Investment Income | |
Income: Dividends (net of foreign taxes withheld of $11,805) | | $ | 4,055,870 | |
| Income distributions — Central Cash Management Fund | | | 5,125 | |
| Securities lending income, including income from Daily Assets Fund Institutional, net of borrower rebates | | | 19,852 | |
| Total income | | | 4,080,847 | |
Expenses: Management fee | | | 1,594,879 | |
| Services to shareholders | | | 416,497 | |
| Distribution and service fees | | | 272,200 | |
| Custodian and accounting fees | | | 38,979 | |
| Professional fees | | | 73,548 | |
| Reports to shareholders | | | 47,653 | |
| Registration fees | | | 77,623 | |
| Directors' fees and expenses | | | 10,653 | |
| Other | | | 14,496 | |
| Total expenses before expense reductions | | | 2,546,528 | |
| Expense reductions | | | (218,717 | ) |
| Total expenses after expense reductions | | | 2,327,811 | |
| Net investment income | | | 1,753,036 | |
| Realized and Unrealized Gain (Loss) | |
| Net realized gain (loss) from investments | | | 50,388,155 | |
| Change in net unrealized appreciation (depreciation) on investments | | | 9,444,002 | |
| Net gain (loss) | | | 59,832,157 | |
| Net increase (decrease) in net assets resulting from operations | | $ | 61,585,193 | |
The accompanying notes are an integral part of the financial statements.
Statement of Changes in Net Assets | | | Years Ended November 30, | |
| Increase (Decrease) in Net Assets | | 2013 | | | 2012 | |
Operations: Net investment income (loss) | | $ | 1,753,036 | | | $ | 2,284,099 | |
| Net realized gain (loss) | | | 50,388,155 | | | | 6,093,602 | |
| Change in net unrealized appreciation (depreciation) | | | 9,444,002 | | | | 16,438,563 | |
| Net increase (decrease) in net assets resulting from operations | | | 61,585,193 | | | | 24,816,264 | |
Distributions to shareholders from: Net investment income: Class A | | | (411,580 | ) | | | (307,663 | ) |
| Class B | | | (3,239 | ) | | | (602 | ) |
| Class C | | | (44,000 | ) | | | (14,075 | ) |
| Class R | | | (2,118 | ) | | | (6 | ) |
| Class S | | | (1,600,423 | ) | | | (1,092,550 | ) |
| Institutional Class | | | (338,744 | ) | | | (285,641 | ) |
| Total distributions | | | (2,400,104 | ) | | | (1,700,537 | ) |
Fund share transactions: Proceeds from shares sold | | | 58,157,073 | | | | 40,922,928 | |
| Reinvestment of distributions | | | 2,223,639 | | | | 1,529,442 | |
| Payments for shares redeemed | | | (108,742,522 | ) | | | (50,409,021 | ) |
| Net increase (decrease) in net assets from Fund share transactions | | | (48,361,810 | ) | | | (7,956,651 | ) |
| Increase (decrease) in net assets | | | 10,823,279 | | | | 15,159,076 | |
| Net assets at beginning of period | | | 200,785,191 | | | | 185,626,115 | |
| Net assets at end of period (including undistributed net investment income of $1,610,461 and $2,257,529, respectively) | | $ | 211,608,470 | | | $ | 200,785,191 | |
The accompanying notes are an integral part of the financial statements.
| | | Years Ended November 30, | |
| Class A | | | 2013 | | | 2012 | | | 2011 | | | 2010 | | | 2009 | |
| Selected Per Share Data | |
| Net asset value, beginning of period | | $ | 11.87 | | | $ | 10.56 | | | $ | 10.43 | | | $ | 9.12 | | | $ | 6.54 | |
Income (loss) from investment operations: Net investment income (loss)a | | | .10 | | | | .12 | | | | .09 | | | | .10 | | | | .13 | |
| Net realized and unrealized gain (loss) | | | 3.96 | | | | 1.27 | | | | .13 | | | | 1.34 | | | | 2.54 | |
| Total from investment operations | | | 4.06 | | | | 1.39 | | | | .22 | | | | 1.44 | | | | 2.67 | |
Less distributions from: Net investment income | | | (.13 | ) | | | (.08 | ) | | | (.09 | ) | | | (.13 | ) | | | (.09 | ) |
| Net asset value, end of period | | $ | 15.80 | | | $ | 11.87 | | | $ | 10.56 | | | $ | 10.43 | | | $ | 9.12 | |
Total Return (%)b | | | 34.54 | c | | | 13.34 | c | | | 2.08 | | | | 15.99 | c | | | 41.27 | c |
| Ratios to Average Net Assets and Supplemental Data | |
| Net assets, end of period ($ millions) | | | 50 | | | | 38 | | | | 40 | | | | 43 | | | | 42 | |
| Ratio of expenses before expense reductions (%) | | | 1.31 | | | | 1.33 | | | | 1.32 | | | | 1.40 | | | | 1.52 | |
| Ratio of expenses after expense reductions (%) | | | 1.22 | | | | 1.31 | | | | 1.32 | | | | 1.37 | | | | 1.34 | |
| Ratio of net investment income (loss) (%) | | | .68 | | | | 1.03 | | | | .81 | | | | 1.01 | | | | 1.76 | |
| Portfolio turnover rate (%) | | | 98 | | | | 28 | | | | 47 | | | | 40 | | | | 67 | |
a Based on average shares outstanding during period. b Total return does not reflect the effect of any sales charges. c Total return would have been lower had certain expenses not been reduced. | |
| | | Years Ended November 30, | |
| Class B | | | 2013 | | | 2012 | | | 2011 | | | 2010 | | | 2009 | |
| Selected Per Share Data | |
| Net asset value, beginning of period | | $ | 11.78 | | | $ | 10.48 | | | $ | 10.35 | | | $ | 9.07 | | | $ | 6.50 | |
Income (loss) from investment operations: Net investment income (loss)a | | | (.00 | )* | | | .02 | | | | .00 | * | | | .03 | | | | .08 | |
| Net realized and unrealized gain (loss) | | | 3.94 | | | | 1.28 | | | | .14 | | | | 1.32 | | | | 2.53 | |
| Total from investment operations | | | 3.94 | | | | 1.30 | | | | .14 | | | | 1.35 | | | | 2.61 | |
Less distributions from: Net investment income | | | (.03 | ) | | | (.00 | )* | | | (.01 | ) | | | (.07 | ) | | | (.04 | ) |
| Net asset value, end of period | | $ | 15.69 | | | $ | 11.78 | | | $ | 10.48 | | | $ | 10.35 | | | $ | 9.07 | |
Total Return (%)b,c | | | 33.53 | | | | 12.44 | | | | 1.33 | | | | 14.93 | | | | 40.34 | |
| Ratios to Average Net Assets and Supplemental Data | |
| Net assets, end of period ($ millions) | | | 1 | | | | 1 | | | | 2 | | | | 3 | | | | 3 | |
| Ratio of expenses before expense reductions (%) | | | 2.16 | | | | 2.19 | | | | 2.15 | | | | 2.27 | | | | 2.54 | |
| Ratio of expenses after expense reductions (%) | | | 1.96 | | | | 2.11 | | | | 2.12 | | | | 2.11 | | | | 2.04 | |
| Ratio of net investment income (loss) (%) | | | (.03 | ) | | | .20 | | | | .01 | | | | .27 | | | | 1.06 | |
| Portfolio turnover rate (%) | | | 98 | | | | 28 | | | | 47 | | | | 40 | | | | 67 | |
a Based on average shares outstanding during the period. b Total return does not reflect the effect of any sales charges. c Total return would have been lower had certain expenses not been reduced. * Amount is less than $.005. | |
| | | Years Ended November 30, | |
| Class C | | | 2013 | | | 2012 | | | 2011 | | | 2010 | | | 2009 | |
| Selected Per Share Data | |
| Net asset value, beginning of period | | $ | 11.77 | | | $ | 10.48 | | | $ | 10.34 | | | $ | 9.06 | | | $ | 6.49 | |
Income (loss) from investment operations: Net investment income (loss)a | | | (.01 | ) | | | .03 | | | | .01 | | | | .03 | | | | .08 | |
| Net realized and unrealized gain (loss) | | | 3.95 | | | | 1.27 | | | | .14 | | | | 1.32 | | | | 2.53 | |
| Total from investment operations | | | 3.94 | | | | 1.30 | | | | .15 | | | | 1.35 | | | | 2.61 | |
Less distributions from: Net investment income | | | (.04 | ) | | | (.01 | ) | | | (.01 | ) | | | (.07 | ) | | | (.04 | ) |
| Net asset value, end of period | | $ | 15.67 | | | $ | 11.77 | | | $ | 10.48 | | | $ | 10.34 | | | $ | 9.06 | |
Total Return (%)b | | | 33.57 | c | | | 12.42 | c | | | 1.45 | | | | 14.94 | c | | | 40.40 | c |
| Ratios to Average Net Assets and Supplemental Data | |
| Net assets, end of period ($ millions) | | | 17 | | | | 13 | | | | 16 | | | | 17 | | | | 15 | |
| Ratio of expenses before expense reductions (%) | | | 2.06 | | | | 2.08 | | | | 2.05 | | | | 2.15 | | | | 2.30 | |
| Ratio of expenses after expense reductions (%) | | | 1.97 | | | | 2.07 | | | | 2.05 | | | | 2.11 | | | | 2.04 | |
| Ratio of net investment income (loss) (%) | | | (.07 | ) | | | .27 | | | | .08 | | | | .27 | | | | 1.06 | |
| Portfolio turnover rate (%) | | | 98 | | | | 28 | | | | 47 | | | | 40 | | | | 67 | |
a Based on average shares outstanding during the period. b Total return does not reflect the effect of any sales charges. c Total return would have been lower had certain expenses not been reduced. | |
| | | Years Ended November 30, | | | | |
| Class R | | 2013 | | | 2012 | | | Period Ended 11/30/11a | |
| Selected Per Share Data | |
| Net asset value, beginning of period | | $ | 11.87 | | | $ | 10.55 | | | $ | 11.66 | |
Income (loss) from investment operations: Net investment income (loss)b | | | .05 | | | | .11 | | | | .05 | |
| Net realized and unrealized gain (loss) | | | 3.99 | | | | 1.26 | | | | (1.16 | ) |
| Total from investment operations | | | 4.04 | | | | 1.37 | | | | (1.11 | ) |
Less distributions from: Net investment income | | | (.09 | ) | | | (.05 | ) | | | — | |
| Net asset value, end of period | | $ | 15.82 | | | $ | 11.87 | | | $ | 10.55 | |
Total Return (%)c | | | 34.30 | | | | 13.08 | | | | (9.52 | )** |
| Ratios to Average Net Assets and Supplemental Data | |
| Net assets, end of period ($ thousands) | | | 1,043 | | | | 229 | | | | 1 | |
| Ratio of expenses before expense reductions (%) | | | 1.61 | | | | 1.64 | | | | 6.24 | * |
| Ratio of expenses after expense reductions (%) | | | 1.47 | | | | 1.59 | | | | 1.57 | * |
| Ratio of net investment income (loss) (%) | | | .35 | | | | .96 | | | | .57 | * |
| Portfolio turnover rate (%) | | | 98 | | | | 28 | | | | 47 | |
a For the period from March 1, 2011 (commencement of Class R shares) to November 30, 2011. b Based on average shares outstanding during the period. c Total return would have been lower had certain expenses not been reduced. * Annualized ** Not annualized | |
| | | Years Ended November 30, | |
| Class S | | | 2013 | | | 2012 | | | 2011 | | | 2010 | | | 2009 | |
| Selected Per Share Data | |
| Net asset value, beginning of period | | $ | 11.87 | | | $ | 10.57 | | | $ | 10.44 | | | $ | 9.15 | | | $ | 6.56 | |
Income (loss) from investment operations: Net investment income (loss)a | | | .13 | | | | .15 | | | | .12 | | | | .12 | | | | .16 | |
| Net realized and unrealized gain (loss) | | | 3.97 | | | | 1.26 | | | | .13 | | | | 1.33 | | | | 2.54 | |
| Total from investment operations | | | 4.10 | | | | 1.41 | | | | .25 | | | | 1.45 | | | | 2.70 | |
Less distributions from: Net investment income | | | (.16 | ) | | | (.11 | ) | | | (.12 | ) | | | (.16 | ) | | | (.11 | ) |
| Net asset value, end of period | | $ | 15.81 | | | $ | 11.87 | | | $ | 10.57 | | | $ | 10.44 | | | $ | 9.15 | |
| Total Return (%) | | | 34.95 | b | | | 13.56 | b | | | 2.38 | | | | 16.13 | b | | | 41.83 | b |
| Ratios to Average Net Assets and Supplemental Data | |
| Net assets, end of period ($ millions) | | | 136 | | | | 121 | | | | 104 | | | | 110 | | | | 97 | |
| Ratio of expenses before expense reductions (%) | | | 1.08 | | | | 1.10 | | | | 1.08 | | | | 1.13 | | | | 1.23 | |
| Ratio of expenses after expense reductions (%) | | | .97 | | | | 1.07 | | | | 1.08 | | | | 1.10 | | | | .99 | |
| Ratio of net investment income (loss) (%) | | | .96 | | | | 1.29 | | | | 1.05 | | | | 1.28 | | | | 2.11 | |
| Portfolio turnover rate (%) | | | 98 | | | | 28 | | | | 47 | | | | 40 | | | | 67 | |
a Based on average shares outstanding during the period. b Total return would have been lower had certain expenses not been reduced. | |
| | | Years Ended November 30, | |
| Institutional Class | | | 2013 | | | 2012 | | | 2011 | | | 2010 | | | 2009 | |
| Selected Per Share Data | |
| Net asset value, beginning of period | | $ | 11.89 | | | $ | 10.59 | | | $ | 10.46 | | | $ | 9.16 | | | $ | 6.57 | |
Income (loss) from investment operations: Net investment income (loss)a | | | .13 | | | | .16 | | | | .13 | | | | .13 | | | | .16 | |
| Net realized and unrealized gain (loss) | | | 3.96 | | | | 1.26 | | | | .13 | | | | 1.33 | | | | 2.54 | |
| Total from investment operations | | | 4.09 | | | | 1.42 | | | | .26 | | | | 1.46 | | | | 2.70 | |
Less distributions from: Net investment income | | | (.17 | ) | | | (.12 | ) | | | (.13 | ) | | | (.16 | ) | | | (.11 | ) |
| Net asset value, end of period | | $ | 15.81 | | | $ | 11.89 | | | $ | 10.59 | | | $ | 10.46 | | | $ | 9.16 | |
| Total Return (%) | | | 34.89 | b | | | 13.67 | b | | | 2.46 | | | | 16.23 | | | | 41.84 | b |
| Ratios to Average Net Assets and Supplemental Data | |
| Net assets, end of period ($ millions) | | | 7 | | | | 27 | | | | 25 | | | | 21 | | | | 18 | |
| Ratio of expenses before expense reductions (%) | | | .98 | | | | .97 | | | | .99 | | | | 1.02 | | | | 1.02 | |
| Ratio of expenses after expense reductions (%) | | | .96 | | | | .97 | | | | .99 | | | | 1.02 | | | | .99 | |
| Ratio of net investment income (loss) (%) | | | .99 | | | | 1.39 | | | | 1.14 | | | | 1.36 | | | | 2.11 | |
| Portfolio turnover rate (%) | | | 98 | | | | 28 | | | | 47 | | | | 40 | | | | 67 | |
a Based on average shares outstanding during the period. b Total return would have been lower had certain expenses not been reduced. | |
Notes to Financial Statements
A. Organization and Significant Accounting Policies
DWS Mid Cap Value Fund (formerly DWS Dreman Mid Cap Value Fund) (the "Fund") is a diversified series of DWS Value Series, Inc. (the "Corporation"), which is registered under the Investment Company Act of 1940, as amended (the "1940 Act"), as an open-end management investment company organized as a Maryland corporation.
The Fund offers multiple classes of shares which provide investors with different purchase options. Class A shares are offered to investors subject to an initial sales charge. Class B shares of the Fund are closed to new purchases, except exchanges or the reinvestment of dividends or other distributions. Class B shares were offered to investors without an initial sales charge and are subject to higher ongoing expenses than Class A shares and a contingent deferred sales charge payable upon certain redemptions. Class B shares automatically convert to Class A shares six years after issuance. Class C shares are offered to investors without an initial sales charge but are subject to higher ongoing expenses than Class A shares and a contingent deferred sales charge payable upon certain redemptions within one year of purchase. Class C shares do not automatically convert into another class. Class R shares are only available to participants in certain retirement plans and are offered to investors without an initial sales charge. Institutional Class shares are generally available only to qualified institutions, are not subject to initial or contingent deferred sales charges and generally have lower ongoing expenses than other classes. Class S shares are not subject to initial or contingent deferred sales charges and are only available to a limited group of investors.
Investment income, realized and unrealized gains and losses, and certain fund-level expenses and expense reductions, if any, are borne pro rata on the basis of relative net assets by the holders of all classes of shares, except that each class bears certain expenses unique to that class such as distribution and service fees, service to shareholders and certain other class-specific expenses. Differences in class-level expenses may result in payment of different per share dividends by class. All shares of the Fund have equal rights with respect to voting subject to class-specific arrangements.
The Fund's financial statements are prepared in accordance with accounting principles generally accepted in the United States of America which require the use of management estimates. Actual results could differ from those estimates. The policies described below are followed consistently by the Fund in the preparation of its financial statements.
Security Valuation. Investments are stated at value determined as of the close of regular trading on the New York Stock Exchange on each day the exchange is open for trading.
Various inputs are used in determining the value of the Fund's investments. The inputs or methodology used for valuing securities are not necessarily an indication of the risk associated with investing in those securities. These inputs are summarized in three broad levels. Level 1 includes quoted prices in active markets for identical securities. Level 2 includes other significant observable inputs (including quoted prices for similar securities, interest rates, prepayment speeds and credit risk). Level 3 includes significant unobservable inputs (including the Fund's own assumptions in determining the fair value of investments).
Equity securities are valued at the most recent sale price or official closing price reported on the exchange (U.S. or foreign) or over-the-counter market on which they trade. Securities for which no sales are reported are valued at the calculated mean between the most recent bid and asked quotations on the relevant market or, if a mean cannot be determined, at the most recent bid quotation. Equity securities are categorized as Level 1.
Investments in open-end investment companies are valued at their net asset value each business day and are categorized as Level 1.
Securities and other assets for which market quotations are not readily available or for which the above valuation procedures are deemed not to reflect fair value are valued in a manner that is intended to reflect their fair value as determined in accordance with procedures approved by the Board and are generally categorized as Level 3. In accordance with the Fund's valuation procedures, factors used in determining value may include, but are not limited to, the type of the security; the size of the holding; the initial cost of the security; the existence of any contractual restrictions on the security's disposition; the price and extent of public trading in similar securities of the issuer or of comparable companies; quotations or evaluated prices from broker-dealers and/or pricing services; information obtained from the issuer, analysts, and/or the appropriate stock exchange (for exchange-traded securities); an analysis of the company's or issuer's financial statements; an evaluation of the forces that influence the issuer and the market(s) in which the security is purchased and sold; and with respect to debt securities, the maturity, coupon, creditworthiness, currency denomination and the movement of the market in which the security is normally traded. The value determined under these procedures may differ from published values for the same securities.
Disclosure about the classification of fair value measurements is included in a table following the Fund's Investment Portfolio.
Foreign Currency Translations. The books and records of the Fund are maintained in U.S. dollars. Investment securities and other assets and liabilities denominated in a foreign currency are translated into U.S. dollars at the prevailing exchange rates at period end. Purchases and sales of investment securities, income and expenses are translated into U.S. dollars at the prevailing exchange rates on the respective dates of the transactions.
Net realized and unrealized gains and losses on foreign currency transactions represent net gains and losses between trade and settlement dates on securities transactions, the acquisition and disposition of foreign currencies, and the difference between the amount of net investment income accrued and the U.S. dollar amount actually received. That portion of both realized and unrealized gains and losses on investments that results from fluctuations in foreign currency exchange rates is not separately disclosed but is included with net realized and unrealized gain/appreciation and loss/depreciation on investments.
Securities Lending. Brown Brothers Harriman & Co., as lending agent, lends securities of the Fund to certain financial institutions under the terms of the Security Lending Agreement. The Fund retains the benefits of owning the securities it has loaned and continues to receive interest and dividends generated by the securities and to participate in any changes in their market value. The Fund requires the borrowers of the securities to maintain collateral with the Fund consisting of either cash or liquid, unencumbered assets having a value at least equal to the value of the securities loaned. When the collateral falls below specified amounts, the lending agent will use its best effort to obtain additional collateral on the next business day to meet required amounts under the security lending agreement. The Fund may invest the cash collateral into a joint trading account in an affiliated money market fund pursuant to Exemptive Orders issued by the SEC. The Fund receives compensation for lending its securities either in the form of fees or by earning interest on invested cash collateral net of borrower rebates and fees paid to a lending agent. Either the Fund or the borrower may terminate the loan. There may be risks of delay and costs in recovery of securities or even loss of rights in the collateral should the borrower of the securities fail financially. If the Fund is not able to recover securities lent, the Fund may sell the collateral and purchase a replacement investment in the market, incurring the risk that the value of the replacement security is greater than the value of the collateral. The Fund is also subject to all investment risks associated with the reinvestment of any cash collateral received, including, but not limited to, interest rate, credit and liquidity risk associated with such investments. As of November 30, 2013, the Fund had no securities on loan.
Federal Income Taxes. The Fund's policy is to comply with the requirements of the Internal Revenue Code, as amended, which are applicable to regulated investment companies, and to distribute all of its taxable income to its shareholders.
Under the Regulated Investment Company Modernization Act of 2010, net capital losses incurred post-enactment may be carried forward indefinitely, and their character is retained as short-term and/or long-term. Previously, net capital losses were carried forward for eight years and treated as short-term losses. As a transition rule, the Act requires that post-enactment net capital losses be used before pre-enactment net capital losses.
At November 30, 2013, the Fund had a net tax basis capital loss carryforward of approximately $4,743,000 of pre-enactment losses, which may be applied against any realized net taxable capital gains of each succeeding year until fully utilized, or until November 30, 2017, the expiration date, whichever occurs first.
In addition, from November 1, 2013 through November 30, 2013, the Fund elects to defer qualified late year losses of approximately $445,000 of net short-term realized capital losses and treat them as arising in the fiscal year ending November 30, 2014.
The Fund has reviewed the tax positions for the open tax years as of November 30, 2013 and has determined that no provision for income tax is required in the Fund's financial statements. The Fund's federal tax returns for the prior three fiscal years remain open subject to examination by the Internal Revenue Service.
Distribution of Income and Gains. Distributions from net investment income of the Fund, if any, are declared and distributed to shareholders annually. Net realized gains from investment transactions, in excess of available capital loss carryforwards, would be taxable to the Fund if not distributed, and, therefore, will be distributed to shareholders at least annually. The fund may also make additional distributions for tax purposes if necessary.
The timing and characterization of certain income and capital gain distributions are determined annually in accordance with federal tax regulations which may differ from accounting principles generally accepted in the United States of America. These differences primarily relate to securities sold at a loss and income received from Real Estate Investment Trusts. As a result, net investment income (loss) and net realized gain (loss) on investment transactions for a reporting period may differ significantly from distributions during such period. Accordingly, the Fund may periodically make reclassifications among certain of its capital accounts without impacting the net asset value of the Fund.
At November 30, 2013, the Fund's components of distributable earnings (accumulated losses) on a tax basis were as follows:
Undistributed ordinary income* | | $ | 1,610,461 | |
| Capital loss carryforwards | | $ | (4,743,000 | ) |
| Net unrealized appreciation (depreciation) on investments | | $ | 24,479,620 | |
In addition, the tax character of distributions paid to shareholders by the Fund is summarized as follows:
| | | Years Ended November 30, | |
| | | 2013 | | | 2012 | |
Distributions from ordinary income* | | $ | 2,400,104 | | | $ | 1,700,537 | |
* For tax purposes, short-term capital gain distributions are considered ordinary income distributions.
Expenses. Expenses of the Corporation arising in connection with a specific fund are allocated to that fund. Other Corporation expenses which cannot be directly attributed to a fund are apportioned among the funds in the Corporation based upon the relative net assets or other appropriate measures.
Contingencies. In the normal course of business, the Fund may enter into contracts with service providers that contain general indemnification clauses. The Fund's maximum exposure under these arrangements is unknown as this would involve future claims that may be made against the Fund that have not yet been made. However, based on experience, the Fund expects the risk of loss to be remote.
Real Estate Investment Trusts. The Fund periodically recharacterizes distributions received from a Real Estate Investment Trust ("REIT") investment based on information provided by the REIT into the following categories: ordinary income, long-term and short-term capital gains, and return of capital. If information is not available timely from a REIT, the recharacterization will be estimated and a recharacterization will be made in the following year when such information becomes available. Distributions received from REITs in excess of income are recorded as either a reduction of cost of investments or realized gains. The Fund distinguishes between dividends received on a tax basis and a financial reporting basis and only distributions in excess of tax basis earnings and profits are reported in the financial statements as a tax return of capital.
Other. Investment transactions are accounted for on a trade date plus one basis for daily net asset valuation calculations. However, for financial reporting purposes, investment transactions are reported on trade date. Interest income is recorded on the accrual basis. Dividend income is recorded on the ex-dividend date net of foreign withholding taxes. Certain dividends from foreign securities may be recorded subsequent to the ex-dividend date as soon as the Fund is informed of such dividends. Realized gains and losses from investment transactions are recorded on an identified cost basis. Proceeds from litigation payments, if any, are included in net realized gain (loss) from investments.
B. Purchases and Sales of Securities
During the year ended November 30, 2013, purchases and sales of investment securities (excluding short-term investments) aggregated $202,060,573 and $257,639,157, respectively.
C. Related Parties
Management Agreement. Under the Investment Management Agreement with Deutsche Investment Management Americas Inc. ("DIMA" or the "Advisor"), an indirect, wholly owned subsidiary of Deutsche Bank AG, the Advisor directs the investments of the Fund in accordance with its investment objectives, policies and restrictions. The Advisor determines the securities, instruments and other contracts relating to investments to be purchased, sold or entered into by the Fund or delegates such responsibility to the Fund's subadvisor. In addition to portfolio management services, the Advisor provides certain administrative services in accordance with the Investment Management Agreement.
Until September 2, 2013, Dreman Value Management, L.L.C. ("DVM") served as subadvisor with respect to the investment and reinvestment of assets of the Fund, and was paid by the Advisor for its services. Effective September 3, 2013, DVM no longer serves as subadvisor to the Fund, and day-to-day portfolio management of the Fund transitioned to DIMA.
Under the Investment Management Agreement with the Advisor, the Fund pays a monthly management fee based on the Fund's average daily net assets, computed and accrued daily and payable monthly, at the following annual rates:
| First $250 million of the Fund's average daily net assets | | | .750 | % |
| Next $250 million of such net assets | | | .720 | % |
| Next $2.0 billion of such net assets | | | .700 | % |
| Next $1.5 billion of such net assets | | | .680 | % |
| Over $4.0 billion of such assets | | | .660 | % |
Accordingly, for the year ended November 30, 2013, the fee pursuant to the Investment Management Agreement was equivalent to an annual effective rate of 0.75% of the Fund's average daily net assets.
For the period from December 1, 2012 through September 30, 2013, the Advisor had contractually agreed to waive its fees and/or reimburse certain operating expenses of the Fund to the extent necessary to maintain the operating expenses (excluding certain expenses such as extraordinary expenses, taxes, brokerage and interest) of each class as follows:
| Class A | 1.21% |
| Class B | 1.96% |
| Class C | 1.96% |
| Class R | 1.46% |
| Class S | .96% |
| Institutional Class | .96% |
Effective October 1, 2013 through September 30, 2014, the Advisor has contractually agreed to waive its fees and/or reimburse certain operating expenses of the Fund to the extent necessary to maintain the operating expenses (excluding certain expenses such as extraordinary expenses, taxes, brokerage and interest) of each class as follows:
| Class A | 1.24% |
| Class B | 1.99% |
| Class C | 1.99% |
| Class R | 1.49% |
| Class S | .99% |
| Institutional Class | .99% |
Service Provider Fees. DWS Investments Service Company ("DISC"), an affiliate of the Advisor, is the transfer agent, dividend-paying agent and shareholder service agent of the Fund. Pursuant to a sub-transfer agency agreement between DISC and DST Systems, Inc. ("DST"), DISC has delegated certain transfer agent, dividend-paying agent and shareholder service agent functions to DST. DISC compensates DST out of the shareholder servicing fee it receives from the Fund. For the year ended November 30, 2013, the amounts charged to the Fund by DISC were as follows:
| Services to Shareholders | | Total Aggregated | | | Waived | | | Unpaid at November 30, 2013 | |
| Class A | | $ | 48,455 | | | $ | 40,534 | | | $ | 1,902 | |
| Class B | | | 2,284 | | | | 1,902 | | | | 51 | |
| Class C | | | 9,602 | | | | 9,602 | | | | — | |
| Class R | | | 516 | | | | 516 | | | | — | |
| Class S | | | 167,059 | | | | 159,359 | | | | — | |
| Institutional Class | | | 2,122 | | | | 2,122 | | | | — | |
| | | $ | 230,038 | | | $ | 214,035 | | | $ | 1,953 | |
In addition, for the year ended November 30, 2013, the Advisor reimbursed $521 of sub-recordkeeping fees for Institutional Class shares.
Pursuant to a fund accounting agreement, DIMA is responsible for computing the daily net asset value per share and maintaining the portfolio and general accounting records of the Fund. DIMA has delegated certain fund accounting and record-keeping services to State Street Bank and Trust Company. The costs and expenses of such delegation are paid by DIMA. For the year ended November 30, 2013, the amount charged to the Fund for accounting services under the fund accounting agreement aggregated $31,898, of which $2,560 is unpaid.
Distribution and Service Fees. Under the Fund's Class B, C and R 12b-1 Plans, DWS Investments Distributors, Inc. ("DIDI"), an affiliate of the Advisor, receives a fee ("Distribution Fee") of 0.75% of average daily net assets of each of Class B and C shares, and 0.25% of the average daily net assets of Class R shares. In accordance with the Fund's Underwriting and Distribution Services Agreement, DIDI enters into related selling group agreements with various firms at various rates for sales of Class B and C shares, respectively. For the year ended November 30, 2013, the Distribution Fee was as follows:
| Distribution Fee | | Total Aggregated | | | Unpaid at November 30, 2013 | |
| Class B | | $ | 7,241 | | | $ | 412 | |
| Class C | | | 113,541 | | | | 10,546 | |
| Class R | | | 1,338 | | | | 203 | |
| | | $ | 122,120 | | | $ | 11,161 | |
In addition, DIDI provides information and administrative services for a fee ("Service Fee") to Class A, B, C and R shareholders at an annual rate of up to 0.25% of average daily net assets for each such class. DIDI in turn has various agreements with financial services firms that provide these services and pays these fees based upon the assets of shareholder accounts the firms service. For the year ended November 30, 2013, the Service Fee was as follows:
| Service Fee | | Total Aggregated | | | Waived | | | Unpaid at November 30, 2013 | | | Annual Effective Rate | |
| Class A | | $ | 108,723 | | | $ | — | | | $ | 30,669 | | | | .24 | % |
| Class B | | | 2,387 | | | | — | | | | 429 | | | | .25 | % |
| Class C | | | 37,635 | | | | 3,927 | | | | 9,927 | | | | .22 | % |
| Class R | | | 1,335 | | | | 234 | | | | 466 | | | | .21 | % |
| | | $ | 150,080 | | | $ | 4,161 | | | $ | 41,491 | | | | | |
Underwriting and Contingent Deferred Sales Charge. DIDI is the principal underwriter for the Fund. Underwriting commissions paid in connection with the distribution of Class A shares for the year ended November 30, 2013 aggregated $7,449.
In addition, DIDI receives any contingent deferred sales charge ("CDSC") from Class B share redemptions occurring within six years of purchase and Class C share redemptions occurring within one year of purchase. There is no such charge upon redemption of any share appreciation or reinvested dividends. The CDSC is based on declining rates, ranging from 4% to 1% for Class B and 1% for Class C, of the value of the shares redeemed. For the year ended November 30, 2013, the CDSC for Class B and C shares aggregated $488 and $944, respectively. A deferred sales charge of up to 1% is assessed on certain redemptions of Class A shares.
Typesetting and Filing Service Fees. Under an agreement with DIMA, DIMA is compensated for providing typesetting and certain regulatory filing services to the Fund. For the year ended November 30, 2013, the amount charged to the Fund by DIMA included in the Statement of Operations under "reports to shareholders" aggregated $16,866, of which $7,148 is unpaid.
Directors' Fees and Expenses. The Fund paid retainer fees to each Director not affiliated with the Advisor, plus specified amounts to the Board Chairperson and Vice Chairperson and to each committee Chairperson.
Affiliated Cash Management Vehicles. The Fund may invest uninvested cash balances in Central Cash Management Fund and DWS Variable NAV Money Fund, affiliated money market funds which are managed by the Advisor. Each affiliated money market fund seeks to provide a high level of current income consistent with liquidity and the preservation of capital. Each affiliated money market fund is managed in accordance with Rule 2a-7 under the Investment Company Act of 1940, which governs the quality, maturity, diversity and liquidity of instruments in which a money market fund may invest. Central Cash Management Fund seeks to maintain a stable net asset value, and DWS Variable NAV Money Fund maintains a floating net asset value. The Fund indirectly bears its proportionate share of the expenses of each affiliated money market fund in which it invests. Central Cash Management Fund does not pay the Advisor an investment management fee. To the extent that DWS Variable NAV Money Fund pays an investment management fee to the Advisor, the Advisor will waive an amount of the investment management fee payable to the Advisor by the Fund equal to the amount of the investment management fee payable on the Fund's assets invested in DWS Variable NAV Money Fund.
D. Line of Credit
The Fund and other affiliated funds (the "Participants") share in a $375 million revolving credit facility provided by a syndication of banks. The Fund may borrow for temporary or emergency purposes, including the meeting of redemption requests that otherwise might require the untimely disposition of securities. The Participants are charged an annual commitment fee which is allocated based on net assets, among each of the Participants. Interest is calculated at a rate per annum equal to the sum of the Federal Funds Rate plus 1.25 percent plus if LIBOR exceeds the Federal Funds Rate the amount of such excess. The Fund may borrow up to a maximum of 33 percent of its net assets under the agreement. The Fund had no outstanding loans at November 30, 2013.
E. Share Transactions
The following table summarizes share and dollar activity in the Fund:
| | | Year Ended November 30, 2013 | | | Year Ended November 30, 2012 | |
| | | Shares | | | Dollars | | | Shares | | | Dollars | |
| Shares sold | |
| Class A | | | 856,653 | | | $ | 12,021,507 | | | | 663,652 | | | $ | 7,408,041 | |
| Class B | | | 5,421 | | | | 72,054 | | | | 943 | | | | 10,191 | |
| Class C | | | 328,921 | | | | 4,650,958 | | | | 175,908 | | | | 1,976,786 | |
| Class R | | | 51,730 | | | | 742,974 | | | | 20,227 | | | | 227,789 | |
| Class S | | | 2,691,526 | | | | 37,471,872 | | | | 2,498,727 | | | | 28,012,806 | |
| Institutional Class | | | 220,791 | | | | 3,197,708 | | | | 294,665 | | | | 3,287,315 | |
| | | | | | | $ | 58,157,073 | | | | | | | $ | 40,922,928 | |
| Shares issued to shareholders in reinvestment of distributions | |
| Class A | | | 33,634 | | | $ | 404,619 | | | | 30,480 | | | $ | 300,231 | |
| Class B | | | 224 | | | | 2,695 | | | | 53 | | | | 527 | |
| Class C | | | 3,271 | | | | 39,323 | | | | 1,195 | | | | 11,757 | |
| Class R | | | 176 | | | | 2,118 | | | | 1 | | | | 6 | |
| Class S | | | 128,155 | | | | 1,539,144 | | | | 102,380 | | | | 1,006,391 | |
| Institutional Class | | | 19,629 | | | | 235,740 | | | | 21,395 | | | | 210,530 | |
| | | | | | | $ | 2,223,639 | | | | | | | $ | 1,529,442 | |
| Shares redeemed | |
| Class A | | | (973,442 | ) | | $ | (13,556,253 | ) | | | (1,225,363 | ) | | $ | (13,779,227 | ) |
| Class B | | | (69,055 | ) | | | (956,462 | ) | | | (82,281 | ) | | | (918,093 | ) |
| Class C | | | (372,209 | ) | | | (5,104,042 | ) | | | (530,801 | ) | | | (5,968,532 | ) |
| Class R | | | (5,262 | ) | | | (75,601 | ) | | | (1,089 | ) | | | (12,456 | ) |
| Class S | | | (4,402,152 | ) | | | (61,974,927 | ) | | | (2,197,305 | ) | | | (24,923,141 | ) |
| Institutional Class | | | (2,040,739 | ) | | | (27,075,237 | ) | | | (424,605 | ) | | | (4,807,572 | ) |
| | | | | | | $ | (108,742,522 | ) | | | | | | $ | (50,409,021 | ) |
| Net increase (decrease) | |
| Class A | | | (83,155 | ) | | $ | (1,130,127 | ) | | | (531,231 | ) | | $ | (6,070,955 | ) |
| Class B | | | (63,410 | ) | | | (881,713 | ) | | | (81,285 | ) | | | (907,375 | ) |
| Class C | | | (40,017 | ) | | | (413,761 | ) | | | (353,698 | ) | | | (3,979,989 | ) |
| Class R | | | 46,644 | | | | 669,491 | | | | 19,139 | | | | 215,339 | |
| Class S | | | (1,582,471 | ) | | | (22,963,911 | ) | | | 403,802 | | | | 4,096,056 | |
| Institutional Class | | | (1,800,319 | ) | | | (23,641,789 | ) | | | (108,545 | ) | | | (1,309,727 | ) |
| | | | | | | $ | (48,361,810 | ) | | | | | | $ | (7,956,651 | ) |
Report of Independent Registered Public Accounting Firm
To the Board of Directors of DWS Value Series, Inc. and Shareholders of DWS Mid Cap Value Fund:
We have audited the accompanying statement of assets and liabilities, including the investment portfolio, of DWS Mid Cap Value Fund (formerly DWS Dreman Mid Cap Value Fund) (one of the series constituting DWS Value Series, Inc. (the "Fund")) as of November 30, 2013, and the related statement of operations for the year then ended, the statements of changes in net assets for each of the two years in the period then ended, and the financial highlights for each of the periods indicated therein. These financial statements and financial highlights are the responsibility of the Fund's management. Our responsibility is to express an opinion on these financial statements and financial highlights based on our audits.
We conducted our audits in accordance with the standards of the Public Company Accounting Oversight Board (United States). Those standards require that we plan and perform the audit to obtain reasonable assurance about whether the financial statements and financial highlights are free of material misstatement. We were not engaged to perform an audit of the Fund's internal control over financial reporting. Our audits included consideration of internal control over financial reporting as a basis for designing audit procedures that are appropriate in the circumstances, but not for the purpose of expressing an opinion on the effectiveness of the Fund's internal control over financial reporting. Accordingly, we express no such opinion. An audit also includes examining, on a test basis, evidence supporting the amounts and disclosures in the financial statements and financial highlights, assessing the accounting principles used and significant estimates made by management, and evaluating the overall financial statement presentation. Our procedures included confirmation of securities owned as of November 30, 2013, by correspondence with the custodian and brokers or by other appropriate auditing procedures where replies from brokers were not received. We believe that our audits provide a reasonable basis for our opinion.
In our opinion, the financial statements and financial highlights referred to above present fairly, in all material respects, the financial position of DWS Mid Cap Value Fund at November 30, 2013, the results of its operations for the year then ended, the changes in its net assets for each of the two years in the period then ended, and the financial highlights for each of the periods indicated therein, in conformity with U.S. generally accepted accounting principles.
| |  |
Boston, Massachusetts January 23, 2014 | |
Information About Your Fund's Expenses
As an investor of the Fund, you incur two types of costs: ongoing expenses and transaction costs. Ongoing expenses include management fees, distribution and service (12b-1) fees and other Fund expenses. Examples of transaction costs include sales charges (loads) and account maintenance fees, which are not shown in this section. The following tables are intended to help you understand your ongoing expenses (in dollars) of investing in the Fund and to help you compare these expenses with the ongoing expenses of investing in other mutual funds. In the most recent six-month period, the Fund limited these expenses; had it not done so, expenses would have been higher. The example in the table is based on an investment of $1,000 invested at the beginning of the six-month period and held for the entire period (June 1, 2013 to November 30, 2013).
The tables illustrate your Fund's expenses in two ways:
—Actual Fund Return. This helps you estimate the actual dollar amount of ongoing expenses (but not transaction costs) paid on a $1,000 investment in the Fund using the Fund's actual return during the period. To estimate the expenses you paid over the period, simply divide your account value by $1,000 (for example, an $8,600 account value divided by $1,000 = 8.6), then multiply the result by the number in the "Expenses Paid per $1,000" line under the share class you hold.
— Hypothetical 5% Fund Return. This helps you to compare your Fund's ongoing expenses (but not transaction costs) with those of other mutual funds using the Fund's actual expense ratio and a hypothetical rate of return of 5% per year before expenses. Examples using a 5% hypothetical fund return may be found in the shareholder reports of other mutual funds. The hypothetical account values and expenses may not be used to estimate the actual ending account balance or expenses you paid for the period.
Please note that the expenses shown in these tables are meant to highlight your ongoing expenses only and do not reflect any transaction costs. The "Expenses Paid per $1,000" line of the tables is useful in comparing ongoing expenses only and will not help you determine the relative total expense of owning different funds. Subject to certain exceptions, an account maintenance fee of $20.00 assessed once per calendar year for Classes A, B, C and S shares may apply for accounts with balances less than $10,000. This fee is not included in these tables. If it was, the estimate of expenses paid for Classes A, B, C and S shares during the period would be higher, and account value during the period would be lower, by this amount.
Expenses and Value of a $1,000 Investment for the six months ended November 30, 2013 (Unaudited) | |
| Actual Fund Return | | Class A | | | Class B | | | Class C | | | Class R | | | Class S | | | Institutional Class | |
| Beginning Account Value 6/1/13 | | $ | 1,000.00 | | | $ | 1,000.00 | | | $ | 1,000.00 | | | $ | 1,000.00 | | | $ | 1,000.00 | | | $ | 1,000.00 | |
| Ending Account Value 11/30/13 | | $ | 1,114.20 | | | $ | 1,110.40 | | | $ | 1,109.80 | | | $ | 1,112.50 | | | $ | 1,115.70 | | | $ | 1,115.70 | |
| Expenses paid per $1,000* | | $ | 6.47 | | | $ | 10.42 | | | $ | 10.42 | | | $ | 7.78 | | | $ | 5.14 | | | $ | 5.14 | |
| Hypothetical 5% Fund Return | | Class A | | | Class B | | | Class C | | | Class R | | | Class S | | | Institutional Class | |
| Beginning Account Value 6/1/13 | | $ | 1,000.00 | | | $ | 1,000.00 | | | $ | 1,000.00 | | | $ | 1,000.00 | | | $ | 1,000.00 | | | $ | 1,000.00 | |
| Ending Account Value 11/30/13 | | $ | 1,018.95 | | | $ | 1,015.19 | | | $ | 1,015.19 | | | $ | 1,017.70 | | | $ | 1,020.21 | | | $ | 1,020.21 | |
| Expenses Paid per $1,000* | | $ | 6.17 | | | $ | 9.95 | | | $ | 9.95 | | | $ | 7.44 | | | $ | 4.91 | | | $ | 4.91 | |
* Expenses are equal to the Fund's annualized expense ratio for each share class, multiplied by the average account value over the period, multiplied by 183 (the number of days in the most recent six-month period), then divided by 365.
| Annualized Expense Ratios | Class A | Class B | Class C | Class R | Class S | Institutional Class |
| DWS Mid Cap Value Fund | 1.22% | 1.97% | 1.97% | 1.47% | .97% | .97% |
For more information, please refer to the Fund's prospectus.
For an analysis of the fees associated with an investment in the Fund or similar funds, please refer to http://apps.finra.org/fundanalyzer/1/fa.aspx.
Tax Information (Unaudited)
For corporate shareholders, 100% of the income dividends paid during the Fund's fiscal year ended November 30, 2013, qualified for the dividends received deduction.
For federal income tax purposes, the Fund designates approximately $4,625,000, or the maximum amount allowable under law, as qualified dividends income.
Please contact a tax advisor if you have questions about federal or state income tax laws, or on how to prepare your tax returns. If you have specific questions about your account, please call (800) 728-3337.
Advisory Agreement Board Considerations and Fee Evaluation
The Board of Directors approved the renewal of DWS Mid Cap Value Fund's investment management agreement (the "Agreement") with Deutsche Investment Management Americas Inc. ("DIMA") in September 2013.
In terms of the process that the Board followed prior to approving the Agreement, shareholders should know that:
— In September 2013, all but one of the Fund's Directors were independent of DIMA and its affiliates.
— The Directors met frequently during the past year to discuss fund matters and dedicated a substantial amount of time to contract review matters. Over the course of several months, the Board's Contract Committee, in coordination with the Board's Equity Oversight Committee, reviewed comprehensive materials received from DIMA, independent third parties and independent counsel. These materials included an analysis of the Fund's performance, fees and expenses, and profitability compiled by a fee consultant retained by the Fund's Independent Directors (the "Fee Consultant"). The Board also received extensive information throughout the year regarding performance of the Fund.
— The Independent Directors regularly meet privately with their independent counsel to discuss contract review and other matters. In addition, the Independent Directors were also advised by the Fee Consultant in the course of their review of the Fund's contractual arrangements and considered a comprehensive report prepared by the Fee Consultant in connection with their deliberations.
— In connection with reviewing the Agreement, the Board also reviewed the terms of the Fund's Rule 12b-1 plan, distribution agreement, transfer agency agreement and other material service agreements.
— Based on its evaluation of the information provided, the Contract Committee presented its findings and recommendations to the Board. The Board then reviewed the Contract Committee's findings and recommendations.
In connection with the contract review process, the Contract Committee and the Board considered the factors discussed below, among others. The Board also considered that DIMA and its predecessors have managed the Fund since its inception, and the Board believes that a long-term relationship with a capable, conscientious advisor is in the best interests of the Fund. The Board considered, generally, that shareholders chose to invest or remain invested in the Fund knowing that DIMA managed the Fund. DIMA is part of Deutsche Bank AG, a major global banking institution that is engaged in a wide range of financial services. The Board believes that there are advantages to being part of a global asset management business that offers a wide range of investing expertise and resources, including hundreds of portfolio managers and analysts with research capabilities in many countries throughout the world.
As part of the contract review process, the Board carefully considered the fees and expenses of each DWS fund overseen by the Board in light of the fund's performance. In many cases, this led to a negotiation with DIMA of lower expense caps as part of the 2012 and 2013 contract review processes than had previously been in place. As part of these negotiations, the Board indicated that it would consider relaxing these new lower caps in future years following sustained improvements in performance, among other considerations.
In June 2012, Deutsche Bank AG ("DB"), DIMA's parent company, announced that DB would combine its Asset Management (of which DIMA was a part) and Wealth Management divisions. DB has advised the Independent Directors that the U.S. asset management business is a critical and integral part of DB, and that it has, and will continue to, reinvest a significant portion of the substantial savings it expects to realize by combining its Asset Management and Wealth Management divisions into the new Asset and Wealth Management ("AWM") division, including ongoing enhancements to its investment capabilities. DB also has confirmed its commitment to maintaining strong legal and compliance groups within the AWM division.
While shareholders may focus primarily on fund performance and fees, the Fund's Board considers these and many other factors, including the quality and integrity of DIMA's personnel and such other issues as back-office operations, fund valuations, and compliance policies and procedures.
Nature, Quality and Extent of Services. The Board considered the terms of the Agreement, including the scope of advisory services provided under the Agreement. The Board noted that, under the Agreement, DIMA provides portfolio management and administrative services to the Fund. The Board considered the experience and skills of senior management and investment personnel, the resources made available to such personnel, the ability of DIMA to attract and retain high-quality personnel, and the organizational depth and stability of DIMA. The Board reviewed the Fund's performance over short-term and long-term periods and compared those returns to various agreed-upon performance measures, including market indices and a peer universe compiled by the Fee Consultant using information supplied by Morningstar Direct ("Morningstar"), an independent fund data service. The Board also noted that it has put into place a process of identifying "Focus Funds" (e.g., funds performing poorly relative to their benchmark or a peer universe compiled by an independent fund data service), and receives more frequent reporting and information from DIMA regarding such funds, along with DIMA's remedial plans to address underperformance. The Board believes this process is an effective manner of identifying and addressing underperforming funds. Based on the information provided, the Board noted that for the one-, three- and five-year periods ended December 31, 2012, the Fund's performance (Class A shares) was in the 2nd quartile, 4th quartile and 3rd quartile, respectively, of the applicable Morningstar universe (the 1st quartile being the best performers and the 4th quartile being the worst performers). The Board also observed that the Fund has underperformed its benchmark in the one-, three- and five-year periods ended December 31, 2012. The Board noted the disappointing investment performance of the Fund in recent periods and continued to discuss with senior management of DIMA the factors contributing to such underperformance and actions being taken to improve performance. The Board recognized that DIMA has made changes to its investment personnel and processes in recent years in an effort to enhance its investment platform and improve long-term performance across the DWS fund complex.
Fees and Expenses. The Board considered the Fund's investment management fee schedule, operating expenses and total expense ratios, and comparative information provided by Lipper Inc. ("Lipper") and the Fee Consultant regarding investment management fee rates paid to other investment advisors by similar funds (1st quartile being the most favorable and 4th quartile being the least favorable). With respect to management fees paid to other investment advisors by similar funds, the Board noted that the contractual fee rates paid by the Fund were lower than the median (1st quartile) of the applicable Lipper peer group (based on Lipper data provided as of December 31, 2012). The Board noted that the Fund's Class A shares total (net) operating expenses (excluding 12b-1 fees) were expected to be lower than the median (2nd quartile) of the applicable Lipper expense universe (based on Lipper data provided as of December 31, 2012, and analyzing Lipper expense universe Class A (net) expenses less any applicable 12b-1 fees) ("Lipper Universe Expenses"). The Board also reviewed data comparing each share class's total (net) operating expenses to the applicable Lipper Universe Expenses. The Board considered the Fund's management fee rate as compared to fees charged by DIMA to a comparable fund and considered differences between the Fund and the comparable fund. The Board also considered how the Fund's total (net) operating expenses compared to the total (net) operating expenses of a more customized peer group selected by Lipper (based on such factors as asset size). The Board also noted that the expense limitations agreed to by DIMA helped to ensure that the Fund's total (net) operating expenses would remain competitive.
The information considered by the Board as part of its review of management fees included information regarding fees charged by DIMA and its affiliates to similar institutional accounts and to similar funds offered primarily to European investors ("DWS Europe funds"), in each case as applicable. The Board observed that advisory fee rates for institutional accounts generally were lower than the management fees charged by similarly managed DWS U.S. mutual funds ("DWS Funds"), but also took note of the differences in services provided to DWS Funds as compared to institutional accounts. In the case of DWS Europe funds, the Board observed that fee rates for DWS Europe funds generally were higher than for similarly managed DWS Funds, but noted that differences in the types of services provided to DWS Funds relative to DWS Europe funds made it difficult to compare such fees.
On the basis of the information provided, the Board concluded that management fees were reasonable and appropriate in light of the nature, quality and extent of services provided by DIMA.
Profitability. The Board reviewed detailed information regarding revenues received by DIMA under the Agreement. The Board considered the estimated costs and pre-tax profits realized by DIMA from advising the DWS Funds, as well as estimates of the pre-tax profits attributable to managing the Fund in particular. The Board also received information regarding the estimated enterprise-wide profitability of DWS and its affiliates with respect to all fund services in totality and by fund. The Board and the Fee Consultant reviewed DIMA's methodology in allocating its costs to the management of the Fund. Based on the information provided, the Board concluded that the pre-tax profits realized by DIMA in connection with the management of the Fund were not unreasonable. The Board also reviewed information regarding the profitability of certain similar investment management firms. The Board noted that while information regarding the profitability of such firms is limited (and in some cases is not necessarily prepared on a comparable basis), DIMA and its affiliates' overall profitability with respect to the DWS fund complex (after taking into account distribution and other services provided to the funds by DIMA and its affiliates) was lower than the overall profitability levels of many comparable firms for which such data was available.
Economies of Scale. The Board considered whether there are economies of scale with respect to the management of the Fund and whether the Fund benefits from any economies of scale. The Board noted that the Fund's management fee schedule includes fee breakpoints. The Board concluded that the Fund's fee schedule represents an appropriate sharing between the Fund and DIMA of such economies of scale as may exist in the management of the Fund at current asset levels.
Other Benefits to DIMA and Its Affiliates. The Board also considered the character and amount of other incidental benefits received by DIMA and its affiliates, including any fees received by an affiliate of DIMA for distribution services. The Board also considered benefits to DIMA related to brokerage and soft-dollar allocations, including allocating brokerage to pay for research generated by parties other than the executing broker dealers, which pertain primarily to funds investing in equity securities, along with the incidental public relations benefits to DIMA related to DWS Funds advertising and cross-selling opportunities among DIMA products and services. The Board concluded that management fees were reasonable in light of these fallout benefits.
Compliance. The Board considered the significant attention and resources dedicated by DIMA to documenting and enhancing its compliance processes in recent years. The Board noted in particular (i) the experience and seniority of both DIMA's chief compliance officer and the Fund's chief compliance officer; (ii) the large number of DIMA compliance personnel; and (iii) the substantial commitment of resources by DIMA and its affiliates to compliance matters.
Based on all of the information considered and the conclusions reached, the Board unanimously determined that the continuation of the Agreement is in the best interests of the Fund. In making this determination, the Board did not give particular weight to any single factor identified above. The Board considered these factors over the course of numerous meetings, certain of which were in executive session with only the Independent Directors and their independent counsel present. It is possible that individual Directors may have weighed these factors differently in reaching their individual decisions to approve the continuation of the Agreement.
Board Members and Officers
The following table presents certain information regarding the Board Members and Officers of the fund. Each Board Member's year of birth is set forth in parentheses after his or her name. Unless otherwise noted, (i) each Board Member has engaged in the principal occupation(s) noted in the table for at least the most recent five years, although not necessarily in the same capacity; and (ii) the address of each Independent Board Member is c/o Kenneth C. Froewiss, Chairman, DWS Mutual Funds, P.O. Box 78, Short Hills, NJ 07078. Except as otherwise noted below, the term of office for each Board Member is until the election and qualification of a successor, or until such Board Member sooner dies, resigns, is removed or as otherwise provided in the governing documents of the fund. Because the fund does not hold an annual meeting of shareholders, each Board Member will hold office for an indeterminate period. The Board Members may also serve in similar capacities with other funds in the fund complex.
| Independent Board Members |
Name, Year of Birth, Position with the Fund and Length of Time Served1 | | Business Experience and Directorships During the Past Five Years | Number of Funds in DWS Fund Complex Overseen | Other Directorships Held by Board Member |
Kenneth C. Froewiss (1945) Chairperson since 2013, and Board Member since 2001 | | Adjunct Professor of Finance, NYU Stern School of Business (September 2009-present; Clinical Professor from 1997-September 2009); Member, Finance Committee, Association for Asian Studies (2002-present); Director, Mitsui Sumitomo Insurance Group (US) (2004-present); prior thereto, Managing Director, J.P. Morgan (investment banking firm) (until 1996) | 103 | — |
William McClayton (1944) Vice Chairperson since 2013, and Board Member since 2004 | | Private equity investor (since October 2009); previously, Managing Director, Diamond Management & Technology Consultants, Inc. (global consulting firm) (2001-2009); Directorship: Board of Managers, YMCA of Metropolitan Chicago; formerly: Senior Partner, Arthur Andersen LLP (accounting) (1966-2001); Trustee, Ravinia Festival | 103 | — |
John W. Ballantine (1946) Board Member since 1999 | | Retired; formerly, Executive Vice President and Chief Risk Management Officer, First Chicago NBD Corporation/The First National Bank of Chicago (1996-1998); Executive Vice President and Head of International Banking (1995-1996); former Directorships: Stockwell Capital Investments PLC (private equity); First Oak Brook Bancshares, Inc. and Oak Brook Bank; Prisma Energy International | 103 | Chairman of the Board, Healthways, Inc.2 (provider of disease and care management services) (2003- present); Portland General Electric2 (utility company) (2003- present) |
Henry P. Becton, Jr. (1943) Board Member since 1990 | | Vice Chair and former President, WGBH Educational Foundation. Directorships: Public Radio International; Public Radio Exchange (PRX); North Bennett Street School (Boston); former Directorships: The PBS Foundation; Association of Public Television Stations; Boston Museum of Science; American Public Television; Concord Academy; New England Aquarium; Mass. Corporation for Educational Telecommunications; Committee for Economic Development; Public Broadcasting Service; Connecticut College | 103 | Lead Director, Becton Dickinson and Company2 (medical technology company); Lead Director, Belo Corporation2 (media company) |
Dawn-Marie Driscoll (1946) Board Member since 1987 | | President, Driscoll Associates (consulting firm); Emeritus Executive Fellow, Center for Business Ethics, Bentley University; formerly, Partner, Palmer & Dodge (1988-1990); Vice President of Corporate Affairs and General Counsel, Filene's (1978-1988). Directorships: Director of ICI Mutual Insurance Company (since 2007); Advisory Board, Center for Business Ethics, Bentley University; Chairman of the Board of Trustees, Southwest Florida Community Foundation (charitable organization); former Directorships: Sun Capital Advisers Trust (mutual funds) (2007-2012), Investment Company Institute (audit, executive, nominating committees) and Independent Directors Council (governance, executive committees) | 103 | — |
Keith R. Fox, CFA (1954) Board Member since 1996 | | Managing General Partner, Exeter Capital Partners (a series of private investment funds) (since 1986). Directorships: Progressive International Corporation (kitchen goods importer and distributor); The Kennel Shop (retailer); former Chairman, National Association of Small Business Investment Companies; former Directorships: BoxTop Media Inc. (advertising); Sun Capital Advisers Trust (mutual funds) (2011-2012) | 103 | — |
Paul K. Freeman (1950) Board Member since 1993 | | Consultant, World Bank/Inter-American Development Bank; Executive and Governing Council of the Independent Directors Council (Chairman of Education Committee); formerly: Project Leader, International Institute for Applied Systems Analysis (1998-2001); Chief Executive Officer, The Eric Group, Inc. (environmental insurance) (1986-1998); Directorships: Denver Zoo Foundation (December 2012-present); former Directorships: Prisma Energy International | 103 | — |
Richard J. Herring (1946) Board Member since 1990 | | Jacob Safra Professor of International Banking and Professor, Finance Department, The Wharton School, University of Pennsylvania (since July 1972); Co-Director, Wharton Financial Institutions Center (since July 2000); Co-Chair, U.S. Shadow Financial Regulatory Committee; Executive Director, Financial Economists Roundtable; formerly: Vice Dean and Director, Wharton Undergraduate Division (July 1995-June 2000); Director, Lauder Institute of International Management Studies (July 2000-June 2006) | 103 | Director, Japan Equity Fund, Inc. (since September 2007), Thai Capital Fund, Inc. (since 2007), Singapore Fund, Inc. (since September 2007), Independent Director of Barclays Bank Delaware (since September 2010) |
Rebecca W. Rimel (1951) Board Member since 1995 | | President and Chief Executive Officer, The Pew Charitable Trusts (charitable organization) (1994 to present); formerly: Executive Vice President, The Glenmede Trust Company (investment trust and wealth management) (1983-2004); Board Member, Investor Education (charitable organization) (2004-2005); Trustee, Executive Committee, Philadelphia Chamber of Commerce (2001-2007); Director, Viasys Health Care2 (January 2007-June 2007); Trustee, Thomas Jefferson Foundation (charitable organization) (1994-2012) | 103 | Director, Becton Dickinson and Company2 (medical technology company) (2012- present); Director, CardioNet, Inc.2 (health care) (2009- present) |
William N. Searcy, Jr. (1946) Board Member since 1993 | | Private investor since October 2003; formerly: Pension & Savings Trust Officer, Sprint Corporation2 (telecommunications) (November 1989-September 2003); Trustee, Sun Capital Advisers Trust (mutual funds) (1998-2012) | 103 | — |
Jean Gleason Stromberg (1943) Board Member since 1997 | | Retired. Formerly, Consultant (1997-2001); Director, Financial Markets U.S. Government Accountability Office (1996-1997); Partner, Fulbright & Jaworski, L.L.P. (law firm) (1978-1996). Directorships: The William and Flora Hewlett Foundation; former Directorships: Service Source, Inc., Mutual Fund Directors Forum (2002-2004), American Bar Retirement Association (funding vehicle for retirement plans) (1987-1990 and 1994-1996) | 103 | — |
Robert H. Wadsworth (1940) Board Member since 1999 | | President, Robert H. Wadsworth & Associates, Inc. (consulting firm) (1983 to present); Director, National Horizon, Inc. (non-profit organization); Director and Treasurer, The Phoenix Boys Choir Association | 106 | — |
Officers4 |
Name, Year of Birth, Position with the Fund and Length of Time Served5 | | Business Experience and Directorships During the Past Five Years |
Brian E. Binder8,9 (1972) President and Chief Executive Officer, 2013-present | | Managing Director3 and Head of Fund Administration, Deutsche Asset & Wealth Management (2013-present); formerly: Head of Business Management and Consulting at Invesco, Ltd. (2010-2012); Chief Administrative Officer, Van Kampen Funds Inc. (2008-2010); and Chief Administrative Officer, Morgan Stanley Investment Management Americas Distribution (2003-2008) |
John Millette7 (1962) Vice President and Secretary, 1999-present | | Director,3 Deutsche Asset & Wealth Management |
Paul H. Schubert6 (1963) Chief Financial Officer, 2004-present Treasurer, 2005-present | | Managing Director,3 Deutsche Asset & Wealth Management (since July 2004); formerly: Executive Director, Head of Mutual Fund Services and Treasurer for UBS Family of Funds (1998-2004); Vice President and Director of Mutual Fund Finance at UBS Global Asset Management (1994-1998) |
Caroline Pearson7 (1962) Chief Legal Officer, 2010-present | | Managing Director,3 Deutsche Asset & Wealth Management; formerly: Assistant Secretary for DWS family of funds (1997-2010) |
Melinda Morrow6 (1970) Vice President, 2012-present | | Director,3 Deutsche Asset & Wealth Management |
Hepsen Uzcan7 (1974) Assistant Secretary, 2013-present | | Vice President, Deutsche Asset & Wealth Management |
Paul Antosca7 (1957) Assistant Treasurer, 2007-present | | Director,3 Deutsche Asset & Wealth Management |
Jack Clark7 (1967) Assistant Treasurer, 2007-present | | Director,3 Deutsche Asset & Wealth Management |
Diane Kenneally7 (1966) Assistant Treasurer, 2007-present | | Director,3 Deutsche Asset & Wealth Management |
John Caruso6 (1965) Anti-Money Laundering Compliance Officer, 2010-present | | Managing Director,3 Deutsche Asset & Wealth Management |
Robert Kloby6 (1962) Chief Compliance Officer, 2006-present | | Managing Director,3 Deutsche Asset & Wealth Management |
1 The length of time served represents the year in which the Board Member joined the board of one or more DWS funds currently overseen by the Board.
2 A publicly held company with securities registered pursuant to Section 12 of the Securities Exchange Act of 1934.
3 Executive title, not a board directorship.
4 As a result of their respective positions held with the Advisor, these individuals are considered "interested persons" of the Advisor within the meaning of the 1940 Act. Interested persons receive no compensation from the fund.
5 The length of time served represents the year in which the officer was first elected in such capacity for one or more DWS funds.
6 Address: 60 Wall Street, New York, NY 10005.
7 Address: One Beacon Street, Boston, MA 02108.
8 Address: 222 South Riverside Plaza, Chicago, IL 60606.
9 Effective as of December 1, 2013.
The fund's Statement of Additional Information ("SAI") includes additional information about the Board Members. The SAI is available, without charge, upon request. If you would like to request a copy of the SAI, you may do so by calling the following toll-free number: (800) 728-3337.
Account Management Resources | |
| For More Information | | The automated telephone system allows you to access personalized account information and obtain information on other DWS funds using either your voice or your telephone keypad. Certain account types within Classes A, B, C and S also have the ability to purchase, exchange or redeem shares using this system. For more information, contact your financial advisor. You may also access our automated telephone system or speak with a Shareholder Service representative by calling: (800) 728-3337 |
| Web Site | | dws-investments.com View your account transactions and balances, trade shares, monitor your asset allocation, subscribe to fund and account updates by e-mail, and change your address, 24 hours a day. Obtain prospectuses and applications, blank forms, interactive worksheets, news about DWS funds, retirement planning information, and more. |
| Written Correspondence | | Deutsche Asset & Wealth Management PO Box 219151 Kansas City, MO 64121-9151 |
| Proxy Voting | | The fund's policies and procedures for voting proxies for portfolio securities and information about how the fund voted proxies related to its portfolio securities during the 12-month period ended June 30 are available on our Web site — dws-investments.com (click on "proxy voting"at the bottom of the page) — or on the SEC's Web site — sec.gov. To obtain a written copy of the fund's policies and procedures without charge, upon request, call us toll free at (800) 728-3337. |
| Portfolio Holdings | | Following the fund's fiscal first and third quarter-end, a complete portfolio holdings listing is filed with the SEC on Form N-Q. This form will be available on the SEC's Web site at sec.gov, and it also may be reviewed and copied at the SEC's Public Reference Room in Washington, D.C. Information on the operation of the SEC's Public Reference Room may be obtained by calling (800) SEC-0330. The fund's portfolio holdings are also posted on dws-investments.com from time to time. Please see the fund's current prospectus for more information. |
| Principal Underwriter | | If you have questions, comments or complaints, contact: DWS Investments Distributors, Inc. 222 South Riverside Plaza Chicago, IL 60606-5808 (800) 621-1148 |
| Investment Advisor | | Deutsche Investment Management Americas Inc. ("DIMA" or the "Advisor"), which is part of Deutsche Asset & Wealth Management, is the investment advisor for the fund. DIMA and its predecessors have more than 80 years of experience managing mutual funds and DIMA provides a full range of investment advisory services to both institutional and retail clients. DIMA is an indirect, wholly owned subsidiary of Deutsche Bank AG. Deutsche Bank AG is a major global banking institution engaged in a wide variety of financial services, including investment management, retail, private and commercial banking, investment banking and insurance. Deutsche Asset & Wealth Management is the retail brand name in the U.S. for the wealth management and asset management activities of Deutsche Bank AG and DIMA. Deutsche Asset & Wealth Management is committed to delivering the investing expertise, insight and resources of this global investment platform to American investors. |
| | | Class A | Class B | Class C | Class S | Institutional Class |
| Nasdaq Symbol | | MIDVX | MIDYX | MIDZX | MIDTX | MIDIX |
| CUSIP Number | | 23338F 747 | 23338F 739 | 23338F 721 | 23338F 713 | 23338F 697 |
| Fund Number | | 417 | 617 | 717 | 2117 | 1417 |
| For shareholders of Class R |
| Automated Information Line | | DWS Investments Flex Plan Access (800) 728-3337 24-hour access to your retirement plan account. |
| Web Site | | dws-investments.com Click "Retirement Plans" to reallocate assets, process transactions, review your funds, and subscribe to fund updates by e-mail through our secure online account access. Obtain prospectuses and applications, blank forms, interactive worksheets, news about DWS funds, retirement planning information, and more. |
| For More Information | | (800) 728-3337 To speak with a service representative. |
| Written Correspondence | | DWS Investments Service Company 222 South Riverside Plaza Chicago, IL 60606-5806 |
| Nasdaq Symbol | | MIDQX |
| CUSIP Number | | 23338F 648 |
| Fund Number | | 517 |
Notes
Notes
Notes
Pursuant to the requirements of the Securities Exchange Act of 1934 and the Investment Company Act of 1940, the registrant has duly caused this report to be signed on its behalf by the undersigned, thereunto duly authorized.
Pursuant to the requirements of the Securities Exchange Act of 1934 and the Investment Company Act of 1940, this report has been signed below by the following persons on behalf of the registrant and in the capacities and on the dates indicated.