Annual Report
and Shareholder Letter
December 31, 2014
Franklin Mutual Beacon Fund
Formerly, Mutual Beacon Fund
Sign up for electronic delivery at franklintempleton.com/edelivery
Franklin Templeton Investments
Gain From Our Perspective®
At Franklin Templeton Investments, we’re dedicated to one goal: delivering exceptional asset management for our clients. By bringing together multiple, world-class investment teams in a single firm, we’re able to offer specialized expertise across styles and asset classes, all supported by the strength and resources of one of the world’s largest asset managers. This has helped us to become a trusted partner to individual and institutional investors across the globe.
Focus on Investment Excellence
At the core of our firm, you’ll find multiple independent investment teams—each with a focused area of expertise—from traditional to alternative strategies and multi-asset solutions. And because our portfolio groups operate autonomously, their strategies can be combined to deliver true style and asset class diversification.
All of our investment teams share a common commitment to excellence grounded in rigorous, fundamental research and robust, disciplined risk management. Decade after decade, our consistent, research-driven processes have helped Franklin Templeton earn an impressive record of strong, long-term results.
Global Perspective Shaped by Local Expertise
In today’s complex and interconnected world, smart investing demands a global perspective. Franklin Templeton pioneered international investing over 60 years ago, and our expertise in emerging markets spans more than a quarter of a century. Today, our investment professionals are on the ground across the globe, spotting investment ideas and potential risks firsthand. These locally based teams bring in-depth understanding of local companies, economies and cultural nuances, and share their best thinking across our global research network.
Strength and Experience
Franklin Templeton is a global leader in asset management serving clients in over 150 countries.1 We run our business with the same prudence we apply to asset management, staying focused on delivering relevant investment solutions, strong long-term results and reliable, personal service. This approach, focused on putting clients first, has helped us to become one of the most trusted names in financial services.
1. As of 12/31/13. Clients are represented by the total number of shareholder accounts.
Not FDIC Insured | May Lose Value | No Bank Guarantee
| Contents | |
| Shareholder Letter | 1 |
| Annual Report | |
| Franklin Mutual Beacon Fund | 4 |
| Performance Summary | 9 |
| Your Fund’s Expenses | 14 |
| Financial Highlights and | |
| Statement of Investments | 16 |
| Financial Statements | 28 |
| Notes to Financial Statements | 32 |
| Report of Independent Registered | |
| Public Accounting Firm | 47 |
| Tax Information | 48 |
| Board Members and Officers | 49 |
| Shareholder Information | 54 |
| 1
Annual Report
Franklin Mutual Beacon Fund
(formerly, Mutual Beacon Fund)
This annual report for Franklin Mutual Beacon Fund covers the fiscal year ended December 31, 2014.
Your Fund’s Goals and Main Investments
The Fund seeks capital appreciation, which may occasionally be short term, with income as a secondary goal, by investing primarily in equity securities of companies the Fund’s managers believe are at prices below their intrinsic value. The Fund may invest up to 35% of its assets in foreign securities.
Performance Overview
The Fund’s Class Z shares delivered a +6.82% cumulative total return for the 12 months ended December 31, 2014. In comparison, the Fund’s benchmark, the Standard & Poor’s 500 Index (S&P 500), which is a broad measure of U.S. stock performance, generated a +13.69% total return.1 You can find more of the Fund’s performance data in the Performance Summary beginning on page 9.
Performance data represent past performance, which does not guarantee future results. Investment return and principal value will fluctuate, and you may have a gain or loss when you sell your shares. Current performance may differ from figures shown. Please visit franklintempleton.com or call (800) 342-5236 for most recent month-end performance.
Economic and Market Overview
The global economy grew moderately during 2014 as U.S. economic growth expanded while growth rates in much of the rest of the world declined. U.S. economic activity was supported in some quarters by increased consumer spending, business investment and federal defense spending. The housing market strengthened, and lower gasoline prices and improved job growth contributed to rising retail sales. The U.S. Federal Reserve Board (Fed) began reducing its large-scale bond purchases $10 billion a month in January and ended the buying program in October. But it continued its practice of maintaining holdings of longer term securities at sizable levels. Toward period-end, the Fed stated that it could be patient with regard to raising interest rates and that the interest rate might not rise for
*Weightings may be negative or may not total 100% due to rounding, use of any derivatives, unsettled trades or other factors.
at least a couple of meetings, possibly implying at least the first two meetings of 2015.
Outside the U.S., the U.K. economy grew relatively well, supported by the services and manufacturing sectors. In the eurozone, economic growth remained subdued, as concerns persisted about the potential negative impacts to growth from the crisis in Ukraine and China’s moderating growth rate. In June, the European Central Bank (ECB) reduced its main interest rate and, for the first time, set a negative deposit rate; the ECB reduced both rates again in September. The ECB
1. Source: Morningstar.
The index is unmanaged and includes reinvested dividends. One cannot invest directly in an index, and an index is not representative of the Fund’s portfolio. See www.franklintempletondatasources.com for additional data provider information.
The dollar value, number of shares or principal amount, and names of all portfolio holdings are listed in the Fund’s Statement of Investments (SOI).
The SOI begins on page 21.
4 | Annual Report
franklintempleton.com
FRANKLIN MUTUAL BEACON FUND
broadened its monetary easing stance by implementing an asset purchase program to prevent deflation and stimulate the economy. Japan’s second- and third-quarter economic contractions indicated the economy was in a recession, although private consumption and exports improved in the third quarter. In October, the Bank of Japan expanded its stimulus measures amid weak domestic demand and as substantially lower crude oil prices exerted further downward pressure on inflation. Near period-end, Japan’s ruling coalition was reelected in early parliamentary elections and subsequently announced a fresh stimulus package aimed at reviving economic growth.
Global developed market stocks, as measured by the MSCI World Index, advanced overall during the 12-month period amid a generally accommodative monetary policy environment and continued strength in corporate earnings. In several emerging markets, economic growth generally moderated. Emerging market stocks overall, as measured by the MSCI Emerging Markets Index, fell for the year, amid headwinds such as soft domestic demand, weak exports, plummeting crude oil prices, regional geopolitical tensions and concerns about possible U.S. interest rate increases. Many emerging market currencies depreciated against the U.S. dollar, leading several central banks to raise interest rates seeking to support their currencies. Several other central banks lowered interest rates to promote economic growth. Gold prices ended the year lower amid benign global inflation and a strong U.S. dollar.
| Top 10 Sectors/Industries | ||
| Based on Equity Securities as of 12/31/14 | ||
| % of Total | ||
| Net Assets | ||
| Media | 14.7 | % |
| Software | 9.3 | % |
| Pharmaceuticals | 9.2 | % |
| Banks | 7.5 | % |
| Tobacco | 5.8 | % |
| Insurance | 5.5 | % |
| Health Care Equipment & Supplies | 4.5 | % |
| Chemicals | 3.3 | % |
| Food & Staples Retailing | 3.3 | % |
| Diversified Telecommunication Services | 2.9 | % |
Investment Strategy
At Mutual Series, we are committed to our distinctive value approach to investing, which we believe can generate above-average risk-adjusted returns over time for our shareholders.
Our major investment strategy is investing in undervalued stocks. When selecting undervalued equities, we are attracted to fundamentally strong companies with healthy balance sheets, high-quality assets, substantial free cash flow and shareholder-oriented management teams and whose stocks are trading at discounts to our assessment of the companies’ intrinsic or business value. We also look for asset rich companies whose shares may be trading at depressed levels due to concerns over short-term earnings disappointments, litigation, management strategy or other perceived negatives. This strict value approach is not only intended to improve the likelihood of upside potential, but it is also intended to reduce the risk of substantial declines. While the vast majority of our undervalued equity investments are made in publicly traded companies globally, we may invest occasionally in privately held companies as well.
We complement this more traditional investment strategy with two others. One is distressed investing, a highly specialized field that has proven quite profitable during certain periods over the years. Distressed investing is complex and can take many forms. The most common distressed investment the Fund undertakes is the purchase of financially troubled or bankrupt companies’ debt at a substantial discount to face value. After the financially distressed company is reorganized, often in bankruptcy court, the old debt is typically replaced with new securities issued by the financially stronger company.
The other piece of our investment strategy is participating in arbitrage situations, another highly specialized field. When companies announce proposed mergers or takeovers, commonly referred to as “deals,” the target company may trade at a discount to the bid it ultimately accepts. One form of arbi-trage involves purchasing the target company’s stock when it is trading below the value we believe it would receive in a deal. In keeping with our commitment to a relatively conservative investment approach, we typically focus our arbitrage efforts on announced deals, and eschew rumored deals or other situations we consider relatively risky.
In addition, it is our practice to hedge the Fund’s currency exposure when we deem it advantageous for our shareholders.
What is meant by “hedge”?
To hedge an investment is to take a position intended to offset potential losses/gains that may be incurred by a companion financial instrument.
Manager’s Discussion
Many Fund holdings increased in value during the 12-month period. Top contributors to performance included software
franklintempleton.com
Annual Report
| 5
FRANKLIN MUTUAL BEACON FUND
company Microsoft, medical device maker Medtronic and Teva Pharmaceutical Industries.
Microsoft shares rose as the company named a new chief executive officer (CEO) in February. We viewed the hiring of Microsoft insider Satya Nadella as positive given his technical background and track record of reaching beyond Microsoft and embracing other technologies. A good example of Nadella’s openness was the March announcement that the company’s Office productivity suite would be made available for the Apple iPad. Nadella also announced a restructuring plan in July. The restructuring was intended to simplify the company’s operations and align the recently acquired Nokia Devices and Services business with the overall strategy.
Medtronic shares rallied in mid-October as the company reaffirmed its commitment to purchasing Ireland-based Covidien at the terms agreed upon when the acquisition was announced in June. Investors had been cautious about the deal after the U.S. Treasury issued a new set of rules in late September intended to limit cross-border merger and acquisition (M&A) deals that could enable U.S.-based companies to lower tax expenses by re-domiciling in countries with lower corporate tax rates. In November, the U.S. Federal Trade Commission approved the company’s acquisition of Covidien with minimal conditions. Medtronic stated that significant cost saving opportunities would arise from the deal and, in our view, those savings may allow Medtronic to further increase its return of free cash flow to shareholders via dividends and share buybacks. Medtronic also received Food and Drug Administration approval in June for its CoreValve self-expanding catheter and positive trial results in April for its Admiral drug-coated angioplasty balloon, both of which we viewed as having potentially meaningful impacts on revenue if they reach the market.
The performance of Israel-based Teva Pharmaceutical Industries was largely driven by positive events related to the company’s most profitable drug, Copaxone, used to prevent the relapse of multiple sclerosis. In March, the U.S. Supreme Court agreed to hear Teva’s appeal (with oral arguments occurring in October) to maintain a patent, which further delayed the entrance of generic competition. The delay provided Teva the opportunity to convert more U.S. patients to its new formulation and allowed it to potentially retain a higher portion of the franchise once generic alternatives entered the market. In December, Teva received more good news regarding Copaxone with the new formulation gaining European Union approval. Investors also reacted favorably to the January 2014 announcement of a new CEO as the market believed he could successfully carry on Teva’s cost-cutting restructuring program.
| Top 10 Equity Holdings | ||
| 12/31/14 | ||
| Company | % of Total | |
| Sector/Industry, Country | Net Assets | |
| Medtronic Inc. | 3.5 | % |
| Health Care Equipment & Supplies, U.S. | ||
| Twenty-First Century Fox Inc., B | 3.4 | % |
| Media, U.S. | ||
| Microsoft Corp. | 3.0 | % |
| Software, U.S. | ||
| Symantec Corp. | 3.0 | % |
| Software, U.S. | ||
| Lorillard Inc. | 2.9 | % |
| Tobacco, U.S. | ||
| Wells Fargo & Co. | 2.8 | % |
| Banks, U.S. | ||
| Merck & Co. Inc. | 2.7 | % |
| Pharmaceuticals, U.S. | ||
| JPMorgan Chase & Co. | 2.6 | % |
| Banks, U.S. | ||
| Koninklijke KPN NV | 2.5 | % |
| Diversified Telecommunication Services, Netherlands | ||
| British American Tobacco PLC | 2.5 | % |
| Tobacco, U.K. |
During the period under review, some of the Fund’s investments negatively affected performance. These included offshore drilling company Transocean, retailer Tesco and natural resources firm Freeport-McMoRan.
Transocean is a Switzerland-headquartered company providing offshore contract drilling services. The offshore drilling market continued to be mired in a downturn with little clarity regarding the length and depth of the current cycle as oil prices plunged during the second half of 2014. Oil companies pushed back projects, leaving a number of new rigs without contracts and increasing potential downtime between jobs for existing rigs. The growing fleet of uncontracted rigs at period-end portended, in our view, weak second-half results and a challenging start to 2015. On a positive note, the company started a Master Limited Partnership (MLP), Transocean Partners, which went public in September. The MLP may provide Transocean with a way to generate cash by selling (dropping down) assets into Transocean Partners while still controlling the operations of those assets.
Shares of U.K.-based Tesco fell throughout 2014. In March, the stock declined as investors became more concerned about price competition from major discounters and competitor supermarkets. Then in August, Tesco issued an unexpected trading statement ahead of its scheduled first-half results. The company lowered its profit guidance primarily for its flagship U.K. oper-
6 | Annual Report
franklintempleton.com
FRANKLIN MUTUAL BEACON FUND
ations and cut its dividend. The stock price took a further hit in September with the announcement of material accounting irregularities in Tesco’s core U.K. operations and a contemporaneous change of both the company’s CEO and chief financial officer. At the end of the year, the company appeared to be at the beginning of what could be a protracted turnaround.
Shares of Freeport-McMoRan came under pressure during 2014 in large part due to falling crude oil prices during the second half of the year, as well as lower prices for copper and gold. The company’s stock also came under pressure from events related to its operations in Indonesia. In early 2014, Indonesia’s government issued new mining-related tax and regulatory policies with the apparent intent to force miners to build smelters within the country. In September, production at the company’s Grasberg mine in Indonesia declined following a fatal accident. The workers’ union subsequently threatened to strike, a development that ultimately did not occur. We took a favorable view of agreements announced in May for Freeport to sell shale assets in Texas and to purchase deepwater oil and gas projects in the Gulf of Mexico. We believe the deepwater assets are more attractive than the shale assets, and proceeds from the shale asset sale allowed Freeport to pay off some of its debt. In addition, we had a favorable view on copper over the longer term as we believed supply shortages were likely in the next few years.
During the period, the Fund held currency forwards and futures to hedge a portion of the currency risk of the portfolio’s non-U.S. dollar investments. The hedges had a positive impact on the Fund’s performance.
What is a currency forward contract?
A currency forward contract, or currency forward, is an agreement between the Fund and a counterparty to buy or sell a foreign currency at a specific exchange rate on a future date.
What is a futures contract?
A futures contract, or a future, is an agreement between the Fund and a counterparty made through a U.S. or foreign futures exchange to buy or sell an asset at a specific price on a future date.
CFA® is a trademark owned by CFA Institute.
As fellow shareholders, we found recent relative performance disappointing, but it is not uncommon for our strategy to lag amid a strong equity market. We remain committed to our disciplined, value investment approach as we seek to generate attractive, long-term, risk-adjusted returns for shareholders. Thank you for your continued participation in Franklin Mutual Beacon Fund. We look forward to continuing to serve your investment needs.
The foregoing information reflects our analysis, opinions and portfolio holdings as of December 31, 2014, the end of the reporting period. The way we implement our main investment strategies and the resulting portfolio holdings may change depending on factors such as market and economic conditions. These opinions may not be relied upon as investment advice or an offer for a particular security. The information is not a complete analysis of every aspect of any market, country, industry, security or the Fund. Statements of fact are from sources considered reliable, but the investment manager makes no representation or warranty as to their completeness or accuracy. Although historical performance is no guarantee of future results, these insights may help you understand our investment management philosophy.
franklintempleton.com
Annual Report
| 7
FRANKLIN MUTUAL BEACON FUND
Christian Correa has been portfolio manager for Franklin
Mutual Beacon Fund (formerly, Mutual Beacon Fund)
since 2007 and a co-portfolio manager since December
2010. He joined Franklin Templeton Investments in 2003
and serves as Director of Research for Franklin Mutual
Advisers. Previously, he covered merger arbitrage and
special situations at Lehman Brothers Holdings Inc.
Aman Gupta has been assistant portfolio manager for
Franklin Mutual Beacon Fund (formerly, Mutual Beacon
Fund) since December 2013 and has been an analyst
for Franklin Mutual Advisers since 2010. Previously,
Mr. Gupta was a senior equity analyst and director at
Evergreen Investments, where he covered the health care
industry with additional responsibilities in the consumer
and industrials sectors.
Mandana Hormozi has been a co-portfolio manager for
Franklin Mutual Beacon Fund (formerly, Mutual Beacon
Fund) since 2010 and was assistant portfolio manager for
the Fund since 2009. Before that, she was assistant portfo-
lio manager for Franklin Mutual Global Discovery Fund
(formerly, Mutual Global Discovery Fund) since 2007.
She has been an analyst for Franklin Mutual Advisers since
2003, when she joined Franklin Templeton Investments.
Previously, she was a senior vice president in the equity
research department at Lazard Freres. Also, she was an
economic research analyst at Mitsubishi Bank.
8 | Annual Report
franklintempleton.com
FRANKLIN MUTUAL BEACON FUND
Performance Summary as of December 31, 2014
Your dividend income will vary depending on dividends or interest paid by securities in the Fund’s portfolio, adjusted for operating expenses of each class. Capital gain distributions are net profits realized from the sale of portfolio securities. The performance table and graphs do not reflect any taxes that a shareholder would pay on Fund dividends, capital gain distributions, if any, or any realized gains on the sale of Fund shares. Total return reflects reinvestment of the Fund’s dividends and capital gain distributions, if any, and any unrealized gains or losses.
| Net Asset Value | ||||||
| Share Class (Symbol) | 12/31/14 | 12/31/13 | Change | |||
| Z (BEGRX) | $ | 16.59 | $ | 16.91 | -$ | 0.32 |
| A (TEBIX) | $ | 16.47 | $ | 16.80 | -$ | 0.33 |
| C (TEMEX) | $ | 16.36 | $ | 16.70 | -$ | 0.34 |
| R (n/a) | $ | 16.33 | $ | 16.68 | -$ | 0.35 |
| R6 (FMBRX) | $ | 16.58 | $ | 16.88 | -$ | 0.30 |
| Distributions (1/1/14 - 12/31/14) | ||||||
| Dividend | Long-Term | |||||
| Share Class | Income | Capital Gain | Total | |||
| Z | $ | 0.6889 | $ | 0.7921 | $ | 1.4810 |
| A | $ | 0.6346 | $ | 0.7921 | $ | 1.4267 |
| C | $ | 0.5105 | $ | 0.7921 | $ | 1.3026 |
| R | $ | 0.6087 | $ | 0.7921 | $ | 1.4008 |
| R6 | $ | 0.7049 | $ | 0.7921 | $ | 1.4970 |
franklintempleton.com
Annual Report
| 9
FRANKLIN MUTUAL BEACON FUND
PERFORMANCE SUMMARY
Performance as of 12/31/14
Cumulative total return excludes sales charges. Average annual total return and value of $10,000 investment include maximum sales charges. Class Z/R/R6: no sales charges; Class A: 5.75% maximum initial sales charge; Class C: 1% contingent deferred sales charge in first year only.
| Cumulative | Average Annual | Value of $10,000 | Total Annual Operating Expenses4 | |||||||||
| Share Class | Total Return1 | Total Return2 | Investment3 | (with waiver) | (without waiver) | |||||||
| Z | N/A | 0.80 | % | |||||||||
| 1-Year | + | 6.82 | % | + | 6.82 | % | $ | 10,682 | ||||
| 5-Year | + | 74.58 | % | + | 11.79 | % | $ | 17,458 | ||||
| 10-Year | + | 84.03 | % | + | 6.29 | % | $ | 18,403 | ||||
| A | N/A | 1.10 | % | |||||||||
| 1-Year | + | 6.48 | % | + | 0.38 | % | $ | 10,038 | ||||
| 5-Year | + | 71.89 | % | + | 10.12 | % | $ | 16,195 | ||||
| 10-Year | + | 78.44 | % | + | 5.34 | % | $ | 16,816 | ||||
| C | N/A | 1.80 | % | |||||||||
| 1-Year | + | 5.78 | % | + | 4.80 | % | $ | 10,480 | ||||
| 5-Year | + | 65.97 | % | + | 10.66 | % | $ | 16,597 | ||||
| 10-Year | + | 66.54 | % | + | 5.23 | % | $ | 16,654 | ||||
| R | N/A | 1.30 | % | |||||||||
| 1-Year | + | 6.31 | % | + | 6.31 | % | $ | 10,631 | ||||
| 5-Year | + | 70.31 | % | + | 11.24 | % | $ | 17,031 | ||||
| Since Inception (10/30/09) | + | 80.92 | % | + | 12.15 | % | $ | 18,092 | ||||
| R65 | 0.71 | % | 2.10 | % | ||||||||
| 1-Year | + | 6.91 | % | + | 6.91 | % | $ | 10,691 | ||||
| Since Inception (5/1/13) | + | 24.91 | % | + | 14.26 | % | $ | 12,491 | ||||
Performance data represent past performance, which does not guarantee future results. Investment return and principal value will fluctuate, and you may have a gain or loss when you sell your shares. Current performance may differ from figures shown. For most recent month-end performance, go to franklintempleton.com or call (800) 342-5236.
10 | Annual Report
franklintempleton.com
FRANKLIN MUTUAL BEACON FUND
PERFORMANCE SUMMARY
Total Return Index Comparison for a Hypothetical $10,000 Investment
Total return represents the change in value of an investment over the periods shown. It includes any applicable maximum sales charge, Fund expenses, account fees and reinvested distributions. The unmanaged index includes reinvestment of any income or distributions. It differs from the Fund in composition and does not pay management fees or expenses. One cannot invest directly in an index.
franklintempleton.com
Annual Report
| 11
FRANKLIN MUTUAL BEACON FUND
PERFORMANCE SUMMARY
Total Return Index Comparison for a Hypothetical $10,000 Investment (continued)
12 | Annual Report
franklintempleton.com
FRANKLIN MUTUAL BEACON FUND
PERFORMANCE SUMMARY
Total Return Index Comparison for a Hypothetical $10,000 Investment (continued)
All investments involve risks, including possible loss of principal. Value securities may not increase in price as anticipated or may decline further in value. The Fund’s investments in smaller company stocks and foreign securities involve special risks. Smaller company stocks have exhibited greater price volatility than larger company stocks, particularly over the short term. Foreign securities risks include currency fluctuations, and economic and political uncertainties. The Fund may also invest in companies engaged in mergers, reorganizations or liquidations, which involve special risks as pending deals may not be completed on time or on favorable terms, as well as lower rated bonds, which entail higher credit risk. The Fund is actively managed but there is no guarantee that the manager’s investment decisions will produce the desired results. The Fund’s prospectus also includes a description of the main investment risks.
Class Z: Shares are available to certain eligible investors as described in the prospectus.
Class C: These shares have higher annual fees and expenses than Class A shares.
Class R: Shares are available to certain eligible investors as described in the prospectus. These shares have higher annual fees and expenses than Class A shares.
Class R6: Shares are available to certain eligible investors as described in the prospectus.
1. Cumulative total return represents the change in value of an investment over the periods indicated.
2. Average annual total return represents the average annual change in value of an investment over the periods indicated.
3. These figures represent the value of a hypothetical $10,000 investment in the Fund over the periods indicated.
4. Figures are as stated in the Fund’s current prospectus. In periods of market volatility, assets may decline significantly, causing total annual Fund operating expenses to
become higher than the figures shown.
5. Class R6 has a fee waiver contractually guaranteed through at least 4/30/15. Investment results reflect the fee waiver to the extent applicable; without this reduction, the
results would have been lower.
6. Source: Morningstar. The S&P 500 is a market capitalization-weighted index of 500 stocks designed to measure total U.S. equity market performance.
See www.franklintempletondatasources.com for additional data provider information.
franklintempleton.com
Annual Report
| 13
FRANKLIN MUTUAL BEACON FUND
Your Fund’s Expenses
As a Fund shareholder, you can incur two types of costs:
- Transaction costs, including sales charges (loads) on Fund purchases; and
- Ongoing Fund costs, including management fees, distribution and service (12b-1) fees, and other Fund expenses. All mutual funds have ongoing costs, sometimes referred to as operating expenses.
The following table shows ongoing costs of investing in the Fund and can help you understand these costs and compare them with those of other mutual funds. The table assumes a $1,000 investment held for the six months indicated.
Actual Fund Expenses
The first line (Actual) for each share class listed in the table provides actual account values and expenses. The “Ending Account Value” is derived from the Fund’s actual return, which includes the effect of Fund expenses.
You can estimate the expenses you paid during the period by following these steps. Of course, your account value and expenses will differ from those in this illustration:
| 1. | Divide your account value by $1,000. |
| If an account had an $8,600 value, then $8,600 ÷ $1,000 = 8.6. | |
| 2. | Multiply the result by the number under the heading “Expenses Paid During Period.” |
| If Expenses Paid During Period were $7.50, then 8.6 x $7.50 = $64.50. |
In this illustration, the estimated expenses paid this period are $64.50.
Hypothetical Example for Comparison with Other Funds
Information in the second line (Hypothetical) for each class in the table can help you compare ongoing costs of investing in the Fund with those of other mutual funds. This information may not be used to estimate the actual ending account balance or expenses you paid during the period. The hypothetical “Ending Account Value” is based on the actual expense ratio for each class and an assumed 5% annual rate of return before expenses, which does not represent the Fund’s actual return. The figure under the heading “Expenses Paid During Period” shows the hypothetical expenses your account would have incurred under this scenario. You can compare this figure with the 5% hypothetical examples that appear in shareholder reports of other funds.
Please note that expenses shown in the table are meant to highlight ongoing costs and do not reflect any transaction costs, such as sales charges. Therefore, the second line for each class is useful in comparing ongoing costs only, and will not help you compare total costs of owning different funds. In addition, if transaction costs were included, your total costs would have been higher. Please refer to the Fund prospectus for additional information on operating expenses.
14 | Annual Report
franklintempleton.com
FRANKLIN MUTUAL BEACON FUND
YOUR FUND’S EXPENSES
| Beginning Account | Ending Account | Expenses Paid During | ||||
| Share Class | Value 7/1/14 | Value 12/31/14 | Period* 7/1/14–12/31/14 | |||
| Z | ||||||
| Actual | $ | 1,000 | $ | 996.90 | $ | 4.23 |
| Hypothetical (5% return before expenses) | $ | 1,000 | $ | 1,020.97 | $ | 4.28 |
| A | ||||||
| Actual | $ | 1,000 | $ | 994.90 | $ | 5.73 |
| Hypothetical (5% return before expenses) | $ | 1,000 | $ | 1,019.46 | $ | 5.80 |
| C | ||||||
| Actual | $ | 1,000 | $ | 991.30 | $ | 9.24 |
| Hypothetical (5% return before expenses) | $ | 1,000 | $ | 1,015.93 | $ | 9.35 |
| R | ||||||
| Actual | $ | 1,000 | $ | 994.00 | $ | 6.73 |
| Hypothetical (5% return before expenses) | $ | 1,000 | $ | 1,018.45 | $ | 6.82 |
| R6 | ||||||
| Actual | $ | 1,000 | $ | 996.60 | $ | 3.77 |
| Hypothetical (5% return before expenses) | $ | 1,000 | $ | 1,021.42 | $ | 3.82 |
*Expenses are calculated using the most recent six-month expense ratio, annualized for each class (Z: 0.84%; A: 1.14%; C: 1.84%; R: 1.34%; and R6: 0.75%), multiplied by the average account value over the period, multiplied by 184/365 to reflect the one-half year period.
franklintempleton.com
Annual Report
| 15
FRANKLIN MUTUAL BEACON FUND
| Financial Highlights | |||||||||||||||
| Year Ended December 31, | |||||||||||||||
| 2014 | 2013 | 2012 | 2011 | 2010 | |||||||||||
| Class Z | |||||||||||||||
| Per share operating performance | |||||||||||||||
| (for a share outstanding throughout the year) | |||||||||||||||
| Net asset value, beginning of year | $ | 16.91 | $ | 13.36 | $ | 11.68 | $ | 12.32 | $ | 11.49 | |||||
| Income from investment operationsa: | |||||||||||||||
| Net investment incomeb | 0.54 | c | 0.31 | 0.24 | 0.28 | 0.36 | d | ||||||||
| Net realized and unrealized gains (losses) | 0.62 | 3.56 | �� | 1.68 | (0.57 | ) | 0.91 | ||||||||
| Total from investment operations | 1.16 | 3.87 | 1.92 | (0.29 | ) | 1.27 | |||||||||
| Less distributions from: | |||||||||||||||
| Net investment income | (0.69 | ) | (0.32 | ) | (0.24 | ) | (0.35 | ) | (0.44 | ) | |||||
| Net realized gains | (0.79 | ) | — | — | — | — | |||||||||
| Total distributions | (1.48 | ) | (0.32 | ) | (0.24 | ) | (0.35 | ) | (0.44 | ) | |||||
| Net asset value, end of year | $ | 16.59 | $ | 16.91 | $ | 13.36 | $ | 11.68 | $ | 12.32 | |||||
| Total return | 6.82 | % | 29.11 | % | 16.44 | % | (2.15 | )% | 11.10 | % | |||||
| Ratios to average net assets | |||||||||||||||
| Expensese | 0.83 | %f | 0.80 | %f | 0.84 | % | 0.84 | % | 0.88 | % | |||||
| Expenses incurred in connection with securities sold short | 0.04 | % | —%g | 0.01 | % | —%g | 0.02 | % | |||||||
| Net investment income | 3.14 | %c | 2.02 | % | 1.87 | % | 2.24 | % | 3.06 | %d | |||||
| Supplemental data | |||||||||||||||
| Net assets, end of year (000’s) | $ | 2,774,929 | $ | 2,876,322 | $ | 2,450,546 | $ | 2,423,177 | $ | 2,860,233 | |||||
| Portfolio turnover rate | 40.06 | % | 32.95 | % | 43.23 | % | 51.38 | % | 34.54 | % | |||||
aThe amount shown for a share outstanding throughout the period may not correlate with the Statement of Operations for the period due to the timing of sales and
repurchases of the Fund shares in relation to income earned and/or fluctuating fair value of the investments of the Fund.
bBased on average daily shares outstanding.
cNet investment income per share includes approximately $0.24 per share received in the form of a special dividend paid in connection with certain Fund’s holdings.
Excluding this amount, the ratio of net investment income to average net assets would have been 1.74%.
dNet investment income per share includes approximately $0.18 per share received in the form of a special dividend paid in connection with a corporate real estate
investment trust (REIT) conversion. Excluding this non-recurring amount, the ratio of net investment income to average net assets would have been 1.53%.
eIncludes dividend and interest expense on securities sold short and security borrowing fees, if any. See below for the ratios of such expenses to average net assets for the
periods presented. See Note 1(e).
fBenefit of expense reduction rounds to less than 0.01%.
gRounds to less than 0.01%.
16 | Annual Report | The accompanying notes are an integral part of these financial statements.
franklintempleton.com
| FRANKLIN MUTUAL BEACON FUND | |||||||||||||||
| FINANCIAL HIGHLIGHTS | |||||||||||||||
| Year Ended December 31, | |||||||||||||||
| 2014 | 2013 | 2012 | 2011 | 2010 | |||||||||||
| Class A | |||||||||||||||
| Per share operating performance | |||||||||||||||
| (for a share outstanding throughout the year) | |||||||||||||||
| Net asset value, beginning of year | $ | 16.80 | $ | 13.28 | $ | 11.61 | $ | 12.24 | $ | 11.40 | |||||
| Income from investment operationsa: | |||||||||||||||
| Net investment incomeb | 0.49 | c | 0.26 | 0.20 | 0.24 | 0.32 | d | ||||||||
| Net realized and unrealized gains (losses) | 0.60 | 3.54 | 1.67 | (0.56 | ) | 0.90 | |||||||||
| Total from investment operations | 1.09 | 3.80 | 1.87 | (0.32 | ) | 1.22 | |||||||||
| Less distributions from: | |||||||||||||||
| Net investment income | (0.63 | ) | (0.28 | ) | (0.20 | ) | (0.31 | ) | (0.38 | ) | |||||
| Net realized gains | (0.79 | ) | — | — | — | — | |||||||||
| Total distributions | (1.42 | ) | (0.28 | ) | (0.20 | ) | (0.31 | ) | (0.38 | ) | |||||
| Net asset value, end of year | $ | 16.47 | $ | 16.80 | $ | 13.28 | $ | 11.61 | $ | 12.24 | |||||
| Total returne | 6.48 | % | 28.70 | % | 16.10 | % | (2.50 | )% | 10.82 | % | |||||
| Ratios to average net assets | |||||||||||||||
| Expensesf | 1.13 | %g | 1.10 | %g | 1.14 | % | 1.14 | % | 1.18 | % | |||||
| Expenses incurred in connection with securities sold short | 0.04 | % | —%h | 0.01 | % | —%h | 0.02 | % | |||||||
| Net investment income | 2.84 | %c | 1.72 | % | 1.57 | % | 1.94 | % | 2.76 | %d | |||||
| Supplemental data | |||||||||||||||
| Net assets, end of year (000’s) | $ | 1,101,706 | $ | 1,148,409 | $ | 983,981 | $ | 1,062,477 | $ | 1,327,189 | |||||
| Portfolio turnover rate | 40.06 | % | 32.95 | % | 43.23 | % | 51.38 | % | 34.54 | % | |||||
aThe amount shown for a share outstanding throughout the period may not correlate with the Statement of Operations for the period due to the timing of sales and
repurchases of the Fund shares in relation to income earned and/or fluctuating fair value of the investments of the Fund.
bBased on average daily shares outstanding.
cNet investment income per share includes approximately $0.24 per share received in the form of a special dividend paid in connection with certain Fund’s holdings.
Excluding this amount, the ratio of net investment income to average net assets would have been 1.44%.
dNet investment income per share includes approximately $0.18 per share received in the form of a special dividend paid in connection with a corporate REIT conversion.
Excluding this non-recurring amount, the ratio of net investment income to average net assets would have been 1.23%.
eTotal return does not reflect sales commissions or contingent deferred sales charges, if applicable.
fIncludes dividend and interest expense on securities sold short and security borrowing fees, if any. See below for the ratios of such expenses to average net assets for the
periods presented. See Note 1(e).
gBenefit of expense reduction rounds to less than 0.01%.
hRounds to less than 0.01%.
franklintempleton.com
The accompanying notes are an integral part of these financial statements. | Annual Report | 17
FRANKLIN MUTUAL BEACON FUND
FINANCIAL HIGHLIGHTS
| Year Ended December 31, | |||||||||||||||
| 2014 | 2013 | 2012 | 2011 | 2010 | |||||||||||
| Class C | |||||||||||||||
| Per share operating performance | |||||||||||||||
| (for a share outstanding throughout the year) | |||||||||||||||
| Net asset value, beginning of year | $ | 16.70 | $ | 13.21 | $ | 11.54 | $ | 12.16 | $ | 11.29 | |||||
| Income from investment operationsa: | |||||||||||||||
| Net investment income b | 0.37 | c | 0.15 | 0.11 | 0.15 | 0.24 | d | ||||||||
| Net realized and unrealized gains (losses) | 0.59 | 3.51 | 1.66 | (0.55 | ) | 0.88 | |||||||||
| Total from investment operations | 0.96 | 3.66 | 1.77 | (0.40 | ) | 1.12 | |||||||||
| Less distributions from: | |||||||||||||||
| Net investment income | (0.51 | ) | (0.17 | ) | (0.10 | ) | (0.22 | ) | (0.25 | ) | |||||
| Net realized gains | (0.79 | ) | — | — | — | — | |||||||||
| Total distributions | (1.30 | ) | (0.17 | ) | (0.10 | ) | (0.22 | ) | (0.25 | ) | |||||
| Net asset value, end of year | $ | 16.36 | $ | 16.70 | $ | 13.21 | $ | 11.54 | $ | 12.16 | |||||
| Total returne | 5.78 | % | 27.79 | % | 15.29 | % | (3.15 | )% | 9.96 | % | |||||
| Ratios to average net assets | |||||||||||||||
| Expensesf | 1.83 | %g | 1.80 | %g | 1.84 | % | 1.84 | % | 1.88 | % | |||||
| Expenses incurred in connection with securities sold short | 0.04 | % | —%h | 0.01 | % | —%h | 0.02 | % | |||||||
| Net investment income | 2.14 | %c | 1.02 | % | 0.87 | % | 1.24 | % | 2.06 | %d | |||||
| Supplemental data | |||||||||||||||
| Net assets, end of year (000’s) | $ | 320,832 | $ | 336,222 | $ | 295,958 | $ | 315,390 | $ | 400,949 | |||||
| Portfolio turnover rate | 40.06 | % | 32.95 | % | 43.23 | % | 51.38 | % | 34.54 | % | |||||
aThe amount shown for a share outstanding throughout the period may not correlate with the Statement of Operations for the period due to the timing of sales and
repurchases of the Fund shares in relation to income earned and/or fluctuating fair value of the investments of the Fund.
bBased on average daily shares outstanding.
cNet investment income per share includes approximately $0.24 per share received in the form of a special dividend paid in connection with certain Fund’s holdings.
Excluding this amount, the ratio of net investment income to average net assets would have been 0.74%.
dNet investment income per share includes approximately $0.18 per share received in the form of a special dividend paid in connection with a corporate REIT conversion.
Excluding this non-recurring amount, the ratio of net investment income to average net assets would have been 0.53%.
eTotal return does not reflect sales commissions or contingent deferred sales charges, if applicable.
fIncludes dividend and interest expense on securities sold short and security borrowing fees, if any. See below for the ratios of such expenses to average net assets for the
periods presented. See Note 1(e).
gBenefit of expense reduction rounds to less than 0.01%.
hRounds to less than 0.01%.
18 | Annual Report | The accompanying notes are an integral part of these financial statements.
franklintempleton.com
| FRANKLIN MUTUAL BEACON FUND | |||||||||||||||
| FINANCIAL HIGHLIGHTS | |||||||||||||||
| Year Ended December 31, | |||||||||||||||
| 2014 | 2013 | 2012 | 2011 | 2010 | |||||||||||
| Class R | |||||||||||||||
| Per share operating performance | |||||||||||||||
| (for a share outstanding throughout the year) | |||||||||||||||
| Net asset value, beginning of year | $ | 16.68 | $ | 13.19 | $ | 11.52 | $ | 12.16 | $ | 11.38 | |||||
| Income from investment operationsa: | |||||||||||||||
| Net investment incomeb | 0.44 | c | 0.23 | 0.18 | 0.21 | 0.26 | d | ||||||||
| Net realized and unrealized gains (losses) | 0.61 | 3.50 | 1.66 | (0.55 | ) | 0.93 | |||||||||
| Total from investment operations | 1.05 | 3.73 | 1.84 | (0.34 | ) | 1.19 | |||||||||
| Less distributions from: | |||||||||||||||
| Net investment income | (0.61 | ) | (0.24 | ) | (0.17 | ) | (0.30 | ) | (0.41 | ) | |||||
| Net realized gains | (0.79 | ) | — | — | — | — | |||||||||
| Total distributions | (1.40 | ) | (0.24 | ) | (0.17 | ) | (0.30 | ) | (0.41 | ) | |||||
| Net asset value, end of year | $ | 16.33 | $ | 16.68 | $ | 13.19 | $ | 11.52 | $ | 12.16 | |||||
| Total return | 6.31 | % | 28.34 | % | 15.95 | % | (2.69 | )% | 10.63 | % | |||||
| Ratios to average net assets | |||||||||||||||
| Expensese | 1.33 | %f | 1.30 | %f | 1.34 | % | 1.34 | % | 1.38 | % | |||||
| Expenses incurred in connection with securities sold short | 0.04 | % | —%g | 0.01 | % | —%g | 0.02 | % | |||||||
| Net investment income | 2.64 | %c | 1.52 | % | 1.37 | % | 1.74 | % | 2.56 | %d | |||||
| Supplemental data | |||||||||||||||
| Net assets, end of year (000’s) | $ | 2,246 | $ | 1,956 | $ | 1,905 | $ | 2,039 | $ | 976 | |||||
| Portfolio turnover rate | 40.06 | % | 32.95 | % | 43.23 | % | 51.38 | % | 34.54 | % | |||||
aThe amount shown for a share outstanding throughout the period may not correlate with the Statement of Operations for the period due to the timing of sales and
repurchases of the Fund shares in relation to income earned and/or fluctuating fair value of the investments of the Fund.
bBased on average daily shares outstanding.
cNet investment income per share includes approximately $0.24 per share received in the form of a special dividend paid in connection with certain Fund’s holdings.
Excluding this amount, the ratio of net investment income to average net assets would have been 1.24%.
dNet investment income per share includes approximately $0.18 per share received in the form of a special dividend paid in connection with a corporate REIT conversion.
Excluding this non-recurring amount, the ratio of net investment income to average net assets would have been 1.03%.
eIncludes dividend and interest expense on securities sold short and security borrowing fees, if any. See below for the ratios of such expenses to average net assets for the
periods presented. See Note 1(e).
fBenefit of expense reduction rounds to less than 0.01%.
gRounds to less than 0.01%.
franklintempleton.com
The accompanying notes are an integral part of these financial statements. | Annual Report | 19
FRANKLIN MUTUAL BEACON FUND
FINANCIAL HIGHLIGHTS
| Year Ended December 31, | ||||||
| 2014 | 2013 | a | ||||
| Class R6 | ||||||
| Per share operating performance | ||||||
| (for a share outstanding throughout the year) | ||||||
| Net asset value, beginning of year | $ | 16.88 | $ | 14.77 | ||
| Income from investment operationsb: | ||||||
| Net investment incomec | 0.56 | d | 0.24 | |||
| Net realized and unrealized gains (losses) | 0.63 | 2.21 | ||||
| Total from investment operations | 1.19 | 2.45 | ||||
| Less distributions from: | ||||||
| Net investment income | (0.70 | ) | (0.34 | ) | ||
| Net realized gains | (0.79 | ) | — | |||
| Total distributions | (1.49 | ) | (0.34 | ) | ||
| Net asset value, end of year | $ | 16.58 | $ | 16.88 | ||
| Total returne | 6.91 | % | 16.83 | % | ||
| Ratios to average net assetsf | ||||||
| Expenses before waiver, payments by affiliates and expense reductiong | 0.74 | % | 2.10 | % | ||
| Expenses net of waiver, payments by affiliates and expense reductiong,h | 0.74 | % | 0.71 | % | ||
| Expenses incurred in connection with securities sold short | 0.04 | % | —%i | |||
| Net investment income | 3.23 | %d | 2.11 | % | ||
| Supplemental data | ||||||
| Net assets, end of year (000’s) | $ | 50,868 | $ | 6 | ||
| Portfolio turnover rate | 40.06 | % | 32.95 | % | ||
aFor the period May 1, 2013 (effective date) to December 31, 2013.
bThe amount shown for a share outstanding throughout the period may not correlate with the Statement of Operations for the period due to the timing of sales and
repurchases of the Fund shares in relation to income earned and/or fluctuating fair value of the investments of the Fund.
cBased on average daily shares outstanding.
dNet investment income per share includes approximately $0.24 per share received in the form of a special dividend paid in connection with certain Fund’s holdings.
Excluding this amount, the ratio of net investment income to average net assets would have been 1.83%.
eTotal return is not annualized for periods less than one year.
fRatios are annualized for periods less than one year.
gIncludes dividend and interest expense on securities sold short and security borrowing fees, if any. See below for the ratios of such expenses to average net assets for the
periods presented. See Note 1(e).
hBenefit of expense reduction rounds to less than 0.01%.
iRounds to less than 0.01%.
20 | Annual Report | The accompanying notes are an integral part of these financial statements.
franklintempleton.com
FRANKLIN MUTUAL BEACON FUND
| Statement of Investments, December 31, 2014 | ||||
| Country | Shares | Value | ||
| Common Stocks and Other Equity Interests 86.5% | ||||
| Auto Components 0.4% | ||||
| a,bInternational Automotive Components Group Brazil LLC | Brazil | 2,846,329 | $ | 269,206 |
| a,b,cInternational Automotive Components Group North America LLC | United States | 22,836,904 | 17,291,647 | |
| 17,560,853 | ||||
| Banks 7.5% | ||||
| Barclays PLC | United Kingdom | 23,519,630 | 89,267,212 | |
| JPMorgan Chase & Co. | United States | 1,762,110 | 110,272,844 | |
| Wells Fargo & Co. | United States | 2,188,070 | 119,949,996 | |
| 319,490,052 | ||||
| Beverages 1.1% | ||||
| PepsiCo Inc. | United States | 510,803 | 48,301,532 | |
| Chemicals 3.3% | ||||
| Arkema | France | 1,295,470 | 86,323,253 | |
| a,d,eDow Corning Corp., Contingent Distribution | United States | 12,598,548 | — | |
| Tronox Ltd., A | United States | 2,187,603 | 52,239,959 | |
| 138,563,212 | ||||
| Communications Equipment 1.4% | ||||
| Cisco Systems Inc. | United States | 2,094,362 | 58,254,679 | |
| Construction & Engineering 0.9% | ||||
| Sinopec Engineering Group Co. Ltd. | China | 58,345,700 | 39,504,372 | |
| Diversified Telecommunication Services 3.6% | ||||
| a,d,eGlobal Crossing Holdings Ltd., Contingent Distribution | United States | 60,632,757 | — | |
| Koninklijke KPN NV | Netherlands | 33,100,190 | 105,254,630 | |
| TDC AS | Denmark | 6,263,530 | 48,063,579 | |
| 153,318,209 | ||||
| Energy Equipment & Services 2.8% | ||||
| Baker Hughes Inc. | United States | 1,359,380 | 76,220,437 | |
| fTransocean Ltd. | United States | 2,409,819 | 44,171,982 | |
| 120,392,419 | ||||
| Food & Staples Retailing 3.3% | ||||
| Tesco PLC | United Kingdom | 16,371,974 | 48,230,900 | |
| Walgreens Boots Alliance Inc. | United States | 1,177,451 | 89,721,766 | |
| 137,952,666 | ||||
| Health Care Equipment & Supplies 4.5% | ||||
| Medtronic Inc. | United States | 2,043,235 | 147,521,567 | |
| Stryker Corp. | United States | 478,132 | 45,102,192 | |
| 192,623,759 | ||||
| Health Care Providers & Services 1.0% | ||||
| Cigna Corp. | United States | 406,872 | 41,871,198 | |
| Hotels, Restaurants & Leisure 0.6% | ||||
| aPinnacle Entertainment Inc. | United States | 1,138,380 | 25,328,955 | |
| Insurance 5.5% | ||||
| The Allstate Corp. | United States | 793,406 | 55,736,771 | |
| a,bOlympus Re Holdings Ltd. | United States | 106,700 | — | |
| aRSA Insurance Group PLC | United Kingdom | 12,512,342 | 84,837,992 | |
| White Mountains Insurance Group Ltd. | United States | 146,141 | 92,084,906 | |
| 232,659,669 | ||||
| franklintempleton.com | Annual Report | 21 | |||
FRANKLIN MUTUAL BEACON FUND
STATEMENT OF INVESTMENTS
| Country | Shares | Value | ||
| Common Stocks and Other Equity Interests (continued) | ||||
| IT Services 2.4% | ||||
| gPolaris Consulting and Services Ltd./India | India | 6,669,381 | $ | 18,150,747 |
| Xerox Corp. | United States | 6,013,798 | 83,351,240 | |
| 101,501,987 | ||||
| Media 14.7% | ||||
| CBS Corp., B | United States | 1,178,271 | 65,205,517 | |
| Comcast Corp., Special A | United States | 731,577 | 42,113,230 | |
| aDIRECTV | United States | 743,000 | 64,418,100 | |
| aLiberty Global PLC, C | United Kingdom | 1,241,640 | 59,983,628 | |
| Reed Elsevier PLC | United Kingdom | 2,648,846 | 45,416,317 | |
| RTL Group SA | Germany | 528,912 | 50,635,495 | |
| Time Warner Cable Inc. | United States | 424,034 | 64,478,610 | |
| Time Warner Inc. | United States | 569,092 | 48,611,839 | |
| aTribune Media Co., A | United States | 322,993 | 19,305,292 | |
| aTribune Media Co., B | United States | 234,472 | 14,014,391 | |
| Tribune Publishing Co. | United States | 154,221 | 3,531,661 | |
| Twenty-First Century Fox Inc., B | United States | 3,954,737 | 145,890,248 | |
| 623,604,328 | ||||
| Metals & Mining 1.6% | ||||
| Freeport-McMoRan Inc., B | United States | 2,965,589 | 69,276,159 | |
| a,b,gPMG LLC | United States | 5,455 | 294,219 | |
| 69,570,378 | ||||
| Oil, Gas & Consumable Fuels 1.3% | ||||
| Apache Corp. | United States | 896,560 | 56,187,415 | |
| Personal Products 0.9% | ||||
| Avon Products Inc. | United States | 3,821,101 | 35,880,138 | |
| Pharmaceuticals 9.2% | ||||
| Eli Lilly & Co. | United States | 695,870 | 48,008,071 | |
| aHospira Inc. | United States | 1,397,795 | 85,614,944 | |
| Merck & Co. Inc. | United States | 2,005,510 | 113,892,913 | |
| Novartis AG, ADR | Switzerland | 527,301 | 48,859,711 | |
| Teva Pharmaceutical Industries Ltd., ADR | Israel | 1,620,652 | 93,203,696 | |
| 389,579,335 | ||||
| Real Estate Management & Development 2.0% | ||||
| eCanary Wharf Group PLC | United Kingdom | 10,069,634 | 84,897,949 | |
| Semiconductors & Semiconductor Equipment 0.3% | ||||
| Tokyo Electron Ltd., ADR | Japan | 720,000 | 13,737,600 | |
| Software 9.3% | ||||
| CA Inc. | United States | 1,276,425 | 38,867,141 | |
| aCheck Point Software Technologies Ltd. | Israel | 681,851 | 53,573,033 | |
| Microsoft Corp. | United States | 2,761,833 | 128,287,143 | |
| Open Text Corp. | Canada | 839,150 | 48,888,879 | |
| Symantec Corp. | United States | 4,968,542 | 127,467,945 | |
| 397,084,141 | ||||
| Technology Hardware, Storage & Peripherals 0.7% | ||||
| Samsung Electronics Co. Ltd. | South Korea | 24,201 | 29,361,768 |
22 | Annual Report
franklintempleton.com
FRANKLIN MUTUAL BEACON FUND
STATEMENT OF INVESTMENTS
| Country | Shares | Value | ||
| Common Stocks and Other Equity Interests (continued) | ||||
| Tobacco 5.8% | ||||
| Altria Group Inc. | United States | 417,710 | $ | 20,580,572 |
| British American Tobacco PLC | United Kingdom | 1,926,205 | 105,083,146 | |
| Lorillard Inc. | United States | 1,940,551 | 122,138,280 | |
| 247,801,998 | ||||
| Wireless Telecommunication Services 2.4% | ||||
| Vodafone Group PLC | United Kingdom | 29,547,319 | 102,542,358 | |
| Total Common Stocks and Other Equity Interests | ||||
| (Cost $2,798,341,580) | 3,677,570,970 | |||
| Preferred Stocks 3.0% | ||||
| Automobiles 1.3% | ||||
| Porsche Automobil Holding SE, pfd. | Germany | 672,530 | 54,652,207 | |
| Technology Hardware, Storage & Peripherals 1.7% | ||||
| Samsung Electronics Co. Ltd., pfd. | South Korea | 75,123 | 71,361,905 | |
| Total Preferred Stocks (Cost $114,540,328) | 126,014,112 | |||
| Principal | ||||
| Amount* | ||||
| Corporate Bonds, Notes and Senior Floating Rate | ||||
| Interests 3.9% | ||||
| h,iBluestem Brands Inc., First Lien Term Loan, 8.50%, 11/07/20 | United States | 6,420,000 | 6,227,400 | |
| h,iCaesars Entertainment Operating Co. Inc., Senior Tranche, first lien, | ||||
| 3/01/17, | ||||
| B5B, 5.949% | United States | 7,949,777 | 6,979,244 | |
| B6B, 6.949% | United States | 33,533,690 | 29,635,399 | |
| B7, 9.75% | United States | 10,720,130 | 9,508,755 | |
| h,iCengage Learning Acquisitions Inc., First Lien Exit Term Loan, 7.00%, | ||||
| 3/31/20 | United States | 1,447,065 | 1,434,403 | |
| First Data Corp., senior note, 11.75%, 8/15/21 | United States | 7,703,000 | 8,877,708 | |
| iHeartCommunications Communications Inc., | ||||
| senior secured note, first lien, 9.00%, 12/15/19 | United States | 18,873,000 | 18,660,679 | |
| h,iTranche B Term Loan, 3.819%, 1/29/16 | United States | 109,609 | 108,479 | |
| h,iTranche C Term Loan, 3.819%, 1/29/16 | United States | 20,291 | 20,062 | |
| h,iTranche D Term Loan, 6.919%, 1/30/19 | United States | 15,813,482 | 14,938,807 | |
| h,iTranche E Term Loan, 7.669%, 7/30/19 | United States | 5,080,935 | 4,884,049 | |
| h,iJC Penney Corp. Inc., Term Loan, 6.00%, 5/22/18 | United States | 21,428,341 | 21,120,309 | |
| h,iKIK Custom Products Inc., Second Lien Term Loan, 9.50%, 11/17/19 | United States | 22,739,000 | 22,710,576 | |
| NGPL PipeCo LLC, | ||||
| jsecured note, 144A, 7.119%, 12/15/17 | United States | 8,028,000 | 7,927,650 | |
| h,iTerm Loan B, 6.75%, 9/15/17 | United States | 652,112 | 630,919 | |
| Walter Energy Inc., | ||||
| h, iB, Term Loan, 7.25%, 4/01/18 | United States | 9,375,505 | 7,295,315 | |
| jfirst lien, 144A, 9.50%, 10/15/19 | United States | 5,229,000 | 4,000,185 | |
| f,j,ksecond lien, 144A, PIK, 11.50%, 4/01/20 | United States | 4,425,000 | 1,460,467 | |
| Total Corporate Bonds, Notes and Senior Floating | ||||
| Rate Interests (Cost $168,690,230) | 166,420,406 | |||
| Corporate Notes and Senior Floating Rate Interests | ||||
| in Reorganization 1.2% | ||||
| b,lBroadband Ventures III LLC, secured promissory note, 5.00%, 2/01/12 | United States | 10,848 | — | |
| h,i,lTexas Competitive Electric Holdings Co. LLC, Extended Term Loan, | ||||
| 4.648%, 10/10/17 | United States | 46,282,735 | 29,968,071 | |
| j,lTexas Competitive Electric Holdings Co. LLC/Texas Competitive Electric | ||||
| Holdings Finance Inc., senior secured note, 144A, 11.50%, 10/01/20 | United States | 28,306,000 | 20,168,025 | |
| Total Corporate Notes and Senior Floating Rate Interests | ||||
| in Reorganization (Cost $66,784,584) | 50,136,096 | |||
| franklintempleton.com | Annual Report | 23 | |||
FRANKLIN MUTUAL BEACON FUND
STATEMENT OF INVESTMENTS
| Country | Shares | Value | |||
| Companies in Liquidation 1.0% | |||||
| aAdelphia Recovery Trust | United States | 48,268,724 | $ | 115,845 | |
| a,dAdelphia Recovery Trust, Arahova Contingent Value Vehicle, | |||||
| Contingent Distribution | United States | 6,161,087 | 61,611 | ||
| a,b,c,gCB FIM Coinvestors LLC | United States | 15,831,950 | — | ||
| a,d,eCentury Communications Corp., Contingent Distribution | United States | 16,986,000 | — | ||
| a,bFIM Coinvestor Holdings I, LLC | United States | 19,805,560 | — | ||
| a,mLehman Brothers Holdings Inc., Bankruptcy Claim | United States | 163,140,446 | 40,785,111 | ||
| a,d,eTribune Media Litigation Trust, Contingent Distribution | United States | 496,804 | — | ||
| Total Companies in Liquidation (Cost $49,903,037) | 40,962,567 | ||||
| Principal | |||||
| Amount* | |||||
| Municipal Bonds (Cost $11,956,511) 0.2% | |||||
| Puerto Rico Commonwealth GO, Refunding, Series A, 8.00%, 7/01/35 | United States | 12,808,000 | 11,190,990 | ||
| Total Investments before Short Term Investments | |||||
| (Cost $3,210,216,270) | 4,072,295,141 | ||||
| Short Term Investments 3.0% | |||||
| U.S. Government and Agency Securities 2.5% | |||||
| nFHLB, 1/02/15 | United States | 2,500,000 | 2,500,000 | ||
| n,oU.S. Treasury Bills, 1/02/15 - 5/28/15 | United States | 102,800,000 | 102,792,502 | ||
| Total U.S. Government and Agency Securities | |||||
| (Cost $105,286,191) | 105,292,502 | ||||
| Total Investments before Money Market Funds | |||||
| (Cost $3,315,502,461) | 4,177,587,643 | ||||
| Shares | |||||
| pInvestments from Cash Collateral Received for Loaned | |||||
| Securities (Cost $21,910,834) 0.5% | |||||
| Money Market Funds 0.5% | |||||
| qBNY Mellon Overnight Government Fund, 0.072% | United States | 21,910,834 | 21,910,834 | ||
| Total Investments (Cost $3,337,413,295) 98.8% | 4,199,498,477 | ||||
| Options Written (0.0)%† | (30,000 | ) | |||
| Securities Sold Short (1.0)% | (44,527,044 | ) | |||
| Other Assets, less Liabilities 2.2% | 95,638,656 | ||||
| Net Assets 100.0% | $ | 4,250,580,089 | |||
| Number of | |||||
| Contracts | |||||
| rOptions Written (Premiums Received $225,175) (0.0)%† | |||||
| Puts – Exchange-Traded | |||||
| Tobacco (0.0)%† | |||||
| Lorillard Inc., January Strike Price $55, Expires 1/17/15 | United States | 2,000 | $ | (30,000 | ) |
| Shares | |||||
| sSecurities Sold Short (1.0)% | |||||
| Common Stocks (1.0)% | |||||
| Diversified Telecommunication Services (0.7)% | |||||
| AT&T Inc. | United States | 891,600 | $ | (29,948,844 | ) |
| Semiconductors & Semiconductor Equipment (0.3)% | |||||
| Applied Materials Inc. | United States | 585,000 | (14,578,200 | ) | |
| Total Securities Sold Short (Proceeds $42,748,380) | $ | (44,527,044 | ) | ||
| 24 | Annual Report | franklintempleton.com | ||||
FRANKLIN MUTUAL BEACON FUND
STATEMENT OF INVESTMENTS
*The principal amount is stated in U.S. dollars unless otherwise indicated.
†Rounds to less than 0.1% of net assets.
aNon-income producing.
bSee Note 9 regarding restricted securities.
cAt December 31, 2014, pursuant to the Fund’s policies and the requirements of applicable securities law, the Fund may be restricted from trading these securities for a limited
or extended period of time.
dContingent distributions represent the right to receive additional distributions, if any, during the reorganization of the underlying company. Shares represent total underlying
principal of debt securities.
eSecurity has been deemed illiquid because it may not be able to be sold within seven days. At December 31, 2014, the aggregate value of these securities was $84,897,949,
representing 2.00% of net assets.
fA portion or all of the security is on loan at December 31, 2014. See Note 1(f).
gSee Note 11 regarding holdings of 5% voting securities.
hSee Note 1(g) regarding senior floating rate interests.
iThe coupon rate shown represents the rate at period end.
jSecurity was purchased pursuant to Rule 144A under the Securities Act of 1933 and may be sold in transactions exempt from registration only to qualified institutional buyers
or in a public offering registered under the Securities Act of 1933. These securities have been deemed liquid under guidelines approved by the Trust’s Board of Trustees. At
December 31, 2014, the aggregate value of these securities was $33,556,327, representing 0.79% of net assets.
kIncome may be received in additional securities and/or cash.
lSee Note 8 regarding credit risk and defaulted securities.
mBankruptcy claims represent the right to receive distributions, if any, during the liquidation of the underlying pool of assets. Shares represent amount of allowed unsecured
claims.
nThe security is traded on a discount basis with no stated coupon rate.
oSecurity or a portion of the security has been pledged as collateral for securities sold short, open futures, forward and written option contracts. At December 31, 2014, the
aggregate value of these securities and/or cash pledged as collateral was $73,750,025, representing 1.74% of net assets.
pSee Note 1(f) regarding securities on loan.
qThe rate shown is the annualized seven-day yield at period end.
rSee Note 1(c) regarding written options.
sSee Note 1(e) regarding securities sold short.
| At December 31, 2014, the Fund had the following futures contracts outstanding. See Note 1(c). | ||||||||||||
| Futures Contracts | ||||||||||||
| Number of | Notional Expiration | Unrealized | Unrealized | |||||||||
| Description | Type | Contracts | Value | Date | Appreciation | Depreciation | ||||||
| Currency Contracts | ||||||||||||
| EUR/USD | Short | 566 | $ | 85,657,025 | 3/16/15 | $ | 2,063,594 | $ | — | |||
| GBP/USD | Short | 1,341 | 130,496,063 | 3/16/15 | 757,207 | — | ||||||
| Unrealized appreciation (depreciation) | 2,820,801 | — | ||||||||||
| Net unrealized appreciation (depreciation) | $ | 2,820,801 | ||||||||||
| At December 31, 2014, the Fund had the following forward exchange contracts outstanding. See Note 1(c). | ||||||||||||
| Forward Exchange Contracts | ||||||||||||
| Contract | Settlement | Unrealized | Unrealized | |||||||||
| Currency | Counterpartya Type | Quantity | Amount | Date Appreciation Depreciation | ||||||||
| Euro | BANT | Buy | 625,376 | $ | 781,455 | 1/20/15 | $ | — | $ | (24,583 | ) | |
| Euro | BANT | Sell | 26,749,217 | 35,965,198 | 1/20/15 | 3,591,478 | — | |||||
| Euro | BONY | Buy | 845,319 | 1,052,504 | 1/20/15 | — | (29,441 | ) | ||||
| Euro | DBFX | Buy | 2,028,933 | 2,529,213 | 1/20/15 | — | (73,661 | ) | ||||
| Euro | DBFX | Sell | 587,064 | 781,899 | 1/20/15 | 71,394 | — | |||||
| Euro | FBCO | Buy | 947,297 | 1,178,065 | 1/20/15 | — | (31,581 | ) | ||||
| Euro | FBCO | Sell | 18,350,185 | 24,538,865 | 1/20/15 | 2,330,224 | — | |||||
| Euro | HSBC | Buy | 2,061,513 | 2,566,277 | 1/20/15 | — | (71,294 | ) | ||||
| Euro | HSBC | Sell | 2,672,949 | 3,567,101 | 1/20/15 | 332,117 | — | |||||
| Euro | SCBT | Sell | 11,365,852 | 15,196,171 | 1/20/15 | 1,440,444 | — | |||||
| franklintempleton.com | Annual Report | 25 | |||||||||||
| FRANKLIN MUTUAL BEACON FUND | |||||||||||
| STATEMENT OF INVESTMENTS | |||||||||||
| Forward Exchange Contracts (continued) | |||||||||||
| Contract | Settlement | Unrealized | Unrealized | ||||||||
| Currency | Counterpartya Type | Quantity | Amount | Date Appreciation Depreciation | |||||||
| Euro | SSBT | Buy | 2,069,734 | $ | 2,579,650 | 1/20/15 | $ | — | $ | (74,718 | ) |
| Euro | SSBT | Sell | 5,743,930 | 7,682,077 | 1/20/15 | 730,383 | — | ||||
| British Pound | BANT | Buy | 5,047,087 | 8,455,355 | 1/21/15 | — | (589,788 | ) | |||
| British Pound | BBU | Buy | 6,166,629 | 9,966,144 | 1/21/15 | — | (355,841 | ) | |||
| British Pound | DBFX | Sell | 23,789,768 | 40,602,711 | 1/21/15 | 3,527,855 | — | ||||
| British Pound | HSBC | Buy | 948,877 | 1,594,351 | 1/21/15 | — | (115,586 | ) | |||
| British Pound | HSBC | Sell | 16,992,691 | 28,989,531 | 1/21/15 | 2,507,491 | — | ||||
| British Pound | SSBT | Buy | 2,568,499 | 4,307,057 | 1/21/15 | — | (304,213 | ) | |||
| British Pound | SSBT | Sell | 26,862,993 | 45,645,788 | 1/21/15 | 3,781,504 | — | ||||
| South Korean Won | BANT | Buy | 2,654,988,142 | 2,465,857 | 2/12/15 | — | (43,695 | ) | |||
| South Korean Won | BANT | Sell | 33,654,647,558 | 31,907,186 | 2/12/15 | 1,295,744 | (91,898 | ) | |||
| South Korean Won | BONY | Sell | 2,307,897,756 | 2,236,261 | 2/12/15 | 130,752 | — | ||||
| South Korean Won | FBCO | Sell | 41,494,946,675 | 39,921,538 | 2/12/15 | 2,077,482 | (12,037 | ) | |||
| South Korean Won | HSBC | Buy | 20,682,265,363 | 19,219,178 | 2/12/15 | 37,200 | (387,821 | ) | |||
| South Korean Won | HSBC | Sell | 55,183,499,676 | 52,584,488 | 2/12/15 | 2,349,985 | (109,740 | ) | |||
| Swiss Franc | BANT | Sell | 34,566,502 | 38,286,127 | 2/12/15 | 3,491,945 | — | ||||
| Swiss Franc | BBU | Buy | 4,276,906 | 4,723,467 | 2/12/15 | — | (418,391 | ) | |||
| Swiss Franc | DBFX | Buy | 18,978,182 | 20,960,080 | 2/12/15 | — | (1,856,894 | ) | |||
| Swiss Franc | FBCO | Buy | 6,154,000 | 6,799,925 | 2/12/15 | — | (605,390 | ) | |||
| Swiss Franc | HSBC | Buy | 5,157,414 | 5,720,259 | 2/12/15 | — | (528,874 | ) | |||
| Danish Krone | BANT | Buy | 20,362,265 | 3,459,627 | 2/17/15 | — | (149,809 | ) | |||
| Danish Krone | BANT | Sell | 23,242,154 | 3,931,329 | 2/17/15 | 153,395 | — | ||||
| Danish Krone | BBU | Buy | 3,040,574 | 506,519 | 2/17/15 | — | (12,284 | ) | |||
| Danish Krone | BONY | Buy | 5,285,234 | 916,264 | 2/17/15 | — | (57,167 | ) | |||
| Danish Krone | BONY | Sell | 3,201,901 | 544,036 | 2/17/15 | 23,578 | — | ||||
| Danish Krone | DBFX | Buy | 6,424,105 | 1,115,696 | 2/17/15 | — | (71,479 | ) | |||
| Danish Krone | DBFX | Sell | 13,595,745 | 2,295,571 | 2/17/15 | 85,628 | — | ||||
| Danish Krone | FBCO | Buy | 2,800,000 | 464,955 | 2/17/15 | — | (9,825 | ) | |||
| Danish Krone | SSBT | Buy | 11,127,690 | 1,919,151 | 2/17/15 | — | (110,382 | ) | |||
| Danish Krone | SSBT | Sell | 269,344,282 | 48,319,809 | 2/17/15 | 4,538,801 | — | ||||
| British Pound | BANT | Buy | 10,543,288 | 16,938,086 | 2/19/15 | — | (510,718 | ) | |||
| British Pound | BANT | Sell | 40,503,576 | 66,892,815 | 2/19/15 | 3,792,936 | (8,248 | ) | |||
| British Pound | BBU | Buy | 340,072 | 540,149 | 2/19/15 | — | (10,287 | ) | |||
| British Pound | DBFX | Buy | 3,529,648 | 5,695,897 | 2/19/15 | — | (196,395 | ) | |||
| British Pound | DBFX | Sell | 2,014,199 | 3,139,580 | 2/19/15 | 5,763 | (4,482 | ) | |||
| British Pound | FBCO | Buy | 4,279,429 | 6,851,939 | 2/19/15 | — | (184,213 | ) | |||
| British Pound | FBCO | Sell | 34,296,631 | 56,633,490 | 2/19/15 | 3,196,329 | — | ||||
| British Pound | HSBC | Buy | 15,419,657 | 24,753,679 | 2/19/15 | — | (728,500 | ) | |||
| British Pound | HSBC | Sell | 3,626,415 | 5,841,034 | 2/19/15 | 190,762 | — | ||||
| British Pound | SSBT | Buy | 5,324,036 | 8,553,937 | 2/19/15 | — | (258,622 | ) | |||
| British Pound | SSBT | Sell | 34,904,556 | 57,480,356 | 2/19/15 | 3,111,619 | (15,625 | ) | |||
| Euro | BANT | Sell | 90,389 | 119,197 | 2/27/15 | 9,767 | — | ||||
| Euro | DBFX | Sell | 475,484 | 627,410 | 2/27/15 | 51,767 | — | ||||
| Euro | SCBT | Sell | 1,981,071 | 2,604,158 | 2/27/15 | 205,779 | — | ||||
| Euro | BANT | Sell | 4,806,505 | 6,125,544 | 4/16/15 | 303,903 | — | ||||
| Euro | BBU | Sell | 300,101 | 376,612 | 4/16/15 | 13,129 | — | ||||
| Euro | BONY | Sell | 578,791 | 725,602 | 4/16/15 | 24,571 | — | ||||
| Euro | DBFX | Sell | 2,930,119 | 3,701,974 | 4/16/15 | 153,013 | — | ||||
| Euro | FBCO | Sell | 9,726,475 | 12,193,867 | 4/16/15 | 413,157 | — | ||||
| Euro | HSBC | Sell | 6,441,447 | 7,988,347 | 4/16/15 | 186,464 | — | ||||
| Euro | SCBT | Sell | 289,395 | 362,713 | 4/16/15 | 12,198 | — | ||||
| Euro | SSBT | Sell | 7,671,536 | 9,667,125 | 4/16/15 | 375,358 | — | ||||
| British Pound | BONY | Buy | 3,420,181 | 5,492,137 | 4/22/15 | — | (166,039 | ) | |||
| British Pound | HSBC | Sell | 32,724,985 | 52,687,226 | 4/22/15 | 1,726,037 | — | ||||
| 26 | Annual Report | franklintempleton.com | ||||||||||
FRANKLIN MUTUAL BEACON FUND
STATEMENT OF INVESTMENTS
| Forward Exchange Contracts (continued) | |||||||||||
| Contract | Settlement | Unrealized | Unrealized | ||||||||
| Currency | Counterpartya Type | Quantity | Amount | Date Appreciation Depreciation | |||||||
| British Pound | SCBT | Sell | 36,469,647 | $ | 58,752,601 | 4/22/15 | $ | 1,960,014 | $ | — | |
| Euro | BANT | Sell | 18,533,325 | 23,142,563 | 5/18/15 | 687,266 | — | ||||
| Euro | BONY | Sell | 208,936 | 254,693 | 5/18/15 | 1,543 | — | ||||
| Euro | DBFX | Sell | 38,278,515 | 47,501,685 | 5/18/15 | 1,122,774 | — | ||||
| Euro | FBCO | Sell | 19,611,334 | 24,474,067 | 5/18/15 | 712,636 | — | ||||
| Euro | HSBC | Sell | 642,361 | 782,868 | 5/18/15 | 4,572 | — | ||||
| Euro | SSBT | Sell | 583,902 | 723,968 | 5/18/15 | 16,502 | — | ||||
| British Pound | BANT | Buy | 1,473,331 | 2,298,757 | 5/21/15 | — | (4,936 | ) | |||
| British Pound | BANT | Sell | 24,066,417 | 37,663,943 | 5/21/15 | 195,059 | — | ||||
| British Pound | FBCO | Buy | 612,224 | 953,059 | 5/21/15 | 110 | — | ||||
| British Pound | FBCO | Sell | 17,336,132 | 27,110,243 | 5/21/15 | 119,706 | — | ||||
| British Pound | HSBC | Buy | 2,517,986 | 3,937,063 | 5/21/15 | — | (16,822 | ) | |||
| British Pound | SSBT | Sell | 31,767,671 | 49,684,637 | 5/21/15 | 225,710 | — | ||||
| Norwegian Krone | BANT | Buy | 53,337,096 | 7,356,380 | 5/21/15 | — | (242,195 | ) | |||
| Norwegian Krone | BONY | Buy | 904,657 | 125,451 | 5/21/15 | — | (4,786 | ) | |||
| Norwegian Krone | DBFX | Buy | 72,990,445 | 9,901,309 | 5/21/15 | 9,608 | (175,338 | ) | |||
| Norwegian Krone | DBFX | Sell | 128,042,438 | 18,728,417 | 5/21/15 | 1,649,919 | — | ||||
| Norwegian Krone | FBCO | Buy | 810,240 | 108,155 | 5/21/15 | — | (84 | ) | |||
| Unrealized appreciation (depreciation) | 52,975,371 | (8,663,682 | ) | ||||||||
| Net unrealized appreciation (depreciation) | $ | 44,311,689 | |||||||||
| aMay be comprised of multiple contracts with the same counterparty, currency and settlement date. | |||||||||||
| See Abbreviations on page 46. | |||||||||||
franklintempleton.com
The accompanying notes are an integral part of these financial statements. | Annual Report | 27
FRANKLIN MUTUAL BEACON FUND
Financial Statements
Statement of Assets and Liabilities
December 31, 2014
| Assets: | ||
| Investments in securities: | ||
| Cost - Unaffiliated issuers | $ | 3,320,261,706 |
| Cost - Controlled affiliated issuers (Note 11) | 381,819 | |
| Cost - Non-controlled affiliated issuers (Note 11) | 16,769,770 | |
| Total cost of investments | $ | 3,337,413,295 |
| Value - Unaffiliated issuers | $ | 4,181,053,511 |
| Value - Controlled affiliated issuers (Note 11) | 294,219 | |
| Value - Non-controlled affiliated issuers (Note 11) | 18,150,747 | |
| Total value of investments (includes securities loaned in the amount of $20,915,345) | 4,199,498,477 | |
| Restricted Cash (Note 1d) | 7,950,000 | |
| Foreign currency, at value (cost $28,821,524) | 28,886,158 | |
| Receivables: | ||
| Investment securities sold | 70,075 | |
| Capital shares sold | 2,045,413 | |
| Dividends and interest | 8,052,541 | |
| Due from brokers | 46,145,574 | |
| Variation margin | 204,730 | |
| Unrealized appreciation on forward exchange contracts | 52,975,371 | |
| Other assets | 744,103 | |
| Total assets | 4,346,572,442 | |
| Liabilities: | ||
| Payables: | ||
| Investment securities purchased | 2,276,150 | |
| Capital shares redeemed | 5,696,567 | |
| Management fees | 2,447,823 | |
| Distribution fees | 1,101,066 | |
| Transfer agent fees | 705,822 | |
| Trustees’ fees and expenses | 214,666 | |
| Funds advanced by custodian | 225,267 | |
| Options written, at value (premiums received $225,175) | 30,000 | |
| Securities sold short, at value (proceeds $42,748,380) | 44,527,044 | |
| Payable upon return of securities loaned | 21,910,834 | |
| Due to brokers | 7,950,000 | |
| Unrealized depreciation on forward exchange contracts | 8,663,682 | |
| Accrued expenses and other liabilities | 243,432 | |
| Total liabilities | 95,992,353 | |
| Net assets, at value | $ | 4,250,580,089 |
| Net assets consist of: | ||
| Paid-in capital | $ | 3,301,327,863 |
| Undistributed net investment income | 8,140,663 | |
| Net unrealized appreciation (depreciation) | 907,603,760 | |
| Accumulated net realized gain (loss) | 33,507,803 | |
| Net assets, at value | $ | 4,250,580,089 |
28 | Annual Report | The accompanying notes are an integral part of these financial statements.
franklintempleton.com
| FRANKLIN MUTUAL BEACON FUND | ||
| FINANCIAL STATEMENTS | ||
| Statement of Assets and Liabilities (continued) | ||
| December 31, 2014 | ||
| Class Z: | ||
| Net assets, at value | $ | 2,774,928,528 |
| Shares outstanding | 167,309,838 | |
| Net asset value and maximum offering price per share | $ | 16.59 |
| Class A: | ||
| Net assets, at value | $ | 1,101,705,607 |
| Shares outstanding | 66,881,841 | |
| Net asset value per sharea | $ | 16.47 |
| Maximum offering price per share (net asset value per share ÷ 94.25%) | $ | 17.47 |
| Class C: | ||
| Net assets, at value | $ | 320,831,776 |
| Shares outstanding | 19,608,140 | |
| Net asset value and maximum offering price per sharea | $ | 16.36 |
| Class R: | ||
| Net assets, at value | $ | 2,246,403 |
| Shares outstanding | 137,556 | |
| Net asset value and maximum offering price per share | $ | 16.33 |
| Class R6: | ||
| Net assets, at value | $ | 50,867,775 |
| Shares outstanding | 3,067,249 | |
| Net asset value and maximum offering price per share | $ | 16.58 |
| aRedemption price is equal to net asset value less contingent deferred sales charges, if applicable. | |||
| franklintempleton.com | The accompanying notes are an integral part of these financial statements. | Annual Report | | | 29 |
FRANKLIN MUTUAL BEACON FUND
FINANCIAL STATEMENTS
Statement of Operations
for the year ended December 31, 2014
| Investment income: | |||
| Dividends: | |||
| Unaffiliated issuers | $ | 148,287,249 | |
| Non-controlled affiliated issuers (Note 11) | 743,381 | ||
| Interest | 22,034,131 | ||
| Income from securities loaned | 349,766 | ||
| Total investment income | 171,414,527 | ||
| Expenses: | |||
| Management fees (Note 3a) | 27,591,295 | ||
| Administrative fees (Note 3b) | 1,632,294 | ||
| Distribution fees: (Note 3c) | |||
| Class A | 3,391,489 | ||
| Class C | 3,296,825 | ||
| Class R | 10,428 | ||
| Transfer agent fees: (Note 3e) | |||
| Class Z | 2,613,611 | ||
| Class A | 1,049,661 | ||
| Class C | 306,112 | ||
| Class R | 1,929 | ||
| Class R6 | 82 | ||
| Custodian fees (Note 4) | 222,316 | ||
| Reports to shareholders | 242,591 | ||
| Registration and filing fees | 143,017 | ||
| Professional fees | 197,517 | ||
| Trustees’ fees and expenses | 98,549 | ||
| Dividends and interest on securities sold short | 1,494,557 | ||
| Other | 87,108 | ||
| Total expenses | 42,379,381 | ||
| Expense reductions (Note 4) | (528 | ) | |
| Net expenses | 42,378,853 | ||
| Net investment income | 129,035,674 | ||
| Realized and unrealized gains (losses): | |||
| Net realized gain (loss) from: | |||
| Investments: | |||
| Unaffiliated issuers | 336,408,341 | ||
| Controlled affiliated issuers (Note 11) | (186,453 | ) | |
| Non-controlled affiliated issuers (Note 11) | 1,901,572 | ||
| Written options | 98,628 | ||
| Foreign currency transactions | (6,749,474 | ) | |
| Futures contracts | 13,912,437 | ||
| Securities sold short | (2,679,810 | ) | |
| Net realized gain (loss) | 342,705,241 | ||
| Net change in unrealized appreciation (depreciation) on: | |||
| Investments | (271,043,578 | ) | |
| Translation of other assets and liabilities denominated in foreign currencies | 77,412,572 | ||
| Change in deferred taxes on unrealized appreciation | 8,455 | ||
| Net change in unrealized appreciation (depreciation) | (193,622,551 | ) | |
| Net realized and unrealized gain (loss) | 149,082,690 | ||
| Net increase (decrease) in net assets resulting from operations | $ | 278,118,364 |
30 | Annual Report | The accompanying notes are an integral part of these financial statements.
franklintempleton.com
| FRANKLIN MUTUAL BEACON FUND | ||||||
| FINANCIAL STATEMENTS | ||||||
| Statements of Changes in Net Assets | ||||||
| Year Ended December 31, | ||||||
| 2014 | 2013 | |||||
| Increase (decrease) in net assets: | ||||||
| Operations: | ||||||
| Net investment income | $ | 129,035,674 | $ | 76,001,737 | ||
| Net realized gain (loss) from investments, written options, foreign currency transactions, | ||||||
| futures contracts and securities sold short | 342,705,241 | 366,398,762 | ||||
| Net change in unrealized appreciation (depreciation) on investments, translation of other | ||||||
| assets and liabilities denominated in foreign currencies and deferred taxes | (193,622,551 | ) | 587,237,579 | |||
| Net increase (decrease) in net assets resulting from operations | 278,118,364 | 1,029,638,078 | ||||
| Distributions to shareholders from: | ||||||
| Net investment income: | ||||||
| Class Z | (108,365,306 | ) | (55,178,018 | ) | ||
| Class A | (39,939,800 | ) | (18,870,498 | ) | ||
| Class C | (9,494,293 | ) | (3,387,637 | ) | ||
| Class R | (76,629 | ) | (27,980 | ) | ||
| Class R6 | (2,007,139 | ) | (115 | ) | ||
| Net realized gains: | ||||||
| Class Z | (124,181,438 | ) | — | |||
| Class A | (49,595,284 | ) | — | |||
| Class C | (14,636,661 | ) | — | |||
| Class R | (101,248 | ) | — | |||
| Class R6 | (2,255,117 | ) | — | |||
| Total distributions to shareholders | (350,652,915 | ) | (77,464,248 | ) | ||
| Capital share transactions: (Note 2) | ||||||
| Class Z | (53,559,902 | ) | (202,452,718 | ) | ||
| Class A | (28,560,400 | ) | (84,966,969 | ) | ||
| Class B | — | (1,429,101 | ) | |||
| Class C | (9,697,118 | ) | (33,769,334 | ) | ||
| Class R | 342,556 | (387,734 | ) | |||
| Class R6 | 51,675,095 | 5,000 | ||||
| Total capital share transactions | (39,799,769 | ) | (323,000,856 | ) | ||
| Net increase (decrease) in net assets | (112,334,320 | ) | 629,172,974 | |||
| Net assets: | ||||||
| Beginning of year | 4,362,914,409 | 3,733,741,435 | ||||
| End of year | $ | 4,250,580,089 | $ | 4,362,914,409 | ||
| Undistributed net investment income included in net assets: | ||||||
| End of year | $ | 8,140,663 | $ | 34,607,622 | ||
franklintempleton.com
The accompanying notes are an integral part of these financial statements. | Annual Report | 31
FRANKLIN MUTUAL BEACON FUND
Notes to Financial Statements
1. Organization and Significant Accounting Policies
Franklin Mutual Series Funds (Trust) is registered under the Investment Company Act of 1940, as amended, (1940 Act) as an open-end management investment company, consisting of seven separate funds and applies the specialized accounting and reporting guidance in U.S. Generally Accepted Accounting Principles (U.S. GAAP). Franklin Mutual Beacon Fund (Fund) is included in this report. The financial statements of the remaining funds in the Trust are presented separately. The Fund offers five classes of shares: Class Z, Class A, Class C, Class R and Class R6. Each class of shares differs by its initial sales load, contingent deferred sales charges, voting rights on matters affecting a single class, its exchange privilege and fees primarily due to differing arrangements for distribution and transfer agent fees.
Effective June 30, 2014, Mutual Beacon Fund was renamed Franklin Mutual Beacon Fund.
The following summarizes the Fund’s significant accounting policies.
a. Financial Instrument Valuation
The Fund’s investments in financial instruments are carried at fair value daily. Fair value is the price that would be received to sell an asset or paid to transfer a liability in an orderly transaction between market participants on the measurement date. The Fund calculates the net asset value (NAV) per share at the close of the New York Stock Exchange (NYSE), generally at 4 p.m. Eastern time (NYSE close) on each day the NYSE is open for trading. Under compliance policies and procedures approved by the Trust’s Board of Trustees (the Board), the Fund’s administrator has responsibility for oversight of valuation, including leading the cross-functional Valuation and Liquidity Oversight Committee (VLOC). The VLOC provides administration and oversight of the Fund’s valuation policies and procedures, which are approved annually by the Board. Among other things, these procedures allow the Fund to utilize independent pricing services, quotations from securities and financial instrument dealers, and other market sources to determine fair value.
Equity securities and derivative financial instruments (derivatives) listed on an exchange or on the NASDAQ National Market System are valued at the last quoted sale price or the official closing price of the day, respectively. Foreign equity securities are valued as of the close of trading on the foreign stock exchange on which the security is primarily traded or as
of the NYSE close, whichever is earlier. The value is then converted into its U.S. dollar equivalent at the foreign exchange rate in effect at the NYSE close on the day that the value of the security is determined. Over-the-counter (OTC) securities are valued within the range of the most recent quoted bid and ask prices. Securities that trade in multiple markets or on multiple exchanges are valued according to the broadest and most representative market. Certain equity securities are valued based upon fundamental characteristics or relationships to similar securities. Investments in non-registered money market funds are valued at the closing NAV.
Debt securities generally trade in the OTC market rather than on a securities exchange. The Fund’s pricing services use multiple valuation techniques to determine fair value. In instances where sufficient market activity exists, the pricing services may utilize a market-based approach through which quotes from market makers are used to determine fair value. In instances where sufficient market activity may not exist or is limited, the pricing services also utilize proprietary valuation models which may consider market characteristics such as benchmark yield curves, credit spreads, estimated default rates, anticipated market interest rate volatility, coupon rates, anticipated timing of principal repayments, underlying collateral, and other unique security features in order to estimate the relevant cash flows, which are then discounted to calculate the fair value. Securities denominated in a foreign currency are converted into their U.S. dollar equivalent at the foreign exchange rate in effect at the NYSE close on the date that the values of the foreign debt securities are determined.
Certain derivatives trade in the OTC market. The Fund’s pricing services use various techniques including industry standard option pricing models and proprietary discounted cash flow models to determine the fair value of those instruments. The Fund’s net benefit or obligation under the derivative contract, as measured by the fair value of the contract, is included in net assets.
The Fund has procedures to determine the fair value of financial instruments for which market prices are not reliable or readily available. Under these procedures, the VLOC convenes on a regular basis to review such financial instruments and considers a number of factors, including significant unobservable valuation inputs, when arriving at fair value. The VLOC primarily employs a market-based approach which may use related or comparable assets or liabilities, recent transactions, market multiples, book values, and other relevant information for the investment to determine the fair value of the investment. An
32 | Annual Report
franklintempleton.com
FRANKLIN MUTUAL BEACON FUND
NOTES TO FINANCIAL STATEMENTS
income-based valuation approach may also be used in which the anticipated future cash flows of the investment are discounted to calculate fair value. Discounts may also be applied due to the nature or duration of any restrictions on the disposition of the investments. Due to the inherent uncertainty of valuations of such investments, the fair values may differ significantly from the values that would have been used had an active market existed. The VLOC employs various methods for calibrating these valuation approaches including a regular review of key inputs and assumptions, transactional back-testing or disposition analysis, and reviews of any related market activity.
Trading in securities on foreign securities stock exchanges and OTC markets may be completed before the daily NYSE close. In addition, trading in certain foreign markets may not take place on every NYSE business day. Occasionally, events occur between the time at which trading in a foreign security is completed and the close of the NYSE that might call into question the reliability of the value of a portfolio security held by the Fund. As a result, differences may arise between the value of the Fund’s portfolio securities as determined at the foreign market close and the latest indications of value at the close of the NYSE. In order to minimize the potential for these differences, the VLOC monitors price movements following the close of trading in foreign stock markets through a series of country specific market proxies (such as baskets of American Depositary Receipts, futures contracts and exchange traded funds). These price movements are measured against established trigger thresholds for each specific market proxy to assist in determining if an event has occurred that may call into question the reliability of the values of the foreign securities held by the Fund. If such an event occurs, the securities may be valued using fair value procedures, which may include the use of independent pricing services.
Also, when the last day of the reporting period is a non-business day, certain foreign markets may be open on those days that the NYSE is closed, which could result in differences between the value of the Fund’s portfolio securities on the last business day and the last calendar day of the reporting period. Any significant security valuation changes due to an open foreign market are adjusted and reflected by the Fund for financial reporting purposes.
b. Foreign Currency Translation
Portfolio securities and other assets and liabilities denominated in foreign currencies are translated into U.S. dollars based on the exchange rate of such currencies against U.S. dollars on the
date of valuation. The Fund may enter into foreign currency exchange contracts to facilitate transactions denominated in a foreign currency. Purchases and sales of securities, income and expense items denominated in foreign currencies are translated into U.S. dollars at the exchange rate in effect on the transaction date. Portfolio securities and assets and liabilities denominated in foreign currencies contain risks that those currencies will decline in value relative to the U.S. dollar. Occasionally, events may impact the availability or reliability of foreign exchange rates used to convert the U.S. dollar equivalent value. If such an event occurs, the foreign exchange rate will be valued at fair value using procedures established and approved by the Board.
The Fund does not separately report the effect of changes in foreign exchange rates from changes in market prices on securities held. Such changes are included in net realized and unrealized gain or loss from investments on the Statement of Operations.
Realized foreign exchange gains or losses arise from sales of foreign currencies, currency gains or losses realized between the trade and settlement dates on securities transactions and the difference between the recorded amounts of dividends, interest, and foreign withholding taxes and the U.S. dollar equivalent of the amounts actually received or paid. Net unrealized foreign exchange gains and losses arise from changes in foreign exchange rates on foreign denominated assets and liabilities other than investments in securities held at the end of the reporting period.
c. Derivative Financial Instruments
The Fund invested in derivatives in order to manage risk or gain exposure to various other investments or markets. Derivatives are financial contracts based on an underlying or notional amount, require no initial investment or an initial net investment that is smaller than would normally be required to have a similar response to changes in market factors, and require or permit net settlement. Derivatives contain various risks including the potential inability of the counterparty to fulfill their obligations under the terms of the contract, the potential for an illiquid secondary market, and/or the potential for market movements which expose the Fund to gains or losses in excess of the amounts shown on the Statement of Assets and Liabilities. Realized gain and loss and unrealized appreciation and depreciation on these contracts for the period are included in the Statement of Operations.
franklintempleton.com
Annual Report
| 33
FRANKLIN MUTUAL BEACON FUND
NOTES TO FINANCIAL STATEMENTS
1. Organization and Significant Accounting
Policies (continued)
c. Derivative Financial Instruments (continued)
Derivative counterparty credit risk is managed through a formal evaluation of the creditworthiness of all potential counterparties. The Fund attempts to reduce its exposure to counterparty credit risk on OTC derivatives, whenever possible, by entering into International Swaps and Derivatives Association (ISDA) master agreements with certain counterparties. These agreements contain various provisions, including but not limited to collateral requirements, events of default, or early termination. Termination events applicable to the counterparty include certain deteriorations in the credit quality of the counterparty. Termination events applicable to the Fund include failure of the Fund to maintain certain net asset levels and/or limit the decline in net assets over various periods of time. In the event of default or early termination, the ISDA master agreement gives the non-defaulting party the right to net and close-out all transactions traded, whether or not arising under the ISDA agreement, to one net amount payable by one counterparty to the other. However, absent an event of default or early termination, OTC derivative assets and liabilities are presented gross and not offset in the Statement of Assets and Liabilities. Early termination by the counterparty may result in an immediate payment by the Fund of any net liability owed to that counterparty under the ISDA agreement.
Collateral requirements differ by type of derivative. Collateral or initial margin requirements are set by the broker or exchange clearing house for exchange traded and centrally cleared derivatives. Initial margin deposited is held at the exchange and can be in the form of cash and/or securities. For OTC derivatives traded under an ISDA master agreement, posting of collateral is required by either the Fund or the applicable counterparty if the total net exposure of all OTC derivatives with the applicable counterparty exceeds the minimum transfer amount, which typically ranges from $100,000 to $250,000, and can vary depending on the counterparty and the type of the agreement. Generally, collateral is determined at the close of fund business each day and any additional collateral required due to changes in derivative values may be delivered by the Fund or the counterparty within a few business days. Collateral pledged and/or received by the Fund for OTC derivatives, if any, is held in segregated accounts with the Fund’s custodian/counterparty broker and can be in the form of cash and/or securities. Unrestricted cash may be invested according to the Fund’s investment objectives.
The Fund entered into exchange traded futures contracts primarily to manage exposure to certain foreign currencies. A futures contract is an agreement between the Fund and a counterparty
to buy or sell an asset for a specified price on a future date. Required initial margins are pledged by the Fund, and the daily change in fair value is accounted for as a variation margin payable or receivable on the Statement of Assets and Liabilities.
The Fund entered into OTC forward exchange contracts primarily to manage exposure to certain foreign currencies.
A forward exchange contract is an agreement between the Fund and a counterparty to buy or sell a foreign currency at a specific exchange rate on a future date.
The Fund purchased or wrote exchange traded and/or OTC option contracts primarily to manage and/or gain exposure to equity price, interest rate and foreign exchange rate risk. An option is a contract entitling the holder to purchase or sell a specific amount of shares or units of an asset or notional amount of a swap (swaption), at a specified price. Options purchased are recorded as an asset while options written are recorded as a liability. Upon exercise of an option, the acquisition cost or sales proceeds of the underlying investment is adjusted by any premium received or paid. Upon expiration of an option, any premium received or paid is recorded as a realized gain or loss. Upon closing an option other than through expiration or exercise, the difference between the premium and the cost to close the position is recorded as a realized gain or loss.
See Notes 7 and 10 regarding investment transactions and other derivative information, respectively.
d. Restricted Cash
At December 31, 2014, the Fund held restricted cash in connection with investments in certain derivative securities. Restricted cash is held in a segregated account with the Fund’s custodian/counterparty broker and is reflected in the Statement of Assets and Liabilities.
e. Securities Sold Short
The Fund is engaged in selling securities short, which obligates the Fund to replace a borrowed security with the same security at current fair value. The Fund incurs a loss if the price of the security increases between the date of the short sale and the date on which the Fund replaces the borrowed security. The Fund realizes a gain if the price of the security declines between those dates. Gains are limited to the price at which the Fund sold the security short, while losses are potentially unlimited in size.
The Fund is required to establish a margin account with the broker lending the security sold short. While the short sale is outstanding, the broker retains the proceeds of the short sale to
34 | Annual Report
franklintempleton.com
FRANKLIN MUTUAL BEACON FUND
NOTES TO FINANCIAL STATEMENTS
the extent necessary to meet margin requirements until the short position is closed out. A deposit must also be maintained with the Fund’s custodian/counterparty broker consisting of cash and/or securities having a value equal to a specified percentage of the value of the securities sold short. The Fund is obligated to pay fees for borrowing the securities sold short and is required to pay the counterparty any dividends and/or interest due on securities sold short. Such dividends and/or interest and any security borrowing fees are recorded as an expense to the Fund.
f. Securities Lending
The Fund participates in an agency based securities lending program. The Fund receives cash collateral against the loaned securities in an amount equal to at least 102% of the fair value of the loaned securities. Collateral is maintained over the life of the loan in an amount not less than 100% of the fair value of loaned securities, as determined at the close of fund business each day; any additional collateral required due to changes in security values is delivered to the Fund on the next business day. The collateral is invested in a non-registered money fund as indicated on the Statement of Investments. The Fund receives income from the investment of cash collateral, in addition to lending fees and rebates paid by the borrower. The Fund bears the market risk with respect to the collateral investment, securities loaned, and the risk that the agent may default on its obligations to the Fund. The securities lending agent has agreed to indemnify the Fund in the event of default by a third party borrower.
g. Senior Floating Rate Interests
The Fund invests in senior secured corporate loans that pay interest at rates which are periodically reset by reference to a base lending rate plus a spread. These base lending rates are generally the prime rate offered by a designated U.S. bank or the London InterBank Offered Rate (LIBOR). Senior secured corporate loans often require prepayment of principal from excess cash flows or at the discretion of the borrower. As a result, actual maturity may be substantially less than the stated maturity. Senior secured corporate loans in which the Fund invests are generally readily marketable, but may be subject to certain restrictions on resale.
h. Income and Deferred Taxes
It is the Fund’s policy to qualify as a regulated investment company under the Internal Revenue Code. The Fund intends to distribute to shareholders substantially all of its taxable income and net realized gains to relieve it from federal income
and excise taxes. As a result, no provision for U.S. federal income taxes is required.
The Fund may be subject to foreign taxation related to income received, capital gains on the sale of securities and certain foreign currency transactions in the foreign jurisdictions in which it invests. Foreign taxes, if any, are recorded based on the tax regulations and rates that exist in the foreign markets in which the Fund invests. When a capital gain tax is determined to apply the Fund records an estimated deferred tax liability in an amount that would be payable if the securities were disposed of on the valuation date. As a result of several court cases, in certain countries across the European Union, the Fund has filed additional tax reclaims for previously withheld taxes on dividends earned in those countries. These additional filings are subject to various administrative proceedings by the local jurisdictions’ tax authorities within the European Union, as well as a number of related judicial proceedings. At this time, uncertainty exists as to the ultimate resolution of these proceedings, the likelihood of receipt of these reclaims, and the potential timing of payments, and accordingly, no amounts are reflected in the financial statements.
The Fund recognizes the tax benefits of uncertain tax positions only when the position is “more likely than not” to be sustained upon examination by the tax authorities based on the technical merits of the tax position. As of December 31, 2014, and for all open tax years, the Fund has determined that no liability for unrecognized tax benefits is required in the Fund’s financial statements related to uncertain tax positions taken on a tax return (or expected to be taken on future tax returns). Open tax years are those that remain subject to examination and are based on each tax jurisdiction statute of limitation.
i. Security Transactions, Investment Income, Expenses and Distributions
Security transactions are accounted for on trade date. Realized gains and losses on security transactions are determined on a specific identification basis. Interest income and estimated expenses are accrued daily. Amortization of premium and accretion of discount on debt securities are included in interest income. Dividend income and dividends declared on securities sold short are recorded on the ex-dividend date except for certain foreign securities where the dividend rate is not available. In such cases, the dividend is recorded as soon as the information is received by the Fund. Distributions to shareholders are recorded on the ex-dividend date and are determined according to income tax regulations (tax basis).
franklintempleton.com
Annual Report
| 35
FRANKLIN MUTUAL BEACON FUND
NOTES TO FINANCIAL STATEMENTS
1. Organization and Significant Accounting
Policies (continued)
i. Security Transactions, Investment Income, Expenses and Distributions (continued)
Distributable earnings determined on a tax basis may differ from earnings recorded in accordance with U.S. GAAP. These differences may be permanent or temporary. Permanent differences are reclassified among capital accounts to reflect their tax character. These reclassifications have no impact on net assets or the results of operations. Temporary differences are not reclassified, as they may reverse in subsequent periods.
Common expenses incurred by the Trust are allocated among the funds based on the ratio of net assets of each fund to the combined net assets of the Trust. Fund specific expenses are charged directly to the fund that incurred the expense.
Realized and unrealized gains and losses and net investment income, not including class specific expenses, are allocated daily to each class of shares based upon the relative proportion of net assets of each class. Differences in per share distributions,
by class, are generally due to differences in class specific expenses.
j. Accounting Estimates
The preparation of financial statements in accordance with U.S. GAAP requires management to make estimates and assumptions that affect the reported amounts of assets and liabilities at the date of the financial statements and the amounts of income and expenses during the reporting period. Actual results could differ from those estimates.
k. Guarantees and Indemnifications
Under the Trust’s organizational documents, its officers and trustees are indemnified by the Trust against certain liabilities arising out of the performance of their duties to the Trust. Additionally, in the normal course of business, the Trust, on behalf of the Fund, enters into contracts with service providers that contain general indemnification clauses. The Trust’s maximum exposure under these arrangements is unknown as this would involve future claims that may be made against the Trust that have not yet occurred. Currently, the Trust expects the risk of loss to be remote.
2. Shares of Beneficial Interest
At December 31, 2014, there were an unlimited number of shares authorized (without par value). Transactions in the Fund’s shares were as follows:
| Year Ended December 31, | ||||||||||||
| 2014 | 2013 | |||||||||||
| Shares | Amount | Shares | Amount | |||||||||
| Class Z Shares: | ||||||||||||
| Shares sold | 5,229,939 | $ | 91,015,375 | 5,766,527 | $ | 88,484,550 | ||||||
| Shares issued in reinvestment of distributions | 12,979,886 | 218,311,381 | 3,192,842 | 51,701,130 | ||||||||
| Shares redeemed | (21,017,382 | ) | (362,886,658 | ) | (22,237,269 | ) | (342,638,398 | ) | ||||
| Net increase (decrease) | (2,807,557 | ) | $ | (53,559,902 | ) | (13,277,900 | ) | $ | (202,452,718 | ) | ||
| Class A Shares: | ||||||||||||
| Shares sold | 4,739,908 | $ | 81,387,282 | 6,524,792 | $ | 99,232,404 | ||||||
| Shares issued in reinvestment of distributions | 5,201,776 | 86,929,792 | 1,140,730 | 18,260,693 | ||||||||
| Shares redeemed | (11,413,516 | ) | (196,877,474 | ) | (13,397,621 | ) | (202,460,066 | ) | ||||
| Net increase (decrease) | (1,471,832 | ) | $ | (28,560,400 | ) | (5,732,099 | ) | $ | (84,966,969 | ) | ||
| Class B Sharesa: | ||||||||||||
| Shares sold | 8 | $ | 118 | |||||||||
| Shares redeemed | (102,482 | ) | (1,429,219 | ) | ||||||||
| Net increase (decrease) | (102,474 | ) | $ | (1,429,101 | ) | |||||||
| Class C Shares: | ||||||||||||
| Shares sold | 970,010 | $ | 16,571,387 | 1,182,680 | $ | 17,946,283 | ||||||
| Shares issued in reinvestment of distributions | 1,364,458 | 22,656,149 | 204,523 | 3,174,069 | ||||||||
| Shares redeemed | (2,863,231 | ) | (48,924,654 | ) | (3,662,772 | ) | (54,889,686 | ) | ||||
| Net increase (decrease) | (528,763 | ) | $ | (9,697,118 | ) | (2,275,569 | ) | $ | (33,769,334 | ) | ||
| 36 | Annual Report | franklintempleton.com | |||||||||||
| FRANKLIN MUTUAL BEACON FUND | |||||||||||
| NOTES TO FINANCIAL STATEMENTS | |||||||||||
| Year Ended December 31, | |||||||||||
| 2014 | 2013 | b | |||||||||
| Shares | Amount | Shares | Amount | ||||||||
| Class R Shares: | |||||||||||
| Shares sold | 23,067 | $ | 398,900 | 18,668 | $ | 278,978 | |||||
| Shares issued in reinvestment of distributions | 10,739 | 177,877 | 1,768 | 27,980 | |||||||
| Shares redeemed | (13,549 | ) | (234,221 | ) | (47,578 | ) | (694,692 | ) | |||
| Net increase (decrease) | 20,257 | $ | 342,556 | (27,142 | ) | $ | (387,734 | ) | |||
| Class R6 Shares: | |||||||||||
| Shares sold | 3,331,155 | $ | 56,277,297 | 339 | $ | 5,000 | |||||
| Shares redeemed | (264,245 | ) | (4,602,202 | ) | — | — | |||||
| Net increase (decrease) | 3,066,910 | $ | 51,675,095 | 339 | $ | 5,000 | |||||
| aEffective March 22, 2013, all Class B shares were converted to Class A. | |||||||||||
| bFor the period May 1, 2013 (effective date) to December 31, 2013, for Class R6. | |||||||||||
3. Transactions with Affiliates
Franklin Resources, Inc. is the holding company for various subsidiaries that together are referred to as Franklin Templeton Investments. Certain officers and trustees of the Fund are also officers and/or directors of the following subsidiaries:
| Subsidiary | Affiliation |
| Franklin Mutual Advisers, LLC (Franklin Mutual) | Investment manager |
| Franklin Templeton Investment Management Limited (FTIML) | Investment manager |
| Franklin Templeton Services, LLC (FT Services) | Administrative manager |
| Franklin Templeton Distributors, Inc. (Distributors) | Principal underwriter |
| Franklin Templeton Investor Services, LLC (Investor Services) | Transfer agent |
a. Management Fees
The Fund pays an investment management fee to Franklin Mutual based on the average daily net assets of the Fund as follows:
| Annualized Fee Rate | Net Assets | |
| 0.675 | % | Up to and including $5 billion |
| 0.645 | % | Over $5 billion, up to and including $7 billion |
| 0.625 | % | Over $7 billion, up to and including $10 billion |
| 0.615 | % | In excess of $10 billion |
Effective July 1, 2014, the Fund combined its investment management and administration agreements as approved by the Board. The fees paid under the combined agreement do not exceed the aggregate fees that were paid under the separate agreements.
Prior to July 1, 2014, the Fund paid fees to Franklin Mutual based on the average daily net assets of the Fund as follows:
| Annualized Fee Rate | Net Assets | |
| 0.600 | % | Up to and including $5 billion |
| 0.570 | % | Over $5 billion, up to and including $7 billion |
| 0.550 | % | Over $7 billion, up to and including $10 billion |
| 0.540 | % | In excess of $10 billion |
franklintempleton.com
Annual Report
| 37
FRANKLIN MUTUAL BEACON FUND
NOTES TO FINANCIAL STATEMENTS
3. Transactions with Affiliates (continued)
a. Management Fees (continued)
Effective August 1, 2014, under a subadvisory agreement, FTIML, an affiliate of Franklin Mutual, provides subadvisory services to the Fund. The subadvisory fee is paid by Franklin Mutual based on the Fund’s average daily net assets, and is not an additional expense of the Fund.
b. Administrative Fees
Effective July 1, 2014, under an agreement with Franklin Mutual, FT Services provides administrative services to the Fund. The fee is paid by Franklin Mutual based on the Fund’s average daily net assets, and is not an additional expense of the Fund.
Prior to July 1, 2014, the Fund paid its allocated share of an administrative fee to FT Services based on the Trust’s aggregate average daily net assets as follows:
| Annualized Fee Rate | Net Assets | |
| 0.150 | % | Up to and including $200 million |
| 0.135 | % | Over $200 million, up to and including $700 million |
| 0.100 | % | Over $700 million, up to and including $1.2 billion |
| 0.075 | % | In excess of $1.2 billion |
c. Distribution Fees
The Board has adopted distribution plans for each share class, with the exception of Class Z and Class R6 shares, pursuant to Rule 12b-1 under the 1940 Act. Distribution fees are not charged on shares held by affiliates. Under the Fund’s Class A reimbursement distribution plan, the Fund reimburses Distributors for costs incurred in connection with the servicing, sale and distribution of the Fund’s shares up to the maximum annual plan rate. Under the Class A reimbursement distribution plan, costs exceeding the maximum for the current plan year cannot be reimbursed in subsequent periods. In addition, under the Fund’s Class C and R compensation distribution plans, the Fund pays Distributors for costs incurred in connection with the servicing, sale and distribution of the Fund’s shares up to the maximum annual plan rate for each class. The plan year, for purposes of monitoring compliance with the maximum annual plan rates, is February 1 through January 31 for each fund.
The maximum annual plan rates, based on the average daily net assets, for each class, are as follows:
| Class A | 0.35 | % |
| Class C | 1.00 | % |
| Class R | 0.50 | % |
The Board has set the current rate at 0.30% per year for Class A shares until further notice and approval by the Board.
d. Sales Charges/Underwriting Agreements
Front-end sales charges and contingent deferred sales charges (CDSC) do not represent expenses of the Fund. These charges are deducted from the proceeds of sales of Fund shares prior to investment or from redemption proceeds prior to remittance, as applicable. Distributors has advised the Fund of the following commission transactions related to the sales and redemptions of the Fund’s shares for the year:
| Sales charges retained net of commissions paid to unaffiliated | ||
| broker/dealers | $ | 232,569 |
| CDSC retained | $ | 17,672 |
38 | Annual Report
franklintempleton.com
FRANKLIN MUTUAL BEACON FUND
NOTES TO FINANCIAL STATEMENTS
e. Transfer Agent Fees
Each class of shares, except for Class R6, pays transfer agent fees to Investor Services for its performance of shareholder servicing obligations and reimburses Investor Services for out of pocket expenses incurred, including shareholding servicing fees paid to third parties. These fees are allocated daily based upon their relative proportion of such classes’ aggregate net assets. Class R6 pays Investor Services transfer agent fees specific to that class.
For the year ended December 31, 2014, the Fund paid transfer agent fees of $3,971,395, of which $1,773,711 was retained by Investor Services.
f. Waiver and Expense Reimbursements
Investor Services has contractually agreed in advance to waive or limit its fees so that the Class R6 transfer agent fees do not exceed 0.01% until April 30, 2015. There were no Class R6 transfer agent fees waived during the year ended December 31, 2014.
4. Expense Offset Arrangement
The Fund has entered into an arrangement with its custodian whereby credits realized as a result of uninvested cash balances are used to reduce a portion of the Fund’s custodian expenses. During the year ended December 31, 2014, the custodian fees were reduced as noted in the Statement of Operations.
5. Independent Trustees’ Retirement Plan
On January 1, 1993, the Trust adopted an Independent Trustees’ Retirement Plan (Plan). The Plan is an unfunded defined benefit plan that provides benefit payments to Trustees whose length of service and retirement age meets the eligibility requirements of the Plan. Benefits under the Plan are based on years of service and fees paid to each trustee at the time of retirement. Effective in December 1996, the Plan was closed to new participants.
During the year ended December 31, 2014, the Fund’s projected benefit obligation and benefit payments under the Plan were as follows:
| aProjected benefit obligation at December 31, 2014 | $ | 214,666 | |
| bIncrease in projected benefit obligation | $ | 6,021 | |
| Benefit payments made to retired trustees | $ | (4,249 | ) |
aThe projected benefit obligation is included in trustees’ fees and expenses in the Statement of Assets and Liabilities. bThe increase in projected benefit obligation is included in trustees’ fees and expenses in the Statement of Operations.
6. Income Taxes
For tax purposes, capital losses may be carried over to offset future capital gains.
During the year ended December 31, 2014, the Fund utilized $136,839,401 of capital loss carryforwards.
The tax character of distributions paid during the years ended December 31, 2014 and 2013, was as follows:
| 2014 | 2013 | |||
| Distributions paid from: | ||||
| Ordinary income | $ | 159,883,206 | $ | 77,464,248 |
| Long term capital gain | 190,769,709 | — | ||
| $ | 350,652,915 | $ | 77,464,248 |
franklintempleton.com
Annual Report
| 39
FRANKLIN MUTUAL BEACON FUND
NOTES TO FINANCIAL STATEMENTS
6. Income Taxes (continued)
At December 31, 2014, the cost of investments, net unrealized appreciation (depreciation), undistributed ordinary income and undistributed long term capital gains for income tax purposes were as follows:
| Cost of investments | $ | 3,342,375,495 | |
| Unrealized appreciation | $ | 1,130,248,778 | |
| Unrealized depreciation | (273,125,796 | ) | |
| Net unrealized appreciation (depreciation) | $ | 857,122,982 | |
| Undistributed ordinary income | $ | 11,874,504 | |
| Undistributed long term capital gains | 79,543,891 | ||
| Distributable earnings | $ | 91,418,395 | |
Differences between income and/or capital gains as determined on a book basis and a tax basis are primarily due to differing treatments of foreign currency transactions and bond discounts and premiums.
7. Investment Transactions
Purchases and sales of investments (excluding short term securities and securities sold short) for the year ended December 31, 2014, aggregated $1,652,284,532 and $1,770,153,547, respectively.
Transactions in options written during the year ended December 31, 2014, were as follows:
| Number of | |||||
| Contracts | Premiums | ||||
| Options outstanding at December 31, 2013 | — | $ | — | ||
| Options written | 3,521 | 1,035,306 | |||
| Options expired | — | — | |||
| Options exercised | (1,484 | ) | (665,603 | ) | |
| Options closed | (37 | ) | (144,528 | ) | |
| Options outstanding at December 31, 2014 | 2,000 | $ | 225,175 |
See Notes 1(c) and 10 regarding derivative financial instruments and other derivative information, respectively.
8. Credit Risk and Defaulted Securities
The Fund may purchase the pre-default or defaulted debt of distressed companies. Distressed companies are financially troubled and are about to be or are already involved in financial restructuring or bankruptcy. Risks associated with purchasing these securities include the possibility that the bankruptcy or other restructuring process takes longer than expected, or that distributions in restructuring are less than anticipated, either or both of which may result in unfavorable consequences to the Fund. If it becomes probable that the income on debt securities, including those of distressed companies, will not be collected, the Fund discontinues accruing income and recognizes an adjustment for uncollectible interest.
At December 31, 2014, the aggregate long value of distressed company securities for which interest recognition has been discontinued was $50,136,096, representing 1.18% of the Fund’s net assets. For information as to specific securities, see the accompanying Statement of Investments.
40 | Annual Report
franklintempleton.com
FRANKLIN MUTUAL BEACON FUND
NOTES TO FINANCIAL STATEMENTS
9. Restricted Securities
The Fund invests in securities that are restricted under the Securities Act of 1933 (1933 Act) or which are subject to legal, contractual, or other agreed upon restrictions on resale. Restricted securities are often purchased in private placement transactions, and cannot be sold without prior registration unless the sale is pursuant to an exemption under the 1933 Act. Disposal of these securities may require greater effort and expense, and prompt sale at an acceptable price may be difficult. The Fund may have registration rights for restricted securities. The issuer generally incurs all registration costs.
At December 31, 2014, the Fund held investments in restricted securities, excluding certain securities exempt from registration under the 1933 Act deemed to be liquid, as follows:
| Principal | ||||||
| Amount/ | Acquisition | |||||
| Shares | Issuer | Dates | Cost | Value | ||
| 10,848 | Broadband Ventures III LLC, secured promissory note, 5.00%, | |||||
| 2/01/12 | 7/01/10 - 11/30/12 | $ | 10,848 | $ | — | |
| 15,831,950 | CB FIM Coinvestors LLC | 1/15/09 - 6/02/09 | — | — | ||
| 19,805,560 | FIM Coinvestor Holdings I, LLC | 11/20/06 - 6/02/09 | — | — | ||
| 2,846,329 | International Automotive Components Group Brazil LLC | 4/13/06 - 12/26/08 | 1,890,264 | 269,206 | ||
| 22,836,904 | International Automotive Components Group North America LLC | 1/12/06 - 3/18/13 | 18,692,218 | 17,291,647 | ||
| 106,700 | Olympus Re Holdings Ltd. | 12/19/01 | 9,967,979 | — | ||
| 5,455 | PMG LLC | 3/22/04 | 381,819 | 294,219 | ||
| Total Restricted Securities (Value is 0.42% of Net Assets) | $ | 30,943,128 | $ | 17,855,072 |
10. Other Derivative Information
At December 31, 2014, the Fund’s investments in derivative contracts are reflected on the Statement of Assets and Liabilities as follows:
| Asset Derivatives | Liability Derivatives | ||||||
| Derivative Contracts | |||||||
| Not Accounted for as | Statement of Assets and | Statement of Assets and | |||||
| Hedging Instruments | Liabilities Location | Fair Value | Liabilities Location | Fair Value | |||
| Foreign exchange | |||||||
| contracts | Unrealized appreciation on | $ | 55,796,172 | a | Unrealized depreciation on | $ | 8,663,682 |
| forward exchange contracts / Net | forward exchange contracts | ||||||
| assets consist of - net unrealized | |||||||
| appreciation (depreciation) | |||||||
| Equity contracts | Options written, at value | 30,000 |
aIncludes cumulative appreciation (depreciation) of futures contracts as reported in the Statement of Investments. Only current day’s variation margin is separately reported within the Statement of Assets and Liabilities.
franklintempleton.com
Annual Report
| 41
FRANKLIN MUTUAL BEACON FUND
NOTES TO FINANCIAL STATEMENTS
10. Other Derivative Information (continued)
For the year ended December 31, 2014, the effect of derivative contracts on the Fund’s Statement of Operations was as follows:
| Change in | ||||||
| Unrealized | ||||||
| Derivative Contracts | Realized Gain | Appreciation | ||||
| Not Accounted for as | (Loss) for | (Depreciation) | ||||
| Hedging Instruments | Statement of Operations Locations | the Year | for the Year | |||
| Interest rate contracts | Net realized gain (loss) from investments / Net change in | $ | (7,114,121 | ) | $ | 5,499,494 |
| unrealized appreciation (depreciation) on investments | ||||||
| Foreign exchange contracts | Net realized gain (loss) from investments, foreign currency | 18,015,441 | 72,158,464 | |||
| transactions and futures contracts / Net change in | ||||||
| unrealized appreciation (depreciation) on investments and | ||||||
| translation of other assets and liabilities denominated in | ||||||
| foreign currencies | ||||||
| Equity contracts | Net realized gain (loss) from written options / Net change | 98,628 | 195,175 | |||
| in unrealized appreciation (depreciation) on investments |
For the year ended December 31, 2014, the average month end fair value of derivatives represented 1.09% of average month end net assets.
The average month end number of open derivative contracts for the year was 237.
| At December 31, 2014, the Fund’s OTC derivative assets and liabilities, are as follows: | ||||
| Gross and Net Amounts of Assets and Liabilities | ||||
| Presented in the Statement of Assets and Liabilities | ||||
| Assetsa | Liabilitiesa | |||
| Derivatives | ||||
| Forward exchange contracts | $ | 52,975,371 | $ | 8,663,682 |
aAbsent an event of default or early termination, OTC derivative assets and liabilities are presented gross and not offset in the Statement of Assets and Liabilities.
At December 31, 2014, the Fund’s OTC derivative assets which may be offset against the Fund’s OTC derivative liabilities and collateral received from the counterparty, is as follows:
| Amounts Not Offset in the | |||||||||||||
| Statement of Assets and Liabilities | |||||||||||||
| Gross and | |||||||||||||
| Net Amounts of | Financial | Financial | |||||||||||
| Assets Presented in | Instruments | Instruments | Cash | Net Amount | |||||||||
| the Statement of | Available for | Collateral | Collateral | (Not less | |||||||||
| Assets and Liabilities | Offset | Receiveda,b | Receivedb | than zero) | |||||||||
| Counterparty | |||||||||||||
| BANT | $ | 13,521,493 | $ | (1,665,870 | ) | $ | (11,855,623 | ) | $ | — | $ | — | |
| BBU | 13,129 | (13,129 | ) | — | — | — | |||||||
| BONY | 180,444 | (180,444 | ) | — | — | — | |||||||
| DBFX | 6,677,721 | (2,378,249 | ) | — | (4,200,000 | ) | 99,472 | ||||||
| FBCO | 8,849,644 | (843,130 | ) | (8,006,514 | ) | — | — | ||||||
| HSBC | 7,334,628 | (1,958,637 | ) | (5,375,991 | ) | — | — | ||||||
| SCBT | 3,618,435 | — | — | (3,618,435 | ) | — | |||||||
| SSBT | 12,779,877 | — | — | — | 12,779,877 | ||||||||
| Total | $ | 52,975,371 | $ | (7,039,459 | ) | $ | (25,238,128 | ) | $ | (7,818,435 | ) | $ | 12,879,349 |
aAt December 31, 2014, the Fund received Federal Republic of Germany Bonds, United Kingdom Treasury Bonds and Notes and U.S. Treasury Bonds and Notes as
collateral for derivatives.
bIn some instances, the collateral amounts disclosed in the table above were adjusted due to the requirement to limit the collateral amounts to avoid the effect of
overcollateralization. Actual collateral received and/or pledged may be more than the amounts disclosed herein.
42 | Annual Report
franklintempleton.com
FRANKLIN MUTUAL BEACON FUND
NOTES TO FINANCIAL STATEMENTS
At December 31, 2014, the Fund’s OTC derivative liabilities which may be offset against the Fund’s OTC derivative assets and collateral pledged to the counterparty, is as follows:
| Amounts Not Offset in the | |||||||||||||
| Statement of Assets and Liabilities | |||||||||||||
| Gross and | |||||||||||||
| Net Amounts of | Financial | Financial | |||||||||||
| Liabilities Presented in | Instruments | Instruments | Cash | Net Amount | |||||||||
| the Statement of | Available for | Collateral | Collateral | (Not less | |||||||||
| Assets and Liabilities | Offset | Pledgeda,b | Pledged | than zero) | |||||||||
| Counterparty | |||||||||||||
| BANT | $ | 1,665,870 | $ | (1,665,870 | ) | $ | — | $ | — | $ | — | ||
| BBU | 796,803 | (13,129 | ) | (783,674 | ) | — | — | ||||||
| BONY | 257,433 | (180,444 | ) | — | — | 76,989 | |||||||
| DBFX | 2,378,249 | (2,378,249 | ) | — | — | — | |||||||
| FBCO | 843,130 | (843,130 | ) | — | — | — | |||||||
| HSBC | 1,958,637 | (1,958,637 | ) | — | — | — | |||||||
| SCBT | — | — | — | — | — | ||||||||
| SSBT | 763,560 | — | — | — | 763,560 | ||||||||
| Total | $ | 8,663,682 | $ | (7,039,459 | ) | $ | (783,674 | ) | $ | — | $ | 840,549 | |
aSee the accompanying Statements of Investment for securities pledged as collateral for derivatives.
bIn some instances, the collateral amounts disclosed in the table above were adjusted due to the requirement to limit the collateral amounts to avoid the effect of
overcollateralization. Actual collateral received and/or pledged may be more than the amounts disclosed herein.
See Notes 1(c) and 7 regarding derivative financial instruments and investment transactions, respectively.
See Abbreviations on page 46.
11. Holdings of 5% Voting Securities of Portfolio Companies
The 1940 Act defines “affiliated companies” to include investments in portfolio companies in which a fund owns 5% or more of
the outstanding voting securities. Investments in “affiliated companies” for the Fund for the year ended December 31, 2014, were
as shown below.
| Number of | Number of | |||||||||||
| Shares Held | Shares Held | Value at | ||||||||||
| at Beginning | Gross | Gross | at End | End of | Investment | Realized | ||||||
| Name of Issuer | of Year | Additions | Reductions | of Year | Year | Income | Gain (Loss) | |||||
| Controlled Affiliatesa | ||||||||||||
| PMG LLC | 17,621 | — | (12,166 | ) | 5,455 | $ | 294,219 | $ | — | $ | (186,453 | ) |
| Non-Controlled Affiliates | ||||||||||||
| CB FIM Coinvestors LLC | 15,831,950 | — | — | 15,831,950 | $ | — | $ | — | $ | — | ||
| First Southern Bancorp Inc. | 1,065,450 | 704,776 | (1,770,226 | ) | — | — | — | 2,114,328 | ||||
| First Southern Bancorp | ||||||||||||
| Inc.,cvt. pfd., C | 1,821 | — | (1,821 | ) | — | — | — | — | ||||
| Polaris Consulting and | ||||||||||||
| Services Ltd./India | 7,108,509 | — | (439,128 | ) | 6,669,381 | 18,150,747 | 743,381 | (212,756 | ) | |||
| Total Non-Controlled Affiliates | $ | 18,150,747 | $ | 743,381 | $ | 1,901,572 | ||||||
| Total Affiliated Securities (Value is 0.43% of Net Assets) | $ | 18,444,966 | $ | 743,381 | $ | 1,715,119 | ||||||
| aIssuer in which the Fund owns 25% or more of the outstanding voting securities. | ||||||||||||
franklintempleton.com
Annual Report
| 43
FRANKLIN MUTUAL BEACON FUND
NOTES TO FINANCIAL STATEMENTS
12. Credit Facility
The Fund, together with other U.S. registered and foreign investment funds (collectively, Borrowers), managed by Franklin Templeton Investments, are borrowers in a joint syndicated senior unsecured credit facility totaling $1.5 billion (Global Credit Facility) which matured on February 13, 2015. This Global Credit Facility provides a source of funds to the Borrowers for temporary and emergency purposes, including the ability to meet future unanticipated or unusually large redemption requests. Effective February 13, 2015, the Borrowers renewed the Global Credit Facility for a total of $2 billion, which matures on February 12, 2016.
Under the terms of the Global Credit Facility, the Fund shall, in addition to interest charged on any borrowings made by the Fund and other costs incurred by the Fund, pay its share of fees and expenses incurred in connection with the implementation and maintenance of the Global Credit Facility, based upon its relative share of the aggregate net assets of all of the Borrowers, including an annual commitment fee of 0.07% based upon the unused portion of the Global Credit Facility. These fees are reflected in other expenses on the Statement of Operations. During the year ended December 31, 2014, the Fund did not use the Global Credit Facility.
13. Fair Value Measurements
The Fund follows a fair value hierarchy that distinguishes between market data obtained from independent sources (observable inputs) and the Fund’s own market assumptions (unobservable inputs). These inputs are used in determining the value of the Fund’s financial instruments and are summarized in the following fair value hierarchy:
- Level 1 – quoted prices in active markets for identical financial instruments
- Level 2 – other significant observable inputs (including quoted prices for similar financial instruments, interest rates, prepayment speed, credit risk, etc.)
- Level 3 – significant unobservable inputs (including the Fund’s own assumptions in determining the fair value of financial instruments)
The input levels are not necessarily an indication of the risk or liquidity associated with financial instruments at that level.
For movements between the levels within the fair value hierarchy, the Fund has adopted a policy of recognizing the transfers as of the date of the underlying event which caused the movement.
A summary of inputs used as of December 31, 2014, in valuing the Fund’s assets and liabilities carried at fair value, is as follows:
| Level 1 | Level 2 | Level 3 | Total | |||||
| Assets: | ||||||||
| Investments in Securities: | ||||||||
| Equity Investments:a | ||||||||
| Auto Components | $ | — | $ | — | $ | 17,560,853 | $ | 17,560,853 |
| Metals & Mining | 69,276,159 | — | 294,219 | 69,570,378 | ||||
| Real Estate Management & Development | — | — | 84,897,949 | 84,897,949 | ||||
| All Other Equity Investmentsb | 3,631,555,902 | — | —c | 3,631,555,902 | ||||
| Corporate Bonds, Notes and Senior Floating Rate | ||||||||
| Interests | — | 166,420,406 | — | 166,420,406 | ||||
| Corporate Notes and Senior Floating Rate Interests in | ||||||||
| Reorganization | — | 50,136,096 | —c | 50,136,096 | ||||
| Companies in Liquidation | 115,845 | 40,846,722 | —c | 40,962,567 | ||||
| Municipal Bonds | — | 11,190,990 | — | 11,190,990 | ||||
| Short Term Investments | 102,792,502 | 24,410,834 | — | 127,203,336 | ||||
| Total Investments in Securities | $ | 3,803,740,408 | $ | 293,005,048 | $ | 102,753,021 | $ | 4,199,498,477 |
| Other Financial Instruments | ||||||||
| Futures Contracts | $ | 2,820,801 | $ | — | $ | — | $ | 2,820,801 |
| Forward Exchange Contracts | — | 52,975,371 | — | 52,975,371 | ||||
| Total Other Financial Instruments | $ | 2,820,801 | $ | 52,975,371 | $ | — | $ | 55,796,172 |
| 44 | Annual Report | franklintempleton.com | |||||||
| FRANKLIN MUTUAL BEACON FUND | ||||||||
| NOTES TO FINANCIAL STATEMENTS | ||||||||
| Level 1 | Level 2 | Level 3 | Total | |||||
| Liabilities: | ||||||||
| Other Financial Instruments | ||||||||
| Options Written | $ | 30,000 | $ | — | $ | — | $ | 30,000 |
| Securities Sold Short | 44,527,044 | — | — | 44,527,044 | ||||
| Forward Exchange Contracts | — | 8,663,682 | — | 8,663,682 | ||||
| Total Other Financial Instruments | $ | 44,557,044 | $ | 8,663,682 | $ | — | $ | 53,220,726 |
| aIncludes common and preferred stocks as well as other equity investments. | ||||||||
| bFor detailed categories, see the accompanying Statement of Investments. | ||||||||
| cIncludes securities determined to have no value at December 31, 2014. | ||||||||
A reconciliation of assets in which Level 3 inputs are used in determining fair value is presented when there are significant Level 3
| financial instruments at the end of the year. At December 31, 2014, the reconciliations of assets, is as follows: | ||||||||||||||||||||||
| Net Change | ||||||||||||||||||||||
| in Unrealized | ||||||||||||||||||||||
| Net | Net | Appreciation | ||||||||||||||||||||
| Balance at | Transfers | Realized | Unrealized | Balance | (Depreciation) | |||||||||||||||||
| Beginning | Into (Out of) | Cost Basis | Gain | Appreciation | at End | on Assets Held | ||||||||||||||||
| of Year | Purchases | Sales | Level 3 | Adjustmentsa | (Loss) | (Depreciation) | of Year | at Year End | ||||||||||||||
| Assets: | ||||||||||||||||||||||
| Investments in Securities: | ||||||||||||||||||||||
| Equity Investments:b | ||||||||||||||||||||||
| Auto Components | $ | 13,476,099 | $ | — | $ | — | $ | — | $ | — | $ | — | $ | 4,084,754 | $ | 17,560,853 | $ | 4,084,754 | ||||
| Banks | 8,535,200 | — | (26,416,323 | ) | — | — | 2,114,328 | 15,766,795 | — | — | ||||||||||||
| Insurance | —c | — | — | — | (27,789 | ) | — | 27,789 | —c | 27,789 | ||||||||||||
| Metals & Mining | 934,094 | — | (665,204 | ) | — | — | (186,453 | ) | 211,782 | 294,219 | 5,073 | |||||||||||
| Real Estate | ||||||||||||||||||||||
| Management | ||||||||||||||||||||||
| & Development | 52,039,512 | — | — | — | — | — | 32,858,437 | 84,897,949 | 32,858,437 | |||||||||||||
| Total | $ | 74,984,905 | $ | — | $ | (27,081,527 | ) | $ | — | $ | (27,789 | ) | $ | 1,927,875 | $ | 52,949,557 | $ | 102,753,021 | $ | 36,976,053 | ||
aMay include accretion, amortization, partnership adjustments, and/or other cost basis adjustments.
bIncludes common and convertible preferred stocks as well as other equity investments.
cIncludes securities determined to have no value.
Significant unobservable valuation inputs developed by the VLOC for material Level 3 financial instruments and impact to fair
value as a result of changes in unobservable valuation inputs as of December 31, 2014, are as follows:
| Impact to Fair | |||||
| Fair Value at | Valuation | Value if Input | |||
| Description | End of Year | Technique | Unobservable Inputs | Amount | Increasesa |
Assets:
Investments in Securities:
| Equity Investments: | |||||||
| Auto Components | $ | 17,291,647 | Market | Discount for lack of marketability | 10 | % | Decreaseb |
| comparables | EV / EBITDA multiple | 3.6 | x | Increasec | |||
| Real Estate Management | |||||||
| & Development. | 84,897,949 | Market | Discount for lack of marketability | ||||
| comparables | 8 | % | Decreasec | ||||
| All Other Investmentsd | 563,425 | ||||||
| Total | $ | 102,753,021 |
aRepresents the directional change in the fair value of the Level 3 financial instruments that would result from a significant and reasonable increase in the corresponding
input. A significant and reasonable decrease in input would have the opposite effect. Significant impacts, if any, to fair value and/or net assets have been indicated.
bRepresents a significant impact to fair value but not net assets.
cRepresents a significant impact to fair value and net assets.
dIncludes fair value of immaterial financial instruments developed using various valuation techniques and unobservable inputs. May also include financial instruments with
values derived using prior transaction prices or third party pricing information without adjustment for which such inputs are also unobservable.
franklintempleton.com
Annual Report
| 45
FRANKLIN MUTUAL BEACON FUND
NOTES TO FINANCIAL STATEMENTS
13. Fair Value Measurements (continued)
Abbreviations List
EBITDA EV | Earnings before interest, taxes, depreciation and amortization Enterprise value |
14. New Accounting Pronouncements
In June 2014, Financial Accounting Standards Board issued Accounting Standards Update (ASU) No. 2014-11, Transfers and Servicing (Topic 860), Repurchase-to-Maturity Transactions, Repurchase Financings, and Disclosures. The ASU changes the accounting for certain repurchase agreements and expands disclosure requirements related to repurchase agreements, securities lending, repurchase-to-maturity and similar transactions. The ASU is effective for interim and annual reporting periods beginning after December 15, 2014. Management has reviewed the requirements and believes the adoption of this ASU will not have a material impact on the financial statements.
15. Subsequent Events
The Fund has evaluated subsequent events through the issuance of the financial statements and determined that no events have occurred that require disclosure other than those already disclosed in the financial statements.
| Abbreviations | |||||
| Counterparty | Currency | Selected Portfolio | |||
| BANT | Bank of America N.A. | EUR | Euro | ADR | American Depositary Receipt |
| BBU | Barclays Bank PLC | GBP | British Pound | FHLB | Federal Home Loan Bank |
| BONY | Bank of New York Mellon | USD | United States Dollar | GO | General Obligation |
| DBFX | Deutsche Bank AG | PIK | Payment-In-Kind | ||
| FBCO | Credit Suisse Group AG | ||||
| HSBC | HSBC Bank USA, N.A. | ||||
| SCBT | Standard Chartered Bank | ||||
| SSBT | State Street Bank and Trust Co., N.A. | ||||
46 | Annual Report
franklintempleton.com
FRANKLIN MUTUAL BEACON FUND
Report of Independent Registered Public Accounting Firm
To the Board of Trustees of Franklin Mutual Series Funds and Shareholders of Franklin Mutual Beacon Fund:
We have audited the accompanying statement of assets and liabilities, including the statement of investments, of Franklin Mutual Beacon Fund (formerly, Mutual Beacon Fund) (the “Fund”) (one of the funds constituting Franklin Mutual Series Funds), as of December 31, 2014, and the related statement of operations for the year then ended, the statements of changes in net assets for each of the two years in the period then ended, and the financial highlights for each of the periods indicated therein. These financial statements and financial highlights are the responsibility of the Fund’s management. Our responsibility is to express an opinion on these financial statements and financial highlights based on our audits.
We conducted our audits in accordance with the standards of the Public Company Accounting Oversight Board (United States). Those standards require that we plan and perform the audit to obtain reasonable assurance about whether the financial statements and financial highlights are free of material misstatement. We were not engaged to perform an audit of the Fund’s internal control over financial reporting. Our audits included consideration of internal control over financial reporting as a basis for designing audit procedures that are appropriate in the circumstances, but not for the purpose of expressing an opinion on the effectiveness of the Fund’s internal control over financial reporting. Accordingly, we express no such opinion. An audit also includes examining, on a test basis, evidence supporting the amounts and disclosures in the financial statements and financial highlights, assessing the accounting principles used and significant estimates made by management, and evaluating the overall financial statement presentation. Our procedures included confirmation of securities owned as of December 31, 2014, by correspondence with the custodian and brokers or by other appropriate auditing procedures where replies from the brokers were not received. We believe that our audits provide a reasonable basis for our opinion.
In our opinion, the financial statements and financial highlights referred to above present fairly, in all material respects, the financial position of Franklin Mutual Beacon Fund (one of the funds constituting Franklin Mutual Series Funds) at December 31, 2014, the results of its operations for the year then ended, the changes in its net assets for each of the two years in the period then ended, and the financial highlights for each of the periods indicated therein, in conformity with U.S. generally accepted accounting principles.
![]()
Boston, Massachusetts
February 18, 2015
franklintempleton.com
Annual Report
| 47
FRANKLIN MUTUAL BEACON FUND
Tax Information (unaudited)
Under Section 852(b)(3)(C) of the Internal Revenue Code (Code), the Fund hereby reports the maximum amount allowable but no less than $190,769,709 as a long term capital gain dividend for the fiscal year ended December 31, 2014.
Under Section 854(b)(1)(A) of the Code, the Fund hereby reports 26.33% of the ordinary income dividends as income qualifying for the dividends received deduction for the fiscal year ended December 31, 2014.
Under Section 854(b)(1)(B) of the Code, the Fund hereby reports the maximum amount allowable but no less than $140,519,723 as qualified dividends for purposes of the maximum rate under Section 1(h)(11) of the Code for the fiscal year ended December 31, 2014. Distributions, including qualified dividend income, paid during calendar year 2014 will be reported to shareholders on Form 1099-DIV by mid-February 2015. Shareholders are advised to check with their tax advisors for information on the treatment of these amounts on their individual income tax returns.
Under Section 871(k)(1)(C) of the Code, the Fund hereby reports the maximum amount allowable but no less than $17,807,264 as interest related dividends for purposes of the tax imposed under Section 871(a)(1)(A) of the Code for the fiscal year ended December 31, 2014.
48 | Annual Report
franklintempleton.com
FRANKLIN MUTUAL BEACON FUND
Board Members and Officers
The name, year of birth and address of the officers and board members, as well as their affiliations, positions held with the Fund, principal occupations during at least the past five years and number of portfolios overseen in the Franklin Templeton Investments fund complex are shown below. Generally, each board member serves until that person’s successor is elected and qualified.
| Independent Board Members | ||||
| Number of Portfolios in | ||||
| Name, Year of Birth | Length of | Fund Complex Overseen | Other Directorships Held During | |
| and Address | Position | Time Served | by Board Member* | at Least the Past 5 Years |
| Edward I. Altman, Ph.D. (1941) | Trustee | Since 1987 | 10 | None |
| c/o Franklin Mutual Advisers, LLC | ||||
| 101 John F. Kennedy Parkway | ||||
| Short Hills, NJ 07078-2789 | ||||
Principal Occupation During at Least the Past 5 Years:
Max L. Heine Professor of Finance and Director of The Credit and Debt Markets Research Program, Salomon Center, Stern School of Business, New York University; editor and author of numerous financial publications; financial consultant; an adviser to numerous financial and publishing organizations; and formerly, Vice Director, Salomon Center, Stern School of Business, New York University.
| Ann Torre Bates (1958) | Trustee | Since 1995 | 36 | Navient Corporation (loan |
| c/o Franklin Mutual Advisers, LLC | management, servicing and asset | |||
| 101 John F. Kennedy Parkway | recovery) (May 2014), Ares Capital | |||
| Short Hills, NJ 07078-2789 | Corporation (specialty finance | |||
| company) (2010-present), United | ||||
| Natural Foods, Inc. (distributor of | ||||
| natural, organic and specialty foods) | ||||
| (2013-present), Allied Capital | ||||
| Corporation (financial services) | ||||
| (2003-2010) and SLM Corporation | ||||
| (Sallie Mae) (1997-2014). | ||||
Principal Occupation During at Least the Past 5 Years:
Director of various companies; and formerly, Executive Vice President and Chief Financial Officer, NHP Incorporated (manager of multifamily housing) (1995-1997); and Vice President and Treasurer, US Airways, Inc. (until 1995).
| Burton J. Greenwald (1929) Trustee | Since 2002 | 17 | Franklin Templeton Emerging Markets |
| c/o Franklin Mutual Advisers, LLC | Debt Opportunities Fund PLC and | ||
| 101 John F. Kennedy Parkway | Fiduciary International Ireland Limited. | ||
| Short Hills, NJ 07078-2789 |
Principal Occupation During at Least the Past 5 Years:
Managing Director, B.J. Greenwald Associates (management consultants to the financial services industry); and formerly, Chairman, Fiduciary Trust International Funds; Executive Vice President, L.F Rothschild Fund Management, Inc.; President and Director, Merit Mutual Funds; President, Underwriting Division and Director, National Securities & Research Corporation; Governor, Investment Company Institute; and Chairman, ICI Public Information Committee.
| Keith E. Mitchell (1954) | Trustee | Since 2009 | 10 | None |
| c/o Franklin Mutual Advisers, LLC | ||||
| 101 John F. Kennedy Parkway | ||||
| Short Hills, NJ 07078-2789 | ||||
Principal Occupation During at Least the Past 5 Years:
Managing Member, Mitchell, Hartley & Bechtel Advisers, LLC (formerly, Mitchell Advisers, LLC) (advisory firm); director of various boards of asset management firms; and formerly, Managing Director, Putnam Lovell NBF.
franklintempleton.com
Annual Report
| 49
| FRANKLIN MUTUAL BEACON FUND | ||||
| Independent Board Members (continued) | ||||
| Number of Portfolios in | ||||
| Name, Year of Birth | Length of | Fund Complex Overseen | Other Directorships Held During | |
| and Address | Position | Time Served | by Board Member* | at Least the Past 5 Years |
| Charles Rubens II (1930) | Trustee | Since 1998 | 17 | None |
| c/o Franklin Mutual Advisers, LLC | ||||
| 101 John F. Kennedy Parkway | ||||
| Short Hills, NJ 07078-2789 | ||||
Principal Occupation During at Least the Past 5 Years:
Private investor and president of non-profit organizations; and formerly, an executive of Time, Inc.; and Trustee of Colorado College.
| Jan Hopkins Trachtman (1947) Trustee | Since 2009 | 10 | None |
| c/o Franklin Mutual Advisers, LLC | |||
| 101 John F. Kennedy Parkway | |||
| Short Hills, NJ 07078-2789 |
Principal Occupation During at Least the Past 5 Years:
President and Founder, The Jan Hopkins Group (communications consulting firm); President, Economic Club of New York; serves on Advisory Board of Knight Bagehot Fellowship; and formerly, Anchor/Correspondent, CNN Financial News (until 2003); Managing Director and Head of Client Communications, Citigroup Private Bank (until 2005); Off-Air Reporter, ABC News’ World News Tonight; and Editor, CBS Network News.
| Robert E. Wade (1946) | Trustee and | Trustee since 1993 43 | El Oro Ltd (investments). | |
| c/o Franklin Mutual Advisers, LLC Chairman of | and Chairman of | |||
| 101 John F. Kennedy Parkway | the Board | the Board since | ||
| Short Hills, NJ 07078-2789 | 2005 | |||
| Principal Occupation During at Least the Past 5 Years: | ||||
| Attorney at law engaged in private practice (1972-2008) and member of various boards. | ||||
| Interested Board Members and Officers | ||||
| Number of Portfolios in | ||||
| Name, Year of Birth | Length of | Fund Complex Overseen | Other Directorships Held During | |
| and Address | Position | Time Served | by Board Member* | at Least the Past 5 Years |
| **Gregory E. Johnson (1961) | Trustee | Since 2007 | 147 | None |
| One Franklin Parkway | ||||
| San Mateo, CA 94403-1906 | ||||
Principal Occupation During at Least the Past 5 Years:
Chairman of the Board, Member – Office of the Chairman, Director, President and Chief Executive Officer, Franklin Resources, Inc.; officer and/or director or trustee, as the case may be, of some of the other subsidiaries of Franklin Resources, Inc. and of 44 of the investment companies in Franklin Templeton Investments; and Vice Chairman, Investment Company Institute.
| **Peter A. Langerman (1955) | Trustee, | Trustee since | 10 | American International Group, Inc. | |
| c/o Franklin Mutual Advisers, LLC President, and | 2007, President, | (AIG) Credit Facility Trust | |||
| 101 John F. Kennedy Parkway | Chief Executive and Chief | (2010–2011 | ). | ||
| Short Hills, NJ 07078-2702 | Officer – | Executive Officer – | |||
| Investment | Investment | ||||
| Management | Management since | ||||
| 2005 | |||||
Principal Occupation During at Least the Past 5 Years:
Chairman of the Board, Chief Executive Officer and President, Franklin Mutual Advisers, LLC; officer and/or director, as the case may be, of four of the investment companies in Franklin Templeton Investments.
50 | Annual Report
franklintempleton.com
FRANKLIN MUTUAL BEACON FUND
| Interested Board Members and Officers (continued) | ||||
| Number of Portfolios in | ||||
| Name, Year of Birth | Length of | Fund Complex Overseen | Other Directorships Held During | |
| and Address | Position | Time Served | by Board Member* | at Least the Past 5 Years |
| Alison E. Baur (1964) | Vice President | Since 2012 | Not Applicable | Not Applicable |
| One Franklin Parkway | ||||
| San Mateo, CA 94403-1906 | ||||
Principal Occupation During at Least the Past 5 Years:
Deputy General Counsel, Franklin Templeton Investments; and officer of some of the other subsidiaries of Franklin Resources, Inc. and of 46 of the investment companies in Franklin Templeton Investments.
| Philippe Brugere-Trelat (1949) | Vice President | Since 2005 | Not Applicable | Not Applicable |
| 101 John F. Kennedy Parkway | ||||
| Short Hills NJ 07078-2789 |
Principal Occupation During at Least the Past 5 Years:
Executive Vice President, Franklin Mutual Advisers, LLC; officer of three of the investment companies in Franklin Templeton Investments; and formerly, Portfolio Manager of Eurovest SA (French registered Investment Company, Sicav).
| Laura F. Fergerson (1962) | Chief | Since 2009 | Not Applicable | Not Applicable |
| One Franklin Parkway | Executive | |||
| San Mateo, CA 94403-1906 | Officer – | |||
| Finance and | ||||
| Administration |
Principal Occupation During at Least the Past 5 Years:
Senior Vice President, Franklin Templeton Services, LLC; and officer of 46 of the investment companies in Franklin Templeton Investments
| Aliya S. Gordon (1973) | Vice President | Since 2009 | Not Applicable | Not Applicable |
| One Franklin Parkway | ||||
| San Mateo, CA 94403-1906 |
Principal Occupation During at Least the Past 5 Years:
Senior Associate General Counsel, Franklin Templeton Investments; officer of 46 of the investment companies in Franklin Templeton Investments; and formerly, Litigation Associate, Steefel, Levitt & Weiss, LLP (2000-2004).
| Steven J. Gray (1955) | Secretary and | Secretary since | Not Applicable | Not Applicable |
| One Franklin Parkway | Vice President | 2005 and Vice | ||
| San Mateo, CA 94403-1906 | President since | |||
| 2009 |
Principal Occupation During at Least the Past 5 Years:
Senior Associate General Counsel, Franklin Templeton Investments; Vice President, Franklin Templeton Distributors, Inc. and Franklin Alternative Strategies Advisers, LLC; and officer of 46 of the investment companies in Franklin Templeton Investments.
| Selena L. Holmes (1965) | Vice President | Since 2012 | Not Applicable | Not Applicable |
| 100 Fountain Parkway | – AML | |||
| St. Petersburg, FL 33716-1205 | Compliance |
Principal Occupation During at Least the Past 5 Years:
Director, Global Compliance Monitoring; Chief Compliance Officer, Franklin Alternative Strategies Advisers, LLC; Vice President, Franklin Templeton Companies, LLC; and officer of 46 of the investment companies in Franklin Templeton Investments.
franklintempleton.com
Annual Report
| 51
FRANKLIN MUTUAL BEACON FUND
| Interested Board Members and Officers (continued) | ||||
| Number of Portfolios in | ||||
| Name, Year of Birth | Length of | Fund Complex Overseen | Other Directorships Held During | |
| and Address | Position | Time Served | by Board Member* | at Least the Past 5 Years |
| Robert G. Kubilis (1973) | Treasurer, | Since 2012 | Not Applicable | Not Applicable |
| 300 S.E. 2nd Street | Chief Financial | |||
| Fort Lauderdale, FL 33301-1923 | Officer and | |||
| Chief | ||||
| Accounting | ||||
| Officer | ||||
Principal Occupation During at Least the Past 5 Years:
Assistant Treasurer, Fund Accounting, Franklin Templeton Investments; and officer of four of the investment companies in Franklin Templeton Investments.
| Kimberly H. Novotny (1972) Vice President | Since 2013 | Not Applicable | Not Applicable |
| 300 S.E. 2nd Street | |||
| Fort Lauderdale, FL 33301-1923 |
Principal Occupation During at Least the Past 5 Years:
Associate General Counsel, Franklin Templeton Investments; Vice President and Secretary, Fiduciary Trust International of the South; Vice President, Templeton Investment Counsel, LLC; Assistant Secretary, Franklin Resources, Inc.; and officer of 46 of the investment companies in Franklin Templeton Investments.
| Robert C. Rosselot (1960) | Chief | Since 2013 | Not Applicable | Not Applicable |
| 300 S.E. 2nd Street | Compliance | |||
| Fort Lauderdale, FL 33301-1923 | Officer |
Principal Occupation During at Least the Past 5 Years:
Director, Global Compliance, Franklin Templeton Investments; Vice President, Franklin Templeton Companies, LLC; officer of 46 of the investment companies in Franklin Templeton Investments; and formerly, Senior Associate General Counsel, Franklin Templeton Investments (2007-2013); and Secretary and Vice President, Templeton Group of Funds (2004-2013).
| Karen L. Skidmore (1952) | Vice President | Since 2009 | Not Applicable | Not Applicable |
| One Franklin Parkway | ||||
| San Mateo, CA 94403-1906 |
Principal Occupation During at Least the Past 5 Years:
Senior Associate General Counsel, Franklin Templeton Investments; and officer of 46 of the investment companies in Franklin Templeton Investments.
| Craig S. Tyle (1960) | Vice President | Since 2005 | Not Applicable | Not Applicable |
| One Franklin Parkway | ||||
| San Mateo, CA 94403-1906 |
Principal Occupation During at Least the Past 5 Years:
General Counsel and Executive Vice President, Franklin Resources, Inc.; and officer of some of the other subsidiaries of Franklin Resources, Inc. and of 46 of the investment companies in Franklin Templeton Investments.
52 | Annual Report
franklintempleton.com
FRANKLIN MUTUAL BEACON FUND
| Interested Board Members and Officers (continued) | ||||
| Number of Portfolios in | ||||
| Name, Year of Birth | Length of | Fund Complex Overseen | Other Directorships Held During | |
| and Address | Position | Time Served | by Board Member* | at Least the Past 5 Years |
| Lori A. Weber (1964) | Vice President | Since 2011 | Not Applicable | Not Applicable |
| 300 S.E. 2nd Street | ||||
| Fort Lauderdale, FL 33301-1923 | ||||
Principal Occupation During at Least the Past 5 Years:
Senior Associate General Counsel, Franklin Templeton Investments; Assistant Secretary, Franklin Resources, Inc.; Vice President and Secretary, Templeton Investment Counsel, LLC; Vice President, Fiduciary Trust International of the South; and officer of 46 of the investment companies in Franklin Templeton Investments.
*We base the number of portfolios on each separate series of the U.S. registered investment companies within the Franklin Templeton Investments fund complex. These portfolios have a common investment manager or affiliated investment managers.
**Gregory E. Johnson is considered to be an interested person of the Fund under the federal securities laws due to his position as an officer and director of Franklin Resources, Inc., which is the parent company of the Fund’s investment manager and distributor. Peter A. Langerman is considered to be an interested person of the Fund under the federal securities laws due to his position as an officer of Franklin Mutual Advisers, LLC, which is an affiliate of the Fund’s investment manager.
Note 1: Officer information is current as of the date of this report. It is possible that after this date, information about officers may change.
The Fund’s Board has determined that certain of the members of the Audit Committee, including Ann Torre Bates, are audit committee financial experts, and “independent,” under those provisions of the Sarbanes-Oxley Act of 2002, and the rules and form amendments adopted by the Securities and Exchange Commission, relating to audit committee financial experts.
The Statement of Additional Information (SAI) includes additional information about the board members and is available, without charge, upon request.
Shareholders may call (800) DIAL BEN/342-5236 to request the SAI.
franklintempleton.com
Annual Report
| 53
FRANKLIN MUTUAL BEACON FUND
Shareholder Information
Proxy Voting Policies and Procedures
The Fund’s investment manager has established Proxy Voting Policies and Procedures (Policies) that the Fund uses to determine how to vote proxies relating to portfolio securities. Shareholders may view the Fund’s complete Policies online at franklintempleton.com. Alternatively, shareholders may request copies of the Policies free of charge by calling the Proxy Group collect at (954) 527-7678 or by sending a written request to: Franklin Templeton Companies, LLC, 300 S.E. 2nd Street, Fort Lauderdale, FL 33301, Attention: Proxy Group. Copies of the Fund’s proxy voting records are also made available online at franklintempleton.com and posted on the U.S. Securities and Exchange Commission’s website at sec.gov and reflect the most recent 12-month period ended June 30.
Quarterly Statement of Investments
The Fund files a complete statement of investments with the U.S. Securities and Exchange Commission for the first and third quarters for each fiscal year on Form N-Q. Shareholders may view the filed Form N-Q by visiting the Commission’s website at sec.gov. The filed form may also be viewed and copied at the Commission’s Public Reference Room in Washington, DC. Information regarding the operations of the Public Reference Room may be obtained by calling (800) SEC-0330.
Householding of Reports and Prospectuses
You will receive the Fund’s financial reports every six months as well as an annual updated summary prospectus (prospectus available upon request). To reduce Fund expenses, we try to identify related shareholders in a household and send only one copy of the financial reports and summary prospectus. This process, called “householding,” will continue indefinitely unless you instruct us otherwise. If you prefer not to have these documents householded, please call us at (800) 632-2301. At any time you may view current prospectuses/summary prospectuses and financial reports on our website. If you choose, you may receive these documents through electronic delivery.
54 | Annual Report
franklintempleton.com
This page intentionally left blank.
This page intentionally left blank.
Annual Report and Shareholder Letter
Franklin Mutual Beacon Fund
Formerly, Mutual Beacon Fund
Investment Manager
Franklin Mutual Advisers, LLC
Subadvisor
Franklin Templeton Investment Management Limited
Distributor
Franklin Templeton Distributors, Inc.
(800) DIAL BEN® / 342-5236
franklintempleton.com
Shareholder Services
(800) 632-2301 - (Class A, C, R & R6)
(800) 448-FUND - (Class Z)
Authorized for distribution only when accompanied or preceded by a summary prospectus and/or prospectus. Investors should carefully consider a fund’s investment goals, risks, charges and expenses before investing. A prospectus contains this and other information; please read it carefully before investing.
To help ensure we provide you with quality service, all calls to and from our service areas are monitored and/or recorded.
| © 2015 Franklin Templeton Investments. All rights reserved. | 476 A 02/15 |
Annual Report
and Shareholder Letter
December 31, 2014
Franklin Mutual European Fund
Formerly, Mutual European Fund

Sign up for electronic delivery at franklintempleton.com/edelivery
Franklin Templeton Investments
Gain From Our Perspective®
At Franklin Templeton Investments, we’re dedicated to one goal: delivering exceptional asset management for our clients. By bringing together multiple, world-class investment teams in a single firm, we’re able to offer specialized expertise across styles and asset classes, all supported by the strength and resources of one of the world’s largest asset managers. This has helped us to become a trusted partner to individual and institutional investors across the globe.
Focus on Investment Excellence
At the core of our firm, you’ll find multiple independent investment teams—each with a focused area of expertise—from traditional to alternative strategies and multi-asset solutions. And because our portfolio groups operate autonomously, their strategies can be combined to deliver true style and asset class diversification.
All of our investment teams share a common commitment to excellence grounded in rigorous, fundamental research and robust, disciplined risk management. Decade after decade, our consistent, research-driven processes have helped Franklin Templeton earn an impressive record of strong, long-term results.
Global Perspective Shaped by Local Expertise
In today’s complex and interconnected world, smart investing demands a global perspective. Franklin Templeton pioneered international investing over 60 years ago, and our expertise in emerging markets spans more than a quarter of a century. Today, our investment professionals are on the ground across the globe, spotting investment ideas and potential risks firsthand. These locally based teams bring in-depth understanding of local companies, economies and cultural nuances, and share their best thinking across our global research network.
Strength and Experience
Franklin Templeton is a global leader in asset management serving clients in over 150 countries.1 We run our business with the same prudence we apply to asset management, staying focused on delivering relevant investment solutions, strong long-term results and reliable, personal service. This approach, focused on putting clients first, has helped us to become one of the most trusted names in financial services.
1. As of 12/31/13. Clients are represented by the total number of shareholder accounts.
Not FDIC Insured | May Lose Value | No Bank Guarantee
| Contents | |
| Shareholder Letter | 1 |
| Annual Report | |
| Franklin Mutual European Fund | 4 |
| Performance Summary | 8 |
| Your Fund’s Expenses | 13 |
| Financial Highlights and | |
| Statement of Investments | 15 |
| Financial Statements | 26 |
| Notes to Financial Statements | 30 |
| Report of Independent Registered | |
| Public Accounting Firm | 44 |
| Tax Information | 45 |
| Board Members and Officers | 46 |
| Shareholder Information | 51 |
| 1
Annual Report
Franklin Mutual European Fund
(formerly, Mutual European Fund)
This annual report for Franklin Mutual European Fund covers the fiscal year ended December 31, 2014.
Your Fund’s Goals and Main Investments
The Fund seeks capital appreciation, with income as a secondary goal, by investing at least 80% of its net assets in securities of European companies that the manager believes are available at market prices less than their intrinsic value. The Fund defines European companies as issuers organized under the laws of, or whose principal business operations are located in, or who earn at least 50% of their revenue from, European countries, as defined in the prospectus.
Performance Overview
The Fund’s Class Z shares had a -4.00% cumulative total return for the 12 months under review. For comparison, the Fund’s benchmark, the MSCI Europe Index, which tracks equity performance in Europe’s developed markets, produced a +4.66% total return in local currency terms.1 You can find more of the Fund’s performance data in the Performance Summary beginning on page 8.
Performance data represent past performance, which does not guarantee future results. Investment return and principal value will fluctuate, and you may have a gain or loss when you sell your shares. Current performance may differ from figures shown. Please visit franklintempleton.com or call (800) 342-5236 for most recent month-end performance.
Economic and Market Overview
The global economy grew moderately during the 12 months under review as U.S. economic growth expanded while growth in the European region was anemic. Oil prices declined sharply during the 12-month period, resulting from weak global demand growth and strong world supply, and gold prices ended lower amid benign global inflation and a strong U.S. dollar.
In Europe, the U.K. economy grew relatively well, supported by the services and manufacturing sectors. In the eurozone,
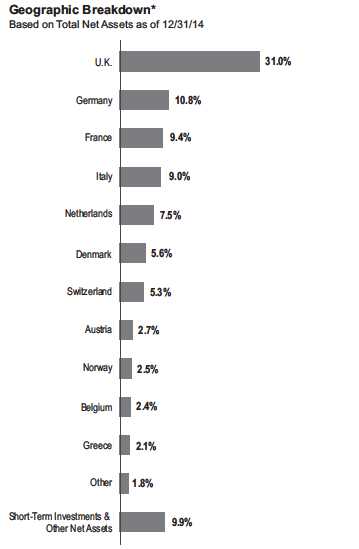
*Weightings may be negative or may not total 100% due to rounding, use of any derivatives, unsettled trades or other factors.
economic growth remained subdued, as concerns persisted about the potential negative impacts to growth from the crisis in Ukraine and China’s moderating growth rate. However, third-quarter economic growth, though meager, exceeded expectations, especially in the region’s major economies of Germany
1. Source: Morningstar.
The unmanaged index is calculated in local currency and includes reinvested daily net dividends. One cannot invest directly in an index, and an index is not representative of the Fund’s portfolio.
See www.franklintempletondatasources.com for additional data provider information.
The dollar value, number of shares or principal amount, and names of all portfolio holdings are listed in the Fund’s Statement of Investments (SOI).
The SOI begins on page 20.
4 | Annual Report
franklintempleton.com
FRANKLIN MUTUAL EUROPEAN FUND
and France. In June, the European Central Bank (ECB) reduced its main interest rate and, for the first time, set a negative deposit rate; the ECB reduced both rates again in September. The ECB broadened its monetary easing stance by implementing an asset purchase program to prevent deflation and stimulate the economy. Toward period-end, the ECB cut its 2014 growth forecast for the eurozone and attributed the reduction to geopolitical risks dampening confidence and private investment.
Investment Strategy
We follow a distinctive value investment approach that combines investments in what we believe are undervalued common stocks with distressed debt investing and risk arbitrage. Our style aims to provide our shareholders with superior risk-adjusted results over time. We employ rigorous, fundamental analysis to find compelling situations. In our opinion, successful investing is as much about assessing risk and containing losses as it is about achieving profits. In choosing investments, we look at the market price of an individual company’s securities relative to our evaluation of its intrinsic value based on factors including book value, cash flow generation, long-term earnings potential and earnings multiples. We may invest in bankrupt or distressed companies if we believe the market overreacted to adverse developments or failed to appreciate positive changes.
In addition, it is our practice to hedge the Fund’s currency exposure when we deem it advantageous for our shareholders.
What is meant by “hedge”?
To hedge an investment is to take a position intended to offset potential losses/gains that may be incurred by a companion financial instrument.
| Top 10 Sectors/Industries | ||
| Based on Equity Securities as of 12/31/14 | ||
| % of Total | ||
| Net Assets | ||
| Insurance | 16.6 | % |
| Banks | 12.7 | % |
| Diversified Telecommunication Services | 6.8 | % |
| Oil, Gas & Consumable Fuels | 5.6 | % |
| Metals & Mining | 4.1 | % |
| Media | 4.1 | % |
| Specialty Retail | 4.0 | % |
| Marine | 2.9 | % |
| Machinery | 2.5 | % |
| Hotels, Restaurants & Leisure | 2.5 | % |
Manager’s Discussion
During the period under review, some of the Fund’s investments negatively affected performance. These included retailers Tesco and Metro and oil and gas firm Cairn Energy.
Shares of U.K.-based Tesco fell throughout 2014. In March, the stock declined as investors became more concerned about price competition from major discounters and competitor supermarkets. Then in August, Tesco issued an unexpected trading statement ahead of its scheduled first-half results. The company lowered its profit guidance primarily for its flagship U.K. operations and cut its dividend. The stock price took a further hit in September with the announcement of material accounting irregularities in Tesco’s core U.K. operations and a contemporaneous change of both the company’s chief executive officer and chief financial officer. At year-end, the Fund no longer held Tesco shares.
Upheaval in Ukraine and Russia’s involvement disrupted Germany-based retailer Metro’s planned partial initial public offering (IPO) of its Russia cash-and-carry business. The IPO was important as it would have provided a benchmark valuation for this important Metro operation and allowed Metro to fund growth and further reduce debt with the capital raised. Instead, the company sought to raise cash by selling other non-core assets, such as the September sale of its stake in U.K.-based Booker and its operations in Vietnam. As of year-end, we believed the market assigned little value to Metro’s Russian operations, despite the fact that the business has continued to perform well amid deteriorating economic conditions within Russia. In our view, Metro stock has material upside potential should the situation in Ukraine be resolved and conditions in Russia improve in a reasonable time frame.
Shares of Cairn Energy declined sharply in the first quarter of 2014 following an inquiry by Indian tax authorities, which appeared to use a 2012 law to seek capital gains tax on transactions internal to Cairn, entered into in 2006–2007. Serious questions arose about the validity of the 2012 law, and its applicability to Cairn was particularly questionable as it related to internal transactions and not an actual sale. Nonetheless, the Indian tax department prohibited Cairn from selling further shares of its holding in Cairn India until this issue was resolved, calling into question the company’s ability to fund its aggressive exploration program beyond the coming year. The situation took a positive turn in May with a landslide victory by the opposition BJP party in India’s national elections. We viewed as positive the new government’s early moves in other dealings with corporations and a statement about the retroactive transfer
franklintempleton.com
Annual Report
| 5
FRANKLIN MUTUAL EUROPEAN FUND
tax. During the second half of the year, the company announced that a significant discovery of high-quality oil off the coast of Senegal seemed to offer potential for expansion of commercial operations, which appeared favorable.
In contrast, several Fund holdings increased in value during the 12-month period. Top contributors to performance included Direct Line Insurance Group, pharmaceutical firm Novartis and International Consolidated Airlines Group.
| Top 10 Equity Holdings | ||
| 12/31/14 | ||
| Company | % of Total | |
| Sector/Industry, Country | Net Assets | |
| A.P. Moeller-Maersk AS, B | 2.9 | % |
| Marine, Denmark | ||
| Direct Line Insurance Group PLC | 2.7 | % |
| Insurance, U.K. | ||
| Accor SA | 2.5 | % |
| Hotels, Restaurants & Leisure, France | ||
| Ageas | 2.4 | % |
| Insurance, Belgium | ||
| Volkswagen AG, pfd. | 2.4 | % |
| Automobiles, Germany | ||
| RSA Insurance Group PLC | 2.2 | % |
| Insurance, U.K. | ||
| Barclays PLC | 2.2 | % |
| Banks, U.K. | ||
| International Consolidated Airlines Group SA | 2.2 | % |
| Airlines, U.K. | ||
| ThyssenKrupp AG | 2.2 | % |
| Metals & Mining, Germany | ||
| BNP Paribas SA | 2.1 | % |
| Banks, France |
U.K.-based Direct Line Insurance Group continued to prioritize margins over growth, a strategy that has benefited financial results. The company’s focus on underwriting and expenses freed up capital that Direct Line used to raise its interim dividend as well as to issue a special dividend in August. Direct Line’s management has been forthright about its disciplined underwriting strategy as the industry confronted shrinking premiums in a deteriorating pricing environment. In late September, the company also announced the sale of its German and Italian operations at a price that exceeded our expectations. We believe proceeds from the sale may also be returned to shareholders via an additional special dividend.
Novartis shares rose in early September after a study showed positive results for its investigational drug for patients with chronic heart failure. An expedited marketing authorization
by the U.S. Food and Drug Administration (FDA) is possible given the FDA’s fast-track designation and rolling review feature, whereby segments of a marketing application are reviewed prior to receipt of the complete application. The Switzerland-based company also stated that it intends to file for marketing authorization for the same drug in the European Union in early 2015. In the fourth quarter of 2014, Novartis shares moved higher in response to quarterly sales and margin results that drove earnings per share above consensus estimates. Solid operating margin results were seen across all divisions but were most notable in pharmaceuticals, which benefited from strong sales of several drugs, particularly leukemia drug Gleevec.
International Consolidated Airlines Group (IAG) is a U.K.-based holding company that owns British Airways, Iberia and discount carrier Vueling. The company is in the process of improving the profitability of Vueling and its legacy carrier operations, British Airways and Iberia. After declining in the middle of 2014 due to weak economic data in Europe, the stock rallied strongly during the fourth quarter. The positive move was aided by solid demand trends, declining fuel costs from more efficient planes and falling fuel prices, and a lack of meaningful business impact from the Ebola crisis in western Africa. In November, IAG held an investor day at which the company announced its goals through 2020. These included a 25% dividend payout ratio starting in 2015, an operating margin target that was higher than expected and earnings-per-share growth of 10% per year.
During the period, the Fund held currency forwards and futures to hedge a significant portion of the currency risk of the portfolio’s non-U.S. dollar investments. The hedges had a positive impact on the Fund’s performance during the period.
What is a currency forward contract?
A currency forward contract, or a currency forward, is an agreement between the Fund and a counterparty to buy or sell a foreign currency at a specific exchange rate on a future date.
What is a futures contract?
A futures contract, or a future, is an agreement between the Fund and a counterparty made through a U.S. or foreign futures exchange to buy or sell an asset at a specific price on a future date.
6 | Annual Report
franklintempleton.com
FRANKLIN MUTUAL EUROPEAN FUND
As fellow shareholders, we found recent relative performance disappointing, but it is not uncommon for our strategy to lag amid a strong equity market. We remain committed to our disciplined, value investment approach as we seek to generate attractive, long-term, risk-adjusted returns for shareholders. Thank you for your continued participation in Franklin Mutual European Fund. We look forward to continuing to serve your investment needs.

The foregoing information reflects our analysis, opinions and portfolio holdings as of December 31, 2014, the end of the reporting period. The way we implement our main investment strategies and the resulting portfolio holdings may change depending on factors such as market and economic conditions. These opinions may not be relied upon as investment advice or an offer for a particular security. The information is not a complete analysis of every aspect of any market, country, industry, security or the Fund. Statements of fact are from sources considered reliable, but the investment manager makes no representation or warranty as to their completeness or accuracy. Although historical performance is no guarantee of future results, these insights may help you understand our investment management philosophy.
CFA® is a trademark owned by CFA Institute.
Philippe Brugere-Trelat has been co-portfolio manager for Franklin Mutual European Fund (formerly, Mutual European Fund) since 2010 and portfolio manager since 2005. He also has been portfolio manager for Franklin Mutual Global Discovery Fund (formerly, Mutual Global Discovery Fund) since 2009. He has been a member of the management team of the Mutual Series Funds since 2004, when he rejoined Franklin Templeton Investments. Previously, he was president and portfolio manager of Eurovest. Between 1984 and 1994, Mr. Brugere-Trelat was employed at Heine Securities Corporation, the Fund’s former manager.
Katrina Dudley has been co-portfolio manager for Franklin Mutual European Fund (formerly, Mutual European Fund) since 2010 and was assistant portfolio manager since 2007. She follows industrial companies (foreign and domestic) including transportation, manufacturers, machinery, electrical equipment and general industrial, as well as health care services companies. Prior to joining Franklin Templeton Investments in 2002, Ms. Dudley was an investment analyst at Federated Investors, Inc., responsible for the technology and health care sectors. From 1995 to 2001, Ms. Dudley was a senior manager in the corporate finance division of Ernst & Young LLP, where she specialized in valuation and litigation consulting.
franklintempleton.com
Annual Report
| 7
FRANKLIN MUTUAL EUROPEAN FUND
Performance Summary as of December 31, 2014
Your dividend income will vary depending on dividends or interest paid by securities in the Fund’s portfolio, adjusted for operating expenses of each class. Capital gain distributions are net profits realized from the sale of portfolio securities. The performance table and graphs do not reflect any taxes that a shareholder would pay on Fund dividends, capital gain distributions, if any, or any realized gains on the sale of Fund shares. Total return reflects reinvestment of the Fund’s dividends and capital gain distributions, if any, and any unrealized gains or losses.
| Net Asset Value | ||||||
| Share Class (Symbol) | 12/31/14 | 12/31/13 | Change | |||
| Z (MEURX) | $ | 20.86 | $ | 24.76 | -$ | 3.90 |
| A (TEMIX) | $ | 20.33 | $ | 24.21 | -$ | 3.88 |
| C (TEURX) | $ | 20.37 | $ | 24.25 | -$ | 3.88 |
| R (n/a) | $ | 20.04 | $ | 23.95 | -$ | 3.91 |
| R6 (FMEUX) | $ | 20.85 | $ | 24.75 | -$ | 3.90 |
| Distributions (1/1/14-12/31/14) | ||||||
| Dividend | Long-Term | |||||
| Share Class | Income | Capital Gain | Total | |||
| Z | $ | 0.6706 | $ | 2.2251 | $ | 2.8957 |
| A | $ | 0.5996 | $ | 2.2251 | $ | 2.8247 |
| C | $ | 0.4392 | $ | 2.2251 | $ | 2.6643 |
| R | $ | 0.6005 | $ | 2.2251 | $ | 2.8256 |
| R6 | $ | 0.7105 | $ | 2.2251 | $ | 2.9356 |
8 | Annual Report
franklintempleton.com
FRANKLIN MUTUAL EUROPEAN FUND
PERFORMANCE SUMMARY
Performance as of 12/31/14
Cumulative total return excludes sales charges. Average annual total return and value of $10,000 investment include maximum sales charges. Class Z/R/R6: no sales charges; Class A: 5.75% maximum initial sales charge; Class C: 1% contingent deferred sales charge in first year only.
| Cumulative | Average Annual | Value of | Total Annual | |||||||
| Share Class | Total Return1 | Total Return2 | $ | 10,000 Investment3 | Operating Expenses4 | |||||
| Z | ||||||||||
| 1.07 | % | |||||||||
| 1-Year | -4.00 | % | -4.00 | % | $ | 9,600 | ||||
| 5-Year | + | 43.03 | % | + | 7.42 | % | $ | 14,303 | ||
| 10-Year | + | 109.14 | % | + | 7.66 | % | $ | 20,914 | ||
| A | ||||||||||
| 1.37 | % | |||||||||
| 1-Year | -4.31 | % | -9.82 | % | $ | 9,018 | ||||
| 5-Year | + | 40.86 | % | + | 5.83 | % | $ | 13,277 | ||
| 10-Year | + | 102.89 | % | + | 6.70 | % | $ | 19,122 | ||
| C | ||||||||||
| 2.07 | % | |||||||||
| 1-Year | -4.97 | % | -5.81 | % | $ | 9,419 | ||||
| 5-Year | + | 36.07 | % | + | 6.35 | % | $ | 13,607 | ||
| 10-Year | + | 89.28 | % | + | 6.59 | % | $ | 18,928 | ||
| R | ||||||||||
| 1.57 | % | |||||||||
| 1-Year | -4.52 | % | -4.52 | % | $ | 9,548 | ||||
| 5-Year | + | 39.45 | % | + | 6.88 | % | $ | 13,945 | ||
| Since Inception (10/30/09) | + | 45.35 | % | + | 7.50 | % | $ | 14,535 | ||
| R65 | ||||||||||
| 0.90 | % | |||||||||
| 1-Year | -3.88 | % | -3.88 | % | $ | 9,612 | ||||
| Since Inception (5/1/13) | + | 14.38 | % | + | 8.38 | % | $ | 11,438 |
Performance data represent past performance, which does not guarantee future results. Investment return and principal value will fluctuate, and you may have a gain or loss when you sell your shares. Current performance may differ from figures shown. For most recent month-end performance, go to franklintempleton.com or call (800) 342-5236.
franklintempleton.com
Annual Report
| 9
FRANKLIN MUTUAL EUROPEAN FUND
PERFORMANCE SUMMARY
Total Return Index Comparison for a Hypothetical $10,000 Investment
Total return represents the change in value of an investment over the periods shown. It includes any applicable maximum sales charge, Fund expenses, account fees and reinvested distributions. The unmanaged index is calculated in local currency and includes reinvested daily net dividends. It differs from the Fund in composition and does not pay management fees or expenses. One cannot invest directly in an index.
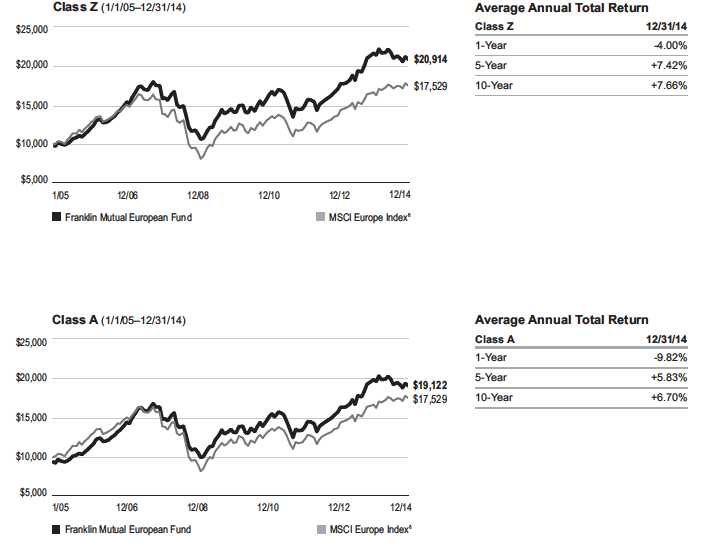
10 | Annual Report
franklintempleton.com
FRANKLIN MUTUAL EUROPEAN FUND
PERFORMANCE SUMMARY
Total Return Index Comparison for a Hypothetical $10,000 Investment (continued)
franklintempleton.com
Annual Report
| 11
FRANKLIN MUTUAL EUROPEAN FUND
PERFORMANCE SUMMARY
Total Return Index Comparison for a Hypothetical $10,000 Investment (continued)

All investments involve risks, including possible loss of principal. Value securities may not increase in price as anticipated or may decline further in value. Special risks are associated with foreign investing, including currency fluctuations, economic instability and political developments. Because the Fund invests its assets primarily in companies in a specific region, it is subject to greater risks of adverse developments in that region and/or the surrounding regions than a fund that is more broadly diversified geographically. Political, social or economic disruptions in the region, even in countries in which the Fund is not invested, may adversely affect the value of securities held by the Fund. The Fund’s investments in smaller company stocks carry an increased risk of price fluctuation, especially over the short term. The Fund’s investments in companies engaged in mergers, reorganizations or liquidations also involve special risks as pending deals may not be completed on time or on favorable terms. The Fund is actively managed but there is no guarantee that the manager’s investment decisions will produce the desired results. The Fund’s prospectus also includes a discussion of the main investment risks.
| Class Z: | Shares are available to certain eligible investors as described in the prospectus. |
| Class C: | These shares have higher annual fees and expenses than Class A shares. |
| Class R: | Shares are available to certain eligible investors as described in the prospectus. These shares have higher annual fees and expenses than Class A shares. |
| Class R6: | Shares are available to certain eligible investors as described in the prospectus. |
1. Cumulative total return represents the change in value of an investment over the periods indicated.
2. Average annual total return represents the average annual change in value of an investment over the periods indicated.
3. These figures represent the value of a hypothetical $10,000 investment in the Fund over the periods indicated.
4. Figures are as stated in the Fund’s current prospectus. In periods of market volatility, assets may decline significantly, causing total annual Fund operating expenses to
become higher than the figures shown.
5. Class R6 has a fee waiver contractually guaranteed through at least 4/30/15. Investment results reflect the fee waiver, to the extent applicable; without this reduction, the
results would have been lower.
6. Source: Morningstar. The MSCI Europe Index is a market capitalization-weighted index designed to measure equity market performance of developed markets in Europe.
See www.franklintempletondatasources.com for additional data provider information.
12 | Annual Report
franklintempleton.com
FRANKLIN MUTUAL EUROPEAN FUND
Your Fund’s Expenses
As a Fund shareholder, you can incur two types of costs:
• Transaction costs, including sales charges (loads) on Fund
purchases; and
• Ongoing Fund costs, including management fees, distribu-
tion and service (12b-1) fees, and other Fund expenses. All
mutual funds have ongoing costs, sometimes referred to
as operating expenses.
The following table shows ongoing costs of investing in the Fund and can help you understand these costs and compare them with those of other mutual funds. The table assumes a $1,000 investment held for the six months indicated.
Actual Fund Expenses
The first line (Actual) for each share class listed in the table provides actual account values and expenses. The “Ending Account Value” is derived from the Fund’s actual return, which includes the effect of Fund expenses.
You can estimate the expenses you paid during the period by following these steps. Of course, your account value and expenses will differ from those in this illustration:
1. Divide your account value by $1,000.
If an account had an $8,600 value,
then $8,600 ÷ $1,000 = 8.6.
2. Multiply the result by the number under the heading
“Expenses Paid During Period.”
If Expenses Paid During Period were $7.50,
then 8.6 x $7.50 = $64.50.
In this illustration, the estimated expenses paid this period are $64.50.
Hypothetical Example for Comparison with Other Funds
Information in the second line (Hypothetical) for each class in the table can help you compare ongoing costs of investing in the Fund with those of other mutual funds. This information may not be used to estimate the actual ending account balance or expenses you paid during the period. The hypothetical “Ending Account Value” is based on the actual expense ratio for each class and an assumed 5% annual rate of return before expenses, which does not represent the Fund’s actual return. The figure under the heading “Expenses Paid During Period” shows the hypothetical expenses your account would have incurred under this scenario. You can compare this figure with the 5% hypothetical examples that appear in shareholder reports of other funds.
Please note that expenses shown in the table are meant to highlight ongoing costs and do not reflect any transaction costs, such as sales charges. Therefore, the second line for each class is useful in comparing ongoing costs only, and will not help you compare total costs of owning different funds. In addition, if transaction costs were included, your total costs would have been higher. Please refer to the Fund prospectus for additional information on operating expenses.
franklintempleton.com
Annual Report
| 13
| FRANKLIN MUTUAL EUROPEAN FUND | ||||||
| YOUR FUND’S EXPENSES | ||||||
| Beginning Account | Ending Account | Expenses Paid During | ||||
| Share Class | Value 7/1/14 | Value 12/31/14 | Period* 7/1/14–12/31/14 | |||
| Z | ||||||
| Actual | $ | 1,000 | $ | 955.30 | $ | 5.13 |
| Hypothetical (5% return before expenses) | $ | 1,000 | $ | 1,019.96 | $ | 5.30 |
| A | ||||||
| Actual | $ | 1,000 | $ | 953.80 | $ | 6.60 |
| Hypothetical (5% return before expenses) | $ | 1,000 | $ | 1,018.45 | $ | 6.82 |
| C | ||||||
| Actual | $ | 1,000 | $ | 950.70 | $ | 10.03 |
| Hypothetical (5% return before expenses) | $ | 1,000 | $ | 1,014.92 | $ | 10.36 |
| R | ||||||
| Actual | $ | 1,000 | $ | 952.40 | $ | 7.58 |
| Hypothetical (5% return before expenses) | $ | 1,000 | $ | 1,017.44 | $ | 7.83 |
| R6 | ||||||
| Actual | $ | 1,000 | $ | 956.20 | $ | 4.44 |
| Hypothetical (5% return before expenses) | $ | 1,000 | $ | 1,020.67 | $ | 4.58 |
*Expenses are calculated using the most recent six-month expense ratio, annualized for each class (Z: 1.04%; A: 1.34%; C: 2.04%; R: 1.54%; and R6: 0.90%), multiplied by the average account value over the period, multiplied by 184/365 to reflect the one-half year period.
14 | Annual Report
franklintempleton.com
| FRANKLIN MUTUAL EUROPEAN FUND | |||||||||||||||
| Financial Highlights | |||||||||||||||
| Year Ended December 31, | |||||||||||||||
| 2014 | 2013 | 2012 | 2011 | 2010 | |||||||||||
| Class Z | |||||||||||||||
| Per share operating performance | |||||||||||||||
| (for a share outstanding throughout the year) | |||||||||||||||
| Net asset value, beginning of year | $ | 24.76 | $ | 21.13 | $ | 18.95 | $ | 21.47 | $ | 20.39 | |||||
| Income from investment operationsa: | |||||||||||||||
| Net investment incomeb | 0.73 | c | 0.49 | 0.44 | 0.50 | 0.34 | |||||||||
| Net realized and unrealized gains (losses) | (1.73 | ) | 5.12 | 2.89 | (2.25 | ) | 1.40 | ||||||||
| Total from investment operations | (1.00 | ) | 5.61 | 3.33 | (1.75 | ) | 1.74 | ||||||||
| Less distributions from: | |||||||||||||||
| Net investment income | (0.67 | ) | (0.46 | ) | (0.68 | ) | (0.77 | ) | (0.66 | ) | |||||
| Net realized gains | (2.23 | ) | (1.52 | ) | (0.47 | ) | — | — | |||||||
| Total distributions | (2.90 | ) | (1.98 | ) | (1.15 | ) | (0.77 | ) | (0.66 | ) | |||||
| Net asset value, end of year | $ | 20.86 | $ | 24.76 | $ | 21.13 | $ | 18.95 | $ | 21.47 | |||||
| Total return | (4.00 | )% | 26.68 | % | 17.73 | % | (8.01 | )% | 8.61 | % | |||||
| Ratios to average net assets | |||||||||||||||
| Expensesd | 1.04 | %e | 1.07 | %e | 1.13 | % | 1.11 | % | 1.10 | % | |||||
| Expenses incurred in connection with securities sold short | 0.01 | % | —%f | —% | —% | —% | |||||||||
| Net investment income | 2.93 | %c | 2.04 | % | 2.16 | % | 2.43 | % | 1.65 | % | |||||
| Supplemental data | |||||||||||||||
| Net assets, end of year (000’s) | $ | 1,128,769 | $ | 1,399,294 | $ | 1,101,659 | $ | 964,069 | $ | 1,057,801 | |||||
| Portfolio turnover rate | 54.05 | % | 39.05 | % | 41.69 | % | 32.60 | % | 35.44 | % | |||||
aThe amount shown for a share outstanding throughout the period may not correlate with the Statement of Operations for the period due to the timing of sales and
repurchases of the Fund shares in relation to income earned and/or fluctuating fair value of the investments of the Fund.
bBased on average daily shares outstanding.
cNet investment income per share includes approximately $0.29 per share received in the form of a special dividend paid in connection with certain Fund’s holdings.
Excluding this amount, the ratio of net investment income to average net assets would have been 1.74%.
dIncludes dividend expense on securities sold short and security borrowing fees, if any. See below for the ratios of such expenses to average net assets for the periods
presented. See Note 1(e).
eBenefit of expense reduction rounds to less than 0.01%.
fRounds to less than 0.01%.
franklintempleton.com
The accompanying notes are an integral part of these financial statements. | Annual Report | 15
FRANKLIN MUTUAL EUROPEAN FUND
FINANCIAL HIGHLIGHTS
| Year Ended December 31, | |||||||||||||||
| 2014 | 2013 | 2012 | 2011 | 2010 | |||||||||||
| Class A | |||||||||||||||
| Per share operating performance | |||||||||||||||
| (for a share outstanding throughout the year) | |||||||||||||||
| Net asset value, beginning of year | $ | 24.21 | $ | 20.71 | $ | 18.59 | $ | 21.06 | $ | 20.02 | |||||
| Income from investment operationsa: | |||||||||||||||
| Net investment incomeb | 0.61 | c | 0.42 | 0.37 | 0.44 | 0.27 | |||||||||
| Net realized and unrealized gains (losses) | (1.66 | ) | 4.99 | 2.84 | (2.20 | ) | 1.37 | ||||||||
| Total from investment operations | (1.05 | ) | 5.41 | 3.21 | (1.76 | ) | 1.64 | ||||||||
| Less distributions from: | |||||||||||||||
| Net investment income | (0.60 | ) | (0.39 | ) | (0.62 | ) | (0.71 | ) | (0.60 | ) | |||||
| Net realized gains | (2.23 | ) | (1.52 | ) | (0.47 | ) | — | — | |||||||
| Total distributions | (2.83 | ) | (1.91 | ) | (1.09 | ) | (0.71 | ) | (0.60 | ) | |||||
| Net asset value, end of year | $ | 20.33 | $ | 24.21 | $ | 20.71 | $ | 18.59 | $ | 21.06 | |||||
| Total returnd | (4.31 | )% | 26.30 | % | 17.37 | % | (8.27 | )% | 8.25 | % | |||||
| Ratios to average net assets | |||||||||||||||
| Expensese | 1.34 | %f | 1.37 | %f | 1.43 | % | 1.41 | % | 1.40 | % | |||||
| Expenses incurred in connection with securities sold short | 0.01 | % | —%g | —% | —% | —% | |||||||||
| Net investment income | 2.63 | %c | 1.74 | % | 1.86 | % | 2.13 | % | 1.35 | % | |||||
| Supplemental data | |||||||||||||||
| Net assets, end of year (000’s) | $ | 843,836 | $ | 839,655 | $ | 653,435 | $ | 593,825 | $ | 765,304 | |||||
| Portfolio turnover rate | 54.05 | % | 39.05 | % | 41.69 | % | 32.60 | % | 35.44 | % | |||||
aThe amount shown for a share outstanding throughout the period may not correlate with the Statement of Operations for the period due to the timing of sales and
repurchases of the Fund shares in relation to income earned and/or fluctuating fair value of the investments of the Fund.
bBased on average daily shares outstanding.
cNet investment income per share includes approximately $0.29 per share received in the form of a special dividend paid in connection with certain Fund’s holdings.
Excluding this amount, the ratio of net investment income to average net assets would have been 1.44%.
dTotal return does not reflect sales commissions or contingent deferred sales charges, if applicable.
eIncludes dividend expense on securities sold short and security borrowing fees, if any. See below for the ratios of such expenses to average net assets for the periods
presented. See Note 1(e).
fBenefit of expense reduction rounds to less than 0.01%.
gRounds to less than 0.01%.
16 | Annual Report | The accompanying notes are an integral part of these financial statements.
franklintempleton.com
| FRANKLIN MUTUAL EUROPEAN FUND | |||||||||||||||
| FINANCIAL HIGHLIGHTS | |||||||||||||||
| Year Ended December 31, | |||||||||||||||
| 2014 | 2013 | 2012 | 2011 | 2010 | |||||||||||
| Class C | |||||||||||||||
| Per share operating performance | |||||||||||||||
| (for a share outstanding throughout the year) | |||||||||||||||
| Net asset value, beginning of year | $ | 24.25 | $ | 20.79 | $ | 18.66 | $ | 21.10 | $ | 20.05 | |||||
| Income from investment operationsa: | |||||||||||||||
| Net investment incomeb | 0.43 | c | 0.24 | 0.24 | 0.31 | 0.13 | |||||||||
| Net realized and unrealized gains (losses) | (1.64 | ) | 5.02 | 2.83 | (2.20 | ) | 1.36 | ||||||||
| Total from investment operations | (1.21 | ) | 5.26 | 3.07 | (1.89 | ) | 1.49 | ||||||||
| Less distributions from: | |||||||||||||||
| Net investment income | (0.44 | ) | (0.28 | ) | (0.47 | ) | (0.55 | ) | (0.44 | ) | |||||
| Net realized gains | (2.23 | ) | (1.52 | ) | (0.47 | ) | — | — | |||||||
| Total distributions | (2.67 | ) | (1.80 | ) | (0.94 | ) | (0.55 | ) | (0.44 | ) | |||||
| Net asset value, end of year | $ | 20.37 | $ | 24.25 | $ | 20.79 | $ | 18.66 | $ | 21.10 | |||||
| Total returnd | (4.97 | )% | 25.44 | % | 16.54 | % | (8.90 | )% | 7.52 | % | |||||
| Ratios to average net assets | |||||||||||||||
| Expensese | 2.04 | %f | 2.07 | %f | 2.13 | % | 2.11 | % | 2.10 | % | |||||
| Expenses incurred in connection with securities sold short | 0.01 | % | —%g | —% | —% | —% | |||||||||
| Net investment income | 1.93 | %c | 1.04 | % | 1.16 | % | 1.43 | % | 0.65 | % | |||||
| Supplemental data | |||||||||||||||
| Net assets, end of year (000’s) | $ | 216,258 | $ | 198,491 | $ | 122,438 | $ | 127,012 | $ | 171,750 | |||||
| Portfolio turnover rate | 54.05 | % | 39.05 | % | 41.69 | % | 32.60 | % | 35.44 | % | |||||
aThe amount shown for a share outstanding throughout the period may not correlate with the Statement of Operations for the period due to the timing of sales and
repurchases of the Fund shares in relation to income earned and/or fluctuating fair value of the investments of the Fund.
bBased on average daily shares outstanding.
cNet investment income per share includes approximately $0.29 per share received in the form of a special dividend paid in connection with certain Fund’s holdings.
Excluding this amount, the ratio of net investment income to average net assets would have been 0.74%.
dTotal return does not reflect sales commissions or contingent deferred sales charges, if applicable.
eIncludes dividend expense on securities sold short and security borrowing fees, if any. See below for the ratios of such expenses to average net assets for the periods
presented. See Note 1(e).
fBenefit of expense reduction rounds to less than 0.01%.
gRounds to less than 0.01%.
franklintempleton.com
The accompanying notes are an integral part of these financial statements. | Annual Report | 17
FRANKLIN MUTUAL EUROPEAN FUND
FINANCIAL HIGHLIGHTS
| Year Ended December 31, | |||||||||||||||
| 2014 | 2013 | 2012 | 2011 | 2010 | |||||||||||
| Class R | |||||||||||||||
| Per share operating performance | |||||||||||||||
| (for a share outstanding throughout the year) | |||||||||||||||
| Net asset value, beginning of year | $ | 23.95 | $ | 20.55 | $ | 18.47 | $ | 21.00 | $ | 19.98 | |||||
| Income from investment operationsa: | |||||||||||||||
| Net investment incomeb | 0.41 | c | 0.31 | 0.33 | 0.16 | 0.19 | |||||||||
| Net realized and unrealized gains (losses) | (1.49 | ) | 5.02 | 2.81 | (1.97 | ) | 1.42 | ||||||||
| Total from investment operations | (1.08 | ) | 5.33 | 3.14 | (1.81 | ) | 1.61 | ||||||||
| Less distributions from: | |||||||||||||||
| Net investment income | (0.60 | ) | (0.41 | ) | (0.59 | ) | (0.72 | ) | (0.59 | ) | |||||
| Net realized gains | (2.23 | ) | (1.52 | ) | (0.47 | ) | — | — | |||||||
| Total distributions | (2.83 | ) | (1.93 | ) | (1.06 | ) | (0.72 | ) | (0.59 | ) | |||||
| Net asset value, end of year | $ | 20.04 | $ | 23.95 | $ | 20.55 | $ | 18.47 | $ | 21.00 | |||||
| Total return | (4.52 | )% | 26.05 | % | 17.16 | % | (8.45 | )% | 8.02 | % | |||||
| Ratios to average net assets | |||||||||||||||
| Expensesd | 1.54 | %e | 1.57 | %e | 1.63 | % | 1.61 | % | 1.60 | % | |||||
| Expenses incurred in connection with securities sold short | 0.01 | % | —%f | —% | —% | —% | |||||||||
| Net investment income | 2.43 | %c | 1.54 | % | 1.66 | % | 1.93 | % | 1.15 | % | |||||
| Supplemental data | |||||||||||||||
| Net assets, end of year (000’s) | $ | 421 | $ | 133 | $ | 46 | $ | 31 | $ | 21 | |||||
| Portfolio turnover rate | 54.05 | % | 39.05 | % | 41.69 | % | 32.60 | % | 35.44 | % | |||||
aThe amount shown for a share outstanding throughout the period may not correlate with the Statement of Operations for the period due to the timing of sales and
repurchases of the Fund shares in relation to income earned and/or fluctuating fair value of the investments of the Fund.
bBased on average daily shares outstanding.
cNet investment income per share includes approximately $0.29 per share received in the form of a special dividend paid in connection with certain Fund’s holdings.
Excluding this amount, the ratio of net investment income to average net assets would have been 1.24%.
dIncludes dividend expense on securities sold short and security borrowing fees, if any. See below for the ratios of such expenses to average net assets for the periods
presented. See Note 1(e).
eBenefit of expense reduction rounds to less than 0.01%.
fRounds to less than 0.01%.
18 | Annual Report | The accompanying notes are an integral part of these financial statements.
franklintempleton.com
FRANKLIN MUTUAL EUROPEAN FUND
FINANCIAL HIGHLIGHTS
| Year Ended December 31, | ||||||
| 2014 | 2013 | a | ||||
| Class R6 | ||||||
| Per share operating performance | ||||||
| (for a share outstanding throughout the year) | ||||||
| Net asset value, beginning of year | $ | 24.75 | $ | 22.54 | ||
| Income from investment operationsb: | ||||||
| Net investment incomec | 0.75 | d | 0.28 | |||
| Net realized and unrealized gains (losses) | (1.71 | ) | 3.95 | |||
| Total from investment operations | (0.96 | ) | 4.23 | |||
| Less distributions from: | ||||||
| Net investment income | (0.71 | ) | (0.50 | ) | ||
| Net realized gains | (2.23 | ) | (1.52 | ) | ||
| Total distributions | (2.94 | ) | (2.02 | ) | ||
| Net asset value, end of year | $ | 20.85 | $ | 24.75 | ||
| Total returne | (3.88 | )% | 18.99 | % | ||
| Ratios to average net assetsf | ||||||
| Expensesg,h | 0.89 | % | 0.90 | % | ||
| Expenses incurred in connection with securities sold short | 0.01 | % | —%i | |||
| Net investment income | 3.08 | %d | 2.21 | % | ||
| Supplemental data | ||||||
| Net assets, end of year (000’s) | $ | 334,396 | $ | 317,690 | ||
| Portfolio turnover rate | 54.05 | % | 39.05 | % | ||
aFor the period May 1, 2013 (effective date) to December 31, 2013.
bThe amount shown for a share outstanding throughout the period may not correlate with the Statement of Operations for the period due to the timing of sales and
repurchases of the Fund shares in relation to income earned and/or fluctuating fair value of the investments of the Fund.
cBased on average daily shares outstanding.
dNet investment income per share includes approximately $0.29 per share received in the form of a special dividend paid in connection with certain Fund’s holdings.
Excluding this amount, the ratio of net investment income to average net assets would have been 1.89%.
eTotal return is not annualized for periods less than one year.
fRatios are annualized for periods less than one year.
gBenefit of expense reduction rounds to less than 0.01%.
hIncludes dividend expense on securities sold short and security borrowing fees, if any. See below for the ratios of such expenses to average net assets for the periods
presented. See Note 1(e).
iRounds to less than 0.01%.
franklintempleton.com
The accompanying notes are an integral part of these financial statements. | Annual Report | 19
| FRANKLIN MUTUAL EUROPEAN FUND | ||||
| Statement of Investments, December 31, 2014 | ||||
| Country | Shares/Rights | Value | ||
| Common Stocks and Other Equity Interests 87.5% | ||||
| Aerospace & Defense 0.5% | ||||
| Safran SA | France | 220,999 | $ | 13,704,700 |
| Airlines 2.2% | ||||
| aInternational Consolidated Airlines Group SA | United Kingdom | 7,248,772 | 54,922,789 | |
| Auto Components 2.1% | ||||
| Cie Generale des Etablissements Michelin, B | France | 221,830 | 20,203,544 | |
| Pirelli & C. SpA | Italy | 2,387,838 | 32,388,873 | |
| 52,592,417 | ||||
| Banks 12.7% | ||||
| Barclays PLC | United Kingdom | 14,493,512 | 55,009,173 | |
| BNP Paribas SA | France | 904,800 | 53,930,241 | |
| aCommerzbank AG | Germany | 2,295,467 | 30,497,115 | |
| aING Groep NV, IDR | Netherlands | 3,294,487 | 43,171,945 | |
| Intesa Sanpaolo SpA | Italy | 13,474,567 | 39,488,834 | |
| aNational Bank of Greece SA | Greece | 11,548,908 | 20,542,042 | |
| Societe Generale SA | France | 832,420 | 35,242,914 | |
| UniCredit SpA | Italy | 6,621,416 | 42,743,557 | |
| 320,625,821 | ||||
| Capital Markets 1.8% | ||||
| UBS Group AG | Switzerland | 2,591,199 | 44,541,934 | |
| Chemicals 1.2% | ||||
| Arkema | France | 465,958 | 31,048,971 | |
| Commercial Services & Supplies 0.9% | ||||
| G4S PLC | United Kingdom | 5,230,728 | 22,657,563 | |
| Construction & Engineering 1.7% | ||||
| Balfour Beatty PLC | United Kingdom | 2,452,020 | 8,102,562 | |
| FLSmidth & Co. AS | Denmark | 778,359 | 34,435,516 | |
| 42,538,078 | ||||
| Construction Materials 0.9% | ||||
| SA des Ciments Vicat | France | 323,193 | 23,307,386 | |
| Containers & Packaging 1.2% | ||||
| Rexam PLC | United Kingdom | 4,118,870 | 29,134,334 | |
| Diversified Financial Services 0.1% | ||||
| Oslo Bors VPS Holding ASA | Norway | 340,000 | 3,458,707 | |
| Diversified Telecommunication Services 6.8% | ||||
| aHellenic Telecommunications Organization SA | Greece | 3,038,392 | 33,455,734 | |
| Koninklijke KPN NV | Netherlands | 16,078,615 | 51,128,065 | |
| TDC AS | Denmark | 4,091,585 | 31,397,027 | |
| aTelecom Italia SpA | Italy | 24,460,204 | 26,104,418 | |
| Telenor ASA | Norway | 1,503,222 | 30,482,952 | |
| 172,568,196 | ||||
| Electric Utilities 1.8% | ||||
| Enel SpA | Italy | 10,306,672 | 46,093,085 | |
| Energy Equipment & Services 0.9% | ||||
| aDeepOcean Group Holding BV | Netherlands | 915,467 | 22,886,675 | |
| Food & Staples Retailing 1.9% | ||||
| Metro AG | Germany | 1,593,016 | 48,786,273 | |
20 | Annual Report
franklintempleton.com
FRANKLIN MUTUAL EUROPEAN FUND
STATEMENT OF INVESTMENTS
| Country | Shares/Rights | Value | ||
| Common Stocks and Other Equity Interests (continued) | ||||
| Hotels, Restaurants & Leisure 2.5% | ||||
| Accor SA | France | 1,399,341 | $ | 63,224,184 |
| Industrial Conglomerates 0.9% | ||||
| Koninklijke Philips NV | Netherlands | 754,776 | 22,055,686 | |
| Insurance 16.6% | ||||
| ACE Ltd. | United States | 149,384 | 17,161,234 | |
| Ageas | Belgium | 1,694,569 | 60,497,891 | |
| Assicurazioni Generali SpA | Italy | 1,977,332 | 40,673,718 | |
| Direct Line Insurance Group PLC | United Kingdom | 14,974,086 | 67,989,731 | |
| Friends Life Group Ltd. | United Kingdom | 4,787,889 | 27,329,075 | |
| Lancashire Holdings Ltd. | United Kingdom | 4,092,985 | 35,726,519 | |
| aNN Group NV | Netherlands | 680,405 | 20,454,641 | |
| a,bNN Group NV, 144A | Netherlands | 978,052 | 29,402,639 | |
| a,cOlympus Re Holdings Ltd. | United States | 16,080 | — | |
| aRSA Insurance Group PLC | United Kingdom | 8,334,639 | 56,511,726 | |
| aStorebrand ASA | Norway | 7,664,955 | 29,958,063 | |
| UNIQA Insurance Group AG | Austria | 3,455,709 | 32,518,808 | |
| 418,224,045 | ||||
| Machinery 2.5% | ||||
| CNH Industrial NV (EUR Traded) | United Kingdom | 655,521 | 5,314,308 | |
| CNH Industrial NV, special voting (EUR Traded) | United Kingdom | 833,461 | 6,756,868 | |
| IMI PLC | United Kingdom | 1,675,692 | 32,988,310 | |
| Vossloh AG | Germany | 293,290 | 18,986,128 | |
| 64,045,614 | ||||
| Marine 2.9% | ||||
| A.P. Moeller-Maersk AS, B | Denmark | 36,150 | 72,653,577 | |
| Media 4.1% | ||||
| aLiberty Global PLC, C | United Kingdom | 602,446 | 29,104,166 | |
| Reed Elsevier PLC | United Kingdom | 2,943,932 | 50,475,773 | |
| RTL Group SA | Germany | 241,477 | 23,117,848 | |
| 102,697,787 | ||||
| Metals & Mining 4.1% | ||||
| Anglo American PLC | United Kingdom | 667,842 | 12,496,788 | |
| aThyssenKrupp AG | Germany | 2,134,255 | 54,902,855 | |
| Voestalpine AG | Austria | 925,299 | 36,717,668 | |
| 104,117,311 | ||||
| Multiline Retail 1.4% | ||||
| Marks & Spencer Group PLC | United Kingdom | 4,561,449 | 34,042,346 | |
| Oil, Gas & Consumable Fuels 5.6% | ||||
| BG Group PLC | United Kingdom | 2,311,593 | 31,166,641 | |
| BP PLC | United Kingdom | 4,722,941 | 30,256,373 | |
| aCairn Energy PLC | United Kingdom | 9,442,570 | 26,271,868 | |
| Repsol SA | Spain | 227,522 | 4,279,564 | |
| Repsol SA (interim line) | Spain | 6,691 | 125,854 | |
| aRepsol SA, rts., 1/08/15 | Spain | 28 | 15 | |
| Royal Dutch Shell PLC, A | United Kingdom | 1,506,604 | 50,423,925 | |
| 142,524,240 | ||||
| Pharmaceuticals 1.6% | ||||
| Novartis AG | Switzerland | 432,994 | 40,220,273 | |
| franklintempleton.com | Annual Report | 21 | |||
FRANKLIN MUTUAL EUROPEAN FUND
STATEMENT OF INVESTMENTS
| Country | Shares/Rights | Value | |||
| Common Stocks and Other Equity Interests (continued) | |||||
| Real Estate Management & Development 0.1% | |||||
| dCanary Wharf Group PLC | United Kingdom | 192,100 | $ | 1,619,612 | |
| Road & Rail 0.9% | |||||
| c,eEuro Wagon LP | Jersey Islands | 16,127,149 | 18,528,986 | ||
| aFirstGroup PLC | United Kingdom | 3,184,682 | 5,296,549 | ||
| 23,825,535 | |||||
| Specialty Retail 4.0% | |||||
| aDufry AG | Switzerland | 330,577 | 49,543,324 | ||
| Kingfisher PLC | United Kingdom | 9,910,074 | 52,596,462 | ||
| 102,139,786 | |||||
| Technology Hardware, Storage & Peripherals 0.6% | |||||
| Wincor Nixdorf AG | Germany | 308,355 | 15,002,735 | ||
| Trading Companies & Distributors 0.9% | |||||
| aKloeckner & Co. SE | Germany | 1,985,080 | 21,528,649 | ||
| Wireless Telecommunication Services 2.1% | |||||
| Vodafone Group PLC | United Kingdom | 15,193,178 | 52,727,095 | ||
| Total Common Stocks and Other Equity Interests | |||||
| (Cost $2,104,591,471) | 2,209,515,404 | ||||
| Preferred Stocks (Cost $68,376,002) 2.4% | |||||
| Automobiles 2.4% | |||||
| Volkswagen AG, pfd. | Germany | 267,237 | 59,707,826 | ||
| Principal | |||||
| Amount* | |||||
| Corporate Bonds (Cost $5,981,223) 0.2% | |||||
| b,fBaggot Securities Ltd., secured bond, 144A, 10.24%, Perpetual | Ireland | 4,212,000 | EUR | 5,338,962 | |
| Total Investments before Short Term Investments | |||||
| (Cost $2,178,948,696) | 2,274,562,192 | ||||
Short Term Investments 5.2%
| U.S. Government and Agency Securities 5.2% |
| gU.S. Treasury Bills, |
| 1/02/15 | United States | 34,600,000 | 34,600,000 | |
| 4/23/15 | United States | 35,000,000 | 34,996,500 | |
| h1/22/15 - 5/21/15 | United States | 60,400,000 | 60,393,798 | |
| Total U.S. Government and Agency Securities | ||||
| (Cost $129,985,876) | 129,990,298 | |||
| Total Investments (Cost $2,308,934,572) 95.3% | 2,404,552,490 | |||
| Other Assets, less Liabilities 4.7% | 119,128,373 | |||
| Net Assets 100.0% | $ | 2,523,680,863 |
22 | Annual Report
franklintempleton.com
FRANKLIN MUTUAL EUROPEAN FUND
STATEMENT OF INVESTMENTS
*The principal amount is stated in U.S. dollars unless otherwise indicated.
aNon-income producing.
bSecurity was purchased pursuant to Rule 144A under the Securities Act of 1933 and may be sold in transactions exempt from registration only to qualified institutional buyers
or in a public offering registered under the Securities Act of 1933. These securities have been deemed liquid under guidelines approved by the Trust’s Board of Trustees. At
December 31, 2014, the aggregate value of these securities was $34,741,601, representing 1.38% of net assets.
cSee Note 10 regarding restricted securities.
dSecurity has been deemed illiquid because it may not be able to be sold within seven days. At December 31, 2014, the value of this security was $1,619,612, representing
0.06% of net assets.
eSee Note 12 regarding holdings of 5% voting securities.
fPerpetual security with no stated maturity date.
gThe security is traded on a discount basis with no stated coupon rate.
hSecurity or a portion of the security has been pledged as collateral for open futures and forward contracts. At December 31, 2014, the aggregate value of these securities
and/or cash pledged as collateral was $8,343,264, representing 0.33% of net assets.
| At December 31, 2014, the Fund had the following futures contracts outstanding. See Note 1(c). | ||||||||||||
| Futures Contracts | ||||||||||||
| Number of | Notional Expiration | Unrealized | Unrealized | |||||||||
| Description | Type Contracts | Value | Date | Appreciation | Depreciation | |||||||
| Currency Contracts | ||||||||||||
| CHF/USD | Short | 51 | $ | 6,422,175 | 3/16/15 | $ | 149,651 | $ | — | |||
| EUR/USD | Short | 2,060 | 311,755,250 | 3/16/15 | 7,507,857 | — | ||||||
| GBP/USD | Short | 1,665 | 162,025,313 | 3/16/15 | 949,301 | — | ||||||
| Unrealized appreciation (depreciation) | 8,606,809 | — | ||||||||||
| Net unrealized appreciation (depreciation) | $ | 8,606,809 | ||||||||||
| At December 31, 2014, the Fund had the following forward exchange contracts outstanding. See Note 1(c). | ||||||||||||
| Forward Exchange Contracts | ||||||||||||
| Contract | Settlement | Unrealized | Unrealized | |||||||||
| Currency | Counterpartya Type | Quantity | Amount | Date Appreciation Depreciation | ||||||||
| Euro | BANT | Buy | 1,013,700 | $ | 1,264,772 | 1/20/15 | $ | — | $ | (37,923 | ) | |
| Euro | BANT | Sell | 116,885,782 | 158,827,725 | 1/20/15 | 17,364,609 | — | |||||
| Euro | BONY | Buy | 1,162,663 | 1,446,801 | 1/20/15 | — | (39,667 | ) | ||||
| Euro | BONY | Sell | 3,322,762 | 4,231,561 | 1/20/15 | 210,128 | — | |||||
| Euro | DBFX | Buy | 3,308,323 | 4,121,405 | 1/20/15 | — | (117,448 | ) | ||||
| Euro | DBFX | Sell | 7,659,800 | 10,171,572 | 1/20/15 | 901,161 | — | |||||
| Euro | FBCO | Buy | 1,567,495 | 1,943,945 | 1/20/15 | — | (46,856 | ) | ||||
| Euro | FBCO | Sell | 11,857,787 | 15,714,556 | 1/20/15 | 1,363,457 | — | |||||
| Euro | HSBC | Buy | 4,105,903 | 5,107,885 | 1/20/15 | — | (138,642 | ) | ||||
| Euro | HSBC | Sell | 11,234,837 | 15,055,626 | 1/20/15 | 1,458,463 | — | |||||
| Euro | SCBT | Sell | 5,034,321 | 6,692,818 | 1/20/15 | 599,941 | — | |||||
| Euro | SSBT | Buy | 3,420,073 | 4,259,907 | 1/20/15 | — | (120,702 | ) | ||||
| Euro | SSBT | Sell | 5,948,477 | 7,852,113 | 1/20/15 | 652,862 | — | |||||
| British Pound | BANT | Buy | 13,265,162 | 21,682,725 | 1/21/15 | — | (1,009,805 | ) | ||||
| British Pound | BBU | Buy | 21,078,481 | 34,180,191 | 1/21/15 | — | (1,330,705 | ) | ||||
| British Pound | BONY | Buy | 1,988,887 | 3,244,868 | 1/21/15 | — | (145,314 | ) | ||||
| British Pound | DBFX | Sell | 44,787,477 | 76,440,131 | 1/21/15 | 6,641,667 | — | |||||
| British Pound | FBCO | Buy | 3,009,060 | 4,884,022 | 1/21/15 | — | (194,591 | ) | ||||
| British Pound | HSBC | Buy | 1,154,467 | 1,939,793 | 1/21/15 | — | (140,629 | ) | ||||
| British Pound | HSBC | Sell | 31,991,055 | 54,576,740 | 1/21/15 | 4,720,694 | — | |||||
| British Pound | SSBT | Buy | 9,150,142 | 14,955,884 | 1/21/15 | — | (695,964 | ) | ||||
| British Pound | SSBT | Sell | 42,194,483 | 72,017,543 | 1/21/15 | 6,260,098 | — | |||||
| franklintempleton.com | Annual Report | 23 | |||||||||||
| FRANKLIN MUTUAL EUROPEAN FUND | |||||||||||
| STATEMENT OF INVESTMENTS | |||||||||||
| Forward Exchange Contracts (continued) | |||||||||||
| Contract | Settlement | Unrealized | Unrealized | ||||||||
| Currency | Counterpartya Type | Quantity | Amount | Date Appreciation Depreciation | |||||||
| Swiss Franc | BANT | Buy | 2,232,715 | $ | 2,302,206 | 2/12/15 | $ | — | $ | (54,785 | ) |
| Swiss Franc | BANT | Sell | 99,015,420 | 109,240,319 | 2/12/15 | 9,572,713 | — | ||||
| Swiss Franc | BONY | Buy | 4,300,000 | 4,519,513 | 2/12/15 | — | (191,190 | ) | |||
| Swiss Franc | BONY | Sell | 5,000,000 | 5,250,529 | 2/12/15 | 217,595 | — | ||||
| Swiss Franc | DBFX | Buy | 1,051,062 | 1,090,766 | 2/12/15 | — | (32,781 | ) | |||
| Swiss Franc | DBFX | Sell | 13,631,730 | 14,426,013 | 2/12/15 | 704,495 | — | ||||
| Swiss Franc | FBCO | Buy | 12,497,710 | 13,139,724 | 2/12/15 | — | (559,695 | ) | |||
| Swiss Franc | FBCO | Sell | 6,203,915 | 6,468,918 | 2/12/15 | 224,140 | — | ||||
| Swiss Franc | HSBC | Buy | 1,331,207 | 1,376,237 | 2/12/15 | — | (36,262 | ) | |||
| Swiss Franc | HSBC | Sell | 7,915,445 | 8,243,011 | 2/12/15 | 275,429 | — | ||||
| Swiss Franc | SSBT | Buy | 3,179,892 | 3,326,657 | 2/12/15 | — | (125,820 | ) | |||
| Swiss Franc | SSBT | Sell | 15,897,823 | 16,682,053 | 2/12/15 | 679,516 | — | ||||
| Danish Krone | BANT | Buy | 38,549,432 | 6,567,266 | 2/17/15 | — | (301,186 | ) | |||
| Danish Krone | BANT | Sell | 42,065,416 | 7,147,554 | 2/17/15 | 309,962 | — | ||||
| Danish Krone | BBU | Buy | 1,021,832 | 170,224 | 2/17/15 | — | (4,128 | ) | |||
| Danish Krone | BONY | Buy | 5,021,037 | 870,177 | 2/17/15 | — | (54,024 | ) | |||
| Danish Krone | BONY | Sell | 2,604,346 | 442,505 | 2/17/15 | 19,177 | — | ||||
| Danish Krone | DBFX | Buy | 21,665,154 | 3,681,783 | 2/17/15 | — | (160,185 | ) | |||
| Danish Krone | DBFX | Sell | 23,279,958 | 3,935,567 | 2/17/15 | 151,489 | — | ||||
| Danish Krone | SSBT | Buy | 11,496,627 | 1,986,422 | 2/17/15 | — | (117,684 | ) | |||
| Danish Krone | SSBT | Sell | 406,746,286 | 72,939,158 | 2/17/15 | 6,823,916 | — | ||||
| British Pound | BANT | Buy | 10,015,195 | 16,110,856 | 2/19/15 | — | (506,302 | ) | |||
| British Pound | BANT | Sell | 34,817,031 | 57,399,911 | 2/19/15 | 3,161,540 | (9,620 | ) | |||
| British Pound | BBU | Buy | 1,000,000 | 1,588,337 | 2/19/15 | — | (30,249 | ) | |||
| British Pound | BONY | Sell | 5,477,441 | 8,753,383 | 2/19/15 | 219,050 | — | ||||
| British Pound | DBFX | Buy | 10,870,757 | 17,542,827 | 2/19/15 | — | (605,233 | ) | |||
| British Pound | DBFX | Sell | 1,707,000 | 2,653,946 | 2/19/15 | — | (5,710 | ) | |||
| British Pound | FBCO | Buy | 4,829,127 | 7,742,720 | 2/19/15 | — | (218,517 | ) | |||
| British Pound | FBCO | Sell | 31,093,333 | 51,609,089 | 2/19/15 | 3,162,947 | — | ||||
| British Pound | HSBC | Buy | 3,784,057 | 6,008,247 | 2/19/15 | — | (112,354 | ) | |||
| British Pound | HSBC | Sell | 3,064,715 | 4,892,358 | 2/19/15 | 117,263 | — | ||||
| British Pound | SCBT | Buy | 5,405,961 | 8,711,182 | 2/19/15 | — | (288,221 | ) | |||
| British Pound | SSBT | Buy | 6,072,290 | 9,750,229 | 2/19/15 | — | (289,068 | ) | |||
| British Pound | SSBT | Sell | 36,731,204 | 60,455,658 | 2/19/15 | 3,243,443 | (18,224 | ) | |||
| Euro | BANT | Sell | 4,474,933 | 5,881,648 | 2/27/15 | 464,082 | — | ||||
| Euro | BONY | Sell | 3,174,144 | 4,175,716 | 2/27/15 | 332,946 | — | ||||
| Euro | DBFX | Sell | 126,972,402 | 167,437,388 | 2/27/15 | 13,718,567 | — | ||||
| Euro | FBCO | Sell | 2,384,861 | 3,132,994 | 2/27/15 | 245,768 | — | ||||
| Euro | HSBC | Sell | 4,719,893 | 6,143,555 | 2/27/15 | 429,429 | — | ||||
| Euro | SCBT | Sell | 1,550,987 | 2,017,847 | 2/27/15 | 140,148 | — | ||||
| Euro | SSBT | Sell | 2,539,098 | 3,320,323 | 2/27/15 | 246,371 | — | ||||
| Euro | BANT | Sell | 19,946,029 | 25,327,168 | 4/16/15 | 1,168,532 | — | ||||
| Euro | BBU | Sell | 12,343,122 | 15,602,265 | 4/16/15 | 652,271 | — | ||||
| Euro | BONY | Sell | 12,579,679 | 15,835,797 | 4/16/15 | 599,286 | — | ||||
| Euro | DBFX | Sell | 92,459,431 | 117,280,904 | 4/16/15 | 5,294,008 | — | ||||
| Euro | FBCO | Sell | 27,729,179 | 34,714,865 | 4/16/15 | 1,129,274 | — | ||||
| Euro | HSBC | Sell | 9,093,565 | 11,441,988 | 4/16/15 | 427,859 | — | ||||
| Euro | SCBT | Sell | 3,763,612 | 4,717,123 | 4/16/15 | 158,635 | — | ||||
| Euro | SSBT | Sell | 16,570,627 | 20,652,132 | 4/16/15 | 581,783 | — | ||||
| British Pound | DBFX | Buy | 591,443 | 945,449 | 4/22/15 | — | (24,421 | ) | |||
| British Pound | FBCO | Buy | 1,912,261 | 3,049,687 | 4/22/15 | — | (71,807 | ) | |||
| British Pound | HSBC | Sell | 33,560,706 | 54,032,737 | 4/22/15 | 1,770,116 | — | ||||
| British Pound | SCBT | Sell | 37,400,997 | 60,253,007 | 4/22/15 | 2,010,068 | — | ||||
| Euro | BANT | Sell | 79,822,884 | 99,670,016 | 5/18/15 | 2,955,228 | — | ||||
| Euro | BONY | Sell | 820,662 | 1,000,387 | 5/18/15 | 6,059 | — | ||||
| 24 | Annual Report | franklintempleton.com | ||||||||||
| FRANKLIN MUTUAL EUROPEAN FUND | |||||||||||
| STATEMENT OF INVESTMENTS | |||||||||||
| Forward Exchange Contracts (continued) | |||||||||||
| Contract | Settlement | Unrealized | Unrealized | ||||||||
| Currency | Counterpartya Type | Quantity | Amount | Date Appreciation Depreciation | |||||||
| Euro | DBFX | Sell | 38,604,995 | $ | 48,110,619 | 5/18/15 | $ | 1,336,139 | $ | — | |
| Euro | FBCO | Sell | 32,843,073 | 41,015,891 | 5/18/15 | 1,222,655 | — | ||||
| Euro | HSBC | Sell | 557,016 | 678,855 | 5/18/15 | 3,965 | — | ||||
| Euro | SSBT | Sell | 9,762,300 | 12,233,281 | 5/18/15 | 405,109 | — | ||||
| British Pound | BANT | Buy | 1,396,604 | 2,179,044 | 5/21/15 | — | (4,679 | ) | |||
| British Pound | BANT | Sell | 29,118,156 | 45,569,914 | 5/21/15 | 236,003 | — | ||||
| British Pound | FBCO | Buy | 355,090 | 552,774 | 5/21/15 | 64 | — | ||||
| British Pound | FBCO | Sell | 20,975,128 | 32,800,905 | 5/21/15 | 144,834 | — | ||||
| British Pound | HSBC | Buy | 2,061,589 | 3,221,811 | 5/21/15 | — | (12,133 | ) | |||
| British Pound | SSBT | Sell | 38,435,967 | 60,113,852 | 5/21/15 | 273,088 | — | ||||
| Norwegian Krone | BANT | Buy | 34,821,336 | 4,860,442 | 5/21/15 | — | (215,917 | ) | |||
| Norwegian Krone | BANT | Sell | 10,985,225 | 1,482,426 | 5/21/15 | 17,200 | — | ||||
| Norwegian Krone | BBU | Buy | 8,848,555 | 1,183,041 | 5/21/15 | — | (2,807 | ) | |||
| Norwegian Krone | BONY | Buy | 6,350,046 | 880,575 | 5/21/15 | — | (33,596 | ) | |||
| Norwegian Krone | DBFX | Buy | 7,765,000 | 1,051,482 | 5/21/15 | — | (15,775 | ) | |||
| Norwegian Krone | DBFX | Sell | 518,782,594 | 75,880,908 | 5/21/15 | 6,684,887 | — | ||||
| Unrealized appreciation (depreciation) | 111,710,129 | (8,120,619 | ) | ||||||||
| Net unrealized appreciation (depreciation) | $ | 103,589,510 | |||||||||
| aMay be comprised of multiple contracts with the same counterparty, currency and settlement date. | |||||||||||
| See Abbreviations on page 43. | |||||||||||
franklintempleton.com
The accompanying notes are an integral part of these financial statements. | Annual Report | 25
FRANKLIN MUTUAL EUROPEAN FUND
Financial Statements
Statement of Assets and Liabilities
December 31, 2014
| Assets: | |||
| Investments in securities: | |||
| Cost - Unaffiliated issuers | $ | 2,302,652,063 | |
| Cost - Controlled affiliated issuers (Note 12) | 6,282,509 | ||
| Total cost of investments | $ | 2,308,934,572 | |
| Value - Unaffiliated issuers | $ | 2,386,023,504 | |
| Value - Controlled affiliated issuers (Note 12) | 18,528,986 | ||
| Total value of investments | 2,404,552,490 | ||
| Cash | 21,950 | ||
| Restricted Cash (Note 1d) | 34,960,000 | ||
| Foreign currency, at value (cost $39,630,368) | 39,700,131 | ||
| Receivables: | |||
| Investment securities sold | 476,220 | ||
| Capital shares sold | 7,412,737 | ||
| Dividends and interest | 3,946,173 | ||
| Variation margin | 1,217,262 | ||
| Unrealized appreciation on forward exchange contracts | 111,710,129 | ||
| Other assets | 236 | ||
| Total assets | 2,603,997,328 | ||
| Liabilities: | |||
| Payables: | |||
| Capital shares redeemed | 33,610,178 | ||
| Management fees | 1,865,509 | ||
| Distribution fees | 805,832 | ||
| Transfer agent fees | 630,645 | ||
| Trustees’ fees and expenses | 89,826 | ||
| Due to brokers | 34,960,000 | ||
| Unrealized depreciation on forward exchange contracts | 8,120,619 | ||
| Accrued expenses and other liabilities | 233,856 | ||
| Total liabilities | 80,316,465 | ||
| Net assets, at value | $ | 2,523,680,863 | |
| Net assets consist of: | |||
| Paid-in capital | $ | 2,360,895,999 | |
| Undistributed net investment income | 1,915,950 | ||
| Net unrealized appreciation (depreciation) | 207,631,302 | ||
| Accumulated net realized gain (loss) | (46,762,388 | ) | |
| Net assets, at value | $ | 2,523,680,863 |
26 | Annual Report | The accompanying notes are an integral part of these financial statements.
franklintempleton.com
| FRANKLIN MUTUAL EUROPEAN FUND | ||
| FINANCIAL STATEMENTS | ||
| Statement of Assets and Liabilities (continued) | ||
| December 31, 2014 | ||
| Class Z: | ||
| Net assets, at value | $ | 1,128,768,903 |
| Shares outstanding | 54,110,945 | |
| Net asset value and maximum offering price per share | $ | 20.86 |
| Class A: | ||
| Net assets, at value | $ | 843,835,941 |
| Shares outstanding | 41,507,046 | |
| Net asset value per sharea | $ | 20.33 |
| Maximum offering price per share (net asset value per share ÷ 94.25%) | $ | 21.57 |
| Class C: | ||
| Net assets, at value | $ | 216,258,491 |
| Shares outstanding | 10,617,136 | |
| Net asset value and maximum offering price per sharea | $ | 20.37 |
| Class R: | ||
| Net assets, at value | $ | 421,441 |
| Shares outstanding | 21,035 | |
| Net asset value and maximum offering price per share | $ | 20.04 |
| Class R6: | ||
| Net assets, at value | $ | 334,396,087 |
| Shares outstanding | 16,041,346 | |
| Net asset value and maximum offering price per share | $ | 20.85 |
| aRedemption price is equal to net asset value less contingent deferred sales charges, if applicable. | |||
| franklintempleton.com | The accompanying notes are an integral part of these financial statements. | Annual Report | | | 27 |
FRANKLIN MUTUAL EUROPEAN FUND
FINANCIAL STATEMENTS
Statement of Operations
for the year ended December 31, 2014
| Investment income: | |||
| Dividends: (net of foreign taxes of $5,704,066) | |||
| Unaffiliated issuers | $ | 111,306,746 | |
| Controlled affiliated issuers (Note 12) | 3,457,450 | ||
| Interest | 796,637 | ||
| Total investment income | 115,560,833 | ||
| Expenses: | |||
| Management fees (Note 3a) | 23,551,405 | ||
| Administrative fees (Note 3b) | 1,142,909 | ||
| Distribution fees: (Note 3c) | |||
| Class A | 2,777,037 | ||
| Class C | 2,273,528 | ||
| Class R | 1,591 | ||
| Transfer agent fees: (Note 3e) | |||
| Class Z | 2,025,351 | ||
| Class A | 1,349,976 | ||
| Class C | 331,566 | ||
| Class R | 464 | ||
| Class R6 | 101 | ||
| Custodian fees (Note 4) | 365,118 | ||
| Reports to shareholders | 187,577 | ||
| Registration and filing fees | 206,932 | ||
| Professional fees | 119,003 | ||
| Trustees’ fees and expenses | 64,670 | ||
| Dividends on securities sold short | 234,059 | ||
| Other | 63,685 | ||
| Total expenses | 34,694,972 | ||
| Expense reductions (Note 4) | (14 | ) | |
| Net expenses | 34,694,958 | ||
| Net investment income | 80,865,875 | ||
| Realized and unrealized gains (losses): | |||
| Net realized gain (loss) from: | |||
| Investments | 127,693,323 | ||
| Foreign currency transactions | 4,397,096 | ||
| Futures contracts | 37,871,303 | ||
| Securities sold short | 458,521 | ||
| Net realized gain (loss) | 170,420,243 | ||
| Net change in unrealized appreciation (depreciation) on: | |||
| Investments | (555,175,197 | ) | |
| Translation of other assets and liabilities denominated in foreign currencies | 170,633,915 | ||
| Net change in unrealized appreciation (depreciation) | (384,541,282 | ) | |
| Net realized and unrealized gain (loss) | (214,121,039 | ) | |
| Net increase (decrease) in net assets resulting from operations | $ | (133,255,164 | ) |
28 | Annual Report | The accompanying notes are an integral part of these financial statements.
franklintempleton.com
| FRANKLIN MUTUAL EUROPEAN FUND | ||||||
| FINANCIAL STATEMENTS | ||||||
| Statements of Changes in Net Assets | ||||||
| Year Ended December 31, | ||||||
| 2014 | 2013 | |||||
| Increase (decrease) in net assets: | ||||||
| Operations: | ||||||
| Net investment income | $ | 80,865,875 | $ | 42,374,574 | ||
| Net realized gain (loss) from investments, foreign currency transactions, futures | ||||||
| contracts and securities sold short | 170,420,243 | 153,787,495 | ||||
| Net change in unrealized appreciation (depreciation) on investments and translation of other | ||||||
| assets and liabilities denominated in foreign currencies | (384,541,282 | ) | 336,696,760 | |||
| Net increase (decrease) in net assets resulting from operations | (133,255,164 | ) | 532,858,829 | |||
| Distributions to shareholders from: | ||||||
| Net investment income: | ||||||
| Class Z | (33,590,853 | ) | (24,011,359 | ) | ||
| Class A | (22,317,956 | ) | (12,591,265 | ) | ||
| Class C | (4,219,670 | ) | (2,058,127 | ) | ||
| Class R | (11,161 | ) | (1,998 | ) | ||
| Class R6 | (10,013,981 | ) | (5,884,957 | ) | ||
| Net realized gains: | ||||||
| Class Z | (111,120,702 | ) | (78,739,802 | ) | ||
| Class A | (82,617,039 | ) | (48,335,077 | ) | ||
| Class C | (21,329,977 | ) | (11,433,236 | ) | ||
| Class R | (41,595 | ) | (7,605 | ) | ||
| Class R6 | (31,288,445 | ) | (17,974,679 | ) | ||
| Total distributions to shareholders | (316,551,379 | ) | (201,038,105 | ) | ||
| Capital share transactions: (Note 2) | ||||||
| Class Z | (63,822,544 | ) | 120,739,224 | |||
| Class A | 153,553,663 | 73,155,449 | ||||
| Class B | — | (630,113 | ) | |||
| Class C | 55,952,304 | 56,172,805 | ||||
| Class R | 356,413 | 80,985 | ||||
| Class R6 | 72,186,056 | 295,734,868 | ||||
| Total capital share transactions | 218,225,892 | 545,253,218 | ||||
| Net increase (decrease) in net assets | (231,580,651 | ) | 877,073,942 | |||
| Net assets: | ||||||
| Beginning of year | 2,755,261,514 | 1,878,187,572 | ||||
| End of year | $ | 2,523,680,863 | $ | 2,755,261,514 | ||
| Undistributed net investment income (distributions in excess of net investment income) | ||||||
| included in net assets: | ||||||
| End of year | $ | 1,915,950 | $ | (2,733,259 | ) | |
franklintempleton.com
The accompanying notes are an integral part of these financial statements. | Annual Report | 29
FRANKLIN MUTUAL EUROPEAN FUND
Notes to Financial Statements
1. Organization and Significant Accounting Policies
Franklin Mutual Series Funds (Trust) is registered under the Investment Company Act of 1940, as amended, (1940 Act) as an open-end management investment company, consisting of seven separate funds and applies the specialized accounting and reporting guidance in U.S. Generally Accepted Accounting Principles (U.S. GAAP). Franklin Mutual European Fund (Fund) is included in this report. The financial statements of the remaining funds in the Trust are presented separately. The Fund offers five classes of shares: Class Z, Class A, Class C, Class R and Class R6. Each class of shares differs by its initial sales load, contingent deferred sales charges, voting rights on matters affecting a single class, its exchange privilege and fees primarily due to differing arrangements for distribution and transfer agent fees.
Effective June 30, 2014, Mutual European Fund was renamed Franklin Mutual European Fund.
The following summarizes the Fund’s significant accounting policies.
a. Financial Instrument Valuation
The Fund’s investments in financial instruments are carried at fair value daily. Fair value is the price that would be received to sell an asset or paid to transfer a liability in an orderly transaction between market participants on the measurement date. The Fund calculates the net asset value per share at the close of the New York Stock Exchange (NYSE), generally at 4 p.m. Eastern time (NYSE close) on each day the NYSE is open for trading. Under compliance policies and procedures approved by the Trust’s Board of Trustees (the Board), the Fund’s administrator has responsibility for oversight of valuation, including leading the cross-functional Valuation and Liquidity Oversight Committee (VLOC). The VLOC provides administration and oversight of the Fund’s valuation policies and procedures, which are approved annually by the Board. Among other things, these procedures allow the Fund to utilize independent pricing services, quotations from securities and financial instrument dealers, and other market sources to determine fair value.
Equity securities and derivative financial instruments (derivatives) listed on an exchange or on the NASDAQ National Market System are valued at the last quoted sale price or the official closing price of the day, respectively. Foreign equity securities are valued as of the close of trading on the foreign stock exchange on which the security is primarily traded or as of the NYSE close, whichever is earlier. The value is then
converted into its U.S. dollar equivalent at the foreign exchange rate in effect at the NYSE close on the day that the value of the security is determined. Over-the-counter (OTC) securities are valued within the range of the most recent quoted bid and ask prices. Securities that trade in multiple markets or on multiple exchanges are valued according to the broadest and most representative market. Certain equity securities are valued based upon fundamental characteristics or relationships to similar securities.
Debt securities generally trade in the OTC market rather than on a securities exchange. The Fund’s pricing services use multiple valuation techniques to determine fair value. In instances where sufficient market activity exists, the pricing services may utilize a market-based approach through which quotes from market makers are used to determine fair value. In instances where sufficient market activity may not exist or is limited, the pricing services also utilize proprietary valuation models which may consider market characteristics such as benchmark yield curves, credit spreads, estimated default rates, anticipated market interest rate volatility, coupon rates, anticipated timing of principal repayments, underlying collateral, and other unique security features in order to estimate the relevant cash flows, which are then discounted to calculate the fair value. Securities denominated in a foreign currency are converted into their U.S. dollar equivalent at the foreign exchange rate in effect at the NYSE close on the date that the values of the foreign debt securities are determined.
Certain derivatives trade in the OTC market. The Fund’s pricing services use various techniques including industry standard option pricing models and proprietary discounted cash flow models to determine the fair value of those instruments. The Fund’s net benefit or obligation under the derivative contract, as measured by the fair value of the contract, is included in net assets.
The Fund has procedures to determine the fair value of financial instruments for which market prices are not reliable or readily available. Under these procedures, the VLOC convenes on a regular basis to review such financial instruments and considers a number of factors, including significant unobservable valuation inputs, when arriving at fair value. The VLOC primarily employs a market-based approach which may use related or comparable assets or liabilities, recent transactions, market multiples, book values, and other relevant information for the investment to determine the fair value of the investment. An income-based valuation approach may also be used in which the anticipated future cash flows of the investment are discounted to
30 | Annual Report
franklintempleton.com
FRANKLIN MUTUAL EUROPEAN FUND
NOTES TO FINANCIAL STATEMENTS
calculate fair value. Discounts may also be applied due to the nature or duration of any restrictions on the disposition of the investments. Due to the inherent uncertainty of valuations of such investments, the fair values may differ significantly from the values that would have been used had an active market existed. The VLOC employs various methods for calibrating these valuation approaches including a regular review of key inputs and assumptions, transactional back-testing or disposition analysis, and reviews of any related market activity.
Trading in securities on foreign securities stock exchanges and OTC markets may be completed before the daily NYSE close. In addition, trading in certain foreign markets may not take place on every NYSE business day. Occasionally, events occur between the time at which trading in a foreign security is completed and the close of the NYSE that might call into question the reliability of the value of a portfolio security held by the Fund. As a result, differences may arise between the value of the Fund’s portfolio securities as determined at the foreign market close and the latest indications of value at the close of the NYSE. In order to minimize the potential for these differences, the VLOC monitors price movements following the close of trading in foreign stock markets through a series of country specific market proxies (such as baskets of American Depositary Receipts, futures contracts and exchange traded funds). These price movements are measured against established trigger thresholds for each specific market proxy to assist in determining if an event has occurred that may call into question the reliability of the values of the foreign securities held by the Fund. If such an event occurs, the securities may be valued using fair value procedures, which may include the use of independent pricing services.
Also, when the last day of the reporting period is a non-business day, certain foreign markets may be open on those days that the NYSE is closed, which could result in differences between the value of the Fund’s portfolio securities on the last business day and the last calendar day of the reporting period. Any significant security valuation changes due to an open foreign market are adjusted and reflected by the Fund for financial reporting purposes.
b. Foreign Currency Translation
Portfolio securities and other assets and liabilities denominated in foreign currencies are translated into U.S. dollars based on the exchange rate of such currencies against U.S. dollars on the date of valuation. The Fund may enter into foreign currency exchange contracts to facilitate transactions denominated in a
foreign currency. Purchases and sales of securities, income and expense items denominated in foreign currencies are translated into U.S. dollars at the exchange rate in effect on the transaction date. Portfolio securities and assets and liabilities denominated in foreign currencies contain risks that those currencies will decline in value relative to the U.S. dollar. Occasionally, events may impact the availability or reliability of foreign exchange rates used to convert the U.S. dollar equivalent value. If such an event occurs, the foreign exchange rate will be valued at fair value using procedures established and approved by the Board.
The Fund does not separately report the effect of changes in foreign exchange rates from changes in market prices on securities held. Such changes are included in net realized and unrealized gain or loss from investments on the Statement of Operations.
Realized foreign exchange gains or losses arise from sales of foreign currencies, currency gains or losses realized between the trade and settlement dates on securities transactions and the difference between the recorded amounts of dividends, interest, and foreign withholding taxes and the U.S. dollar equivalent of the amounts actually received or paid. Net unrealized foreign exchange gains and losses arise from changes in foreign exchange rates on foreign denominated assets and liabilities other than investments in securities held at the end of the reporting period.
c. Derivative Financial Instruments
The Fund invested in derivatives in order to manage risk or gain exposure to various other investments or markets. Derivatives are financial contracts based on an underlying or notional amount, require no initial investment or an initial net investment that is smaller than would normally be required to have a similar response to changes in market factors, and require or permit net settlement. Derivatives contain various risks including the potential inability of the counterparty to fulfill their obligations under the terms of the contract, the potential for an illiquid secondary market, and/or the potential for market movements which expose the Fund to gains or losses in excess of the amounts shown on the Statement of Assets and Liabilities. Realized gain and loss and unrealized appreciation and depreciation on these contracts for the period are included in the Statement of Operations.
Derivative counterparty credit risk is managed through a formal evaluation of the creditworthiness of all potential counterparties. The Fund attempts to reduce its exposure to counterparty credit risk on OTC derivatives, whenever possible, by entering into International Swaps and Derivatives Association (ISDA) master agreements with certain counterparties. These agreements
franklintempleton.com
Annual Report
| 31
FRANKLIN MUTUAL EUROPEAN FUND
NOTES TO FINANCIAL STATEMENTS
1. Organization and Significant Accounting
Policies (continued)
c. Derivative Financial Instruments (continued)
contain various provisions, including but not limited to collateral requirements, events of default, or early termination. Termination events applicable to the counterparty include certain deteriorations in the credit quality of the counterparty. Termination events applicable to the Fund include failure of the Fund to maintain certain net asset levels and/or limit the decline in net assets over various periods of time. In the event of default or early termination, the ISDA master agreement gives the non-defaulting party the right to net and close-out all transactions traded, whether or not arising under the ISDA agreement, to one net amount payable by one counterparty to the other. However, absent an event of default or early termination, OTC derivative assets and liabilities are presented gross and not offset in the Statement of Assets and Liabilities. Early termination by the counterparty may result in an immediate payment by the Fund of any net liability owed to that counterparty under the ISDA agreement.
Collateral requirements differ by type of derivative. Collateral or initial margin requirements are set by the broker or exchange clearing house for exchange traded and centrally cleared derivatives. Initial margin deposited is held at the exchange and can be in the form of cash and/or securities. For OTC derivatives traded under an ISDA master agreement, posting of collateral is required by either the Fund or the applicable counterparty if the total net exposure of all OTC derivatives with the applicable counterparty exceeds the minimum transfer amount, which typically ranges from $100,000 to $250,000, and can vary depending on the counterparty and the type of the agreement. Generally, collateral is determined at the close of fund business each day and any additional collateral required due to changes in derivative values may be delivered by the Fund or the counterparty within a few business days. Collateral pledged and/or received by the Fund for OTC derivatives, if any, is held in segregated accounts with the Fund’s custodian/counterparty broker and can be in the form of cash and/or securities. Unrestricted cash may be invested according to the Fund’s investment objectives.
The Fund entered into exchange traded futures contracts primarily to manage exposure to certain foreign currencies. A futures contract is an agreement between the Fund and a counterparty to buy or sell an asset for a specified price on a future date. Required initial margins are pledged by the Fund, and the daily change in fair value is accounted for as a variation margin payable or receivable on the Statement of Assets and Liabilities.
The Fund entered into OTC forward exchange contracts primarily to manage exposure to certain foreign currencies. A forward exchange contract is an agreement between the Fund and a coun-terparty to buy or sell a foreign currency at a specific exchange rate on a future date.
The Fund purchased or wrote exchange traded option contracts primarily to manage exposure to equity price risk. An option is a contract entitling the holder to purchase or sell a specific amount of shares or units of an asset or notional amount of a swap (swaption), at a specified price. Options purchased are recorded as an asset while options written are recorded as a liability. Upon exercise of an option, the acquisition cost or sales proceeds of the underlying investment is adjusted by any premium received or paid. Upon expiration of an option, any premium received or paid is recorded as a realized gain or loss. Upon closing an option other than through expiration or exercise, the difference between the premium and the cost to close the position is recorded as a realized gain or loss.
See Notes 7 and 11 regarding investment transactions and other derivative information, respectively.
d. Restricted Cash
At December 31, 2014, the Fund held restricted cash in connection with investments in certain derivative securities. Restricted cash is held in a segregated account with the Fund’s custodian/counterparty broker and is reflected in the Statement of Assets and Liabilities.
e. Securities Sold Short
The Fund is engaged in selling securities short, which obligates the Fund to replace a borrowed security with the same security at current fair value. The Fund incurs a loss if the price of the security increases between the date of the short sale and the date on which the Fund replaces the borrowed security. The Fund realizes a gain if the price of the security declines between those dates. Gains are limited to the price at which the Fund sold the security short, while losses are potentially unlimited in size.
The Fund is required to establish a margin account with the broker lending the security sold short. While the short sale is outstanding, the broker retains the proceeds of the short sale to the extent necessary to meet margin requirements until the short position is closed out. A deposit must also be maintained with the Fund’s custodian/counterparty broker consisting of cash and/or securities having a value equal to a specified percentage of the value of the securities sold short. The Fund is obligated to
32 | Annual Report
franklintempleton.com
FRANKLIN MUTUAL EUROPEAN FUND
NOTES TO FINANCIAL STATEMENTS
pay fees for borrowing the securities sold short and is required to pay the counterparty any dividends and/or interest due on securities sold short. Such dividends and/or interest and any security borrowing fees are recorded as an expense to the Fund. At December 31, 2014, the Fund had no securities sold short.
f. Securities Lending
The Fund participates in an agency based securities lending program. The Fund receives cash collateral against the loaned securities in an amount equal to at least 102% of the fair value of the loaned securities. Collateral is maintained over the life of the loan in an amount not less than 100% of the fair value of loaned securities, as determined at the close of fund business each day; any additional collateral required due to changes in security values is delivered to the Fund on the next business day. The collateral is invested in a non-registered money fund. The Fund receives income from the investment of cash collateral, in addition to lending fees and rebates paid by the borrower. The Fund bears the market risk with respect to the collateral investment, securities loaned, and the risk that the agent may default on its obligations to the Fund. The securities lending agent has agreed to indemnify the Fund in the event of default by a third party borrower. At December 31, 2014, the Fund had no securities on loan.
g. Income and Deferred Taxes
It is the Fund’s policy to qualify as a regulated investment company under the Internal Revenue Code. The Fund intends to distribute to shareholders substantially all of its taxable income and net realized gains to relieve it from federal income and excise taxes. As a result, no provision for U.S. federal income taxes is required.
The Fund may be subject to foreign taxation related to income received, capital gains on the sale of securities and certain foreign currency transactions in the foreign jurisdictions in which it invests. Foreign taxes, if any, are recorded based on the tax regulations and rates that exist in the foreign markets in which the Fund invests. When a capital gain tax is determined to apply the Fund records an estimated deferred tax liability in an amount that would be payable if the securities were disposed of on the valuation date. As a result of several court cases, in certain countries across the European Union, the Fund has filed additional tax reclaims for previously withheld taxes on dividends earned in those countries. These additional filings are subject to various administrative proceedings by the local jurisdictions’ tax authorities within the European Union, as well as a number of related judicial proceedings. At this time,
uncertainty exists as to the ultimate resolution of these proceedings, the likelihood of receipt of these reclaims, and the potential timing of payment, and accordingly, no amounts are reflected in the financial statements.
The Fund recognizes the tax benefits of uncertain tax positions only when the position is “more likely than not” to be sustained upon examination by the tax authorities based on the technical merits of the tax position. As of December 31, 2014, and for all open tax years, the Fund has determined that no liability for unrecognized tax benefits is required in the Fund’s financial statements related to uncertain tax positions taken on a tax return (or expected to be taken on future tax returns). Open tax years are those that remain subject to examination and are based on each tax jurisdiction statute of limitation.
h. Security Transactions, Investment Income, Expenses and Distributions
Security transactions are accounted for on trade date. Realized gains and losses on security transactions are determined on a specific identification basis. Interest income and estimated expenses are accrued daily. Amortization of premium and accretion of discount on debt securities are included in interest income. Dividend income and dividends declared on securities sold short are recorded on the ex-dividend date except for certain foreign securities where the dividend rate is not available. In such cases, the dividend is recorded as soon as the information is received by the Fund. Distributions to shareholders are recorded on the ex-dividend date and are determined according to income tax regulations (tax basis). Distributable earnings determined on a tax basis may differ from earnings recorded in accordance with U.S. GAAP. These differences may be permanent or temporary. Permanent differences are reclassified among capital accounts to reflect their tax character. These reclassifications have no impact on net assets or the results of operations. Temporary differences are not reclassified, as they may reverse in subsequent periods.
Common expenses incurred by the Trust are allocated among the funds based on the ratio of net assets of each fund to the combined net assets of the Trust. Fund specific expenses are charged directly to the fund that incurred the expense.
Realized and unrealized gains and losses and net investment income, not including class specific expenses, are allocated daily to each class of shares based upon the relative proportion of net assets of each class. Differences in per share distributions, by class, are generally due to differences in class specific expenses.
franklintempleton.com
Annual Report
| 33
FRANKLIN MUTUAL EUROPEAN FUND
NOTES TO FINANCIAL STATEMENTS
1. Organization and Significant Accounting
Policies (continued)
i. Accounting Estimates
The preparation of financial statements in accordance with U.S. GAAP requires management to make estimates and assumptions that affect the reported amounts of assets and liabilities at the date of the financial statements and the amounts of income and expenses during the reporting period. Actual results could differ from those estimates.
j. Guarantees and Indemnifications
Under the Trust’s organizational documents, its officers and trustees are indemnified by the Trust against certain liabilities arising out of the performance of their duties to the Trust.
Additionally, in the normal course of business, the Trust, on behalf of the Fund, enters into contracts with service providers that contain general indemnification clauses. The Trust’s maximum exposure under these arrangements is unknown as this would involve future claims that may be made against the Trust that have not yet occurred. Currently, the Trust expects the risk of loss to be remote.
2. Shares of Beneficial Interest
At December 31, 2014, there were an unlimited number of shares authorized (without par value). Transactions in the Fund’s shares were as follows:
| Year Ended December 31, | |||||||||||||
| 2014 | 2013 | a | |||||||||||
| Shares | Amount | Shares | Amount | ||||||||||
| Class Z Shares: | |||||||||||||
| Shares sold | 19,112,824 | $ | 467,220,561 | 20,746,802 | $ | 500,000,153 | |||||||
| Shares issued in reinvestment of distributions | 6,540,426 | 135,963,256 | 3,970,748 | 96,496,979 | |||||||||
| Shares redeemedb | (28,053,784 | ) | (667,006,361 | ) | (20,331,016 | ) | (475,757,908 | ) | |||||
| Net increase (decrease) | (2,400,534 | ) | $ | (63,822,544 | ) | 4,386,534 | $ | 120,739,224 | |||||
| Class A Shares: | |||||||||||||
| Shares sold | 16,444,913 | $ | 390,643,608 | 13,679,102 | $ | 324,306,477 | |||||||
| Shares issued in reinvestment of distributions | 4,183,197 | 84,743,971 | 2,057,291 | 48,885,214 | |||||||||
| Shares redeemed | (13,806,874 | ) | (321,833,916 | ) | (12,609,582 | ) | (300,036,242 | ) | |||||
| Net increase (decrease) | 6,821,236 | $ | 153,553,663 | 3,126,811 | $ | 73,155,449 | |||||||
| Class B Sharesc: | |||||||||||||
| Shares sold | 151 | $ | 3,172 | ||||||||||
| Shares redeemed | (29,455 | ) | (633,285 | ) | |||||||||
| Net increase (decrease) | (29,304 | ) | $ | (630,113 | ) | ||||||||
| Class C Shares: | |||||||||||||
| Shares sold | 3,504,884 | $ | 83,819,205 | 2,863,541 | $ | 68,880,536 | |||||||
| Shares issued in reinvestment of distributions | 1,147,068 | 23,294,092 | 512,117 | 12,189,089 | |||||||||
| Shares redeemed | (2,221,185 | ) | (51,160,993 | ) | (1,079,321 | ) | (24,896,820 | ) | |||||
| Net increase (decrease) | 2,430,767 | $ | 55,952,304 | 2,296,337 | $ | 56,172,805 | |||||||
| Class R Shares: | |||||||||||||
| Shares sold | 15,696 | $ | 370,698 | 3,841 | $ | 93,844 | |||||||
| Shares issued in reinvestment of distributions | 2,643 | 52,756 | 409 | 9,603 | |||||||||
| Shares redeemed | (2,847 | ) | (67,041 | ) | (937 | ) | (22,462 | ) | |||||
| Net increase (decrease) | 15,492 | $ | 356,413 | 3,313 | $ | 80,985 | |||||||
| Class R6 Shares: | |||||||||||||
| Shares soldb | 4,003,505 | $ | 98,368,915 | 12,899,801 | $ | 295,926,197 | |||||||
| Shares issued in reinvestment of distributions | 1,728,585 | 35,897,725 | 982,194 | 23,859,636 | |||||||||
| Shares redeemed | (2,525,555 | ) | (62,080,584 | ) | (1,047,184 | ) | (24,050,965 | ) | |||||
| Net increase (decrease) | 3,206,535 | $ | 72,186,056 | 12,834,811 | $ | 295,734,868 | |||||||
aFor the period May 1, 2013 (effective date) to December 31, 2013, for Class R6.
bEffective May 1, 2013, a portion of Class Z shares were exchanged into Class R6.
cEffective March 22, 2013, all Class B shares were converted to Class A.
34 | Annual Report
franklintempleton.com
FRANKLIN MUTUAL EUROPEAN FUND
NOTES TO FINANCIAL STATEMENTS
3. Transactions with Affiliates
Franklin Resources, Inc. is the holding company for various subsidiaries that together are referred to as Franklin Templeton Investments. Certain officers and trustees of the Fund are also officers and/or directors of the following subsidiaries:
| Subsidiary | Affiliation |
| Franklin Mutual Advisers, LLC (Franklin Mutual) | Investment manager |
| Franklin Templeton Services, LLC (FT Services) | Administrative manager |
| Franklin Templeton Distributors, Inc. (Distributors) | Principal underwriter |
| Franklin Templeton Investor Services, LLC (Investor Services) | Transfer agent |
a. Management Fees
The Fund pays an investment management fee to Franklin Mutual based on the average daily net assets of the Fund as follows:
| Annualized Fee Rate | Net Assets | |
| 0.875 | % | Up to and including $1 billion |
| 0.845 | % | Over $1 billion, up to and including $2 billion |
| 0.825 | % | Over $2 billion, up to and including $5 billion |
| 0.805 | % | In excess of $5 billion |
| Effective July 1, 2014, the Fund combined its investment management and administration agreements as approved by the Board. | ||
| The fees paid under the combined agreement do not exceed the aggregate fees that were paid under the separate agreements. | ||
| Prior to July 1, 2014, the Fund paid fees to Franklin Mutual based on the average daily net assets of the Fund as follows: | ||
| Annualized Fee Rate | Net Assets | |
| 0.800 | % | Up to and including $1 billion |
| 0.770 | % | Over $1 billion, up to and including $2 billion |
| 0.750 | % | Over $2 billion, up to and including $5 billion |
| 0.730 | % | In excess of $5 billion |
b. Administrative Fees
Effective July 1, 2014, under an agreement with Franklin Mutual, FT Services provides administrative services to the Fund. The fee is paid by Franklin Mutual based on the Fund’s average daily net assets, and is not an additional expense of the Fund.
Prior to July 1, 2014, the Fund paid its allocated share of an administrative fee to FT Services based on the Trust’s aggregate average daily net assets as follows:
| Annualized Fee Rate | Net Assets | |
| 0.150 | % | Up to and including $200 million |
| 0.135 | % | Over $200 million, up to and including $700 million |
| 0.100 | % | Over $700 million, up to and including $1.2 billion |
| 0.075 | % | In excess of $1.2 billion |
c. Distribution Fees
The Board has adopted distribution plans for each share class, with the exception of Class Z and Class R6 shares, pursuant to Rule 12b-1 under the 1940 Act. Distribution fees are not charged on shares held by affiliates. Under the Fund’s Class A reimbursement distribution plan, the Fund reimburses Distributors for costs incurred in connection with the servicing, sale and distribution of the Fund’s shares up to the maximum annual plan rate. Under the Class A reimbursement distribution plan, costs exceeding the maximum for the current plan year cannot be reimbursed in subsequent periods. In addition, under the Fund’s Class C and R
franklintempleton.com
Annual Report
| 35
FRANKLIN MUTUAL EUROPEAN FUND
NOTES TO FINANCIAL STATEMENTS
3. Transactions with Affiliates (continued)
c. Distribution Fees (continued)
compensation distribution plans, the Fund pays Distributors for costs incurred in connection with the servicing, sale and distribution of the Fund’s shares up to the maximum annual plan rate for each class. The plan year, for purposes of monitoring compliance with the maximum annual plan rates, is February 1 through January 31 for each fund.
The maximum annual plan rates, based on the average daily net assets, for each class, are as follows:
| Class A | 0.35 | % |
| Class C | 1.00 | % |
| Class R | 0.50 | % |
The Board has set the current rate at 0.30% per year for Class A shares until further notice and approval by the Board.
d. Sales Charges/Underwriting Agreements
Front-end sales charges and contingent deferred sales charges (CDSC) do not represent expenses of the Fund. These charges are deducted from the proceeds of sales of Fund shares prior to investment or from redemption proceeds prior to remittance, as applicable. Distributors has advised the Fund of the following commission transactions related to the sales and redemptions of the Fund’s shares for the year:
| Sales charges retained net of commissions paid to unaffiliated | ||
| broker/dealers | $ | 483,232 |
| CDSC retained | $ | 90,909 |
e. Transfer Agent Fees
Each class of shares, except for Class R6, pays transfer agent fees to Investor Services for its performance of shareholder servicing obligations and reimburses Investor Services for out of pocket expenses incurred, including shareholding servicing fees paid to third parties. These fees are allocated daily based upon their relative proportion of such classes’ aggregate net assets. Class R6 pays Investor Services transfer agent fees specific to that class.
For the year ended December 31, 2014, the Fund paid transfer agent fees of $3,707,458, of which $1,974,219 was retained by Investor Services.
f. Waiver and Expense Reimbursements
Investor Services has contractually agreed in advance to waive or limit its fees so that the Class R6 transfer agent fees do not exceed 0.01% until April 30, 2015. There were no Class R6 transfer agent fees waived during the year ended December 31, 2014.
g. Other Affiliated Transactions
At December 31, 2014, one or more of the funds in the Franklin Fund Allocator Series owned 10.71% of the Fund’s outstanding shares.
4. Expense Offset Arrangement
The Fund has entered into an arrangement with its custodian whereby credits realized as a result of uninvested cash balances are used to reduce a portion of the Fund’s custodian expenses. During the year ended December 31, 2014, the custodian fees were reduced as noted in the Statement of Operations.
36 | Annual Report
franklintempleton.com
FRANKLIN MUTUAL EUROPEAN FUND
NOTES TO FINANCIAL STATEMENTS
5. Independent Trustees’ Retirement Plan
On January 1, 1993, the Trust adopted an Independent Trustees’ Retirement Plan (Plan). The Plan is an unfunded defined benefit plan that provides benefit payments to Trustees whose length of service and retirement age meets the eligibility requirements of the Plan. Benefits under the Plan are based on years of service and fees paid to each trustee at the time of retirement. Effective in December 1996, the Plan was closed to new participants.
During the year ended December 31, 2014, the Fund’s projected benefit obligation and benefit payments under the Plan were as follows:
| aProjected benefit obligation at December 31, 2014 | $ | 89,826 | |
| bIncrease in projected benefit obligation | $ | 3,752 | |
| Benefit payments made to retired trustees | $ | (2,863 | ) |
aThe projected benefit obligation is included in trustees’ fees and expenses in the Statement of Assets and Liabilities.
bThe increase in projected benefit obligation is included in trustees’ fees and expenses in the Statement of Operations.
6. Income Taxes
The tax character of distributions paid during the years ended December 31, 2014 and 2013, was as follows:
| 2014 | 2013 | |||
| Distributions paid from: | ||||
| Ordinary income | $ | 70,154,145 | $ | 61,258,224 |
| Long term capital gain | 246,397,234 | 139,779,881 | ||
| $ | 316,551,379 | $ | 201,038,105 |
At December 31, 2014, the cost of investments, net unrealized appreciation (depreciation), undistributed ordinary income and undistributed long term capital gains for income tax purposes were as follows:
| Cost of investments | $ | 2,325,852,064 | |
| Unrealized appreciation | $ | 272,589,668 | |
| Unrealized depreciation | (193,889,242 | ) | |
| Net unrealized appreciation (depreciation) | $ | 78,700,426 | |
| Undistributed ordinary income | $ | 18,550,036 | |
| Undistributed long term capital gains | 58,646,938 | ||
| Distributable earnings | $ | 77,196,974 | |
Differences between income and/or capital gains as determined on a book basis and a tax basis are primarily due to differing treatments of foreign currency transactions.
7. Investment Transactions
Purchases and sales of investments (excluding short term securities and securities sold short) for the year ended December 31, 2014, aggregated $1,554,689,693 and $1,370,557,895, respectively.
franklintempleton.com
Annual Report
| 37
FRANKLIN MUTUAL EUROPEAN FUND
NOTES TO FINANCIAL STATEMENTS
7. Investment Transactions (continued)
Transactions in options written during the year ended December 31, 2014, were as follows:
| Number of | |||||
| Contracts | Premiums | ||||
| Options outstanding at December 31, 2013 | — | $ | — | ||
| Options written | 161 | 80,348 | |||
| Options expired | — | — | |||
| Options exercised | (161 | ) | (80,348 | ) | |
| Options closed | — | — | |||
| Options outstanding at December 31, 2014 | — | $ | — |
See Notes 1(c) and 11 regarding derivative financial instruments and other derivative information, respectively.
8. Credit Risk and Defaulted Securities
The Fund may purchase the pre-default or defaulted debt of distressed companies. Distressed companies are financially troubled and are about to be or are already involved in financial restructuring or bankruptcy. Risks associated with purchasing these securities include the possibility that the bankruptcy or other restructuring process takes longer than expected, or that distributions in restructuring are less than anticipated, either or both of which may result in unfavorable consequences to the Fund. If it becomes probable that the income on debt securities, including those of distressed companies, will not be collected, the Fund discontinues accruing income and recognizes an adjustment for uncollectible interest.
At December 31, 2014, the Fund did not hold any distressed company securities for which interest recognition has been discontinued.
9. Concentration of Risk
Investing in foreign securities may include certain risks and considerations not typically associated with investing in U.S. securities, such as fluctuating currency values and changing local and regional economic, political and social conditions, which may result in greater market volatility. In addition, certain foreign securities may not be as liquid as U.S. securities.
10. Restricted Securities
The Fund invests in securities that are restricted under the Securities Act of 1933 (1933 Act) or which are subject to legal, contractual, or other agreed upon restrictions on resale. Restricted securities are often purchased in private placement transactions, and cannot be sold without prior registration unless the sale is pursuant to an exemption under the 1933 Act. Disposal of these securities may require greater effort and expense, and prompt sale at an acceptable price may be difficult. The Fund may have registration rights for restricted securities. The issuer generally incurs all registration costs.
At December 31, 2014, the Fund held investments in restricted securities, excluding certain securities exempt from registration under the 1933 Act deemed to be liquid, as follows:
| Acquisition | ||||||
| Shares | Issuer | Dates | Cost | Value | ||
| 16,127,149 | Euro Wagon LP | 12/08/05 - 1/02/08 | $ | 6,282,509 | $ | 18,528,986 |
| 16,080 | Olympus Re Holdings Ltd. | 12/19/01 | 1,502,203 | — | ||
| Total Restricted Securities (Value is 0.73% of Net Assets) | $ | 7,784,712 | $ | 18,528,986 |
38 | Annual Report
franklintempleton.com
FRANKLIN MUTUAL EUROPEAN FUND
NOTES TO FINANCIAL STATEMENTS
11. Other Derivative Information
At December 31, 2014, the Fund’s investments in derivative contracts are reflected on the Statement of Assets and Liabilities as follows:
| Asset Derivatives | Liability Derivatives | ||||||
| Derivative Contracts | |||||||
| Not Accounted for as | Statement of Assets and | Statement of Assets and | |||||
| Hedging Instruments | Liabilities Location | Fair Value | Liabilities Location | Fair Value | |||
| Foreign exchange | |||||||
| contracts | Unrealized appreciation on | $ | 120,316,938 | a | Unrealized depreciation on | $ | 8,120,619 |
| forward exchange contracts / Net | forward exchange contracts | ||||||
| assets consist of – net unrealized | |||||||
| appreciation (depreciation) |
aIncludes cumulative appreciation (depreciation) of futures contracts as reported in the Statement of Investments. Only current day’s variation margin is separately reported within the Statement of Assets and Liabilities.
For the year ended December 31, 2014, the effect of derivative contracts on the Fund’s Statement of Operations was as follows:
| Change in | |||||
| Unrealized | |||||
| Derivative Contracts | Realized Gain | Appreciation | |||
| Not Accounted for as | (Loss) for | (Depreciation) | |||
| Hedging Instruments | Statement of Operations Locations | the Year | for the Year | ||
| Foreign exchange contracts | Net realized gain (loss) from foreign currency transactions and | $ | 48,477,807 | $ | 171,012,486 |
futures contracts / Net change in unrealized appreciation
(depreciation) on translation of other assets and liabilities
denominated in foreign currencies
For the year ended December 31, 2014, the average month end fair value of derivatives represented 2.30% of average month end net assets. The average month end number of open derivative contracts for the year was 241.
At December 31, 2014, the Fund’s OTC derivative assets and liabilities, are as follows:
| Gross and Net Amounts of Assets and Liabilities | ||||
| Presented in the Statement of Assets and Liabilities | ||||
| Assetsa | Liabilitiesa | |||
| Derivatives | ||||
| Forward exchange contracts | $ | 111,710,129 | $ | 8,120,619 |
aAbsent an event of default or early termination, OTC derivative assets and liabilities are presented gross and not offset in the Statement of Assets and Liabilities.
franklintempleton.com
Annual Report
| 39
FRANKLIN MUTUAL EUROPEAN FUND
NOTES TO FINANCIAL STATEMENTS
11. Other Derivative Information (continued)
At December 31, 2014, the Fund’s OTC derivative assets which may be offset against the Fund’s OTC derivative liabilities and collateral received from the counterparty, is as follows:
| Amounts Not Offset in the | |||||||||||||
| Statement of Assets and Liabilities | |||||||||||||
| Gross and | |||||||||||||
| Net Amounts of | Financial | Financial | |||||||||||
| Assets Presented in | Instruments | Instruments | Cash | Net Amount | |||||||||
| the Statement of | Available for | Collateral | Collateral | (Not less | |||||||||
| Assets and Liabilities | Offset | Receiveda,b | Receivedb | than zero) | |||||||||
| Counterparty | |||||||||||||
| BANT | $ | 35,249,869 | $ | (2,140,217 | ) | $ | (32,463,243 | ) | $ | — | $ | 646,409 | |
| BBU | 652,271 | (652,271 | ) | — | — | — | |||||||
| BONY | 1,604,241 | (463,791 | ) | (1,056,379 | ) | — | 84,071 | ||||||
| DBFX | 35,432,413 | (961,553 | ) | — | (32,210,000 | ) | 2,260,860 | ||||||
| FBCO | 7,493,139 | (1,091,466 | ) | (6,196,224 | ) | — | 205,449 | ||||||
| HSBC | 9,203,218 | (440,020 | ) | (8,763,198 | ) | — | — | ||||||
| SCBT | 2,908,792 | (288,221 | ) | — | (2,620,571 | ) | — | ||||||
| SSBT | 19,166,186 | — | — | — | 19,166,186 | ||||||||
| Total | $ | 111,710,129 | $ | 6,037,539 | $ | (48,479,044 | ) | $ | (34,830,571 | ) | $ | 22,362,975 | |
| aAt December 31, 2014, the Fund received Federal Republic of Germany Bonds, United Kingdom Treasury Notes and U.S. Treasury Bonds and Notes as collateral | ||||||||||||||
| for derivatives. | ||||||||||||||
| bIn some instances, the collateral amounts disclosed in the table above were adjusted due to the requirement to limit the collateral amounts to avoid the effect of | ||||||||||||||
| overcollateralization. Actual collateral received and/or pledged may be more than the amounts disclosed herein. | ||||||||||||||
| At December 31, 2014, the Fund’s OTC derivative liabilities which may be offset against the Fund’s OTC derivative assets and | ||||||||||||||
| collateral pledged to the counterparty, is as follows: | ||||||||||||||
| Amounts Not Offset in the | ||||||||||||||
| Statement of Assets and Liabilities | ||||||||||||||
| Gross and | ||||||||||||||
| Net Amounts of | Financial | Financial | ||||||||||||
| Liabilities Presented in | Instruments | Instruments | Cash | Net Amount | ||||||||||
| the Statement of | Available for | Collateral | Collateral | (Not less | ||||||||||
| Assets and Liabilities | Offset | Pledgeda,b | Pledged | than zero) | ||||||||||
| Counterparty | ||||||||||||||
| BANT | $ | 2,140,217 | $ | (2,140,217 | ) | $ | — | $ | — | $ | — | |||
| BBU | 1,367,889 | (652,271 | ) | (715,618 | ) | — | — | |||||||
| BONY | 463,791 | (463,791 | ) | — | — | — | ||||||||
| DBFX | 961,553 | (961,553 | ) | — | — | — | ||||||||
| FBCO | 1,091,466 | (1,091,466 | ) | — | — | — | ||||||||
| HSBC | 440,020 | (440,020 | ) | — | — | — | ||||||||
| SCBT | 288,221 | (288,221 | ) | — | — | — | ||||||||
| SSBT | 1,367,462 | — | — | — | 1,367,462 | |||||||||
| Total | $ | 8,120,619 | $ | 6,037,539 | $ | (715,618 | ) | $ | — | $ | 1,367,462 | |||
aSee the accompanying Statement of Investments for securities pledged as collateral for derivatives.
bIn some instances, the collateral amounts disclosed in the table above were adjusted due to the requirement to limit the collateral amounts to avoid the effect of
overcollateralization. Actual collateral received and/or pledged may be more than the amounts disclosed herein.
See Notes 1(c) and 7 regarding derivative financial instruments and investment transactions, respectively.
See Abbreviations on page 43.
40 | Annual Report
franklintempleton.com
FRANKLIN MUTUAL EUROPEAN FUND
NOTES TO FINANCIAL STATEMENTS
12. Holdings of 5% Voting Securities of Portfolio Companies
The 1940 Act defines “affiliated companies” to include investments in portfolio companies in which a fund owns 5% or more of the outstanding voting securities. Investments in “affiliated companies” for the Fund for the year ended December 31, 2014, were as shown below.
| Number of | Number of | ||||||||
| Shares Held | Shares Held | Value | |||||||
| at Beginning | Gross | Gross | at End | at End | Investment | Realized | |||
| Name of Issuer | of Year | Additions | Reductions | of Year | of Year | Income | Gain (Loss) | ||
| Controlled Affiliatesa | |||||||||
| Euro Wagon LP | |||||||||
| (Value is 0.73% of Net Assets) | 16,127,149 | — | — | 16,127,149 | $ | 18,528,986 | $ | 3,457,450 | $ — |
| aIssuer in which the Fund owns 25% or more of the outstanding voting securities. | |||||||||
13. Credit Facility
The Fund, together with other U.S. registered and foreign investment funds (collectively, Borrowers), managed by Franklin Templeton Investments, are borrowers in a joint syndicated senior unsecured credit facility totaling $1.5 billion (Global Credit Facility) which matured on February 13, 2015. This Global Credit Facility provides a source of funds to the Borrowers for temporary and emergency purposes, including the ability to meet future unanticipated or unusually large redemption requests. Effective February 13, 2015, the Borrowers renewed the Global Credit Facility for a total of $2 billion, which matures on February 12, 2016.
Under the terms of the Global Credit Facility, the Fund shall, in addition to interest charged on any borrowings made by the Fund and other costs incurred by the Fund, pay its share of fees and expenses incurred in connection with the implementation and maintenance of the Global Credit Facility, based upon its relative share of the aggregate net assets of all of the Borrowers, including an annual commitment fee of 0.07% based upon the unused portion of the Global Credit Facility. These fees are reflected in other expenses on the Statement of Operations. During the year ended December 31, 2014, the Fund did not use the Global Credit Facility.
14. Fair Value Measurements
The Fund follows a fair value hierarchy that distinguishes between market data obtained from independent sources (observable inputs) and the Fund’s own market assumptions (unobservable inputs). These inputs are used in determining the value of the Fund’s financial instruments and are summarized in the following fair value hierarchy:
- Level 1 – quoted prices in active markets for identical financial instruments
- Level 2 – other significant observable inputs (including quoted prices for similar financial instruments, interest rates, prepayment speed, credit risk, etc.)
- Level 3 – significant unobservable inputs (including the Fund’s own assumptions in determining the fair value of financial instruments)
The input levels are not necessarily an indication of the risk or liquidity associated with financial instruments at that level.
For movements between the levels within the fair value hierarchy, the Fund has adopted a policy of recognizing the transfers as of the date of the underlying event which caused the movement.
franklintempleton.com
Annual Report
| 41
FRANKLIN MUTUAL EUROPEAN FUND
NOTES TO FINANCIAL STATEMENTS
14. Fair Value Measurements (continued)
A summary of inputs used as of December 31, 2014, in valuing the Fund’s assets and liabilities carried at fair value, is as follows:
| Level 1 | Level 2 | Level 3 | Total | |||||
| Assets: | ||||||||
| Investments in Securities: | ||||||||
| Equity Investments:a | ||||||||
| Energy Equipment & Services | $ | — | $ | — | $ | 22,886,675 | $ | 22,886,675 |
| Machinery | 57,288,746 | 6,756,868 | — | 64,045,614 | ||||
| Oil, Gas & Consumable Fuels | 142,398,386 | 125,854 | — | 142,524,240 | ||||
| Real Estate Management & Development | — | — | 1,619,612 | 1,619,612 | ||||
| Road & Rail | 5,296,549 | — | 18,528,986 | 23,825,535 | ||||
| All Other Equity Investmentsb | 2,014,321,554 | — | —c | 2,014,321,554 | ||||
| Corporate Bonds | — | 5,338,962 | — | 5,338,962 | ||||
| Short Term Investments | 129,990,298 | — | — | 129,990,298 | ||||
| Total Investments in Securities | $ | 2,349,295,533 | $ | 12,221,684 | $ | 43,035,273 | $ | 2,404,552,490 |
| Other Financial Instruments | ||||||||
| Futures Contracts | $ | 8,606,809 | $ | — | $ | — | $ | 8,606,809 |
| Forward Exchange Contracts | — | 111,710,129 | — | 111,710,129 | ||||
| Total Other Financial Instruments | $ | 8,606,809 | $ | 111,710,129 | $ | — | $ | 120,316,938 |
| Liabilities: | ||||||||
| Other Financial Instruments | ||||||||
| Forward Exchange Contracts | $ | — | $ | 8,120,619 | $ | — | $ | 8,120,619 |
| aIncludes common and preferred stocks as well as other equity investments. | ||||||||
| bFor detailed categories, see the accompanying Statement of Investments. | ||||||||
| cIncludes securities determined to have no value at December 31, 2014. | ||||||||
A reconciliation of assets in which Level 3 inputs are used in determining fair value is presented when there are significant Level 3 financial instruments at the end of the year. At December 31, 2014, the reconciliations of assets, is as follows:
| Net Change | ||||||||||||||||||||||||
| in Unrealized | ||||||||||||||||||||||||
| Net | Appreciation | |||||||||||||||||||||||
| Balance at | Realized Net Unrealized | Balance | (Depreciation) | |||||||||||||||||||||
| Beginning | Transfers Into | Transfer Out | Cost Basis | Gain | Appreciation | at End on Assets Held | ||||||||||||||||||
| of Year | Purchases | Sales | Level 3a | of Level 3 Adjustmentsb | (Loss) | (Depreciation) | of Year | at Year End | ||||||||||||||||
| Assets: | ||||||||||||||||||||||||
| Investments in Securities: | ||||||||||||||||||||||||
| Equity Investments:c | ||||||||||||||||||||||||
| Capital Markets | $ | 109,153 | $ | — | $ | (111,616 | ) | $ | — | $ | — | $ | — | $ | (43,585 | ) | $ | 46,048 | $ | — | $ | — | ||
| Energy Equipment & | ||||||||||||||||||||||||
| Services | — | — | — | 22,886,675 | — | — | — | — | 22,886,675 | — | ||||||||||||||
| Insurance | —d | — | — | — | — | (4,188 | ) | — | 4,188 | —d | 4,188 | |||||||||||||
| Real Estate Management & | ||||||||||||||||||||||||
| Development | 992,766 | — | — | — | — | — | — | 626,846 | 1,619,612 | 626,846 | ||||||||||||||
| Road & Rail | 16,886,505 | — | — | — | — | — | — | 1,642,481 | 18,528,986 | 1,642,481 | ||||||||||||||
| Total | $ | 17,988,424 | $ | — | $ | (111,616 | ) | $ | 22,886,675 | $ | — | $ | (4,188 | ) | $ | (43,585 | ) | $ | 2,319,563 | $ | 43,035,273 | $ | 2,273,515 | |
aThe investment was transferred into Level 3 as a result of its value being determined using a significant observable valuation input.
bMay include accretion, amortization, partnership adjustments, and/or other cost basis adjustments.
cIncludes common and preferred stocks as well as other equity investments.
dIncludes securities determined to have no value.
42 | Annual Report
franklintempleton.com
FRANKLIN MUTUAL EUROPEAN FUND
NOTES TO FINANCIAL STATEMENTS
Significant unobservable valuation inputs developed by the VLOC for material Level 3 financial instruments and impact to fair value as a result of changes in unobservable valuation inputs as of December 31, 2014, are as follows:
| Impact to Fair | |||||||
| Fair Value at End | Value if Input | ||||||
| Description | of Year | Valuation Technique | Unobservable Inputs | Amount | Increasesa | ||
| Assets: | |||||||
| Investments in Securities: | |||||||
| Equity Investments: | |||||||
| Road & Rail | $ | 18,528,986 | Market comparables | Discount for lack of | |||
| marketability | 15 | % | Decreaseb | ||||
| All Other Investmentsc | 24,506,287 | ||||||
| Total | $ | 43,035,273 |
aRepresents the directional change in the fair value of the Level 3 financial instruments that would result from a significant and reasonable increase in the corresponding
input. A significant and reasonable decrease in input would have the opposite effect. Significant impacts, if any, to fair value and/or net assets have been indicated.
bRepresents a significant impact to fair value but not net assets.
cIncludes fair value of immaterial financial instruments developed using various valuation techniques and unobservable inputs. May also include financial instruments with
values derived using prior transaction prices or third party pricing information without adjustment for which such inputs are also unobservable.
15. New Accounting Pronouncements
In June 2014, Financial Accounting Standards Board issued Accounting Standards Update (ASU) No. 2014-11, Transfers and Servicing (Topic 860), Repurchase-to-Maturity Transactions, Repurchase Financings, and Disclosures. The ASU changes the accounting for certain repurchase agreements and expands disclosure requirements related to repurchase agreements, securities lending, repurchase-to-maturity and similar transactions. The ASU is effective for interim and annual reporting periods beginning after December 15, 2014. Management has reviewed the requirements and believes the adoption of this ASU will not have a material impact on the financial statements.
16. Subsequent Events
The Fund has evaluated subsequent events through the issuance of the financial statements and determined that no events have occurred that require disclosure other than those already disclosed in the financial statements.
| Abbreviations | ||||
| Counterparty | Currency | Selected Portfolio | ||
| BANT | Bank of America N.A. | CHF | Swiss Franc | IDR International Depositary Receipt |
| BBU | Barclays Bank PLC | EUR Euro | ||
| BONY | Bank of New York Mellon | GBP | British Pound | |
| DBFX | Deutsche Bank AG | USD | United States Dollar | |
| FBCO | Credit Suisse Group AG | |||
| HSBC | HSBC Bank USA, N.A. | |||
| SCBT | Standard Chartered Bank | |||
| SSBT | State Street Bank and Trust Co., N.A. | |||
franklintempleton.com
Annual Report
| 43
FRANKLIN MUTUAL EUROPEAN FUND
Report of Independent Registered Public Accounting Firm
To the Board of Trustees of Franklin Mutual Series Funds and Shareholders of Franklin Mutual European Fund:
We have audited the accompanying statement of assets and liabilities, including the statement of investments, of Franklin Mutual European Fund (formerly, Mutual European Fund) (the “Fund”) (one of the funds constituting Franklin Mutual Series Funds), as of December 31, 2014, and the related statement of operations for the year then ended, the statements of changes in net assets for each of the two years in the period then ended, and the financial highlights for each of the periods indicated therein. These financial statements and financial highlights are the responsibility of the Fund’s management. Our responsibility is to express an opinion on these financial statements and financial highlights based on our audits.
We conducted our audits in accordance with the standards of the Public Company Accounting Oversight Board (United States). Those standards require that we plan and perform the audit to obtain reasonable assurance about whether the financial statements and financial highlights are free of material misstatement. We were not engaged to perform an audit of the Fund’s internal control over financial reporting. Our audits included consideration of internal control over financial reporting as a basis for designing audit procedures that are appropriate in the circumstances, but not for the purpose of expressing an opinion on the effectiveness of the Fund’s internal control over financial reporting. Accordingly, we express no such opinion. An audit also includes examining, on a test basis, evidence supporting the amounts and disclosures in the financial statements and financial highlights, assessing the accounting principles used and significant estimates made by management, and evaluating the overall financial statement presentation. Our procedures included confirmation of securities owned as of December 31, 2014, by correspondence with the custodian and brokers. We believe that our audits provide a reasonable basis for our opinion.
In our opinion, the financial statements and financial highlights referred to above present fairly, in all material respects, the financial position of Franklin Mutual European Fund (one of the funds constituting Franklin Mutual Series Funds) at December 31, 2014, the results of its operations for the year then ended, the changes in its net assets for each of the two years in the period then ended, and the financial highlights for each of the periods indicated therein, in conformity with U.S. generally accepted accounting principles.

Boston, Massachusetts
February 18, 2015
44 | Annual Report
franklintempleton.com
FRANKLIN MUTUAL EUROPEAN FUND
Tax Information (unaudited)
Under Section 852(b)(3)(C) of the Internal Revenue Code (Code), the Fund hereby reports the maximum amount allowable but no less than $246,397,234 as a long term capital gain dividend for the fiscal year ended December 31, 2014.
Under Section 871(k)(2)(C) of the Code, the Fund hereby reports the maximum amount allowable but no less than $524 as a short term capital gain dividend for purposes of the tax imposed under Section 871(a)(1)(A) of the Code for the fiscal year ended December 31, 2014.
Under Section 854(b)(1)(B) of the Code, the Fund hereby reports the maximum amount allowable but no less than $103,930,708 as qualified dividends for purposes of the maximum rate under Section 1(h)(11) of the Code for the fiscal year ended December 31, 2014. Distributions, including qualified dividend income, paid during calendar year 2014 will be reported to shareholders on Form 1099-DIV by mid-February 2015. Shareholders are advised to check with their tax advisors for information on the treatment of these amounts on their individual income tax returns.
At December 31, 2014, more than 50% of the Fund’s total assets were invested in securities of foreign issuers. In most instances, foreign taxes were withheld from income paid to the Fund on these investments. As shown in the table below, the Fund hereby reports to shareholders the foreign source income and foreign taxes paid, pursuant to Section 853 of the Code. This written statement will allow shareholders of record on December 18, 2014, to treat their proportionate share of foreign taxes paid by the Funds as having been paid directly by them. The shareholder shall consider these amounts as foreign taxes paid in the tax year in which they receive the Fund distribution.
The following table provides a detailed analysis of foreign tax paid, foreign source income and foreign source qualified dividends as reported by the Fund, to Class Z, Class A, Class C, Class R and Class R6 shareholders of record.
| Foreign Tax Paid | Foreign Source | Foreign Source Qualified | ||||
| Class | Per Share | Income Per Share | Dividends Per Share | |||
| Class Z | $ | 0.0515 | $ | 0.7965 | $ | 0.7024 |
| Class A | $ | 0.0515 | $ | 0.7278 | $ | 0.6418 |
| Class C | $ | 0.0515 | $ | 0.5712 | $ | 0.5036 |
| Class R | $ | 0.0515 | $ | 0.7294 | $ | 0.6433 |
| Class R6 | $ | 0.0515 | $ | 0.8362 | $ | 0.7373 |
Foreign Tax Paid Per Share (Column 1) is the amount per share available to you, as a tax credit (assuming you held your shares in the Fund for a minimum of 16 days during the 31-day period beginning 15 days before the ex-dividend date of the Fund’s distribution to which the foreign taxes relate), or, as a tax deduction.
Foreign Source Income Per Share (Column 2) is the amount per share of income dividends attributable to foreign securities held by the Fund, plus any foreign taxes withheld on these dividends. The amounts reported include foreign source qualified dividends that have not been adjusted for the rate differential applicable to such dividend income.1
Foreign Source Qualified Dividends Per Share (Column 3) is the amount per share of foreign source qualified dividends, plus any foreign taxes withheld on these dividends. These amounts represent the portion of the Foreign Source Income reported to you in column 2 that were derived from qualified foreign securities held by the Fund.1
By mid-February 2015, shareholders will receive Form 1099-DIV which will include their share of taxes paid and foreign source income distributed during the calendar year 2014. The Foreign Source Income reported on Form 1099-DIV has not been adjusted for the rate differential on foreign source qualified dividend income. Shareholders are advised to check with their tax advisors for information on the treatment of these amounts on their 2014 individual income tax returns.
1Qualified dividends are taxed at reduced long term capital gains tax rates. In determining the amount of foreign tax credit that may be applied against the U.S. tax liability of individuals receiving foreign source qualified dividends, adjustments may be required to the foreign tax credit limitation calculation to reflect the rate differential applicable to such dividend income. The rules however permit certain individuals to elect not to apply the rate differential adjustments for capital gains and/or dividends for any taxable year. Please consult your tax advisor and the instructions to Form 1116 for more information.
franklintempleton.com
Annual Report
| 45
FRANKLIN MUTUAL EUROPEAN FUND
Board Members and Officers
The name, year of birth and address of the officers and board members, as well as their affiliations, positions held with the Fund, principal occupations during at least the past five years and number of portfolios overseen in the Franklin Templeton Investments fund complex are shown below. Generally, each board member serves until that person’s successor is elected and qualified.
| Independent Board Members | ||||
| Number of Portfolios in | ||||
| Name, Year of Birth | Length of | Fund Complex Overseen | Other Directorships Held During | |
| and Address | Position | Time Served | by Board Member* | at Least the Past 5 Years |
| Edward I. Altman, Ph.D. (1941) | Trustee | Since 1987 | 10 | None |
| c/o Franklin Mutual Advisers, LLC | ||||
| 101 John F. Kennedy Parkway | ||||
| Short Hills, NJ 07078-2789 | ||||
Principal Occupation During at Least the Past 5 Years:
Max L. Heine Professor of Finance and Director of The Credit and Debt Markets Research Program, Salomon Center, Stern School of Business, New York University; editor and author of numerous financial publications; financial consultant; an adviser to numerous financial and publishing organizations; and formerly, Vice Director, Salomon Center, Stern School of Business, New York University.
| Ann Torre Bates (1958) | Trustee | Since 1995 | 36 | Navient Corporation (loan |
| c/o Franklin Mutual Advisers, LLC | management, servicing and asset | |||
| 101 John F. Kennedy Parkway | recovery) (May 2014), Ares Capital | |||
| Short Hills, NJ 07078-2789 | Corporation (specialty finance | |||
| company) (2010-present), United | ||||
| Natural Foods, Inc. (distributor of | ||||
| natural, organic and specialty foods) | ||||
| (2013-present), Allied Capital | ||||
| Corporation (financial services) | ||||
| (2003-2010) and SLM Corporation | ||||
| (Sallie Mae) (1997-2014). | ||||
Principal Occupation During at Least the Past 5 Years:
Director of various companies; and formerly, Executive Vice President and Chief Financial Officer, NHP Incorporated (manager of multifamily housing) (1995-1997); and Vice President and Treasurer, US Airways, Inc. (until 1995).
| Burton J. Greenwald (1929) Trustee | Since 2002 | 17 | Franklin Templeton Emerging Markets |
| c/o Franklin Mutual Advisers, LLC | Debt Opportunities Fund PLC and | ||
| 101 John F. Kennedy Parkway | Fiduciary International Ireland Limited. | ||
| Short Hills, NJ 07078-2789 |
Principal Occupation During at Least the Past 5 Years:
Managing Director, B.J. Greenwald Associates (management consultants to the financial services industry); and formerly, Chairman, Fiduciary Trust International Funds; Executive Vice President, L.F Rothschild Fund Management, Inc.; President and Director, Merit Mutual Funds; President, Underwriting Division and Director, National Securities & Research Corporation; Governor, Investment Company Institute; and Chairman, ICI Public Information Committee.
| Keith E. Mitchell (1954) | Trustee | Since 2009 | 10 | None |
| c/o Franklin Mutual Advisers, LLC | ||||
| 101 John F. Kennedy Parkway | ||||
| Short Hills, NJ 07078-2789 | ||||
Principal Occupation During at Least the Past 5 Years:
Managing Member, Mitchell, Hartley & Bechtel Advisers, LLC (formerly, Mitchell Advisers, LLC) (advisory firm); director of various boards of asset management firms; and formerly, Managing Director, Putnam Lovell NBF.
46 | Annual Report
franklintempleton.com
FRANKLIN MUTUAL EUROPEAN FUND
| Independent Board Members (continued) | ||||
| Number of Portfolios in | ||||
| Name, Year of Birth | Length of | Fund Complex Overseen | Other Directorships Held During | |
| and Address | Position | Time Served | by Board Member* | at Least the Past 5 Years |
| Charles Rubens II (1930) | Trustee | Since 1998 | 17 | None |
| c/o Franklin Mutual Advisers, LLC | ||||
| 101 John F. Kennedy Parkway | ||||
| Short Hills, NJ 07078-2789 | ||||
Principal Occupation During at Least the Past 5 Years:
Private investor and president of non-profit organizations; and formerly, an executive of Time, Inc.; and Trustee of Colorado College.
| Jan Hopkins Trachtman (1947) Trustee | Since 2009 | 10 | None |
| c/o Franklin Mutual Advisers, LLC | |||
| 101 John F. Kennedy Parkway | |||
| Short Hills, NJ 07078-2789 |
Principal Occupation During at Least the Past 5 Years:
President and Founder, The Jan Hopkins Group (communications consulting firm); President, Economic Club of New York; serves on Advisory Board of Knight Bagehot Fellowship; and formerly, Anchor/Correspondent, CNN Financial News (until 2003); Managing Director and Head of Client Communications, Citigroup Private Bank (until 2005); Off-Air Reporter, ABC News’ World News Tonight; and Editor, CBS Network News.
| Robert E. Wade (1946) | Trustee and | Trustee since 1993 43 | El Oro Ltd (investments). | |
| c/o Franklin Mutual Advisers, LLC Chairman of | and Chairman of | |||
| 101 John F. Kennedy Parkway | the Board | the Board since | ||
| Short Hills, NJ 07078-2789 | 2005 | |||
| Principal Occupation During at Least the Past 5 Years: | ||||
| Attorney at law engaged in private practice (1972-2008) and member of various boards. | ||||
| Interested Board Members and Officers | ||||
| Number of Portfolios in | ||||
| Name, Year of Birth | Length of | Fund Complex Overseen | Other Directorships Held During | |
| and Address | Position | Time Served | by Board Member* | at Least the Past 5 Years |
| **Gregory E. Johnson (1961) | Trustee | Since 2007 | 147 | None |
| One Franklin Parkway | ||||
| San Mateo, CA 94403-1906 | ||||
Principal Occupation During at Least the Past 5 Years:
Chairman of the Board, Member – Office of the Chairman, Director, President and Chief Executive Officer, Franklin Resources, Inc.; officer and/or director or trustee, as the case may be, of some of the other subsidiaries of Franklin Resources, Inc. and of 44 of the investment companies in Franklin Templeton Investments; and Vice Chairman, Investment Company Institute.
| **Peter A. Langerman (1955) | Trustee, | Trustee since | 10 | American International Group, Inc. | |
| c/o Franklin Mutual Advisers, LLC President, and | 2007, President, | (AIG) Credit Facility Trust | |||
| 101 John F. Kennedy Parkway | Chief Executive and Chief | (2010–2011). | |||
| Short Hills, NJ 07078-2702 | Officer – | Executive Officer – | |||
| Investment | Investment | ||||
| Management | Management since | ||||
| 2005 | |||||
Principal Occupation During at Least the Past 5 Years:
Chairman of the Board, Chief Executive Officer and President, Franklin Mutual Advisers, LLC; officer and/or director, as the case may be, of four of the investment companies in Franklin Templeton Investments.
franklintempleton.com
Annual Report
| 47
| FRANKLIN MUTUAL EUROPEAN FUND | ||||
| Interested Board Members and Officers (continued) | ||||
| Number of Portfolios in | ||||
| Name, Year of Birth | Length of | Fund Complex Overseen | Other Directorships Held During | |
| and Address | Position | Time Served | by Board Member* | at Least the Past 5 Years |
| Alison E. Baur (1964) | Vice President | Since 2012 | Not Applicable | Not Applicable |
| One Franklin Parkway | ||||
| San Mateo, CA 94403-1906 | ||||
Principal Occupation During at Least the Past 5 Years:
Deputy General Counsel, Franklin Templeton Investments; and officer of some of the other subsidiaries of Franklin Resources, Inc. and of 46 of the investment companies in Franklin Templeton Investments.
| Philippe Brugere-Trelat (1949) | Vice President | Since 2005 | Not Applicable | Not Applicable |
| 101 John F. Kennedy Parkway | ||||
| Short Hills NJ 07078-2789 |
Principal Occupation During at Least the Past 5 Years:
Executive Vice President, Franklin Mutual Advisers, LLC; officer of three of the investment companies in Franklin Templeton Investments; and formerly, Portfolio Manager of Eurovest SA (French registered Investment Company, Sicav).
| Laura F. Fergerson (1962) | Chief | Since 2009 | Not Applicable | Not Applicable |
| One Franklin Parkway | Executive | |||
| San Mateo, CA 94403-1906 | Officer – | |||
| Finance and | ||||
| Administration |
Principal Occupation During at Least the Past 5 Years:
Senior Vice President, Franklin Templeton Services, LLC; and officer of 46 of the investment companies in Franklin Templeton Investments
| Aliya S. Gordon (1973) | Vice President | Since 2009 | Not Applicable | Not Applicable |
| One Franklin Parkway | ||||
| San Mateo, CA 94403-1906 |
Principal Occupation During at Least the Past 5 Years:
Senior Associate General Counsel, Franklin Templeton Investments; officer of 46 of the investment companies in Franklin Templeton Investments; and formerly, Litigation Associate, Steefel, Levitt & Weiss, LLP (2000-2004).
| Steven J. Gray (1955) | Secretary and | Secretary since | Not Applicable | Not Applicable |
| One Franklin Parkway | Vice President | 2005 and Vice | ||
| San Mateo, CA 94403-1906 | President since | |||
| 2009 |
Principal Occupation During at Least the Past 5 Years:
Senior Associate General Counsel, Franklin Templeton Investments; Vice President, Franklin Templeton Distributors, Inc. and Franklin Alternative Strategies Advisers, LLC; and officer of 46 of the investment companies in Franklin Templeton Investments.
| Selena L. Holmes (1965) | Vice President | Since 2012 | Not Applicable | Not Applicable |
| 100 Fountain Parkway | – AML | |||
| St. Petersburg, FL 33716-1205 | Compliance |
Principal Occupation During at Least the Past 5 Years:
Director, Global Compliance Monitoring; Chief Compliance Officer, Franklin Alternative Strategies Advisers, LLC; Vice President, Franklin Templeton Companies, LLC; and officer of 46 of the investment companies in Franklin Templeton Investments.
48 | Annual Report
franklintempleton.com
FRANKLIN MUTUAL EUROPEAN FUND
| Interested Board Members and Officers (continued) | ||||
| Number of Portfolios in | ||||
| Name, Year of Birth | Length of | Fund Complex Overseen | Other Directorships Held During | |
| and Address | Position | Time Served | by Board Member* | at Least the Past 5 Years |
| Robert G. Kubilis (1973) | Treasurer, | Since 2012 | Not Applicable | Not Applicable |
| 300 S.E. 2nd Street | Chief Financial | |||
| Fort Lauderdale, FL 33301-1923 | Officer and | |||
| Chief | ||||
| Accounting | ||||
| Officer | ||||
Principal Occupation During at Least the Past 5 Years:
Assistant Treasurer, Fund Accounting, Franklin Templeton Investments; and officer of four of the investment companies in Franklin Templeton Investments.
| Kimberly H. Novotny (1972) Vice President | Since 2013 | Not Applicable | Not Applicable |
| 300 S.E. 2nd Street | |||
| Fort Lauderdale, FL 33301-1923 |
Principal Occupation During at Least the Past 5 Years:
Associate General Counsel, Franklin Templeton Investments; Vice President and Secretary, Fiduciary Trust International of the South; Vice President, Templeton Investment Counsel, LLC; Assistant Secretary, Franklin Resources, Inc.; and officer of 46 of the investment companies in Franklin Templeton Investments.
| Robert C. Rosselot (1960) | Chief | Since 2013 | Not Applicable | Not Applicable |
| 300 S.E. 2nd Street | Compliance | |||
| Fort Lauderdale, FL 33301-1923 | Officer |
Principal Occupation During at Least the Past 5 Years:
Director, Global Compliance, Franklin Templeton Investments; Vice President, Franklin Templeton Companies, LLC; officer of 46 of the investment companies in Franklin Templeton Investments; and formerly, Senior Associate General Counsel, Franklin Templeton Investments (2007-2013); and Secretary and Vice President, Templeton Group of Funds (2004-2013).
| Karen L. Skidmore (1952) | Vice President | Since 2009 | Not Applicable | Not Applicable |
| One Franklin Parkway | ||||
| San Mateo, CA 94403-1906 |
Principal Occupation During at Least the Past 5 Years:
Senior Associate General Counsel, Franklin Templeton Investments; and officer of 46 of the investment companies in Franklin Templeton Investments.
| Craig S. Tyle (1960) | Vice President | Since 2005 | Not Applicable | Not Applicable |
| One Franklin Parkway | ||||
| San Mateo, CA 94403-1906 |
Principal Occupation During at Least the Past 5 Years:
General Counsel and Executive Vice President, Franklin Resources, Inc.; and officer of some of the other subsidiaries of Franklin Resources, Inc. and of 46 of the investment companies in Franklin Templeton Investments.
franklintempleton.com
Annual Report
| 49
FRANKLIN MUTUAL EUROPEAN FUND
| Interested Board Members and Officers (continued) | ||||
| Number of Portfolios in | ||||
| Name, Year of Birth | Length of | Fund Complex Overseen | Other Directorships Held During | |
| and Address | Position | Time Served | by Board Member* | at Least the Past 5 Years |
| Lori A. Weber (1964) | Vice President | Since 2011 | Not Applicable | Not Applicable |
| 300 S.E. 2nd Street | ||||
| Fort Lauderdale, FL 33301-1923 | ||||
Principal Occupation During at Least the Past 5 Years:
Senior Associate General Counsel, Franklin Templeton Investments; Assistant Secretary, Franklin Resources, Inc.; Vice President and Secretary, Templeton Investment Counsel, LLC; Vice President, Fiduciary Trust International of the South; and officer of 46 of the investment companies in Franklin Templeton Investments.
*We base the number of portfolios on each separate series of the U.S. registered investment companies within the Franklin Templeton Investments fund complex. These portfolios have a common investment manager or affiliated investment managers.
**Gregory E. Johnson is considered to be an interested person of the Fund under the federal securities laws due to his position as an officer and director of Franklin Resources, Inc., which is the parent company of the Fund’s investment manager and distributor. Peter A. Langerman is considered to be an interested person of the Fund under the federal securities laws due to his position as an officer of Franklin Mutual Advisers, LLC, which is an affiliate of the Fund’s investment manager.
Note 1: Officer information is current as of the date of this report. It is possible that after this date, information about officers may change.
The Fund’s Board has determined that certain of the members of the Audit Committee, including Ann Torre Bates, are audit committee financial experts, and “independent,” under those provisions of the Sarbanes-Oxley Act of 2002, and the rules and form amendments adopted by the Securities and Exchange Commission, relating to audit committee financial experts.
The Statement of Additional Information (SAI) includes additional information about the board members and is available, without charge, upon request.
Shareholders may call (800) DIAL BEN/342-5236 to request the SAI.
50 | Annual Report
franklintempleton.com
FRANKLIN MUTUAL EUROPEAN FUND
Shareholder Information
Proxy Voting Policies and Procedures
The Fund’s investment manager has established Proxy Voting Policies and Procedures (Policies) that the Fund uses to determine how to vote proxies relating to portfolio securities. Shareholders may view the Fund’s complete Policies online at franklintempleton.com. Alternatively, shareholders may request copies of the Policies free of charge by calling the Proxy Group collect at (954) 527-7678 or by sending a written request to: Franklin Templeton Companies, LLC, 300 S.E. 2nd Street, Fort Lauderdale, FL 33301, Attention: Proxy Group. Copies of the Fund’s proxy voting records are also made available online at franklintempleton.com and posted on the U.S. Securities and Exchange Commission’s website at sec.gov and reflect the most recent 12-month period ended June 30.
Quarterly Statement of Investments
The Fund files a complete statement of investments with the U.S. Securities and Exchange Commission for the first and third quarters for each fiscal year on Form N-Q. Shareholders may view the filed Form N-Q by visiting the Commission’s website at sec.gov. The filed form may also be viewed and copied at the Commission’s Public Reference Room in Washington, DC. Information regarding the operations of the Public Reference Room may be obtained by calling (800) SEC-0330.
Householding of Reports and Prospectuses
You will receive the Fund’s financial reports every six months as well as an annual updated summary prospectus (prospectus available upon request). To reduce Fund expenses, we try to identify related shareholders in a household and send only one copy of the financial reports and summary prospectus. This process, called “householding,” will continue indefinitely unless you instruct us otherwise. If you prefer not to have these documents householded, please call us at (800) 632-2301. At any time you may view current prospectuses/summary prospectuses and financial reports on our website. If you choose, you may receive these documents through electronic delivery.
franklintempleton.com
Annual Report
| 51
This page intentionally left blank.

Annual Report and Shareholder Letter
Franklin Mutual European Fund
Formerly, Mutual European Fund
Investment Manager
Franklin Mutual Advisers, LLC
Distributor
Franklin Templeton Distributors, Inc.
(800) DIAL BEN® / 342-5236
franklintempleton.com
Shareholder Services
(800) 632-2301 - (Class A, C, R & R6)
(800) 448-FUND - (Class Z)
Authorized for distribution only when accompanied or preceded by a summary prospectus and/or prospectus. Investors should carefully consider a fund’s investment goals, risks, charges and expenses before investing. A prospectus contains this and other information; please read it carefully before investing.
To help ensure we provide you with quality service, all calls to and from our service areas are monitored and/or recorded.
| © 2015 Franklin Templeton Investments. All rights reserved. | 478 A 02/15 |
Annual Report
and Shareholder Letter
December 31, 2014
Franklin Mutual Financial Services Fund
Formerly, Mutual Financial Services Fund

Sign up for electronic delivery at franklintempleton.com/edelivery
Franklin Templeton Investments
Gain From Our Perspective®
At Franklin Templeton Investments, we’re dedicated to one goal: delivering exceptional asset management for our clients. By bringing together multiple, world-class investment teams in a single firm, we’re able to offer specialized expertise across styles and asset classes, all supported by the strength and resources of one of the world’s largest asset managers. This has helped us to become a trusted partner to individual and institutional investors across the globe.
Focus on Investment Excellence
At the core of our firm, you’ll find multiple independent investment teams—each with a focused area of expertise—from traditional to alternative strategies and multi-asset solutions. And because our portfolio groups operate autonomously, their strategies can be combined to deliver true style and asset class diversification.
All of our investment teams share a common commitment to excellence grounded in rigorous, fundamental research and robust, disciplined risk management. Decade after decade, our consistent, research-driven processes have helped Franklin Templeton earn an impressive record of strong, long-term results.
Global Perspective Shaped by Local Expertise
In today’s complex and interconnected world, smart investing demands a global perspective. Franklin Templeton pioneered international investing over 60 years ago, and our expertise in emerging markets spans more than a quarter of a century. Today, our investment professionals are on the ground across the globe, spotting investment ideas and potential risks firsthand. These locally based teams bring in-depth understanding of local companies, economies and cultural nuances, and share their best thinking across our global research network.
Strength and Experience
Franklin Templeton is a global leader in asset management serving clients in over 150 countries.1 We run our business with the same prudence we apply to asset management, staying focused on delivering relevant investment solutions, strong long-term results and reliable, personal service. This approach, focused on putting clients first, has helped us to become one of the most trusted names in financial services.
1. As of 12/31/13. Clients are represented by the total number of shareholder accounts.
Not FDIC Insured | May Lose Value | No Bank Guarantee
| Contents | |
| Shareholder Letter | 1 |
| Annual Report | |
| Franklin Mutual | |
| Financial Services Fund | 3 |
| Performance Summary | 8 |
| Your Fund’s Expenses | 13 |
| Financial Highlights and | |
| Statement of Investments | 15 |
| Financial Statements | 24 |
| Notes to Financial Statements | 28 |
| Report of Independent Registered | |
| Public Accounting Firm | 41 |
| Tax Information | 42 |
| Board Members and Officers | 43 |
| Shareholder Information | 48 |
| 1
Annual Report
Franklin Mutual Financial Services Fund
(formerly, Mutual Financial Services Fund)
This annual report for Franklin Mutual Financial Services Fund covers the period ended December 31, 2014.
Your Fund’s Goals and Main Investments
The Fund seeks capital appreciation, which may occasionally be short term, with income as a secondary goal, by investing at least 80% of its net assets in securities of financial services companies that the manager believes are available at market prices less than their intrinsic value. The Fund concentrates its investments in securities of issuers such as banks, savings and loan organizations, credit card companies, brokerage firms, finance companies, subprime lending institutions, investment advisors, investment companies and insurance companies.
Performance Overview
The Fund’s Class Z shares delivered a cumulative total return of +11.07% for the 12 months under review. For comparison, the Fund’s narrow benchmark, the Standard & Poor’s 500 (S&P 500) Financials Index, which tracks financials stocks in the S&P 500 Index, generated a +15.20% total return.1 For the same period, the Fund’s broad benchmark, the S&P 500 Index, which is a broad measure of U.S. stock performance, posted a +13.69% total return.1 You can find more of the Fund’s performance data in the Performance Summary beginning on page 8.
Performance data represent past performance, which does not guarantee future results. Investment return and principal value will fluctuate, and you may have a gain or loss when you sell your shares. Current performance may differ from figures shown. Please visit franklintempleton.com or call (800) 342-5236 for most recent month-end performance.
Economic and Market Overview
The global economy grew moderately during 2014 as U.S. economic growth expanded while growth rates in much of the rest of the world declined. U.S. economic activity was supported in some quarters by increased consumer spending, business investment and federal defense spending. The housing market strengthened, and lower gasoline prices and improved job

*Weightings may be negative or may not total 100% due to rounding, use of any derivatives, unsettled trades or other factors.
growth contributed to rising retail sales. The U.S. Federal Reserve Board (Fed) began reducing its large-scale bond purchases $10 billion a month in January and ended the buying program in October. But it continued its practice of maintaining holdings of longer term securities at sizable levels. Toward period-end, the Fed stated that it could be patient with regard to raising interest rates and that the interest rate might not rise for
1. Source: Morningstar.
The indexes are unmanaged and include reinvested dividends. One cannot invest directly in an index, and an index is not representative of the Fund’s portfolio. See www.franklintempletondatasources.com for additional data provider information.
The dollar value, number of shares or principal amount, and names of all portfolio holdings are listed in the Fund’s Statement of Investments (SOI).
The SOI begins on page 19.
franklintempleton.com
Annual Report
| 3
FRANKLIN MUTUAL FINANCIAL SERVICES FUND
at least a couple of meetings, possibly implying at least the first two meetings of 2015.
Outside the U.S., the U.K. economy grew relatively well, supported by the services and manufacturing sectors. In the eurozone, economic growth remained subdued, as concerns persisted about the potential negative impacts to growth from the crisis in Ukraine and China’s moderating growth rate. In June, the European Central Bank (ECB) reduced its main interest rate and, for the first time, set a negative deposit rate; the ECB reduced both rates again in September. The ECB broadened its monetary easing stance by implementing an asset purchase program to prevent deflation and stimulate the economy. Japan’s second- and third-quarter economic contractions indicated the economy was in a recession, although private consumption and exports improved in the third quarter. In October, the Bank of Japan expanded its stimulus measures amid weak domestic demand and as substantially lower crude oil prices exerted further downward pressure on inflation. Near period-end, Japan’s ruling coalition was reelected in early parliamentary elections and subsequently announced a fresh stimulus package aimed at reviving economic growth.
Global developed market stocks, as measured by the MSCI World Index, advanced overall during the 12-month period amid a generally accommodative monetary policy environment and continued strength in corporate earnings. In several emerging markets, economic growth generally moderated. Emerging market stocks overall, as measured by the MSCI Emerging Markets Index, fell for the year, amid headwinds such as soft domestic demand, weak exports, plummeting crude oil prices, regional geopolitical tensions and concerns about possible U.S. interest rate increases. Many emerging market currencies depreciated against the U.S. dollar, leading several central banks to raise interest rates seeking to support their currencies. Several other central banks lowered interest rates to promote economic growth. Gold prices ended the year lower amid benign global inflation and a strong U.S. dollar.
Investment Strategy
We strive to provide investors with superior risk-adjusted returns over time through our distinctive, value investment style, which includes investments in undervalued common stocks, distressed debt and risk arbitrage. Rigorous fundamental analysis drives our investment process. We attempt to determine each investment’s intrinsic value as well as the price at which we would be willing to commit shareholder funds. While valuation remains our key consideration, we utilize numerous fundamental factors such as return on equity,
financial leverage and long-term earnings power. We also consider factors such as management quality and competitive position. As always, our approach to investing is as much about assessing risk and containing losses as it is about achieving profits.
What is return on equity?
Return on equity is an amount, expressed as a percentage, earned on a company’s common stock investment for a given period. Return on equity tells common shareholders how effectually their money is being employed. Comparing percentages for current and prior periods also reveals trends, and comparison with industry composites reveals how well a company is holding its own against its competitors.
In addition, it is our practice to hedge the Fund’s currency exposure when we deem it advantageous for our shareholders.
What is meant by “hedge”?
To hedge an investment is to take a position intended to offset potential losses/gains that may be incurred by a companion financial instrument.
Portfolio Breakdown*
Based on Total Net Assets as of 12/31/14

*Portfolio Breakdown figures are stated as a percentage of total and may not equal 100% or may be negative due to rounding, use of any derivatives, unsettled trades or other factors.
4 | Annual Report
franklintempleton.com
FRANKLIN MUTUAL FINANCIAL SERVICES FUND
Manager’s Discussion
Many Fund holdings increased in value during the 12-month period. Top contributors to performance included insurer Protector Forsikring, brokerage China Galaxy Securities and exchange operator Oslo Bors.
Norwegian insurance company Protector Forsikring reported positive full-year 2013 results in February and provided an upbeat outlook for 2014. The company followed up with positive first-quarter results in May as premiums grew at a solid pace and investment returns exceeded expectations. Protector also raised its full-year guidance for growth and earnings. The company’s strong Nordic franchise allowed it to increase rates, resulting in improved underwriting margins and a higher return on equity. The strong operational performance, in our view, also bolstered the firm’s ability to pay out dividends. We sold our position before year-end.
China Galaxy Securities is a major player in the Chinese brokerage industry with the least exposure to proprietary trading among its peers. The stock rallied in August after the company announced better-than-expected first-half results. Strong gains in investment banking, asset management fees and margin financing income more than offset the deterioration in brokerage commissions; fierce competition has been driving down commission rates. The positive first-half results for 2014 built upon the solid full-year 2013 numbers issued in March. Late in the year, shares of China Galaxy, along with the Chinese equity markets in general, got a boost from a November interest rate cut by the People’s Bank of China. We sought to take advantage of the stock rally and exited our position.
Founded in 1819, Oslo Bors offers the only regulated markets for securities trading in Norway. The exchange company’s stock was supported by strong operating results throughout the year. Overall, Oslo Bors benefited from a combination of higher equity and fixed income trading volumes and effective cost controls in 2014. The market also reacted favorably to the sale of the company’s clearing business. The clearing business accounted for a relatively small portion of earnings and its disposal unlocked a significant amount of capital that the company ultimately distributed to shareholders as a special dividend.
During the period under review, some of the Fund’s investments negatively affected performance. Key detractors included Bank of Piraeus, Hana Financial Group and Storebrand.
Bank of Piraeus is one of the four largest lenders in Greece. Piraeus shares, as well as the overall Greek equity market, tumbled when a political crisis reemerged. On December 9, Greek
Prime Minister Antonis Samaras announced a snap presidential election, to take place on January 25, 2015, which raised fears of the radical leftist party’s potential victory that could lead to an effort to pull Greece out of its international bailout program. In November, the bank also announced poor quarterly results and a surprise 2.2 billion euro loan-loss provision to “put the crisis behind them.” In our view, the earnings potential of the Greek banking industry is considerably higher than recent prices implied, but we anticipate continued stock price volatility in the short term.
South Korea-based Hana Financial Group was hurt by high costs relative to income that arose as a result of its 2012 acquisition of Korea Exchange Bank (KEB). KEB’s union sought to delay efforts to integrate Hana Bank and KEB until 2017 over job security concerns. However, in October, the boards of directors of both banks agreed to accelerate the merger, citing worsening financial conditions. We believe this development may be a catalyst for Hana Financial shares in 2015 as management strives for improved efficiency. While concerns about the ability to maintain net interest margins also weighed on the stock, financial results showed us the fear was unfounded as Hana’s strong positioning and increased focus in the small-to-medium business market provided higher loan yields. We believe that rate cuts in 2014 by the Bank of Korea should eventually be reflected in the net interest margin.
| Top 10 Equity Holdings | ||
| 12/31/14 | ||
| Company | % of Total | |
| Sector/Industry, Country | Net Assets | |
| PartnerRe Ltd. | 2.5 | % |
| Insurance, U.S. | ||
| Direct Line Insurance Group PLC | 2.3 | % |
| Insurance, U.K. | ||
| Wells Fargo & Co. | 2.2 | % |
| Banks, U.S. | ||
| MetLife Inc. | 2.1 | % |
| Insurance, U.S. | ||
| Oslo Bors VPS Holding ASA | 2.0 | % |
| Diversified Financial Services, Norway | ||
| Ageas | 2.0 | % |
| Insurance, Belgium | ||
| China Pacific Insurance (Group) Co. Ltd., H | 2.0 | % |
| Insurance, China | ||
| Zurich Insurance Group AG | 1.9 | % |
| Insurance, Switzerland | ||
| RSA Insurance Group PLC | 1.9 | % |
| Insurance, U.K. | ||
| SunTrust Banks Inc. | 1.9 | % |
| Banks, U.S. |
franklintempleton.com
Annual Report
| 5
FRANKLIN MUTUAL FINANCIAL SERVICES FUND
Norway-based Storebrand provides a variety of insurance and asset management services through its subsidiaries. A decline in 10-year Norwegian government bond yields weighed on Storebrand’s stock price as a significant portion of the company’s business is guaranteed products. Lower yields made it more difficult for insurers to achieve the returns needed to cover guaranteed policies. The company also faced a changing regulatory environment as European Union insurers must meet increased capital requirements laid out in Solvency II regulations. Investor concerns that Storebrand might need to raise capital to meet Solvency II standards also appeared to weigh on the stock despite management’s statements that it was trying hard to avoid such a move. Fundamentally, the company is executing on an internal cost-reduction program. We believe the company is operating well, and we approve of Storebrand’s efforts to move away from guaranteed pensions to less capital-intensive defined contribution plans and unit-linked policies in which policyholders bear the investment return risk.
During the year, the Fund held currency forwards and futures to hedge a portion of the currency risk of the portfolio’s non-U.S. dollar investments. The hedges had a positive impact on the Fund’s performance during the period.
What is a currency forward contract?
A currency forward contract, or a currency forward, is an agreement between the Fund and a counterparty to buy or sell a foreign currency at a specific exchange rate on a future date.
What is a futures contract?
A futures contract, or a future, is an agreement between the Fund and a counterparty made through a U.S. or foreign futures exchange to buy or sell an asset at a specific price on a future date.
CFA® is a trademark owned by CFA Institute.
Thank you for your continued participation in Franklin Mutual Financial Services Fund. We look forward to continuing to serve your investment needs.

The foregoing information reflects our analysis, opinions and portfolio holdings as of December 31, 2014, the end of the reporting period. The way we implement our main investment strategies and the resulting portfolio holdings may change depending on factors such as market and economic conditions. These opinions may not be relied upon as investment advice or an offer for a particular security. The information is not a complete analysis of every aspect of any market, country, industry, security or the Fund. Statements of fact are from sources considered reliable, but the investment manager makes no representation or warranty as to their completeness or accuracy. Although historical performance is no guarantee of future results, these insights may help you understand our investment management philosophy.
6 | Annual Report
franklintempleton.com
Andrew Sleeman has been portfolio manager for Franklin Mutual Financial Services Fund (formerly, Mutual Financial Services Fund) since 2009. He has also been a co-portfolio manager for Franklin Mutual International Fund (formerly, Mutual International Fund) since 2009. Mr. Sleeman joined Franklin Templeton Investments in 2007. Previously, he was with Fox-Pitt, Kelton, a financials specialist firm, where he focused on international financial equities. Prior to that, he worked in international equities at BNP Paribas. Mr. Sleeman also worked in Australia in the fixed income division of JP Morgan Investment Management.
Richard Cetlin has been assistant portfolio manager for Franklin Mutual Financial Services Fund (formerly, Mutual Financial Services Fund) since 2010 with primary coverage of European banks. Prior to joining Franklin Templeton Investments in 2010, Mr. Cetlin was a consultant for Asian Century Quest, a hedge fund focused on the Asia-Pacific region. In this role, he focused on the analysis of banking, insurance and real estate stocks in China and banking stocks in Hong Kong and Korea. Prior to that, Mr. Cetlin worked for 14 years at AllianceBernstein where he was a senior vice president and senior analyst for U.S. banking and specialty finance.
FRANKLIN MUTUAL FINANCIAL SERVICES FUND
Andrew Dinnhaupt has been assistant portfolio manager for Franklin Mutual Financial Services Fund (formerly, Mutual Financial Services Fund) since December 2013 and has been an analyst for Franklin Mutual Advisers since 2011, specializing in the global insurance industry. Previously, Mr. Dinnhaupt was a portfolio manager and senior analyst covering the global financial services sector for RBC Capital Markets. Prior to RBC, Mr. Dinnhaupt worked at several hedge funds where he was responsible for analyzing and managing portfolios in the financial services sector. Before that, he worked at Mitchell Hutchins Asset Management where he covered the financial services industry.
franklintempleton.com
Annual Report
| 7
FRANKLIN MUTUAL FINANCIAL SERVICES FUND
Performance Summary as of December 31, 2014
Your dividend income will vary depending on dividends or interest paid by securities in the Fund’s portfolio, adjusted for operating expenses of each class. Capital gain distributions are net profits realized from the sale of portfolio securities. The performance table and graphs do not reflect any taxes that a shareholder would pay on Fund dividends, capital gain distributions, if any, or any realized gains on the sale of Fund shares. Total return reflects reinvestment of the Fund’s dividends and capital gain distributions, if any, and any unrealized gains or losses.
| Net Asset Value | ||||||
| Share Class (Symbol) | 12/31/14 | 12/31/13 | Change | |||
| Z (TEFAX) | $ | 18.40 | $ | 16.90 | +$ | 1.50 |
| A (TFSIX) | $ | 18.46 | $ | 16.96 | +$ | 1.50 |
| C (TMFSX) | $ | 18.41 | $ | 16.92 | +$ | 1.49 |
| R6 (n/a) | $ | 18.52 | $ | 16.88 | +$ | 1.64 |
| Distributions (1/1/14–12/31/14) | ||||||
| Share Class | Dividend Income | |||||
| Z | $ | 0.3684 | ||||
| A | $ | 0.3134 | ||||
| C | $ | 0.1891 | ||||
| R6 | $ | 0.2749 | ||||
8 | Annual Report
franklintempleton.com
FRANKLIN MUTUAL FINANCIAL SERVICES FUND
PERFORMANCE SUMMARY
Performance as of 12/31/14
Cumulative total return excludes sales charges. Average annual total return and value of $10,000 investment include maximum sales charges. Class Z/R6: no sales charges; Class A: 5.75% maximum initial sales charge; Class C: 1% contingent deferred sales charge in first year only.
| Cumulative | Average Annual | Value of $10,000 | Total Annual Operating Expenses4 | |||||||||
| Share Class | Total Return1 | Total Return2 | Investment3 | (with waiver) | (without waiver) | |||||||
| Z | N/A | 1.16 | % | |||||||||
| 1-Year | + | 11.07 | % | + | 11.07 | % | $ | 11,107 | ||||
| 5-Year | + | 71.48 | % | + | 11.39 | % | $ | 17,148 | ||||
| 10-Year | + | 47.18 | % | + | 3.94 | % | $ | 14,718 | ||||
| A | N/A | 1.46 | % | |||||||||
| 1-Year | + | 10.71 | % | + | 4.37 | % | $ | 10,437 | ||||
| 5-Year | + | 68.80 | % | + | 9.73 | % | $ | 15,907 | ||||
| 10-Year | + | 42.87 | % | + | 3.02 | % | $ | 13,465 | ||||
| C | N/A | 2.16 | % | |||||||||
| 1-Year | + | 9.93 | % | + | 8.93 | % | $ | 10,893 | ||||
| 5-Year | + | 63.03 | % | + | 10.27 | % | $ | 16,303 | ||||
| 10-Year | + | 33.22 | % | + | 2.91 | % | $ | 13,322 | ||||
| R65 | 0.97 | % | 2.18 | % | ||||||||
| 1-Year | + | 11.23 | % | + | 11.23 | % | $ | 11,123 | ||||
| Since Inception (5/1/13) | + | 27.76 | % | + | 15.81 | % | $ | 12,776 | ||||
Performance data represent past performance, which does not guarantee future results. Investment return and principal value will fluctuate, and you may have a gain or loss when you sell your shares. Current performance may differ from figures shown. For most recent month-end performance, go to franklintempleton.com or call (800) 342-5236.
franklintempleton.com
Annual Report
| 9
FRANKLIN MUTUAL FINANCIAL SERVICES FUND
PERFORMANCE SUMMARY
Total Return Index Comparison for a Hypothetical $10,000 Investment
Total return represents the change in value of an investment over the periods shown. It includes any applicable maximum sales charge, Fund expenses, account fees and reinvested distributions. The unmanaged index includes reinvestment of any income or distributions. It differs from the Fund in composition and does not pay management fees or expenses. One cannot invest directly in an index.
| 10 | | | Annual Report | franklintempleton.com |
FRANKLIN MUTUAL FINANCIAL SERVICES FUND
PERFORMANCE SUMMARY
Total Return Index Comparison for a Hypothetical $10,000 Investment (continued)

franklintempleton.com
Annual Report
| 11
FRANKLIN MUTUAL FINANCIAL SERVICES FUND
PERFORMANCE SUMMARY
All investments involve risks, including possible loss of principal. Value securities may not increase in price as anticipated or may decline further in value. Investing in a single-sector fund involves special risks, including greater sensitivity to economic, political or regulatory developments impacting the sector. In addition, the Fund invests in foreign securities whose risks include currency fluctuations, and economic and political uncertainties. The Fund’s investments in smaller company stocks carry an increased risk of price fluctuation, particularly over the short term. The Fund may also invest in companies engaged in mergers, reorganizations or liquidations, which involve special risks as pending deals may not be completed on time or on favorable terms, as well as lower rated bonds, which entail higher credit risk. The Fund is actively managed but there is no guarantee that the manager’s investment decisions will produce the desired results. The Fund’s prospectus also includes a description of the main investment risks.
Class Z: Shares are available to certain eligible investors as described in the prospectus.
Class C: These shares have higher annual fees and expenses than Class A shares.
Class R6: Shares are available to certain eligible investors as described in the prospectus.
1. Cumulative total return represents the change in value of an investment over the periods indicated.
2. Average annual total return represents the average annual change in value of an investment over the periods indicated.
3. These figures represent the value of a hypothetical $10,000 investment in the Fund over the periods indicated.
4. Figures are as stated in the Fund’s current prospectus. In periods of market volatility, assets may decline significantly, causing total annual Fund operating expenses to
become higher than the figures shown.
5. Class R6 shares have a fee waiver contractually guaranteed through at least 4/30/15. Investment results reflect the fee waiver, to the extent applicable; without this
reduction, the results would have been lower.
6. Source: Morningstar. The S&P 500 is a market capitalization-weighted index of 500 stocks designed to measure total U.S. equity market performance. The S&P 500
Financials Index is market capitalization-weighted and consists of all financial stocks in the S&P 500 Index.
See www.franklintempletondatasources.com for additional data provider information.
12 | Annual Report
franklintempleton.com
FRANKLIN MUTUAL FINANCIAL SERVICES FUND
Your Fund’s Expenses
As a Fund shareholder, you can incur two types of costs:
• Transaction costs, including sales charges (loads) on Fund
purchases; and
• Ongoing Fund costs, including management fees, distribution
and service (12b-1) fees, and other Fund expenses. All
mutual funds have ongoing costs, sometimes referred to as
operating expenses.
The following table shows ongoing costs of investing in the Fund and can help you understand these costs and compare them with those of other mutual funds. The table assumes a $1,000 investment held for the six months indicated.
Actual Fund Expenses
The first line (Actual) for each share class listed in the table provides actual account values and expenses. The “Ending Account Value” is derived from the Fund’s actual return, which includes the effect of Fund expenses.
You can estimate the expenses you paid during the period by following these steps. Of course, your account value and expenses will differ from those in this illustration:
1. Divide your account value by $1,000.
If an account had an $8,600 value,
then $8,600 ÷ $1,000 = 8.6.
2. Multiply the result by the number under the heading
“Expenses Paid During Period.”
If Expenses Paid During Period were $7.50,
then 8.6 x $7.50 = $64.50.
In this illustration, the estimated expenses paid this period are $64.50.
Hypothetical Example for Comparison with Other Funds
Information in the second line (Hypothetical) for each class in the table can help you compare ongoing costs of investing in the Fund with those of other mutual funds. This information may not be used to estimate the actual ending account balance or expenses you paid during the period. The hypothetical “Ending Account Value” is based on the actual expense ratio for each class and an assumed 5% annual rate of return before expenses, which does not represent the Fund’s actual return. The figure under the heading “Expenses Paid During Period” shows the hypothetical expenses your account would have incurred under this scenario. You can compare this figure with the 5% hypothetical examples that appear in shareholder reports of other funds.
Please note that expenses shown in the table are meant to highlight ongoing costs and do not reflect any transaction costs, such as sales charges. Therefore, the second line for each class is useful in comparing ongoing costs only, and will not help you compare total costs of owning different funds. In addition, if transaction costs were included, your total costs would have been higher. Please refer to the Fund prospectus for additional information on operating expenses.
franklintempleton.com
Annual Report
| 13
| FRANKLIN MUTUAL FINANCIAL SERVICES FUND | ||||||
| YOUR FUND’S EXPENSES | ||||||
| Beginning Account | Ending Account | Expenses Paid During | ||||
| Share Class | Value 7/1/14 | Value 12/31/14 | Period* 7/1/14–12/31/14 | |||
| Z | ||||||
| Actual | $ | 1,000 | $ | 1,064.70 | $ | 5.93 |
| Hypothetical (5% return before expenses) | $ | 1,000 | $ | 1,019.46 | $ | 5.80 |
| A | ||||||
| Actual | $ | 1,000 | $ | 1,062.60 | $ | 7.49 |
| Hypothetical (5% return before expenses) | $ | 1,000 | $ | 1,017.95 | $ | 7.32 |
| C | ||||||
| Actual | $ | 1,000 | $ | 1,058.70 | $ | 11.10 |
| Hypothetical (5% return before expenses) | $ | 1,000 | $ | 1,014.42 | $ | 10.87 |
| R6 | ||||||
| Actual | $ | 1,000 | $ | 1,065.00 | $ | 5.05 |
| Hypothetical (5% return before expenses) | $ | 1,000 | $ | 1,020.32 | $ | 4.94 |
*Expenses are calculated using the most recent six-month expense ratio, annualized for each class (Z: 1.14%; A: 1.44%; C: 2.14%; and R6: 0.97% (net of expense waivers)), multiplied by the average account value over the period, multiplied by 184/365 to reflect the one-half year period.
14 | Annual Report
franklintempleton.com
| FRANKLIN MUTUAL FINANCIAL SERVICES FUND | |||||||||||||||
| Financial Highlights | |||||||||||||||
| Year Ended December 31, | |||||||||||||||
| 2014 | 2013 | 2012 | 2011 | 2010 | |||||||||||
| Class Z | |||||||||||||||
| Per share operating performance | |||||||||||||||
| (for a share outstanding throughout the year) | |||||||||||||||
| Net asset value, beginning of year | $ | 16.90 | $ | 13.59 | $ | 11.53 | $ | 13.01 | $ | 12.05 | |||||
| Income from investment operationsa: | |||||||||||||||
| Net investment incomeb | 0.25 | 0.24 | 0.20 | 0.28 | 0.26 | ||||||||||
| Net realized and unrealized gains (losses) | 1.62 | 3.24 | 2.09 | (1.48 | ) | 1.27 | |||||||||
| Total from investment operations | 1.87 | 3.48 | 2.29 | (1.20 | ) | 1.53 | |||||||||
| Less distributions from net investment income | (0.37 | ) | (0.17 | ) | (0.23 | ) | (0.28 | ) | (0.57 | ) | |||||
| Net asset value, end of year | $ | 18.40 | $ | 16.90 | $ | 13.59 | $ | 11.53 | $ | 13.01 | |||||
| Total return | 11.07 | % | 25.67 | % | 19.98 | % | (9.26 | )% | 12.84 | % | |||||
| Ratios to average net assets | |||||||||||||||
| Expenses | 1.14 | %c | 1.16 | %c | 1.24 | % | 1.24 | % | 1.28 | % | |||||
| Net investment income | 1.44 | % | 1.51 | % | 1.56 | % | 2.22 | % | 2.07 | % | |||||
| Supplemental data | |||||||||||||||
| Net assets, end of year (000’s) | $ | 112,156 | $ | 105,279 | $ | 86,519 | $ | 80,105 | $ | 97,487 | |||||
| Portfolio turnover rate | 33.69 | % | 25.73 | % | 12.65 | % | 23.58 | % | 35.37 | % | |||||
aThe amount shown for a share outstanding throughout the period may not correlate with the Statement of Operations for the period due to the timing of sales and
repurchases of the Fund shares in relation to income earned and/or fluctuating fair value of the investments of the Fund.
bBased on average daily shares outstanding.
cBenefit of expense reduction rounds to less than 0.01%.
franklintempleton.com
The accompanying notes are an integral part of these financial statements. | Annual Report | 15
FRANKLIN MUTUAL FINANCIAL SERVICES FUND
FINANCIAL HIGHLIGHTS
| Year Ended December 31, | |||||||||||||||
| 2014 | 2013 | 2012 | 2011 | 2010 | |||||||||||
| Class A | |||||||||||||||
| Per share operating performance | |||||||||||||||
| (for a share outstanding throughout the year) | |||||||||||||||
| Net asset value, beginning of year | $ | 16.96 | $ | 13.64 | $ | 11.57 | $ | 13.05 | $ | 12.09 | |||||
| Income from investment operationsa: | |||||||||||||||
| Net investment incomeb | 0.20 | 0.19 | 0.16 | 0.25 | 0.22 | ||||||||||
| Net realized and unrealized gains (losses) | 1.61 | 3.26 | 2.10 | (1.49 | ) | 1.27 | |||||||||
| Total from investment operations | 1.81 | 3.45 | 2.26 | (1.24 | ) | 1.49 | |||||||||
| Less distributions from net investment income | (0.31 | ) | (0.13 | ) | (0.19 | ) | (0.24 | ) | (0.53 | ) | |||||
| Net asset value, end of year | $ | 18.46 | $ | 16.96 | $ | 13.64 | $ | 11.57 | $ | 13.05 | |||||
| Total returnc | 10.71 | % | 25.32 | % | 19.55 | % | (9.49 | )% | 12.45 | % | |||||
| Ratios to average net assets | |||||||||||||||
| Expenses | 1.44 | %d | 1.46 | %d | 1.54 | % | 1.54 | % | 1.58 | % | |||||
| Net investment income | 1.14 | % | 1.21 | % | 1.26 | % | 1.92 | % | 1.77 | % | |||||
| Supplemental data | |||||||||||||||
| Net assets, end of year (000’s) | $ | 255,242 | $ | 240,529 | $ | 184,681 | $ | 173,167 | $ | 226,172 | |||||
| Portfolio turnover rate | 33.69 | % | 25.73 | % | 12.65 | % | 23.58 | % | 35.37 | % | |||||
aThe amount shown for a share outstanding throughout the period may not correlate with the Statement of Operations for the period due to the timing of sales and
repurchases of the Fund shares in relation to income earned and/or fluctuating fair value of the investments of the Fund.
bBased on average daily shares outstanding.
cTotal return does not reflect sales commissions or contingent deferred sales charges, if applicable.
dBenefit of expense reduction rounds to less than 0.01%.
16 | Annual Report | The accompanying notes are an integral part of these financial statements.
franklintempleton.com
FRANKLIN MUTUAL FINANCIAL SERVICES FUND
FINANCIAL HIGHLIGHTS
| Year Ended December 31, | |||||||||||||||
| 2014 | 2013 | 2012 | 2011 | 2010 | |||||||||||
| Class C | |||||||||||||||
| Per share operating performance | |||||||||||||||
| (for a share outstanding throughout the year) | |||||||||||||||
| Net asset value, beginning of year | $ | 16.92 | $ | 13.61 | $ | 11.55 | $ | 13.01 | $ | 12.05 | |||||
| Income from investment operationsa: | |||||||||||||||
| Net investment incomeb | 0.08 | 0.08 | 0.07 | 0.16 | 0.13 | ||||||||||
| Net realized and unrealized gains (losses) | 1.60 | 3.25 | 2.08 | (1.48 | ) | 1.26 | |||||||||
| Total from investment operations | 1.68 | 3.33 | 2.15 | (1.32 | ) | 1.39 | |||||||||
| Less distributions from net investment income | (0.19 | ) | (0.02 | ) | (0.09 | ) | (0.14 | ) | (0.43 | ) | |||||
| Net asset value, end of year | $ | 18.41 | $ | 16.92 | $ | 13.61 | $ | 11.55 | $ | 13.01 | |||||
| Total returnc | 9.93 | % | 24.50 | % | 18.67 | % | (10.13 | )% | 11.69 | % | |||||
| Ratios to average net assets | |||||||||||||||
| Expenses | 2.14 | %d | 2.16 | %d | 2.24 | % | 2.24 | % | 2.28 | % | |||||
| Net investment income | 0.44 | % | 0.51 | % | 0.56 | % | 1.22 | % | 1.07 | % | |||||
| Supplemental data | |||||||||||||||
| Net assets, end of year (000’s) | $ | 89,341 | $ | 86,370 | $ | 69,046 | $ | 68,324 | $ | 89,989 | |||||
| Portfolio turnover rate | 33.69 | % | 25.73 | % | 12.65 | % | 23.58 | % | 35.37 | % | |||||
aThe amount shown for a share outstanding throughout the period may not correlate with the Statement of Operations for the period due to the timing of sales and
repurchases of the Fund shares in relation to income earned and/or fluctuating fair value of the investments of the Fund.
bBased on average daily shares outstanding.
cTotal return does not reflect sales commissions or contingent deferred sales charges, if applicable.
dBenefit of expense reduction rounds to less than 0.01%.
franklintempleton.com
The accompanying notes are an integral part of these financial statements. | Annual Report | 17
FRANKLIN MUTUAL FINANCIAL SERVICES FUND
FINANCIAL HIGHLIGHTS
| Year Ended December 31, | ||||||
| 2014 | 2013 | a | ||||
| Class R6 | ||||||
| Per share operating performance | ||||||
| (for a share outstanding throughout the year) | ||||||
| Net asset value, beginning of year | $ | 16.88 | $ | 14.89 | ||
| Income from investment operationsb: | ||||||
| Net investment incomec | 0.25 | 0.13 | ||||
| Net realized and unrealized gains (losses) | 1.66 | 2.07 | ||||
| Total from investment operations | 1.91 | 2.20 | ||||
| Less distributions from net investment income | (0.27 | ) | (0.21 | ) | ||
| Net asset value, end of year | $ | 18.52 | $ | 16.88 | ||
| Total returnd | 11.23 | % | 14.86 | % | ||
| Ratios to average net assetse | ||||||
| Expenses before waiver, payment by affiliates and expense reduction | 2.61 | % | 2.18 | % | ||
| Expenses net of waiver, payment by affiliates and expense reductionf | 0.97 | % | 0.97 | % | ||
| Net investment income | 1.61 | % | 1.70 | % | ||
| Supplemental data | ||||||
| Net assets, end of year (000’s) | $ | 12 | $ | 6 | ||
| Portfolio turnover rate | 33.69 | % | 25.73 | % | ||
aFor the May 1, 2013 (effective date) to December 31, 2013.
bThe amount shown for a share outstanding throughout the period may not correlate with the Statement of Operations for the period due to the timing of sales and
repurchases of the Fund shares in relation to income earned and/or fluctuating fair value of the investments of the Fund.
cBased on average daily shares outstanding.
dTotal return is not annualized for periods less than one year.
eRatios are annualized for periods less than one year.
fBenefit of expense reduction rounds to less than 0.01%.
18 | Annual Report | The accompanying notes are an integral part of these financial statements.
franklintempleton.com
FRANKLIN MUTUAL FINANCIAL SERVICES FUND
| Statement of Investments, December 31, 2014 | ||||
| Country | Shares/Units | Value | ||
| Common Stocks and Other Equity Interests 86.9% | ||||
| Banks 31.6% | ||||
| a,bAB&T Financial Corp. | United States | 226,100 | $ | 72,352 |
| Bank of China Ltd., H | China | 8,288,000 | 4,670,982 | |
| Barclays PLC | United Kingdom | 1,522,675 | 5,779,213 | |
| BB&T Corp. | United States | 85,130 | 3,310,706 | |
| BNP Paribas SA | France | 71,270 | 4,248,020 | |
| aCapital Bank Financial Corp., A | United States | 42,649 | 1,142,993 | |
| a,cCapital Bank Financial Corp., B, 144A, non-voting | United States | 153,021 | 4,100,963 | |
| CIT Group Inc. | United States | 162,740 | 7,783,854 | |
| Citigroup Inc. | United States | 83,399 | 4,512,720 | |
| Citizens Financial Group Inc. | United States | 152,816 | 3,799,006 | |
| Columbia Banking System Inc. | United States | 259,504 | 7,164,905 | |
| aFCB Financial Holdings Inc., A | United States | 286,469 | 7,058,596 | |
| Guaranty Bancorp | United States | 266,761 | 3,852,029 | |
| Hana Financial Group Inc. | South Korea | 162,646 | 4,758,514 | |
| HSBC Holdings PLC | United Kingdom | 561,180 | 5,323,492 | |
| Industrial and Commercial Bank of China Ltd., H | China | 11,794,999 | 8,609,766 | |
| aING Groep NV, IDR | Netherlands | 616,569 | 8,079,705 | |
| JPMorgan Chase & Co. | United States | 108,420 | 6,784,924 | |
| KB Financial Group Inc. | South Korea | 163,888 | 5,416,683 | |
| aNational Bank of Greece SA | Greece | 1,114,960 | 1,983,179 | |
| aPiraeus Bank SA | Greece | 3,163,660 | 3,483,506 | |
| PNC Financial Services Group Inc. | United States | 78,520 | 7,163,379 | |
| aSeacoast Banking Corp. of Florida | United States | 227,309 | 3,125,499 | |
| Southern National Bancorp of Virginia Inc. | United States | 547,560 | 6,187,428 | |
| State Bank Financial Corp. | United States | 137,860 | 2,754,443 | |
| SunTrust Banks Inc. | United States | 209,110 | 8,761,709 | |
| UniCredit SpA | Italy | 625,394 | 4,037,137 | |
| Wells Fargo & Co. | United States | 186,280 | 10,211,869 | |
| 144,177,572 | ||||
| Capital Markets 5.1% | ||||
| a,dAnima Holding SpA, Reg S | Italy | 832,620 | 4,195,106 | |
| Credit Suisse Group AG | Switzerland | 178,523 | 4,503,477 | |
| Sun Hung Kai & Co. Ltd. | Hong Kong | 9,193,704 | 7,019,226 | |
| UBS Group AG | Switzerland | 434,420 | 7,467,549 | |
| 23,185,358 | ||||
| Consumer Finance 1.0% | ||||
| aAlly Financial Inc. | United States | 200,630 | 4,738,881 | |
| Diversified Financial Services 3.3% | ||||
| First Pacific Co. Ltd. | Hong Kong | 5,774,902 | 5,719,827 | |
| Oslo Bors VPS Holding ASA | Norway | 911,000 | 9,267,300 | |
| 14,987,127 | ||||
| Insurance 40.9% | ||||
| ACE Ltd. | United States | 74,640 | 8,574,643 | |
| Ageas | Belgium | 256,999 | 9,175,134 | |
| aAlleghany Corp. | United States | 12,747 | 5,908,235 | |
| The Allstate Corp. | United States | 113,416 | 7,967,474 | |
| American International Group Inc. | United States | 154,888 | 8,675,277 | |
| Argo Group International Holdings Ltd. | United States | 105,712 | 5,863,845 | |
| Assicurazioni Generali SpA | Italy | 222,390 | 4,574,562 | |
| aAvivaSA Emeklilik ve Hayat AS | Turkey | 178,443 | 3,421,744 | |
| franklintempleton.com | Annual Report | 19 | |||
FRANKLIN MUTUAL FINANCIAL SERVICES FUND
STATEMENT OF INVESTMENTS
| Country | Shares/Units | Value | ||
| Common Stocks and Other Equity Interests (continued) | ||||
| Insurance (continued) | ||||
| Catlin Group Ltd. | United Kingdom | 334,038 | $ | 3,493,662 |
| China Pacific Insurance (Group) Co. Ltd., H | China | 1,810,515 | 9,141,362 | |
| CNO Financial Group Inc. | United States | 236,780 | 4,077,352 | |
| Direct Line Insurance Group PLC | United Kingdom | 2,361,659 | 10,723,096 | |
| aEnstar Group Ltd. | United States | 34,879 | 5,332,650 | |
| Friends Life Group Ltd. | United Kingdom | 846,049 | 4,829,213 | |
| Korean Reinsurance Co. | South Korea | 600,118 | 5,925,682 | |
| Lancashire Holdings Ltd. | United Kingdom | 503,377 | 4,393,837 | |
| Maiden Holdings Ltd. | United States | 496,740 | 6,353,305 | |
| MetLife Inc. | United States | 177,140 | 9,581,503 | |
| aNN Group NV | Netherlands | 96,365 | 2,896,968 | |
| a,cNN Group NV, 144A | Netherlands | 139,582 | 4,196,177 | |
| a,eOlympus Re Holdings Ltd. | United States | 7,480 | — | |
| PartnerRe Ltd. | United States | 101,330 | 11,564,793 | |
| PICC Property and Casualty Co. Ltd., H | China | 3,937,174 | 7,657,076 | |
| aRSA Insurance Group PLC | United Kingdom | 1,294,581 | 8,777,705 | |
| Samsung Life Insurance Co. Ltd. | South Korea | 22,315 | 2,376,845 | |
| State National Cos. Inc. | United States | 38,710 | 463,746 | |
| cState National Cos. Inc., 144A | United States | 350,000 | 4,193,000 | |
| aStorebrand ASA | Norway | 1,200,174 | 4,690,815 | |
| UNIQA Insurance Group AG | Austria | 564,365 | 5,310,770 | |
| White Mountains Insurance Group Ltd. | United States | 12,068 | 7,604,167 | |
| Zurich Insurance Group AG | Switzerland | 28,050 | 8,794,191 | |
| 186,538,829 | ||||
| Real Estate Investment Trusts (REITs) 0.9% | ||||
| Hibernia REIT PLC | Ireland | 3,262,857 | 4,283,642 | |
| Real Estate Management & Development 2.6% | ||||
| Dalian Wanda Commercial Properties Co. Ltd., H | China | 887,600 | 5,649,128 | |
| aDolphin Capital Investors Ltd. | Greece | 3,979,650 | 1,721,355 | |
| Takara Leben Co. Ltd. | Japan | 1,006,200 | 4,408,554 | |
| 11,779,037 | ||||
| Thrifts & Mortgage Finance 1.5% | ||||
| Cape Bancorp Inc. | United States | 264,663 | 2,490,479 | |
| Genworth Mortgage Insurance Australia Ltd. | Australia | 1,496,278 | 4,447,028 | |
| 6,937,507 | ||||
| Total Common Stocks and Other Equity Interests | ||||
| (Cost $341,542,808) | 396,627,953 | |||
| Convertible Preferred Stocks (Cost $122,400) 0.1% | ||||
| Banks 0.1% | ||||
| Columbia Banking System Inc., cvt. pfd., B | United States | 1,224 | 393,910 | |
| Preferred Stocks 1.2% | ||||
| Diversified Financial Services 1.2% | ||||
| a,eHightower Holding LLC, pfd., A | United States | 3,000,000 | 3,244,500 | |
| a,eHightower Holding LLC, pfd., A, Series 2 | United States | 968,000 | 2,251,955 | |
| Total Preferred Stocks (Cost $4,782,324) | 5,496,455 | |||
20 | Annual Report
franklintempleton.com
FRANKLIN MUTUAL FINANCIAL SERVICES FUND
STATEMENT OF INVESTMENTS
| Principal | |||||
| Country | Amount* | Value | |||
| Corporate Bonds (Cost $1,158,755) 0.2% | |||||
| c,fBaggot Securities Ltd., secured bond, 144A, 10.24%, Perpetual | Ireland | 816,000 | EUR | $ | 1,034,329 |
| Shares | |||||
| Companies in Liquidation 0.4% | |||||
| a,eFIM Coinvestor Holdings I, LLC | United States | 4,357,178 | — | ||
| a,gLehman Brothers Holdings Inc., Bankruptcy Claim | United States | 7,766,103 | 1,941,526 | ||
| Total Companies in Liquidation (Cost $2,163,564) | 1,941,526 | ||||
| Total Investments before Short Term Investments | |||||
| (Cost $349,769,851) | 405,494,173 | ||||
| Principal | |||||
| Amount* | |||||
| Short Term Investments 8.2% | |||||
| U.S. Government and Agency Securities 8.2% | |||||
| hFHLB, 1/02/15 | United States | 500,000 | 500,000 | ||
| hU.S. Treasury Bills, | |||||
| 1/02/15 | United States | 18,900,000 | 18,900,000 | ||
| i 2/12/15 - 7/02/15 | United States | 18,200,000 | 18,198,314 | ||
| Total U.S. Government and Agency Securities | |||||
| (Cost $37,597,610) | 37,598,314 | ||||
| Total Investments (Cost $387,367,461) 97.0% | 443,092,487 | ||||
| Other Assets, less Liabilities 3.0% | 13,659,553 | ||||
| Net Assets 100.0% | $ | 456,752,040 | |||
*The principal amount is stated in U.S. dollars unless otherwise indicated.
aNon-income producing.
bSee Note 10 regarding holdings of 5% voting securities.
cSecurity was purchased pursuant to Rule 144A under the Securities Act of 1933 and may be sold in transactions exempt from registration only to qualified institutional buyers
or in a public offering registered under the Securities Act of 1933. These securities have been deemed liquid under guidelines approved by the Trust’s Board of Trustees. At
December 31, 2014, the aggregate value of these securities was $13,524,469, representing 2.96% of net assets.
dSecurity was purchased pursuant to Regulation S under the Securities Act of 1933, which exempts from registration securities offered and sold outside of the United States.
Such a security cannot be sold in the United States without either an effective registration statement filed pursuant to the Securities Act of 1933, or pursuant to an exemption
from registration. This security has been deemed liquid under guidelines approved by the Trust’s Board of Trustees. At December 31, 2014, the value of this security was
$4,195,106, representing 0.92% of net assets.
eSee Note 8 regarding restricted securities.
fPerpetual security with no stated maturity date.
gBankruptcy claims represent the right to receive distributions, if any, during the liquidation of the underlying pool of assets. Shares represent amount of allowed unsecured claims.
hThe security is traded on a discount basis with no stated coupon rate.
iSecurity or a portion of the security has been pledged as collateral for open futures contracts. At December 31, 2014, the value of this security and/or cash pledged as collateral
was $350,965, representing 0.08% of net assets.
franklintempleton.com
Annual Report
| 21
| FRANKLIN MUTUAL FINANCIAL SERVICES FUND | ||||||||||||
| STATEMENT OF INVESTMENTS | ||||||||||||
| At December 31, 2014, the Fund had the following futures contracts outstanding. See Note 1(c). | ||||||||||||
| Futures Contracts | ||||||||||||
| Number of | Notional Expiration | Unrealized | Unrealized | |||||||||
| Description | Type Contracts | Value | Date | Appreciation | Depreciation | |||||||
| Currency Contracts | ||||||||||||
| EUR/USD | Short | 76 | $ | 11,501,650 | 3/16/15 | $ | 279,598 | $ | — | |||
| GBP/USD | Short | 112 | 10,899,000 | 3/16/15 | 63,511 | — | ||||||
| Unrealized appreciation (depreciation) | 343,109 | — | ||||||||||
| Net unrealized appreciation (depreciation) | $ | 343,109 | ||||||||||
| At December 31, 2014, the Fund had the following forward exchange contracts outstanding. See Note 1(c). | ||||||||||||
| Forward Exchange Contracts | ||||||||||||
| Contract | Settlement | Unrealized | Unrealized | |||||||||
| Currency | Counterpartya Type | Quantity | Amount | Date Appreciation Depreciation | ||||||||
| Euro | BANT | Buy | 208,796 | $ | 260,964 | 1/20/15 | $ | — | $ | (8,265 | ) | |
| Euro | BANT | Sell | 3,094,348 | 4,007,256 | 1/20/15 | 262,265 | — | |||||
| Euro | BONY | Buy | 130,428 | 162,729 | 1/20/15 | — | (4,876 | ) | ||||
| Euro | BONY | Sell | 4,237,194 | 5,365,855 | 1/20/15 | 237,715 | — | |||||
| Euro | FBCO | Buy | 153,758 | 192,321 | 1/20/15 | — | (6,233 | ) | ||||
| Euro | FBCO | Sell | 861,227 | 1,154,110 | 1/20/15 | 111,795 | — | |||||
| Euro | DBFX | Buy | 452,674 | 565,207 | 1/20/15 | — | (17,350 | ) | ||||
| Euro | DBFX | Sell | 85,456 | 112,914 | 1/20/15 | 9,490 | — | |||||
| Euro | HSBC | Buy | 359,809 | 448,876 | 1/20/15 | — | (13,411 | ) | ||||
| Euro | HSBC | Sell | 729,149 | 973,306 | 1/20/15 | 90,841 | — | |||||
| Euro | SCBT | Sell | 42,533 | 56,213 | 1/20/15 | 4,737 | — | |||||
| Euro | SSBT | Buy | 1,477,680 | 1,835,550 | 1/20/15 | — | (47,161 | ) | ||||
| Euro | SSBT | Sell | 288,931 | 373,696 | 1/20/15 | 24,011 | — | |||||
| British Pound | BANT | Buy | 113,499 | 189,878 | 1/21/15 | — | (12,997 | ) | ||||
| British Pound | DBFX | Sell | 1,746,453 | 2,980,724 | 1/21/15 | 258,987 | — | |||||
| British Pound | HSBC | Buy | 40,563 | 68,156 | 1/21/15 | — | (4,941 | ) | ||||
| British Pound | HSBC | Sell | 1,247,467 | 2,128,179 | 1/21/15 | 184,080 | — | |||||
| British Pound | SSBT | Buy | 81,129 | 136,348 | 1/21/15 | — | (9,913 | ) | ||||
| British Pound | SSBT | Sell | 1,645,341 | 2,808,268 | 1/21/15 | 244,108 | — | |||||
| South Korean Won | BANT | Sell | 7,347,881,915 | 7,021,181 | 2/12/15 | 317,663 | — | |||||
| South Korean Won | BONY | Sell | 461,870,740 | 447,534 | 2/12/15 | 26,167 | — | |||||
| South Korean Won | FBCO | Buy | 74,063,828 | 67,762 | 2/12/15 | — | (193 | ) | ||||
| South Korean Won | FBCO | Sell | 8,004,822,255 | 7,714,270 | 2/12/15 | 411,422 | — | |||||
| South Korean Won | HSBC | Buy | 3,705,853,065 | 3,439,788 | 2/12/15 | 14,888 | (73,804 | ) | ||||
| South Korean Won | HSBC | Sell | 8,175,537,083 | 7,931,835 | 2/12/15 | 473,243 | — | |||||
| Swiss Franc | BANT | Buy | 146,575 | 151,546 | 2/12/15 | — | (4,006 | ) | ||||
| Swiss Franc | BANT | Sell | 1,937,069 | 2,079,364 | 2/12/15 | 129,536 | — | |||||
| Swiss Franc | BONY | Sell | 266,655 | 280,268 | 2/12/15 | 11,856 | — | |||||
| Swiss Franc | FBCO | Buy | 10,521 | 11,242 | 2/12/15 | — | (651 | ) | ||||
| Swiss Franc | FBCO | Sell | 5,304,835 | 5,589,467 | 2/12/15 | 249,690 | — | |||||
| Swiss Franc | DBFX | Buy | 106,298 | 110,662 | 2/12/15 | — | (3,663 | ) | ||||
| Swiss Franc | DBFX | Sell | 767,692 | 797,404 | 2/12/15 | 24,656 | — | |||||
| Swiss Franc | HSBC | Buy | 43,433 | 44,902 | 2/12/15 | — | (1,183 | ) | ||||
| Swiss Franc | HSBC | Sell | 210,670 | 215,636 | 2/12/15 | 3,578 | — | |||||
| Swiss Franc | SSBT | Buy | 89,507 | 93,209 | 2/12/15 | — | (3,113 | ) | ||||
| Swiss Franc | SSBT | Sell | 497,285 | 521,695 | 2/12/15 | 21,134 | — | |||||
| British Pound | BANT | Buy | 49,424 | 78,636 | 2/19/15 | — | (1,629 | ) | ||||
| British Pound | BANT | Sell | 1,752,871 | 2,913,847 | 2/19/15 | 182,720 | — | |||||
| British Pound | BBU | Buy | 8,986 | 14,273 | 2/19/15 | — | (272 | ) | ||||
| 22 | Annual Report | franklintempleton.com | |||||||||||
FRANKLIN MUTUAL FINANCIAL SERVICES FUND
STATEMENT OF INVESTMENTS
| Forward Exchange Contracts (continued) | |||||||||||
| Contract | Settlement | Unrealized | Unrealized | ||||||||
| Currency | Counterpartya Type | Quantity | Amount | Date Appreciation Depreciation | |||||||
| British Pound | BONY | Sell | 173,671 | $ | 277,540 | 2/19/15 | $ | 6,945 | $ | — | |
| British Pound | FBCO | Buy | 44,929 | 71,585 | 2/19/15 | — | (1,582 | ) | |||
| British Pound | FBCO | Sell | 1,752,875 | 2,914,573 | 2/19/15 | 183,440 | — | ||||
| British Pound | DBFX | Buy | 145,297 | 228,805 | 2/19/15 | — | (2,419 | ) | |||
| British Pound | HSBC | Buy | 26,287 | 41,793 | 2/19/15 | — | (835 | ) | |||
| British Pound | HSBC | Sell | 267,680 | 433,163 | 2/19/15 | 16,094 | — | ||||
| British Pound | SCBT | Sell | 170,508 | 277,906 | 2/19/15 | 12,239 | — | ||||
| British Pound | SSBT | Buy | 100,938 | 158,681 | 2/19/15 | — | (1,411 | ) | |||
| British Pound | SSBT | Sell | 1,967,457 | 3,261,302 | 2/19/15 | 195,832 | — | ||||
| Australian Dollar | HSBC | Sell | 5,446,380 | 4,436,199 | 2/23/15 | 7,540 | (1,075 | ) | |||
| Euro | BANT | Sell | 544,226 | 707,052 | 2/27/15 | 48,187 | — | ||||
| Euro | BONY | Sell | 101,854 | 133,947 | 2/27/15 | 10,638 | — | ||||
| Euro | FBCO | Sell | 22,102 | 28,733 | 2/27/15 | 1,976 | — | ||||
| Euro | DBFX | Sell | 4,140,803 | 5,446,032 | 2/27/15 | 432,979 | — | ||||
| Euro | HSBC | Sell | 43,004 | 55,876 | 2/27/15 | 3,814 | — | ||||
| Euro | SCBT | Sell | 46,603 | 60,516 | 2/27/15 | 4,097 | — | ||||
| Euro | SSBT | Sell | 1,528,965 | 1,940,479 | 2/27/15 | 89,441 | — | ||||
| Euro | BANT | Sell | 1,025,529 | 1,285,985 | 4/16/15 | 43,864 | — | ||||
| Euro | BBU | Sell | 15,774 | 20,005 | 4/16/15 | 900 | — | ||||
| Euro | FBCO | Sell | 265,592 | 330,071 | 4/16/15 | 8,387 | — | ||||
| Euro | DBFX | Sell | 2,638,881 | 3,353,868 | 4/16/15 | 157,654 | — | ||||
| Euro | HSBC | Sell | 391,564 | 491,050 | 4/16/15 | 16,787 | — | ||||
| Euro | SSBT | Sell | 411,933 | 520,734 | 4/16/15 | 21,800 | — | ||||
| British Pound | HSBC | Sell | 3,283,245 | 5,286,024 | 4/22/15 | 173,171 | — | ||||
| British Pound | SCBT | Sell | 3,658,941 | 5,894,554 | 4/22/15 | 196,645 | — | ||||
| British Pound | SSBT | Buy | 1,007,000 | 1,574,912 | 4/22/15 | — | (6,755 | ) | |||
| Japanese Yen | BONY | Sell | 554,838,137 | 5,202,103 | 4/22/15 | 566,571 | — | ||||
| Japanese Yen | FBCO | Buy | 12,720,195 | 107,445 | 4/22/15 | — | (1,171 | ) | |||
| Japanese Yen | FBCO | Sell | 84,817,061 | 739,803 | 4/22/15 | 31,178 | — | ||||
| Japanese Yen | DBFX | Buy | 150,862,283 | 1,280,269 | 4/22/15 | — | (19,853 | ) | |||
| Japanese Yen | DBFX | Sell | 33,919,430 | 313,854 | 4/22/15 | 30,466 | — | ||||
| Japanese Yen | HSBC | Buy | 92,383,276 | 786,929 | 4/22/15 | — | (15,090 | ) | |||
| Japanese Yen | HSBC | Sell | 106,325,664 | 907,804 | 4/22/15 | 23,109 | (3,628 | ) | |||
| Euro | BANT | Sell | 9,101,771 | 11,359,464 | 5/18/15 | 331,601 | — | ||||
| Euro | FBCO | Sell | 5,077,947 | 6,340,995 | 5/18/15 | 188,466 | — | ||||
| Euro | DBFX | Sell | 5,286,085 | 6,601,935 | 5/18/15 | 197,222 | — | ||||
| Euro | SSBT | Sell | 105,564 | 130,249 | 5/18/15 | 2,346 | — | ||||
| British Pound | BANT | Buy | 113,537 | 177,146 | 5/21/15 | — | (380 | ) | |||
| British Pound | BANT | Sell | 1,031,462 | 1,614,238 | 5/21/15 | 8,360 | — | ||||
| British Pound | FBCO | Sell | 743,008 | 1,161,916 | 5/21/15 | 5,130 | — | ||||
| British Pound | HSBC | Buy | 176,407 | 275,737 | 5/21/15 | — | (1,090 | ) | |||
| British Pound | SSBT | Sell | 1,361,529 | 2,129,431 | 5/21/15 | 9,674 | — | ||||
| Norwegian Krone | BANT | Buy | 3,648,329 | 507,604 | 5/21/15 | — | (20,984 | ) | |||
| Norwegian Krone | DBFX | Buy | 5,527,408 | 748,579 | 5/21/15 | 1,276 | (12,601 | ) | |||
| Norwegian Krone | DBFX | Sell | 111,636,515 | 16,328,767 | 5/21/15 | 1,438,517 | — | ||||
| Unrealized appreciation (depreciation) | 7,760,928 | (302,535 | ) | ||||||||
| Net unrealized appreciation (depreciation) | $ | 7,458,393 | |||||||||
| aMay be comprised of multiple contracts with the same counterparty, currency and settlement date. | |||||||||||
| See Abbreviations on page 40. | |||||||||||
franklintempleton.com
The accompanying notes are an integral part of these financial statements. | Annual Report | 23
FRANKLIN MUTUAL FINANCIAL SERVICES FUND
Financial Statements
Statement of Assets and Liabilities
December 31, 2014
| Assets: | |||
| Investments in securities: | |||
| Cost - Unaffiliated issuers | $ | 385,140,376 | |
| Cost - Non-controlled affiliated issuers (Note 10) | 2,227,085 | ||
| Total cost of investments | $ | 387,367,461 | |
| Value - Unaffiliated issuers | $ | 443,020,135 | |
| Value - Non-controlled affiliated issuers (Note 10) | 72,352 | ||
| Total value of investments | 443,092,487 | ||
| Restricted Cash (Note 1d) | 2,330,000 | ||
| Foreign currency, at value (cost $7,728,193) | 7,721,972 | ||
| Receivables: | |||
| Investment securities sold | 1,201,955 | ||
| Capital shares sold | 953,444 | ||
| Dividends and interest | 310,617 | ||
| Variation margin | 36,850 | ||
| Unrealized appreciation on forward exchange contracts | 7,760,928 | ||
| Other assets | 183,640 | ||
| Total assets | 463,591,893 | ||
| Liabilities: | |||
| Payables: | |||
| Investment securities purchased | 2,515,647 | ||
| Capital shares redeemed | 453,691 | ||
| Management fees | 338,719 | ||
| Distribution fees | 276,188 | ||
| Transfer agent fees | 126,246 | ||
| Trustees’ fees and expenses | 22,997 | ||
| Funds advanced by custodian | 347,546 | ||
| Due to brokers | 2,330,000 | ||
| Unrealized depreciation on forward exchange contracts | 302,535 | ||
| Accrued expenses and other liabilities | 126,284 | ||
| Total liabilities | 6,839,853 | ||
| Net assets, at value | $ | 456,752,040 | |
| Net assets consist of: | |||
| Paid-in capital | $ | 550,114,561 | |
| Undistributed net investment income | 1,782,857 | ||
| Net unrealized appreciation (depreciation) | 63,502,908 | ||
| Accumulated net realized gain (loss) | (158,648,286 | ) | |
| Net assets, at value | $ | 456,752,040 |
24 | Annual Report | The accompanying notes are an integral part of these financial statements.
franklintempleton.com
| FRANKLIN MUTUAL FINANCIAL SERVICES FUND | ||
| FINANCIAL STATEMENTS | ||
| Statement of Assets and Liabilities (continued) | ||
| December 31, 2014 | ||
| Class Z: | ||
| Net assets, at value | $ | 112,156,468 |
| Shares outstanding | 6,096,843 | |
| Net asset value and maximum offering price per share | $ | 18.40 |
| Class A: | ||
| Net assets, at value | $ | 255,241,746 |
| Shares outstanding | 13,827,183 | |
| Net asset value per sharea | $ | 18.46 |
| Maximum offering price per share (net asset value per share ÷ 94.25%) | $ | 19.59 |
| Class C: | ||
| Net assets, at value | $ | 89,341,398 |
| Shares outstanding | 4,852,287 | |
| Net asset value and maximum offering price per sharea | $ | 18.41 |
| Class R6: | ||
| Net assets, at value | $ | 12,428 |
| Shares outstanding | 671 | |
| Net asset value and maximum offering price per share | $ | 18.52 |
| aRedemption price is equal to net asset value less contingent deferred sales charges, if applicable. | |||
| franklintempleton.com | The accompanying notes are an integral part of these financial statements. | Annual Report | | | 25 |
FRANKLIN MUTUAL FINANCIAL SERVICES FUND
FINANCIAL STATEMENTS
Statement of Operations
for the year ended December 31, 2014
| Investment income: | |||
| Dividends: (net of foreign taxes of $863,400) | |||
| Unaffiliated issuers | $ | 10,449,797 | |
| Non-controlled affiliated issuers (Note 10) | 710,873 | ||
| Interest | 184,516 | ||
| Total investment income | 11,345,186 | ||
| Expenses: | |||
| Management fees (Note 3a) | 3,685,606 | ||
| Administrative fees (Note 3b) | 162,138 | ||
| Distribution fees: (Note 3c) | |||
| Class A | 740,745 | ||
| Class C | 863,694 | ||
| Transfer agent fees: (Note 3e) | |||
| Class Z | 187,644 | ||
| Class A | 439,953 | ||
| Class C | 153,482 | ||
| Class R6 | 109 | ||
| Custodian fees (Note 4) | 42,072 | ||
| Reports to shareholders | 83,789 | ||
| Registration and filing fees | 69,998 | ||
| Professional fees | 135,094 | ||
| Trustees’ fees and expenses | 11,562 | ||
| Other | 18,494 | ||
| Total expenses | 6,594,380 | ||
| Expense reductions (Note 4) | (44 | ) | |
| Expenses waived/paid by affiliates (Note 3f) | (108 | ) | |
| Net expenses | 6,594,228 | ||
| Net investment income | 4,750,958 | ||
| Realized and unrealized gains (losses): | |||
| Net realized gain (loss) from: | |||
| Investments: | |||
| Unaffiliated issuers | 40,461,801 | ||
| Non-controlled affiliated issuers (Note 10) | 15,050,683 | ||
| Foreign currency transactions | (1,333,356 | ) | |
| Futures contracts | 1,538,315 | ||
| Net realized gain (loss) | 55,717,443 | ||
| Net change in unrealized appreciation (depreciation) on: | |||
| Investments | (28,199,700 | ) | |
| Translation of other assets and liabilities denominated in foreign currencies | 12,213,932 | ||
| Net change in unrealized appreciation (depreciation) | (15,985,768 | ) | |
| Net realized and unrealized gain (loss) | 39,731,675 | ||
| Net increase (decrease) in net assets resulting from operations | $ | 44,482,633 |
26 | Annual Report | The accompanying notes are an integral part of these financial statements.
franklintempleton.com
FRANKLIN MUTUAL FINANCIAL SERVICES FUND
FINANCIAL STATEMENTS
| Statements of Changes in Net Assets | ||||||
| Year Ended December 31, | ||||||
| 2014 | 2013 | |||||
| Increase (decrease) in net assets: | ||||||
| Operations: | ||||||
| Net investment income | $ | 4,750,958 | $ | 4,514,430 | ||
| Net realized gain (loss) from investments, foreign currency transactions and futures | ||||||
| contracts | 55,717,443 | 10,579,316 | ||||
| Net change in unrealized appreciation (depreciation) on investments and translation of other | ||||||
| assets and liabilities denominated in foreign currencies | (15,985,768 | ) | 71,872,868 | |||
| Net increase (decrease) in net assets resulting from operations | 44,482,633 | 86,966,614 | ||||
| Distributions to shareholders from: | ||||||
| Net investment income: | ||||||
| Class Z | (2,206,551 | ) | (1,085,169 | ) | ||
| Class A | (4,298,998 | ) | (1,840,120 | ) | ||
| Class C | (912,109 | ) | (118,179 | ) | ||
| Class R6 | (162 | ) | (70 | ) | ||
| Total distributions to shareholders | (7,417,820 | ) | (3,043,538 | ) | ||
| Capital share transactions: (Note 2) | ||||||
| Class Z | (1,989,359 | ) | (2,248,625 | ) | ||
| Class A | (6,235,910 | ) | 9,777,938 | |||
| Class B | — | (374,083 | ) | |||
| Class C | (4,277,422 | ) | 503,579 | |||
| Class R6 | 6,199 | 5,000 | ||||
| Total capital share transactions | (12,496,492 | ) | 7,663,809 | |||
| Net increase (decrease) in net assets | 24,568,321 | 91,586,885 | ||||
| Net assets: | ||||||
| Beginning of year | 432,183,719 | 340,596,834 | ||||
| End of year | $ | 456,752,040 | $ | 432,183,719 | ||
| Undistributed net investment income included in net assets: | ||||||
| End of year | $ | 1,782,857 | $ | 1,155,140 | ||
franklintempleton.com
The accompanying notes are an integral part of these financial statements. | Annual Report | 27
FRANKLIN MUTUAL FINANCIAL SERVICES FUND
Notes to Financial Statements
1. Organization and Significant Accounting Policies
Franklin Mutual Series Funds (Trust) is registered under the Investment Company Act of 1940, as amended, (1940 Act) as an open-end management investment company, consisting of seven separate funds and applies the specialized accounting and reporting guidance in U.S. Generally Accepted Accounting Principles (U.S. GAAP). Franklin Mutual Financial Services Fund (Fund) is included in this report. The financial statements of the remaining funds in the Trust are presented separately. The Fund offers four classes of shares: Class Z, Class A, Class C and Class R6. Each class of shares differs by its initial sales load, contingent deferred sales charges, voting rights on matters affecting a single class, its exchange privilege and fees primarily due to differing arrangements for distribution and transfer agent fees.
Effective June 30, 2014, Mutual Financial Services Fund was renamed Franklin Mutual Financial Services Fund.
The following summarizes the Fund’s significant accounting policies.
a. Financial Instrument Valuation
The Fund’s investments in financial instruments are carried at fair value daily. Fair value is the price that would be received to sell an asset or paid to transfer a liability in an orderly transaction between market participants on the measurement date. The Fund calculates the net asset value per share at the close of the New York Stock Exchange (NYSE), generally at 4 p.m. Eastern time (NYSE close) on each day the NYSE is open for trading. Under compliance policies and procedures approved by the Trust’s Board of Trustees (the Board), the Fund’s administrator has responsibility for oversight of valuation, including leading the cross-functional Valuation and Liquidity Oversight Committee (VLOC). The VLOC provides administration and oversight of the Fund’s valuation policies and procedures, which are approved annually by the Board. Among other things, these procedures allow the Fund to utilize independent pricing services, quotations from securities and financial instrument dealers, and other market sources to determine fair value.
Equity securities and derivative financial instruments (derivatives) listed on an exchange or on the NASDAQ National Market System are valued at the last quoted sale price or the official closing price of the day, respectively. Foreign equity securities are valued as of the close of trading on the foreign stock exchange on which the security is primarily traded or as
of the NYSE close, whichever is earlier. The value is then converted into its U.S. dollar equivalent at the foreign exchange rate in effect at the NYSE close on the day that the value of the security is determined. Over-the-counter (OTC) securities are valued within the range of the most recent quoted bid and ask prices. Securities that trade in multiple markets or on multiple exchanges are valued according to the broadest and most representative market. Certain equity securities are valued based upon fundamental characteristics or relationships to similar securities.
Debt securities generally trade in the OTC market rather than on a securities exchange. The Fund’s pricing services use multiple valuation techniques to determine fair value. In instances where sufficient market activity exists, the pricing services may utilize a market-based approach through which quotes from market makers are used to determine fair value. In instances where sufficient market activity may not exist or is limited, the pricing services also utilize proprietary valuation models which may consider market characteristics such as benchmark yield curves, credit spreads, estimated default rates, anticipated market interest rate volatility, coupon rates, anticipated timing of principal repayments, underlying collateral, and other unique security features in order to estimate the relevant cash flows, which are then discounted to calculate the fair value. Securities denominated in a foreign currency are converted into their U.S. dollar equivalent at the foreign exchange rate in effect at the NYSE close on the date that the values of the foreign debt securities are determined.
Certain derivatives trade in the OTC market. The Fund’s pricing services use various techniques including industry standard option pricing models and proprietary discounted cash flow models to determine the fair value of those instruments. The Fund's net benefit or obligation under the derivative contract, as measured by the fair value of the contract, is included in net assets.
The Fund has procedures to determine the fair value of financial instruments for which market prices are not reliable or readily available. Under these procedures, the VLOC convenes on a regular basis to review such financial instruments and considers a number of factors, including significant unobservable valuation inputs, when arriving at fair value. The VLOC primarily employs a market-based approach which may use related or comparable assets or liabilities, recent transactions, market multiples, book values, and other relevant information for the investment to determine the fair value of the investment. An income-based valuation approach may also be used
28 | Annual Report
franklintempleton.com
FRANKLIN MUTUAL FINANCIAL SERVICES FUND
NOTES TO FINANCIAL STATEMENTS
in which the anticipated future cash flows of the investment are discounted to calculate fair value. Discounts may also be applied due to the nature or duration of any restrictions on the disposition of the investments. Due to the inherent uncertainty of valuations of such investments, the fair values may differ significantly from the values that would have been used had an active market existed. The VLOC employs various methods for calibrating these valuation approaches including a regular review of key inputs and assumptions, transactional back-testing or disposition analysis, and reviews of any related market activity.
Trading in securities on foreign securities stock exchanges and OTC markets may be completed before the daily NYSE close. In addition, trading in certain foreign markets may not take place on every NYSE business day. Occasionally, events occur between the time at which trading in a foreign security is completed and the close of the NYSE that might call into question the reliability of the value of a portfolio security held by the Fund. As a result, differences may arise between the value of the Fund’s portfolio securities as determined at the foreign market close and the latest indications of value at the close of the NYSE. In order to minimize the potential for these differences, the VLOC monitors price movements following the close of trading in foreign stock markets through a series of country specific market proxies (such as baskets of American Depositary Receipts, futures contracts and exchange traded funds). These price movements are measured against established trigger thresholds for each specific market proxy to assist in determining if an event has occurred that may call into question the reliability of the values of the foreign securities held by the Fund. If such an event occurs, the securities may be valued using fair value procedures, which may include the use of independent pricing services.
Also, when the last day of the reporting period is a non-business day, certain foreign markets may be open on those days that the NYSE is closed, which could result in differences between the value of the Fund’s portfolio securities on the last business day and the last calendar day of the reporting period. Any significant security valuation changes due to an open foreign market are adjusted and reflected by the Fund for financial reporting purposes.
b. Foreign Currency Translation
Portfolio securities and other assets and liabilities denominated in foreign currencies are translated into U.S. dollars based on the exchange rate of such currencies against U.S.
dollars on the date of valuation. The Fund may enter into foreign currency exchange contracts to facilitate transactions denominated in a foreign currency. Purchases and sales of securities, income and expense items denominated in foreign currencies are translated into U.S. dollars at the exchange rate in effect on the transaction date. Portfolio securities and assets and liabilities denominated in foreign currencies contain risks that those currencies will decline in value relative to the U.S. dollar. Occasionally, events may impact the availability or reliability of foreign exchange rates used to convert the U.S. dollar equivalent value. If such an event occurs, the foreign exchange rate will be valued at fair value using procedures established and approved by the Board.
The Fund does not separately report the effect of changes in foreign exchange rates from changes in market prices on securities held. Such changes are included in net realized and unrealized gain or loss from investments on the Statement of Operations.
Realized foreign exchange gains or losses arise from sales of foreign currencies, currency gains or losses realized between the trade and settlement dates on securities transactions and the difference between the recorded amounts of dividends, interest, and foreign withholding taxes and the U.S. dollar equivalent of the amounts actually received or paid. Net unrealized foreign exchange gains and losses arise from changes in foreign exchange rates on foreign denominated assets and liabilities other than investments in securities held at the end of the reporting period.
c. Derivative Financial Instruments
The Fund invested in derivatives in order to manage risk or gain exposure to various other investments or markets. Derivatives are financial contracts based on an underlying or notional amount, require no initial investment or an initial net investment that is smaller than would normally be required to have a similar response to changes in market factors, and require or permit net settlement. Derivatives contain various risks including the potential inability of the counterparty to fulfill their obligations under the terms of the contract, the potential for an illiquid secondary market, and/or the potential for market movements which expose the Fund to gains or losses in excess of the amounts shown on the Statement of Assets and Liabilities. Realized gain and loss and unrealized appreciation and depreciation on these contracts for the period are included in the Statement of Operations.
franklintempleton.com
Annual Report
| 29
FRANKLIN MUTUAL FINANCIAL SERVICES FUND
NOTES TO FINANCIAL STATEMENTS
1. Organization and Significant Accounting
Policies (continued)
c. Derivative Financial Instruments (continued)
Derivative counterparty credit risk is managed through a formal evaluation of the creditworthiness of all potential counterparties. The Fund attempts to reduce its exposure to counterparty credit risk on OTC derivatives, whenever possible, by entering into International Swaps and Derivatives Association (ISDA) master agreements with certain counterparties. These agreements contain various provisions, including but not limited to collateral requirements, events of default, or early termination. Termination events applicable to the counterparty include certain deteriorations in the credit quality of the counterparty. Termination events applicable to the Fund include failure of the Fund to maintain certain net asset levels and/or limit the decline in net assets over various periods of time. In the event of default or early termination, the ISDA master agreement gives the non-defaulting party the right to net and close-out all transactions traded, whether or not arising under the ISDA agreement, to one net amount payable by one counterparty to the other. However, absent an event of default or early termination, OTC derivative assets and liabilities are presented gross and not offset in the Statement of Assets and Liabilities. Early termination by the counterparty may result in an immediate payment by the Fund of any net liability owed to that counterparty under the ISDA agreement.
Collateral requirements differ by type of derivative. Collateral or initial margin requirements are set by the broker or exchange clearing house for exchange traded and centrally cleared derivatives. Initial margin deposited is held at the exchange and can be in the form of cash and/or securities. For OTC derivatives traded under an ISDA master agreement, posting of collateral is required by either the Fund or the applicable counterparty if the total net exposure of all OTC derivatives with the applicable counterparty exceeds the minimum transfer amount, which typically ranges from $100,000 to $250,000, and can vary depending on the counterparty and the type of the agreement. Generally, collateral is determined at the close of fund business each day and any additional collateral required due to changes in derivative values may be delivered by the Fund or the counterparty within a few business days. Collateral pledged and/or received by the Fund for OTC derivatives, if any, is held in segregated accounts with the Fund’s custodian/counterparty broker and can be in the form of cash and/or securities. Unrestricted cash may be invested according to the Fund’s investment objectives.
The Fund entered into exchange traded futures contracts primarily to manage exposure to certain foreign currencies. A futures contract is an agreement between the Fund and a counterparty to buy or sell an asset for a specified price on a future date. Required initial margins are pledged by the Fund, and the daily change in fair value is accounted for as a variation margin payable or receivable on the Statement of Assets and Liabilities.
The Fund entered into OTC forward exchange contracts primarily to manage exposure to certain foreign currencies. A forward exchange contract is an agreement between the Fund and a counterparty to buy or sell a foreign currency at a specific exchange rate on a future date.
See Note 9 regarding other derivative information.
d. Restricted Cash
At December 31, 2014, the Fund held restricted cash in connection with investments in certain derivative securities. Restricted cash is held in a segregated account with the Fund’s custodian/counterparty broker and is reflected in the Statement of Assets and Liabilities.
e. Securities Lending
The Fund participates in an agency based securities lending program. The Fund receives cash collateral against the loaned securities in an amount equal to at least 102% of the fair value of the loaned securities. Collateral is maintained over the life of the loan in an amount not less than 100% of the fair value of loaned securities, as determined at the close of fund business each day; any additional collateral required due to changes in security values is delivered to the Fund on the next business day. The collateral is invested in a non-registered money fund. The Fund receives income from the investment of cash collateral, in addition to lending fees and rebates paid by the borrower. The Fund bears the market risk with respect to the collateral investment, securities loaned, and the risk that the agent may default on its obligations to the Fund. The securities lending agent has agreed to indemnify the Fund in the event of default by a third party borrower. At December 31, 2014, the Fund had no securities on loan.
f. Income and Deferred Taxes
It is the Fund’s policy to qualify as a regulated investment company under the Internal Revenue Code. The Fund intends
30 | Annual Report
franklintempleton.com
FRANKLIN MUTUAL FINANCIAL SERVICES FUND
NOTES TO FINANCIAL STATEMENTS
to distribute to shareholders substantially all of its taxable income and net realized gains to relieve it from federal income and excise taxes. As a result, no provision for U.S. federal income taxes is required.
The Fund may be subject to foreign taxation related to income received, capital gains on the sale of securities and certain foreign currency transactions in the foreign jurisdictions in which it invests. Foreign taxes, if any, are recorded based on the tax regulations and rates that exist in the foreign markets in which the Fund invests. When a capital gain tax is determined to apply the Fund records an estimated deferred tax liability in an amount that would be payable if the securities were disposed of on the valuation date. As a result of several court cases, in certain countries across the European Union, the Fund has filed additional tax reclaims for previously withheld taxes on dividends earned in those countries. These additional filings are subject to various administrative proceedings by the local jurisdictions’ tax authorities within the European Union, as well as a number of related judicial proceedings. At this time, uncertainty exists as to the ultimate resolution of these proceedings, the likelihood of receipt of these reclaims, and the potential timing of payment, and accordingly, no amounts are reflected in the financial statements.
The Fund recognizes the tax benefits of uncertain tax positions only when the position is “more likely than not” to be sustained upon examination by the tax authorities based on the technical merits of the tax position. As of December 31, 2014, and for all open tax years, the Fund has determined that no liability for unrecognized tax benefits is required in the Fund’s financial statements related to uncertain tax positions taken on a tax return (or expected to be taken on future tax returns). Open tax years are those that remain subject to examination and are based on each tax jurisdiction statute of limitation.
g. Security Transactions, Investment Income, Expenses and Distributions
Security transactions are accounted for on trade date. Realized gains and losses on security transactions are determined on a specific identification basis. Interest income and estimated expenses are accrued daily. Amortization of premium and accretion of discount on debt securities are included in interest income. Dividend income is recorded on the ex-dividend date
except for certain foreign securities where the dividend rate is not available. In such cases, the dividend is recorded as soon as the information is received by the Fund. Distributions to shareholders are recorded on the ex-dividend date and are determined according to income tax regulations (tax basis). Distributable earnings determined on a tax basis may differ from earnings recorded in accordance with U.S. GAAP. These differences may be permanent or temporary. Permanent differences are reclassified among capital accounts to reflect their tax character. These reclassifications have no impact on net assets or the results of operations. Temporary differences are not reclassified, as they may reverse in subsequent periods.
Common expenses incurred by the Trust are allocated among the funds based on the ratio of net assets of each fund to the combined net assets of the Trust. Fund specific expenses are charged directly to the fund that incurred the expense.
Realized and unrealized gains and losses and net investment income, not including class specific expenses, are allocated daily to each class of shares based upon the relative proportion of net assets of each class. Differences in per share distributions, by class, are generally due to differences in class specific expenses.
h. Accounting Estimates
The preparation of financial statements in accordance with U.S. GAAP requires management to make estimates and assumptions that affect the reported amounts of assets and liabilities at the date of the financial statements and the amounts of income and expenses during the reporting period. Actual results could differ from those estimates.
i. Guarantees and Indemnifications
Under the Trust’s organizational documents, its officers and trustees are indemnified by the Trust against certain liabilities arising out of the performance of their duties to the Trust. Additionally, in the normal course of business, the Trust, on behalf of the Fund, enters into contracts with service providers that contain general indemnification clauses. The Trust’s maximum exposure under these arrangements is unknown as this would involve future claims that may be made against the Trust that have not yet occurred. Currently, the Trust expects the risk of loss to be remote.
franklintempleton.com
Annual Report
| 31
FRANKLIN MUTUAL FINANCIAL SERVICES FUND
NOTES TO FINANCIAL STATEMENTS
2. Shares of Beneficial Interest
At December 31, 2014, there were an unlimited number of shares authorized (without par value). Transactions in the Fund’s shares were as follows:
| Year Ended December 31, | |||||||||||||
| 2014 | 2013 | a | |||||||||||
| Shares | Amount | Shares | Amount | ||||||||||
| Class Z Shares: | |||||||||||||
| Shares sold | 900,157 | $ | 15,916,337 | 688,935 | $ | 10,392,063 | |||||||
| Shares issued in reinvestment of distributions | 108,683 | 1,990,815 | 57,352 | 946,286 | |||||||||
| Shares redeemed | (1,142,574 | ) | (19,896,511 | ) | (883,206 | ) | (13,586,974 | ) | |||||
| Net increase (decrease) | (133,734 | ) | $ | (1,989,359 | ) | (136,919 | ) | $ | (2,248,625 | ) | |||
| Class A Shares: | |||||||||||||
| Shares sold | 3,011,856 | $ | 53,245,431 | 3,661,594 | $ | 56,607,499 | |||||||
| Shares issued in reinvestment of distributions | 226,229 | 4,156,062 | 107,325 | 1,772,519 | |||||||||
| Shares redeemed | (3,597,075 | ) | (63,637,403 | ) | (3,124,833 | ) | (48,602,080 | ) | |||||
| Net increase (decrease) | (358,990 | ) | $ | (6,235,910 | ) | 644,086 | $ | 9,777,938 | |||||
| Class B Sharesb: | |||||||||||||
| Shares sold | 54 | $ | 759 | ||||||||||
| Shares redeemed | (25,977 | ) | (374,842 | ) | |||||||||
| Net increase (decrease) | (25,923 | ) | $ | (374,083 | ) | ||||||||
| Class C Shares: | |||||||||||||
| Shares sold | 675,189 | $ | 11,864,749 | 1,115,744 | $ | 17,176,940 | |||||||
| Shares issued in reinvestment of distributions | 47,533 | 870,024 | 7,101 | 111,402 | |||||||||
| Shares redeemed | (975,769 | ) | (17,012,195 | ) | (1,088,960 | ) | (16,784,763 | ) | |||||
| Net increase (decrease) | (253,047 | ) | $ | (4,277,422 | ) | 33,885 | $ | 503,579 | |||||
| Class R6 Shares: | |||||||||||||
| Shares sold | 331 | $ | 6,129 | 336 | $ | 5,000 | |||||||
| Shares issued in reinvestment of distributions | 4 | 70 | — | — | |||||||||
| Net increase (decrease) | 335 | $ | 6,199 | 336 | $ | 5,000 | |||||||
| aFor the period May 1, 2013 (effective date) to December 31, 2013, for Class R6. | |||||||||||||
| bEffective March 22, 2013, all Class B shares were converted to Class A. | |||||||||||||
3. Transactions with Affiliates
Franklin Resources, Inc. is the holding company for various subsidiaries that together are referred to as Franklin Templeton Investments. Certain officers and trustees of the Fund are also officers and/or directors of the following subsidiaries:
| Subsidiary | Affiliation |
| Franklin Mutual Advisers, LLC (Franklin Mutual) | Investment manager |
| Franklin Templeton Services, LLC (FT Services) | Administrative manager |
| Franklin Templeton Distributors, Inc. (Distributors) | Principal underwriter |
| Franklin Templeton Investor Services, LLC (Investor Services) | Transfer agent |
32 | Annual Report
franklintempleton.com
FRANKLIN MUTUAL FINANCIAL SERVICES FUND
NOTES TO FINANCIAL STATEMENTS
a. Management Fees
The Fund pays an investment management fee to Franklin Mutual based on the average daily net assets of the Fund as follows:
| Annualized Fee Rate | Net Assets | |
| 0.875 | % | Up to and including $1 billion |
| 0.845 | % | Over $1 billion, up to and including $2 billion |
| 0.825 | % | Over $2 billion, up to and including $5 billion |
| 0.805 | % | In excess of $5 billion |
| Effective July 1, 2014, the Fund combined its investment management and administration agreements as approved by the Board. | ||
| The fees paid under the combined agreement do not exceed the aggregate fees that were paid under the separate agreements. | ||
| Prior to July 1, 2014, the Fund paid fees to Franklin Mutual based on the average daily net assets of the Fund as follows: | ||
| Annualized Fee Rate | Net Assets | |
| 0.800 | % | Up to and including $1 billion |
| 0.770 | % | Over $1 billion, up to and including $2 billion |
| 0.750 | % | Over $2 billion, up to and including $5 billion |
| 0.730 | % | In excess of $5 billion |
b. Administrative Fees
Effective July 1, 2014, under an agreement with Franklin Mutual, FT Services provides administrative services to the Fund. The fee is paid by Franklin Mutual based on the Fund’s average daily net assets, and is not an additional expense of the Fund.
Prior to July 1, 2014, the Fund paid its allocated share of an administrative fee to FT Services based on the Trust’s aggregate average daily net assets as follows:
| Annualized Fee Rate | Net Assets | |
| 0.150 | % | Up to and including $200 million |
| 0.135 | % | Over $200 million, up to and including $700 million |
| 0.100 | % | Over $700 million, up to and including $1.2 billion |
| 0.075 | % | In excess of $1.2 billion |
c. Distribution Fees
The Board has adopted distribution plans for each share class, with the exception of Class Z and Class R6 shares, pursuant to Rule 12b-1 under the 1940 Act. Distribution fees are not charged on shares held by affiliates. Under the Fund’s Class A reimbursement distribution plan, the Fund reimburses Distributors for costs incurred in connection with the servicing, sale and distribution of the Fund’s shares up to the maximum annual plan rate. Under the Class A reimbursement distribution plan, costs exceeding the maximum for the current plan year cannot be reimbursed in subsequent periods. In addition, under the Fund’s Class C compensation distribution plan, the Fund pays Distributors for costs incurred in connection with the servicing, sale and distribution of the Fund’s shares up to the maximum annual plan rate. The plan year, for purposes of monitoring compliance with the maximum annual plan rates, is February 1 through January 31 for each fund.
The maximum annual plan rates, based on the average daily net assets, for each class, are as follows:
| Class A | 0.35 | % |
| Class C | 1.00 | % |
The Board has set the current rate at 0.30% per year for Class A shares until further notice and approval by the Board.
franklintempleton.com
Annual Report
| 33
FRANKLIN MUTUAL FINANCIAL SERVICES FUND
NOTES TO FINANCIAL STATEMENTS
3. Transactions with Affiliates (continued)
d. Sales Charges/Underwriting Agreements
Front-end sales charges and contingent deferred sales charges (CDSC) do not represent expenses of the Fund. These charges are deducted from the proceeds of sales of Fund shares prior to investment or from redemption proceeds prior to remittance, as applicable. Distributors has advised the Fund of the following commission transactions related to the sales and redemptions of the Fund’s shares for the year:
| Sales charges retained net of commissions paid to unaffiliated | ||
| broker/dealers | $ | 71,218 |
| CDSC retained | $ | 4,767 |
e. Transfer Agent Fees
Each class of shares, except for Class R6, pays transfer agent fees to Investor Services for its performance of shareholder servicing obligations and reimburses Investor Services for out of pocket expenses incurred, including shareholding servicing fees paid to third parties. These fees are allocated daily based upon their relative proportion of such classes’ aggregate net assets. Class R6 pays Investor Services transfer agent fees specific to that class.
For the year ended December 31, 2014, the Fund paid transfer agent fees of $781,188, of which $412,824 was retained by Investor Services.
f. Waiver and Expense Reimbursements
Investor Services has contractually agreed in advance to waive or limit its fees so that the Class R6 transfer agent fees do not exceed 0.01% until April 30, 2015.
4. Expense Offset Arrangement
The Fund has entered into an arrangement with its custodian whereby credits realized as a result of uninvested cash balances are used to reduce a portion of the Fund’s custodian expenses. During the year ended December 31, 2014, the custodian fees were reduced as noted in the Statement of Operations.
5. Independent Trustees’ Retirement Plan
On January 1, 1993, the Trust adopted an Independent Trustees’ Retirement Plan (Plan). The Plan is an unfunded defined benefit plan that provides benefit payments to Trustees whose length of service and retirement age meets the eligibility requirements of the Plan. Benefits under the Plan are based on years of service and fees paid to each trustee at the time of retirement. Effective in December 1996, the Plan was closed to new participants.
During the year ended December 31, 2014, the Fund’s projected benefit obligation and benefit payments under the Plan were as follows:
| aProjected benefit obligation at December 31, 2014 | $ | 22,997 | |
| bIncrease in projected benefit obligation | $ | 633 | |
| Benefit payments made to retired trustees | $ | (427 | ) |
aThe projected benefit obligation is included in trustees’ fees and expenses in the Statement of Assets and Liabilities.
bThe increase in projected benefit obligation is included in trustees’ fees and expenses in the Statement of Operations.
34 | Annual Report
franklintempleton.com
FRANKLIN MUTUAL FINANCIAL SERVICES FUND
NOTES TO FINANCIAL STATEMENTS
6. Income Taxes
For tax purposes, capital losses may be carried over to offset future capital gains. Capital loss carryforwards with no expiration, if any, must be fully utilized before those losses with expiration dates.
At December 31, 2014, capital loss carryforwards were as follows:
| Capital loss carryforwards subject to expiration: | ||
| 2016 | $ | 45,964,078 |
| 2017 | 73,527,713 | |
| 2018 | 31,091,133 | |
| Total capital loss carryforwards | $ | 150,582,924 |
During the year ended December 31, 2014, the Fund utilized $64,521,077 of capital loss carryforwards.
The tax character of distributions paid during the years ended December 31, 2014 and 2013, was as follows:
| 2014 | 2013 | |||
| Distributions paid from ordinary income | $ | 7,417,820 | $ | 3,043,538 |
At December 31, 2014, the cost of investments, net unrealized appreciation (depreciation) and undistributed ordinary income for income tax purposes were as follows:
| Cost of investments | $ | 387,769,184 | |
| Unrealized appreciation | $ | 96,597,537 | |
| Unrealized depreciation | (41,274,234 | ) | |
| Net unrealized appreciation (depreciation) | $ | 55,323,303 | |
| Distributable earnings – undistributed ordinary income | $ | 1,722,928 | |
Differences between income and/or capital gains as determined on a book basis and a tax basis are primarily due to differing treatments of foreign currency transactions.
7. Investment Transactions
Purchases and sales of investments (excluding short term securities) for the year ended December 31, 2014, aggregated $131,810,267 and $154,548,132, respectively.
8. Restricted Securities
The Fund invests in securities that are restricted under the Securities Act of 1933 (1933 Act) or which are subject to legal, contractual, or other agreed upon restrictions on resale. Restricted securities are often purchased in private placement transactions, and cannot be sold without prior registration unless the sale is pursuant to an exemption under the 1933 Act. Disposal of these securities may require greater effort and expense, and prompt sale at an acceptable price may be difficult. The Fund may have registration rights for restricted securities. The issuer generally incurs all registration costs.
franklintempleton.com
Annual Report
| 35
FRANKLIN MUTUAL FINANCIAL SERVICES FUND
NOTES TO FINANCIAL STATEMENTS
8. Restricted Securities (continued)
At December 31, 2014, the Fund held investments in restricted securities, excluding certain securities exempt from registration under the 1933 Act deemed to be liquid, as follows:
| Acquisition | ||||||
| Shares | Issuer | Dates | Cost | Value | ||
| 4,357,178 | FIM Coinvestor Holdings I, LLC | 11/20/06 - 6/02/09 | $ | — | $ | — |
| 3,000,000 | Hightower Holding LLC, pfd., A | 3/31/08 - 1/05/10 | 2,362,324 | 3,244,500 | ||
| 968,000 | Hightower Holding LLC, pfd., A, Series 2 | 6/10/10 - 5/10/12 | 2,420,000 | 2,251,955 | ||
| 7,480 | Olympus Re Holdings Ltd. | 12/19/01 | 698,786 | — | ||
| Total Restricted Securities (Value is 1.20% of Net Assets) | $ | 5,481,110 | $ | 5,496,455 |
9. Other Derivative Information
At December 31, 2014, the Fund’s investments in derivative contracts are reflected on the Statement of Assets and Liabilities as follows:
| Asset Derivatives | Liability Derivatives | ||||||
| Derivative Contracts | |||||||
| Not Accounted for as | Statement of Assets and | Statement of Assets and | |||||
| Hedging Instruments | Liabilities Location | Fair Value | Liabilities Location | Fair Value | |||
| Foreign exchange | |||||||
| contracts | Unrealized appreciation on forward | $ | 8,104,037 | a | Unrealized depreciation on | $ | 302,535 |
| exchange contracts / Net assets | forward exchange | ||||||
| consist of – net unrealized | contracts | ||||||
| appreciation (depreciation) |
aIncludes cumulative appreciation (depreciation) of futures contracts as reported in the Statement of Investments. Only current day’s variation margin is separately reported within the Statement of Assets and Liabilities.
For the year ended December 31, 2014, the effect of derivative contracts on the Fund’s Statement of Operations was as follows:
| Change in | |||||
| Unrealized | |||||
| Derivative Contracts | Realized Gain | Appreciation | |||
| Not Accounted for as | (Loss) for | (Depreciation) | |||
| Hedging Instruments | Statement of Operations Locations | the Year | for the Year | ||
| Foreign exchange contracts | Net realized gain (loss) from foreign currency transactions | $ | 1,124,780 | $ | 12,233,998 |
| and futures contracts / Net change in unrealized appreciation | |||||
| (depreciation) on translation of other assets and | |||||
| liabilities denominated in foreign currencies |
For the year ended December 31, 2014, the average month end fair value of derivatives represented 1.27% of average month end net assets. The average month end number of open derivative contracts for the year was 176.
At December 31, 2014, the Fund’s OTC derivative assets and liabilities are as follows:
| Gross and Net Amounts of Assets and Liabilities | ||||
| Presented in the Statement of Assets and Liabilities | ||||
| Assetsa | Liabilitiesa | |||
| Derivatives | ||||
| Forward exchange contracts | $ | 7,760,928 | $ | 302,535 |
aAbsent an event of default or early termination, OTC derivative assets and liabilities are presented gross and not offset in the Statement of Assets and Liabilities.
36 | Annual Report
franklintempleton.com
FRANKLIN MUTUAL FINANCIAL SERVICES FUND
NOTES TO FINANCIAL STATEMENTS
At December 31, 2014, the Fund’s OTC derivative assets which may be offset against the Fund’s OTC derivative liabilities and collateral received from the counterparty, is as follows:
| Amounts Not Offset in the | ||||||||||||||
| Statement of Assets and Liabilities | ||||||||||||||
| Gross and | ||||||||||||||
| Net Amounts of | Financial | Financial | ||||||||||||
| Assets Presented in | Instruments | Instruments | Cash | Net Amount | ||||||||||
| the Statement of | Available for | Collateral | Collateral | (Not less | ||||||||||
| Assets and Liabilities | Offset | Receiveda,b | Received | than zero) | ||||||||||
| Counterparty | ||||||||||||||
| BANT | $ | 1,324,196 | $ | (48,261 | ) | $ | (1,263,870 | ) | $ | — | $ | 12,065 | ||
| BBU | 900 | (272 | ) | — | — | 628 | ||||||||
| BONY | 859,892 | (4,876 | ) | (855,016 | ) | — | — | |||||||
| DBFX | 2,551,247 | (55,886 | ) | — | (2,330,000 | ) | 165,361 | |||||||
| FBCO | 1,191,484 | (9,830 | ) | (989,026 | ) | — | 192,628 | |||||||
| HSBC | 1,007,145 | (115,057 | ) | (892,088 | ) | — | — | |||||||
| SCBT | 217,718 | — | — | — | 217,718 | |||||||||
| SSBT | 608,346 | — | — | — | 608,346 | |||||||||
| Total | $ | 7,760,928 | $ | (234,182 | ) | $ | (4,000,000 | ) | $ | (2,330,000 | ) | $ | 1,196,746 | |
aAt December 31, 2014, the Fund received U.S. Treasury Notes as collateral for derivatives.
bIn some instances, the collateral amounts disclosed in the table above were adjusted due to the requirement to limit collateral amounts to avoid the effect of
overcollateralization. Actual collateral received and/or pledged may be more than the amounts disclosed herein.
At December 31, 2014, the Fund’s OTC derivative liabilities which may be offset against the Fund’s OTC derivative assets
and collateral pledged to the counterparty, is as follows:
| Amounts Not Offset in the | |||||||||||
| Statement of Assets and Liabilities | |||||||||||
| Gross and | |||||||||||
| Net Amounts of | Financial | Financial | |||||||||
| Liabilities Presented in | Instruments | Instruments | Cash | Net Amount | |||||||
| the Statement of | Available for | Collateral | Collateral | (Not less | |||||||
| Assets and Liabilities | Offset | Pledged | Pledged | than zero) | |||||||
| Counterparty | |||||||||||
| BANT | $ | 48,261 | $ | (48,261 | ) | $ | — | $ | — | $ | — |
| BBU | 272 | (272 | ) | — | — | — | |||||
| BONY | 4,876 | (4,876 | ) | — | — | — | |||||
| DBFX | 55,886 | (55,886 | ) | — | — | — | |||||
| FBCO | 9,830 | (9,830 | ) | — | — | — | |||||
| HSBC | 115,057 | (115,057 | ) | — | — | — | |||||
| SCBT | — | — | — | — | — | ||||||
| SSBT | 68,353 | — | — | — | 68,353 | ||||||
| Total | $ | 302,535 | $ | (234,182 | ) | $ | — | $ | — | $ | 68,353 |
| See Note 1(c) regarding derivative financial instruments. | |||||||||||
| See Abbreviations on page 40. | |||||||||||
franklintempleton.com
Annual Report
| 37
FRANKLIN MUTUAL FINANCIAL SERVICES FUND
NOTES TO FINANCIAL STATEMENTS
10. Holdings of 5% Voting Securities of Portfolio Companies
The 1940 Act defines “affiliated companies” to include investments in portfolio companies in which a fund owns 5% or more of the outstanding voting securities. Investments in “affiliated companies” for the Fund for the year ended December 31, 2014, were as shown below.
| Number of | Number of | ||||||||||
| Shares Held | Shares Held | ||||||||||
| at Beginning | Gross | Gross | at End | Value at End | Investment | Realized | |||||
| Name of Issuer | of Year | Additions | Reductions | of Year | of Year | Income | Gain (Loss) | ||||
| Non-Controlled Affiliates | |||||||||||
| AB&T Financial Corp. | 226,100 | — | — | 226,100 | $ | 72,352 | $ | — | $ | — | |
| Protector Forsikring ASA | 4,479,410 | — | (4,479,410 | ) | — | — | 710,873 | 15,050,683 | |||
| Total Affiliated Securities (Value is 0.02% of Net Assets) | $ | 72,352 | $ | 710,873 | $ | 15,050,683 | |||||
11. Credit Facility
The Fund, together with other U.S. registered and foreign investment funds (collectively, Borrowers), managed by Franklin Templeton Investments, are borrowers in a joint syndicated senior unsecured credit facility totaling $1.5 billion (Global Credit Facility) which matured on February 13, 2015. This Global Credit Facility provides a source of funds to the Borrowers for temporary and emergency purposes, including the ability to meet future unanticipated or unusually large redemption requests. Effective February 13, 2015, the Borrowers renewed the Global Credit Facility for a total of $2 billion, which matures on February 12, 2016.
Under the terms of the Global Credit Facility, the Fund shall, in addition to interest charged on any borrowings made by the Fund and other costs incurred by the Fund, pay its share of fees and expenses incurred in connection with the implementation and maintenance of the Global Credit Facility, based upon its relative share of the aggregate net assets of all of the Borrowers, including an annual commitment fee of 0.07% based upon the unused portion of the Global Credit Facility. These fees are reflected in other expenses on the Statement of Operations. During the year ended December 31, 2014, the Fund did not use the Global Credit Facility.
12. Fair Value Measurements
The Fund follows a fair value hierarchy that distinguishes between market data obtained from independent sources (observable inputs) and the Fund’s own market assumptions (unobservable inputs). These inputs are used in determining the value of the Fund’s financial instruments and are summarized in the following fair value hierarchy:
- Level 1 – quoted prices in active markets for identical financial instruments
- Level 2 – other significant observable inputs (including quoted prices for similar financial instruments, interest rates, prepayment speed, credit risk, etc.)
- Level 3 – significant unobservable inputs (including the Fund’s own assumptions in determining the fair value of financial instruments)
The input levels are not necessarily an indication of the risk or liquidity associated with financial instruments at that level.
For movements between the levels within the fair value hierarchy, the Fund has adopted a policy of recognizing the transfers as of the date of the underlying event which caused the movement.
38 | Annual Report
franklintempleton.com
FRANKLIN MUTUAL FINANCIAL SERVICES FUND
NOTES TO FINANCIAL STATEMENTS
A summary of inputs used as of December 31, 2014, in valuing the Fund’s assets and liabilities carried at fair value, is as follows:
| Level 1 | Level 2 | Level 3 | Total | |||||
| Assets: | ||||||||
| Investments in Securities: | ||||||||
| Equity Investments:a | ||||||||
| Banks | $ | 140,004,257 | $ | 4,567,225 | $ | — | $ | 144,571,482 |
| Diversified Financial Services | 14,987,127 | — | 5,496,455 | 20,483,582 | ||||
| All Other Equity Investmentsc | 237,463,254 | — | —b | 237,463,254 | ||||
| Corporate Bonds | — | 1,034,329 | — | 1,034,329 | ||||
| Companies in Liquidation | — | 1,941,526 | —b | 1,941,526 | ||||
| Short Term Investments | 37,098,314 | 500,000 | — | 37,598,314 | ||||
| Total Investments in Securities | $ | 429,552,952 | $ | 8,043,080 | $ | 5,496,455 | $ | 443,092,487 |
| Other Financial Instruments | ||||||||
| Futures Contracts | $ | 343,109 | $ | — | $ | — | $ | 343,109 |
| Forward Exchange Contracts | — | 7,760,928 | — | 7,760,928 | ||||
| Total Other Financial Instruments | $ | 343,109 | $ | 7,760,928 | $ | — | $ | 8,104,037 |
| Liabilities: | ||||||||
| Other Financial Instruments | ||||||||
| Forward Exchange Contracts | $ | — | $ | 302,535 | $ | — | $ | 302,535 |
| alncludes common, convertible preferred and preferred stocks as well as other equity investments. | ||||||||
| bIncludes securities determined to have no value at December 31, 2014. | ||||||||
| cFor detailed categories, see the accompanying Statement of Investments. | ||||||||
| A reconciliation of assets in which Level 3 inputs are used in determining fair value is presented when there are significant Level 3 | ||||||||||||||||||||||||||
| financial instruments at the end of the year. At December 31, 2014, the reconciliations of assets, is as follows: | ||||||||||||||||||||||||||
| Net Change | ||||||||||||||||||||||||||
| in Unrealized | ||||||||||||||||||||||||||
| Balance | Net | Net | Appreciation | |||||||||||||||||||||||
| at | Transfers | Transfers | Realized | Unrealized | Balance | (Depreciation) | ||||||||||||||||||||
| Beginning | Into | Out of | Cost Basis | Gain | Gain | at End | on Assets Held | |||||||||||||||||||
| of Year | Purchases | Sales | Level 3 | Level 3a Adjustmentsb | (Loss) | (Loss) | of Year | at Year End | ||||||||||||||||||
| Assets: | ||||||||||||||||||||||||||
| Investments in Securities: | ||||||||||||||||||||||||||
| Equity Investments:c | ||||||||||||||||||||||||||
| Banks | $ | 8,900,266 | $ | — | $ | (2,748,317 | ) | $ | — | $ | (10,173,155 | ) | $ | — | $ | 220,605 | $ | 3,800,601 | $ | — | $ | — | ||||
| Capital Markets | 19,734 | — | (20,180 | ) | — | — | — | (7,880 | ) | 8,326 | — | — | ||||||||||||||
| Diversified Financial | ||||||||||||||||||||||||||
| Services | 4,700,233 | — | — | — | — | — | — | 796,222 | 5,496,455 | 796,222 | ||||||||||||||||
| Insurance | 501,418 | d | — | (478,104 | ) | — | — | (1,948 | ) | (224,781 | ) | 203,415 | —d | 1,948 | ||||||||||||
| Total | $ | 14,121,651 | $ | — | $ | (3,246,601 | ) | $ | — | $ | (10,173,155 | ) | $ | (1,948) $ (12,056) | $ | 4,808,564 | $ | 5,496,455 | $ | 798,170 | ||||||
aThe investments were transferred out of Level 3 as a result of the removal of a significant unobservable valuation input and/or a corporate action.
bMay include accretion, amortization, partnership adjustments, and/or other cost basis adjustments.
cIncludes common and preferred stocks as well as other equity investments.
dIncludes securities determined to have no value.
franklintempleton.com
Annual Report
| 39
FRANKLIN MUTUAL FINANCIAL SERVICES FUND
NOTES TO FINANCIAL STATEMENTS
12. Fair Value Measurements (continued)
Significant unobservable valuation inputs developed by the VLOC for material Level 3 financial instruments and impact to fair value as a result of changes in unobservable valuation inputs as of December 31, 2014, are as follows:
| Impact to Fair | |||||||
| Fair Value at | Valuation | Amount/ | Value if Input | ||||
| Description | End of Year | Technique | Unobservable Inputs | Range | Increasesa | ||
| Assets: | |||||||
| Investments in Securities:b | |||||||
| Diversified Financial Services | $ | 5,496,455 | Discounted | Cost of equity | 16 | % | Decrease |
| cash flow | Long-term revenue | 6.2% - 29.0% | Increasec | ||||
| model | growth rate | ||||||
| Adjusted EBITDA margin | 5.0% - 26.9% | Increase |
aRepresents the directional change in the fair value of the Level 3 financial instruments that would result from a significant and reasonable increase in the corresponding
input. A significant and reasonable decrease in input would have the opposite effect. Significant impacts, if any, to fair value and/or net assets have been indicated.
bIncludes preferred stocks.
cRepresents a significant impact to fair value and net assets.
Abbreviations List
EBITDA Earnings before interest, taxes, depreciation and amortization
13. New Accounting Pronouncements
In June 2014, Financial Accounting Standards Board issued Accounting Standards Update (ASU) No. 2014-11, Transfers and Servicing (Topic 860), Repurchase-to-Maturity Transactions, Repurchase Financings, and Disclosures. The ASU changes the accounting for certain repurchase agreements and expands disclosure requirements related to repurchase agreements, securities lending, repurchase-to-maturity and similar transactions. The ASU is effective for interim and annual reporting periods beginning after December 15, 2014. Management has reviewed the requirements and believes the adoption of this ASU will not have a material impact on the financial statements.
14. Subsequent Events
The Fund has evaluated subsequent events through the issuance of the financial statements and determined that no events have occurred that require disclosure other than those already disclosed in the financial statements.
| Abbreviations | |||||
| Counterparty | Currency | Selected Portfolio | |||
| BANT | Bank of America N.A. | EUR | Euro | FHLB | Federal Home Loan Bank |
| BBU | Barclays Bank PLC | GBP | British Pound | IDR | International Depositary Receipt |
| BONY | Bank of New York Mellon | USD | United States Dollar | ||
| DBFX | Deutsche Bank AG | ||||
| FBCO | Credit Suisse Group AG | ||||
| HSBC | HSBC Bank USA, N.A. | ||||
| SCBT | Standard Chartered Bank | ||||
| SSBT | State Street Bank and Trust Co., N.A. | ||||
40 | Annual Report
franklintempleton.com
FRANKLIN MUTUAL FINANCIAL SERVICES FUND
Report of Independent Registered Public Accounting Firm
To the Board of Trustees of Franklin Mutual Series Funds and Shareholders of Franklin Mutual Financial Services Fund:
We have audited the accompanying statement of assets and liabilities, including the statement of investments, of Franklin Mutual Financial Services Fund (formerly, Mutual Financial Services Fund) (the “Fund”) (one of the funds constituting Franklin Mutual Series Funds), as of December 31, 2014, and the related statement of operations for the year then ended, the statements of changes in net assets for each of the two years in the period then ended, and the financial highlights for each of the periods indicated therein. These financial statements and financial highlights are the responsibility of the Fund’s management. Our responsibility is to express an opinion on these financial statements and financial highlights based on our audits.
We conducted our audits in accordance with the standards of the Public Company Accounting Oversight Board (United States). Those standards require that we plan and perform the audit to obtain reasonable assurance about whether the financial statements and financial highlights are free of material misstatement. We were not engaged to perform an audit of the Fund’s internal control over financial reporting. Our audits included consideration of internal control over financial reporting as a basis for designing audit procedures that are appropriate in the circumstances, but not for the purpose of expressing an opinion on the effectiveness of the Fund’s internal control over financial reporting. Accordingly, we express no such opinion. An audit also includes examining, on a test basis, evidence supporting the amounts and disclosures in the financial statements and financial highlights, assessing the accounting principles used and significant estimates made by management, and evaluating the overall financial statement presentation. Our procedures included confirmation of securities owned as of December 31, 2014, by correspondence with the custodian and brokers or by other appropriate auditing procedures where replies from the brokers were not received. We believe that our audits provide a reasonable basis for our opinion.
In our opinion, the financial statements and financial highlights referred to above present fairly, in all material respects, the financial position of Franklin Mutual Financial Services Fund (one of the funds constituting Franklin Mutual Series Funds) at December 31, 2014, the results of its operations for the year then ended, the changes in its net assets for each of the two years in the period then ended, and the financial highlights for each of the periods indicated therein, in conformity with U.S. generally accepted accounting principles.

Boston, Massachusetts
February 18, 2015
franklintempleton.com
Annual Report
| 41
FRANKLIN MUTUAL FINANCIAL SERVICES FUND
Tax Information (unaudited)
Under Section 854(b)(1)(A) of the Internal Revenue Code (Code), the Fund hereby reports 28.71% of the ordinary income dividends as income qualifying for the dividends received deduction for the fiscal year ended December 31, 2014.
Under Section 854(b)(1)(B) of the Code, the Fund hereby reports the maximum amount allowable but no less than $8,402,095 as qualified dividends for purposes of the maximum rate under Section 1(h)(11) of the Code for the fiscal year ended December 31, 2014. Distributions, including qualified dividend income, paid during calendar year 2014 will be reported to shareholders on Form 1099-DIV by mid-February 2015. Shareholders are advised to check with their tax advisors for information on the treatment of these amounts on their individual income tax returns.
42 | Annual Report
franklintempleton.com
FRANKLIN MUTUAL FINANCIAL SERVICES FUND
Board Members and Officers
The name, year of birth and address of the officers and board members, as well as their affiliations, positions held with the Fund, principal occupations during at least the past five years and number of portfolios overseen in the Franklin Templeton Investments fund complex are shown below. Generally, each board member serves until that person’s successor is elected and qualified.
| Independent Board Members | ||||
| Number of Portfolios in | ||||
| Name, Year of Birth | Length of | Fund Complex Overseen | Other Directorships Held During | |
| and Address | Position | Time Served | by Board Member* | at Least the Past 5 Years |
| Edward I. Altman, Ph.D. (1941) | Trustee | Since 1987 | 10 | None |
| c/o Franklin Mutual Advisers, LLC | ||||
| 101 John F. Kennedy Parkway | ||||
| Short Hills, NJ 07078-2789 | ||||
Principal Occupation During at Least the Past 5 Years:
Max L. Heine Professor of Finance and Director of The Credit and Debt Markets Research Program, Salomon Center, Stern School of Business, New York University; editor and author of numerous financial publications; financial consultant; an adviser to numerous financial and publishing organizations; and formerly, Vice Director, Salomon Center, Stern School of Business, New York University.
| Ann Torre Bates (1958) | Trustee | Since 1995 | 36 | Navient Corporation (loan |
| c/o Franklin Mutual Advisers, LLC | management, servicing and asset | |||
| 101 John F. Kennedy Parkway | recovery) (May 2014), Ares Capital | |||
| Short Hills, NJ 07078-2789 | Corporation (specialty finance | |||
| company) (2010-present), United | ||||
| Natural Foods, Inc. (distributor of | ||||
| natural, organic and specialty foods) | ||||
| (2013-present), Allied Capital | ||||
| Corporation (financial services) | ||||
| (2003-2010) and SLM Corporation | ||||
| (Sallie Mae) (1997-2014). | ||||
Principal Occupation During at Least the Past 5 Years:
Director of various companies; and formerly, Executive Vice President and Chief Financial Officer, NHP Incorporated (manager of multifamily housing) (1995-1997); and Vice President and Treasurer, US Airways, Inc. (until 1995).
| Burton J. Greenwald (1929) Trustee | Since 2002 | 17 | Franklin Templeton Emerging Markets |
| c/o Franklin Mutual Advisers, LLC | Debt Opportunities Fund PLC and | ||
| 101 John F. Kennedy Parkway | Fiduciary International Ireland Limited. | ||
| Short Hills, NJ 07078-2789 |
Principal Occupation During at Least the Past 5 Years:
Managing Director, B.J. Greenwald Associates (management consultants to the financial services industry); and formerly, Chairman, Fiduciary Trust International Funds; Executive Vice President, L.F Rothschild Fund Management, Inc.; President and Director, Merit Mutual Funds; President, Underwriting Division and Director, National Securities & Research Corporation; Governor, Investment Company Institute; and Chairman, ICI Public Information Committee.
| Keith E. Mitchell (1954) | Trustee | Since 2009 | 10 | None |
| c/o Franklin Mutual Advisers, LLC | ||||
| 101 John F. Kennedy Parkway | ||||
| Short Hills, NJ 07078-2789 | ||||
Principal Occupation During at Least the Past 5 Years:
Managing Member, Mitchell, Hartley & Bechtel Advisers, LLC (formerly, Mitchell Advisers, LLC) (advisory firm); director of various boards of asset management firms; and formerly, Managing Director, Putnam Lovell NBF.
franklintempleton.com
Annual Report
| 43
FRANKLIN MUTUAL FINANCIAL SERVICES FUND
| Independent Board Members (continued) | ||||
| Number of Portfolios in | ||||
| Name, Year of Birth | Length of | Fund Complex Overseen | Other Directorships Held During | |
| and Address | Position | Time Served | by Board Member* | at Least the Past 5 Years |
| Charles Rubens II (1930) | Trustee | Since 1998 | 17 | None |
| c/o Franklin Mutual Advisers, LLC | ||||
| 101 John F. Kennedy Parkway | ||||
| Short Hills, NJ 07078-2789 | ||||
Principal Occupation During at Least the Past 5 Years:
Private investor and president of non-profit organizations; and formerly, an executive of Time, Inc.; and Trustee of Colorado College.
| Jan Hopkins Trachtman (1947) Trustee | Since 2009 | 10 | None |
| c/o Franklin Mutual Advisers, LLC | |||
| 101 John F. Kennedy Parkway | |||
| Short Hills, NJ 07078-2789 |
Principal Occupation During at Least the Past 5 Years:
President and Founder, The Jan Hopkins Group (communications consulting firm); President, Economic Club of New York; serves on Advisory Board of Knight Bagehot Fellowship; and formerly, Anchor/Correspondent, CNN Financial News (until 2003); Managing Director and Head of Client Communications, Citigroup Private Bank (until 2005); Off-Air Reporter, ABC News’ World News Tonight; and Editor, CBS Network News.
| Robert E. Wade (1946) | Trustee and | Trustee since 1993 43 | El Oro Ltd (investments). | |
| c/o Franklin Mutual Advisers, LLC Chairman of | and Chairman of | |||
| 101 John F. Kennedy Parkway | the Board | the Board since | ||
| Short Hills, NJ 07078-2789 | 2005 | |||
| Principal Occupation During at Least the Past 5 Years: | ||||
| Attorney at law engaged in private practice (1972-2008) and member of various boards. | ||||
| Interested Board Members and Officers | ||||
| Number of Portfolios in | ||||
| Name, Year of Birth | Length of | Fund Complex Overseen | Other Directorships Held During | |
| and Address | Position | Time Served | by Board Member* | at Least the Past 5 Years |
| **Gregory E. Johnson (1961) | Trustee | Since 2007 | 147 | None |
| One Franklin Parkway | ||||
| San Mateo, CA 94403-1906 | ||||
Principal Occupation During at Least the Past 5 Years:
Chairman of the Board, Member – Office of the Chairman, Director, President and Chief Executive Officer, Franklin Resources, Inc.; officer and/or director or trustee, as the case may be, of some of the other subsidiaries of Franklin Resources, Inc. and of 44 of the investment companies in Franklin Templeton Investments; and Vice Chairman, Investment Company Institute.
| **Peter A. Langerman (1955) | Trustee, | Trustee since | 10 | American International Group, Inc. | |
| c/o Franklin Mutual Advisers, LLC President, and | 2007, President, | (AIG) Credit Facility Trust | |||
| 101 John F. Kennedy Parkway | Chief Executive and Chief | (2010–2011). | |||
| Short Hills, NJ 07078-2702 | Officer – | Executive Officer – | |||
| Investment | Investment | ||||
| Management | Management since | ||||
| 2005 | |||||
Principal Occupation During at Least the Past 5 Years:
Chairman of the Board, Chief Executive Officer and President, Franklin Mutual Advisers, LLC; officer and/or director, as the case may be, of four of the investment companies in Franklin Templeton Investments.
44 | Annual Report
franklintempleton.com
FRANKLIN MUTUAL FINANCIAL SERVICES FUND
| Interested Board Members and Officers (continued) | ||||
| Number of Portfolios in | ||||
| Name, Year of Birth | Length of | Fund Complex Overseen | Other Directorships Held During | |
| and Address | Position | Time Served | by Board Member* | at Least the Past 5 Years |
| Alison E. Baur (1964) | Vice President | Since 2012 | Not Applicable | Not Applicable |
| One Franklin Parkway | ||||
| San Mateo, CA 94403-1906 | ||||
Principal Occupation During at Least the Past 5 Years:
Deputy General Counsel, Franklin Templeton Investments; and officer of some of the other subsidiaries of Franklin Resources, Inc. and of 46 of the investment companies in Franklin Templeton Investments.
| Philippe Brugere-Trelat (1949) | Vice President | Since 2005 | Not Applicable | Not Applicable |
| 101 John F. Kennedy Parkway | ||||
| Short Hills NJ 07078-2789 |
Principal Occupation During at Least the Past 5 Years:
Executive Vice President, Franklin Mutual Advisers, LLC; officer of three of the investment companies in Franklin Templeton Investments; and formerly, Portfolio Manager of Eurovest SA (French registered Investment Company, Sicav).
| Laura F. Fergerson (1962) | Chief | Since 2009 | Not Applicable | Not Applicable |
| One Franklin Parkway | Executive | |||
| San Mateo, CA 94403-1906 | Officer – | |||
| Finance and | ||||
| Administration |
Principal Occupation During at Least the Past 5 Years:
Senior Vice President, Franklin Templeton Services, LLC; and officer of 46 of the investment companies in Franklin Templeton Investments
| Aliya S. Gordon (1973) | Vice President | Since 2009 | Not Applicable | Not Applicable |
| One Franklin Parkway | ||||
| San Mateo, CA 94403-1906 |
Principal Occupation During at Least the Past 5 Years:
Senior Associate General Counsel, Franklin Templeton Investments; officer of 46 of the investment companies in Franklin Templeton Investments; and formerly, Litigation Associate, Steefel, Levitt & Weiss, LLP (2000-2004).
| Steven J. Gray (1955) | Secretary and | Secretary since | Not Applicable | Not Applicable |
| One Franklin Parkway | Vice President | 2005 and Vice | ||
| San Mateo, CA 94403-1906 | President since | |||
| 2009 |
Principal Occupation During at Least the Past 5 Years:
Senior Associate General Counsel, Franklin Templeton Investments; Vice President, Franklin Templeton Distributors, Inc. and Franklin Alternative Strategies Advisers, LLC; and officer of 46 of the investment companies in Franklin Templeton Investments.
| Selena L. Holmes (1965) | Vice President | Since 2012 | Not Applicable | Not Applicable |
| 100 Fountain Parkway | – AML | |||
| St. Petersburg, FL 33716-1205 | Compliance |
Principal Occupation During at Least the Past 5 Years:
Director, Global Compliance Monitoring; Chief Compliance Officer, Franklin Alternative Strategies Advisers, LLC; Vice President, Franklin Templeton Companies, LLC; and officer of 46 of the investment companies in Franklin Templeton Investments.
franklintempleton.com
Annual Report
| 45
| FRANKLIN MUTUAL FINANCIAL SERVICES FUND | ||||
| Interested Board Members and Officers (continued) | ||||
| Number of Portfolios in | ||||
| Name, Year of Birth | Length of | Fund Complex Overseen | Other Directorships Held During | |
| and Address | Position | Time Served | by Board Member* | at Least the Past 5 Years |
| Robert G. Kubilis (1973) | Treasurer, | Since 2012 | Not Applicable | Not Applicable |
| 300 S.E. 2nd Street | Chief Financial | |||
| Fort Lauderdale, FL 33301-1923 | Officer and | |||
| Chief | ||||
| Accounting | ||||
| Officer | ||||
Principal Occupation During at Least the Past 5 Years:
Assistant Treasurer, Fund Accounting, Franklin Templeton Investments; and officer of four of the investment companies in Franklin Templeton Investments.
| Kimberly H. Novotny (1972) Vice President | Since 2013 | Not Applicable | Not Applicable |
| 300 S.E. 2nd Street | |||
| Fort Lauderdale, FL 33301-1923 |
Principal Occupation During at Least the Past 5 Years:
Associate General Counsel, Franklin Templeton Investments; Vice President and Secretary, Fiduciary Trust International of the South; Vice President, Templeton Investment Counsel, LLC; Assistant Secretary, Franklin Resources, Inc.; and officer of 46 of the investment companies in Franklin Templeton Investments.
| Robert C. Rosselot (1960) | Chief | Since 2013 | Not Applicable | Not Applicable |
| 300 S.E. 2nd Street | Compliance | |||
| Fort Lauderdale, FL 33301-1923 | Officer |
Principal Occupation During at Least the Past 5 Years:
Director, Global Compliance, Franklin Templeton Investments; Vice President, Franklin Templeton Companies, LLC; officer of 46 of the investment companies in Franklin Templeton Investments; and formerly, Senior Associate General Counsel, Franklin Templeton Investments (2007-2013); and Secretary and Vice President, Templeton Group of Funds (2004-2013).
| Karen L. Skidmore (1952) | Vice President | Since 2009 | Not Applicable | Not Applicable |
| One Franklin Parkway | ||||
| San Mateo, CA 94403-1906 |
Principal Occupation During at Least the Past 5 Years:
Senior Associate General Counsel, Franklin Templeton Investments; and officer of 46 of the investment companies in Franklin Templeton Investments.
| Craig S. Tyle (1960) | Vice President | Since 2005 | Not Applicable | Not Applicable |
| One Franklin Parkway | ||||
| San Mateo, CA 94403-1906 |
Principal Occupation During at Least the Past 5 Years:
General Counsel and Executive Vice President, Franklin Resources, Inc.; and officer of some of the other subsidiaries of Franklin Resources, Inc. and of 46 of the investment companies in Franklin Templeton Investments.
46 | Annual Report
franklintempleton.com
FRANKLIN MUTUAL FINANCIAL SERVICES FUND
| Interested Board Members and Officers (continued) | ||||
| Number of Portfolios in | ||||
| Name, Year of Birth | Length of | Fund Complex Overseen | Other Directorships Held During | |
| and Address | Position | Time Served | by Board Member* | at Least the Past 5 Years |
| Lori A. Weber (1964) | Vice President | Since 2011 | Not Applicable | Not Applicable |
| 300 S.E. 2nd Street | ||||
| Fort Lauderdale, FL 33301-1923 | ||||
Principal Occupation During at Least the Past 5 Years:
Senior Associate General Counsel, Franklin Templeton Investments; Assistant Secretary, Franklin Resources, Inc.; Vice President and Secretary, Templeton Investment Counsel, LLC; Vice President, Fiduciary Trust International of the South; and officer of 46 of the investment companies in Franklin Templeton Investments.
*We base the number of portfolios on each separate series of the U.S. registered investment companies within the Franklin Templeton Investments fund complex. These portfolios have a common investment manager or affiliated investment managers.
**Gregory E. Johnson is considered to be an interested person of the Fund under the federal securities laws due to his position as an officer and director of Franklin Resources, Inc., which is the parent company of the Fund’s investment manager and distributor. Peter A. Langerman is considered to be an interested person of the Fund under the federal securities laws due to his position as an officer of Franklin Mutual Advisers, LLC, which is an affiliate of the Fund’s investment manager.
Note 1: Officer information is current as of the date of this report. It is possible that after this date, information about officers may change.
The Fund’s Board has determined that certain of the members of the Audit Committee, including Ann Torre Bates, are audit committee financial experts, and “independent,” under those provisions of the Sarbanes-Oxley Act of 2002, and the rules and form amendments adopted by the Securities and Exchange Commission, relating to audit committee financial experts.
The Statement of Additional Information (SAI) includes additional information about the board members and is available, without charge, upon request.
Shareholders may call (800) DIAL BEN/342-5236 to request the SAI.
franklintempleton.com
Annual Report
| 47
FRANKLIN MUTUAL FINANCIAL SERVICES FUND
Shareholder Information
Proxy Voting Policies and Procedures
The Fund’s investment manager has established Proxy Voting Policies and Procedures (Policies) that the Fund uses to determine how to vote proxies relating to portfolio securities. Shareholders may view the Fund’s complete Policies online at franklintempleton.com. Alternatively, shareholders may request copies of the Policies free of charge by calling the Proxy Group collect at (954) 527-7678 or by sending a written request to: Franklin Templeton Companies, LLC, 300 S.E. 2nd Street, Fort Lauderdale, FL 33301, Attention: Proxy Group. Copies of the Fund’s proxy voting records are also made available online at franklintempleton.com and posted on the U.S. Securities and Exchange Commission’s website at sec.gov and reflect the most recent 12-month period ended June 30.
Quarterly Statement of Investments
The Fund files a complete statement of investments with the U.S. Securities and Exchange Commission for the first and third quarters for each fiscal year on Form N-Q. Shareholders may view the filed Form N-Q by visiting the Commission’s website at sec.gov. The filed form may also be viewed and copied at the Commission’s Public Reference Room in Washington, DC. Information regarding the operations of the Public Reference Room may be obtained by calling (800) SEC-0330.
Householding of Reports and Prospectuses
You will receive the Fund’s financial reports every six months as well as an annual updated summary prospectus (prospectus available upon request). To reduce Fund expenses, we try to identify related shareholders in a household and send only one copy of the financial reports and summary prospectus. This process, called “householding,” will continue indefinitely unless you instruct us otherwise. If you prefer not to have these documents householded, please call us at (800) 632-2301. At any time you may view current prospectuses/summary prospectuses and financial reports on our website. If you choose, you may receive these documents through electronic delivery.
48 | Annual Report
franklintempleton.com
Annual Report and Shareholder Letter
Franklin Mutual Financial Services Fund
Formerly, Mutual Financial Services Fund
Investment Manager
Franklin Mutual Advisers, LLC
Distributor
Franklin Templeton Distributors, Inc.
(800) DIAL BEN® / 342-5236
franklintempleton.com
Shareholder Services
(800) 632-2301 - (Class A, C & R6)
(800) 448-FUND - (Class Z)
Authorized for distribution only when accompanied or preceded by a summary prospectus and/or prospectus. Investors should carefully consider a fund’s investment goals, risks, charges and expenses before investing. A prospectus contains this and other information; please read it carefully before investing.
To help ensure we provide you with quality service, all calls to and from our service areas are monitored and/or recorded.
| © 2015 Franklin Templeton Investments. All rights reserved. | 479 A 02/15 |
Annual Report
and Shareholder Letter
December 31, 2014
Franklin Mutual Global Discovery Fund
Formerly, Mutual Global Discovery Fund

Sign up for electronic delivery at franklintempleton.com/edelivery
Franklin Templeton Investments
Gain From Our Perspective®
At Franklin Templeton Investments, we’re dedicated to one goal: delivering exceptional asset management for our clients. By bringing together multiple, world-class investment teams in a single firm, we’re able to offer specialized expertise across styles and asset classes, all supported by the strength and resources of one of the world’s largest asset managers. This has helped us to become a trusted partner to individual and institutional investors across the globe.
Focus on Investment Excellence
At the core of our firm, you’ll find multiple independent investment teams—each with a focused area of expertise—from traditional to alternative strategies and multi-asset solutions. And because our portfolio groups operate autonomously, their strategies can be combined to deliver true style and asset class diversification.
All of our investment teams share a common commitment to excellence grounded in rigorous, fundamental research and robust, disciplined risk management. Decade after decade, our consistent, research-driven processes have helped Franklin Templeton earn an impressive record of strong, long-term results.
Global Perspective Shaped by Local Expertise
In today’s complex and interconnected world, smart investing demands a global perspective. Franklin Templeton pioneered international investing over 60 years ago, and our expertise in emerging markets spans more than a quarter of a century. Today, our investment professionals are on the ground across the globe, spotting investment ideas and potential risks firsthand. These locally based teams bring in-depth understanding of local companies, economies and cultural nuances, and share their best thinking across our global research network.
Strength and Experience
Franklin Templeton is a global leader in asset management serving clients in over 150 countries.1 We run our business with the same prudence we apply to asset management, staying focused on delivering relevant investment solutions, strong long-term results and reliable, personal service. This approach, focused on putting clients first, has helped us to become one of the most trusted names in financial services.
1. As of 12/31/13. Clients are represented by the total number of shareholder accounts.
Not FDIC Insured | May Lose Value | No Bank Guarantee
| Contents | |
| Shareholder Letter | 1 |
| Annual Report | |
| Franklin Mutual | |
| Global Discovery Fund | 4 |
| Performance Summary | 9 |
| Your Fund’s Expenses | 14 |
| Financial Highlights and | |
| Statement of Investments | 16 |
| Financial Statements | 29 |
| Notes to Financial Statements | 33 |
| Report of Independent Registered | |
| Public Accounting Firm | 48 |
| Tax Information | 49 |
| Board Members and Officers | 50 |
| Shareholder Information | 55 |
1
Annual Report
Franklin Mutual Global Discovery Fund
(formerly, Mutual Global Discovery Fund)
This annual report for Franklin Mutual Global Discovery Fund covers the fiscal year ended December 31, 2014.
Your Fund’s Goal and Main Investments
The Fund seeks capital appreciation, which may occasionally be short term, by investing primarily in equity securities of companies of any nation the Fund’s managers believe are at prices below their intrinsic value. The Fund may invest up to 100% of its assets in foreign securities.
Performance Overview
The Fund’s Class Zshares delivered a +5.33% cumulative total return for the 12 months ended December 31, 2014. For comparison, the MSCI World Index, which tracks stock performance in global developed markets, generated a +5.50% total return, and the Standard & Poor’s 500 Index (S&P 500), which is a broad measure of U.S. stock performance, posted a +13.69% total return.1 You can find more of the Fund’s performance data in the Performance Summary beginning on page 9.
Performance data represent past performance, which does not guarantee future results. Investment return and principal value will fluctuate, and you may have a gain or loss when you sell your shares. Current performance may differ from figures shown. Please visit franklintempleton.com or call (800) 342-5236 for most recent month-end performance.
Economic and Market Overview
The global economy grew moderately during the 12 months under review as U.S. economic growth expanded while growth rates in much of the rest of the world declined. As measured by the MSCI World Index, stocks in global developed markets advanced overall during the 12-month period amid a generally accommodative monetary policy environment and continued strength in corporate earnings. Oil prices declined sharply during the 12-month period, resulting from weak global demand growth and strong world supply, and gold prices ended lower amid benign global inflation and a strong U.S. dollar.
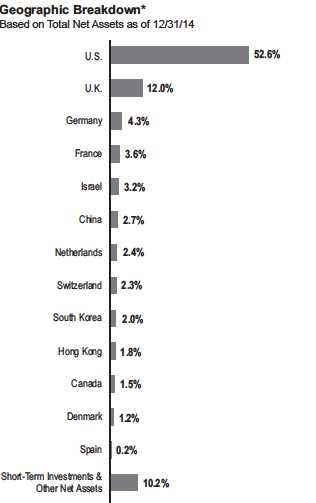
*Weightings may be negative or may not total 100% due to rounding, use of any derivatives, unsettled trades or other factors.
U.S. economic growth trends were generally encouraging during the period. Economic activity expanded for most of 2014, supported in some quarters by increased consumer spending, business investment and federal defense spending. The U.S. Federal Reserve Board (Fed) began reducing its large-scale bond purchases $10 billion a month in January and ended the buying program in October. But it continued its
1. Source: Morningstar.
The indexes are unmanaged and include reinvested dividends. One cannot invest directly in an index, and an index is not representative of the Fund’s portfolio. See www.franklintempletondatasources.com for additional data provider information.
The dollar value, number of shares or principal amount, and names of all portfolio holdings are listed in the Fund’s Statement of Investments (SOI).
The SOI begins on page 21.
4 | Annual Report
franklintempleton.com
FRANKLIN MUTUAL GLOBAL DISCOVERY FUND
practice of maintaining holdings of longer term securities at sizable levels. The Fed believed underlying economic strength could support ongoing progress in labor market conditions. Toward period-end, the Fed stated that it could be patient with regard to raising interest rates and that the interest rate might not rise for at least a couple of meetings, possibly implying at least the first two meetings of 2015.
Outside the U.S., the U.K. economy grew relatively well, supported by the services and manufacturing sectors. In the eurozone, economic growth remained subdued, as concerns persisted about the potential negative impacts to growth from the crisis in Ukraine and China’s moderating growth rate. However, third-quarter economic growth, though meager, exceeded expectations, especially in the region’s major economies of Germany and France. In June, the European Central Bank (ECB) reduced its main interest rate and, for the first time, set a negative deposit rate;the ECB reduced both rates again in September. The ECB broadened its monetary easing stance by implementing an asset purchase program to prevent deflation and stimulate the economy. Toward period-end, the ECB cut its 2014 growth forecast for the eurozone and attributed the reduction to geopolitical risks dampening confidence and private investment.
Japan’s second-and third-quarter economic contractions indicated the economy was in a recession. However, private consumption and exports improved in the third quarter. In October, the Bank of Japan expanded its stimulus measures amid weak domestic demand and as substantially lower crude oil prices exerted further downward pressure on inflation. Toward period-end, Japan’s ruling coalition was reelected in early parliamentary elections and subsequently announced a fresh stimulus package aimed at reviving economic growth.
In several emerging markets, economic growth generally moderated. However, Brazil exited recession as government spending prior to a presidential election drove third-quarter economic growth. Emerging market equities, as measured by the MSCI Emerging Markets Index, fell for the 12-month period, amid headwinds such as soft domestic demand and weak exports in several countries. Falling crude oil prices and geopolitical tensions in certain regions, as well as concerns about the timing of U.S. interest rate increases, also pressured emerging market equities. Many emerging market currencies depreciated against the U.S. dollar, leading central banks in several countries to raise interest rates in an effort to curb inflation and support their currencies. Several other central banks lowered interest rates to promote economic growth. After implementing monetary stimulus measures to support
| Top10Sectors/Industries | ||
| Basedon EquitySecuritiesasof 12/31/14 | ||
| % of Total | ||
| Net Assets | ||
| Banks | 14.1 | % |
| Insurance | 8.7 | % |
| Oil,Gas& Consumable Fuels | 6.8 | % |
| Pharmaceuticals | 6.8 | % |
| Media | 6.7 | % |
| Tobacco | 4.9 | % |
| Software | 4.3 | % |
| Food& StaplesRetailing | 3.4 | % |
| TechnologyHardware,Storage & Peripherals | 3.4 | % |
| HealthCare Equipment & Supplies | 2.9 | % |
specific sectors, China’s central bank increased its efforts to bolster the economy by cutting its benchmark interest rates for the first time since July 2012. In contrast, Russia’s central bank raised its key interest rate sharply toward period-end to limit further devaluation of the Russian ruble and contain rising inflation.
Investment Strategy
At Mutual Series, we are committed to our distinctive value approach to investing, which we believe can generate above-average risk-adjusted returns over time for our shareholders. Our major investment strategy is investing in undervalued stocks. When selecting undervalued equities, we are attracted to fundamentally strong companies with healthy balance sheets, high-quality assets, substantial free cash flow and shareholder-oriented management teams and whose stocks are trading at discounts to our assessment of the companies’ intrinsic or business value. We also look for asset rich companies whose shares may be trading at depressed levels due to concerns over short-term earnings disappointments, litigation, management strategy or other perceived negatives. This strict value approach is not only intended to improve the likelihood of upside potential, but it is also intended to reduce the risk of substantial declines. While the vast majority of our undervalued equity investments are made in publicly traded companies globally, we may invest occasionally in privately held companies as well.
We complement this more traditional investment strategy with two others. One is distressed investing, a highly specialized field that has proven quite profitable during certain periods over the years. Distressed investing is complex and can take many forms. The most common distressed investment the Fund undertakes is the purchase of financially troubled or bankrupt companies’ debt at a substantial discount to face value. After
franklintempleton.com
Annual Report
| 5
FRANKLIN MUTUAL GLOBAL DISCOVERY FUND
the financially distressed company is reorganized, often in bankruptcy court, the old debt is typically replaced with new securities issued by the financially stronger company.
The other piece of our investment strategy is participating in arbitrage situations, another highly specialized field. When companies announce proposed mergers or takeovers, commonly referred to as “deals,” the target company may trade at a discount to the bid it ultimately accepts. One form of arbitrage involves purchasing the target company’s stock when it is trading below the value we believe it would receive in a deal. In keeping with our commitment to a relatively conservative investment approach, we typically focus our arbitrage efforts on announced deals, and eschew rumored deals or other situations we consider relatively risky.
In addition, it is our practice to hedge the Fund’s currency exposure when we deem it advantageous for our shareholders.
W hat is meant by “hedge”?
To hedge an investment isto take a position intendedto offset potential losses/gainsthat maybe incurredbya companion financial instrument.
Manager’s Discussion
Many Fund holdings increased in value during the 12-month period. Top contributors to performance included technology leader Apple, Teva Pharmaceutical Industries and software company Microsoft.
During the year Apple reported consistently good quarterly results, driven by its strong iPhone business. In addition, the company announced a trio of shareholder friendly actions. These included an enhanced share repurchase program of $90 billion, up from $60 billion, with the same end date of December 2015, an 8% increase in the dividend, and a seven-for-one stock split that went into effect in early June. In September, the company released its highly anticipated iPhone 6, which sold 10 million units in its first two days. The iPhone sales drove a strong fiscal fourth quarter via healthy sales volumes and a strong product mix that led to a higher average selling price for the period. In October, the company refreshed its product line-up ahead of the holiday season, including launches of the new iPad Air 2, iPad Mini 3, iMac with Retina Display and an updated Mac Mini. Apple also announced the commencement of support for Apple Pay, its mobile payment and digital wallet application.
The performance of Israel-based Teva Pharmaceutical Industries was largely driven by positive events related to the company’s most profitable drug, Copaxone, used to prevent the relapse of
| Top10Equity Holdings | ||
| 12/31/14 | ||
| Company | % of Total | |
| Sector/Industry, Country | Net Assets | |
| Merck & Co. Inc. | 2.1 | % |
| Pharmaceuticals, U.S. | ||
| Teva Pharmaceutical IndustriesLtd.,ADR | 2.0 | % |
| Pharmaceuticals, Israel | ||
| Medtronic Inc. | 1.9 | % |
| Health Care Equipment & Supplies, U.S. | ||
| Microsoft Corp. | 1.8 | % |
| Software, U.S. | ||
| Apple Inc. | 1.8 | % |
| Technology Hardware, Storage & Peripherals, U.S. | ||
| WellsFargo & Co. | 1.6 | % |
| Banks, U.S. | ||
| ACE Ltd. | 1.5 | % |
| Insurance, U.S. | ||
| BritishAmerican Tobacco PLC | 1.5 | % |
| Tobacco, U.K. | ||
| Royal DutchShell PLC,A | 1.4 | % |
| Oil, Gas & Consumable Fuels, U.K. | ||
| Volkswagen AG,pfd. | 1.4 | % |
| Automobiles, Germany |
multiple sclerosis. In March, the U.S. Supreme Court agreed to hear Teva’s appeal (with oral arguments occurring in October) to maintain a patent, which further delayed the entrance of generic competition. The delay provided Teva the opportunity to convert more U.S. patients to its new formulation and allowed it to potentially retain a higher portion of the franchise once generic alternatives entered the market. In December, Teva received more good news regarding Copaxone with the new formulation gaining European Union approval. Investors also reacted favorably to the January 2014 announcement of a new chief executive officer (CEO) as the market believed he could successfully carry on Teva’s cost-cutting restructuring program.
Microsoft shares rose as the company named a new CEO in February. We viewed the hiring of Microsoft insider Satya Nadella as positive given his technical background and track record of reaching beyond Microsoft and embracing other technologies. A good example of Nadella’s openness was the March announcement that the company’s Office productivity suite would be made available for the Apple iPad. Nadella also announced a restructuring plan in July. The restructuring was intended to simplify the company’s operations and align the recently acquired Nokia Devices and Services business with the overall strategy.
During the period under review, some of the Fund’s investments negatively affected performance. These included retailers Metro and Tesco, and energy exploration and production firm Apache.
6 | Annual Report
franklintempleton.com
FRANKLIN MUTUAL GLOBAL DISCOVERY FUND
Upheaval in Ukraine and Russia’s involvement disrupted Germany-based retailer Metro’s planned partial initial public offering (IPO) of its Russia cash-and-carry business. The IPO was important as it would have provided a benchmark valuation for this important Metro operation and allowed Metro to fund growth and further reduce debt with the capital raised. Instead, the company sought to raise cash by selling other non-core assets, such as the September sale of its stake in U.K.-based Booker and its operations in Vietnam. As of year-end, we believed the market assigned little value to Metro’s Russian operations, despite the fact that the business has continued to perform well amid deteriorating economic conditions within Russia. In our view, Metro stock has material upside potential should the situation in Ukraine be resolved and conditions in Russia improve in a reasonable time frame.
Shares of U.K.-based Tesco fell throughout 2014. In March, the stock declined as investors became more concerned about price competition from major discounters and competitor supermarkets. Then in August, Tesco issued an unexpected trading statement ahead of its scheduled first-half results. The company lowered its profit guidance primarily for its flagship U.K. operations and cut its dividend. The stock price took a further hit in September with the announcement of material accounting irregularities in Tesco’s core U.K. operations and a contemporaneous change of both the company’s CEO and chief financial officer. At year-end, the Fund no longer held Tesco shares.
Share prices of energy sector companies almost universally plunged during the second half of 2014, driven by an oil price collapse of nearly 50%. Apache was hit especially hard due to its current restructuring efforts. In early May, Apache took a significant step in its program of monetizing capital-intensive, long-lead-time assets, selling non-producing deepwater oil and gas projects in the Gulf of Mexico that were a drain on cash flow. However, during the second half of 2014, investors became concerned that Apache’s attempts to sell additional assets would be unsuccessful and failed asset sales would result in a weak balance sheet at a time of depressed commodity prices. In December, Apache sold its liquefied natural gas assets and some upstream Australian assets for $2.75 billion. In our view, the sales materially strengthened the company’s balance sheet and could result in reduced future capital requirements.
During the period, the Fund held currency forwards and futures to hedge a portion of the currency risk of the portfolio’s non-U.S. dollar investments. The hedges had a positive impact on the Fund’s performance.
CFA® is a trademark owned by CFA Institute.
W hat is a currency forward contract?
A currencyforwardcontract,or a currencyforward,isan agreement between the Fundanda counterpartyto buyor sell a foreign currencyat a specific exchange rate on a future date.
W hat is a futures contract?
Afuturescontract,or a future,isan agreement between the Fund anda counterpartymade througha U.S. or foreign futures exchange to buyor sell an asset at a specific price on a future date.
As fellow shareholders, we found recent relative performance disappointing, but it is not uncommon for our strategy to lag amid a strong equity market. We remain committed to our disciplined, value investment approach as we seek to generate attractive, long-term, risk-adjusted returns for shareholders. Thank you for your continued participation in Franklin Mutual Global Discovery Fund. We look forward to continuing to serve your investment needs.

franklintempleton.com
Annual Report
| 7
FRANKLIN MUTUAL GLOBAL DISCOVERY FUND
The foregoing information reflects our analysis, opinions and portfolio holdings as of December 31, 2014, the end of the reporting period. The way we implement our main investment strategies and the resulting portfolio holdings may change depending on factors such as market and economic conditions. These opinions may not be relied upon as investment advice or an offer for a particular security. The information is not a complete analysis of every aspect of any market, country, industry, security or the Fund. Statements of fact are from sources considered reliable, but the investment manager makes no representation or warranty as to their completeness or accuracy. Although historical performance is no guarantee of future results, these insights may help you understand our investment management philosophy.
Peter Langerman has been portfolio manager for Franklin Mutual Global Discovery Fund (formerly, Mutual Global Discovery Fund) since 2009. He has been portfolio manager for Franklin Mutual Shares Fund (formerly, Mutual Shares Fund) since 2005. He joined Franklin Templeton Investments in 1996, serving in various capacities, including President and Chief Executive Officer of Franklin Mutual Advisers and member of the management team of the Funds, including Franklin Mutual Shares Fund. From 2002 to 2005, he served as director of New Jersey’s Division of Investment, overseeing employee pension funds. Between 1986and 1996, Mr. Langerman was employed at Heine Securities Corporation, the Fund’s former manager.
Philippe Brugere-Trelat has been portfolio manager for Franklin Mutual Global Discovery Fund (formerly, Mutual Global Discovery Fund) since 2009. He has been lead portfolio manager for Franklin Mutual European Fund (formerly, Mutual European Fund) since 2005 and co-portfolio manager for Franklin Mutual International Fund (formerly, Mutual International Fund) since 2009. He has been a member of the management team of the Mutual Series Funds since 2004, when he rejoined Franklin Templeton Investments. Previously, he was president and portfolio manager of Eurovest. Between 1984 and 1994, Mr. Brugere-Trelat was employed at Heine Securities Corporation, the Fund’s former manager.
Timothy Rankin rejoined the Mutual Series investment group in 2010 and currently serves as co-portfolio manager for Franklin Mutual Global Discovery Fund (formerly, Mutual Global Discovery Fund), and as a research analyst, responsible for the analysis of the global energy and chemical industries. Mr. Rankin had previously worked at Mutual Series from 1997through 2004. Mr. Rankin has over 20 years of experience in the investment management industry, including over 10 years with Mutual Series as a research analyst and portfolio manager. Most recently, he was managing director of Blue Harbour Group, LLC, a private investment firm focused on small-and mid-cap North American companies. Prior to his original employment with Mutual Series, Mr. Rankin was an equity analyst at Glickenhaus & Co.
8 | Annual Report
franklintempleton.com
FRANKLIN MUTUAL GLOBAL DISCOVERY FUND
Performance Summary as of December 31, 2014
Your dividend income will vary depending on dividends or interest paid by securities in the Fund’s portfolio, adjusted for operating expenses of each class. Capital gain distributions are net profits realized from the sale of portfolio securities. The performance table and graphs do not reflect any taxes that a shareholder would pay on Fund dividends, capital gain distributions, if any, or any realized gains on the sale of Fund shares. Total return reflects reinvestment of the Fund’s dividends and capital gain distributions, if any, and any unrealized gains or losses.
| Net Asset Value | ||||||
| Share Class (Symbol) | 12/31/14 | 12/31/13 | Change | |||
| Z(MDISX) | $ | 33.32 | $ | 33.73 | -$ | 0.41 |
| A (TEDIX) | $ | 32.81 | $ | 33.24 | -$ | 0.43 |
| C (TEDSX) | $ | 32.49 | $ | 32.94 | -$ | 0.45 |
| R (TEDRX) | $ | 32.43 | $ | 32.88 | -$ | 0.45 |
| R6(FMDRX) | $ | 33.33 | $ | 33.73 | -$ | 0.40 |
| Distributions (1/1/14 –12/31/14) | ||||||
| Dividend | Long-Term | |||||
| Share Class | Income | Capital Gain | Total | |||
| Z | $ | 0.8230 | $ | 1.3773 | $ | 2.2003 |
| A | $ | 0.7215 | $ | 1.3773 | $ | 2.0988 |
| C | $ | 0.4886 | $ | 1.3773 | $ | 1.8659 |
| R | $ | 0.6476 | $ | 1.3773 | $ | 2.0249 |
| R6 | $ | 0.8691 | $ | 1.3773 | $ | 2.2464 |
franklintempleton.com
Annual Report
| 9
FRANKLIN MUTUAL GLOBAL DISCOVERY FUND
PERFORMANCE SUMMARY
Performance as of 12/31/14
Cumulative total return excludes sales charges. Average annual total return and value of $10,000 investment include maximum sales charges; Class Z/R/R6: no sales charges; Class A: 5.75% maximum initial sales charge; Class C: 1% contingent deferred sales charge in first year only.
| Cumulative | Average Annual | Value of | Total Annual | |||||||
| Share Class | Total Return1 | Total Return2 | $ | 10,000Investment3 | OperatingExpenses4 | |||||
| Z | 0.98 | % | ||||||||
| 1-Year | + | 5.33 | % | + | 5.33 | % | $ | 10,533 | ||
| 5-Year | + | 63.00 | % | + | 10.26 | % | $ | 16,300 | ||
| 10-Year | + | 130.86 | % | + | 8.73 | % | $ | 23,086 | ||
| A | 1.28 | % | ||||||||
| 1-Year | + | 5.01 | % | -1.04 | % | $ | 9,896 | |||
| 5-Year | + | 60.64 | % | + | 8.65 | % | $ | 15,141 | ||
| 10-Year | + | 123.92 | % | + | 7.75 | % | $ | 21,104 | ||
| C | 1.98 | % | ||||||||
| 1-Year | + | 4.28 | % | + | 3.30 | % | $ | 10,330 | ||
| 5-Year | + | 55.10 | % | + | 9.18 | % | $ | 15,510 | ||
| 10-Year | + | 108.99 | % | + | 7.65 | % | $ | 20,899 | ||
| R | 1.48 | % | ||||||||
| 1-Year | + | 4.77 | % | + | 4.77 | % | $ | 10,477 | ||
| 5-Year | + | 58.98 | % | + | 9.72 | % | $ | 15,898 | ||
| 10-Year | + | 119.59 | % | + | 8.18 | % | $ | 21,959 | ||
| R65 | 0.84 | % | ||||||||
| 1-Year | + | 5.46 | % | + | 5.46 | % | $ | 10,546 | ||
| Since Inception (5/1/13) | + | 20.97 | % | + | 12.09 | % | $ | 12,097 |
Performance data represent past performance, which does not guarantee future results. Investment return and principal value will fluctuate, and you may have a gain or loss when you sell your shares. Current performance may differ from figures shown. For most recent month-end performance, go to franklintempleton.com or call (800) 342-5236.
10 | Annual Report
franklintempleton.com
FRANKLIN MUTUAL GLOBAL DISCOVERY FUND
PERFORMANCE SUMMARY
Total Return Index Comparison for a Hypothetical $10,000 Investment
Total return represents the change in value of an investment over the periods shown. It includes any applicable maximum sales charge, Fund expenses, account fees and reinvested distributions. The unmanaged indexes include reinvestment of any income or distributions. They differ from the Fund in composition and do not pay management fees or expenses. One cannot invest directly in an index.
franklintempleton.com
Annual Report
| 11
FRANKLIN MUTUAL GLOBAL DISCOVERY FUND
PERFORMANCE SUMMARY
Total Return Index Comparison for a Hypothetical $10,000 Investment (continued)
12 | Annual Report
franklintempleton.com
FRANKLIN MUTUAL GLOBAL DISCOVERY FUND
PERFORMANCE SUMMARY
Total Return Index Comparison for a Hypothetical $10,000 Investment (continued)
All investments involve risks, including possible loss of principal. Value securities may not increase in price as anticipated or may decline further in value. The Fund’s investments in foreign securities involve certain risks including currency fluctuations, and economic and political uncertainties. Smaller company stocks have exhibited greater price volatility than larger company stocks, particularly over the short term. The Fund’s investments in companies engaged in mergers, reorganizations or liquidations also involve special risks as pending deals may not be completed on time or on favorable terms. The Fund may invest in lower rated bonds, which entail higher credit risk. The Fund is actively managed but there is no guarantee that the manager’s investment decisions will produce the desired results. The Fund’s prospectus also includes a description of the main investment risks.
Class Z: Shares are available to certain eligible investors as described in the prospectus.
Class C: These shares have higher annual fees and expenses than Class A shares.
Class R: Shares are available to certain eligible investors as described in the prospectus. These shares have higher annual fees and expenses than Class A shares.
Class R6: Shares are available to certain eligible investors as described in the prospectus.
1. Cumulative total return represents the change in value of an investment over the periods indicated.
2. Average annual total return represents the average annual change in value of an investment over the periods indicated.
3. These figures represent the value of a hypothetical $10,000 investment in the Fund over the periods indicated.
4. Figures are as stated in the Fund’s current prospectus. In periods of market volatility, assets may decline significantly, causing total annual Fund operating expenses to
become higher than the figures shown.
5. Class R6 has a fee waiver contractually guaranteed through at least 4/30/15. Investment results reflect the fee waiver, to the extent applicable; without this reduction, the
results would have been lower.
6. Source: Morningstar. The S&P 500 is a market capitalization-weighted index of 500 stocks designed to measure total U.S. equity market performance. The MSCI World
Index is a free float-adjusted, market capitalization-weighted index designed to measure equity market performance in global developed markets.
See www.franklintempletondatasources.com for additional data provider information.
franklintempleton.com
Annual Report
| 13
FRANKLIN MUTUAL GLOBAL DISCOVERY FUND
Your Fund’s Expenses
As a Fund shareholder, you can incur two types of costs:
•Transaction costs, including sales charges (loads) on Fund purchases;and
•Ongoing Fund costs, including management fees, distribution and service (12b-1) fees, and other Fund expenses. All mutual funds have ongoing costs, sometimes referred to as operating expenses.
The following table shows ongoing costs of investing in the Fund and can help you understand these costs and compare them with those of other mutual funds. The table assumes a $1,000 investment held for the six months indicated.
Actual Fund Expenses
The first line (Actual) for each share class listed in the table provides actual account values and expenses. The “Ending Account Value” is derived from the Fund’s actual return, which includes the effect of Fund expenses.
You can estimate the expenses you paid during the period by following these steps. Of course, your account value and expenses will differ from those in this illustration:
| 1. | Divide your account value by $1,000. |
| If an account had an $8,600 value, then $8,600 ÷ $1,000 = 8.6. | |
| 2. | Multiply the result by the number under the heading “Expenses Paid During Period.” |
| If Expenses Paid During Period were $7.50, then 8.6 x $7.50 = $64.50. |
In this illustration, the estimated expenses paid this period are $64.50.
Hypothetical Example for Comparison with Other Funds
Information in the second line (Hypothetical) for each class in the table can help you compare ongoing costs of investing in the Fund with those of other mutual funds. This information may not be used to estimate the actual ending account balance or expenses you paid during the period. The hypothetical “Ending Account Value” is based on the Fund’s actual expense ratio for each class and an assumed 5% annual rate of return before expenses, which does not represent the Fund’s actual return. The figure under the heading “Expenses Paid During Period” shows the hypothetical expenses your account would have incurred under this scenario. You can compare this figure with the 5% hypothetical examples that appear in shareholder reports of other funds.
Please note that expenses shown in the table are meant to highlight ongoing costs and do not reflect any transaction costs, such as sales charges. Therefore, the second line for each class is useful in comparing ongoing costs only, and will not help you compare total costs of owning different funds. In addition, if transaction costs were included, your total costs would have been higher. Please refer to the Fund prospectus for additional information on operating expenses.
14 | Annual Report
franklintempleton.com
FRANKLIN MUTUAL GLOBAL DISCOVERY FUND
YOUR FUND’S EXPENSES
| BeginningAccount | EndingAccount | Expenses Paid During | ||||
| Share Class | Value 7/1/14 | Value 12/31/14 | Period*7/1/14–12/31/14 | |||
| Z | ||||||
| Actual | $ | 1,000 | $ | 990.70 | $ | 5.07 |
| Hypothetical (5% return before expenses) | $ | 1,000 | $ | 1,020.11 | $ | 5.14 |
| A | ||||||
| Actual | $ | 1,000 | $ | 989.40 | $ | 6.57 |
| Hypothetical (5% return before expenses) | $ | 1,000 | $ | 1,018.60 | $ | 6.67 |
| C | ||||||
| Actual | $ | 1,000 | $ | 986.00 | $ | 10.06 |
| Hypothetical (5% return before expenses) | $ | 1,000 | $ | 1,015.07 | $ | 10.21 |
| R | ||||||
| Actual | $ | 1,000 | $ | 988.20 | $ | 7.57 |
| Hypothetical (5% return before expenses) | $ | 1,000 | $ | 1,017.59 | $ | 7.68 |
| R6 | ||||||
| Actual | $ | 1,000 | $ | 991.70 | $ | 4.32 |
| Hypothetical (5% return before expenses) | $ | 1,000 | $ | 1,020.87 | $ | 4.38 |
*Expenses are calculated using the most recent six-month expense ratio, annualized for each class (Z: 1.01%; A: 1.31%; C: 2.01%; R: 1.51%; and R6: 0.86%), multiplied by the average account value over the period, multiplied by 184/365 to reflect the one-half year period.
franklintempleton.com
Annual Report
| 15
FRANKLIN MUTUAL GLOBAL DISCOVERY FUND
| Financial Highlights | |||||||||||||||
| Year Ended December 31, | |||||||||||||||
| 2014 | 2013 | 2012 | 2011 | 2010 | |||||||||||
| Class Z | |||||||||||||||
| Per share operatingperformance | |||||||||||||||
| (for a share outstandingthroughout the year) | |||||||||||||||
| Net asset value,beginningof year | $ | 33.73 | $ | 28.65 | $ | 27.47 | $ | 29.54 | $ | 27.03 | |||||
| Income from investment operationsa: | |||||||||||||||
| Net investment incomeb | 0.82 | c | 0.55 | 0.56 | 0.61 | 0.53 | d | ||||||||
| Net realizedandunrealizedgains(losses) | 0.97 | 6.74 | 3.21 | (1.46 | ) | 2.55 | |||||||||
| Total from investment operations | 1.79 | 7.29 | 3.77 | (0.85 | ) | 3.08 | |||||||||
| Lessdistributionsfrom: | |||||||||||||||
| Net investment income | (0.82 | ) | (0.57 | ) | (0.57 | ) | (0.55 | ) | (0.57 | ) | |||||
| Net realizedgains | (1.38 | ) | (1.64 | ) | (2.02 | ) | (0.67 | ) | — | ||||||
| Total distributions | (2.20 | ) | (2.21 | ) | (2.59 | ) | (1.22 | ) | (0.57 | ) | |||||
| Net asset value,endof year | $ | 33.32 | $ | 33.73 | $ | 28.65 | $ | 27.47 | $ | 29.54 | |||||
| Total return | 5.33 | % | 25.64 | % | 13.64 | % | (2.68 | )% | 11.37 | % | |||||
| Ratios to average net assets | |||||||||||||||
| Expensese | 0.99 | %f | 0.98 | %f | 1.02 | % | 1.01 | % | 1.04 | % | |||||
| Expensesincurredin connection withsecuritiessoldshort | 0.03 | % | — %g | — %g | — %g | 0.02 | % | ||||||||
| Net investment income | 2.38 | %c | 1.68 | % | 1.89 | % | 2.11 | % | 1.89 | %d | |||||
| Supplemental data | |||||||||||||||
| Net assets,endof year (000’s) | $ | 10,375,518 | $ | 9,529,245 | $ | 7,417,041 | $ | 7,159,033 | $ | 7,210,122 | |||||
| Portfolio turnover rate | 23.66 | % | 23.57 | % | 24.65 | % | 33.60 | % | 37.76 | % | |||||
aThe amount shown for a share outstanding throughout the period may not correlate with the Statement of Operations for the period due to the timing of sales and
repurchases of the Fund shares in relation to income earned and/or fluctuating fair value of the investments of the Fund.
bBased on average daily shares outstanding.
cNet investment income per share includes approximately $0.34 per share received in the form of a special dividend paid in connection with certain Fund’s holdings.
Excluding this amount, the ratio of net investment income to average net assets would have been 1.40%.
dNet investment income per share includes approximately $0.05 per share received in the form of a special dividend paid in connection with a corporate real estate
investment trust (REIT) conversion. Excluding this non-recurring amount, the ratio of net investment income to average net assets would have been 1.71%.
eIncludes dividend expense on securities sold short and security borrowing fees, if any. See below for the ratios of such expenses to average net assets for the periods
presented. See Note 1(e).
fBenefit of expense reduction rounds to less than 0.01%.
gRounds to less than 0.01%.
16 | Annual Report | The accompanyingnotesare an integral part of these financial statements.
franklintempleton.com
FRANKLIN MUTUAL GLOBAL DISCOVERY FUND
FINANCIAL HIGHLIGHTS
| Year Ended December 31, | |||||||||||||||
| 2014 | 2013 | 2012 | 2011 | 2010 | |||||||||||
| Class A | |||||||||||||||
| Per share operatingperformance | |||||||||||||||
| (for a share outstandingthroughout the year) | |||||||||||||||
| Net asset value,beginningof year | $ | 33.24 | $ | 28.27 | $ | 27.14 | $ | 29.19 | $ | 26.72 | |||||
| Income from investment operationsa: | |||||||||||||||
| Net investment incomeb | 0.71 | c | 0.44 | 0.46 | 0.52 | 0.44 | d | ||||||||
| Net realizedandunrealizedgains(losses) | 0.96 | 6.65 | 3.17 | (1.44 | ) | 2.52 | |||||||||
| Total from investment operations | 1.67 | 7.09 | 3.63 | (0.92 | ) | 2.96 | |||||||||
| Lessdistributionsfrom: | |||||||||||||||
| Net investment income | (0.72 | ) | (0.48 | ) | (0.48 | ) | (0.46 | ) | (0.49 | ) | |||||
| Net realizedgains | (1.38 | ) | (1.64 | ) | (2.02 | ) | (0.67 | ) | — | ||||||
| Total distributions | (2.10 | ) | (2.12 | ) | (2.50 | ) | (1.13 | ) | (0.49 | ) | |||||
| Net asset value,endof year | $ | 32.81 | $ | 33.24 | $ | 28.27 | $ | 27.14 | $ | 29.19 | |||||
| Total returne | 5.01 | % | 25.26 | % | 13.34 | % | (2.99 | )% | 11.08 | % | |||||
| Ratios to average net assets | |||||||||||||||
| f | 1.29 | %g | 1.28 | %g | 1.32 | % | 1.31 | % | 1.34 | % | |||||
| Expensesincurredin connection withsecuritiessoldshort | 0.03 | % | — %h | — %h | — %h | 0.02 | % | ||||||||
| Net investment income | 2.08 | %c | 1.38 | % | 1.59 | % | 1.81 | % | 1.59 | %d | |||||
| Supplemental data | |||||||||||||||
| Net assets,endof year (000’s) | $ | 11,573,196 | $10,785,375 | $ | 7,977,279 | $ | 7,617,500 | $ | 8,122,714 | ||||||
| Portfolio turnover rate | 23.66 | % | 23.57 | % | 24.65 | % | 33.60 | % | 37.76 | % | |||||
aThe amount shown for a share outstanding throughout the period may not correlate with the Statement of Operations for the period due to the timing of sales and
repurchases of the Fund shares in relation to income earned and/or fluctuating fair value of the investments of the Fund.
bBased on average daily shares outstanding.
cNet investment income per share includes approximately $0.34 per share received in the form of a special dividend paid in connection with certain Fund’s holdings.
Excluding this amount, the ratio of net investment income to average net assets would have been 1.10%.
dNet investment income per share includes approximately $0.05 per share received in the form of a special dividend paid in connection with a corporate REIT conversion.
Excluding this non-recurring amount, the ratio of net investment income to average net assets would have been 1.41%.
eTotal return does not reflect sales commissions or contingent deferred sales charges, if applicable.
fIncludes dividend expense on securities sold short and security borrowing fees, if any. See below for the ratios of such expenses to average net assets for the periods
presented. See Note 1(e).
gBenefit of expense reduction rounds to less than 0.01%.
hRounds to less than 0.01%.
franklintempleton.com
The accompanyingnotesare an integral part of these financial statements. | Annual Report | 17
FRANKLIN MUTUAL GLOBAL DISCOVERY FUND
FINANCIAL HIGHLIGHTS
| Year Ended December 31, | |||||||||||||||
| 2014 | 2013 | 2012 | 2011 | 2010 | |||||||||||
| Class C | |||||||||||||||
| Per share operatingperformance | |||||||||||||||
| (for a share outstandingthroughout the year) | |||||||||||||||
| Net asset value,beginningof year | $ | 32.94 | $ | 28.05 | $ | 26.95 | $ | 28.97 | $ | 26.53 | |||||
| Income from investment operationsa: | |||||||||||||||
| Net investment incomeb | 0.47 | c | 0.22 | 0.25 | 0.32 | 0.24 | d | ||||||||
| Net realizedandunrealizedgains(losses) | 0.95 | 6.58 | 3.14 | (1.42 | ) | 2.49 | |||||||||
| Total from investment operations | 1.42 | 6.80 | 3.39 | (1.10 | ) | 2.73 | |||||||||
| Lessdistributionsfrom: | |||||||||||||||
| Net investment income | (0.49 | ) | (0.27 | ) | (0.27 | ) | (0.25 | ) | (0.29 | ) | |||||
| Net realizedgains | (1.38 | ) | (1.64 | ) | (2.02 | ) | (0.67 | ) | — | ||||||
| Total distributions | (1.87 | ) | (1.91 | ) | (2.29 | ) | (0.92 | ) | (0.29 | ) | |||||
| Net asset value,endof year | $ | 32.49 | $ | 32.94 | $ | 28.05 | $ | 26.95 | $ | 28.97 | |||||
| Total returne | 4.28 | % | 24.39 | % | 12.53 | % | (3.64 | )% | 10.26 | % | |||||
| Ratios to average net assets | |||||||||||||||
| f | 1.99 | %g | 1.98 | %g | 2.02 | % | 2.01 | % | 2.04 | % | |||||
| Expensesincurredin connection withsecuritiessoldshort | 0.03 | % | — %h | — %h | — %h | 0.02 | % | ||||||||
| Net investment income | 1.38 | %c | 0.68 | % | 0.89 | % | 1.11 | % | 0.89 | %d | |||||
| Supplemental data | |||||||||||||||
| Net assets,endof year (000’s) | $ | 3,077,691 | $ | 2,894,908 | $ | 2,222,484 | $ | 2,268,995 | $ | 2,587,189 | |||||
| Portfolio turnover rate | 23.66 | % | 23.57 | % | 24.65 | % | 33.60 | % | 37.76 | % | |||||
aThe amount shown for a share outstanding throughout the period may not correlate with the Statement of Operations for the period due to the timing of sales and
repurchases of the Fund shares in relation to income earned and/or fluctuating fair value of the investments of the Fund.
bBased on average daily shares outstanding.
cNet investment income per share includes approximately $0.34 per share received in the form of a special dividend paid in connection with certain Fund’s holdings.
Excluding this amount, the ratio of net investment income to average net assets would have been 0.40%.
dNet investment income per share includes approximately $0.05 per share received in the form of a special dividend paid in connection with a corporate REIT conversion.
Excluding this non-recurring amount, the ratio of net investment income to average net assets would have been 0.71%.
eTotal return does not reflect sales commissions or contingent deferred sales charges, if applicable.
fIncludes dividend expense on securities sold short and security borrowing fees, if any. See below for the ratios of such expenses to average net assets for the periods
presented. See Note 1(e).
gBenefit of expense reduction rounds to less than 0.01%.
hRounds to less than 0.01%.
18 | Annual Report | The accompanyingnotesare an integral part of these financial statements.
franklintempleton.com
FRANKLIN MUTUAL GLOBAL DISCOVERY FUND
FINANCIAL HIGHLIGHTS
| Year Ended December 31, | |||||||||||||||
| 2014 | 2013 | 2012 | 2011 | 2010 | |||||||||||
| Class R | |||||||||||||||
| Per share operatingperformance | |||||||||||||||
| (for a share outstandingthroughout the year) | |||||||||||||||
| Net asset value,beginningof year | $ | 32.88 | $ | 27.98 | $ | 26.89 | $ | 28.93 | $ | 26.50 | |||||
| Income from investment operationsa: | |||||||||||||||
| Net investment incomeb | 0.65 | c | 0.37 | 0.39 | 0.46 | 0.38 | d | ||||||||
| Net realizedandunrealizedgains(losses) | 0.93 | 6.58 | 3.14 | (1.42 | ) | 2.49 | |||||||||
| Total from investment operations | 1.58 | 6.95 | 3.53 | (0.96 | ) | 2.87 | |||||||||
| Lessdistributionsfrom: | |||||||||||||||
| Net investment income | (0.65 | ) | (0.41 | ) | (0.42 | ) | (0.41 | ) | (0.44 | ) | |||||
| Net realizedgains | (1.38 | ) | (1.64 | ) | (2.02 | ) | (0.67 | ) | — | ||||||
| Total distributions | (2.03 | ) | (2.05 | ) | (2.44 | ) | (1.08 | ) | (0.44 | ) | |||||
| Net asset value,endof year | $ | 32.43 | $ | 32.88 | $ | 27.98 | $ | 26.89 | $ | 28.93 | |||||
| Total return | 4.77 | % | 25.02 | % | 13.09 | % | (3.17 | )% | 10.84 | % | |||||
| Ratios to average net assets | |||||||||||||||
| Expensese | 1.49 | %f | 1.48 | %f | 1.52 | % | 1.51 | % | 1.54 | % | |||||
| Expensesincurredin connection withsecuritiessoldshort | 0.03 | % | — %g | — %g | — %g | 0.02 | % | ||||||||
| Net investment income | 1.88 | %c | 1.18 | % | 1.39 | % | 1.61 | % | 1.39 | %d | |||||
| Supplemental data | |||||||||||||||
| Net assets,endof year (000’s) | $ | 528,439 | $ | 539,613 | $ | 458,142 | $ | 434,893 | $ | 422,042 | |||||
| Portfolio turnover rate | 23.66 | % | 23.57 | % | 24.65 | % | 33.60 | % | 37.76 | % | |||||
aThe amount shown for a share outstanding throughout the period may not correlate with the Statement of Operations for the period due to the timing of sales and
repurchases of the Fund shares in relation to income earned and/or fluctuating fair value of the investments of the Fund.
bBased on average daily shares outstanding.
cNet investment income per share includes approximately $0.34 per share received in the form of a special dividend paid in connection with certain Fund’s holdings.
Excluding this amount, the ratio of net investment income to average net assets would have been 0.90%.
dNet investment income per share includes approximately $0.05 per share received in the form of a special dividend paid in connection with a corporate
REIT conversion. Excluding this non-recurring amount, the ratio of net investment income to average net assets would have been 1.21%.
eIncludes dividend expense on securities sold short and security borrowing fees, if any. See below for the ratios of such expenses to average net assets for the periods
presented. See Note 1(e).
fBenefit of expense reduction rounds to less than 0.01%.
gRounds to less than 0.01%.
franklintempleton.com
The accompanyingnotesare an integral part of these financial statements. | Annual Report | 19
FRANKLIN MUTUAL GLOBAL DISCOVERY FUND
FINANCIAL HIGHLIGHTS
| Year Ended December 31, | ||||||
| 2014 | 2013 | a | ||||
| Class R6 | ||||||
| Per share operatingperformance | ||||||
| (for a share outstandingthroughout the year) | ||||||
| Net asset value,beginningof year | $ | 33.73 | $ | 31.42 | ||
| Income from investment operationsb: | ||||||
| Net investment incomec | 0.85 | d | 0.40 | |||
| Net realizedandunrealizedgains(losses) | 1.00 | 4.17 | ||||
| Total from investment operations | 1.85 | 4.57 | ||||
| Lessdistributionsfrom: | ||||||
| Net investment income | (0.87 | ) | (0.62 | ) | ||
| Net realizedgains | (1.38 | ) | (1.64 | ) | ||
| Total distributions | (2.25 | ) | (2.26 | ) | ||
| Net asset value,endof year | $ | 33.33 | $ | 33.73 | ||
| Total returne | 5.46 | % | 14.71 | % | ||
| Ratios to average net assetsf | ||||||
| Expensesg,h | 0.85 | % | 0.84 | % | ||
| Expensesincurredin connection withsecuritiessoldshort | 0.03 | % | — %i | |||
| Net investment income | 2.52 | %d | 1.83 | % | ||
| Supplemental data | ||||||
| Net assets,endof year (000’s) | $ | 137,922 | $ | 10,535 | ||
| Portfolio turnover rate | 23.66 | % | 23.57 | % | ||
aFor the period May 1, 2013 (effective date) to December 31, 2013.
bThe amount shown for a share outstanding throughout the period may not correlate with the Statement of Operations for the period due to the timing of sales and
repurchases of the Fund shares in relation to income earned and/or fluctuating fair value of the investments of the Fund.
cBased on average daily shares outstanding.
dNet investment income per share includes approximately $0.34 per share received in the form of a special dividend paid in connection with certain Fund’s holdings.
Excluding this amount, the ratio of net investment income to average net assets would have been 1.54%.
eTotal return is not annualized for periods less than one year.
fRatios are annualized for periods less than one year.
gIncludes dividend expense on securities sold short and security borrowing fees, if any. See below for the ratios of such expenses to average net assets for the periods
presented. See Note 1(e).
hBenefit of expense reduction rounds to less than 0.01%.
iRounds to less than 0.01%.
20 | Annual Report | The accompanyingnotesare an integral part of these financial statements.
franklintempleton.com
| FRANKLIN MUTUAL GLOBAL DISCOVERY FUND | ||||
| Statement of Investments, December 31, 2014 | ||||
| Shares/ | ||||
| Country | Rights/Units | Value | ||
| Common Stocks and Other Equity Interests 84.0% | ||||
| Aerospace & Defense 1.1% | ||||
| aB/EAerospace Inc. | UnitedStates | 2,140,150 | $ | 124,171,503 |
| aKLX Inc. | UnitedStates | 1,070,075 | 44,140,594 | |
| Safran SA | France | 1,978,939 | 122,718,953 | |
| 291,031,050 | ||||
| Auto Components 0.6% | ||||
| Cie Generale desEtablissementsMichelin,B | France | 1,343,160 | 122,330,577 | |
| a,bInternational Automotive ComponentsGroup Brazil LLC | Brazil | 3,819,425 | 361,241 | |
| a,b,c,dInternational Automotive ComponentsGroup NorthAmerica LLC | UnitedStates | 35,491,081 | 26,873,137 | |
| 149,564,955 | ||||
| Automobiles 1.3% | ||||
| General MotorsCo. | UnitedStates | 6,291,420 | 219,633,472 | |
| Hyundai Motor Co. | SouthKorea | 699,956 | 108,152,213 | |
| 327,785,685 | ||||
| Banks 14.1% | ||||
| BarclaysPLC | UnitedKingdom | 70,083,673 | 265,997,980 | |
| BNPParibasSA | France | 3,905,802 | 232,803,760 | |
| aCapital Bank Financial Corp.,A | UnitedStates | 866,477 | 23,221,584 | |
| a,eCapital Bank Financial Corp.,B,144A,non-voting | UnitedStates | 2,980,444 | 79,875,899 | |
| CITGroup Inc. | UnitedStates | 2,806,874 | 134,252,783 | |
| Citigroup Inc. | UnitedStates | 5,809,671 | 314,361,298 | |
| CitizensFinancial Group Inc. | UnitedStates | 3,015,436 | 74,963,739 | |
| aCommerzbank AG | Germany | 20,442,210 | 271,591,107 | |
| HSBCHoldingsPLC | UnitedKingdom | 22,629,178 | 214,665,990 | |
| Industrial andCommercial Bank of China Ltd.,H | China | 313,005,603 | 228,478,609 | |
| aING Groep NV,IDR | Netherlands | 21,107,283 | 276,596,162 | |
| JPMorgan Chase & Co. | UnitedStates | 4,857,660 | 303,992,363 | |
| KBFinancial Group Inc. | SouthKorea | 4,411,804 | 145,815,092 | |
| PNC Financial ServicesGroup Inc. | UnitedStates | 3,118,000 | 284,455,140 | |
| Societe Generale SA | France | 4,050,169 | 171,475,646 | |
| SunTrust BanksInc. | UnitedStates | 4,238,534 | 177,594,575 | |
| WellsFargo & Co. | UnitedStates | 7,620,708 | 417,767,213 | |
| 3,617,908,940 | ||||
| Beverages 1.2% | ||||
| Coca-Cola EnterprisesInc. | UnitedStates | 1,029,439 | 45,521,792 | |
| PepsiCo Inc. | UnitedStates | 2,913,866 | 275,535,169 | |
| 321,056,961 | ||||
| Capital Markets 0.6% | ||||
| Credit Suisse Group AG | Switzerland | 5,738,848 | 144,769,974 | |
| Chemicals 0.0% | ||||
| a,f,gDow CorningCorp.,Contingent Distribution | UnitedStates | 11,430,153 | — | |
| Communications Equipment 0.8% | ||||
| Cisco SystemsInc. | UnitedStates | 7,847,650 | 218,282,385 | |
| Consumer Finance 0.4% | ||||
| aAllyFinancial Inc. | UnitedStates | 4,911,500 | 116,009,630 | |
| Diversified Consumer Services 0.1% | ||||
| Cengage LearningHoldingsIILP | UnitedStates | 1,149,083 | 25,854,367 | |
franklintempleton.com
Annual Report
| 21
FRANKLIN MUTUAL GLOBAL DISCOVERY FUND
STATEMENT OF INVESTMENTS
| Shares/ | ||||
| Country | Rights/Units | Value | ||
| Common Stocks and Other Equity Interests (continued) | ||||
| Diversified Telecommunication Services 1.1% | ||||
| a,f,gGlobal CrossingHoldingsLtd.,Contingent Distribution | UnitedStates | 45,658,716 | $ | — |
| Koninklijke KPNNV | Netherlands | 90,237,310 | 286,943,811 | |
| 286,943,811 | ||||
| Energy Equipment & Services 1.3% | ||||
| Baker HughesInc. | UnitedStates | 4,371,100 | 245,087,577 | |
| Ensco PLC,A | UnitedStates | 691,490 | 20,710,126 | |
| hTransocean Ltd. | UnitedStates | 3,123,804 | 57,259,327 | |
| 323,057,030 | ||||
| Food & Staples Retailing3.4% | ||||
| CVSHealthCorp. | UnitedStates | 2,333,967 | 224,784,362 | |
| Empire Co. Ltd.,A | Canada | 2,355,152 | 177,703,697 | |
| Metro AG | Germany | 7,814,516 | 239,320,329 | |
| WalgreensBootsAlliance Inc. | UnitedStates | 2,998,912 | 228,517,094 | |
| 870,325,482 | ||||
| Health Care Equipment & Supplies 2.9% | ||||
| Medtronic Inc. | UnitedStates | 6,764,876 | 488,424,047 | |
| Stryker Corp. | UnitedStates | 2,778,559 | 262,101,471 | |
| 750,525,518 | ||||
| Health Care Providers & Services 0.9% | ||||
| Cigna Corp. | UnitedStates | 2,263,817 | 232,969,407 | |
| Hotels,Restaurants & Leisure 1.1% | ||||
| Accor SA | France | 6,111,782 | 276,138,861 | |
| Independent Power & Renewable Electricity Producers 0.7% | ||||
| NRG EnergyInc. | UnitedStates | 6,590,837 | 177,623,057 | |
| Industrial Conglomerates 2.0% | ||||
| Jardine Matheson HoldingsLtd. | HongKong | 2,106,966 | 128,419,578 | |
| Jardine Strategic HoldingsLtd. | HongKong | 9,774,205 | 334,277,811 | |
| Koninklijke PhilipsNV | Netherlands | 1,750,918 | 51,164,449 | |
| SiemensAG | Germany | 113,787 | 12,907,712 | |
| 526,769,550 | ||||
| Insurance 8.7% | ||||
| ACE Ltd. | UnitedStates | 3,451,290 | 396,484,195 | |
| aAlleghanyCorp. | UnitedStates | 81,228 | 37,649,178 | |
| The Allstate Corp. | UnitedStates | 3,354,175 | 235,630,794 | |
| American International Group Inc. | UnitedStates | 5,795,145 | 324,586,071 | |
| China Pacific Insurance (Group)Co. Ltd.,H | China | 34,456,415 | 173,971,801 | |
| E-LFinancial Corp. Ltd. | Canada | 177,619 | 105,328,641 | |
| MetLife Inc. | UnitedStates | 3,265,940 | 176,654,695 | |
| a,bOlympusRe HoldingsLtd. | UnitedStates | 47,160 | — | |
| PartnerRe Ltd. | UnitedStates | 1,813,630 | 206,989,592 | |
| PICC PropertyandCasualtyCo. Ltd.,H | China | 46,664,324 | 90,753,487 | |
| aRSAInsurance Group PLC | UnitedKingdom | 18,896,626 | 128,125,638 | |
| W hite MountainsInsurance Group Ltd. | UnitedStates | 172,815 | 108,892,460 | |
| ZurichInsurance Group AG | Switzerland | 813,000 | 254,890,465 | |
| 2,239,957,017 | ||||
| IT Services 0.9% | ||||
| XeroxCorp. | UnitedStates | 16,670,797 | 231,057,246 | |
| 22 | Annual Report | franklintempleton.com | |||
FRANKLIN MUTUAL GLOBAL DISCOVERY FUND
STATEMENT OF INVESTMENTS
| Shares/ | ||||
| Country | Rights/Units | Value | ||
| Common Stocks and Other Equity Interests (continued) | ||||
| Machinery 0.9% | ||||
| Caterpillar Inc. | UnitedStates | 1,281,679 | $ | 117,312,079 |
| CNH Industrial NV (EUR Traded) | UnitedKingdom | 6,569,123 | 53,255,879 | |
| CNH Industrial NV,special voting(EUR Traded) | UnitedKingdom | 7,338,645 | 59,494,393 | |
| 230,062,351 | ||||
| Marine 1.2% | ||||
| A.P. Moeller-Maersk AS,B | Denmark | 150,055 | 301,577,662 | |
| Media 6.7% | ||||
| CBSCorp.,B | UnitedStates | 4,879,342 | 270,022,786 | |
| Comcast Corp.,Special A | UnitedStates | 1,094,160 | 62,985,320 | |
| aDIRECTV | UnitedStates | 3,633,416 | 315,017,167 | |
| ReedElsevier PLC | UnitedKingdom | 20,193,070 | 346,224,307 | |
| Time Warner Cable Inc. | UnitedStates | 1,851,179 | 281,490,279 | |
| Time Warner Inc. | UnitedStates | 2,174,747 | 185,766,889 | |
| aTribune Media Co.,A | UnitedStates | 836,070 | 49,971,904 | |
| aTribune Media Co.,B | UnitedStates | 606,923 | 36,275,788 | |
| Tribune PublishingCo. | UnitedStates | 399,197 | 9,141,611 | |
| Twenty-First CenturyFoxInc.,B | UnitedStates | 4,401,800 | 162,382,402 | |
| 1,719,278,453 | ||||
| Metals & Mining1.7% | ||||
| Anglo American PLC | UnitedKingdom | 6,478,250 | 121,222,263 | |
| Freeport-McMoRan Inc.,B | UnitedStates | 3,621,030 | 84,587,261 | |
| aThyssenKrupp AG | Germany | 8,967,041 | 230,673,537 | |
| 436,483,061 | ||||
| Multiline Retail 0.4% | ||||
| Kohl’sCorp. | UnitedStates | 1,644,442 | 100,376,740 | |
| Oil,Gas & Consumable Fuels 6.8% | ||||
| Anadarko Petroleum Corp. | UnitedStates | 1,399,510 | 115,459,575 | |
| Apache Corp. | UnitedStates | 4,036,842 | 252,988,888 | |
| BG Group PLC | UnitedKingdom | 10,339,348 | 139,402,890 | |
| BPPLC | UnitedKingdom | 31,838,677 | 203,966,739 | |
| China Shenhua EnergyCo. Ltd.,H | China | 67,067,936 | 198,073,980 | |
| CONSOLEnergyInc. | UnitedStates | 3,002,892 | 101,527,779 | |
| Marathon Oil Corp. | UnitedStates | 5,814,486 | 164,491,809 | |
| MurphyOil Corp. | UnitedStates | 1,168,040 | 59,009,381 | |
| Repsol SA | Spain | 2,239,357 | 42,121,073 | |
| Repsol SA(interim line) | Spain | 65,863 | 1,238,847 | |
| aRepsol SA,rts.,1/08/15 | Spain | 15 | 8 | |
| Royal DutchShell PLC,A | UnitedKingdom | 10,904,242 | 364,949,705 | |
| Talisman EnergyInc. (CAD Traded) | Canada | 886,182 | 6,944,462 | |
| Talisman EnergyInc. (USDTraded) | Canada | 12,162,087 | 95,229,141 | |
| 1,745,404,277 | ||||
| Paper & Forest Products 0.7% | ||||
| International Paper Co. | UnitedStates | 2,477,590 | 132,749,272 | |
| dNewPage HoldingsInc. | UnitedStates | 583,268 | 52,931,571 | |
| 185,680,843 | ||||
| Personal Products 0.3% | ||||
| Avon ProductsInc. | UnitedStates | 8,701,492 | 81,707,010 |
franklintempleton.com
Annual Report
| 23
FRANKLIN MUTUAL GLOBAL DISCOVERY FUND
STATEMENT OF INVESTMENTS
| Shares/ | ||||
| Country | Rights/Units | Value | ||
| Common Stocks and Other Equity Interests (continued) | ||||
| Pharmaceuticals 6.8% | ||||
| Eli Lilly& Co. | UnitedStates | 4,376,858 | $ | 301,959,434 |
| aHospira Inc. | UnitedStates | 3,562,996 | 218,233,505 | |
| Merck & Co. Inc. | UnitedStates | 9,354,960 | 531,268,178 | |
| NovartisAG,ADR | Switzerland | 1,997,437 | 185,082,512 | |
| Teva Pharmaceutical IndustriesLtd.,ADR | Israel | 8,737,113 | 502,471,369 | |
| 1,739,014,998 | ||||
| Real Estate Management & Development 0.2% | ||||
| gCanaryW harf Group PLC | UnitedKingdom | 5,400,183 | 45,529,407 | |
| Semiconductors & Semiconductor Equipment 0.3% | ||||
| aSKHynixSemiconductor Inc. | SouthKorea | 1,712,305 | 74,753,661 | |
| Software 4.3% | ||||
| aCheck Point Software TechnologiesLtd. | Israel | 3,989,230 | 313,433,801 | |
| Microsoft Corp. | UnitedStates | 10,230,912 | 475,225,862 | |
| Symantec Corp. | UnitedStates | 12,534,725 | 321,578,370 | |
| 1,110,238,033 | ||||
| Specialty Retail 0.9% | ||||
| Kingfisher PLC | UnitedKingdom | 45,047,763 | 239,085,294 | |
| Technology Hardware,Storage & Peripherals 3.4% | ||||
| Apple Inc. | UnitedStates | 4,206,170 | 464,277,045 | |
| Hewlett-PackardCo. | UnitedStates | 4,892,480 | 196,335,222 | |
| SamsungElectronicsCo. Ltd. | SouthKorea | 166,197 | 201,637,854 | |
| 862,250,121 | ||||
| Tobacco 4.9% | ||||
| Altria Group Inc. | UnitedStates | 4,246,046 | 209,202,687 | |
| BritishAmerican Tobacco PLC | UnitedKingdom | 6,977,821 | 380,671,521 | |
| Imperial Tobacco Group PLC | UnitedKingdom | 4,677,039 | 206,747,247 | |
| LorillardInc. | UnitedStates | 5,323,181 | 335,041,012 | |
| Philip MorrisInternational Inc. | UnitedStates | 1,484,505 | 120,912,932 | |
| 1,252,575,399 | ||||
| W ireless Telecommunication Services 1.3% | ||||
| Vodafone Group PLC | UnitedKingdom | 94,517,600 | 328,018,171 | |
| Total Common Stocks and Other Equity Interests | ||||
| (Cost $16,284,955,477) | 21,579,666,407 | |||
| Preferred Stocks 1.4% | ||||
| Automobiles 1.4% | ||||
| Volkswagen AG,pfd. | Germany | 1,559,522 | 348,438,534 | |
| Diversified Financial Services 0.0%† | ||||
| a,bHightower HoldingLLC,pfd.,A,Series2 | UnitedStates | 3,048,000 | 7,090,867 | |
| Total Preferred Stocks (Cost $396,329,279) | 355,529,401 | |||
| Principal | ||||
| Amount* | ||||
| Corporate Bonds,Notes and Senior FloatingRate | ||||
| Interests 3.5% | ||||
| Avaya Inc., | ||||
| esenior note,144A,10.50%,3/01/21 | UnitedStates | 74,998,000 | 64,498,280 | |
| esenior securednote,144A,7.00%,4/01/19 | UnitedStates | 51,741,000 | 50,706,180 | |
| i,jTranche B-3Term Loan,4.67%,10/26/17 | UnitedStates | 78,738,786 | 75,720,492 | |
| i,jTranche B-6Term Loan,6.50%,3/31/18 | UnitedStates | 19,531,377 | 19,311,649 | |
| 24 | Annual Report | franklintempleton.com | |||
FRANKLIN MUTUAL GLOBAL DISCOVERY FUND
STATEMENT OF INVESTMENTS
| Principal | |||||
| Country | Amount* | Value | |||
| Corporate Bonds,Notes and Senior FloatingRate | |||||
| Interests (continued) | |||||
| i,jCaesarsEntertainment OperatingCo. Inc.,Senior Tranche,first lien, | |||||
| 3/01/17, | |||||
| B5B,5.949% | UnitedStates | 13,307,605 | $ | 11,682,973 | |
| B6B,6.949% | UnitedStates | 63,441,299 | 56,066,248 | ||
| B7,9.75% | UnitedStates | 46,344,115 | 41,107,230 | ||
| i,jCengage LearningAcquisitionsInc.,First Lien Exit Term Loan,7.00%, | |||||
| 3/31/20 | UnitedStates | 7,183,715 | 7,120,857 | ||
| First Data Corp.,senior note,11.75%,8/15/21 | UnitedStates | 42,742,000 | 49,260,155 | ||
| iHeartCommunicationsInc., | |||||
| senior securednote,first lien,9.00%,12/15/19 | UnitedStates | 95,618,000 | 94,542,297 | ||
| i,jTranche BTerm Loan,3.819%,1/29/16 | UnitedStates | 887,635 | 878,482 | ||
| i,jTranche C Term Loan,3.819%,1/29/16 | UnitedStates | 91,819 | 90,786 | ||
| i,jTranche D Term Loan,6.919%,1/30/19 | UnitedStates | 117,978,997 | 111,453,343 | ||
| i,jTranche ETerm Loan,7.669%,7/30/19 | UnitedStates | 37,921,652 | 36,452,188 | ||
| i,jJC PenneyCorp. Inc.,Term Loan,6.00%,5/22/18 | UnitedStates | 113,896,220 | 112,258,961 | ||
| NGPLPipeCo LLC, | |||||
| esecurednote,144A,7.119%,12/15/17 | UnitedStates | 42,312,000 | 41,783,100 | ||
| e,hsenior securednote,144A,9.625%,6/01/19 | UnitedStates | 62,806,000 | 63,277,045 | ||
| i,jTerm Loan B,6.75%,9/15/17 | UnitedStates | 3,435,429 | 3,323,778 | ||
| Walter EnergyInc., | |||||
| i,jB,Term Loan,7.25%,4/01/18 | UnitedStates | 55,667,214 | 43,316,051 | ||
| efirst lien,144A,9.50%,10/15/19 | UnitedStates | 30,996,000 | 23,711,940 | ||
| e,h,ksecondlien,144A,PIK,11.00%,4/01/20 | UnitedStates | 26,246,000 | 8,662,466 | ||
| Total Corporate Bonds,Notes and Senior FloatingRate | |||||
| Interests (Cost $913,751,207) | 915,224,501 | ||||
| Corporate Notes and Senior FloatingRate Interests | |||||
| in Reorganization 0.7% | |||||
| b,lBroadbandVenturesIIILLC,securedpromissorynote,5.00%,2/01/12 | UnitedStates | 8,893 | — | ||
| i,j,lTexasCompetitive Electric HoldingsCo. LLC,ExtendedTerm Loan, | |||||
| 4.648%,10/10/17 | UnitedStates | 142,325,613 | 92,155,835 | ||
| e,lTexasCompetitive Electric HoldingsCo. LLC/TexasCompetitive | |||||
| Electric HoldingsFinance Inc.,senior securednote,144A, | |||||
| 11.50%,10/01/20 | UnitedStates | 118,132,000 | 84,169,050 | ||
| Total Corporate Notes and Senior FloatingRate | |||||
| Interests in Reorganization (Cost $233,198,118) | 176,324,885 | ||||
| Shares | |||||
| Companies in Liquidation 0.6% | |||||
| aAdelphia RecoveryTrust | UnitedStates | 45,477,593 | 109,146 | ||
| a,fAdelphia RecoveryTrust,Arahova Contingent Value Vehicle, | |||||
| Contingent Distribution | UnitedStates | 5,538,790 | 55,388 | ||
| a,f,gCenturyCommunicationsCorp.,Contingent Distribution | UnitedStates | 15,282,000 | — | ||
| a,bFIM Coinvestor HoldingsI,LLC | UnitedStates | 30,279,560 | — | ||
| a,mLehman BrothersHoldingsInc.,BankruptcyClaim | UnitedStates | 587,363,521 | 146,840,880 | ||
| a,f,gNewPage Corp.,Litigation Trust,Contingent Distribution | UnitedStates | 145,817,000 | — | ||
| a,f,gTribune Media Litigation Trust,Contingent Distribution | UnitedStates | 1,285,960 | — | ||
| Total Companies in Liquidation (Cost $164,973,082) | 147,005,414 |
franklintempleton.com
Annual Report
| 25
| FRANKLIN MUTUAL GLOBAL DISCOVERY FUND | |||||
| STATEMENT OF INVESTMENTS | |||||
| Principal | |||||
| Country | Amount* | Value | |||
| Municipal Bonds (Cost $67,686,298)0.2% | |||||
| Puerto Rico CommonwealthGO,Refunding,SeriesA,8.00%,7/01/35 | UnitedStates | 72,507,000 | $ | 63,352,991 | |
| Total Investments before Short Term Investments | |||||
| (Cost $18,060,893,461) | 23,237,103,599 | ||||
| Short Term Investments 8.5% | |||||
| U.S.Government and Agency Securities 8.3% | |||||
| nFHLB,1/02/15 | UnitedStates | 4,400,000 | 4,400,000 | ||
| n,oU.S.TreasuryBills,1/02/15-7/02/15 | UnitedStates | 2,130,300,000 | 2,130,109,680 | ||
| Total U.S.Government and Agency Securities | |||||
| (Cost $2,134,410,525) | 2,134,509,680 | ||||
| Total Investments before Money Market Funds | |||||
| (Cost $20,195,303,986) | 25,371,613,279 | ||||
| Shares | |||||
| pInvestments from Cash Collateral Received for Loaned | |||||
| Securities (Cost $38,119,184)0.2% | |||||
| Money Market Funds 0.2% | |||||
| qBNYMellon Overnight Government Fund,0.072% | UnitedStates | 38,119,184 | 38,119,184 | ||
| Total Investments (Cost $20,233,423,170)98.9% | 25,409,732,463 | ||||
| Securities Sold Short (0.6)% | (158,660,383 | ) | |||
| Other Assets,less Liabilities 1.7% | 441,693,620 | ||||
| Net Assets 100.0% | $ | 25,692,765,700 | |||
| rSecurities Sold Short (Proceeds $165,175,794)(0.6)% | |||||
| Common Stocks (0.6)% | |||||
| Diversified Telecommunication Services (0.6)% | |||||
| AT&TInc. | UnitedStates | 4,723,441 | $ | (158,660,383 | ) |
†Rounds to less than 0.1% of net assets.
*The principal amount is stated in U.S. dollars unless otherwise indicated.
aNon-income producing.
bSee Note 10 regarding restricted securities.
cAt December 31, 2014, pursuant to the Fund’s policies and the requirements of applicable securities law, the Fund may be restricted from trading these securities for a limited
or extended period of time.
dSee Note 12 regarding holdings of 5% voting securities.
eSecurity was purchased pursuant to Rule 144A under the Securities Act of 1933 and may be sold in transactions exempt from registration only to qualified institutional buyers
or in a public offering registered under the Securities Act of 1933. These securities have been deemed liquid under guidelines approved by the Trust’s Board of Trustees. At
December 31, 2014, the aggregate value of these securities was $416,683,960, representing 1.62% of net assets.
fContingent distributions represent the right to receive additional distributions, if any, during the reorganization of the underlying company. Shares represent total underlying
principal of debt securities.
gSecurity has been deemed illiquid because it may not be able to be sold within seven days. At December 31, 2014, the aggregate value of these securities was $45,529,407,
representing 0.18% of net assets.
hA portion or all of the security is on loan at December 31, 2014. See Note 1(f).
iSee Note 1(g) regarding senior floating rate interests.
jThe coupon rate shown represents the rate at period end.
kIncome may be received in additional securities and/or cash.
lSee Note 8 regarding credit risk and defaulted securities.
mBankruptcy claims represent the right to receive distributions, if any, during the liquidation of the underlying pool of assets. Shares represent amount of allowed unsecured claims.
nThe security is traded on a discount basis with no stated coupon rate.
oSecurity or a portion of the security has been pledged as collateral for securities sold short, open futures and forward contracts. At December 31, 2014, the aggregate value of
these securities and/or cash pledged as collateral was $267,044,167, representing 1.04% of net assets.
pSee Note 1(f) regarding securities on loan.
qThe rate shown is the annualized seven-day yield at period end.
rSee Note 1(e) regarding securities sold short.
26 | Annual Report
franklintempleton.com
| FRANKLIN MUTUAL GLOBAL DISCOVERY FUND | |||||||||||||
| STATEMENT OF INVESTMENTS | |||||||||||||
| At December 31, 2014, the Fund had the following futures contracts outstanding. See Note 1(c). | |||||||||||||
| Futures Contracts | |||||||||||||
| Number of | Notional Expiration | Unrealized | Unrealized | ||||||||||
| Description | Type Contracts | Value | Date Appreciation Depreciation | ||||||||||
| Currency Contracts | |||||||||||||
| CHF/USD | Short | 107 | $ | 13,473,975 | 3/16/15 | $ | 313,974 | $ | — | ||||
| EUR/USD | Short | 5,513 | 834,323,638 | 3/16/15 | 20,095,756 | — | |||||||
| GBP/USD | Short | 5,931 | 577,160,437 | 3/16/15 | 3,380,830 | — | |||||||
| Unrealizedappreciation (depreciation) | 23,790,560 | — | |||||||||||
| Net unrealizedappreciation (depreciation) | $ | 23,790,560 | |||||||||||
| At December 31, 2014, the Fund had the following forward exchange contracts outstanding. See Note 1(c). | |||||||||||||
| Forward Exchange Contracts | |||||||||||||
| Contract | Settlement | Unrealized | Unrealized | ||||||||||
| Currency | Counterpartya Type | Quantity | Amount | Date Appreciation Depreciation | |||||||||
| Euro | BANT | Buy | 1,466,792 | $ | 1,837,885 | 1/20/15 | $ | — | $ | (62,673 | ) | ||
| Euro | BANT | Sell | 202,243,438 | 275,074,645 | 1/20/15 | 30,305,891 | — | ||||||
| Euro | BONY | Buy | 6,661,531 | 8,288,309 | 1/20/15 | — | (226,072 | ) | |||||
| Euro | FBCO | Buy | 6,830,495 | 8,479,425 | 1/20/15 | — | (212,696 | ) | |||||
| Euro | FBCO | Sell | 4,845,505 | 6,454,538 | 1/20/15 | 590,179 | — | ||||||
| Euro | DBFX | Buy | 10,578,992 | 13,172,513 | 1/20/15 | — | (369,098 | ) | |||||
| Euro | DBFX | Sell | 15,868,323 | 21,047,523 | 1/20/15 | 1,842,600 | — | ||||||
| Euro | HSBC | Buy | 11,680,039 | 14,523,318 | 1/20/15 | — | (387,341 | ) | |||||
| Euro | HSBC | Sell | 7,482,537 | 9,908,960 | 1/20/15 | 853,086 | — | ||||||
| Euro | SCBT | Sell | 6,298,866 | 8,324,770 | 1/20/15 | 701,455 | — | ||||||
| Euro | SSBT | Buy | 10,942,088 | 13,625,375 | 1/20/15 | — | (382,516 | ) | |||||
| Euro | SSBT | Sell | 5,457,515 | 7,212,008 | 1/20/15 | 606,952 | — | ||||||
| BritishPound | BANT | Buy | 51,245,482 | 83,478,773 | 1/21/15 | — | (3,615,915 | ) | |||||
| BritishPound | BBU | Buy | 48,502,049 | 78,212,614 | 1/21/15 | — | (2,625,224 | ) | |||||
| BritishPound | FBCO | Buy | 857,497 | 1,388,391 | 1/21/15 | — | (52,036 | ) | |||||
| BritishPound | FBCO | Sell | 2,428,100 | 3,936,183 | 1/21/15 | 152,142 | — | ||||||
| BritishPound | DBFX | Sell | 144,291,349 | 246,113,467 | 1/21/15 | 21,244,482 | — | ||||||
| BritishPound | HSBC | Buy | 4,122,870 | 6,927,452 | 1/21/15 | — | (502,219 | ) | |||||
| BritishPound | HSBC | Sell | 101,783,789 | 173,643,144 | 1/21/15 | 15,019,515 | — | ||||||
| BritishPound | SCBT | Sell | 4,172,644 | 6,762,772 | 1/21/15 | 259,968 | — | ||||||
| BritishPound | SSBT | Buy | 11,324,127 | 18,987,428 | 1/21/15 | — | (1,339,490 | ) | |||||
| BritishPound | SSBT | Sell | 134,247,352 | 229,133,381 | 1/21/15 | 19,917,332 | — | ||||||
| SouthKorean Won | BANT | Sell | 165,948,232,491 | 158,173,375 | 2/12/15 | 7,083,976 | (306,185 | ) | |||||
| SouthKorean Won | BONY | Sell | 10,598,888,230 | 10,269,902 | 2/12/15 | 600,472 | — | ||||||
| SouthKorean Won | FBCO | Buy | 2,637,173,346 | 2,412,784 | 2/12/15 | — | (6,875 | ) | |||||
| SouthKorean Won | FBCO | Sell | 181,057,990,375 | 174,270,284 | 2/12/15 | 9,157,855 | (67,880 | ) | |||||
| SouthKorean Won | HSBC | Buy | 29,691,998,255 | 26,951,191 | 2/12/15 | 212,598 | (75,598 | ) | |||||
| SouthKorean Won | HSBC | Sell | 254,809,321,855 | 244,790,688 | 2/12/15 | 12,401,832 | (75,242 | ) | |||||
| SwissFranc | BANT | Buy | 5,185,728 | 5,358,405 | 2/12/15 | — | (138,520 | ) | |||||
| SwissFranc | BANT | Sell | 52,724,241 | 58,302,284 | 2/12/15 | 5,230,763 | — | ||||||
| SwissFranc | FBCO | Buy | 7,989,281 | 8,319,284 | 2/12/15 | — | (277,380 | ) | |||||
| SwissFranc | FBCO | Sell | 2,294,737 | 2,437,001 | 2/12/15 | 127,150 | — | ||||||
| SwissFranc | DBFX | Buy | 6,919,721 | 7,176,936 | 2/12/15 | — | (211,637 | ) | |||||
| SwissFranc | DBFX | Sell | 2,614,585 | 2,832,776 | 2/12/15 | 200,970 | — | ||||||
| SwissFranc | HSBC | Buy | 288,933 | 298,707 | 2/12/15 | — | (7,871 | ) | |||||
| SwissFranc | HSBC | Sell | 727,558 | 739,621 | 2/12/15 | 7,271 | — | ||||||
| SwissFranc | SSBT | Buy | 9,255,222 | 9,585,375 | 2/12/15 | — | (269,192 | ) | |||||
| SwissFranc | SSBT | Sell | 332,712 | 346,097 | 2/12/15 | 11,193 | — | ||||||
| BritishPound | BANT | Buy | 74,461,525 | 119,871,819 | 2/19/15 | — | (3,854,228 | ) | |||||
| franklintempleton.com | Annual Report | 27 | ||||||||||||
| FRANKLIN MUTUAL GLOBAL DISCOVERY FUND | |||||||||||
| STATEMENT OF INVESTMENTS | |||||||||||
| Forward Exchange Contracts (continued) | |||||||||||
| Contract Settlement | Unrealized | Unrealized | |||||||||
| Currency | Counterpartya Type | Quantity | Amount | Date Appreciation Depreciation | |||||||
| BritishPound | BANT | Sell | 132,948,112 | $ | 220,024,607 | 2/19/15 | $ | 12,879,780 | $ | — | |
| BritishPound | BBU | Buy | 2,662,599 | 4,215,185 | 2/19/15 | — | (66,622 | ) | |||
| BritishPound | FBCO | Buy | 27,270,917 | 43,662,702 | 2/19/15 | — | (1,172,220 | ) | |||
| BritishPound | FBCO | Sell | 114,897,971 | 191,034,389 | 2/19/15 | 12,013,265 | — | ||||
| BritishPound | DBFX | Buy | 7,330,214 | 11,752,411 | 2/19/15 | — | (331,294 | ) | |||
| BritishPound | DBFX | Sell | 1,752,585 | 2,745,663 | 2/19/15 | 14,981 | — | ||||
| BritishPound | HSBC | Buy | 18,923,645 | 30,298,339 | 2/19/15 | — | (813,639 | ) | |||
| BritishPound | HSBC | Sell | 13,343,243 | 21,547,281 | 2/19/15 | 757,336 | — | ||||
| BritishPound | SCBT | Buy | 1,025,880 | 1,660,818 | 2/19/15 | — | (62,407 | ) | |||
| BritishPound | SCBT | Sell | 4,449,351 | 7,184,785 | 2/19/15 | 252,306 | — | ||||
| BritishPound | SSBT | Buy | 30,543,635 | 48,710,853 | 2/19/15 | — | (1,121,189 | ) | |||
| BritishPound | SSBT | Sell | 117,880,805 | 195,511,320 | 2/19/15 | 11,842,680 | — | ||||
| Euro | BANT | Sell | 69,308,845 | 90,515,459 | 2/27/15 | 6,606,879 | — | ||||
| Euro | BONY | Sell | 8,928,353 | 11,717,606 | 2/27/15 | 908,518 | — | ||||
| Euro | FBCO | Sell | 39,596,502 | 51,405,898 | 2/27/15 | 3,468,493 | — | ||||
| Euro | DBFX | Sell | 311,852,374 | 411,056,827 | 2/27/15 | 33,513,531 | — | ||||
| Euro | HSBC | Sell | 15,235,173 | 19,973,793 | 2/27/15 | 1,529,369 | — | ||||
| Euro | SCBT | Sell | 23,514,862 | 30,808,090 | 2/27/15 | 2,339,880 | — | ||||
| Euro | SSBT | Sell | 8,803,123 | 11,484,081 | 2/27/15 | 826,602 | — | ||||
| Canadian Dollar | BONY | Buy | 2,872,434 | 2,568,023 | 3/18/15 | — | (98,666 | ) | |||
| Canadian Dollar | BONY | Sell | 7,863,284 | 6,995,116 | 3/18/15 | 235,254 | — | ||||
| Canadian Dollar | DBFX | Sell | 18,424,804 | 16,012,823 | 3/18/15 | 173,494 | — | ||||
| Canadian Dollar | SCBT | Buy | 2,854,895 | 2,542,878 | 3/18/15 | — | (88,598 | ) | |||
| Canadian Dollar | SCBT | Sell | 305,800,913 | 277,849,527 | 3/18/15 | 14,960,359 | — | ||||
| Canadian Dollar | SSBT | Buy | 2,231,612 | 1,975,233 | 3/18/15 | — | (56,773 | ) | |||
| Euro | BANT | Sell | 62,791,192 | 79,055,141 | 4/16/15 | 3,002,427 | — | ||||
| Euro | BBU | Sell | 7,828,160 | 9,864,416 | 4/16/15 | 382,946 | — | ||||
| Euro | BONY | Sell | 9,230,123 | 11,571,362 | 4/16/15 | 391,834 | — | ||||
| Euro | FBCO | Sell | 71,843,478 | 90,150,152 | 4/16/15 | 3,133,306 | — | ||||
| Euro | DBFX | Sell | 175,749,410 | 221,984,263 | 4/16/15 | 9,116,516 | — | ||||
| Euro | HSBC | Sell | 31,007,163 | 39,105,481 | 4/16/15 | 1,549,594 | — | ||||
| Euro | SCBT | Sell | 4,615,062 | 5,784,288 | 4/16/15 | 194,523 | — | ||||
| Euro | SSBT | Sell | 21,408,147 | 27,016,789 | 4/16/15 | 1,087,233 | — | ||||
| BritishPound | BANT | Sell | 4,578,998 | 7,152,852 | 4/22/15 | 22,179 | — | ||||
| BritishPound | HSBC | Sell | 120,707,529 | 194,110,345 | 4/22/15 | 6,137,786 | — | ||||
| BritishPound | SCBT | Sell | 129,377,572 | 208,427,268 | 4/22/15 | 6,953,231 | — | ||||
| Euro | BANT | Sell | 131,523,685 | 164,162,672 | 5/18/15 | 4,806,299 | — | ||||
| Euro | BONY | Sell | 1,990,289 | 2,426,162 | 5/18/15 | 14,694 | — | ||||
| Euro | FBCO | Sell | 138,214,148 | 172,527,180 | 5/18/15 | 5,064,526 | — | ||||
| Euro | DBFX | Sell | 159,169,667 | 198,266,403 | 5/18/15 | 5,413,680 | — | ||||
| Euro | HSBC | Sell | 20,850,437 | 25,774,412 | 5/18/15 | 511,662 | — | ||||
| Euro | SSBT | Sell | 1,738,913 | 2,182,266 | 5/18/15 | 75,369 | — | ||||
| BritishPound | BANT | Buy | 5,744,351 | 8,962,595 | 5/21/15 | — | (19,244 | ) | |||
| BritishPound | BANT | Sell | 103,884,314 | 162,578,951 | 5/21/15 | 841,985 | — | ||||
| BritishPound | FBCO | Buy | 1,870,684 | 2,912,124 | 5/21/15 | 335 | — | ||||
| BritishPound | FBCO | Sell | 74,832,581 | 117,023,190 | 5/21/15 | 516,721 | — | ||||
| BritishPound | HSBC | Buy | 9,737,008 | 15,224,149 | 5/21/15 | — | (64,650 | ) | |||
| BritishPound | SSBT | Sell | 137,127,294 | 214,467,088 | 5/21/15 | 974,294 | — | ||||
| Unrealizedappreciation (depreciation) | 279,041,549 | (18,961,190 | ) | ||||||||
| Net unrealizedappreciation (depreciation) | $ | 260,080,359 | |||||||||
| aMay be comprised of multiple contracts with the same counterparty, currency and settlement date. | |||||||||||
| See Abbreviations on page 47. | |||||||||||
| 28 | Annual Report | The accompanyingnotesare an integral part of these financial statements. | franklintempleton.com | ||||||||||
FRANKLIN MUTUAL GLOBAL DISCOVERY FUND
Financial Statements
Statement of Assets and Liabilities
December 31,2014
| Assets: | |||
| Investmentsin securities: | |||
| Cost -Unaffiliatedissuers | $ | 20,098,236,403 | |
| Cost -Non-controlled affiliated issuers (Note 12) | 135,186,767 | ||
| Total cost of investments | $ | 20,233,423,170 | |
| Value -Unaffiliated issuers | $ | 25,329,927,755 | |
| Value -Non-controlled affiliated issuers (Note 12) | 79,804,708 | ||
| Total value of investments (includes securities loaned in the amount of $36,672,827) | 25,409,732,463 | ||
| Cash | 2,067,669 | ||
| Restricted Cash(Note 1d) | 96,420,000 | ||
| Foreign currency,at value (cost $69,994,163) | 70,114,482 | ||
| Receivables: | |||
| Investment securities sold | 43,080,259 | ||
| Capital shares sold | 40,874,878 | ||
| Dividends and interest | 48,893,371 | ||
| Due from brokers | 164,215,565 | ||
| Variation margin | 3,037,538 | ||
| Unrealized appreciation on forward exchange contracts | 279,041,549 | ||
| Other assets | 1,043,805 | ||
| Total assets | 26,158,521,579 | ||
| Liabilities: | |||
| Payables: | |||
| Investment securities purchased | 74,960,406 | ||
| Capital shares redeemed | 41,685,669 | ||
| Management fees | 17,321,176 | ||
| Distribution fees | 11,387,710 | ||
| Transfer agent fees | 6,273,470 | ||
| Trustees’feesandexpenses | 740,043 | ||
| Securities sold short,at value (proceeds$165,175,794) | 158,660,383 | ||
| Payable upon return of securities loaned | 38,119,184 | ||
| Due to brokers | 96,420,000 | ||
| Unrealized depreciation on forward exchange contracts | 18,961,190 | ||
| Accrued expenses and other liabilities | 1,226,648 | ||
| Total liabilities | 465,755,879 | ||
| Net assets,at value | $ | 25,692,765,700 | |
| Net assetsconsist of: | |||
| Paid-in capital | $ | 20,275,520,565 | |
| Undistributed net investment income | 2,877,198 | ||
| Net unrealized appreciation (depreciation) | 5,466,084,477 | ||
| Accumulated net realizedgain (loss) | (51,716,540 | ) | |
| Net assets,at value | $ | 25,692,765,700 |
franklintempleton.com
The accompanyingnotesare an integral part of these financial statements. | Annual Report | 29
| FRANKLIN MUTUAL GLOBAL DISCOVERY FUND | |||
| FINANCIAL STATEMENTS | |||
| Statement of Assets and Liabilities (continued) | |||
| December 31,2014 | |||
| Class Z: | |||
| Net assets, at value | $ | 10,375,517,847 | |
| Shares outstanding | 311,391,107 | ||
| Net asset value and maximum offering price per share | $ | 33.32 | |
| Class A: | |||
| Net assets, at value | $ | 11,573,196,482 | |
| Shares outstanding | 352,773,441 | ||
| Net asset value per sharea | $ | 32.81 | |
| Maximum offering price per share (net asset value per share ÷94.25%) | $ | 34.81 | |
| Class C: | |||
| Net assets,at value | $ | 3,077,691,163 | |
| Sharesoutstanding | 94,739,726 | ||
| Net asset value and maximum offering price per sharea | $ | 32.49 | |
| Class R: | |||
| Net assets,at value | $ | 528,438,554 | |
| Shares outstanding | 16,293,162 | ||
| Net asset value and maximum offering price per share | $ | 32.43 | |
| Class R6: | |||
| Net assets,at value | $ | 137,921,654 | |
| Sharesoutstanding | 4,138,446 | ||
| Net asset value and maximum offering price per share | $ | 33.33 | |
aRedemption price is equal to net asset value less contingent deferred sales charges, if applicable.
30 | Annual Report | The accompanying notes are an integral part of these financial statements.
franklintempleton.com
FRANKLIN MUTUAL GLOBAL DISCOVERY FUND
FINANCIAL STATEMENTS
Statement of Operations
for the year endedDecember 31,2014
| Investment income: | |||
| Dividends:(net of foreign taxesof $15,742,361) | |||
| Unaffiliatedissuers | $ | 744,291,690 | |
| Non-controlledaffiliatedissuers(Note 12) | 414,120 | ||
| Interest | 97,339,055 | ||
| Income from securitiesloaned | 1,183,142 | ||
| Total investment income | 843,228,007 | ||
| Expenses: | |||
| Management fees(Note 3a) | 191,000,219 | ||
| Administrative fees(Note 3b) | 9,255,667 | ||
| Distribution fees:(Note 3c) | |||
| ClassA | 34,032,155 | ||
| ClassC | 30,276,969 | ||
| ClassR | 2,719,133 | ||
| Transfer agent fees:(Note 3e) | |||
| ClassZ | 14,004,661 | ||
| ClassA | 15,849,558 | ||
| ClassC | 4,230,674 | ||
| ClassR | 760,938 | ||
| ClassR6 | 1,030 | ||
| Custodian fees(Note 4) | 1,345,631 | ||
| Reportsto shareholders | 2,013,542 | ||
| Registration and filing fees | 681,770 | ||
| Professional fees | 425,932 | ||
| Trustees’ fees and expenses | 560,170 | ||
| Dividendson securities sold short | 6,422,346 | ||
| Other | 343,800 | ||
| Total expenses | 313,924,195 | ||
| Expense reductions (Note 4) | (2,268 | ) | |
| Net expenses | 313,921,927 | ||
| Net investment income | 529,306,080 | ||
| Realized and unrealized gains (losses): | |||
| Net realized gain (loss) from: | |||
| Investments: | |||
| Unaffiliated issuers | 747,201,601 | ||
| Non-controlled affiliated issuers (Note 12) | (1,854,806 | ) | |
| Foreign currency transactions | (74,849,033 | ) | |
| Futures contracts | 112,350,476 | ||
| Securities sold short | (13,609,632 | ) | |
| Net realizedgain (loss) | 769,238,606 | ||
| Net change in unrealized appreciation (depreciation )on: | |||
| Investments | (551,961,976 | ) | |
| Translation of other assets and liabilities denominatedin foreign currencies | 473,787,753 | ||
| Net change in unrealized appreciation (depreciation) | (78,174,223 | ) | |
| Net realized and unrealized gain (loss) | 691,064,383 | ||
| Net increase (decrease)in net assets resulting from operations | $ | 1,220,370,463 |
franklintempleton.com
The accompanyingnotesare an integral part of these financial statements. | Annual Report | 31
| FRANKLIN MUTUAL GLOBAL DISCOVERY FUND | ||||||
| FINANCIAL STATEMENTS | ||||||
| Statements of Changes in Net Assets | ||||||
| Year Ended December 31, | ||||||
| 2014 | 2013 | |||||
| Increase (decrease) in net assets: | ||||||
| Operations: | ||||||
| Net investment income | $ | 529,306,080 | $ | 298,219,557 | ||
| Net realizedgain (loss) from investments, foreign currency transactions, written options, | ||||||
| futures contracts and securities sold short | 769,238,606 | 1,161,060,031 | ||||
| Net change in unrealized appreciation (depreciation) on investments and translation of other | ||||||
| assets and liabilities denominated in foreign currencies | (78,174,223 | ) | 3,228,161,161 | |||
| Net increase (decrease) in net assets resulting from operations | 1,220,370,463 | 4,687,440,749 | ||||
| Distributionsto shareholders from: | ||||||
| Net investment income: | ||||||
| ClassZ | (242,833,725 | ) | (153,169,921 | ) | ||
| ClassA | (241,185,816 | ) | (147,576,057 | ) | ||
| ClassC | (44,110,108 | ) | (22,295,610 | ) | ||
| ClassR | (10,113,788 | ) | (6,426,289 | ) | ||
| ClassR6 | (3,363,366 | ) | (175,736 | ) | ||
| Net realized gains: | ||||||
| ClassZ | (405,244,066 | ) | (439,026,091 | ) | ||
| ClassA | (460,043,428 | ) | (501,321,480 | ) | ||
| ClassC | (124,294,638 | ) | (136,541,361 | ) | ||
| ClassR | (21,543,405 | ) | (25,642,292 | ) | ||
| ClassR6 | (5,256,846 | ) | (455,197 | ) | ||
| Total distributionsto shareholders | (1,557,989,186 | ) | (1,432,630,034 | ) | ||
| Capital share transactions:(Note 2) | ||||||
| ClassZ | 983,458,650 | 763,820,861 | ||||
| ClassA | 936,331,601 | 1,372,830,037 | ||||
| ClassB | — | (7,791,204 | ) | |||
| ClassC | 225,941,115 | 280,891,544 | ||||
| ClassR | (5,024,677 | ) | 2,361,667 | |||
| ClassR6 | 130,002,289 | 10,407,188 | ||||
| Total capital share transactions | 2,270,708,978 | 2,422,520,093 | ||||
| Net increase (decrease) in net assets | 1,933,090,255 | 5,677,330,808 | ||||
| Net assets: | ||||||
| Beginning of year | 23,759,675,445 | 18,082,344,637 | ||||
| Endof year | $ | 25,692,765,700 | $ | 23,759,675,445 | ||
| Undistributed net investment income (distributions in excess of net investment income) included | ||||||
| in net assets: | ||||||
| Endof year | $ | 2,877,198 | $ | (10,673,520 | ) | |
32 | Annual Report | The accompanyingnotesare an integral part of these financial statements.
franklintempleton.com
FRANKLIN MUTUAL GLOBAL DISCOVERY FUND
Notes to Financial Statements
1.Organization and Significant Accounting Policies
Franklin Mutual Series Funds (Trust) is registered under the Investment Company Act of 1940, as amended, (1940 Act) as an open-end management investment company, consisting of seven separate funds and applies the specialized accounting and reporting guidance in U.S. Generally Accepted Accounting Principles (U.S. GAAP). Franklin Mutual Global Discovery Fund (Fund) is included in this report. The financial statements of the remaining funds in the Trust are presented separately. The Fund offers five classes of shares:Class Z, Class A, Class C, Class R and Class R6. Each class of shares differs by its initial sales load, contingent deferred sales charges, voting rights on matters affecting a single class, its exchange privilege and fees primarily due to differing arrangements for distribution and transfer agent fees.
Effective June 30, 2014, Mutual Global Discovery Fund was renamed Franklin Mutual Global Discovery Fund.
The following summarizes the Fund’s significant accounting policies.
a. Financial Instrument Valuation
The Fund’s investments in financial instruments are carried at fair value daily. Fair value is the price that would be received to sell an asset or paid to transfer a liability in an orderly transaction between market participants on the measurement date. The Fund calculates the net asset value (NAV) per share at the close of the New York Stock Exchange (NYSE), generally at 4 p.m. Eastern time (NYSE close) on each day the NYSE is open for trading. Under compliance policies and procedures approved by the Trust’s Board of Trustees (the Board), the Fund’s administrator has responsibility for oversight of valuation, including leading the cross-functional Valuation and Liquidity Oversight Committee (VLOC). The VLOC provides administration and oversight of the Fund’s valuation policies and procedures, which are approved annually by the Board. Among other things, these procedures allow the Fund to utilize independent pricing services, quotations from securities and financial instrument dealers, and other market sources to determine fair value.
Equity securities and derivative financial instruments (derivatives) listed on an exchange or on the NASDAQ National Market System are valued at the last quoted sale price or the official closing price of the day, respectively. Foreign equity securities are valued as of the close of trading on the foreign stock exchange on which the security is primarily traded or as of the NYSE close, whichever is earlier. The value is then converted into its U.S. dollar equivalent at the foreign exchange rate in effect at the NYSE close on the day that the value of the security is determined. Over-the-counter (OTC) securities are valued within the range of the most recent quoted bid and ask prices. Securities that trade in multiple markets or on multiple exchanges are valued according to the broadest and most representative market. Certain equity securities are valued based upon fundamental characteristics or relationships to similar securities. Investments in non-registered money market funds are valued at the closing NAV.
Debt securities generally trade in the OTC market rather than on a securities exchange. The Fund’s pricing services use multiple valuation techniques to determine fair value. In instances where sufficient market activity exists, the pricing services may utilize a market-based approach through which quotes from market makers are used to determine fair value. In instances where sufficient market activity may not exist or is limited, the pricing services also utilize proprietary valuation models which may consider market characteristics such as benchmark yield curves, credit spreads, estimated default rates, anticipated market interest rate volatility, coupon rates, anticipated timing of principal repayments, underlying collateral, and other unique security features in order to estimate the relevant cash flows, which are then discounted to calculate the fair value. Securities denominated in a foreign currency are converted into their U.S. dollar equivalent at the foreign exchange rate in effect at the NYSE close on the date that the values of the foreign debt securities are determined.
Certain derivatives trade in the OTC market. The Fund’s pricing services use various techniques including industry standard option pricing models and proprietary discounted cash flow models to determine the fair value of those instruments. The Fund’s net benefit or obligation under the derivative contract, as measured by the fair value of the contract, is included in net assets.
franklintempleton.com
Annual Report
| 33
FRANKLIN MUTUAL GLOBAL DISCOVERY FUND
NOTES TO FINANCIAL STATEMENTS
1.Organization and Significant Accounting
Policies (continued)
a. Financial Instrument Valuation (continued)
The Fund has procedures to determine the fair value of financial instruments for which market prices are not reliable or readily available. Under these procedures, the VLOC convenes on a regular basis to review such financial instruments and considers a number of factors, including significant unobservable valuation inputs, when arriving at fair value. The VLOC primarily employs a market-based approach which may use related or comparable assets or liabilities, recent transactions, market multiples, book values, and other relevant information for the investment to determine the fair value of the investment. An income-based valuation approach may also be used in which the anticipated future cash flows of the investment are discounted to calculate fair value. Discounts may also be applied due to the nature or duration of any restrictions on the disposition of the investments. Due to the inherent uncertainty of valuations of such investments, the fair values may differ significantly from the values that would have been used had an active market existed. The VLOC employs various methods for calibrating these valuation approaches including a regular review of key inputs and assumptions, transactional back-testing or disposition analysis, and reviews of any related market activity.
Trading in securities on foreign securities stock exchanges and OTC markets may be completed before the daily NYSE close. In addition, trading in certain foreign markets may not take place on every NYSE business day. Occasionally, events occur between the time at which trading in a foreign security is completed and the close of the NYSE that might call into question the reliability of the value of a portfolio security held by the Fund. As a result, differences may arise between the value of the Fund’s portfolio securities as determined at the foreign market close and the latest indications of value at the close of the NYSE. In order to minimize the potential for these differences, the VLOC monitors price movements following the close of trading in foreign stock markets through a series of country specific market proxies (such as baskets of American Depositary Receipts, futures contracts and exchange traded funds). These price movements are measured against established trigger thresholds for each specific market proxy to assist in determining if an event has occurred that may call into question the reliability of the values of the foreign securities held by the Fund. If such an event occurs, the securities may be
valued using fair value procedures, which may include the use of independent pricing services.
Also, when the last day of the reporting period is a non-business day, certain foreign markets may be open on those days that the NYSE is closed, which could result in differences between the value of the Fund’s portfolio securities on the last business day and the last calendar day of the reporting period. Any significant security valuation changes due to an open foreign market are adjusted and reflected by the Fund for financial reporting purposes.
b. Foreign Currency Translation
Portfolio securities and other assets and liabilities denominated in foreign currencies are translated into U.S. dollars based on the exchange rate of such currencies against U.S. dollars on the date of valuation. The Fund may enter into foreign currency exchange contracts to facilitate transactions denominated in a foreign currency. Purchases and sales of securities, income and expense items denominated in foreign currencies are translated into U.S. dollars at the exchange rate in effect on the transaction date. Portfolio securities and assets and liabilities denominated in foreign currencies contain risks that those currencies will decline in value relative to the U.S. dollar. Occasionally, events may impact the availability or reliability of foreign exchange rates used to convert the U.S. dollar equivalent value. If such an event occurs, the foreign exchange rate will be valued at fair value using procedures established and approved by the Board.
The Fund does not separately report the effect of changes in foreign exchange rates from changes in market prices on securities held. Such changes are included in net realized and unrealized gain or loss from investments on the Statement of Operations.
Realized foreign exchange gains or losses arise from sales of foreign currencies, currency gains or losses realized between the trade and settlement dates on securities transactions and the difference between the recorded amounts of dividends, interest, and foreign withholding taxes and the U.S. dollar equivalent of the amounts actually received or paid. Net unrealized foreign exchange gains and losses arise from changes in foreign exchange rates on foreign denominated assets and liabilities other than investments in securities held at the end of the reporting period.
34 | Annual Report
franklintempleton.com
FRANKLIN MUTUAL GLOBAL DISCOVERY FUND
NOTES TO FINANCIAL STATEMENTS
c. Derivative Financial Instruments
The Fund invested in derivatives in order to manage risk or gain exposure to various other investments or markets. Derivatives are financial contracts based on an underlying or notional amount, require no initial investment or an initial net investment that is smaller than would normally be required to have a similar response to changes in market factors, and require or permit net settlement. Derivatives contain various risks including the potential inability of the counterparty to fulfill their obligations under the terms of the contract, the potential for an illiquid secondary market, and/or the potential for market movements which expose the Fund to gains or losses in excess of the amounts shown on the Statement of Assets and Liabilities. Realized gain and loss and unrealized appreciation and depreciation on these contracts for the period are included in the Statement of Operations.
Derivative counterparty credit risk is managed through a formal evaluation of the creditworthiness of all potential counterparties. The Fund attempts to reduce its exposure to counterparty credit risk on OTC derivatives, whenever possible, by entering into International Swaps and Derivatives Association (ISDA) master agreements with certain counter-parties. These agreements contain various provisions, including but not limited to collateral requirements, events of default, or early termination. Termination events applicable to the counterparty include certain deteriorations in the credit quality of the counterparty. Termination events applicable to the Fund include failure of the Fund to maintain certain net asset levels and/or limit the decline in net assets over various periods of time. In the event of default or early termination, the ISDA master agreement gives the non-defaulting party the right to net and close-out all transactions traded, whether or not arising under the ISDA agreement, to one net amount payable by one counterparty to the other. However, absent an event of default or early termination, OTC derivative assets and liabilities are presented gross and not offset in the Statement of Assets and Liabilities. Early termination by the counterparty may result in an immediate payment by the Fund of any net liability owed to that counterparty under the ISDA agreement.
Collateral requirements differ by type of derivative. Collateral or initial margin requirements are set by the broker or exchange clearing house for exchange traded and centrally cleared derivatives. Initial margin deposited is held at the exchange and can
be in the form of cash and/or securities. For OTC derivatives traded under an ISDA master agreement, posting of collateral is required by either the Fund or the applicable counterparty if the total net exposure of all OTC derivatives with the applicable counterparty exceeds the minimum transfer amount, which typically ranges from $100,000 to $250,000, and can vary depending on the counterparty and the type of the agreement. Generally, collateral is determined at the close of fund business each day and any additional collateral required due to changes in derivative values may be delivered by the Fund or the coun-terparty within a few business days. Collateral pledged and/or received by the Fund for OTC derivatives, if any, is held in segregated accounts with the Fund’s custodian/counterparty broker and can be in the form of cash and/or securities. Unrestricted cash may be invested according to the Fund’s investment objectives.
The Fund entered into exchange traded futures contracts primarily to manage exposure to certain foreign currencies. A futures contract is an agreement between the Fund and a counterparty to buy or sell an asset for a specified price on a future date. Required initial margins are pledged by the Fund, and the daily change in fair value is accounted for as a variation margin payable or receivable on the Statement of Assets and Liabilities.
The Fund entered into OTC forward exchange contracts primarily to manage exposure to certain foreign currencies.
A forward exchange contract is an agreement between the Fund and a counterparty to buy or sell a foreign currency at a specific exchange rate on a future date.
The Fund purchased or wrote exchange traded option contracts primarily to manage exposure to equity price risk. An option is a contract entitling the holder to purchase or sell a specific amount of shares or units of an asset or notional amount of a swap (swaption), at a specified price. Options purchased are recorded as an asset while options written are recorded as a liability. Upon exercise of an option, the acquisition cost or sales proceeds of the underlying investment is adjusted by any premium received or paid. Upon expiration of an option, any premium received or paid is recorded as a realized gain or loss. Upon closing an option other than through expiration or exercise, the difference between the premium and the cost to close the position is recorded as a realized gain or loss.
See Notes 7and 11 regarding investment transactions and other derivative information, respectively.
franklintempleton.com
Annual Report
| 35
FRANKLIN MUTUAL GLOBAL DISCOVERY FUND
NOTES TO FINANCIAL STATEMENTS
1.Organization and Significant Accounting
Policies (continued)
d. Restricted Cash
At December 31, 2014, the Fund held restricted cash in connection with investments in certain derivative securities. Restricted cash is held in a segregated account with the Fund’s custodian/counterparty broker and is reflected in the Statement of Assets and Liabilities.
e. Securities Sold Short
The Fund is engaged in selling securities short, which obligates the Fund to replace a borrowed security with the same security at current fair value. The Fund incurs a loss if the price of the security increases between the date of the short sale and the date on which the Fund replaces the borrowed security. The Fund realizes a gain if the price of the security declines between those dates. Gains are limited to the price at which the Fund sold the security short, while losses are potentially unlimited in size.
The Fund is required to establish a margin account with the broker lending the security sold short. While the short sale is outstanding, the broker retains the proceeds of the short sale to the extent necessary to meet margin requirements until the short position is closed out. A deposit must also be maintained with the Fund’s custodian/counterparty broker consisting of cash and/or securities having a value equal to a specified percentage of the value of the securities sold short. The Fund is obligated to pay fees for borrowing the securities sold short and is required to pay the counterparty any dividends and/or interest due on securities sold short. Such dividends and/or interest and any security borrowing fees are recorded as an expense to the Fund.
f. Securities Lending
The Fund participates in an agency based securities lending program. The Fund receives cash collateral against the loaned securities in an amount equal to at least 102% of the fair value of the loaned securities. Collateral is maintained over the life of the loan in an amount not less than 100% of the fair value of loaned securities, as determined at the close of fund business each day;any additional collateral required due to changes in security values is delivered to the Fund on the next business day. The collateral is invested in a non-registered money fund as indicated on the Statement of Investments. The Fund receives income from the investment of cash collateral, in
addition to lending fees and rebates paid by the borrower. The Fund bears the market risk with respect to the collateral investment, securities loaned, and the risk that the agent may default on its obligations to the Fund. The securities lending agent has agreed to indemnify the Fund in the event of default by a third party borrower.
g. Senior Floating Rate Interests
The Fund invests in senior secured corporate loans that pay interest at rates which are periodically reset by reference to a base lending rate plus a spread. These base lending rates are generally the prime rate offered by a designated U.S. bank or the London InterBank Offered Rate (LIBOR). Senior secured corporate loans often require prepayment of principal from excess cash flows or at the discretion of the borrower. As a result, actual maturity may be substantially less than the stated maturity. Senior secured corporate loans in which the Fund invests are generally readily marketable, but may be subject to certain restrictions on resale.
h. Income and Deferred Taxes
It is the Fund’s policy to qualify as a regulated investment company under the Internal Revenue Code. The Fund intends to distribute to shareholders substantially all of its taxable income and net realized gains to relieve it from federal income and excise taxes. As a result, no provision for U.S. federal income taxes is required.
The Fund may be subject to foreign taxation related to income received, capital gains on the sale of securities and certain foreign currency transactions in the foreign jurisdictions in which it invests. Foreign taxes, if any, are recorded based on the tax regulations and rates that exist in the foreign markets in which the Fund invests. When a capital gain tax is determined to apply the Fund records an estimated deferred tax liability in an amount that would be payable if the securities were disposed of on the valuation date. As a result of several court cases, in certain countries across the European Union, the Fund has filed additional tax reclaims for previously withheld taxes on dividends earned in those countries. These additional filings are subject to various administrative proceedings by the local jurisdictions’ tax authorities within the European Union, as well as a number of related judicial proceedings. At this time, uncertainty exists as to the ultimate resolution of these proceedings, the likelihood of receipt of these reclaims, and the potential timing of payment, and accordingly, no amounts are reflected in the financial statements.
36 | Annual Report
franklintempleton.com
FRANKLIN MUTUAL GLOBAL DISCOVERY FUND
NOTES TO FINANCIAL STATEMENTS
The Fund recognizes the tax benefits of uncertain tax positions only when the position is “more likely than not” to be sustained upon examination by the tax authorities based on the technical merits of the tax position. As of December 31, 2014, and for all open tax years, the Fund has determined that no liability for unrecognized tax benefits is required in the Fund’s financial statements related to uncertain tax positions taken on a tax return (or expected to be taken on future tax returns). Open tax years are those that remain subject to examination and are based on each tax jurisdiction statute of limitation.
i. Security Transactions, Investment Income, Expenses and Distributions
Security transactions are accounted for on trade date. Realized gains and losses on security transactions are determined on a specific identification basis. Interest income and estimated expenses are accrued daily. Amortization of premium and accretion of discount on debt securities are included in interest income. Dividend income and dividends declared on securities sold short are recorded on the ex-dividend date except for certain foreign securities where the dividend rate is not available. In such cases, the dividend is recorded as soon as the information is received by the Fund. Distributions to shareholders are recorded on the ex-dividend date and are determined according to income tax regulations (tax basis). Distributable earnings determined on a tax basis may differ from earnings recorded in accordance with U.S. GAAP. These differences may be permanent or temporary. Permanent differences are reclassified among capital accounts to reflect their tax character. These reclassifications have no impact on net assets or the results of operations. Temporary differences are not reclassified, as they may reverse in subsequent periods.
Common expenses incurred by the Trust are allocated among the funds based on the ratio of net assets of each fund to the combined net assets of the Trust. Fund specific expenses are charged directly to the fund that incurred the expense.
Realized and unrealized gains and losses and net investment income, not including class specific expenses, are allocated daily to each class of shares based upon the relative proportion of net assets of each class. Differences in per share distributions, by class, are generally due to differences in class specific expenses.
j. Accounting Estimates
The preparation of financial statements in accordance with U.S. GAAP requires management to make estimates and assumptions that affect the reported amounts of assets and liabilities at the date of the financial statements and the amounts of income and expenses during the reporting period. Actual results could differ from those estimates.
k. Guarantees and Indemnifications
Under the Trust’s organizational documents, its officers and trustees are indemnified by the Trust against certain liabilities arising out of the performance of their duties to the Trust. Additionally, in the normal course of business, the Trust, on behalf of the Fund, enters into contracts with service providers that contain general indemnification clauses. The Trust’s maximum exposure under these arrangements is unknown as this would involve future claims that may be made against the Trust that have not yet occurred. Currently, the Trust expects the risk of loss to be remote.
2.Shares of Beneficial Interest
At December 31, 2014, there were an unlimited number of shares authorized (without par value). Transactions in the Fund’s shares were as follows:
| Year Ended December 31, | ||||||||||
| 2014 | 2013 | |||||||||
| Shares | Amount | Shares | Amount | |||||||
| Class Z Shares: | ||||||||||
| Shares sold | 46,881,605 | $ | 1,625,275,624 | 39,277,044 | $ | 1,262,484,145 | ||||
| Shares issued in reinvestment of distributions | 18,056,654 | 605,754,122 | 16,798,038 | 556,566,980 | ||||||
| Shares redeemed | (36,103,244 | ) | (1,247,571,096 | ) | (32,446,005 | ) | (1,055,230,264 | ) | ||
| Net increase (decrease) | 28,835,015 | $ | 983,458,650 | 23,629,077 | $ | 763,820,861 | ||||
franklintempleton.com
Annual Report
| 37
FRANKLIN MUTUAL GLOBAL DISCOVERY FUND
NOTES TO FINANCIAL STATEMENTS
| 2.Shares of Beneficial Interest (continued) | |||||||||||||
| Year Ended December 31, | |||||||||||||
| 2014 | 2013 | a | |||||||||||
| Shares | Amount | Shares | Amount | ||||||||||
| Class A Shares: | |||||||||||||
| Sharessold | 61,719,494 | $ | 2,100,805,860 | 67,514,512 | $ | 2,161,156,184 | |||||||
| Sharesissuedin reinvestment of distributions | 20,602,620 | 680,745,874 | 19,281,960 | 629,578,265 | |||||||||
| Sharesredeemed | (54,018,329 | ) | (1,845,220,133 | ) | (44,501,012 | ) | (1,417,904,412 | ) | |||||
| Net increase (decrease) | 28,303,785 | $ | 936,331,601 | 42,295,460 | $ | 1,372,830,037 | |||||||
| Class B Sharesb: | |||||||||||||
| Sharessold | 327 | $ | 9,532 | ||||||||||
| Sharesredeemed | (263,544 | ) | (7,800,736 | ) | |||||||||
| Net increase (decrease) | (263,217 | ) $ | (7,791,204 | ) | |||||||||
| Class C Shares: | |||||||||||||
| Sharessold | 13,386,983 | $ | 449,946,196 | 14,796,292 | $ | 470,219,996 | |||||||
| Sharesissuedin reinvestment of distributions | 4,719,640 | 154,538,611 | 4,473,813 | 144,765,096 | |||||||||
| Sharesredeemed | (11,248,942 | ) | (378,543,692 | ) | (10,615,918 | ) | (334,093,548 | ) | |||||
| Net increase (decrease) | 6,857,681 | $ | 225,941,115 | 8,654,187 | $ | 280,891,544 | |||||||
| Class R Shares: | |||||||||||||
| Sharessold | 2,510,654 | $ | 84,607,881 | 3,025,023 | $ | 95,077,806 | |||||||
| Sharesissuedin reinvestment of distributions | 948,190 | 30,987,138 | 971,774 | 31,386,222 | |||||||||
| Sharesredeemed | (3,577,569 | ) | (120,619,696 | ) | (3,957,937 | ) | (124,102,361 | ) | |||||
| Net increase (decrease) | (118,725 | ) | $ | (5,024,677 | ) | 38,860 | $ | 2,361,667 | |||||
| Class R6Shares: | |||||||||||||
| Sharessold | 4,042,082 | $ | 137,605,135 | 306,934 | $ | 10,243,048 | |||||||
| Sharesissuedin reinvestment of distributions | 88,191 | 2,951,083 | 19,028 | 630,574 | |||||||||
| Sharesredeemed | (304,142 | ) | (10,553,929 | ) | (13,647 | ) | (466,434 | ) | |||||
| Net increase (decrease) | 3,826,131 | $ | 130,002,289 | 312,315 | $ | 10,407,188 | |||||||
| aFor the period May 1, 2013 (effective date) to December 31, 2013, for Class R6. | |||||||||||||
| bEffective March 22, 2013, all Class B shares were converted to Class A. | |||||||||||||
3.Transactions with Affiliates
Franklin Resources, Inc. is the holding company for various subsidiaries that together are referred to as Franklin Templeton Investments. Certain officers and trustees of the Fund are also officers and/or directors of the following subsidiaries:
| Subsidiary | Affiliation |
| Franklin Mutual Advisers,LLC (Franklin Mutual) | Investment manager |
| Franklin Templeton Services,LLC (FTServices) | Administrative manager |
| Franklin Templeton Distributors,Inc. (Distributors) | Principal underwriter |
| Franklin Templeton Investor Services,LLC (Investor Services) | Transfer agent |
38 | Annual Report
franklintempleton.com
FRANKLIN MUTUAL GLOBAL DISCOVERY FUND
NOTES TO FINANCIAL STATEMENTS
a. Management Fees
The Fund pays an investment management fee to Franklin Mutual based on the average daily net assets of the Fund as follows:
| Annualized Fee Rate | Net Assets | |
| 0.875 | % | Up to andincluding$4 billion |
| 0.845 | % | Over $4 billion,up to andincluding$7billion |
| 0.825 | % | Over $7billion,up to andincluding$10billion |
| 0.805 | % | Over $10billion,up to andincluding$13billion |
| 0.785 | % | Over $13billion,up to andincluding$16billion |
| 0.765 | % | Over $16billion,up to andincluding$19billion |
| 0.745 | % | Over $19billion,up to andincluding$22billion |
| 0.725 | % | Over $22billion,up to andincluding$25billion |
| 0.705 | % | In excessof $25billion |
| Effective July 1, 2014, the Fund combined its investment management and administration agreements as approved by the Board. | ||
| The fees paid under the combined agreement do not exceed the aggregate fees that were paid under the separate agreements. | ||
| Prior to July 1, 2014, the Fund paid fees to Franklin Mutual based on the average daily net assets of the Fund as follows: | ||
| Annualized Fee Rate | Net Assets | |
| 0.800 | % | Up to andincluding$4 billion |
| 0.770 | % | Over $4 billion,up to andincluding$7billion |
| 0.750 | % | Over $7billion,up to andincluding$10billion |
| 0.730 | % | Over $10billion,up to andincluding$13billion |
| 0.710 | % | Over $13billion,up to andincluding$16billion |
| 0.690 | % | Over $16billion,up to andincluding$19billion |
| 0.670 | % | Over $19billion,up to andincluding$22billion |
| 0.650 | % | In excessof $22billion |
b. Administrative Fees
Effective July 1, 2014, under an agreement with Franklin Mutual, FT Services provides administrative services to the Fund. The fee is paid by Franklin Mutual based on the Fund’s average daily net assets, and is not an additional expense of the Fund.
Prior to July 1, 2014, the Fund paid its allocated share of an administrative fee to FT Services based on the Trust’s aggregate average daily net assets as follows:
| Annualized Fee Rate | Net Assets | |
| 0.150 | % | Up to andincluding$200million |
| 0.135 | % | Over $200million,up to andincluding$700million |
| 0.100 | % | Over $700million,up to andincluding$1.2billion |
| 0.075 | % | In excessof $1.2billion |
franklintempleton.com
Annual Report
| 39
FRANKLIN MUTUAL GLOBAL DISCOVERY FUND
NOTES TO FINANCIAL STATEMENTS
3.Transactions with Affiliates (continued)
c. Distribution Fees
The Board has adopted distribution plans for each share class, with the exception of Class Zand Class R6shares, pursuant to Rule 12b 1 under the 1940 Act. Distribution fees are not charged on shares held by affiliates. Under the Fund’s Class A reimbursement distribution plan, the Fund reimburses Distributors for costs incurred in connection with the servicing, sale and distribution of the Fund’s shares up to the maximum annual plan rate. Under the Class A reimbursement distribution plan, costs exceeding the maximum for the current plan year cannot be reimbursed in subsequent periods. In addition, under the Fund’s Class C and R compensation distribution plans, the Fund pays Distributors for costs incurred in connection with the servicing, sale and distribution of the Fund’s shares up to the maximum annual plan rate for each class. The plan year, for purposes of monitoring compliance with the maximum annual plan rates, is February 1 through January 31 for each fund.
The maximum annual plan rates, based on the average daily net assets, for each class, are as follows:
| ClassA | 0.35 | % |
| ClassC | 1.00 | % |
| ClassR | 0.50 | % |
The Board has set the current rate at 0.30% per year for Class A shares until further notice and approval by the Board.
d. Sales Charges/Underwriting Agreements
Front-end sales charges and contingent deferred sales charges (CDSC) do not represent expenses of the Fund. These charges are deducted from the proceeds of sales of Fund shares prior to investment or from redemption proceeds prior to remittance, as applicable. Distributors has advised the Fund of the following commission transactions related to the sales and redemptions of the Fund’s shares for the year:
| Saleschargesretainednet of commissionspaidto unaffiliated | ||
| broker/dealers | $ | 6,957,266 |
| CDSCretained | $ | 230,626 |
e. Transfer Agent Fees
Each class of shares, except for Class R6, pays transfer agent fees to Investor Services for its performance of shareholder servicing obligations and reimburses Investor Services for out of pocket expenses incurred, including shareholding servicing fees paid to third parties. These fees are allocated daily based upon their relative proportion of such classes’ aggregate net assets. Class R6pays Investor Services transfer agent fees specific to that class.
For the year ended December 31, 2014, the Fund paid transfer agent fees of $34,846,861, of which $12,533,354 was retained by Investor Services.
f. Waiver and Expense Reimbursements
Investor Services has contractually agreed in advance to waive or limit its fees so that the Class R6transfer agent fees do not exceed 0.01% until April 30, 2015. There were no Class R6transfer agent fees waived during the year ended December 31, 2014.
4.Expense Offset Arrangement
The Fund has entered into an arrangement with its custodian whereby credits realized as a result of uninvested cash balances are used to reduce a portion of the Fund’s custodian expenses. During the year ended December 31, 2014, the custodian fees were reduced as noted in the Statement of Operations.
40 | Annual Report
franklintempleton.com
FRANKLIN MUTUAL GLOBAL DISCOVERY FUND
NOTES TO FINANCIAL STATEMENTS
5.Independent Trustees’Retirement Plan
On January 1, 1993, the Trust adopted an Independent Trustees’ Retirement Plan (Plan). The Plan is an unfunded defined benefit plan that provides benefit payments to Trustees whose length of service and retirement age meets the eligibility requirements of the Plan. Benefits under the Plan are based on years of service and fees paid to each trustee at the time of retirement. Effective in December 1996, the Plan was closed to new participants.
During the year ended December 31, 2014, the Fund’s projected benefit obligation and benefit payments under the Plan were as follows:
| aProjectedbenefit obligation at December 31,2014 | $ | 740,043 | |
| bIncrease in projectedbenefit obligation | $ | 35,896 | |
| Benefit paymentsmade to retiredtrustees | $ | (24,237 | ) |
aThe projected benefit obligation is included in trustees’ fees and expenses in the Statement of Assets and Liabilities. bThe increase in projected benefit obligation is included in trustees’ fees and expenses in the Statement of Operations.
6.Income Taxes
The tax character of distributions paid during the years ended December 31, 2014 and 2013, was as follows:
| 2014 | 2013 | |||
| Distributionspaidfrom: | ||||
| Ordinaryincome | $ | 541,606,803 | $ | 467,985,037 |
| Longterm capital gain | 1,016,382,383 | 964,644,997 | ||
| $ | 1,557,989,186 | $ | 1,432,630,034 |
At December 31, 2014, the cost of investments, net unrealized appreciation (depreciation), undistributed ordinary income and undistributed long term capital gains for income tax purposes were as follows:
| Cost of investments | $ | 20,244,621,649 | |
| Unrealizedappreciation | $ | 6,346,851,876 | |
| Unrealizeddepreciation | (1,181,741,062 | ) | |
| Net unrealizedappreciation (depreciation) | $ | 5,165,110,814 | |
| Undistributedordinaryincome | $ | 17,275,258 | |
| Undistributedlongterm capital gains | 284,122,141 | ||
| Distributable earnings | $ | 301,397,399 | |
Differences between income and/or capital gains as determined on a book basis and a tax basis are primarily due to differing treatments of foreign currency transactions.
7.Investment Transactions
Purchases and sales of investments (excluding short term securities and securities sold short) for the year ended December 31, 2014, aggregated $6,019,636,423 and $5,509,516,279, respectively.
franklintempleton.com
Annual Report
| 41
FRANKLIN MUTUAL GLOBAL DISCOVERY FUND
NOTES TO FINANCIAL STATEMENTS
7.Investment Transactions (continued)
Transactions in options written during the year ended December 31, 2014, were as follows:
| Number of | |||||
| Contracts | Premiums | ||||
| Optionsoutstandingat December 31,2013 | — | $ | — | ||
| Optionswritten | 1,287 | 642,308 | |||
| Optionsexpired | — | — | |||
| Optionsexercised | (1,287 | ) | (642,308 | ) | |
| Optionsclosed | — | — | |||
| Optionsoutstandingat December 31,2014 | — | $ | — |
See Notes 1(c) and 11 regarding derivative financial instruments and other derivative information, respectively.
8.Credit Risk and Defaulted Securities
The Fund may purchase the pre-default or defaulted debt of distressed companies. Distressed companies are financially troubled and are about to be or are already involved in financial restructuring or bankruptcy. Risks associated with purchasing these securities include the possibility that the bankruptcy or other restructuring process takes longer than expected, or that distributions in restructuring are less than anticipated, either or both of which may result in unfavorable consequences to the Fund. If it becomes probable that the income on debt securities, including those of distressed companies, will not be collected, the Fund discontinues accruing income and recognizes an adjustment for uncollectible interest.
At December 31, 2014, the aggregate long value of distressed company securities for which interest recognition has been discontinued was $176,324,885, representing 0.69% of the Fund’s net assets. For information as to specific securities, see the accompanying Statement of Investments.
9.Concentration of Risk
Investing in foreign securities may include certain risks and considerations not typically associated with investing in U.S. securities, such as fluctuating currency values and changing local and regional economic, political and social conditions, which may result in greater market volatility. In addition, certain foreign securities may not be as liquid as U.S. securities.
10.Restricted Securities
The Fund invests in securities that are restricted under the Securities Act of 1933 (1933 Act) or which are subject to legal, contractual, or other agreed upon restrictions on resale. Restricted securities are often purchased in private placement transactions, and cannot be sold without prior registration unless the sale is pursuant to an exemption under the 1933 Act. Disposal of these securities may require greater effort and expense, and prompt sale at an acceptable price may be difficult. The Fund may have registration rights for restricted securities. The issuer generally incurs all registration costs.
42 | Annual Report
franklintempleton.com
FRANKLIN MUTUAL GLOBAL DISCOVERY FUND
NOTES TO FINANCIAL STATEMENTS
At December 31, 2014, the Fund held investments in restricted securities, excluding certain securities exempt from registration under the 1933 Act deemed to be liquid, as follows:
| Principal | ||||||
| Amount/Units/ | Acquisition | |||||
| Shares | Issuer | Dates | Cost | Value | ||
| 8,893 | BroadbandVenturesIIILLC,securedpromissorynote,5.00%, | |||||
| 2/01/12 | 7/01/10-11/30/12 | $ | 8,893 | $ | — | |
| 30,279,560 | FIM Coinvestor HoldingsI,LLC | 11/20/06-6/02/09 | — | — | ||
| 3,048,000 | Hightower HoldingLLC,pfd.,A,Series2 | 6/10/10-5/10/12 | 7,620,000 | 7,090,867 | ||
| 3,819,425 | International Automotive ComponentsGroup Brazil LLC | 4/13/06-12/26/08 | 2,536,498 | 361,241 | ||
| 35,491,081 | International Automotive ComponentsGroup NorthAmerica LLC | 1/12/06-3/18/13 | 29,095,371 | 26,873,137 | ||
| 47,160 | OlympusRe HoldingsLtd. | 12/19/01 | 4,405,716 | — | ||
| Total Restricted Securities (Value is0.13% of Net Assets) | $ | 43,666,478 | $ | 34,325,245 |
11.Other Derivative Information
At December 31, 2014, the Fund’s investments in derivative contracts are reflected on the Statement of Assets and Liabilities as follows:
| Asset Derivatives | Liability Derivatives | ||||||
| Derivative Contracts | |||||||
| Not Accounted for as | Statement of Assets and | Statement of Assets and | |||||
| HedgingInstruments | Liabilities Location | Fair Value | Liabilities Location | Fair Value | |||
| Foreign exchange | |||||||
| contracts | Unrealizedappreciation on | $ | 302,832,109 | a | Unrealizeddepreciation on | $ | 18,961,190 |
| forwardexchange contracts/ | forwardexchange contracts | ||||||
| Net assetsconsist of – | |||||||
| net unrealizedappreciation | |||||||
| (depreciation) |
aIncludes cumulative appreciation (depreciation) of futures contracts as reported in the Statement of Investments. Only current day’s variation margin is separately reported within the Statement of Assets and Liabilities.
For the year ended December 31, 2014, the effect of derivative contracts on the Fund’s Statement of Operations was as follows:
| Change in | |||||
| Unrealized | |||||
| Derivative Contracts | Realized Gain | Appreciation | |||
| Not Accounted for as | (Loss)for | (Depreciation) | |||
| HedgingInstruments | Statement of Operations Locations | the Year | for the Year | ||
| Foreign exchange contracts | Net realizedgain (loss)from foreign currencytransactionsand | $ | 40,807,902 | $ | 474,974,725 |
| futurescontracts/Net change in unrealizedappreciation | |||||
| (depreciation)on translation of other assetsandliabilities | |||||
| denominatedin foreign currencies |
For the year ended December 31, 2014, the average month end fair value of derivatives represented 0.71% of average month end net assets. The average month end number of open derivative contracts for the year was 238.
franklintempleton.com
Annual Report
| 43
| FRANKLIN MUTUAL GLOBAL DISCOVERY FUND | ||||
| NOTES TO FINANCIAL STATEMENTS | ||||
| 11.Other Derivative Information (continued) | ||||
| At December 31, 2014, the Fund’s OTC derivative assets and liabilities, are as follows: | ||||
| Gross and Net Amounts of Assets and Liabilities | ||||
| Presented in the Statement of Assets and Liabilities | ||||
| Assetsa | Liabilitiesa | |||
| Derivatives | ||||
| Forwardexchange contracts | $ | 279,041,549 | $ | 18,961,190 |
aAbsent an event of default or early termination, OTC derivative assets and liabilities are presented gross and not offset in the Statement of Assets and Liabilities.
At December 31, 2014, the Fund’s OTC derivative assets which may be offset against the Fund’s OTC derivative liabilities and collateral received from the counterparty, is as follows:
| Amounts Not Offset in the | ||||||||||||||
| Statement of Assets and Liabilities | ||||||||||||||
| Gross and | ||||||||||||||
| Net Amounts of | Financial | Financial | ||||||||||||
| Assets Presented in | Instruments | Instruments | Cash | Net Amount | ||||||||||
| the Statement of | Available for | Collateral | Collateral | (Not less | ||||||||||
| Assets and Liabilities | Offset | Receiveda,b | Receivedb | than zero) | ||||||||||
| Counterparty | ||||||||||||||
| BANT | $ | 70,780,179 | $ | (7,996,765 | ) | $ | (62,593,179 | ) | $ | — | $ | 190,235 | ||
| BBU | 382,946 | (382,946 | ) | — | — | — | ||||||||
| BONY | 2,150,772 | (324,738 | ) | (1,826,034 | ) | — | — | |||||||
| DBFX | 71,520,254 | (912,029 | ) | — | (66,140,000 | ) | 4,468,225 | |||||||
| FBCO | 34,223,972 | (1,789,087 | ) | (32,434,885 | ) | — | — | |||||||
| HSBC | 38,980,049 | (1,926,560 | ) | (33,453,489 | ) | (3,600,000 | ) | — | ||||||
| SCBT | 25,661,722 | (151,005 | ) | — | (25,510,717 | ) | — | |||||||
| SSBT | 35,341,655 | — | — | — | 35,341,655 | |||||||||
| Total | $ | 279,041,549 | $ | (13,483,130 | ) | $ | (130,307,587 | ) | $ | (95,250,717 | ) | $ | 40,000,115 | |
aAt December 31, 2014, the Fund received Federal Republic of Germany Bonds, U.S. Treasury Bills and Notes as collateral for derivatives.
bIn some instances, the collateral amounts disclosed in the table above were adjusted due to the requirement to limit the collateral amounts to avoid the effect of
overcollateralization. Actual collateral received and/or pledged may be more than the amounts disclosed herein.
44 | Annual Report
franklintempleton.com
FRANKLIN MUTUAL GLOBAL DISCOVERY FUND
NOTES TO FINANCIAL STATEMENTS
At December 31, 2014, the Fund’s OTC derivative liabilities which may be offset against the Fund’s OTC derivative assets and collateral pledged to the counterparty, is as follows:
| Amounts Not Offset in the | |||||||||||||
| Statement of Assets and Liabilities | |||||||||||||
| Gross and | |||||||||||||
| Net Amounts of | Financial | Financial | |||||||||||
| Liabilities Presented in | Instruments | Instruments | Cash | Net Amount | |||||||||
| the Statement of | Available for | Collateral | Collateral | (Not less | |||||||||
| Assets and Liabilities | Offset | Pledgeda,b | Pledged | than zero) | |||||||||
| Counterparty | |||||||||||||
| BANT | $ | 7,996,765 | $ | (7,996,765 | ) | $ | — | $ | — | $ | — | ||
| BBU | 2,691,846 | (382,946 | ) | (2,308,900 | ) | — | — | ||||||
| BONY | 324,738 | (324,738 | ) | — | — | — | |||||||
| DBFX | 912,029 | (912,029 | ) | — | — | — | |||||||
| FBCO | 1,789,087 | (1,789,087 | ) | — | — | — | |||||||
| HSBC | 1,926,560 | (1,926,560 | ) | — | — | — | |||||||
| SCBT | 151,005 | (151,005 | ) | — | — | — | |||||||
| SSBT | 3,169,160 | — | — | — | 3,169,160 | ||||||||
| Total | $ | 18,961,190 | $ | (13,483,130 | ) | $ | (2,308,900 | ) | $ | — | $ | 3,169,160 | |
aSee the accompanying Statement of Investments for securities pledged as collateral for derivatives.
bIn some instances, the collateral amounts disclosed in the table above were adjusted due to the requirement to limit the collateral amounts to avoid the effect of
overcollateralization. Actual collateral received and/or pledged may be more than the amounts disclosed herein.
See Notes 1(c) and 7regarding derivative financial instruments and investment transactions, respectively.
See Abbreviations on page 47.
12.Holdings of 5% Voting Securities of Portfolio Companies
The 1940 Act defines “affiliated companies” to include investments in portfolio companies in which a fund owns 5% or more of
the outstanding voting securities. Investments in “affiliated companies” for the Fund for the year ended December 31, 2014, were
as shown below.
| Number of | Number of | |||||||||||
| Shares Held | Shares Held | Value | ||||||||||
| at Beginning | Gross | Gross | at End | at End | Investment | Realized | ||||||
| Name of Issuer | of Year | Additions | Reductions | of Year | of Year | Income | Gain (Loss) | |||||
| Non-Controlled Affiliates | ||||||||||||
| Imagine Group HoldingsLtd. | 566,317 | — | (566,317 | ) | — | $ | — | $ | — | $ | (1,854,806 | ) |
| International Automotive | ||||||||||||
| ComponentsGroup | ||||||||||||
| NorthAmerica LLC | 35,491,081 | — | — | 35,491,081 | 26,873,137 | — | — | |||||
| NewPage HoldingsInc. | 583,268 | — | — | 583,268 | 52,931,571 | 414,120 | — | |||||
| Total Affiliated Securities (Value is0.31% of Net Assets) | $ | 79,804,708 | $ | 414,120 | $ | (1,854,806 | ) | |||||
13.Credit Facility
The Fund, together with other U.S. registered and foreign investment funds (collectively, Borrowers), managed by Franklin Templeton Investments, are borrowers in a joint syndicated senior unsecured credit facility totaling $1.5 billion (Global Credit Facility) which matured on February 13, 2015. This Global Credit Facility provides a source of funds to the Borrowers for temporary and emergency purposes, including the ability to meet future unanticipated or unusually large redemption requests. Effective February 13, 2015, the Borrowers renewed the Global Credit Facility for a total of $2 billion, which matures on February 12, 2016.
franklintempleton.com
Annual Report
| 45
FRANKLIN MUTUAL GLOBAL DISCOVERY FUND
NOTES TO FINANCIAL STATEMENTS
13.Credit Facility (continued)
Under the terms of the Global Credit Facility, the Fund shall, in addition to interest charged on any borrowings made by the Fund and other costs incurred by the Fund, pay its share of fees and expenses incurred in connection with the implementation and maintenance of the Global Credit Facility, based upon its relative share of the aggregate net assets of all of the Borrowers, including an annual commitment fee of 0.07% based upon the unused portion of the Global Credit Facility. These fees are reflected in other expenses on the Statement of Operations. During the year ended December 31, 2014, the Fund did not use the Global Credit Facility.
14.Fair Value Measurements
The Fund follows a fair value hierarchy that distinguishes between market data obtained from independent sources (observable
inputs) and the Fund’s own market assumptions (unobservable inputs). These inputs are used in determining the value of the
Fund’s financial instruments and are summarized in the following fair value hierarchy:
•Level 1 –quoted prices in active markets for identical financial instruments
•Level 2 –other significant observable inputs (including quoted prices for similar financial instruments, interest rates,
prepayment speed, credit risk, etc.)
•Level 3 –significant unobservable inputs (including the Fund’s own assumptions in determining the fair value of financial
instruments)
The input levels are not necessarily an indication of the risk or liquidity associated with financial instruments at that level.
For movements between the levels within the fair value hierarchy, the Fund has adopted a policy of recognizing the transfers as of
the date of the underlying event which caused the movement.
A summary of inputs used as of December 31, 2014, in valuing the Fund’s assets and liabilities carried at fair value, is as follows:
| Level 1 | Level 2 | Level 3 | Total | |||||||
| Assets: | ||||||||||
| Investmentsin Securities: | ||||||||||
| Equity | a | |||||||||
| Auto Components | $ | 122,330,577 | $ | — | $ | 27,234,378 | $ | 149,564,955 | ||
| Banks | 3,538,033,041 | 79,875,899 | — | 3,617,908,940 | ||||||
| DiversifiedFinancial Services | — | — | 7,090,867 | 7,090,867 | ||||||
| Machinery | 170,567,958 | 59,494,393 | — | 230,062,351 | ||||||
| Oil,Gas& Consumable Fuels | 1,744,165,430 | 1,238,847 | — | 1,745,404,277 | ||||||
| Paper & Forest Products | 132,749,272 | 52,931,571 | — | 185,680,843 | ||||||
| Real Estate Management & Development | — | — | 45,529,407 | 45,529,407 | ||||||
| All Other EquityInvestmentsb | 15,953,954,168 | — | — c | 15,953,954,168 | ||||||
| Corporate Bonds,NotesandSenior FloatingRate | ||||||||||
| Interests | — | 915,224,501 | — | 915,224,501 | ||||||
| Corporate NotesandSenior FloatingRate Interestsin | ||||||||||
| Reorganization | — | 176,324,885 | — c | 176,324,885 | ||||||
| Companiesin Liquidation | 109,146 | 146,896,268 | — c | 147,005,414 | ||||||
| Municipal Bonds | — | 63,352,991 | — | 63,352,991 | ||||||
| Short Term Investments | 2,130,109,680 | 42,519,184 | — | 2,172,628,864 | ||||||
| Total Investmentsin Securities | $ | 23,792,019,272 | $1,537,858,539 | $ | 79,854,652 | $ | 25,409,732,463 | |||
| Other Financial Instruments | ||||||||||
| FuturesContracts | $ | 23,790,560 | $ | — | $ | — | $ | 23,790,560 | ||
| ForwardExchange Contracts | — | 279,041,549 | — | 279,041,549 | ||||||
| Total Other Financial Instruments | $ | 23,790,560 | $ 279,041,549 | $ | — | $ | 302,832,109 | |||
46 | Annual Report
franklintempleton.com
FRANKLIN MUTUAL GLOBAL DISCOVERY FUND
NOTES TO FINANCIAL STATEMENTS
| Level 1 | Level 2 | Level 3 | Total | |||||
| Liabilities: | ||||||||
| Other Financial Instruments | ||||||||
| SecuritiesSoldShort | $ | 158,660,383 | $ | — | $ | — | $ | 158,660,383 |
| ForwardExchange Contracts | — | 18,961,190 | — | 18,961,190 | ||||
| Total Other Financial Instruments | $ | 158,660,383 | $ | 18,961,190 | $ | — | $ | 177,621,573 |
aIncludes common and preferred stocks as well as other equity investments.
bFor detailed categories, see the accompanying Statement of Investments.
cIncludes securities determined to have no value at December 31, 2014.
A reconciliation of assets in which Level 3 inputs are used in determining fair value is presented when there are significant Level 3 financial instruments at the end of the year.
15.New Accounting Pronouncements
In June 2014, the Financial Accounting Standards Board issued Accounting Standards Update (ASU) No. 2014-11, Transfers and Servicing (Topic 860), Repurchase-to-Maturity Transactions, Repurchase Financings, and Disclosures. The ASU changes the accounting for certain repurchase agreements and expands disclosure requirements related to repurchase agreements, securities lending, repurchase-to-maturity and similar transactions. The ASU is effective for interim and annual reporting periods beginning after December 15, 2014. Management has reviewed the requirements and believes the adoption of this ASU will not have a material impact on the financial statements.
16.Subsequent Events
The Fund has evaluated subsequent events through the issuance of the financial statements and determined that no events have occurred that require disclosure other then those already disclosed in the financial statements.
| Abbreviations | |||||
| Counterparty | Currency | Selected Portfolio | |||
| BANT | Bank of America N.A. | CAD | Canadian Dollar | ADR | American DepositaryReceipt |
| BBU | BarclaysBank PLC | CHF | SwissFranc | GO | General Obligation |
| BONY | Bank of New York Mellon | EUR | Euro | IDR | International DepositaryReceipt |
| DBFX | Deutsche Bank AG | GBP | BritishPound | PIK | Payment-In-Kind |
| FBCO | Credit Suisse Group AG | USD | UnitedStatesDollar | ||
| HSBC | HSBCBank USA,N.A. | ||||
| SCBT | StandardCharteredBank | ||||
| SSBT | State Street Bank andTrust Co.,N.A. | ||||
franklintempleton.com
Annual Report
| 47
FRANKLIN MUTUAL GLOBAL DISCOVERY FUND
Report of Independent Registered Public Accounting Firm
To the Board of Trustees of Franklin Mutual Series Funds and Shareholders of Franklin Mutual Global Discovery Fund:
We have audited the accompanying statement of assets and liabilities, including the statement of investments, of Franklin Mutual Global Discovery Fund (formerly, Mutual Global Discovery Fund) (the “Fund”) (one of the funds constituting Franklin Mutual Series Funds), as of December 31, 2014, and the related statement of operations for the year then ended, the statements of changes in net assets for each of the two years in the period then ended, and the financial highlights for each of the periods indicated therein. These financial statements and financial highlights are the responsibility of the Fund’s management. Our responsibility is to express an opinion on these financial statements and financial highlights based on our audits.
We conducted our audits in accordance with the standards of the Public Company Accounting Oversight Board (United States). Those standards require that we plan and perform the audit to obtain reasonable assurance about whether the financial statements and financial highlights are free of material misstatement. We were not engaged to perform an audit of the Fund’s internal control over financial reporting. Our audits included consideration of internal control over financial reporting as a basis for designing audit procedures that are appropriate in the circumstances, but not for the purpose of expressing an opinion on the effectiveness of the Fund’s internal control over financial reporting. Accordingly, we express no such opinion. An audit also includes examining, on a test basis, evidence supporting the amounts and disclosures in the financial statements and financial highlights, assessing the accounting principles used and significant estimates made by management, and evaluating the overall financial statement presentation. Our procedures included confirmation of securities owned as of December 31, 2014, by correspondence with the custodian and brokers or by other appropriate auditing procedures where replies from the brokers were not received. We believe that our audits provide a reasonable basis for our opinion.
In our opinion, the financial statements and financial highlights referred to above present fairly, in all material respects, the financial position of Franklin Mutual Global Discovery Fund (one of the funds constituting Franklin Mutual Series Funds) at December 31, 2014, the results of its operations for the year then ended, the changes in its net assets for each of the two years in the period then ended, and the financial highlights for each of the periods indicated therein, in conformity with U.S. generally accepted accounting principles.

Boston, Massachusetts
February 18, 2015
48 | Annual Report
franklintempleton.com
FRANKLIN MUTUAL GLOBAL DISCOVERY FUND
Tax Information (unaudited)
Under Section 852(b)(3)(C) of the Internal Revenue Code (Code), the Fund hereby reports the maximum amount allowable but no less than $1,016,382,383 as a long term capital gain dividend for the fiscal year ended December 31, 2014.
Under Section 854(b)(1)(A) of the Code, the Fund hereby reports 39.13% of the ordinary income dividends as income qualifying for the dividends received deduction for the fiscal year ended December 31, 2014.
Under Section 854(b)(1)(B) of the Code, the Fund hereby reports the maximum amount allowable but no less than $681,213,916 as qualified dividends for purposes of the maximum rate under Section 1(h)(11) of the Code for the fiscal year ended December 31, 2014. Distributions, including qualified dividend income, paid during calendar year 2014 will be reported to shareholders on Form 1099-DIV by mid-February 2015. Shareholders are advised to check with their tax advisors for information on the treatment of these amounts on their individual income tax returns.
Under Section 871(k)(1)(C) of the Code, the Fund hereby reports the maximum amount allowable but no less than $62,978,783 as interest related dividends for purposes of the tax imposed under Section 871(a)(1)(A) of the Code for the fiscal year ended December 31, 2014.
franklintempleton.com
Annual Report
| 49
FRANKLIN MUTUAL GLOBAL DISCOVERY FUND
Board Members and Officers
The name, year of birth and address of the officers and board members, as well as their affiliations, positions held with the Fund, principal occupations during at least the past five years and number of portfolios overseen in the Franklin Templeton Investments fund complex are shown below. Generally, each board member serves until that person’s successor is elected and qualified.
| Independent Board Members | ||||
| Number of Portfolios in | ||||
| Name,Year of Birth | Length of | Fund ComplexOverseen | Other Directorships Held During | |
| and Address | Position | Time Served | by Board Member* | at Least the Past 5Years |
| Edward I.Altman,Ph.D.(1941) Trustee | Since 1987 | 10 | None | |
| c/o Franklin Mutual Advisers,LLC | ||||
| 101John F. KennedyParkway | ||||
| Short Hills,NJ07078-2789 | ||||
Principal Occupation During at Least the Past 5Years:
MaxL. Heine Professor of Finance andDirector of The Credit andDebt MarketsResearchProgram,Salomon Center,Stern School of Business,New York University;editor andauthor of numerousfinancial publications;financial consultant;an adviser to numerousfinancial and publishingorganizations;andformerly,Vice Director,Salomon Center,Stern School of Business,New York University.
| Ann Torre Bates (1958) | Trustee | Since 1995 | 36 | Navient Corporation (loan |
| c/o Franklin Mutual Advisers,LLC | management,servicingandasset | |||
| 101John F. KennedyParkway | recovery)(May2014),AresCapital | |||
| Short Hills,NJ07078-2789 | Corporation (specialtyfinance | |||
| company)(2010-present),United | ||||
| Natural Foods,Inc. (distributor of | ||||
| natural,organic andspecialtyfoods) | ||||
| (2013-present),AlliedCapital | ||||
| Corporation (financial services) | ||||
| (2003-2010)andSLM Corporation | ||||
| (Sallie Mae)(1997-2014). | ||||
Principal Occupation During at Least the Past 5Years:
Director of variouscompanies;andformerly,Executive Vice President andChief Financial Officer,NHPIncorporated(manager of multifamily housing)(1995-1997);andVice President andTreasurer,US Airways,Inc. (until 1995).
| Burton J.Greenwald (1929) Trustee | Since 2002 | 17 | Franklin Templeton EmergingMarkets |
| c/o Franklin Mutual Advisers,LLC | Debt OpportunitiesFundPLC and | ||
| 101John F. KennedyParkway | FiduciaryInternational IrelandLimited. | ||
| Short Hills,NJ07078-2789 |
Principal Occupation During at Least the Past 5Years:
ManagingDirector,B.J. GreenwaldAssociates(management consultantsto the financial servicesindustry);andformerly,Chairman, FiduciaryTrust International Funds;Executive Vice President,L.F RothschildFundManagement,Inc.;President andDirector,Merit Mutual Funds;President,UnderwritingDivision andDirector,National Securities& ResearchCorporation;Governor,Investment CompanyInstitute; andChairman,ICIPublic Information Committee.
| Keith E.Mitchell (1954) | Trustee | Since 2009 | 10 | None |
| c/o Franklin Mutual Advisers,LLC | ||||
| 101John F. KennedyParkway | ||||
| Short Hills,NJ07078-2789 | ||||
Principal Occupation During at Least the Past 5Years:
ManagingMember,Mitchell,Hartley& Bechtel Advisers,LLC (formerly,Mitchell Advisers,LLC)(advisoryfirm);director of variousboardsof asset management firms;andformerly,ManagingDirector,Putnam Lovell NBF.
50 | Annual Report
franklintempleton.com
FRANKLIN MUTUAL GLOBAL DISCOVERY FUND
| Independent Board Members (continued) | ||||
| Number of Portfolios in | ||||
| Name,Year of Birth | Length of | Fund ComplexOverseen | Other Directorships Held During | |
| and Address | Position | Time Served | by Board Member* | at Least the Past 5Years |
| Charles Rubens II(1930) | Trustee | Since 1998 | 17 | None |
| c/o Franklin Mutual Advisers,LLC | ||||
| 101John F. KennedyParkway | ||||
| Short Hills,NJ07078-2789 | ||||
Principal Occupation During at Least the Past 5Years:
Private investor andpresident of non-profit organizations;andformerly,an executive of Time,Inc.;andTrustee of Colorado College.
| Jan Hopkins Trachtman (1947) Trustee | Since 2009 | 10 | None |
| c/o Franklin Mutual Advisers,LLC | |||
| 101John F. KennedyParkway | |||
| Short Hills,NJ07078-2789 |
Principal Occupation During at Least the Past 5Years:
President andFounder,The Jan HopkinsGroup (communicationsconsultingfirm);President,Economic Clubof New York;serveson Advisory Boardof Knight Bagehot Fellowship;andformerly,Anchor/Correspondent,CNN Financial News(until 2003);ManagingDirector andHeadof Client Communications,Citigroup Private Bank (until 2005);Off-Air Reporter,ABC News’WorldNewsTonight;andEditor,CBSNetwork News.
| Robert E.Wade (1946) | Trustee and | Trustee since 1993 43 | El Oro Ltd(investments). | |
| c/o Franklin Mutual Advisers,LLC Chairman of | andChairman of | |||
| 101John F. KennedyParkway | the Board | the Boardsince | ||
| Short Hills,NJ07078-2789 | 2005 | |||
| Principal Occupation Duringat Least the Past 5Years: | ||||
| Attorneyat law engagedin private practice (1972-2008)andmember of variousboards. | ||||
| Interested Board Members and Officers | ||||
| Number of Portfolios in | ||||
| Name,Year of Birth | Length of | Fund ComplexOverseen | Other Directorships Held During | |
| and Address | Position | Time Served | by Board Member* | at Least the Past 5Years |
| **Gregory E.Johnson (1961) | Trustee | Since 2007 | 147 | None |
| One Franklin Parkway | ||||
| San Mateo,CA 94403-1906 | ||||
Principal Occupation During at Least the Past 5Years:
Chairman of the Board,Member –Office of the Chairman,Director,President andChief Executive Officer,Franklin Resources,Inc.;officer and/or director or trustee,asthe case maybe,of some of the other subsidiariesof Franklin Resources,Inc. andof 44 of the investment companiesin Franklin Templeton Investments;andVice Chairman,Investment CompanyInstitute.
| **Peter A.Langerman (1955) | Trustee, | Trustee since | 10 | American International Group,Inc. | |
| c/o Franklin Mutual Advisers,LLC President,and | 2007,President, | (AIG)Credit FacilityTrust | |||
| 101John F. KennedyParkway | Chief Executive andChief | (2010–2011 | ). | ||
| Short Hills,NJ07078-2702 | Officer – | Executive Officer – | |||
| Investment | Investment | ||||
| Management | Management since | ||||
| 2005 | |||||
Principal Occupation During at Least the Past 5Years:
Chairman of the Board,Chief Executive Officer andPresident,Franklin Mutual Advisers,LLC;officer and/or director,asthe case maybe,of four of the investment companiesin Franklin Templeton Investments.
franklintempleton.com
Annual Report
| 51
| FRANKLIN MUTUAL GLOBAL DISCOVERY FUND | ||||
| Interested Board Members and Officers (continued) | ||||
| Number of Portfolios in | ||||
| Name,Year of Birth | Length of | Fund ComplexOverseen | Other Directorships Held During | |
| and Address | Position | Time Served | by Board Member* | at Least the Past 5Years |
| Alison E.Baur (1964) | Vice President | Since 2012 | Not Applicable | Not Applicable |
| One Franklin Parkway | ||||
| San Mateo,CA 94403-1906 | ||||
Principal Occupation During at Least the Past 5Years:
DeputyGeneral Counsel,Franklin Templeton Investments;andofficer of some of the other subsidiariesof Franklin Resources,Inc. andof 46 of the investment companiesin Franklin Templeton Investments.
| Philippe Brugere-Trelat (1949) Vice President | Since 2005 | Not Applicable | Not Applicable | |
| 101 John F. Kennedy Parkway | ||||
| Short Hills, NJ 07078-2789 | ||||
Principal Occupation During at Least the Past 5Years:
Executive Vice President,Franklin Mutual Advisers,LLC;officer of three of the investment companiesin Franklin Templeton Investments;and formerly,Portfolio Manager of Eurovest SA(FrenchregisteredInvestment Company,Sicav).
| Laura F.Fergerson (1962) | Chief | Since 2009 | Not Applicable | Not Applicable |
| One Franklin Parkway | Executive | |||
| San Mateo,CA 94403-1906 | Officer – | |||
| Finance and | ||||
| Administration |
Principal Occupation During at Least the Past 5Years:
Senior Vice President,Franklin Templeton Services,LLC;andofficer of 46of the investment companiesin Franklin Templeton Investments
| Aliya S.Gordon (1973) | Vice President | Since 2009 | Not Applicable | Not Applicable |
| One Franklin Parkway | ||||
| San Mateo,CA 94403-1906 |
Principal Occupation During at Least the Past 5Years:
Senior Associate General Counsel,Franklin Templeton Investments;officer of 46of the investment companiesin Franklin Templeton Investments;andformerly,Litigation Associate,Steefel,Levitt & Weiss,LLP(2000-2004).
| Steven J.Gray (1955) | Secretary and | Secretary since | Not Applicable | Not Applicable |
| One Franklin Parkway | Vice President | 2005 and Vice | ||
| San Mateo,CA 94403-1906 | President since | |||
| 2009 |
Principal Occupation During at Least the Past 5Years:
Senior Associate General Counsel,Franklin Templeton Investments;Vice President,Franklin Templeton Distributors,Inc. andFranklin Alternative StrategiesAdvisers,LLC;andofficer of 46of the investment companiesin Franklin Templeton Investments.
| Selena L.Holmes (1965) | Vice President | Since 2012 | Not Applicable | Not Applicable |
| 100Fountain Parkway | –AML | |||
| St. Petersburg,FL33716-1205 | Compliance |
Principal Occupation During at Least the Past 5Years:
Director,Global Compliance Monitoring;Chief Compliance Officer,Franklin Alternative StrategiesAdvisers,LLC;Vice President,Franklin Templeton Companies,LLC;andofficer of 46of the investment companiesin Franklin Templeton Investments.
52 | Annual Report
franklintempleton.com
FRANKLIN MUTUAL GLOBAL DISCOVERY FUND
| Interested Board Members and Officers (continued) | ||||
| Number of Portfolios in | ||||
| Name,Year of Birth | Length of | Fund ComplexOverseen | Other Directorships Held During | |
| and Address | Position | Time Served | by Board Member* | at Least the Past 5Years |
| Robert G.Kubilis (1973) | Treasurer, | Since 2012 | Not Applicable | Not Applicable |
| 300S.E. 2ndStreet | Chief Financial | |||
| Fort Lauderdale,FL33301-1923 Officer and | ||||
| Chief | ||||
| Accounting | ||||
| Officer | ||||
Principal Occupation During at Least the Past 5Years:
Assistant Treasurer,FundAccounting,Franklin Templeton Investments;andofficer of four of the investment companiesin Franklin Templeton Investments.
| Kimberly H.Novotny (1972) Vice President | Since 2013 | Not Applicable | Not Applicable |
| 300S.E. 2ndStreet | |||
| Fort Lauderdale,FL33301-1923 |
Principal Occupation During at Least the Past 5Years:
Associate General Counsel,Franklin Templeton Investments;Vice President andSecretary,FiduciaryTrust International of the South;Vice President,Templeton Investment Counsel,LLC;Assistant Secretary,Franklin Resources,Inc.;andofficer of 46of the investment companies in Franklin Templeton Investments.
| Robert C.Rosselot (1960) | Chief | Since 2013 | Not Applicable | Not Applicable |
| 300S.E. 2ndStreet | Compliance | |||
| Fort Lauderdale,FL33301-1923 Officer | ||||
Principal Occupation During at Least the Past 5Years:
Director,Global Compliance,Franklin Templeton Investments;Vice President,Franklin Templeton Companies,LLC;officer of 46of the investment companiesin Franklin Templeton Investments;andformerly,Senior Associate General Counsel,Franklin Templeton Investments (2007-2013);andSecretaryandVice President,Templeton Group of Funds(2004-2013).
| Karen L.Skidmore (1952) | Vice President | Since 2009 | Not Applicable | Not Applicable |
| One Franklin Parkway | ||||
| San Mateo,CA 94403-1906 |
Principal Occupation During at Least the Past 5Years:
Senior Associate General Counsel,Franklin Templeton Investments;andofficer of 46of the investment companiesin Franklin Templeton Investments.
| CraigS.Tyle (1960) | Vice President | Since 2005 | Not Applicable | Not Applicable |
| One Franklin Parkway | ||||
| San Mateo,CA 94403-1906 |
Principal Occupation During at Least the Past 5Years:
General Counsel andExecutive Vice President,Franklin Resources,Inc.;andofficer of some of the other subsidiariesof Franklin Resources, Inc. andof 46of the investment companiesin Franklin Templeton Investments.
franklintempleton.com
Annual Report
| 53
FRANKLIN MUTUAL GLOBAL DISCOVERY FUND
| Interested Board Members and Officers (continued) | ||||
| Number of Portfolios in | ||||
| Name,Year of Birth | Length of | Fund ComplexOverseen | Other Directorships Held During | |
| and Address | Position | Time Served | by Board Member* | at Least the Past 5Years |
| Lori A.Weber (1964) | Vice President | Since 2011 | Not Applicable | Not Applicable |
| 300S.E. 2ndStreet | ||||
| Fort Lauderdale,FL33301-1923 | ||||
Principal Occupation During at Least the Past 5Years:
Senior Associate General Counsel,Franklin Templeton Investments;Assistant Secretary,Franklin Resources,Inc.;Vice President and Secretary,Templeton Investment Counsel,LLC;Vice President,FiduciaryTrust International of the South;andofficer of 46of the investment companiesin Franklin Templeton Investments.
*We base the number of portfolios on each separate series of the U.S. registered investment companies within the Franklin Templeton Investments fund complex. These portfolios have a common investment manager or affiliated investment managers.
**Gregory E. Johnson is considered to be an interested person of the Fund under the federal securities laws due to his position as an officer and director of Franklin Resources, Inc., which is the parent company of the Fund’s investment manager and distributor. Peter A. Langerman is considered to be an interested person of the Fund under the federal securities laws due to his position as an officer of Franklin Mutual Advisers, LLC, which is an affiliate of the Fund’s investment manager.
Note 1: Officer information is current as of the date of this report. It is possible that after this date, information about officers may change.
The Fund’s Board has determined that certain of the members of the Audit Committee, including Ann Torre Bates, are audit committee financial experts, and “independent,” under those provisions of the Sarbanes-Oxley Act of 2002, and the rules and form amendments adopted by the Securities and Exchange Commission, relating to audit committee financial experts.
The Statement of Additional Information (SAI) includes additional information about the board members and is available, without charge, upon request.
Shareholders may call (800) DIAL BEN/342-5236 to request the SAI.
54 | Annual Report
franklintempleton.com
FRANKLIN MUTUAL GLOBAL DISCOVERY FUND
Shareholder Information
Proxy Voting Policies and Procedures
The Fund’s investment manager has established Proxy Voting Policies and Procedures (Policies) that the Fund uses to determine how to vote proxies relating to portfolio securities. Shareholders may view the Fund’s complete Policies online at franklintempleton.com. Alternatively, shareholders may request copies of the Policies free of charge by calling the Proxy Group collect at (954) 527-7678 or by sending a written request to: Franklin Templeton Companies, LLC, 300 S.E. 2nd Street, Fort Lauderdale, FL 33301, Attention:Proxy Group. Copies of the Fund’s proxy voting records are also made available online at franklintempleton.com and posted on the U.S. Securities and Exchange Commission’s website at sec.gov and reflect the most recent 12-month period ended June 30.
Quarterly Statement of Investments
The Fund files a complete statement of investments with the U.S. Securities and Exchange Commission for the first and third quarters for each fiscal year on Form N-Q. Shareholders may view the filed Form N-Q by visiting the Commission’s website at sec.gov. The filed form may also be viewed and copied at the Commission’s Public Reference Room in Washington, DC. Information regarding the operations of the Public Reference Room may be obtained by calling (800) SEC-0330.
Householding of Reports and Prospectuses
You will receive the Fund’s financial reports every six months as well as an annual updated summary prospectus (prospectus available upon request). To reduce Fund expenses, we try to identify related shareholders in a household and send only one copy of the financial reports and summary prospectus. This process, called “householding,” will continue indefinitely unless you instruct us otherwise. If you prefer not to have these documents householded, please call us at (800) 632-2301. At any time you may view current prospectuses/summary prospectuses and financial reports on our website. If you choose, you may receive these documents through electronic delivery.
franklintempleton.com
Annual Report
| 55
Thispage intentionallyleft blank.

Annual Report and Shareholder Letter
Franklin Mutual Global Discovery Fund
Formerly, Mutual Global Discovery Fund
Investment Manager
Franklin Mutual Advisers, LLC
Distributor
Franklin Templeton Distributors, Inc.
(800) DIAL BEN® /342-5236
franklintempleton.com
Shareholder Services
(800) 632-2301 -(Class A, C, R & R6)
(800) 448-FUND -(Class Z)
Authorizedfor distribution onlywhen accompaniedor precededbya summaryprospectusand/or prospectus. Investorsshould carefullyconsider a fund’sinvestment goals,risks,chargesandexpensesbefore investing. A prospectuscontainsthisandother information;please readit carefullybefore investing.
To help ensure we provide you withqualityservice,all callsto andfrom our service areasare monitoredand/or recorded.
| © 2015Franklin Templeton Investments. All rightsreserved. | 477A 02/15 |
Annual Report
and Shareholder Letter
December 31, 2014
Franklin Mutual International Fund
Formerly, Mutual International Fund

Sign up for electronic delivery at franklintempleton.com/edelivery
Franklin Templeton Investments
Gain From Our Perspective®
At Franklin Templeton Investments, we’re dedicated to one goal: delivering exceptional asset management for our clients. By bringing together multiple, world-class investment teams in a single firm, we’re able to offer specialized expertise across styles and asset classes, all supported by the strength and resources of one of the world’s largest asset managers. This has helped us to become a trusted partner to individual and institutional investors across the globe.
Focus on Investment Excellence
At the core of our firm, you’ll find multiple independent investment teams—each with a focused area of expertise—from traditional to alternative strategies and multi-asset solutions. And because our portfolio groups operate autonomously, their strategies can be combined to deliver true style and asset class diversification.
All of our investment teams share a common commitment to excellence grounded in rigorous, fundamental research and robust, disciplined risk management. Decade after decade, our consistent, research-driven processes have helped Franklin Templeton earn an impressive record of strong, long-term results.
Global Perspective Shaped by Local Expertise
In today’s complex and interconnected world, smart investing demands a global perspective. Franklin Templeton pioneered international investing over 60 years ago, and our expertise in emerging markets spans more than a quarter of a century. Today, our investment professionals are on the ground across the globe, spotting investment ideas and potential risks firsthand. These locally based teams bring in-depth understanding of local companies, economies and cultural nuances, and share their best thinking across our global research network.
Strength and Experience
Franklin Templeton is a global leader in asset management serving clients in over 150 countries.1 We run our business with the same prudence we apply to asset management, staying focused on delivering relevant investment solutions, strong long-term results and reliable, personal service. This approach, focused on putting clients first, has helped us to become one of the most trusted names in financial services.
1. As of 12/31/13. Clients are represented by the total number of shareholder accounts.
Not FDIC Insured | May Lose Value | No Bank Guarantee
| Contents | |
| Shareholder Letter | 1 |
| Annual Report | |
| Franklin Mutual International Fund | 4 |
| Performance Summary | 9 |
| Your Fund’s Expenses | 14 |
| Financial Highlights and | |
| Statement of Investments | 16 |
| Financial Statements | 27 |
| Notes to Financial Statements | 31 |
| Report of Independent Registered | |
| Public Accounting Firm | 43 |
| Tax Information | 44 |
| Board Members and Officers | 45 |
| Shareholder Information | 50 |
| | | 1 |
Annual Report
Franklin Mutual International Fund
(formerly, Mutual International Fund)
This annual report for Franklin Mutual International Fund covers the fiscal year ended December 31, 2014.
Your Fund’s Goals and Main Investments
The Fund seeks capital appreciation, which may occasionally be short term, with income as a secondary goal. The Fund normally invests at least 80% of its net assets in securities of non-U.S. issuers that the manager believes are available at prices less than their intrinsic value. The Fund invests, to a lesser extent, in risk arbitrage securities and distressed companies.
Performance Overview
The Fund’s Class Z shares had a -1.63% cumulative total return for the 12 months under review. In comparison, the Fund’s benchmark, the MSCI Europe, Australasia, Far East (EAFE) Index Net Return (Local Currency), which measures equity performance in global developed markets outside the U.S. and Canada, generated a +5.92% total return.1 You can find more of the Fund’s performance data in the Performance Summary beginning on page 9.
Performance data represent past performance, which does not guarantee future results. Investment return and principal value will fluctuate, and you may have a gain or loss when you sell your shares. Current performance may differ from figures shown. Please visit franklintempleton.com or call (800) 342-5236 for most recent month-end performance.
Economic and Market Overview
The global economy grew moderately during the 12 months under review as U.S. economic growth expanded while growth rates in much of the rest of the world declined. As measured by the MSCI World Index, stocks in global developed markets advanced overall during the 12-month period amid a generally accommodative monetary policy environment and continued strength in corporate earnings. Oil prices declined sharply during the 12-month period, resulting from weak global demand growth and strong world supply, and gold prices ended lower amid benign global inflation and a strong
U.S. dollar.
1. Source: Morningstar.
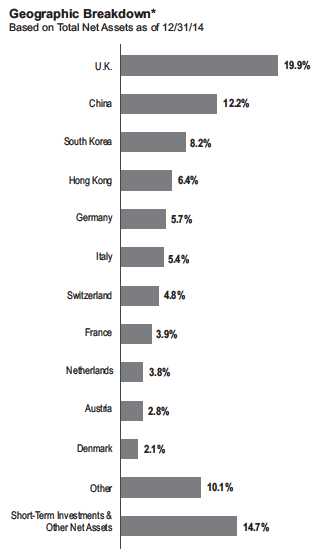
*Weightings may be negative or may not total 100% due to rounding, use of any derivatives, unsettled trades or other factors.
In Europe, the U.K. economy grew relatively well, supported by the services and manufacturing sectors. In the eurozone, economic growth remained subdued, as concerns persisted about the potential negative impacts to growth from the crisis in Ukraine and China’s moderating growth rate. However,
The unmanaged index is calculated in local currency and includes reinvested daily net dividends. One cannot invest directly in an index, and an index is not representative of the Fund’s portfolio.
See www.franklintempletondatasources.com for additional data provider information.
The dollar value, number of shares or principal amount, and names of all portfolio holdings are listed in the Fund’s Statement of Investments (SOI).
The SOI begins on page 21.
4 | Annual Report
franklintempleton.com
FRANKLIN MUTUAL INTERNATIONAL FUND
third-quarter economic growth, though meager, exceeded expectations, especially in the region’s major economies of Germany and France. In June, the European Central Bank (ECB) reduced its main interest rate and, for the first time, set a negative deposit rate; the ECB reduced both rates again in September. The ECB broadened its monetary easing stance by implementing an asset purchase program to prevent deflation and stimulate the economy. Toward period-end, the ECB cut its 2014 growth forecast for the eurozone and attributed the reduction to geopolitical risks dampening confidence and private investment.
Japan’s second- and third-quarter economic contractions indicated the economy was in a recession. However, private consumption and exports improved in the third quarter. In October, the Bank of Japan expanded its stimulus measures amid weak domestic demand and as substantially lower crude oil prices exerted further downward pressure on inflation. Toward period-end, Japan’s ruling coalition was reelected in early parliamentary elections and subsequently announced a fresh stimulus package aimed at reviving economic growth.
In several emerging markets, economic growth generally moderated. However, Brazil exited recession as government spending prior to a presidential election drove third-quarter economic growth. Emerging market equities, as measured by the MSCI Emerging Markets Index, fell for the 12-month period, amid headwinds such as soft domestic demand and weak exports in several countries. Falling crude oil prices and geopolitical tensions in certain regions, as well as concerns about the timing of U.S. interest rate increases, also pressured emerging market equities. Many emerging market currencies depreciated against the U.S. dollar, leading central banks in several countries to raise interest rates in an effort to curb inflation and support their currencies. Several other central banks lowered interest rates to promote economic growth. After implementing monetary stimulus measures to support specific sectors, China’s central bank increased its efforts to bolster the economy by cutting its benchmark interest rates for the first time since July 2012. In contrast, Russia’s central bank raised its key interest rate sharply toward period-end to limit further devaluation of the Russian ruble and contain rising inflation.
Investment Strategy
At Mutual Series, we are committed to our distinctive value approach to investing, which we believe can generate above-average risk-adjusted returns over time for our shareholders.
Our major investment strategy is investing in undervalued stocks in Asia and Europe. We have the ability to invest in emerging markets, although this is unlikely to be a significant focus of our strategy. When selecting undervalued equities, we are attracted to fundamentally strong companies with healthy balance sheets, high-quality assets, substantial free cash flow and shareholder-oriented management teams and whose stocks are trading at discounts to our assessment of the companies’ intrinsic or business value. We also look for asset rich companies whose shares may be trading at depressed levels due to concerns over short-term earnings disappointments, litigation, management strategy or other perceived negatives. This strict value approach is not only intended to improve the likelihood of upside potential, but it is also intended to reduce the risk of substantial declines. While the vast majority of our undervalued equity investments are made in publicly traded companies internationally, we may invest occasionally in privately held companies as well.
We complement this more traditional investment strategy with two others. One is distressed investing, a highly specialized field that has proven quite profitable during certain periods over the years. Distressed investing is complex and can take many forms. The most common distressed investment the Fund undertakes is the purchase of financially troubled or bankrupt companies’ debt at a substantial discount to face value. After the financially distressed company is reorganized, the old debt is typically replaced with new securities issued by the financially stronger company.
The other piece of our investment strategy is participating in arbitrage situations, another highly specialized field. When companies announce proposed mergers or takeovers, commonly referred to as “deals,” the target company may trade at a discount to the bid it ultimately accepts. One form of arbitrage involves purchasing the target company’s stock when it is trading below the value we believe it would receive in a deal.
In keeping with our commitment to a relatively conservative investment approach, we typically focus our arbitrage efforts on announced deals, and eschew rumored deals or other situations we consider relatively risky.
In addition, it is our practice to hedge the Fund’s currency exposure when we deem it advantageous for our shareholders.
What is meant by “hedge”?
To hedge an investment is to take a position intended to offset potential losses/gains that may be incurred by a companion financial instrument.
franklintempleton.com
Annual Report
| 5
FRANKLIN MUTUAL INTERNATIONAL FUND
| Top 10 Sectors/Industries | ||
| Based on Equity Securities as of 12/31/14 | ||
| % of Total | ||
| Net Assets | ||
| Insurance | 19.7 | % |
| Banks | 11.9 | % |
| Oil, Gas & Consumable Fuels | 4.5 | % |
| Media | 4.4 | % |
| Specialty Retail | 3.8 | % |
| Capital Markets | 3.7 | % |
| Hotels, Restaurants & Leisure | 3.3 | % |
| Metals & Mining | 3.2 | % |
| Automobiles | 3.1 | % |
| Electric Utilities | 2.6 | % |
Manager’s Discussion
During the period under review, some of the Fund’s investments negatively affected performance. These included Baoxin Auto Group, glassmaker Xinyi Glass Holding, and oil and gas firm Cairn Energy.
Baoxin Auto Group is a leading Chinese automobile dealership group with a high market share in the more affluent coastal regions. The company reported weaker-than-expected results for the first half of the year due to weaker sales and increased discounting. Shares of the company also came under pressure as China’s government investigated auto dealer practices and potential ways to increase competition. Among the government’s potential actions were deregulation of dealerships, lower spare part prices and allowing parallel imports (vehicles bought at dealerships outside of the country that are shipped to China and sold at lower prices than vehicles purchased directly at local dealerships), which it plans to test in Shanghai. As the number of luxury vehicles sold in China has grown, our analysis showed that Baoxin appeared positioned to benefit from the continued growth in aftermarket sales and service, which carry significantly higher margins than car sales.
Xinyi Glass is a major Chinese diversified glass manufacturer. The company’s stock was negatively affected by a slowdown in China’s real estate sector. Xinyi’s exposure to the real estate market comes primarily through its float glass business. Float glass is used for windows in new homes. Although the real estate challenge affected Xinyi’s profit in the near term, we viewed the company’s business model as defensive. For example, its auto glass division was highly profitable and accounted for approximately half of the company’s profit. Moreover, Chinese real estate showed signs of stabilization after the
Chinese government announced various measures to support the sector. As a leader in the glass industry, Xinyi appeared to us positioned to benefit from an improvement in the real estate sector and government efforts to reduce overcapacity in glass manufacturing.
Shares of Cairn Energy declined sharply in the first quarter of 2014 following an inquiry by Indian tax authorities, which appeared to use a 2012 law to seek capital gains tax on transactions internal to Cairn, entered into in 2006–2007. Serious questions arose about the validity of the 2012 law, and its applicability to Cairn was particularly questionable as it related to internal transactions and not an actual sale. Nonetheless, the Indian tax department prohibited Cairn from selling further shares of its holding in Cairn India until this issue was resolved, calling into question the company’s ability to fund its aggressive exploration program beyond the coming year. The situation took a positive turn in May with a landslide victory by the opposition BJP party in India’s national elections. We viewed as positive the new government’s early moves in other dealings with corporations and a statement about the retroactive transfer tax. During the second half of the year, the company announced that a significant discovery of high-quality oil off the coast of Senegal seemed to offer potential for expansion of commercial operations, which appeared favorable.
Several Fund holdings increased in value during the review period. Top contributors to performance included brokerage China Galaxy Securities, China Pacific Insurance and Teva Pharmaceutical Industries.
China Galaxy Securities is a major player in the Chinese brokerage industry with the least exposure to proprietary trading among its peers. The stock rallied in August after the company announced better-than-expected first-half results. Strong gains in investment banking, asset management fees and margin financing income more than offset the deterioration in brokerage commissions; fierce competition has been driving down commission rates. The positive first-half results for 2014 built upon the solid full-year 2013 numbers issued in March. Late in the year, shares of China Galaxy, along with the Chinese equity markets in general, got a boost from a November interest rate cut by the People’s Bank of China. We sought to take advantage of the stock rally to exit our position.
China Pacific Insurance is a leading insurance conglomerate in mainland China, ranking among the top three in the life and property and casualty markets. In the first half of the year, the stock came under pressure along with those of its sector peers as premium growth declined. The weaker premium gains were due to a general move away from bank-distributed products
6 | Annual Report
franklintempleton.com
FRANKLIN MUTUAL INTERNATIONAL FUND
| Top 10 Equity Holdings | ||
| 12/31/14 | ||
| Company | % of Total | |
| Sector/Industry, Country | Net Assets | |
| NN Group NV | 2.0 | % |
| Insurance, Netherlands | ||
| Industrial and Commercial Bank of China Ltd., H | 1.9 | % |
| Banks, China | ||
| Accor SA | 1.8 | % |
| Hotels, Restaurants & Leisure, France | ||
| Volkswagen AG, pfd. | 1.8 | % |
| Automobiles, Germany | ||
| RSA Insurance Group PLC | 1.7 | % |
| Insurance, U.K. | ||
| China Pacific Insurance (Group) Co. Ltd., H | 1.6 | % |
| Insurance, China | ||
| Ageas | 1.6 | % |
| Insurance, Belgium | ||
| SK Hynix Semiconductor Inc. | 1.5 | % |
| Semiconductors & Semiconductor Equipment, South Korea | ||
| Mandarin Oriental International Ltd. | 1.5 | % |
| Hotels, Restaurants & Leisure, Hong Kong | ||
| Zurich Insurance Group AG | 1.5 | % |
| Insurance, Switzerland | ||
(bancassurance), lower interest rates and poor equity returns in the Chinese market. In the fourth quarter of 2014, the company showed improving margins in its new business as the impact from the shrinking bancassurance business diminished. Equity markets in China also experienced improved returns in the final quarter, which helped the industry as a whole. China Pacific has been reorganizing its underperforming property and casualty division, which, in our view, has the potential to improve profitability. During the fourth quarter, we sought to take advantage of the stock price increase and trimmed the position.
The performance of Israel-based Teva Pharmaceutical Industries was largely driven by positive events related to the company’s most profitable drug, Copaxone, used to prevent the relapse of multiple sclerosis. In March, the U.S. Supreme Court agreed to hear Teva’s appeal (with oral arguments occurring in October) to maintain a patent, which further delayed the entrance of generic competition. The delay provided Teva the opportunity to convert more U.S. patients to its new formulation and allowed it to potentially retain a higher portion of the franchise once generic alternatives entered the market. In December, Teva received more good news regarding Copaxone with the new formulation gaining European Union approval. Investors also reacted favorably to the January 2014 announcement of a new chief executive officer as the market believed he could successfully carry on Teva’s cost-cutting restructuring program.
CFA® is a trademark owned by CFA Institute.
During the year, the Fund held currency forwards and futures to hedge a portion of the currency risk of the portfolio’s non-U.S. dollar investments. The hedges had a positive impact on the Fund’s performance during the period.
What is a currency forward contract?
A currency forward contract, or a currency forward, is an agreement between the Fund and a counterparty to buy or sell a foreign currency at a specific exchange rate on a future date.
What is a futures contract?
A futures contract, or a future, is an agreement between the Fund and a counterparty made through a U.S. or foreign futures exchange to buy or sell an asset at a specific price on a future date.
As fellow shareholders, we found recent relative performance disappointing, but it is not uncommon for our strategy to lag amid a strong equity market. We remain committed to our disciplined, value investment approach as we seek to generate attractive, long-term, risk-adjusted returns for shareholders. Thank you for your continued participation in Franklin Mutual International Fund. We look forward to continuing to serve your investment needs.

franklintempleton.com
Annual Report
| 7
FRANKLIN MUTUAL INTERNATIONAL FUND
The foregoing information reflects our analysis, opinions and portfolio holdings as of December 31, 2014, the end of the reporting period. The way we implement our main investment strategies and the resulting portfolio holdings may change depending on factors such as market and economic conditions. These opinions may not be relied upon as investment advice or an offer for a particular security. The information is not a complete analysis of every aspect of any market, country, industry, security or the Fund. Statements of fact are from sources considered reliable, but the investment manager makes no representation or warranty as to their completeness or accuracy. Although historical performance is no guarantee of future results, these insights may help you understand our investment management philosophy.
Philippe Brugere-Trelat has been a co-portfolio manager for Franklin Mutual International Fund (formerly, Mutual International Fund) since 2009. Mr. Brugere-Trelat has also served as lead portfolio manager for Franklin Mutual European Fund (formerly, Mutual European Fund) since 2005 and as portfolio manager for Franklin Mutual Global Discovery Fund (formerly, Mutual Global Discovery Fund) since 2009. He has been a member of the management team of the Mutual Series Funds since 2004, when he rejoined Franklin Templeton Investments. Previously, he was president and portfolio manager of Eurovest. Between 1984 and 1994, Mr. Brugere-Trelat was employed at Heine Securities Corporation, the Fund’s former manager.
Andrew Sleeman has been a co-portfolio manager for Franklin Mutual International Fund (formerly, Mutual International Fund) since 2009. He has also served as lead portfolio manager for Franklin Mutual Financial Services Fund (formerly, Mutual Financial Services Fund) since 2009. Mr. Sleeman joined Franklin Templeton Investments in 2007. Previously, he was with Fox-Pitt, Kelton, a financials specialist firm, where he focused on international financial equities. Prior to that, he worked in international equities at BNP Paribas. Mr. Sleeman also worked in Australia in the fixed income division of JP Morgan Investment Management.
8 | Annual Report
franklintempleton.com
FRANKLIN MUTUAL INTERNATIONAL FUND
Performance Summary as of December 31, 2014
Your dividend income will vary depending on dividends or interest paid by securities in the Fund’s portfolio, adjusted for operating expenses of each class. Capital gain distributions are net profits realized from the sale of portfolio securities. The performance table and graphs do not reflect any taxes that a shareholder would pay on Fund dividends, capital gain distributions, if any, or any realized gains on the sale of Fund shares. Total return reflects reinvestment of the Fund’s dividends and capital gain distributions, if any, and any unrealized gains or losses.
| Net Asset Value | ||||||
| Share Class (Symbol) | 12/31/14 | 12/31/13 | Change | |||
| Z (FMIZX) | $ | 14.59 | $ | 15.90 | -$ | 1.31 |
| A (FMIAX) | $ | 14.54 | $ | 15.84 | -$ | 1.30 |
| C (FCMIX) | $ | 14.38 | $ | 15.68 | -$ | 1.30 |
| R (FRMIX) | $ | 14.51 | $ | 15.83 | -$ | 1.32 |
| R6 (FIMFX) | $ | 14.59 | $ | 15.87 | -$ | 1.28 |
| Distributions (1/1/14-12/31/14) | ||||||
| Dividend | Long-Term | |||||
| Share Class | Income | Capital Gain | Total | |||
| Z | $ | 0.4335 | $ | 0.6131 | $ | 1.0466 |
| A | $ | 0.3840 | $ | 0.6131 | $ | 0.9971 |
| C | $ | 0.2799 | $ | 0.6131 | $ | 0.8930 |
| R | $ | 0.3672 | $ | 0.6131 | $ | 0.9803 |
| R6 | $ | 0.4515 | $ | 0.6131 | $ | 1.0646 |
franklintempleton.com
Annual Report
| 9
FRANKLIN MUTUAL INTERNATIONAL FUND
PERFORMANCE SUMMARY
Performance as of 12/31/141
Cumulative total return excludes sales charges. Average annual total return and value of $10,000 investment include maximum sales charges. Class Z/R/R6: no sales charges; Class A: 5.75% maximum initial sales charge; Class C: 1% contingent deferred sales charge in first year only.
| Cumulative | Average Annual | Value of | Total Annual Operating Expenses5 | |||||||||
| Share Class | Total Return2 | Total Return3 | $ | 10,000 Investment4 | (with waiver) | (without waiver) | ||||||
| Z | 1.17 | % | 1.49 | % | ||||||||
| 1-Year | -1.63 | % | -1.63 | % | $ | 9,837 | ||||||
| 5-Year | + | 40.30 | % | + | 7.01 | % | $ | 14,030 | ||||
| Since Inception (5/1/09) | + | 79.96 | % | + | 10.92 | % | $ | 17,996 | ||||
| A | 1.47 | % | 1.79 | % | ||||||||
| 1-Year | -1.89 | % | -7.55 | % | $ | 9,245 | ||||||
| 5-Year | + | 38.23 | % | + | 5.43 | % | $ | 13,026 | ||||
| Since Inception (5/1/09) | + | 77.01 | % | + | 9.45 | % | $ | 16,683 | ||||
| C | 2.17 | % | 2.49 | % | ||||||||
| 1-Year | -2.58 | % | -3.50 | % | $ | 9,650 | ||||||
| 5-Year | + | 33.43 | % | + | 5.94 | % | $ | 13,343 | ||||
| Since Inception (5/1/09) | + | 70.00 | % | + | 9.81 | % | $ | 17,000 | ||||
| R | 1.67 | % | 1.99 | % | ||||||||
| 1-Year | -2.13 | % | �� | -2.13 | % | $ | 9,787 | |||||
| 5-Year | + | 36.70 | % | + | 6.45 | % | $ | 13,670 | ||||
| Since Inception (5/1/09) | + | 74.82 | % | + | 10.36 | % | $ | 17,482 | ||||
| R6 | 1.00 | % | 2.89 | % | ||||||||
| 1-Year | -1.46 | % | -1.46 | % | $ | 9,854 | ||||||
| Since Inception (5/1/13) | + | 12.43 | % | + | 7.27 | % | $ | 11,243 | ||||
Performance data represent past performance, which does not guarantee future results. Investment return and principal value will fluctuate, and you may have a gain or loss when you sell your shares. Current performance may differ from figures shown. For most recent month-end performance, go to franklintempleton.com or call (800) 342-5236.
10 | Annual Report
franklintempleton.com
FRANKLIN MUTUAL INTERNATIONAL FUND
PERFORMANCE SUMMARY
Total Return Index Comparison for a Hypothetical $10,000 Investment1
Total return represents the change in value of an investment over the periods shown. It includes any applicable, maximum sales charge, Fund expenses, account fees and reinvested distributions. The unmanaged index is calculated in local currency and includes reinvested daily net dividends. It differs from the Fund in composition and does not pay management fees or expenses. One cannot invest directly in an index.
franklintempleton.com
Annual Report
| 11
FRANKLIN MUTUAL INTERNATIONAL FUND
PERFORMANCE SUMMARY
Total Return Index Comparison for a Hypothetical $10,000 Investment1 (continued)

12 | Annual Report
franklintempleton.com
FRANKLIN MUTUAL INTERNATIONAL FUND
PERFORMANCE SUMMARY
Total Return Index Comparison for a Hypothetical $10,000 Investment1 (continued)
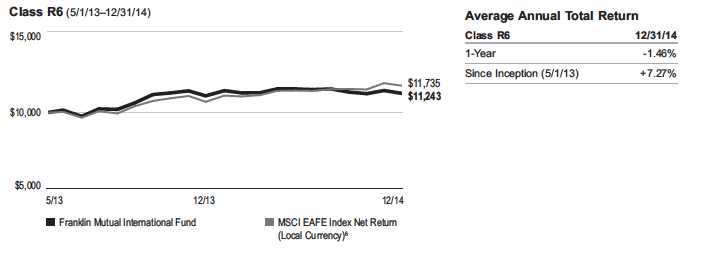
All investments involve risks, including possible loss of principal. Value securities may not increase in price as anticipated or may decline further in value. Special risks are associated with foreign investing, including currency fluctuations, economic instability and political developments. Because the Fund invests its assets primarily in companies in a specific region, it is subject to greater risks of adverse developments in that region and/or the surrounding regions than a fund that is more broadly diversified geographically. Political, social or economic disruptions in the region, even in countries in which the Fund is not invested, may adversely affect the value of securities held by the Fund. The Fund’s investments in smaller company stocks carry an increased risk of price fluctuation, especially over the short term. The Fund’s investments in companies engaged in mergers, reorganizations or liquidations also involve special risks as pending deals may not be completed on time or on favorable terms. The Fund is actively managed but there is no guarantee that the manager’s investment decisions will produce the desired results. The Fund’s prospectus also includes a description of the main investment risks.
| Class Z: | Shares are available to certain eligible investors as described in the prospectus. |
| Class C: | These shares have higher annual fees and expenses than Class A shares. |
| Class R: | Shares are available to certain eligible investors as described in the prospectus. These shares have higher annual fees and expenses than Class A shares. |
| Class R6: | Shares are available to certain eligible investors as described in the prospectus. |
1. The Fund has an expense reduction contractually guaranteed through at least 4/30/15. Fund investment results reflect the expense reduction, to the extent applicable;
without this reduction, the results would have been lower.
2. Cumulative total return represents the change in value of an investment over the periods indicated.
3. Average annual total return represents the average annual change in value of an investment over the periods indicated.
4. These figures represent the value of a hypothetical $10,000 investment in the Fund over the periods indicated.
5. Figures are as stated in the Fund’s current prospectus. In periods of market volatility, assets may decline significantly, causing total annual Fund operating expenses to
become higher than the figures shown.
6. Source: Morningstar. The MSCI EAFE Index Net Return (Local Currency) is a free float-adjusted, market capitalization-weighted index designed to measure equity market
performance of global developed markets excluding the U.S. and Canada.
See www.franklintempletondatasources.com for additional data provider information.
franklintempleton.com
Annual Report
| 13
FRANKLIN MUTUAL INTERNATIONAL FUND
Your Fund’s Expenses
As a Fund shareholder, you can incur two types of costs:
- Transaction costs, including sales charges (loads) on Fund purchases; and
- Ongoing Fund costs, including management fees, distribution and service (12b-1) fees, and other Fund expenses. All mutual funds have ongoing costs, sometimes referred to as operating expenses.
The following table shows ongoing costs of investing in the Fund and can help you understand these costs and compare them with those of other mutual funds. The table assumes a $1,000 investment held for the six months indicated.
Actual Fund Expenses
The first line (Actual) for each share class listed in the table provides actual account values and expenses. The “Ending Account Value” is derived from the Fund’s actual return, which includes the effect of Fund expenses.
You can estimate the expenses you paid during the period by following these steps. Of course, your account value and expenses will differ from those in this illustration:
| 1. | Divide your account value by $1,000. |
| If an account had an $8,600 value, then $8,600 ÷ $1,000 = 8.6. | |
| 2. | Multiply the result by the number under the heading “Expenses Paid During Period.” |
| If Expenses Paid During Period were $7.50, then 8.6 x $7.50 = $64.50. |
In this illustration, the estimated expenses paid this period are $64.50.
Hypothetical Example for Comparison with Other Funds
Information in the second line (Hypothetical) for each class in the table can help you compare ongoing costs of investing in the Fund with those of other mutual funds. This information may not be used to estimate the actual ending account balance or expenses you paid during the period. The hypothetical “Ending Account Value” is based on the actual expense ratio for each class and an assumed 5% annual rate of return before expenses, which does not represent the Fund’s actual return. The figure under the heading “Expenses Paid During Period” shows the hypothetical expenses your account would have incurred under this scenario. You can compare this figure with the 5% hypothetical examples that appear in shareholder reports of other funds.
Please note that expenses shown in the table are meant to highlight ongoing costs and do not reflect any transaction costs, such as sales charges. Therefore, the second line for each class is useful in comparing ongoing costs only, and will not help you compare total costs of owning different funds. In addition, if transaction costs were included, your total costs would have been higher. Please refer to the Fund prospectus for additional information on operating expenses.
14 | Annual Report
franklintempleton.com
FRANKLIN MUTUAL INTERNATIONAL FUND
YOUR FUND’S EXPENSES
| Beginning Account | Ending Account | Expenses Paid During | ||||
| Share Class | Value 7/1/14 | Value 12/31/14 | Period* 7/1/14–12/31/14 | |||
| Z | ||||||
| Actual | $ | 1,000 | $ | 974.50 | $ | 5.77 |
| Hypothetical (5% return before expenses) | $ | 1,000 | $ | 1,019.36 | $ | 5.90 |
| A | ||||||
| Actual | $ | 1,000 | $ | 973.10 | $ | 7.26 |
| Hypothetical (5% return before expenses) | $ | 1,000 | $ | 1,017.85 | $ | 7.43 |
| C | ||||||
| Actual | $ | 1,000 | $ | 969.90 | $ | 10.72 |
| Hypothetical (5% return before expenses) | $ | 1,000 | $ | 1,014.32 | $ | 10.97 |
| R | ||||||
| Actual | $ | 1,000 | $ | 972.00 | $ | 8.25 |
| Hypothetical (5% return before expenses) | $ | 1,000 | $ | 1,016.84 | $ | 8.44 |
| R6 | ||||||
| Actual | $ | 1,000 | $ | 975.00 | $ | 4.98 |
| Hypothetical (5% return before expenses) | $ | 1,000 | $ | 1,020.16 | $ | 5.09 |
*Expenses are calculated using the most recent six-month expense ratio, net of expense waivers, annualized for each class (Z: 1.16%; A: 1.46%; C: 2.16%; R: 1.66%; and R6: 1.00%), multiplied by the average account value over the period, multiplied by 184/365 to reflect the one-half year period.
franklintempleton.com
Annual Report
| 15
FRANKLIN MUTUAL INTERNATIONAL FUND
| Financial Highlights | |||||||||||||||
| Year Ended December 31, | |||||||||||||||
| 2014 | 2013 | 2012 | 2011 | 2010 | |||||||||||
| Class Z | |||||||||||||||
| Per share operating performance | |||||||||||||||
| (for a share outstanding throughout the year) | |||||||||||||||
| Net asset value, beginning of year | $ | 15.90 | $ | 13.58 | $ | 11.83 | $ | 13.81 | $ | 12.59 | |||||
| Income from investment operationsa: | |||||||||||||||
| Net investment incomeb | 0.30 | c | 0.24 | 0.24 | 0.28 | 0.22 | |||||||||
| Net realized and unrealized gains (losses) | (0.57 | ) | 2.42 | 1.68 | (1.81 | ) | 1.66 | ||||||||
| Total from investment operations | (0.27 | ) | 2.66 | 1.92 | (1.53 | ) | 1.88 | ||||||||
| Less distributions from: | |||||||||||||||
| Net investment income | (0.43 | ) | (0.24 | ) | (0.15 | ) | (0.30 | ) | (0.49 | ) | |||||
| Net realized gains | (0.61 | ) | (0.10 | ) | (0.02 | ) | (0.15 | ) | (0.17 | ) | |||||
| Total distributions | (1.04 | ) | (0.34 | ) | (0.17 | ) | (0.45 | ) | (0.66 | ) | |||||
| Net asset value, end of year | $ | 14.59 | $ | 15.90 | $ | 13.58 | $ | 11.83 | $ | 13.81 | |||||
| Total return | (1.63 | )% | 19.71 | % | 16.30 | % | (11.08 | )% | 15.20 | % | |||||
| Ratios to average net assets | |||||||||||||||
| Expenses before waiver, payments by affiliates and expense | |||||||||||||||
| reductiond | 1.39 | % | 1.49 | % | 1.75 | % | 1.80 | % | 2.77 | % | |||||
| Expenses net of waiver, payments by affiliates and expense | |||||||||||||||
| reductiond | 1.16 | %e | 1.17 | %e | 1.17 | % | 1.17 | % | 1.17 | % | |||||
| Expenses incurred in connection with securities sold short | —%f | —% | —% | —% | —% | ||||||||||
| Net investment income | 1.78 | %c | 1.64 | % | 1.70 | % | 2.12 | % | 1.70 | % | |||||
| Supplemental data | |||||||||||||||
| Net assets, end of year (000’s) | $ | 19,940 | $ | 14,732 | $ | 10,354 | $ | 6,977 | $ | 7,968 | |||||
| Portfolio turnover rate | 54.78 | % | 41.47 | % | 27.97 | % | 41.26 | % | 38.43 | % | |||||
aThe amount shown for a share outstanding throughout the period may not correlate with the Statement of Operations for the period due to the timing of sales and
repurchases of the Fund shares in relation to income earned and/or fluctuating fair value of the investments of the Fund.
bBased on average daily shares outstanding.
cNet investment income per share includes approximately $0.08 per share received in the form of a special dividend paid in connection with certain Fund’s holdings.
Excluding this amount, the ratio of net investment income to average net assets would have been 1.27%.
dIncludes dividend expense on securities sold short and security borrowing fees, if any. See below for the ratios of such expenses to average net assets for the periods
presented. See Note 1(d).
eBenefit of expense reduction rounds to less than 0.01%.
fRounds to less than 0.01%.
16 | Annual Report | The accompanying notes are an integral part of these financial statements.
franklintempleton.com
| FRANKLIN MUTUAL INTERNATIONAL FUND | |||||||||||||||
| FINANCIAL HIGHLIGHTS | |||||||||||||||
| Year Ended December 31, | |||||||||||||||
| 2014 | 2013 | 2012 | 2011 | 2010 | |||||||||||
| Class A | |||||||||||||||
| Per share operating performance | |||||||||||||||
| (for a share outstanding throughout the year) | |||||||||||||||
| Net asset value, beginning of year | $ | 15.84 | $ | 13.54 | $ | 11.81 | $ | 13.78 | $ | 12.58 | |||||
| Income from investment operationsa: | |||||||||||||||
| Net investment incomeb | 0.26 | c | 0.20 | 0.18 | 0.24 | 0.18 | |||||||||
| Net realized and unrealized gains (losses) | (0.57 | ) | 2.41 | 1.70 | (1.80 | ) | 1.66 | ||||||||
| Total from investment operations | (0.31 | ) | 2.61 | 1.88 | (1.56 | ) | 1.84 | ||||||||
| Less distributions from: | |||||||||||||||
| Net investment income | (0.38 | ) | (0.21 | ) | (0.13 | ) | (0.26 | ) | (0.47 | ) | |||||
| Net realized gains | (0.61 | ) | (0.10 | ) | (0.02 | ) | (0.15 | ) | (0.17 | ) | |||||
| Total distributions | (0.99 | ) | (0.31 | ) | (0.15 | ) | (0.41 | ) | (0.64 | ) | |||||
| Net asset value, end of year | $ | 14.54 | $ | 15.84 | $ | 13.54 | $ | 11.81 | $ | 13.78 | |||||
| Total returnd | (1.89 | )% | 19.34 | % | 16.01 | % | (11.39 | )% | 14.86 | % | |||||
| Ratios to average net assets | |||||||||||||||
| Expenses before waiver, payments by affiliates and expense | |||||||||||||||
| reductione | 1.69 | % | 1.79 | % | 2.05 | % | 2.11 | % | 3.05 | % | |||||
| Expenses net of waiver, payments by affiliates and expense | |||||||||||||||
| reductione | 1.46 | %f | 1.47 | %f | 1.47 | % | 1.48 | % | 1.45 | % | |||||
| Expenses incurred in connection with securities sold short | —%g | —% | —% | —% | —% | ||||||||||
| Net investment income | 1.48 | %c | 1.34 | % | 1.40 | % | 1.81 | % | 1.42 | % | |||||
| Supplemental data | |||||||||||||||
| Net assets, end of year (000’s) | $ | 39,810 | $ | 35,319 | $ | 18,221 | $ | 9,212 | $ | 8,144 | |||||
| Portfolio turnover rate | 54.78 | % | 41.47 | % | 27.97 | % | 41.26 | % | 38.43 | % | |||||
aThe amount shown for a share outstanding throughout the period may not correlate with the Statement of Operations for the period due to the timing of sales and
repurchases of the Fund shares in relation to income earned and/or fluctuating fair value of the investments of the Fund.
bBased on average daily shares outstanding.
cNet investment income per share includes approximately $0.08 per share received in the form of a special dividend paid in connection with certain Fund’s holdings.
Excluding this amount, the ratio of net investment income to average net assets would have been 0.97%.
dTotal return does not reflect sales commissions or contingent deferred sales charges, if applicable.
eIncludes dividend expense on securities sold short and security borrowing fees, if any. See below for the ratios of such expenses to average net assets for the periods
presented. See Note 1(d).
fBenefit of expense reduction rounds to less than 0.01%.
gRounds to less than 0.01%.
franklintempleton.com
The accompanying notes are an integral part of these financial statements. | Annual Report | 17
FRANKLIN MUTUAL INTERNATIONAL FUND
FINANCIAL HIGHLIGHTS
| Year Ended December 31, | |||||||||||||||
| 2014 | 2013 | 2012 | 2011 | 2010 | |||||||||||
| Class C | |||||||||||||||
| Per share operating performance | |||||||||||||||
| (for a share outstanding throughout the year) | |||||||||||||||
| Net asset value, beginning of year | $ | 15.68 | $ | 13.41 | $ | 11.74 | $ | 13.71 | $ | 12.54 | |||||
| Income from investment operationsa: | |||||||||||||||
| Net investment incomeb | 0.15 | c | 0.10 | 0.05 | 0.14 | 0.09 | |||||||||
| Net realized and unrealized gains (losses) | (0.56 | ) | 2.38 | 1.72 | (1.78 | ) | 1.64 | ||||||||
| Total from investment operations | (0.41 | ) | 2.48 | 1.77 | (1.64 | ) | 1.73 | ||||||||
| Less distributions from: | |||||||||||||||
| Net investment income | (0.28 | ) | (0.11 | ) | (0.08 | ) | (0.18 | ) | (0.39 | ) | |||||
| Net realized gains | (0.61 | ) | (0.10 | ) | (0.02 | ) | (0.15 | ) | (0.17 | ) | |||||
| Total distributions | (0.89 | ) | (0.21 | ) | (0.10 | ) | (0.33 | ) | (0.56 | ) | |||||
| Net asset value, end of year | $ | 14.38 | $ | 15.68 | $ | 13.41 | $ | 11.74 | $ | 13.71 | |||||
| Total returnd | (2.58 | )% | 18.54 | % | 15.14 | % | (11.98 | )% | 14.02 | % | |||||
| Ratios to average net assets | |||||||||||||||
| Expenses before waiver, payments by affiliates and expense | |||||||||||||||
| reductione | 2.39 | % | 2.49 | % | 2.75 | % | 2.80 | % | 3.77 | % | |||||
| Expenses net of waiver, payments by affiliates and expense | |||||||||||||||
| reductione | 2.16 | %f | 2.17 | %f | 2.17 | % | 2.17 | % | 2.17 | % | |||||
| Expenses incurred in connection with securities sold short | —%g | —% | —% | —% | —% | ||||||||||
| Net investment income | 0.78 | %c | 0.64 | % | 0.70 | % | 1.12 | % | 0.70 | % | |||||
| Supplemental data | |||||||||||||||
| Net assets, end of year (000’s) | $ | 14,794 | $ | 14,198 | $ | 10,503 | $ | 2,667 | $ | 2,103 | |||||
| Portfolio turnover rate | 54.78 | % | 41.47 | % | 27.97 | % | 41.26 | % | 38.43 | % | |||||
aThe amount shown for a share outstanding throughout the period may not correlate with the Statement of Operations for the period due to the timing of sales and
repurchases of the Fund shares in relation to income earned and/or fluctuating fair value of the investments of the Fund.
bBased on average daily shares outstanding.
cNet investment income per share includes approximately $0.08 per share received in the form of a special dividend paid in connection with certain Fund’s holdings.
Excluding this amount, the ratio of net investment income to average net assets would have been 0.27%.
dTotal return does not reflect sales commissions or contingent deferred sales charges, if applicable.
eIncludes dividend expense on securities sold short and security borrowing fees, if any. See below for the ratios of such expenses to average net assets for the periods
presented. See Note 1(d).
fBenefit of expense reduction rounds to less than 0.01%.
gRounds to less than 0.01%.
18 | Annual Report | The accompanying notes are an integral part of these financial statements.
franklintempleton.com
| FRANKLIN MUTUAL INTERNATIONAL FUND | |||||||||||||||
| FINANCIAL HIGHLIGHTS | |||||||||||||||
| Year Ended December 31, | |||||||||||||||
| 2014 | 2013 | 2012 | 2011 | 2010 | |||||||||||
| Class R | |||||||||||||||
| Per share operating performance | |||||||||||||||
| (for a share outstanding throughout the year) | |||||||||||||||
| Net asset value, beginning of year | $ | 15.83 | $ | 13.54 | $ | 11.82 | $ | 13.78 | $ | 12.58 | |||||
| Income from investment operationsa: | |||||||||||||||
| Net investment incomeb | 0.18 | c | 0.15 | 0.11 | 0.21 | 0.16 | |||||||||
| Net realized and unrealized gains (losses) | (0.52 | ) | 2.43 | 1.73 | (1.79 | ) | 1.64 | ||||||||
| Total from investment operations | (0.34 | ) | 2.58 | 1.84 | (1.58 | ) | 1.80 | ||||||||
| Less distributions from: | |||||||||||||||
| Net investment income | (0.37 | ) | (0.19 | ) | (0.10 | ) | (0.23 | ) | (0.43 | ) | |||||
| Net realized gains | (0.61 | ) | (0.10 | ) | (0.02 | ) | (0.15 | ) | (0.17 | ) | |||||
| Total distributions | (0.98 | ) | (0.29 | ) | (0.12 | ) | (0.38 | ) | (0.60 | ) | |||||
| Net asset value, end of year | $ | 14.51 | $ | 15.83 | $ | 13.54 | $ | 11.82 | $ | 13.78 | |||||
| Total return | (2.13 | )% | 19.13 | % | 15.70 | % | (11.53 | )% | 14.54 | % | |||||
| Ratios to average net assets | |||||||||||||||
| Expenses before waiver, payments by affiliates and expense | |||||||||||||||
| reductiond | 1.89 | % | 1.99 | % | 2.25 | % | 2.30 | % | 3.27 | % | |||||
| Expenses net of waiver, payments by affiliates and expense | |||||||||||||||
| reductiond | 1.66 | %e | 1.67 | %e | 1.67 | % | 1.67 | % | 1.67 | % | |||||
| Expenses incurred in connection with securities sold short | —%f | —% | —% | —% | —% | ||||||||||
| Net investment income | 1.28 | %c | 1.14 | % | 1.20 | % | 1.62 | % | 1.20 | % | |||||
| Supplemental data | |||||||||||||||
| Net assets, end of year (000’s) | $ | 112 | $ | 90 | $ | 42 | $ | 12 | $ | 14 | |||||
| Portfolio turnover rate | 54.78 | % | 41.47 | % | 27.97 | % | 41.26 | % | 38.43 | % | |||||
aThe amount shown for a share outstanding throughout the period may not correlate with the Statement of Operations for the period due to the timing of sales and
repurchases of the Fund shares in relation to income earned and/or fluctuating fair value of the investments of the Fund.
bBased on average daily shares outstanding.
cNet investment income per share includes approximately $0.08 per share received in the form of a special dividend paid in connection with certain Fund’s holdings.
Excluding this amount, the ratio of net investment income to average net assets would have been 0.77%.
dIncludes dividend expense on securities sold short and security borrowing fees, if any. See below for the ratios of such expenses to average net assets for the periods
presented. See Note 1(d).
eBenefit of expense reduction rounds to less than 0.01%.
fRounds to less than 0.01%.
franklintempleton.com
The accompanying notes are an integral part of these financial statements. | Annual Report | 19
FRANKLIN MUTUAL INTERNATIONAL FUND
FINANCIAL HIGHLIGHTS
| Year Ended December 31, | ||||||
| 2014 | 2013 | a | ||||
| Class R6 | ||||||
| Per share operating performance | ||||||
| (for a share outstanding throughout the year) | ||||||
| Net asset value, beginning of year | $ | 15.87 | $ | 14.26 | ||
| Income from investment operationsb: | ||||||
| Net investment incomec | —d,e | 0.15 | ||||
| Net realized and unrealized gains (losses) | (0.22 | ) | 1.83 | |||
| Total from investment operations | (0.22 | ) | 1.98 | |||
| Less distributions from: | ||||||
| Net investment income | (0.45 | ) | (0.27 | ) | ||
| Net realized gains | (0.61 | ) | (0.10 | ) | ||
| Total distributions | (1.06 | ) | (0.37 | ) | ||
| Net asset value, end of year | $ | 14.59 | $ | 15.87 | ||
| Total returnf | (1.46 | )% | 14.09 | % | ||
| Ratios to average net assetsg | ||||||
| Expenses before waiver, payments by affiliates and expense reductionh | 1.24 | % | 2.89 | % | ||
| Expenses net of waiver, payments by affiliates and expense reductionh,i | 1.00 | % | 1.00 | % | ||
| Expenses incurred in connection with securities sold short | —%j | —% | ||||
| Net investment income | 1.94 | %d | 1.81 | % | ||
| Supplemental data | ||||||
| Net assets, end of year (000’s) | $ | 19,398 | $ | 6 | ||
| Portfolio turnover rate | 54.78 | % | 41.47 | % | ||
aFor the period May 1, 2013 (commencement of operations) to December 31, 2013.
bThe amount shown for a share outstanding throughout the period may not correlate with the Statement of Operations for the period due to the timing of sales and
repurchases of the Fund shares in relation to income earned and/or fluctuating fair value of the investments of the Fund.
cBased on average daily shares outstanding.
dNet investment income per share includes approximately $0.08 per share received in the form of a special dividend paid in connection with certain Fund’s holdings.
Excluding this amount, the ratio of net investment income to average net assets would have been 1.42%.
eAmount rounds to less than $0.01 per share.
fTotal return is not annualized for periods less than one year.
gRatios are annualized for periods less than one year.
hIncludes dividend expense on securities sold short and security borrowing fees, if any. See below for the ratios of such expenses to average net assets for the periods
presented. See Note 1(d).
iBenefit of expense reduction rounds to less than 0.01%.
jRounds to less than 0.01%.
20 | Annual Report | The accompanying notes are an integral part of these financial statements.
franklintempleton.com
FRANKLIN MUTUAL INTERNATIONAL FUND
| Statement of Investments, December 31, 2014 | ||||
| Country | Shares/Rights | Value | ||
| Common Stocks and Other Equity Interests 83.0% | ||||
| Aerospace & Defense 0.3% | ||||
| Safran SA | France | 5,305 | $ | 328,976 |
| Airlines 1.4% | ||||
| aInternational Consolidated Airlines Group SA | United Kingdom | 171,728 | 1,301,156 | |
| Auto Components 2.5% | ||||
| Cie Generale des Etablissements Michelin, B | France | 5,610 | 510,940 | |
| Pirelli & C. SpA | Italy | 65,254 | 885,112 | |
| Xinyi Glass Holdings Ltd. | Hong Kong | 1,804,000 | 909,683 | |
| 2,305,735 | ||||
| Automobiles 0.8% | ||||
| Hyundai Motor Co. | South Korea | 4,796 | 741,044 | |
| Banks 11.9% | ||||
| Bank of China Ltd., H | China | 1,685,000 | 949,638 | |
| Barclays PLC | United Kingdom | 345,167 | 1,310,059 | |
| BNP Paribas SA | France | 13,910 | 829,100 | |
| a Commerzbank AG | Germany | 73,974 | 982,804 | |
| Hana Financial Group Inc. | South Korea | 36,587 | 1,070,421 | |
| HSBC Holdings PLC | United Kingdom | 124,510 | 1,181,133 | |
| Industrial and Commercial Bank of China Ltd., H | China | 2,416,518 | 1,763,939 | |
| aING Groep NV, IDR | Netherlands | 93,980 | 1,231,542 | |
| KB Financial Group Inc. | South Korea | 16,370 | 541,047 | |
| aNational Bank of Greece SA | Greece | 265,853 | 472,873 | |
| UniCredit SpA | Italy | 132,949 | 858,232 | |
| 11,190,788 | ||||
| Capital Markets 3.7% | ||||
| a,bAnima Holding SpA, Reg S | Italy | 147,765 | 744,505 | |
| Sun Hung Kai & Co. Ltd. | Hong Kong | 1,794,748 | 1,370,258 | |
| UBS Group AG | Switzerland | 79,130 | 1,360,221 | |
| 3,474,984 | ||||
| Construction & Engineering 1.0% | ||||
| FLSmidth & Co. AS | Denmark | 15,340 | 678,660 | |
| Sinopec Engineering Group Co. Ltd. | China | 438,483 | 296,885 | |
| 975,545 | ||||
| Construction Materials 0.3% | ||||
| SA des Ciments Vicat | France | 3,897 | 281,036 | |
| Diversified Financial Services 1.4% | ||||
| First Pacific Co. Ltd. | Hong Kong | 560,859 | 555,510 | |
| Metro Pacific Investments Corp. | Philippines | 7,641,400 | 784,871 | |
| 1,340,381 | ||||
| Diversified Telecommunication Services 1.3% | ||||
| aHellenic Telecommunications Organization SA | Greece | 68,550 | 754,804 | |
| TDC AS | Denmark | 59,831 | 459,117 | |
| 1,213,921 | ||||
| Electric Utilities 2.6% | ||||
| Enel SpA | Italy | 285,032 | 1,274,708 | |
| Power Assets Holdings Ltd. | Hong Kong | 116,000 | 1,125,001 | |
| 2,399,709 |
franklintempleton.com
Annual Report
| 21
FRANKLIN MUTUAL INTERNATIONAL FUND
STATEMENT OF INVESTMENTS
| Country | Shares/Rights | Value | ||
| Common Stocks and Other Equity Interests (continued) | ||||
| Food & Staples Retailing 0.6% | ||||
| Metro AG | Germany | 19,696 | $ | 603,192 |
| Hotels, Restaurants & Leisure 3.3% | ||||
| Accor SA | France | 36,940 | 1,669,001 | |
| Mandarin Oriental International Ltd. | Hong Kong | 843,361 | 1,412,630 | |
| 3,081,631 | ||||
| Industrial Conglomerates 1.3% | ||||
| Jardine Matheson Holdings Ltd. | Hong Kong | 5,400 | 329,130 | |
| Jardine Strategic Holdings Ltd. | Hong Kong | 9,200 | 314,640 | |
| Koninklijke Philips NV | Netherlands | 17,529 | 512,223 | |
| Siemens AG | Germany | 283 | 32,103 | |
| 1,188,096 | ||||
| Insurance 19.7% | ||||
| ACE Ltd. | United States | 8,447 | 970,391 | |
| Ageas | Belgium | 41,254 | 1,472,811 | |
| Assicurazioni Generali SpA | Italy | 65,433 | 1,345,957 | |
| Catlin Group Ltd. | United Kingdom | 66,531 | 695,840 | |
| China Pacific Insurance (Group) Co. Ltd., H | China | 300,632 | 1,517,903 | |
| Direct Line Insurance Group PLC | United Kingdom | 276,458 | 1,255,256 | |
| Friends Life Group Ltd. | United Kingdom | 239,476 | 1,366,919 | |
| Korean Reinsurance Co. | South Korea | 79,350 | 783,517 | |
| Lancashire Holdings Ltd. | United Kingdom | 130,253 | 1,136,942 | |
| a NN Group NV | Netherlands | 40,680 | 1,222,940 | |
| a,c NN Group NV, 144A | Netherlands | 21,537 | 647,455 | |
| PICC Property and Casualty Co. Ltd., H | China | 490,509 | 953,949 | |
| a RSA Insurance Group PLC | United Kingdom | 229,775 | 1,557,954 | |
| a Storebrand ASA | Norway | 241,009 | 941,971 | |
| UNIQA Insurance Group AG | Austria | 135,747 | 1,277,402 | |
| Zurich Insurance Group AG | Switzerland | 4,450 | 1,395,157 | |
| 18,542,364 | ||||
| Machinery 2.0% | ||||
| CNH Industrial NV (EUR Traded) | United Kingdom | 30,305 | 245,683 | |
| CNH Industrial NV, special voting (EUR Traded) | United Kingdom | 16,517 | 133,903 | |
| IMI PLC | United Kingdom | 56,077 | 1,103,953 | |
| Vossloh AG | Germany | 6,344 | 410,679 | |
| 1,894,218 | ||||
| Marine 0.9% | ||||
| A.P. Moeller-Maersk AS, B | Denmark | 440 | 884,304 | |
| Media 4.4% | ||||
| a Liberty Global PLC, C | United Kingdom | 19,415 | 937,939 | |
| Nine Entertainment Co. Holdings Ltd. | Australia | 488,468 | 761,773 | |
| Reed Elsevier PLC | United Kingdom | 33,489 | 574,192 | |
| RTL Group SA | Germany | 4,470 | 427,936 | |
| Seven West Media Ltd. | Australia | 400,878 | 441,878 | |
| Sinomedia Holding Ltd. | China | 1,680,346 | 949,183 | |
| 4,092,901 |
22 | Annual Report
franklintempleton.com
FRANKLIN MUTUAL INTERNATIONAL FUND
STATEMENT OF INVESTMENTS
| Country | Shares/Rights | Value | ||
| Common Stocks and Other Equity Interests (continued) | ||||
| Metals & Mining 3.2% | ||||
| Anglo American PLC | United Kingdom | 20,638 | $ | 386,182 |
| a ThyssenKrupp AG | Germany | 47,379 | 1,218,806 | |
| Voestalpine AG | Austria | 34,982 | 1,388,154 | |
| 2,993,142 | ||||
| Multiline Retail 1.9% | ||||
| Hyundai Department Store Co. Ltd. | South Korea | 11,614 | 1,306,065 | |
| Marks & Spencer Group PLC | United Kingdom | 61,707 | 460,523 | |
| 1,766,588 | ||||
| Oil, Gas & Consumable Fuels 4.5% | ||||
| BG Group PLC | United Kingdom | 69,054 | 931,038 | |
| BP PLC | United Kingdom | 111,218 | 712,491 | |
| a Cairn Energy PLC | United Kingdom | 212,312 | 590,711 | |
| China Shenhua Energy Co. Ltd., H | China | 363,941 | 1,074,839 | |
| Repsol SA | Spain | 8,009 | 150,645 | |
| Repsol SA (interim line) | Spain | 235 | 4,420 | |
| a Repsol SA, rts., 1/08/15 | Spain | 19 | 11 | |
| Royal Dutch Shell PLC, A | United Kingdom | 23,039 | 771,083 | |
| 4,235,238 | ||||
| Pharmaceuticals 2.0% | ||||
| Novartis AG | Switzerland | 9,469 | 879,564 | |
| Teva Pharmaceutical Industries Ltd., ADR | Israel | 17,640 | 1,014,476 | |
| 1,894,040 | ||||
| Real Estate Investment Trusts (REITs) 1.0% | ||||
| Hibernia REIT PLC | Ireland | 685,800 | 900,352 | |
| Real Estate Management & Development 2.0% | ||||
| Dalian Wanda Commercial Properties Co. Ltd., H | China | 177,800 | 1,131,608 | |
| Takara Leben Co. Ltd. | Japan | 180,400 | 790,402 | |
| 1,922,010 | ||||
| Road & Rail 1.1% | ||||
| a CAR Inc. | China | 625,709 | 842,461 | |
| a FirstGroup PLC | United Kingdom | 95,639 | 159,061 | |
| 1,001,522 | ||||
| Semiconductors & Semiconductor Equipment 1.5% | ||||
| a SK Hynix Semiconductor Inc. | South Korea | 33,287 | 1,453,202 | |
| Specialty Retail 3.8% | ||||
| Baoxin Auto Group Ltd. | China | 1,746,889 | 1,011,553 | |
| China ZhengTong Auto Services Holdings Ltd. | China | 2,187,887 | 962,180 | |
| a Dufry AG | Switzerland | 5,954 | 892,321 | |
| Kingfisher PLC | United Kingdom | 132,792 | 704,777 | |
| 3,570,831 | ||||
| Technology Hardware, Storage & Peripherals 1.4% | ||||
| Samsung Electronics Co. Ltd. | South Korea | 1,101 | 1,335,784 | |
| Wireless Telecommunication Services 1.2% | ||||
| Vodafone Group PLC | United Kingdom | 334,960 | 1,162,460 | |
| Total Common Stocks and Other Equity Interests | ||||
| (Cost $77,171,198) | 78,075,150 | |||
| franklintempleton.com | Annual Report | 23 | |||
FRANKLIN MUTUAL INTERNATIONAL FUND
STATEMENT OF INVESTMENTS
| Country | Shares/Rights | Value | |||
| Preferred Stocks 2.3% | |||||
| Automobiles 2.3% | |||||
| Hyundai Motor Co., pfd. | South Korea | 3,996 | $ | 462,162 | |
| Volkswagen AG, pfd. | Germany | 7,400 | 1,653,356 | ||
| Total Preferred Stocks (Cost $2,133,979) | 2,115,518 | ||||
| Total Investments before Short Term Investments | |||||
| (Cost $79,305,177) | 80,190,668 | ||||
| Principal Amount | |||||
| Short Term Investments 10.2% | |||||
| U.S. Government and Agency Securities 10.2% | |||||
| d FHLB, 1/02/15 | United States | $ | 1,600,000 | 1,600,000 | |
| d U.S. Treasury Bills, | |||||
| 1/02/15 | United States | 6,500,000 | 6,500,000 | ||
| 4/09/15 | United States | 500,000 | 499,967 | ||
| e5/14/15 | United States | 1,000,000 | 999,844 | ||
| Total U.S. Government and Agency Securities | |||||
| (Cost $9,599,718) | 9,599,811 | ||||
| Total Investments (Cost $88,904,895) 95.5% | 89,790,479 | ||||
| Other Assets, less Liabilities 4.5% | 4,263,047 | ||||
| Net Assets 100.0% | $ | 94,053,526 | |||
aNon-income producing.
bSecurity was purchased pursuant to Regulation S under the Securities Act of 1933, which exempts from registration securities offered and sold outside of the United States.
Such a security cannot be sold in the United States without either an effective registration statement filed pursuant to the Securities Act of 1933, or pursuant to an exemption
from registration. This security has been deemed liquid under guidelines approved by the Trust’s Board of Trustees. At December 31, 2014, the value of this security was
$744,505, representing 0.79% of net assets.
cSecurity was purchased pursuant to Rule 144A under the Securities Act of 1933 and may be sold in transactions exempt from registration only to qualified institutional buyers
or in a public offering registered under the Securities Act of 1933. This security has been deemed liquid under guidelines approved by the Trust’s Board of Trustees. At
December 31, 2014, the value of this security was $647,455, representing 0.69% of net assets.
dThe security is traded on a discount basis with no stated coupon rate.
eSecurity or a portion of the security has been pledged as collateral for open futures contracts. At December 31, 2014, the value of this security and/or cash pledged as collat-
eral was $239,954, representing 0.26% of net assets.
24 | Annual Report
franklintempleton.com
| FRANKLIN MUTUAL INTERNATIONAL FUND | ||||||||||||
| STATEMENT OF INVESTMENTS | ||||||||||||
| At December 31, 2014, the Fund had the following futures contracts outstanding. See Note 1(c). | ||||||||||||
| Futures Contracts | ||||||||||||
| Number of | Notional Expiration | Unrealized | Unrealized | |||||||||
| Description | Type Contracts | Value | Date | Appreciation | Depreciation | |||||||
| Currency Contracts | ||||||||||||
| CHF/USD | Short | 1 | $ | 125,925 | 3/16/15 | $ | 2,934 | $ | — | |||
| EUR/USD | Short | 54 | 8,172,225 | 3/16/15 | 195,879 | — | ||||||
| GBP/USD | Short | 41 | 3,989,813 | 3/16/15 | 22,999 | — | ||||||
| Unrealized appreciation (depreciation) | 221,812 | — | ||||||||||
| Net unrealized appreciation (depreciation) | $ | 221,812 | ||||||||||
| At December 31, 2014, the Fund had the following forward exchange contracts outstanding. See Note 1(c). | ||||||||||||
| Forward Exchange Contracts | ||||||||||||
| Contract | Settlement | Unrealized | Unrealized | |||||||||
| Currency | Counterpartya Type | Quantity | Amount | Date Appreciation Depreciation | ||||||||
| Euro | BANT | Buy | 73,443 | $ | 92,939 | 1/20/15 | $ | — | $ | (4,053 | ) | |
| Euro | BANT | Sell | 8,270,190 | 11,120,193 | 1/20/15 | 1,111,047 | — | |||||
| Euro | BBU | Sell | 19,020 | 23,855 | 1/20/15 | 836 | — | |||||
| Euro | BONY | Sell | 1,005,587 | 1,276,261 | 1/20/15 | 59,232 | — | |||||
| Euro | DBFX | Buy | 2,278,501 | 2,913,602 | 1/20/15 | — | (156,005 | ) | ||||
| Euro | DBFX | Sell | 359,033 | 456,656 | 1/20/15 | 22,131 | — | |||||
| Euro | FBCO | Buy | 94,905 | 119,497 | 1/20/15 | — | (4,637 | ) | ||||
| Euro | FBCO | Sell | 3,542,274 | 4,578,769 | 1/20/15 | 291,668 | — | |||||
| Euro | HSBC | Buy | 136,704 | 171,542 | 1/20/15 | — | (6,094 | ) | ||||
| Euro | HSBC | Sell | 302,359 | 391,427 | 1/20/15 | 25,492 | — | |||||
| Euro | SCBT | Buy | 45,025 | 57,445 | 1/20/15 | — | (2,953 | ) | ||||
| Euro | SCBT | Sell | 19,613 | 26,240 | 1/20/15 | 2,503 | — | |||||
| Euro | SSBT | Buy | 135,409 | 168,738 | 1/20/15 | — | (4,857 | ) | ||||
| Euro | SSBT | Sell | 568,982 | 729,151 | 1/20/15 | 40,531 | — | |||||
| South Korean Won | BANT | Buy | 152,731,000 | 142,739 | 2/12/15 | — | (3,402 | ) | ||||
| South Korean Won | BANT | Sell | 1,847,320,796 | 1,774,615 | 2/12/15 | 90,490 | (1,197 | ) | ||||
| South Korean Won | BONY | Sell | 160,779,040 | 155,789 | 2/12/15 | 9,109 | — | |||||
| South Korean Won | FBCO | Sell | 2,623,257,779 | 2,527,171 | 2/12/15 | 133,956 | — | |||||
| South Korean Won | HSBC | Buy | 2,120,690,836 | 2,016,573 | 2/12/15 | 696 | (82,550 | ) | ||||
| South Korean Won | HSBC | Sell | 6,057,860,882 | 5,758,352 | 2/12/15 | 241,953 | (10,224 | ) | ||||
| Swiss Franc | BANT | Buy | 112,062 | 119,291 | 2/12/15 | — | (6,491 | ) | ||||
| Swiss Franc | BANT | Sell | 2,119,820 | 2,344,304 | 2/12/15 | 210,521 | — | |||||
| Swiss Franc | BONY | Sell | 85,672 | 90,045 | 2/12/15 | 3,809 | — | |||||
| Swiss Franc | DBFX | Buy | 90,344 | 94,917 | 2/12/15 | — | (3,978 | ) | ||||
| Swiss Franc | DBFX | Sell | 71,304 | 74,947 | 2/12/15 | 3,173 | — | |||||
| Swiss Franc | FBCO | Buy | 221,269 | 232,282 | 2/12/15 | — | (9,556 | ) | ||||
| Swiss Franc | FBCO | Sell | 715,925 | 753,597 | 2/12/15 | 32,956 | — | |||||
| Swiss Franc | HSBC | Buy | 77,638 | 80,808 | 2/12/15 | — | (2,658 | ) | ||||
| Swiss Franc | HSBC | Sell | 73,885 | 75,627 | 2/12/15 | 1,255 | — | |||||
| Swiss Franc | SSBT | Buy | 162,388 | 170,379 | 2/12/15 | — | (6,922 | ) | ||||
| Swiss Franc | SSBT | Sell | 497,090 | 521,512 | 2/12/15 | 21,148 | — | |||||
| Danish Krone | BANT | Buy | 415,070 | 70,481 | 2/17/15 | — | (3,012 | ) | ||||
| Danish Krone | BANT | Sell | 509,417 | 86,838 | 2/17/15 | 4,034 | — | |||||
| Danish Krone | BBU | Buy | 17,845 | 2,973 | 2/17/15 | — | (72 | ) | ||||
| Danish Krone | BONY | Buy | 159,606 | 27,137 | 2/17/15 | — | (1,194 | ) | ||||
| Danish Krone | DBFX | Buy | 198,330 | 33,535 | 2/17/15 | — | (1,297 | ) | ||||
| Danish Krone | DBFX | Sell | 897,440 | 155,798 | 2/17/15 | 9,922 | — | |||||
| Danish Krone | SSBT | Buy | 30,797 | 5,160 | 2/17/15 | — | (154 | ) | ||||
| franklintempleton.com | Annual Report | 25 | |||||||||||
| FRANKLIN MUTUAL INTERNATIONAL FUND | |||||||||||
| STATEMENT OF INVESTMENTS | |||||||||||
| Forward Exchange Contracts (continued) | |||||||||||
| Contract | Settlement | Unrealized | Unrealized | ||||||||
| Currency | Counterpartya Type | Quantity | Amount | Date Appreciation Depreciation | |||||||
| Danish Krone | SSBT | Sell | 6,268,641 | $ | 1,124,581 | 2/17/15 | $ | 105,635 | $ | — | |
| British Pound | BANT | Buy | 435,558 | 696,789 | 2/19/15 | 17 | (18,169 | ) | |||
| British Pound | BANT | Sell | 2,997,404 | 4,971,719 | 2/19/15 | 301,501 | — | ||||
| British Pound | BBU | Buy | 48,085 | 76,827 | 2/19/15 | — | (1,907 | ) | |||
| British Pound | BONY | Sell | 74,643 | 119,500 | 2/19/15 | 3,199 | — | ||||
| British Pound | DBFX | Buy | 159,912 | 253,779 | 2/19/15 | — | (4,622 | ) | |||
| British Pound | FBCO | Buy | 205,507 | 328,480 | 2/19/15 | — | (8,282 | ) | |||
| British Pound | FBCO | Sell | 2,627,271 | 4,374,994 | 2/19/15 | 281,476 | — | ||||
| British Pound | HSBC | Buy | 226,961 | 359,352 | 2/19/15 | 63 | (5,790 | ) | |||
| British Pound | HSBC | Sell | 98,461 | 157,071 | 2/19/15 | 3,660 | — | ||||
| British Pound | SSBT | Buy | 354,179 | 561,519 | 2/19/15 | 379 | (10,057 | ) | |||
| British Pound | SSBT | Sell | 2,614,487 | 4,355,373 | 2/19/15 | 281,773 | — | ||||
| Australian Dollar | HSBC | Sell | 1,474,120 | 1,201,017 | 2/23/15 | 2,064 | — | ||||
| Philippine Peso | BONY | Buy | 6,938,163 | 154,898 | 3/23/15 | 120 | (628 | ) | |||
| Philippine Peso | BONY | Sell | 40,942,393 | 914,832 | 3/23/15 | 4,044 | (275 | ) | |||
| Japanese Yen | BONY | Sell | 99,473,355 | 932,652 | 4/22/15 | 101,577 | — | ||||
| Japanese Yen | DBFX | Buy | 27,044,312 | 229,507 | 4/22/15 | — | (3,559 | ) | |||
| Japanese Yen | DBFX | Sell | 6,080,570 | 56,263 | 4/22/15 | 5,462 | — | ||||
| Japanese Yen | FBCO | Buy | 2,279,805 | 19,257 | 4/22/15 | — | (210 | ) | |||
| Japanese Yen | FBCO | Sell | 15,206,143 | 132,633 | 4/22/15 | 5,590 | — | ||||
| Japanese Yen | HSBC | Buy | 16,525,283 | 140,768 | 4/22/15 | — | (2,703 | ) | |||
| Japanese Yen | HSBC | Sell | 19,024,336 | 162,439 | 4/22/15 | 4,143 | (648 | ) | |||
| Euro | BANT | Sell | 1,152,052 | 1,436,989 | 5/18/15 | 41,143 | — | ||||
| Euro | DBFX | Sell | 91,264 | 112,429 | 5/18/15 | 1,852 | — | ||||
| Euro | FBCO | Sell | 45,077 | 55,761 | 5/18/15 | 1,145 | — | ||||
| Euro | HSBC | Sell | 76,527 | 93,482 | 5/18/15 | 760 | — | ||||
| Euro | SSBT | Sell | 85,838 | 105,847 | 5/18/15 | 1,845 | — | ||||
| Norwegian Krone | BANT | Buy | 984,884 | 135,811 | 5/21/15 | — | (4,444 | ) | |||
| Norwegian Krone | BANT | Sell | 129,775 | 17,513 | 5/21/15 | 203 | — | ||||
| Norwegian Krone | BBU | Buy | 151,445 | 20,248 | 5/21/15 | — | (48 | ) | |||
| Norwegian Krone | BONY | Buy | 225,347 | 31,249 | 5/21/15 | — | (1,192 | ) | |||
| Norwegian Krone | BONY | Sell | 277,100 | 37,029 | 5/21/15 | 69 | — | ||||
| Norwegian Krone | DBFX | Buy | 172,440 | 23,351 | 5/21/15 | — | (350 | ) | |||
| Norwegian Krone | DBFX | Sell | 8,164,448 | 1,194,191 | 5/21/15 | 105,204 | — | ||||
| Unrealized appreciation (depreciation) | 3,569,386 | (374,190 | ) | ||||||||
| Net unrealized appreciation (depreciation) | $ | 3,195,196 | |||||||||
| aMay be comprised of multiple contracts with the same counterparty, currency and settlement date. | |||||||||||
| See Abbreviations on page 42. | |||||||||||
26 | Annual Report | The accompanying notes are an integral part of these financial statements.
franklintempleton.com
FRANKLIN MUTUAL INTERNATIONAL FUND
Financial Statements
Statement of Assets and Liabilities
December 31, 2014
| Assets: | |||
| Investments in securities: | |||
| Cost | $ | 88,904,895 | |
| Value | $ | 89,790,479 | |
| Cash | 13,808 | ||
| Foreign currency, at value (cost $994,945) | 996,520 | ||
| Receivables: | |||
| Investment securities sold | 213,740 | ||
| Capital shares sold | 221,791 | ||
| Dividends | 63,193 | ||
| Variation margin | 32,075 | ||
| Unrealized appreciation on forward exchange contracts | 3,569,386 | ||
| Total assets | 94,900,992 | ||
| Liabilities: | |||
| Payables: | |||
| Investment securities purchased | 46,907 | ||
| Capital shares redeemed | 236,612 | ||
| Management fees | 65,063 | ||
| Distribution fees | 43,777 | ||
| Transfer agent fees | 11,839 | ||
| Trustees’ fees and expenses | 54 | ||
| Professional fees | 49,386 | ||
| Unrealized depreciation on forward exchange contracts | 374,190 | ||
| Accrued expenses and other liabilities | 19,638 | ||
| Total liabilities | 847,466 | ||
| Net assets, at value | $ | 94,053,526 | |
| Net assets consist of: | |||
| Paid-in capital | $ | 91,109,400 | |
| Distributions in excess of net investment income | (485,936 | ) | |
| Net unrealized appreciation (depreciation) | 4,300,562 | ||
| Accumulated net realized gain (loss) | (870,500 | ) | |
| Net assets, at value | $ | 94,053,526 |
franklintempleton.com
The accompanying notes are an integral part of these financial statements. | Annual Report | 27
| FRANKLIN MUTUAL INTERNATIONAL FUND | ||
| FINANCIAL STATEMENTS | ||
| Statement of Assets and Liabilities (continued) | ||
| December 31, 2014 | ||
| Class Z: | ||
| Net assets, at value | $ | 19,940,131 |
| Shares outstanding | 1,366,414 | |
| Net asset value and maximum offering price per share | $ | 14.59 |
| Class A: | ||
| Net assets, at value | $ | 39,809,589 |
| Shares outstanding | 2,738,073 | |
| Net asset value per sharea | $ | 14.54 |
| Maximum offering price per share (net asset value per share ÷ 94.25%) | $ | 15.43 |
| Class C: | ||
| Net assets, at value | $ | 14,794,001 |
| Shares outstanding | 1,028,847 | |
| Net asset value and maximum offering price per sharea | $ | 14.38 |
| Class R: | ||
| Net assets, at value | $ | 112,033 |
| Shares outstanding | 7,720 | |
| Net asset value and maximum offering price per share | $ | 14.51 |
| Class R6: | ||
| Net assets, at value | $ | 19,397,772 |
| Shares outstanding | 1,329,676 | |
| Net asset value and maximum offering price per share | $ | 14.59 |
| aRedemption price is equal to net asset value less contingent deferred sales charges, if applicable. | |
| 28 | Annual Report | The accompanying notes are an integral part of these financial statements. | franklintempleton.com |
FRANKLIN MUTUAL INTERNATIONAL FUND
FINANCIAL STATEMENTS
Statement of Operations
for the year ended December 31, 2014
| Investment income: | |||
| Dividends (net of foreign taxes of $109,742) | $ | 2,151,683 | |
| Interest | 7,211 | ||
| Total investment income | 2,158,894 | ||
| Expenses: | |||
| Management fees (Note 3a) | 618,658 | ||
| Administrative fees (Note 3b) | 24,868 | ||
| Distribution fees: (Note 3c) | |||
| Class A | 112,414 | ||
| Class C | 145,003 | ||
| Class R | 470 | ||
| Transfer agent fees: (Note 3e) | |||
| Class Z | 23,795 | ||
| Class A | 56,900 | ||
| Class C | 22,020 | ||
| Class R | 143 | ||
| Class R6 | 102 | ||
| Custodian fees (Note 4) | 16,991 | ||
| Reports to shareholders | 33,755 | ||
| Registration and filing fees | 73,970 | ||
| Professional fees | 88,136 | ||
| Trustees’ fees and expenses | 1,535 | ||
| Dividends on securities sold short | 2,333 | ||
| Excise tax (Note 1f) | 19,600 | ||
| Other | 30,292 | ||
| Total expenses | 1,270,985 | ||
| Expense reductions (Note 4) | (136 | ) | |
| Expenses waived/paid by affiliates (Note 3f) | (169,865 | ) | |
| Net expenses | 1,100,984 | ||
| Net investment income | 1,057,910 | ||
| Realized and unrealized gains (losses): | |||
| Net realized gain (loss) from: | |||
| Investments | 3,232,151 | ||
| Foreign currency transactions | (1,351,564 | ) | |
| Futures contracts | 668,963 | ||
| Securities sold short | 7,798 | ||
| Net realized gain (loss) | 2,557,348 | ||
| Net change in unrealized appreciation (depreciation) on: | |||
| Investments | (10,462,870 | ) | |
| Translation of other assets and liabilities denominated in foreign currencies | 4,976,705 | ||
| Net change in unrealized appreciation (depreciation) | (5,486,165 | ) | |
| Net realized and unrealized gain (loss) | (2,928,817 | ) | |
| Net increase (decrease) in net assets resulting from operations | $ | (1,870,907 | ) |
franklintempleton.com
The accompanying notes are an integral part of these financial statements. | Annual Report | 29
| FRANKLIN MUTUAL INTERNATIONAL FUND | ||||||
| FINANCIAL STATEMENTS | ||||||
| Statements of Changes in Net Assets | ||||||
| Year Ended December 31, | ||||||
| 2014 | 2013 | |||||
| Increase (decrease) in net assets: | ||||||
| Operations: | ||||||
| Net investment income | $ | 1,057,910 | $ | 645,464 | ||
| Net realized gain (loss) from investments, foreign currency transactions and futures | ||||||
| contracts | 2,557,348 | 1,394,372 | ||||
| Net change in unrealized appreciation (depreciation) on investments and translation of other | ||||||
| assets and liabilities denominated in foreign currencies | (5,486,165 | ) | 7,143,327 | |||
| Net increase (decrease) in net assets resulting from operations | (1,870,907 | ) | 9,183,163 | |||
| Distributions to shareholders from: | ||||||
| Net investment income: | ||||||
| Class Z | (523,715 | ) | (218,779 | ) | ||
| Class A | (944,114 | ) | (447,845 | ) | ||
| Class C | (268,761 | ) | (94,563 | ) | ||
| Class R | (2,686 | ) | (1,045 | ) | ||
| Class R6 | (446,640 | ) | (94 | ) | ||
| Net realized gains: | ||||||
| Class Z | (781,116 | ) | (92,660 | ) | ||
| Class A | (1,515,476 | ) | (222,263 | ) | ||
| Class C | (593,424 | ) | (91,241 | ) | ||
| Class R | (4,446 | ) | (585 | ) | ||
| Class R6 | (759,333 | ) | (36 | ) | ||
| Total distributions to shareholders | (5,839,711 | ) | (1,169,111 | ) | ||
| Capital share transactions: (Note 2) | ||||||
| Class Z | 6,711,687 | 2,483,765 | ||||
| Class A | 7,674,681 | 12,890,819 | ||||
| Class C | 1,833,944 | 1,795,889 | ||||
| Class R | 32,032 | 35,105 | ||||
| Class R6 | 21,167,542 | 5,000 | ||||
| Total capital share transactions | 37,419,886 | 17,210,578 | ||||
| Net increase (decrease) in net assets | 29,709,268 | 25,224,630 | ||||
| Net assets: | ||||||
| Beginning of year | 64,344,258 | 39,119,628 | ||||
| End of year | $ | 94,053,526 | $ | 64,344,258 | ||
| Distributions in excess of net investment income included in net assets: | ||||||
| End of year | $ | (485,936 | ) | $ | (233,787 | ) |
30 | Annual Report | The accompanying notes are an integral part of these financial statements.
franklintempleton.com
FRANKLIN MUTUAL INTERNATIONAL FUND
Notes to Financial Statements
1. Organization and Significant Accounting Policies
Franklin Mutual Series Funds (Trust) is registered under the Investment Company Act of 1940, as amended, (1940 Act) as an open-end management investment company, consisting of seven separate funds and applies the specialized accounting and reporting guidance in U.S. Generally Accepted Accounting Principles (U.S. GAAP). Franklin Mutual International Fund (Fund) is included in this report. The financial statements of the remaining funds in the Trust are presented separately. The Fund offers five classes of shares: Class Z, Class A, Class C, Class R and Class R6. Each class of shares differs by its initial sales load, contingent deferred sales charges, voting rights on matters affecting a single class, its exchange privilege and fees primarily due to differing arrangements for distribution and transfer agent fees.
Effective June 30, 2014, Mutual International Fund was renamed Franklin Mutual International Fund.
The following summarizes the Fund’s significant accounting policies.
a. Financial Instrument Valuation
The Fund’s investments in financial instruments are carried at fair value daily. Fair value is the price that would be received to sell an asset or paid to transfer a liability in an orderly transaction between market participants on the measurement date. The Fund calculates the net asset value per share at the close of the New York Stock Exchange (NYSE), generally at 4 p.m. Eastern time (NYSE close) on each day the NYSE is open for trading. Under compliance policies and procedures approved by the Trust’s Board of Trustees (the Board), the Fund’s administrator has responsibility for oversight of valuation, including leading the cross-functional Valuation and Liquidity Oversight Committee (VLOC). The VLOC provides administration and oversight of the Fund’s valuation policies and procedures, which are approved annually by the Board. Among other things, these procedures allow the Fund to utilize independent pricing services, quotations from securities and financial instrument dealers, and other market sources to determine fair value.
Equity securities and derivative financial instruments (derivatives) listed on an exchange or on the NASDAQ National Market System are valued at the last quoted sale price or the official closing price of the day, respectively. Foreign equity securities are valued as of the close of trading on the foreign stock exchange on which the security is primarily traded or as of the NYSE close, whichever is earlier. The value is then converted into its U.S. dollar equivalent at the foreign
exchange rate in effect at the NYSE close on the day that the value of the security is determined. Over-the-counter (OTC) securities are valued within the range of the most recent quoted bid and ask prices. Securities that trade in multiple markets or on multiple exchanges are valued according to the broadest and most representative market. Certain equity securities are valued based upon fundamental characteristics or relationships to similar securities.
Debt securities generally trade in the OTC market rather than on a securities exchange. The Fund’s pricing services use multiple valuation techniques to determine fair value. In instances where sufficient market activity exists, the pricing services may utilize a market-based approach through which quotes from market makers are used to determine fair value. In instances where sufficient market activity may not exist or is limited, the pricing services also utilize proprietary valuation models which may consider market characteristics such as benchmark yield curves, credit spreads, estimated default rates, anticipated market interest rate volatility, coupon rates, anticipated timing of principal repayments, underlying collateral, and other unique security features in order to estimate the relevant cash flows, which are then discounted to calculate the fair value. Securities denominated in a foreign currency are converted into their U.S. dollar equivalent at the foreign exchange rate in effect at the NYSE close on the date that the values of the foreign debt securities are determined.
Certain derivatives trade in the OTC market. The Fund’s pricing services use various techniques including industry standard option pricing models and proprietary discounted cash flow models to determine the fair value of those instruments. The Fund’s net benefit or obligation under the derivative contract, as measured by the fair value of the contract, is included in net assets.
The Fund has procedures to determine the fair value of financial instruments for which market prices are not reliable or readily available. Under these procedures, the VLOC convenes on a regular basis to review such financial instruments and considers a number of factors, including significant unobservable valuation inputs, when arriving at fair value. The VLOC primarily employs a market-based approach which may use related or comparable assets or liabilities, recent transactions, market multiples, book values, and other relevant information for the investment to determine the fair value of the investment. An income-based valuation approach may also be used in which the anticipated future cash flows of the investment are discounted to calculate fair value. Discounts may also be applied due to the nature or duration of any restrictions on the
franklintempleton.com
Annual Report
| 31
FRANKLIN MUTUAL INTERNATIONAL FUND
NOTES TO FINANCIAL STATEMENTS
1. Organization and Significant Accounting
Policies (continued)
a. Financial Instrument Valuation (continued)
disposition of the investments. Due to the inherent uncertainty of valuations of such investments, the fair values may differ significantly from the values that would have been used had an active market existed. The VLOC employs various methods for calibrating these valuation approaches including a regular review of key inputs and assumptions, transactional back-testing or disposition analysis, and reviews of any related market activity.
Trading in securities on foreign securities stock exchanges and OTC markets may be completed before the daily NYSE close. In addition, trading in certain foreign markets may not take place on every NYSE business day. Occasionally, events occur between the time at which trading in a foreign security is completed and the close of the NYSE that might call into question the reliability of the value of a portfolio security held by the Fund. As a result, differences may arise between the value of the Fund’s portfolio securities as determined at the foreign market close and the latest indications of value at the close of the NYSE. In order to minimize the potential for these differences, the VLOC monitors price movements following the close of trading in foreign stock markets through a series of country specific market proxies (such as baskets of American Depositary Receipts, futures contracts and exchange traded funds). These price movements are measured against established trigger thresholds for each specific market proxy to assist in determining if an event has occurred that may call into question the reliability of the values of the foreign securities held by the Fund. If such an event occurs, the securities may be valued using fair value procedures, which may include the use of independent pricing services.
Also, when the last day of the reporting period is a non-business day, certain foreign markets may be open on those days that the NYSE is closed, which could result in differences between the value of the Fund’s portfolio securities on the last business day and the last calendar day of the reporting period. Any significant security valuation changes due to an open foreign market are adjusted and reflected by the Fund for financial reporting purposes.
b. Foreign Currency Translation
Portfolio securities and other assets and liabilities denominated in foreign currencies are translated into U.S. dollars based on the exchange rate of such currencies against U.S. dollars on the date of valuation. The Fund may enter into foreign currency
exchange contracts to facilitate transactions denominated in a foreign currency. Purchases and sales of securities, income and expense items denominated in foreign currencies are translated into U.S. dollars at the exchange rate in effect on the transaction date. Portfolio securities and assets and liabilities denominated in foreign currencies contain risks that those currencies will decline in value relative to the U.S. dollar. Occasionally, events may impact the availability or reliability of foreign exchange rates used to convert the U.S. dollar equivalent value. If such an event occurs, the foreign exchange rate will be valued at fair value using procedures established and approved by the Board.
The Fund does not separately report the effect of changes in foreign exchange rates from changes in market prices on securities held. Such changes are included in net realized and unrealized gain or loss from investments on the Statement of Operations.
Realized foreign exchange gains or losses arise from sales of foreign currencies, currency gains or losses realized between the trade and settlement dates on securities transactions and the difference between the recorded amounts of dividends, interest, and foreign withholding taxes and the U.S. dollar equivalent of the amounts actually received or paid. Net unrealized foreign exchange gains and losses arise from changes in foreign exchange rates on foreign denominated assets and liabilities other than investments in securities held at the end of the reporting period.
c. Derivative Financial Instruments
The Fund invested in derivatives in order to manage risk or gain exposure to various other investments or markets. Derivatives are financial contracts based on an underlying or notional amount, require no initial investment or an initial net investment that is smaller than would normally be required to have a similar response to changes in market factors, and require or permit net settlement. Derivatives contain various risks including the potential inability of the counterparty to fulfill their obligations under the terms of the contract, the potential for an illiquid secondary market, and/or the potential for market movements which expose the Fund to gains or losses in excess of the amounts shown on the Statement of Assets and Liabilities. Realized gain and loss and unrealized appreciation and depreciation on these contracts for the period are included in the Statement of Operations.
Derivative counterparty credit risk is managed through a formal evaluation of the creditworthiness of all potential counterparties. The Fund attempts to reduce its exposure to counterparty credit risk on OTC derivatives, whenever possible, by entering into International Swaps and Derivatives
32 | Annual Report
franklintempleton.com
FRANKLIN MUTUAL INTERNATIONAL FUND
NOTES TO FINANCIAL STATEMENTS
Association (ISDA) master agreements with certain counter-parties. These agreements contain various provisions, including but not limited to collateral requirements, events of default, or early termination. Termination events applicable to the counterparty include certain deteriorations in the credit quality of the counterparty. Termination events applicable to the Fund include failure of the Fund to maintain certain net asset levels and/or limit the decline in net assets over various periods of time. In the event of default or early termination, the ISDA master agreement gives the non-defaulting party the right to net and close-out all transactions traded, whether or not arising under the ISDA agreement, to one net amount payable by one counterparty to the other. However, absent an event of default or early termination, OTC derivative assets and liabilities are presented gross and not offset in the Statement of Assets and Liabilities. Early termination by the counterparty may result in an immediate payment by the Fund of any net liability owed to that counterparty under the ISDA agreement.
Collateral requirements differ by type of derivative. Collateral or initial margin requirements are set by the broker or exchange clearing house for exchange traded and centrally cleared derivatives. Initial margin deposited is held at the exchange and can be in the form of cash and/or securities. For OTC derivatives traded under an ISDA master agreement, posting of collateral is required by either the Fund or the applicable counterparty if the total net exposure of all OTC derivatives with the applicable counterparty exceeds the minimum transfer amount, which typically ranges from $100,000 to $250,000, and can vary depending on the counterparty and the type of the agreement. Generally, collateral is determined at the close of fund business each day and any additional collateral required due to changes in derivative values may be delivered by the Fund or the counterparty within a few business days. Collateral pledged and/or received by the Fund for OTC derivatives, if any, is held in segregated accounts with the Fund’s custodian/counterparty broker and can be in the form of cash and/or securities. Unrestricted cash may be invested according to the Fund’s investment objectives.
The Fund entered into exchange traded futures contracts primarily to manage exposure to certain foreign currencies. A futures contract is an agreement between the Fund and a counterparty to buy or sell an asset for a specified price on a future date. Required initial margins are pledged by the Fund, and the daily change in fair value is accounted for as a variation margin payable or receivable on the Statement of Assets and Liabilities.
The Fund entered into OTC forward exchange contracts primarily to manage exposure to certain foreign currencies. A forward exchange contract is an agreement between the Fund and a counterparty to buy or sell a foreign currency at a specific exchange rate on a future date.
The Fund purchased or wrote OTC option contracts primarily to manage exposure to equity price risk. An option is a contract entitling the holder to purchase or sell a specific amount of shares or units of an asset or notional amount of a swap (swap-tion), at a specified price. Options purchased are recorded as an asset while options written are recorded as a liability. Upon exercise of an option, the acquisition cost or sales proceeds of the underlying investment is adjusted by any premium received or paid. Upon expiration of an option, any premium received or paid is recorded as a realized gain or loss. Upon closing an option other than through expiration or exercise, the difference between the premium and the cost to close the position is recorded as a realized gain or loss.
See Notes 7 and 9 regarding investment transactions and other derivative information, respectively.
d. Securities Sold Short
The Fund is engaged in selling securities short, which obligates the Fund to replace a borrowed security with the same security at current fair value. The Fund incurs a loss if the price of the security increases between the date of the short sale and the date on which the Fund replaces the borrowed security. The Fund realizes a gain if the price of the security declines between those dates. Gains are limited to the price at which the Fund sold the security short, while losses are potentially unlimited in size.
The Fund is required to establish a margin account with the broker lending the security sold short. While the short sale is outstanding, the broker retains the proceeds of the short sale to the extent necessary to meet margin requirements until the short position is closed out. A deposit must also be maintained with the Fund’s custodian/counterparty broker consisting of cash and/or securities having a value equal to a specified percentage of the value of the securities sold short. The Fund is obligated to pay fees for borrowing the securities sold short and is required to pay the counterparty any dividends and/or interest due on securities sold short. Such dividends and/or interest and any security borrowing fees are recorded as an expense to the Fund. At December 31, 2014, the Fund had no securities sold short.
franklintempleton.com
Annual Report
| 33
FRANKLIN MUTUAL INTERNATIONAL FUND
NOTES TO FINANCIAL STATEMENTS
1. Organization and Significant Accounting
Policies (continued)
e. Securities Lending
The Fund participates in an agency based securities lending program. The Fund receives cash collateral against the loaned securities in an amount equal to at least 102% of the fair value of the loaned securities. Collateral is maintained over the life of the loan in an amount not less than 100% of the fair value of loaned securities, as determined at the close of fund business each day; any additional collateral required due to changes in security values is delivered to the Fund on the next business day. The collateral is invested in a non-registered money fund. The Fund receives income from the investment of cash collateral, in addition to lending fees and rebates paid by the borrower. The Fund bears the market risk with respect to the collateral investment, securities loaned, and the risk that the agent may default on its obligations to the Fund. The securities lending agent has agreed to indemnify the Fund in the event of default by a third party borrower. At December 31, 2014, the Fund had no securities on loan.
f. Income and Deferred Taxes
It is the Fund’s policy to qualify as a regulated investment company under the Internal Revenue Code. The Fund intends to distribute to shareholders substantially all of its taxable income and net realized gains to relieve it from federal income and excise taxes. However, during the period the Fund retained a portion of its taxable income and net realized gains and as result incurred an excise tax of $19,600 as noted in the Statement of Operations. No further provision for U.S. federal income taxes is required.
The Fund may be subject to foreign taxation related to income received, capital gains on the sale of securities and certain foreign currency transactions in the foreign jurisdictions in which it invests. Foreign taxes, if any, are recorded based on the tax regulations and rates that exist in the foreign markets in which the Fund invests. When a capital gain tax is determined to apply the Fund records an estimated deferred tax liability in an amount that would be payable if the securities were disposed of on the valuation date. As a result of several court cases, in certain countries across the European Union, the Fund has filed additional tax reclaims for previously withheld taxes on dividends earned in those countries. These additional filings are subject to various administrative proceedings by the local jurisdictions’ tax authorities within the European Union, as well as a number of related judicial proceedings. At this time,
uncertainty exists as to the ultimate resolution of these proceedings, the likelihood of receipt of these reclaims, and the potential timing of payment, and accordingly, no amounts are reflected in the financial statements.
The Fund recognizes the tax benefits of uncertain tax positions only when the position is “more likely than not” to be sustained upon examination by the tax authorities based on the technical merits of the tax position. As of December 31, 2014, and for all open tax years, the Fund has determined that no liability for unrecognized tax benefits is required in the Fund’s financial statements related to uncertain tax positions taken on a tax return (or expected to be taken on future tax returns). Open tax years are those that remain subject to examination and are based on each tax jurisdiction statute of limitation.
g. Security Transactions, Investment Income, Expenses and Distributions
Security transactions are accounted for on trade date. Realized gains and losses on security transactions are determined on a specific identification basis. Interest income and estimated expenses are accrued daily. Amortization of premium and accretion of discount on debt securities are included in interest income. Dividend income and dividends declared on securities sold short are recorded on the ex-dividend date except for certain foreign securities where the dividend rate is not available. In such cases, the dividend is recorded as soon as the information is received by the Fund. Distributions to shareholders are recorded on the ex-dividend date and are determined according to income tax regulations (tax basis). Distributable earnings determined on a tax basis may differ from earnings recorded in accordance with U.S. GAAP. These differences may be permanent or temporary. Permanent differences are reclassified among capital accounts to reflect their tax character. These reclassifications have no impact on net assets or the results of operations. Temporary differences are not reclassified, as they may reverse in subsequent periods.
Common expenses incurred by the Trust are allocated among the funds based on the ratio of net assets of each fund to the combined net assets of the Trust. Fund specific expenses are charged directly to the fund that incurred the expense.
Realized and unrealized gains and losses and net investment income, not including class specific expenses, are allocated daily to each class of shares based upon the relative proportion of net assets of each class. Differences in per share distributions, by class, are generally due to differences in class specific expenses.
34 | Annual Report
franklintempleton.com
FRANKLIN MUTUAL INTERNATIONAL FUND
NOTES TO FINANCIAL STATEMENTS
h. Accounting Estimates
The preparation of financial statements in accordance with U.S. GAAP requires management to make estimates and assumptions that affect the reported amounts of assets and liabilities at the date of the financial statements and the amounts of income and expenses during the reporting period. Actual results could differ from those estimates.
i. Guarantees and Indemnifications
Under the Trust’s organizational documents, its officers and trustees are indemnified by the Trust against certain liabilities arising out of the performance of their duties to the Trust. Additionally, in the normal course of business, the Trust, on behalf of the Fund, enters into contracts with service providers that contain general indemnification clauses. The Trust’s maximum exposure under these arrangements is unknown as this would involve future claims that may be made against the Trust that have not yet occurred. Currently, the Trust expects the risk of loss to be remote.
2. Shares of Beneficial Interest
At December 31, 2014, there were an unlimited number of shares authorized (without par value). Transactions in the Fund’s shares were as follows:
| Year Ended December 31, | |||||||||||||
| 2014 | 2013 | a | |||||||||||
| Shares | Amount | Shares | Amount | ||||||||||
| Class Z Shares: | |||||||||||||
| Shares sold | 529,983 | $ | 8,226,852 | 532,453 | $ | 7,747,736 | |||||||
| Shares issued in reinvestment of distributions | 86,650 | 1,263,366 | 19,629 | 304,656 | |||||||||
| Shares redeemed | (176,966 | ) | (2,778,531 | ) | (387,998 | ) | (5,568,627 | ) | |||||
| Net increase (decrease) | 439,667 | $ | 6,711,687 | 164,084 | $ | 2,483,765 | |||||||
| Class A Shares: | |||||||||||||
| Shares sold | 901,338 | $ | 13,970,519 | 1,274,923 | $ | 18,493,067 | |||||||
| Shares issued in reinvestment of distributions | 165,114 | 2,404,279 | 42,070 | 650,456 | |||||||||
| Shares redeemed | (558,333 | ) | (8,700,117 | ) | (432,923 | ) | (6,252,704 | ) | |||||
| Net increase (decrease) | 508,119 | $ | 7,674,681 | 884,070 | $ | 12,890,819 | |||||||
| Class C Shares: | |||||||||||||
| Shares sold | 262,947 | $ | 4,041,488 | 260,176 | $ | 3,760,594 | |||||||
| Shares issued in reinvestment of distributions | 59,615 | 859,241 | 12,115 | 185,013 | |||||||||
| Shares redeemed | (199,373 | ) | (3,066,785 | ) | (149,858 | ) | (2,149,718 | ) | |||||
| Net increase (decrease) | 123,189 | $ | 1,833,944 | 122,433 | $ | 1,795,889 | |||||||
| Class R Shares: | |||||||||||||
| Shares sold | 3,627 | $ | 57,262 | 10,728 | $ | 158,252 | |||||||
| Shares issued in reinvestment of distributions | 490 | 7,132 | 106 | 1,631 | |||||||||
| Shares redeemed | (2,078 | ) | (32,362 | ) | (8,221 | ) | (124,778 | ) | |||||
| Net increase (decrease) | 2,039 | $ | 32,032 | 2,613 | $ | 35,105 | |||||||
| Class R6 Shares: | |||||||||||||
| Shares sold | 1,298,073 | $ | 20,764,282 | 351 | $ | 5,000 | |||||||
| Shares issued in reinvestment of distributions | 83,260 | 1,205,600 | — | — | |||||||||
| Shares redeemed | (52,008 | ) | (802,340 | ) | — | — | |||||||
| Net increase (decrease) | 1,329,325 | $ | 21,167,542 | 351 | $ | 5,000 | |||||||
| aFor the period May 1, 2013 (effective date) to December 31, 2013, for Class R6. | |||||||||||||
franklintempleton.com
Annual Report
| 35
FRANKLIN MUTUAL INTERNATIONAL FUND
NOTES TO FINANCIAL STATEMENTS
3. Transactions with Affiliates
Franklin Resources, Inc. is the holding company for various subsidiaries that together are referred to as Franklin Templeton Investments. Certain officers and trustees of the Fund are also officers and/or directors of the following subsidiaries:
| Subsidiary | Affiliation |
| Franklin Mutual Advisers, LLC (Franklin Mutual) | Investment manager |
| Franklin Templeton Services, LLC (FT Services) | Administrative manager |
| Franklin Templeton Distributors, Inc. (Distributors) | Principal underwriter |
| Franklin Templeton Investor Services, LLC (Investor Services) | Transfer agent |
a. Management Fees
The Fund pays an investment management fee to Franklin Mutual of 0.875% per year of the average daily net assets of the Fund.
Effective July 1, 2014, the Fund combined its investment management and administration agreements as approved by the Board. The fees paid under the combined agreement do not exceed the aggregate fees that were paid under the separate agreements.
Prior to July 1, 2014, the Fund paid fees to Franklin Mutual of 0.800% per year of the average daily net assets of the Fund.
b. Administrative Fees
Effective July 1, 2014, under an agreement with Franklin Mutual, FT Services provides administrative services to the Fund. The fee is paid by Franklin Mutual based on the Fund’s average daily net assets, and is not an additional expense of the Fund.
Prior to July 1, 2014, the Fund paid its allocated share of an administrative fee to FT Services based on the Trust’s aggregate average daily net assets as follows:
| Annualized Fee Rate | Net Assets | |
| 0.150 | % | Up to and including $200 million |
| 0.135 | % | Over $200 million, up to and including $700 million |
| 0.100 | % | Over $700 million, up to and including $1.2 billion |
| 0.075 | % | In excess of $1.2 billion |
c. Distribution Fees
The Board has adopted distribution plans for each share class, with the exception of Class Z and Class R6 shares, pursuant to Rule 12b-1 under the 1940 Act. Distribution fees are not charged on shares held by affiliates. Under the Fund’s Class A reimbursement distribution plan, the Fund reimburses Distributors for costs incurred in connection with the servicing, sale and distribution of the Fund’s shares up to the maximum annual plan rate. Under the Class A reimbursement distribution plan, costs exceeding the maximum for the current plan year cannot be reimbursed in subsequent periods. In addition, under the Fund’s Class C and R compensation distribution plans, the Fund pays Distributors for costs incurred in connection with the servicing, sale and distribution of the Fund’s shares up to the maximum annual plan rate for each class. The plan year, for purposes of monitoring compliance with the maximum annual plan rates, is February 1 through January 31 for each fund.
The maximum annual plan rates, based on the average daily net assets, for each class, are as follows:
| Class A | 0.35 | % |
| Class C | 1.00 | % |
| Class R | 0.50 | % |
The Board has set the current rate at 0.30% per year for Class A shares until further notice and approval by the Board.
36 | Annual Report
franklintempleton.com
FRANKLIN MUTUAL INTERNATIONAL FUND
NOTES TO FINANCIAL STATEMENTS
d. Sales Charges/Underwriting Agreements
Front-end sales charges and contingent deferred sales charges (CDSC) do not represent expenses of the Fund. These charges are deducted from the proceeds of sales of Fund shares prior to investment or from redemption proceeds prior to remittance, as applicable. Distributors has advised the Fund of the following commission transactions related to the sales and redemptions of the Fund’s shares for the year:
| Sales charges retained net of commissions paid to unaffiliated | ||
| broker/dealers | $ | 20,007 |
| CDSC retained | $ | 1,754 |
e. Transfer Agent Fees
Each class of shares, except for Class R6, pays transfer agent fees to Investor Services for its performance of shareholder servicing obligations and reimburses Investor Services for out of pocket expenses incurred, including shareholding servicing fees paid to third parties. These fees are allocated daily based upon their relative proportion of such classes’ aggregate net assets. Class R6 pays Investor Services transfer agent fees specific to that class.
For the year ended December 31, 2014, the Fund paid transfer agent fees of $102,960, of which $63,658 was retained by Investor Services.
f. Waiver and Expense Reimbursements
Franklin Mutual has contractually agreed in advance to waive or limit its respective fees and to assume as its own expense certain expenses otherwise payable by the Fund so that the expenses (excluding distribution fees and acquired fund fees and expenses) for each class of the Fund do not exceed 1.17%, and Class R6 does not exceed 1.00% based on the average net assets of each class (other than certain non-routine expenses or costs, including those relating to litigation, indemnification, reorganizations, and liquidations) until April 30, 2015. Prior to the combining of the investment management and administrative agreements, the Fund had a contractual fee agreement with FT Services, which was eliminated effective July 1, 2014.
g. Other Affiliated Transactions
At December 31, 2014, one or more of the funds in the Franklin Fund Allocator Series owned 20.54% of the Fund’s outstanding shares.
4. Expense Offset Arrangement
The Fund has entered into an arrangement with its custodian whereby credits realized as a result of uninvested cash balances are used to reduce a portion of the Fund’s custodian expenses. During the year ended December 31, 2014, the custodian fees were reduced as noted in the Statement of Operations.
5. Independent Trustees’ Retirement Plan
On January 1, 1993, the Trust adopted an Independent Trustees’ Retirement Plan (Plan). The Plan is an unfunded defined benefit plan that provides benefit payments to Trustees whose length of service and retirement age meets the eligibility requirements of the Plan. Benefits under the Plan are based on years of service and fees paid to each trustee at the time of retirement. Effective in December 1996, the Plan was closed to new participants.
franklintempleton.com
Annual Report
| 37
FRANKLIN MUTUAL INTERNATIONAL FUND
NOTES TO FINANCIAL STATEMENTS
5. Independent Trustees’ Retirement Plan (continued)
During the year ended December 31, 2014, the Fund’s projected benefit obligation and benefit payments under the Plan were as follows:
| aProjected benefit obligation at December 31, 2014 | $ | 54 | |
| bIncrease in projected benefit obligation | $ | 122 | |
| Benefit payments made to retired trustees | $ | (68 | ) |
aThe projected benefit obligation is included in trustees’ fees and expenses in the Statement of Assets and Liabilities. bThe increase in projected benefit obligation is included in trustees’ fees and expenses in the Statement of Operations.
6. Income Taxes
For tax purposes, the Fund may elect to defer any portion of a late-year ordinary loss to the first day of the following fiscal year. At December 31, 2014, the Fund deferred late-year ordinary losses of $12,474.
The tax character of distributions paid during the years ended December 31, 2014 and 2013, was as follows:
| 2014 | 2013 | |||
| Distributions paid from: | ||||
| Ordinary income | $ | 2,185,916 | $ | 1,034,231 |
| Long term capital gain | 3,653,795 | 134,880 | ||
| $ | 5,839,711 | $ | 1,169,111 |
At December 31, 2014, the cost of investments, net unrealized appreciation (depreciation), undistributed ordinary income and undistributed long term capital gains for income tax purposes were as follows:
| Cost of investments | $ | 89,411,028 | |
| Unrealized appreciation | $ | 7,262,499 | |
| Unrealized depreciation | (6,883,048 | ) | |
| Net unrealized appreciation (depreciation) | $ | 379,451 | |
| Undistributed ordinary income | $ | 1,000,447 | |
| Undistributed long term capital gains | 1,462,303 | ||
| Distributable earnings | $ | 2,462,750 | |
Differences between income and/or capital gains as determined on a book basis and a tax basis are primarily due to differing treatments of foreign currency transactions and passive foreign investment company shares.
7. Investment Transactions
Purchases and sales of investments (excluding short term securities and securities sold short) for the year ended December 31, 2014, aggregated $63,235,778 and $36,935,940, respectively.
38 | Annual Report
franklintempleton.com
FRANKLIN MUTUAL INTERNATIONAL FUND
NOTES TO FINANCIAL STATEMENTS
Transactions in options written during the year ended December 31, 2014, were as follows:
| Number of | |||||
| Contracts | Premiums | ||||
| Options outstanding at December 31, 2013 | — | $ | — | ||
| Options written | 3 | 1,504 | |||
| Options expired | — | — | |||
| Options exercised | (3 | ) | (1,504 | ) | |
| Options closed | — | — | |||
| Options outstanding at December 31, 2014 | — | $ | — |
See Notes 1(c) and 9 regarding derivative financial instruments and other derivative information, respectively.
8. Concentration of Risk
Investing in foreign securities may include certain risks and considerations not typically associated with investing in U.S. securities, such as fluctuating currency values and changing local and regional economic, political and social conditions, which may result in greater market volatility. In addition, certain foreign securities may not be as liquid as U.S. securities.
9. Other Derivative Information
At December 31, 2014, the Fund’s investments in derivative contracts are reflected on the Statement of Assets and Liabilities as follows:
| Asset Derivatives | Liability Derivatives | ||||||
| Derivative Contracts | |||||||
| Not Accounted for as | Statement of Assets and | Statement of Assets and | |||||
| Hedging Instruments | Liabilities Location | Fair Value | Liabilities Location | Fair Value | |||
| Foreign exchange | |||||||
| contracts | Unrealized appreciation on forward | $ | 3,791,198 | a | Unrealized depreciation on | $ | 374,190 |
| exchange contracts / Net assets | forward exchange contracts | ||||||
| consist of – net unrealized | |||||||
| appreciation (depreciation) |
aIncludes cumulative appreciation (depreciation) of futures contracts as reported in the Statement of Investments. Only current day’s variation margin is separately reported within the Statement of Assets and Liabilities.
For the year ended December 31, 2014, the effect of derivative contracts on the Fund’s Statement of Operations was as follows:
| Change in | ||||||
| Unrealized | ||||||
| Derivative Contracts | Realized Gain | Appreciation | ||||
| Not Accounted for as | (Loss) for | (Depreciation) | ||||
| Hedging Instruments | Statement of Operations Locations | the Year | for the Year | |||
| Foreign exchange contracts | Net realized gain (loss) from foreign currency transactions and | $ | (639,656 | ) | $ | 4,979,268 |
futures contracts / Net change in unrealized appreciation
(depreciation) on translation of other assets and liabilities
denominated in foreign currencies
For the year ended December 31, 2014, the average month end fair value of derivatives represented 2.28% of average month end net assets. The average month end number of open derivative contracts for the year was 230.
franklintempleton.com
Annual Report
| 39
| FRANKLIN MUTUAL INTERNATIONAL FUND | ||||
| NOTES TO FINANCIAL STATEMENTS | ||||
| 9. Other Derivative Information (continued) | ||||
| At December 31, 2014, the Fund’s OTC derivative assets and liabilities, are as follows: | ||||
| Gross and Net Amounts of Assets and Liabilities Presented | ||||
| in the Statement of Assets and Liabilities | ||||
| Assetsa | Liabilitiesa | |||
| Derivatives | ||||
| Forward exchange contracts | $ | 3,569,386 | $ | 374,190 |
aAbsent an event of default or early termination, OTC derivative assets and liabilities are presented gross and not offset in the Statement of Assets and Liabilities.
At December 31, 2014, the Fund’s OTC derivative assets which may be offset against the Fund’s OTC derivative liabilities and collateral received from the counterparty, is as follows:
| Amounts Not Offset in the | ||||||||||||
| Statement of Assets and Liabilities | ||||||||||||
| Gross and | ||||||||||||
| Net Amounts of | Financial | Financial | ||||||||||
| Assets Presented in | Instruments | Instruments | Cash | Net Amount | ||||||||
| the Statement of | Available for | Collateral | Collateral | (Not less | ||||||||
| Assets and Liabilities | Offset | Received a,b | Received | than zero) | ||||||||
| Counterparty | ||||||||||||
| BANT | $ | 1,758,956 | $ | (40,768 | ) | $ | (1,623,968 | ) | $ | — | $ | 94,220 |
| BBU | 836 | (836 | ) | — | — | — | ||||||
| BONY | 181,159 | (3,289 | ) | (103,465 | ) | — | 74,405 | |||||
| DBFX | 147,744 | (147,744 | ) | — | — | — | ||||||
| FBCO | 746,791 | (22,685 | ) | (538,063 | ) | — | 186,043 | |||||
| HSBC | 280,086 | (110,667 | ) | (169,419 | ) | — | — | |||||
| SCBT | 2,503 | (2,503 | ) | — | — | — | ||||||
| SSBT | 451,311 | — | — | — | 451,311 | |||||||
| Total | $ | 3,569,386 | $ | (328,492 | ) | $ | (2,434,915 | ) | $ | — | $ | 805,979 |
aAt December 31, 2014, the Fund received U.S. Treasury Bonds and Notes as collateral for derivatives.
bIn some instances, the collateral amounts disclosed in the table above were adjusted due to the requirement to limit the collateral amounts to avoid the effect of overcollater-
alization. Actual collateral received and/or pledged may be more than the amounts disclosed herein.
At December 31, 2014, the Fund’s OTC derivative liabilities which may be offset against the Fund’s OTC derivative assets and
collateral pledged to the counterparty, is as follows:
| Amounts Not Offset in the | |||||||||||
| Statement of Assets and Liabilities | |||||||||||
| Gross and | |||||||||||
| Net Amounts of | Financial | Financial | |||||||||
| Liabilities Presented in | Instruments | Instruments | Cash | Net Amount | |||||||
| the Statement of | Available for | Collateral | Collateral | (Not less | |||||||
| Assets and Liabilities | Offset | Pledged | Pledged | than zero) | |||||||
| Counterparty | |||||||||||
| BANT | $ | 40,768 | $ | (40,768 | ) | $ | — | $ | — | $ | — |
| BBU | 2,027 | (836 | ) | — | — | 1,191 | |||||
| BONY | 3,289 | (3,289 | ) | — | — | — | |||||
| DBFX | 169,811 | (147,744 | ) | — | — | 22,067 | |||||
| FBCO | 22,685 | (22,685 | ) | — | — | — | |||||
| HSBC | 110,667 | (110,667 | ) | — | — | — | |||||
| SCBT | 2,953 | (2,503 | ) | — | — | 450 | |||||
| SSBT | 21,990 | — | — | — | 21,990 | ||||||
| Total | $ | 374,190 | $ | (328,492 | ) | $ | — | $ | — | $ | 45,698 |
| 40 | Annual Report | franklintempleton.com | ||||||||||
FRANKLIN MUTUAL INTERNATIONAL FUND
NOTES TO FINANCIAL STATEMENTS
See Notes 1(c) and 7 regarding derivative financial instrument and investment transactions, respectively.
See Abbreviations on page 42.
10. Credit Facility
The Fund, together with other U.S. registered and foreign investment funds (collectively, Borrowers), managed by Franklin Templeton Investments, are borrowers in a joint syndicated senior unsecured credit facility totaling $1.5 billion (Global Credit Facility) which matured on February 13, 2015. This Global Credit Facility provides a source of funds to the Borrowers for temporary and emergency purposes, including the ability to meet future unanticipated or unusually large redemption requests. Effective February 13, 2015, the Borrowers renewed the Global Credit Facility for a total of $2 billion, which matures on February 12, 2016.
Under the terms of the Global Credit Facility, the Fund shall, in addition to interest charged on any borrowings made by the Fund and other costs incurred by the Fund, pay its share of fees and expenses incurred in connection with the implementation and maintenance of the Global Credit Facility, based upon its relative share of the aggregate net assets of all of the Borrowers, including an annual commitment fee of 0.07% based upon the unused portion of the Global Credit Facility. These fees are reflected in other expenses on the Statement of Operations. During the year ended December 31, 2014, the Fund did not use the Global Credit Facility.
11. Fair Value Measurements
The Fund follows a fair value hierarchy that distinguishes between market data obtained from independent sources (observable inputs) and the Fund’s own market assumptions (unobservable inputs). These inputs are used in determining the value of the Fund’s financial instruments and are summarized in the following fair value hierarchy:
- Level 1 – quoted prices in active markets for identical financial instruments
- Level 2 – other significant observable inputs (including quoted prices for similar financial instruments, interest rates, prepayment speed, credit risk, etc.)
- Level 3 – significant unobservable inputs (including the Fund’s own assumptions in determining the fair value of financial instruments)
The input levels are not necessarily an indication of the risk or liquidity associated with financial instruments at that level.
For movements between the levels within the fair value hierarchy, the Fund has adopted a policy of recognizing the transfers as of the date of the underlying event which caused the movement.
franklintempleton.com
Annual Report
| 41
FRANKLIN MUTUAL INTERNATIONAL FUND
NOTES TO FINANCIAL STATEMENTS
11. Fair Value Measurements (continued)
A summary of inputs used as of December 31, 2014, in valuing the Fund’s assets and liabilities carried at fair value, is as follows:
| Level 1 | Level 2 | Level 3 | Total | |||||
| Assets: | ||||||||
| Investments in Securities: | ||||||||
| Equity Investments:a | ||||||||
| Machinery | $ | 1,760,315 | $ | 133,903 | — | $ | 1,894,218 | |
| Oil, Gas & Consumable Fuels | 4,230,818 | 4,420 | — | 4,235,238 | ||||
| All Other Equity Investmentsb | 74,061,212 | — | — | 74,061,212 | ||||
| Short Term Investments | 7,999,811 | 1,600,000 | — | 9,599,811 | ||||
| Total Investments in Securities | $ | 88,052,156 | $ | 1,738,323 | $ | — | $ | 89,790,479 |
| Other Financial Instruments | ||||||||
| Futures Contracts | $ | 221,812 | $ | — | $ | — | $ | 221,812 |
| Forward Exchange Contracts | — | 3,569,386 | — | 3,569,386 | ||||
| Total Other Financial Instruments | $ | 221,812 | $ | 3,569,386 | $ | — | $ | 3,791,198 |
| Liabilities: | ||||||||
| Other Financial Instruments | ||||||||
| Forward Exchange Contracts | $ | — | $ | 374,190 | $ | — | $ | 374,190 |
| aIncludes common and preferred stocks as well as other equity investments. | ||||||||
| bFor detailed categories, see the accompanying Statement of Investments. | ||||||||
A reconciliation of assets in which Level 3 inputs are used in determining fair value is presented when there are significant Level 3 financial instruments at the end of the year.
12. New Accounting Pronouncements
In June 2014, Financial Accounting Standards Board issued Accounting Standards Update (ASU) No. 2014-11, Transfers and Servicing (Topic 860), Repurchase-to-Maturity Transactions, Repurchase Financings, and Disclosures. The ASU changes the accounting for certain repurchase agreements and expands disclosure requirements related to repurchase agreements, securities lending, repurchase-to-maturity and similar transactions. The ASU is effective for interim and annual reporting periods beginning after December 15, 2014. Management has reviewed the requirements and believes the adoption of this ASU will not have a material impact on the financial statements.
13. Subsequent Events
The Fund has evaluated subsequent events through the issuance of the financial statements and determined that no events have occurred that require disclosure other than those already disclosed in the financial statements.
| Abbreviations | |||||
| Counterparty | Currency | Selected Portfolio | |||
| BANT | Bank of America N.A. | EUR | Euro | ADR | American Depositary Receipt |
| BBU | Barclays Bank PLC | GBP | British Pound | FHLB | Federal Home Loan Bank |
| BONY | Bank of New York Mellon | CHF | Swiss Franc | IDR | International Depositary Receipt |
| DBFX | Deutsche Bank AG | USD | United States Dollar | ||
| FBCO | Credit Suisse Group AG | ||||
| HSBC | HSBC Bank USA, N.A. | ||||
| SCBT | Standard Chartered Bank | ||||
| SSBT | State Street Bank and Trust Co., N.A. | ||||
| 42 | | Annual Report | franklintempleton.com | |||
FRANKLIN MUTUAL INTERNATIONAL FUND
Report of Independent Registered Public Accounting Firm
To the Board of Trustees of Franklin Mutual Series Funds and Shareholders of the Franklin Mutual International Fund:
We have audited the accompanying statement of assets and liabilities, including the statement of investments, of Franklin Mutual International Fund (formerly, Mutual International Fund) (the “Fund”) (one of the funds constituting Franklin Mutual Series Funds), as of December 31, 2014, and the related statement of operations for the year then ended, the statements of changes in net assets for each of the two years in the period then ended, and the financial highlights for each of the periods indicated therein. These financial statements and financial highlights are the responsibility of the Fund’s management. Our responsibility is to express an opinion on these financial statements and financial highlights based on our audits.
We conducted our audits in accordance with the standards of the Public Company Accounting Oversight Board (United States). Those standards require that we plan and perform the audit to obtain reasonable assurance about whether the financial statements and financial highlights are free of material misstatement. We were not engaged to perform an audit of the Fund’s internal control over financial reporting. Our audits included consideration of internal control over financial reporting as a basis for designing audit procedures that are appropriate in the circumstances, but not for the purpose of expressing an opinion on the effectiveness of the Fund’s internal control over financial reporting. Accordingly, we express no such opinion. An audit also includes examining, on a test basis, evidence supporting the amounts and disclosures in the financial statements and financial highlights, assessing the accounting principles used and significant estimates made by management, and evaluating the overall financial statement presentation. Our procedures included confirmation of securities owned as of December 31, 2014, by correspondence with the custodian and brokers, or by other appropriate auditing procedures where replies from the brokers were not received. We believe that our audits provide a reasonable basis for our opinion.
In our opinion, the financial statements and financial highlights referred to above present fairly, in all material respects, the financial position of Franklin Mutual International Fund (one of the funds constituting Franklin Mutual Series Funds) at December 31, 2014, the results of its operations for the year then ended, the changes in its net assets for each of the two years in the period then ended, and the financial highlights for each of the periods indicated therein, in conformity with U.S. generally accepted accounting principles.
Boston, Massachusetts
February 18, 2015

franklintempleton.com
Annual Report
| 43
FRANKLIN MUTUAL INTERNATIONAL FUND
Tax Information (unaudited)
Under Section 852(b)(3)(C) of the Internal Revenue Code (Code), the Fund hereby reports the maximum amount allowable but no less than $3,653,795 as a long term capital gain dividend for the fiscal year ended December 31, 2014.
Under Section 854(b)(1)(B) of the Code, the Fund hereby reports the maximum amount allowable but no less than $1,423,590 as qualified dividends for purposes of the maximum rate under Section 1(h)(11) of the Code for the fiscal year ended December 31, 2014. Distributions, including qualified dividend income, paid during calendar year 2014 will be reported to shareholders on Form 1099-DIV by mid-February 2015. Shareholders are advised to check with their tax advisors for information on the treatment of these amounts on their individual income tax returns.
At December 31, 2014, more than 50% of the Fund’s total assets were invested in securities of foreign issuers. In most instances, foreign taxes were withheld from income paid to the Fund on these investments. As shown in the table below, the Fund hereby reports to shareholders the foreign source income and foreign taxes paid, pursuant to Section 853 of the Code. This written statement will allow shareholders of record on December 18, 2014, to treat their proportionate share of foreign taxes paid by the Funds as having been paid directly by them. The shareholder shall consider these amounts as foreign taxes paid in the tax year in which they receive the Fund distribution.
The following table provides a detailed analysis of foreign tax paid, foreign source income and foreign source qualified dividends as reported by the Fund, to Class Z, Class A, Class C, Class R and Class R6 shareholders of record.
| Foreign Tax Paid | Foreign Source | Foreign Source Qualified | ||||
| Class | Per Share | Income Per Share | Dividends Per Share | |||
| Class Z | $ | 0.0182 | $ | 0.2771 | $ | 0.1740 |
| Class A | $ | 0.0182 | $ | 0.2401 | $ | 0.1508 |
| Class C | $ | 0.0182 | $ | 0.1633 | $ | 0.1025 |
| Class R | $ | 0.0182 | $ | 0.2281 | $ | 0.1431 |
| Class R6 | $ | 0.0182 | $ | 0.2907 | $ | 0.1825 |
Foreign Tax Paid Per Share (Column 1) is the amount per share available to you, as a tax credit (assuming you held your shares in the Fund for a minimum of 16 days during the 31-day period beginning 15 days before the ex-dividend date of the Fund’s distribution to which the foreign taxes relate), or, as a tax deduction.
Foreign Source Income Per Share (Column 2) is the amount per share of income dividends attributable to foreign securities held by the Fund, plus any foreign taxes withheld on these dividends. The amounts reported include foreign source qualified dividends that have not been adjusted for the rate differential applicable to such dividend income.1
Foreign Source Qualified Dividends Per Share (Column 3) is the amount per share of foreign source qualified dividends, plus any foreign taxes withheld on these dividends. These amounts represent the portion of the Foreign Source Income reported to you in column 2 that were derived from qualified foreign securities held by the Fund.1
By mid-February 2015, shareholders will receive Form 1099-DIV which will include their share of taxes paid and foreign source income distributed during the calendar year 2014. The Foreign Source Income reported on Form 1099-DIV has not been adjusted for the rate differential on foreign source qualified dividend income. Shareholders are advised to check with their tax advisors for information on the treatment of these amounts on their 2014 individual income tax returns.
1 Qualified dividends are taxed at reduced long term capital gains tax rates. In determining the amount of foreign tax credit that may be applied against the U.S. tax liability of individuals receiving foreign source qualified dividends, adjustments may be required to the foreign tax credit limitation calculation to reflect the rate differential applicable to such dividend income. The rules however permit certain individuals to elect not to apply the rate differential adjustments for capital gains and/or dividends for any taxable year. Please consult your tax advisor and the instructions to Form 1116 for more information.
44 | Annual Report
franklintempleton.com
FRANKLIN MUTUAL INTERNATIONAL FUND
Board Members and Officers
The name, year of birth and address of the officers and board members, as well as their affiliations, positions held with the Trust, principal occupations during at least the past five years and number of portfolios overseen in the Franklin Templeton Investments fund complex are shown below. Generally, each board member serves until that person’s successor is elected and qualified.
| Independent Board Members | ||||
| Number of Portfolios in | ||||
| Name, Year of Birth | Length of | Fund Complex Overseen | Other Directorships Held During | |
| and Address | Position | Time Served | by Board Member* | at Least the Past 5 Years |
| Edward I. Altman, Ph.D. (1941) | Trustee | Since 1987 | 10 | None |
| c/o Franklin Mutual Advisers, LLC | ||||
| 101 John F. Kennedy Parkway | ||||
| Short Hills, NJ 07078-2789 | ||||
Principal Occupation During at Least the Past 5 Years:
Max L. Heine Professor of Finance and Director of The Credit and Debt Markets Research Program, Salomon Center, Stern School of Business, New York University; editor and author of numerous financial publications; financial consultant; an adviser to numerous financial and publishing organizations; and formerly, Vice Director, Salomon Center, Stern School of Business, New York University.
| Ann Torre Bates (1958) | Trustee | Since 1995 | 36 | Navient Corporation (loan |
| c/o Franklin Mutual Advisers, LLC | management, servicing and asset | |||
| 101 John F. Kennedy Parkway | recovery) (May 2014), Ares Capital | |||
| Short Hills, NJ 07078-2789 | Corporation (specialty finance | |||
| company) (2010-present), United | ||||
| Natural Foods, Inc. (distributor of | ||||
| natural, organic and specialty foods) | ||||
| (2013-present), Allied Capital | ||||
| Corporation (financial services) | ||||
| (2003-2010) and SLM Corporation | ||||
| (Sallie Mae) (1997-2014). | ||||
Principal Occupation During at Least the Past 5 Years:
Director of various companies; and formerly, Executive Vice President and Chief Financial Officer, NHP Incorporated (manager of multifamily housing) (1995-1997); and Vice President and Treasurer, US Airways, Inc. (until 1995).
| Burton J. Greenwald (1929) Trustee | Since 2002 | 17 | Franklin Templeton Emerging Markets |
| c/o Franklin Mutual Advisers, LLC | Debt Opportunities Fund PLC and | ||
| 101 John F. Kennedy Parkway | Fiduciary International Ireland Limited. | ||
| Short Hills, NJ 07078-2789 |
Principal Occupation During at Least the Past 5 Years:
Managing Director, B.J. Greenwald Associates (management consultants to the financial services industry); and formerly, Chairman, Fiduciary Trust International Funds; Executive Vice President, L.F Rothschild Fund Management, Inc.; President and Director, Merit Mutual Funds; President, Underwriting Division and Director, National Securities & Research Corporation; Governor, Investment Company Institute; and Chairman, ICI Public Information Committee.
| Keith E. Mitchell (1954) | Trustee | Since 2009 | 10 | None |
| c/o Franklin Mutual Advisers, LLC | ||||
| 101 John F. Kennedy Parkway | ||||
| Short Hills, NJ 07078-2789 | ||||
Principal Occupation During at Least the Past 5 Years:
Managing Member, Mitchell, Hartley & Bechtel Advisers, LLC (formerly, Mitchell Advisers, LLC) (advisory firm); director of various boards of asset management firms; and formerly, Managing Director, Putnam Lovell NBF.
franklintempleton.com
Annual Report
| 45
FRANKLIN MUTUAL INTERNATIONAL FUND
| Independent Board Members (continued) | ||||
| Number of Portfolios in | ||||
| Name, Year of Birth | Length of | Fund Complex Overseen | Other Directorships Held During | |
| and Address | Position | Time Served | by Board Member* | at Least the Past 5 Years |
| Charles Rubens II (1930) | Trustee | Since 1998 | 17 | None |
| c/o Franklin Mutual Advisers, LLC | ||||
| 101 John F. Kennedy Parkway | ||||
| Short Hills, NJ 07078-2789 | ||||
Principal Occupation During at Least the Past 5 Years:
Private investor and president of non-profit organizations; and formerly, an executive of Time, Inc.; and Trustee of Colorado College.
| Jan Hopkins Trachtman (1947) Trustee | Since 2009 | 10 | None |
| c/o Franklin Mutual Advisers, LLC | |||
| 101 John F. Kennedy Parkway | |||
| Short Hills, NJ 07078-2789 |
Principal Occupation During at Least the Past 5 Years:
President and Founder, The Jan Hopkins Group (communications consulting firm); President, Economic Club of New York; serves on Advisory Board of Knight Bagehot Fellowship; and formerly, Anchor/Correspondent, CNN Financial News (until 2003); Managing Director and Head of Client Communications, Citigroup Private Bank (until 2005); Off-Air Reporter, ABC News’ World News Tonight; and Editor, CBS Network News.
| Robert E. Wade (1946) | Trustee and | Trustee since 1993 43 | El Oro Ltd (investments). | |
| c/o Franklin Mutual Advisers, LLC Chairman of | and Chairman of | |||
| 101 John F. Kennedy Parkway | the Board | the Board since | ||
| Short Hills, NJ 07078-2789 | 2005 | |||
| Principal Occupation During at Least the Past 5 Years: | ||||
| Attorney at law engaged in private practice (1972-2008) and member of various boards. | ||||
| Interested Board Members and Officers | ||||
| Number of Portfolios in | ||||
| Name, Year of Birth | Length of | Fund Complex Overseen | Other Directorships Held During | |
| and Address | Position | Time Served | by Board Member* | at Least the Past 5 Years |
| **Gregory E. Johnson (1961) | Trustee | Since 2007 | 147 | None |
| One Franklin Parkway | ||||
| San Mateo, CA 94403-1906 | ||||
Principal Occupation During at Least the Past 5 Years:
Chairman of the Board, Member – Office of the Chairman, Director, President and Chief Executive Officer, Franklin Resources, Inc.; officer and/or director or trustee, as the case may be, of some of the other subsidiaries of Franklin Resources, Inc. and of 44 of the investment companies in Franklin Templeton Investments; and Vice Chairman, Investment Company Institute.
| **Peter A. Langerman (1955) | Trustee, | Trustee since | 10 | American International Group, Inc. | |
| c/o Franklin Mutual Advisers, LLC President, and | 2007, President, | (AIG) Credit Facility Trust | |||
| 101 John F. Kennedy Parkway | Chief Executive and Chief | (2010–2011 | ). | ||
| Short Hills, NJ 07078-2702 | Officer – | Executive Officer – | |||
| Investment | Investment | ||||
| Management | Management since | ||||
| 2005 | |||||
Principal Occupation During at Least the Past 5 Years:
Chairman of the Board, Chief Executive Officer and President, Franklin Mutual Advisers, LLC; officer and/or director, as the case may be, of four of the investment companies in Franklin Templeton Investments.
46 | Annual Report
franklintempleton.com
FRANKLIN MUTUAL INTERNATIONAL FUND
| Interested Board Members and Officers (continued) | ||||
| Number of Portfolios in | ||||
| Name, Year of Birth | Length of | Fund Complex Overseen | Other Directorships Held During | |
| and Address | Position | Time Served | by Board Member* | at Least the Past 5 Years |
| Alison E. Baur (1964) | Vice President | Since 2012 | Not Applicable | Not Applicable |
| One Franklin Parkway | ||||
| San Mateo, CA 94403-1906 | ||||
Principal Occupation During at Least the Past 5 Years:
Deputy General Counsel, Franklin Templeton Investments; and officer of some of the other subsidiaries of Franklin Resources, Inc. and of 46 of the investment companies in Franklin Templeton Investments.
| Philippe Brugere-Trelat (1949) | Vice President | Since 2005 | Not Applicable | Not Applicable |
| 101 John F. Kennedy Parkway | ||||
| Short Hills NJ 07078-2789 |
Principal Occupation During at Least the Past 5 Years:
Executive Vice President, Franklin Mutual Advisers, LLC; officer of three of the investment companies in Franklin Templeton Investments; and formerly, Portfolio Manager of Eurovest SA (French registered Investment Company, Sicav).
| Laura F. Fergerson (1962) | Chief | Since 2009 | Not Applicable | Not Applicable |
| One Franklin Parkway | Executive | |||
| San Mateo, CA 94403-1906 | Officer – | |||
| Finance and | ||||
| Administration |
Principal Occupation During at Least the Past 5 Years:
Senior Vice President, Franklin Templeton Services, LLC; and officer of 46 of the investment companies in Franklin Templeton Investments
| Aliya S. Gordon (1973) | Vice President | Since 2009 | Not Applicable | Not Applicable |
| One Franklin Parkway | ||||
| San Mateo, CA 94403-1906 |
Principal Occupation During at Least the Past 5 Years:
Senior Associate General Counsel, Franklin Templeton Investments; officer of 46 of the investment companies in Franklin Templeton Investments; and formerly, Litigation Associate, Steefel, Levitt & Weiss, LLP (2000-2004).
| Steven J. Gray (1955) | Secretary and | Secretary since | Not Applicable | Not Applicable |
| One Franklin Parkway | Vice President | 2005 and Vice | ||
| San Mateo, CA 94403-1906 | President since | |||
| 2009 |
Principal Occupation During at Least the Past 5 Years:
Senior Associate General Counsel, Franklin Templeton Investments; Vice President, Franklin Templeton Distributors, Inc. and Franklin Alternative Strategies Advisers, LLC; and officer of 46 of the investment companies in Franklin Templeton Investments.
| Selena L. Holmes (1965) | Vice President | Since 2012 | Not Applicable | Not Applicable |
| 100 Fountain Parkway | – AML | |||
| St. Petersburg, FL 33716-1205 | Compliance |
Principal Occupation During at Least the Past 5 Years:
Director, Global Compliance Monitoring; Chief Compliance Officer, Franklin Alternative Strategies Advisers, LLC; Vice President, Franklin Templeton Companies, LLC; and officer of 46 of the investment companies in Franklin Templeton Investments.
franklintempleton.com
Annual Report
| 47
| FRANKLIN MUTUAL INTERNATIONAL FUND | ||||
| Interested Board Members and Officers (continued) | ||||
| Number of Portfolios in | ||||
| Name, Year of Birth | Length of | Fund Complex Overseen | Other Directorships Held During | |
| and Address | Position | Time Served | by Board Member* | at Least the Past 5 Years |
| Robert G. Kubilis (1973) | Treasurer, | Since 2012 | Not Applicable | Not Applicable |
| 300 S.E. 2nd Street | Chief Financial | |||
| Fort Lauderdale, FL 33301-1923 | Officer and | |||
| Chief | ||||
| Accounting | ||||
| Officer | ||||
Principal Occupation During at Least the Past 5 Years:
Assistant Treasurer, Fund Accounting, Franklin Templeton Investments; and officer of four of the investment companies in Franklin Templeton Investments.
| Kimberly H. Novotny (1972) Vice President | Since 2013 | Not Applicable | Not Applicable |
| 300 S.E. 2nd Street | |||
| Fort Lauderdale, FL 33301-1923 |
Principal Occupation During at Least the Past 5 Years:
Associate General Counsel, Franklin Templeton Investments; Vice President and Secretary, Fiduciary Trust International of the South; Vice President, Templeton Investment Counsel, LLC; Assistant Secretary, Franklin Resources, Inc.; and officer of 46 of the investment companies in Franklin Templeton Investments.
| Robert C. Rosselot (1960) | Chief | Since 2013 | Not Applicable | Not Applicable |
| 300 S.E. 2nd Street | Compliance | |||
| Fort Lauderdale, FL 33301-1923 | Officer |
Principal Occupation During at Least the Past 5 Years:
Director, Global Compliance, Franklin Templeton Investments; Vice President, Franklin Templeton Companies, LLC; officer of 46 of the investment companies in Franklin Templeton Investments; and formerly, Senior Associate General Counsel, Franklin Templeton Investments (2007-2013); and Secretary and Vice President, Templeton Group of Funds (2004-2013).
| Karen L. Skidmore (1952) | Vice President | Since 2009 | Not Applicable | Not Applicable |
| One Franklin Parkway | ||||
| San Mateo, CA 94403-1906 |
Principal Occupation During at Least the Past 5 Years:
Senior Associate General Counsel, Franklin Templeton Investments; and officer of 46 of the investment companies in Franklin Templeton Investments.
| Craig S. Tyle (1960) | Vice President | Since 2005 | Not Applicable | Not Applicable |
| One Franklin Parkway | ||||
| San Mateo, CA 94403-1906 |
Principal Occupation During at Least the Past 5 Years:
General Counsel and Executive Vice President, Franklin Resources, Inc.; and officer of some of the other subsidiaries of Franklin Resources, Inc. and of 46 of the investment companies in Franklin Templeton Investments.
48 | Annual Report
franklintempleton.com
FRANKLIN MUTUAL INTERNATIONAL FUND
| Interested Board Members and Officers (continued) | ||||
| Number of Portfolios in | ||||
| Name, Year of Birth | Length of | Fund Complex Overseen | Other Directorships Held During | |
| and Address | Position | Time Served | by Board Member* | at Least the Past 5 Years |
| Lori A. Weber (1964) | Vice President | Since 2011 | Not Applicable | Not Applicable |
| 300 S.E. 2nd Street | ||||
| Fort Lauderdale, FL 33301-1923 | ||||
Principal Occupation During at Least the Past 5 Years:
Senior Associate General Counsel, Franklin Templeton Investments; Assistant Secretary, Franklin Resources, Inc.; Vice President and
Secretary, Templeton Investment Counsel, LLC; Vice President, Fiduciary Trust International of the South; and officer of 46 of the investment
companies in Franklin Templeton Investments.
*We base the number of portfolios on each separate series of the U.S. registered investment companies within the Franklin Templeton Investments fund
complex. These portfolios have a common investment manager or affiliated investment managers.
**Gregory E. Johnson is considered to be an interested person of the Fund under the federal securities laws due to his position as an officer and director
of Franklin Resources, Inc., which is the parent company of the Fund’s investment manager and distributor. Peter A. Langerman is considered to be an
interested person of the Fund under the federal securities laws due to his position as an officer of Franklin Mutual Advisers, LLC, which is an affiliate of
the Fund’s investment manager.
Note 1: Officer information is current as of the date of this report. It is possible that after this date, information about officers may change.
The Fund’s Board has determined that certain of the members of the Audit Committee, including Ann Torre Bates, are audit committee financial experts, and
“independent,” under those provisions of the Sarbanes-Oxley Act of 2002, and the rules and form amendments adopted by the Securities and Exchange
Commission, relating to audit committee financial experts.
The Statement of Additional Information (SAI) includes additional information about the board members and is available, without charge, upon request.
Shareholders may call (800) DIAL BEN/342-5236 to request the SAI
franklintempleton.com
Annual Report
| 49
FRANKLIN MUTUAL INTERNATIONAL FUND
Shareholder Information
Proxy Voting Policies and Procedures
The Fund’s investment manager has established Proxy Voting Policies and Procedures (Policies) that the Fund uses to determine how to vote proxies relating to portfolio securities. Shareholders may view the Fund’s complete Policies online at franklintempleton.com. Alternatively, shareholders may request copies of the Policies free of charge by calling the Proxy Group collect at (954) 527-7678 or by sending a written request to: Franklin Templeton Companies, LLC, 300 S.E. 2nd Street, Fort Lauderdale, FL 33301, Attention: Proxy Group. Copies of the Fund’s proxy voting records are also made available online at franklintempleton.com and posted on the U.S. Securities and Exchange Commission’s website at sec.gov and reflect the most recent 12-month period ended June 30.
Quarterly Statement of Investments
The Fund files a complete statement of investments with the U.S. Securities and Exchange Commission for the first and third quarters for each fiscal year on Form N-Q. Shareholders may view the filed Form N-Q by visiting the Commission’s website at sec.gov. The filed form may also be viewed and copied at the Commission’s Public Reference Room in Washington, DC. Information regarding the operations of the Public Reference Room may be obtained by calling (800) SEC-0330.
Householding of Reports and Prospectuses
You will receive the Fund’s financial reports every six months as well as an annual updated summary prospectus (prospectus available upon request). To reduce Fund expenses, we try to identify related shareholders in a household and send only one copy of the financial reports and summary prospectus. This process, called “householding,” will continue indefinitely unless you instruct us otherwise. If you prefer not to have these documents householded, please call us at (800) 632-2301. At any time you may view current prospectuses/summary prospectuses and financial reports on our website. If you choose, you may receive these documents through electronic delivery.
50 | Annual Report
franklintempleton.com
This page intentionally left blank.
This page intentionally left blank.

Annual Report and Shareholder Letter
Franklin Mutual International Fund
Formerly, Mutual International Fund
Investment Manager
Franklin Mutual Advisers, LLC
Distributor
Franklin Templeton Distributors, Inc.
(800) DIAL BEN® / 342-5236
franklintempleton.com
Shareholder Services
(800) 632-2301 - (Class A, C, R & R6)
(800) 448-FUND - (Class Z)
Authorized for distribution only when accompanied or preceded by a summary prospectus and/or prospectus. Investors should carefully consider a fund’s investment goals, risks, charges and expenses before investing. A prospectus contains this and other information; please read it carefully before investing.
To help ensure we provide you with quality service, all calls to and from our service areas are monitored and/or recorded.
| © 2015 Franklin Templeton Investments. All rights reserved. | 373 A 02/15 |
Annual Report
and Shareholder Letter
December 31, 2014
Franklin Mutual Quest Fund
Formerly, Mutual Quest Fund

Sign up for electronic delivery at franklintempleton.com/edelivery
Franklin Templeton Investments
Gain From Our Perspective®
At Franklin Templeton Investments, we’re dedicated to one goal: delivering exceptional asset management for our clients. By bringing together multiple, world-class investment teams in a single firm, we’re able to offer specialized expertise across styles and asset classes, all supported by the strength and resources of one of the world’s largest asset managers. This has helped us to become a trusted partner to individual and institutional investors across the globe.
Focus on Investment Excellence
At the core of our firm, you’ll find multiple independent investment teams—each with a focused area of expertise—from traditional to alternative strategies and multi-asset solutions. And because our portfolio groups operate autonomously, their strategies can be combined to deliver true style and asset class diversification.
All of our investment teams share a common commitment to excellence grounded in rigorous, fundamental research and robust, disciplined risk management. Decade after decade, our consistent, research-driven processes have helped Franklin Templeton earn an impressive record of strong, long-term results.
Global Perspective Shaped by Local Expertise
In today’s complex and interconnected world, smart investing demands a global perspective. Franklin Templeton pioneered international investing over 60 years ago, and our expertise in emerging markets spans more than a quarter of a century. Today, our investment professionals are on the ground across the globe, spotting investment ideas and potential risks firsthand. These locally based teams bring in-depth understanding of local companies, economies and cultural nuances, and share their best thinking across our global research network.
Strength and Experience
Franklin Templeton is a global leader in asset management serving clients in over 150 countries.1 We run our business with the same prudence we apply to asset management, staying focused on delivering relevant investment solutions, strong long-term results and reliable, personal service. This approach, focused on putting clients first, has helped us to become one of the most trusted names in financial services.
1. As of 12/31/13. Clients are represented by the total number of shareholder accounts.
Not FDIC Insured | May Lose Value | No Bank Guarantee
| Contents | ||
| Shareholder Letter | 1 | |
| Annual Report | ||
| Franklin Mutual Quest Fund | 4 | |
| Performance Summary | 9 | |
| Your Fund’s Expenses | 14 | |
| Financial Highlights and | ||
| Statement of Investments | 16 | |
| Financial Statements | 30 | |
| Notes to Financial Statements | 34 | |
| Report of Independent Registered | ||
| Public Accounting Firm | 50 | |
| Tax Information | 51 | |
| Board Members and Officers | 52 | |
| Shareholder Information | 57 | |
| | | 1 |
Annual Report
Franklin Mutual Quest Fund
(formerly, Mutual Quest Fund)
This annual report for Franklin Mutual Quest Fund covers the fiscal year ended December 31, 2014.
Your Fund’s Goals and Main Investments
The Fund seeks capital appreciation, which may occasionally be short term, with income as a secondary goal, by investing primarily in equity securities of companies the Fund’s managers believe are at prices below their intrinsic value. The Fund may invest up to 50% of its assets in foreign securities.
Performance Overview
The Fund’s Class Z shares delivered a +3.44% cumulative total return for the 12 months ended December 31, 2014. In comparison, the Fund’s benchmark, the Standard & Poor’s 500 Index (S&P 500), which is a broad measure of U.S. stock performance, generated a +13.69% total return.1 You can find more of the Fund’s performance data in the Performance Summary beginning on page 9.
Performance data represent past performance, which does not guarantee future results. Investment return and principal value will fluctuate, and you may have a gain or loss when you sell your shares. Current performance may differ from figures shown. Please visit franklintempleton.com or call (800) 342-5236 for most recent month-end performance.
Economic and Market Overview
The global economy grew moderately during 2014 as U.S. economic growth expanded while growth rates in much of the rest of the world declined. U.S. economic activity was supported in some quarters by increased consumer spending, business investment and federal defense spending. The housing market strengthened, and lower gasoline prices and improved job growth contributed to rising retail sales. The U.S. Federal Reserve Board (Fed) began reducing its large-scale bond purchases $10 billion a month in January and ended the buying program in October. But it continued its practice of maintaining holdings of longer term securities at

*Weightings may be negative or may not total 100% due to rounding, use of any derivatives, unsettled trades or other factors.
sizable levels. Toward period-end, the Fed stated that it could be patient with regard to raising interest rates and that the interest rate might not rise for at least a couple of meetings, possibly implying at least the first two meetings of 2015.
Outside the U.S., the U.K. economy grew relatively well, supported by the services and manufacturing sectors. In the eurozone, economic growth remained subdued, as concerns persisted about the potential negative impacts to growth from the crisis in Ukraine and China’s moderating growth rate. In June, the European Central Bank (ECB) reduced its main interest rate and, for the first time, set a negative deposit rate; the
1. Source: Morningstar.
The index is unmanaged and includes reinvested dividends. One cannot invest directly in an index, and an index is not representative of the Fund’s portfolio. See www.franklintempletondatasources.com for additional data provider information.
The dollar value, number of shares or principal amount, and names of all portfolio holdings are listed in the Fund’s Statement of Investments (SOI).
The SOI begins on page 21.
4 | Annual Report
franklintempleton.com
FRANKLIN MUTUAL QUEST FUND
ECB reduced both rates again in September. The ECB broadened its monetary easing stance by implementing an asset purchase program to prevent deflation and stimulate the economy. Japan’s second- and third-quarter economic contractions indicated the economy was in a recession, although private consumption and exports improved in the third quarter. In October, the Bank of Japan expanded its stimulus measures amid weak domestic demand and as substantially lower crude oil prices exerted further downward pressure on inflation. Near period-end, Japan’s ruling coalition was reelected in early parliamentary elections and subsequently announced a fresh stimulus package aimed at reviving economic growth.
Global developed market stocks, as measured by the MSCI World Index, advanced overall during the 12-month period amid a generally accommodative monetary policy environment and continued strength in corporate earnings. In several emerging markets, economic growth generally moderated. Emerging market stocks overall, as measured by the MSCI Emerging Markets Index, fell for the year, amid headwinds such as soft domestic demand, weak exports, plummeting crude oil prices, regional geopolitical tensions and concerns about possible U.S. interest rate increases. Many emerging market currencies depreciated against the U.S. dollar, leading several central banks to raise interest rates seeking to support their currencies. Several other central banks lowered interest rates to promote economic growth. Gold prices ended the year lower amid benign global inflation and a strong U.S. dollar.
Investment Strategy
At Mutual Series, we are committed to our distinctive value approach to investing, which we believe can generate above-average risk-adjusted returns over time for our shareholders. Our major investment strategy is investing in undervalued stocks. When selecting undervalued equities, we are attracted to fundamentally strong companies with healthy balance sheets, high-quality assets, substantial free cash flow and shareholder-oriented management teams and whose stocks are trading at discounts to our assessment of the companies’ intrinsic or business value. We also look for asset rich companies whose shares may be trading at depressed levels due to concerns over short-term earnings disappointments, litigation, management strategy or other perceived negatives. This strict value approach is not only intended to improve the likelihood of upside potential, but it is also intended to reduce the risk of substantial declines. While the vast majority of our undervalued equity investments are made in publicly traded companies globally, we may invest occasionally in privately held companies as well.
| Top 10 Sectors/Industries | ||
| Based on Equity Securities as of 12/31/14 | ||
| % of Total | ||
| Net Assets | ||
| Media | 8.0 | % |
| Insurance | 6.8 | % |
| Banks | 5.4 | % |
| Tobacco | 5.1 | % |
| Oil, Gas & Consumable Fuels | 5.0 | % |
| Technology Hardware, Storage & Peripherals | 5.0 | % |
| Automobiles | 4.7 | % |
| Diversified Telecommunication Services | 3.0 | % |
| Wireless Telecommunication Services | 2.8 | % |
| Energy Equipment & Services | 2.3 | % |
We complement this more traditional investment strategy with two others. One is distressed investing, a highly specialized field that has proven quite profitable during certain periods over the years. Distressed investing is complex and can take many forms. The most common distressed investment the Fund undertakes is the purchase of financially troubled or bankrupt companies’ debt at a substantial discount to face value. After the financially distressed company is reorganized, often in bankruptcy court, the old debt is typically replaced with new securities issued by the financially stronger company.
The other piece of our investment strategy is participating in arbitrage situations, another highly specialized field. When companies announce proposed mergers or takeovers, commonly referred to as “deals,” the target company may trade at a discount to the bid it ultimately accepts. One form of arbitrage involves purchasing the target company’s stock when it is trading below the value we believe it would receive in a deal. In keeping with our commitment to a relatively conservative investment approach, we typically focus our arbitrage efforts on announced deals, and eschew rumored deals or other situations we consider relatively risky.
In addition, it is our practice to hedge the Fund’s currency exposure when we deem it advantageous for our shareholders.
What is meant by “hedge”?
To hedge an investment is to take a position intended to offset potential losses/gains that may be incurred by a companion financial instrument.
franklintempleton.com
Annual Report
| 5
FRANKLIN MUTUAL QUEST FUND
Manager’s Discussion
Many Fund investments increased in value during the 12-month period. Top contributors to performance included specialty telecommunications company Sorenson Communications, real estate investment trust Spirit Realty Capital and Teva Pharmaceutical Industries.
Sorenson Communications offers videophones, applications and video relay services to the hearing impaired. The Fund’s investment in the company’s debt appreciated during the period. In September, a U.S. Court of Appeals ruled against Sorenson and in favor of the Federal Communications Commission (FCC) regarding the government agency’s 2013 move to lower the reimbursement rate paid to Sorenson. However, the court sided with Sorenson regarding an FCC rule that required improved services without factoring in the additional costs required to comply. In early March, the company filed a prearranged bankruptcy plan seeking to restructure its balance sheet and gain time to negotiate reimbursement rates with the FCC.
Spirit Realty Capital invests in single-tenant, operationally essential real estate leased to companies operating in a variety of industries. In 2014, the company benefited from strong occupancy rates and also managed to increase tenant and geographical diversification through advantageous property acquisitions and disposals. Since the company’s initial public offering in 2012, we believe Spirit Realty has taken positive steps toward developing a high-quality investment portfolio to generate sustainable earnings growth and a reasonably predictable income stream for shareholders. In our view, Spirit Realty continued to provide an attractive dividend yield at period-end that implied a discount relative to its peers. In our assessment, the company’s long-term weighted average lease life provided a positive dynamic for operational results moving into 2015.
The performance of Israel-based Teva Pharmaceutical Industries was largely driven by positive events related to the company’s most profitable drug, Copaxone, used to prevent the relapse of multiple sclerosis. In March, the U.S. Supreme Court agreed to hear Teva’s appeal (with oral arguments occurring in October) to maintain a patent, which further delayed the entrance of generic competition. The delay provided Teva the opportunity to convert more U.S. patients to its new formulation and allowed it to potentially retain a higher portion of the franchise once generic alternatives entered the market. In December, Teva received more good news regarding Copaxone with the new formulation gaining European Union approval.
| Top 10 Equity Holdings | ||
| 12/31/14 | ||
| Company | % of Total | |
| Sector/Industry, Country | Net Assets | |
| Samsung Electronics Co. Ltd., ord. & pfd. | 3.8 | % |
| Technology Hardware, Storage & Peripherals, South Korea | ||
| Vodafone Group PLC | 2.8 | % |
| Wireless Telecommunication Services, U.K. | ||
| General Motors Co., ord & wts. | 2.8 | % |
| Automobiles, U.S. | ||
| Ageas | 2.2 | % |
| Insurance, Belgium | ||
| CIT Group Inc. | 2.1 | % |
| Banks, U.S. | ||
| Koninklijke KPN NV | 1.9 | % |
| Diversified Telecommunication Services, Netherlands | ||
| Royal Dutch Shell PLC, A | 1.9 | % |
| Oil, Gas & Consumable Fuels, U.K. | ||
| White Mountains Insurance Group Ltd. | 1.8 | % |
| Insurance, U.S. | ||
| Spirit Realty Capital Inc. | 1.8 | % |
| Real Estate Investment Trusts (REITs), U.S. | ||
| Imperial Tobacco Group PLC | 1.8 | % |
| Tobacco, U.K. |
Investors also reacted favorably to the January 2014 announcement of a new chief executive officer as the market believed he could successfully carry on Teva’s cost-cutting restructuring program.
During the period under review, some of the Fund’s investments negatively affected performance. These included offshore drilling firms Transocean and Rowan Companies and energy services firm Fugro.
Transocean is a Switzerland-headquartered company providing offshore contract drilling services. The offshore drilling market continued to be mired in a downturn with little clarity regarding the length and depth of the current cycle as oil prices plunged during the second half of 2014. Oil companies pushed back projects, leaving a number of new rigs without contracts and increasing potential downtime between jobs for existing rigs. The growing fleet of uncontracted rigs at period-end portended, in our view, weak second-half results and a challenging start to 2015. On a positive note, the company started a Master Limited Partnership (MLP), Transocean Partners, which went public in September. The MLP may provide Transocean with a way to generate cash by selling (dropping down) assets into Transocean Partners while still controlling the operations of those assets.
6 | Annual Report
franklintempleton.com
FRANKLIN MUTUAL QUEST FUND
The decline in Rowan Companies’ stock was similarly correlated with the falling price of crude oil as precipitous price declines created significant headwinds, particularly in the second half of the year. Lower oil prices have made clients less willing to contract rigs, placing pressure on utilization and day rates commanded by service providers such as Rowan.
Netherlands-based Fugro provides subsea geotechnical and survey solutions. In July, Fugro shares dropped in reaction to a profit warning resulting from weaker capital spending in the oil and gas market. The stock came under further pressure during the second half of the year amid the sharp decline in energy prices. In late October, the company said that third-quarter results would fall significantly short of expectations and announced in November that its board chairman would step down. At year-end, we no longer held Fugro shares.
During the period, the Fund held currency forwards and futures to hedge a portion of the currency risk of the portfolio’s non-U.S. dollar investments. The hedges had a positive impact on the Fund’s performance.
What is a currency forward contract?
A currency forward contract, or a currency forward, is an agreement between the Fund and a counterparty to buy or sell a foreign currency at a specific exchange rate on a future date.
What is a futures contract?
A futures contract, or a future, is an agreement between the Fund and a counterparty made through a U.S. or foreign futures exchange to buy or sell an asset at a specific price on a future date.
As fellow shareholders, we found recent relative performance disappointing, but it is not uncommon for our strategy to lag amid a strong equity market. We remain committed to our disciplined, value investment approach as we seek to generate attractive, long-term, risk-adjusted returns for shareholders.
CFA® is a trademark owned by CFA Institute.
Thank you for your continued participation in Franklin Mutual Quest Fund. We look forward to continuing to serve your investment needs.

The foregoing information reflects our analysis, opinions and portfolio holdings as of December 31, 2014, the end of the reporting period. The way we implement our main investment strategies and the resulting portfolio holdings may change depending on factors such as market and economic conditions. These opinions may not be relied upon as investment advice or an offer for a particular security. The information is not a complete analysis of every aspect of any market, country, industry, security or the Fund. Statements of fact are from sources considered reliable, but the investment manager makes no representation or warranty as to their completeness or accuracy. Although historical performance is no guarantee of future results, these insights may help you understand our investment management philosophy.
franklintempleton.com
Annual Report
| 7
FRANKLIN MUTUAL QUEST FUND
Shawn Tumulty has been a portfolio manager for Franklin Mutual Quest Fund (formerly, Mutual Quest Fund) since 2003 and a co-portfolio manager since 2010. He joined Franklin Templeton Investments in 2000. Prior to joining Franklin Templeton Investments, Mr. Tumulty was an analyst and portfolio manager at Hamilton Partners Limited.
CFA® is a trademark owned by CFA Institute.
Keith Luh has been a co-portfolio manager for Franklin Mutual Quest Fund (formerly, Mutual Quest Fund) since 2010. He is also a research analyst specializing in distressed securities, merger and capital structure arbitrage, and event-driven situations. Prior to joining Mutual Series in 2005, Mr. Luh was an analyst in global investment research at Putnam Investments, where he also helped manage a best-ideas research fund. Previously, he worked in the investment banking group at Volpe Brown Whelan and Co., LLC, and the derivative products trading group at BNP. Mr. Luh is also Adjunct Professor in Finance and Economics at the Graduate School of Business, Columbia University and the Gabelli School of Business, Fordham University.
8 | Annual Report
franklintempleton.com
FRANKLIN MUTUAL QUEST FUND
Performance Summary as of December 31, 2014
Your dividend income will vary depending on dividends or interest paid by securities in the Fund’s portfolio, adjusted for operating expenses of each class. Capital gain distributions are net profits realized from the sale of portfolio securities. The performance table and graphs do not reflect any taxes that a shareholder would pay on Fund dividends, capital gain distributions, if any, or any realized gains on the sale of Fund shares. Total return reflects reinvestment of the Fund’s dividends and capital gain distributions, if any, and any unrealized gains or losses.
| Net Asset Value | ||||||||
| Share Class (Symbol) | 12/31/14 | 12/31/13 | Change | |||||
| Z (MQIFX) | $ | 16.21 | $ | 18.18 | -$ | 1.97 | ||
| A (TEQIX) | $ | 16.02 | $ | 18.00 | -$ | 1.98 | ||
| C (TEMQX) | $ | 15.78 | $ | 17.76 | -$ | 1.98 | ||
| R (n/a) | $ | 15.87 | $ | 17.84 | -$ | 1.97 | ||
| R6 (FMQRX) | $ | 16.19 | $ | 18.19 | -$ | 2.00 | ||
| Distributions (1/1/14–12/31/14) | ||||||||
| Dividend | Short-Term | Long-Term | ||||||
| Income | Capital Gain | Capital Gain | Total | |||||
| Z | $ | 0.8532 | $ | 0.6080 | $ | 1.1300 | $ | 2.5912 |
| A | $ | 0.7978 | $ | 0.6080 | $ | 1.1300 | $ | 2.5358 |
| C | $ | 0.6685 | $ | 0.6080 | $ | 1.1300 | $ | 2.4065 |
| R | $ | 0.7535 | $ | 0.6080 | $ | 1.1300 | $ | 2.4915 |
| R6 | $ | 0.8672 | $ | 0.6080 | $ | 1.1300 | $ | 2.6052 |
franklintempleton.com
Annual Report
| 9
FRANKLIN MUTUAL QUEST FUND
PERFORMANCE SUMMARY
Performance as of 12/31/14
Cumulative total return excludes sales charges. Average annual total return and value of $10,000 investment include maximum sales charges. Class Z/R/R6: no sales charges; Class A: 5.75% maximum initial sales charge; Class C: 1% contingent deferred sales charge in first year only.
| Cumulative | Average Annual | Value of $10,000 | Total Annual Operating Expenses4 | |||||||||
| Share Class | Total Return1 | Total Return2 | Investment3 | (with waiver) | (without waiver) | |||||||
| Z | N/A | 0.84 | % | |||||||||
| 1-Year | + | 3.44 | % | + | 3.44 | % | $ | 10,344 | ||||
| 5-Year | + | 58.62 | % | + | 9.67 | % | $ | 15,862 | ||||
| 10-Year | + | 106.86 | % | + | 7.54 | % | $ | 20,686 | ||||
| A | N/A | 1.14 | % | |||||||||
| 1-Year | + | 3.11 | % | -2.83 | % | $ | 9,717 | |||||
| 5-Year | + | 56.29 | % | + | 8.06 | % | $ | 14,734 | ||||
| 10-Year | + | 100.49 | % | + | 6.57 | % | $ | 18,900 | ||||
| C | N/A | 1.84 | % | |||||||||
| 1-Year | + | 2.42 | % | + | 1.53 | % | $ | 10,153 | ||||
| 5-Year | + | 50.90 | % | + | 8.58 | % | $ | 15,090 | ||||
| 10-Year | + | 87.15 | % | + | 6.47 | % | $ | 18,715 | ||||
| R | N/A | 1.34 | % | |||||||||
| 1-Year | + | 2.94 | % | + | 2.94 | % | $ | 10,294 | ||||
| 5-Year | + | 54.79 | % | + | 9.13 | % | $ | 15,479 | ||||
| Since Inception (5/1/09) | + | 84.03 | % | + | 11.36 | % | $ | 18,403 | ||||
| R65 | 0.77 | % | 2.00 | % | ||||||||
| 1-Year | + | 3.53 | % | + | 3.53 | % | $ | 10,353 | ||||
| Since Inception (5/1/13) | + | 18.88 | % | + | 10.92 | % | $ | 11,888 | ||||
Performance data represent past performance, which does not guarantee future results. Investment return and principal value will fluctuate, and you may have a gain or loss when you sell your shares. Current performance may differ from figures shown. For most recent month-end performance, go to franklintempleton.com or call (800) 342-5236.
10 | Annual Report
franklintempleton.com
FRANKLIN MUTUAL QUEST FUND
PERFORMANCE SUMMARY
Total Return Index Comparison for a Hypothetical $10,000 Investment
Total return represents the change in value of an investment over the periods shown. It includes any applicable maximum sales charge, Fund expenses, account fees and reinvested distributions. The unmanaged index includes reinvestment of any income or distributions. It differs from the Fund in composition and does not pay management fees or expenses. One cannot invest directly in an index.
franklintempleton.com
Annual Report
| 11
FRANKLIN MUTUAL QUEST FUND
PERFORMANCE SUMMARY
Total Return Index Comparison for a Hypothetical $10,000 Investment (continued)

12 | Annual Report
franklintempleton.com
FRANKLIN MUTUAL QUEST FUND
PERFORMANCE SUMMARY
Total Return Index Comparison for a Hypothetical $10,000 Investment (continued)
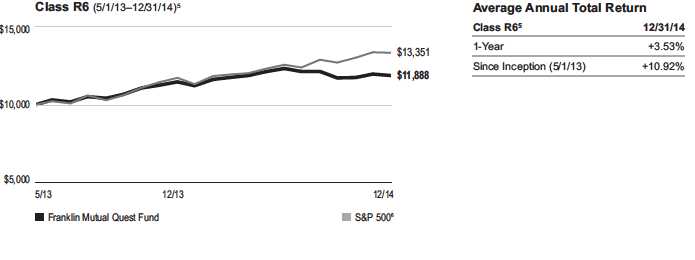
All investments involve risks, including possible loss of principal. Value securities may not increase in price as anticipated or may decline further in value. The Fund’s investments in smaller company stocks and foreign securities involve special risks. Smaller company stocks have exhibited greater price volatility than larger company stocks, particularly over the short term. Foreign securities risks include currency fluctuations, and economic and political uncertainties. The Fund may also invest in companies engaged in mergers, reorganizations or liquidations, which involve special risks as pending deals may not be completed on time or on favorable terms, as well as lower rated bonds, which entail higher credit risk. The Fund is actively managed but there is no guarantee that the manager’s investment decisions will produce the desired results. The Fund’s prospectus also includes a description of the main investment risks.
| Class Z: | Shares are available to certain eligible investors as described in the prospectus. |
| Class C: | These shares have higher annual fees and expenses than Class A shares. |
| Class R: | Shares available to certain eligible investors as described in the prospectus. These shares have higher annual fees and expenses than Class A shares. |
| Class R6: | Shares are available to certain eligible investors as described in the prospectus. |
1. Cumulative total return represents the change in value of an investment over the periods indicated.
2. Average annual total return represents the average annual change in value of an investment over the periods indicated.
3. These figures represent the value of a hypothetical $10,000 investment in the Fund over the periods indicated.
4. Figures are as stated in the Fund’s current prospectus. In periods of market volatility, assets may decline significantly, causing total annual Fund operating expenses to
become higher than the figures shown.
5. Class R6 has a fee waiver contractually guaranteed through at least 4/30/15. Investment results reflect the fee waiver, to the extent applicable; without this reduction, the
results would have been lower.
6. Source: Morningstar. The S&P 500 is a market capitalization-weighted index of 500 stocks designed to measure total U.S. equity market performance.
See www.franklintempletondatasources.com for additional data provider information.
franklintempleton.com
Annual Report
| 13
FRANKLIN MUTUAL QUEST FUND
Your Fund’s Expenses
As a Fund shareholder, you can incur two types of costs:
- Transaction costs, including sales charges (loads) on Fund purchases; and
- Ongoing Fund costs, including management fees, distribu- tion and service (12b-1) fees, and other Fund expenses. All mutual funds have ongoing costs, sometimes referred to as operating expenses.
The following table shows ongoing costs of investing in the Fund and can help you understand these costs and compare them with those of other mutual funds. The table assumes a $1,000 investment held for the six months indicated.
Actual Fund Expenses
The first line (Actual) for each share class listed in the table provides actual account values and expenses. The “Ending Account Value” is derived from the Fund’s actual return, which includes the effect of Fund expenses.
You can estimate the expenses you paid during the period by following these steps. Of course, your account value and expenses will differ from those in this illustration:
| 1. | Divide your account value by $1,000. |
| If an account had an $8,600 value, then $8,600 ÷ $1,000 = 8.6. | |
| 2. | Multiply the result by the number under the heading “Expenses Paid During Period.” |
| If Expenses Paid During Period were $7.50, then 8.6 x $7.50 = $64.50. |
In this illustration, the estimated expenses paid this period are $64.50.
Hypothetical Example for Comparison with Other Funds
Information in the second line (Hypothetical) for each class in the table can help you compare ongoing costs of investing in the Fund with those of other mutual funds. This information may not be used to estimate the actual ending account balance or expenses you paid during the period. The hypothetical “Ending Account Value” is based on the actual expense ratio for each class and an assumed 5% annual rate of return before expenses, which does not represent the Fund’s actual return. The figure under the heading “Expenses Paid During Period” shows the hypothetical expenses your account would have incurred under this scenario. You can compare this figure with the 5% hypothetical examples that appear in shareholder reports of other funds.
Please note that expenses shown in the table are meant to highlight ongoing costs and do not reflect any transaction costs, such as sales charges. Therefore, the second line for each class is useful in comparing ongoing costs only, and will not help you compare total costs of owning different funds. In addition, if transaction costs were included, your total costs would have been higher. Please refer to the Fund prospectus for additional information on operating expenses.
14 | Annual Report
franklintempleton.com
FRANKLIN MUTUAL QUEST FUND
YOUR FUND’S EXPENSES
| Beginning Account | Ending Account | Expenses Paid During | ||||
| Share Class | Value 7/1/14 | Value 12/31/14 | Period* 7/1/14–12/31/14 | |||
| Z | ||||||
| Actual | $ | 1,000 | $ | 962.90 | $ | 4.01 |
| Hypothetical (5% return before expenses) | $ | 1,000 | $ | 1,021.12 | $ | 4.13 |
| A | ||||||
| Actual | $ | 1,000 | $ | 961.10 | $ | 5.49 |
| Hypothetical (5% return before expenses) | $ | 1,000 | $ | 1,019.61 | $ | 5.65 |
| C | ||||||
| Actual | $ | 1,000 | $ | 957.90 | $ | 8.93 |
| Hypothetical (5% return before expenses) | $ | 1,000 | $ | 1,016.08 | $ | 9.20 |
| R | ||||||
| Actual | $ | 1,000 | $ | 960.50 | $ | 6.47 |
| Hypothetical (5% return before expenses) | $ | 1,000 | $ | 1,018.60 | $ | 6.67 |
| R6 | ||||||
| Actual | $ | 1,000 | $ | 963.20 | $ | 3.66 |
| Hypothetical (5% return before expenses) | $ | 1,000 | $ | 1,021.48 | $ | 3.77 |
*Expenses are calculated using the most recent six-month expense ratio, annualized for each class (Z: 0.81%; A: 1.11%; C: 1.81%; R: 1.31%; and R6: 0.74%), multiplied by the average account value over the period, multiplied by 184/365 to reflect the one-half year period.
franklintempleton.com
Annual Report
| 15
FRANKLIN MUTUAL QUEST FUND
| Financial Highlights | |||||||||||||||
| Year Ended December 31, | |||||||||||||||
| 2014 | 2013 | 2012 | 2011 | 2010 | |||||||||||
| Class Z | |||||||||||||||
| Per share operating performance | |||||||||||||||
| (for a share outstanding throughout the year) | |||||||||||||||
| Net asset value, beginning of year | $ | 18.18 | $ | 16.55 | $ | 16.24 | $ | 17.70 | $ | 17.24 | |||||
| Income from investment operationsa: | |||||||||||||||
| Net investment incomeb | 0.78 | c | 0.54 | 0.43 | 0.51 | 0.41 | d | ||||||||
| Net realized and unrealized gains (losses) | (0.16 | ) | 3.68 | 1.61 | (0.88 | ) | 1.34 | ||||||||
| Total from investment operations | 0.62 | 4.22 | 2.04 | (0.37 | ) | 1.75 | |||||||||
| Less distributions from: | |||||||||||||||
| Net investment income | (0.85 | ) | (0.56 | ) | (0.43 | ) | (0.52 | ) | (0.45 | ) | |||||
| Net realized gains | (1.74 | ) | (2.03 | ) | (1.30 | ) | (0.57 | ) | (0.84 | ) | |||||
| Total distributions | (2.59 | ) | (2.59 | ) | (1.73 | ) | (1.09 | ) | (1.29 | ) | |||||
| Net asset value, end of year | $ | 16.21 | $ | 18.18 | $ | 16.55 | $ | 16.24 | $ | 17.70 | |||||
| Total return | 3.44 | % | 25.97 | % | 12.57 | % | (1.83 | )% | 10.16 | % | |||||
| Ratios to average net assets | |||||||||||||||
| Expensese | 0.81 | %f | 0.84 | %f | 0.90 | % | 0.86 | % | 0.83 | % | |||||
| Expenses incurred in connection with securities sold short | 0.04 | % | 0.07 | % | 0.11 | % | 0.06 | % | 0.02 | % | |||||
| Net investment income | 4.18 | %c | 2.93 | % | 2.48 | % | 2.90 | % | 2.33 | %d | |||||
| Supplemental data | |||||||||||||||
| Net assets, end of year (000’s) | $ | 4,116,651 | $ | 4,270,828 | $ | 3,582,856 | $ | 3,413,759 | $ | 3,701,894 | |||||
| Portfolio turnover rate | 65.77 | % | 63.41 | % | 65.21 | % | 107.25 | % | 49.13 | % | |||||
aThe amount shown for a share outstanding throughout the period may not correlate with the Statement of Operations for the period due to the timing of sales and
repurchases of the Fund shares in relation to income earned and/or fluctuating fair value of the investments of the Fund.
bBased on average daily shares outstanding.
cNet investment income per share includes approximately $0.27 per share received in the form of a special dividend paid in connection with certain Fund’s holdings.
Excluding this amount, the ratio of net investment income to average net assets would have been 2.73%.
dNet investment income per share includes approximately $0.06 per share received in the form of a special dividend paid in connection with a corporate real estate
investment trust (REIT) conversion. Excluding this non-recurring amount, the ratio of net investment income to average net assets would have been 1.97%.
eIncludes dividend and interest expense on securities sold short and security borrowing fees, if any. See below for the ratios of such expenses to average net assets for the
periods presented. See Note 1(f).
fBenefit of expense reduction rounds to less than 0.01%.
16 | Annual Report | The accompanying notes are an integral part of these financial statements.
franklintempleton.com
| FRANKLIN MUTUAL QUEST FUND | |||||||||||||||
| FINANCIAL HIGHLIGHTS | |||||||||||||||
| Year Ended December 31, | |||||||||||||||
| 2014 | 2013 | 2012 | 2011 | 2010 | |||||||||||
| Class A | |||||||||||||||
| Per share operating performance | |||||||||||||||
| (for a share outstanding throughout the year) | |||||||||||||||
| Net asset value, beginning of year | $ | 18.00 | $ | 16.41 | $ | 16.12 | $ | 17.57 | $ | 17.12 | |||||
| Income from investment operationsa: | |||||||||||||||
| Net investment incomeb | 0.71 | c | 0.48 | 0.37 | 0.45 | 0.35 | d | ||||||||
| Net realized and unrealized gains (losses) | (0.15 | ) | 3.65 | 1.60 | (0.86 | ) | 1.34 | ||||||||
| Total from investment operations | 0.56 | 4.13 | 1.97 | (0.41 | ) | 1.69 | |||||||||
| Less distributions from: | |||||||||||||||
| Net investment income | (0.80 | ) | (0.51 | ) | (0.38 | ) | (0.47 | ) | (0.40 | ) | |||||
| Net realized gains | (1.74 | ) | (2.03 | ) | (1.30 | ) | (0.57 | ) | (0.84 | ) | |||||
| Total distributions | (2.54 | ) | (2.54 | ) | (1.68 | ) | (1.04 | ) | (1.24 | ) | |||||
| Net asset value, end of year | $ | 16.02 | $ | 18.00 | $ | 16.41 | $ | 16.12 | $ | 17.57 | |||||
| Total returne | 3.11 | % | 25.61 | % | 12.21 | % | (2.10 | )% | 9.86 | % | |||||
| Ratios to average net assets | |||||||||||||||
| Expensesf | 1.11 | %g | 1.14 | %g | 1.20 | % | 1.16 | % | 1.13 | % | |||||
| Expenses incurred in connection with securities sold short | 0.04 | % | 0.07 | % | 0.11 | % | 0.06 | % | 0.02 | % | |||||
| Net investment income | 3.88 | %c | 2.63 | % | 2.18 | % | 2.60 | % | 2.03 | %d | |||||
| Supplemental data | |||||||||||||||
| Net assets, end of year (000’s) | $ | 1,394,138 | $ | 1,371,789 | $ | 1,101,808 | $ | 1,093,539 | $ | 1,194,746 | |||||
| Portfolio turnover rate | 65.77 | % | 63.41 | % | 65.21 | % | 107.25 | % | 49.13 | % | |||||
aThe amount shown for a share outstanding throughout the period may not correlate with the Statement of Operations for the period due to the timing of sales and
repurchases of the Fund shares in relation to income earned and/or fluctuating fair value of the investments of the Fund.
bBased on average daily shares outstanding.
cNet investment income per share includes approximately $0.27 per share received in the form of a special dividend paid in connection with certain Fund’s holdings.
Excluding this amount, the ratio of net investment income to average net assets would have been 2.43%.
dNet investment income per share includes approximately $0.06 per share received in the form of a special dividend paid in connection with a corporate REIT conversion.
Excluding this non-recurring amount, the ratio of net investment income to average net assets would have been 1.67%.
eTotal return does not reflect sales commissions or contingent deferred sales charges, if applicable.
fIncludes dividend and interest expense on securities sold short and security borrowing fees, if any. See below for the ratios of such expenses to average net assets for the
periods presented. See Note 1(f).
gBenefit of expense reduction rounds to less than 0.01%.
franklintempleton.com
The accompanying notes are an integral part of these financial statements. | Annual Report | 17
FRANKLIN MUTUAL QUEST FUND
FINANCIAL HIGHLIGHTS
| Year Ended December 31, | |||||||||||||||
| 2014 | 2013 | 2012 | 2011 | 2010 | |||||||||||
| Class C | |||||||||||||||
| Per share operating performance | |||||||||||||||
| (for a share outstanding throughout the year) | |||||||||||||||
| Net asset value, beginning of year | $ | 17.76 | $ | 16.24 | $ | 15.96 | $ | 17.39 | $ | 16.97 | |||||
| Income from investment operationsa: | |||||||||||||||
| Net investment incomeb | 0.57 | c | 0.35 | 0.25 | 0.33 | 0.23 | d | ||||||||
| Net realized and unrealized gains (losses) | (0.14 | ) | 3.59 | 1.59 | (0.85 | ) | 1.30 | ||||||||
| Total from investment operations | 0.43 | 3.94 | 1.84 | (0.52 | ) | 1.53 | |||||||||
| Less distributions from: | |||||||||||||||
| Net investment income | (0.67 | ) | (0.39 | ) | (0.26 | ) | (0.34 | ) | (0.27 | ) | |||||
| Net realized gains | (1.74 | ) | (2.03 | ) | (1.30 | ) | (0.57 | ) | (0.84 | ) | |||||
| Total distributions | (2.41 | ) | (2.42 | ) | (1.56 | ) | (0.91 | ) | (1.11 | ) | |||||
| Net asset value, end of year | $ | 15.78 | $ | 17.76 | $ | 16.24 | $ | 15.96 | $ | 17.39 | |||||
| Total returne | 2.42 | % | 24.74 | % | 11.42 | % | (2.82 | )% | 9.08 | % | |||||
| Ratios to average net assets | |||||||||||||||
| Expensesf | 1.81 | %g | 1.84 | %g | 1.90 | % | 1.86 | % | 1.83 | % | |||||
| Expenses incurred in connection with securities sold short | 0.04 | % | 0.07 | % | 0.11 | % | 0.06 | % | 0.02 | % | |||||
| Net investment income | 3.18 | %c | 1.93 | % | 1.48 | % | 1.90 | % | 1.33 | %d | |||||
| Supplemental data | |||||||||||||||
| Net assets, end of year (000’s) | $ | 397,963 | $ | 406,304 | $ | 333,908 | $ | 338,983 | $ | 392,134 | |||||
| Portfolio turnover rate | 65.77 | % | 63.41 | % | 65.21 | % | 107.25 | % | 49.13 | % | |||||
aThe amount shown for a share outstanding throughout the period may not correlate with the Statement of Operations for the period due to the timing of sales and
repurchases of the Fund shares in relation to income earned and/or fluctuating fair value of the investments of the Fund.
bBased on average daily shares outstanding.
cNet investment income per share includes approximately $0.27 per share received in the form of a special dividend paid in connection with certain Fund’s holdings.
Excluding this amount, the ratio of net investment income to average net assets would have been 1.73%.
dNet investment income per share includes approximately $0.06 per share received in the form of a special dividend paid in connection with a corporate REIT conversion.
Excluding this non-recurring amount, the ratio of net investment income to average net assets would have been 0.97%.
eTotal return does not reflect sales commissions or contingent deferred sales charges, if applicable.
fIncludes dividend and interest expense on securities sold short and security borrowing fees, if any. See below for the ratios of such expenses to average net assets for the
periods presented. See Note 1(f).
gBenefit of expense reduction rounds to less than 0.01%.
18 | Annual Report | The accompanying notes are an integral part of these financial statements.
franklintempleton.com
| FRANKLIN MUTUAL QUEST FUND | |||||||||||||||
| FINANCIAL HIGHLIGHTS | |||||||||||||||
| Year Ended December 31, | |||||||||||||||
| 2014 | 2013 | 2012 | 2011 | 2010 | |||||||||||
| Class R | |||||||||||||||
| Per share operating performance | |||||||||||||||
| (for a share outstanding throughout the year) | |||||||||||||||
| Net asset value, beginning of year | $ | 17.84 | $ | 16.33 | $ | 16.05 | $ | 17.50 | $ | 17.07 | |||||
| Income from investment operationsa: | |||||||||||||||
| Net investment incomeb | 0.65 | c | 0.50 | 0.33 | 0.41 | 0.32 | d | ||||||||
| Net realized and unrealized gains (losses) | (0.13 | ) | 3.56 | 1.60 | (0.85 | ) | 1.33 | ||||||||
| Total from investment operations | 0.52 | 4.06 | 1.93 | (0.44 | ) | 1.65 | |||||||||
| Less distributions from: | |||||||||||||||
| Net investment income | (0.75 | ) | (0.52 | ) | (0.35 | ) | (0.44 | ) | (0.38 | ) | |||||
| Net realized gains | (1.74 | ) | (2.03 | ) | (1.30 | ) | (0.57 | ) | (0.84 | ) | |||||
| Total distributions | (2.49 | ) | (2.55 | ) | (1.65 | ) | (1.01 | ) | (1.22 | ) | |||||
| Net asset value, end of year | $ | 15.87 | $ | 17.84 | $ | 16.33 | $ | 16.05 | $ | 17.50 | |||||
| Total return | 2.94 | % | 25.34 | % | 11.99 | % | (2.31 | )% | 9.65 | % | |||||
| Ratios to average net assets | |||||||||||||||
| Expensese | 1.31 | %f | 1.34 | %f | 1.40 | % | 1.36 | % | 1.33 | % | |||||
| Expenses incurred in connection with securities sold short | 0.04 | % | 0.07 | % | 0.11 | % | 0.06 | % | 0.02 | % | |||||
| Net investment income | 3.68 | %c | 2.43 | % | 1.98 | % | 2.40 | % | 1.83 | % | |||||
| Supplemental data | |||||||||||||||
| Net assets, end of year (000’s) | $ | 675 | $ | 853 | $ | 212 | $ | 193 | $ | 204 | |||||
| Portfolio turnover rate | 65.77 | % | 63.41 | % | 65.21 | % | 107.25 | % | 49.13 | % | |||||
aThe amount shown for a share outstanding throughout the period may not correlate with the Statement of Operations for the period due to the timing of sales and
repurchases of the Fund shares in relation to income earned and/or fluctuating fair value of the investments of the Fund.
bBased on average daily shares outstanding.
cNet investment income per share includes approximately $0.27 per share received in the form of a special dividend paid in connection with certain Fund’s holdings.
Excluding this amount, the ratio of net investment income to average net assets would have been 2.23%.
dNet investment income per share includes approximately $0.06 per share received in the form of a special dividend paid in connection with a corporate REIT conversion.
Excluding this non-recurring amount, the ratio of net investment income to average net assets would have been 1.47%.
eIncludes dividend and interest expense on securities sold short and security borrowing fees, if any. See below for the ratios of such expenses to average net assets for the
periods presented. See Note 1(f).
fBenefit of expense reduction rounds to less than 0.01%.
franklintempleton.com
The accompanying notes are an integral part of these financial statements. | Annual Report | 19
FRANKLIN MUTUAL QUEST FUND
FINANCIAL HIGHLIGHTS
| Year Ended December 31, | ||||||
| 2014 | 2013 | a | ||||
| Class R6 | ||||||
| Per share operating performance | ||||||
| (for a share outstanding throughout the year) | ||||||
| Net asset value, beginning of year | $ | 18.19 | $ | 18.16 | ||
| Income from investment operationsb: | ||||||
| Net investment incomec | 0.51 | d | 0.36 | |||
| Net realized and unrealized gains (losses) | 0.10 | 2.28 | ||||
| Total from investment operations | 0.61 | 2.64 | ||||
| Less distributions from: | ||||||
| Net investment income | (0.87 | ) | (0.58 | ) | ||
| Net realized gains | (1.74 | ) | (2.03 | ) | ||
| Total distributions | (2.61 | ) | (2.61 | ) | ||
| Net asset value, end of year | $ | 16.19 | $ | 18.19 | ||
| Total returne | 3.53 | % | 14.83 | % | ||
| Ratios to average net assetsf | ||||||
| Expenses before waiver, payments by affiliates and expense reductiong | 0.74 | % | 2.00 | % | ||
| Expenses net of waiver, payments by affiliates and expense reductiong,h | 0.74 | % | 0.77 | % | ||
| Expenses incurred in connection with securities sold short | 0.04 | % | 0.07 | % | ||
| Net investment income | 4.25 | %d | 3.00 | % | ||
| Supplemental data | ||||||
| Net assets, end of year (000’s) | $ | 44,340 | $ | 5 | ||
| Portfolio turnover rate | 65.77 | % | 63.41 | % | ||
aFor the period May 1, 2013 (effective date) to December 31, 2013.
bThe amount shown for a share outstanding throughout the period may not correlate with the Statement of Operations for the period due to the timing of sales and
repurchases of the Fund shares in relation to income earned and/or fluctuating fair value of the investments of the Fund.
cBased on average daily shares outstanding.
dNet investment income per share includes approximately $0.27 per share received in the form of a special dividend paid in connection certain Fund’s holdings. Excluding
this amount, the ratio of net investment income to average net assets would have been 2.80%.
eTotal return is not annualized for periods less than one year.
fRatios are annualized for periods less than one year.
gIncludes dividend and interest expense on securities sold short and security borrowing fees, if any. See below for the ratios of such expenses to average net assets for the
periods presented. See Note 1(f).
hBenefit of expense reduction rounds to less than 0.01%.
20 | Annual Report | The accompanying notes are an integral part of these financial statements.
franklintempleton.com
| FRANKLIN MUTUAL QUEST FUND | ||||
| Statement of Investments, December 31, 2014 | ||||
| Shares/ | ||||
| Country | Warrants | Value | ||
| Common Stocks and Other Equity Interests 59.8% | ||||
| Aerospace & Defense 1.0% | ||||
| aB/E Aerospace Inc. | United States | 742,990 | $ | 43,108,280 |
| aKLX Inc. | United States | 371,495 | 15,324,169 | |
| 58,432,449 | ||||
| Auto Components 0.2% | ||||
| a,bInternational Automotive Components Group Brazil LLC | Brazil | 2,363,058 | 223,498 | |
| a,b,cInternational Automotive Components Group North America LLC | United States | 18,661,349 | 14,130,000 | |
| 14,353,498 | ||||
| Automobiles 2.8% | ||||
| General Motors Co. | United States | 2,446,828 | 85,418,765 | |
| aGeneral Motors Co., wts., 7/10/16 | United States | 1,895,215 | 47,873,131 | |
| aGeneral Motors Co., wts., 7/10/19 | United States | 1,894,460 | 32,452,100 | |
| 165,743,996 | ||||
| Banks 5.4% | ||||
| Barclays PLC | United Kingdom | 11,430,800 | 43,384,851 | |
| BB&T Corp. | United States | 434,627 | 16,902,644 | |
| BNP Paribas SA | France | 530,700 | 31,632,161 | |
| CIT Group Inc. | United States | 2,645,447 | 126,531,730 | |
| Citizens Financial Group Inc. | United States | 715,790 | 17,794,539 | |
| Guaranty Bancorp | United States | 347,127 | 5,012,514 | |
| SunTrust Banks Inc. | United States | 1,333,217 | 55,861,792 | |
| Wells Fargo & Co. | United States | 436,834 | 23,947,240 | |
| 321,067,471 | ||||
| Capital Markets 0.6% | ||||
| Credit Suisse Group AG | Switzerland | 1,420,340 | 35,829,941 | |
| Chemicals 0.5% | ||||
| Arkema | France | 484,140 | 32,260,523 | |
| a,d,eDow Corning Corp., Contingent Distribution | United States | 12,089,194 | — | |
| 32,260,523 | ||||
| Communications Equipment 0.5% | ||||
| a,c,eSorenson Communications Inc., Membership Interests | United States | 222,771 | 27,846,362 | |
| Consumer Finance 1.7% | ||||
| aAlly Financial Inc. | United States | 4,443,462 | 104,954,572 | |
| Diversified Consumer Services 0.1% | ||||
| Cengage Learning Holdings II LP | United States | 310,021 | 6,975,472 | |
| Diversified Financial Services 0.4% | ||||
| Capmark Financial Group Inc. | United States | 4,885,536 | 23,450,573 | |
| Diversified Telecommunication Services 3.1% | ||||
| a,d,eGlobal Crossing Holdings Ltd., Contingent Distribution | United States | 49,411,586 | — | |
| Koninklijke KPN NV | Netherlands | 36,143,160 | 114,930,909 | |
| TDC AS | Denmark | 9,107,906 | 69,890,071 | |
| 184,820,980 | ||||
| Energy Equipment & Services 2.3% | ||||
| Rowan Cos. PLC | United States | 2,745,900 | 64,034,388 | |
| fTransocean Ltd. | United States | 3,938,158 | 72,186,436 | |
| 136,220,824 | ||||
| franklintempleton.com | Annual Report | 21 | |||
FRANKLIN MUTUAL QUEST FUND
STATEMENT OF INVESTMENTS
| Shares/ | ||||
| Country | Warrants | Value | ||
| Common Stocks and Other Equity Interests (continued) | ||||
| Health Care Equipment & Supplies 1.0% | ||||
| Covidien PLC | United States | 228,920 | $ | 23,413,938 |
| Medtronic Inc. | United States | 501,486 | 36,207,289 | |
| 59,621,227 | ||||
| Hotels, Restaurants & Leisure 1.3% | ||||
| aCaesars Acquisition Co., A | United States | 1,415,748 | 14,596,362 | |
| aCaesars Entertainment Corp. | United States | 1,817,320 | 28,513,751 | |
| aPinnacle Entertainment Inc. | United States | 1,630,260 | 36,273,285 | |
| 79,383,398 | ||||
| Independent Power & Renewable Electricity Producers 1.4% | ||||
| NRG Energy Inc. | United States | 3,125,324 | 84,227,482 | |
| Insurance 6.8% | ||||
| Ageas | Belgium | 3,724,110 | 132,954,634 | |
| The Allstate Corp. | United States | 518,412 | 36,418,443 | |
| American International Group Inc. | United States | 397,446 | 22,260,951 | |
| a,bOlympus Re Holdings Ltd. | United States | 97,300 | — | |
| aRSA Insurance Group PLC | United Kingdom | 15,458,075 | 104,811,077 | |
| White Mountains Insurance Group Ltd. | United States | 171,770 | 108,233,995 | |
| 404,679,100 | ||||
| Media 8.0% | ||||
| CBS Corp., B | United States | 1,731,650 | 95,829,511 | |
| Comcast Corp., Special A | United States | 763,114 | 43,928,657 | |
| aDIRECTV | United States | 279,960 | 24,272,532 | |
| a,bLee Enterprises Inc., wts., 12/31/22 | United States | 1,110,000 | 1,831,500 | |
| gNew Media Investment Group Inc. | United States | 2,470,007 | 58,366,265 | |
| RTL Group SA | Germany | 989,712 | 94,750,274 | |
| Time Warner Cable Inc. | United States | 127,770 | 19,428,706 | |
| aTribune Media Co., A | United States | 973,372 | 58,178,445 | |
| aTribune Media Co., B | United States | 706,604 | 42,233,721 | |
| Tribune Publishing Co. | United States | 464,761 | 10,643,027 | |
| Twenty-First Century Fox Inc., B | United States | 679,900 | 25,081,511 | |
| 474,544,149 | ||||
| Metals & Mining 0.6% | ||||
| Freeport-McMoRan Inc., B | United States | 938,287 | 21,918,384 | |
| aThyssenKrupp AG | Germany | 472,089 | 12,144,301 | |
| 34,062,685 | ||||
| Oil, Gas & Consumable Fuels 5.0% | ||||
| Apache Corp. | United States | 878,720 | 55,069,382 | |
| BP PLC | United Kingdom | 8,662,707 | 55,495,525 | |
| China Shenhua Energy Co. Ltd., H | China | 8,513,995 | 25,144,666 | |
| Royal Dutch Shell PLC, A | United Kingdom | 3,339,251 | 111,760,054 | |
| Talisman Energy Inc. (USD Traded) | Canada | 6,390,070 | 50,034,248 | |
| 297,503,875 | ||||
| Personal Products 0.4% | ||||
| Avon Products Inc. | United States | 2,375,997 | 22,310,612 | |
| Pharmaceuticals 0.9% | ||||
| Teva Pharmaceutical Industries Ltd., ADR | Israel | 938,226 | 53,957,377 |
22 | Annual Report
franklintempleton.com
FRANKLIN MUTUAL QUEST FUND
STATEMENT OF INVESTMENTS
| Shares/ | ||||
| Country | Warrants | Value | ||
| Common Stocks and Other Equity Interests (continued) | ||||
| Real Estate Investment Trusts (REITs) 1.8% | ||||
| Spirit Realty Capital Inc. | United States | 9,080,361 | $ | 107,965,492 |
| Real Estate Management & Development 1.2% | ||||
| eCanary Wharf Group PLC | United Kingdom | 8,298,072 | 69,961,758 | |
| Semiconductors & Semiconductor Equipment 0.7% | ||||
| Tokyo Electron Ltd., ADR | Japan | 2,273,000 | 43,368,840 | |
| Software 1.2% | ||||
| Microsoft Corp. | United States | 145,781 | 6,771,527 | |
| Symantec Corp. | United States | 2,478,926 | 63,596,847 | |
| 70,368,374 | ||||
| Technology Hardware, Storage & Peripherals 3.0% | ||||
| a,gEastman Kodak Co. | United States | 3,207,889 | 69,643,270 | |
| a,gEastman Kodak Co., wts., 9/03/18 | United States | 43,321 | 329,240 | |
| a,gEastman Kodak Co., wts., 9/03/18 | United States | 43,321 | 268,590 | |
| Samsung Electronics Co. Ltd. | South Korea | 88,147 | 106,944,000 | |
| 177,185,100 | ||||
| Tobacco 5.1% | ||||
| Altria Group Inc. | United States | 1,106,870 | 54,535,485 | |
| British American Tobacco PLC | United Kingdom | 987,518 | 53,873,549 | |
| Imperial Tobacco Group PLC | United Kingdom | 2,408,078 | 106,448,438 | |
| Lorillard Inc. | United States | 1,002,564 | 63,101,378 | |
| Philip Morris International Inc. | United States | 298,690 | 24,328,301 | |
| 302,287,151 | ||||
| Wireless Telecommunication Services 2.8% | ||||
| Vodafone Group PLC | United Kingdom | 48,150,150 | 167,102,467 | |
| Total Common Stocks and Other Equity Interests | ||||
| (Cost $3,137,683,943) | 3,560,485,748 | |||
| Preferred Stocks 3.9% | ||||
| Automobiles 1.9% | ||||
| Hyundai Motor Co., pfd., 2 | South Korea | 523,429 | 64,126,944 | |
| Volkswagen AG, pfd. | Germany | 221,900 | 49,578,339 | |
| 113,705,283 | ||||
| Technology Hardware, Storage & Peripherals 2.0% | ||||
| Samsung Electronics Co. Ltd., pfd. | South Korea | 125,200 | 118,931,758 | |
| Total Preferred Stocks (Cost $244,913,412) | 232,637,041 | |||
| Principal | ||||
| Amount* | ||||
| Corporate Bonds, Notes and Senior Floating Rate | ||||
| Interests 23.0% | ||||
| Avaya Inc., | ||||
| hsenior note, 144A, 10.50%, 3/01/21 | United States | 69,456,000 | 59,732,160 | |
| hsenior secured note, 144A, 7.00%, 4/01/19 | United States | 14,003,000 | 13,722,940 | |
| i,jTranche B-3 Term Loan, 4.67%, 10/26/17 | United States | 21,029,458 | 20,223,336 | |
| i,jTranche B-6 Term Loan, 6.50%, 3/31/18 | United States | 5,128,997 | 5,071,296 | |
| i,jBluestem Brands Inc., First Lien Term Loan, 8.50%, 11/07/20 | United States | 19,000,000 | 18,430,000 | |
franklintempleton.com
Annual Report
| 23
FRANKLIN MUTUAL QUEST FUND
STATEMENT OF INVESTMENTS
| Principal | ||||
| Country | Amount* | Value | ||
| Corporate Bonds, Notes and Senior Floating Rate | ||||
| Interests (continued) | ||||
| Caesars Entertainment Operating Co. Inc., | ||||
| senior secured note, first lien, 11.25%, 6/01/17 | United States | 70,000,000 | $ | 51,660,000 |
| i,jSenior Tranche, first lien, B5B, 5.949%, 3/01/17 | United States | 7,170,869 | 6,295,428 | |
| i,jSenior Tranche, first lien, B6B, 6.949%, 3/01/17 | United States | 34,184,041 | 30,210,146 | |
| i,jSenior Tranche, first lien, B7, 9.75%, 3/01/17 | United States | 13,553,890 | 12,022,300 | |
| i,jCengage Learning Acquisitions Inc., First Lien Exit Term Loan, 7.00%, | ||||
| 3/31/20 | United States | 1,929,420 | 1,912,538 | |
| hDynegy Finance I Inc./Dynegy Finance II Inc., senior secured bond, | ||||
| first lien, 144A, 7.625%, 11/01/24 | United States | 19,825,000 | 20,246,281 | |
| g,i,jEastman Kodak Co., | ||||
| First Lien Term Loan, 7.25%, 9/03/19 | United States | 14,623,310 | 14,611,129 | |
| Second Lien Term Loan, 10.75%, 9/03/20 | United States | 50,486,000 | 50,549,107 | |
| First Data Corp., senior note, 11.75%, 8/15/21 | United States | 16,274,000 | 18,755,785 | |
| GenOn Americas Generation LLC, senior bond, | ||||
| 8.50%, 10/01/21 | United States | 9,900,000 | 8,563,500 | |
| 9.125%, 5/01/31 | United States | 121,480,000 | 104,472,800 | |
| iHeartCommunications Inc., | ||||
| senior secured note, first lien, 9.00%, 12/15/19 | United States | 37,367,000 | 36,946,621 | |
| i,jTranche B Term Loan, 3.819%, 1/29/16 | United States | 327,700 | 324,321 | |
| i,jTranche C Term Loan, 3.819%, 1/29/16 | United States | 47,087 | 46,558 | |
| i,jTranche D Term Loan, 6.919%, 1/30/19 | United States | 45,389,937 | 42,879,329 | |
| i,jTranche E Term Loan, 7.669%, 7/30/19 | United States | 14,586,689 | 14,021,455 | |
| i,jJC Penney Corp. Inc., Term Loan, 6.00%, 5/22/18 | United States | 29,421,257 | 28,998,327 | |
| Lee Enterprises Inc., | ||||
| i,jSecond Lien Term Loan, 12.00%, 12/31/22 | United States | 27,750,000 | 29,137,500 | |
| hsenior secured note, first lien, 144A, 9.50%, 3/15/22 | United States | 74,255,000 | 76,575,469 | |
| i,jMoxie Liberty LLC, Construction B-1 Term Loan, 7.50%, 8/21/20 | United States | 42,552,000 | 42,126,480 | |
| i,jMoxie Patriot LLC, Construction B-1 Term Loan, 6.75%, 12/18/20 | United States | 24,748,000 | 24,840,805 | |
| i,jNew Media Holdings II LLC, first lien, 7.25%, 6/04/20 | United States | 114,425,000 | 113,059,910 | |
| NGPL PipeCo LLC, | ||||
| hsecured note, 144A, 7.119%, 12/15/17 | United States | 11,037,000 | 10,899,038 | |
| f,hsenior secured note, 144A, 9.625%, 6/01/19 | United States | 16,383,000 | 16,505,872 | |
| i,jTerm Loan B, 6.75%, 9/15/17 | United States | 896,199 | 867,072 | |
| cSorenson Communications Inc., | ||||
| i,jExit First Lien Term Loan, 8.00%, 4/30/20 | United States | 145,000,000 | 147,175,000 | |
| h,ksecured note, second lien, 144A, PIK, 9.00%, 10/31/20 | United States | 96,021,938 | 90,260,622 | |
| c,h,kSorenson Holdings LLC/Finance Corp., senior note, 144A, PIK, 13.00%, | ||||
| 10/31/21 | United States | 72,976,673 | 73,341,556 | |
| Spirit Realty Capital Inc., cvt., senior note, | ||||
| 2.875%, 5/15/19 | United States | 45,000,000 | 43,903,350 | |
| 3.75%, 5/15/21 | United States | 35,000,000 | 34,168,925 | |
| hSunshine Oilsands Ltd., secured note, 144A, 10.00%, 8/01/17 | Canada | 18,000,000 | 13,241,250 | |
| i,jToys R US-Delaware Inc., | ||||
| Filo Term Loan, 8.75%, 10/24/19 | United States | 9,139,000 | 8,997,071 | |
| lTerm Loan B4, 9.75%, 4/24/20 | United States | 71,187,309 | 65,171,981 | |
| Walter Energy Inc., | ||||
| i,jB, Term Loan, 7.25%, 4/01/18 | United States | 13,319,153 | 10,363,966 | |
| hfirst lien, 144A, 9.50%, 10/15/19 | United States | 7,372,000 | 5,639,580 | |
| f,h,ksecond lien, 144A, PIK, 11.50%, 4/01/20 | United States | 6,228,000 | 2,055,545 | |
| Total Corporate Bonds, Notes and Senior Floating Rate | ||||
| Interests (Cost $1,384,571,225) | 1,368,026,349 |
24 | Annual Report
franklintempleton.com
| FRANKLIN MUTUAL QUEST FUND | |||||||
| STATEMENT OF INVESTMENTS | |||||||
| Principal | |||||||
| Country | Amount* | Value | |||||
| Corporate Bonds, Notes and Senior Floating Rate | |||||||
| Interests in Reorganization 4.2% | |||||||
| b,mBroadband Ventures III LLC, secured promissory note, 5.00%, 2/01/12 | United States | 9,272 | $ | — | |||
| mNortel Networks Corp., cvt., senior note, | |||||||
| 1.75%, 4/15/12 | Canada | 76,472,000 | 75,229,330 | ||||
| 2.125%, 4/15/14 | Canada | 12,797,000 | 12,510,667 | ||||
| mNortel Networks Ltd., senior note, | |||||||
| 10.125%, 7/15/13 | Canada | 34,400,000 | 38,334,500 | ||||
| 10.75%, 7/15/16 | Canada | 20,475,000 | 23,187,938 | ||||
| mNorthern Telecom Ltd., 6.875%, 9/01/23 | Canada | 20,544,000 | 8,217,600 | ||||
| i,j,mTexas Competitive Electric Holdings Co. LLC, Extended Term Loan, | |||||||
| 4.648%, 10/10/17 | United States | 101,650,473 | 65,818,681 | ||||
| h,mTexas Competitive Electric Holdings Co. LLC/Texas Competitive Electric | |||||||
| Holdings Finance Inc., senior secured note, 144A, 11.50%, 10/01/20 | United States | 39,724,000 | 28,303,350 | ||||
| Total Corporate Bonds, Notes and Senior Floating Rate | |||||||
| Interests in Reorganization (Cost $273,220,415) | 251,602,066 | ||||||
| Shares | |||||||
| Companies in Liquidation 2.1% | |||||||
| aAdelphia Recovery Trust | United States | 38,254,708 | 91,811 | ||||
| a,dAdelphia Recovery Trust, Arahova Contingent Value Vehicle, Contingent | |||||||
| Distribution | United States | 4,899,492 | 48,995 | ||||
| a,d,eCentury Communications Corp., Contingent Distribution | United States | 13,497,000 | — | ||||
| EME Reorganization Trust | United States | 364,733,491 | 9,483,071 | ||||
| a,bFIM Coinvestor Holdings I, LLC | United States | 16,133,491 | — | ||||
| a,g,hKGen Power Corp., 144A | United States | 5,377,461 | 1,543,815 | ||||
| a,nLehman Brothers Holdings Inc., Bankruptcy Claim | United States | 454,066,643 | 113,516,661 | ||||
| a,d,eTribune Media Litigation Trust, Contingent Distribution | United States | 1,497,164 | — | ||||
| Total Companies in Liquidation (Cost $138,814,862) | 124,684,353 | ||||||
| Principal | |||||||
| Amount* | |||||||
| Asset-Backed Securities 0.5% | |||||||
| Diversified Financial Services 0.5% | |||||||
| Master Asset Vehicle, 2009-2, | |||||||
| jA2, FRN, 0.775%, 1/22/17 | Canada | 8,500,000 | CAD | 6,770,355 | |||
| B, zero cpn., 7/15/56 | Canada | 29,000,000 | CAD | 23,100,108 | |||
| Total Asset-Backed Securities (Cost $27,036,548) | 29,870,463 | ||||||
| Municipal Bonds (Cost $16,965,596) 0.3% | |||||||
| Puerto Rico Commonwealth GO, Refunding, Series A, 8.00%, 7/01/35 | United States | 18,174,000 | 15,879,533 | ||||
| Number of | |||||||
| Contracts | |||||||
| Options Purchased 0.0%† | |||||||
| Calls — Exchange-Traded | |||||||
| Automobiles 0.0%† | |||||||
| General Motors Co., January Strike Price $40, Expires 1/17/15 | United States | 20,000 | 20,000 | ||||
| Hotels, Restaurants & Leisure 0.0% | |||||||
| Caesars Entertainment Corp., January Strike Price $22.50, | |||||||
| Expires 1/17/15 | United States | 1,000 | — | ||||
| Total Options Purchased (Cost $3,646,941) | 20,000 | ||||||
| Total Investments before Short Term Investments | |||||||
| (Cost $5,226,852,942) | 5,583,205,553 | ||||||
| franklintempleton.com | Annual Report | 25 | ||||||
| FRANKLIN MUTUAL QUEST FUND | |||||
| STATEMENT OF INVESTMENTS | |||||
| Principal | |||||
| Country | Amount* | Value | |||
| Short Term Investments 5.6% | |||||
| U.S. Government and Agency Securities | |||||
| (Cost $293,257,264) 4.9% | |||||
| o,pU.S. Treasury Bills, 1/02/15 - 5/28/15 | United States | 293,300,000 | $ | 293,275,609 | |
| Total Investments before Money Market Funds | |||||
| (Cost $5,520,110,906) | 5,876,481,162 | ||||
| Shares | |||||
| qInvestments from Cash Collateral Received for Loaned | |||||
| Securities (Cost $43,569,055) 0.7% | |||||
| Money Market Funds 0.7% | |||||
| rBNY Mellon Overnight Government Fund, 0.072% | United States | 43,569,055 | 43,569,055 | ||
| Total Investments (Cost $5,563,679,961) 99.4% | 5,920,050,217 | ||||
| Options Written (0.0)%† | (920,000 | ) | |||
| Securities Sold Short (1.4)% | (83,883,552 | ) | |||
| Other Assets, less Liabilities 2.0% | 118,519,438 | ||||
| Net Assets 100.0% | $ | 5,953,766,103 | |||
| Number of | |||||
| Contracts | |||||
| sOptions Written (0.0)%† | |||||
| Puts — Exchange-Traded | |||||
| Automobiles (0.0)%† | |||||
| General Motors Co., January Strike Price $32, Expires 1/17/15 | United States | 3,000 | $ | (24,000 | ) |
| General Motors Co., January Strike Price $35, Expires 1/17/15 | United States | 3,000 | (225,000 | ) | |
| (249,000 | ) | ||||
| Energy Equipment & Services (0.0)%† | |||||
| Transocean Ltd., February Strike Price $13, Expires 2/20/15 | United States | 3,500 | (140,000 | ) | |
| Hotels, Restaurants & Leisure (0.0)%† | |||||
| Caesars Entertainment Corp., January Strike Price $12.50, | |||||
| Expires 1/17/15 | United States | 3,000 | (141,000 | ) | |
| Caesars Entertainment Corp., March Strike Price $15, Expires 3/20/15 | United States | 1,500 | (390,000 | ) | |
| (531,000 | ) | ||||
| Total Options Written (Premiums Received $2,112,030) | $ | (920,000 | ) | ||
| Shares | |||||
| tSecurities Sold Short (1.4)% | |||||
| Common Stocks (0.9)% | |||||
| Diversified Telecommunication Services (0.1)% | |||||
| AT&T Inc. | United States | 242,300 | $ | (8,138,857 | ) |
| Semiconductors & Semiconductor Equipment (0.8)% | |||||
| Applied Materials Inc. | United States | 1,846,813 | (46,022,580 | ) | |
| Total Common Stocks (Proceeds $50,175,477) | $ | (54,161,437 | ) | ||
26 | Annual Report
franklintempleton.com
| FRANKLIN MUTUAL QUEST FUND | |||||
| STATEMENT OF INVESTMENTS | |||||
| Principal | |||||
| Country | Amount* | Value | |||
| Securities Sold Short (continued) | |||||
| Corporate Notes (Proceeds $28,360,925) (0.5)% | |||||
| NRG Energy Inc., senior note, 7.875%, 5/15/21 | United States | 20,000,000 | $ | (21,650,000 | ) |
| Vulcan Materials Co., senior note, | |||||
| 6.50%, 12/01/16 | United States | 3,565,000 | (3,814,550 | ) | |
| 7.00%, 6/15/18 | United States | 3,853,000 | (4,257,565 | ) | |
| (29,722,115 | ) | ||||
| Total Securities Sold Short (Proceeds $78,536,402) | $ | (83,883,552 | ) | ||
*The principal amount is stated in U.S. dollars unless otherwise indicated.
†Rounds to less than 0.1% of net assets.
aNon-income producing.
bSee Note 9 regarding restricted securities.
cAt December 31, 2014, pursuant to the Fund’s policies and the requirements of applicable securities law, the Fund may be restricted from trading these securities for a
limited or extended period of time.
dContingent distributions represent the right to receive additional distributions, if any, during the reorganization of the underlying company. Shares represent total underlying
principal of debt securities.
eSecurity has been deemed illiquid because it may not be able to be sold within seven days. At December 31, 2014, the aggregate value of these securities was $97,808,120,
representing 1.64% of net assets.
fA portion or all of the security is on loan at December 31, 2014. See Note 1(g).
gSee Note 11 regarding holdings of 5% voting securities.
hSecurity was purchased pursuant to Rule 144A under the Securities Act of 1933 and may be sold in transactions exempt from registration only to qualified institutional buyers
or in a public offering registered under the Securities Act of 1933. These securities have been deemed liquid under guidelines approved by the Trust’s Board of Trustees. At
December 31, 2014, the aggregate value of these securities was $412,067,478, representing 6.92% of net assets.
iSee Note 1(h) regarding senior floating rate interests.
jThe coupon rate shown represents the rate at period end.
kIncome may be received in additional securities and/or cash.
lA portion or all of the security purchased on a delayed delivery basis. See Note 1(c).
mSee Note 8 regarding credit risk and defaulted securities.
nBankruptcy claims represent the right to receive distributions, if any, during the liquidation of the underlying pool of assets. Shares represent amount of allowed unsecured
claims.
oThe security is traded on a discount basis with no stated coupon rate.
pSecurity or a portion of the security has been pledged as collateral for securities sold short, open futures, forwards and written options contracts. At December 31, 2014, the
aggregate value of these securities and/or cash pledged as collateral was $123,935,550, representing 2.08% of net assets.
qSee Note 1(g) regarding securities on loan.
rThe rate shown is the annualized seven-day yield at period end.
sSee Note 1(d) regarding written options.
tSee Note 1(f) regarding securities sold short.
franklintempleton.com
Annual Report
| 27
| FRANKLIN MUTUAL QUEST FUND | ||||||||||||||
| STATEMENT OF INVESTMENTS | ||||||||||||||
| At December 31, 2014, the Fund had the following futures contracts outstanding. See Note 1(d). | ||||||||||||||
| Futures Contracts | ||||||||||||||
| Number of | Notional Expiration | Unrealized | Unrealized | |||||||||||
| Description | Type Contracts | Value | Date | Appreciation | Depreciation | |||||||||
| Currency Contracts | ||||||||||||||
| CHF/USD | Short | 17 | $ 2,140,725 | 3/16/15 | $ | 49,884 | $ | — | ||||||
| EUR/USD | Short | 908 | 137,414,450 | 3/16/15 | 3,309,150 | — | ||||||||
| GBP/USD | Short | 1,287 | 125,241,188 | 3/16/15 | 726,880 | — | ||||||||
| Unrealized appreciation (depreciation) | 4,085,914 | — | ||||||||||||
| Net unrealized appreciation (depreciation) | $ | 4,085,914 | ||||||||||||
| At December 31, 2014, the Fund had the following forward exchange contracts outstanding. See Note 1(d). | ||||||||||||||
| Forward Exchange Contracts | ||||||||||||||
| Contract | Settlement | Unrealized | Unrealized | |||||||||||
| Currency | Counterpartya Type | Quantity | Amount | Date Appreciation Depreciation | ||||||||||
| Euro | BANT | Buy | 224,445 | $ | 281,229 | 1/20/15 | $ | — | $ | (9,590 | ) | |||
| Euro | BANT | Sell | 49,052,772 | 65,693,608 | 1/20/15 | 6,326,610 | — | |||||||
| Euro | BONY | Buy | 702,893 | 874,880 | 1/20/15 | — | (24,191 | ) | ||||||
| Euro | BONY | Sell | 796,443 | 1,067,943 | 1/20/15 | 104,033 | — | |||||||
| Euro | FBCO | Buy | 932,742 | 1,157,580 | 1/20/15 | — | (28,712 | ) | ||||||
| Euro | FBCO | Sell | 13,874,537 | 18,580,033 | 1/20/15 | 1,788,125 | — | |||||||
| Euro | DBFX | Buy | 1,169,787 | 1,457,609 | 1/20/15 | — | (41,854 | ) | ||||||
| Euro | HSBC | Buy | 1,554,922 | 1,933,652 | 1/20/15 | — | (51,779 | ) | ||||||
| Euro | HSBC | Sell | 280,348 | 375,160 | 1/20/15 | 35,864 | — | |||||||
| Euro | SCBT | Sell | 16,472,569 | 22,062,790 | 1/20/15 | 2,126,568 | — | |||||||
| Euro | SSBT | Buy | 1,230,604 | 1,533,211 | 1/20/15 | — | (43,850 | ) | ||||||
| Euro | SSBT | Sell | 2,721,340 | �� | 3,641,619 | 1/20/15 | 348,069 | — | ||||||
| British Pound | BANT | Buy | 4,565,925 | 7,667,939 | 1/21/15 | — | (552,232 | ) | ||||||
| British Pound | BBU | Buy | 802,129 | 1,276,652 | 1/21/15 | — | (26,585 | ) | ||||||
| British Pound | DBFX | Sell | 21,708,081 | 37,049,833 | 1/21/15 | 3,219,155 | — | |||||||
| British Pound | HSBC | Buy | 545,604 | 916,751 | 1/21/15 | — | (66,462 | ) | ||||||
| British Pound | HSBC | Sell | 18,046,147 | 30,475,227 | 1/21/15 | 2,351,442 | — | |||||||
| British Pound | SSBT | Buy | 1,091,208 | 1,833,913 | 1/21/15 | — | (133,334 | ) | ||||||
| British Pound | SSBT | Sell | 20,451,281 | 34,906,246 | 1/21/15 | 3,034,212 | — | |||||||
| South Korean Won | BANT | Buy | 6,580,139,182 | 6,111,395 | 2/12/15 | — | (108,294 | ) | ||||||
| South Korean Won | BANT | Sell | 101,959,415,635 | 96,672,047 | 2/12/15 | 3,948,075 | (294,224 | ) | ||||||
| South Korean Won | BONY | Sell | 7,044,904,251 | 6,826,233 | 2/12/15 | 399,124 | — | |||||||
| South Korean Won | FBCO | Sell | 123,550,089,662 | 118,892,161 | 2/12/15 | 6,217,539 | (40,878 | ) | ||||||
| South Korean Won | HSBC | Buy | 54,568,706,603 | 51,186,483 | 2/12/15 | 79,634 | (1,482,753 | ) | ||||||
| South Korean Won | HSBC | Sell | 145,179,148,730 | 139,289,211 | 2/12/15 | 7,025,282 | (183,893 | ) | ||||||
| Swiss Franc | BANT | Buy | 248,423 | 256,843 | 2/12/15 | — | (6,783 | ) | ||||||
| Swiss Franc | BANT | Sell | 8,823,521 | 9,757,238 | 2/12/15 | 875,599 | — | |||||||
| Swiss Franc | FBCO | Buy | 651,489 | 690,241 | 2/12/15 | — | (34,461 | ) | ||||||
| Swiss Franc | FBCO | Sell | 379,275 | 402,796 | 2/12/15 | 21,023 | — | |||||||
| Swiss Franc | DBFX | Buy | 302,564 | 319,104 | 2/12/15 | — | (14,547 | ) | ||||||
| Swiss Franc | DBFX | Sell | 432,028 | 468,085 | 2/12/15 | 33,211 | — | |||||||
| Swiss Franc | HSBC | Buy | 74,259 | 76,771 | 2/12/15 | — | (2,023 | ) | ||||||
| Swiss Franc | HSBC | Sell | 178,063 | 181,015 | 2/12/15 | 1,780 | — | |||||||
| Swiss Franc | SSBT | Buy | 214,717 | 224,386 | 2/12/15 | — | (8,254 | ) | ||||||
| Swiss Franc | SSBT | Sell | 54,943 | 57,153 | 2/12/15 | 1,848 | — | |||||||
| Danish Krone | BANT | Buy | 31,861,484 | 5,409,381 | 2/17/15 | — | (230,404 | ) | ||||||
| Danish Krone | BANT | Sell | 37,558,588 | 6,352,931 | 2/17/15 | 247,909 | — | |||||||
| Danish Krone | BBU | Buy | 4,919,749 | 819,564 | 2/17/15 | — | (19,876 | ) | ||||||
28 | Annual Report
franklintempleton.com
| FRANKLIN MUTUAL QUEST FUND | ||||||||||||
| STATEMENT OF INVESTMENTS | ||||||||||||
| Forward Exchange Contracts (continued) | ||||||||||||
| Contract | Settlement | Unrealized | Unrealized | |||||||||
| Currency | Counterpartya Type | Quantity | Amount | Date Appreciation Depreciation | ||||||||
| Danish Krone | BONY | Buy | 8,497,253 | $ | 1,473,147 | 2/17/15 | $ | — | $ | (91,947 | ) | |
| Danish Krone | BONY | Sell | 5,193,753 | 882,472 | 2/17/15 | 38,245 | — | |||||
| Danish Krone | FBCO | Buy | 4,500,000 | 747,249 | 2/17/15 | — | (15,789 | ) | ||||
| Danish Krone | DBFX | Buy | 11,527,114 | 2,001,916 | 2/17/15 | — | (128,222 | ) | ||||
| Danish Krone | DBFX | Sell | 21,978,357 | 3,710,928 | 2/17/15 | 138,420 | — | |||||
| Danish Krone | SSBT | Buy | 17,944,032 | 3,094,699 | 2/17/15 | — | (177,957 | ) | ||||
| Danish Krone | SSBT | Sell | 435,175,561 | 78,069,599 | 2/17/15 | 7,333,274 | — | |||||
| British Pound | BANT | Buy | 4,801,170 | 7,673,075 | 2/19/15 | — | (192,431 | ) | ||||
| British Pound | BANT | Sell | 30,483,136 | 49,976,112 | 2/19/15 | 2,489,723 | (9,012 | ) | ||||
| British Pound | BBU | Buy | 408,009 | 644,471 | 2/19/15 | — | (8,757 | ) | ||||
| British Pound | BONY | Sell | 2,382,566 | 3,807,529 | 2/19/15 | 95,282 | — | |||||
| British Pound | FBCO | Buy | 2,402,569 | 3,782,373 | 2/19/15 | — | (38,959 | ) | ||||
| British Pound | FBCO | Sell | 20,299,409 | 33,435,292 | 2/19/15 | 1,807,031 | — | |||||
| British Pound | DBFX | Buy | 2,086,218 | 3,287,563 | 2/19/15 | — | (37,052 | ) | ||||
| British Pound | DBFX | Sell | 2,819,553 | 4,425,662 | 2/19/15 | 36,290 | (3,739 | ) | ||||
| British Pound | HSBC | Buy | 595,379 | 946,575 | 2/19/15 | — | (18,922 | ) | ||||
| British Pound | HSBC | Sell | 5,725,862 | 9,242,437 | 2/19/15 | 321,042 | — | |||||
| British Pound | SCBT | Sell | 3,295,230 | 5,370,797 | 2/19/15 | 236,539 | — | |||||
| British Pound | SSBT | Buy | 2,530,891 | 3,978,349 | 2/19/15 | — | (35,000 | ) | ||||
| British Pound | SSBT | Sell | 20,427,705 | 33,718,805 | 2/19/15 | 1,890,648 | — | |||||
| Euro | DBFX | Sell | 22,462,900 | 29,640,246 | 2/27/15 | 2,445,592 | — | |||||
| Canadian Dollar | BONY | Sell | 245,205 | 215,030 | 3/18/15 | 4,234 | — | |||||
| Canadian Dollar | SCBT | Sell | 30,371,771 | 27,594,997 | 3/18/15 | 1,485,168 | — | |||||
| Euro | BANT | Sell | 2,188,185 | 2,782,809 | 4/16/15 | 132,478 | — | |||||
| Euro | BBU | Sell | 372 | 467 | 4/16/15 | 16 | — | |||||
| Euro | BONY | Sell | 717 | 899 | 4/16/15 | 30 | — | |||||
| Euro | FBCO | Sell | 5,507,787 | 6,879,522 | 4/16/15 | 208,488 | — | |||||
| Euro | DBFX | Sell | 64,788,221 | 82,114,118 | 4/16/15 | 3,642,603 | — | |||||
| Euro | HSBC | Sell | 3,454,516 | 4,350,045 | 4/16/15 | 165,934 | — | |||||
| Euro | SCBT | Sell | 359 | 450 | 4/16/15 | 15 | — | |||||
| Euro | SSBT | Sell | 3,211,705 | 4,034,412 | 4/16/15 | 144,394 | — | |||||
| British Pound | BANT | Sell | 118,790 | 185,562 | 4/22/15 | 575 | — | |||||
| British Pound | HSBC | Sell | 34,759,984 | 55,963,574 | 4/22/15 | 1,833,370 | — | |||||
| British Pound | SCBT | Sell | 38,737,505 | 62,406,121 | 4/22/15 | 2,081,897 | — | |||||
| Euro | BANT | Sell | 17,914,671 | 22,370,050 | 5/18/15 | 664,324 | — | |||||
| Euro | BONY | Sell | 312,591 | 381,048 | 5/18/15 | 2,308 | — | |||||
| Euro | FBCO | Sell | 20,332,347 | 25,390,113 | 5/18/15 | 755,090 | — | |||||
| Euro | DBFX | Sell | 24,071,841 | 30,031,286 | 5/18/15 | 865,428 | — | |||||
| Euro | HSBC | Sell | 1,981,111 | 2,449,675 | 5/18/15 | 49,327 | — | |||||
| Euro | SSBT | Sell | 1,945,855 | 2,436,388 | 5/18/15 | 78,757 | — | |||||
| British Pound | BANT | Buy | 2,757,105 | 4,301,759 | 5/21/15 | — | (9,237 | ) | ||||
| British Pound | BANT | Sell | 23,737,817 | 37,149,684 | 5/21/15 | 192,396 | — | |||||
| British Pound | FBCO | Buy | 573,239 | 892,370 | 5/21/15 | 103 | — | |||||
| British Pound | FBCO | Sell | 17,099,426 | 26,740,083 | 5/21/15 | 118,072 | — | |||||
| British Pound | HSBC | Buy | 4,344,227 | 6,790,675 | 5/21/15 | — | (27,171 | ) | ||||
| British Pound | SSBT | Sell | 31,333,919 | 49,006,249 | 5/21/15 | 222,627 | — | |||||
| Unrealized appreciation (depreciation) | 67,664,822 | (4,199,174 | ) | |||||||||
| Net unrealized appreciation (depreciation) | $ | 63,465,648 | ||||||||||
| aMay be comprised of multiple contracts with the same counterparty, currency and settlement date. | ||||||||||||
| See Abbreviations on page 49. | ||||||||||||
franklintempleton.com
The accompanying notes are an integral part of these financial statements. | Annual Report | 29
FRANKLIN MUTUAL QUEST FUND
Financial Statements
Statement of Assets and Liabilities
December 31, 2014
| Assets: | |||
| Investments in securities: | |||
| Cost - Unaffiliated issuers | $ | 5,386,908,016 | |
| Cost - Non-controlled affiliated issuers (Note 11) | 176,771,945 | ||
| Total cost of investments | $ | 5,563,679,961 | |
| Value - Unaffiliated issuers | $ | 5,724,738,801 | |
| Value - Non-controlled affiliated issuers (Note 11) | 195,311,416 | ||
| Total value of investments (includes securities loaned in the amount of $41,650,412) | 5,920,050,217 | ||
| Cash | 6,400,560 | ||
| Restricted Cash (Note 1e) | 15,520,000 | ||
| Foreign currency, at value (cost $2,087,715) | 2,091,595 | ||
| Receivables: | |||
| Investment securities sold | 4,476,356 | ||
| Capital shares sold | 4,517,911 | ||
| Dividends and interest | 22,195,988 | ||
| Due from brokers | 86,317,488 | ||
| Variation margin | 457,275 | ||
| Unrealized appreciation on forward exchange contracts | 67,664,822 | ||
| Other assets | 514 | ||
| Total assets | 6,129,692,726 | ||
| Liabilities: | |||
| Payables: | |||
| Investment securities purchased | 8,631,711 | ||
| Capital shares redeemed | 13,225,264 | ||
| Management fees | 3,377,391 | ||
| Distribution fees | 1,379,100 | ||
| Transfer agent fees | 684,595 | ||
| Trustees’ fees and expenses | 240,985 | ||
| Options written, at value (premiums received $2,112,030) | 920,000 | ||
| Securities sold short, at value (proceeds $78,536,402) | 83,883,552 | ||
| Payable upon return of securities loaned | 43,569,055 | ||
| Due to brokers | 15,520,000 | ||
| Unrealized depreciation on forward exchange contracts | 4,199,174 | ||
| Accrued expenses and other liabilities | 295,796 | ||
| Total liabilities | 175,926,623 | ||
| Net assets, at value | $ | 5,953,766,103 | |
| Net assets consist of: | |||
| Paid-in capital | $ | 5,559,779,289 | |
| Distributions in excess of net investment income | (7,376,721 | ) | |
| Net unrealized appreciation (depreciation) | 419,614,300 | ||
| Accumulated net realized gain (loss) | (18,250,765 | ) | |
| Net assets, at value | $ | 5,953,766,103 |
30 | Annual Report | The accompanying notes are an integral part of these financial statements.
franklintempleton.com
FRANKLIN MUTUAL QUEST FUND
FINANCIAL STATEMENTS
| Statement of Assets and Liabilities (continued) | ||
| December 31, 2014 | ||
| Class Z: | ||
| Net assets, at value | $ | 4,116,650,997 |
| Shares outstanding | 253,984,775 | |
| Net asset value and maximum offering price per share | $ | 16.21 |
| Class A: | ||
| Net assets, at value | $ | 1,394,138,002 |
| Shares outstanding | 87,032,963 | |
| Net asset value per sharea | $ | 16.02 |
| Maximum offering price per share (net asset value per share ÷ 94.25%) | $ | 17.00 |
| Class C: | ||
| Net assets, at value | $ | 397,962,667 |
| Shares outstanding | 25,223,292 | |
| Net asset value and maximum offering price per sharea | $ | 15.78 |
| Class R: | ||
| Net assets, at value | $ | 674,577 |
| Shares outstanding | 42,512 | |
| Net asset value and maximum offering price per share | $ | 15.87 |
| Class R6: | ||
| Net assets, at value | $ | 44,339,860 |
| Shares outstanding | 2,738,007 | |
| Net asset value and maximum offering price per share | $ | 16.19 |
| aRedemption price is equal to net asset value less contingent deferred sales charges, if applicable. | |||
| franklintempleton.com | The accompanying notes are an integral part of these financial statements. | Annual Report | | | 31 |
FRANKLIN MUTUAL QUEST FUND
FINANCIAL STATEMENTS
Statement of Operations
for the year ended December 31, 2014
| Investment income: | |||
| Dividends: | |||
| Unaffiliated issuers | $ | 197,863,187 | |
| Non-controlled affiliated issuers (Note 11) | 1,028,569 | ||
| Interest: | |||
| Unaffiliated issuers | 100,987,102 | ||
| Non-controlled affiliated issuers (Note 11) | 5,272,579 | ||
| Income from securities loaned | 505,051 | ||
| Total investment income | 305,656,488 | ||
| Expenses: | |||
| Management fees (Note 3a) | 38,775,208 | ||
| Administrative fees (Note 3b) | 2,319,003 | ||
| Distribution fees: (Note 3c) | |||
| Class A | 4,262,901 | ||
| Class C | 4,126,403 | ||
| Class R | 3,592 | ||
| Transfer agent fees: (Note 3e) | |||
| Class Z | 3,187,188 | ||
| Class A | 1,058,193 | ||
| Class C | 307,302 | ||
| Class R | 535 | ||
| Class R6 | 405 | ||
| Custodian fees (Note 4) | 295,967 | ||
| Reports to shareholders | 306,196 | ||
| Registration and filing fees | 238,702 | ||
| Professional fees | 251,393 | ||
| Trustees’ fees and expenses | 139,193 | ||
| Dividends and interest on securities sold short | 2,663,770 | ||
| Other | 99,957 | ||
| Total expenses | 58,035,908 | ||
| Expense reductions (Note 4) | (1,412 | ) | |
| Net expenses | 58,034,496 | ||
| Net investment income | 247,621,992 | ||
| Realized and unrealized gains (losses): | |||
| Net realized gain (loss) from: | |||
| Investments: | |||
| Unaffiliated issuers | 545,221,518 | ||
| Non-controlled affiliated issuers (Note 11) | 1,379,309 | ||
| Written options | 15,043,855 | ||
| Foreign currency transactions | (16,935,043 | ) | |
| Futures contracts | 20,016,785 | ||
| Securities sold short | (1,925,582 | ) | |
| Net realized gain (loss) | 562,800,842 | ||
| Net change in unrealized appreciation (depreciation) on: | |||
| Investments | (717,086,138 | ) | |
| Translation of other assets and liabilities denominated in foreign currencies | 104,185,400 | ||
| Net change in unrealized appreciation (depreciation) | (612,900,738 | ) | |
| Net realized and unrealized gain (loss) | (50,099,896 | ) | |
| Net increase (decrease) in net assets resulting from operations | $ | 197,522,096 |
32 | Annual Report | The accompanying notes are an integral part of these financial statements.
franklintempleton.com
| FRANKLIN MUTUAL QUEST FUND | ||||||
| FINANCIAL STATEMENTS | ||||||
| Statements of Changes in Net Assets | ||||||
| Year Ended December 31, | ||||||
| 2014 | 2013 | |||||
| Increase (decrease) in net assets: | ||||||
| Operations: | ||||||
| Net investment income | $ | 247,621,992 | $ | 156,112,098 | ||
| Net realized gain (loss) from investments, written options, foreign currency transactions, | ||||||
| futures contracts and securities sold short | 562,800,842 | 483,018,738 | ||||
| Net change in unrealized appreciation (depreciation) on investments and translation of other | ||||||
| assets and liabilities denominated in foreign currencies | (612,900,738 | ) | 630,665,489 | |||
| Net increase (decrease) in net assets resulting from operations | 197,522,096 | 1,269,796,325 | ||||
| Distributions to shareholders from: | ||||||
| Net investment income: | ||||||
| Class Z | (190,782,212 | ) | (119,200,085 | ) | ||
| Class A | (60,978,852 | ) | (34,924,178 | ) | ||
| Class C | (14,917,082 | ) | (7,984,041 | ) | ||
| Class R | (27,118 | ) | (20,663 | ) | ||
| Class R6 | (2,013,042 | ) | (159 | ) | ||
| Net realized gains: | ||||||
| Class Z | (387,863,649 | ) | (429,707,917 | ) | ||
| Class A | (132,713,943 | ) | (138,766,536 | ) | ||
| Class C | (38,720,015 | ) | (41,877,771 | ) | ||
| Class R | (62,584 | ) | (71,953 | ) | ||
| Class R6 | (4,096,572 | ) | (560 | ) | ||
| Total distributions to shareholders | (832,175,069 | ) | (772,553,863 | ) | ||
| Capital share transactions: (Note 2) | ||||||
| Class Z | 279,883,976 | 329,356,966 | ||||
| Class A | 173,092,819 | 162,496,969 | ||||
| Class B | — | (990,999 | ) | |||
| Class C | 35,618,735 | 41,284,507 | ||||
| Class R | (111,703 | ) | 651,940 | |||
| Class R6 | 50,156,576 | 5,000 | ||||
| Total capital share transactions | 538,640,403 | 532,804,383 | ||||
| Net increase (decrease) in net assets | (96,012,570 | ) | 1,030,046,845 | |||
| Net assets: | ||||||
| Beginning of year | 6,049,778,673 | 5,019,731,828 | ||||
| End of year | $ | 5,953,766,103 | $ | 6,049,778,673 | ||
| Distributions in excess of net investment income included in net assets: | ||||||
| End of year | $ | (7,376,721 | ) | $ | (5,986,981 | ) |
franklintempleton.com
The accompanying notes are an integral part of these financial statements. | Annual Report | 33
FRANKLIN MUTUAL QUEST FUND
Notes to Financial Statements
1. Organization and Significant Accounting Policies
Franklin Mutual Series Funds (Trust) is registered under the Investment Company Act of 1940, as amended, (1940 Act) as an open-end management investment company, consisting of seven separate funds and applies the specialized accounting and reporting guidance in U.S. Generally Accepted Accounting Principles (U.S. GAAP). Franklin Mutual Quest Fund (Fund) is included in this report. The financial statements of the remaining funds in the Trust are presented separately. The Fund offers five classes of shares: Class Z, Class A, Class C, Class R and Class R6. Each class of shares differs by its initial sales load, contingent deferred sales charges, voting rights on matters affecting a single class, its exchange privilege and fees primarily due to differing arrangements for distribution and transfer agent fees.
Effective June 30, 2014, Mutual Quest Fund was renamed Franklin Mutual Quest Fund.
The following summarizes the Fund’s significant accounting policies.
a. Financial Instrument Valuation
The Fund’s investments in financial instruments are carried at fair value daily. Fair value is the price that would be received to sell an asset or paid to transfer a liability in an orderly transaction between market participants on the measurement date. The Fund calculates the net asset value (NAV) per share at the close of the New York Stock Exchange (NYSE), generally at 4 p.m. Eastern time (NYSE close) on each day the NYSE is open for trading. Under compliance policies and procedures approved by the Trust’s Board of Trustees (the Board), the Fund’s administrator has responsibility for oversight of valuation, including leading the cross-functional Valuation and Liquidity Oversight Committee (VLOC). The VLOC provides administration and oversight of the Fund’s valuation policies and procedures, which are approved annually by the Board. Among other things, these procedures allow the Fund to utilize independent pricing services, quotations from securities and financial instrument dealers, and other market sources to determine fair value.
Equity securities and derivative financial instruments (derivatives) listed on an exchange or on the NASDAQ National Market System are valued at the last quoted sale price or the official closing price of the day, respectively. Foreign equity securities are valued as of the close of trading on the foreign stock exchange on which the security is primarily traded or as
of the NYSE close, whichever is earlier. The value is then converted into its U.S. dollar equivalent at the foreign exchange rate in effect at the NYSE close on the day that the value of the security is determined. Over-the-counter (OTC) securities are valued within the range of the most recent quoted bid and ask prices. Securities that trade in multiple markets or on multiple exchanges are valued according to the broadest and most representative market. Certain equity securities are valued based upon fundamental characteristics or relationships to similar securities. Investments in non-registered money market funds are valued at the closing NAV.
Debt securities generally trade in the OTC market rather than on a securities exchange. The Fund’s pricing services use multiple valuation techniques to determine fair value. In instances where sufficient market activity exists, the pricing services may utilize a market-based approach through which quotes from market makers are used to determine fair value. In instances where sufficient market activity may not exist or is limited, the pricing services also utilize proprietary valuation models which may consider market characteristics such as benchmark yield curves, credit spreads, estimated default rates, anticipated market interest rate volatility, coupon rates, anticipated timing of principal repayments, underlying collateral, and other unique security features in order to estimate the relevant cash flows, which are then discounted to calculate the fair value. Securities denominated in a foreign currency are converted into their U.S. dollar equivalent at the foreign exchange rate in effect at the NYSE close on the date that the values of the foreign debt securities are determined.
Certain derivatives trade in the OTC market. The Fund’s pricing services use various techniques including industry standard option pricing models and proprietary discounted cash flow models to determine the fair value of those instruments. The Fund’s net benefit or obligation under the derivative contract, as measured by the fair value of the contract, is included in net assets.
The Fund has procedures to determine the fair value of financial instruments for which market prices are not reliable or readily available. Under these procedures, the VLOC convenes on a regular basis to review such financial instruments and considers a number of factors, including significant unobservable valuation inputs, when arriving at fair value. The VLOC primarily employs a market-based approach which may use related or comparable assets or liabilities, recent transactions, market multiples, book values, and other relevant information for the investment to determine the fair value of the investment. An
34 | Annual Report
franklintempleton.com
FRANKLIN MUTUAL QUEST FUND
NOTES TO FINANCIAL STATEMENTS
income-based valuation approach may also be used in which the anticipated future cash flows of the investment are discounted to calculate fair value. Discounts may also be applied due to the nature or duration of any restrictions on the disposition of the investments. Due to the inherent uncertainty of valuations of such investments, the fair values may differ significantly from the values that would have been used had an active market existed. The VLOC employs various methods for calibrating these valuation approaches including a regular review of key inputs and assumptions, transactional back-testing or disposition analysis, and reviews of any related market activity.
Trading in securities on foreign securities stock exchanges and OTC markets may be completed before the daily NYSE close. In addition, trading in certain foreign markets may not take place on every NYSE business day. Occasionally, events occur between the time at which trading in a foreign security is completed and the close of the NYSE that might call into question the reliability of the value of a portfolio security held by the Fund. As a result, differences may arise between the value of the Fund’s portfolio securities as determined at the foreign market close and the latest indications of value at the close of the NYSE. In order to minimize the potential for these differences, the VLOC monitors price movements following the close of trading in foreign stock markets through a series of country specific market proxies (such as baskets of American Depositary Receipts, futures contracts and exchange traded funds). These price movements are measured against established trigger thresholds for each specific market proxy to assist in determining if an event has occurred that may call into question the reliability of the values of the foreign securities held by the Fund. If such an event occurs, the securities may be valued using fair value procedures, which may include the use of independent pricing services.
Also, when the last day of the reporting period is a non-business day, certain foreign markets may be open on those days that the NYSE is closed, which could result in differences between the value of the Fund’s portfolio securities on the last business day and the last calendar day of the reporting period. Any significant security valuation changes due to an open foreign market are adjusted and reflected by the Fund for financial reporting purposes.
b. Foreign Currency Translation
Portfolio securities and other assets and liabilities denominated in foreign currencies are translated into U.S. dollars based on the exchange rate of such currencies against U.S. dollars on the
date of valuation. The Fund may enter into foreign currency exchange contracts to facilitate transactions denominated in a foreign currency. Purchases and sales of securities, income and expense items denominated in foreign currencies are translated into U.S. dollars at the exchange rate in effect on the transaction date. Portfolio securities and assets and liabilities denominated in foreign currencies contain risks that those currencies will decline in value relative to the U.S. dollar. Occasionally, events may impact the availability or reliability of foreign exchange rates used to convert the U.S. dollar equivalent value. If such an event occurs, the foreign exchange rate will be valued at fair value using procedures established and approved by the Board.
The Fund does not separately report the effect of changes in foreign exchange rates from changes in market prices on securities held. Such changes are included in net realized and unrealized gain or loss from investments on the Statement of Operations.
Realized foreign exchange gains or losses arise from sales of foreign currencies, currency gains or losses realized between the trade and settlement dates on securities transactions and the difference between the recorded amounts of dividends, interest, and foreign withholding taxes and the U.S. dollar equivalent of the amounts actually received or paid. Net unrealized foreign exchange gains and losses arise from changes in foreign exchange rates on foreign denominated assets and liabilities other than investments in securities held at the end of the reporting period.
c. Securities Purchased on a Delayed Delivery Basis
The Fund purchases securities on a delayed delivery basis, with payment and delivery scheduled for a future date. These transactions are subject to market fluctuations and are subject to the risk that the value at delivery may be more or less than the trade date purchase price. Although the Fund will generally purchase these securities with the intention of holding the securities, it may sell the securities before the settlement date. Sufficient assets have been segregated for these securities.
d. Derivative Financial Instruments
The Fund invested in derivatives in order to manage risk or gain exposure to various other investments or markets. Derivatives are financial contracts based on an underlying or notional amount, require no initial investment or an initial net investment that is smaller than would normally be required to have a similar response to changes in market factors, and require or permit net settlement. Derivatives contain various
franklintempleton.com
Annual Report
| 35
FRANKLIN MUTUAL QUEST FUND
NOTES TO FINANCIAL STATEMENTS
1. Organization and Significant Accounting
Policies (continued)
d. Derivative Financial Instruments (continued)
risks including the potential inability of the counterparty to fulfill their obligations under the terms of the contract, the potential for an illiquid secondary market, and/or the potential for market movements which expose the Fund to gains or losses in excess of the amounts shown on the Statement of Assets and Liabilities. Realized gain and loss and unrealized appreciation and depreciation on these contracts for the period are included in the Statement of Operations.
Derivative counterparty credit risk is managed through a formal evaluation of the creditworthiness of all potential counterparties. The Fund attempts to reduce its exposure to counterparty credit risk on OTC derivatives, whenever possible, by entering into International Swaps and Derivatives Association (ISDA) master agreements with certain counterparties. These agreements contain various provisions, including but not limited to collateral requirements, events of default, or early termination. Termination events applicable to the counterparty include certain deteriorations in the credit quality of the counterparty. Termination events applicable to the Fund include failure of the Fund to maintain certain net asset levels and/or limit the decline in net assets over various periods of time. In the event of default or early termination, the ISDA master agreement gives the non-defaulting party the right to net and close-out all transactions traded, whether or not arising under the ISDA agreement, to one net amount payable by one counterparty to the other. However, absent an event of default or early termination, OTC derivative assets and liabilities are presented gross and not offset in the Statement of Assets and Liabilities. Early termination by the counterparty may result in an immediate payment by the Fund of any net liability owed to that counterparty under the ISDA agreement.
Collateral requirements differ by type of derivative. Collateral or initial margin requirements are set by the broker or exchange clearing house for exchange traded and centrally cleared derivatives. Initial margin deposited is held at the exchange and can be in the form of cash and/or securities. For OTC derivatives traded under an ISDA master agreement, posting of collateral is required by either the fund or the applicable counterparty if the total net exposure of all OTC derivatives with the applicable counterparty exceeds the minimum transfer amount, which typically ranges from $100,000 to $250,000, and can vary depending on the counterparty and the type of the agreement.
Generally, collateral is determined at the close of fund business each day and any additional collateral required due to changes in derivative values may be delivered by the Fund or the coun-terparty within a few business days. Collateral pledged and/or received by the Fund for OTC derivatives, if any, is held in segregated accounts with the Fund’s custodian/counterparty broker and can be in the form of cash and/or securities. Unrestricted cash may be invested according to the Fund’s investment objectives.
The Fund entered into exchange traded futures contracts primarily to manage exposure to certain foreign currencies. A futures contract is an agreement between the Fund and a counterparty to buy or sell an asset for a specified price on a future date. Required initial margins are pledged by the Fund, and the daily change in fair value is accounted for as a variation margin payable or receivable on the Statement of Assets and Liabilities.
The Fund entered into OTC forward exchange contracts primarily to manage exposure to certain foreign currencies. A forward exchange contract is an agreement between the Fund and a counterparty to buy or sell a foreign currency at a specific exchange rate on a future date.
The Fund purchased or wrote exchange traded option contracts primarily to manage exposure to equity price risk. An option is a contract entitling the holder to purchase or sell a specific amount of shares or units of an asset or notional amount of a swap (swaption), at a specified price. Options purchased are recorded as an asset while options written are recorded as a liability. Upon exercise of an option, the acquisition cost or sales proceeds of the underlying investment is adjusted by any premium received or paid. Upon expiration of an option, any premium received or paid is recorded as a realized gain or loss. Upon closing an option other than through expiration or exercise, the difference between the premium and the cost to close the position is recorded as a realized gain or loss.
See Notes 7 and 10 regarding investment transactions and other derivative information, respectively.
e. Restricted Cash
At December 31, 2014, the Fund held restricted cash in connection with investments in certain derivative securities. Restricted cash is held in a segregated account with the Fund’s custodian/counterparty broker and is reflected in the Statement of Assets and Liabilities.
36 | Annual Report
franklintempleton.com
FRANKLIN MUTUAL QUEST FUND
NOTES TO FINANCIAL STATEMENTS
f. Securities Sold Short
The Fund is engaged in selling securities short, which obligates the Fund to replace a borrowed security with the same security at current fair value. The Fund incurs a loss if the price of the security increases between the date of the short sale and the date on which the Fund replaces the borrowed security. The Fund realizes a gain if the price of the security declines between those dates. Gains are limited to the price at which the Fund sold the security short, while losses are potentially unlimited in size.
The Fund is required to establish a margin account with the broker lending the security sold short. While the short sale is outstanding, the broker retains the proceeds of the short sale to the extent necessary to meet margin requirements until the short position is closed out. A deposit must also be maintained with the Fund’s custodian/counterparty broker consisting of cash and/or securities having a value equal to a specified percentage of the value of the securities sold short. The Fund is obligated to pay fees for borrowing the securities sold short and is required to pay the counterparty any dividends and/or interest due on securities sold short. Such dividends and/or interest and any security borrowing fees are recorded as an expense to the Fund.
g. Securities Lending
The Fund participates in an agency based securities lending program. The Fund receives cash collateral against the loaned securities in an amount equal to at least 102% of the fair value of the loaned securities. Collateral is maintained over the life of the loan in an amount not less than 100% of the fair value of loaned securities, as determined at the close of fund business each day; any additional collateral required due to changes in security values is delivered to the Fund on the next business day. The collateral is invested in a non-registered money fund as indicated on the Statement of Investments. The Fund receives income from the investment of cash collateral, in addition to lending fees and rebates paid by the borrower. The Fund bears the market risk with respect to the collateral investment, securities loaned, and the risk that the agent may default on its obligations to the Fund. The securities lending agent has agreed to indemnify the Fund in the event of default by a third party borrower.
h. Senior Floating Rate Interests
The Fund invests in senior secured corporate loans that pay interest at rates which are periodically reset by reference to a
base lending rate plus a spread. These base lending rates are generally the prime rate offered by a designated U.S. bank or the London InterBank Offered Rate (LIBOR). Senior secured corporate loans often require prepayment of principal from excess cash flows or at the discretion of the borrower. As a result, actual maturity may be substantially less than the stated maturity. Senior secured corporate loans in which the Fund invests are generally readily marketable, but may be subject to certain restrictions on resale.
i. Income and Deferred Taxes
It is the Fund’s policy to qualify as a regulated investment company under the Internal Revenue Code. The Fund intends to distribute to shareholders substantially all of its taxable income and net realized gains to relieve it from federal income and excise taxes. As a result, no provision for U.S. federal income taxes is required.
The Fund may be subject to foreign taxation related to income received, capital gains on the sale of securities and certain foreign currency transactions in the foreign jurisdictions in which it invests. Foreign taxes, if any, are recorded based on the tax regulations and rates that exist in the foreign markets in which the Fund invests. When a capital gain tax is determined to apply the Fund records an estimated deferred tax liability in an amount that would be payable if the securities were disposed of on the valuation date. As a result of several court cases, in certain countries across the European Union, the Fund has filed additional tax reclaims for previously withheld taxes on dividends earned in those countries. These additional filings are subject to various administrative proceedings by the local jurisdictions’ tax authorities within the European Union, as well as a number of related judicial proceedings. At this time, uncertainty exists as to the ultimate resolution of these proceedings, the likelihood of receipt of these reclaims, and the potential timing of payment, and accordingly, no amounts are reflected in the financial statements.
The Fund recognizes the tax benefits of uncertain tax positions only when the position is “more likely than not” to be sustained upon examination by the tax authorities based on the technical merits of the tax position. As of December 31, 2014, and for all open tax years, the Fund has determined that no liability for unrecognized tax benefits is required in the Fund’s financial statements related to uncertain tax positions taken on a tax return (or expected to be taken on future tax returns). Open tax years are those that remain subject to examination and are based on each tax jurisdiction statute of limitation.
franklintempleton.com
Annual Report
| 37
FRANKLIN MUTUAL QUEST FUND
NOTES TO FINANCIAL STATEMENTS
1. Organization and Significant Accounting
Policies (continued)
j. Security Transactions, Investment Income, Expenses and Distributions
Security transactions are accounted for on trade date. Realized gains and losses on security transactions are determined on a specific identification basis. Interest income and estimated expenses are accrued daily. Amortization of premium and accretion of discount on debt securities are included in interest income. Dividend income and dividends declared on securities sold short are recorded on the ex-dividend date except for certain foreign securities where the dividend rate is not available. In such cases, the dividend is recorded as soon as the information is received by the Fund. Distributions to shareholders are recorded on the ex-dividend date and are determined according to income tax regulations (tax basis). Distributable earnings determined on a tax basis may differ from earnings recorded in accordance with U.S. GAAP. These differences may be permanent or temporary. Permanent differences are reclassified among capital accounts to reflect their tax character. These reclassifications have no impact on net assets or the results of operations. Temporary differences are not reclassified, as they may reverse in subsequent periods.
Common expenses incurred by the Trust are allocated among the funds based on the ratio of net assets of each fund to the combined net assets of the Trust. Fund specific expenses are charged directly to the fund that incurred the expense.
Realized and unrealized gains and losses and net investment income, not including class specific expenses, are allocated daily to each class of shares based upon the relative proportion of net assets of each class. Differences in per share distributions, by class, are generally due to differences in class specific expenses.
k. Accounting Estimates
The preparation of financial statements in accordance with U.S. GAAP requires management to make estimates and assumptions that affect the reported amounts of assets and liabilities at the date of the financial statements and the amounts of income and expenses during the reporting period. Actual results could differ from those estimates.
l. Guarantees and Indemnifications
Under the Trust’s organizational documents, its officers and trustees are indemnified by the Trust against certain liabilities arising out of the performance of their duties to the Trust. Additionally, in the normal course of business, the Trust, on behalf of the Fund, enters into contracts with service providers that contain general indemnification clauses. The Trust’s maximum exposure under these arrangements is unknown as this would involve future claims that may be made against the Trust that have not yet occurred. Currently, the Trust expects the risk of loss to be remote.
2. Shares of Beneficial Interest
At December 31, 2014, there were an unlimited number of shares authorized (without par value). Transactions in the Fund’s shares were as follows:
| Year Ended December 31, | ||||||||||
| 2014 | 2013 | |||||||||
| Shares | Amount | Shares | Amount | |||||||
| Class Z Shares: | ||||||||||
| Shares sold | 13,791,131 | $ | 254,628,820 | 11,698,858 | $ | 217,333,009 | ||||
| Shares issued in reinvestment of distributions | 33,993,990 | 551,437,500 | 29,082,475 | 524,878,902 | ||||||
| Shares redeemed | (28,713,574 | ) | (526,182,344 | ) | (22,293,224 | ) | (412,854,945 | ) | ||
| Net increase (decrease) | 19,071,547 | $ | 279,883,976 | 18,488,109 | $ | 329,356,966 | ||||
| Class A Shares: | ||||||||||
| Shares sold | 12,523,961 | $ | 230,093,834 | 12,521,572 | $ | 230,284,598 | ||||
| Shares issued in reinvestment of distributions | 11,754,465 | 188,443,537 | 9,440,266 | 168,652,419 | ||||||
| Shares redeemed | (13,468,589 | ) | (245,444,552 | ) | (12,865,192 | ) | (236,440,048 | ) | ||
| Net increase (decrease) | 10,809,837 | $ | 173,092,819 | 9,096,646 | $ | 162,496,969 | ||||
38 | Annual Report
franklintempleton.com
| FRANKLIN MUTUAL QUEST FUND | |||||||||||
| NOTES TO FINANCIAL STATEMENTS | |||||||||||
| Year Ended December 31, | |||||||||||
| 2014 | 2013 | a | |||||||||
| Shares | Amount | Shares | Amount | ||||||||
| Class B Sharesb: | |||||||||||
| Shares sold | 619 | $ | 10,718 | ||||||||
| Shares redeemed | (58,326 | ) | (1,001,717 | ) | |||||||
| Net increase (decrease) | (57,707 | ) | $ | (990,999 | ) | ||||||
| Class C Shares: | |||||||||||
| Shares sold | 2,624,276 | $ | 47,212,405 | 2,814,368 | $ | 51,317,041 | |||||
| Shares issued in reinvestment of distributions | 3,246,333 | 51,269,278 | 2,705,655 | 47,704,834 | |||||||
| Shares redeemed | (3,524,189 | ) | (62,862,948 | ) | (3,207,256 | ) | (57,737,368 | ) | |||
| Net increase (decrease) | 2,346,420 | $ | 35,618,735 | 2,312,767 | $ | 41,284,507 | |||||
| Class R Shares: | |||||||||||
| Shares sold | 57,363 | $ | 1,046,886 | 33,864 | $ | 637,240 | |||||
| Shares issued in reinvestment of distributions | 5,648 | 89,702 | 5,249 | 92,616 | |||||||
| Shares redeemed | (68,294 | ) | (1,248,291 | ) | (4,282 | ) | (77,916 | ) | |||
| Net increase (decrease) | (5,283 | ) | $ | (111,703 | ) | 34,831 | $ | 651,940 | |||
| Class R6 Shares: | |||||||||||
| Shares sold | 2,577,392 | $ | 48,100,007 | 275 | $ | 5,000 | |||||
| Shares issued in reinvestment of distributions | 377,501 | 6,108,898 | — | — | |||||||
| Shares redeemed | (217,161 | ) | (4,052,329 | ) | — | — | |||||
| Net increase (decrease) | 2,737,732 | $ | 50,156,576 | 275 | $ | 5,000 | |||||
| aFor the period May 1, 2013 (effective date) to December 31, 2013, for Class R6. | |||||||||||
| bEffective March 22, 2013, all Class B shares were converted to Class A. | |||||||||||
3. Transactions with Affiliates
Franklin Resources, Inc. is the holding company for various subsidiaries that together are referred to as Franklin Templeton Investments. Certain officers and trustees of the Fund are also officers and/or directors of the following subsidiaries:
| Subsidiary | Affiliation |
| Franklin Mutual Advisers, LLC (Franklin Mutual) | Investment manager |
| Franklin Templeton Services, LLC (FT Services) | Administrative manager |
| Franklin Templeton Distributors, Inc. (Distributors) | Principal underwriter |
| Franklin Templeton Investor Services, LLC (Investor Services) | Transfer agent |
a. Management Fees
The Fund pays an investment management fee to Franklin Mutual based on the average daily net assets of the Fund as follows:
| Annualized Fee Rate | Net Assets | |
| 0.675 | % | Up to and including $5 billion |
| 0.645 | % | Over $5 billion, up to and including $7 billion |
| 0.625 | % | Over $7 billion, up to and including $10 billion |
| 0.615 | % | In excess of $10 billion |
franklintempleton.com
Annual Report
| 39
FRANKLIN MUTUAL QUEST FUND
NOTES TO FINANCIAL STATEMENTS
3. Transactions with Affiliates (continued)
a. Management Fees (continued)
Effective July 1, 2014, the Fund combined its investment management and administration agreements as approved by the Board. The fees paid under the combined agreement do not exceed the aggregate fees that were paid under the separate agreements.
Prior to July 1, 2014, the Fund paid fees to Franklin Mutual based on the average daily net assets of the Fund as follows:
| Annualized Fee Rate | Net Assets | |
| 0.600 | % | Up to and including $5 billion |
| 0.570 | % | Over $5 billion, up to and including $7 billion |
| 0.550 | % | Over $7 billion, up to and including $10 billion |
| 0.540 | % | In excess of $10 billion |
b. Administrative Fees
Effective July 1, 2014, under an agreement with Franklin Mutual, FT Services provides administrative services to the Fund. The fee is paid by Franklin Mutual based on the Fund’s average daily net assets, and is not an additional expense of the Fund.
Prior to July 1, 2014, the Fund paid its allocated share of an administrative fee to FT Services based on the Trust’s aggregate average daily net assets as follows:
| Annualized Fee Rate | Net Assets | |
| 0.150 | % | Up to and including $200 million |
| 0.135 | % | Over $200 million, up to and including $700 million |
| 0.100 | % | Over $700 million, up to and including $1.2 billion |
| 0.075 | % | In excess of $1.2 billion |
c. Distribution Fees
The Board has adopted distribution plans for each share class, with the exception of Class Z and Class R6 shares, pursuant to Rule 12b-1 under the 1940 Act. Distribution fees are not charged on shares held by affiliates. Under the Fund’s Class A reimbursement distribution plan, the Fund reimburses Distributors for costs incurred in connection with the servicing, sale and distribution of the Fund’s shares up to the maximum annual plan rate. Under the Class A reimbursement distribution plan, costs exceeding the maximum for the current plan year cannot be reimbursed in subsequent periods. In addition, under the Fund’s Class C and R compensation distribution plans, the Fund pays Distributors for costs incurred in connection with the servicing, sale and distribution of the Fund’s shares up to the maximum annual plan rate for each class. The plan year, for purposes of monitoring compliance with the maximum annual plan rates, is February 1 through January 31 for each fund.
The maximum annual plan rates, based on the average daily net assets, for each class, are as follows:
| Class A | 0.35 | % |
| Class C | 1.00 | % |
| Class R | 0.50 | % |
The Board has set the current rate at 0.30% per year for Class A shares until further notice and approval by the Board.
40 | Annual Report
franklintempleton.com
FRANKLIN MUTUAL QUEST FUND
NOTES TO FINANCIAL STATEMENTS
d. Sales Charges/Underwriting Agreements
Front-end sales charges and contingent deferred sales charges (CDSC) do not represent expenses of the Fund. These charges are deducted from the proceeds of sales of Fund shares prior to investment or from redemption proceeds prior to remittance, as applicable. Distributors has advised the Fund of the following commission transactions related to the sales and redemptions of the Fund’s shares for the year:
| Sales charges retained net of commissions paid to unaffiliated | ||
| broker/dealers | $ | 658,957 |
| CDSC retained | $ | 19,616 |
e. Transfer Agent Fees
Each class of shares, except for Class R6, pays transfer agent fees to Investor Services for its performance of shareholder servicing obligations and reimburses Investor Services for out of pocket expenses incurred, including shareholding servicing fees paid to third parties. These fees are allocated daily based upon their relative proportion of such classes’ aggregate net assets. Class R6 pays Investor Services transfer agent fees specific to that class.
For the year ended December 31, 2014, the Fund paid transfer agent fees of $4,553,623, of which $2,468,171 was retained by Investor Services.
f. Waiver and Expense Reimbursements
Investor Services has contractually agreed in advance to waive or limit its fees so that the Class R6 transfer agent fees do not exceed 0.01% until April 30, 2015. There were no Class R6 transfer agent fees waived during the year ended December 31, 2014.
4. Expense Offset Arrangement
The Fund has entered into an arrangement with its custodian whereby credits realized as a result of uninvested cash balances are used to reduce a portion of the Fund’s custodian expenses. During the year ended December 31, 2014, the custodian fees were reduced as noted in the Statement of Operations.
5. Independent Trustees’ Retirement Plan
On January 1, 1993, the Trust adopted an Independent Trustees’ Retirement Plan (Plan). The Plan is an unfunded defined benefit plan that provides benefit payments to Trustees whose length of service and retirement age meets the eligibility requirements of the Plan. Benefits under the Plan are based on years of service and fees paid to each trustee at the time of retirement. Effective in December 1996, the Plan was closed to new participants.
During the year ended December 31, 2014, the Fund’s projected benefit obligation and benefit payments under the Plan were as follows:
| aProjected benefit obligation at December 31, 2014 | $ | 240,985 | |
| bDecrease in projected benefit obligation | $ | 8,529 | |
| Benefit payments made to retired trustees | $ | (6,011 | ) |
aThe projected benefit obligation is included in trustees’ fees and expenses in the Statement of Assets and Liabilities.
bThe increase in projected benefit obligation is included in trustees’ fees and expenses in the Statement of Operations.
franklintempleton.com
Annual Report
| 41
FRANKLIN MUTUAL QUEST FUND
NOTES TO FINANCIAL STATEMENTS
6. Income Taxes
The tax character of distributions paid during the years ended December 31, 2014 and 2013, was as follows:
| 2014 | 2013 | |||
| Distributions paid from: | ||||
| Ordinary income | $ | 465,683,084 | $ | 494,364,532 |
| Long term capital gain | 366,491,985 | 278,189,331 | ||
| $ | 832,175,069 | $ | 772,553,863 |
At December 31, 2014, the cost of investments, net unrealized appreciation (depreciation), undistributed ordinary income and undistributed long term capital gains for income tax purposes were as follows:
| Cost of investments | $ | 5,572,861,211 | |
| Unrealized appreciation | $ | 767,112,420 | |
| Unrealized depreciation | (419,923,414 | ) | |
| Net unrealized appreciation (depreciation) | $ | 347,189,006 | |
| Undistributed ordinary income | $ | 14,109,666 | |
| Undistributed long term capital gains | 41,281,438 | ||
| Distributable earnings | $ | 55,391,104 | |
Differences between income and/or capital gains as determined on a book basis and a tax basis are primarily due to differing treatments of foreign currency transactions, bond discounts and premiums, tax straddles and wash sales.
7. Investment Transactions
Purchases and sales of investments (excluding short term securities and securities sold short) for the year ended December 31, 2014, aggregated $3,932,173,925 and $3,814,590,885, respectively.
Transactions in options written during the year ended December 31, 2014, were as follows:
| Number of | |||||
| Contracts | Premiums | ||||
| Options outstanding at December 31, 2013 | 15,000 | $ | 5,365,918 | ||
| Options written | 107,643 | 30,947,272 | |||
| Options expired | (9,000 | ) | (1,247,026 | ) | |
| Options exercised | (10,075 | ) | (6,205,080 | ) | |
| Options closed | (89,568 | ) | (26,749,054 | ) | |
| Options outstanding at December 31, 2014 | 14,000 | $ | 2,112,030 |
See Notes 1(d) and 10 regarding derivative financial instruments and other derivative information, respectively.
8. Credit Risk and Defaulted Securities
The Fund may purchase the pre-default or defaulted debt of distressed companies. Distressed companies are financially troubled and are about to be or are already involved in financial restructuring or bankruptcy. Risks associated with purchasing these securities include the possibility that the bankruptcy or other restructuring process takes longer than expected, or that distributions in restructuring are less than anticipated, either or both of which may result in unfavorable consequences to the Fund. If it becomes probable that the income on debt securities, including those of distressed companies, will not be collected, the Fund discontinues accruing income and recognizes an adjustment for uncollectible interest.
42 | Annual Report
franklintempleton.com
FRANKLIN MUTUAL QUEST FUND
NOTES TO FINANCIAL STATEMENTS
At December 31, 2014, the aggregate long value of distressed company securities for which interest recognition has been discontinued was $251,602,066, representing 4.23% of the Fund’s net assets. For information as to specific securities, see the accompanying Statement of Investments.
9. Restricted Securities
The Fund invests in securities that are restricted under the Securities Act of 1933 (1933 Act) or which are subject to legal, contractual, or other agreed upon restrictions on resale. Restricted securities are often purchased in private placement transactions, and cannot be sold without prior registration unless the sale is pursuant to an exemption under the 1933 Act. Disposal of these securities may require greater effort and expense, and prompt sale at an acceptable price may be difficult. The Fund may have registration rights for restricted securities. The issuer generally incurs all registration costs.
At December 31, 2014, the Fund held investments in restricted securities, excluding certain securities exempt from registration under the 1933 Act deemed to be liquid, as follows:
| Principal | ||||||
| Amount/ | ||||||
| Shares/ | Acquisition | |||||
| Warrants | Issuer | Dates | Cost | Value | ||
| 9,272 | Broadband Ventures III LLC, secured promissory note, 5.00%, | |||||
| 2/01/12 | 7/01/10 - 11/30/12 | $ | 9,272 | $ | — | |
| 16,133,491 | FIM Coinvestor Holdings I, LLC | 11/20/06 - 6/02/09 | — | — | ||
| 2,363,058 | International Automotive Components Group Brazil LLC | 4/13/06 - 12/26/08 | 1,569,318 | 223,498 | ||
| 18,661,349 | International Automotive Components Group North America LLC | 1/02/06 - 3/18/13 | 15,279,344 | 14,130,000 | ||
| 1,110,000 | aLee Enterprises Inc., wts., 12/31/22 | 3/31/14 | 1,490,026 | 1,831,500 | ||
| 97,300 | Olympus Re Holdings Ltd. | 12/19/01 | 9,089,825 | — | ||
| Total Restricted Securities (Value is 0.27% of Net Assets) | $ | 27,437,785 | $ | 16,184,998 | ||
| aThe Fund also invests in unrestricted securities or other investments in the issuer, valued at $105,712,969 as of December 31, 2014. | ||||||
10. Other Derivative Information
At December 31, 2014, the Fund’s investments in derivative contracts are reflected on the Statement of Assets and Liabilities as follows:
| Asset Derivatives | Liability Derivatives | ||||||
| Derivative Contracts | |||||||
| Not Accounted for as | Statement of Assets and | Statement of Assets and | |||||
| Hedging Instruments | Liabilities Location | Fair Value | Liabilities Location | Fair Value | |||
| Foreign exchange | |||||||
| contracts | Unrealized appreciation on forward | $ | 71,750,736 | a | Unrealized depreciation on forward | $ | 4,199,174 |
| exchange contracts / Net assets | exchange contracts | ||||||
| consist of – net unrealized | |||||||
| appreciation (depreciation) | |||||||
| Equity contracts | Investments, at value | 20,000 | Options written, at value | 920,000 |
aIncludes cumulative appreciation (depreciation) of futures contracts as reported in the Statement of Investments. Only current day’s variation margin is separately reported within the Statement of Assets and Liabilities.
franklintempleton.com
Annual Report
| 43
FRANKLIN MUTUAL QUEST FUND
NOTES TO FINANCIAL STATEMENTS
10. Other Derivative Information (continued)
For the year ended December 31, 2014, the effect of derivative contracts on the Fund’s Statement of Operations was as follows:
| Change in | ||||||
| Unrealized | ||||||
| Derivative Contracts | Realized Gain | Appreciation | ||||
| Not Accounted for as | (Loss) for | (Depreciation) | ||||
| Hedging Instruments | Statement of Operations Locations | the Year | for the Year | |||
| Foreign exchange contracts | Net realized gain (loss) from foreign currency transactions and | $ | 3,413,806 | $ | 104,509,906 | |
| futures contracts / Net change in unrealized appreciation | ||||||
| (depreciation) on translation of other assets and | ||||||
| liabilities denominated in foreign currencies | ||||||
| Equity contracts | Net realized gain (loss) from investments and written options / Net | 10,339,356 | (3,599,481 | ) | ||
| change in unrealized appreciation (depreciation) on investments | ||||||
For the year ended December 31, 2014, the average month end fair value of derivatives represented 0.84% of average month end net assets. The average month end number of open derivative contracts for the year was 208.
At December 31, 2014, the Fund’s OTC derivative assets and liabilities, are as follows:
| Gross and Net Amounts of Assets and Liabilities | ||||
| Presented in the Statement of Assets and Liabilities | ||||
| Assetsa | Liabilitiesa | |||
| Derivatives | ||||
| Forward exchange contracts | $ | 67,664,822 | $ | 4,199,174 |
aAbsent an event of default or early termination, OTC derivative assets and liabilities are presented gross and not offset in the Statement of Assets and Liabilities.
At December 31, 2014, the Fund’s OTC derivative assets which may be offset against the Fund’s OTC derivative liabilities and collateral received from the counterparty, is as follows:
| Amounts Not Offset in the | |||||||||||||
| Statement of Assets and Liabilities | |||||||||||||
| Gross and | |||||||||||||
| Net Amounts of | Financial | Financial | |||||||||||
| Assets Presented in | Instruments | Instruments | Cash | Net Amount | |||||||||
| the Statement of | Available for | Collateral | Collateral | (Not less | |||||||||
| Assets and Liabilities | Offset | Received a,b | Receivedb | than zero) | |||||||||
| Counterparty | |||||||||||||
| BANT | $ | 14,877,689 | $ | (1,412,207 | ) | $ | (13,465,482 | ) | $ | — | $ | — | |
| BBU | 16 | (16 | ) | — | — | — | |||||||
| BONY | 643,256 | (116,138 | ) | (527,118 | ) | — | — | ||||||
| DBFX | 10,380,699 | (225,414 | ) | — | (9,440,000 | ) | 715,285 | ||||||
| FBCO | 10,915,471 | (158,799 | ) | (10,756,672 | ) | — | — | ||||||
| HSBC | 11,863,675 | (1,833,003 | ) | (10,030,672 | ) | — | — | ||||||
| SCBT | 5,930,187 | — | — | (5,930,187 | ) | — | |||||||
| SSBT | 13,053,829 | — | — | — | 13,053,829 | ||||||||
| Total | $ | 67,664,822 | $ | (3,745,577 | ) | $ | (34,779,944 | ) | $ | (15,370,187 | ) | $ | 13,769,114 |
aAt December 31, 2014, the Fund received Federal Republic of Germany Bonds and U.S. Treasury Bonds and Notes as collateral for derivatives.
bIn some instances, the collateral amounts disclosed in the table above were adjusted due to the requirement to limit collateral amounts to avoid the effect of
overcollateralization. Actual collateral received and/or pledged may be more than the amounts disclosed herein.
44 | Annual Report
franklintempleton.com
FRANKLIN MUTUAL QUEST FUND
NOTES TO FINANCIAL STATEMENTS
At December 31, 2014, the Fund’s OTC derivative liabilities which may be offset against the Fund’s OTC derivative assets and collateral pledged to the counterparty, is as follows:
| Amounts Not Offset in the | |||||||||||
| Statement of Assets and Liabilities | |||||||||||
| Gross and | |||||||||||
| Net Amounts of | Financial | Financial | |||||||||
| Liabilities Presented in | Instruments | Instruments | Cash | Net Amount | |||||||
| the Statement of | Available for | Collateral | Collateral | (Not less | |||||||
| Assets and Liabilities | Offset | Pledgeda | Pledged | than zero) | |||||||
| Counterparty | |||||||||||
| BANT | $ | 1,412,207 | $ | (1,412,207 | ) | $ | — | $ | — | $ | — |
| BBU | 55,218 | (16 | ) | — | — | 55,202 | |||||
| BONY | 116,138 | (116,138 | ) | — | — | — | |||||
| DBFX | 225,414 | (225,414 | ) | — | — | — | |||||
| FBCO | 158,799 | (158,799 | ) | — | — | — | |||||
| HSBC | 1,833,003 | (1,833,003 | ) | — | — | — | |||||
| SCBT | — | — | — | — | — | ||||||
| SSBT | 398,395 | — | — | — | 398,395 | ||||||
| Total | $ | 4,199,174 | $ | (3,745,577 | ) | $ | — | $ | — | $ | 453,597 |
aIn some instances, the collateral amounts disclosed in the table above were adjusted due to the requirement to limit collateral amounts to avoid the effect of overcollateralization. Actual collateral received and/or pledged may be more than the amounts disclosed herein.
See Notes 1(d) and 7 regarding derivative financial instruments and investment transactions, respectively.
See Abbreviations on page 49.
11. Holdings of 5% Voting Securities of Portfolio Companies
The 1940 Act defines “affiliated companies” to include investments in portfolio companies in which a fund owns 5% or more of the outstanding voting securities. Investments in “affiliated companies” for the Fund for the year ended December 31, 2014, were as shown below.
| Number of | Number of | |||||||||||
| Shares/ | Shares/ | |||||||||||
| Warrants/ | Warrants/ | |||||||||||
| Principal | Principal | |||||||||||
| Amount Held | Amount Held | Value | ||||||||||
| at Beginning | Gross | Gross | at End | at End | Investment | Realized | ||||||
| Name of Issuer | of Year | Additions | Reductions | of Year | of Year | Income | Gain (Loss) | |||||
| Non-Controlled Affiliates | ||||||||||||
| Eastman Kodak Co. | 869,627 | 2,419,549 | (81,287 | ) | 3,207,889 | $ | 69,643,270 | $ | — | $ | 469,725 | |
| Eastman Kodak Co., First Lien | ||||||||||||
| Term Loan, 7.25%, 9/03/19 | 14,771,770 | — | (148,460 | ) | 14,623,310 | 14,611,129 | 1,063,942 | 1,988 | ||||
| Eastman Kodak Co., Second | ||||||||||||
| Lien Term Loan, 10.75%, | ||||||||||||
| 9/03/20 | 39,590,000 | 10,896,000 | — | 50,486,000 | 50,549,107 | 4,208,637 | — | |||||
| Eastman Kodak Co., wts., | ||||||||||||
| 9/03/18 | 38,301 | 5,020 | — | 43,321 | 329,240 | — | — | |||||
| Eastman Kodak Co., wts., | ||||||||||||
| 9/03/18 | 38,301 | 5,020 | — | 43,321 | 268,590 | — | — | |||||
| Imagine Group Holdings Ltd. | 350,236 | — | (350,236 | ) | — | — | — | (1,147,096 | ) | |||
| KGen Power Corp., 144A | 5,377,461 | — | — | 5,377,461 | 1,543,815 | — | 1,774,562 | |||||
| New Media Investment Group | ||||||||||||
| Inc. | — | 2,504,758 | (34,751 | ) | 2,470,007 | 58,366,265 | 1,028,569 | 280,130 | ||||
| Total Affiliated Securities (Value is 3.28% of Net Assets) | $ | 195,311,416 | $ | 6,301,148 | $ | 1,379,309 | ||||||
| franklintempleton.com | Annual Report | 45 | |||||||||||
FRANKLIN MUTUAL QUEST FUND
NOTES TO FINANCIAL STATEMENTS
12. Credit Facility
The Fund, together with other U.S. registered and foreign investment funds (collectively, Borrowers), managed by Franklin Templeton Investments, are borrowers in a joint syndicated senior unsecured credit facility totaling $1.5 billion (Global Credit Facility) which matured on February 13, 2015. This Global Credit Facility provides a source of funds to the Borrowers for temporary and emergency purposes, including the ability to meet future unanticipated or unusually large redemption requests. Effective February 13, 2015, the Borrowers renewed the Global Credit Facility for a total of $2 billion, which matures on February 12, 2016.
Under the terms of the Global Credit Facility, the Fund shall, in addition to interest charged on any borrowings made by the Fund and other costs incurred by the Fund, pay its share of fees and expenses incurred in connection with the implementation and maintenance of the Global Credit Facility, based upon its relative share of the aggregate net assets of all of the Borrowers, including an annual commitment fee of 0.07% based upon the unused portion of the Global Credit Facility. These fees are reflected in other expenses on the Statement of Operations. During the year ended December 31, 2014, the Fund did not use the Global Credit Facility.
13. Fair Value Measurements
The Fund follows a fair value hierarchy that distinguishes between market data obtained from independent sources (observable inputs) and the Fund’s own market assumptions (unobservable inputs). These inputs are used in determining the value of the Fund’s financial instruments and are summarized in the following fair value hierarchy:
- Level 1 – quoted prices in active markets for identical financial instruments
- Level 2 – other significant observable inputs (including quoted prices for similar financial instruments, interest rates, prepayment speed, credit risk, etc.)
- Level 3 – significant unobservable inputs (including the Fund’s own assumptions in determining the fair value of financial instruments)
The input levels are not necessarily an indication of the risk or liquidity associated with financial instruments at that level.
For movements between the levels within the fair value hierarchy, the Fund has adopted a policy of recognizing the transfers as of the date of the underlying event which caused the movement.
46 | Annual Report
franklintempleton.com
FRANKLIN MUTUAL QUEST FUND
NOTES TO FINANCIAL STATEMENTS
A summary of inputs used as of December 31, 2014, in valuing the Fund’s assets and liabilities carried at fair value, is as follows:
| Level 1 | Level 2 | Level 3 | Total | ||||||
| Assets: | |||||||||
| Investments in Securities: | |||||||||
| Equity Investments:a | |||||||||
| Auto Components | $ | — | $ | — | $ | 14,353,498 | $ | 14,353,498 | |
| Communications Equipment | — | — | 27,846,362 | 27,846,362 | |||||
| Media | 472,712,649 | — | 1,831,500 | 474,544,149 | |||||
| Real Estate Management & Development | — | — | 69,961,758 | 69,961,758 | |||||
| All Other Equity Investmentsb | 3,206,417,022 | — | —c | 3,206,417,022 | |||||
| Corporate Bonds, Notes and Senior Floating Rate | |||||||||
| Interests | — | 1,354,785,099 | 13,241,250 | 1,368,026,349 | |||||
| Corporate Notes and Senior Floating Rate Interests in | |||||||||
| Reorganization | — | 251,602,066 | —c | 251,602,066 | |||||
| Companies in Liquidation | 9,574,882 | 113,565,656 | 1,543,815 | c | 124,684,353 | ||||
| Asset-Backed Securities | — | 29,870,463 | — | 29,870,463 | |||||
| Municipal Bonds | — | 15,879,533 | — | 15,879,533 | |||||
| Options Purchased | 20,000 | — | — | 20,000 | |||||
| Short Term Investments | 293,275,609 | 43,569,055 | — | 336,844,664 | |||||
| Total Investments in Securities | $ | 3,982,000,162 | $ | 1,809,271,872 | $ | 128,778,183 | $ | 5,920,050,217 | |
| Other Financial Instruments | |||||||||
| Futures Contracts | $ | 4,085,914 | $ | — | $ | — | $ | 4,085,914 | |
| Forward Exchange Contracts | — | 67,664,822 | — | 67,664,822 | |||||
| Total Investments in Securities | $ | 4,085,914 | $ | 67,664,822 | $ | — | $ | 71,750,736 | |
| Liabilities: | |||||||||
| Other Financial Instruments | |||||||||
| Options Written | $ | 920,000 | $ | — | $ | — | $ | 920,000 | |
| Securities Sold Short | 54,161,437 | 29,722,115 | — | 83,883,552 | |||||
| Forward Exchange Contracts | — | 4,199,174 | — | 4,199,174 | |||||
| Total Other Financial Instruments | $ | 55,081,437 | $ | 33,921,289 | $ | — | $ | 89,002,726 |
aIncludes common and preferred stocks as well as other equity investments.
bFor detailed categories, see the accompanying Statement of Investments.
cIncludes securities determined to have no value at December 31, 2014.
franklintempleton.com
Annual Report
| 47
FRANKLIN MUTUAL QUEST FUND
NOTES TO FINANCIAL STATEMENTS
13. Fair Value Measurements (continued)
A reconciliation of assets in which Level 3 inputs are used in determining fair value is presented when there are significant Level 3 financial instruments at the end of the year. At December 31, 2014, the reconciliations of assets, is as follows:
| Net Change | ||||||||||||||||||||||||||||
| in Unrealized | ||||||||||||||||||||||||||||
| Net | Net | Appreciation | ||||||||||||||||||||||||||
| Balance at | Transfers | Transfers | Realized | Unrealized | Balance | (Depreciation) | ||||||||||||||||||||||
| Beginning | Into | Out of | Cost Basis | Gain | Appreciation | at End on Assets Held | ||||||||||||||||||||||
| of Year | Purchases | Sales | Level 3a | Level 3b Adjustmentsc | (Loss) (Depreciation) | of Year | at Year End | |||||||||||||||||||||
| Assets: | ||||||||||||||||||||||||||||
| Investments in Securities: | ||||||||||||||||||||||||||||
| Equity Investments:d | ||||||||||||||||||||||||||||
| Auto Components | $ | 11,019,335 | $ | — | $ | — | $ | — | $ | — | $ | — | $ | — | $ | 3,334,163 | $ | 14,353,498 | $ | 3,334,163 | ||||||||
| Communications | ||||||||||||||||||||||||||||
| Equipment | — | — | — | — | — | — | — | 27,846,362 | 27,846,362 | 27,846,362 | ||||||||||||||||||
| Insurance | 2,558,824 | e | — | (2,439,846 | ) | — | — | (25,341 | ) | (1,147,096 | ) | 1,053,459 | —e | 25,341 | ||||||||||||||
| Leisure Equipment & | ||||||||||||||||||||||||||||
| Products | 28,675,515 | — | — | — | (24,340,860 | ) | — | — | (4,334,655 | ) | — | — | ||||||||||||||||
| Media | — | — | — | 1,490,026 | — | — | — | 341,474 | 1,831,500 | 341,474 | ||||||||||||||||||
| Real Estate Management & | ||||||||||||||||||||||||||||
| Development | 42,884,142 | — | — | — | — | — | — | 27,077,616 | 69,961,758 | 27,077,616 | ||||||||||||||||||
| Companies in Liquidation | —e | — | — | 1,344,365 | — | — | — | 199,450 | 1,543,815 | e | 199,450 | |||||||||||||||||
| Corporate Bonds, Notes and | ||||||||||||||||||||||||||||
| Senior Floating Rate | ||||||||||||||||||||||||||||
| Interests | — | 17,018,722 | — | — | — | — | — | (3,777,472 | ) | 13,241,250 | (3,777,472 | ) | ||||||||||||||||
| Total | $ | 85,137,816 | $ | 17,018,722 | $ | (2,439,846) $2,834,391 | $ | (24,340,860 | ) | $ | (25,341 | ) | $ | (1,147,096 | ) | $ | 51,740,397 | $ | 128,778,183 | $ | 55,046,934 | |||||||
aThe investments were transferred into Level 3 as a result of their value being determined using a significant unobservable input.
bThe investments were transferred out of Level 3 as a result of the removal of a significant unobservable valuation input.
cMay include accretion, amortization, partnership adjustments, and/or other cost basis adjustments.
dIncludes common and preferred stocks as well as other equity investments.
eIncludes securities determined to have no value.
48 | Annual Report
franklintempleton.com
FRANKLIN MUTUAL QUEST FUND
NOTES TO FINANCIAL STATEMENTS
Significant unobservable valuation inputs developed by the VLOC for material Level 3 financial instruments and impact to fair value as a result of changes in unobservable valuation inputs as of December 31, 2014, are as follows:
| Impact to Fair | |||||||
| Fair Value at | Valuation | Value if Input | |||||
| Description | End of Year | Technique | Unobservable Inputs | Amount | Increasesa | ||
| Assets: | |||||||
| Investments in Securities: | |||||||
| Equity Investments: | |||||||
| Auto Components. | $ | 14,130,000 | Market | Discount for lack of marketability | 10 | % | Decreaseb |
| comparables | EV / EBITDA multiple | 3.6 | x | Increaseb | |||
| Real Estate Management & | |||||||
| Development. | 69,961,758 | Market | Discount for lack of marketability | 8 | % | Decreaseb | |
| comparables | |||||||
| All Other Investmentsc | 44,686,425 | ||||||
| Total | $ | 128,778,183 | |||||
aRepresents the directional change in the fair value of the Level 3 financial instruments that would result from a significant and reasonable increase in the corresponding
input. A significant and reasonable decrease in the input would have the opposite effect. Significant impacts, if any, to fair value and/or net assets have been indicated.
bRepresents a significant impact to fair value but not net assets.
cIncludes fair value of immaterial financial instruments developed using various valuation techniques and unobservable inputs. May also include financial instruments with
values derived using prior transaction prices or third party pricing information without adjustment for which such inputs are also unobservable.
Abbreviations List
EBITDA EV | Earnings before interest, taxes, depreciation and amortization Enterprise value |
14. New Accounting Pronouncements
In June 2014, Financial Accounting Standards Board issued Accounting Standards Update (ASU) No. 2014-11, Transfers and Servicing (Topic 860), Repurchase-to-Maturity Transactions, Repurchase Financings, and Disclosures. The ASU changes the accounting for certain repurchase agreements and expands disclosure requirements related to repurchase agreements, securities lending, repurchase-to-maturity and similar transactions. The ASU is effective for interim and annual reporting periods beginning after December 15, 2014. Management has reviewed the requirements and believes the adoption of this ASU will not have a material impact on the financial statements.
15. Subsequent Events
The Fund has evaluated subsequent events through the issuance of the financial statements and determined that no events have occurred that require disclosure other than those already disclosed in the financial statements.
| Abbreviations | |||||||
| Counterparty | Currency | Selected Portfolio | |||||
| BANT | Bank of America N.A. | CAD | Canadian Dollar | ADR | American Depositary Receipt | ||
| BBU | Barclays Bank PLC | CHF | Swiss Franc | FRN | Floating Rate Note | ||
| BONY | Bank of New York Mellon | EUR | Euro | GO | General Obligation | ||
| DBFX | Deutsche Bank AG | GBP British Pound | PIK | Payment-In-Kind | |||
| FBCO | Credit Suisse Group AG | USD | United States Dollar | ||||
| HSBC | HSBC Bank USA, N.A. | ||||||
| SCBT | Standard Chartered Bank | ||||||
| SSBT | State Street Bank and Trust Co., N.A. | ||||||
| franklintempleton.com | Annual Report | | | 49 | ||||
FRANKLIN MUTUAL QUEST FUND
Report of Independent Registered Public Accounting Firm
To the Board of Trustees of Franklin Mutual Series Funds and Shareholders of the Franklin Mutual Quest Fund:
We have audited the accompanying statement of assets and liabilities, including the statement of investments, of Franklin Mutual Quest Fund (formerly, Mutual Quest Fund) (the “Fund”) (one of the funds constituting Franklin Mutual Series Funds), as of December 31, 2014, and the related statement of operations for the year then ended, the statements of changes in net assets for each of the two years in the period then ended, and the financial highlights for each of the periods indicated therein. These financial statements and financial highlights are the responsibility of the Fund’s management. Our responsibility is to express an opinion on these financial statements and financial highlights based on our audits.
We conducted our audits in accordance with the standards of the Public Company Accounting Oversight Board (United States). Those standards require that we plan and perform the audit to obtain reasonable assurance about whether the financial statements and financial highlights are free of material misstatement. We were not engaged to perform an audit of the Fund’s internal control over financial reporting. Our audits included consideration of internal control over financial reporting as a basis for designing audit procedures that are appropriate in the circumstances, but not for the purpose of expressing an opinion on the effectiveness of the Fund’s internal control over financial reporting. Accordingly, we express no such opinion. An audit also includes examining, on a test basis, evidence supporting the amounts and disclosures in the financial statements and financial highlights, assessing the accounting principles used and significant estimates made by management, and evaluating the overall financial statement presentation. Our procedures included confirmation of securities owned as of December 31, 2014, by correspondence with the custodian and brokers, or by other appropriate auditing procedures where replies from the brokers were not received. We believe that our audits provide a reasonable basis for our opinion.
In our opinion, the financial statements and financial highlights referred to above present fairly, in all material respects, the financial position of Franklin Mutual Quest Fund (one of the funds constituting Franklin Mutual Series Funds) at December 31, 2014, the results of its operations for the year then ended, the changes in its net assets for each of the two years in the period then ended, and the financial highlights for each of the periods indicated therein, in conformity with U.S. generally accepted accounting principles.

Boston, Massachusetts
February 18, 2015
50 | Annual Report
franklintempleton.com
FRANKLIN MUTUAL QUEST FUND
Tax Information (unaudited)
Under Section 852(b)(3)(C) of the Internal Revenue Code (Code), the Fund hereby reports the maximum amount allowable but no less than $366,491,985 as a long term capital gain dividend for the fiscal year ended December 31, 2014.
Under Section 871(k)(2)(C) of the Code, the Fund hereby reports the maximum amount allowable but no less than $199,614,723 as a short term capital gain dividend for purposes of the tax imposed under Section 871(a)(1)(A) of the Code for the fiscal year ended December 31, 2014.
Under Section 854(b)(1)(A) of the Code, the Fund hereby reports 6.77% of the ordinary income dividends as income qualifying for the dividends received deduction for the fiscal year ended December 31, 2014.
Under Section 854(b)(1)(B) of the Code, the Fund hereby reports the maximum amount allowable but no less than $176,325,746 as qualified dividends for purposes of the maximum rate under Section 1(h)(11) of the Code for the fiscal year ended December 31, 2014. Distributions, including qualified dividend income, paid during calendar year 2014 will be reported to shareholders on Form 1099-DIV by mid-February 2015. Shareholders are advised to check with their tax advisors for information on the treatment of these amounts on their individual income tax returns.
Under Section 871(k)(1)(C) of the Code, the Fund hereby reports the maximum amount allowable but no less than $95,790,310 as interest related dividends for purposes of the tax imposed under Section 871(a)(1)(A) of the Code for the fiscal year ended December 31, 2014.
franklintempleton.com
Annual Report
| 51
FRANKLIN MUTUAL QUEST FUND
Board Members and Officers
The name, year of birth and address of the officers and board members, as well as their affiliations, positions held with the Fund, principal occupations during at least the past five years and number of portfolios overseen in the Franklin Templeton Investments fund complex are shown below. Generally, each board member serves until that person’s successor is elected and qualified.
| Independent Board Members | ||||
| Number of Portfolios in | ||||
| Name, Year of Birth | Length of | Fund Complex Overseen | Other Directorships Held During | |
| and Address | Position | Time Served | by Board Member* | at Least the Past 5 Years |
| Edward I. Altman, Ph.D. (1941) | Trustee | Since 1987 | 10 | None |
| c/o Franklin Mutual Advisers, LLC | ||||
| 101 John F. Kennedy Parkway | ||||
| Short Hills, NJ 07078-2789 | ||||
Principal Occupation During at Least the Past 5 Years:
Max L. Heine Professor of Finance and Director of The Credit and Debt Markets Research Program, Salomon Center, Stern School of Business, New York University; editor and author of numerous financial publications; financial consultant; an adviser to numerous financial and publishing organizations; and formerly, Vice Director, Salomon Center, Stern School of Business, New York University.
| Ann Torre Bates (1958) | Trustee | Since 1995 | 36 | Navient Corporation (loan |
| c/o Franklin Mutual Advisers, LLC | management, servicing and asset | |||
| 101 John F. Kennedy Parkway | recovery) (May 2014), Ares Capital | |||
| Short Hills, NJ 07078-2789 | Corporation (specialty finance | |||
| company) (2010-present), United | ||||
| Natural Foods, Inc. (distributor of | ||||
| natural, organic and specialty foods) | ||||
| (2013-present), Allied Capital | ||||
| Corporation (financial services) | ||||
| (2003-2010) and SLM Corporation | ||||
| (Sallie Mae) (1997-2014). | ||||
Principal Occupation During at Least the Past 5 Years:
Director of various companies; and formerly, Executive Vice President and Chief Financial Officer, NHP Incorporated (manager of multifamily housing) (1995-1997); and Vice President and Treasurer, US Airways, Inc. (until 1995).
| Burton J. Greenwald (1929) Trustee | Since 2002 | 17 | Franklin Templeton Emerging Markets |
| c/o Franklin Mutual Advisers, LLC | Debt Opportunities Fund PLC and | ||
| 101 John F. Kennedy Parkway | Fiduciary International Ireland Limited. | ||
| Short Hills, NJ 07078-2789 |
Principal Occupation During at Least the Past 5 Years:
Managing Director, B.J. Greenwald Associates (management consultants to the financial services industry); and formerly, Chairman, Fiduciary Trust International Funds; Executive Vice President, L.F Rothschild Fund Management, Inc.; President and Director, Merit Mutual Funds; President, Underwriting Division and Director, National Securities & Research Corporation; Governor, Investment Company Institute; and Chairman, ICI Public Information Committee.
| Keith E. Mitchell (1954) | Trustee | Since 2009 | 10 | None |
| c/o Franklin Mutual Advisers, LLC | ||||
| 101 John F. Kennedy Parkway | ||||
| Short Hills, NJ 07078-2789 | ||||
Principal Occupation During at Least the Past 5 Years:
Managing Member, Mitchell, Hartley & Bechtel Advisers, LLC (formerly, Mitchell Advisers, LLC) (advisory firm); director of various boards of asset management firms; and formerly, Managing Director, Putnam Lovell NBF.
52 | Annual Report
franklintempleton.com
FRANKLIN MUTUAL QUEST FUND
| Independent Board Members (continued) | ||||
| Number of Portfolios in | ||||
| Name, Year of Birth | Length of | Fund Complex Overseen | Other Directorships Held During | |
| and Address | Position | Time Served | by Board Member* | at Least the Past 5 Years |
| Charles Rubens II (1930) | Trustee | Since 1998 | 17 | None |
| c/o Franklin Mutual Advisers, LLC | ||||
| 101 John F. Kennedy Parkway | ||||
| Short Hills, NJ 07078-2789 | ||||
Principal Occupation During at Least the Past 5 Years:
Private investor and president of non-profit organizations; and formerly, an executive of Time, Inc.; and Trustee of Colorado College.
| Jan Hopkins Trachtman (1947) Trustee | Since 2009 | 10 | None |
| c/o Franklin Mutual Advisers, LLC | |||
| 101 John F. Kennedy Parkway | |||
| Short Hills, NJ 07078-2789 |
Principal Occupation During at Least the Past 5 Years:
President and Founder, The Jan Hopkins Group (communications consulting firm); President, Economic Club of New York; serves on Advisory Board of Knight Bagehot Fellowship; and formerly, Anchor/Correspondent, CNN Financial News (until 2003); Managing Director and Head of Client Communications, Citigroup Private Bank (until 2005); Off-Air Reporter, ABC News’ World News Tonight; and Editor, CBS Network News.
| Robert E. Wade (1946) | Trustee and | Trustee since 1993 43 | El Oro Ltd (investments). | |
| c/o Franklin Mutual Advisers, LLC Chairman of | and Chairman of | |||
| 101 John F. Kennedy Parkway | the Board | the Board since | ||
| Short Hills, NJ 07078-2789 | 2005 | |||
| Principal Occupation During at Least the Past 5 Years: | ||||
| Attorney at law engaged in private practice (1972-2008) and member of various boards. | ||||
| Interested Board Members and Officers | ||||
| Number of Portfolios in | ||||
| Name, Year of Birth | Length of | Fund Complex Overseen | Other Directorships Held During | |
| and Address | Position | Time Served | by Board Member* | at Least the Past 5 Years |
| **Gregory E. Johnson (1961) | Trustee | Since 2007 | 147 | None |
| One Franklin Parkway | ||||
| San Mateo, CA 94403-1906 | ||||
Principal Occupation During at Least the Past 5 Years:
Chairman of the Board, Member – Office of the Chairman, Director, President and Chief Executive Officer, Franklin Resources, Inc.; officer and/or director or trustee, as the case may be, of some of the other subsidiaries of Franklin Resources, Inc. and of 44 of the investment companies in Franklin Templeton Investments; and Vice Chairman, Investment Company Institute.
| **Peter A. Langerman (1955) | Trustee, | Trustee since | 10 | American International Group, Inc. |
| c/o Franklin Mutual Advisers, LLC President, and | 2007, President, | (AIG) Credit Facility Trust (2010-2011). | ||
| 101 John F. Kennedy Parkway | Chief Executive and Chief | |||
| Short Hills, NJ 07078-2702 | Officer – | Executive Officer – | ||
| Investment | Investment | |||
| Management | Management since | |||
| 2005 | ||||
Principal Occupation During at Least the Past 5 Years:
Chairman of the Board, Chief Executive Officer and President, Franklin Mutual Advisers, LLC; officer and/or director, as the case may be, of four of the investment companies in Franklin Templeton Investments.
franklintempleton.com
Annual Report
| 53
| FRANKLIN MUTUAL QUEST FUND | ||||
| Interested Board Members and Officers (continued) | ||||
| Number of Portfolios in | ||||
| Name, Year of Birth | Length of | Fund Complex Overseen | Other Directorships Held During | |
| and Address | Position | Time Served | by Board Member* | at Least the Past 5 Years |
| Alison E. Baur (1964) | Vice President | Since 2012 | Not Applicable | Not Applicable |
| One Franklin Parkway | ||||
| San Mateo, CA 94403-1906 | ||||
Principal Occupation During at Least the Past 5 Years:
Deputy General Counsel, Franklin Templeton Investments; and officer of some of the other subsidiaries of Franklin Resources, Inc. and of 46 of the investment companies in Franklin Templeton Investments.
| Philippe Brugere-Trelat (1949) | Vice President | Since 2005 | Not Applicable | Not Applicable |
| 101 John F. Kennedy Parkway | ||||
| Short Hills NJ 07078-2789 |
Principal Occupation During at Least the Past 5 Years:
Executive Vice President, Franklin Mutual Advisers, LLC; officer of three of the investment companies in Franklin Templeton Investments; and formerly, Portfolio Manager of Eurovest SA (French registered Investment Company, Sicav).
| Laura F. Fergerson (1962) | Chief | Since 2009 | Not Applicable | Not Applicable |
| One Franklin Parkway | Executive | |||
| San Mateo, CA 94403-1906 | Officer – | |||
| Finance and | ||||
| Administration |
Principal Occupation During at Least the Past 5 Years:
Senior Vice President, Franklin Templeton Services, LLC; and officer of 46 of the investment companies in Franklin Templeton Investments
| Aliya S. Gordon (1973) | Vice President | Since 2009 | Not Applicable | Not Applicable |
| One Franklin Parkway | ||||
| San Mateo, CA 94403-1906 |
Principal Occupation During at Least the Past 5 Years:
Senior Associate General Counsel, Franklin Templeton Investments; officer of 46 of the investment companies in Franklin Templeton Investments; and formerly, Litigation Associate, Steefel, Levitt & Weiss, LLP (2000-2004).
| Steven J. Gray (1955) | Secretary and | Secretary since | Not Applicable | Not Applicable |
| One Franklin Parkway | Vice President | 2005 and Vice | ||
| San Mateo, CA 94403-1906 | President since | |||
| 2009 |
Principal Occupation During at Least the Past 5 Years:
Senior Associate General Counsel, Franklin Templeton Investments; Vice President, Franklin Templeton Distributors, Inc. and Franklin Alternative Strategies Advisers, LLC; and officer of 46 of the investment companies in Franklin Templeton Investments.
| Selena L. Holmes (1965) | Vice President | Since 2012 | Not Applicable | Not Applicable |
| 100 Fountain Parkway | – AML | |||
| St. Petersburg, FL 33716-1205 | Compliance |
Principal Occupation During at Least the Past 5 Years:
Director, Global Compliance Monitoring; Chief Compliance Officer, Franklin Alternative Strategies Advisers, LLC; Vice President, Franklin Templeton Companies, LLC; and officer of 46 of the investment companies in Franklin Templeton Investments.
54 | Annual Report
franklintempleton.com
FRANKLIN MUTUAL QUEST FUND
| Interested Board Members and Officers (continued) | ||||
| Number of Portfolios in | ||||
| Name, Year of Birth | Length of | Fund Complex Overseen | Other Directorships Held During | |
| and Address | Position | Time Served | by Board Member* | at Least the Past 5 Years |
| Robert G. Kubilis (1973) | Treasurer, | Since 2012 | Not Applicable | Not Applicable |
| 300 S.E. 2nd Street | Chief Financial | |||
| Fort Lauderdale, FL 33301-1923 | Officer and | |||
| Chief | ||||
| Accounting | ||||
| Officer | ||||
Principal Occupation During at Least the Past 5 Years:
Assistant Treasurer, Fund Accounting, Franklin Templeton Investments; and officer of four of the investment companies in Franklin Templeton Investments.
| Kimberly H. Novotny (1972) Vice President | Since 2013 | Not Applicable | Not Applicable |
| 300 S.E. 2nd Street | |||
| Fort Lauderdale, FL 33301-1923 |
Principal Occupation During at Least the Past 5 Years:
Associate General Counsel, Franklin Templeton Investments; Vice President and Secretary, Fiduciary Trust International of the South; Vice President, Templeton Investment Counsel, LLC; Assistant Secretary, Franklin Resources, Inc.; and officer of 46 of the investment companies in Franklin Templeton Investments.
| Robert C. Rosselot (1960) | Chief | Since 2013 | Not Applicable | Not Applicable |
| 300 S.E. 2nd Street | Compliance | |||
| Fort Lauderdale, FL 33301-1923 | Officer |
Principal Occupation During at Least the Past 5 Years:
Director, Global Compliance, Franklin Templeton Investments; Vice President, Franklin Templeton Companies, LLC; officer of 46 of the investment companies in Franklin Templeton Investments; and formerly, Senior Associate General Counsel, Franklin Templeton Investments (2007-2013); and Secretary and Vice President, Templeton Group of Funds (2004-2013).
| Karen L. Skidmore (1952) | Vice President | Since 2009 | Not Applicable | Not Applicable |
| One Franklin Parkway | ||||
| San Mateo, CA 94403-1906 |
Principal Occupation During at Least the Past 5 Years:
Senior Associate General Counsel, Franklin Templeton Investments; and officer of 46 of the investment companies in Franklin Templeton Investments.
| Craig S. Tyle (1960) | Vice President | Since 2005 | Not Applicable | Not Applicable |
| One Franklin Parkway | ||||
| San Mateo, CA 94403-1906 |
Principal Occupation During at Least the Past 5 Years:
General Counsel and Executive Vice President, Franklin Resources, Inc.; and officer of some of the other subsidiaries of Franklin Resources, Inc. and of 46 of the investment companies in Franklin Templeton Investments.
franklintempleton.com
Annual Report
| 55
FRANKLIN MUTUAL QUEST FUND
| Interested Board Members and Officers (continued) | ||||
| Number of Portfolios in | ||||
| Name, Year of Birth | Length of | Fund Complex Overseen | Other Directorships Held During | |
| and Address | Position | Time Served | by Board Member* | at Least the Past 5 Years |
| Lori A. Weber (1964) | Vice President | Since 2011 | Not Applicable | Not Applicable |
| 300 S.E. 2nd Street | ||||
| Fort Lauderdale, FL 33301-1923 | ||||
Principal Occupation During at Least the Past 5 Years:
Senior Associate General Counsel, Franklin Templeton Investments; Assistant Secretary, Franklin Resources, Inc.; Vice President and Secretary, Templeton Investment Counsel, LLC; Vice President, Fiduciary Trust International of the South; and officer of 46 of the investment companies in Franklin Templeton Investments.
*We base the number of portfolios on each separate series of the U.S. registered investment companies within the Franklin Templeton Investments fund complex. These portfolios have a common investment manager or affiliated investment managers.
**Gregory E. Johnson is considered to be an interested person of the Fund under the federal securities laws due to his position as an officer and director of Franklin Resources, Inc., which is the parent company of the Fund’s investment manager and distributor. Peter A. Langerman is considered to be an interested person of the Fund under the federal securities laws due to his position as an officer of Franklin Mutual Advisers, LLC, which is an affiliate of the Fund’s investment manager.
Note 1: Officer information is current as of the date of this report. It is possible that after this date, information about officers may change.
The Fund’s Board has determined that certain of the members of the Audit Committee, including Ann Torre Bates, are audit committee financial experts, and “independent,” under those provisions of the Sarbanes-Oxley Act of 2002, and the rules and form amendments adopted by the Securities and Exchange Commission, relating to audit committee financial experts.
The Statement of Additional Information (SAI) includes additional information about the board members and is available, without charge, upon request.
Shareholders may call (800) DIAL BEN/342-5236 to request the SAI.
56 | Annual Report
franklintempleton.com
FRANKLIN MUTUAL QUEST FUND
Shareholder Information
Proxy Voting Policies and Procedures
The Fund’s investment manager has established Proxy Voting Policies and Procedures (Policies) that the Fund uses to determine how to vote proxies relating to portfolio securities. Shareholders may view the Fund’s complete Policies online at franklintempleton.com. Alternatively, shareholders may request copies of the Policies free of charge by calling the Proxy Group collect at (954) 527-7678 or by sending a written request to: Franklin Templeton Companies, LLC, 300 S.E. 2nd Street, Fort Lauderdale, FL 33301, Attention: Proxy Group. Copies of the Fund’s proxy voting records are also made available online at franklintempleton.com and posted on the U.S. Securities and Exchange Commission’s website at sec.gov and reflect the most recent 12-month period ended June 30.
Quarterly Statement of Investments
The Fund files a complete statement of investments with the U.S. Securities and Exchange Commission for the first and third quarters for each fiscal year on Form N-Q. Shareholders may view the filed Form N-Q by visiting the Commission’s website at sec.gov. The filed form may also be viewed and copied at the Commission’s Public Reference Room in Washington, DC. Information regarding the operations of the Public Reference Room may be obtained by calling (800) SEC-0330.
Householding of Reports and Prospectuses
You will receive the Fund’s financial reports every six months as well as an annual updated summary prospectus (prospectus available upon request). To reduce Fund expenses, we try to identify related shareholders in a household and send only one copy of the financial reports and summary prospectus. This process, called “householding,” will continue indefinitely unless you instruct us otherwise. If you prefer not to have these documents householded, please call us at (800) 632-2301. At any time you may view current prospectuses/summary prospectuses and financial reports on our website. If you choose, you may receive these documents through electronic delivery.
franklintempleton.com
Annual Report
| 57
This page intentionally left blank.
This page intentionally left blank.
This page intentionally left blank.

Annual Report and Shareholder Letter
Franklin Mutual Quest Fund
Formerly, Mutual Quest Fund
Investment Manager
Franklin Mutual Advisers, LLC
Distributor
Franklin Templeton Distributors, Inc.
(800) DIAL BEN® / 342-5236
franklintempleton.com
Shareholder Services
(800) 632-2301 - (Class A, C, R & R6)
(800) 448-FUND - (Class Z)
Authorized for distribution only when accompanied or preceded by a summary prospectus and/or prospectus. Investors should carefully consider a fund’s investment goals, risks, charges and expenses before investing. A prospectus contains this and other information; please read it carefully before investing.
To help ensure we provide you with quality service, all calls to and from our service areas are monitored and/or recorded.
| © 2015 Franklin Templeton Investments. All rights reserved. | 475 A 02/15 |
Annual Report
and Shareholder Letter
December 31, 2014
Franklin Mutual Shares Fund
Formerly, Mutual Shares Fund

Sign up for electronic delivery at franklintempleton.com/edelivery
Franklin Templeton Investments
Gain From Our Perspective®
At Franklin Templeton Investments, we’re dedicated to one goal: delivering exceptional asset management for our clients. By bringing together multiple, world-class investment teams in a single firm, we’re able to offer specialized expertise across styles and asset classes, all supported by the strength and resources of one of the world’s largest asset managers. This has helped us to become a trusted partner to individual and institutional investors across the globe.
Focus on Investment Excellence
At the core of our firm, you’ll find multiple independent investment teams—each with a focused area of expertise—from traditional to alternative strategies and multi-asset solutions. And because our portfolio groups operate autonomously, their strategies can be combined to deliver true style and asset class diversification.
All of our investment teams share a common commitment to excellence grounded in rigorous, fundamental research and robust, disciplined risk management. Decade after decade, our consistent, research-driven processes have helped Franklin Templeton earn an impressive record of strong, long-term results.
Global Perspective Shaped by Local Expertise
In today’s complex and interconnected world, smart investing demands a global perspective. Franklin Templeton pioneered international investing over 60 years ago, and our expertise in emerging markets spans more than a quarter of a century. Today, our investment professionals are on the ground across the globe, spotting investment ideas and potential risks firsthand. These locally based teams bring in-depth understanding of local companies, economies and cultural nuances, and share their best thinking across our global research network.
Strength and Experience
Franklin Templeton is a global leader in asset management serving clients in over 150 countries.1 We run our business with the same prudence we apply to asset management, staying focused on delivering relevant investment solutions, strong long-term results and reliable, personal service. This approach, focused on putting clients first, has helped us to become one of the most trusted names in financial services.
1. As of 12/31/13. Clients are represented by the total number of shareholder accounts.
Not FDIC Insured | May Lose Value | No Bank Guarantee
| Contents | ||||
| Shareholder Letter | 1 | |||
| Annual Report | ||||
| Franklin Mutual Shares Fund | 4 | |||
| Performance Summary | 9 | |||
| Your Fund’s Expenses | 14 | |||
| Financial Highlights and | ||||
| Statement of Investments | 16 | |||
| Financial Statements | 29 | |||
| Notes to Financial Statements | 33 | |||
| Report of Independent Registered | ||||
| Public Accounting Firm | 48 | |||
| Tax Information | 49 | |||
| Board Members and Officers | 50 | |||
| Shareholder Information | 55 | |||
| | | 1 |
Annual Report
Franklin Mutual Shares Fund
(formerly, Mutual Shares Fund)
This annual report for Franklin Mutual Shares Fund covers the fiscal year ended December 31, 2014.
Your Fund’s Goals and Main Investments
The Fund seeks capital appreciation, with income as a secondary goal, by investing primarily in equity securities of companies the Fund’s managers believe are at prices below their intrinsic value. The Fund may invest up to 35% of its assets in foreign securities.
Performance Overview
The Fund’s Class Z shares delivered a cumulative total return of +7.60% for the 12 months ended December 31, 2014. For comparison, the Fund’s benchmark, the Standard & Poor’s 500 Index (S&P 500), which is a broad measure of U.S. stock performance, generated a +13.69% total return.1 You can find more of the Fund’s performance data in the Performance Summary beginning on page 9.
Performance data represent past performance, which does not guarantee future results. Investment return and principal value will fluctuate, and you may have a gain or loss when you sell your shares. Current performance may differ from figures shown. Please visit franklintempleton.com or call (800) 342-5236 for most recent month-end performance.
Economic and Market Overview
The global economy grew moderately during 2014 as U.S. economic growth expanded while growth rates in much of the rest of the world declined. U.S. economic activity was supported in some quarters by increased consumer spending, business investment and federal defense spending. The housing market strengthened, and lower gasoline prices and improved job growth contributed to rising retail sales. The U.S. Federal Reserve Board (Fed) began reducing its large-scale bond purchases $10 billion a month in January and ended the buying program in October. But it continued its practice of maintaining holdings of longer term securities at sizable levels. Toward period-end, the Fed stated that it could be patient with regard to

*Weightings may be negative or may not total 100% due to rounding, use of any derivatives, unsettled trades or other factors.
raising interest rates and that the interest rate might not rise for at least a couple of meetings, possibly implying at least the first two meetings of 2015.
Outside the U.S., the U.K. economy grew relatively well, supported by the services and manufacturing sectors. In the eurozone, economic growth remained subdued, as concerns persisted about the potential negative impacts to growth from the crisis in Ukraine and China’s moderating growth rate. In June, the European Central Bank (ECB) reduced its main
1. Source: Morningstar.
The index is unmanaged and includes reinvested dividends. One cannot invest directly in an index, and an index is not representative of the Fund’s portfolio. See www.franklintempletondatasources.com for additional data provider information.
The dollar value, number of shares or principal amount, and names of all portfolio holdings are listed in the Fund’s Statement of Investments (SOI).
The SOI begins on page 21.
4 | Annual Report
franklintempleton.com
FRANKLIN MUTUAL SHARES FUND
interest rate and, for the first time, set a negative deposit rate; the ECB reduced both rates again in September. The ECB broadened its monetary easing stance by implementing an asset purchase program to prevent deflation and stimulate the economy. Japan’s second- and third-quarter economic contractions indicated the economy was in a recession, although private consumption and exports improved in the third quarter. In October, the Bank of Japan expanded its stimulus measures amid weak domestic demand and as substantially lower crude oil prices exerted further downward pressure on inflation. Near period-end, Japan’s ruling coalition was reelected in early parliamentary elections and subsequently announced a fresh stimulus package aimed at reviving economic growth.
Global developed market stocks, as measured by the MSCI World Index, advanced overall during the 12-month period amid a generally accommodative monetary policy environment and continued strength in corporate earnings. In several emerging markets, economic growth generally moderated. Emerging market stocks overall, as measured by the MSCI Emerging Markets Index, fell for the year, amid headwinds such as soft domestic demand, weak exports, plummeting crude oil prices, regional geopolitical tensions and concerns about possible U.S. interest rate increases. Many emerging market currencies depreciated against the U.S. dollar, leading several central banks to raise interest rates seeking to support their currencies. Several other central banks lowered interest rates to promote economic growth. Gold prices ended the year lower amid benign global inflation and a strong U.S. dollar.
Top 10 Sectors/Industries
Based on Equity Securities as of 12/31/14
| % of Total | ||
| Net Assets | ||
| Insurance | 9.3 | % |
| Banks | 9.2 | % |
| Media | 8.8 | % |
| Pharmaceuticals | 6.8 | % |
| Oil, Gas & Consumable Fuels | 6.6 | % |
| Tobacco | 5.7 | % |
| Software | 4.9 | % |
| Health Care Equipment & Supplies | 4.0 | % |
| Technology Hardware, Storage & Peripherals | 3.5 | % |
| Food & Staples Retailing | 3.4 | % |
Investment Strategy
At Mutual Series, we are committed to our distinctive value approach to investing, which we believe can generate above-average risk-adjusted returns over time for our shareholders. Our major investment strategy is investing in undervalued stocks. When selecting undervalued equities, we are attracted to fundamentally strong companies with healthy balance sheets, high-quality assets, substantial free cash flow and shareholder-oriented management teams and whose stocks are trading at discounts to our assessment of the companies’ intrinsic or business value. We also look for asset-rich companies whose shares may be trading at depressed levels due to concerns over short-term earnings disappointments, litigation, management strategy or other perceived negatives. This strict value approach is not only intended to improve the likelihood of upside potential, but it is also intended to reduce the risk of substantial declines. While the vast majority of our undervalued equity investments are made in publicly traded companies globally, we may invest occasionally in privately held companies as well.
We complement this more traditional investment strategy with two others. One is distressed investing, a highly specialized field that has proven quite profitable during certain periods over the years. Distressed investing is complex and can take many forms. The most common distressed investment the Fund undertakes is the purchase of financially troubled or bankrupt companies’ debt at a substantial discount to face value. After the financially distressed company is reorganized, often in bankruptcy court, the old debt is typically replaced with new securities issued by the financially stronger company.
The other piece of our investment strategy is participating in arbitrage situations, another highly specialized field. When companies announce proposed mergers or takeovers, commonly referred to as “deals,” the target company may trade at a discount to the bid it ultimately accepts. One form of arbitrage involves purchasing the target company’s stock when it is trading below the value we believe it would receive in a deal. In keeping with our commitment to a relatively conservative investment approach, we typically focus our arbitrage efforts on announced deals, and eschew rumored deals or other situations we consider relatively risky.
In addition, it is our practice to hedge the Fund’s currency exposure when we deem it advantageous for our shareholders.
What is meant by “hedge”?
To hedge an investment is to take a position intended to offset potential losses/gains that may be incurred by a companion financial instrument.
franklintempleton.com
Annual Report
| 5
FRANKLIN MUTUAL SHARES FUND
Manager’s Discussion
Many Fund holdings increased in value during the 12-month period. Top contributors to performance included technology leader Apple, Teva Pharmaceutical Industries and retailer Kroger.
During the year Apple reported consistently good quarterly results, driven by its strong iPhone business. In addition, the company announced a trio of shareholder friendly actions. These included an enhanced share repurchase program of $90 billion, up from $60 billion, with the same end date of December 2015, an 8% increase in the dividend, and a seven-for-one stock split that went into effect in early June. In September, the company released its highly anticipated iPhone 6, which sold 10 million units in its first two days. The iPhone sales drove a strong fiscal fourth quarter via healthy sales volumes and a strong product mix that led to a higher average selling price for the period. In October, the company refreshed its product line-up ahead of the holiday season, including launches of the new iPad Air 2, iPad Mini 3, iMac with Retina Display and an updated Mac Mini. Apple also announced the commencement of support for Apple Pay, its mobile payment and digital wallet application.
The performance of Israel-based Teva Pharmaceutical Industries was largely driven by positive events related to the company’s most profitable drug, Copaxone, used to prevent the relapse of multiple sclerosis. In March, the U.S. Supreme Court agreed to hear Teva’s appeal (with oral arguments occurring in October) to maintain a patent, which further delayed the entrance of generic competition. The delay provided Teva the opportunity to convert more U.S. patients to its new formulation and allowed it to potentially retain a higher portion of the franchise once generic alternatives entered the market. In December, Teva received more good news regarding Copaxone with the new formulation gaining European Union approval. Investors also reacted favorably to the January 2014 announcement of a new chief executive officer (CEO) as the market believed he could successfully carry on Teva’s cost-cutting restructuring program.
Kroger is a Cincinnati-based grocery retailer that operates over 2,400 grocery and multi-department stores in 31 states. During 2014, the company reported strong quarterly operating profits while also raising its fiscal year 2014 earnings outlook for three consecutive quarters. The increase in the full-year outlook was driven in part by the acquisition of Harris Teeter, a stronger outlook for 2014 full-year sales and a decline in gasoline prices, which has helped the U.S. consumer. Kroger’s management team has been executing on a program called “Consumer First”
for several years. This program has resonated with Kroger customers, enabling the company to gain market share, leverage fixed costs, drive operating profit growth and increase shareholder value.
During the period under review, some of the Fund’s investments negatively affected performance. These included offshore drilling company Transocean, natural resources firm Freeport-McMoRan and retailer Tesco.
Transocean is a Switzerland-headquartered company providing offshore contract drilling services. The offshore drilling market continued to be mired in a downturn with little clarity regarding the length and depth of the current cycle as oil prices plunged during the second half of 2014. Oil companies pushed back projects, leaving a number of new rigs without contracts and increasing potential downtime between jobs for existing rigs. The growing fleet of uncontracted rigs at period-end portended, in our view, weak second-half results and a challenging start to 2015. On a positive note, the company started a Master Limited Partnership (MLP), Transocean Partners, which went public in September. The MLP may provide Transocean with a way to generate cash by selling (dropping down) assets into Transocean Partners while still controlling the operations of those assets.
| Top 10 Equity Holdings | ||
| 12/31/14 | ||
| Company | % of Total | |
| Sector/Industry, Country | Net Assets | |
| Medtronic Inc. | 3.0 | % |
| Health Care Equipment & Supplies, U.S. | ||
| Microsoft Corp. | 2.8 | % |
| Software, U.S. | ||
| Merck & Co. Inc. | 2.6 | % |
| Pharmaceuticals, U.S. | ||
| White Mountains Insurance Group Ltd. | 2.5 | % |
| Insurance, U.S. | ||
| Teva Pharmaceutical Industries Ltd., ADR | 2.2 | % |
| Pharmaceuticals, Israel | ||
| Apple Inc. | 2.0 | % |
| Technology Hardware, Storage & Peripherals, U.S. | ||
| Twenty-First Century Fox Inc., B | 1.9 | % |
| Media, U.S. | ||
| PNC Financial Services Group Inc. | 1.9 | % |
| Banks, U.S. | ||
| American International Group Inc. | 1.7 | % |
| Insurance, U.S. | ||
| Time Warner Cable Inc. | 1.6 | % |
| Media, U.S. |
6 | Annual Report
franklintempleton.com
FRANKLIN MUTUAL SHARES FUND
Shares of Freeport-McMoRan came under pressure during 2014 in large part due to falling crude oil prices during the second half of the year, as well as lower prices for copper and gold. The company’s stock also came under pressure from events related to its operations in Indonesia. In early 2014, Indonesia’s government issued new mining-related tax and regulatory policies with the apparent intent to force miners to build smelters within the country. In September, production at the company’s Grasberg mine in Indonesia declined following a fatal accident. The workers’ union subsequently threatened to strike, a development that ultimately did not occur. We took a favorable view of agreements announced in May for Freeport to sell shale assets in Texas and to purchase deepwater oil and gas projects in the Gulf of Mexico. We believe the deepwater assets are more attractive than the shale assets, and proceeds from the shale asset sale allowed Freeport to pay off some of its debt. In addition, we had a favorable view on copper over the longer term as we believed supply shortages were likely in the next few years.
Shares of the U.K.-based Tesco fell throughout 2014. In March, the stock declined as investors became more concerned about price competition from major discounters and competitor supermarkets. Then in August, Tesco issued an unexpected trading statement ahead of its scheduled first-half results. The company lowered its profit guidance primarily for its flagship U.K. operations and cut its dividend. The stock price took a further hit in September with the announcement of material accounting irregularities in Tesco’s core U.K. operations and a contemporaneous change of both the company’s CEO and chief financial officer. At year-end, the Fund no longer held Tesco shares.
During the period, the Fund held currency forwards and futures to somewhat hedge the currency risk of the portfolio’s non-U.S. dollar investments. The hedges had a positive impact on the Fund’s performance.
What is a currency forward contract?
A currency forward contract, or a currency forward, is an agreement between the Fund and a counterparty to buy or sell a foreign currency at a specific exchange rate on a future date.
What is a futures contract?
A futures contract, or a future, is an agreement between the Fund and a counterparty made through a U.S. or foreign futures exchange to buy or sell an asset at a specific price on a future date.
CFA® is a trademark owned by CFA Institute.
As fellow shareholders, we found recent relative performance disappointing, but it is not uncommon for our strategy to lag amid a strong equity market. We remain committed to our disciplined, value investment approach as we seek to generate attractive, long-term, risk-adjusted returns for shareholders. Thank you for your continued participation in Franklin Mutual Shares Fund. We look forward to continuing to serve your investment needs.

The foregoing information reflects our analysis, opinions and portfolio holdings as of December 31, 2014, the end of the reporting period. The way we implement our main investment strategies and the resulting portfolio holdings may change depending on factors such as market and economic conditions. These opinions may not be relied upon as investment advice or an offer for a particular security. The information is not a complete analysis of every aspect of any market, country, industry, security or the Fund. Statements of fact are from sources considered reliable, but the investment manager makes no representation or warranty as to their completeness or accuracy. Although historical performance is no guarantee of future results, these insights may help you understand our investment management philosophy.
franklintempleton.com
Annual Report
| 7
FRANKLIN MUTUAL SHARES FUND
Peter Langerman has been portfolio manager for Franklin Mutual Shares Fund (formerly, Mutual Shares Fund) since 2005. He has been portfolio manager of Franklin Mutual Global Discovery Fund (formerly, Mutual Global Discovery Fund) since 2009. He joined Franklin Templeton Investments in 1996, serving in various capacities, including President and Chief Executive Officer of Franklin Mutual Advisers and member of the management team of the Funds, including Franklin Mutual Shares Fund. From 2002 to 2005, he served as director of New Jersey’s Division of Investment, overseeing employee pension funds. Between 1986 and 1996, Mr. Langerman was employed at Heine Securities Corporation, the Fund’s former manager.
F. David Segal has been portfolio manager for Franklin Mutual Shares Fund (formerly, Mutual Shares Fund) since 2005. He joined Franklin Templeton Investments in 2002. Previously, he was an analyst in the Structured Finance Group of MetLife for the period 1999 to 2002.
Debbie Turner has been assistant portfolio manager for Franklin Mutual Shares Fund (formerly, Mutual Shares Fund) since 2001. She joined Franklin Templeton Investments in 1996. Between 1993 and 1996, Ms. Turner was employed at Heine Securities Corporation, the Fund’s former manager.
8 | Annual Report
franklintempleton.com
FRANKLIN MUTUAL SHARES FUND
Performance Summary as of December 31, 2014
Your dividend income will vary depending on dividends or interest paid by securities in the Fund’s portfolio, adjusted for operating expenses of each class. Capital gain distributions are net profits realized from the sale of portfolio securities. The performance table and graphs do not reflect any taxes that a shareholder would pay on Fund dividends, capital gain distributions, if any, or any realized gains on the sale of Fund shares. Total return reflects reinvestment of the Fund’s dividends and capital gain distributions, if any, and any unrealized gains or losses.
| Net Asset Value | ||||||
| Share Class (Symbol) | 12/31/14 | 12/31/13 | Change | |||
| Z (MUTHX) | $ | 29.52 | $ | 28.34 | +$ | 1.18 |
| A (TESIX) | $ | 29.29 | $ | 28.12 | +$ | 1.17 |
| C (TEMTX) | $ | 29.02 | $ | 27.88 | +$ | 1.14 |
| R (TESRX) | $ | 29.14 | $ | 27.98 | +$ | 1.16 |
| R6 (FMSHX) | $ | 29.51 | $ | 28.33 | +$ | 1.18 |
| Distributions (1/1/2014–12/31/2014) | ||||||
| Share Class | Dividend Income | |||||
| Z | $ | 0.9791 | ||||
| A | $ | 0.8876 | ||||
| C | $ | 0.6830 | ||||
| R | $ | 0.8228 | ||||
| R6 | $ | 1.0143 | ||||
franklintempleton.com
Annual Report
| 9
FRANKLIN MUTUAL SHARES FUND
PERFORMANCE SUMMARY
Performance as of 12/31/14
Cumulative total return excludes sales charges. Average annual total return and value of $10,000 investment include maximum sales charges. Class Z/R/R6: no sales charges; Class A: 5.75% maximum initial sales charge; Class C: 1% contingent deferred sales charge in first year only.
| Cumulative | Average Annual | Value of | Total Annual | |||||||
| Share Class | Total Return1 | Total Return2 | $ | 10,000 Investment3 | Operating Expenses4 | |||||
| Z | 0.79 | % | ||||||||
| 1-Year | + | 7.60 | % | + | 7.60 | % | $ | 10,760 | ||
| 5-Year | + | 74.70 | % | + | 11.80 | % | $ | 17,470 | ||
| 10-Year | + | 87.66 | % | + | 6.50 | % | $ | 18,766 | ||
| A | 1.09 | % | ||||||||
| 1-Year | + | 7.30 | % | + | 1.11 | % | $ | 10,111 | ||
| 5-Year | + | 72.09 | % | + | 10.16 | % | $ | 16,222 | ||
| 10-Year | + | 81.94 | % | + | 5.54 | % | $ | 17,148 | ||
| C | 1.79 | % | ||||||||
| 1-Year | + | 6.56 | % | + | 5.56 | % | $ | 10,556 | ||
| 5-Year | + | 66.22 | % | + | 10.70 | % | $ | 16,622 | ||
| 10-Year | + | 69.88 | % | + | 5.44 | % | $ | 16,988 | ||
| R | 1.29 | % | ||||||||
| 1-Year | + | 7.10 | % | + | 7.10 | % | $ | 10,710 | ||
| 5-Year | + | 70.45 | % | + | 11.25 | % | $ | 17,045 | ||
| 10-Year | + | 78.60 | % | + | 5.97 | % | $ | 17,860 | ||
| R65 | 0.67 | % | ||||||||
| 1-Year | + | 7.72 | % | + | 7.72 | % | $ | 10,772 | ||
| Since Inception (5/1/13) | + | 24.63 | % | + | 14.11 | % | $ | 12,463 |
Performance data represent past performance, which does not guarantee future results. Investment return and principal value will fluctuate, and you may have a gain or loss when you sell your shares. Current performance may differ from figures shown. For most recent month-end performance, go to franklintempleton.com or call (800) 342-5236.
10 | Annual Report
franklintempleton.com
FRANKLIN MUTUAL SHARES FUND
PERFORMANCE SUMMARY
Total Return Index Comparison for a Hypothetical $10,000 Investment
Total return represents the change in value of an investment over the periods shown. It includes any applicable maximum sales charge, Fund expenses, account fees and reinvested distributions. The unmanaged index includes reinvestment of any income or distributions. It differs from the Fund in composition and does not pay management fees or expenses. One cannot invest directly in an index.
franklintempleton.com
Annual Report
| 11
FRANKLIN MUTUAL SHARES FUND
PERFORMANCE SUMMARY
Total Return Index Comparison for a Hypothetical $10,000 Investment (continued)
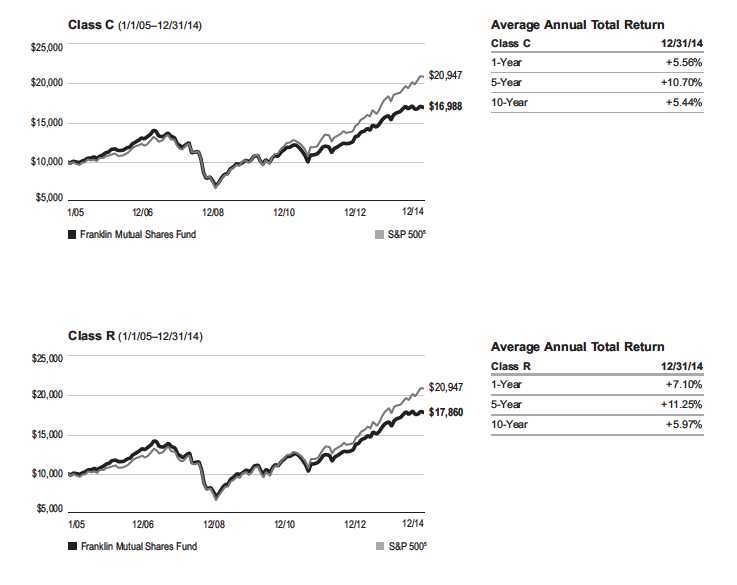
12 | Annual Report
franklintempleton.com
FRANKLIN MUTUAL SHARES FUND
PERFORMANCE SUMMARY
Total Return Index Comparison for a Hypothetical $10,000 Investment (continued)
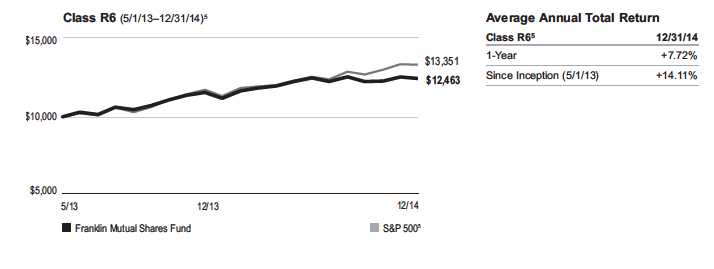
All investments involve risks, including possible loss of principal. Value securities may not increase in price as anticipated or may decline further in value. The Fund’s investments in foreign securities involve special risks including currency fluctuations, and economic and political uncertainties. The Fund may also invest in companies engaged in mergers, reorganizations or liquidations, which involve special risks as pending deals may not be completed on time or on favorable terms, as well as lower rated bonds, which entail higher credit risk. The Fund is actively managed but there is no guarantee that the manager’s investment decisions will produce the desired results. The Fund’s prospectus also includes a description of the main investment risks.
| Class Z: | Shares are available to certain eligible investors as described in the prospectus. |
| Class C: | These shares have higher annual fees and expenses than Class A shares. |
| Class R: | Shares are available to certain eligible investors as described in the prospectus. These shares have higher annual fees and expenses than Class A shares. |
| Class R6: | Shares are available to certain eligible investors as described in the prospectus. |
1. Cumulative total return represents the change in value of an investment over the periods indicated.
2. Average annual total return represents the average annual change in value of an investment over the periods indicated.
3. These figures represent the value of a hypothetical $10,000 investment in the Fund over the periods indicated.
4. Figures are as stated in the Fund’s current prospectus. In periods of market volatility, assets may decline significantly, causing total annual Fund operating expenses to
become higher than the figures shown.
5. Class R6 has a fee waiver contractually guaranteed through at least 4/30/15. Investment results reflect the fee waiver, to the extent applicable; without this reduction, the
results would have been lower.
6. Source: Morningstar. The S&P 500 is a market capitalization-weighted index of 500 stocks designed to measure total U.S. equity market performance.
See www.franklintempletondatasources.com for additional data provider information.
franklintempleton.com
Annual Report
| 13
FRANKLIN MUTUAL SHARES FUND
Your Fund’s Expenses
As a Fund shareholder, you can incur two types of costs:
- Transaction costs, including sales charges (loads) on Fund purchases; and
- Ongoing Fund costs, including management fees, distribution and service (12b-1) fees, and other Fund expenses. All mutual funds have ongoing costs, sometimes referred to as operating expenses.
The following table shows ongoing costs of investing in the Fund and can help you understand these costs and compare them with those of other mutual funds. The table assumes a $1,000 investment held for the six months indicated.
Actual Fund Expenses
The first line (Actual) for each share class listed in the table provides actual account values and expenses. The “Ending Account Value” is derived from the Fund’s actual return, which includes the effect of Fund expenses.
You can estimate the expenses you paid during the period by following these steps. Of course, your account value and expenses will differ from those in this illustration:
| 1. | Divide your account value by $1,000. |
| If an account had an $8,600 value, then $8,600 ÷ $1,000 = 8.6. | |
| 2. | Multiply the result by the number under the heading “Expenses Paid During Period.” |
| If Expenses Paid During Period were $7.50, then 8.6 x $7.50 = $64.50. |
In this illustration, the estimated expenses paid this period are $64.50.
Hypothetical Example for Comparison with Other Funds
Information in the second line (Hypothetical) for each class in the table can help you compare ongoing costs of investing in the Fund with those of other mutual funds. This information may not be used to estimate the actual ending account balance or expenses you paid during the period. The hypothetical “Ending Account Value” is based on the actual expense ratio for each class and an assumed 5% annual rate of return before expenses, which does not represent the Fund’s actual return. The figure under the heading “Expenses Paid During Period” shows the hypothetical expenses your account would have incurred under this scenario. You can compare this figure with the 5% hypothetical examples that appear in shareholder reports of other funds.
Please note that expenses shown in the table are meant to highlight ongoing costs and do not reflect any transaction costs, such as sales charges. Therefore, the second line for each class is useful in comparing ongoing costs only, and will not help you compare total costs of owning different funds. In addition, if transaction costs were included, your total costs would have been higher. Please refer to the Fund prospectus for additional information on operating expenses.
14 | Annual Report
franklintempleton.com
FRANKLIN MUTUAL SHARES FUND
YOUR FUND’S EXPENSES
| Beginning Account | Ending Account | Expenses Paid During | ||||
| Share Class | Value 7/1/14 | Value 12/31/14 | Period* 7/1/14–12/31/14 | |||
| Z | ||||||
| Actual | $ | 1,000 | $ | 996.20 | $ | 4.08 |
| Hypothetical (5% return before expenses) | $ | 1,000 | $ | 1,021.12 | $ | 4.13 |
| A | ||||||
| Actual | $ | 1,000 | $ | 994.80 | $ | 5.58 |
| Hypothetical (5% return before expenses) | $ | 1,000 | $ | 1,019.61 | $ | 5.65 |
| C | ||||||
| Actual | $ | 1,000 | $ | 991.20 | $ | 9.08 |
| Hypothetical (5% return before expenses) | $ | 1,000 | $ | 1,016.08 | $ | 9.20 |
| R | ||||||
| Actual | $ | 1,000 | $ | 993.90 | $ | 6.58 |
| Hypothetical (5% return before expenses) | $ | 1,000 | $ | 1,018.60 | $ | 6.67 |
| R6 | ||||||
| Actual | $ | 1,000 | $ | 996.70 | $ | 3.52 |
| Hypothetical (5% return before expenses) | $ | 1,000 | $ | 1,021.68 | $ | 3.57 |
*Expenses are calculated using the most recent six-month expense ratio, annualized for each class (Z: 0.81%; A: 1.11%; C: 1.81%; R: 1.31%; and R6: 0.70%), multiplied by the average account value over the period, multiplied by 184/365 to reflect the one-half year period.
franklintempleton.com
Annual Report
| 15
FRANKLIN MUTUAL SHARES FUND
| Financial Highlights | |||||||||||||||
| Year Ended December 31, | |||||||||||||||
| 2014 | 2013 | 2012 | 2011 | 2010 | |||||||||||
| Class Z | |||||||||||||||
| Per share operating performance | |||||||||||||||
| (for a share outstanding throughout the year) | |||||||||||||||
| Net asset value, beginning of year | $ | 28.34 | $ | 22.48 | $ | 19.96 | $ | 20.80 | $ | 19.19 | |||||
| Income from investment operationsa: | |||||||||||||||
| Net investment incomeb | 0.78 | c | 0.47 | 0.39 | 0.47 | d | 0.56 | e | |||||||
| Net realized and unrealized gains (losses) | 1.38 | 5.83 | 2.62 | (0.80 | ) | 1.68 | |||||||||
| Total from investment operations | 2.16 | 6.30 | 3.01 | (0.33 | ) | 2.24 | |||||||||
| Less distributions from net investment income | (0.98 | ) | (0.44 | ) | (0.49 | ) | (0.51 | ) | (0.63 | ) | |||||
| Net asset value, end of year | $ | 29.52 | $ | 28.34 | $ | 22.48 | $ | 19.96 | $ | 20.80 | |||||
| Total return | 7.60 | % | 28.10 | % | 15.14 | % | (1.50 | )% | 11.75 | % | |||||
| Ratios to average net assets | |||||||||||||||
| Expensesf | 0.80 | %g | 0.79 | %g | 0.82 | % | 0.86 | % | 0.85 | %h | |||||
| Expenses incurred in connection with securities sold short | 0.03 | % | —%i | —%i | —%i | 0.02 | % | ||||||||
| Net investment income | 2.67 | %c | 1.85 | % | 1.82 | % | 2.24 | %d | 2.83 | %e | |||||
| Supplemental data | |||||||||||||||
| Net assets, end of year (000’s) | $ | 7,363,765 | $ | 7,025,908 | $ | 7,575,308 | $ | 7,540,502 | $ | 8,635,954 | |||||
| Portfolio turnover rate | 19.24 | % | 24.29 | % | 21.57 | % | 29.44 | % | 28.25 | % | |||||
aThe amount shown for a share outstanding throughout the period may not correlate with the Statement of Operations for the period due to the timing of sales and
repurchases of the Fund shares in relation to income earned and/or fluctuating fair value of the investments of the Fund.
bBased on average daily shares outstanding.
cNet investment income per share includes approximately $0.29 per share received in the form of a special dividend paid in connection with certain Fund’s holdings.
Excluding this amount, the ratio of net investment income to average net assets would have been 1.66%.
dNet investment income per share includes approximately $0.08 per share related to interest income received that had previously been deemed uncollectible. Excluding this
amount, the ratio of net investment income to average net assets would have been 1.87%.
eNet investment income per share includes approximately $0.21 per share received in the form of a special dividend paid in connection with a corporate real estate
investment trust (REIT) conversion. Excluding this non-recurring amount, the ratio of net investment income to average net assets would have been 1.73%.
fIncludes dividend expense on securities sold short and borrowing fees, if any. See below for the ratios of such expenses to average net assets for the periods presented.
See Note 1(f).
gBenefit of expense reduction rounds to less than 0.01%.
hBenefit of waiver and payment by affiliates rounds to less than 0.01%.
iRounds to less than 0.01%.
16 | Annual Report | The accompanying notes are an integral part of these financial statements.
franklintempleton.com
| FRANKLIN MUTUAL SHARES FUND | |||||||||||||||
| FINANCIAL HIGHLIGHTS | |||||||||||||||
| Year Ended December 31, | |||||||||||||||
| 2014 | 2013 | 2012 | 2011 | 2010 | |||||||||||
| Class A | |||||||||||||||
| Per share operating performance | |||||||||||||||
| (for a share outstanding throughout the year) | |||||||||||||||
| Net asset value, beginning of year | $ | 28.12 | $ | 22.32 | $ | 19.81 | $ | 20.64 | $ | 19.06 | |||||
| Income from investment operationsa: | |||||||||||||||
| Net investment incomeb | 0.69 | c | 0.40 | 0.33 | 0.40 | d | 0.49 | e | |||||||
| Net realized and unrealized gains (losses) | 1.37 | 5.76 | 2.60 | (0.79 | ) | 1.66 | |||||||||
| Total from investment operations | 2.06 | 6.16 | 2.93 | (0.39 | ) | 2.15 | |||||||||
| Less distributions from net investment income | (0.89 | ) | (0.36 | ) | (0.42 | ) | (0.44 | ) | (0.57 | ) | |||||
| Net asset value, end of year | $ | 29.29 | $ | 28.12 | $ | 22.32 | $ | 19.81 | $ | 20.64 | |||||
| Total returnf | 7.30 | % | 27.74 | % | 14.75 | % | (1.79 | )% | 11.41 | % | |||||
| Ratios to average net assets | |||||||||||||||
| Expensesg | 1.10 | %h | 1.09 | %h | 1.12 | % | 1.16 | % | 1.15 | %i | |||||
| Expenses incurred in connection with securities sold short | 0.03 | % | —%j | —%j | —%j | 0.02 | % | ||||||||
| Net investment income | 2.37 | %c | 1.55 | % | 1.52 | % | 1.94 | %d | 2.53 | %e | |||||
| Supplemental data | |||||||||||||||
| Net assets, end of year (000’s) | $ | 5,392,130 | $ | 5,477,733 | $ | 4,633,895 | $ | 4,681,967 | $ | 5,368,887 | |||||
| Portfolio turnover rate | 19.24 | % | 24.29 | % | 21.57 | % | 29.44 | % | 28.25 | % | |||||
aThe amount shown for a share outstanding throughout the period may not correlate with the Statement of Operations for the period due to the timing of sales and
repurchases of the Fund shares in relation to income earned and/or fluctuating fair value of the investments of the Fund.
bBased on average daily shares outstanding.
cNet investment income per share includes approximately $0.29 per share received in the form of a special dividend paid in connection with certain Fund’s holdings.
Excluding this amount, the ratio of net investment income to average net assets would have been 1.36%.
dNet investment income per share includes approximately $0.08 per share related to interest income received that had previously been deemed uncollectible. Excluding this
amount, the ratio of net investment income to average net assets would have been 1.57%.
eNet investment income per share includes approximately $0.21 per share received in the form of a special dividend paid in connection with a corporate REIT conversion.
Excluding this non-recurring amount, the ratio of net investment income to average net assets would have been 1.43%.
fTotal return does not reflect sales commissions or contingent deferred sales charges, if applicable.
gIncludes dividend expense on securities sold short and borrowing fees, if any. See below for the ratios of such expenses to average net assets for the periods presented.
See Note 1(f).
hBenefit of expense reduction rounds to less than 0.01%.
iBenefit of waiver and payment by affiliates rounds to less than 0.01%.
jRounds to less than 0.01%.
franklintempleton.com
The accompanying notes are an integral part of these financial statements. | Annual Report | 17
FRANKLIN MUTUAL SHARES FUND
FINANCIAL HIGHLIGHTS
| Year Ended December 31, | |||||||||||||||
| 2014 | 2013 | 2012 | 2011 | 2010 | |||||||||||
| Class C | |||||||||||||||
| Per share operating performance | |||||||||||||||
| (for a share outstanding throughout the year) | |||||||||||||||
| Net asset value, beginning of year | $ | 27.88 | $ | 22.13 | $ | 19.65 | $ | 20.46 | $ | 18.89 | |||||
| Income from investment operationsa: | |||||||||||||||
| Net investment incomeb | 0.48 | c | 0.22 | 0.17 | 0.25 | d | 0.35 | e | |||||||
| Net realized and unrealized gains (losses) | 1.34 | 5.71 | 2.57 | (0.77 | ) | 1.65 | |||||||||
| Total from investment operations | 1.82 | 5.93 | 2.74 | (0.52 | ) | 2.00 | |||||||||
| Less distributions from net investment income | (0.68 | ) | (0.18 | ) | (0.26 | ) | (0.29 | ) | (0.43 | ) | |||||
| Net asset value, end of year | $ | 29.02 | $ | 27.88 | $ | 22.13 | $ | 19.65 | $ | 20.46 | |||||
| Total returnf | 6.56 | % | 26.82 | % | 13.97 | % | (2.44 | )% | 10.62 | % | |||||
| Ratios to average net assets | |||||||||||||||
| Expensesg | 1.80 | %h | 1.79 | %h | 1.82 | % | 1.86 | % | 1.85 | %i | |||||
| Expenses incurred in connection with securities sold short | 0.03 | % | —%j | —%j | —%j | 0.02 | % | ||||||||
| Net investment income | 1.67 | %c | 0.85 | % | 0.82 | % | 1.24 | %d | 1.83 | %e | |||||
| Supplemental data | |||||||||||||||
| Net assets, end of year (000’s) | $ | 1,240,845 | $ | 1,236,603 | $ | 1,043,695 | $ | 1,065,446 | $ | 1,292,711 | |||||
| Portfolio turnover rate | 19.24 | % | 24.29 | % | 21.57 | % | 29.44 | % | 28.25 | % | |||||
aThe amount shown for a share outstanding throughout the period may not correlate with the Statement of Operations for the period due to the timing of sales and
repurchases of the Fund shares in relation to income earned and/or fluctuating fair value of the investments of the Fund.
bBased on average daily shares outstanding.
cNet investment income per share includes approximately $0.29 per share received in the form of a special dividend paid in connection with certain Fund’s holdings.
Excluding this amount, the ratio of net investment income to average net assets would have been 0.66%.
dNet investment income per share includes approximately $0.08 per share related to interest income received that had previously been deemed uncollectible. Excluding this
amount, the ratio of net investment income to average net assets would have been 0.87%.
eNet investment income per share includes approximately $0.21 per share received in the form of a special dividend paid in connection with a corporate REIT conversion.
Excluding this non-recurring amount, the ratio of net investment income to average net assets would have been 0.73%.
fTotal return does not reflect sales commissions or contingent deferred sales charges, if applicable.
gIncludes dividend expense on securities sold short and borrowing fees, if any. See below for the ratios of such expenses to average net assets for the periods presented.
See Note 1(f).
hBenefit of expense reduction rounds to less than 0.01%.
iBenefit of waiver and payment by affiliates rounds to less than 0.01%.
jRounds to less than 0.01%.
18 | Annual Report | The accompanying notes are an integral part of these financial statements.
franklintempleton.com
| FRANKLIN MUTUAL SHARES FUND | |||||||||||||||
| FINANCIAL HIGHLIGHTS | |||||||||||||||
| Year Ended December 31, | |||||||||||||||
| 2014 | 2013 | 2012 | 2011 | 2010 | |||||||||||
| Class R | |||||||||||||||
| Per share operating performance | |||||||||||||||
| (for a share outstanding throughout the year) | |||||||||||||||
| Net asset value, beginning of year | $ | 27.98 | $ | 22.20 | $ | 19.70 | $ | 20.52 | $ | 18.95 | |||||
| Income from investment operationsa: | |||||||||||||||
| Net investment incomeb | 0.64 | c | 0.34 | 0.28 | 0.36 | d | 0.45 | e | |||||||
| Net realized and unrealized gains (losses) | 1.34 | 5.73 | 2.59 | (0.78 | ) | 1.66 | |||||||||
| Total from investment operations | 1.98 | 6.07 | 2.87 | (0.42 | ) | 2.11 | |||||||||
| Less distributions from net investment income | (0.82 | ) | (0.29 | ) | (0.37 | ) | (0.40 | ) | (0.54 | ) | |||||
| Net asset value, end of year | $ | 29.14 | $ | 27.98 | $ | 22.20 | $ | 19.70 | $ | 20.52 | |||||
| Total return | 7.10 | % | 27.47 | % | 14.52 | % | (1.94 | )% | 11.18 | % | |||||
| Ratios to average net assets | |||||||||||||||
| Expensesf | 1.30 | %g | 1.29 | %g | 1.32 | % | 1.36 | % | 1.35 | %h | |||||
| Expenses incurred in connection with securities sold short | 0.03 | % | —%i | —%i | —%i | 0.02 | % | ||||||||
| Net investment income | 2.17 | %c | 1.35 | % | 1.32 | % | 1.74 | %d | 2.33 | %e | |||||
| Supplemental data | |||||||||||||||
| Net assets, end of year (000’s) | $ | 172,938 | $ | 192,658 | $ | 191,304 | $ | 218,757 | $ | 259,834 | |||||
| Portfolio turnover rate | 19.24 | % | 24.29 | % | 21.57 | % | 29.44 | % | 28.25 | % | |||||
aThe amount shown for a share outstanding throughout the period may not correlate with the Statement of Operations for the period due to the timing of sales and
repurchases of the Fund shares in relation to income earned and/or fluctuating fair value of the investments of the Fund.
bBased on average daily shares outstanding.
cNet investment income per share includes approximately $0.29 per share received in the form of a special dividend paid in connection with certain Fund’s holdings.
Excluding this amount, the ratio of net investment income to average net assets would have been 1.16%.
dNet investment income per share includes approximately $0.08 per share related to interest income received that had previously been deemed uncollectible. Excluding this
amount, the ratio of net investment income to average net assets would have been 1.37%.
eNet investment income per share includes approximately $0.21 per share received in the form of a special dividend paid in connection with a corporate REIT conversion.
Excluding this non-recurring amount, the ratio of net investment income to average net assets would have been 1.23%.
fIncludes dividend expense on securities sold short and borrowing fees, if any. See below for the ratios of such expenses to average net assets for the periods presented.
See Note 1(f).
gBenefit of expense reduction rounds to less than 0.01%.
hBenefit of waiver and payment by affiliates rounds to less than 0.01%.
iRounds to less than 0.01%.
franklintempleton.com
The accompanying notes are an integral part of these financial statements. | Annual Report | 19
FRANKLIN MUTUAL SHARES FUND
FINANCIAL HIGHLIGHTS
| Year Ended December 31, | ||||||
| 2014 | 2013 | a | ||||
| Class R6 | ||||||
| Per share operating performance | ||||||
| (for a share outstanding throughout the year) | ||||||
| Net asset value, beginning of year | $ | 28.33 | $ | 24.91 | ||
| Income from investment operationsb: | ||||||
| Net investment incomec | 0.82 | d | 0.38 | |||
| Net realized and unrealized gains (losses) | 1.37 | 3.51 | ||||
| Total from investment operations | 2.19 | 3.89 | ||||
| Less distributions from net investment income | (1.01 | ) | (0.47 | ) | ||
| Net asset value, end of year | $ | 29.51 | $ | 28.33 | ||
| Total returne | 7.72 | % | 15.70 | % | ||
| Ratios to average net assetsf | ||||||
| Expensesg,h | 0.69 | % | 0.67 | % | ||
| Expenses incurred in connection with securities sold short | 0.03 | % | —%i | |||
| Net investment income | 2.78 | %d | 1.97 | % | ||
| Supplemental data | ||||||
| Net assets, end of year (000’s) | $ | 2,249,991 | $ | 2,221,889 | ||
| Portfolio turnover rate | 19.24 | % | 24.29 | % | ||
aFor the period May 1, 2013 (effective date) to December 31, 2013.
bThe amount shown for a share outstanding throughout the period may not correlate with the Statement of Operations for the period due to the timing of sales and
repurchases of the Fund shares in relation to income earned and/or fluctuating fair value of the investments of the Fund.
cBased on average daily shares outstanding.
dNet investment income per share includes approximately $0.29 per share received in the form of a special dividend paid in connection with certain Fund’s holdings.
Excluding this amount, the ratio of net investment income to average net assets would have been 1.77%.
eTotal return is not annualized for periods less than one year.
fRatios are annualized for periods less than one year.
gIncludes dividend expense on securities sold short and borrowing fees, if any. See below for the ratios of such expenses to average net assets for the periods presented.
See Note 1(f).
hBenefit of expense reduction rounds to less than 0.01%.
iRounds to less than 0.01%.
20 | Annual Report | The accompanying notes are an integral part of these financial statements.
franklintempleton.com
FRANKLIN MUTUAL SHARES FUND
| Statement of Investments, December 31, 2014 | ||||
| Country | Shares | Value | ||
| Common Stocks and Other Equity Interests 84.7% | ||||
| Aerospace & Defense 1.7% | ||||
| a B/E Aerospace Inc. | United States | 1,412,070 | $ | 81,928,301 |
| Huntington Ingalls Industries Inc. | United States | 1,508,054 | 169,595,753 | |
| a KLX Inc. | United States | 706,035 | 29,123,944 | |
| 280,647,998 | ||||
| Auto Components 0.3% | ||||
| a,b,c International Automotive Components Group Brazil LLC | Brazil | 7,234,813 | 684,268 | |
| a,b,c,d International Automotive Components Group North America LLC | United States | 63,079,866 | 47,762,813 | |
| 48,447,081 | ||||
| Automobiles 1.3% | ||||
| General Motors Co. | United States | 6,183,080 | 215,851,323 | |
| Banks 9.2% | ||||
| Barclays PLC | United Kingdom | 22,479,720 | 85,320,301 | |
| CIT Group Inc. | United States | 2,102,356 | 100,555,687 | |
| Citigroup Inc. | United States | 3,362,406 | 181,939,789 | |
| Citizens Financial Group Inc. | United States | 1,950,638 | 48,492,861 | |
| Columbia Banking System Inc. | United States | 1,603,629 | 44,276,197 | |
| a FCB Financial Holdings Inc., A | United States | 1,647,570 | 40,596,125 | |
| c Guaranty Bancorp | United States | 1,146,366 | 16,553,525 | |
| a ING Groep NV, IDR | Netherlands | 7,306,186 | 95,742,451 | |
| JPMorgan Chase & Co. | United States | 3,550,940 | 222,217,825 | |
| KB Financial Group Inc. | South Korea | 2,078,971 | 68,712,333 | |
| PNC Financial Services Group Inc. | United States | 3,438,533 | 313,697,366 | |
| Societe Generale SA | France | 627,835 | 26,581,215 | |
| State Bank Financial Corp. | United States | 1,467,000 | 29,310,660 | |
| SunTrust Banks Inc. | United States | 2,963,080 | 124,153,052 | |
| Wells Fargo & Co. | United States | 2,093,160 | 114,747,031 | |
| 1,512,896,418 | ||||
| Beverages 1.3% | ||||
| Coca-Cola Enterprises Inc. | United States | 556,852 | 24,623,995 | |
| PepsiCo Inc. | United States | 1,930,319 | 182,530,965 | |
| 207,154,960 | ||||
| Capital Markets 0.4% | ||||
| Credit Suisse Group AG | Switzerland | 2,666,742 | 67,272,067 | |
| Chemicals 0.0% | ||||
| a,e,f Dow Corning Corp., Contingent Distribution | United States | 12,630,547 | — | |
| Communications Equipment 1.4% | ||||
| Cisco Systems Inc. | United States | 8,126,460 | 226,037,485 | |
| Consumer Finance 0.5% | ||||
| a Ally Financial Inc. | United States | 3,254,500 | 76,871,290 | |
| Containers & Packaging 0.9% | ||||
| MeadWestvaco Corp. | United States | 3,395,925 | 150,745,111 | |
| Diversified Consumer Services 0.1% | ||||
| Cengage Learning Holdings II LP | United States | 837,095 | 18,834,638 | |
| Diversified Telecommunication Services 0.6% | ||||
| a,e,f Global Crossing Holdings Ltd., Contingent Distribution | United States | 105,649,309 | — | |
| Koninklijke KPN NV | Netherlands | 30,410,640 | 96,702,184 | |
| 96,702,184 | ||||
| franklintempleton.com | Annual Report | 21 | |||
FRANKLIN MUTUAL SHARES FUND
STATEMENT OF INVESTMENTS
| Country | Shares | Value | ||
| Common Stocks and Other Equity Interests (continued) | ||||
| Energy Equipment & Services 1.4% | ||||
| Baker Hughes Inc. | United States | 2,860,306 | $ | 160,377,358 |
| Ensco PLC, A | United States | 545,492 | 16,337,485 | |
| g Transocean Ltd. | United States | 3,071,412 | 56,298,982 | |
| 233,013,825 | ||||
| Food & Staples Retailing 3.4% | ||||
| CVS Health Corp. | United States | 1,528,221 | 147,182,965 | |
| The Kroger Co. | United States | 3,609,640 | 231,774,984 | |
| Walgreens Boots Alliance Inc. | United States | 2,283,129 | 173,974,430 | |
| 552,932,379 | ||||
| Health Care Equipment & Supplies 4.0% | ||||
| Medtronic Inc. | United States | 6,804,194 | 491,262,807 | |
| Stryker Corp. | United States | 1,810,620 | 170,795,784 | |
| 662,058,591 | ||||
| Health Care Providers & Services 1.1% | ||||
| Cigna Corp. | United States | 1,718,030 | 176,802,467 | |
| Household Products 0.2% | ||||
| Energizer Holdings Inc. | United States | 196,822 | 25,303,436 | |
| Independent Power & Renewable Electricity Producers 0.7% | ||||
| NRG Energy Inc. | United States | 4,399,652 | 118,570,621 | |
| Insurance 9.3% | ||||
| ACE Ltd. | United States | 1,939,640 | 222,825,843 | |
| a Alleghany Corp. | United States | 377,389 | 174,919,802 | |
| The Allstate Corp. | United States | 2,228,178 | 156,529,505 | |
| American International Group Inc. | United States | 5,079,039 | 284,476,974 | |
| MetLife Inc. | United States | 2,895,970 | 156,643,017 | |
| a,b Olympus Re Holdings Ltd. | United States | 202,380 | — | |
| c White Mountains Insurance Group Ltd. | United States | 655,346 | 412,940,068 | |
| Zurich Insurance Group AG | Switzerland | 352,340 | 110,465,075 | |
| 1,518,800,284 | ||||
| IT Services 1.3% | ||||
| Xerox Corp. | United States | 15,854,785 | 219,747,320 | |
| Machinery 1.3% | ||||
| Caterpillar Inc. | United States | 934,365 | 85,522,428 | |
| CNH Industrial NV (EUR Traded) | United Kingdom | 4,351,332 | 35,276,248 | |
| CNH Industrial NV, special voting (EUR Traded) | United Kingdom | 5,296,616 | 42,939,665 | |
| c Federal Signal Corp. | United States | 3,360,800 | 51,890,752 | |
| 215,629,093 | ||||
| Marine 1.2% | ||||
| A.P. Moeller-Maersk AS, B | Denmark | 100,690 | 202,364,831 | |
| Media 8.8% | ||||
| CBS Corp., B | United States | 3,336,259 | 184,628,573 | |
| Comcast Corp., Special A | United States | 846,676 | 48,738,904 | |
| a DIRECTV | United States | 2,385,168 | 206,794,066 | |
| Reed Elsevier PLC | United Kingdom | 12,648,470 | 216,866,863 | |
| Time Warner Cable Inc. | United States | 1,769,704 | 269,101,190 | |
| Time Warner Inc. | United States | 1,428,918 | 122,058,176 | |
22 | Annual Report
franklintempleton.com
FRANKLIN MUTUAL SHARES FUND
STATEMENT OF INVESTMENTS
| Country | Shares | Value | ||
| Common Stocks and Other Equity Interests (continued) | ||||
| Media (continued) | ||||
| a Tribune Media Co., A | United States | 647,376 | $ | 38,693,664 |
| a Tribune Media Co., B | United States | 469,946 | 28,088,672 | |
| Tribune Publishing Co. | United States | 309,101 | 7,078,413 | |
| Twenty-First Century Fox Inc., B | United States | 8,524,052 | 314,452,278 | |
| 1,436,500,799 | ||||
| Metals & Mining 1.8% | ||||
| Anglo American PLC | United Kingdom | 2,188,929 | 40,959,662 | |
| Freeport-McMoRan Inc., B | United States | 5,933,533 | 138,607,331 | |
| a ThyssenKrupp AG | Germany | 4,544,107 | 116,895,332 | |
| 296,462,325 | ||||
| Multiline Retail 0.4% | ||||
| Kohl’s Corp. | United States | 1,087,447 | 66,377,765 | |
| Oil, Gas & Consumable Fuels 6.6% | ||||
| Anadarko Petroleum Corp. | United States | 903,460 | 74,535,450 | |
| Apache Corp. | United States | 2,845,910 | 178,353,180 | |
| BG Group PLC | United Kingdom | 5,968,338 | 80,469,636 | |
| BP PLC | United Kingdom | 15,851,497 | 101,548,760 | |
| CONSOL Energy Inc. | United States | 2,383,474 | 80,585,256 | |
| Marathon Oil Corp. | United States | 5,828,073 | 164,876,185 | |
| Murphy Oil Corp. | United States | 1,576,220 | 79,630,634 | |
| Royal Dutch Shell PLC, A | United Kingdom | 7,327,252 | 245,232,860 | |
| Talisman Energy Inc. (CAD Traded) | Canada | 614,645 | 4,816,594 | |
| Talisman Energy Inc. (USD Traded) | Canada | 8,388,371 | 65,680,945 | |
| 1,075,729,500 | ||||
| Paper & Forest Products 1.3% | ||||
| International Paper Co. | United States | 3,879,234 | 207,849,358 | |
| Personal Products 0.4% | ||||
| Avon Products Inc. | United States | 7,470,204 | 70,145,216 | |
| Pharmaceuticals 6.8% | ||||
| Eli Lilly & Co. | United States | 2,495,948 | 172,195,452 | |
| a Hospira Inc. | United States | 2,595,187 | 158,955,204 | |
| Merck & Co. Inc. | United States | 7,460,200 | 423,664,758 | |
| Teva Pharmaceutical Industries Ltd., ADR | Israel | 6,224,949 | 357,996,817 | |
| 1,112,812,231 | ||||
| Real Estate Investment Trusts (REITs) 0.9% | ||||
| c Alexander’s Inc. | United States | 326,675 | 142,815,777 | |
| Real Estate Management & Development 0.8% | ||||
| f Canary Wharf Group PLC | United Kingdom | 14,262,931 | 120,251,997 | |
| a Forestar Group Inc. | United States | 886,386 | 13,650,344 | |
| 133,902,341 | ||||
| Software 4.9% | ||||
| CA Inc. | United States | 3,111,638 | 94,749,377 | |
| Microsoft Corp. | United States | 9,836,982 | 456,927,814 | |
| Symantec Corp. | United States | 10,127,147 | 259,811,956 | |
| 811,489,147 | ||||
franklintempleton.com
Annual Report
| 23
FRANKLIN MUTUAL SHARES FUND
STATEMENT OF INVESTMENTS
| Country | Shares | Value | ||||
| Common Stocks and Other Equity Interests (continued) | ||||||
| Technology Hardware, Storage & Peripherals 3.5% | ||||||
| Apple Inc. | United States | 3,012,110 | $ | 332,476,702 | ||
| Hewlett-Packard Co. | United States | 3,520,334 | 141,271,003 | |||
| Samsung Electronics Co. Ltd. | South Korea | 88,806 | 107,743,529 | |||
| 581,491,234 | ||||||
| Tobacco 5.7% | ||||||
| Altria Group Inc. | United States | 3,982,209 | 196,203,438 | |||
| British American Tobacco PLC | United Kingdom | 4,864,275 | 265,368,080 | |||
| Imperial Tobacco Group PLC | United Kingdom | 3,810,199 | 168,428,819 | |||
| Lorillard Inc. | United States | 3,687,131 | 232,068,025 | |||
| Philip Morris International Inc. | United States | 944,754 | 76,950,213 | |||
| 939,018,575 | ||||||
| Wireless Telecommunication Services 1.2% | ||||||
| Vodafone Group PLC | United Kingdom | 58,574,055 | 203,278,060 | |||
| Total Common Stocks and Other Equity Interests | ||||||
| (Cost $9,607,764,563) | 13,904,555,730 | |||||
| Convertible Preferred Stocks (Cost $755,800) 0.0%† | ||||||
| Banks 0.0%† | ||||||
| Columbia Banking System Inc., cvt. pfd., B | United States | 7,558 | 2,432,332 | |||
| Preferred Stocks (Cost $117,489,716) 0.6% | ||||||
| Automobiles 0.6% | ||||||
| Volkswagen AG, pfd. | Germany | 450,280 | 100,604,482 | |||
| Principal | ||||||
| Amount* | ||||||
| Corporate Bonds, Notes and Senior Floating Rate | ||||||
| Interests 4.5% | ||||||
| Avaya Inc., | ||||||
| hsenior note, 144A, 10.50%, 3/01/21 | United States | 53,494,000 | 46,004,840 | |||
| hsenior secured note, 144A, 7.00%, 4/01/19 | United States | 37,416,000 | 36,667,680 | |||
| i,jTranche B-3 Term Loan, 4.67%, 10/26/17 | United States | 56,504,098 | 54,338,127 | |||
| i,jTranche B-6 Term Loan, 6.50%, 3/31/18 | United States | 13,787,058 | 13,631,954 | |||
| i,jCaesars Entertainment Operating Co. Inc., Senior Tranche, first lien, | ||||||
| 3/01/17, | ||||||
| B5B, 5.949% | United States | 9,541,623 | 8,376,753 | |||
| B6B, 6.949% | United States | 45,490,495 | 40,202,225 | |||
| B7, 9.75% | United States | 30,701,720 | 27,232,426 | |||
| i,jCengage Learning Acquisitions Inc., First Lien Exit Term Loan, 7.00%, | ||||||
| 3/31/20 | United States | 5,290,025 | 5,243,737 | |||
| First Data Corp., senior note, 11.75%, 8/15/21 | United States | 28,654,000 | 33,023,735 | |||
| iHeartCommunications Inc., | ||||||
| senior secured note, first lien, 9.00%, 12/15/19 | United States | 74,295,000 | 73,459,181 | |||
| i,jTranche B Term Loan, 3.819%, 1/29/16 | United States | 708,077 | 700,775 | |||
| i,jTranche C Term Loan, 3.819%, 1/29/16 | United States | 76,893 | 76,028 | |||
| i,jTranche D Term Loan, 6.919%, 1/30/19 | United States | 94,620,527 | 89,386,876 | |||
| i,jTranche E Term Loan, 7.669%, 7/30/19 | United States | 30,412,812 | 29,234,316 | |||
| i,jJC Penney Corp. Inc., Term Loan, 6.00%, 5/22/18 | United States | 78,949,728 | 77,814,826 | |||
| NGPL PipeCo LLC, | ||||||
| hsecured note, 144A, 7.119%, 12/15/17 | United States | 29,468,000 | 29,099,650 | |||
| g,hsenior secured note, 144A, 9.625%, 6/01/19 | United States | 43,741,000 | 44,069,057 | |||
| i,jTerm Loan B, 6.75%, 9/15/17 | United States | 2,392,596 | 2,314,837 | |||
| 24 | | Annual Report | franklintempleton.com | ||||
FRANKLIN MUTUAL SHARES FUND
STATEMENT OF INVESTMENTS
| Principal | ||||
| Country | Amount* | Value | ||
| Corporate Bonds, Notes and Senior Floating Rate | ||||
| Interests (continued) | ||||
| i,jToys R US-Delaware Inc., | ||||
| Filo Term Loan, 8.75%, 10/24/19 | United States | 8,171,000 | $ | 8,044,104 |
| kTerm Loan B4, 9.75%, 4/24/20 | United States | 69,136,648 | 63,294,601 | |
| Walter Energy Inc., | ||||
| i,jB, Term Loan, 7.25%, 4/01/18 | United States | 35,970,965 | 27,989,907 | |
| hfirst lien, 144A, 9.50%, 10/15/19 | United States | 20,046,000 | 15,335,190 | |
| g,h,lsecond lien, 144A, PIK, 11.50%, 4/01/20 | United States | 16,960,000 | 5,597,631 | |
| Total Corporate Bonds, Notes and Senior Floating | ||||
| Rate Interests (Cost $730,401,999) | 731,138,456 | |||
| Corporate Notes and Senior Floating Rate Interests | ||||
| in Reorganization 1.2% | ||||
| b,m Broadband Ventures III LLC, secured promissory note, 5.00%, 2/01/12 | United States | 19,594 | — | |
| i,j,mTexas Competitive Electric Holdings Co. LLC, Extended Term Loan, | ||||
| 4.648%, 10/10/17 | United States | 194,177,556 | 125,729,967 | |
| h,m Texas Competitive Electric Holdings Co. LLC/Texas Competitive Electric | ||||
| Holdings Finance Inc., senior secured note, 144A, 11.50%, 10/01/20 | United States | 98,672,000 | 70,303,800 | |
| Total Corporate Notes and Senior Floating Rate | ||||
| Interests in Reorganization (Cost $261,071,411) | 196,033,767 | |||
| Shares | ||||
| Companies in Liquidation 0.6% | ||||
| a Adelphia Recovery Trust | United States | 99,967,609 | 239,922 | |
| a,e Adelphia Recovery Trust, Arahova Contingent Value Vehicle, | ||||
| Contingent Distribution | United States | 12,005,115 | 120,051 | |
| a,b,c,d CB FIM Coinvestors LLC | United States | 43,105,703 | — | |
| a,e,f Century Communications Corp., Contingent Distribution | United States | 33,138,000 | — | |
| a,b FIM Coinvestor Holdings I, LLC | United States | 53,924,666 | — | |
| a,n Lehman Brothers Holdings Inc., Bankruptcy Claim | United States | 420,480,670 | 105,120,168 | |
| a,e,f Tribune Media Litigation Trust, Contingent Distribution | United States | 995,729 | — | |
| a,e,f Tropicana Litigation Trust, Contingent Distribution | United States | 76,355,000 | — | |
| Total Companies in Liquidation (Cost $125,665,191) | 105,480,141 | |||
| Principal | ||||
| Amount* | ||||
| Municipal Bonds (Cost $45,179,457) 0.3% | ||||
| Puerto Rico Commonwealth GO, Refunding, Series A, 8.00%, 7/01/35 | United States | 48,397,000 | 42,286,879 | |
| Total Investments before Short Term Investments | ||||
| (Cost $10,888,328,137) | 15,082,531,787 | |||
| Short Term Investments 7.6% | ||||
| U.S. Government and Agency Securities 7.5% | ||||
| o FHLB, 1/02/15 | United States | 1,900,000 | 1,900,000 | |
| o,p U.S. Treasury Bills, | ||||
| 2/19/15 | United States | 263,000,000 | 262,995,529 | |
| 1/02/15 - 7/02/15 | United States | 968,000,000 | 967,932,229 | |
| Total U.S. Government and Agency Securities | ||||
| (Cost $1,232,761,078) | 1,232,827,758 | |||
| Total Investments before Money Market Funds | ||||
| (Cost $12,121,089,215) | 16,315,359,545 | |||
| franklintempleton.com | Annual Report | 25 | |||
FRANKLIN MUTUAL SHARES FUND
STATEMENT OF INVESTMENTS
| Country | Shares | Value | |||
| Short Term Investments (continued) | |||||
| q Investments from Cash Collateral Received for Loaned | |||||
| Securities (Cost $24,944,100) 0.1% | |||||
| Money Market Funds 0.1% | |||||
| r BNY Mellon Overnight Government Fund, 0.072% | United States | 24,944,100 | $ | 24,944,100 | |
| Total Investments (Cost $12,146,033,315) 99.5% | 16,340,303,645 | ||||
| Securities Sold Short (0.6)% | (104,153,151 | ) | |||
| Other Assets, less Liabilities 1.1% | 183,519,338 | ||||
| Net Assets 100.0% | $ | 16,419,669,832 | |||
| s Securities Sold Short (Proceeds $108,441,982) (0.6)% | |||||
| Common Stocks (0.6)% | |||||
| Diversified Telecommunication Services (0.6)% | |||||
| AT&T Inc. | United States | 3,100,719 | $ | (104,153,151 | ) |
†Rounds to less than 0.1% of net assets.
* The principal amount is stated in U.S. dollars unless otherwise indicated.
aNon-income producing.
bSee Note 9 regarding restricted securities.
cSee Note 11 regarding holdings of 5% voting securities.
dAt December 31, 2014, pursuant to the Fund’s policies and the requirements of applicable securities law, the Fund may be restricted from trading these securities for a limited
or extended period of time.
eContingent distributions represent the right to receive additional distributions, if any, during the reorganization of the underlying company. Shares represent total underlying
principal of debt securities.
fSecurity has been deemed illiquid because it may not be able to be sold within seven days. At December 31, 2014, the aggregate value of these securities was $120,251,997,
representing 0.73% of net assets.
gA portion or all of the security is on loan at December 31, 2014. See Note 1(g).
hSecurity was purchased pursuant to Rule 144A under the Securities Act of 1933 and may be sold in transactions exempt from registration only to qualified institutional buyers
or in a public offering registered under the Securities Act of 1933. These securities have been deemed liquid under guidelines approved by the Trust’s Board of Trustees. At
December 31, 2014, the aggregate value of these securities was $247,077,848, representing 1.50% of net assets.
iSee Note 1(h) regarding senior floating rate interests.
jThe coupon rate shown represents the rate at period end.
kA portion or all of the security purchased on a delayed delivery basis. See Note 1(c).
lIncome may be received in additional securities and/or cash.
mSee Note 8 regarding credit risk and defaulted securities.
nBankruptcy Claim represent the right to receive distributions, if any, during the liquidation of the underlying pool of assets. Shares represent the amount of allowed unsecured
claims.
oThe security is traded on a discount basis with no stated coupon rate.
pSecurity or a portion of the security has been pledged as collateral for securities sold short, open futures and forward contracts. At December 31, 2014, the aggregate value of
these securities and/or cash pledged as collateral was $169,069,960, representing 1.03% of net assets.
qSee Note 1(g) regarding securities on loan.
rThe rate shown is the annualized seven-day yield at period end.
sSee Note 1(f) regarding securities sold short.
26 | Annual Report
franklintempleton.com
| FRANKLIN MUTUAL SHARES FUND | |||||||||||||
| STATEMENT OF INVESTMENTS | |||||||||||||
| At December 31, 2014, the Fund had the following futures contracts outstanding. See Note 1(d). | |||||||||||||
| Futures Contracts | |||||||||||||
| Number of | Notional Expiration | Unrealized | Unrealized | ||||||||||
| Description | Type Contracts | Value | Date | Appreciation | Depreciation | ||||||||
| Currency Contracts | |||||||||||||
| CHF/USD | Short | 68 | $ | 8,562,900 | 3/16/15 | $ | 199,535 | $ | — | ||||
| EUR/USD | Short | 1,284 | 194,317,350 | 3/16/15 | 4,680,832 | — | |||||||
| GBP/USD | Short | 3,270 | 318,211,875 | 3/16/15 | 1,877,075 | — | |||||||
| Unrealized appreciation (depreciation) | 6,757,442 | — | |||||||||||
| Net unrealized appreciation (depreciation) | $ | 6,757,442 | |||||||||||
| At December 31, 2014, the Fund had the following forward exchange contracts outstanding. See Note 1(d). | |||||||||||||
| Forward Exchange Contracts | |||||||||||||
| Contract | Settlement | Unrealized | Unrealized | ||||||||||
| Currency | Counterpartya Type | Quantity | Amount | Date Appreciation Depreciation | |||||||||
| Euro | BANT | Buy | 565,714 | $ | 704,569 | 1/20/15 | $ | — | $ | (19,903 | ) | ||
| Euro | BANT | Sell | 268,491 | 354,709 | 1/20/15 | 29,763 | — | ||||||
| Euro | BONY | Buy | 93,419 | 117,009 | 1/20/15 | — | (3,947 | ) | |||||
| Euro | DBFX | Buy | 1,131,428 | 1,409,894 | 1/20/15 | — | (40,563 | ) | |||||
| Euro | DBFX | Sell | 1,214,178 | 1,604,336 | 1/20/15 | 134,855 | — | ||||||
| Euro | FBCO | Sell | 220,075 | 291,560 | 1/20/15 | 25,210 | — | ||||||
| Euro | HSBC | Buy | 1,131,429 | 1,409,308 | 1/20/15 | — | (39,976 | ) | |||||
| Euro | HSBC | Sell | 1,079,932 | 1,427,238 | 1/20/15 | 120,231 | — | ||||||
| Euro | SCBT | Sell | 273,819 | 361,887 | 1/20/15 | 30,493 | — | ||||||
| Euro | SSBT | Buy | 1,205,060 | 1,500,895 | 1/20/15 | — | (42,449 | ) | |||||
| Euro | SSBT | Sell | 1,079,932 | 1,427,111 | 1/20/15 | 120,104 | — | ||||||
| British Pound | BANT | Buy | 41,834,473 | 68,252,815 | 1/21/15 | — | (3,056,423 | ) | |||||
| British Pound | BBU | Buy | 36,422,569 | 58,746,195 | 1/21/15 | — | (1,983,913 | ) | |||||
| British Pound | DBFX | Sell | 79,710,205 | 135,945,971 | 1/21/15 | 11,722,634 | — | ||||||
| British Pound | FBCO | Buy | 13,086,161 | 21,363,824 | 1/21/15 | — | (969,865 | ) | |||||
| British Pound | FBCO | Sell | 1,553,437 | 2,518,270 | 1/21/15 | 97,337 | — | ||||||
| British Pound | HSBC | Buy | 2,037,713 | 3,423,867 | 1/21/15 | — | (248,220 | ) | |||||
| British Pound | HSBC | Sell | 56,116,005 | 95,733,905 | 1/21/15 | 8,280,643 | — | ||||||
| British Pound | SCBT | Sell | 2,669,558 | 4,326,660 | 1/21/15 | 166,321 | — | ||||||
| British Pound | SSBT | Buy | 6,611,379 | 11,074,850 | 1/21/15 | — | (771,431 | ) | |||||
| British Pound | SSBT | Sell | 74,013,998 | 126,327,091 | 1/21/15 | 10,980,934 | — | ||||||
| South Korean Won | BANT | Buy | 4,503,026,384 | 4,202,882 | 2/12/15 | — | (94,743 | ) | |||||
| South Korean Won | BANT | Sell | 57,026,254,622 | 54,495,694 | 2/12/15 | 2,528,980 | (58,686 | ) | |||||
| South Korean Won | BONY | Sell | 4,522,734,532 | 4,382,350 | 2/12/15 | 256,232 | — | ||||||
| South Korean Won | FBCO | Buy | 1,412,739,859 | 1,292,534 | 2/12/15 | — | (3,683 | ) | |||||
| South Korean Won | FBCO | Sell | 76,518,933,272 | 73,724,895 | 2/12/15 | 3,916,206 | — | ||||||
| South Korean Won | HSBC | Buy | 14,022,673,339 | 12,807,183 | 2/12/15 | 53,998 | (68,210 | ) | |||||
| South Korean Won | HSBC | Sell | 74,870,880,806 | 72,061,338 | 2/12/15 | 3,830,479 | (74,302 | ) | |||||
| Swiss Franc | BANT | Buy | 4,120,876 | 4,256,312 | 2/12/15 | — | (108,293 | ) | |||||
| Swiss Franc | BANT | Sell | 30,311,377 | 33,516,894 | 2/12/15 | 3,005,864 | — | ||||||
| Swiss Franc | DBFX | Buy | 5,363,525 | 5,552,036 | 2/12/15 | — | (153,183 | ) | |||||
| Swiss Franc | DBFX | Sell | 1,535,227 | 1,663,348 | 2/12/15 | 118,009 | — | ||||||
| Swiss Franc | FBCO | Buy | 5,647,170 | 5,863,457 | 2/12/15 | — | (179,090 | ) | |||||
| Swiss Franc | FBCO | Sell | 1,344,952 | 1,428,228 | 2/12/15 | 74,417 | — | ||||||
| Swiss Franc | HSBC | Buy | 134,243 | 138,784 | 2/12/15 | — | (3,657 | ) | |||||
| Swiss Franc | HSBC | Sell | 339,635 | 345,266 | 2/12/15 | 3,394 | — | ||||||
| Swiss Franc | SSBT | Buy | 7,242,730 | 7,498,455 | 2/12/15 | — | (208,019 | ) | |||||
| Swiss Franc | SSBT | Sell | 195,342 | 203,201 | 2/12/15 | 6,572 | — | ||||||
| British Pound | BANT | Buy | 47,456,647 | 76,428,771 | 2/19/15 | — | (2,487,149 | ) | |||||
| franklintempleton.com | Annual Report | 27 | ||||||||||||
FRANKLIN MUTUAL SHARES FUND
STATEMENT OF INVESTMENTS
| Forward Exchange Contracts (continued) | |||||||||||
| Contract | Settlement | Unrealized | Unrealized | ||||||||
| Currency | Counterpartya Type | Quantity | Amount | Date Appreciation Depreciation | |||||||
| British Pound | BANT | Sell | 71,114,405 | $ | 116,916,002 | 2/19/15 | $ | 6,113,517 | $ | — | |
| British Pound | BBU | Buy | 1,066,489 | 1,693,944 | 2/19/15 | — | (32,260 | ) | |||
| British Pound | DBFX | Buy | 6,131,641 | 9,821,321 | 2/19/15 | — | (267,686 | ) | |||
| British Pound | DBFX | Sell | 1,236,169 | 1,936,627 | 2/19/15 | 10,567 | — | ||||
| British Pound | FBCO | Buy | 12,870,252 | 20,601,941 | 2/19/15 | — | (548,959 | ) | |||
| British Pound | FBCO | Sell | 66,928,356 | 109,868,235 | 2/19/15 | 5,587,981 | — | ||||
| British Pound | HSBC | Buy | 10,209,783 | 16,354,640 | 2/19/15 | — | (446,902 | ) | |||
| British Pound | HSBC | Sell | 6,990,132 | 11,275,501 | 2/19/15 | 384,262 | — | ||||
| British Pound | SCBT | Buy | 909,303 | 1,472,089 | 2/19/15 | — | (55,315 | ) | |||
| British Pound | SCBT | Sell | 1,488,213 | 2,392,421 | 2/19/15 | 73,655 | — | ||||
| British Pound | SSBT | Buy | 19,373,481 | 31,242,772 | 2/19/15 | — | (1,057,188 | ) | |||
| British Pound | SSBT | Sell | 57,574,930 | 94,998,595 | 2/19/15 | 5,291,801 | — | ||||
| Euro | BANT | Buy | 181,187 | 227,083 | 2/27/15 | — | (7,730 | ) | |||
| Euro | BANT | Sell | 1,045,925 | 1,366,622 | 2/27/15 | 100,376 | — | ||||
| Euro | BONY | Buy | 1,201,669 | 1,494,215 | 2/27/15 | — | (39,418 | ) | |||
| Euro | BONY | Sell | 1,922,528 | 2,521,738 | 2/27/15 | 194,234 | — | ||||
| Euro | DBFX | Buy | 1,976,792 | 2,460,474 | 2/27/15 | — | (67,276 | ) | |||
| Euro | DBFX | Sell | 3,157,816 | 4,124,935 | 2/27/15 | 301,933 | — | ||||
| Euro | FBCO | Buy | 1,270,839 | 1,576,694 | 2/27/15 | — | (38,156 | ) | |||
| Euro | FBCO | Sell | 1,437,028 | 1,871,694 | 2/27/15 | 131,960 | — | ||||
| Euro | HSBC | Buy | 2,256,229 | 2,805,101 | 2/27/15 | — | (73,603 | ) | |||
| Euro | HSBC | Sell | 2,513,732 | 3,275,850 | 2/27/15 | 232,606 | — | ||||
| Euro | SCBT | Sell | 1,520,726 | 1,974,739 | 2/27/15 | 133,676 | — | ||||
| Euro | SSBT | Buy | 1,976,792 | 2,461,070 | 2/27/15 | — | (67,872 | ) | |||
| Euro | SSBT | Sell | 1,990,004 | 2,594,844 | 2/27/15 | 185,651 | — | ||||
| Euro | BANT | Sell | 6,268,797 | 7,971,202 | 4/16/15 | 378,433 | — | ||||
| Euro | BBU | Sell | 951,661 | 1,194,287 | 4/16/15 | 41,635 | — | ||||
| Euro | BONY | Sell | 1,835,421 | 2,300,979 | 4/16/15 | 77,917 | — | ||||
| Euro | DBFX | Sell | 22,321,975 | 28,276,811 | 4/16/15 | 1,240,427 | — | ||||
| Euro | FBCO | Sell | 4,148,728 | 5,212,750 | 4/16/15 | 187,809 | — | ||||
| Euro | HSBC | Sell | 5,445,550 | 6,874,831 | 4/16/15 | 279,179 | — | ||||
| Euro | SCBT | Sell | 917,710 | 1,150,212 | 4/16/15 | 38,681 | — | ||||
| Euro | SSBT | Sell | 4,856,165 | 6,116,778 | 4/16/15 | 234,989 | — | ||||
| British Pound | BANT | Sell | 5,886,792 | 9,195,757 | 4/22/15 | 28,514 | — | ||||
| British Pound | HSBC | Sell | 57,256,038 | 91,888,104 | 4/22/15 | 2,725,779 | — | ||||
| British Pound | SCBT | Sell | 57,196,761 | 92,143,982 | 4/22/15 | 3,073,966 | — | ||||
| Euro | BANT | Sell | 61,001,714 | 76,172,840 | 5/18/15 | 2,262,108 | — | ||||
| Euro | BONY | Sell | 380,905 | 464,323 | 5/18/15 | 2,812 | — | ||||
| Euro | DBFX | Sell | 68,639,701 | 85,668,255 | 5/18/15 | 2,503,206 | — | ||||
| Euro | FBCO | Sell | 66,319,078 | 82,806,059 | 5/18/15 | 2,452,716 | — | ||||
| Euro | HSBC | Sell | 5,687,211 | 7,050,795 | 5/18/15 | 160,072 | — | ||||
| Euro | SSBT | Sell | 3,533,578 | 4,418,717 | 5/18/15 | 137,373 | — | ||||
| British Pound | BANT | Buy | 1,935,048 | 3,019,149 | 5/21/15 | — | (6,482 | ) | |||
| British Pound | BANT | Sell | 44,885,618 | 70,245,992 | 5/21/15 | 363,799 | — | ||||
| British Pound | FBCO | Buy | 1,027,176 | 1,599,021 | 5/21/15 | 184 | — | ||||
| British Pound | FBCO | Sell | 32,333,146 | 50,562,574 | 5/21/15 | 223,260 | — | ||||
| British Pound | HSBC | Buy | 3,391,356 | 5,303,069 | 5/21/15 | — | (23,084 | ) | |||
| British Pound | SSBT | Sell | 59,249,016 | 92,665,461 | 5/21/15 | 420,965 | — | ||||
| Unrealized appreciation (depreciation) | 81,078,719 | (13,347,636 | ) | ||||||||
| Net unrealized appreciation (depreciation) | $ | 67,731,083 | |||||||||
| aMay be comprised of multiple contracts with the same counterparty, currency and settlement date. | |||||||||||
| See Abbreviations on page 47. | |||||||||||
| 28 | Annual Report | The accompanying notes are an integral part of these financial statements. | franklintempleton.com | ||||||||||
FRANKLIN MUTUAL SHARES FUND
Financial Statements
Statement of Assets and Liabilities
December 31, 2014
| Assets: | ||
| Investments in securities: | ||
| Cost - Unaffiliated issuers | $ | 11,865,549,153 |
| Cost - Non-controlled affiliated issuers (Note 11) | 280,484,162 | |
| Total cost of investments | $ | 12,146,033,315 |
| Value - Unaffiliated issuers | $ | 15,667,656,442 |
| Value - Non-controlled affiliated issuers (Note 11) | 672,647,203 | |
| Total value of investments (includes securities loaned in the amount of $23,855,094) | 16,340,303,645 | |
| Cash | 1,418,396 | |
| Restricted Cash (Note 1e) | 20,200,000 | |
| Foreign currency, at value (cost $28,606,016) | 28,658,204 | |
| Receivables: | ||
| Investment securities sold | 13,122,255 | |
| Capital shares sold | 10,851,540 | |
| Dividends and interest | 31,968,239 | |
| Due from brokers | 107,815,125 | |
| Variation margin | 473,075 | |
| Unrealized appreciation on forward exchange contracts | 81,078,719 | |
| Other assets | 3,734,865 | |
| Total assets | 16,639,624,063 | |
| Liabilities: | ||
| Payables: | ||
| Investment securities purchased | 25,441,932 | |
| Capital shares redeemed | 14,108,347 | |
| Management fees | 8,987,274 | |
| Distribution fees | 4,945,958 | |
| Transfer agent fees | 2,516,915 | |
| Trustees’ fees and expenses | 715,684 | |
| Securities sold short, at value (proceeds $108,441,982) | 104,153,151 | |
| Payable upon return of securities loaned | 24,944,100 | |
| Due to Brokers | 20,200,000 | |
| Unrealized depreciation on forward exchange contracts | 13,347,636 | |
| Accrued expenses and other liabilities | 593,234 | |
| Total liabilities | 219,954,231 | |
| Net assets, at value | $ | 16,419,669,832 |
| Net assets consist of: | ||
| Paid-in capital | $ | 12,135,158,105 |
| Undistributed net investment income | 3,557,868 | |
| Net unrealized appreciation (depreciation) | 4,272,875,400 | |
| Accumulated net realized gain (loss) | 8,078,459 | |
| Net assets, at value | $ | 16,419,669,832 |
franklintempleton.com
The accompanying notes are an integral part of these financial statements. | Annual Report | 29
| FRANKLIN MUTUAL SHARES FUND | ||
| FINANCIAL STATEMENTS | ||
| Statement of Assets and Liabilities (continued) | ||
| December 31, 2014 | ||
| Class Z: | ||
| Net assets, at value | $ | 7,363,764,789 |
| Shares outstanding | 249,437,555 | |
| Net asset value and maximum offering price per share | $ | 29.52 |
| Class A: | ||
| Net assets, at value | $ | 5,392,129,946 |
| Shares outstanding | 184,114,657 | |
| Net asset value per sharea | $ | 29.29 |
| Maximum offering price per share (net asset value per share ÷ 94.25%) | $ | 31.08 |
| Class C: | ||
| Net assets, at value | $ | 1,240,845,434 |
| Shares outstanding | 42,758,135 | |
| Net asset value and maximum offering price per sharea | $ | 29.02 |
| Class R: | ||
| Net assets, at value | $ | 172,938,290 |
| Shares outstanding | 5,933,853 | |
| Net asset value and maximum offering price per share | $ | 29.14 |
| Class R6: | ||
| Net assets, at value | $ | 2,249,991,373 |
| Shares outstanding | 76,244,509 | |
| Net asset value and maximum offering price per share | $ | 29.51 |
| aRedemption price is equal to net asset value less contingent deferred sales charges, if applicable. | |
| 30 | Annual Report | The accompanying notes are an integral part of these financial statements. | franklintempleton.com |
FRANKLIN MUTUAL SHARES FUND
FINANCIAL STATEMENTS
Statement of Operations
for the year ended December 31, 2014
| Investment income: | |||
| Dividends: | |||
| Unaffiliated issuers | $ | 489,241,985 | |
| Non-controlled affiliated issuers (Note 11) | 5,433,866 | ||
| Interest | 73,890,127 | ||
| Income from securities loaned | 827,956 | ||
| Total investment income | 569,393,934 | ||
| Expenses: | |||
| Management fees (Note 3a) | 99,749,387 | ||
| Administrative fees (Note 3b) | 6,148,966 | ||
| Distribution fees: (Note 3c) | |||
| Class A | 16,468,547 | ||
| Class C | 12,481,062 | ||
| Class R | 911,746 | ||
| Transfer agent fees: (Note 3e) | |||
| Class Z | 8,236,368 | ||
| Class A | 6,239,704 | ||
| Class C | 1,420,822 | ||
| Class R | 207,846 | ||
| Class R6 | 57 | ||
| Custodian fees (Note 4) | 487,350 | ||
| Reports to shareholders | 914,303 | ||
| Registration and filing fees | 322,348 | ||
| Professional fees | 352,913 | ||
| Trustees’ fees and expenses | 371,791 | ||
| Dividends on securities sold short | 4,238,006 | ||
| Other | 224,798 | ||
| Total expenses | 158,776,014 | ||
| Expense reductions (Note 4) | (1,099 | ) | |
| Net expenses | 158,774,915 | ||
| Net investment income | 410,619,019 | ||
| Realized and unrealized gains (losses): | |||
| Net realized gain (loss) from: | |||
| Investments: | |||
| Unaffiliated issuers | 574,696,414 | ||
| Foreign currency transactions | (47,798,177 | ) | |
| Futures contracts | 34,992,691 | ||
| Securities sold short | (8,830,974 | ) | |
| Net realized gain (loss) | 553,059,954 | ||
| Net change in unrealized appreciation (depreciation) on: | |||
| Investments | 60,566,269 | ||
| Translation of other assets and liabilities denominated in foreign currencies | 156,334,479 | ||
| Net change in unrealized appreciation (depreciation) | 216,900,748 | ||
| Net realized and unrealized gain (loss) | 769,960,702 | ||
| Net increase (decrease) in net assets resulting from operations | $ | 1,180,579,721 |
franklintempleton.com
The accompanying notes are an integral part of these financial statements. | Annual Report | 31
| FRANKLIN MUTUAL SHARES FUND | ||||||
| FINANCIAL STATEMENTS | ||||||
| Statements of Changes in Net Assets | ||||||
| Year Ended December 31, | ||||||
| 2014 | 2013 | |||||
| Increase (decrease) in net assets: | ||||||
| Operations: | ||||||
| Net investment income | $ | 410,619,019 | $ | 251,344,544 | ||
| Net realized gain (loss) from investments, written options, foreign currency transactions, | ||||||
| futures contracts and securities sold short | 553,059,954 | 993,731,116 | ||||
| Net change in unrealized appreciation (depreciation) on investments and | ||||||
| translation of other assets and liabilities denominated in foreign currencies | 216,900,748 | 2,396,375,091 | ||||
| Net increase (decrease) in net assets resulting from operations | 1,180,579,721 | 3,641,450,751 | ||||
| Distributions to shareholders from: | ||||||
| Net investment income: | ||||||
| Class Z | (239,045,203 | ) | (108,650,856 | ) | ||
| Class A | (160,771,009 | ) | (70,929,517 | ) | ||
| Class C | (28,860,009 | ) | (8,234,548 | ) | ||
| Class R | (4,880,076 | ) | (2,105,976 | ) | ||
| Class R6 | (76,100,480 | ) | (36,946,169 | ) | ||
| Total distributions to shareholders | (509,656,777 | ) | (226,867,066 | ) | ||
| Capital share transactions: (Note 2) | ||||||
| Class Z | 45,622,128 | (2,214,251,239 | ) | |||
| Class A | (311,543,956 | ) | (322,542,799 | ) | ||
| Class B | — | (8,747,313 | ) | |||
| Class C | (45,734,382 | ) | (69,514,789 | ) | ||
| Class R | (27,313,743 | ) | (45,098,562 | ) | ||
| Class R6 | (67,074,130 | ) | 1,947,873,302 | |||
| Total capital share transactions | (406,044,083 | ) | (712,281,400 | ) | ||
| Net increase (decrease) in net assets | 264,878,861 | 2,702,302,285 | ||||
| Net assets: | ||||||
| Beginning of year | 16,154,790,971 | 13,452,488,686 | ||||
| End of year | $ | 16,419,669,832 | $ | 16,154,790,971 | ||
| Undistributed net investment income included in net assets: | ||||||
| End of year | $ | 3,557,868 | $ | 69,030,288 | ||
32 | Annual Report | The accompanying notes are an integral part of these financial statements.
franklintempleton.com
FRANKLIN MUTUAL SHARES FUND
Notes to Financial Statements
1. Organization and Significant Accounting Policies
Franklin Mutual Series Funds (Trust) is registered under the Investment Company Act of 1940, as amended, (1940 Act) as an open-end management investment company, consisting of seven separate funds and applies the specialized accounting and reporting guidance in U.S. Generally Accepted Accounting Principles (U.S. GAAP). Franklin Mutual Shares Fund (Fund) is included in this report. The financial statements of the remaining funds in the Trust are presented separately. The Fund offers five classes of shares: Class Z, Class A, Class C, Class R and Class R6. Each class of shares differs by its initial sales load, contingent deferred sales charges, voting rights on matters affecting a single class, its exchange privilege and fees primarily due to differing arrangements for distribution and transfer agent fees.
Effective June 30, 2014, Mutual Shares Fund was renamed Franklin Mutual Shares Fund.
The following summarizes the Fund’s significant accounting policies.
a. Financial Instrument Valuation
The Fund’s investments in financial instruments are carried at fair value daily. Fair value is the price that would be received to sell an asset or paid to transfer a liability in an orderly transaction between market participants on the measurement date. The Fund calculates the net asset value (NAV) per share at the close of the New York Stock Exchange (NYSE), generally at 4 p.m. Eastern time (NYSE close) on each day the NYSE is open for trading. Under compliance policies and procedures approved by the Trust’s Board of Trustees (the Board), the Fund’s administrator has responsibility for oversight of valuation, including leading the cross-functional Valuation and Liquidity Oversight Committee (VLOC). The VLOC provides administration and oversight of the Fund’s valuation policies and procedures, which are approved annually by the Board. Among other things, these procedures allow the Fund to utilize independent pricing services, quotations from securities and financial instrument dealers, and other market sources to determine fair value.
Equity securities and derivative financial instruments (derivatives) listed on an exchange or on the NASDAQ National Market System are valued at the last quoted sale price or the official closing price of the day, respectively. Foreign equity securities are valued as of the close of trading on the foreign stock exchange on which the security is primarily traded or as
of the NYSE close, whichever is earlier. The value is then converted into its U.S. dollar equivalent at the foreign exchange rate in effect at the NYSE close on the day that the value of the security is determined. Over-the-counter (OTC) securities are valued within the range of the most recent quoted bid and ask prices. Securities that trade in multiple markets or on multiple exchanges are valued according to the broadest and most representative market. Certain equity securities are valued based upon fundamental characteristics or relationships to similar securities. Investments in non-registered money market funds are valued at the closing NAV.
Debt securities generally trade in the OTC market rather than on a securities exchange. The Fund’s pricing services use multiple valuation techniques to determine fair value. In instances where sufficient market activity exists, the pricing services may utilize a market-based approach through which quotes from market makers are used to determine fair value. In instances where sufficient market activity may not exist or is limited, the pricing services also utilize proprietary valuation models which may consider market characteristics such as benchmark yield curves, credit spreads, estimated default rates, anticipated market interest rate volatility, coupon rates, anticipated timing of principal repayments, underlying collateral, and other unique security features in order to estimate the relevant cash flows, which are then discounted to calculate the fair value. Securities denominated in a foreign currency are converted into their U.S. dollar equivalent at the foreign exchange rate in effect at the NYSE close on the date that the values of the foreign debt securities are determined.
Certain derivatives trade in the OTC market. The Fund’s pricing services use various techniques including industry standard option pricing models and proprietary discounted cash flow models to determine the fair value of those instruments. The Fund’s net benefit or obligation under the derivative contract, as measured by the fair value of the contract, is included in net assets.
The Fund has procedures to determine the fair value of financial instruments for which market prices are not reliable or readily available. Under these procedures, the VLOC convenes on a regular basis to review such financial instruments and considers a number of factors, including significant unobservable valuation inputs, when arriving at fair value. The VLOC primarily employs a market-based approach which may use related or comparable assets or liabilities, recent transactions, market multiples, book values, and other relevant information for the investment to determine the fair value of the investment. An income-based valuation
franklintempleton.com
Annual Report
| 33
FRANKLIN MUTUAL SHARES FUND
NOTES TO FINANCIAL STATEMENTS
1. Organization and Significant Accounting
Policies (continued)
a. Financial Instrument Valuation (continued)
approach may also be used in which the anticipated future cash flows of the investment are discounted to calculate fair value. Discounts may also be applied due to the nature or duration of any restrictions on the disposition of the investments. Due to the inherent uncertainty of valuations of such investments, the fair values may differ significantly from the values that would have been used had an active market existed. The VLOC employs various methods for calibrating these valuation approaches including a regular review of key inputs and assumptions, transactional back-testing or disposition analysis, and reviews of any related market activity.
Trading in securities on foreign securities stock exchanges and OTC markets may be completed before the daily NYSE close. In addition, trading in certain foreign markets may not take place on every NYSE business day. Occasionally, events occur between the time at which trading in a foreign security is completed and the close of the NYSE that might call into question the reliability of the value of a portfolio security held by the Fund. As a result, differences may arise between the value of the Fund’s portfolio securities as determined at the foreign market close and the latest indications of value at the close of the NYSE. In order to minimize the potential for these differences, the VLOC monitors price movements following the close of trading in foreign stock markets through a series of country specific market proxies (such as baskets of American Depositary Receipts, futures contracts and exchange traded funds). These price movements are measured against established trigger thresholds for each specific market proxy to assist in determining if an event has occurred that may call into question the reliability of the values of the foreign securities held by the Fund. If such an event occurs, the securities may be valued using fair value procedures, which may include the use of independent pricing services.
Also, when the last day of the reporting period is a non-business day, certain foreign markets may be open on those days that the NYSE is closed, which could result in differences between the value of the Fund’s portfolio securities on the last business day and the last calendar day of the reporting period. Any significant security valuation changes due to an open foreign market are adjusted and reflected by the Fund for financial reporting purposes.
b. Foreign Currency Translation
Portfolio securities and other assets and liabilities denominated in foreign currencies are translated into U.S. dollars based on the exchange rate of such currencies against U.S. dollars on the date of valuation. The Fund may enter into foreign currency exchange contracts to facilitate transactions denominated in a foreign currency. Purchases and sales of securities, income and expense items denominated in foreign currencies are translated into U.S. dollars at the exchange rate in effect on the transaction date. Portfolio securities and assets and liabilities denominated in foreign currencies contain risks that those currencies will decline in value relative to the U.S. dollar. Occasionally, events may impact the availability or reliability of foreign exchange rates used to convert the U.S. dollar equivalent value. If such an event occurs, the foreign exchange rate will be valued at fair value using procedures established and approved by the Board.
The Fund does not separately report the effect of changes in foreign exchange rates from changes in market prices on securities held. Such changes are included in net realized and unrealized gain or loss from investments on the Statement of Operations.
Realized foreign exchange gains or losses arise from sales of foreign currencies, currency gains or losses realized between the trade and settlement dates on securities transactions and the difference between the recorded amounts of dividends, interest, and foreign withholding taxes and the U.S. dollar equivalent of the amounts actually received or paid. Net unrealized foreign exchange gains and losses arise from changes in foreign exchange rates on foreign denominated assets and liabilities other than investments in securities held at the end of the reporting period.
c. Securities Purchased on a Delayed Delivery Basis
The Fund purchases securities on a delayed delivery basis, with payment and delivery scheduled for a future date. These transactions are subject to market fluctuations and are subject to the risk that the value at delivery may be more or less than the trade date purchase price. Although the Fund will generally purchase these securities with the intention of holding the securities, it may sell the securities before the settlement date. Sufficient assets have been segregated for these securities.
34 | Annual Report
franklintempleton.com
FRANKLIN MUTUAL SHARES FUND
NOTES TO FINANCIAL STATEMENTS
d. Derivative Financial Instruments
The Fund invested in derivatives in order to manage risk or gain exposure to various other investments or markets. Derivatives are financial contracts based on an underlying or notional amount, require no initial investment or an initial net investment that is smaller than would normally be required to have a similar response to changes in market factors, and require or permit net settlement. Derivatives contain various risks including the potential inability of the counterparty to fulfill their obligations under the terms of the contract, the potential for an illiquid secondary market, and/or the potential for market movements which expose the Fund to gains or losses in excess of the amounts shown on the Statement of Assets and Liabilities. Realized gain and loss and unrealized appreciation and depreciation on these contracts for the period are included in the Statement of Operations.
Derivative counterparty credit risk is managed through a formal evaluation of the creditworthiness of all potential counterparties. The Fund attempts to reduce its exposure to counterparty credit risk on OTC derivatives, whenever possible, by entering into International Swaps and Derivatives Association (ISDA) master agreements with certain counterparties. These agreements contain various provisions, including but not limited to collateral requirements, events of default, or early termination. Termination events applicable to the counterparty include certain deteriorations in the credit quality of the counterparty. Termination events applicable to the Fund include failure of the Fund to maintain certain net asset levels and/or limit the decline in net assets over various periods of time. In the event of default or early termination, the ISDA master agreement gives the non-defaulting party the right to net and close-out all transactions traded, whether or not arising under the ISDA agreement, to one net amount payable by one counterparty to the other. However, absent an event of default or early termination, OTC derivative assets and liabilities are presented gross and not offset in the Statement of Assets and Liabilities. Early termination by the counterparty may result in an immediate payment by the Fund of any net liability owed to that counterparty under the ISDA agreement. At December 31, 2014, the Fund had OTC derivatives in a net liability position of $1,974,538 and the aggregate value of collateral pledged for such contracts was $2,230,470.
Collateral requirements differ by type of derivative. Collateral or initial margin requirements are set by the broker or exchange clearing house for exchange traded and centrally cleared derivatives. Initial margin deposited is held at the exchange and can be in the form of cash and/or securities. For OTC derivatives traded under an ISDA master agreement, posting of collateral is
required by either the Fund or the applicable counterparty if the total net exposure of all OTC derivatives with the applicable counterparty exceeds the minimum transfer amount, which typically ranges from $100,000 to $250,000, and can vary depending on the counterparty and the type of the agreement. Generally, collateral is determined at the close of fund business each day and any additional collateral required due to changes in derivative values may be delivered by the Fund or the counterparty within a few business days. Collateral pledged and/or received by the Fund for OTC derivatives, if any, is held in segregated accounts with the Fund’s custodian/counterparty broker and can be in the form of cash and/or securities. Unrestricted cash may be invested according to the Fund’s investment objectives.
At December 31, 2014, the Fund received $36,877,934 in Federal Republic of Germany Bonds, United Kingdom Treasury Bonds and Notes and U.S. Treasury Bonds and Notes as collateral for derivatives.
The Fund entered into exchange traded futures contracts primarily to manage exposure to certain foreign currencies. A futures contract is an agreement between the Fund and a counterparty to buy or sell an asset for a specified price on a future date. Required initial margins are pledged by the Fund, and the daily change in fair value is accounted for as a variation margin payable or receivable on the Statement of Assets and Liabilities.
The Fund entered into OTC forward exchange contracts primarily to manage exposure to certain foreign currencies. A forward exchange contract is an agreement between the Fund and a counterparty to buy or sell a foreign currency at a specific exchange rate on a future date.
The Fund purchased or wrote exchange traded option contracts primarily to manage exposure to equity price risk. An option is a contract entitling the holder to purchase or sell a specific amount of shares or units of an asset or notional amount of a swap (swaption), at a specified price. Options purchased are recorded as an asset while options written are recorded as a liability. Upon exercise of an option, the acquisition cost or sales proceeds of the underlying investment is adjusted by any premium received or paid. Upon expiration of an option, any premium received or paid is recorded as a realized gain or loss. Upon closing an option other than through expiration or exercise, the difference between the premium and the cost to close the position is recorded as a realized gain or loss.
See Notes 10 regarding other derivative information.
franklintempleton.com
Annual Report
| 35
FRANKLIN MUTUAL SHARES FUND
NOTES TO FINANCIAL STATEMENTS
1. Organization and Significant Accounting
Policies (continued)
e. Restricted Cash
At December 31, 2014, the Fund held restricted cash in connection with investments in certain derivative securities. Restricted cash is held in a segregated account with the Fund’s custodian/counterparty broker and is reflected in the Statement of Assets and Liabilities.
f. Securities Sold Short
The Fund is engaged in selling securities short, which obligates the Fund to replace a borrowed security with the same security at current fair value. The Fund incurs a loss if the price of the security increases between the date of the short sale and the date on which the Fund replaces the borrowed security. The Fund realizes a gain if the price of the security declines between those dates. Gains are limited to the price at which the Fund sold the security short, while losses are potentially unlimited in size.
The Fund is required to establish a margin account with the broker lending the security sold short. While the short sale is outstanding, the broker retains the proceeds of the short sale to the extent necessary to meet margin requirements until the short position is closed out. A deposit must also be maintained with the Fund’s custodian/counterparty broker consisting of cash and/or securities having a value equal to a specified percentage of the value of the securities sold short. The Fund is obligated to pay fees for borrowing the securities sold short and is required to pay the counterparty any dividends and/or interest due on securities sold short. Such dividends and/or interest and any security borrowing fees are recorded as an expense to the Fund.
g. Securities Lending
The Fund participates in an agency based securities lending program. The Fund receives cash collateral against the loaned securities in an amount equal to at least 102% of the fair value of the loaned securities. Collateral is maintained over the life of the loan in an amount not less than 100% of the fair value of loaned securities, as determined at the close of fund business each day; any additional collateral required due to changes in security values is delivered to the Fund on the next business day. The collateral is invested in a non-registered money fund as indicated on the Statement of Investments. The Fund receives income from the investment of cash collateral, in addition to lending fees and rebates paid by the borrower. The Fund bears the market risk with respect to the collateral investment,
securities loaned, and the risk that the agent may default on its obligations to the Fund. The securities lending agent has agreed to indemnify the Fund in the event of default by a third party borrower.
h. Senior Floating Rate Interests
The Fund invests in senior secured corporate loans that pay interest at rates which are periodically reset by reference to a base lending rate plus a spread. These base lending rates are generally the prime rate offered by a designated U.S. bank or the London InterBank Offered Rate (LIBOR). Senior secured corporate loans often require prepayment of principal from excess cash flows or at the discretion of the borrower. As a result, actual maturity may be substantially less than the stated maturity. Senior secured corporate loans in which the Fund invests are generally readily marketable, but may be subject to certain restrictions on resale.
i. Income and Deferred Taxes
It is the Fund’s policy to qualify as a regulated investment company under the Internal Revenue Code. The Fund intends to distribute to shareholders substantially all of its taxable income and net realized gains to relieve it from federal income and excise taxes. As a result, no provision for U.S. federal income taxes is required.
The Fund may be subject to foreign taxation related to income received, capital gains on the sale of securities and certain foreign currency transactions in the foreign jurisdictions in which it invests. Foreign taxes, if any, are recorded based on the tax regulations and rates that exist in the foreign markets in which the Fund invests. When a capital gain tax is determined to apply the Fund records an estimated deferred tax liability in an amount that would be payable if the securities were disposed of on the valuation date. As a result of several court cases, in certain countries across the European Union, the Fund has filed additional tax reclaims for previously withheld taxes on dividends earned in those countries. These additional filings are subject to various administrative proceedings by the local jurisdictions’ tax authorities within the European Union, as well as a number of related judicial proceedings. At this time, uncertainty exists as to the ultimate resolution of these proceedings, the likelihood of receipt of these reclaims, and the potential timing of payments, and accordingly, no amounts are reflected in the financial statements.
The Fund recognizes the tax benefits of uncertain tax positions only when the position is “more likely than not” to be sustained
36 | Annual Report
franklintempleton.com
FRANKLIN MUTUAL SHARES FUND
NOTES TO FINANCIAL STATEMENTS
upon examination by the tax authorities based on the technical merits of the tax position. As of December 31, 2014, and for all open tax years, the Fund has determined that no liability for unrecognized tax benefits is required in the Fund’s financial statements related to uncertain tax positions taken on a tax return (or expected to be taken on future tax returns). Open tax years are those that remain subject to examination and are based on each tax jurisdiction statute of limitation.
j. Security Transactions, Investment Income, Expenses and Distributions
Security transactions are accounted for on trade date. Realized gains and losses on security transactions are determined on a specific identification basis. Interest income and estimated expenses are accrued daily. Amortization of premium and accretion of discount on debt securities are included in interest income. Dividend income and dividends declared on securities sold short are recorded on the ex-dividend date except for certain foreign securities where the dividend rate is not available. In such cases, the dividend is recorded as soon as the information is received by the Fund. Distributions to shareholders are recorded on the ex-dividend date and are determined according to income tax regulations (tax basis). Distributable earnings determined on a tax basis may differ from earnings recorded in accordance with U.S. GAAP. These differences may be permanent or temporary. Permanent differences are reclassified among capital accounts to reflect their tax character. These reclassifications have no impact on net assets or the results of operations. Temporary differences are not reclassified, as they may reverse in subsequent periods.
Common expenses incurred by the Trust are allocated among the funds based on the ratio of net assets of each fund to the combined net assets of the Trust. Fund specific expenses are charged directly to the fund that incurred the expense.
Realized and unrealized gains and losses and net investment income, not including class specific expenses, are allocated daily to each class of shares based upon the relative proportion of net assets of each class. Differences in per share distributions, by class, are generally due to differences in class specific expenses.
k. Accounting Estimates
The preparation of financial statements in accordance with U.S. GAAP requires management to make estimates and assumptions that affect the reported amounts of assets and liabilities at the date of the financial statements and the amounts of income and expenses during the reporting period. Actual results could differ from those estimates.
l. Guarantees and Indemnifications
Under the Trust’s organizational documents, its officers and trustees are indemnified by the Trust against certain liabilities arising out of the performance of their duties to the Trust. Additionally, in the normal course of business, the Trust, on behalf of the Fund, enters into contracts with service providers that contain general indemnification clauses. The Trust’s maximum exposure under these arrangements is unknown as this would involve future claims that may be made against the Trust that have not yet occurred. Currently, the Trust expects the risk of loss to be remote.
2. Shares of Beneficial Interest
At December 31, 2014, there were an unlimited number of shares authorized (without par value). Transactions in the Fund’s shares were as follows:
| Year Ended December 31, | ||||||||||
| 2014 | 2013 | |||||||||
| Shares | Amount | Shares | Amount | |||||||
| Class Z Shares: | ||||||||||
| Shares sold | 22,793,740 | $ | 670,723,079 | 23,777,445 | $ | 610,905,219 | ||||
| Shares issued in reinvestment of distributions | 7,266,342 | 217,049,081 | 3,583,743 | 98,456,406 | ||||||
| Shares redeemeda | (28,537,599 | ) | (842,150,032 | ) | (116,412,728 | ) | (2,923,612,864 | ) | ||
| Net increase (decrease) | 1,522,483 | $ | 45,622,128 | (89,051,540 | ) | $ | (2,214,251,239 | ) | ||
| Class A Shares: | ||||||||||
| Shares sold | 17,328,653 | $ | 506,435,075 | 19,131,649 | $ | 488,767,639 | ||||
| Shares issued in reinvestment of distributions | 5,000,232 | 148,238,236 | 2,409,509 | 65,436,121 | ||||||
| Shares redeemed | (33,005,127 | ) | (966,217,267 | ) | (34,406,256 | ) | (876,746,559 | ) | ||
| Net increase (decrease) | (10,676,242 | ) | $ | (311,543,956 | ) | (12,865,098 | ) | $ | (322,542,799 | ) |
| franklintempleton.com | Annual Report | 37 | |||||||||
FRANKLIN MUTUAL SHARES FUND
NOTES TO FINANCIAL STATEMENTS
| 2. Shares of Beneficial Interest (continued) | ||||||||||
| Year Ended December 31, | ||||||||||
| 2014 | 2013 | c | ||||||||
| Shares | Amount | Shares | Amount | |||||||
| Class B Sharesb: | ||||||||||
| Shares sold | 561 | $ | 13,200 | |||||||
| Shares redeemed | (373,830 | ) | (8,760,513 | ) | ||||||
| Net increase (decrease) | (373,269 | ) | $ | (8,747,313 | ) | |||||
| Class C Shares: | ||||||||||
| Shares sold | 3,259,585 | $ | 93,998,595 | 3,626,063 | $ | 91,651,237 | ||||
| Shares issued in reinvestment of distributions | 926,812 | 27,251,988 | 293,487 | 7,744,860 | ||||||
| Shares redeemed | (5,790,089 | ) | (166,984,965 | ) | (6,713,803 | ) | (168,910,886 | ) | ||
| Net increase (decrease) | (1,603,692 | ) | $ | (45,734,382 | ) | (2,794,253 | ) | $ | (69,514,789 | ) |
| Class R Shares: | ||||||||||
| Shares sold | 768,981 | $ | 22,249,134 | 1,292,806 | $ | 32,376,979 | ||||
| Shares issued in reinvestment of distributions | 164,329 | 4,850,146 | 78,123 | 2,098,501 | ||||||
| Shares redeemed | (1,884,250 | ) | (54,413,023 | ) | (3,105,285 | ) | (79,574,042 | ) | ||
| Net increase (decrease) | (950,940 | ) | $ | (27,313,743 | ) | (1,734,356 | ) | $ | (45,098,562 | ) |
| Class R6 Shares: | ||||||||||
| Shares solda | 3,360,357 | $ | 98,879,499 | 82,984,840 | $ | 2,067,192,481 | ||||
| Shares issued in reinvestment of distributions | 2,548,288 | 76,100,480 | 1,344,162 | 36,946,169 | ||||||
| Shares redeemed | (8,093,000 | ) | (242,054,109 | ) | (5,900,138 | ) | (156,265,348 | ) | ||
| Net increase (decrease) | (2,184,355 | ) | $ | (67,074,130 | ) | 78,428,864 | $ | 1,947,873,302 | ||
| aEffective May 1, 2013, a portion of Class Z shares were exchanged into Class R6. | ||||||||||
| bEffective March 22, 2013, all Class B shares were converted to Class A. | ||||||||||
| cFor the period May 1, 2013 (effective date) to December 31, 2013, for Class R6. | ||||||||||
3. Transactions with Affiliates
Franklin Resources, Inc. is the holding company for various subsidiaries that together are referred to as Franklin Templeton Investments. Certain officers and trustees of the Fund are also officers and/or directors of the following subsidiaries:
| Subsidiary | Affiliation |
| Franklin Mutual Advisers, LLC (Franklin Mutual) | Investment manager |
| Franklin Templeton Services, LLC (FT Services) | Administrative manager |
| Franklin Templeton Distributors, Inc. (Distributors) | Principal underwriter |
| Franklin Templeton Investor Services, LLC (Investor Services) | Transfer agent |
38 | Annual Report
franklintempleton.com
FRANKLIN MUTUAL SHARES FUND
NOTES TO FINANCIAL STATEMENTS
a. Management Fees
The Fund pays an investment management fee to Franklin Mutual based on the average daily net assets of the Fund as follows:
| Annualized Fee Rate | Net Assets | |
| 0.675 | % | Up to and including $5 billion |
| 0.645 | % | Over $5 billion, up to and including $10 billion |
| 0.625 | % | Over $10 billion, up to and including $15 billion |
| 0.595 | % | Over $15 billion, up to and including $20 billion |
| 0.585 | % | Over $20 billion, up to and including $25 billion |
| 0.565 | % | Over $25 billion, up to and including $30 billion |
| 0.555 | % | Over $30 billion, up to and including $35 billion |
| 0.545 | % | In excess of $35 billion |
| Effective July 1, 2014, the Fund combined its investment management and administration agreements as approved by the Board. | ||
| The fees paid under the combined agreement do not exceed the aggregate fees that were paid under the separate agreements. | ||
| Prior to July 1, 2014, the Fund paid fees to Franklin Mutual based on the average daily net assets of the Fund as follows: | ||
| Annualized Fee Rate | Net Assets | |
| 0.600 | % | Up to and including $5 billion |
| 0.570 | % | Over $5 billion, up to and including $10 billion |
| 0.550 | % | Over $10 billion, up to and including $15 billion |
| 0.520 | % | Over $15 billion, up to and including $20 billion |
| 0.510 | % | Over $20 billion, up to and including $25 billion |
| 0.490 | % | Over $25 billion, up to and including $30 billion |
| 0.480 | % | Over $30 billion, up to and including $35 billion |
| 0.470 | % | In excess of $35 billion |
b. Administrative Fees
Effective July 1, 2014, under an agreement with Franklin Mutual, FT Services provides administrative services to the Fund. The fee is paid by Franklin Mutual based on the Fund’s average daily net assets, and is not an additional expense of the Fund.
Prior to July 1, 2014, the Fund paid its allocated share of an administrative fee to FT Services based on the Trust’s aggregate average daily net assets as follows:
| Annualized Fee Rate | Net Assets | |
| 0.150 | % | Up to and including $200 million |
| 0.135 | % | Over $200 million, up to and including $700 million |
| 0.100 | % | Over $700 million, up to and including $1.2 billion |
| 0.075 | % | In excess of $1.2 billion |
franklintempleton.com
Annual Report
| 39
FRANKLIN MUTUAL SHARES FUND
NOTES TO FINANCIAL STATEMENTS
3. Transactions with Affiliates (continued)
c. Distribution Fees
The Board has adopted distribution plans for each share class, with the exception of Class Z and Class R6 shares, pursuant to Rule 12b-1 under the 1940 Act. Distribution fees are not charged on shares held by affiliates. Under the Fund’s Class A reimbursement distribution plan, the Fund reimburses Distributors for costs incurred in connection with the servicing, sale and distribution of the Fund’s shares up to the maximum annual plan rate. Under the Class A reimbursement distribution plan, costs exceeding the maximum for the current plan year cannot be reimbursed in subsequent periods. In addition, under the Fund’s Class C and R compensation distribution plans, the Fund pays Distributors for costs incurred in connection with the servicing, sale and distribution of the Fund’s shares up to the maximum annual plan rate for each class. The plan year, for purposes of monitoring compliance with the maximum annual plan rates, is February 1 through January 31 for each fund.
The maximum annual plan rates, based on the average daily net assets, for each class, are as follows:
| Class A | 0.35 | % |
| Class C | 1.00 | % |
| Class R | 0.50 | % |
The Board has set the current rate at 0.30% per year for Class A shares until further notice and approval by the Board.
d. Sales Charges/Underwriting Agreements
Front-end sales charges and contingent deferred sales charges (CDSC) do not represent expenses of the Fund. These charges are deducted from the proceeds of sales of Fund shares prior to investment or from redemption proceeds prior to remittance, as applicable. Distributors has advised the Fund of the following commission transactions related to the sales and redemptions of the Fund’s shares for the year:
| Sales charges retained net of commissions | ||
| paid to unaffiliated broker/dealers | $ | 1,373,834 |
| CDSC retained | $ | 36,415 |
e. Transfer Agent Fees
Each class of shares, except for Class R6, pays transfer agent fees to Investor Services for its performance of shareholder servicing obligations and reimburses Investor Services for out of pocket expenses incurred, including shareholding servicing fees paid to third parties. These fees are allocated daily based upon their relative proportion of such classes’ aggregate net assets. Class R6 pays Investor Services transfer agent fees specific to that class.
For the year ended December 31, 2014, the Fund paid transfer agent fees of $16,104,797, of which $7,628,958 was retained by Investor Services.
f. Waiver and Expense Reimbursements
Investor Services has contractually agreed in advance to waive or limit its fees so that the Class R6 transfer agent fees do not exceed 0.01% until April 30, 2015. There were no Class R6 transfer agent fees waived during the year ended December 31, 2014.
g. Other Affiliated Transactions
At December 31, 2014, one or more of the funds in the Franklin Fund Allocator Series owned 13.06% of the Fund’s outstanding shares.
40 | Annual Report
franklintempleton.com
FRANKLIN MUTUAL SHARES FUND
NOTES TO FINANCIAL STATEMENTS
4. Expense Offset Arrangement
The Fund has entered into an arrangement with its custodian whereby credits realized as a result of uninvested cash balances are used to reduce a portion of the Fund’s custodian expenses. During the year ended December 31, 2014, the custodian fees were reduced as noted in the Statement of Operations.
5. Independent Trustees’ Retirement Plan
On January 1, 1993, the Trust adopted an Independent Trustees’ Retirement Plan (Plan). The Plan is an unfunded defined benefit plan that provides benefit payments to Trustees whose length of service and retirement age meets the eligibility requirements of the Plan. Benefits under the Plan are based on years of service and fees paid to each trustee at the time of retirement. Effective in December 1996, the Plan was closed to new participants.
During the year ended December 31, 2014, the Fund’s projected benefit obligation and benefit payments under the Plan were as follows:
| aProjected benefit obligation at December 31, 2014 | $ | 715,684 | |
| bIncrease in projected benefit obligation | $ | 23,141 | |
| Benefit payments made to retired trustees | $ | (16,041 | ) |
aThe projected benefit obligation is included in trustees’ fees and expenses in the Statement of Assets and Liabilities. bThe increase in projected benefit obligation is included in trustees’ fees and expenses in the Statement of Operations.
6. Income Taxes
For tax purposes, capital losses may be carried over to offset future capital gains.
During the year ended December 31, 2014, the Fund utilized $578,581,524 of capital loss carryforwards.
The tax character of distributions paid during the years ended December 31, 2014 and 2013, was as follows:
| 2014 | 2013 | |||
| Distributions paid from ordinary income | $ | 509,656,777 | $ | 226,867,066 |
At December 31, 2014, the cost of investments, net unrealized appreciation (depreciation), undistributed ordinary income and undistributed long term capital gains for income tax purposes were as follows:
| Cost of investments | $ | 12,166,340,224 | |
| Unrealized appreciation | $ | 5,067,447,902 | |
| Unrealized depreciation | (893,484,481 | ) | |
| Net unrealized appreciation (depreciation) | $ | 4,173,963,421 | |
| Undistributed ordinary income | $ | 23,905,336 | |
| Undistributed long term capital gains | 90,750,515 | ||
| Distributable earnings | $ | 114,655,851 | |
Differences between income and/or capital gains as determined on a book basis and a tax basis are primarily due to differing treatments of foreign currency transactions and bond discounts and premiums.
7. Investment Transactions
Purchases and sales of investments (excluding short term securities and securities sold short) for the year ended December 31, 2014, aggregated $2,956,708,783 and $3,834,240,550, respectively.
franklintempleton.com
Annual Report
| 41
FRANKLIN MUTUAL SHARES FUND
NOTES TO FINANCIAL STATEMENTS
8. Credit Risk and Defaulted Securities
The Fund may purchase the pre-default or defaulted debt of distressed companies. Distressed companies are financially troubled and are about to be or are already involved in financial restructuring or bankruptcy. Risks associated with purchasing these securities include the possibility that the bankruptcy or other restructuring process takes longer than expected, or that distributions in restructuring are less than anticipated, either or both of which may result in unfavorable consequences to the Fund. If it becomes probable that the income on debt securities, including those of distressed companies, will not be collected, the Fund discontinues accruing income and recognizes an adjustment for uncollectible interest.
At December 31, 2014, the aggregate long value of distressed company securities for which interest recognition has been discontinued was $196,033,767, representing 1.19% of the Fund’s net assets. For information as to specific securities, see the accompanying Statement of Investments.
9. Restricted Securities
The Fund invests in securities that are restricted under the Securities Act of 1933 (1933 Act) or which are subject to legal, contractual, or other agreed upon restrictions on resale. Restricted securities are often purchased in private placement transactions, and cannot be sold without prior registration unless the sale is pursuant to an exemption under the 1933 Act. Disposal of these securities may require greater effort and expense, and prompt sale at an acceptable price may be difficult. The Fund may have registration rights for restricted securities. The issuer generally incurs all registration costs.
At December 31, 2014, the Fund held investments in restricted securities, excluding certain securities exempt from registration under the 1933 Act deemed to be liquid, as follows:
| Principal | ||||||
| Amount | Acquisition | |||||
| Shares | Issuer | Dates | Cost | Value | ||
| 19,594 | Broadband Ventures III LLC, secured promissory note, 5.00%, | |||||
| 2/01/12 | 7/01/10 - 11/30/12 | $ | 19,594 | $ | — | |
| 43,105,703 | CB FIM Coinvestors LLC | 1/15/09 - 6/02/09 | — | — | ||
| 53,924,666 | FIM Coinvestor Holdings I, LLC | 11/20/06 - 6/02/09 | — | — | ||
| 7,234,813 | International Automotive Components Group Brazil LLC | 4/13/06 - 12/26/08 | 4,804,678 | 684,268 | ||
| 63,079,866 | International Automotive Components Group North America LLC | 1/12/06 - 3/18/13 | 51,662,536 | 47,762,813 | ||
| 202,380 | Olympus Re Holdings Ltd. | 12/19/01 | 18,906,463 | — | ||
| Total Restricted Securities (Value is 0.30% of Net Assets) | $ | 75,393,271 | $ | 48,447,081 |
10. Other Derivative Information
At December 31, 2014, the Fund’s investments in derivative contracts are reflected on the Statement of Assets and Liabilities as follows:
| Asset Derivatives | Liability Derivatives | ||||||
| Derivative Contracts | |||||||
| Not Accounted for as | Statement of Assets and | Statement of Assets and | |||||
| Hedging Instruments | Liabilities Location | Fair Value | Liabilities Location | Fair Value | |||
| Foreign exchange | |||||||
| contracts | Unrealized appreciation on forward | $ | 87,836,161 | a | Unrealized depreciation on | $ | 13,347,636 |
| exchange contracts / Net assets | forward exchange contracts | ||||||
| consist of – net unrealized | |||||||
| appreciation (depreciation) |
aIncludes cumulative appreciation (depreciation) of futures contracts as reported in the Statement of Investments. Only current day’s variation margin is separately reported within the Statement of Assets and Liabilities.
42 | Annual Report
franklintempleton.com
FRANKLIN MUTUAL SHARES FUND
NOTES TO FINANCIAL STATEMENTS
For the year ended December 31, 2014, the effect of derivative contracts on the Fund’s Statement of Operations was as follows:
| Change in | ||||||
| Unrealized | ||||||
| Derivative Contracts | Realized Gain | Appreciation | ||||
| Not Accounted for as | (Loss) for | (Depreciation) | ||||
| Hedging Instruments | Statement of Operations Locations | the Year | for the Year | |||
| Foreign exchange contracts | Net realized gain (loss) from foreign currency transactions | $ | (10,744,827 | ) | $ | 156,757,074 |
and futures contracts / Net change in unrealized appreciation
(depreciation) on translation of other assets and liabilities
denominated in foreign currencies
For the year ended December 31, 2014, the average month end fair value of derivatives represented 0.40% of average month end net assets. The average month end number of open derivative contracts for the year was 222.
See Note 1(d) regarding derivative financial instruments.
11. Holdings of 5% Voting Securities of Portfolio Companies
The 1940 Act defines “affiliated companies” to include investments in portfolio companies in which a fund owns 5% or more of the outstanding voting securities. Investments in “affiliated companies” for the Fund for the year ended December 31, 2014, were as shown below.
| Number of | Number of | |||||||||
| Shares Held | Shares | |||||||||
| at Beginning | Gross | Gross | Held at End | Value at | Investment | Realized | ||||
| Name of Issuer | of Year | Additions | Reductions | of Year | End of Year | Income | Gain (Loss) | |||
| Controlled Affiliatesa | ||||||||||
| CB FIM Coinvestors LLC | 43,105,703 | — | — | 43,105,703 | $ | — | $ | — | $ | — |
| Non-Controlled Affiliates | ||||||||||
| Alexander’s Inc. | 326,675 | — | — | 326,675 | $ | 142,815,777 | $ | 4,246,775 | $ | — |
| FCB Financial Holdings Inc.,A, | 1,647,570 | — | — | 1,647,570 | —b | — | — | |||
| Federal Signal Corp. | 3,360,800 | — | — | 3,360,800 | 51,890,752 | 302,472 | — | |||
| Guaranty Bancorp | 1,146,366 | — | — | 1,146,366 | 16,553,525 | 229,273 | — | |||
| International Automotive | ||||||||||
| Components Group | ||||||||||
| Brazil LLC | 7,234,813 | — | — | 7,234,813 | 684,268 | — | — | |||
| International Automotive | ||||||||||
| Components Group North | ||||||||||
| America LLC | 63,079,866 | — | — | 63,079,866 | 47,762,813 | — | — | |||
| White Mountains Insurance | ||||||||||
| Group Ltd. | 655,346 | — | — | 655,346 | 412,940,068 | 655,346 | — | |||
| Total Non-Controlled Affiliates | $ | 672,647,203 | $ | 5,433,866 | $ | — | ||||
| Total Affiliated Securities (Value is 4.10% of Net Assets) | $ | 672,647,203 | $ | 5,433,866 | $ | — | ||||
| aIssuer in which the Fund owns 25% or more of the outstanding voting securities. | ||||||||||
| bAs of December 31, 2014, no longer an affiliate. | ||||||||||
franklintempleton.com
Annual Report
| 43
FRANKLIN MUTUAL SHARES FUND
NOTES TO FINANCIAL STATEMENTS
12. Credit Facility
The Fund, together with other U.S. registered and foreign investment funds (collectively, Borrowers), managed by Franklin Templeton Investments, are borrowers in a joint syndicated senior unsecured credit facility totaling $1.5 billion (Global Credit Facility) which matured on February 13, 2015. This Global Credit Facility provides a source of funds to the Borrowers for temporary and emergency purposes, including the ability to meet future unanticipated or unusually large redemption requests. Effective February 13, 2015, the Borrowers renewed the Global Credit Facility for a total of $2 billion, which matures on February 12, 2016.
Under the terms of the Global Credit Facility, the Fund shall, in addition to interest charged on any borrowings made by the Fund and other costs incurred by the Fund, pay its share of fees and expenses incurred in connection with the implementation and maintenance of the Global Credit Facility, based upon its relative share of the aggregate net assets of all of the Borrowers, including an annual commitment fee of 0.07% based upon the unused portion of the Global Credit Facility. These fees are reflected in other expenses on the Statement of Operations. During the year ended December 31, 2014, the Fund did not use the Global Credit Facility.
13. Fair Value Measurements
The Fund follows a fair value hierarchy that distinguishes between market data obtained from independent sources (observable inputs) and the Fund’s own market assumptions (unobservable inputs). These inputs are used in determining the value of the Fund’s financial instruments and are summarized in the following fair value hierarchy:
- Level 1 – quoted prices in active markets for identical financial instruments
- Level 2 – other significant observable inputs (including quoted prices for similar financial instruments, interest rates, prepayment speed, credit risk, etc.)
- Level 3 – significant unobservable inputs (including the Fund’s own assumptions in determining the fair value of financial instruments)
The input levels are not necessarily an indication of the risk or liquidity associated with financial instruments at that level.
For movements between the levels within the fair value hierarchy, the Fund has adopted a policy of recognizing the transfers as of the date of the underlying event which caused the movement.
A summary of inputs used as of December 31, 2014, in valuing the Fund’s assets and liabilities carried at fair value, is as follows:
| Level 1 | Level 2 | Level 3 | Total | |||||
| Assets: | ||||||||
| Investments in Securities: | ||||||||
| Equity Investments:a | ||||||||
| Auto Components | $ | — | $ | — | $ | 48,447,081 | $ | 48,447,081 |
| Banks | 1,512,896,418 | 2,432,332 | — | 1,515,328,750 | ||||
| Machinery | 172,689,428 | 42,939,665 | — | 215,629,093 | ||||
| Real Estate Management & Development | 13,650,344 | — | 120,251,997 | 133,902,341 | ||||
| All Other Equity Investmentsb | 12,094,285,279 | — | —c | 12,094,285,279 | ||||
| Corporate Bonds, Notes and Senior Floating Rate | ||||||||
| Interests | — | 731,138,456 | — | 731,138,456 | ||||
| Corporate Notes and Senior Floating Rate Interests in | ||||||||
| Reorganization | — | 196,033,767 | —c | 196,033,767 | ||||
| Companies in Liquidation | 239,922 | 105,240,219 | —c | 105,480,141 | ||||
| Municipal Bonds | — | 42,286,879 | — | 42,286,879 | ||||
| Short Term Investments | 1,230,927,758 | 26,844,100 | — | 1,257,771,858 | ||||
| Total Investments in Securities | $ | 15,024,689,149 | $ | 1,146,915,418 | $ | 168,699,078 | $ | 16,340,303,645 |
44 | Annual Report
franklintempleton.com
| FRANKLIN MUTUAL SHARES FUND | ||||||||
| NOTES TO FINANCIAL STATEMENTS | ||||||||
| Level 1 | Level 2 | Level 3 | Total | |||||
| Assets: (continued) | ||||||||
| Other Financial Instruments | ||||||||
| Futures Contracts | $ | 6,757,442 | $ | — | $ | — | $ | 6,757,442 |
| Forward Exchange Contracts | — | 81,078,719 | — | 81,078,719 | ||||
| Total Other Financial Instruments | $ | 6,757,442 | $ | 81,078,719 | $ | — | $ | 87,836,161 |
| Liabilities: | ||||||||
| Other Financial Instruments | ||||||||
| Securities Sold Short | $ | 104,153,151 | $ | — | $ | — | $ | 104,153,151 |
| Forward Exchange Contracts | — | 13,347,636 | — | 13,347,636 | ||||
| Total Other Financial Instruments | $ | 104,153,151 | $ | 13,347,636 | $ | — | $ | 117,500,787 |
aIncludes common, convertible preferred and preferred stocks as well as other equity investments.
bFor detailed categories, see the accompanying Statement of Investments.
cIncludes securities determined to have no value at December 31, 2014.
A reconciliation of assets in which Level 3 inputs are used in determining fair value is presented when there are significant Level 3
financial instruments at the end of the year. At December 31, 2014, the reconciliations of assets, is as follows:
| Net Change | ||||||||||||||||||||||||
| in Unrealized | ||||||||||||||||||||||||
| Net | Net | Appreciation | ||||||||||||||||||||||
| Balance at | Transfers | Transfers | Realized | Unrealized | Balance | (Depreciation) | ||||||||||||||||||
| Beginning | Into | Out of | Cost Basis | Gain | Appreciation | at End | on Assets Held | |||||||||||||||||
| of Year | Purchases | Sales | Level 3 | Level 3a | Adjustmentsb | (Loss) | (Depreciation) | of Year | at Year End | |||||||||||||||
| Assets: | ||||||||||||||||||||||||
| Investments in Securities: | ||||||||||||||||||||||||
| Equity Investments:c | ||||||||||||||||||||||||
| Auto Components | $ | 37,101,336 | $ | — | $ | — | $ | — | $ | — | $ | — | $ | — | $ | 11,345,745 | $ | 48,447,081 | $ | 11,345,745 | ||||
| Banks | 37,831,649 | — | (11,231,302 | ) | — | (45,564,117 | ) | — | 898,664 | 18,065,106 | — | — | ||||||||||||
| Insurance | —d | — | — | — | (52,708 | ) | — | 52,708 | —d | 52,708 | ||||||||||||||
| Real Estate | ||||||||||||||||||||||||
| Management & | ||||||||||||||||||||||||
| Development | 73,710,322 | — | — | — | — | — | — | 46,541,675 | 120,251,997 | 46,541,675 | ||||||||||||||
| Total | $ | 148,643,307 | $ | — | $ | (11,231,302 | ) | $ | — | $ | (45,564,117 | ) | $ | (52,708 | ) | $ | 898,664 | $ | 76,005,234 | $ | 168,699,078 | $ | 57,940,128 | |
aThe investments were transferred out of Level 3 as a result of the removal of a significant unobservable valuation input.
bMay include accretion, amortization, partnership adjustments, and/or other cost basis adjustments.
cIncludes common stock as well as other equity investments.
dIncludes securities determined to have no value.
franklintempleton.com
Annual Report
| 45
FRANKLIN MUTUAL SHARES FUND
NOTES TO FINANCIAL STATEMENTS
13. Fair Value Measurements (continued)
Significant unobservable valuation inputs developed by the VLOC for material Level 3 financial instruments and impact to fair value as a result of changes in unobservable valuation inputs as of December 31, 2014, are as follows:
| Impact to Fair | |||||
| Fair Value at | Valuation | Value if Input | |||
| Description | End of Year | Technique | Unobservable Inputs | Amount | Increasesa |
Assets:
Investments in Securities:
| Equity Investments: | |||||||
| Auto Components | $ | 47,762,813 | Market | Discount for lack of marketability | 10 | % | Decreaseb |
| comparables | EV / EBITDA multiple | 3.6 | x | Increasec | |||
| Real Estate Management & | |||||||
| Development | 120,251,997 | Market | Discount for lack of marketability | 8 | % | Decreaseb | |
| comparables | |||||||
| All Other Investmentsd | 684,268 | ||||||
| Total | $ | 168,699,078 |
aRepresents the directional change in the fair value of the Level 3 financial instruments that would result from a significant and reasonable increase in the corresponding
input. A significant and reasonable decrease in the input would have the opposite effect. Significant impacts, if any, to fair value and/or net assets have been indicated.
bRepresents a significant impact to fair value but not net assets.
cRepresents a significant impact to fair value and net assets.
dIncludes fair value of immaterial financial instruments developed using various valuation techniques and unobservable inputs. May also include financial instruments with
values derived using prior transaction prices or third party pricing information without adjustment for which such inputs are also unobservable.
Abbreviations List
| EBITDA | Earnings before interest, taxes, depreciation and amortization |
| EV | Enterprise value |
14. New Accounting Pronouncements
In June 2014, the Financial Accounting Standards Board issued Accounting Standards Update (ASU) No. 2014-11, Transfers and Servicing (Topic 860), Repurchase-to-Maturity Transactions, Repurchase Financings, and Disclosures. The ASU changes the accounting for certain repurchase agreements and expands disclosure requirements related to repurchase agreements, securities lending, repurchase-to-maturity and similar transactions. The ASU is effective for interim and annual reporting periods beginning after December 15, 2014. Management has reviewed the requirements and believes the adoption of this ASU will not have a material impact on the financial statements.
46 | Annual Report
franklintempleton.com
FRANKLIN MUTUAL SHARES FUND
NOTES TO FINANCIAL STATEMENTS
15. Subsequent Events
The Fund has evaluated subsequent events through the issuance of the financial statements and determined that no events have occurred that require disclosure other than those already disclosed in the financial statements.
| Abbreviations | |||||
| Counterparty | Currency | Selected Portfolio | |||
| BANT | Bank of America N.A. | CAD | Canadian Dollar | ADR | American Depositary Receipt |
| BBU | Barclays Bank PLC | CHF | Swiss Franc | FHLB | Federal Home Loan Bank |
| BONY | Bank of New York Mellon | EUR | Euro | GO | General Obligation |
| DBFX | Deutsche Bank AG | GBP | British Pound | IDR | International Depositary Receipt |
| FBCO | Credit Suisse Group AG | USD | United States Dollar | PIK | Payment-In-Kind |
| HSBC | HSBC Bank USA, N.A. | ||||
| SCBT | Standard Chartered Bank | ||||
| SSBT | State Street Bank and Trust Co., N.A. | ||||
franklintempleton.com
Annual Report
| 47
FRANKLIN MUTUAL SHARES FUND
Report of Independent Registered Public Accounting Firm
To the Board of Trustees of Franklin Mutual Series Funds and Shareholders of Franklin Mutual Shares Fund:
We have audited the accompanying statement of assets and liabilities, including the statement of investments, of Franklin Mutual Shares Fund (formerly, Mutual Shares Fund) (the “Fund”) (one of the funds constituting Franklin Mutual Series Funds), as of December 31, 2014, and the related statement of operations for the year then ended, the statements of changes in net assets for each of the two years in the period then ended, and the financial highlights for each of the periods indicated therein. These financial statements and financial highlights are the responsibility of the Fund’s management. Our responsibility is to express an opinion on these financial statements and financial highlights based on our audits.
We conducted our audits in accordance with the standards of the Public Company Accounting Oversight Board (United States). Those standards require that we plan and perform the audit to obtain reasonable assurance about whether the financial statements and financial highlights are free of material misstatement. We were not engaged to perform an audit of the Fund’s internal control over financial reporting. Our audits included consideration of internal control over financial reporting as a basis for designing audit procedures that are appropriate in the circumstances, but not for the purpose of expressing an opinion on the effectiveness of the Fund’s internal control over financial reporting. Accordingly, we express no such opinion. An audit also includes examining, on a test basis, evidence supporting the amounts and disclosures in the financial statements and financial highlights, assessing the accounting principles used and significant estimates made by management, and evaluating the overall financial statement presentation. Our procedures included confirmation of securities owned as of December 31, 2014, by correspondence with the custodian and brokers or by other appropriate auditing procedures where replies from the brokers were not received. We believe that our audits provide a reasonable basis for our opinion.
In our opinion, the financial statements and financial highlights referred to above present fairly, in all material respects, the financial position of Franklin Mutual Shares Fund (one of the Funds constituting Franklin Mutual Series Funds) at December 31, 2014, the results of its operations for the year then ended, the changes in its net assets for each of the two years in the period then ended, and the financial highlights for each of the periods indicated therein, in conformity with U.S. generally accepted accounting principles.
Boston, Massachusetts
February 18, 2015
48 | Annual Report
franklintempleton.com
FRANKLIN MUTUAL SHARES FUND
Tax Information (unaudited)
Under Section 854(b)(1)(A) of the Internal Revenue Code (Code), the Fund hereby reports 37.88% of the ordinary income dividends as income qualifying for the dividends received deduction for the fiscal year ended December 31, 2014.
Under Section 854(b)(1)(B) of the Code, the Fund hereby reports the maximum amount allowable but no less than $456,542,838 as qualified dividends for purposes of the maximum rate under Section 1(h)(11) of the Code for the fiscal year ended December 31, 2014. Distributions, including qualified dividend income, paid during calendar year 2014 will be reported to shareholders on Form 1099-DIV by mid-February 2015. Shareholders are advised to check with their tax advisors for information on the treatment of these amounts on their individual income tax returns.
Under Section 871(k)(1)(C) of the Code, the Fund hereby reports the maximum amount allowable but no less than $57,866,451 as interest related dividends for purposes of the tax imposed under Section 871(a)(1)(A) of the Code for the fiscal year ended December 31, 2014.
franklintempleton.com
Annual Report
| 49
FRANKLIN MUTUAL SHARES FUND
Board Members and Officers
The name, year of birth and address of the officers and board members, as well as their affiliations, positions held with the Fund, principal occupations during at least the past five years and number of portfolios overseen in the Franklin Templeton Investments fund complex are shown below. Generally, each board member serves until that person’s successor is elected and qualified.
| Independent Board Members | ||||
| Number of Portfolios in | ||||
| Name, Year of Birth | Length of | Fund Complex Overseen | Other Directorships Held During | |
| and Address | Position | Time Served | by Board Member* | at Least the Past 5 Years |
| Edward I. Altman, Ph.D. (1941) | Trustee | Since 1987 | 10 | None |
| c/o Franklin Mutual Advisers, LLC | ||||
| 101 John F. Kennedy Parkway | ||||
| Short Hills, NJ 07078-2789 | ||||
Principal Occupation During at Least the Past 5 Years:
Max L. Heine Professor of Finance and Director of The Credit and Debt Markets Research Program, Salomon Center, Stern School of Business, New York University; editor and author of numerous financial publications; financial consultant; an adviser to numerous financial and publishing organizations; and formerly, Vice Director, Salomon Center, Stern School of Business, New York University.
| Ann Torre Bates (1958) | Trustee | Since 1995 | 36 | Navient Corporation (loan |
| c/o Franklin Mutual Advisers, LLC | management, servicing and asset | |||
| 101 John F. Kennedy Parkway | recovery) (May 2014), Ares Capital | |||
| Short Hills, NJ 07078-2789 | Corporation (specialty finance | |||
| company) (2010-present), United | ||||
| Natural Foods, Inc. (distributor of | ||||
| natural, organic and specialty foods) | ||||
| (2013-present), Allied Capital | ||||
| Corporation (financial services) | ||||
| (2003-2010) and SLM Corporation | ||||
| (Sallie Mae) (1997-2014). | ||||
Principal Occupation During at Least the Past 5 Years:
Director of various companies; and formerly, Executive Vice President and Chief Financial Officer, NHP Incorporated (manager of multifamily housing) (1995-1997); and Vice President and Treasurer, US Airways, Inc. (until 1995).
| Burton J. Greenwald (1929) Trustee | Since 2002 | 17 | Franklin Templeton Emerging Markets |
| c/o Franklin Mutual Advisers, LLC | Debt Opportunities Fund PLC and | ||
| 101 John F. Kennedy Parkway | Fiduciary International Ireland Limited. | ||
| Short Hills, NJ 07078-2789 |
Principal Occupation During at Least the Past 5 Years:
Managing Director, B.J. Greenwald Associates (management consultants to the financial services industry); and formerly, Chairman, Fiduciary Trust International Funds; Executive Vice President, L.F Rothschild Fund Management, Inc.; President and Director, Merit Mutual Funds; President, Underwriting Division and Director, National Securities & Research Corporation; Governor, Investment Company Institute; and Chairman, ICI Public Information Committee.
| Keith E. Mitchell (1954) | Trustee | Since 2009 | 10 | None |
| c/o Franklin Mutual Advisers, LLC | ||||
| 101 John F. Kennedy Parkway | ||||
| Short Hills, NJ 07078-2789 | ||||
Principal Occupation During at Least the Past 5 Years:
Managing Member, Mitchell, Hartley & Bechtel Advisers, LLC (formerly, Mitchell Advisers, LLC) (advisory firm); director of various boards of asset management firms; and formerly, Managing Director, Putnam Lovell NBF.
50 | Annual Report
franklintempleton.com
FRANKLIN MUTUAL SHARES FUND
| Independent Board Members (continued) | |||||
| Number of Portfolios in | |||||
| Name, Year of Birth | Length of | Fund Complex Overseen | Other Directorships Held During | ||
| and Address | Position | Time Served | by Board Member* | at Least the Past 5 Years | |
| Charles Rubens II (1930) | Trustee | Since 1998 | 17 | None | |
| c/o Franklin Mutual Advisers, LLC | |||||
| 101 John F. Kennedy Parkway | |||||
| Short Hills, NJ 07078-2789 | |||||
| Principal Occupation During at Least the Past 5 Years: | |||||
| Private investor and president of non-profit organizations; and formerly, an executive of Time, Inc.; and Trustee of Colorado College. | |||||
| Jan Hopkins Trachtman (1947) | Trustee | Since 2009 | 10 | None | |
c/o Franklin Mutual Advisers, LLC | |||||
| 101 John F. Kennedy Parkway | |||||
| Short Hills, NJ 07078-2789 | |||||
| Principal Occupation During at Least the Past 5 Years: | |||||
| President and Founder, The Jan Hopkins Group (communications consulting firm); President, Economic Club of New York; serves on Advisory | |||||
| Board of Knight Bagehot Fellowship; and formerly, Anchor/Correspondent, CNN Financial News (until 2003); Managing Director and Head of | |||||
| Client Communications, Citigroup Private Bank (until 2005); Off-Air Reporter, ABC News’ World News Tonight; and Editor, CBS Network News. | |||||
| Robert E. Wade (1946) | Trustee and | Trustee since 1993 | 43 | El Oro Ltd (investments). | |
| c/o Franklin Mutual Advisers, LLC | Chairman of | and Chairman of | |||
| 101 John F. Kennedy Parkway | the Board | the Board since | |||
| Short Hills, NJ 07078-2789 | 2005 | ||||
| Principal Occupation During at Least the Past 5 Years: | |||||
| Attorney at law engaged in private practice (1972-2008) and member of various boards. | |||||
| Interested Board Members and Officers | |||||
| Number of Portfolios in | |||||
| Name, Year of Birth | Length of | Fund Complex Overseen | Other Directorships Held During | ||
| and Address | Position | Time Served | by Board Member* | at Least the Past 5 Years | |
| **Gregory E. Johnson (1961) | Trustee | Since 2007 | 147 | None | |
| One Franklin Parkway | |||||
| San Mateo, CA 94403-1906 | |||||
| Principal Occupation During at Least the Past 5 Years: | |||||
| Chairman of the Board, Member – Office of the Chairman, Director, President and Chief Executive Officer, Franklin Resources, Inc.; officer | |||||
| and/or director or trustee, as the case may be, of some of the other subsidiaries of Franklin Resources, Inc. and of 44 of the investment | |||||
| companies in Franklin Templeton Investments; and Vice Chairman, Investment Company Institute. | |||||
| **Peter A. Langerman (1955) | Trustee, | Trustee since | 10 | American International Group, Inc. | |
| c/o Franklin Mutual Advisers, LLC President, and | 2007, President, | (AIG) Credit Facility Trust | |||
| 101 John F. Kennedy Parkway | Chief Executive and Chief | (2010–2011). | |||
| Short Hills, NJ 07078-2702 | Officer – | Executive Officer – | |||
| Investment | Investment | ||||
| Management | Management since | ||||
| 2005 | |||||
| Principal Occupation During at Least the Past 5 Years: | |||||
| Chairman of the Board, Chief Executive Officer and President, Franklin Mutual Advisers, LLC; officer and/or director, as the case may be, of | |||||
| four of the investment companies in Franklin Templeton Investments. | |||||
franklintempleton.com
Annual Report
| 51
| FRANKLIN MUTUAL SHARES FUND | ||||
| Interested Board Members and Officers (continued) | ||||
| Number of Portfolios in | ||||
| Name, Year of Birth | Length of | Fund Complex Overseen | Other Directorships Held During | |
| and Address | Position | Time Served | by Board Member* | at Least the Past 5 Years |
| Alison E. Baur (1964) | Vice President | Since 2012 | Not Applicable | Not Applicable |
| One Franklin Parkway | ||||
| San Mateo, CA 94403-1906 | ||||
Principal Occupation During at Least the Past 5 Years:
Deputy General Counsel, Franklin Templeton Investments; and officer of some of the other subsidiaries of Franklin Resources, Inc. and of 46 of the investment companies in Franklin Templeton Investments.
| Philippe Brugere-Trelat (1949) | Vice President | Since 2005 | Not Applicable | Not Applicable |
| 101 John F. Kennedy Parkway | ||||
| Short Hills NJ 07078-2789 |
Principal Occupation During at Least the Past 5 Years:
Executive Vice President, Franklin Mutual Advisers, LLC; officer of three of the investment companies in Franklin Templeton Investments; and formerly, Portfolio Manager of Eurovest SA (French registered Investment Company, Sicav).
| Laura F. Fergerson (1962) | Chief | Since 2009 | Not Applicable | Not Applicable |
| One Franklin Parkway | Executive | |||
| San Mateo, CA 94403-1906 | Officer – | |||
| Finance and | ||||
| Administration |
Principal Occupation During at Least the Past 5 Years:
Senior Vice President, Franklin Templeton Services, LLC; and officer of 46 of the investment companies in Franklin Templeton Investments
| Aliya S. Gordon (1973) | Vice President | Since 2009 | Not Applicable | Not Applicable |
| One Franklin Parkway | ||||
| San Mateo, CA 94403-1906 |
Principal Occupation During at Least the Past 5 Years:
Senior Associate General Counsel, Franklin Templeton Investments; officer of 46 of the investment companies in Franklin Templeton Investments; and formerly, Litigation Associate, Steefel, Levitt & Weiss, LLP (2000-2004).
| Steven J. Gray (1955) | Secretary and | Secretary since | Not Applicable | Not Applicable |
| One Franklin Parkway | Vice President | 2005 and Vice | ||
| San Mateo, CA 94403-1906 | President since | |||
| 2009 |
Principal Occupation During at Least the Past 5 Years:
Senior Associate General Counsel, Franklin Templeton Investments; Vice President, Franklin Templeton Distributors, Inc. and Franklin Alternative Strategies Advisers, LLC; and officer of 46 of the investment companies in Franklin Templeton Investments.
| Selena L. Holmes (1965) | Vice President | Since 2012 | Not Applicable | Not Applicable |
| 100 Fountain Parkway | – AML | |||
| St. Petersburg, FL 33716-1205 | Compliance |
Principal Occupation During at Least the Past 5 Years:
Director, Global Compliance Monitoring; Chief Compliance Officer, Franklin Alternative Strategies Advisers, LLC; Vice President, Franklin Templeton Companies, LLC; and officer of 46 of the investment companies in Franklin Templeton Investments.
52 | Annual Report
franklintempleton.com
FRANKLIN MUTUAL SHARES FUND
| Interested Board Members and Officers (continued) | ||||
| Number of Portfolios in | ||||
| Name, Year of Birth | Length of | Fund Complex Overseen | Other Directorships Held During | |
| and Address | Position | Time Served | by Board Member* | at Least the Past 5 Years |
| Robert G. Kubilis (1973) | Treasurer, | Since 2012 | Not Applicable | Not Applicable |
| 300 S.E. 2nd Street | Chief Financial | |||
| Fort Lauderdale, FL 33301-1923 | Officer and | |||
| Chief | ||||
| Accounting | ||||
| Officer | ||||
Principal Occupation During at Least the Past 5 Years:
Assistant Treasurer, Fund Accounting, Franklin Templeton Investments; and officer of four of the investment companies in Franklin Templeton Investments.
| Kimberly H. Novotny (1972) Vice President | Since 2013 | Not Applicable | Not Applicable |
| 300 S.E. 2nd Street | |||
| Fort Lauderdale, FL 33301-1923 |
Principal Occupation During at Least the Past 5 Years:
Associate General Counsel, Franklin Templeton Investments; Vice President and Secretary, Fiduciary Trust International of the South; Vice President, Templeton Investment Counsel, LLC; Assistant Secretary, Franklin Resources, Inc.; and officer of 46 of the investment companies in Franklin Templeton Investments.
| Robert C. Rosselot (1960) | Chief | Since 2013 | Not Applicable | Not Applicable |
| 300 S.E. 2nd Street | Compliance | |||
| Fort Lauderdale, FL 33301-1923 | Officer |
Principal Occupation During at Least the Past 5 Years:
Director, Global Compliance, Franklin Templeton Investments; Vice President, Franklin Templeton Companies, LLC; officer of 46 of the investment companies in Franklin Templeton Investments; and formerly, Senior Associate General Counsel, Franklin Templeton Investments (2007-2013); and Secretary and Vice President, Templeton Group of Funds (2004-2013).
| Karen L. Skidmore (1952) | Vice President | Since 2009 | Not Applicable | Not Applicable |
| One Franklin Parkway | ||||
| San Mateo, CA 94403-1906 |
Principal Occupation During at Least the Past 5 Years:
Senior Associate General Counsel, Franklin Templeton Investments; and officer of 46 of the investment companies in Franklin Templeton Investments.
| Craig S. Tyle (1960) | Vice President | Since 2005 | Not Applicable | Not Applicable |
| One Franklin Parkway | ||||
| San Mateo, CA 94403-1906 |
Principal Occupation During at Least the Past 5 Years:
General Counsel and Executive Vice President, Franklin Resources, Inc.; and officer of some of the other subsidiaries of Franklin Resources, Inc. and of 46 of the investment companies in Franklin Templeton Investments.
franklintempleton.com
Annual Report
| 53
FRANKLIN MUTUAL SHARES FUND
| Interested Board Members and Officers (continued) | ||||
| Number of Portfolios in | ||||
| Name, Year of Birth | Length of | Fund Complex Overseen | Other Directorships Held During | |
| and Address | Position | Time Served | by Board Member* | at Least the Past 5 Years |
| Lori A. Weber (1964) | Vice President | Since 2011 | Not Applicable | Not Applicable |
| 300 S.E. 2nd Street | ||||
| Fort Lauderdale, FL 33301-1923 | ||||
Principal Occupation During at Least the Past 5 Years:
Senior Associate General Counsel, Franklin Templeton Investments; Assistant Secretary, Franklin Resources, Inc.; Vice President and Secretary, Templeton Investment Counsel, LLC; Vice President, Fiduciary Trust International of the South; and officer of 46 of the investment companies in Franklin Templeton Investments.
*We base the number of portfolios on each separate series of the U.S. registered investment companies within the Franklin Templeton Investments fund complex. These portfolios have a common investment manager or affiliated investment managers.
**Gregory E. Johnson is considered to be an interested person of the Fund under the federal securities laws due to his position as an officer and director of Franklin Resources, Inc., which is the parent company of the Fund’s investment manager and distributor. Peter A. Langerman is considered to be an interested person of the Fund under the federal securities laws due to his position as an officer of Franklin Mutual Advisers, LLC, which is an affiliate of the Fund’s investment manager.
Note 1: Officer information is current as of the date of this report. It is possible that after this date, information about officers may change.
The Fund’s Board has determined that certain of the members of the Audit Committee, including Ann Torre Bates, are audit committee financial experts, and “independent,” under those provisions of the Sarbanes-Oxley Act of 2002, and the rules and form amendments adopted by the Securities and Exchange Commission, relating to audit committee financial experts.
The Statement of Additional Information (SAI) includes additional information about the board members and is available, without charge, upon request.
Shareholders may call (800) DIAL BEN/342-5236 to request the SAI.
54 | Annual Report
franklintempleton.com
FRANKLIN MUTUAL SHARES FUND
Shareholder Information
Proxy Voting Policies and Procedures
The Fund’s investment manager has established Proxy Voting Policies and Procedures (Policies) that the Fund uses to determine how to vote proxies relating to portfolio securities. Shareholders may view the Fund’s complete Policies online at franklintempleton.com. Alternatively, shareholders may request copies of the Policies free of charge by calling the Proxy Group collect at (954) 527-7678 or by sending a written request to: Franklin Templeton Companies, LLC, 300 S.E. 2nd Street, Fort Lauderdale, FL 33301, Attention: Proxy Group. Copies of the Fund’s proxy voting records are also made available online at franklintempleton.com and posted on the U.S. Securities and Exchange Commission’s website at sec.gov and reflect the most recent 12-month period ended June 30.
Quarterly Statement of Investments
The Fund files a complete statement of investments with the U.S. Securities and Exchange Commission for the first and third quarters for each fiscal year on Form N-Q. Shareholders may view the filed Form N-Q by visiting the Commission’s website at sec.gov. The filed form may also be viewed and copied at the Commission’s Public Reference Room in Washington, DC. Information regarding the operations of the Public Reference Room may be obtained by calling (800) SEC-0330.
Householding of Reports and Prospectuses
You will receive the Fund’s financial reports every six months as well as an annual updated summary prospectus (prospectus available upon request). To reduce Fund expenses, we try to identify related shareholders in a household and send only one copy of the financial reports and summary prospectus. This process, called “householding,” will continue indefinitely unless you instruct us otherwise. If you prefer not to have these documents householded, please call us at (800) 632-2301. At any time you may view current prospectuses/summary prospectuses and financial reports on our website. If you choose, you may receive these documents through electronic delivery.
franklintempleton.com
Annual Report
| 55
This page intentionally left blank.

Annual Report and Shareholder Letter
Franklin Mutual Shares Fund
Formerly, Mutual Shares Fund
Investment Manager
Franklin Mutual Advisers, LLC
Distributor
Franklin Templeton Distributors, Inc.
(800) DIAL BEN® / 342-5236
franklintempleton.com
Shareholder Services
(800) 632-2301 - (Class A, C, R & R6)
(800) 448-FUND - (Class Z)
Authorized for distribution only when accompanied or preceded by a summary prospectus and/or prospectus. Investors should carefully consider a fund’s investment goals, risks, charges and expenses before investing. A prospectus contains this and other information; please read it carefully before investing.
To help ensure we provide you with quality service, all calls to and from our service areas are monitored and/or recorded.
| © 2015 Franklin Templeton Investments. All rights reserved. | 474 A 02/15 |
Item 2. Code of Ethics.
(a) The Registrant has adopted a code of ethics that applies to its principal executive officers and principal financial and accounting officer.
| (c) | N/A |
| (d) | N/A |
| (f) | Pursuant to Item 12(a)(1), the Registrant is attaching as an exhibit a copy of its code of ethics that applies to its principal executive officers and principal financial and accounting officer. |
Item 3. Audit Committee Financial Expert.
(a)(1) The registrant has an audit committee financial expert serving on its audit committee.
(2) The audit committee financial expert is Ann Torre Bates, and she is “independent” as defined under the relevant Securities and Exchange Commission Rules and Releases.
Item 4. Principal Accountant Fees and Services.
(a) Audit Fees
The aggregate fees paid to the principal accountant for professional services rendered by the principal accountant for the audit of the registrant’s annual financial statements or for services that are normally provided by the principal accountant in connection with statutory and regulatory filings or engagements were $534,460 for the fiscal year ended December 31, 2014 and $528,870 for the fiscal year ended December 31, 2013.
(b) Audit-Related Fees
There were no fees paid to the principal accountant for assurance and related services rendered by the principal accountant to the registrant that are reasonably related to the performance of the audit of the registrant's financial statements and are not reported under paragraph (a) of Item 4.
There were no fees paid to the principal accountant for assurance and related services rendered by the principal accountant to the registrant's investment adviser and any entity controlling, controlled by or under common control with the investment adviser that provides ongoing services to the registrant that are reasonably related to the performance of the audit of their financial statements.
(c) Tax Fees
The aggregate fees paid to the principal accountant for professional services rendered by the principal accountant to the registrant for tax compliance, tax advice and tax planning were $6,022 the fiscal year ended December 31, 2014 and $3,281 for the fiscal year ended December 31, 2013. The services for which these fees were paid included
identifying passive foreign investment company to manage exposure to tax liabilities.
The aggregate fees paid to the principal accountant for professional services rendered by the principal accountant to the registrant’s investment adviser and any entity controlling, controlled by or under common control with the investment adviser that provides ongoing services to the registrant for tax compliance, tax advice and tax planning were $81,000 for the fiscal year ended December 31, 2014 and $67,000 for the fiscal year ended December 31, 2013. The services for which these fees were paid included technical tax consultation for withholding tax report to foreign governments, application of local country tax laws and tax advice.
(d) All Other Fees
There were no fees paid to the principal accountant for products and services rendered by the principal accountant to the registrant not reported in paragraphs (a)-(c) of Item 4.
There were no fees paid to the principal accountant for products and services rendered by the principal accountant to the registrant’s investment adviser and any entity controlling, controlled by or under common control with the investment adviser that provides ongoing services to the registrant other than services reported in paragraphs (a)-(c) of Item 4.
(e) (1) The registrant’s audit committee is directly responsible for approving the services to be provided by the auditors, including:
(i) pre-approval of all audit and audit related services;
(ii) pre-approval of all non-audit related services to be provided to the Fund by the auditors;
(iii) pre-approval of all non-audit related services to be provided to the registrant by the auditors to the registrant’s investment adviser or to any entity that controls, is controlled by or is under common control with the registrant’s investment adviser and that provides ongoing services to the registrant where the non-audit services relate directly to the operations or financial reporting of the registrant; and
(iv) establishment by the audit committee, if deemed necessary or appropriate, as an alternative to committee pre-approval of services to be provided by the auditors, as required by paragraphs (ii) and (iii) above, of policies and procedures to permit such services to be pre-approved by other means, such as through establishment of guidelines or by action of a designated member or members of the committee; provided the policies and procedures are detailed as to the particular service and the committee is informed of each service and such policies and procedures do not include delegation of audit committee responsibilities, as contemplated under the Securities Exchange Act of 1934, to management; subject, in the case of (ii) through (iv), to any waivers, exceptions or exemptions that may be available under applicable law or rules.
(e) (2) None of the services provided to the registrant described in paragraphs (b)-(d) of Item 4 were approved by the audit committee pursuant to paragraph (c)(7)(i)(C) of Rule 2-01 of regulation S-X.
(f) No disclosures are required by this Item 4(f).
(g) The aggregate non-audit fees paid to the principal accountant for services rendered by the principal accountant to the registrant and the registrant’s investment adviser and any entity controlling, controlled by or under common control with the investment adviser that provides ongoing services to the registrant were $87,022 for the fiscal year ended December 31, 2014 and $70,281 for the fiscal year ended December 31, 2013.
(h) The registrant’s audit committee of the board has considered whether the provision of non-audit services that were rendered to the registrant’s investment adviser (not including any sub-adviser whose role is primarily portfolio management and is subcontracted with or overseen by another investment adviser), and any entity controlling, controlled by, or under common control with the investment adviser that provides ongoing services to the registrant that were not pre-approved pursuant to paragraph (c)(7)(ii) of Rule 2-01 of Regulation S-X is compatible with maintaining the principal accountant’s independence.
Item 5. Audit Committee of Listed Registrants. N/A
Item 6. Schedule of Investments. N/A
Item 7. Disclosure of Proxy Voting Policies and Procedures for Closed-End Management Investment Companies. N/A
Item 8. Portfolio Managers of Closed-End Management Investment Companies. N/A
Item 9. Purchases of Equity Securities by Closed-End Management Investment Company and Affiliated Purchasers. N/A
Item 10. Submission of Matters to a Vote of Security Holders.
There have been no changes to the procedures by which shareholders may recommend nominees to the Registrant's board of trustees that would require disclosure herein.
Item 11. Controls and Procedures.
(a) Evaluation of Disclosure Controls and Procedures. The Registrant maintains disclosure controls and procedures that are designed to ensure that information required to be disclosed in the Registrant’s filings under the Securities Exchange Act of 1934 and the Investment
Company Act of 1940 is recorded, processed, summarized and reported within the periods specified in the rules and forms of the Securities and Exchange Commission. Such information is accumulated and communicated to the Registrant’s management, including its principal executive officer and principal financial officer, as appropriate, to allow timely decisions regarding required disclosure. The Registrant’s management, including the principal executive officer and the principal financial officer, recognizes that any set of controls and procedures, no matter how well designed and operated, can provide only reasonable assurance of achieving the desired control objectives.
Within 90 days prior to the filing date of this Shareholder Report on Form N-CSR, the Registrant had carried out an evaluation, under the supervision and with the participation of the Registrant’s management, including the Registrant’s principal executive officer and the Registrant’s principal financial officer, of the effectiveness of the design and operation of the Registrant’s disclosure controls and procedures. Based on such evaluation, the Registrant’s principal executive officer and principal financial officer concluded that the Registrant’s disclosure controls and procedures are effective.
(b) Changes in Internal Controls.
There have been no changes in the
Registrant’s internal controls or in other factors that could materially affect the internal controls over financial reporting subsequent to the date of their evaluation in connection with the preparation of this Shareholder Report on Form N-CSR.
Item 12. Exhibits.
(a)(1) Code of Ethics
(a)(2) Certifications pursuant to Section 302 of the Sarbanes-Oxley Act of 2002 of Laura F. Fergerson, Chief Executive Officer - Finance and Administration, and Robert G. Kubilis, Chief Financial Officer and Chief Accounting Officer (b) Certifications pursuant to Section 906 of the Sarbanes-Oxley Act of 2002 of Laura F. Fergerson, Chief Executive Officer - Finance and Administration, and Robert G. Kubilis, Chief Financial Officer and Chief Accounting Officer
SIGNATURES
Pursuant to the requirements of the Securities Exchange Act of 1934 and the Investment Company Act of 1940, the registrant has duly caused this report to be signed on its behalf by the undersigned, thereunto duly authorized.
FRANKLIN MUTUAL SERIES FUNDS
By /s/LAURA F. FERGERSON
Laura F. Fergerson
Chief Executive Officer –
Finance and Administration
Date February 26, 2015
Pursuant to the requirements of the Securities Exchange Act of 1934 and the Investment Company Act of 1940, this report has been signed below by the following persons on behalf of the registrant and in the capacities and on the dates indicated.
By /s/LAURA F. FERGERSON
Laura F. Fergerson
Chief Executive Officer –
Finance and Administration
Date February 26, 2015
By /s/ROBERT G. KUBILIS
Robert G. Kubilis
Chief Financial Officer and
Chief Accounting Officer
Date: February 26, 2015