UNITED STATES
SECURITIES AND EXCHANGE COMMISSION
Washington, DC 20549
FORM N-CSR
CERTIFIED SHAREHOLDER REPORT OF REGISTERED MANAGEMENT INVESTMENT COMPANIES
Investment Company Act file number 811-05387
Franklin Mutual Series Funds
(Exact name of registrant as specified in charter)
101 John F. Kennedy Parkway, Short Hills, NJ 07078-2705
(Address of principal executive offices) (Zip code)
Craig S. Tyle, One Franklin Parkway, San Mateo, CA 94403-1906
(Name and address of agent for service)
Registrant's telephone number, including area code: (210) 912-2100
Date of fiscal year end: _12/31
Date of reporting period: 12/31/15_
Item 1. Reports to Stockholders.
| Contents | |
| Annual Report | |
| Franklin Mutual Beacon Fund | 3 |
| Performance Summary | 8 |
| Your Fund’s Expenses | 13 |
| Financial Highlights and Statement of Investments | 15 |
| Financial Statements | 26 |
| Notes to Financial Statements | 30 |
| Report of Independent Registered | |
| Public Accounting Firm | 42 |
| Tax Information | 43 |
| Board Members and Officers | 44 |
| Shareholder Information | 49 |
Visit franklintempleton.com for fund updates, to access your account, or to find helpful financial planning tools.
2 Annual Report
franklintempleton.com
Annual Report
Franklin Mutual Beacon Fund
This annual report for Franklin Mutual Beacon Fund covers the fiscal year ended December 31, 2015.
Your Fund’s Goals and Main Investments
The Fund seeks capital appreciation, which may occasionally be short term, with income as a secondary goal, by investing primarily in equity securities of companies that we believe are at prices below their intrinsic value. The Fund may invest up to 35% of its assets in foreign securities.
Performance Overview
The Fund’s Class Z shares had a -4.14% cumulative total return for the 12 months ended December 31, 2015. In comparison, the Fund’s benchmark, the Standard & Poor’s 500 Index (S&P 500®), which is a broad measure of U.S. stock performance, posted a +1.38% total return, and the MSCI World Index, which tracks stock performance in global developed markets, had a -0.32% total return.1 You can find more of the Fund’s performance data in the Performance Summary beginning on page 8.
Performance data represent past performance, which does not guarantee future results. Investment return and principal value will fluctuate, and you may have a gain or loss when you sell your shares. Current performance may differ from figures shown. For most recent month-end performance, go to franklintempleton.com or call (800) 342-5236.
Economic and Market Overview
U.S. economic growth slowed in 2015’s first quarter but strengthened in 2015’s second quarter amid healthy consumer spending. The third and fourth quarters were less robust as exports slowed and state and local governments reduced their spending. At its December meeting, the U.S. Federal Reserve (Fed) increased its target range for the federal funds rate to 0.25%–0.50%, as policymakers cited the labor market’s considerable improvement and were reasonably confident that inflation would move back to the Fed’s 2% medium-term objective. Furthermore, the Fed raised its forecast for 2016 U.S. economic growth and lowered its unemployment projection. Despite periods of volatility, the broad U.S. stock market, as measured by the S&P 500, generated a modest positive total return for 2015.
The global economy expanded moderately during the 12 months under review. As measured by the MSCI World Index, stocks in global developed markets overall were down slightly for the year despite some positive developments. Weighing on global stocks at times were worries about China’s slowing economy and tumbling stock market, declining commodity prices, geopolitical tensions between Russia and Turkey, and ongoing uncertainty over the Fed’s timing for
*Figures are stated as a percentage of total and may not equal 100% or may be negative due to rounding, use of any derivatives, unsettled trades or other factors. The Fund held 34.4% of total net assets in foreign securities.
1. Source: Morningstar.
The indexes are unmanaged and include reinvestment of any income or distributions. One cannot invest directly in an index, and an index is not representative of the
Fund’s portfolio.
The dollar value, number of shares or principle amount, and names of all portfolio holdings are listed in the Fund’s Statement of Investments (SOI).
The SOI begins on page 20.
franklintempleton.com
Annual Report
3
FRANKLIN MUTUAL BEACON FUND
raising interest rates. Toward period-end, equity markets recovered somewhat as the Fed increased its federal funds target range, alleviating some uncertainty about a change in the U.S. monetary policy. During the year, oil prices declined sharply largely due to increased global supply that exceeded demand. Gold and other commodity prices also fell. The U.S. dollar appreciated against most currencies during the period, which reduced returns of many foreign assets in U.S. dollar terms.
In Europe, U.K. economic growth gained momentum from the services sector, but the economy slowed in 2015 compared with 2014. The eurozone grew moderately and generally benefited during the year from lower oil prices, a weaker euro that supported exports, the European Central Bank’s (ECB’s) accommodative policy and expectations of further ECB stimulus. Although the eurozone’s annual inflation rate declined early in the period, it rose slightly during the rest of the period. The ECB maintained its benchmark interest rates although it reduced its bank deposit rate in December, seeking to boost the region’s slowing growth.
Japan’s economy continued to grow in 2015’s first quarter. After a decline in the second quarter of 2015, it expanded in the third quarter as capital expenditures improved. The Bank of Japan took several actions during the reporting period, including maintaining its monetary policy, lowering its economic growth and inflation forecasts, and reorganizing its stimulus program to increase exposure to long-term government bonds and exchange-traded funds.
China’s economy grew at a less robust pace in 2015 than in 2014, as strength in services and consumption was offset by weakness in fixed-asset investment, imports and exports, and manufacturing. The Chinese government’s efforts to promote stable growth supported China’s domestic stock market in 2015’s first half. However, tight liquidity conditions and uncertainties about the central bank’s monetary policy led China’s domestic market to correct from June through August, contributing to a global stock market correction. The government’s intervention to cool domestic stock market speculation and its effective currency devaluation led to a severe slump in emerging market stocks from June through August. Although equities in China and most other emerging markets gained in October after China expanded its monetary and fiscal stimulus, they generally declined for the remainder of the year amid concerns about declining commodity prices and China’s moderating economy.
Investment Strategy
At Franklin Mutual Series, we are committed to our distinctive value approach to investing, which we believe can generate above-average risk-adjusted returns over time for our shareholders. Our major investment strategy is investing in undervalued stocks. When selecting undervalued equities, we are attracted to what we believe are fundamentally strong companies with healthy balance sheets, high-quality assets, substantial free cash flow and shareholder-oriented management teams and whose stocks are trading at discounts to our assessment of the companies’ intrinsic or business value. We also look for asset-rich companies whose shares may be trading at depressed levels due to concerns over short-term earnings disappointments, litigation, management strategy or other perceived negatives. This strict value approach is not only intended to improve the likelihood of upside potential, but it is also intended to reduce the risk of substantial declines. While the vast majority of our undervalued equity investments are made in publicly traded companies globally, we may invest occasionally in privately held companies as well.
We complement this more traditional investment strategy with two others. One is distressed investing, a highly specialized field that has proven quite profitable during certain periods over the years. Distressed investing is complex and can take many forms. The most common distressed investment the Fund undertakes is the purchase of financially troubled or bankrupt companies’ debt at a substantial discount to face value. After the financially distressed company is reorganized, often in bankruptcy court, the old debt is typically replaced with new securities issued by the financially stronger company.
The other piece of our investment strategy is participating in arbitrage situations, another highly specialized field. When companies announce proposed mergers or takeovers, commonly referred to as “deals,” the target company may trade at a discount to the bid it ultimately accepts. One form of arbitrage involves purchasing the target company’s stock when it is trading below the value we believe it would receive in a deal. In keeping with our commitment to a relatively conservative
| Top 10 Sectors/Industries | ||
| Based on Equity Securities as of 12/31/15 | ||
| % of Total | ||
| Net Assets | ||
| Banks | 11.0 | % |
| Pharmaceuticals | 10.9 | % |
| Software | 10.9 | % |
| Media | 9.8 | % |
| Insurance | 5.3 | % |
| Health Care Equipment & Supplies | 5.1 | % |
| Tobacco | 4.5 | % |
| Communications Equipment | 4.3 | % |
| Diversified Telecommunication Services | 3.3 | % |
| Technology Hardware, Storage & Peripherals | 3.2 | % |
4 Annual Report
franklintempleton.com
FRANKLIN MUTUAL BEACON FUND
investment approach, we typically focus our arbitrage efforts on announced deals, and eschew rumored deals or other situations we consider relatively risky.
In addition, it is our practice to hedge the Fund’s currency exposure when we deem it advantageous for our shareholders.
What is meant by “hedge”?
To hedge an investment is to take a position intended to offset potential losses/gains that may be incurred by a companion financial instrument.
Manager’s Discussion
During the 12 months under review, stocks in most global markets declined after a three-year ascent. Globally, several major central banks became more accommodative while fiscal authorities focused on budgetary discipline. Large companies also remained disciplined about operating costs, with margins at historically high levels in many industries and countries. To drive further growth, an increasing number of companies took advantage of low interest rates to finance deals. In this environment, we saw a number of opportunities.
Equity prices are typically forward looking, reflecting investors’ beliefs about how various factors and events will play out in the future. Global equity prices at period-end were down from mid-2015 highs, reflecting increased uncertainty among global investors regarding China and other emerging markets, global commodity prices, U.S. monetary policy divergence and geopolitical events. However, with the support of global quantitative easing, many corporations have been able to build strong balance sheets, focus intensely on improving efficiency, maintain historically high margins and return a significant amount of capital to shareholders.
Merger and acquisition (M&A) activity accelerated in the past 12 months, helping to support valuations. Deal volumes reached historical highs and regulators globally increased their scrutiny of potential negative effects of high concentration. Such an environment — active M&A combined with regulatory uncertainty, greater complexity and market volatility — may provide attractive investment opportunities. We seek to use a mixture of merger arbitrage positions and investments in one or both of the companies to participate in these opportunities. The traditional merger arbitrage positions are constructed solely to benefit from deal completion, while unhedged investments in one or both companies can allow the Fund to benefit from possible value creation once the deal is completed.
Distressed debt remained a difficult market in which we could find compelling new opportunities. Low interest rates have kept credit widely available, and we felt bankruptcies were limited, except in the energy and mining sectors. Increased stress in high yield markets, particularly in energy credit, has expanded the potential opportunity set for us. For non-energy firms, costs of issuing debt are climbing and these debt securities are starting to look attractive to us. Within energy, declining commodity prices increased financial pressures for a growing number of issuers. At year-end, a record level of crude oil inventories and insistence by Saudi Ara-bia that it will not reduce production provide little reason to expect a quick recovery in crude oil prices, implying to us an increased likelihood of new investment opportunities in energy sector debt.
Turning to Fund performance, top contributors included phar-maeutical company Hospira,2 telecommunications provider Koninklijke KPN and multinational software company Microsoft.
Hospira is a global pharmaceutical and medical device company specializing in injectable generic drugs and biosimilars — drugs highly similar to medications licensed by other firms. Shares rose
| Top 10 Equity Holdings | ||
| 12/31/15 | ||
| Company | % of Total | |
| Sector/Industry, Country | Net Assets | |
| Medtronic PLC | 3.6 | % |
| Health Care Equipment & Supplies, U.S. | ||
| Microsoft Corp. | 3.6 | % |
| Software, U.S. | ||
| JPMorgan Chase & Co. | 3.3 | % |
| Banks, U.S. | ||
| Koninklijke KPN NV | 3.3 | % |
| Diversified Telecommunication Services, Netherlands | ||
| British American Tobacco PLC | 3.3 | % |
| Tobacco, U.K. | ||
| Merck & Co. Inc. | 3.3 | % |
| Pharmaceuticals, U.S. | ||
| Wells Fargo & Co. | 3.2 | % |
| Banks, U.S. | ||
| Samsung Electronics Co. Ltd. | 3.2 | % |
| Technology Hardware, Storage & Peripherals, South Korea | ||
| Vodaphone Group PLC | 2.9 | % |
| Wireless Telecommunication Services, U.K. | ||
| Symantec Corp. | 2.8 | % |
| Software, U.S. | ||
2. Not held at period-end.
See www.franklintempletondatasources.com for additional data provider information.
franklintempleton.com
Annual Report 5
FRANKLIN MUTUAL BEACON FUND
sharply in early February following the announcement that Pfizer had reached an agreement to acquire Hospira. We believed the deal, which closed in early September, made sense as Hospira offered Pfizer a strong leadership position in injectables and an attractive high-growth generics market, and the deal positioned Pfizer as a top-tier biosimilars company with a strong pipeline. This acquisition news was in line with our views on industry consolidation and more specifically on Hospira as a highly attractive asset in the generics industry.
KPN is the incumbent telecommunications operator in the Netherlands. In July, management raised 2015 earnings and free cash flow guidance while announcing a special dividend that would redistribute the substantial dividend KPN received from Telefonica Deutschland. KPN holds a stake in Telefonica Deutschland that stems from a 2014 sale of its German E-Plus unit. In April, KPN sold BASE Company, a Belgium-based mobile business, as part of an ongoing process to simplify its structure to focus on its core business and improve operating performance. We also viewed positively KPN’s selection of its new chairman in February 2015 because of his management record in the industry.
Shares of Microsoft rose as earnings improved and the company’s cloud computing services gained momentum. In April and October, Microsoft’s quarterly earnings exceeded consensus estimates despite a challenging environment for personal computer sales. Revenue outperformance and cost controls helped drive the solid results, highlighted by the strong performance of Microsoft’s cloud computing operations, which include Azure and Office365. We believe Microsoft’s cloud computing business has the potential to grow and become increasingly profitable as technology users become more comfortable relying on cloud infrastructure and applications. Supporting this belief were the company’s assertions that the growth in Office365 subscriptions began to fully offset the decline in transactional, one-time license purchases. October’s quarterly results also showed strength in the adoption of Microsoft’s new Windows 10 operating system.
During the period under review, some of the Fund’s investments that negatively affected performance were mining company Tronox, natural resources company Freeport-McMoRan and oil and gas exploration and production company Marathon Oil.
Tronox mines and processes minerals, including titanium ore, zircon and trona ore, and manufactures titanium dioxide pigments. Tronox shares declined early in 2015 as investors were disappointed in the company’s acquisition of what we viewed as the attractive but low-growth alkali chemicals business of FMC. The deal provided Tronox a tangible path to increase monetization of its substantial tax losses but leveraged the company and may have disappointed some investors who anticipated a sale of Tronox. During the year, titanium dioxide prices declined more than we anticipated, due to ongoing oversupply and demand weakness. Furthermore, unfavorable currency rates exacerbated the price slide. We believe investors have been generally overlooking the attractive and relatively stable soda ash business, underestimating potential substantial tax benefits and viewing the company’s balance sheet too negatively, where in our view the debt structure and covenants allow the company to maneuver to the benefit of shareholders, despite relatively high leverage.
Shares of Freeport McMoRan were primarily affected by steeply falling commodity prices in 2015, such as for copper, crude oil and natural gas. Investor uncertainty regarding the company’s negotiations with Indonesia’s government also hurt the stock price. The two sides agreed to a six-month export permit extension in late July, but other important matters remained outstanding at year-end, including every-other-year negotiations of a labor contract and the long-term operating rights and investment plans of the company’s Indonesia unit. The company took steps to strengthen its financial position, including a significant cut in its 2016–2017 capital investment budget, the suspension of its dividend and an agreement with creditors to ease covenants on a $4 billon term loan, announced in December.
Marathon Oil’s stock price closely followed the decline in crude oil. In October, Marathon Oil announced a dividend cut, a move that preserves capital and puts the company’s capital allocation policies more in line with its exploration and production peer group, in our analysis. We believed this move could allow for a smaller reduction in capital spending and a corresponding improvement in its production profile, which we welcomed given the returns available from the company’s resource base. The company also announced a significant reduction in its deepwater exploration program, an action we viewed favorably given the program’s lackluster returns in recent years. We continued to believe that Marathon Oil’s relatively low-cost assets would enable it to weather the current downturn with the potential to generate strong returns if the environment improves.
During the year, the Fund held currency forwards and futures to hedge the currency risk of the portfolio’s non-U.S. dollar investments. The currency forwards had a positive impact on the Fund’s performance, and currency futures had a negligible impact.
What is a currency forward contract?
A currency forward contract, or a currency forward, is an agreement between the Fund and a counterparty to buy or sell a foreign currency at a specific exchange rate on a future date.
6 Annual Report
franklintempleton.com
FRANKLIN MUTUAL BEACON FUND
What is a futures contract?
A futures contract, or a future, is an agreement between the Fund and a counterparty made through a U.S. or foreign futures exchange to buy or sell an underlying instrument or asset at a specific price on a future date.
As fellow shareholders, we found recent relative and absolute performance disappointing, but it is not uncommon for our strategy to lag the equity markets at times. We remain committed to our disciplined, value investment approach as we seek to generate attractive, long-term, risk-adjusted returns for shareholders.
Thank you for your continued participation in Franklin Mutual Beacon Fund. We look forward to continuing to serve your investment needs.
CFA® is a trademark owned by CFA Institute.
The foregoing information reflects our analysis, opinions and portfolio holdings as of December 31, 2015, the end of the reporting period. The way we implement our main investment strategies and the resulting portfolio holdings may change depending on factors such as market and economic conditions. These opinions may not be relied upon as investment advice or an offer for a particular security. The information is not a complete analysis of every aspect of any market, country, industry, security or the Fund. Statements of fact are from sources considered reliable, but the investment manager makes no representation or warranty as to their completeness or accuracy. Although historical performance is no guarantee of future results, these insights may help you understand our investment management philosophy.
Christian Correa has been portfolio manager for Franklin Mutual Beacon Fund since 2007 and a co-portfolio manager since December 2010. He joined Franklin Templeton Investments in 2003 and serves as Director of Research for Franklin Mutual Advisers. Previously, he covered merger arbitrage and special situations at Lehman Brothers Holdings Inc.
Mandana Hormozi has been a co-portfolio manager for Franklin Mutual Beacon Fund since 2010 and was assistant portfolio manager for the Fund since 2009. Before that, she was assistant portfolio manager for Franklin Mutual Global Discovery Fund since 2007. She has been an analyst for Franklin Mutual Advisers since 2003, when she joined Franklin Templeton Investments. Previously, she was a senior vice president in the equity research department at Lazard Freres. Also, she was an economic research analyst at Mitsubishi Bank.
Aman Gupta has been assistant portfolio manager for Franklin Mutual Beacon Fund since December 2013 and has been an analyst for Franklin Mutual Advisers since 2010. Previously, Mr. Gupta was a senior equity analyst and director at Evergreen Investments, where he covered the health care industry with additional responsibilities in the consumer and industrials sectors.
franklintempleton.com
Annual Report 7
FRANKLIN MUTUAL BEACON FUND
Performance Summary as of December 31, 2015
Your dividend income will vary depending on dividends or interest paid by securities in the Fund’s portfolio, adjusted for operating expenses of each class. Capital gain distributions are net profits realized from the sale of portfolio securities. The performance table and graphs do not reflect any taxes that a shareholder would pay on Fund dividends, capital gain distributions, if any, or any realized gains on the sale of Fund shares. Total return reflects reinvestment of the Fund’s dividends and capital gain distributions, if any, and any unrealized gains or losses.
| Net Asset Value | ||||||
| Share Class (Symbol) | 12/31/15 | 12/31/14 | Change | |||
| Z (BEGRX) | $ | 14.30 | $ | 16.59 | -$ | 2.29 |
| A (TEBIX) | $ | 14.20 | $ | 16.47 | -$ | 2.27 |
| C (TEMEX) | $ | 14.10 | $ | 16.36 | -$ | 2.26 |
| R (N/A) | $ | 14.05 | $ | 16.33 | -$ | 2.28 |
| R6 (FMBRX) | $ | 14.30 | $ | 16.58 | -$ | 2.28 |
| Distributions1 (1/1/15–12/31/15) | ||||||
| Dividend | Long-Term | |||||
| Share Class | Income | Capital Gain | Total | |||
| Z | $ | 0.3665 | $ | 1.2151 | $ | 1.5816 |
| A | $ | 0.3211 | $ | 1.2151 | $ | 1.5362 |
| C | $ | 0.2005 | $ | 1.2151 | $ | 1.4156 |
| R | $ | 0.2930 | $ | 1.2151 | $ | 1.5081 |
| R6 | $ | 0.3827 | $ | 1.2151 | $ | 1.5978 |
See page 12 for Performance Summary footnotes.
8 Annual Report
franklintempleton.com
FRANKLIN MUTUAL BEACON FUND
Performance as of 12/31/152
Cumulative total return excludes sales charges. Average annual total return and value of $10,000 investment include maximum sales charges. Class Z/R/R6: no sales charges; Class A: 5.75% maximum initial sales charge; Class C: 1% contingent deferred sales charge in first year only.
| Cumulative | Average Annual | Value of $10,000 | Total Annual | |||||
| Share Class | Total Return3 | Total Return4 | Investment5 | Operating Expenses6 | ||||
| Z | 0.83 | % | ||||||
| 1-Year | -4.14 | % | -4.14 | % | $ | 9,586 | ||
| 5-Year | +50.64 | % | +8.54 | % | $ | 15,064 | ||
| 10-Year | +61.47 | % | +4.91 | % | $ | 16,147 | ||
| A | 1.13 | % | ||||||
| 1-Year | -4.33 | % | -9.80 | % | $ | 9,020 | ||
| 5-Year | +48.40 | % | +6.94 | % | $ | 13,983 | ||
| 10-Year | +56.78 | % | +3.98 | % | $ | 14,778 | ||
| C | 1.83 | % | ||||||
| 1-Year | -5.06 | % | -5.92 | % | $ | 9,408 | ||
| 5-Year | +43.30 | % | +7.46 | % | $ | 14,330 | ||
| 10-Year | +46.24 | % | +3.87 | % | $ | 14,624 | ||
| R | 1.33 | % | ||||||
| 1-Year | -4.61 | % | -4.61 | % | $ | 9,539 | ||
| 5-Year | +46.85 | % | +7.99 | % | $ | 14,685 | ||
| Since Inception (10/30/09) | +72.59 | % | +9.25 | % | $ | 17,259 | ||
| R6 | 0.74 | % | ||||||
| 1-Year | -3.98 | % | -3.98 | % | $ | 9,602 | ||
| Since Inception (5/1/13) | +19.94 | % | +7.05 | % | $ | 11,994 |
Performance data represent past performance, which does not guarantee future results. Investment return and principal value will fluctuate, and you may have a gain or loss when you sell your shares. Current performance may differ from figures shown. For most recent month-end performance, go to franklintempleton.com or call (800) 342-5236.
See page 12 for Performance Summary footnotes.
franklintempleton.com
Annual Report 9
FRANKLIN MUTUAL BEACON FUND
PERFORMANCE SUMMARY
Total Return Index Comparison for a Hypothetical $10,000 Investment2
Total return represents the change in value of an investment over the periods shown. It includes any applicable maximum sales charge, Fund expenses, account fees and reinvested distributions. The unmanaged index includes reinvestment of any income or distributions. It differs from the Fund in composition and does not pay management fees or expenses. One cannot invest directly in an index.
See page 12 for Performance Summary footnotes.
10 Annual Report
franklintempleton.com
See page 12 for Performance Summary footnotes.
franklintempleton.com
Annual Report
11
FRANKLIN MUTUAL BEACON FUND
PERFORMANCE SUMMARY
Total Return Index Comparison for a Hypothetical $10,000 Investment2 (continued)
All investments involve risks, including possible loss of principal. Value securities may not increase in price as anticipated or may decline further in value. The Fund’s investments in smaller company stocks and foreign securities involve special risks. Smaller company stocks have exhibited greater price volatility than larger company stocks, particularly over the short term. Foreign securities risks include currency fluctuations, and economic and political uncertainties. The Fund may also invest in companies engaged in mergers, reorganizations or liquidations, which involve special risks as pending deals may not be completed on time or on favorable terms, as well as lower rated bonds, which entail higher credit risk. The Fund is actively managed but there is no guarantee that the manager’s investment decisions will produce the desired results. The Fund’s prospectus also includes a description of the main investment risks.
Class Z: Class C: Class R: Class R6: | Shares are available to certain eligible investors as described in the prospectus. These shares have higher annual fees and expenses than Class A shares. Shares are available to certain eligible investors as described in the prospectus. These shares have higher annual fees and expenses than Class A shares. Shares are available to certain eligible investors as described in the prospectus. |
1. The distribution amount is the sum of the dividend payments to shareholders for the period shown and includes only estimated tax-basis net investment income and
capital gain.
2. The Fund has a fee waiver associated with any investment in a Franklin Templeton money fund, contractually guaranteed through at least its current fiscal year-end. Fund
investment results reflect the fee waiver, to the extent applicable; without this reduction, the results would have been lower.
3. Cumulative total return represents the change in value of an investment over the periods indicated.
4. Average annual total return represents the average annual change in value of an investment over the periods indicated. Return for less than one year, if any, has not
been annualized.
5. These figures represent the value of a hypothetical $10,000 investment in the Fund over the periods indicated.
6. Figures are as stated in the Fund’s current prospectus. In periods of market volatility, assets may decline significantly, causing total annual Fund operating expenses to
become higher than the figures shown.
7. Source: Morningstar. The S&P 500 is a market capitalization-weighted index of 500 stocks designed to measure total U.S. equity market performance.
See www.franklintempletondatasources.com for additional data provider information.
12 Annual Report
franklintempleton.com
FRANKLIN MUTUAL BEACON FUND
Your Fund’s Expenses
As a Fund shareholder, you can incur two types of costs:
- Transaction costs, including sales charges (loads) on Fund purchases; and
- Ongoing Fund costs, including management fees, distribution and service (12b-1) fees, and other Fund expenses. All mutual funds have ongoing costs, sometimes referred to as operating expenses.
The following table shows ongoing costs of investing in the Fund and can help you understand these costs and compare them with those of other mutual funds. The table assumes a $1,000 investment held for the six months indicated.
Actual Fund Expenses
The first line (Actual) for each share class listed in the table provides actual account values and expenses. The “Ending Account Value” is derived from the Fund’s actual return, which includes the effect of Fund expenses.
You can estimate the expenses you paid during the period by following these steps. Of course, your account value and expenses will differ from those in this illustration:
1. Divide your account value by $1,000.
If an account had an $8,600 value, then $8,600 ÷ $1,000 = 8.6.
2. Multiply the result by the number under the heading “Expenses Paid During Period.”
If Expenses Paid During Period were $7.50, then 8.6 × $7.50 = $64.50.
In this illustration, the estimated expenses paid this period are $64.50.
Hypothetical Example for Comparison with Other Funds
Information in the second line (Hypothetical) for each class in the table can help you compare ongoing costs of investing in the Fund with those of other mutual funds. This information may not be used to estimate the actual ending account balance or expenses you paid during the period. The hypothetical “Ending Account Value” is based on the actual expense ratio for each class and an assumed 5% annual rate of return before expenses, which does not represent the Fund’s actual return. The figure under the heading “Expenses Paid During Period” shows the hypothetical expenses your account would have incurred under this scenario. You can compare this figure with the 5% hypothetical examples that appear in shareholder reports of other funds.
Please note that expenses shown in the table are meant to highlight ongoing costs and do not reflect any transaction costs, such as sales charges. Therefore, the second line for each class is useful in comparing ongoing costs only, and will not help you compare total costs of owning different funds. In addition, if transaction costs were included, your total costs would have been higher. Please refer to the Fund prospectus for additional information on operating expenses.
franklintempleton.com
Annual Report
13
FRANKLIN MUTUAL BEACON FUND
YOUR FUND’S EXPENSES
| Beginning Account | Ending Account | Expenses Paid During | ||||
| Share Class | Value 7/1/15 | Value 12/31/15 | Period* 7/1/15–12/31/15 | |||
| Z | ||||||
| Actual | $ | 1,000 | $ | 929.50 | $ | 4.04 |
| Hypothetical (5% return before expenses) | $ | 1,000 | $ | 1,021.02 | $ | 4.23 |
| A | ||||||
| Actual | $ | 1,000 | $ | 928.50 | $ | 5.30 |
| Hypothetical (5% return before expenses) | $ | 1,000 | $ | 1,019.71 | $ | 5.55 |
| C | ||||||
| Actual | $ | 1,000 | $ | 924.60 | $ | 8.88 |
| Hypothetical (5% return before expenses) | $ | 1,000 | $ | 1,015.98 | $ | 9.30 |
| R | ||||||
| Actual | $ | 1,000 | $ | 926.70 | $ | 6.46 |
| Hypothetical (5% return before expenses) | $ | 1,000 | $ | 1,018.50 | $ | 6.77 |
| R6 | ||||||
| Actual | $ | 1,000 | $ | 929.90 | $ | 3.50 |
| Hypothetical (5% return before expenses) | $ | 1,000 | $ | 1,021.58 | $ | 3.67 |
*Expenses are calculated using the most recent six-month expense ratio, net of expense waivers, annualized for each class (Z: 0.83%; A: 1.09%; C: 1.83%; R: 1.33%; and R6: 0.72%), multiplied by the average account value over the period, multiplied by 184/365 to reflect the one-half year period.
14 Annual Report
franklintempleton.com
FRANKLIN MUTUAL BEACON FUND
| Financial Highlights | |||||||||||||||
| Year Ended December 31, | |||||||||||||||
| 2015 | 2014 | 2013 | 2012 | 2011 | |||||||||||
| Class Z | |||||||||||||||
| Per share operating performance | |||||||||||||||
| (for a share outstanding throughout the year) | |||||||||||||||
| Net asset value, beginning of year | $ | 16.59 | $ | 16.91 | $ | 13.36 | $ | 11.68 | $ | 12.32 | |||||
| Income from investment operationsa: | |||||||||||||||
| Net investment incomeb | 0.29 | 0.54 | c | 0.31 | 0.24 | 0.28 | |||||||||
| Net realized and unrealized gains (losses) | (0.99 | ) | 0.62 | 3.56 | 1.68 | (0.57 | ) | ||||||||
| Total from investment operations | (0.70 | ) | 1.16 | 3.87 | 1.92 | (0.29 | ) | ||||||||
| Less distributions from: | |||||||||||||||
| Net investment income | (0.37 | ) | (0.69 | ) | (0.32 | ) | (0.24 | ) | (0.35 | ) | |||||
| Net realized gains | (1.22 | ) | (0.79 | ) | — | — | — | ||||||||
| Total distributions | (1.59 | ) | (1.48 | ) | (0.32 | ) | (0.24 | ) | (0.35 | ) | |||||
| Net asset value, end of year | $ | 14.30 | $ | 16.59 | $ | 16.91 | $ | 13.36 | $ | 11.68 | |||||
| Total return | (4.14 | )% | 6.82 | % | 29.11 | % | 16.44 | % | (2.15 | )% | |||||
| Ratios to average net assets | |||||||||||||||
| Expensesd | 0.84 | %e,f | 0.83 | %e | 0.80 | %e | 0.84 | % | 0.84 | % | |||||
| Expenses incurred in connection with securities sold short | 0.04 | % | 0.04 | % | —%g | 0.01 | % | —%g | |||||||
| Net investment income | 1.73 | % | 3.14 | %c | 2.02 | % | 1.87 | % | 2.24 | % | |||||
| Supplemental data | |||||||||||||||
| Net assets, end of year (000’s) | $ | 2,420,165 | $ | 2,774,929 | $ | 2,876,322 | $ | 2,450,546 | $ | 2,423,177 | |||||
| Portfolio turnover rate | 35.80 | % | 40.06 | % | 32.95 | % | 43.23 | % | 51.38 | % | |||||
aThe amount shown for a share outstanding throughout the period may not correlate with the Statement of Operations for the period due to the timing of sales and repurchases
of the Fund’s shares in relation to income earned and/or fluctuating fair value of the investments of the Fund.
bBased on average daily shares outstanding.
cNet investment income per share includes approximately $0.24 per share received in the form of a special dividend paid in connection with certain Fund’s holdings. Excluding
this amount, the ratio of net investment income to average net assets would have been 1.74%.
dIncludes dividend and/or interest expense on securities sold short and security borrowing fees, if any. See below for the ratios of such expenses to average net assets for the
periods presented. See Note 1(e).
eBenefit of expense reduction rounds to less than 0.01%.
fBenefit of waiver and payments by affiliates rounds to less than 0.01%.
gRounds to less than 0.01%.
franklintempleton.com The accompanying notes are an integral part of these consolidated financial statements. | Annual Report 15
FRANKLIN MUTUAL BEACON FUND
FINANCIAL H IGHLIGHTS
| Year Ended December 31, | |||||||||||||||
| 2015 | 2014 | 2013 | 2012 | 2011 | |||||||||||
| Class A | |||||||||||||||
| Per share operating performance | |||||||||||||||
| (for a share outstanding throughout the year) | |||||||||||||||
| Net asset value, beginning of year | $ | 16.47 | $ | 16.80 | $ | 13.28 | $ | 11.61 | $ | 12.24 | |||||
| Income from investment operationsa: | |||||||||||||||
| Net investment incomeb | 0.24 | 0.49 | c | 0.26 | 0.20 | 0.24 | |||||||||
| Net realized and unrealized gains (losses) | (0.97 | ) | 0.60 | 3.54 | 1.67 | (0.56 | ) | ||||||||
| Total from investment operations | (0.73 | ) | 1.09 | 3.80 | 1.87 | (0.32 | ) | ||||||||
| Less distributions from: | |||||||||||||||
| Net investment income | (0.32 | ) | (0.63 | ) | (0.28 | ) | (0.20 | ) | (0.31 | ) | |||||
| Net realized gains | (1.22 | ) | (0.79 | ) | — | — | — | ||||||||
| Total distributions | (1.54 | ) | (1.42 | ) | (0.28 | ) | (0.20 | ) | (0.31 | ) | |||||
| Net asset value, end of year | $ | 14.20 | $ | 16.47 | $ | 16.80 | $ | 13.28 | $ | 11.61 | |||||
| Total returnd | (4.33 | )% | 6.48 | % | 28.70 | % | 16.10 | % | (2.50 | )% | |||||
| Ratios to average net assets | |||||||||||||||
| Expensese | 1.12 | %f,g | 1.13 | %f | 1.10 | %f | 1.14 | % | 1.14 | % | |||||
| Expenses incurred in connection with securities sold short | 0.04 | % | 0.04 | % | —%h | 0.01 | % | —%h | |||||||
| Net investment income | 1.45 | % | 2.84 | %c | 1.72 | % | 1.57 | % | 1.94 | % | |||||
| Supplemental data | |||||||||||||||
| Net assets, end of year (000’s) | $ | 1,019,568 | $ | 1,101,706 | $ | 1,148,409 | $ | 983,981 | $ | 1,062,477 | |||||
| Portfolio turnover rate | 35.80 | % | 40.06 | % | 32.95 | % | 43.23 | % | 51.38 | % | |||||
aThe amount shown for a share outstanding throughout the period may not correlate with the Statement of Operations for the period due to the timing of sales and repurchases
of the Fund’s shares in relation to income earned and/or fluctuating fair value of the investments of the Fund.
bBased on average daily shares outstanding.
cNet investment income per share includes approximately $0.24 per share received in the form of a special dividend paid in connection with certain Fund’s holdings. Excluding
this amount, the ratio of net investment income to average net assets would have been 1.44%.
dTotal return does not reflect sales commissions or contingent deferred sales charges, if applicable.
eIncludes dividend and/or interest expense on securities sold short and security borrowing fees, if any. See below for the ratios of such expenses to average net assets for the
periods presented. See Note 1(e).
fBenefit of expense reduction rounds to less than 0.01%.
gBenefit of waiver and payments by affiliates rounds to less than 0.01%.
hRounds to less than 0.01%.
16 Annual Report | The accompanying notes are an integral part of these consolidated financial statements. franklintempleton.com
FRANKLIN MUTUAL BEACON FUND
FINANCIAL HIGHLIGHTS
| Year Ended December 31, | |||||||||||||||
| 2015 | 2014 | 2013 | 2012 | 2011 | |||||||||||
| Class C | |||||||||||||||
| Per share operating performance | |||||||||||||||
| (for a share outstanding throughout the year) | |||||||||||||||
| Net asset value, beginning of year | $ | 16.36 | $ | 16.70 | $ | 13.21 | $ | 11.54 | $ | 12.16 | |||||
| Income from investment operationsa: | |||||||||||||||
| Net investment incomeb | 0.12 | 0.37 | c | 0.15 | 0.11 | 0.15 | |||||||||
| Net realized and unrealized gains (losses) | (0.96 | ) | 0.59 | 3.51 | 1.66 | (0.55 | ) | ||||||||
| Total from investment operations | (0.84 | ) | 0.96 | 3.66 | 1.77 | (0.40 | ) | ||||||||
| Less distributions from: | |||||||||||||||
| Net investment income | (0.20 | ) | (0.51 | ) | (0.17 | ) | (0.10 | ) | (0.22 | ) | |||||
| Net realized gains | (1.22 | ) | (0.79 | ) | — | — | — | ||||||||
| Total distributions | (1.42 | ) | (1.30 | ) | (0.17 | ) | (0.10 | ) | (0.22 | ) | |||||
| Net asset value, end of year | $ | 14.10 | $ | 16.36 | $ | 16.70 | $ | 13.21 | $ | 11.54 | |||||
| Total returnd | (5.06 | )% | 5.78 | % | 27.79 | % | 15.29 | % | (3.15 | )% | |||||
| Ratios to average net assets | |||||||||||||||
| Expensese | 1.84 | %f,g | 1.83 | %f | 1.80 | %f | 1.84 | % | 1.84 | % | |||||
| Expenses incurred in connection with securities sold short | 0.04 | % | 0.04 | % | —%h | 0.01 | % | —%h | |||||||
| Net investment income | 0.73 | % | 2.14 | %c | 1.02 | % | 0.87 | % | 1.24 | % | |||||
| Supplemental data | |||||||||||||||
| Net assets, end of year (000’s) | $ | 285,333 | $ | 320,832 | $ | 336,222 | $ | 295,958 | $ | 315,390 | |||||
| Portfolio turnover rate | 35.80 | % | 40.06 | % | 32.95 | % | 43.23 | % | 51.38 | % | |||||
aThe amount shown for a share outstanding throughout the period may not correlate with the Statement of Operations for the period due to the timing of sales and repurchases
of the Fund’s shares in relation to income earned and/or fluctuating fair value of the investments of the Fund.
bBased on average daily shares outstanding.
cNet investment income per share includes approximately $0.24 per share received in the form of a special dividend paid in connection with certain Fund’s holdings. Excluding
this amount, the ratio of net investment income to average net assets would have been 0.74%.
dTotal return does not reflect sales commissions or contingent deferred sales charges, if applicable.
eIncludes dividend and/or interest expense on securities sold short and security borrowing fees, if any. See below for the ratios of such expenses to average net assets for the
periods presented. See Note 1(e).
fBenefit of expense reduction rounds to less than 0.01%.
gBenefit of waiver and payments by affiliates rounds to less than 0.01%.
hRounds to less than 0.01%.
franklintempleton.com The accompanying notes are an integral part of these consolidated financial statements. | Annual Report 17
FRANKLIN MUTUAL BEACON FUND
FINANCIAL H IGHLIGHTS
| Year Ended December 31, | |||||||||||||||
| 2015 | 2014 | 2013 | 2012 | 2011 | |||||||||||
| Class R | |||||||||||||||
| Per share operating performance | |||||||||||||||
| (for a share outstanding throughout the year) | |||||||||||||||
| Net asset value, beginning of year | $ | 16.33 | $ | 16.68 | $ | 13.19 | $ | 11.52 | $ | 12.16 | |||||
| Income from investment operationsa: | |||||||||||||||
| Net investment incomeb | 0.20 | 0.44 | c | 0.23 | 0.18 | 0.21 | |||||||||
| Net realized and unrealized gains (losses) | (0.97 | ) | 0.61 | 3.50 | 1.66 | (0.55 | ) | ||||||||
| Total from investment operations | (0.77 | ) | 1.05 | 3.73 | 1.84 | (0.34 | ) | ||||||||
| Less distributions from: | |||||||||||||||
| Net investment income | (0.29 | ) | (0.61 | ) | (0.24 | ) | (0.17 | ) | (0.30 | ) | |||||
| Net realized gains | (1.22 | ) | (0.79 | ) | — | — | — | ||||||||
| Total distributions | (1.51 | ) | (1.40 | ) | (0.24 | ) | (0.17 | ) | (0.30 | ) | |||||
| Net asset value, end of year | $ | 14.05 | $ | 16.33 | $ | 16.68 | $ | 13.19 | $ | 11.52 | |||||
| Total return | (4.61 | )% | 6.31 | % | 28.34 | % | 15.95 | % | (2.69 | )% | |||||
| Ratios to average net assets | |||||||||||||||
| Expensesd | 1.34 | %e,f | 1.33 | %e | 1.30 | %e | 1.34 | % | 1.34 | % | |||||
| Expenses incurred in connection with securities sold short | 0.04 | % | 0.04 | % | —%g | 0.01 | % | —%g | |||||||
| Net investment income | 1.23 | % | 2.64 | %c | 1.52 | % | 1.37 | % | 1.74 | % | |||||
| Supplemental data | |||||||||||||||
| Net assets, end of year (000’s) | $ | 2,343 | $ | 2,246 | $ | 1,956 | $ | 1,905 | $ | 2,039 | |||||
| Portfolio turnover rate | 35.80 | % | 40.06 | % | 32.95 | % | 43.23 | % | 51.38 | % | |||||
aThe amount shown for a share outstanding throughout the period may not correlate with the Statement of Operations for the period due to the timing of sales and repurchases
of the Fund’s shares in relation to income earned and/or fluctuating fair value of the investments of the Fund.
bBased on average daily shares outstanding.
cNet investment income per share includes approximately $0.24 per share received in the form of a special dividend paid in connection with certain Fund’s holdings. Excluding
this amount, the ratio of net investment income to average net assets would have been 1.24%.
dIncludes dividend and/or interest expense on securities sold short and security borrowing fees, if any. See below for the ratios of such expenses to average net assets for the
periods presented. See Note 1(e).
eBenefit of expense reduction rounds to less than 0.01%.
fBenefit of waiver and payments by affiliates rounds to less than 0.01%.
gRounds to less than 0.01%.
18 Annual Report | The accompanying notes are an integral part of these consolidated financial statements. franklintempleton.com
FRANKLIN MUTUAL BEACON FUND
FINANCIAL H IGHLIGHTS
| Year Ended December 31, | |||||||||
| 2015 | 2014 | 2013 | a | ||||||
| Class R6 | |||||||||
| Per share operating performance | |||||||||
| (for a share outstanding throughout the year) | |||||||||
| Net asset value, beginning of year | $ | 16.58 | $ | 16.88 | $ | 14.77 | |||
| Income from investment operationsb: | |||||||||
| Net investment incomec | 0.30 | 0.56 | d | 0.24 | |||||
| Net realized and unrealized gains (losses) | (0.98 | ) | 0.63 | 2.21 | |||||
| Total from investment operations | (0.68 | ) | 1.19 | 2.45 | |||||
| Less distributions from: | |||||||||
| Net investment income | (0.38 | ) | (0.70 | ) | (0.34 | ) | |||
| Net realized gains | (1.22 | ) | (0.79 | ) | — | ||||
| Total distributions | (1.60 | ) | (1.49 | ) | (0.34 | ) | |||
| Net asset value, end of year | $ | 14.30 | $ | 16.58 | $ | 16.88 | |||
| Total returne | (3.98 | )% | 6.91 | % | 16.83 | % | |||
| Ratios to average net assetsf | |||||||||
| Expenses before waiver, payments by affiliates and expense reductiong | 0.74 | % | 0.74 | % | 2.10 | % | |||
| Expenses net of waiver, payments by affiliates and expense reductiong,h | 0.74 | %i | 0.74 | % | 0.71 | % | |||
| Expenses incurred in connection with securities sold short | 0.04 | % | 0.04 | % | —%j | ||||
| Net investment income | 1.83 | % | 3.23 | %d | 2.11 | % | |||
| Supplemental data | |||||||||
| Net assets, end of year (000’s) | $ | 48,844 | $ | 50,868 | $ | 6 | |||
| Portfolio turnover rate | 35.80 | % | 40.06 | % | 32.95 | % | |||
aFor the period May 1, 2013 (effective date) to December 31, 2013.
bThe amount shown for a share outstanding throughout the period may not correlate with the Statement of Operations for the period due to the timing of sales and repurchases
of the Fund’s shares in relation to income earned and/or fluctuating fair value of the investments of the Fund.
cBased on average daily shares outstanding.
dNet investment income per share includes approximately $0.24 per share received in the form of a special dividend paid in connection with certain Fund’s holdings. Excluding
this amount, the ratio of net investment income to average net assets would have been 1.83%.
eTotal return is not annualized for periods less than one year.
fRatios are annualized for periods less than one year.
gIncludes dividend and/or interest expense on securities sold short and security borrowing fees, if any. See below for the ratios of such expenses to average net assets for the
periods presented. See Note 1(e).
hBenefit of expense reduction rounds to less than 0.01%.
iBenefit of waiver and payments by affiliates rounds to less than 0.01%.
jRounds to less than 0.01%.
franklintempleton.com The accompanying notes are an integral part of these consolidated financial statements. | Annual Report 19
| FRANKLIN MUTUAL BEACON FUND | ||||
| Statement of Investments, December 31, 2015 | ||||
| Country | Shares | Value | ||
| Common Stocks and Other Equity Interests 89.3% | ||||
| Aerospace & Defense 2.1% | ||||
| aKLX Inc | United States | 2,576,340 | $ | 79,325,510 |
| Auto Components 0.3% | ||||
| a,bInternational Automotive Components Group Brazil LLC | Brazil | 2,846,329 | 29,269 | |
| a,b,cInternational Automotive Components Group North America LLC | United States | 22,836,904 | 12,328,845 | |
| 12,358,114 | ||||
| Banks 11.0% | ||||
| Barclays PLC | United Kingdom | 16,380,136 | 52,850,122 | |
| JPMorgan Chase & Co | United States | 1,911,470 | 126,214,364 | |
| Societe Generale SA | France | 1,573,970 | 72,782,989 | |
| Standard Chartered PLC | United Kingdom | 4,970,186 | 41,295,564 | |
| Wells Fargo & Co | United States | 2,226,980 | 121,058,633 | |
| 414,201,672 | ||||
| Beverages 2.0% | ||||
| Molson Coors Brewing Co., B | United States | 243,220 | 22,843,222 | |
| PepsiCo Inc | United States | 528,267 | 52,784,439 | |
| 75,627,661 | ||||
| Chemicals 1.1% | ||||
| The Chemours Co. LLC | United States | 3,571,419 | 19,142,806 | |
| a,d,eDow Corning Corp., Contingent Distribution | United States | 12,598,548 | — | |
| fTronox Ltd., A | United States | 5,968,680 | 23,337,539 | |
| 42,480,345 | ||||
| Communications Equipment 4.3% | ||||
| Cisco Systems Inc | United States | 3,011,612 | 81,780,324 | |
| Nokia Corp., ADR | Finland | 11,395,524 | 79,996,578 | |
| 161,776,902 | ||||
| Construction & Engineering 1.3% | ||||
| Sinopec Engineering Group Co. Ltd | China | 58,345,700 | 49,837,556 | |
| Consumer Finance 2.1% | ||||
| Capital One Financial Corp | United States | 1,094,900 | 79,029,882 | |
| Diversified Telecommunication Services 3.3% | ||||
| a,d,eGlobal Crossing Holdings Ltd., Contingent Distribution | United States | 60,632,757 | — | |
| Koninklijke KPN NV | Netherlands | 33,100,190 | 125,555,143 | |
| 125,555,143 | ||||
| Energy Equipment & Services 2.0% | ||||
| Baker Hughes Inc | United States | 1,624,730 | 74,981,289 | |
| Food & Staples Retailing 2.7% | ||||
| Walgreens Boots Alliance Inc | United States | 1,177,451 | 100,265,840 | |
| Health Care Equipment & Supplies 5.1% | ||||
| Medtronic PLC | United States | 1,762,955 | 135,606,499 | |
| Stryker Corp | United States | 611,166 | 56,801,768 | |
| 192,408,267 | ||||
| Insurance 5.3% | ||||
| The Allstate Corp | United States | 1,257,706 | 78,090,966 | |
| RSA Insurance Group PLC | United Kingdom | 2,471,679 | 15,537,954 | |
| White Mountains Insurance Group Ltd | United States | 146,141 | 106,216,740 | |
| 199,845,660 | ||||
20 Annual Report
franklintempleton.com
FRANKLIN MUTUAL BEACON FUND
STATEMENT O F INVESTMENTS
| Country | Shares | Value | ||
| Common Stocks and Other Equity Interests (continued) | ||||
| IT Services 1.5% | ||||
| Xerox Corp | United States | 5,412,419 | $ | 57,534,014 |
| Machinery 1.8% | ||||
| Caterpillar Inc | United States | 976,280 | 66,347,989 | |
| Media 9.8% | ||||
| Cablevision Systems Corp., A | United States | 341,765 | 10,902,304 | |
| aLiberty Global PLC, C | United Kingdom | 1,435,540 | 58,526,966 | |
| Relx PLC | United Kingdom | 2,648,846 | 46,734,068 | |
| Time Warner Cable Inc | United States | 424,034 | 78,696,470 | |
| Time Warner Inc | United States | 1,351,872 | 87,425,562 | |
| Twenty-First Century Fox Inc., B | United States | 3,167,258 | 86,244,435 | |
| 368,529,805 | ||||
| Metals & Mining 0.9% | ||||
| Freeport-McMoRan Inc., B | United States | 4,967,519 | 33,630,103 | |
| a,b,fPMG LLC | United States | 5,455 | 213,055 | |
| 33,843,158 | ||||
| Oil, Gas & Consumable Fuels 1.6% | ||||
| Marathon Oil Corp | United States | 4,867,611 | 61,283,222 | |
| Pharmaceuticals 10.9% | ||||
| Eli Lilly & Co | United States | 955,382 | 80,500,487 | |
| GlaxoSmithKline PLC | United Kingdom | 2,531,877 | 51,238,437 | |
| Merck & Co. Inc | United States | 2,342,630 | 123,737,717 | |
| Novartis AG, ADR | Switzerland | 1,118,303 | 96,218,790 | |
| Teva Pharmaceutical Industries Ltd., ADR | Israel | 934,567 | 61,344,978 | |
| 413,040,409 | ||||
| Software 10.9% | ||||
| CA Inc | United States | 2,175,056 | 62,119,599 | |
| aCheck Point Software Technologies Ltd | Israel | 613,666 | 49,940,139 | |
| Microsoft Corp | United States | 2,444,092 | 135,598,224 | |
| Open Text Corp | Canada | 1,158,530 | 55,528,343 | |
| Symantec Corp | United States | 5,067,402 | 106,415,442 | |
| 409,601,747 | ||||
| Specialty Retail 0.5% | ||||
| aOffice Depot Inc | United States | 3,481,770 | 19,637,183 | |
| Technology Hardware, Storage & Peripherals 1.4% | ||||
| Samsung Electronics Co. Ltd | South Korea | 49,616 | 53,191,209 | |
| Tobacco 4.5% | ||||
| British American Tobacco PLC | United Kingdom | 2,236,965 | 124,336,446 | |
| Reynolds American Inc | United States | 1,016,111 | 46,893,523 | |
| 171,229,969 | ||||
| Wireless Telecommunication Services 2.9% | ||||
| Vodafone Group PLC | United Kingdom | 33,931,619 | 110,529,851 | |
| Total Common Stocks and Other Equity Interests | ||||
| (Cost $2,935,567,509) | 3,372,462,397 |
franklintempleton.com
Annual Report
21
FRANKLIN MUTUAL BEACON FUND
STATEMENT O F INVESTMENTS
| Country | Shares | Value | |||
| Preferred Stocks 4.1% | |||||
| Automobiles 2.3% | |||||
| Porsche Automobil Holding SE, pfd | Germany | 314,400 | $ | 17,079,265 | |
| Volkswagen AG, pfd | Germany | 478,500 | 69,519,320 | ||
| 86,598,585 | |||||
| Technology Hardware, Storage & Peripherals 1.8% | |||||
| Samsung Electronics Co. Ltd., pfd | South Korea | 72,001 | 66,836,061 | ||
| Total Preferred Stocks (Cost $136,345,028) | 153,434,646 | ||||
| Principal | |||||
| Amount | |||||
| Corporate Notes and Senior Floating Rate Interests 0.8% | |||||
| g,hCengage Learning Acquisitions Inc., Original Term Loans, 7.00%, 3/31/20 | United States | $ | 1,402,571 | 1,364,001 | |
| iHeartCommunications Inc., | |||||
| senior secured note, first lien, 9.00%,12/15/19 | United States | 18,873,000 | 14,036,794 | ||
| g,hTranche D Term Loan, 7.174%, 1/30/19 | United States | 15,813,482 | 11,148,505 | ||
| g,hTranche E Term Loan, 7.924%, 7/30/19 | United States | 5,080,935 | 3,586,292 | ||
| g,hNGPL PipeCo LLC, Term Loan, 6.75%, 9/15/17 | United States | 597,591 | 566,217 | ||
| Total Corporate Notes and Senior Floating Rate Interests | |||||
| (Cost $39,651,740) | 30,701,809 | ||||
| Corporate Bonds, Notes and Senior Floating Rate Interests | |||||
| in Reorganization 1.9% | |||||
| b,iBroadband Ventures III LLC, secured promissory note, 5.00%, 2/01/12 | United States | 10,848 | — | ||
| g,h,iCaesars Entertainment Operating Co. Inc., 1.50%, 3/01/17, | |||||
| Term B-5-B Loans | United States | 7,949,777 | 6,916,306 | ||
| Term B-6-B Loans | United States | 33,533,690 | 29,509,648 | ||
| Term B-7 Loans | United States | 10,720,130 | 8,964,709 | ||
| iSamson Investment Co., senior note, 9.75%, 2/15/20 | United States | 14,349,000 | 32,285 | ||
| g,h,iTexas Competitive Electric Holdings Co. LLC, Term Loans, 4.908%, 10/10/17 | United States | 46,282,735 | 14,217,501 | ||
| i,jTexas Competitive Electric Holdings Co. LLC/Texas Competitive Electric Holdings | |||||
| Finance Inc., senior secured note, first lien, 144A, 4.726%, 10/01/20 | United States | 28,306,000 | 9,482,510 | ||
| iWalter Energy Inc., | |||||
| g,hB Term Loan, 5.80%, 4/02/18 | United States | 9,375,505 | 2,625,141 | ||
| jfirst lien, 144A, 6.33%, 10/15/19 | United States | 5,229,000 | 1,359,540 | ||
| j,ksecond lien, 144A, PIK, 11.50%, 4/01/20 | United States | 4,557,750 | 11,675 | ||
| Total Corporate Bonds, Notes and Senior Floating Rate | |||||
| Interests in Reorganization (Cost $136,708,429) | 73,119,315 | ||||
| Shares | |||||
| Companies in Liquidation 0.3% | |||||
| aAdelphia Recovery Trust | United States | 48,268,724 | 193,075 | ||
| a,dAdelphia Recovery Trust, Arahova Contingent Value Vehicle, Contingent | |||||
| Distribution | United States | 6,161,087 | 12,322 | ||
| a,b,c,fCB FIM Coinvestors LLC | United States | 15,831,950 | — | ||
| a,d,eCentury Communications Corp., Contingent Distribution | United States | 16,986,000 | — | ||
| a,bFIM Coinvestor Holdings I, LLC | United States | 19,805,560 | — | ||
| a,lLehman Brothers Holdings Inc., Bankruptcy Claim | United States | 163,140,446 | 9,176,650 | ||
| a,d,eTribune Media Litigation Trust, Contingent Distribution | United States | 496,810 | — | ||
| Total Companies in Liquidation (Cost $20,374,335) | 9,382,047 | ||||
22 Annual Report
franklintempleton.com
FRANKLIN MUTUAL BEACON FUND
STATEMENT O F INVESTMENTS
| Principal | |||||
| Country | Amount | Value | |||
| Municipal Bonds (Cost $14,874,743) 0.3% | |||||
| Puerto Rico Commonwealth GO, Refunding, Series A, 8.00%, 7/01/35 | United States | $ | 17,038,000 | $ | 12,395,145 |
| Total Investments before Short Term Investments | |||||
| (Cost $3,283,521,784) | 3,651,495,359 | ||||
| Short Term Investments 2.6% | |||||
| U.S. Government and Agency Securities 2.6% | |||||
| FHLB, 1/04/16 | United States | 8,200,000 | 8,200,000 | ||
| m,nU.S. Treasury Bill, 1/07/16 - 6/09/16 | United States | 91,800,000 | 91,768,303 | ||
| Total U.S. Government and Agency Securities | |||||
| (Cost $99,966,143) | 99,968,303 | ||||
| Total Investments (Cost $3,383,487,927) 99.3% | 3,751,463,662 | ||||
| Other Assets, less Liabilities 0.7% | 24,787,861 | ||||
| Net Assets 100.0% | $ | 3,776,251,523 |
aNon-income producing.
bSee Note 9 regarding restricted securities.
cAt December 31, 2015, pursuant to the Fund’s policies and the requirements of applicable securities law, the Fund is restricted from trading these securities at year end.
dContingent distributions represent the right to receive additional distributions, if any, during the reorganization of the underlying company. Shares represent total underlying
principal of debt securities.
eSecurity has been deemed illiquid because it may not be able to be sold within seven days.
fSee Note 11 regarding holdings of 5% voting securities.
gSee Note 1(g) regarding senior floating rate interests.
hThe coupon rate shown represents the rate at period end.
iSee Note 8 regarding credit risk and defaulted securities.
jSecurity was purchased pursuant to Rule 144A under the Securities Act of 1933 and may be sold in transactions exempt from registration only to qualified institutional buyers
or in a public offering registered under the Securities Act of 1933. These securities have been deemed liquid under guidelines approved by the Trust’s Board of Trustees. At
December 31, 2015, the aggregate value of these securities was $10,853,725, representing 0.29% of net assets.
kIncome may be received in additional securities and/or cash.
lBankruptcy claims represent the right to receive distributions, if any, during the liquidation of the underlying pool of assets. Shares represent amount of allowed unsecured
claims.
mThe security is traded on a discount basis with no stated coupon rate.
nA portion or all of the security has been segregated as collateral for open forward contracts. At December 31, 2015, the value of this security and/or cash pledged amounted
to $429,965, representing 0.01% of net assets.
franklintempleton.com
Annual Report
23
FRANKLIN MUTUAL BEACON FUND
STATEMENT O F INVESTMENTS
| At December 31, 2015, the Fund had the following futures contracts outstanding. See Note 1(c). | ||||||||||
| Futures Contracts | ||||||||||
| Number of | Notional Expiration | Unrealized | Unrealized | |||||||
| Description | Type | Contracts | Value | Date | Appreciation | Depreciation | ||||
| Currency Contracts | ||||||||||
| EUR/USD | Short 1,123 | $152,812,225 | 3/14/16 | $ | 76,600 | $ | — | |||
| GBP/USD | Short 1,705 | 157,009,188 | 3/14/16 | 4,072,054 | — | |||||
| Total Futures Contracts | $ | 4,148,654 | $ | — | ||||||
| Net unrealized appreciation (depreciation) | $ | 4,148,654 | ||||||||
| At December 31, 2015, the Fund had the following forward exchange contracts outstanding. See Note 1(c). | ||||||||||
| Forward Exchange Contracts | ||||||||||
| Contract | Settlement | Unrealized | Unrealized | |||||||
| Currency | Counterpartya | Type | Quantity | Amount | Date | Appreciation | Depreciation | |||
| OTC Forward Exchange Contracts | ||||||||||
| Euro | BANT | Buy | 2,466,077 | $ 2,711,984 | 1/06/16 | $ | — | $ | (32,801 | ) |
| Euro | BANT | Sell | 1,002,571 | 1,112,862 | 1/06/16 | 23,654 | — | |||
| Euro | BONY | Buy | 8,969,574 | 9,892,029 | 1/06/16 | — | (147,352 | ) | ||
| Euro | BONY | Sell | 21,064,614 | 23,039,422 | 1/06/16 | 154,516 | — | |||
| Euro | DBFX | Buy | 1,772,035 | 1,955,239 | 1/06/16 | — | (30,074 | ) | ||
| Euro | FBCO | Buy | 1,476,078 | 1,629,171 | 1/06/16 | — | (25,538 | ) | ||
| Euro | FBCO | Sell | 1,253,214 | 1,389,819 | 1/06/16 | 28,309 | — | |||
| Euro | HSBC | Buy | 3,280,145 | 3,601,218 | 1/06/16 | — | (37,621 | ) | ||
| Euro | HSBC | Sell | 1,935,000 | 2,136,898 | 1/06/16 | 34,685 | — | |||
| Euro | SSBT | Buy | 1,180,146 | 1,298,969 | 1/06/16 | — | (16,841 | ) | ||
| Euro | BANT | Buy | 1,983,539 | 2,163,919 | 1/20/16 | — | (8,210 | ) | ||
| Euro | BANT | Sell | 321,537 | 351,716 | 1/20/16 | 2,270 | — | |||
| Euro | BBU | Sell | 321,537 | 351,925 | 1/20/16 | 2,479 | — | |||
| Euro | BONY | Buy | 345,071 | 387,000 | 1/20/16 | — | (11,978 | ) | ||
| Euro | BONY | Sell | 181,407 | 198,572 | 1/20/16 | 1,419 | — | |||
| Euro | DBFX | Buy | 3,107,936 | 3,411,697 | 1/20/16 | — | (33,994 | ) | ||
| Euro | DBFX | Sell | 4,622,421 | 5,100,995 | 1/20/16 | 77,352 | — | |||
| Euro | FBCO | Buy | 1,983,415 | 2,163,306 | 1/20/16 | — | (7,732 | ) | ||
| Euro | FBCO | Sell | 22,840,946 | 25,020,469 | 1/20/16 | 196,948 | — | |||
| Euro | HSBC | Buy | 2,247,808 | 2,454,281 | 1/20/16 | — | (11,365 | ) | ||
| Euro | HSBC | Sell | 23,875,920 | 26,140,121 | 1/20/16 | 191,791 | — | |||
| Euro | SSBT | Buy | 5,101,887 | 5,580,983 | 1/20/16 | — | (36,257 | ) | ||
| Euro | SSBT | Sell | 22,818,675 | 24,996,702 | 1/20/16 | 206,159 | — | |||
| British Pound | BANT | Buy | 442,795 | 669,758 | 1/21/16 | — | (17,064 | ) | ||
| British Pound | BANT | Sell | 27,551,370 | 43,045,921 | 1/21/16 | 2,434,268 | — | |||
| British Pound | BBU | Buy | 3,884,693 | 5,970,773 | 1/21/16 | — | (244,604 | ) | ||
| British Pound | DBFX | Buy | 419,000 | 646,048 | 1/21/16 | — | (28,428 | ) | ||
| British Pound | FBCO | Buy | 5,680,769 | 8,721,572 | 1/21/16 | — | (347,926 | ) | ||
| British Pound | SSBT | Buy | 73,918 | 111,731 | 1/21/16 | — | (2,773 | ) | ||
| Euro | SSBT | Sell | 12,642,864 | 14,368,778 | 1/21/16 | 628,524 | — | |||
| British Pound | SSBT | Sell | 22,738,449 | 35,501,540 | 2/12/16 | 1,984,296 | — | |||
| South Korean Won | BANT | Buy | 2,862,916,457 | 2,468,457 | 2/12/16 | — | (35,466 | ) | ||
| South Korean Won | BANT | Sell | 21,648,475,949 | 18,676,892 | 2/12/16 | 300,586 | (21,207 | ) | ||
| South Korean Won | FBCO | Buy | 1,239,063,331 | 1,047,037 | 2/12/16 | 5,956 | — | |||
| South Korean Won | FBCO | Sell | 19,826,913,292 | 17,119,183 | 2/12/16 | 270,596 | (908 | ) | ||
| South Korean Won | HSBC | Buy | 5,694,535,212 | 4,827,902 | 2/12/16 | 20,317 | (8,835 | ) | ||
| British Pound | BANT | Buy | 9,929,257 | 15,289,414 | 2/19/16 | — | (652,797 | ) | ||
| British Pound | BBU | Buy | 1,446,139 | 2,266,056 | 2/19/16 | — | (134,318 | ) | ||
| British Pound | DBFX | Buy | 1,418,166 | 2,111,692 | 2/19/16 | — | (21,188 | ) | ||
| British Pound | DBFX | Sell | 27,244,897 | 42,447,550 | 2/19/16 | 2,286,123 | — | |||
| British Pound | FBCO | Buy | 7,392,250 | 11,525,718 | 2/19/16 | — | (628,878 | ) | ||
| British Pound | FBCO | Sell | 33,923,701 | 52,758,755 | 2/19/16 | 2,752,172 | — | |||
| British Pound | HSBC | Buy | 11,172,020 | 17,227,183 | 2/19/16 | — | (758,621 | ) | ||
| British Pound | SSBT | Buy | 5,299,470 | 8,135,229 | 2/19/16 | — | (323,335 | ) | ||
24 Annual Report
franklintempleton.com
FRANKLIN MUTUAL BEACON FUND
STATEMENT O F INVESTMENTS
| Forward Exchange Contracts (continued) | |||||||||||
| Contract | Settlement | Unrealized | Unrealized | ||||||||
| Currency | Counterpartya Type | Quantity | Amount | Date | Appreciation | Depreciation | |||||
| OTC Forward Exchange Contracts (continued) | |||||||||||
| South Korean Won | HSBC | Sell | 46,881,747,310 | $ | 40,357,504 | 2/19/16 | $ | 517,737 | $ | (1,724 | ) |
| British Pound | SSBT | Sell | 5,953,488 | 9,101,847 | 2/22/16 | 325,871 | — | ||||
| Euro | BANT | Sell | 1,140,791 | 1,284,005 | 2/22/16 | 43,145 | — | ||||
| Euro | BBU | Sell | 77,775 | 87,781 | 2/22/16 | 3,184 | — | ||||
| Euro | DBFX | Sell | 2,206,996 | 2,485,030 | 2/22/16 | 84,440 | — | ||||
| Euro | FBCO | Sell | 5,242,010 | 5,894,886 | 2/22/16 | 193,054 | — | ||||
| Euro | HSBC | Sell | 3,490,727 | 3,930,090 | 2/22/16 | 133,161 | — | ||||
| Euro | DBFX | Sell | 3,687,171 | 4,223,028 | 4/01/16 | 208,118 | — | ||||
| Euro | HSBC | Sell | 9,400,559 | 10,277,068 | 4/01/16 | 40,928 | — | ||||
| Euro | SSBT | Sell | 2,876,401 | 3,255,305 | 4/01/16 | 126,590 | — | ||||
| Euro | BANT | Sell | 6,037,744 | 6,822,129 | 4/18/16 | 244,051 | — | ||||
| Euro | BONY | Sell | 600,428 | 665,965 | 4/18/16 | 11,803 | — | ||||
| Euro | DBFX | Sell | 776,326 | 860,443 | 4/18/16 | 14,642 | — | ||||
| Euro | FBCO | Sell | 3,315,750 | 3,672,807 | 4/18/16 | 60,322 | — | ||||
| Euro | HSBC | Sell | 7,124,775 | 8,015,298 | 4/18/16 | 252,908 | — | ||||
| Euro | SSBT | Sell | 3,687,171 | 4,222,991 | 4/18/16 | 208,081 | — | ||||
| British Pound | BANT | Sell | 20,795,192 | 32,122,333 | 4/22/16 | 1,463,331 | — | ||||
| British Pound | HSBC | Sell | 15,655,310 | 24,182,757 | 4/22/16 | 1,101,644 | — | ||||
| Euro | SSBT | Sell | 2,817,158 | 3,119,311 | 4/22/16 | 50,037 | — | ||||
| British Pound | SSBT | Buy | 8,410,000 | 12,919,299 | 5/04/16 | — | (520,173 | ) | |||
| Euro | SSBT | Sell | 29,816,546 | 32,064,713 | 5/12/16 | — | (437,234 | ) | |||
| South Korean Won | BANT | Sell | 19,782,979,060 | 17,202,783 | 5/12/16 | 411,623 | — | ||||
| South Korean Won | FBCO | Sell | 20,123,513,190 | 17,448,638 | 5/12/16 | 368,444 | — | ||||
| Euro | BANT | Sell | 13,371,711 | 14,378,480 | 5/18/16 | — | (204,234 | ) | |||
| Euro | DBFX | Sell | 239,767 | 258,477 | 5/18/16 | — | (3,005 | ) | |||
| Euro | FBCO | Sell | 13,291,789 | 14,296,169 | 5/18/16 | — | (199,385 | ) | |||
| South Korean Won | HSBC | Sell | 20,563,724,199 | 17,996,560 | 5/18/16 | 542,729 | — | ||||
| British Pound | FBCO | Sell | 22,291,713 | 34,151,796 | 5/23/16 | 1,281,423 | — | ||||
| Euro | HSBC | Sell | 239,766 | 258,332 | 5/23/16 | — | (3,149 | ) | |||
| British Pound | HSBC | Sell | 19,369,523 | 29,645,442 | 5/23/16 | 1,084,002 | — | ||||
| Total Forward Exchange Contracts | $ | 20,373,688 | $ | (4,995,015 | ) | ||||||
| Net unrealized appreciation (depreciation) | $ | 15,378,673 | |||||||||
aMay be comprised of multiple contracts with the same counterparty, currency and settlement date.
See Abbreviations on page 41.
franklintempleton.com
The accompanying notes are an integral part of these financial statements. | Annual Report 25
| FRANKLIN MUTUAL BEACON FUND | |||
| Financial Statements | |||
| Statement of Assets and Liabilities | |||
| December 31, 2015 | |||
| Assets: | |||
| Investments in securities: | |||
| Cost - Unaffiliated issuers | $ | 3,295,341,705 | |
| Cost - Controlled affiliates (Note 11) | 381,819 | ||
| Cost - Non-controlled affiliates (Note 11) | 87,764,403 | ||
| Total cost of investments | $ | 3,383,487,927 | |
| Value - Unaffiliated issuers | $ | 3,727,913,068 | |
| Value - Controlled affiliates (Note 11) | 213,055 | ||
| Value - Non-controlled affiliates (Note 11) | 23,337,539 | ||
| Total value of investments | 3,751,463,662 | ||
| Cash | 3,137,424 | ||
| Restricted Cash (Note 1d) | 2,290,000 | ||
| Foreign currency, at value (cost $3,453,481) | 3,401,919 | ||
| Receivables: | |||
| Investment securities sold | 6,894,185 | ||
| Capital shares sold | 1,636,048 | ||
| Dividends and interest | 7,869,695 | ||
| Due from brokers | 7,498,545 | ||
| Variation margin | 1,858,488 | ||
| Unrealized appreciation on OTC forward exchange contracts | 20,373,688 | ||
| Other assets | 1,897,472 | ||
| Total assets | 3,808,321,126 | ||
| Liabilities: | |||
| Payables: | |||
| Investment securities purchased | 10,217,355 | ||
| Capital shares redeemed | 7,380,564 | ||
| Management fees | 2,188,951 | ||
| Distribution fees | 932,046 | ||
| Transfer agent fees | 623,985 | ||
| Trustees’ fees and expenses | 223,091 | ||
| Due to brokers | 5,290,000 | ||
| Unrealized depreciation on OTC forward exchange contracts | 4,995,015 | ||
| Accrued expenses and other liabilities | 218,596 | ||
| Total liabilities | 32,069,603 | ||
| Net assets, at value | $ | 3,776,251,523 | |
| Net assets consist of: | |||
| Paid-in capital | $ | 3,383,070,912 | |
| Distributions in excess of net investment income | (3,797,460 | ) | |
| Net unrealized appreciation (depreciation) | 387,283,793 | ||
| Accumulated net realized gain (loss) | 9,694,278 | ||
| Net assets, at value | $ | 3,776,251,523 | |
26 Annual Report | The accompanying notes are an integral part of these consolidated financial statements. franklintempleton.com
FRANKLIN MUTUAL BEACON FUND
FINANCIAL STATEMENTS
| Statement of Assets and Liabilities (continued) | ||
| December 31, 2015 | ||
| Class Z: | ||
| Net assets, at value | $ | 2,420,164,537 |
| Shares outstanding | 169,219,886 | |
| Net asset value and maximum offering price per share | $ | 14.30 |
| Class A: | ||
| Net assets, at value | $ | 1,019,567,585 |
| Shares outstanding | 71,821,616 | |
| Net asset value per sharea | $ | 14.20 |
| Maximum offering price per share (net asset value per share ÷ 94.25%) | $ | 15.07 |
| Class C: | ||
| Net assets, at value | $ | 285,332,835 |
| Shares outstanding | 20,235,366 | |
| Net asset value and maximum offering price per sharea | $ | 14.10 |
| Class R: | ||
| Net assets, at value | $ | 2,342,940 |
| Shares outstanding | 166,701 | |
| Net asset value and maximum offering price per share | $ | 14.05 |
| Class R6: | ||
| Net assets, at value | $ | 48,843,626 |
| Shares outstanding | 3,415,766 | |
| Net asset value and maximum offering price per share | $ | 14.30 |
aRedemption price is equal to net asset value less contingent deferred sales charges, if applicable.
franklintempleton.com The accompanying notes are an integral part of these consolidated financial statements. | Annual Report 27
FRANKLIN MUTUAL BEACON FUND
FINANCIAL STATEMENTS
| Statement of Operations | |||
| for the year ended December 31, 2015 | |||
| Investment income: | |||
| Dividends: | |||
| Unaffiliated issuers | $ | 90,102,939 | |
| Non-controlled affiliates (Note 11) | 3,832,715 | ||
| Interest | 10,539,139 | ||
| Income from securities loaned | 969,856 | ||
| Other income (Note 1h) | 1,857,489 | ||
| Total investment income | 107,302,138 | ||
| Expenses: | |||
| Management fees (Note 3a) | 28,261,517 | ||
| Distribution fees: (Note 3c) | |||
| Class A | 3,074,421 | ||
| Class C | 3,174,986 | ||
| Class R | 12,173 | ||
| Transfer agent fees: (Note 3e) | |||
| Class Z | 2,595,629 | ||
| Class A | 1,050,069 | ||
| Class C | 303,406 | ||
| Class R | 2,327 | ||
| Class R6 | 286 | ||
| Custodian fees (Note 4) | 174,625 | ||
| Reports to shareholders | 207,274 | ||
| Registration and filing fees | 111,580 | ||
| Professional fees | 180,362 | ||
| Trustees’ fees and expenses | 118,759 | ||
| Dividends and/or interest on securities sold short | 1,620,907 | ||
| Other | 124,402 | ||
| Total expenses | 41,012,723 | ||
| Expense reductions (Note 4) | (1,312 | ) | |
| Expenses waived/paid by affiliates (Note 3f) | (4,250 | ) | |
| Net expenses | 41,007,161 | ||
| Net investment income | 66,294,977 | ||
| Realized and unrealized gains (losses): | |||
| Net realized gain (loss) from: | |||
| Investments: | |||
| Unaffiliated issuers | 202,475,244 | ||
| Non-controlled affiliates (Note 11) | (5,570,256 | ) | |
| Written options | 225,175 | ||
| Foreign currency transactions | 71,835,874 | ||
| Futures contracts | 17,524,913 | ||
| Securities sold short | (2,994,857 | ) | |
| Net realized gain (loss) | 283,496,093 | ||
| Net change in unrealized appreciation (depreciation) on: | |||
| Investments | (492,330,783 | ) | |
| Translation of other assets and liabilities denominated in foreign currencies | (29,121,862 | ) | |
| Written options | (195,175 | ) | |
| Futures contracts | 1,327,853 | ||
| Net change in unrealized appreciation (depreciation) | (520,319,967 | ) | |
| Net realized and unrealized gain (loss) | (236,823,874 | ) | |
| Net increase (decrease) in net assets resulting from operations | $ | (170,528,897 | ) |
28 Annual Report | The accompanying notes are an integral part of these consolidated financial statements. franklintempleton.com
FRANKLIN MUTUAL BEACON FUND
FINANCIAL STATEMENTS
| Statements of Changes in Net Assets | ||||||
| Year Ended December 31, | ||||||
| 2015 | 2014 | |||||
| Increase (decrease) in net assets: | ||||||
| Operations: | ||||||
| Net investment income | $ | 66,294,977 | $ | 129,035,674 | ||
| Net realized gain (loss) | 283,496,093 | 342,705,241 | ||||
| Net change in unrealized appreciation (depreciation) | (520,319,967 | ) | (193,622,551 | ) | ||
| Net increase (decrease) in net assets resulting from operations | (170,528,897 | ) | 278,118,364 | |||
| Distributions to shareholders from: | ||||||
| Net investment income: | ||||||
| Class Z | (58,009,414 | ) | (108,365,306 | ) | ||
| Class A | (21,453,939 | ) | (39,939,800 | ) | ||
| Class C | (3,841,292 | ) | (9,494,293 | ) | ||
| Class R | (47,012 | ) | (76,629 | ) | ||
| Class R6 | (1,193,201 | ) | (2,007,139 | ) | ||
| Net realized gains: | ||||||
| Class Z | (192,557,510 | ) | (124,181,438 | ) | ||
| Class A | (81,200,001 | ) | (49,595,284 | ) | ||
| Class C | (23,270,842 | ) | (14,636,661 | ) | ||
| Class R | (194,535 | ) | (101,248 | ) | ||
| Class R6 | (3,774,972 | ) | (2,255,117 | ) | ||
| Total distributions to shareholders | (385,542,718 | ) | (350,652,915 | ) | ||
| Capital share transactions: (Note 2) | ||||||
| Class Z | 767,996 | (53,559,902 | ) | |||
| Class A | 68,017,445 | (28,560,400 | ) | |||
| Class C | 7,516,255 | (9,697,118 | ) | |||
| Class R | 458,707 | 342,556 | ||||
| Class R6 | 4,982,646 | 51,675,095 | ||||
| Total capital share transactions | 81,743,049 | (39,799,769 | ) | |||
| Net increase (decrease) in net assets | (474,328,566 | ) | (112,334,320 | ) | ||
| Net assets: | ||||||
| Beginning of year | 4,250,580,089 | 4,362,914,409 | ||||
| End of year | $ | 3,776,251,523 | $ | 4,250,580,089 | ||
| Undistributed net investment income (distributions in excess of net investment income) included in | ||||||
| net assets: | ||||||
| End of year | $ | (3,797,460 | ) | $ | 8,140,663 | |
franklintempleton.com The accompanying notes are an integral part of these consolidated financial statements. | Annual Report 29
FRANKLIN MUTUAL BEACON FUND
Notes to Financial Statements
1. Organization and Significant Accounting Policies
Franklin Mutual Series Funds (Trust) is registered under the Investment Company Act of 1940 (1940 Act) as an open-end management investment company, consisting of seven separate funds and applies the specialized accounting and reporting guidance in U.S. Generally Accepted Accounting Principles (U.S. GAAP). Franklin Mutual Beacon Fund (Fund) is included in this report. The financial statements of the remaining funds in the Trust are presented separately. The Fund offers five classes of shares: Class Z, Class A, Class C, Class R and Class R6. Each class of shares differs by its initial sales load, contingent deferred sales charges, voting rights on matters affecting a single class, its exchange privilege and fees primarily due to differing arrangements for distribution and transfer agent fees.
The following summarizes the Fund’s significant accounting policies.
a. Financial Instrument Valuation
The Fund’s investments in financial instruments are carried at fair value daily. Fair value is the price that would be received to sell an asset or paid to transfer a liability in an orderly transaction between market participants on the measurement date. The Fund calculates the net asset value per share as of 4 p.m. Eastern time each day the New York Stock Exchange (NYSE) is open for trading. Under compliance policies and procedures approved by the Trust’s Board of Trustees (the Board), the Fund’s administrator has responsibility for oversight of valuation, including leading the cross-functional Valuation and Liquidity Oversight Committee (VLOC). The VLOC provides administration and oversight of the Fund’s valuation policies and procedures, which are approved annually by the Board. Among other things, these procedures allow the Fund to utilize independent pricing services, quotations from securities and financial instrument dealers, and other market sources to determine fair value.
Equity securities and derivative financial instruments (derivatives) listed on an exchange or on the NASDAQ National Market System are valued at the last quoted sale price or the official closing price of the day, respectively. Foreign equity securities are valued as of the close of trading on the foreign stock exchange on which the security is primarily traded or as of 4 p.m. Eastern time, whichever is earlier. The value is then converted into its U.S. dollar equivalent at the foreign exchange rate in effect at 4 p.m. Eastern time on the day that the value of the security is determined. Over-the-counter (OTC) securities are valued within the range of the most recent quoted bid and ask prices. Securities that trade in multiple markets or on multiple exchanges are valued according to the broadest and most representative market. Certain equity securities are valued based upon fundamental characteristics or relationships to similar securities.
Debt securities generally trade in the OTC market rather than on a securities exchange. The Fund’s pricing services use multiple valuation techniques to determine fair value. In instances where sufficient market activity exists, the pricing services may utilize a market-based approach through which quotes from market makers are used to determine fair value. In instances where sufficient market activity may not exist or is limited, the pricing services also utilize proprietary valuation models which may consider market characteristics such as benchmark yield curves, credit spreads, estimated default rates, anticipated market interest rate volatility, coupon rates, anticipated timing of principal repayments, underlying collateral, and other unique security features in order to estimate the relevant cash flows, which are then discounted to calculate the fair value. Securities denominated in a foreign currency are converted into their U.S. dollar equivalent at the foreign exchange rate in effect at 4 p.m. Eastern time on the date that the values of the foreign debt securities are determined.
Certain derivatives trade in the OTC market. The Fund’s pricing services use various techniques including industry standard option pricing models and proprietary discounted cash flow models to determine the fair value of those instruments. The Fund’s net benefit or obligation under the derivative contract, as measured by the fair value of the contract, is included in net assets.
The Fund has procedures to determine the fair value of financial instruments for which market prices are not reliable or readily available. Under these procedures, the VLOC convenes on a regular basis to review such financial instruments and considers a number of factors, including significant unobservable valuation inputs, when arriving at fair value. The VLOC primarily employs a market-based approach which may use related or comparable assets or liabilities, recent transactions, market multiples, book values, and other relevant information for the investment to determine the fair value of the investment. An income-based valuation approach may also be used in which the anticipated future cash flows of the investment are discounted to calculate fair value. Discounts may also be applied due to the
30 Annual Report
franklintempleton.com
FRANKLIN MUTUAL BEACON FUND
NOTES TO FINANCIAL STATEMENTS
nature or duration of any restrictions on the disposition of the investments. Due to the inherent uncertainty of valuations of such investments, the fair values may differ significantly from the values that would have been used had an active market existed. The VLOC employs various methods for calibrating these valuation approaches including a regular review of key inputs and assumptions, transactional back-testing or disposition analysis, and reviews of any related market activity.
Trading in securities on foreign securities stock exchanges and OTC markets may be completed before 4 p.m. Eastern time. In addition, trading in certain foreign markets may not take place on every NYSE business day. Occasionally, events occur between the time at which trading in a foreign security is completed and the close of the NYSE that might call into question the reliability of the value of a portfolio security held by the Fund. As a result, differences may arise between the value of the Fund’s portfolio securities as determined at the foreign market close and the latest indications of value at the close of the NYSE. In order to minimize the potential for these differences, the VLOC monitors price movements following the close of trading in foreign stock markets through a series of country specific market proxies (such as baskets of American Depositary Receipts, futures contracts and exchange traded funds). These price movements are measured against established trigger thresholds for each specific market proxy to assist in determining if an event has occurred that may call into question the reliability of the values of the foreign securities held by the Fund. If such an event occurs, the securities may be valued using fair value procedures, which may include the use of independent pricing services.
When the last day of the reporting period is a non-business day, certain foreign markets may be open on those days that the NYSE is closed, which could result in differences between the value of the Fund’s portfolio securities on the last business day and the last calendar day of the reporting period. Any significant security valuation changes due to an open foreign market are adjusted and reflected by the Fund for financial reporting purposes.
b. Foreign Currency Translation
Portfolio securities and other assets and liabilities denominated in foreign currencies are translated into U.S. dollars based on the exchange rate of such currencies against U.S. dollars on the date of valuation. The Fund may enter into foreign currency exchange contracts to facilitate transactions denominated in a foreign currency. Purchases and sales of securities, income and expense items denominated in foreign currencies are translated into U.S. dollars at the exchange rate in effect on the transaction date. Portfolio securities and assets and liabilities denominated in foreign currencies contain risks that those currencies will decline in value relative to the U.S. dollar. Occasionally, events may impact the availability or reliability of foreign exchange rates used to convert the U.S. dollar equivalent value. If such an event occurs, the foreign exchange rate will be valued at fair value using procedures established and approved by the Board.
The Fund does not separately report the effect of changes in foreign exchange rates from changes in market prices on securities held. Such changes are included in net realized and unrealized gain or loss from investments in the Statement of Operations.
Realized foreign exchange gains or losses arise from sales of foreign currencies, currency gains or losses realized between the trade and settlement dates on securities transactions and the difference between the recorded amounts of dividends, interest, and foreign withholding taxes and the U.S. dollar equivalent of the amounts actually received or paid. Net unrealized foreign exchange gains and losses arise from changes in foreign exchange rates on foreign denominated assets and liabilities other than investments in securities held at the end of the reporting period.
c. Derivative Financial Instruments
The Fund invested in derivatives in order to manage risk or gain exposure to various other investments or markets. Derivatives are financial contracts based on an underlying or notional amount, require no initial investment or an initial net investment that is smaller than would normally be required to have a similar response to changes in market factors, and require or permit net settlement. Derivatives contain various risks including the potential inability of the counterparty to fulfill their obligations under the terms of the contract, the potential for an illiquid secondary market, and/or the potential for market movements which expose the Fund to gains or losses in excess of the amounts shown in the Statement of Assets and Liabilities. Realized gain and loss and unrealized appreciation and depreciation on these contracts for the period are included in the Statement of Operations.
Derivative counterparty credit risk is managed through a formal evaluation of the creditworthiness of all potential counterparties. The Fund attempts to reduce its exposure to counterparty credit
franklintempleton.com
Annual Report
31
FRANKLIN MUTUAL BEACON FUND
NOTES TO FINANCIAL STATEMENTS
1. Organization and Significant Accounting
Policies (continued)
c. Derivative Financial Instruments (continued)
risk on OTC derivatives, whenever possible, by entering into International Swaps and Derivatives Association (ISDA) master agreements with certain counterparties. These agreements contain various provisions, including but not limited to collateral requirements, events of default, or early termination. Termination events applicable to the counterparty include certain deteriorations in the credit quality of the counterparty. Termination events applicable to the Fund include failure of the Fund to maintain certain net asset levels and/or limit the decline in net assets over various periods of time. In the event of default or early termination, the ISDA master agreement gives the non-defaulting party the right to net and close-out all transactions traded, whether or not arising under the ISDA agreement, to one net amount payable by one counterparty to the other. However, absent an event of default or early termination, OTC derivative assets and liabilities are presented gross and not offset in the Statement of Assets and Liabilities. Early termination by the counterparty may result in an immediate payment by the Fund of any net liability owed to that counterparty under the ISDA agreement. At December 31, 2015, the Fund had OTC derivatives in a net liability position of $373,259 and the aggregate value of collateral pledged for such contracts was $319,974.
Collateral requirements differ by type of derivative. Collateral or initial margin requirements are set by the broker or exchange clearing house for exchange traded and centrally cleared derivatives. Initial margin deposited is held at the exchange and can be in the form of cash and/or securities. For OTC derivatives traded under an ISDA master agreement, posting of collateral is required by either the Fund or the applicable coun-terparty if the total net exposure of all OTC derivatives with the applicable counterparty exceeds the minimum transfer amount, which typically ranges from $100,000 to $250,000, and can vary depending on the counterparty and the type of the agreement. Generally, collateral is determined at the close of Fund business each day and any additional collateral required due to changes in derivative values may be delivered by the Fund or the counterparty within a few business days. Collateral pledged and/or received by the Fund for OTC derivatives, if any, is held in segregated accounts with the Fund’s custodian/counterparty broker and can be in the form of cash and/or securities. Unrestricted cash may be invested according to the Fund’s investment objectives. To the extent that the amounts due to the Fund from its counterparties are not subject to collateralization or are not fully collateralized, the Fund bears the risk of loss from counterparty non-performance.
At December 31, 2015, the Fund received $6,507,593 in United Kingdom Treasury Bonds and U.S. Treasury Bonds and Notes as collateral for derivatives.
The Fund entered into exchange traded futures contracts primarily to manage exposure to certain foreign currencies. A futures contract is an agreement between the Fund and a counterparty to buy or sell an asset for a specified price on a future date. Required initial margins are pledged by the Fund, and the daily change in fair value is accounted for as a variation margin payable or receivable in the Statement of Assets and Liabilities.
The Fund entered into OTC forward exchange contracts primarily to manage exposure to certain foreign currencies. A forward exchange contract is an agreement between the Fund and a counterparty to buy or sell a foreign currency at a specific exchange rate on a future date.
The Fund purchased or wrote exchange traded option contracts primarily to manage exposure to equity price risk. An option is a contract entitling the holder to purchase or sell a specific amount of shares or units of an asset or notional amount of a swap (swaption), at a specified price. When an option is purchased or written, an amount equal to the premium paid or received is recorded as an asset or liability, respectively. Upon exercise of an option, the acquisition cost or sales proceeds of the underlying investment is adjusted by any premium received or paid. Upon expiration of an option, any premium received or paid is recorded as a realized gain or loss. Upon closing an option other than through expiration or exercise, the difference between the premium received or paid and the cost to close the position is recorded as a realized gain or loss.
See Notes 7 and 10 regarding investment transactions and other derivative information, respectively.
d. Restricted Cash
At December 31, 2015, the Fund held restricted cash in connection with investments in certain derivative securities. Restricted cash is held in a segregated account with the Fund’s custodian/counterparty broker and is reflected in the Statement of Assets and Liabilities.
32 Annual Report
franklintempleton.com
FRANKLIN MUTUAL BEACON FUND
NOTES TO FINANCIAL STATEMENTS
e. Securities Sold Short
The Fund is engaged in selling securities short, which obligates the Fund to replace a borrowed security with the same security at current fair value. The Fund incurs a loss if the price of the security increases between the date of the short sale and the date on which the Fund replaces the borrowed security. The Fund realizes a gain if the price of the security declines between those dates. Gains are limited to the price at which the Fund sold the security short, while losses are potentially unlimited in size.
The Fund is required to establish a margin account with the broker lending the security sold short. While the short sale is outstanding, the broker retains the proceeds of the short sale to the extent necessary to meet margin requirements until the short position is closed out. A deposit must also be maintained with the Fund’s custodian/counterparty broker consisting of cash and/ or securities having a value equal to a specified percentage of the value of the securities sold short. The Fund is obligated to pay fees for borrowing the securities sold short and is required to pay the counterparty any dividends and/or interest due on securities sold short. Such dividends and/or interest and any security borrowing fees are recorded as an expense to the Fund. At December 31, 2015, the Fund had no securities sold short.
f. Securities Lending
The Fund participates in an agency based securities lending program to earn additional income. The Fund receives cash collateral against the loaned securities in an amount equal to at least 102% of the fair value of the loaned securities. Collateral is maintained over the life of the loan in an amount not less than 100% of the fair value of loaned securities, as determined at the close of Fund business each day; any additional collateral required due to changes in security values is delivered to the Fund on the next business day. The collateral is deposited into a joint cash account with other funds and is used to invest in a money market fund managed by Franklin Advisers, Inc., an affiliate of the Fund, and/or a joint repurchase agreement.
The Fund may receive income from the investment of cash collateral, in addition to lending fees and rebates paid by the borrower. Income from securities loaned is reported separately in the Statement of Operations. The Fund bears the market risk with respect to the collateral investment, securities loaned, and the risk that the agent may default on its obligations to the Fund. If the borrower defaults on its obligation to return the securities loaned, the Fund has the right to repurchase the securities in the open market using the collateral received. The securities lending agent has agreed to indemnify the Fund in the event of default by a third party borrower. At December 31, 2015, the Fund had no securities on loan.
g. Senior Floating Rate Interests
The Fund invests in senior secured corporate loans that pay interest at rates which are periodically reset by reference to a base lending rate plus a spread. These base lending rates are generally the prime rate offered by a designated U.S. bank or the London InterBank Offered Rate (LIBOR). Senior secured corporate loans often require prepayment of principal from excess cash flows or at the discretion of the borrower. As a result, actual maturity may be substantially less than the stated maturity. Senior secured corporate loans in which the Fund invests are generally readily marketable, but may be subject to certain restrictions on resale.
h. Income and Deferred Taxes
It is the Fund’s policy to qualify as a regulated investment company under the Internal Revenue Code. The Fund intends to distribute to shareholders substantially all of its taxable income and net realized gains to relieve it from federal income and excise taxes. As a result, no provision for U.S. federal income taxes is required.
The Fund may be subject to foreign taxation related to income received, capital gains on the sale of securities and certain foreign currency transactions in the foreign jurisdictions in which it invests. Foreign taxes, if any, are recorded based on the tax regulations and rates that exist in the foreign markets in which the Fund invests. When a capital gain tax is determined to apply, the Fund records an estimated deferred tax liability in an amount that would be payable if the securities were disposed of on the valuation date. As a result of several court cases, in certain countries across the European Union, the Fund has filed additional tax reclaims for previously withheld taxes on dividends earned in those countries. These additional filings are subject to various administrative proceedings by the local jurisdictions’ tax authorities within the European Union, as well as a number of related judicial proceedings. During the year ended December 31, 2015, the Fund recognized $1,876,063 from Sweden for previously withheld foreign taxes and interest on such taxes. These amounts are reflected as other income and interest in the Statement of Operations. In regards to filings in other European Union countries, uncertainty exists as to the ultimate resolution of these proceedings, the likelihood of receipt of these reclaims, and the potential timing of payment, and accordingly, no amounts are reflected in the financial statements.
The Fund may recognize an income tax liability related to its uncertain tax positions under U.S. GAAP when the uncertain
franklintempleton.com
Annual Report
33
FRANKLIN MUTUAL BEACON FUND
NOTES TO FINANCIAL STATEMENTS
1. Organization and Significant Accounting
Policies (continued)
h. Income and Deferred Taxes (continued)
tax position has a less than 50% probability that it will be sustained upon examination by the tax authorities based on its technical merits. As of December 31, 2015, the Fund has determined that no tax liability is required in its financial statements related to uncertain tax positions for any open tax years (or expected to be taken on future tax returns). Open tax years are those that remain subject to examination and are based on each tax jurisdiction’s statute of limitation.
i. Security Transactions, Investment Income, Expenses and Distributions
Security transactions are accounted for on trade date. Realized gains and losses on security transactions are determined on a specific identification basis. Interest income and estimated expenses are accrued daily. Amortization of premium and accretion of discount on debt securities are included in interest income. Dividend income and dividends declared on securities sold short are recorded on the ex-dividend date except for certain dividends from foreign securities where the dividend rate is not available. In such cases, the dividend is recorded as soon as the information is received by the Fund. Distributions to shareholders are recorded on the ex-dividend date and are determined according to income tax regulations (tax basis). Distributable earnings determined on a tax basis may differ from earnings recorded in accordance with U.S. GAAP. These differences may be permanent or temporary. Permanent differences are reclassified among capital accounts to reflect their tax character. These reclassifications have no impact on net assets or the results of operations. Temporary differences are not reclassified, as they may reverse in subsequent periods.
Common expenses incurred by the Trust are allocated among the funds based on the ratio of net assets of each fund to the combined net assets of the Trust. Fund specific expenses are charged directly to the fund that incurred the expense.
Realized and unrealized gains and losses and net investment income, not including class specific expenses, are allocated daily to each class of shares based upon the relative proportion of net assets of each class. Differences in per share distributions, by class, are generally due to differences in class specific expenses.
j. Accounting Estimates
The preparation of financial statements in accordance with U.S. GAAP requires management to make estimates and assumptions that affect the reported amounts of assets and liabilities at the date of the financial statements and the amounts of income and expenses during the reporting period. Actual results could differ from those estimates.
k. Guarantees and Indemnifications
Under the Trust’s organizational documents, its officers and trustees are indemnified by the Trust against certain liabilities arising out of the performance of their duties to the Trust. Additionally, in the normal course of business, the Trust, on behalf of the Fund, enters into contracts with service providers that contain general indemnification clauses. The Trust’s maximum exposure under these arrangements is unknown as this would involve future claims that may be made against the Trust that have not yet occurred. Currently, the Trust expects the risk of loss to be remote.
2. Shares of Beneficial Interest
At December 31, 2015, there were an unlimited number of shares authorized (without par value). Transactions in the Fund’s shares were as follows:
| Year Ended December 31, | |||||||||||
| 2015 | 2014 | ||||||||||
| Shares | Amount | Shares | Amount | ||||||||
| Class Z Shares: | |||||||||||
| Shares sold | 6,184,343 | $ | 103,977,966 | 5,229,939 | $ | 91,015,375 | |||||
| Shares issued in reinvestment of distributions | 16,350,016 | 235,028,910 | 12,979,886 | 218,311,381 | |||||||
| Shares redeemed | (20,624,311 | ) | (338,238,880 | ) | (21,017,382 | ) | (362,886,658 | ) | |||
| Net increase (decrease) | 1,910,048 | $ | 767,996 | (2,807,557 | ) | $ | (53,559,902 | ) | |||
34 Annual Report
franklintempleton.com
FRANKLIN MUTUAL BEACON FUND
NOTES TO FINANCIAL STATEMENTS
| Year Ended December 31, | |||||||||||
| 2015 | 2014 | ||||||||||
| Shares | Amount | Shares | Amount | ||||||||
| Class A Shares: | |||||||||||
| Shares sold | 9,371,751 | $ | 155,165,698 | 4,739,908 | $ | 81,387,282 | |||||
| Shares issued in reinvestment of distributions | 7,035,175 | 100,397,421 | 5,201,776 | 86,929,792 | |||||||
| Shares redeemed | (11,467,151 | ) | (187,545,674 | ) | (11,413,516 | ) | (196,877,474 | ) | |||
| Net increase (decrease) | 4,939,775 | $ | 68,017,445 | (1,471,832 | ) | $ | (28,560,400 | ) | |||
| Class C Shares: | |||||||||||
| Shares sold | 1,843,908 | $ | 30,482,924 | 970,010 | $ | 16,571,387 | |||||
| Shares issued in reinvestment of distributions | 1,808,301 | 25,661,223 | 1,364,458 | 22,656,149 | |||||||
| Shares redeemed | (3,024,983 | ) | (48,627,892 | ) | (2,863,231 | ) | (48,924,654 | ) | |||
| Net increase (decrease) | 627,226 | $ | 7,516,255 | (528,763 | ) | $ | (9,697,118 | ) | |||
| Class R Shares: | |||||||||||
| Shares sold | 32,967 | $ | 537,011 | 23,067 | $ | 398,900 | |||||
| Shares issued in reinvestment of distributions | 17,101 | 241,547 | 10,739 | 177,877 | |||||||
| Shares redeemed | (20,923 | ) | (319,851 | ) | (13,549 | ) | (234,221 | ) | |||
| Net increase (decrease) | 29,145 | $ | 458,707 | 20,257 | $ | 342,556 | |||||
| Class R6 Shares: | |||||||||||
| Shares sold | 757,819 | $ | 11,893,414 | 3,331,155 | $ | 56,277,297 | |||||
| Shares issued in reinvestment of distributions | 5,769 | 82,858 | — | — | |||||||
| Shares redeemed | (415,071 | ) | (6,993,626 | ) | (264,245 | ) | (4,602,202 | ) | |||
| Net increase (decrease) | 348,517 | $ | 4,982,646 | 3,066,910 | $ | 51,675,095 | |||||
3. Transactions with Affiliates
Franklin Resources, Inc. is the holding company for various subsidiaries that together are referred to as Franklin Templeton Investments. Certain officers and trustees of the Fund are also officers and/or directors of the following subsidiaries:
| Subsidiary | Affiliation |
| Franklin Mutual Advisers, LLC (Franklin Mutual) | Investment manager |
| Franklin Templeton Investment Management Limited (FTIML) | Investment manager |
| Franklin Templeton Services, LLC (FT Services) | Administrative manager |
| Franklin Templeton Distributors, Inc. (Distributors) | Principal underwriter |
| Franklin Templeton Investor Services, LLC (Investor Services) | Transfer agent |
a. Management Fees
The Fund pays an investment management fee to Franklin Mutual based on the average daily net assets of the Fund as follows:
| Annualized Fee Rate | Net Assets | |
| 0.675 | % | Up to and including $5 billion |
| 0.645 | % | Over $5 billion, up to and including $7 billion |
| 0.625 | % | Over $7 billion, up to and including $10 billion |
| 0.615 | % | In excess of $10 billion |
franklintempleton.com
Annual Report
35
FRANKLIN MUTUAL BEACON FUND
NOTES TO FINANCIAL STATEMENTS
3. Transactions with Affiliates (continued)
a. Management Fees (continued)
Under a subadvisory agreement, FTIML, an affiliate of Franklin Mutual, provides subadvisory services to the Fund. The sub-advisory fee is paid by Franklin Mutual based on the Fund’s average daily net assets, and is not an additional expense of the Fund. Effective July 31, 2015, the subadvisory agreement was terminated for the Fund.
b. Administrative Fees
Under an agreement with Franklin Mutual, FT Services provides administrative services to the Fund. The fee is paid by Franklin Mutual based on the Fund’s average daily net assets, and is not an additional expense of the Fund.
c. Distribution Fees
The Board has adopted distribution plans for each share class, with the exception of Class Z and Class R6 shares, pursuant to Rule 12b-1 under the 1940 Act. Under the Fund’s Class A reimbursement distribution plan, the Fund reimburses Distributors for costs incurred in connection with the servicing, sale and distribution of the Fund’s shares up to the maximum annual plan rate. Under the Class A reimbursement distribution plan, costs exceeding the maximum for the current plan year cannot be reimbursed in subsequent periods. In addition, under the Fund’s Class C and R compensation distribution plans, the Fund pays Distributors for costs incurred in connection with the servicing, sale and distribution of the Fund’s shares up to the maximum annual plan rate for each class. The plan year, for purposes of monitoring compliance with the maximum annual plan rates, is February 1 through January 31 for each fund.
The maximum annual plan rates, based on the average daily net assets, for each class, are as follows:
| Class A | 0.35 | % |
| Class C | 1.00 | % |
| Class R | 0.50 | % |
Effective August 1, 2015, the Board has set the current rate at 0.25% per year for Class A shares until further notice and approval by the Board. Prior to August 1, 2015, the Board had set the rate at 0.30% per year for Class A shares.
d. Sales Charges/Underwriting Agreements
Front-end sales charges and contingent deferred sales charges (CDSC) do not represent expenses of the Fund. These charges are deducted from the proceeds of sales of Fund shares prior to investment or from redemption proceeds prior to remittance, as applicable. Distributors has advised the Fund of the following commission transactions related to the sales and redemptions of the Fund’s shares for the year:
| Sales charges retained net of commissions paid to unaffiliated | ||
| broker/dealers | $ | 277,427 |
| CDSC retained | $ | 6,222 |
e. Transfer Agent Fees
Each class of shares, except for Class R6, pays transfer agent fees to Investor Services for its performance of shareholder servicing obligations and reimburses Investor Services for out of pocket expenses incurred, including shareholding servicing fees paid to third parties. These fees are allocated daily based upon their relative proportion of such classes’ aggregate net assets. Class R6 pays Investor Services transfer agent fees specific to that class.
For the year ended December 31, 2015, the Fund paid transfer agent fees of $3,951,717, of which $1,643,950 was retained by Investor Services.
36 Annual Report
franklintempleton.com
FRANKLIN MUTUAL BEACON FUND
NOTES TO FINANCIAL STATEMENTS
f. Investments in Affiliated Management Investment Companies
The Fund invests in an affiliated management investment company for purposes other than exercising a controlling influence over the management or policies. Management fees paid by the Fund are waived on assets invested in the affiliated management investment company, as noted in the Statement of Operations, in an amount not to exceed the management and administrative fees paid directly or indirectly by each affiliate.
| % of Affiliated | |||||||||
| Number of | Number of | Fund Shares | |||||||
| Shares Held | Shares Held | Value | Outstanding | ||||||
| at Beginning | Gross | Gross | at End | at End | Investment | Realized | Held at End | ||
| of Year | Additions | Reductions | of Year | of Year | Income | Gain (Loss) | of Year | ||
| Non-Controlled Affiliates | |||||||||
| Institutional Fiduciary | |||||||||
| Trust Money Market | |||||||||
| Portfolio | — | 25,750,000 | (25,750,000 | ) | — | $ — | $ — | $ — | —% |
g. Waiver and Expense Reimbursements
Investor Services has contractually agreed in advance to waive or limit its fees so that the Class R6 transfer agent fees do not exceed 0.01% until April 30, 2016. There were no Class R6 transfer agent fees waived during the year ended December 31, 2015.
4. Expense Offset Arrangement
The Fund has entered into an arrangement with its custodian whereby credits realized as a result of uninvested cash balances are used to reduce a portion of the Fund’s custodian expenses. During the year ended December 31, 2015, the custodian fees were reduced as noted in the Statement of Operations.
5. Independent Trustees’ Retirement Plan
On January 1, 1993, the Trust adopted an Independent Trustees’ Retirement Plan (Plan). The Plan is an unfunded defined benefit plan that provides benefit payments to Trustees whose length of service and retirement age meets the eligibility requirements of the Plan. Benefits under the Plan are based on years of service and fees paid to each trustee at the time of retirement. Effective in December 1996, the Plan was closed to new participants.
During the year ended December 31, 2015, the Fund’s projected benefit obligation and benefit payments under the Plan were as follows:
| aProjected benefit obligation at December 31, 2015 | $ | 223,091 | |
| bIncrease in projected benefit obligation | $ | 12,214 | |
| Benefit payments made to retired trustees | $ | (3,789 | ) |
aThe projected benefit obligation is included in trustees’ fees and expenses in the Statement of Assets and Liabilities.
bThe increase in projected benefit obligation is included in trustees’ fees and expenses in the Statement of Operations.
6. Income Taxes
The tax character of distributions paid during the years ended December 31, 2015 and 2014, was as follows:
| 2015 | 2014 | |||
| Distributions paid from: | ||||
| Ordinary income | $ | 84,544,858 | $ | 159,883,206 |
| Long term capital gain | 300,997,860 | 190,769,709 | ||
| $ | 385,542,718 | $ | 350,652,915 |
franklintempleton.com
Annual Report
37
FRANKLIN MUTUAL BEACON FUND
NOTES TO FINANCIAL STATEMENTS
6. Income Taxes (continued)
At December 31, 2015, the cost of investments, net unrealized appreciation (depreciation), undistributed ordinary income and undistributed long term capital gains for income tax purposes were as follows:
| Cost of investments | $ | 3,397,505,649 | |
| Unrealized appreciation | $ | 761,692,435 | |
| Unrealized depreciation | (407,734,422 | ) | |
| Net unrealized appreciation (depreciation) | $ | 353,958,013 | |
| Undistributed ordinary income | $ | 375,103 | |
| Undistributed long term capital gains | 40,495,572 | ||
| Distributable earnings | $ | 40,870,675 |
Differences between income and/or capital gains as determined on a book basis and a tax basis are primarily due to differing treatment of foreign currency transactions.
7. Investment Transactions
Purchases and sales of investments (excluding short term securities and securities sold short) for the year ended December 31, 2015, aggregated $1,422,875,028 and $1,511,941,297, respectively.
Transactions in options written during the year ended December 31, 2015, were as follows:
| Number of | |||||
| Contracts | Premiums | ||||
| Options outstanding at December 31, 2014 | 2,000 | $ | 225,175 | ||
| Options written | — | — | |||
| Options expired | (2,000 | ) | (225,175 | ) | |
| Options exercised | — | — | |||
| Options closed | — | — | |||
| Options outstanding at December 31, 2015 | — | $ | — |
See Notes 1(c) and 10 regarding derivative financial instruments and other derivative information, respectively.
8. Credit Risk and Defaulted Securities
The Fund may purchase the pre-default or defaulted debt of distressed companies. Distressed companies are financially troubled and are about to be or are already involved in financial restructuring or bankruptcy. Risks associated with purchasing these securities include the possibility that the bankruptcy or other restructuring process takes longer than expected, or that distributions in restructuring are less than anticipated, either or both of which may result in unfavorable consequences to the Fund. If it becomes probable that the income on debt securities, including those of distressed companies, will not be collected, the Fund discontinues accruing income and recognizes an adjustment for uncollectible interest.
At December 31, 2015, the aggregate long value of distressed company securities for which interest recognition has been discontinued was $73,119,315, representing 1.94% of the Fund’s net assets. For information as to specific securities, see the accompanying Statement of Investments.
9. Restricted Securities
The Fund invests in securities that are restricted under the Securities Act of 1933 (1933 Act) or which are subject to legal, contractual, or other agreed upon restrictions on resale. Restricted securities are often purchased in private placement transactions, and cannot be sold without prior registration unless the sale is pursuant to an exemption under the 1933 Act. Disposal of these securities may require greater effort and expense, and prompt sale at an acceptable price may be difficult. The Fund may have registration rights for restricted securities. The issuer generally incurs all registration costs.
38 Annual Report
franklintempleton.com
FRANKLIN MUTUAL BEACON FUND
NOTES TO FINANCIAL STATEMENTS
At December 31, 2015, the Fund held investments in restricted securities, excluding certain securities exempt from registration under the 1933 Act deemed to be liquid, as follows:
| Principal | ||||||
| Amount/ | Acquisition | |||||
| Shares | Issuer | Dates | Cost | Value | ||
| 10,848 | Broadband Ventures III LLC, secured promissory note, 5.00%, 2/01/12 | 7/01/10 - 11/30/12 | $ | 10,848 | $ | — |
| 15,831,950 | CB FIM Coinvestors LLC | 1/15/09 - 6/02/09 | — | — | ||
| 19,805,560 | FIM Coinvestor Holdings I, LLC | 11/20/06 - 6/02/09 | — | — | ||
| 2,846,329 | International Automotive Components Group Brazil LLC | 4/13/06 - 12/26/08 | 1,890,264 | 29,269 | ||
| 22,836,904 | International Automotive Components Group North America LLC | 1/12/06 - 3/18/13 | 18,692,218 | 12,328,845 | ||
| 5,455 | PMG LLC | 3/22/04 | 381,819 | 213,055 | ||
| Total Restricted Securities (Value is 0.33% of Net Assets) | $ | 20,975,149 | $ | 12,571,169 |
10. Other Derivative Information
At December 31, 2015, the Fund’s investments in derivative contracts are reflected in the Statement of Assets and Liabilities as follows:
| Asset Derivatives | Liability Derivatives | ||||||
| Derivative Contracts | |||||||
| Not Accounted for as | Statement of Assets and | Statement of Assets and | |||||
| Hedging Instruments | Liabilities Location | Fair Value | Liabilities Location | Fair Value | |||
| Foreign exchange contracts | Variation margin | $ | 4,148,654 | a | |||
| Unrealized appreciation on | 20,373,688 | Unrealized depreciation on | $ | 4,995,015 | |||
| OTC forward exchange | OTC forward exchange | ||||||
| contracts | contracts | ||||||
| Totals | $ | 24,522,342 | $ | 4,995,015 | |||
aThis amount reflects the cumulative appreciation (depreciation) of futures contracts as reported in the Statement of Investments. Only the variation margin receivable/payable
at year end is separately reported within the Statement of Assets and Liabilities. Prior variation margin movements were recorded to cash upon receipt or payment.
For the year ended December 31, 2015, the effect of derivative contracts in the Fund’s Statement of Operations was as follows:
| Net Change in | ||||||||
| Unrealized | ||||||||
| Derivative Contracts | Net Realized | Appreciation | ||||||
| Not Accounted for as | Statement of Operations | Gain (Loss) | Statement of Operations | (Depreciation) | ||||
| Hedging Instruments | Locations | for the Year | Locations | for the Year | ||||
| Net realized gain (loss) from: | Net change in unrealized | |||||||
| appreciation (depreciation) | ||||||||
| on: | ||||||||
| Foreign exchange contracts | Foreign currency | $ | 72,754,959 | a | Translation of other assets | $ | (28,933,016 | )a |
| transactions | and liabilities | |||||||
| denominated in foreign | ||||||||
| currencies | ||||||||
| Futures contracts | 17,524,913 | Futures contracts | 1,327,853 | |||||
| Equity contracts | Written options | 225,175 | Written options | (195,175 | ) | |||
| Totals | $ | 90,505,047 | $ | (27,800,338 | ) |
aForward exchange contracts are included in net realized gain (loss) from foreign currency transactions and net change in unrealized appreciation (depreciation) on translation of other assets and liabilities denominated in foreign currencies in the Statement of Operations.
franklintempleton.com
Annual Report
39
FRANKLIN MUTUAL BEACON FUND
NOTES TO FINANCIAL STATEMENTS
10. Other Derivative Information (continued)
For the year ended December 31, 2015, the average month end fair value of derivatives represented 0.85% of average month end net assets. The average month end number of open derivative contracts for the year was 175.
See Notes 1(c) and 7 regarding derivative financial instruments and investment transactions, respectively.
11. Holdings of 5% Voting Securities of Portfolio Companies
The 1940 Act defines “affiliated companies” to include investments in portfolio companies in which a fund owns 5% or more of the outstanding voting securities. Investments in “affiliated companies” for the Fund for the year ended December 31, 2015, were as shown below.
| Number of | Number of | |||||||||||
| Shares Held | Shares Held | Value | ||||||||||
| at Beginning | Gross | Gross | at End | at End | Investment | Realized | ||||||
| Name of Issuer | of Year | Additions | Reductions | of Year | of Year | Income | Gain (Loss) | |||||
| Controlled Affiliatesa | ||||||||||||
| PMG LLC | 5,455 | — | — | 5,455 | $ | 213,055 | $ | — | $ | — | ||
| Non-Controlled Affiliates | ||||||||||||
| CB FIM Coinvestors LLC | 15,831,950 | — | — | 15,831,950 | $ | — | $ | — | $ | — | ||
| Polaris Consulting and | ||||||||||||
| Services Ltd./India | 6,669,381 | — | (6,669,381 | ) | — | — | 487,763 | 1,313,642 | ||||
| Tronox Ltd., A | 2,187,603 | 4,349,644 | (568,567 | ) | 5,968,680 | 23,337,539 | 3,344,952 | (6,883,898 | ) | |||
| Total Non-Controlled Affiliates | 23,337,539 | 3,832,715 | (5,570,256 | ) | ||||||||
| Total Affiliated Securities (Value is 0.62% of Net Assets) | $ | 23,550,594 | $ | 3,832,715 | $ | (5,570,256 | ) | |||||
| aIssuer in which the Fund owns 25% or more of the outstanding voting securities. | ||||||||||||
12. Credit Facility
The Fund, together with other U.S. registered and foreign investment funds (collectively, Borrowers), managed by Franklin Templeton Investments, are borrowers in a joint syndicated senior unsecured credit facility totaling $2 billion (Global Credit Facility) which matured on February 12, 2016. This Global Credit Facility provides a source of funds to the Borrowers for temporary and emergency purposes, including the ability to meet future unanticipated or unusually large redemption requests. Effective February 12, 2016, the Borrowers renewed the Global Credit Facility for a one year term, maturing February 10, 2017, for a total of $2 billion.
Under the terms of the Global Credit Facility, the Fund shall, in addition to interest charged on any borrowings made by the Fund and other costs incurred by the Fund, pay its share of fees and expenses incurred in connection with the implementation and maintenance of the Global Credit Facility, based upon its relative share of the aggregate net assets of all of the Borrowers, including an annual commitment fee of 0.07% based upon the unused portion of the Global Credit Facility. Effective February 12, 2016, the annual commitment fee is 0.15%. These fees are reflected in other expenses in the Statement of Operations. During the year ended December 31, 2015, the Fund did not use the Global Credit Facility.
13. Fair Value Measurements
The Fund follows a fair value hierarchy that distinguishes between market data obtained from independent sources (observable inputs) and the Fund’s own market assumptions (unobservable inputs). These inputs are used in determining the value of the Fund’s financial instruments and are summarized in the following fair value hierarchy:
- Level 1 – quoted prices in active markets for identical financial instruments
- Level 2 – other significant observable inputs (including quoted prices for similar financial instruments, interest rates, prepayment speed, credit risk, etc.)
40 Annual Report
franklintempleton.com
FRANKLIN MUTUAL BEACON FUND
NOTES TO FINANCIAL STATEMENTS
- Level 3 – significant unobservable inputs (including the Fund’s own assumptions in determining the fair value of financial instruments)
The input levels are not necessarily an indication of the risk or liquidity associated with financial instruments at that level.
For movements between the levels within the fair value hierarchy, the Fund has adopted a policy of recognizing the transfers as of the date of the underlying event which caused the movement.
A summary of inputs used as of December 31, 2015, in valuing the Fund’s assets and liabilities carried at fair value, is as follows:
| Level 1 | Level 2 | Level 3 | Total | ||||||
| Assets: | |||||||||
| Investments in Securities: | |||||||||
| Equity Investments:a | |||||||||
| Auto Components | $ | — | $ | — | $ | 12,358,114 | $ | 12,358,114 | |
| Metals & Mining | 33,630,103 | — | 213,055 | 33,843,158 | |||||
| All Other Equity Investmentsb | 3,479,695,771 | — | —c | 3,479,695,771 | |||||
| Corporate Notes and Senior Floating Rate Interests | — | 30,701,809 | — | 30,701,809 | |||||
| Corporate Bonds, Notes and Senior Floating Rate Interests in | |||||||||
| Reorganization | — | 73,107,640 | 11,675 | c | 73,119,315 | ||||
| Companies in Liquidation | 193,075 | 9,188,972 | —c | 9,382,047 | |||||
| Municipal Bonds | — | 12,395,145 | — | 12,395,145 | |||||
| Short Term Investments | 91,768,303 | 8,200,000 | — | 99,968,303 | |||||
| Total Investments in Securities | $ | 3,605,287,252 | $ | 133,593,566 | $ | 12,582,844 | $ | 3,751,463,662 | |
| Other Financial Instruments | |||||||||
| Futures Contracts | $ | 4,148,654 | $ | — | $ | — | $ | 4,148,654 | |
| Forward Exchange Contracts | — | 20,373,688 | — | 20,373,688 | |||||
| Total Other Financial Instruments | $ | 4,148,654 | $ | 20,373,688 | $ | — | $ | 24,522,342 | |
| Liabilities: | |||||||||
| Other Financial Instruments | |||||||||
| Forward Exchange Contracts | $ | — | $ | 4,995,015 | $ | — | $ | 4,995,015 | |
| aIncludes common and preferred stocks as well as other equity investments. | |||||||||
| bFor detailed categories, see the accompanying Statement of Investments. | |||||||||
| cIncludes securities determined to have no value at December 31, 2015. | |||||||||
A reconciliation of assets in which Level 3 inputs are used in determining fair value is presented when there are significant Level 3 financial instruments at the end of the year.
14. Subsequent Events
The Fund has evaluated subsequent events through the issuance of the financial statements and determined that no events have occurred that require disclosure other than those already disclosed in the financial statements.
| Abbreviations | |||||
| Counterparty | Currency | Selected Portfolio | |||
| BANT | Bank of America N.A. | EUR | Euro | ADR | American Depositary Receipt |
| BBU | Barclays Bank PLC | GBP | British Pound | FHLB | Federal Home Loan Bank |
| BONY | Bank of New York Mellon | USD | United States Dollar | GO | General Obligation |
| DBFX | Deutsche Bank AG | PIK | Payment-In-Kind | ||
| FBCO | Credit Suisse Group AG | ||||
| HSBC | HSBC Bank USA, N.A. | ||||
| SSBT | State Street Bank and Trust Co., N.A. | ||||
franklintempleton.com
Annual Report
41
FRANKLIN MUTUAL BEACON FUND
Report of Independent Registered Public Accounting Firm
To the Board of Trustees of Franklin Mutual Series Funds and Shareholders of Franklin Mutual Beacon Fund:
We have audited the accompanying statement of assets and liabilities, including the statement of investments, of Franklin Mutual Beacon Fund (the “Fund”) (one of the funds constituting Franklin Mutual Series Funds), as of December 31, 2015, and the related statement of operations for the year then ended, the statements of changes in net assets for each of the two years in the period then ended, and the financial highlights for each of the periods indicated therein. These financial statements and financial highlights are the responsibility of the Fund’s management. Our responsibility is to express an opinion on these financial statements and financial highlights based on our audits.
We conducted our audits in accordance with the standards of the Public Company Accounting Oversight Board (United States). Those standards require that we plan and perform the audit to obtain reasonable assurance about whether the financial statements and financial highlights are free of material misstatement. We were not engaged to perform an audit of the Fund’s internal control over financial reporting. Our audits included consideration of internal control over financial reporting as a basis for designing audit procedures that are appropriate in the circumstances, but not for the purpose of expressing an opinion on the effectiveness of the Fund’s internal control over financial reporting. Accordingly, we express no such opinion. An audit also includes examining, on a test basis, evidence supporting the amounts and disclosures in the financial statements and financial highlights, assessing the accounting principles used and significant estimates made by management, and evaluating the overall financial statement presentation. Our procedures included confirmation of securities owned as of December 31, 2015, by correspondence with the custodian and brokers, or by other appropriate auditing procedures where replies from the brokers were not received. We believe that our audits provide a reasonable basis for our opinion.
In our opinion, the financial statements and financial highlights referred to above present fairly, in all material respects, the financial position of Franklin Mutual Beacon Fund (one of the funds constituting Franklin Mutual Series Funds) at December 31, 2015, the results of its operations for the year then ended, the changes in its net assets for each of the two years in the period then ended, and the financial highlights for each of the periods indicated therein, in conformity with U.S. generally accepted accounting principles.
![]()
Boston, Massachusetts
February 18, 2016
42 Annual Report
franklintempleton.com
FRANKLIN MUTUAL BEACON FUND
Tax Information (unaudited)
Under Section 852(b)(3)(C) of the Internal Revenue Code (Code), the Fund hereby reports the maximum amount allowable but no less than $300,997,860 as a long term capital gain dividend for the fiscal year ended December 31, 2015.
Under Section 854(b)(1)(A) of the Code, the Fund hereby reports 56.24% of the ordinary income dividends as income qualifying for the dividends received deduction for the fiscal year ended December 31, 2015.
Under Section 854(b)(1)(B) of the Code, the Fund hereby reports the maximum amount allowable but no less than $82,370,451 as qualified dividends for purposes of the maximum rate under Section 1(h)(11) of the Code for the fiscal year ended December 31, 2015. Distributions, including qualified dividend income, paid during calendar year 2015 will be reported to shareholders on Form 1099-DIV by mid-February 2016. Shareholders are advised to check with their tax advisors for information on the treatment of these amounts on their individual income tax returns.
Under Section 871(k)(1)(C) of the Code, the Fund hereby reports the maximum amount allowable but no less than $6,153,993 as interest related dividends for purposes of the tax imposed under Section 871(a)(1)(A) of the Code for the fiscal year ended December 31, 2015.
Annual Report
43
FRANKLIN MUTUAL BEACON FUND
| Board Members and Officers | ||||
| The name, year of birth and address of the officers and board members, as well as their affiliations, positions held with the Fund, | ||||
| principal occupations during at least the past five years and number of portfolios overseen in the Franklin Templeton Investments | ||||
| fund complex, are shown below. Generally, each board member serves until that person’s successor is elected and qualified. | ||||
| Independent Board Members | ||||
| Number of Portfolios in | ||||
| Name, Year of Birth | Length of | Fund Complex Overseen | Other Directorships Held | |
| and Address | Position | Time Served | by Board Member* | During at Least the Past 5 Years |
| Edward I. Altman, Ph.D. (1941) | Trustee | Since 1987 | 17 | None |
| c/o Franklin Mutual Advisers, LLC | ||||
| 101 John F. Kennedy Parkway | ||||
| Short Hills, NJ 07078-2789 | ||||
| Principal Occupation During at Least the Past 5 Years: | ||||
| Max L. Heine Professor of Finance, Emeritus and Director of The Credit and Debt Markets Research Program, Salomon Center, Stern School | ||||
| of Business, New York University; editor and author of numerous financial publications; financial consultant; an adviser to numerous financial | ||||
| and publishing organizations; and formerly, Vice Director, Salomon Center, Stern School of Business, New York University. | ||||
| Ann Torre Bates (1958) | Trustee | Since 1995 | 41 | Navient Corporation (loan |
| c/o Franklin Mutual Advisers, LLC | management, servicing and asset | |||
| 101 John F. Kennedy Parkway | recovery) (2014-present), Ares Capital | |||
| Short Hills, NJ 07078-2789 | Corporation (specialty finance | |||
| company) (2010-present), United | ||||
| Natural Foods, Inc. (distributor of | ||||
| natural, organic and specialty foods) | ||||
| (2013-present), Allied Capital | ||||
| Corporation (financial services) | ||||
| (2003-2010) and SLM Corporation | ||||
| (Sallie Mae) (1997-2014). | ||||
| Principal Occupation During at Least the Past 5 Years: | ||||
| Director of various companies; and formerly, Executive Vice President and Chief Financial Officer, NHP Incorporated (manager of multifamily | ||||
| housing) (1995-1997); and Vice President and Treasurer, US Airways, Inc. (until 1995). | ||||
| Burton J. Greenwald (1929) | Trustee | Trustee since | 17 | Franklin Templeton Emerging Markets |
| c/o Franklin Mutual Advisers, LLC | and Vice | 2002 and Vice | Debt Opportunities Fund PLC and | |
| 101 John F. Kennedy Parkway | Chairman | Chairman since | Fiduciary International Ireland Limited | |
| Short Hills, NJ 07078-2789 | of the | April 2015 | (1999-2015). | |
| Board | ||||
| Principal Occupation During at Least the Past 5 Years: | ||||
| Managing Director, B.J. Greenwald Associates (management consultants to the financial services industry); and formerly, Chairman, | ||||
| Fiduciary Trust International Funds; Executive Vice President, L.F. Rothschild Fund Management, Inc.; President and Director, Merit Mutual | ||||
| Funds; President, Underwriting Division and Director, National Securities & Research Corporation; Governor, Investment Company Institute; | ||||
| and Chairman, ICI Public Information Committee. | ||||
| Keith E. Mitchell (1954) | Trustee | Since 2009 | 17 | None |
| c/o Franklin Mutual Advisers, LLC | ||||
| 101 John F. Kennedy Parkway | ||||
| Short Hills, NJ 07078-2789 | ||||
| Principal Occupation During at Least the Past 5 Years: | ||||
| Director of various boards of asset management firms; and formerly, Managing Member, Mitchell, Hartley & Bechtel Advisers, LLC (formerly, | ||||
| Mitchell Advisers, LLC) (advisory firm) (2003-2015) and Managing Director, Putnam Lovell NBF. | ||||
44 Annual Report
franklintempleton.com
FRANKLIN MUTUAL BEACON FUND
| Independent Board Members (continued) | |||||
| Number of Portfolios in | |||||
| Name, Year of Birth | Length of | Fund Complex Overseen | Other Directorships Held | ||
| and Address | Position | Time Served | by Board Member* | During at Least the Past 5 Years | |
| David W. Niemiec (1949) | Trustee | Since | 41 | Emeritus Corporation (assisted living) | |
| One Franklin Parkway | April 2015 | (1999-2010) and OSI Pharmaceuticals, | |||
| San Mateo, CA 94403-1906 | Inc. (pharmaceutical products) | ||||
| (2006-2010). | |||||
| Principal Occupation During at Least the Past 5 Years: | |||||
| Advisor, Saratoga Partners (private equity fund); and formerly, Managing Director, Saratoga Partners (1998-2001) and SBC Warburg Dillon | |||||
| Read (investment banking) (1997-1998); Vice Chairman, Dillon, Read & Co. Inc. (investment banking) (1991-1997); and Chief Financial | |||||
| Officer, Dillon, Read & Co. Inc. (1982-1997). | |||||
| Charles Rubens II (1930) | Trustee | Since 1998 | 17 | None | |
| c/o Franklin Mutual Advisers, LLC | |||||
| 101 John F. Kennedy Parkway | |||||
| Short Hills, NJ 07078-2789 | |||||
| Principal Occupation During at Least the Past 5 Years: | |||||
| Private investor and president of non-profit organizations; and formerly, an executive of Time, Inc.; and Trustee of Colorado College. | |||||
| Jan Hopkins Trachtman (1947) | Trustee | Since 2009 | 17 | None | |
| c/o Franklin Mutual Advisers, LLC | |||||
| 101 John F. Kennedy Parkway | |||||
| Short Hills, NJ 07078-2789 | |||||
| Principal Occupation During at Least the Past 5 Years: | |||||
| President and Founder, The Jan Hopkins Group (communications consulting firm); serves on Advisory Board of Knight Bagehot Fellowship; | |||||
| and formerly, President, Economic Club of New York (2001-2015); Anchor/Correspondent, CNN Financial News (until 2003); Managing | |||||
| Director and Head of Client Communications, Citigroup Private Bank (until 2005); Off-Air Reporter, ABC News’ World News Tonight; and | |||||
| Editor, CBS Network News. | |||||
| Robert E. Wade (1946) | Trustee | Trustee since | 41 | El Oro Ltd (investments) | |
| c/o Franklin Mutual Advisers, LLC | and | 1993 | and | (2003-present). | |
| 101 John F. Kennedy Parkway | Chairman | Chairman | |||
| Short Hills, NJ 07078-2789 | of the | of the Board | |||
| Board | since 2005 | ||||
| Principal Occupation During at Least the Past 5 Years: | |||||
| Attorney at law engaged in private practice (1972-2008) and member of various boards. | |||||
| Gregory H. Williams (1943) | Trustee | Since | 17 | None | |
| One Franklin Parkway | April 2015 | ||||
| San Mateo, CA 94403-1906 | |||||
| Principal Occupation During at Least the Past 5 Years: | |||||
| Private investor; Consultant; and formerly, President, University of Cincinnati (2009-2012); President, The City College of New York | |||||
| (2001-2009); Dean, College of Law, Ohio State University (1993-2001); and Associate Vice President, Academic Affairs and Professor of Law, | |||||
| University of Iowa (1977-1993). | |||||
franklintempleton.com
Annual Report
45
FRANKLIN MUTUAL BEACON FUND
| Interested Board Members and Officers | ||||
| Number of Portfolios in | ||||
| Name, Year of Birth | Length of | Fund Complex Overseen | Other Directorships Held | |
| and Address | Position | Time Served | by Board Member* | During at Least the Past 5 Years |
| **Gregory E. Johnson (1961) | Trustee | Since 2007 | 164 | None |
| One Franklin Parkway | ||||
| San Mateo, CA 94403-1906 | ||||
| Principal Occupation During at Least the Past 5 Years: | ||||
| Chairman of the Board, Member – Office of the Chairman, Director and Chief Executive Officer, Franklin Resources, Inc.; officer and/or | ||||
| director or trustee, as the case may be, of some of the other subsidiaries of Franklin Resources, Inc. and of 44 of the investment companies in | ||||
| Franklin Templeton Investments; Vice Chairman, Investment Company Institute; and formerly, President, Franklin Resources, Inc. | ||||
| (1994-2015). | ||||
| **Peter A. Langerman (1955) | Trustee, | Trustee | 7 | American International Group, Inc. |
| c/o Franklin Mutual Advisers, LLC | President, | since 2007, | (AIG) Credit Facility Trust | |
| 101 John F. Kennedy Parkway | and Chief | President, and | (2010-2011). | |
| Short Hills, NJ 07078-2702 | Executive | Chief Executive | ||
| Officer – | Officer – | |||
| Investment | Investment | |||
| Management | Management | |||
| since 2005 | ||||
| Principal Occupation During at Least the Past 5 Years: | ||||
| Chairman of the Board, Chief Executive Officer and President, Franklin Mutual Advisers, LLC; and officer and/or director, as the case may be, | ||||
| of two of the investment companies in Franklin Templeton Investments. | ||||
| Alison E. Baur (1964) | Vice | Since 2012 | Not Applicable | Not Applicable |
| One Franklin Parkway | President | |||
| San Mateo, CA 94403-1906 | ||||
| Principal Occupation During at Least the Past 5 Years: | ||||
| Deputy General Counsel, Franklin Templeton Investments; and officer of some of the other subsidiaries of Franklin Resources, Inc. and of 44 | ||||
| of the investment companies in Franklin Templeton Investments. | ||||
| Philippe Brugere-Trelat (1949) | Vice | Since 2005 | Not Applicable | Not Applicable |
| 101 John F. Kennedy Parkway | President | |||
| Short Hills NJ 07078-2789 | ||||
| Principal Occupation During at Least the Past 5 Years: | ||||
| Executive Vice President, Franklin Mutual Advisers, LLC; officer of two of the investment companies in Franklin Templeton Investments; and | ||||
| formerly, Portfolio Manager of Eurovest SA (French registered Investment Company, Sicav). | ||||
| Laura F. Fergerson (1962) | Chief | Since 2009 | Not Applicable | Not Applicable |
| One Franklin Parkway | Executive | |||
| San Mateo, CA 94403-1906 | Officer – | |||
| Finance and | ||||
| Administration | ||||
| Principal Occupation During at Least the Past 5 Years: | ||||
| Senior Vice President, Franklin Templeton Services, LLC; Vice President, Franklin Advisers, Inc. and Franklin Templeton Institutional, LLC; | ||||
| and officer of 44 of the investment companies in Franklin Templeton Investments. | ||||
| Aliya S. Gordon (1973) | Vice | Since 2009 | Not Applicable | Not Applicable |
| One Franklin Parkway | President | |||
| San Mateo, CA 94403-1906 | ||||
| Principal Occupation During at Least the Past 5 Years: | ||||
| Senior Associate General Counsel, Franklin Templeton Investments; and officer of 44 of the investment companies in Franklin Templeton | ||||
| Investments. | ||||
46 Annual Report
franklintempleton.com
FRANKLIN MUTUAL BEACON FUND
| Interested Board Members and Officers (continued) | ||||
| Number of Portfolios in | ||||
| Name, Year of Birth | Length of | Fund Complex Overseen | Other Directorships Held | |
| and Address | Position | Time Served | by Board Member* | During at Least the Past 5 Years |
| Steven J. Gray (1955) | Secretary | Secretary | Not Applicable | Not Applicable |
| One Franklin Parkway | and Vice | since 2005 and | ||
| San Mateo, CA 94403-1906 | President | Vice President | ||
| since 2009 | ||||
| Principal Occupation During at Least the Past 5 Years: | ||||
| Senior Associate General Counsel, Franklin Templeton Investments; Vice President, Franklin Templeton Distributors, Inc. and Franklin | ||||
| Alternative Strategies Advisers, LLC; and officer of 44 of the investment companies in Franklin Templeton Investments. | ||||
| Selena L. Holmes (1965) | Vice | Since 2012 | Not Applicable | Not Applicable |
| 100 Fountain Parkway | President – | |||
| St. Petersburg, FL 33716-1205 | AML | |||
| Compliance | ||||
| Principal Occupation During at Least the Past 5 Years: | ||||
| Director, Global Compliance Monitoring; Chief Compliance Officer, Franklin Alternative Strategies Advisers, LLC; Vice President, Franklin | ||||
| Templeton Companies, LLC; and officer of 44 of the investment companies in Franklin Templeton Investments. | ||||
| Robert G. Kubilis (1973) | Treasurer, | Since 2012 | Not Applicable | Not Applicable |
| 300 S.E. 2nd Street | Chief | |||
| Fort Lauderdale, FL 33301-1923 | Financial | |||
| Officer | ||||
| and Chief | ||||
| Accounting | ||||
| Officer | ||||
| Principal Occupation During at Least the Past 5 Years: | ||||
| Treasurer, U.S. Fund Administration & Reporting, Franklin Templeton Investments; and officer of four of the investment companies in Franklin | ||||
| Templeton Investments. | ||||
| Kimberly H. Novotny (1972) | Vice | Since 2013 | Not Applicable | Not Applicable |
| 300 S.E. 2nd Street | President | |||
| Fort Lauderdale, FL 33301-1923 | ||||
| Principal Occupation During at Least the Past 5 Years: | ||||
| Associate General Counsel, Franklin Templeton Investments; Vice President, Fiduciary Trust International of the South and Templeton | ||||
| Investment Counsel, LLC; Assistant Secretary, Franklin Resources, Inc.; and officer of 44 of the investment companies in Franklin Templeton | ||||
| Investments. | ||||
| Robert C. Rosselot (1960) | Chief | Since 2013 | Not Applicable | Not Applicable |
| 300 S.E. 2nd Street | Compliance | |||
| Fort Lauderdale, FL 33301-1923 | Officer | |||
| Principal Occupation During at Least the Past 5 Years: | ||||
| Director, Global Compliance, Franklin Templeton Investments; Vice President, Franklin Templeton Companies, LLC; officer of 44 of the | ||||
| investment companies in Franklin Templeton Investments; and formerly, Senior Associate General Counsel, Franklin Templeton Investments | ||||
| (2007-2013); and Secretary and Vice President, Templeton Group of Funds (2004-2013). | ||||
| Karen L. Skidmore (1952) | Vice | Since 2009 | Not Applicable | Not Applicable |
| One Franklin Parkway | President | |||
| San Mateo, CA 94403-1906 | ||||
| Principal Occupation During at Least the Past 5 Years: | ||||
| Senior Associate General Counsel, Franklin Templeton Investments; and officer of 44 of the investment companies in Franklin Templeton | ||||
| Investments. | ||||
franklintempleton.com
Annual Report
47
FRANKLIN MUTUAL BEACON FUND
| Interested Board Members and Officers (continued) | ||||
| Number of Portfolios in | ||||
| Name, Year of Birth | Length of | Fund Complex Overseen | Other Directorships Held | |
| and Address | Position | Time Served | by Board Member* | During at Least the Past 5 Years |
| Navid Tofigh (1972) | Vice | Since | Not Applicable | Not Applicable |
| One Franklin Parkway | President | November 2015 | ||
| San Mateo, CA 94403-1906 | ||||
| Principal Occupation During at Least the Past 5 Years: | ||||
| Associate General Counsel, Franklin Templeton Investments; and officer of 44 of the investment companies in Franklin Templeton | ||||
| Investments. | ||||
| Craig S. Tyle (1960) | Vice | Since 2005 | Not Applicable | Not Applicable |
| One Franklin Parkway | President | |||
| San Mateo, CA 94403-1906 | ||||
| Principal Occupation During at Least the Past 5 Years: | ||||
| General Counsel and Executive Vice President, Franklin Resources, Inc.; and officer of some of the other subsidiaries of Franklin Resources, | ||||
| Inc. and of 44 of the investment companies in Franklin Templeton Investments. | ||||
| Lori A. Weber (1964) | Vice | Since 2011 | Not Applicable | Not Applicable |
| 300 S.E. 2nd Street | President | |||
| Fort Lauderdale, FL 33301-1923 | ||||
Principal Occupation During at Least the Past 5 Years:
Senior Associate General Counsel, Franklin Templeton Investments; Assistant Secretary, Franklin Resources, Inc.; Vice President and
Secretary, Templeton Investment Counsel, LLC; and officer of 44 of the investment companies in Franklin Templeton Investments.
*We base the number of portfolios on each separate series of the U.S. registered investment companies within the Franklin Templeton Investments fund complex. These
portfolios have a common investment manager or affiliated investment managers.
**Gregory E. Johnson is considered to be an interested person of the Fund under the federal securities laws due to his position as an officer and director of Franklin
Resources, Inc., which is the parent company of the Fund’s investment manager and distributor. Peter A. Langerman is considered to be an interested person of the Fund
under the federal securities laws due to his position as an officer of Franklin Mutual Advisers, LLC, which is an affiliate of the Fund’s investment manager.
Note 1: Officer information is current as of the date of this report. It is possible that after this date, information about officers may change.
The Fund’s Board has determined that certain of the members of the Audit Committee, including Ann Torre Bates, are audit committee financial experts, and
“independent,” under those provisions of the Sarbanes-Oxley Act of 2002, and the rules and form amendments adopted by the Securities and Exchange
Commission, relating to audit committee financial experts.
The Statement of Additional Information (SAI) includes additional information about the board members and is available, without charge, upon request.
Shareholders may call (800) DIAL BEN/342-5236 to request the SAI.
48 Annual Report
franklintempleton.com
FRANKLIN MUTUAL BEACON FUND
Shareholder Information
Proxy Voting Policies and Procedures
The Fund’s investment manager has established Proxy Voting Policies and Procedures (Policies) that the Fund uses to determine how to vote proxies relating to portfolio securities. Shareholders may view the Fund’s complete Policies online at franklintempleton.com. Alternatively, shareholders may request copies of the Policies free of charge by calling the Proxy Group collect at (954) 527-7678 or by sending a written request to: Franklin Templeton Companies, LLC, 300 S.E. 2nd Street, Fort Lauderdale, FL 33301, Attention: Proxy Group. Copies of the Fund’s proxy voting records are also made available online at franklintempleton.com and posted on the U.S. Securities and Exchange Commission’s website at sec.gov and reflect the most recent 12-month period ended June 30.
Quarterly Statement of Investments
The Fund files a complete statement of investments with the U.S. Securities and Exchange Commission for the first and third quarters for each fiscal year on Form N-Q. Shareholders may view the filed Form N-Q by visiting the Commission’s website at sec.gov. The filed form may also be viewed and copied at the Commission’s Public Reference Room in Washington, DC. Information regarding the operations of the Public Reference Room may be obtained by calling (800) SEC-0330.
Householding of Reports and Prospectuses
You will receive the Fund’s financial reports every six months as well as an annual updated summary prospectus (prospectus available upon request). To reduce Fund expenses, we try to identify related shareholders in a household and send only one copy of the financial reports and summary prospectus. This process, called “householding,” will continue indefinitely unless you instruct us otherwise. If you prefer not to have these documents householded, please call us at (800) 632-2301. At any time you may view current prospectuses/summary prospectuses and financial reports on our website. If you choose, you may receive these documents through electronic delivery.
franklintempleton.com
Annual Report
49
This page intentionally left blank
This page intentionally left blank
This page intentionally left blank
| Contents | |
| Annual Report | |
| Franklin Mutual European Fund | 3 |
| Performance Summary | 8 |
| Your Fund’s Expenses | 13 |
| Financial Highlights and Statement of Investments | 15 |
| Financial Statements | 25 |
| Notes to Financial Statements | 29 |
| Report of Independent Registered | |
| Public Accounting Firm | 42 |
| Tax Information | 43 |
| Board Members and Officers | 44 |
| Shareholder Information | 49 |
Visit franklintempleton.com for fund updates, to access your account, or to find helpful financial planning tools.
2 Annual Report
franklintempleton.com
Annual Report
Franklin Mutual European Fund
This annual report for Franklin Mutual European Fund covers the fiscal year ended December 31, 2015.
Your Fund’s Goals and Main Investments
The Fund seeks capital appreciation, with income as a secondary goal, by investing at least 80% of its net assets in securities of European companies that we believe are available at market prices less than their intrinsic value. The Fund defines European companies as issuers organized under the laws of, or whose principal business operations are located in, or who earn at least 50% of their revenue from, European countries, as defined in the prospectus.
Performance Overview
The Fund’s Class Z shares delivered a +0.82% cumulative total return for the 12 months under review. In comparison, the Fund’s benchmark, the MSCI Europe Index, which tracks equity performance in Europe’s developed markets, had a +4.91% total return in local currency terms.1 You can find more of the Fund’s performance data in the Performance Summary beginning on page 8.
Performance data represent past performance, which does not guarantee future results. Investment return and principal value will fluctuate, and you may have a gain or loss when you sell your shares. Current performance may differ from figures shown. For most recent month-end performance, go to franklintempleton.com or call (800) 342-5236.
Economic and Market Overview
The European economy expanded moderately during the 12 months under review. As measured by the MSCI Europe Index in euro and local currency terms, European equities generally rose in 2015 despite experiencing volatility, particularly in the second half of the year. The European Central Bank (ECB) initiated a significant bond-buying program in January, and eurozone economic data published during the period showed broad-based improvements such as a decrease in the number of unemployed and a small decline in the unemployment rate. Manufacturing data were generally positive, and the ECB’s quarterly bank lending surveys were also upbeat as credit conditions generally eased, particularly for businesses, and loan demand rose.
The eurozone also generally benefited from lower oil prices, a weaker euro that boosted exports, and expectations of further ECB stimulus. Slower first-quarter growth in Germany, largely due to weak exports, picked up in subsequent quarters, and growth in the U.K. remained healthy, albeit slowing. Economic expansion in France, led by higher consumer spending and

1. Source: Morningstar.
The unmanaged index is calculated in local currency and includes reinvestment of any income or distributions. One cannot invest directly in an index, and an index is not
representative of the Fund’s portfolio.
See www.franklintempletondatasources.com for additional data provider information.
The dollar value, number of shares or principal amount, and names of all portfolio holdings are listed in the Fund’s Statement of Investments (SOI).
The SOI begins on page 20.
franklintempleton.com
Annual Report
3
FRANKLIN MUTUAL EUROPEAN FUND
business investment, also contributed to regional recovery. Although the eurozone’s annual inflation rate declined early in 2015, it rose slightly during the remainder of the year.
In January, investors responded favorably to the ECB’s efforts meant to build economic momentum and boost inflation. Following market volatility in August, ECB President Mario Draghi stated that the central bank would take further action, if needed, to support the eurozone economy. Seeking to boost slowing growth, in December the ECB maintained its benchmark interest rates but announced a reduction in its deposit rate and pushed out the end date of its bond-buying program to March 2017. The moves disappointed investors, but the ECB indicated a willingness to act again if required.
Events in Greece caused volatility in European equity markets. The left-wing and anti-austerity Syriza party won Greece’s general election in January, and a July 5 referendum produced a vote against further austerity. However, Europe’s financial markets rose after negotiations produced a preliminary rescue deal and Greece’s parliament passed necessary austerity measures to secure a new bailout package. Volatility in August was driven by concerns about the potential impact of a slowdown in China’s economic growth, China’s stock market plunge, the devaluation of the yuan by the People’s Bank of China and declining commodity prices.
Investment Strategy
We follow a distinctive value investment approach that combines investments in what we believe are undervalued common stocks with distressed debt investing and risk arbitrage. Our style aims to provide our shareholders with superior risk-adjusted results over time. We employ rigorous, fundamental analysis to find compelling situations. In our opinion, successful investing is as much about assessing risk and containing losses as it is about achieving profits. In choosing investments, we look at the market price of an individual company’s securities relative to our evaluation of its intrinsic value based on factors including book value, cash flow generation, long-term earnings potential and earnings multiples. We may invest in bankrupt or distressed companies if we believe the market overreacted to adverse developments or failed to appreciate positive changes.
In addition, it is our practice to hedge the Fund’s currency exposure when we deem it advantageous for our shareholders.
What is meant by “hedge”?
To hedge an investment is to take a position intended to offset potential losses/gains that may be incurred by a companion financial instrument.
| Top 10 Sectors/Industries | ||
| Based on Equity Securities as of 12/31/15 | ||
| % of Total | ||
| Net Assets | ||
| Insurance | 18.3 | % |
| Banks | 11.5 | % |
| Diversified Telecommunication Services | 7.4 | % |
| Oil, Gas & Consumable Fuels | 5.0 | % |
| Media | 4.7 | % |
| Pharmaceuticals | 4.0 | % |
| Specialty Retail | 3.7 | % |
| Construction & Engineering | 2.9 | % |
| Metals & Mining | 2.8 | % |
| Communications Equipment | 2.5 | % |
Manager’s Discussion
During the 12 months under review, European stock markets made gains in local currency terms. The ECB, among several other central banks, became more accommodative while fiscal authorities focused on budgetary discipline. Large companies also remained disciplined about operating costs, with margins at historically high levels in many industries and countries. To drive further growth, an increasing number of companies took advantage of low interest rates to finance deals. In this environment, we saw a number of opportunities.
We initiated a position in the U.K.-based pharmaceutical company GlaxoSmithKline in the second half of 2015. The company has missed expectations for many years and significantly underperformed its pharmaceutical industry peers. However, the drug company maintains a strong position in several important end markets and is working through a restructuring plan. In our view, continued market pessimism created an opportunity for us to buy the stock at an attractive valuation. We also initiated a position in the multinational communications and information technology company Nokia. In April, Nokia announced that it was in talks to purchase Alcatel-Lucent, a French global telecommunications equipment company. We view the potential merger as compelling. The combined company would become a much larger competitor and gain the benefits of scale in wireless access and 4G long-term evolution as well as routing and voice over Internet protocol. Overall, we view the strengths of Alcatel-Lucent as complementary to Nokia’s businesses and believe significant cost savings could be achieved.
Conversely, we exited a handful of positions during the year, including ING Groep. We sold our position in ING as the company has successfully completed the majority of its multi-year
4 Annual Report
franklintempleton.com
FRANKLIN MUTUAL EUROPEAN FUND
restructuring effort, which included spinning off its European insurance business, NN Group, and its U.S. insurance business, Voya. The company has also repaid the state aid it received from the government of the Netherlands during the financial crises. ING now has a sizable excess capital position and is able to resume dividend payments. We sold our shares in ING as the stock price reflected these positive developments and the market was paying a premium for financial stocks with strong capital positions and the potential for high dividend yields. In the first quarter of 2015, we sold our position in Marks and Spencer, the U.K.-based multinational retailer. The stock approached our sell target and we saw no new catalysts for further stock price appreciation.
Merger and acquisition (M&A) activity accelerated in the past 12 months, helping to support valuations. Deal volumes reached historical highs and regulators globally increased their scrutiny of potential negative effects of high concentration. Such an environment — active M&A combined with regulatory uncertainty, greater complexity and market volatility — may provide attractive investment opportunities. We seek to use a mixture of merger arbitrage positions and investments in one or both of the companies to participate in these opportunities. The traditional merger arbitrage positions are constructed solely to benefit from deal completion, while unhedged investments in one or both companies can allow the Fund to benefit from possible value creation once the deal is completed.
Distressed debt remained a difficult market in which we could find compelling new opportunities. Low interest rates have kept credit widely available, and we felt bankruptcies were limited, except in the energy and mining sectors. Increased stress in high yield markets, particularly in energy credit, has expanded the potential opportunity set for us. For non-energy firms, costs of issuing debt are climbing and these debt securities are starting to look attractive to us. Within energy, declining commodity prices increased financial pressures for a growing number of issuers. At year-end, a record level of crude oil inventories and insistence by Saudi Arabia that it will not reduce production provide little reason to expect a quick recovery in crude oil prices, implying to us an increased likelihood of new investment opportunities in energy sector debt.
Turning to Fund performance, top contributors included insurers Direct Line Insurance Group, Ageas and NN Group.
U.K.-based Direct Line Insurance Group achieved strong cash flow generation in 2015. Amid a bottoming price environment, the company focused on disciplined underwriting and lowering expenses. Such discipline resulted in a decline in new policies written and improved profitability as evidenced by the August release of better-than-expected first-half results showing earnings across all business segments exceeded expectations. The stock had also risen in May after the announcement of a special dividend to be paid following the sale of its international division, and the dividend was paid in July 2015.
Headquartered in Belgium, Ageas is a diversified insurer with operations in Europe and Asia. The company’s stock price rose in 2015 as Ageas improved its underlying insurance results while focusing on cash generation. The company disclosed a solid capital position under new eurozone capitalization guidelines for insurers, reassuring investors. In late August, Ageas announced the sale of its Hong Kong life insurance business at a valuation that, in our view, was quite favorable.
NN Group is a Dutch insurer spun out of ING Groep. The company followed through successfully on its efforts to reduce expenses and improve return on equity, a measure of the amount earned on a company’s common stock investment. Results for several quarters were positive, and the company stated in November that it had reached its expense savings target a year early but would continue to push for further efficiencies. The company also periodically repurchased shares from ING Groep to help meet ING’s goal to fully divest its insurance and investment management holdings by the end of 2016, as required under ING’s restructuring agreement with the European Commission.
During the period under review, some of the Fund’s investments that negatively affected performance were offshore energy services company DeepOcean Group Holding, cement products and services company LafargeHolcim and broadcaster Societe Television Francaise 1.
DeepOcean provides seabed mapping and subsea services, including installation, inspection, maintenance and repairs. The ongoing decline in crude oil prices during 2015 hindered the company as many oil exploration and production companies aggressively reduced capital investment plans.
franklintempleton.com
Annual Report 5
FRANKLIN MUTUAL EUROPEAN FUND
| Top 10 Equity Holdings | ||
| 12/31/15 | ||
| Company | % of Total | |
| Sector/Industry, Country | Net Assets | |
| NN Group NV | 3.0 | % |
| Insurance, Netherlands | ||
| Direct Line Insurance Group PLC | 2.7 | % |
| Insurance, U.K. | ||
| Ageas | 2.6 | % |
| Insurance, Belgium | ||
| Vodafone Group PLC | 2.5 | % |
| Wireless Telecommunication Services, U.K. | ||
| Koninklijke KPN NV | 2.4 | % |
| Diversified Telecommunication Services, Netherlands | ||
| Deutsche Telekom AG | 2.4 | % |
| Diversified Telecommunication Services, Germany | ||
| Enel SpA | 2.4 | % |
| Electric Utilities, Italy | ||
| Novartis AG | 2.4 | % |
| Pharmaceuticals, Switzerland | ||
| Metro AG | 2.4 | % |
| Food & Staples Retailing, Germany | ||
| Accor SA | 2.4 | % |
| Hotels, Restaurants & Leisure, France |
Switzerland-based LafargeHolcim was created by the merger of Holcim and Lafarge in July 2015. Prior to the merger’s closing, each company lowered its guidance for 2015 earnings, which was followed by a November report of weaker-than-expected quarterly earnings and revenue due to slower economic growth in key emerging markets, particularly China and Brazil. Amid uncertainty in emerging markets, the company experienced selling price pressure as well as cost inflation that hindered earnings. LarfargeHolcim’s stock price decline was mitigated as investors reacted favorably to some announcements in November, including a proposed 2015 dividend increase, new targets for cumulative free cash flow and an asset sale. In its December 2015 capital markets presentation, the company also highlighted its focus on generating and returning cash to shareholders, reinforcing our belief that the market has underestimated company management’s focus on cash, costs and return on invested capital.
Societe Television Francaise 1 is a French broadcasting and communication services company. A weak advertising environment and shrinking audience share for the company’s TF1 channel hurt the stock price. In July, Television Francaise 1 sold its remaining stake in Eurosport to Discovery Communications in exchange for cash and the minority stakes of three French pay-TV stations that Television Francaise 1 had sold to Discovery Communications in 2012. Eurosport accounted for nearly 11% of net income for Television Francaise 1, but the sports network was also a non-core asset approaching a period of increased costs. Shares of Television Francaise 1 and other
private broadcasters also retreated in September after the French Foreign Minister proposed lifting an advertising ban on public channels. Instead, the government increased the television license fee and a telecommunication operator tax. Although maintaining the ban was positive for private broadcasters, the serious consideration to remove it raised investors’ concerns about potential regulatory risks.
During the year, the Fund held currency forwards and futures to hedge a significant portion of the currency risk of the portfolio’s non-U.S. dollar investments. The currency forwards had a positive impact on the Fund’s performance during the period, and currency futures had a negligible impact.
What is a currency forward contract?
A currency forward contract, or a currency forward, is an agreement between the Fund and a counterparty to buy or sell a foreign currency at a specific exchange rate on a future date.
What is a futures contract?
A futures contract, or a future, is an agreement between the Fund and a counterparty made through a U.S. or foreign futures exchange to buy or sell an underlying instrument or asset at a specific price on a future date.
As fellow shareholders, we found recent relative and absolute performance disappointing, but it is not uncommon for our strategy to lag the equity markets at times. We remain committed to our disciplined, value investment approach as we seek to generate attractive, long-term, risk-adjusted returns for shareholders. Thank you for your continued participation in Franklin Mutual European Fund. We look forward to continuing to serve your investment needs.

CFA® is a trademark owned by CFA Institute.
6 Annual Report
franklintempleton.com
FRANKLIN MUTUAL EUROPEAN FUND
The foregoing information reflects our analysis, opinions and portfolio holdings as of December 31, 2015, the end of the reporting period. The way we implement our main investment strategies and the resulting portfolio holdings may change depending on factors such as market and economic conditions. These opinions may not be relied upon as investment advice or an offer for a particular security. The information is not a complete analysis of every aspect of any market, country, industry, security or the Fund. Statements of fact are from sources considered reliable, but the investment manager makes no representation or warranty as to their completeness or accuracy. Although historical performance is no guarantee of future results, these insights may help you understand our investment management philosophy.
Philippe Brugere-Trelat has been co-portfolio manager for Franklin Mutual European Fund since 2010 and portfolio manager since 2005. He also has been portfolio manager for Franklin Mutual Global Discovery Fund since 2009. He has been a member of the management team of the Franklin Mutual Series Funds since 2004, when he rejoined Franklin Templeton Investments. Previously, he was president and portfolio manager of Eurovest. Between 1984 and 1994, Mr. Brugere-Trelat was employed at Heine Securities Corporation, the Fund’s former manager.
Katrina Dudley has been co-portfolio manager for Franklin Mutual European Fund since 2010 and was assistant portfolio manager since 2007. She follows industrial companies including transportation, manufacturers, machinery, electrical equipment and general industrial, as well as health care services companies. Prior to joining Franklin Templeton Investments in 2002, Ms. Dudley was an investment analyst at Federated Investors, Inc., responsible for the technology and health care sectors. From 1995 to 2001, Ms. Dudley was a senior manager in the corporate finance division of Ernst & Young LLP, where she specialized in valuation and litigation consulting.
franklintempleton.com
Annual Report 7
FRANKLIN MUTUAL EUROPEAN FUND
Performance Summary as of December 31, 2015
Your dividend income will vary depending on dividends or interest paid by securities in the Fund’s portfolio, adjusted for operating expenses of each class. Capital gain distributions are net profits realized from the sale of portfolio securities. The performance table and graphs do not reflect any taxes that a shareholder would pay on Fund dividends, capital gain distributions, if any, or any realized gains on the sale of Fund shares. Total return reflects reinvestment of the Fund’s dividends and capital gain distributions, if any, and any unrealized gains or losses.
| Net Asset Value | ||||||||
| Share Class (Symbol) | 12/31/15 | 12/31/14 | Change | |||||
| Z (MEURX) | $ | 19.48 | $ | 20.86 | -$ | 1.38 | ||
| A (TEMIX) | $ | 18.95 | $ | 20.33 | -$ | 1.38 | ||
| C (TEURX) | $ | 18.97 | $ | 20.37 | -$ | 1.40 | ||
| R (n/a) | $ | 18.62 | $ | 20.04 | -$ | 1.42 | ||
| R6 (FMEUX) | $ | 19.47 | $ | 20.85 | -$ | 1.38 | ||
| Distributions1 (1/1/15–12/31/15) | ||||||||
| Dividend | Short-Term | Long-Term | ||||||
| Share Class | Income | Capital Gain | Capital Gain | Total | ||||
| Z | $ | 0.4559 | $ | 0.0975 | $ | 0.9761 | $ | 1.5295 |
| A | $ | 0.4020 | $ | 0.0975 | $ | 0.9761 | $ | 1.4756 |
| C | $ | 0.2681 | $ | 0.0975 | $ | 0.9761 | $ | 1.3417 |
| R | $ | 0.3898 | $ | 0.0975 | $ | 0.9761 | $ | 1.4634 |
| R6 | $ | 0.4874 | $ | 0.0975 | $ | 0.9761 | $ | 1.5610 |
See page 12 for Performance Summary footnotes.
8 Annual Report
franklintempleton.com
FRANKLIN MUTUAL EUROPEAN FUND
PERFORMANCE SUMMARY
Performance as of 12/31/15
Cumulative total return excludes sales charges. Average annual total return and value of $10,000 investment include maximum sales charges. Class Z/R/R6: no sales charges; Class A: 5.75% maximum initial sales charge; Class C: 1% contingent deferred sales charge in first year only.
| Cumulative | Average Annual | Value of $10,000 | Total Annual | |||||
| Share Class | Total Return2 | Total Return3 | Investment4 | Operating Expenses5 | ||||
| Z | 1.04 | % | ||||||
| 1-Year | +0.82 | % | +0.82 | % | $ | 10,082 | ||
| 5-Year | +32.77 | % | +5.83 | % | $ | 13,277 | ||
| 10-Year | +78.64 | % | +5.97 | % | $ | 17,864 | ||
| A | 1.34 | % | ||||||
| 1-Year | +0.57 | % | -5.21 | % | $ | 9,479 | ||
| 5-Year | +30.87 | % | +4.29 | % | $ | 12,337 | ||
| 10-Year | +73.58 | % | +5.05 | % | $ | 16,360 | ||
| C | 2.04 | % | ||||||
| 1-Year | -0.16 | % | -1.09 | % | $ | 9,891 | ||
| 5-Year | +26.36 | % | +4.79 | % | $ | 12,636 | ||
| 10-Year | +61.83 | % | +4.93 | % | $ | 16,183 | ||
| R | 1.54 | % | ||||||
| 1-Year | +0.37 | % | +0.37 | % | $ | 10,037 | ||
| 5-Year | +29.57 | % | +5.32 | % | $ | 12,957 | ||
| Since Inception (10/30/09) | +45.88 | % | +6.31 | % | $ | 14,588 | ||
| R6 | 0.89 | % | ||||||
| 1-Year | +0.98 | % | +0.98 | % | $ | 10,098 | ||
| Since Inception (5/1/13) | +15.49 | % | +5.55 | % | $ | 11,549 |
Performance data represent past performance, which does not guarantee future results. Investment return and principal value will fluctuate, and you may have a gain or loss when you sell your shares. Current performance may differ from figures shown. For most recent month-end performance, go to franklintempleton.com or call (800) 342-5236.
See page 12 for Performance Summary footnotes.
franklintempleton.com
Annual Report 9
FRANKLIN MUTUAL EUROPEAN FUND
PERFORMANCE SUMMARY
Total Return Index Comparison for a Hypothetical $10,000 Investment
Total return represents the change in value of an investment over the periods shown. It includes any applicable maximum sales charge, Fund expenses, account fees and reinvested distributions. The unmanaged index is calculated in local currency and includes reinvested daily net dividends. It differs from the Fund in composition and does not pay management fees or expenses. One cannot invest directly in an index.
See page 12 for Performance Summary footnotes.
10 Annual Report
franklintempleton.com
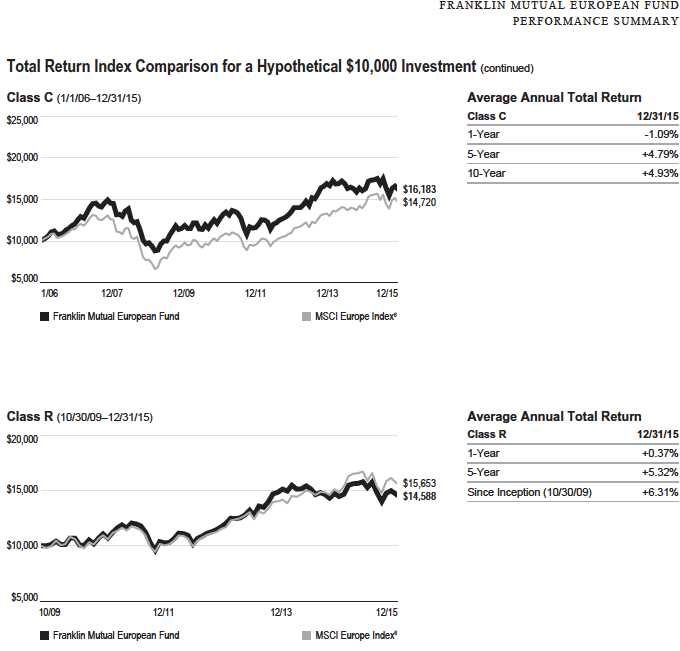
See page 12 for Performance Summary footnotes.
franklintempleton.com
Annual Report
11
FRANKLIN MUTUAL EUROPEAN FUND
PERFORMANCE SUMMARY
Total Return Index Comparison for a Hypothetical $10,000 Investment (continued)

All investments involve risks, including possible loss of principal. Value securities may not increase in price as anticipated or may decline further in value. Special risks are associated with foreign investing, including currency fluctuations, economic instability and political developments. Because the Fund invests its assets primarily in companies in a specific region, it is subject to greater risks of adverse developments in that region and/or the surrounding regions than a fund that is more broadly diversified geographically. Political, social or economic disruptions in the region, even in countries in which the Fund is not invested, may adversely affect the value of securities held by the Fund. The Fund’s investments in smaller company stocks carry an increased risk of price fluctuation, especially over the short term. The Fund’s investments in companies engaged in mergers, reorganizations or liquidations also involve special risks as pending deals may not be completed on time or on favorable terms. The Fund is actively managed but there is no guarantee that the manager’s investment decisions will produce the desired results. The Fund’s prospectus also includes a discussion of the main investment risks.
Class Z: Class C: Class R: Class R6: | Shares are available to certain eligible investors as described in the prospectus. These shares have higher annual fees and expenses than Class A shares. Shares are available to certain eligible investors as described in the prospectus. These shares have higher annual fees and expenses than Class A shares. Shares are available to certain eligible investors as described in the prospectus. |
1. The distribution amount is the sum of the dividend payments to shareholders for the period shown and includes only estimated tax-basis net investment income and
capital gain.
2. Cumulative total return represents the change in value of an investment over the periods indicated.
3. Average annual total return represents the average annual change in value of an investment over the periods indicated. Return for less than one year, if any, has not
been annualized.
4. These figures represent the value of a hypothetical $10,000 investment in the Fund over the periods indicated.
5. Figures are as stated in the Fund’s current prospectus. In periods of market volatility, assets may decline significantly, causing total annual Fund operating expenses to
become higher than the figures shown.
6. Source: Morningstar. The MSCI Europe Index is a market capitalization-weighted index designed to measure equity market performance of developed markets in Europe.
See www.franklintempletondatasources.com for additional data provider information.
12 Annual Report
franklintempleton.com
FRANKLIN MUTUAL EUROPEAN FUND
Your Fund’s Expenses
As a Fund shareholder, you can incur two types of costs:
- Transaction costs, including sales charges (loads) on Fund purchases; and
- Ongoing Fund costs, including management fees, distribution and service (12b-1) fees, and other Fund expenses. All mutual funds have ongoing costs, sometimes referred to as operating expenses.
The following table shows ongoing costs of investing in the Fund and can help you understand these costs and compare them with those of other mutual funds. The table assumes a $1,000 investment held for the six months indicated.
Actual Fund Expenses
The first line (Actual) for each share class listed in the table provides actual account values and expenses. The “Ending Account Value” is derived from the Fund’s actual return, which includes the effect of Fund expenses.
You can estimate the expenses you paid during the period by following these steps. Of course, your account value and expenses will differ from those in this illustration:
1. Divide your account value by $1,000.
If an account had an $8,600 value, then $8,600 ÷ $1,000 = 8.6.
2. Multiply the result by the number under the heading “Expenses Paid During Period.”
If Expenses Paid During Period were $7.50, then 8.6 × $7.50 = $64.50.
In this illustration, the estimated expenses paid this period are $64.50.
Hypothetical Example for Comparison with Other Funds
Information in the second line (Hypothetical) for each class in the table can help you compare ongoing costs of investing in the Fund with those of other mutual funds. This information may not be used to estimate the actual ending account balance or expenses you paid during the period. The hypothetical “Ending Account Value” is based on the actual expense ratio for each class and an assumed 5% annual rate of return before expenses, which does not represent the Fund’s actual return. The figure under the heading “Expenses Paid During Period” shows the hypothetical expenses your account would have incurred under this scenario. You can compare this figure with the 5% hypothetical examples that appear in shareholder reports of other funds.
Please note that expenses shown in the table are meant to highlight ongoing costs and do not reflect any transaction costs, such as sales charges. Therefore, the second line for each class is useful in comparing ongoing costs only, and will not help you compare total costs of owning different funds. In addition, if transaction costs were included, your total costs would have been higher. Please refer to the Fund prospectus for additional information on operating expenses.
franklintempleton.com
Annual Report
13
FRANKLIN MUTUAL EUROPEAN FUND
YOUR FUND’S EXPENSES
| Beginning Account | Ending Account | Expenses Paid During | ||||
| Share Class | Value 7/1/15 | Value 12/31/15 | Period* 7/1/15–12/31/15 | |||
| Z | ||||||
| Actual | $ | 1,000 | $ | 951.60 | $ | 5.17 |
| Hypothetical (5% return before expenses) | $ | 1,000 | $ | 1,019.91 | $ | 5.35 |
| A | ||||||
| Actual | $ | 1,000 | $ | 950.60 | $ | 6.44 |
| Hypothetical (5% return before expenses) | $ | 1,000 | $ | 1,018.60 | $ | 6.67 |
| C | ||||||
| Actual | $ | 1,000 | $ | 947.30 | $ | 10.06 |
| Hypothetical (5% return before expenses) | $ | 1,000 | $ | 1,014.87 | $ | 10.41 |
| R | ||||||
| Actual | $ | 1,000 | $ | 949.60 | $ | 7.62 |
| Hypothetical (5% return before expenses) | $ | 1,000 | $ | 1,017.39 | $ | 7.88 |
| R6 | ||||||
| Actual | $ | 1,000 | $ | 952.70 | $ | 4.38 |
| Hypothetical (5% return before expenses) | $ | 1,000 | $ | 1,020.72 | $ | 4.53 |
*Expenses are calculated using the most recent six-month expense ratio, annualized for each class (Z: 1.05%; A: 1.31%; C: 2.05%; R: 1.55%; and R6: 0.89%), multiplied by the average account value over the period, multiplied by 184/365 to reflect the one-half year period.
14 Annual Report
franklintempleton.com
FRANKLIN MUTUAL EUROPEAN FUND
| Financial Highlights | |||||||||||||||
| Year Ended December 31, | |||||||||||||||
| 2015 | 2014 | 2013 | 2012 | 2011 | |||||||||||
| Class Z | |||||||||||||||
| Per share operating performance | |||||||||||||||
| (for a share outstanding throughout the year) | |||||||||||||||
| Net asset value, beginning of year | $ | 20.86 | $ | 24.76 | $ | 21.13 | $ | 18.95 | $ | 21.47 | |||||
| Income from investment operationsa: | |||||||||||||||
| Net investment incomeb | 0.42 | 0.73 | c | 0.49 | 0.44 | 0.50 | |||||||||
| Net realized and unrealized gains (losses) | (0.27 | ) | (1.73 | ) | 5.12 | 2.89 | (2.25 | ) | |||||||
| Total from investment operations | 0.15 | (1.00 | ) | 5.61 | 3.33 | (1.75 | ) | ||||||||
| Less distributions from: | |||||||||||||||
| Net investment income | (0.46 | ) | (0.67 | ) | (0.46 | ) | (0.68 | ) | (0.77 | ) | |||||
| Net realized gains | (1.07 | ) | (2.23 | ) | (1.52 | ) | (0.47 | ) | — | ||||||
| Total distributions | (1.53 | ) | (2.90 | ) | (1.98 | ) | (1.15 | ) | (0.77 | ) | |||||
| Net asset value, end of year | $ | 19.48 | $ | 20.86 | $ | 24.76 | $ | 21.13 | $ | 18.95 | |||||
| Total return | 0.82 | % | (4.00 | )% | 26.68 | % | 17.73 | % | (8.01 | )% | |||||
| Ratios to average net assets | |||||||||||||||
| Expensesd | 1.05 | % | 1.04 | %e | 1.07 | %e | 1.13 | % | 1.11 | % | |||||
| Expenses incurred in connection with securities sold short | —%f | 0.01 | % | —%f | —% | —% | |||||||||
| Net investment income | 1.93 | % | 2.93 | %c | 2.04 | % | 2.16 | % | 2.43 | % | |||||
| Supplemental data | |||||||||||||||
| Net assets, end of year (000’s) | $ | 1,355,780 | $ | 1,128,769 | $ | 1,399,294 | $ | 1,101,659 | $ | 964,069 | |||||
| Portfolio turnover rate | 32.59 | % | 54.05 | % | 39.05 | % | 41.69 | % | 32.60 | % | |||||
aThe amount shown for a share outstanding throughout the period may not correlate with the Statement of Operations for the period due to the timing of sales and repurchases
of the Fund’s shares in relation to income earned and/or fluctuating fair value of the investments of the Fund.
bBased on average daily shares outstanding.
cNet investment income per share includes approximately $0.29 per share received in the form of a special dividend paid in connection with certain Fund’s holdings. Excluding
this amount, the ratio of net investment income to average net assets would have been 1.74%.
dIncludes dividend and/or interest expense on securities sold short and security borrowing fees, if any. See below for the ratios of such expenses to average net assets for the
periods presented. See Note 1(e).
eBenefit of expense reduction rounds to less than 0.01%.
fRounds to less than 0.01%.
franklintempleton.com
The accompanying notes are an integral part of these financial statements. | Annual Report 15
FRANKLIN MUTUAL EUROPEAN FUND
FINANCIAL H IGHLIGHTS
| Year Ended December 31, | |||||||||||||||
| 2015 | 2014 | 2013 | 2012 | 2011 | |||||||||||
| Class A | |||||||||||||||
| Per share operating performance | |||||||||||||||
| (for a share outstanding throughout the year) | |||||||||||||||
| Net asset value, beginning of year | $ | 20.33 | $ | 24.21 | $ | 20.71 | $ | 18.59 | $ | 21.06 | |||||
| Income from investment operationsa: | |||||||||||||||
| Net investment incomeb | 0.35 | 0.61 | c | 0.42 | 0.37 | 0.44 | |||||||||
| Net realized and unrealized gains (losses) | (0.26 | ) | (1.66 | ) | 4.99 | 2.84 | (2.20 | ) | |||||||
| Total from investment operations | 0.09 | (1.05 | ) | 5.41 | 3.21 | (1.76 | ) | ||||||||
| Less distributions from: | |||||||||||||||
| Net investment income | (0.40 | ) | (0.60 | ) | (0.39 | ) | (0.62 | ) | (0.71 | ) | |||||
| Net realized gains | (1.07 | ) | (2.23 | ) | (1.52 | ) | (0.47 | ) | — | ||||||
| Total distributions | (1.47 | ) | (2.83 | ) | (1.91 | ) | (1.09 | ) | (0.71 | ) | |||||
| Net asset value, end of year | $ | 18.95 | $ | 20.33 | $ | 24.21 | $ | 20.71 | $ | 18.59 | |||||
| Total returnd | 0.57 | % | (4.31 | )% | 26.30 | % | 17.37 | % | (8.27 | )% | |||||
| Ratios to average net assets | |||||||||||||||
| Expensese | 1.33 | % | 1.34 | %f | 1.37 | %f | 1.43 | % | 1.41 | % | |||||
| Expenses incurred in connection with securities sold short | —%g | 0.01 | % | —%g | —% | —% | |||||||||
| Net investment income | 1.65 | % | 2.63 | %c | 1.74 | % | 1.86 | % | 2.13 | % | |||||
| Supplemental data | |||||||||||||||
| Net assets, end of year (000’s) | $ | 1,033,307 | $ | 843,836 | $ | 839,655 | $ | 653,435 | $ | 593,825 | |||||
| Portfolio turnover rate | 32.59 | % | 54.05 | % | 39.05 | % | 41.69 | % | 32.60 | % | |||||
aThe amount shown for a share outstanding throughout the period may not correlate with the Statement of Operations for the period due to the timing of sales and repurchases
of the Fund’s shares in relation to income earned and/or fluctuating fair value of the investments of the Fund.
bBased on average daily shares outstanding.
cNet investment income per share includes approximately $0.29 per share received in the form of a special dividend paid in connection with certain Fund’s holdings. Excluding
this amount, the ratio of net investment income to average net assets would have been 1.44%.
dTotal return does not reflect sales commissions or contingent deferred sales charges, if applicable.
eIncludes dividend and/or interest expense on securities sold short and security borrowing fees, if any. See below for the ratios of such expenses to average net assets for the
periods presented. See Note 1(e).
fBenefit of expense reduction rounds to less than 0.01%.
gRounds to less than 0.01%.
16 Annual Report | The accompanying notes are an integral part of these financial statements.
franklintempleton.com
FRANKLIN MUTUAL EUROPEAN FUND
FINANCIAL H IGHLIGHTS
| Year Ended December 31, | |||||||||||||||
| 2015 | 2014 | 2013 | 2012 | 2011 | |||||||||||
| Class C | |||||||||||||||
| Per share operating performance | |||||||||||||||
| (for a share outstanding throughout the year) | |||||||||||||||
| Net asset value, beginning of year | $ | 20.37 | $ | 24.25 | $ | 20.79 | $ | 18.66 | $ | 21.10 | |||||
| Income from investment operationsa: | |||||||||||||||
| Net investment incomeb | 0.19 | 0.43 | c | 0.24 | 0.24 | 0.31 | |||||||||
| Net realized and unrealized gains (losses) | (0.25 | ) | (1.64 | ) | 5.02 | 2.83 | (2.20 | ) | |||||||
| Total from investment operations | (0.06 | ) | (1.21 | ) | 5.26 | 3.07 | (1.89 | ) | |||||||
| Less distributions from: | |||||||||||||||
| Net investment income | (0.27 | ) | (0.44 | ) | (0.28 | ) | (0.47 | ) | (0.55 | ) | |||||
| Net realized gains | (1.07 | ) | (2.23 | ) | (1.52 | ) | (0.47 | ) | — | ||||||
| Total distributions | (1.34 | ) | (2.67 | ) | (1.80 | ) | (0.94 | ) | (0.55 | ) | |||||
| Net asset value, end of year | $ | 18.97 | $ | 20.37 | $ | 24.25 | $ | 20.79 | $ | 18.66 | |||||
| Total returnd | (0.16 | )% | (4.97 | )% | 25.44 | % | 16.54 | % | (8.90 | )% | |||||
| Ratios to average net assets | |||||||||||||||
| Expensese | 2.05 | % | 2.04 | %f | 2.07 | %f | 2.13 | % | 2.11 | % | |||||
| Expenses incurred in connection with securities sold short | —%g | 0.01 | % | —%g | —% | —% | |||||||||
| Net investment income | 0.93 | % | 1.93 | %c | 1.04 | % | 1.16 | % | 1.43 | % | |||||
| Supplemental data | |||||||||||||||
| Net assets, end of year (000’s) | $ | 291,752 | $ | 216,258 | $ | 198,491 | $ | 122,438 | $ | 127,012 | |||||
| Portfolio turnover rate | 32.59 | % | 54.05 | % | 39.05 | % | 41.69 | % | 32.60 | % | |||||
aThe amount shown for a share outstanding throughout the period may not correlate with the Statement of Operations for the period due to the timing of sales and repurchases
of the Fund’s shares in relation to income earned and/or fluctuating fair value of the investments of the Fund.
bBased on average daily shares outstanding.
cNet investment income per share includes approximately $0.29 per share received in the form of a special dividend paid in connection with certain Fund’s holdings. Excluding
this amount, the ratio of net investment income to average net assets would have been 0.74%.
dTotal return does not reflect sales commissions or contingent deferred sales charges, if applicable.
eIncludes dividend and/or interest expense on securities sold short and security borrowing fees, if any. See below for the ratios of such expenses to average net assets for the
periods presented. See Note 1(e).
fBenefit of expense reduction rounds to less than 0.01%.
gRounds to less than 0.01%.
franklintempleton.com
The accompanying notes are an integral part of these financial statements. | Annual Report 17
FRANKLIN MUTUAL EUROPEAN FUND
FINANCIAL H IGHLIGHTS
| Year Ended December 31, | |||||||||||||||
| 2015 | 2014 | 2013 | 2012 | 2011 | |||||||||||
| Class R | |||||||||||||||
| Per share operating performance | |||||||||||||||
| (for a share outstanding throughout the year) | |||||||||||||||
| Net asset value, beginning of year | $ | 20.04 | $ | 23.95 | $ | 20.55 | $ | 18.47 | $ | 21.00 | |||||
| Income from investment operationsa: | |||||||||||||||
| Net investment incomeb | 0.27 | 0.41 | c | 0.31 | 0.33 | 0.16 | |||||||||
| Net realized and unrealized gains (losses) | (0.23 | ) | (1.49 | ) | 5.02 | 2.81 | (1.97 | ) | |||||||
| Total from investment operations | 0.04 | (1.08 | ) | 5.33 | 3.14 | (1.81 | ) | ||||||||
| Less distributions from: | |||||||||||||||
| Net investment income | (0.39 | ) | (0.60 | ) | (0.41 | ) | (0.59 | ) | (0.72 | ) | |||||
| Net realized gains | (1.07 | ) | (2.23 | ) | (1.52 | ) | (0.47 | ) | — | ||||||
| Total distributions | (1.46 | ) | (2.83 | ) | (1.93 | ) | (1.06 | ) | (0.72 | ) | |||||
| Net asset value, end of year | $ | 18.62 | $ | 20.04 | $ | 23.95 | $ | 20.55 | $ | 18.47 | |||||
| Total return | 0.37 | % | (4.52 | )% | 26.05 | % | 17.16 | % | (8.45 | )% | |||||
| Ratios to average net assets | |||||||||||||||
| Expensesd | 1.55 | % | 1.54 | %e | 1.57 | %e | 1.63 | % | 1.61 | % | |||||
| Expenses incurred in connection with securities sold short | —%f | 0.01 | % | —%f | —% | —% | |||||||||
| Net investment income | 1.43 | % | 2.43 | %c | 1.54 | % | 1.66 | % | 1.93 | % | |||||
| Supplemental data | |||||||||||||||
| Net assets, end of year (000’s) | $ | 997 | $ | 421 | $ | 133 | $ | 46 | $ | 31 | |||||
| Portfolio turnover rate | 32.59 | % | 54.05 | % | 39.05 | % | 41.69 | % | 32.60 | % | |||||
aThe amount shown for a share outstanding throughout the period may not correlate with the Statement of Operations for the period due to the timing of sales and repurchases
of the Fund’s shares in relation to income earned and/or fluctuating fair value of the investments of the Fund.
bBased on average daily shares outstanding.
cNet investment income per share includes approximately $0.29 per share received in the form of a special dividend paid in connection with certain Fund’s holdings. Excluding
this amount, the ratio of net investment income to average net assets would have been 1.24%.
dIncludes dividend and/or interest expense on securities sold short and security borrowing fees, if any. See below for the ratios of such expenses to average net assets for the
periods presented. See Note 1(e).
eBenefit of expense reduction rounds to less than 0.01%.
fRounds to less than 0.01%.
18 Annual Report | The accompanying notes are an integral part of these financial statements.
franklintempleton.com
FRANKLIN MUTUAL EUROPEAN FUND
FINANCIAL H IGHLIGHTS
| Year Ended December 31, | |||||||||
| 2015 | 2014 | 2013 | a | ||||||
| Class R6 | |||||||||
| Per share operating performance | |||||||||
| (for a share outstanding throughout the year) | |||||||||
| Net asset value, beginning of year | $ | 20.85 | $ | 24.75 | $ | 22.54 | |||
| Income from investment operationsb: | |||||||||
| Net investment incomec | 0.46 | 0.75 | d | 0.28 | |||||
| Net realized and unrealized gains (losses) | (0.28 | ) | (1.71 | ) | 3.95 | ||||
| Total from investment operations | 0.18 | (0.96 | ) | 4.23 | |||||
| Less distributions from: | |||||||||
| Net investment income | (0.49 | ) | (0.71 | ) | (0.50 | ) | |||
| Net realized gains | (1.07 | ) | (2.23 | ) | (1.52 | ) | |||
| Total distributions | (1.56 | ) | (2.94 | ) | (2.02 | ) | |||
| Net asset value, end of year | $ | 19.47 | $ | 20.85 | $ | 24.75 | |||
| Total returne | 0.98 | % | (3.88 | )% | 18.99 | % | |||
| Ratios to average net assetsf | |||||||||
| Expensesg | 0.89 | % | 0.89 | %h | 0.90 | %h | |||
| Expenses incurred in connection with securities sold short | —%i | 0.01 | % | —%i | |||||
| Net investment income | 2.09 | % | 3.08 | %d | 2.21 | % | |||
| Supplemental data | |||||||||
| Net assets, end of year (000’s) | $ | 373,904 | $ | 334,396 | $ | 317,690 | |||
| Portfolio turnover rate | 32.59 | % | 54.05 | % | 39.05 | % | |||
aFor the period May 1, 2013 (effective date) to December 31, 2013.
bThe amount shown for a share outstanding throughout the period may not correlate with the Statement of Operations for the period due to the timing of sales and repurchases
of the Fund’s shares in relation to income earned and/or fluctuating fair value of the investments of the Fund.
cBased on average daily shares outstanding.
dNet investment income per share includes approximately $0.29 per share received in the form of a special dividend paid in connection with certain Fund’s holdings. Excluding
this amount, the ratio of net investment income to average net assets would have been 1.89%.
eTotal return is not annualized for periods less than one year.
fRatios are annualized for periods less than one year.
gIncludes dividend and/or interest expense on securities sold short and security borrowing fees, if any. See below for the ratios of such expenses to average net assets for the
periods presented. See Note 1(e).
hBenefit of expense reduction rounds to less than 0.01%.
iRounds to less than 0.01%.
franklintempleton.com
The accompanying notes are an integral part of these financial statements. | Annual Report 19
| FRANKLIN MUTUAL EUROPEAN FUND | ||||
| Statement of Investments, December 31, 2015 | ||||
| Country | Shares | Value | ||
| Common Stocks 91.3% | ||||
| Air Freight & Logistics 2.0% | ||||
| Deutsche Post AG | Germany | 2,182,340 | $ | 61,528,061 |
| Auto Components 1.6% | ||||
| Cie Generale des Etablissements Michelin, B | France | 515,350 | 49,206,326 | |
| Banks 11.5% | ||||
| Barclays PLC | United Kingdom | 14,226,562 | 45,901,665 | |
| BNP Paribas SA | France | 1,059,470 | 60,108,858 | |
| aCommerzbank AG | Germany | 3,869,928 | 40,237,905 | |
| HSBC Holdings PLC | United Kingdom | 5,156,850 | 40,756,233 | |
| aRoyal Bank of Scotland Group PLC | United Kingdom | 9,206,016 | 40,979,004 | |
| Societe Generale SA | France | 1,426,820 | 65,978,528 | |
| UniCredit SpA | Italy | 10,178,557 | 56,774,909 | |
| 350,737,102 | ||||
| Beverages 0.6% | ||||
| SABMiller PLC | United Kingdom | 287,320 | 17,234,141 | |
| Capital Markets 1.7% | ||||
| UBS Group AG | Switzerland | 2,716,984 | 52,929,668 | |
| Chemicals 2.2% | ||||
| Arkema SA | France | 864,355 | 60,643,913 | |
| a,bCovestro AG, 144A | Germany | 184,155 | 6,728,291 | |
| 67,372,204 | ||||
| Commercial Services & Supplies 1.1% | ||||
| G4S PLC | United Kingdom | 10,283,548 | 34,180,016 | |
| Communications Equipment 2.5% | ||||
| Nokia Corp., ADR | Finland | 5,416,684 | 38,025,122 | |
| Nokia OYJ, A | Finland | 5,254,934 | 37,645,394 | |
| 75,670,516 | ||||
| Construction & Engineering 2.9% | ||||
| aBalfour Beatty PLC | United Kingdom | 12,287,260 | 48,935,398 | |
| FLSmidth & Co. AS | Denmark | 1,157,049 | 40,429,164 | |
| 89,364,562 | ||||
| Construction Materials 1.8% | ||||
| aLafargeHolcim Ltd., B | Switzerland | 1,069,771 | 53,702,077 | |
| Diversified Financial Services 0.1% | ||||
| Oslo Bors VPS Holding ASA | Norway | 340,000 | 3,364,395 | |
| Diversified Telecommunication Services 7.4% | ||||
| Deutsche Telekom AG | Germany | 4,071,986 | 73,823,120 | |
| aEuskaltel SA | Spain | 3,553,732 | 44,701,595 | |
| Hellenic Telecommunications Organization SA | Greece | 3,354,681 | 33,670,765 | |
| Koninklijke KPN NV | Netherlands | 19,594,565 | 74,325,809 | |
| 226,521,289 | ||||
| Electric Utilities 2.4% | ||||
| Enel SpA | Italy | 17,391,006 | 73,523,694 | |
| Energy Equipment & Services 0.2% | ||||
| a,cDeepOcean Group Holding BV | Netherlands | 915,467 | 5,492,802 | |
| Food & Staples Retailing 2.4% | ||||
| Metro AG | Germany | 2,253,361 | 72,354,407 | |
20 Annual Report
franklintempleton.com
FRANKLIN MUTUAL EUROPEAN FUND
STATEMENT O F INVESTMENTS
| Country | Shares | Value | ||
| Common Stocks (continued) | ||||
| Hotels, Restaurants & Leisure 2.4% | ||||
| Accor SA | France | 1,660,611 | $ | 72,162,566 |
| Industrial Conglomerates 2.3% | ||||
| Koninklijke Philips NV | Netherlands | 2,795,546 | 71,543,752 | |
| Insurance 18.3% | ||||
| Ageas | Belgium | 1,719,689 | 79,950,920 | |
| Assicurazioni Generali SpA | Italy | 3,652,907 | 67,138,055 | |
| Direct Line Insurance Group PLC | United Kingdom | 13,726,245 | 82,444,576 | |
| Lancashire Holdings Ltd | United Kingdom | 3,635,463 | 33,651,320 | |
| NN Group NV | Netherlands | 2,620,354 | 92,649,002 | |
| RSA Insurance Group PLC | United Kingdom | 10,023,189 | 63,009,740 | |
| aStorebrand ASA | Norway | 7,001,292 | 27,672,308 | |
| UNIQA Insurance Group AG | Austria | 5,362,759 | 43,835,359 | |
| XL Group PLC | Ireland | 1,794,560 | 70,310,861 | |
| 560,662,141 | ||||
| Machinery 1.5% | ||||
| CNH Industrial NV | United Kingdom | 2,999,447 | 20,656,667 | |
| CNH Industrial NV, special voting | United Kingdom | 833,461 | 5,739,900 | |
| aVossloh AG | Germany | 293,290 | 18,962,254 | |
| 45,358,821 | ||||
| Marine 1.9% | ||||
| A.P. Moeller-Maersk AS, B | Denmark | 43,810 | 57,245,254 | |
| Media 4.7% | ||||
| aLiberty Global PLC, C | United Kingdom | 1,678,216 | 68,420,866 | |
| Relx PLC | United Kingdom | 2,683,818 | 47,351,086 | |
| Societe Television Francaise 1 | France | 2,437,601 | 27,140,402 | |
| 142,912,354 | ||||
| Metals & Mining 2.8% | ||||
| ThyssenKrupp AG | Germany | 2,356,505 | 46,945,879 | |
| Voestalpine AG | Austria | 1,260,959 | 38,824,620 | |
| 85,770,499 | ||||
| Oil, Gas & Consumable Fuels 5.0% | ||||
| BG Group PLC | United Kingdom | 3,385,143 | 49,146,883 | |
| BP PLC | United Kingdom | 8,930,241 | 46,596,057 | |
| aCairn Energy PLC | United Kingdom | 12,858,240 | 29,887,938 | |
| Royal Dutch Shell PLC, A | United Kingdom | 1,215,969 | 27,863,253 | |
| 153,494,131 | ||||
| Pharmaceuticals 4.0% | ||||
| GlaxoSmithKline PLC | United Kingdom | 2,372,367 | 48,010,380 | |
| Novartis AG | Switzerland | 846,994 | 73,372,334 | |
| 121,382,714 | ||||
| Road & Rail 0.7% | ||||
| d,eEuro Wagon LP | Jersey Islands | 16,127,149 | 20,683,866 | |
| Specialty Retail 3.7% | ||||
| aDufry AG | Switzerland | 345,245 | 41,346,707 | |
| Hornbach Holding AG & Co. KGaA | Germany | 144,613 | 9,621,509 | |
| Kingfisher PLC | United Kingdom | 12,840,634 | 62,362,658 | |
| 113,330,874 |
franklintempleton.com
Annual Report
21
FRANKLIN MUTUAL EUROPEAN FUND
STATEMENT O F INVESTMENTS
| Country | Shares | Value | |||
| Common Stocks (continued) | |||||
| Technology Hardware, Storage & Peripherals 0.3% | |||||
| Wincor Nixdorf AG | Germany | 191,959 | $ | 9,669,905 | |
| Trading Companies & Distributors 0.9% | |||||
| Kloeckner & Co. SE | Germany | 3,031,653 | 26,493,255 | ||
| Wireless Telecommunication Services 2.4% | |||||
| Vodafone Group PLC | United Kingdom | 23,038,468 | 75,046,181 | ||
| Total Common Stocks (Cost $2,917,741,670) | 2,788,937,573 | ||||
| Preferred Stocks 2.6% | |||||
| Auto Components 0.6% | |||||
| aSchaeffler AG, pfd | Germany | 992,820 | 17,524,824 | ||
| Automobiles 2.0% | |||||
| Volkswagen AG, pfd | Germany | 422,568 | 61,393,188 | ||
| Total Preferred Stocks (Cost $81,060,425) | 78,918,012 | ||||
| Total Investments before Short Term Investments | |||||
| (Cost $2,998,802,095) | 2,867,855,585 | ||||
| Principal | |||||
| Amount | |||||
| Short Term Investments (Cost $112,732,463) 3.6% | |||||
| U.S. Government and Agency Securities 3.6% | |||||
| fU.S. Treasury Bill, 1/21/16 - 5/26/16 | United States | $ | 112,800,000 | 112,732,160 | |
| Total Investments (Cost $3,111,534,558) 97.5% | 2,980,587,745 | ||||
| Other Assets, less Liabilities 2.5% | 75,153,074 | ||||
| Net Assets 100.0% | $ | 3,055,740,819 | |||
aNon-income producing.
bSecurity was purchased pursuant to Rule 144A under the Securities Act of 1933 and may be sold in transactions exempt from registration only to qualified institutional buyers
or in a public offering registered under the Securities Act of 1933. This security has been deemed liquid under guidelines approved by the Trust’s Board of Trustees. At
December 31, 2015, the value of this security was $6,728,291, representing 0.22% of net assets.
cSecurity has been deemed illiquid because it may not be able to be sold within seven days.
dSee Note 9 regarding restricted securities.
eSee Note 11 regarding holdings of 5% voting securities.
fThe security is traded on a discount basis with no stated coupon rate.
22 Annual Report
franklintempleton.com
FRANKLIN MUTUAL EUROPEAN FUND
STATEMENT O F INVESTMENTS
| At December 31, 2015, the Fund had the following futures contracts outstanding. See Note 1(c). | |||||||||||
| Futures Contracts | |||||||||||
| Number of | Notional Expiration | Unrealized | Unrealized | ||||||||
| Description | Type | Contracts | Value | Date | Appreciation | Depreciation | |||||
| Currency Contracts | |||||||||||
| CHF/USD | Short | 82 | $ | 10,282,800 | 3/14/16 | $ | 134,240 | $ | — | ||
| EUR/USD | Short | 3,635 | 494,632,625 | 3/14/16 | 246,914 | — | |||||
| GBP/USD | Short | 2,019 | 185,924,663 | 3/14/16 | 4,793,678 | — | |||||
| Total Futures Contracts | $ | 5,174,832 | $ | — | |||||||
| Net unrealized appreciation (depreciation) | $ | 5,174,832 | |||||||||
| At December 31, 2015, the Fund had the following forward exchange contracts outstanding. See Note 1(c). | |||||||||||
| Forward Exchange Contracts | |||||||||||
| Contract | Settlement | Unrealized | Unrealized | ||||||||
| Currency | Counterpartya Type | Quantity | Amount | Date | Appreciation | Depreciation | |||||
| OTC Forward Exchange Contracts | |||||||||||
| Euro | BANT | Buy | 5,876,994 | $ | 6,483,423 | 1/06/16 | $ | — | $ | (98,571 | ) |
| Euro | BANT | Sell | 26,033,059 | 28,891,489 | 1/06/16 | 608,791 | — | ||||
| Euro | BONY | Buy | 5,335,051 | 5,885,627 | 1/06/16 | — | (89,549 | ) | |||
| Euro | BONY | Sell | 57,780,776 | 63,197,724 | 1/06/16 | 423,840 | — | ||||
| Euro | DBFX | Buy | 7,055,348 | 7,784,772 | 1/06/16 | — | (119,739 | ) | |||
| Euro | DBFX | Sell | 169,226 | 188,018 | 1/06/16 | 4,168 | — | ||||
| Euro | FBCO | Buy | 5,876,995 | 6,486,533 | 1/06/16 | — | (101,680 | ) | |||
| Euro | HSBC | Buy | 4,698,743 | 5,171,892 | 1/06/16 | — | (67,109 | ) | |||
| Euro | SSBT | Buy | 4,698,744 | 5,171,837 | 1/06/16 | — | (67,053 | ) | |||
| Euro | SSBT | Sell | 60,091,123 | 65,822,977 | 1/06/16 | 539,099 | — | ||||
| Euro | BANT | Buy | 7,202,045 | 7,869,094 | 1/20/16 | — | (41,917 | ) | |||
| Euro | BANT | Sell | 30,347,232 | 33,907,218 | 1/20/16 | 925,871 | — | ||||
| Euro | BBU | Sell | 1,148,740 | 1,257,307 | 1/20/16 | 8,858 | — | ||||
| Euro | BONY | Buy | 1,816,848 | 1,980,575 | 1/20/16 | — | (6,026 | ) | |||
| Euro | BONY | Sell | 648,104 | 709,427 | 1/20/16 | 5,068 | — | ||||
| Euro | DBFX | Buy | 13,529,254 | 14,799,713 | 1/20/16 | 644 | (96,775 | ) | |||
| Euro | DBFX | Sell | 1,013,367 | 1,132,706 | 1/20/16 | 31,380 | — | ||||
| Euro | FBCO | Buy | 7,202,027 | 7,867,002 | 1/20/16 | — | (39,846 | ) | |||
| Euro | FBCO | Sell | 61,594,587 | 67,481,988 | 1/20/16 | 541,043 | — | ||||
| Euro | HSBC | Buy | 8,080,671 | 8,831,255 | 1/20/16 | — | (49,188 | ) | |||
| Euro | HSBC | Sell | 54,084,611 | 59,220,009 | 1/20/16 | 440,898 | — | ||||
| Euro | SSBT | Buy | 11,817,318 | 12,959,827 | 1/20/16 | — | (116,776 | ) | |||
| Euro | SSBT | Sell | 14,004,389 | 15,824,143 | 1/20/16 | 604,185 | — | ||||
| British Pound | BANT | Buy | 47,283 | 71,519 | 1/21/16 | — | (1,822 | ) | |||
| British Pound | BANT | Sell | 40,869,005 | 63,774,702 | 1/21/16 | 3,532,405 | — | ||||
| British Pound | BONY | Sell | 289,599 | 445,408 | 1/21/16 | 18,529 | — | ||||
| British Pound | DBFX | Buy | 853,627 | 1,316,190 | 1/21/16 | — | (57,915 | ) | |||
| British Pound | FBCO | Buy | 5,236,132 | 8,254,574 | 1/21/16 | — | (536,338 | ) | |||
| British Pound | FBCO | Sell | 401,261 | 615,608 | 1/21/16 | 24,136 | — | ||||
| British Pound | SSBT | Buy | 7,893 | 11,931 | 1/21/16 | — | (296 | ) | |||
| British Pound | SSBT | Sell | 38,795,630 | 60,513,618 | 1/21/16 | 3,327,545 | — | ||||
| British Pound | BANT | Buy | 4,517,102 | 6,982,641 | 2/19/16 | — | (324,026 | ) | |||
| British Pound | BANT | Sell | 21,822,065 | 33,261,498 | 2/19/16 | 1,093,813 | — | ||||
| British Pound | BBU | Buy | 2,982,901 | 4,591,474 | 2/19/16 | — | (194,410 | ) | |||
| British Pound | BBU | Sell | 581,708 | 882,783 | 2/19/16 | 25,293 | — | ||||
| British Pound | DBFX | Buy | 1,221,418 | 1,849,246 | 2/19/16 | — | (48,767 | ) | |||
| British Pound | DBFX | Sell | 43,239,809 | 67,353,049 | 2/19/16 | 3,613,685 | — | ||||
| British Pound | FBCO | Buy | 13,815,174 | 21,419,570 | 2/19/16 | — | (1,054,762 | ) | |||
| British Pound | FBCO | Sell | 47,341,151 | 73,723,153 | 2/19/16 | 3,938,044 | — | ||||
| British Pound | HSBC | Buy | 9,892,123 | 15,517,048 | 2/19/16 | — | (935,170 | ) | |||
| British Pound | SSBT | Buy | 9,178,274 | 14,285,099 | 2/19/16 | — | (755,498 | ) | |||
| British Pound | SSBT | Sell | 631,728 | 954,086 | 2/19/16 | 22,863 | — | ||||
| Euro | BANT | Sell | 80,475,441 | 90,837,553 | 2/22/16 | 3,302,919 | — | ||||
franklintempleton.com
Annual Report
23
FRANKLIN MUTUAL EUROPEAN FUND
STATEMENT O F INVESTMENTS
| Forward Exchange Contracts (continued) | |||||||||||
| Contract | Settlement | Unrealized | Unrealized | ||||||||
| Currency | Counterpartya Type | Quantity | Amount | Date | Appreciation | Depreciation | |||||
| OTC Forward Exchange Contracts (continued) | |||||||||||
| Euro | BBU | Sell | 748,207 | $ | 844,469 | 2/22/16 | $ | 30,630 | $ | — | |
| Euro | BONY | Sell | 1,046,116 | 1,186,306 | 2/22/16 | 48,426 | — | ||||
| Euro | DBFX | Sell | 11,745,953 | 13,229,386 | 2/22/16 | 453,094 | — | ||||
| Euro | FBCO | Sell | 11,029,062 | 12,469,947 | 2/22/16 | 473,431 | — | ||||
| Euro | HSBC | Sell | 89,793,352 | 101,266,872 | 2/22/16 | 3,596,972 | — | ||||
| Euro | SSBT | Sell | 14,250,329 | 16,093,405 | 2/22/16 | 593,057 | — | ||||
| Euro | DBFX | Sell | 58,077,148 | 66,517,500 | 4/01/16 | 3,278,091 | — | ||||
| Euro | FBCO | Sell | 2,516,754 | 2,713,773 | 4/01/16 | — | (26,686 | ) | |||
| Euro | SSBT | Sell | 58,077,147 | 66,516,918 | 4/01/16 | 3,277,510 | — | ||||
| Euro | BANT | Sell | 53,468,539 | 61,293,330 | 4/18/16 | 3,039,745 | — | ||||
| Euro | BONY | Sell | 2,241,505 | 2,486,165 | 4/18/16 | 44,062 | — | ||||
| Euro | DBFX | Sell | 5,866,807 | 6,514,193 | 4/18/16 | 122,349 | — | ||||
| Euro | FBCO | Sell | 4,483,009 | 4,967,062 | 4/18/16 | 82,856 | — | ||||
| Euro | HSBC | Sell | 59,976,164 | 68,474,138 | 4/18/16 | 3,130,542 | — | ||||
| Euro | SSBT | Sell | 10,571,891 | 11,707,038 | 4/18/16 | 189,039 | — | ||||
| British Pound | BANT | Sell | 40,407,815 | 62,310,777 | 4/22/16 | 2,736,272 | — | ||||
| British Pound | DBFX | Sell | 1,492,421 | 2,222,491 | 4/22/16 | 22,168 | — | ||||
| British Pound | HSBC | Sell | 29,019,928 | 44,827,082 | 4/22/16 | 2,042,095 | — | ||||
| Euro | BANT | Sell | 32,082,052 | 34,965,526 | 5/04/16 | 9,908 | (15,876 | ) | |||
| Euro | FBCO | Sell | 2,975,904 | 3,214,572 | 5/04/16 | — | (29,354 | ) | |||
| Euro | HSBC | Sell | 1,098,664 | 1,165,430 | 5/04/16 | — | (32,184 | ) | |||
| Euro | SSBT | Sell | 126,956,194 | 136,563,506 | 5/04/16 | 9,275 | (1,836,165 | ) | |||
| Swiss Franc | BANT | Buy | 2,169,035 | 2,186,134 | 5/12/16 | 6,614 | (14,687 | ) | |||
| Swiss Franc | BANT | Sell | 20,733,077 | 20,786,602 | 5/12/16 | — | (32,751 | ) | |||
| Swiss Franc | BONY | Buy | 3,829,668 | 3,821,002 | 5/12/16 | 32,124 | (7,521 | ) | |||
| Swiss Franc | DBFX | Buy | 1,212,720 | 1,203,333 | 5/12/16 | 14,433 | — | ||||
| Swiss Franc | FBCO | Buy | 2,085,436 | 2,085,967 | 5/12/16 | 24,332 | (16,185 | ) | |||
| Swiss Franc | HSBC | Buy | 2,476,005 | 2,456,873 | 5/12/16 | 38,017 | (8,582 | ) | |||
| Swiss Franc | HSBC | Sell | 589,400 | 595,400 | 5/12/16 | 3,547 | — | ||||
| Swiss Franc | SSBT | Buy | 4,206,908 | 4,217,347 | 5/12/16 | 14,767 | (7,699 | ) | |||
| Euro | BANT | Sell | 72,599,673 | 77,938,103 | 5/18/16 | — | (1,236,531 | ) | |||
| Euro | DBFX | Sell | 21,395,850 | 22,796,951 | 5/18/16 | — | (536,605 | ) | |||
| Euro | FBCO | Sell | 85,848,047 | 92,034,387 | 5/18/16 | — | (1,588,454 | ) | |||
| Euro | HSBC | Sell | 6,773,164 | 7,222,707 | 5/18/16 | — | (163,865 | ) | |||
| Euro | SSBT | Sell | 3,408,770 | 3,633,241 | 5/18/16 | — | (84,243 | ) | |||
| British Pound | BANT | Sell | 954,252 | 1,415,585 | 5/23/16 | 8,487 | — | ||||
| British Pound | BONY | Sell | 1,807,204 | 2,700,649 | 5/23/16 | 35,827 | — | ||||
| British Pound | FBCO | Sell | 39,438,882 | 60,421,945 | 5/23/16 | 2,267,117 | — | ||||
| British Pound | HSBC | Sell | 25,268,893 | 38,674,546 | 5/23/16 | 1,414,157 | — | ||||
| Norwegian Krone | BANT | Sell | 250,556,871 | 29,072,319 | 5/23/16 | 756,649 | — | ||||
| Norwegian Krone | BONY | Buy | 689,513 | 79,672 | 5/23/16 | — | (1,750 | ) | |||
| Norwegian Krone | DBFX | Buy | 8,395,150 | 970,829 | 5/23/16 | — | (22,086 | ) | |||
| Norwegian Krone | DBFX | Sell | 8,904,520 | 1,033,519 | 5/23/16 | 27,211 | — | ||||
| Norwegian Krone | SSBT | Sell | 20,928,442 | 2,401,966 | 5/23/16 | 36,823 | — | ||||
| Total Forward Exchange Contracts | $ | 50,892,704 | $ | (10,464,457 | ) | ||||||
| Net unrealized appreciation (depreciation) | $ | 40,428,247 | |||||||||
aMay be comprised of multiple contracts with the same counterparty, currency and settlement date.
See Abbreviations on page 41.
24 Annual Report | The accompanying notes are an integral part of these financial statements.
franklintempleton.com
FRANKLIN MUTUAL EUROPEAN FUND
| Financial Statements | |||
| Statement of Assets and Liabilities | |||
| December 31, 2015 | |||
| Assets: | |||
| Investments in securities: | |||
| Cost - Unaffiliated issuers | $ | 3,105,252,049 | |
| Cost - Controlled affiliates (Note 11) | 6,282,509 | ||
| Total cost of investments | $ | 3,111,534,558 | |
| Value - Unaffiliated issuers | $ | 2,959,903,879 | |
| Value - Controlled affiliates (Note 11) | 20,683,866 | ||
| Total value of investments | 2,980,587,745 | ||
| Cash | 2,179,882 | ||
| Restricted Cash (Note 1d) | 5,770,000 | ||
| Foreign currency, at value (cost and $4,956,918) | 4,922,230 | ||
| Receivables: | |||
| Investment securities sold | 1,926,780 | ||
| Capital shares sold | 17,488,546 | ||
| Dividends | 5,650,848 | ||
| Due from brokers | 17,877,295 | ||
| Variation margin | 4,001,163 | ||
| Unrealized appreciation on OTC forward exchange contracts | 50,892,704 | ||
| Other assets | 2,595,834 | ||
| Total assets | 3,093,893,027 | ||
| Liabilities: | |||
| Payables: | |||
| Investment securities purchased | 4,231 | ||
| Capital shares redeemed | 15,555,405 | ||
| Management fees | 2,230,477 | ||
| Distribution fees | 943,439 | ||
| Transfer agent fees | 679,086 | ||
| Trustees’ fees and expenses | 96,374 | ||
| Due to brokers | 7,910,000 | ||
| Unrealized depreciation on OTC forward exchange contracts | 10,464,457 | ||
| Accrued expenses and other liabilities | 268,739 | ||
| Total liabilities | 38,152,208 | ||
| Net assets, at value | $ | 3,055,740,819 | |
| Net assets consist of: | |||
| Paid-in capital | $ | 3,160,884,775 | |
| Undistributed net investment income | 1,503,610 | ||
| Net unrealized appreciation (depreciation) | (85,750,525 | ) | |
| Accumulated net realized gain (loss) | (20,897,041 | ) | |
| Net assets, at value | $ | 3,055,740,819 | |
franklintempleton.com
The accompanying notes are an integral part of these financial statements. | Annual Report 25
FRANKLIN MUTUAL EUROPEAN FUND
FINANCIAL STATEMENTS
| Statement of Assets and Liabilities (continued) | ||
| December 31, 2015 | ||
| Class Z: | ||
| Net assets, at value | $ | 1,355,780,265 |
| Shares outstanding | 69,589,685 | |
| Net asset value and maximum offering price per share | $ | 19.48 |
| Class A: | ||
| Net assets, at value | $ | 1,033,307,318 |
| Shares outstanding | 54,538,999 | |
| Net asset value per sharea | $ | 18.95 |
| Maximum offering price per share (net asset value per share ÷ 94.25%) | $ | 20.11 |
| Class C: | ||
| Net assets, at value | $ | 291,751,742 |
| Shares outstanding | 15,375,627 | |
| Net asset value and maximum offering price per sharea | $ | 18.97 |
| Class R: | ||
| Net assets, at value | $ | 997,164 |
| Shares outstanding | 53,559 | |
| Net asset value and maximum offering price per share | $ | 18.62 |
| Class R6: | ||
| Net assets, at value | $ | 373,904,330 |
| Shares outstanding | 19,205,396 | |
| Net asset value and maximum offering price per share | $ | 19.47 |
aRedemption price is equal to net asset value less contingent deferred sales charges, if applicable.
26 Annual Report | The accompanying notes are an integral part of these financial statements.
franklintempleton.com
FRANKLIN MUTUAL EUROPEAN FUND
FINANCIAL STATEMENTS
| Statement of Operations | |||
| for the year ended December 31, 2015 | |||
| Investment income: | |||
| Dividends: (net of foreign taxes of $8,150,465) | |||
| Unaffiliated issuers | $ | 87,042,573 | |
| Controlled affiliates (Note 11) | 2,733,151 | ||
| Interest | 357,273 | ||
| Other Income (Note 1f) | 2,721,387 | ||
| Total investment income | 92,854,384 | ||
| Expenses: | |||
| Management fees (Note 3a) | 26,405,032 | ||
| Distribution fees: (Note 3c) | |||
| Class A | 2,898,013 | ||
| Class C | 2,819,629 | ||
| Class R | 3,795 | ||
| Transfer agent fees: (Note 3e) | |||
| Class Z | 2,203,402 | ||
| Class A | 1,631,388 | ||
| Class C | 441,451 | ||
| Class R | 1,189 | ||
| Class R6 | 2,496 | ||
| Custodian fees (Note 4) | 380,161 | ||
| Reports to shareholders | 134,040 | ||
| Registration and filing fees | 178,239 | ||
| Professional fees | 219,443 | ||
| Trustees’ fees and expenses | 84,363 | ||
| Dividends and/or interest on securities sold short | 44,451 | ||
| Other | 245,685 | ||
| Total expenses | 37,692,777 | ||
| Net investment income | 55,161,607 | ||
| Realized and unrealized gains (losses): | |||
| Net realized gain (loss) from: | |||
| Investments | (13,490,596 | ) | |
| Foreign currency transactions | 164,046,357 | ||
| Futures contracts | 50,565,858 | ||
| Securities sold short | 82,534 | ||
| Net realized gain (loss) | 201,204,153 | ||
| Net change in unrealized appreciation (depreciation) on: | |||
| Investments | (226,564,731 | ) | |
| Translation of other assets and liabilities denominated in foreign currencies | (63,385,119 | ) | |
| Futures contracts | (3,431,977 | ) | |
| Net change in unrealized appreciation (depreciation) | (293,381,827 | ) | |
| Net realized and unrealized gain (loss) | (92,177,674 | ) | |
| Net increase (decrease) in net assets resulting from operations | $ | (37,016,067 | ) |
franklintempleton.com
The accompanying notes are an integral part of these financial statements. | Annual Report 27
| Statements of Changes in Net Assets | ||||||
| Year Ended December 31, | ||||||
| 2015 | 2014 | |||||
| Increase (decrease) in net assets: | ||||||
| Operations: | ||||||
| Net investment income | $ | 55,161,607 | $ | 80,865,875 | ||
| Net realized gain (loss) | 201,204,153 | 170,420,243 | ||||
| Net change in unrealized appreciation (depreciation) | (293,381,827 | ) | (384,541,282 | ) | ||
| Net increase (decrease) in net assets resulting from operations | (37,016,067 | ) | (133,255,164 | ) | ||
| Distributions to shareholders from: | ||||||
| Net investment income: | ||||||
| Class Z | (31,114,277 | ) | (33,590,853 | ) | ||
| Class A | (21,144,357 | ) | (22,317,956 | ) | ||
| Class C | (3,964,425 | ) | (4,219,670 | ) | ||
| Class R | (19,419 | ) | (11,161 | ) | ||
| Class R6 | (8,882,402 | ) | (10,013,981 | ) | ||
| Net realized gains: | ||||||
| Class Z | (73,683,072 | ) | (111,120,702 | ) | ||
| Class A | (56,764,217 | ) | (82,617,039 | ) | ||
| Class C | (15,827,677 | ) | (21,329,977 | ) | ||
| Class R | (50,917 | ) | (41,595 | ) | ||
| Class R6 | (19,461,990 | ) | (31,288,445 | ) | ||
| Total distributions to shareholders | (230,912,753 | ) | (316,551,379 | ) | ||
| Capital share transactions: (Note 2) | ||||||
| Class Z | 346,269,841 | (63,822,544 | ) | |||
| Class A | 283,078,189 | 153,553,663 | ||||
| Class C | 102,973,077 | 55,952,304 | ||||
| Class R | 682,210 | 356,413 | ||||
| Class R6 | 66,985,459 | 72,186,056 | ||||
| Total capital share transactions | 799,988,776 | 218,225,892 | ||||
| Net increase (decrease) in net assets | 532,059,956 | (231,580,651 | ) | |||
| Net assets: | ||||||
| Beginning of year | 2,523,680,863 | 2,755,261,514 | ||||
| End of year | $ | 3,055,740,819 | $ | 2,523,680,863 | ||
| Undistributed net investment income included in net assets: | ||||||
| End of year | $ | 1,503,610 | $ | 1,915,950 | ||
28 Annual Report | The accompanying notes are an integral part of these financial statements.
franklintempleton.com
FRANKLIN MUTUAL EUROPEAN FUND
FINANCIAL STATEMENTS
FRANKLIN MUTUAL EUROPEAN FUND
Notes to Financial Statements
1. Organization and Significant Accounting Policies
Franklin Mutual Series Funds (Trust) is registered under the Investment Company Act of 1940 (1940 Act) as an open-end management investment company, consisting of seven separate funds and applies the specialized accounting and reporting guidance in U.S. Generally Accepted Accounting Principles (U.S. GAAP). Franklin Mutual European Fund (Fund) is included in this report. The financial statements of the remaining funds in the Trust are presented separately. The Fund offers five classes of shares: Class Z, Class A, Class C, Class R and Class R6. Each class of shares differs by its initial sales load, contingent deferred sales charges, voting rights on matters affecting a single class, its exchange privilege and fees primarily due to differing arrangements for distribution and transfer agent fees.
The following summarizes the Fund’s significant accounting policies.
a. Financial Instrument Valuation
The Fund’s investments in financial instruments are carried at fair value daily. Fair value is the price that would be received to sell an asset or paid to transfer a liability in an orderly transaction between market participants on the measurement date. The Fund calculates the net asset value (NAV) per share as of 4 p.m. Eastern time each day the New York Stock Exchange (NYSE) is open for trading. Under compliance policies and procedures approved by the Trust’s Board of Trustees (the Board), the Fund’s administrator has responsibility for oversight of valuation, including leading the cross-functional Valuation and Liquidity Oversight Committee (VLOC). The VLOC provides administration and oversight of the Fund’s valuation policies and procedures, which are approved annually by the Board. Among other things, these procedures allow the Fund to utilize independent pricing services, quotations from securities and financial instrument dealers, and other market sources to determine fair value.
Equity securities and derivative financial instruments (derivatives) listed on an exchange or on the NASDAQ National Market System are valued at the last quoted sale price or the official closing price of the day, respectively. Foreign equity securities are valued as of the close of trading on the foreign stock exchange on which the security is primarily traded or as of 4 p.m. Eastern time, whichever is earlier. The value is then converted into its U.S. dollar equivalent at the foreign exchange rate in effect at 4 p.m. Eastern time on the day that the value of the security is determined. Over-the-counter (OTC) securities are valued within the range of the most recent quoted bid and ask prices. Securities that trade in multiple markets or on multiple exchanges are valued according to the broadest and most representative market. Certain equity securities are valued based upon fundamental characteristics or relationships to similar securities.
Debt securities generally trade in the OTC market rather than on a securities exchange. The Fund’s pricing services use multiple valuation techniques to determine fair value. In instances where sufficient market activity exists, the pricing services may utilize a market-based approach through which quotes from market makers are used to determine fair value. In instances where sufficient market activity may not exist or is limited, the pricing services also utilize proprietary valuation models which may consider market characteristics such as benchmark yield curves, credit spreads, estimated default rates, anticipated market interest rate volatility, coupon rates, anticipated timing of principal repayments, underlying collateral, and other unique security features in order to estimate the relevant cash flows, which are then discounted to calculate the fair value. Securities denominated in a foreign currency are converted into their U.S. dollar equivalent at the foreign exchange rate in effect at 4 p.m. Eastern time on the date that the values of the foreign debt securities are determined.
Certain derivatives trade in the OTC market. The Fund’s pricing services use various techniques including industry standard option pricing models and proprietary discounted cash flow models to determine the fair value of those instruments. The Fund’s net benefit or obligation under the derivative contract, as measured by the fair value of the contract, is included in net assets.
The Fund has procedures to determine the fair value of financial instruments for which market prices are not reliable or readily available. Under these procedures, the VLOC convenes on a regular basis to review such financial instruments and considers a number of factors, including significant unobservable valuation inputs, when arriving at fair value. The VLOC primarily employs a market-based approach which may use related or comparable assets or liabilities, recent transactions, market multiples, book values, and other relevant information for the investment to determine the fair value of the investment. An income-based valuation approach may also be used in which the anticipated future cash flows of the investment are discounted
franklintempleton.com
Annual Report
29
FRANKLIN MUTUAL EUROPEAN FUND
NOTES TO FINANCIAL STATEMENTS
1. Organization and Significant Accounting
Policies (continued)
a. Financial Instrument Valuation (continued)
to calculate fair value. Discounts may also be applied due to the nature or duration of any restrictions on the disposition of the investments. Due to the inherent uncertainty of valuations of such investments, the fair values may differ significantly from the values that would have been used had an active market existed. The VLOC employs various methods for calibrating these valuation approaches including a regular review of key inputs and assumptions, transactional back-testing or disposition analysis, and reviews of any related market activity.
Trading in securities on foreign securities stock exchanges and OTC markets may be completed before 4 p.m. Eastern time. In addition, trading in certain foreign markets may not take place on every NYSE business day. Occasionally, events occur between the time at which trading in a foreign security is completed and the close of the NYSE that might call into question the reliability of the value of a portfolio security held by the Fund. As a result, differences may arise between the value of the Fund’s portfolio securities as determined at the foreign market close and the latest indications of value at the close of the NYSE. In order to minimize the potential for these differences, the VLOC monitors price movements following the close of trading in foreign stock markets through a series of country specific market proxies (such as baskets of American Depositary Receipts, futures contracts and exchange traded funds). These price movements are measured against established trigger thresholds for each specific market proxy to assist in determining if an event has occurred that may call into question the reliability of the values of the foreign securities held by the Fund. If such an event occurs, the securities may be valued using fair value procedures, which may include the use of independent pricing services.
When the last day of the reporting period is a non-business day, certain foreign markets may be open on those days that the NYSE is closed, which could result in differences between the value of the Fund’s portfolio securities on the last business day and the last calendar day of the reporting period. Any significant security valuation changes due to an open foreign market are adjusted and reflected by the Fund for financial reporting purposes.
b. Foreign Currency Translation
Portfolio securities and other assets and liabilities denominated in foreign currencies are translated into U.S. dollars based on the exchange rate of such currencies against U.S. dollars on the date of valuation. The Fund may enter into foreign currency exchange contracts to facilitate transactions denominated in a foreign currency. Purchases and sales of securities, income and expense items denominated in foreign currencies are translated into U.S. dollars at the exchange rate in effect on the transaction date. Portfolio securities and assets and liabilities denominated in foreign currencies contain risks that those currencies will decline in value relative to the U.S. dollar. Occasionally, events may impact the availability or reliability of foreign exchange rates used to convert the U.S. dollar equivalent value. If such an event occurs, the foreign exchange rate will be valued at fair value using procedures established and approved by the Board.
The Fund does not separately report the effect of changes in foreign exchange rates from changes in market prices on securities held. Such changes are included in net realized and unrealized gain or loss from investments in the Statement of Operations.
Realized foreign exchange gains or losses arise from sales of foreign currencies, currency gains or losses realized between the trade and settlement dates on securities transactions and the difference between the recorded amounts of dividends, interest, and foreign withholding taxes and the U.S. dollar equivalent of the amounts actually received or paid. Net unrealized foreign exchange gains and losses arise from changes in foreign exchange rates on foreign denominated assets and liabilities other than investments in securities held at the end of the reporting period.
c. Derivative Financial Instruments
The Fund invested in derivatives in order to manage risk or gain exposure to various other investments or markets. Derivatives are financial contracts based on an underlying or notional amount, require no initial investment or an initial net investment that is smaller than would normally be required to have a similar response to changes in market factors, and require or permit net settlement. Derivatives contain various risks including the potential inability of the counterparty to fulfill their obligations under the terms of the contract, the potential for an illiquid secondary market, and/or the potential for market movements which expose the Fund to gains or losses in excess of the amounts shown in the Statement of Assets and Liabilities. Realized gain and loss and
30 Annual Report
franklintempleton.com
FRANKLIN MUTUAL EUROPEAN FUND
NOTES TO FINANCIAL STATEMENTS
unrealized appreciation and depreciation on these contracts for the period are included in the Statement of Operations.
Derivative counterparty credit risk is managed through a formal evaluation of the creditworthiness of all potential counter-parties. The Fund attempts to reduce its exposure to counterparty credit risk on OTC derivatives, whenever possible, by entering into International Swaps and Derivatives Association (ISDA) master agreements with certain counterparties. These agreements contain various provisions, including but not limited to collateral requirements, events of default, or early termination. Termination events applicable to the counterparty include certain deteriorations in the credit quality of the counterparty. Termination events applicable to the Fund include failure of the Fund to maintain certain net asset levels and/or limit the decline in net assets over various periods of time. In the event of default or early termination, the ISDA master agreement gives the non-defaulting party the right to net and close-out all transactions traded, whether or not arising under the ISDA agreement, to one net amount payable by one counterparty to the other. However, absent an event of default or early termination, OTC derivative assets and liabilities are presented gross and not offset in the Statement of Assets and Liabilities. Early termination by the counterparty may result in an immediate payment by the Fund of any net liability owed to that counterparty under the ISDA agreement.
Collateral requirements differ by type of derivative. Collateral or initial margin requirements are set by the broker or exchange clearing house for exchange traded and centrally cleared derivatives. Initial margin deposited is held at the exchange and can be in the form of cash and/or securities. For OTC derivatives traded under an ISDA master agreement, posting of collateral is required by either the Fund or the applicable counterparty if the total net exposure of all OTC derivatives with the applicable counterparty exceeds the minimum transfer amount, which typically ranges from $100,000 to $250,000, and can vary depending on the counterparty and the type of the agreement. Generally, collateral is determined at the close of Fund business each day and any additional collateral required due to changes in derivative values may be delivered by the Fund or the counter-party within a few business days. Collateral pledged and/or received by the Fund for OTC derivatives, if any, is held in segregated accounts with the Fund’s custodian/counterparty broker and can be in the form of cash and/or securities. Unrestricted cash may be invested according to the Fund’s investment objectives. To the extent that the amounts due to the Fund from its counterparties are not subject to collateralization or are not fully collateralized, the Fund bears the risk of loss from counterparty non-performance.
The Fund entered into exchange traded financial futures contracts primarily to manage exposure to certain foreign currencies. A futures contract is an agreement between the Fund and a counterparty to buy or sell an asset for a specified price on a future date. Required initial margins are pledged by the Fund, and the daily change in fair value is accounted for as a variation margin payable or receivable in the Statement of Assets and Liabilities.
The Fund entered into OTC forward exchange contracts primarily to manage exposure to certain foreign currencies. A forward exchange contract is an agreement between the Fund and a counterparty to buy or sell a foreign currency at a specific exchange rate on a future date.
See Note 10 regarding other derivative information.
d. Restricted Cash
At December 31, 2015, the Fund held restricted cash in connection with investments in certain derivative securities. Restricted cash is held in a segregated account with the Fund’s custodian/counterparty broker and is reflected in the Statement of Assets and Liabilities.
e. Securities Sold Short
The Fund is engaged in selling securities short, which obligates the Fund to replace a borrowed security with the same security at current fair value. The Fund incurs a loss if the price of the security increases between the date of the short sale and the date on which the Fund replaces the borrowed security. The Fund realizes a gain if the price of the security declines between those dates. Gains are limited to the price at which the Fund sold the security short, while losses are potentially unlimited in size.
The Fund is required to establish a margin account with the broker lending the security sold short. While the short sale is outstanding, the broker retains the proceeds of the short sale to the extent necessary to meet margin requirements until the short position is closed out. A deposit must also be maintained with the Fund’s custodian/counterparty broker consisting of cash and/ or securities having a value equal to a specified percentage of the value of the securities sold short. The Fund is obligated to pay fees for borrowing the securities sold short and is required to pay the counterparty any dividends and/or interest due on securities sold short. Such dividends and/or interest and any security
franklintempleton.com
Annual Report
31
FRANKLIN MUTUAL EUROPEAN FUND
NOTES TO FINANCIAL STATEMENTS
1. Organization and Significant Accounting
Policies (continued)
e. Securities Sold Short (continued)
borrowing fees are recorded as an expense to the Fund. At December 31, 2015, the Fund had no securities sold short.
f. Income and Deferred Taxes
It is the Fund’s policy to qualify as a regulated investment company under the Internal Revenue Code. The Fund intends to distribute to shareholders substantially all of its taxable income and net realized gains to relieve it from federal income and excise taxes. As a result, no provision for U.S. federal income taxes is required.
The Fund may be subject to foreign taxation related to income received, capital gains on the sale of securities and certain foreign currency transactions in the foreign jurisdictions in which it invests. Foreign taxes, if any, are recorded based on the tax regulations and rates that exist in the foreign markets in which the Fund invests. When a capital gain tax is determined to apply, the Fund records an estimated deferred tax liability in an amount that would be payable if the securities were disposed of on the valuation date. As a result of several court cases, in certain countries across the European Union, the Fund has filed additional tax reclaims for previously withheld taxes on dividends earned in those countries. These additional filings are subject to various administrative proceedings by the local jurisdictions’ tax authorities within the European Union, as well as a number of related judicial proceedings. During the year ended December 31, 2015, the Fund recognized $2,748,147 from Finland and Sweden for previously withheld foreign taxes and interest on such taxes. These amounts are reflected as other income and interest in the Statement of Operations. In regards to filings in other European Union countries, uncertainty exists as to the ultimate resolution of these proceedings, the likelihood of receipt of these reclaims, and the potential timing of payment, and accordingly, no amounts are reflected in the financial statements.
The Fund may recognize an income tax liability related to its uncertain tax positions under U.S. GAAP when the uncertain tax position has a less than 50% probability that it will be sustained upon examination by the tax authorities based on its technical merits. As of December 31, 2015, the Fund has determined that no tax liability is required in its financial statements related to uncertain tax positions for any open tax years (or expected to be taken on future tax returns). Open tax years are those that remain subject to examination and are based on each tax jurisdiction’s statute of limitation.
g. Security Transactions, Investment Income, Expenses and Distributions
Security transactions are accounted for on trade date. Realized gains and losses on security transactions are determined on a specific identification basis. Interest income and estimated expenses are accrued daily. Amortization of premium and accretion of discount on debt securities are included in interest income. Dividend income and dividends declared on securities sold short are recorded on the ex-dividend date except for certain dividends from foreign securities where the dividend rate is not available. In such cases, the dividend is recorded as soon as the information is received by the Fund. Distributions to shareholders are recorded on the ex-dividend date and are determined according to income tax regulations (tax basis). Distributable earnings determined on a tax basis may differ from earnings recorded in accordance with U.S. GAAP. These differences may be permanent or temporary. Permanent differences are reclassified among capital accounts to reflect their tax character. These reclassifications have no impact on net assets or the results of operations. Temporary differences are not reclassified, as they may reverse in subsequent periods.
Common expenses incurred by the Trust are allocated among the funds based on the ratio of net assets of each fund to the combined net assets of the Trust. Fund specific expenses are charged directly to the fund that incurred the expense.
Realized and unrealized gains and losses and net investment income, not including class specific expenses, are allocated daily to each class of shares based upon the relative proportion of net assets of each class. Differences in per share distributions, by class, are generally due to differences in class specific expenses.
h. Accounting Estimates
The preparation of financial statements in accordance with U.S. GAAP requires management to make estimates and assumptions that affect the reported amounts of assets and liabilities at the date of the financial statements and the amounts of income and expenses during the reporting period. Actual results could differ from those estimates.
32 Annual Report
franklintempleton.com
FRANKLIN MUTUAL EUROPEAN FUND
NOTES TO FINANCIAL STATEMENTS
i. Guarantees and Indemnifications
Under the Trust’s organizational documents, its officers and trustees are indemnified by the Trust against certain liabilities arising out of the performance of their duties to the Trust. Additionally, in the normal course of business, the Trust, on behalf
of the Fund, enters into contracts with service providers that contain general indemnification clauses. The Trust’s maximum exposure under these arrangements is unknown as this would involve future claims that may be made against the Trust that have not yet occurred. Currently, the Trust expects the risk of loss to be remote.
2. Shares of Beneficial Interest
At December 31, 2015, there were an unlimited number of shares authorized (without par value). Transactions in the Fund’s shares were as follows:
| Year Ended December 31, | ||||||||||||
| 2015 | 2014 | |||||||||||
| Shares | Amount | Shares | Amount | |||||||||
| Class Z Shares: | ||||||||||||
| Shares sold | 31,157,604 | $ | 682,962,755 | 19,112,824 | $ | 467,220,561 | ||||||
| Shares issued in reinvestment of distributions | 4,845,079 | 94,687,945 | 6,540,426 | 135,963,256 | ||||||||
| Shares redeemed | (20,523,943 | ) | (431,380,859 | ) | (28,053,784 | ) | (667,006,361 | ) | ||||
| Net increase (decrease) | 15,478,740 | $ | 346,269,841 | (2,400,534 | ) | $ | (63,822,544 | ) | ||||
| Class A Shares: | ||||||||||||
| Shares sold | 24,404,654 | $ | 524,110,675 | 16,444,913 | $ | 390,643,608 | ||||||
| Shares issued in reinvestment of distributions | 3,489,444 | 66,343,462 | 4,183,197 | 84,743,971 | ||||||||
| Shares redeemed | (14,862,145 | ) | (307,375,948 | ) | (13,806,874 | ) | (321,833,916 | ) | ||||
| Net increase (decrease) | 13,031,953 | $ | 283,078,189 | 6,821,236 | $ | 153,553,663 | ||||||
| Class C Shares: | ||||||||||||
| Shares sold | 6,548,213 | $ | 141,414,212 | 3,504,884 | $ | 83,819,205 | ||||||
| Shares issued in reinvestment of distributions | 960,581 | 18,300,147 | 1,147,068 | 23,294,092 | ||||||||
| Shares redeemed | (2,750,303 | ) | (56,741,282 | ) | (2,221,185 | ) | (51,160,993 | ) | ||||
| Net increase (decrease) | 4,758,491 | $ | 102,973,077 | 2,430,767 | $ | 55,952,304 | ||||||
| Class R Shares: | ||||||||||||
| Shares sold | 36,230 | $ | 764,990 | 15,696 | $ | 370,698 | ||||||
| Shares issued in reinvestment of distributions | 3,771 | 70,336 | 2,643 | 52,756 | ||||||||
| Shares redeemed | (7,477 | ) | (153,116 | ) | (2,847 | ) | (67,041 | ) | ||||
| Net increase (decrease) | 32,524 | $ | 682,210 | 15,492 | $ | 356,413 | ||||||
| Class R6 Shares: | ||||||||||||
| Shares sold | 3,899,003 | $ | 85,801,878 | 4,003,505 | $ | 98,368,915 | ||||||
| Shares issued in reinvestment of distributions | 1,283,929 | 25,056,065 | 1,728,585 | 35,897,725 | ||||||||
| Shares redeemed | (2,018,882 | ) | (43,872,484 | ) | (2,525,555 | ) | (62,080,584 | ) | ||||
| Net increase (decrease) | 3,164,050 | $ | 66,985,459 | 3,206,535 | $ | 72,186,056 | ||||||
franklintempleton.com
Annual Report
33
FRANKLIN MUTUAL EUROPEAN FUND
NOTES TO FINANCIAL STATEMENTS
3. Transactions with Affiliates
Franklin Resources, Inc. is the holding company for various subsidiaries that together are referred to as Franklin Templeton Investments. Certain officers and trustees of the Fund are also officers and/or directors of the following subsidiaries:
| Subsidiary | Affiliation |
| Franklin Mutual Advisers, LLC (Franklin Mutual) | Investment manager |
| Franklin Templeton Services, LLC (FT Services) | Administrative manager |
| Franklin Templeton Distributors, Inc. (Distributors) | Principal underwriter |
| Franklin Templeton Investor Services, LLC (Investor Services) | Transfer agent |
a. Management Fees
The Fund pays an investment management fee to Franklin Mutual based on the average daily net assets of the Fund as follows:
| Annualized Fee Rate | Net Assets | |
| 0.875 | % | Up to and including $1 billion |
| 0.845 | % | Over $1 billion, up to and including $2 billion |
| 0.825 | % | Over $2 billion, up to and including $5 billion |
| 0.805 | % | In excess of $5 billion |
b. Administrative Fees
Under an agreement with Franklin Mutual, FT Services provides administrative services to the Fund. The fee is paid by Franklin Mutual based on the Fund’s average daily net assets, and is not an additional expense of the Fund.
c. Distribution Fees
The Board has adopted distribution plans for each share class, with the exception of Class Z and Class R6 shares, pursuant to Rule 12b-1 under the 1940 Act. Under the Fund’s Class A reimbursement distribution plan, the Fund reimburses Distributors for costs incurred in connection with the servicing, sale and distribution of the Fund’s shares up to the maximum annual plan rate. Under the Class A reimbursement distribution plan, costs exceeding the maximum for the current plan year cannot be reimbursed in subsequent periods. In addition, under the Fund’s Class C and R compensation distribution plans, the Fund pays Distributors for costs incurred in connection with the servicing, sale and distribution of the Fund’s shares up to the maximum annual plan rate for each class. The plan year, for purposes of monitoring compliance with the maximum annual plan rates, is February 1 through January 31 for each fund.
The maximum annual plan rates, based on the average daily net assets, for each class, are as follows:
| Class A | 0.35 | % |
| Class C | 1.00 | % |
| Class R | 0.50 | % |
Effective August 1, 2015, the Board has set the current rate at 0.25% per year for Class A shares until further notice and approval by the Board. Prior to August 1, 2015, the Board had set the rate at 0.30% per year for Class A shares.
d. Sales Charges/Underwriting Agreements
Front-end sales charges and contingent deferred sales charges (CDSC) do not represent expenses of the Fund. These charges are deducted from the proceeds of sales of Fund shares prior to investment or from redemption proceeds prior to remittance, as applicable. Distributors has advised the Fund of the following commission transactions related to the sales and redemptions of the Fund’s shares for the year:
| Sales charges retained net of commissions paid to unaffiliated broker/dealers | $ | 606,099 |
| CDSC retained | $ | 74,228 |
34 Annual Report
franklintempleton.com
FRANKLIN MUTUAL EUROPEAN FUND
NOTES TO FINANCIAL STATEMENTS
e. Transfer Agent Fees
Each class of shares, except for Class R6, pays transfer agent fees to Investor Services for its performance of shareholder servicing obligations and reimburses Investor Services for out of pocket expenses incurred, including shareholding servicing fees paid to third parties. These fees are allocated daily based upon their relative proportion of such classes’ aggregate net assets. Class R6 pays Investor Services transfer agent fees specific to that class.
For the year ended December 31, 2015, the Fund paid transfer agent fees of $4,279,926, of which $2,022,142 was retained by Investor Services.
f. Waiver and Expense Reimbursements
Investor Services has contractually agreed in advance to waive or limit its fees so that the Class R6 transfer agent fees do not exceed 0.01% until April 30, 2016. There were no Class R6 transfer agent fees waived during the year ended December 31, 2015.
g. Other Affiliated Transactions
At December 31, 2015, one or more of the funds in Franklin Fund Allocator Series owned 8.79% of the Fund’s outstanding shares.
4. Expense Offset Arrangement
The Fund has entered into an arrangement with its custodian whereby credits realized as a result of uninvested cash balances are used to reduce a portion of the Fund’s custodian expenses. During the year ended December 31, 2015, there were no credits earned.
5. Independent Trustees’ Retirement Plan
On January 1, 1993, the Trust adopted an Independent Trustees’ Retirement Plan (Plan). The Plan is an unfunded defined benefit plan that provides benefit payments to Trustees whose length of service and retirement age meets the eligibility requirements of the Plan. Benefits under the Plan are based on years of service and fees paid to each trustee at the time of retirement. Effective in December 1996, the Plan was closed to new participants.
During the year ended December 31, 2015, the Fund’s projected benefit obligation and benefit payments under the Plan were as follows:
| aProjected benefit obligation at December 31, 2015 | $ | 96,374 | |
| bIncrease in projected benefit obligation | $ | 9,274 | |
| Benefit payments made to retired trustees | $ | (2,726 | ) |
aThe projected benefit obligation is included in trustees’ fees and expenses in the Statement of Assets and Liabilities. bThe increase in projected benefit obligation is included in trustees’ fees and expenses in the Statement of Operations.
6. Income Taxes
The tax character of distributions paid during the years ended December 31, 2015 and 2014, was as follows:
| 2015 | 2014 | |||
| Distributions paid from: | ||||
| Ordinary income | $ | 80,260,634 | $ | 70,154,145 |
| Long term capital gain | 150,652,119 | 246,397,234 | ||
| $ | 230,912,753 | $ | 316,551,379 |
franklintempleton.com
Annual Report
35
FRANKLIN MUTUAL EUROPEAN FUND
NOTES TO FINANCIAL STATEMENTS
6. Income Taxes (continued)
At December 31, 2015, the cost of investments, net unrealized appreciation (depreciation), undistributed ordinary income and undistributed long term capital gains for income tax purposes were as follows:
| Cost of investments | $ | 3,125,879,799 | |
| Unrealized appreciation | $ | 194,879,577 | |
| Unrealized depreciation | (340,171,631 | ) | |
| Net unrealized appreciation (depreciation) | $ | (145,292,054 | ) |
| Undistributed ordinary income | $ | 1,451,226 | |
| Undistributed long term capital gains | 36,725,841 | ||
| Distributable earnings | $ | 38,177,067 |
Differences between income and/or capital gains as determined on a book basis and a tax basis are primarily due to differing treatments of foreign currency transactions.
7. Investment Transactions
Purchases and sales of investments (excluding short term securities and securities sold short) for the year ended December 31, 2015, aggregated $1,710,977,832 and $881,581,395, respectively.
8. Concentration of Risk
Investing in foreign securities may include certain risks and considerations not typically associated with investing in U.S. securities, such as fluctuating currency values and changing local and regional economic, political and social conditions, which may result in greater market volatility. In addition, certain foreign securities may not be as liquid as U.S. securities.
9. Restricted Securities
The Fund invests in securities that are restricted under the Securities Act of 1933 (1933 Act) or which are subject to legal, contractual, or other agreed upon restrictions on resale. Restricted securities are often purchased in private placement transactions, and cannot be sold without prior registration unless the sale is pursuant to an exemption under the 1933 Act. Disposal of these securities may require greater effort and expense, and prompt sale at an acceptable price may be difficult. The Fund may have registration rights for restricted securities. The issuer generally incurs all registration costs.
At December 31, 2015, the Fund held investments in restricted securities, excluding certain securities exempt from registration under the 1933 Act deemed to be liquid, as follows:
| Shares | Issuer | Acquisition Dates | Cost | Value | ||
| 16,127,149 | Euro Wagon LP (Value is 0.67% of Net Assets) | 12/08/05 - 1/02/08 | $ | 6,282,509 | $ | 20,683,866 |
36 Annual Report
franklintempleton.com
FRANKLIN MUTUAL EUROPEAN FUND
NOTES TO FINANCIAL STATEMENTS
| 10. Other Derivative Information | ||||||||||||
| At December 31, 2015, the Fund’s investments in derivative contracts are reflected in the Statement of Assets and Liabilities | ||||||||||||
| as follows: | ||||||||||||
| Asset Derivatives | Liability Derivatives | |||||||||||
| Derivative Contracts | ||||||||||||
| Not Accounted for as | Statement of Assets and | Statement of Assets and | ||||||||||
| Hedging Instruments | Liabilities Location | Fair Value | Liabilities Location | Fair Value | ||||||||
| Foreign exchange contracts | Variation margin | $ | 5,174,832a Variation margin | $ | — | |||||||
| Unrealized appreciation on | 50,892,704 | Unrealized depreciation on | 10,464,457 | |||||||||
| OTC forward exchange | OTC forward exchange | |||||||||||
| contracts | contracts | |||||||||||
| Totals | $ | 56,067,536 | $ | 10,464,457 | ||||||||
| aThis amount reflects the cumulative appreciation (depreciation) of futures contracts as reported in the Statement of Investments. Only the variation margin receivable/payable | ||||||||||||
| at period end is separately reported within the Statement of Assets and Liabilities. Prior variation margin movements were recorded to cash upon receipt or payment. | ||||||||||||
| For the year ended December 31, 2015, the effect of derivative contracts in the Fund’s Statement of Operations was as follows: | ||||||||||||
| Net Change in | ||||||||||||
| Unrealized | ||||||||||||
| Derivative Contracts | Net Realized | Appreciation | ||||||||||
| Not Accounted for as | Statement of Operations | Gain (Loss) | Statement of Operations | (Depreciation) | ||||||||
| Hedging Instruments | Locations | for the Year | Locations | for the Year | ||||||||
| Net realized gain (loss) from: | Net change in unrealized | |||||||||||
| appreciation (depreciation) on: | ||||||||||||
| Foreign exchange contracts | Foreign currency transactions | $ | 166,093,431 | a | Translation of other assets | $ | (63,161,263 | )a | ||||
| and liabilities denominated | ||||||||||||
| in foreign currencies | ||||||||||||
| Futures contracts | 50,565,858 | Futures contracts | (3,431,977 | ) | ||||||||
| Totals | $ | 216,659,289 | $ | (66,593,240 | ) | |||||||
| aForward exchange contracts are included in net realized gain (loss) from foreign currency transactions and net change in unrealized appreciation (depreciation) on translation | ||||||||||||
| of other assets and liabilities denominated in foreign currencies in the Statement of Operations. | ||||||||||||
| For the year ended December 31, 2015, the average month end fair value of derivatives represented 2.69% of average month end net | ||||||||||||
| assets. The average month end number of open derivative contracts for the year was 219. | ||||||||||||
| At December 31, 2015, the Fund’s OTC derivative assets and liabilities are as follows: | ||||||||||||
| Gross and Net Amounts | ||||||||||||
| of Assets and Liabilities | ||||||||||||
| Presented in the | ||||||||||||
| Statement of | ||||||||||||
| Assets and Liabilities | ||||||||||||
| Assetsa | Liabilitiesa | |||||||||||
| Derivatives | ||||||||||||
| Forward exchange contracts | $ | 50,892,704 | $ | 10,464,457 | ||||||||
| aAbsent an event of default or early termination, OTC derivative assets and liabilities are presented gross and not offset in the Statement of Assets and Liabilities. | ||||||||||||
franklintempleton.com
Annual Report
37
FRANKLIN MUTUAL EUROPEAN FUND
NOTES TO FINANCIAL STATEMENTS
10. Other Derivative Information (continued)
At December 31, 2015, the Fund’s OTC derivative assets, which may be offset against the Fund’s OTC derivative liabilities and collateral received from the counterparty, are as follows:
| Amounts Not Offset in the | ||||||||||||||
| Statement of Assets and Liabilities | ||||||||||||||
| Gross and Net | ||||||||||||||
| Amounts of Assets | Financial | |||||||||||||
| Presented in the | Financial | Instruments | Cash | |||||||||||
| Statement of | Instruments | Collateral | Collateral | Net Amount (Not | ||||||||||
| Assets and Liabilities | Available for Offset | Receiveda | Received | less than zero) | ||||||||||
| Counterparty | ||||||||||||||
| BANT | $ | 16,021,474 | $ | (1,766,181 | ) | $ | (10,903,659 | ) | $ | — | $ | 3,351,634 | ||
| BBU | 64,781 | (64,781 | ) | — | — | — | ||||||||
| BONY | 607,876 | (104,846 | ) | — | — | 503,030 | ||||||||
| DBFX | 7,567,223 | (881,887 | ) | — | (5,770,000 | ) | 915,336 | |||||||
| FBCO | 7,350,959 | (3,393,305 | ) | — | (2,140,000 | ) | 1,817,654 | |||||||
| HSBC | 10,666,228 | (1,256,098 | ) | (5,114,621 | ) | — | 4,295,509 | |||||||
| SSBT | 8,614,163 | (2,867,730 | ) | (3,480,852 | ) | — | 2,265,581 | |||||||
| Total | $ | 50,892,704 | $ | (10,334,828 | ) | $ | (19,499,132 | ) | $ | (7,910,000 | ) | $ | 13,148,744 | |
| aAt December 31, 2015, the Fund received United Kingdom Treasury Bonds and U.S. Treasury Notes as collateral for derivatives. | ||||||||||||||
At December 31, 2015, the Fund’s OTC derivative liabilities, which may be offset against the Fund’s OTC derivative assets and collateral pledged to the counterparty, are as follows:
| Amounts Not Offset in the | |||||||||||
| Statement of Assets and Liabilities | |||||||||||
| Gross and Net | |||||||||||
| Amounts of Liabilities | Financial | ||||||||||
| Presented in the | Financial | Instruments | Cash | ||||||||
| Statement of | Instruments | Collateral | Collateral | Net Amount (Not | |||||||
| Assets and Liabilities | Available for Offset | Pledged | Pledged | less than zero) | |||||||
| Counterparty | |||||||||||
| BANT | $ | 1,766,181 | $ | (1,766,181 | ) | $ | — | $ | — | $ | — |
| BBU | 194,410 | (64,781 | ) | — | — | 129,629 | |||||
| BONY | 104,846 | (104,846 | ) | — | — | — | |||||
| DBFX | 881,887 | (881,887 | ) | — | — | — | |||||
| FBCO | 3,393,305 | (3,393,305 | ) | — | — | — | |||||
| HSBC | 1,256,098 | (1,256,098 | ) | — | — | — | |||||
| SSBT | 2,867,730 | (2,867,730 | ) | — | — | — | |||||
| Total | $ | 10,464,457 | $ | (10,334,828 | ) | $ | — | $ | — | $ | 129,629 |
| See Note 1(c) regarding derivative financial instruments. | |||||||||||
| See Abbreviations on page 41. | |||||||||||
38 Annual Report
franklintempleton.com
FRANKLIN MUTUAL EUROPEAN FUND
NOTES TO FINANCIAL STATEMENTS
11. Holdings of 5% Voting Securities of Portfolio Companies
The 1940 Act defines “affiliated companies” to include investments in portfolio companies in which a fund owns 5% or more of the outstanding voting securities. Investments in “affiliated companies” for the Fund for the year ended December 31, 2015, were as shown below.
| Number of | Number of | ||||||||
| Shares Held | Shares Held | Value | |||||||
| at Beginning | Gross | Gross | at End | at End | Investment | Realized | |||
| Name of Issuer | of Year | Additions | Reductions | of Year | of Year | Income | Gain (Loss) | ||
| Controlled Affiliatesa | |||||||||
| Euro Wagon LP | |||||||||
| (Value is 0.67% of | |||||||||
| Net Assets) | 16,127,149 | — | — | 16,127,149 | $ | 20,683,866 | $ | 2,733,151 | $ — |
| aIssuer in which the Fund owns 25% or more of the outstanding voting securities. | |||||||||
12. Credit Facility
The Fund, together with other U.S. registered and foreign investment funds (collectively, Borrowers), managed by Franklin Temple-ton Investments, are borrowers in a joint syndicated senior unsecured credit facility totaling $2 billion (Global Credit Facility) which matured on February 12, 2016. This Global Credit Facility provides a source of funds to the Borrowers for temporary and emergency purposes, including the ability to meet future unanticipated or unusually large redemption requests. Effective February 12, 2016, the Borrowers renewed the Global Credit Facility for a one year term, maturing February 10, 2017, for a total of $2 billion.
Under the terms of the Global Credit Facility, the Fund shall, in addition to interest charged on any borrowings made by the Fund and other costs incurred by the Fund, pay its share of fees and expenses incurred in connection with the implementation and maintenance of the Global Credit Facility, based upon its relative share of the aggregate net assets of all of the Borrowers, including an annual commitment fee of 0.07% based upon the unused portion of the Global Credit Facility. Effective February 12, 2016, the annual commitment fee is 0.15%. These fees are reflected in other expenses in the Statement of Operations. During the year ended December 31, 2015, the Fund did not use the Global Credit Facility.
13. Fair Value Measurements
The Fund follows a fair value hierarchy that distinguishes between market data obtained from independent sources (observable inputs) and the Fund’s own market assumptions (unobservable inputs). These inputs are used in determining the value of the Fund’s financial instruments and are summarized in the following fair value hierarchy:
- Level 1 – quoted prices in active markets for identical financial instruments
- Level 2 – other significant observable inputs (including quoted prices for similar financial instruments, interest rates, prepayment speed, credit risk, etc.)
- Level 3 – significant unobservable inputs (including the Fund’s own assumptions in determining the fair value of financial instruments)
The input levels are not necessarily an indication of the risk or liquidity associated with financial instruments at that level.
For movements between the levels within the fair value hierarchy, the Fund has adopted a policy of recognizing the transfers as of the date of the underlying event which caused the movement.
franklintempleton.com
Annual Report
39
FRANKLIN MUTUAL EUROPEAN FUND
NOTES TO FINANCIAL STATEMENTS
13. Fair Value Measurements (continued)
A summary of inputs used as of December 31, 2015, in valuing the Fund’s assets and liabilities carried at fair value, is as follows:
40 Annual Report
franklintempleton.com
| Level 1 | Level 2 | Level 3 | Total | |||||||||||||||||||
| Assets: | ||||||||||||||||||||||
| Investments in Securities: | ||||||||||||||||||||||
| Equity Investments:a | ||||||||||||||||||||||
| Energy Equipment & Services | $ | — | $ | — | $ | 5,492,802 | $ | 5,492,802 | ||||||||||||||
| Machinery | 39,618,921 | 5,739,900 | — | 45,358,821 | ||||||||||||||||||
| Road & Rail | — | — | 20,683,866 | 20,683,866 | ||||||||||||||||||
| All Other Equity Investmentsb | 2,796,320,096 | — | — | 2,796,320,096 | ||||||||||||||||||
| Short Term Investments | 112,732,160 | — | — | 112,732,160 | ||||||||||||||||||
| Total Investments in Securities | $ | 2,948,671,177 | $ | 5,739,900 | $ | 26,176,668 | $ | 2,980,587,745 | ||||||||||||||
| Other Financial Instruments | ||||||||||||||||||||||
| Futures Contracts | $ | 5,174,832 | $ | — | $ | — | $ | 5,174,832 | ||||||||||||||
| Forward Exchange Contracts | 50,892,704 | 50,892,704 | ||||||||||||||||||||
| Total Other Financial Instruments | $ | 5,174,832 | $ | 50,892,704 | $ | — | $ | 56,067,536 | ||||||||||||||
| Liabilities: | ||||||||||||||||||||||
| Other Financial Instruments | ||||||||||||||||||||||
| Forward Exchange Contracts | $ | — | $ | 10,464,457 | $ | — | $ | 10,464,457 | ||||||||||||||
| aIncludes common and preferred stocks. | ||||||||||||||||||||||
| bFor detailed categories, see the accompanying Statement of Investments. | ||||||||||||||||||||||
| A reconciliation of assets in which Level 3 inputs are used in determining fair value is presented when there are significant Level 3 | ||||||||||||||||||||||
| financial instruments at the end of the year. At December 31, 2015, the reconciliation of assets, is as follows: | ||||||||||||||||||||||
| Net Change | ||||||||||||||||||||||
| in Unrealized | ||||||||||||||||||||||
| Appreciation | ||||||||||||||||||||||
| Balance at | Transfers | Net Unrealized | (Depreciation) | |||||||||||||||||||
| Beginning | Into (Out of) | Cost Basis | Net Realized | Appreciation | Balance at | on Assets Held | ||||||||||||||||
| of Year | Purchases | Sales | Level 3 Adjustmentsa | Gain (Loss) | (Depreciation) | End of Year | at Year End | |||||||||||||||
| Assets: | ||||||||||||||||||||||
| Investments in Securities: | ||||||||||||||||||||||
| Equity Investments:b | ||||||||||||||||||||||
| Energy Equipment & | ||||||||||||||||||||||
| Services | $ | 22,886,675 | $ | — $ | — | $ | — | $ — $ | — | $ | (17,393,873) | $ 5,492,802 | $ | (17,393,873) | ||||||||
| Insurance | —c | — | — | — | (6,265 | ) | (1,495,939 | ) | 1,502,204 | — | — | |||||||||||
| Real Estate | ||||||||||||||||||||||
| Management & | ||||||||||||||||||||||
| Development | 1,619,612 | — | (1,924,237 | ) | — | — | 1,137,811 | (833,186 | ) | — | — | |||||||||||
| Road & Rail | 18,528,986 | — | — | — | — | — | 2,154,880 | 20,683,866 | 2,154,880 | |||||||||||||
| Total Investments | ||||||||||||||||||||||
| in Securities | $ | 43,035,273 | $ | — $(1,924,237) | $ | — | $ 6,265 | ) $ | (358,128) $(14,569,975)$26,176,668 | $ | (15,238,993) | |||||||||||
| aMay include accretion, amortization, partnership adjustments, and/or other cost basis adjustments. | ||||||||||||||||||||||
| bIncludes common and preferred stocks. | ||||||||||||||||||||||
| cIncludes securities determined to have no value. | ||||||||||||||||||||||
FRANKLIN MUTUAL EUROPEAN FUND
NOTES TO FINANCIAL STATEMENTS
Significant unobservable valuation inputs developed by the VLOC for material Level 3 financial instruments and impact to fair value as a result of changes in unobservable valuation inputs as of December 31, 2015, are as follows:
| Impact to Fair | ||||||
| Fair Value at | Value if Input | |||||
| Description | End of Year Valuation Technique | Unobservable Inputs | Amount | Increasesa | ||
| Assets: | ||||||
| Investments in Securities | ||||||
| Equity Investments: | ||||||
| Road & Rail | $20,683,866 Market comparables Discount for lack of marketability | 15 | % | Decreaseb | ||
| All Other Investmentsc | 5,492,802 | |||||
| Total | $ | 26,176,668 | ||||
aRepresents the directional change in the fair value of the Level 3 financial instruments that would result froma significant and reasonable increase in the corresponding input.
A significant and reasonable decrease in the input would have the opposite effect. Significant impacts, if any, to fair value and/or net assets have been indicated.
bRepresents a significant impact to fair value but not net assets.
cIncludes financial instruments with values derived using prior transaction prices or third party pricing information without adjustment for which such inputs are unobservable.
May also include fair value of immaterial financial instruments developed using various valuation techniques and unobservable inputs.
14. Subsequent Events
The Fund has evaluated subsequent events through the issuance of the financial statements and determined that no events have occurred that require disclosure other than those already disclosed in the financial statements.
| Abbreviations | ||||
| Counterparty | Currency | Selected Portfolio | ||
| BANT | Bank of America N.A. | CHF | Swiss Franc | ADR American Depositary Receipt |
| BBU | Barclays Bank PLC | EUR | Euro | |
| BONY | Bank of New York Mellon | GBP | British Pound | |
| DBFX | Deutsche Bank AG | USD | United States Dollar | |
| FBCO | Credit Suisse Group AG | |||
| HSBC | HSBC Bank USA, N.A. | |||
| SSBT | State Street Bank and Trust Co., N.A. | |||
franklintempleton.com
Annual Report
41
FRANKLIN MUTUAL EUROPEAN FUND
Report of Independent Registered Public Accounting Firm
To the Board of Trustees of Franklin Mutual Series Funds and Shareholders of Franklin Mutual European Fund:
We have audited the accompanying statement of assets and liabilities, including the statement of investments, of Franklin Mutual European Fund (the “Fund”) (one of the funds constituting Franklin Mutual Series Funds) as of December 31, 2015, and the related statement of operations for the year then ended, the statements of changes in net assets for each of the two years in the period then ended, and the financial highlights for each of the periods indicated therein. These financial statements and financial highlights are the responsibility of the Fund’s management. Our responsibility is to express an opinion on these financial statements and financial highlights based on our audits.
We conducted our audits in accordance with the standards of the Public Company Accounting Oversight Board (United States). Those standards require that we plan and perform the audit to obtain reasonable assurance about whether the financial statements and financial highlights are free of material misstatement. We were not engaged to perform an audit of the Fund’s internal control over financial reporting. Our audits included consideration of internal control over financial reporting as a basis for designing audit procedures that are appropriate in the circumstances, but not for the purpose of expressing an opinion on the effectiveness of the Fund’s internal control over financial reporting. Accordingly, we express no such opinion. An audit also includes examining, on a test basis, evidence supporting the amounts and disclosures in the financial statements and financial highlights, assessing the accounting principles used and significant estimates made by management, and evaluating the overall financial statement presentation. Our procedures included confirmation of securities owned as of December 31, 2015, by correspondence with the custodian and brokers, or by other appropriate auditing procedures where replies from the brokers were not received. We believe that our audits provide a reasonable basis for our opinion.
In our opinion, the financial statements and financial highlights referred to above present fairly, in all material respects, the financial position of Franklin Mutual European Fund (one of the funds constituting Franklin Mutual Series Funds) at December 31, 2015, the results of its operations for the year then ended, the changes in its net assets for each of the two years in the period then ended, and the financial highlights for each of the periods indicated therein, in conformity with U.S. generally accepted accounting principles.

Boston, Massachusetts
February 18, 2016
42 Annual Report
franklintempleton.com
FRANKLIN MUTUAL EUROPEAN FUND
Tax Information (unaudited)
Under Section 852(b)(3)(C) of the Internal Revenue Code (Code), the Fund hereby reports the maximum amount allowable but no less than $150,652,119 as a long term capital gain dividend for the fiscal year ended December 31, 2015.
Under Section 871(k)(2)(C) of the Code, the Fund hereby reports the maximum amount allowable but no less than $15,132,428 as a short term capital gain dividend for purposes of the tax imposed under Section 871(a)(1)(A) of the Code for the fiscal year ended December 31, 2015.
Under Section 854(b)(1)(B) of the Code, the Fund hereby reports the maximum amount allowable but no less than $85,812,716 as qualified dividends for purposes of the maximum rate under Section 1(h)(11) of the Code for the fiscal year ended December 31, 2015. Distributions, including qualified dividend income, paid during calendar year 2015 will be reported to shareholders on Form 1099-DIV by mid-February 2016. Shareholders are advised to check with their tax advisors for information on the treatment of these amounts on their individual income tax returns.
At December 31, 2015, more than 50% of the Fund’s total assets were invested in securities of foreign issuers. In most instances, foreign taxes were withheld from income paid to the Fund on these investments. As shown in the table below, the Fund hereby reports to shareholders the foreign source income and foreign taxes paid, pursuant to Section 853 of the Code. This written statement will allow shareholders of record on December 17, 2015, to treat their proportionate share of foreign taxes paid by the Funds as having been paid directly by them. The shareholder shall consider these amounts as foreign taxes paid in the tax year in which they receive the Fund distribution.
The following table provides a detailed analysis of foreign tax paid, foreign source income, and foreign source qualified dividends as reported by the Fund, to Class Z, Class A, Class C, Class R and Class R6 shareholders of record.
| Foreign Tax Paid | Foreign Source | Foreign Source Qualified | ||||
| Class | Per Share | Income Per Share | Dividends Per Share | |||
| Class Z | $ | 0.0512 | $ | 0.4354 | $ | 0.3867 |
| Class A | $ | 0.0512 | $ | 0.3865 | $ | 0.3432 |
| Class C | $ | 0.0512 | $ | 0.2650 | $ | 0.2353 |
| Class R | $ | 0.0512 | $ | 0.3755 | $ | 0.3335 |
| Class R6 | $ | 0.0512 | $ | 0.4646 | $ | 0.4127 |
Foreign Tax Paid Per Share (Column 1) is the amount per share available to you, as a tax credit (assuming you held your shares in the Fund for a minimum of 16 days during the 31-day period beginning 15 days before the ex-dividend date of the Fund’s distribution to which the foreign taxes relate), or, as a tax deduction.
Foreign Source Income Per Share (Column 2) is the amount per share of income dividends attributable to foreign securities held by the Fund, plus any foreign taxes withheld on these dividends. The amounts reported include foreign source qualified dividends that have not been adjusted for the rate differential applicable to such dividend income.1
Foreign Source Qualified Dividends Per Share (Column 3) is the amount per share of foreign source qualified dividends, plus any foreign taxes withheld on these dividends. These amounts represent the portion of the Foreign Source Income reported to you in column 2 that were derived from qualified foreign securities held by the Fund.1
By mid-February 2016, shareholders will receive Form 1099-DIV which will include their share of taxes paid and foreign source income distributed during the calendar year 2015. The Foreign Source Income reported on Form 1099-DIV has not been adjusted for the rate differential on foreign source qualified dividend income. Shareholders are advised to check with their tax advisors for information on the treatment of these amounts on their 2015 individual income tax returns.
1Qualified dividends are taxed at reduced long term capital gains tax rates. In determining the amount of foreign tax credit that may be applied against the U.S. tax liability of
individuals receiving foreign source qualified dividends, adjustments may be required to the foreign tax credit limitation calculation to reflect the rate differential applicable to
such dividend income. The rules however permit certain individuals to elect not to apply the rate differential adjustments for capital gains and/or dividends for any taxable year.
Please consult your tax advisor and the instructions to Form 1116 for more information.
franklintempleton.com
Annual Report
43
FRANKLIN MUTUAL EUROPEAN FUND
| Board Members and Officers | ||||
| The name, year of birth and address of the officers and board members, as well as their affiliations, positions held with the Fund, | ||||
| principal occupations during at least the past five years and number of portfolios overseen in the Franklin Templeton Investments | ||||
| fund complex, are shown below. Generally, each board member serves until that person’s successor is elected and qualified. | ||||
| Independent Board Members | ||||
| Number of Portfolios in | ||||
| Name, Year of Birth | Length of | Fund Complex Overseen | Other Directorships Held | |
| and Address | Position | Time Served | by Board Member* | During at Least the Past 5 Years |
| Edward I. Altman, Ph.D. (1941) | Trustee | Since 1987 | 17 | None |
| c/o Franklin Mutual Advisers, LLC | ||||
| 101 John F. Kennedy Parkway | ||||
| Short Hills, NJ 07078-2789 | ||||
| Principal Occupation During at Least the Past 5 Years: | ||||
| Max L. Heine Professor of Finance, Emeritus and Director of The Credit and Debt Markets Research Program, Salomon Center, Stern School | ||||
| of Business, New York University; editor and author of numerous financial publications; financial consultant; an adviser to numerous financial | ||||
| and publishing organizations; and formerly, Vice Director, Salomon Center, Stern School of Business, New York University. | ||||
| Ann Torre Bates (1958) | Trustee | Since 1995 | 41 | Navient Corporation (loan |
| c/o Franklin Mutual Advisers, LLC | management, servicing and asset | |||
| 101 John F. Kennedy Parkway | recovery) (2014-present), Ares Capital | |||
| Short Hills, NJ 07078-2789 | Corporation (specialty finance | |||
| company) (2010-present), United | ||||
| Natural Foods, Inc. (distributor of | ||||
| natural, organic and specialty foods) | ||||
| (2013-present), Allied Capital | ||||
| Corporation (financial services) | ||||
| (2003-2010) and SLM Corporation | ||||
| (Sallie Mae) (1997-2014). | ||||
| Principal Occupation During at Least the Past 5 Years: | ||||
| Director of various companies; and formerly, Executive Vice President and Chief Financial Officer, NHP Incorporated (manager of multifamily | ||||
| housing) (1995-1997); and Vice President and Treasurer, US Airways, Inc. (until 1995). | ||||
| Burton J. Greenwald (1929) | Trustee | Trustee since | 17 | Franklin Templeton Emerging Markets |
| c/o Franklin Mutual Advisers, LLC | and Vice | 2002 and Vice | Debt Opportunities Fund PLC and | |
| 101 John F. Kennedy Parkway | Chairman | Chairman since | Fiduciary International Ireland Limited | |
| Short Hills, NJ 07078-2789 | of the | April 2015 | (1999-2015). | |
| Board | ||||
| Principal Occupation During at Least the Past 5 Years: | ||||
| Managing Director, B.J. Greenwald Associates (management consultants to the financial services industry); and formerly, Chairman, | ||||
| Fiduciary Trust International Funds; Executive Vice President, L.F. Rothschild Fund Management, Inc.; President and Director, Merit Mutual | ||||
| Funds; President, Underwriting Division and Director, National Securities & Research Corporation; Governor, Investment Company Institute; | ||||
| and Chairman, ICI Public Information Committee. | ||||
| Keith E. Mitchell (1954) | Trustee | Since 2009 | 17 | None |
| c/o Franklin Mutual Advisers, LLC | ||||
| 101 John F. Kennedy Parkway | ||||
| Short Hills, NJ 07078-2789 | ||||
| Principal Occupation During at Least the Past 5 Years: | ||||
| Director of various boards of asset management firms; and formerly, Managing Member, Mitchell, Hartley & Bechtel Advisers, LLC (formerly, | ||||
| Mitchell Advisers, LLC) (advisory firm) (2003-2015) and Managing Director, Putnam Lovell NBF. | ||||
44 Annual Report
franklintempleton.com
FRANKLIN MUTUAL EUROPEAN FUND
| Independent Board Members (continued) | |||||
| Number of Portfolios in | |||||
| Name, Year of Birth | Length of | Fund Complex Overseen | Other Directorships Held | ||
| and Address | Position | Time Served | by Board Member* | During at Least the Past 5 Years | |
| David W. Niemiec (1949) | Trustee | Since April | 41 | Emeritus Corporation (assisted living) | |
| One Franklin Parkway | 2015 | (1999-2010) and OSI Pharmaceuticals, | |||
| San Mateo, CA 94403-1906 | Inc. (pharmaceutical products) | ||||
| (2006-2010). | |||||
| Principal Occupation During at Least the Past 5 Years: | |||||
| Advisor, Saratoga Partners (private equity fund); and formerly, Managing Director, Saratoga Partners (1998-2001) and SBC Warburg Dillon | |||||
| Read (investment banking) (1997-1998); Vice Chairman, Dillon, Read & Co. Inc. (investment banking) (1991-1997); and Chief Financial | |||||
| Officer, Dillon, Read & Co. Inc. (1982-1997). | |||||
| Charles Rubens II (1930) | Trustee | Since 1998 | 17 | None | |
| c/o Franklin Mutual Advisers, LLC | |||||
| 101 John F. Kennedy Parkway | |||||
| Short Hills, NJ 07078-2789 | |||||
| Principal Occupation During at Least the Past 5 Years: | |||||
| Private investor and president of non-profit organizations; and formerly, an executive of Time, Inc.; and Trustee of Colorado College. | |||||
| Jan Hopkins Trachtman (1947) | Trustee | Since 2009 | 17 | None | |
| c/o Franklin Mutual Advisers, LLC | |||||
| 101 John F. Kennedy Parkway | |||||
| Short Hills, NJ 07078-2789 | |||||
| Principal Occupation During at Least the Past 5 Years: | |||||
| President and Founder, The Jan Hopkins Group (communications consulting firm); serves on Advisory Board of Knight Bagehot Fellowship; | |||||
| and formerly, President, Economic Club of New York (2001-2015); Anchor/Correspondent, CNN Financial News (until 2003); Managing | |||||
| Director and Head of Client Communications, Citigroup Private Bank (until 2005); Off-Air Reporter, ABC News’ World News Tonight; and | |||||
| Editor, CBS Network News. | |||||
| Robert E. Wade (1946) | Trustee | Trustee since | 41 | El Oro Ltd (investments) | |
| c/o Franklin Mutual Advisers, LLC | and | 1993 | and | (2003-present). | |
| 101 John F. Kennedy Parkway | Chairman | Chairman of the | |||
| Short Hills, NJ 07078-2789 | of the | Board | |||
| Board | since 2005 | ||||
| Principal Occupation During at Least the Past 5 Years: | |||||
| Attorney at law engaged in private practice (1972-2008) and member of various boards. | |||||
| Gregory H. Williams (1943) | Trustee | Since | 17 | None | |
| One Franklin Parkway | April 2015 | ||||
| San Mateo, CA 94403-1906 | |||||
| Principal Occupation During at Least the Past 5 Years: | |||||
| Private investor; Consultant; and formerly, President, University of Cincinnati (2009-2012); President, The City College of New York | |||||
| (2001-2009); Dean, College of Law, Ohio State University (1993-2001); and Associate Vice President, Academic Affairs and Professor of Law, | |||||
| University of Iowa (1977-1993). | |||||
franklintempleton.com
Annual Report
45
FRANKLIN MUTUAL EUROPEAN FUND
| Interested Board Members and Officers | ||||
| Number of Portfolios in | ||||
| Name, Year of Birth | Length of | Fund Complex Overseen | Other Directorships Held | |
| and Address | Position | Time Served | by Board Member* | During at Least the Past 5 Years |
| **Gregory E. Johnson (1961) | Trustee | Since 2007 | 164 | None |
| One Franklin Parkway | ||||
| San Mateo, CA 94403-1906 | ||||
| Principal Occupation During at Least the Past 5 Years: | ||||
| Chairman of the Board, Member – Office of the Chairman, Director and Chief Executive Officer, Franklin Resources, Inc.; officer and/or | ||||
| director or trustee, as the case may be, of some of the other subsidiaries of Franklin Resources, Inc. and of 44 of the investment companies in | ||||
| Franklin Templeton Investments; Vice Chairman, Investment Company Institute; and formerly, President, Franklin Resources, Inc. | ||||
| (1994-2015). | ||||
| **Peter A. Langerman (1955) | Trustee, | Trustee | 7 | American International Group, Inc. |
| c/o Franklin Mutual Advisers, LLC | President, | since 2007, | (AIG) Credit Facility Trust | |
| 101 John F. Kennedy Parkway | and Chief | President, and | (2010-2011). | |
| Short Hills, NJ 07078-2702 | Executive | Chief Executive | ||
| Officer – | Officer – | |||
| Investment | Investment | |||
| Management | Management | |||
| since 2005 | ||||
| Principal Occupation During at Least the Past 5 Years: | ||||
| Chairman of the Board, Chief Executive Officer and President, Franklin Mutual Advisers, LLC; and officer and/or director, as the case may be, | ||||
| of two of the investment companies in Franklin Templeton Investments. | ||||
| Alison E. Baur (1964) | Vice | Since 2012 | Not Applicable | Not Applicable |
| One Franklin Parkway | President | |||
| San Mateo, CA 94403-1906 | ||||
| Principal Occupation During at Least the Past 5 Years: | ||||
| Deputy General Counsel, Franklin Templeton Investments; and officer of some of the other subsidiaries of Franklin Resources, Inc. and of 44 | ||||
| of the investment companies in Franklin Templeton Investments. | ||||
| Philippe Brugere-Trelat (1949) | Vice | Since 2005 | Not Applicable | Not Applicable |
| 101 John F. Kennedy Parkway | President | |||
| Short Hills NJ 07078-2789 | ||||
| Principal Occupation During at Least the Past 5 Years: | ||||
| Executive Vice President, Franklin Mutual Advisers, LLC; officer of two of the investment companies in Franklin Templeton Investments; and | ||||
| formerly, Portfolio Manager of Eurovest SA (French registered Investment Company, Sicav). | ||||
| Laura F. Fergerson (1962) | Chief | Since 2009 | Not Applicable | Not Applicable |
| One Franklin Parkway | Executive | |||
| San Mateo, CA 94403-1906 | Officer – | |||
| Finance and | ||||
| Administration | ||||
| Principal Occupation During at Least the Past 5 Years: | ||||
| Senior Vice President, Franklin Templeton Services, LLC; Vice President, Franklin Advisers, Inc. and Franklin Templeton Institutional, LLC; | ||||
| and officer of 44 of the investment companies in Franklin Templeton Investments. | ||||
| Aliya S. Gordon (1973) | Vice | Since 2009 | Not Applicable | Not Applicable |
| One Franklin Parkway | President | |||
| San Mateo, CA 94403-1906 | ||||
| Principal Occupation During at Least the Past 5 Years: | ||||
| Senior Associate General Counsel, Franklin Templeton Investments; and officer of 44 of the investment companies in Franklin Templeton | ||||
| Investments. | ||||
46 Annual Report
franklintempleton.com
FRANKLIN MUTUAL EUROPEAN FUND
| Interested Board Members and Officers (continued) | ||||
| Number of Portfolios in | ||||
| Name, Year of Birth | Length of | Fund Complex Overseen | Other Directorships Held | |
| and Address | Position | Time Served | by Board Member* | During at Least the Past 5 Years |
| Steven J. Gray (1955) | Secretary | Secretary | Not Applicable | Not Applicable |
| One Franklin Parkway | and Vice | since 2005 and | ||
| San Mateo, CA 94403-1906 | President | Vice President | ||
| since 2009 | ||||
| Principal Occupation During at Least the Past 5 Years: | ||||
| Senior Associate General Counsel, Franklin Templeton Investments; Vice President, Franklin Templeton Distributors, Inc. and Franklin | ||||
| Alternative Strategies Advisers, LLC; and officer of 44 of the investment companies in Franklin Templeton Investments. | ||||
| Selena L. Holmes (1965) | Vice | Since 2012 | Not Applicable | Not Applicable |
| 100 Fountain Parkway | President – | |||
| St. Petersburg, FL 33716-1205 | AML | |||
| Compliance | ||||
| Principal Occupation During at Least the Past 5 Years: | ||||
| Director, Global Compliance Monitoring; Chief Compliance Officer, Franklin Alternative Strategies Advisers, LLC; Vice President, Franklin | ||||
| Templeton Companies, LLC; and officer of 44 of the investment companies in Franklin Templeton Investments. | ||||
| Robert G. Kubilis (1973) | Treasurer, | Since 2012 | Not Applicable | Not Applicable |
| 300 S.E. 2nd Street | Chief | |||
| Fort Lauderdale, FL 33301-1923 | Financial | |||
| Officer and | ||||
| Chief | ||||
| Accounting | ||||
| Officer | ||||
| Principal Occupation During at Least the Past 5 Years: | ||||
| Treasurer, U.S. Fund Administration & Reporting, Franklin Templeton Investments; and officer of four of the investment companies in Franklin | ||||
| Templeton Investments. | ||||
| Kimberly H. Novotny (1972) | Vice | Since 2013 | Not Applicable | Not Applicable |
| 300 S.E. 2nd Street | President | |||
| Fort Lauderdale, FL 33301-1923 | ||||
| Principal Occupation During at Least the Past 5 Years: | ||||
| Associate General Counsel, Franklin Templeton Investments; Vice President, Fiduciary Trust International of the South and Templeton | ||||
| Investment Counsel, LLC; Assistant Secretary, Franklin Resources, Inc.; and officer of 44 of the investment companies in Franklin Templeton | ||||
| Investments. | ||||
| Robert C. Rosselot (1960) | Chief | Since 2013 | Not Applicable | Not Applicable |
| 300 S.E. 2nd Street | Compliance | |||
| Fort Lauderdale, FL 33301-1923 | Officer | |||
| Principal Occupation During at Least the Past 5 Years: | ||||
| Director, Global Compliance, Franklin Templeton Investments; Vice President, Franklin Templeton Companies, LLC; officer of 44 of the | ||||
| investment companies in Franklin Templeton Investments; and formerly, Senior Associate General Counsel, Franklin Templeton Investments | ||||
| (2007-2013); and Secretary and Vice President, Templeton Group of Funds (2004-2013). | ||||
| Karen L. Skidmore (1952) | Vice | Since 2009 | Not Applicable | Not Applicable |
| One Franklin Parkway | President | |||
| San Mateo, CA 94403-1906 | ||||
| Principal Occupation During at Least the Past 5 Years: | ||||
| Senior Associate General Counsel, Franklin Templeton Investments; and officer of 44 of the investment companies in Franklin Templeton | ||||
| Investments. | ||||
franklintempleton.com
Annual Report
47
FRANKLIN MUTUAL EUROPEAN FUND
| Interested Board Members and Officers (continued) | ||||
| Number of Portfolios in | ||||
| Name, Year of Birth | Length of | Fund Complex Overseen | Other Directorships Held | |
| and Address | Position | Time Served | by Board Member* | During at Least the Past 5 Years |
| Navid Tofigh (1972) | Vice | Since | Not Applicable | Not Applicable |
| One Franklin Parkway | President | November 2015 | ||
| San Mateo, CA 94403-1906 | ||||
| Principal Occupation During at Least the Past 5 Years: | ||||
| Associate General Counsel, Franklin Templeton Investments; and officer of 44 of the investment companies in Franklin Templeton | ||||
| Investments. | ||||
| Craig S. Tyle (1960) | Vice | Since 2005 | Not Applicable | Not Applicable |
| One Franklin Parkway | President | |||
| San Mateo, CA 94403-1906 | ||||
| Principal Occupation During at Least the Past 5 Years: | ||||
| General Counsel and Executive Vice President, Franklin Resources, Inc.; and officer of some of the other subsidiaries of Franklin Resources, | ||||
| Inc. and of 44 of the investment companies in Franklin Templeton Investments. | ||||
| Lori A. Weber (1964) | Vice | Since 2011 | Not Applicable | Not Applicable |
| 300 S.E. 2nd Street | President | |||
| Fort Lauderdale, FL 33301-1923 | ||||
| Principal Occupation During at Least the Past 5 Years: | ||||
| Senior Associate General Counsel, Franklin Templeton Investments; Assistant Secretary, Franklin Resources, Inc.; Vice President and | ||||
| Secretary, Templeton Investment Counsel, LLC; and officer of 44 of the investment companies in Franklin Templeton Investments. | ||||
*We base the number of portfolios on each separate series of the U.S. registered investment companies within the Franklin Templeton Investments fund complex. These
portfolios have a common investment manager or affiliated investment managers.
**Gregory E. Johnson is considered to be an interested person of the Fund under the federal securities laws due to his position as an officer and director of Franklin
Resources, Inc., which is the parent company of the Fund’s investment manager and distributor. Peter A. Langerman is considered to be an interested person of the Fund
under the federal securities laws due to his position as an officer of Franklin Mutual Advisers, LLC, which is an affiliate of the Fund’s investment manager.
Note 1: Officer information is current as of the date of this report. It is possible that after this date, information about officers may change.
The Fund’s Board has determined that certain of the members of the Audit Committee, including Ann Torre Bates, are audit committee financial experts, and
“independent,” under those provisions of the Sarbanes-Oxley Act of 2002, and the rules and form amendments adopted by the Securities and Exchange
Commission, relating to audit committee financial experts.
The Statement of Additional Information (SAI) includes additional information about the board members and is available, without charge, upon request.
Shareholders may call (800) DIAL BEN/342-5236 to request the SAI.
48 Annual Report
franklintempleton.com
FRANKLIN MUTUAL EUROPEAN FUND
Shareholder Information
Proxy Voting Policies and Procedures
The Fund’s investment manager has established Proxy Voting Policies and Procedures (Policies) that the Fund uses to determine how to vote proxies relating to portfolio securities. Shareholders may view the Fund’s complete Policies online at franklintempleton.com. Alternatively, shareholders may request copies of the Policies free of charge by calling the Proxy Group collect at (954) 527-7678 or by sending a written request to: Franklin Templeton Companies, LLC, 300 S.E. 2nd Street, Fort Lauderdale, FL 33301, Attention: Proxy Group. Copies of the Fund’s proxy voting records are also made available online at franklintempleton.com and posted on the U.S. Securities and Exchange Commission’s website at sec.gov and reflect the most recent 12-month period ended June 30.
Quarterly Statement of Investments
The Fund files a complete statement of investments with the U.S. Securities and Exchange Commission for the first and third quarters for each fiscal year on Form N-Q. Shareholders may view the filed Form N-Q by visiting the Commission’s website at sec.gov. The filed form may also be viewed and copied at the Commission’s Public Reference Room in Washington, DC. Information regarding the operations of the Public Reference Room may be obtained by calling (800) SEC-0330.
Householding of Reports and Prospectuses
You will receive the Fund’s financial reports every six months as well as an annual updated summary prospectus (prospectus available upon request). To reduce Fund expenses, we try to identify related shareholders in a household and send only one copy of the financial reports and summary prospectus. This process, called “householding,” will continue indefinitely unless you instruct us otherwise. If you prefer not to have these documents householded, please call us at (800) 632-2301. At any time you may view current prospectuses/summary prospectuses and financial reports on our website. If you choose, you may receive these documents through electronic delivery.
franklintempleton.com
Annual Report
49
This page intentionally left blank
This page intentionally left blank
This page intentionally left blank

| Contents | |
| Annual Report | |
| Franklin Mutual Financial Services Fund | 3 |
| Performance Summary | 8 |
| Your Fund’s Expenses | 13 |
| Financial Highlights and Statement of Investments | 15 |
| Financial Statements | 24 |
| Notes to Financial Statements | 28 |
| Report of Independent Registered | |
| Public Accounting Firm | 40 |
| Tax Information | 41 |
| Board Members and Officers | 42 |
| Shareholder Information | 47 |
Visit franklintempleton.com for fund updates, to access your account, or to find helpful financial planning tools.
2 Annual Report
franklintempleton.com
Annual Report
Franklin Mutual Financial Services Fund
We are pleased to bring you Franklin Mutual Financial Services Fund’s annual report for the fiscal year ended December 31, 2015.
Your Fund’s Goals and Main Investments
The Fund seeks capital appreciation, which may occasionally be short term, with income as a secondary goal, by investing at least 80% of its net assets in securities of financial services companies that we believe are available at market prices less than their intrinsic value. The Fund concentrates its investments in securities of issuers such as banks, savings and loan organizations, credit card companies, brokerage firms, finance companies, subprime lending institutions, investment advisors, investment companies and insurance companies.
Performance Overview
The Fund’s Class Z shares delivered a cumulative total return of +8.34% for the 12 months under review. In comparison, the Fund’s narrow benchmark, the Standard & Poor’s 500 (S&P 500®) Financials Index, which tracks financials stocks in the S&P 500 Index, had a -1.53% total return.1 For the same period, the Fund’s broad benchmark, the S&P 500 Index, which is a broad measure of U.S. stock performance, posted a +1.38% total return.1 You can find more of the Fund’s performance data in the Performance Summary beginning on page 8.
Performance data represent past performance, which does not guarantee future results. Investment return and principal value will fluctuate, and you may have a gain or loss when you sell your shares. Current performance may differ from figures shown. For most recent month-end performance, go to franklintempleton.com or call (800) 342-5236.
Economic and Market Overview
U.S. economic growth slowed in 2015’s first quarter but strengthened in 2015’s second quarter amid healthy consumer spending. The third and fourth quarters were less robust as exports slowed and state and local governments reduced their spending. At its December meeting, the U.S. Federal Reserve (Fed) increased its target range for the federal funds rate to 0.25%–0.50%, as policymakers cited the labor market’s considerable improvement and were reasonably confident that inflation would move back to the Fed’s 2% medium-term objective. Furthermore, the Fed raised its forecast for 2016 U.S. economic growth and lowered its unemployment projection. Despite periods of volatility, the broad U.S. stock market, as measured by the S&P 500 Index, generated a modest positive total return for 2015.
The global economy expanded moderately during the 12 months under review. As measured by the MSCI World Index, stocks in global developed markets overall were down slightly for the year despite some positive developments. Weighing on global stocks at times were worries about China’s

1. Source: Morningstar.
The indexes are unmanaged and include reinvestment of any income or distributions. One cannot invest directly in an index, and an index is not representative of the Fund’s
portfolio.
See www.franklintempletondatasources.com for additional data provider information.
The dollar value, number of shares or principal amount, and names of all portfolio holdings are listed in the Fund’s Statement of Investments (SOI).
The SOI begins on page 19.
franklintempleton.com
Annual Report
3
FRANKLIN MUTUAL FINANCIAL SERVICES FUND
slowing economy and tumbling stock market, declining commodity prices, geopolitical tensions between Russia and Turkey, and ongoing uncertainty over the Fed’s timing for raising interest rates. Toward period-end, equity markets recovered somewhat as the Fed increased its federal funds target range, alleviating some uncertainty about a change in the U.S. monetary policy. During the year, oil prices declined sharply largely due to increased global supply that exceeded demand. Gold and other commodity prices also fell. The U.S. dollar appreciated against most currencies during the period, which reduced returns of many foreign assets in U.S. dollar terms.
In Europe, U.K. economic growth gained momentum from the services sector, but the economy slowed in 2015 compared with 2014. The eurozone grew moderately and generally benefited during the year from lower oil prices, a weaker euro that supported exports, the European Central Bank’s (ECB’s) accommodative policy and expectations of further ECB stimulus. Although the eurozone’s annual inflation rate declined early in the period, it rose slightly during the rest of the period. The ECB maintained its benchmark interest rates although it reduced its bank deposit rate in December, seeking to boost the region’s slowing growth.
Japan’s economy continued to grow in 2015’s first quarter. After a decline in the second quarter of 2015, it expanded in the third quarter as capital expenditures improved. The Bank of Japan took several actions during the reporting period, including maintaining its monetary policy, lowering its economic growth and inflation forecasts, and reorganizing its stimulus program to increase exposure to long-term government bonds and exchange-traded funds.
China’s economy grew at a less robust pace in 2015 than in 2014, as strength in services and consumption was offset by weakness in fixed-asset investment, imports and exports, and manufacturing. The Chinese government’s efforts to promote stable growth supported China’s domestic stock market in 2015’s first half. However, tight liquidity conditions and uncertainties about the central bank’s monetary policy led China’s domestic market to correct from June through August, contributing to a global stock market correction. The government’s intervention to cool domestic stock market speculation and its effective currency devaluation led to a severe slump in emerging market stocks from June through August. Although equities in China and most other emerging markets gained in October after China expanded its monetary and fiscal stimulus, they generally declined for the remainder of the year amid concerns about declining commodity prices and China’s moderating economy.
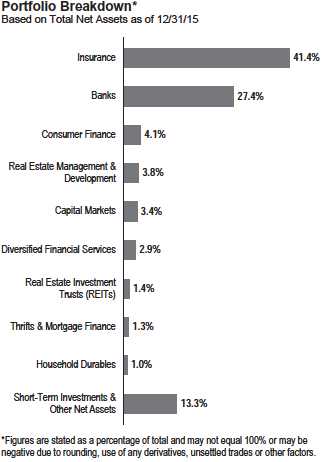
Investment Strategy
We strive to provide investors with superior risk-adjusted returns over time through our distinctive, value investment style, which includes investments in undervalued common stocks, distressed debt and risk arbitrage. Rigorous fundamental analysis drives our investment process. We attempt to determine each investment’s intrinsic value as well as the price at which we would be willing to commit shareholder funds. While valuation remains our key consideration, we utilize numerous fundamental factors such as return on equity, financial leverage and long-term earnings power. We also consider factors such as management quality and competitive position. As always, our approach to investing is as much about assessing risk and containing losses as it is about achieving profits.
In addition, it is our practice to hedge the Fund’s currency exposure when we deem it advantageous for our shareholders.
4 Annual Report
franklintempleton.com
FRANKLIN MUTUAL FINANCIAL SERVICES FUND
What is return on equity?
Return on equity is an amount, expressed as a percentage, earned on a company’s common stock investment for a given period. Return on equity tells common shareholders how effectually their money is being employed. Comparing percentages for current and prior periods also reveals trends, and comparison with industry composites reveals how well a company is holding its own against its competitors.
What is meant by “hedge”?
To hedge an investment is to take a position intended to offset potential losses/gains that may be incurred by a companion financial instrument.
Manager’s Discussion
During the 12 months under review, stocks in most global markets declined after a three-year ascent. Globally, several major central banks became more accommodative while fiscal authorities focused on budgetary discipline. Large companies also remained disciplined about operating costs, with margins at historically high levels in many industries and countries. To drive further growth, an increasing number of companies took advantage of low interest rates to finance deals. In this environment, we saw a number of opportunities.
Equity prices are typically forward looking, reflecting investors’ beliefs about how various factors and events will play out in the future. Global equity prices at period-end were down from mid-2015 highs, reflecting increased uncertainty among global investors regarding China and other emerging markets, global commodity prices, U.S. monetary policy divergence and geopolitical events. However, with the support of global quantitative easing, many corporations have been able to build strong balance sheets, focus intensely on improving efficiency, maintain historically high margins and return a significant amount of capital to shareholders.
Merger and acquisition (M&A) activity accelerated in the past 12 months, helping to support valuations. Deal volumes reached historical highs and regulators globally increased their scrutiny of potential negative effects of high concentration. Such an environment — active M&A combined with regulatory uncertainty, greater complexity and market volatility — may provide attractive investment opportunities. We seek to use a mixture of merger arbitrage positions and investments in one or both of the companies to participate in these opportunities. The traditional merger arbitrage positions are constructed solely to benefit from deal completion, while unhedged investments in one or both companies can allow the Fund to benefit from possible value creation once the deal is completed.
| Top 10 Equity Holdings | ||
| 12/31/15 | ||
| Company | % of Total | |
| Sector/Industry, Country | Net Assets | |
| American International Group Inc. | 3.5 | % |
| Insurance, U.S. | ||
| XL Group PLC | 3.3 | % |
| Insurance, Ireland | ||
| ACE Ltd. | 3.2 | % |
| Insurance, U.S. | ||
| CIT Group Inc. | 3.2 | % |
| Banks, U.S. | ||
| NN Group NV | 2.9 | % |
| Insurance, Netherlands | ||
| Wells Fargo & Co. | 2.3 | % |
| Banks, U.S. | ||
| Citizens Financial Group Inc. | 2.2 | % |
| Banks, U.S. | ||
| The Allstate Corp. | 2.2 | % |
| Insurance, U.S. | ||
| CNO Financial Group Inc. | 2.1 | % |
| Insurance, U.S. | ||
| SunTrust Banks Inc. | 2.1 | % |
| Banks, U.S. |
Distressed debt remained a difficult market in which we could find compelling new opportunities. Low interest rates have kept credit widely available, and we felt bankruptcies were limited, except in the energy and mining sectors. Increased stress in high yield markets has expanded the potential opportunity set for us. For some firms, costs of issuing debt are climbing and these debt securities are starting to look attractive to us.
Turning to Fund performance, top contributors included insurers NN Group and Ageas, as well as condominium developer Takara Leben.
NN Group is a Dutch insurer spun out of ING Groep. The company followed through successfully on its efforts to improve return on equity and reduce expenses. Results for several quarters were positive, and the company stated in November that it had reached its expense savings target a year early but would continue to push for further efficiencies. The company also periodically repurchased shares from ING Groep to help meet ING’s goal to fully divest its insurance and investment management holdings by the end of 2016, as required under ING’s restructuring agreement with the European Commission.
Headquartered in Belgium, Ageas is a diversified insurer with operations in Europe and Asia. The company’s stock price rose in 2015 as Ageas improved its underlying insurance results while focusing on cash generation. The company disclosed a solid capital position under new eurozone capitalization
franklintempleton.com
Annual Report 5
FRANKLIN MUTUAL FINANCIAL SERVICES FUND
guidelines for insurers, reassuring investors. In late August, Ageas announced the sale of its Hong Kong life insurance business at a valuation that, in our view, was quite favorable.
Takara Leben is a midsized condominium developer in Japan. The company rapidly expanded its solar farm capacity and expressed its intention to list its solar power assets on a proposed infrastructure market. The financial vehicle holding the solar power assets would be similar to a real estate investment trust, and the capitalization rate on similar assets in 2015 implied a higher value for the solar assets than indicated by the share price. Events in 2015 brought the company’s plan closer to fruition. After prolonged discussion, in February the Tokyo Stock Exchange (TSE) announced its planned launch of an infrastructure development market. Takara Leben became a member of the Investment Trust Association of Japan in September, as required before the company could apply for an initial public offering (IPO) of its solar assets on the proposed TSE infrastructure market. In December, Japan’s government proposed to lengthen the tax-free period from 10 to 20 years for listed renewable infrastructure securities, such as Takara Leben’s pending IPO.
During the period under review, some of the Fund’s investments that negatively affected performance were bank holding company CIT Group, investment management holding company First Pacific and China Pacific Insurance.
CIT Group is a commercial financing and leasing company that primarily serves small and midsized businesses in a variety of industries. Shares of CIT declined due to factors including lackluster performance by the company’s legacy operations, uncertainty about the potential financial gain from its July acquisition of OneWest Bank, and uncertainty regarding the valuation CIT might obtain for the planned sale or spin-off of its aircraft leasing division. Investor concerns were magnified by management changes in October, including the departure of the chief financial officer, the naming of a replacement and the announced March 2016 retirement of the chief executive officer. As of year-end, we believed CIT’s core businesses were well positioned to grow given the company’s ample capital and stable deposit funding base. We also believe the split or sale of the aircraft leasing business will allow management to focus on a simpler regional bank business model.
Hong Kong-based First Pacific manages investments primarily in telecommunications, infrastructure, consumer food products and natural resources. Shares of First Pacific were negatively impacted by weaker performance of its telecommunication asset PLDT and food group Indofood Suskes, as well as currency translation of the earnings from assets domiciled in Indonesia and the Philippines.
China Pacific Insurance is a major insurance conglomerate in mainland China, ranking among the top three in the life and property and casualty markets. Its shares were hindered from June through August by the broad-based sell-off in China’s equity markets. However, the stock recovered slightly in September, due in part to half-year results released at the end of August that exceeded investors’ expectations. Aiding the results were better-than-expected growth in the value of new business in its life insurance division and improving property and casualty underwriting results.
During the year, the Fund held currency forwards and futures to hedge a portion of the currency risk of the portfolio’s non-U.S. dollar investments. The currency forwards had a positive impact on the Fund’s performance during the period, and currency futures had a negligible impact.
What is a currency forward contract?
A currency forward contract, or a currency forward, is an agreement between the Fund and a counterparty to buy or sell a foreign currency at a specific exchange rate on a future date.
What is a futures contract?
A futures contract, or a future, is an agreement between the Fund and a counterparty made through a U.S. or foreign futures exchange to buy or sell an underlying instrument or asset at a specific price on a future date.
6 Annual Report
franklintempleton.com
FRANKLIN MUTUAL FINANCIAL SERVICES FUND
Thank you for your continued participation in Franklin Mutual Financial Services Fund. We look forward to continuing to serve your investment needs.

The foregoing information reflects our analysis, opinions and portfolio holdings as of December 31, 2015, the end of the reporting period. The way we implement our main investment strategies and the resulting portfolio holdings may change depending on factors such as market and economic conditions. These opinions may not be relied upon as investment advice or an offer for a particular security. The information is not a complete analysis of every aspect of any market, country, industry, security or the Fund. Statements of fact are from sources considered reliable, but the investment manager makes no representation or warranty as to their completeness or accuracy. Although historical performance is no guarantee of future results, these insights may help you understand our investment management philosophy.
CFA® is a trademark owned by CFA Institute.
Andrew Sleeman has been portfolio manager for Franklin Mutual Financial Services Fund since 2009. He has also been a co-portfolio manager for Franklin Mutual International Fund since 2009. Mr. Sleeman joined Franklin Templeton Investments in 2007. Previously, he was with Fox-Pitt, Kelton, a financials specialist firm, where he focused on international financial equities. Prior to that, he worked in international equities at BNP Paribas.
Mr. Sleeman also worked in Australia in the fixed income division of JP Morgan Investment Management.
Richard Cetlin has been assistant portfolio manager for Franklin Mutual Financial Services Fund since 2010 with primary coverage of European banks. Prior to joining Franklin Templeton Investments in 2010, Mr. Cetlin was a consultant for Asian Century Quest, a hedge fund focused on the Asia-Pacific region. In this role, he focused on the analysis of banking, insurance and real estate stocks in China and banking stocks in Hong Kong and Korea. Prior to that, Mr. Cetlin worked for 14 years at AllianceBernstein where he was a senior vice president and senior analyst for U.S. banking and specialty finance.
Andrew Dinnhaupt has been assistant portfolio manager for Franklin Mutual Financial Services Fund since December 2013 and has been an analyst for Franklin Mutual Advisers since 2011, specializing in the global insurance industry. Previously, Mr. Dinnhaupt was a portfolio manager and senior analyst covering the global financial services sector for RBC Capital Markets. Prior to RBC, Mr. Dinnhaupt worked at several hedge funds where he was responsible for analyzing and managing portfolios in the financial services sector. Before that, he worked at Mitchell Hutchins Asset Management where he covered the financial services industry.
franklintempleton.com
Annual Report 7
FRANKLIN MUTUAL FINANCIAL SERVICES FUND
Performance Summary as of December 31, 2015
Your dividend income will vary depending on dividends or interest paid by securities in the Fund’s portfolio, adjusted for operating expenses of each class. Capital gain distributions are net profits realized from the sale of portfolio securities. The performance table and graphs do not reflect any taxes that a shareholder would pay on Fund dividends, capital gain distributions, if any, or any realized gains on the sale of Fund shares. Total return reflects reinvestment of the Fund’s dividends and capital gain distributions, if any, and any unrealized gains or losses.
| Net Asset Value | |||||
| Share Class (Symbol) | 12/31/15 | 12/31/14 | Change | ||
| Z (TEFAX) | $ | 19.63 | $ | 18.40 | +$1.23 |
| A (TFSIX) | $ | 19.69 | $ | 18.46 | +$1.23 |
| C (TMFSX) | $ | 19.61 | $ | 18.40 | +$1.21 |
| R6 (FMFVX) | $ | 19.76 | $ | 18.52 | +$1.24 |
| Distributions1 (1/1/15–12/31/15) | ||
| Dividend | ||
| Share Class | Income | |
| Z | $ | 0.2984 |
| A | $ | 0.2501 |
| C | $ | 0.1385 |
| R6 | $ | 0.3245 |
See page 12 for Performance Summary footnotes.
8 Annual Report
franklintempleton.com
FRANKLIN MUTUAL FINANCIAL SERVICES FUND
PERFORMANCE SUMMARY
Performance as of 12/31/15
Cumulative total return excludes sales charges. Average annual total return and value of $10,000 investment include maximum sales charges. Class Z/R6: no sales charges; Class A: 5.75% maximum initial sales charge; Class C: 1% contingent deferred sales charge in first year only.
| Cumulative | Average Annual | Value of $10,000 | Total Annual Operating Expenses5 | |||||||
| Share Class | Total Return2 | Total Return3 | Investment4 | (with waiver) | (without waiver) | |||||
| Z | 1.14 | % | 1.14 | % | ||||||
| 1-Year | +8.34 | % | +8.34 | % | $ | 10,834 | ||||
| 5-Year | +64.64 | % | +10.49 | % | $ | 16,464 | ||||
| 10-Year | +39.71 | % | +3.40 | % | $ | 13,971 | ||||
| A | 1.44 | % | 1.44 | % | ||||||
| 1-Year | +8.05 | % | +1.82 | % | $ | 10,182 | ||||
| 5-Year | +62.20 | % | +8.85 | % | $ | 15,283 | ||||
| 10-Year | +35.63 | % | +2.49 | % | $ | 12,782 | ||||
| C | 2.14 | % | 2.14 | % | ||||||
| 1-Year | +7.30 | % | +6.30 | % | $ | 10,630 | ||||
| 5-Year | +56.61 | % | +9.39 | % | $ | 15,661 | ||||
| 10-Year | +26.43 | % | +2.37 | % | $ | 12,643 | ||||
| R66 | 0.97 | % | 2.61 | % | ||||||
| 1-Year | +8.55 | % | +8.55 | % | $ | 10,855 | ||||
| Since Inception (5/1/13) | +38.67 | % | +13.03 | % | $ | 13,867 | ||||
Performance data represent past performance, which does not guarantee future results. Investment return and principal value will fluctuate, and you may have a gain or loss when you sell your shares. Current performance may differ from figures shown. For most recent month-end performance, go to franklintempleton.com or call (800) 342-5236.
See page 12 for Performance Summary footnotes.
franklintempleton.com
Annual Report 9
FRANKLIN MUTUAL FINANCIAL SERVICES FUND
PERFORMANCE SUMMARY
Total Return Index Comparison for a Hypothetical $10,000 Investment
Total return represents the change in value of an investment over the periods shown. It includes any applicable maximum sales charge, Fund expenses, account fees and reinvested distributions. The unmanaged indexes include reinvestment of any income or distributions. They differ from the Fund in composition and do not pay management fees or expenses. One cannot invest directly in an index.
See page 12 for Performance Summary footnotes.
10 Annual Report
franklintempleton.com
FRANKLIN MUTUAL FINANCIAL SERVICES FUND
PERFORMANCE SUMMARY
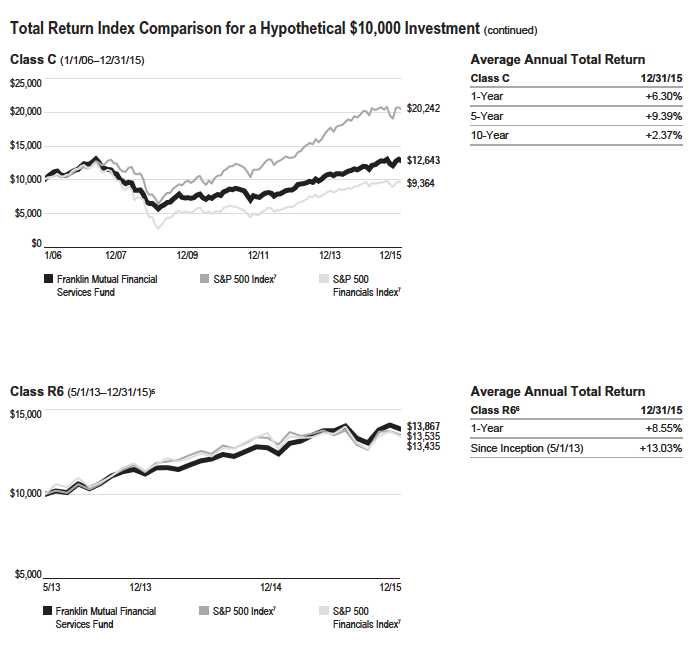
See page 12 for Performance Summary footnotes.
franklintempleton.com
Annual Report
11
FRANKLIN MUTUAL FINANCIAL SERVICES FUND
PERFORMANCE SUMMARY
All investments involve risks, including possible loss of principal. Value securities may not increase in price as anticipated or may decline further in value. Investing in a single-sector fund involves special risks, including greater sensitivity to economic, political or regulatory developments impacting the sector. In addition, the Fund invests in foreign securities whose risks include currency fluctuations, and economic and political uncertainties. The Fund’s investments in smaller company stocks carry an increased risk of price fluctuation, particularly over the short term. The Fund may also invest in companies engaged in mergers, reorganizations or liquidations, which involve special risks as pending deals may not be completed on time or on favorable terms, as well as lower rated bonds, which entail higher credit risk. The Fund is actively managed but there is no guarantee that the manager’s investment decisions will produce the desired results. The Fund’s prospectus also includes a description of the main investment risks.
| Class Z: | Shares are available to certain eligible investors as described in the prospectus. |
| Class C: | These shares have higher annual fees and expenses than Class A shares. |
| Class R6: | Shares are available to certain eligible investors as described in the prospectus. |
1. The distribution amount is the sum of the dividend payments to shareholders for the period shown and includes only estimated tax-basis net investment income.
2. Cumulative total return represents the change in value of an investment over the periods indicated.
3. Average annual total return represents the average annual change in value of an investment over the periods indicated. Return for less than one year, if any, has not
been annualized.
4. These figures represent the value of a hypothetical $10,000 investment in the Fund over the periods indicated.
5. Figures are as stated in the Fund’s current prospectus. In periods of market volatility, assets may decline significantly, causing total annual Fund operating expenses to
become higher than the figures shown.
6. The transfer agent has contractually agreed to cap transfer agency fees for Class R6 shares so that transfer agency fees for that class do not exceed 0.01% until at least
4/30/16. Investment results reflect the fee cap, to the extent applicable; without this fee cap, the results would have been lower.
7. Source: Morningstar. The S&P 500 Index is a market capitalization-weighted index of 500 stocks designed to measure total U.S. equity market performance. The S&P 500
Financials Index is market capitalization weighted and consists of all financial stocks in the S&P 500 Index.
See www.franklintempletondatasources.com for additional data provider information.
12 Annual Report
franklintempleton.com
FRANKLIN MUTUAL FINANCIAL SERVICES FUND
Your Fund’s Expenses
As a Fund shareholder, you can incur two types of costs:
- Transaction costs, including sales charges (loads) on Fund purchases; and
- Ongoing Fund costs, including management fees, distribu- tion and service (12b-1) fees, and other Fund expenses. All mutual funds have ongoing costs, sometimes referred to as operating expenses.
The following table shows ongoing costs of investing in the Fund and can help you understand these costs and compare them with those of other mutual funds. The table assumes a $1,000 investment held for the six months indicated.
Actual Fund Expenses
The first line (Actual) for each share class listed in the table provides actual account values and expenses. The “Ending Account Value” is derived from the Fund’s actual return, which includes the effect of Fund expenses.
You can estimate the expenses you paid during the period by following these steps. Of course, your account value and expenses will differ from those in this illustration:
1. Divide your account value by $1,000.
If an account had an $8,600 value, then $8,600 ÷ $1,000 = 8.6.
2. Multiply the result by the number under the heading “Expenses Paid During Period.”
If Expenses Paid During Period were $7.50, then 8.6 × $7.50 = $64.50.
In this illustration, the estimated expenses paid this period are $64.50.
Hypothetical Example for Comparison with Other Funds
Information in the second line (Hypothetical) for each class in the table can help you compare ongoing costs of investing in the Fund with those of other mutual funds. This information may not be used to estimate the actual ending account balance or expenses you paid during the period. The hypothetical “Ending Account Value” is based on the actual expense ratio for each class and an assumed 5% annual rate of return before expenses, which does not represent the Fund’s actual return. The figure under the heading “Expenses Paid During Period” shows the hypothetical expenses your account would have incurred under this scenario. You can compare this figure with the 5% hypothetical examples that appear in shareholder reports of other funds.
Please note that expenses shown in the table are meant to highlight ongoing costs and do not reflect any transaction costs, such as sales charges. Therefore, the second line for each class is useful in comparing ongoing costs only, and will not help you compare total costs of owning different funds. In addition, if transaction costs were included, your total costs would have been higher. Please refer to the Fund prospectus for additional information on operating expenses.
franklintempleton.com
Annual Report
13
| FRANKLIN MUTUAL FINANCIAL SERVICES FUND |
| YOUR FUND’S EXPENSES |
| Beginning Account | Ending Account | Expenses Paid During | ||||
| Share Class | Value 7/1/15 | Value 12/31/15 | Period* 7/1/15–12/31/15 | |||
| Z | ||||||
| Actual | $ | 1,000 | $ | 1,006.80 | $ | 5.77 |
| Hypothetical (5% return before expenses) | $ | 1,000 | $ | 1,019.46 | $ | 5.80 |
| A | ||||||
| Actual | $ | 1,000 | $ | 1,005.90 | $ | 7.08 |
| Hypothetical (5% return before expenses) | $ | 1,000 | $ | 1,018.15 | $ | 7.12 |
| C | ||||||
| Actual | $ | 1,000 | $ | 1,001.70 | $ | 10.80 |
| Hypothetical (5% return before expenses) | $ | 1,000 | $ | 1,014.42 | $ | 10.87 |
| R6 | ||||||
| Actual | $ | 1,000 | $ | 1,007.60 | $ | 4.86 |
| Hypothetical (5% return before expenses) | $ | 1,000 | $ | 1,020.37 | $ | 4.89 |
*Expenses are calculated using the most recent six-month expense ratio, annualized for each class (Z: 1.14%; A: 1.40%; C: 2.14%; and R6: 0.96% (net of expense waivers)), multiplied by the average account value over the period, multiplied by 184/365 to reflect the one-half year period.
14 Annual Report
franklintempleton.com
FRANKLIN MUTUAL FINANCIAL SERVICES FUND
| Financial Highlights | |||||||||||||||
| Year Ended December 31, | |||||||||||||||
| 2015 | 2014 | 2013 | 2012 | 2011 | |||||||||||
| Class Z | |||||||||||||||
| Per share operating performance | |||||||||||||||
| (for a share outstanding throughout the year) | |||||||||||||||
| Net asset value, beginning of year | $ | 18.40 | $ | 16.90 | $ | 13.59 | $ | 11.53 | $ | 13.01 | |||||
| Income from investment operationsa: | |||||||||||||||
| Net investment incomeb | 0.30 | c | 0.25 | 0.24 | 0.20 | 0.28 | |||||||||
| Net realized and unrealized gains (losses) | 1.23 | 1.62 | 3.24 | 2.09 | (1.48 | ) | |||||||||
| Total from investment operations | 1.53 | 1.87 | 3.48 | 2.29 | (1.20 | ) | |||||||||
| Less distributions from net investment income | (0.30 | ) | (0.37 | ) | (0.17 | ) | (0.23 | ) | (0.28 | ) | |||||
| Net asset value, end of year | $ | 19.63 | $ | 18.40 | $ | 16.90 | $ | 13.59 | $ | 11.53 | |||||
| Total return | 8.34 | % | 11.07 | % | 25.67 | % | 19.98 | % | (9.26 | )% | |||||
| Ratios to average net assets | |||||||||||||||
| Expenses | 1.13 | %d | 1.14 | %d | 1.16 | %d | 1.24 | % | 1.24 | % | |||||
| Net investment income | 1.53 | %c | 1.44 | % | 1.51 | % | 1.56 | % | 2.22 | % | |||||
| Supplemental data | |||||||||||||||
| Net assets, end of year (000’s) | $ | 178,157 | $ | 112,156 | $ | 105,279 | $ | 86,519 | $ | 80,105 | |||||
| Portfolio turnover rate | 25.43 | % | 33.69 | % | 25.73 | % | 12.65 | % | 23.58 | % | |||||
aThe amount shown for a share outstanding throughout the period may not correlate with the Statement of Operations for the period due to the timing of sales and repurchases
of the Fund’s shares in relation to income earned and/or fluctuating fair value of the investments of the Fund.
bBased on average daily shares outstanding.
cNet investment income per share includes approximately $0.14 per share related to income received in the form of special dividends in connection with certain Fund holdings.
Excluding this amount, the ratio of net investment income to average net assets would have been 0.81%.
dBenefit of expense reduction rounds to less than 0.01%.
franklintempleton.com
The accompanying notes are an integral part of these financial statements. | Annual Report 15
FRANKLIN MUTUAL FINANCIAL SERVICES FUND
FINANCIAL H IGHLIGHTS
| Year Ended December 31, | |||||||||||||||
| 2015 | 2014 | 2013 | 2012 | 2011 | |||||||||||
| Class A | |||||||||||||||
| Per share operating performance | |||||||||||||||
| (for a share outstanding throughout the year) | |||||||||||||||
| Net asset value, beginning of year | $ | 18.46 | $ | 16.96 | $ | 13.64 | $ | 11.57 | $ | 13.05 | |||||
| Income from investment operationsa: | |||||||||||||||
| Net investment incomeb | 0.25 | c | 0.20 | 0.19 | 0.16 | 0.25 | |||||||||
| Net realized and unrealized gains (losses) | 1.23 | 1.61 | 3.26 | 2.10 | (1.49 | ) | |||||||||
| Total from investment operations | 1.48 | 1.81 | 3.45 | 2.26 | (1.24 | ) | |||||||||
| Less distributions from net investment income | (0.25 | ) | (0.31 | ) | (0.13 | ) | (0.19 | ) | (0.24 | ) | |||||
| Net asset value, end of year | $ | 19.69 | $ | 18.46 | $ | 16.96 | $ | 13.64 | $ | 11.57 | |||||
| Total returnd | 8.05 | % | 10.71 | % | 25.32 | % | 19.55 | % | (9.49 | )% | |||||
| Ratios to average net assets | |||||||||||||||
| Expenses | 1.41 | %e | 1.44 | %e | 1.46 | %e | 1.54 | % | 1.54 | % | |||||
| Net investment income | 1.25 | %c | 1.14 | % | 1.21 | % | 1.26 | % | 1.92 | % | |||||
| Supplemental data | |||||||||||||||
| Net assets, end of year (000’s) | $ | 360,278 | $ | 255,242 | $ | 240,529 | $ | 184,681 | $ | 173,167 | |||||
| Portfolio turnover rate | 25.43 | % | 33.69 | % | 25.73 | % | 12.65 | % | 23.58 | % | |||||
aThe amount shown for a share outstanding throughout the period may not correlate with the Statement of Operations for the period due to the timing of sales and repurchases
of the Fund’s shares in relation to income earned and/or fluctuating fair value of the investments of the Fund.
bBased on average daily shares outstanding.
cNet investment income per share includes approximately $0.14 per share related to income received in the form of special dividends in connection with certain Fund holdings.
Excluding this amount, the ratio of net investment income to average net assets would have been 0.53%.
dTotal return does not reflect sales commissions or contingent deferred sales charges, if applicable.
eBenefit of expense reduction rounds to less than 0.01%.
16 Annual Report | The accompanying notes are an integral part of these financial statements.
franklintempleton.com
FRANKLIN MUTUAL FINANCIAL SERVICES FUND
FINANCIAL H IGHLIGHTS
| Year Ended December 31, | |||||||||||||||
| 2015 | 2014 | 2013 | 2012 | 2011 | |||||||||||
| Class C | |||||||||||||||
| Per share operating performance | |||||||||||||||
| (for a share outstanding throughout the year) | |||||||||||||||
| Net asset value, beginning of year | $ | 18.41 | $ | 16.92 | $ | 13.61 | $ | 11.55 | $ | 13.01 | |||||
| Income from investment operationsa: | |||||||||||||||
| Net investment incomeb | 0.10 | c | 0.08 | 0.08 | 0.07 | 0.16 | |||||||||
| Net realized and unrealized gains (losses) | 1.24 | 1.60 | 3.25 | 2.08 | (1.48 | ) | |||||||||
| Total from investment operations | 1.34 | 1.68 | 3.33 | 2.15 | (1.32 | ) | |||||||||
| Less distributions from net investment income | (0.14 | ) | (0.19 | ) | (0.02 | ) | (0.09 | ) | (0.14 | ) | |||||
| Net asset value, end of year | $ | 19.61 | $ | 18.41 | $ | 16.92 | $ | 13.61 | $ | 11.55 | |||||
| Total returnd | 7.30 | % | 9.93 | % | 24.50 | % | 18.67 | % | (10.13 | )% | |||||
| Ratios to average net assets | |||||||||||||||
| Expenses | 2.13 | %e | 2.14 | %e | 2.16 | %e | 2.24 | % | 2.24 | % | |||||
| Net investment income | 0.53 | %c | 0.44 | % | 0.51 | % | 0.56 | % | 1.22 | % | |||||
| Supplemental data | |||||||||||||||
| Net assets, end of year (000’s) | $ | 132,975 | $ | 89,341 | $ | 86,370 | $ | 69,046 | $ | 68,324 | |||||
| Portfolio turnover rate | 25.43 | % | 33.69 | % | 25.73 | % | 12.65 | % | 23.58 | % | |||||
aThe amount shown for a share outstanding throughout the period may not correlate with the Statement of Operations for the period due to the timing of sales and repurchases
of the Fund’s shares in relation to income earned and/or fluctuating fair value of the investments of the Fund.
bBased on average daily shares outstanding.
cNet investment income per share includes approximately $0.14 per share related to income received in the form of special dividends in connection with certain Fund holdings.
Excluding this amount, the ratio of net investment income to average net assets would have been (0.19)%.
dTotal return does not reflect sales commissions or contingent deferred sales charges, if applicable.
eBenefit of expense reduction rounds to less than 0.01%.
franklintempleton.com
The accompanying notes are an integral part of these financial statements. | Annual Report 17
FRANKLIN MUTUAL FINANCIAL SERVICES FUND
FINANCIAL H IGHLIGHTS
| Year Ended December 31, | |||||||||
| 2015 | 2014 | 2013 | a | ||||||
| Class R6 | |||||||||
| Per share operating performance | |||||||||
| (for a share outstanding throughout the year) | |||||||||
| Net asset value, beginning of year | $ | 18.52 | $ | 16.88 | $ | 14.89 | |||
| Income from investment operationsb: | |||||||||
| Net investment incomec | 0.07 | d | 0.25 | 0.13 | |||||
| Net realized and unrealized gains (losses) | 1.49 | 1.66 | 2.07 | ||||||
| Total from investment operations | 1.56 | 1.91 | 2.20 | ||||||
| Less distributions from net investment income | (0.32 | ) | (0.27 | ) | (0.21 | ) | |||
| Net asset value, end of year | $ | 19.76 | $ | 18.52 | $ | 16.88 | |||
| Total returne | 8.55 | % | 11.23 | % | 14.86 | % | |||
| Ratios to average net assetsf | |||||||||
| Expenses before waiver, payments by affiliates and expense reduction | 1.16 | % | 2.61 | % | 2.18 | % | |||
| Expenses net of waiver, payments by affiliates and expense reductiong | 0.96 | % | 0.97 | % | 0.97 | % | |||
| Net investment income | 1.70 | %d | 1.61 | % | 1.70 | % | |||
| Supplemental data | |||||||||
| Net assets, end of year (000’s) | $ | 1,421 | $ | 12 | $ | 6 | |||
| Portfolio turnover rate | 25.43 | % | 33.69 | % | 25.73 | % | |||
aFor the period May 1, 2013 (effective date) to December 31, 2013.
bThe amount shown for a share outstanding throughout the period may not correlate with the Statement of Operations for the period due to the timing of sales and repurchases
of the Fund’s shares in relation to income earned and/or fluctuating fair value of the investments of the Fund.
cBased on average daily shares outstanding.
dNet investment income per share includes approximately $0.14 per share related to income received in the form of special dividends in connection with certain Fund holdings.
Excluding this amount, the ratio of net investment income to average net assets would have been 0.98%.
eTotal return is not annualized for periods less than one year.
fRatios are annualized for periods less than one year.
gBenefit of expense reduction rounds to less than 0.01%.
18 Annual Report | The accompanying notes are an integral part of these financial statements.
franklintempleton.com
FRANKLIN MUTUAL FINANCIAL SERVICES FUND
| Statement of Investments, December 31, 2015 | ||||
| Country | Shares/Units | Value | ||
| Common Stocks and Other Equity Interests 85.7% | ||||
| Banks 27.3% | ||||
| a,bAB&T Financial Corp | United States | 226,100 | $ | 76,874 |
| Barclays PLC | United Kingdom | 1,522,675 | 4,912,876 | |
| BB&T Corp | United States | 165,180 | 6,245,456 | |
| BNP Paribas SA | France | 71,270 | 4,043,492 | |
| Capital Bank Financial Corp., A | United States | 42,649 | 1,363,915 | |
| cCapital Bank Financial Corp., B, 144A, non-voting | United States | 153,021 | 4,893,611 | |
| CIT Group Inc | United States | 546,680 | 21,703,196 | |
| Citigroup Inc | United States | 83,399 | 4,315,898 | |
| Citizens Financial Group Inc | United States | 574,836 | 15,054,955 | |
| Columbia Banking System Inc | United States | 141,188 | 4,590,022 | |
| aFCB Financial Holdings Inc., A | United States | 356,409 | 12,755,878 | |
| Guaranty Bancorp | United States | 266,761 | 4,412,227 | |
| HSBC Holdings PLC | United Kingdom | 1,615,010 | 12,763,940 | |
| JPMorgan Chase & Co | United States | 156,190 | 10,313,226 | |
| KB Financial Group Inc | South Korea | 107,348 | 3,027,785 | |
| PNC Financial Services Group Inc | United States | 94,970 | 9,051,591 | |
| aRoyal Bank of Scotland Group PLC | United Kingdom | 1,152,670 | 5,130,913 | |
| a,cShawbrook Group PLC, 144A | United Kingdom | 426,514 | 2,200,940 | |
| Southern National Bancorp of Virginia Inc | United States | 547,560 | 7,151,134 | |
| Standard Chartered PLC | United Kingdom | 956,190 | 7,944,653 | |
| State Bank Financial Corp | United States | 416,160 | 8,751,845 | |
| SunTrust Banks Inc | United States | 333,790 | 14,299,564 | |
| UniCredit SpA | Italy | 625,394 | 3,488,381 | |
| Wells Fargo & Co | United States | 284,820 | 15,482,815 | |
| 183,975,187 | ||||
| Capital Markets 3.3% | ||||
| aChina International Capital Corp. Ltd., H | China | 4,425,001 | 7,205,475 | |
| Credit Suisse Group AG | Switzerland | 307,290 | 6,651,816 | |
| UBS Group AG | Switzerland | 441,330 | 8,597,567 | |
| 22,454,858 | ||||
| Consumer Finance 4.1% | ||||
| Capital One Financial Corp | United States | 194,100 | 14,010,138 | |
| a,cHoist Finance AB, 144A | Sweden | 373,060 | 3,909,926 | |
| Sun Hung Kai & Co. Ltd | Hong Kong | 14,145,704 | 9,308,606 | |
| 27,228,670 | ||||
| Diversified Financial Services 2.1% | ||||
| First Pacific Co. Ltd | Hong Kong | 7,786,902 | 5,164,374 | |
| Oslo Bors VPS Holding ASA | Norway | 911,000 | 9,014,600 | |
| 14,178,974 | ||||
| Household Durables 1.0% | ||||
| aCairn Homes PLC | Ireland | 2,388,116 | 3,099,939 | |
| a,cCairn Homes PLC, 144A | Ireland | 2,988,749 | 3,879,601 | |
| 6,979,540 | ||||
| Insurance 41.4% | ||||
| ACE Ltd | United States | 185,780 | 21,708,393 | |
| Ageas | Belgium | 256,999 | 11,948,269 | |
| aAlleghany Corp | United States | 18,637 | 8,907,181 | |
| The Allstate Corp | United States | 237,086 | 14,720,670 | |
| American International Group Inc | United States | 375,458 | 23,267,132 | |
| Argo Group International Holdings Ltd | United States | 198,441 | 11,874,710 | |
franklintempleton.com
Annual Report
19
FRANKLIN MUTUAL FINANCIAL SERVICES FUND
STATEMENT O F INVESTMENTS
| Country | Shares/Units | Value | ||
| Common Stocks and Other Equity Interests (continued) | ||||
| Insurance (continued) | ||||
| Assicurazioni Generali SpA | Italy | 416,743 | $ | 7,659,465 |
| China Pacific Insurance (Group) Co. Ltd., H | China | 2,979,740 | 12,245,533 | |
| CNO Financial Group Inc | United States | 755,060 | 14,414,095 | |
| Direct Line Insurance Group PLC | United Kingdom | 2,164,854 | 13,002,862 | |
| aEnstar Group Ltd | United States | 51,919 | 7,789,927 | |
| Korean Reinsurance Co | South Korea | 622,180 | 7,490,660 | |
| Lancashire Holdings Ltd | United Kingdom | 633,269 | 5,861,795 | |
| Maiden Holdings Ltd | United States | 637,820 | 9,509,896 | |
| MetLife Inc | United States | 272,020 | 13,114,084 | |
| NN Group NV | Netherlands | 544,508 | 19,252,407 | |
| PartnerRe Ltd | United States | 50,384 | 7,040,660 | |
| PICC Property and Casualty Co. Ltd., H | China | 4,940,284 | 9,803,884 | |
| RSA Insurance Group PLC | United Kingdom | 1,851,271 | 11,637,824 | |
| State National Cos. Inc | United States | 373,757 | 3,666,556 | |
| cState National Cos. Inc.144A | United States | 350,000 | 3,433,500 | |
| aStorebrand ASA | Norway | 1,200,174 | 4,743,637 | |
| UNIQA Insurance Group AG | Austria | 564,365 | 4,613,137 | |
| White Mountains Insurance Group Ltd | United States | 12,068 | 8,771,143 | |
| XL Group PLC | Ireland | 570,422 | 22,349,134 | |
| 278,826,554 | ||||
| Real Estate Investment Trusts (REITs) 1.4% | ||||
| Hibernia REIT PLC | Ireland | 6,124,132 | 9,366,492 | |
| Real Estate Management & Development 3.8% | ||||
| Dalian Wanda Commercial Properties Co. Ltd., H | China | 1,597,400 | 9,336,880 | |
| aDolphin Capital Investors Ltd | Greece | 3,979,650 | 850,542 | |
| Hang Lung Properties Ltd | Hong Kong | 1,277,000 | 2,906,560 | |
| Takara Leben Co. Ltd | Japan | 2,175,700 | 12,236,559 | |
| 25,330,541 | ||||
| Thrifts & Mortgage Finance 1.3% | ||||
| Cape Bancorp Inc | United States | 264,663 | 3,289,761 | |
| Genworth Mortgage Insurance Australia Ltd | Australia | 2,553,677 | 5,134,576 | |
| 8,424,337 | ||||
| Total Common Stocks and Other Equity Interests | ||||
| (Cost $520,090,724) | 576,765,153 | |||
| Convertible Preferred Stocks (Cost $122,400) 0.1% | ||||
| Banks 0.1% | ||||
| Columbia Banking System Inc., cvt. pfd., B | United States | 1,224 | 463,818 | |
| Preferred Stocks 0.8% | ||||
| Diversified Financial Services 0.8% | ||||
| a,dHightower Holding LLC, pfd., A | United States | 3,000,000 | 3,302,700 | |
| a,dHightower Holding LLC, pfd., A, Series 2 | United States | 968,000 | 2,298,710 | |
| Total Preferred Stocks (Cost $4,782,324) | 5,601,410 | |||
| Companies in Liquidation 0.1% | ||||
| a,dFIM Coinvestor Holdings I, LLC | United States | 4,357,178 | — | |
| a,eLehman Brothers Holdings Inc., Bankruptcy Claim | United States | 7,766,103 | 436,843 | |
| Total Companies in Liquidation (Cost $765,665) | 436,843 | |||
| Total Investments before Short Term Investments | ||||
| (Cost $525,761,113) | 583,267,224 |
20 Annual Report
franklintempleton.com
FRANKLIN MUTUAL FINANCIAL SERVICES FUND
STATEMENT O F INVESTMENTS
| Principal | |||||
| Country | Amount | Value | |||
| Short Term Investments 11.9% | |||||
| U.S. Government and Agency Securities 11.9% | |||||
| FHLB, | |||||
| 1/04/16 | United States | $ | 3,200,000 | $ | 3,200,000 |
| f1/05/16 | United States | 5,000,000 | 4,999,980 | ||
| fU.S. Treasury Bill, | |||||
| 1/07/16 | United States | 20,500,000 | 20,499,918 | ||
| 1/21/16 | United States | 16,000,000 | 15,999,344 | ||
| 1/28/16 | United States | 10,000,000 | 9,999,180 | ||
| 1/14/16 - 6/09/16 | United States | 25,700,000 | 25,666,987 | ||
| Total U.S. Government and Agency Securities | |||||
| (Cost $80,362,608) | 80,365,409 | ||||
| Total Investments (Cost $606,123,721) 98.6% | 663,632,633 | ||||
| Other Assets, less Liabilities 1.4% | 9,198,268 | ||||
| Net Assets 100.0% | $ | 672,830,901 | |||
aNon-income producing.
bSee Note 10 regarding holdings of 5% voting securities.
cSecurity was purchased pursuant to Rule 144A under the Securities Act of 1933 and may be sold in transactions exempt from registration only to qualified institutional buyers
or in a public offering registered under the Securities Act of 1933. These securities have been deemed liquid under guidelines approved by the Trust’s Board of Trustees. At
December 31, 2015, the aggregate value of these securities was $18,317,578, representing 2.72% of net assets.
dSee Note 8 regarding restricted securities.
eBankruptcy claims represent the right to receive distributions, if any, during the liquidation of the underlying pool of assets. Shares represent amount of allowed unsecured
claims.
| fThe security is traded on a discount basis with no stated coupon rate. | |||||||||
| At December 31, 2015, the Fund had the following futures contracts outstanding. See Note 1(c). | |||||||||
| Futures Contracts | |||||||||
| Number of | Notional | Expiration | Unrealized | Unrealized | |||||
| Description | Type | Contracts | Value | Date | Appreciation | Depreciation | |||
| Currency Contracts | |||||||||
| CHF/USD | Short | 1 | $ | 125,400 | 3/14/16 | $ | 1,059 | $ | — |
| EUR/USD | Short | 120 | 16,329,000 | 3/14/16 | 7,522 | — | |||
| GBP/USD | Short | 149 | 13,721,038 | 3/14/16 | 350,747 | — | |||
| Total Futures Contracts | $ | 359,328 | $ | — | |||||
| Net unrealized appreciation (depreciation) | $ | 359,328 | |||||||
franklintempleton.com
Annual Report
21
FRANKLIN MUTUAL FINANCIAL SERVICES FUND
STATEMENT O F INVESTMENTS
| At December 31, 2015, the Fund had the following forward exchange contracts outstanding. See Note 1(c). | |||||||||||
| Forward Exchange Contracts | |||||||||||
| Contract | Settlement | Unrealized | Unrealized | ||||||||
| Currency | Counterpartya Type | Quantity | Amount | Date | Appreciation | Depreciation | |||||
| OTC Forward Exchange Contracts | |||||||||||
| Euro | BANT | Buy | 179,652 | $ | 198,190 | 1/06/16 | $ | — | $ | (3,013 | ) |
| Euro | BONY | Buy | 146,276 | 161,379 | 1/06/16 | — | (2,462 | ) | |||
| Euro | BONY | Sell | 2,225,248 | 2,433,865 | 1/06/16 | 16,323 | — | ||||
| Euro | DBFX | Buy | 215,676 | 237,974 | 1/06/16 | — | (3,660 | ) | |||
| Euro | FBCO | Buy | 179,648 | 198,280 | 1/06/16 | — | (3,108 | ) | |||
| Euro | HSBC | Buy | 143,636 | 158,100 | 1/06/16 | — | (2,051 | ) | |||
| Euro | SSBT | Buy | 143,630 | 158,091 | 1/06/16 | — | (2,050 | ) | |||
| Euro | SSBT | Sell | 4,331,694 | 4,767,550 | 1/06/16 | 61,534 | — | ||||
| Euro | BANT | Buy | 48,601 | 53,378 | 1/20/16 | — | (558 | ) | |||
| Euro | BANT | Sell | 303,242 | 344,499 | 1/20/16 | 14,936 | — | ||||
| Euro | BBU | Sell | 49,467 | 54,142 | 1/20/16 | 381 | — | ||||
| Euro | BONY | Sell | 44,047 | 48,234 | 1/20/16 | 365 | — | ||||
| Euro | DBFX | Buy | 122,856 | 135,201 | 1/20/16 | — | (1,681 | ) | |||
| Euro | DBFX | Sell | 1,102,776 | 1,218,898 | 1/20/16 | 20,402 | — | ||||
| Euro | FBCO | Buy | 48,601 | 53,243 | 1/20/16 | — | (423 | ) | |||
| Euro | FBCO | Sell | 2,124,885 | 2,327,679 | 1/20/16 | 18,356 | — | ||||
| Euro | HSBC | Buy | 72,907 | 79,954 | 1/20/16 | — | (719 | ) | |||
| Euro | HSBC | Sell | 2,649,206 | 2,920,644 | 1/20/16 | 41,489 | — | ||||
| Euro | SSBT | Buy | 48,601 | 53,428 | 1/20/16 | — | (608 | ) | |||
| Euro | SSBT | Sell | 1,373,666 | 1,530,367 | 1/20/16 | 37,469 | — | ||||
| British Pound | BANT | Sell | 2,903,187 | 4,531,875 | 1/21/16 | 252,479 | — | ||||
| British Pound | BONY | Sell | 94,214 | 144,903 | 1/21/16 | 6,028 | — | ||||
| British Pound | SSBT | Sell | 2,901,539 | 4,530,173 | 1/21/16 | 253,206 | — | ||||
| Australian Dollar | HSBC | Sell | 6,818,299 | 4,918,603 | 1/29/16 | 26 | (41,310 | ) | |||
| South Korean Won | BANT | Buy | 69,849,183 | 60,225 | 2/12/16 | — | (865 | ) | |||
| South Korean Won | BANT | Sell | 3,114,770,379 | 2,665,295 | 2/12/16 | 22,869 | (4,597 | ) | |||
| South Korean Won | FBCO | Sell | 264,377,211 | 228,788 | 2/12/16 | 4,125 | (13 | ) | |||
| South Korean Won | HSBC | Buy | 543,896,417 | 462,452 | 2/12/16 | 1,243 | (1,476 | ) | |||
| South Korean Won | HSBC | Sell | 4,126,119,581 | 3,527,790 | 2/12/16 | 21,478 | (186 | ) | |||
| British Pound | BANT | Sell | 1,218,378 | 1,831,369 | 2/19/16 | 35,370 | — | ||||
| British Pound | DBFX | Sell | 3,690,812 | 5,750,285 | 2/19/16 | 309,697 | — | ||||
| British Pound | FBCO | Buy | 210,494 | 320,117 | 2/19/16 | — | (9,830 | ) | |||
| British Pound | FBCO | Sell | 3,987,326 | 6,212,254 | 2/19/16 | 334,577 | — | ||||
| British Pound | HSBC | Buy | 1,001,123 | 1,517,728 | 2/19/16 | — | (41,982 | ) | |||
| British Pound | HSBC | Sell | 694,257 | 1,036,775 | 2/19/16 | 13,378 | — | ||||
| Euro | BANT | Sell | 1,173,558 | 1,326,362 | 2/22/16 | 49,861 | — | ||||
| Euro | BBU | Sell | 22,920 | 25,869 | 2/22/16 | 938 | — | ||||
| Euro | DBFX | Sell | 174,299 | 196,115 | 2/22/16 | 6,527 | — | ||||
| Euro | FBCO | Sell | 245,621 | 278,174 | 2/22/16 | 11,008 | — | ||||
| Euro | HSBC | Sell | 533,640 | 603,212 | 2/22/16 | 22,761 | — | ||||
| Euro | SSBT | Sell | 347,494 | 392,381 | 2/22/16 | 14,405 | — | ||||
| Swedish Krona | BANT | Buy | 12,790,858 | 1,481,544 | 3/29/16 | 37,216 | — | ||||
| Swedish Krona | BANT | Sell | 10,716,567 | 1,275,121 | 3/29/16 | 2,798 | (140 | ) | |||
| Swedish Krona | BONY | Buy | 1,025,000 | 118,300 | 3/29/16 | 3,407 | — | ||||
| Swedish Krona | BONY | Sell | 1,361,100 | 159,213 | 3/29/16 | — | (2,401 | ) | |||
| Swedish Krona | DBFX | Buy | 386,300 | 44,474 | 3/29/16 | 1,395 | — | ||||
| Swedish Krona | DBFX | Sell | 18,855,503 | 2,254,394 | 3/29/16 | 19,925 | (4,395 | ) | |||
| Swedish Krona | SSBT | Buy | 1,088,308 | 129,285 | 3/29/16 | 270 | (332 | ) | |||
| Swedish Krona | SSBT | Sell | 16,217,555 | 1,921,809 | 3/29/16 | 354 | (4,184 | ) | |||
| Euro | BANT | Sell | 251,457 | 274,652 | 4/01/16 | 844 | — | ||||
| Euro | DBFX | Sell | 1,805,648 | 2,068,063 | 4/01/16 | 101,918 | — | ||||
| Euro | FBCO | Sell | 298,736 | 321,682 | 4/01/16 | — | (3,607 | ) | |||
| Euro | HSBC | Sell | 163,219 | 175,803 | 4/01/16 | — | (1,924 | ) | |||
| Euro | SSBT | Sell | 2,357,110 | 2,664,574 | 4/01/16 | 102,648 | (4,698 | ) | |||
| Euro | BANT | Sell | 2,159,431 | 2,467,797 | 4/18/16 | 115,112 | — | ||||
| Euro | BONY | Sell | 127,164 | 141,044 | 4/18/16 | 2,500 | — | ||||
22 Annual Report
franklintempleton.com
FRANKLIN MUTUAL FINANCIAL SERVICES FUND
STATEMENT O F INVESTMENTS
| Forward Exchange Contracts (continued) | |||||||||||
| Contract | Settlement | Unrealized | Unrealized | ||||||||
| Currency | Counterpartya Type | Quantity | Amount | Date | Appreciation | Depreciation | |||||
| OTC Forward Exchange Contracts (continued) | |||||||||||
| Euro | DBFX | Sell | 314,013 | $ | 351,338 | 4/18/16 | $ | 9,224 | $ | — | |
| Euro | FBCO | Sell | 615,076 | 692,389 | 4/18/16 | 22,269 | — | ||||
| Euro | HSBC | Sell | 2,273,633 | 2,585,683 | 4/18/16 | 108,576 | — | ||||
| Euro | SSBT | Sell | 596,478 | 660,490 | 4/18/16 | 10,632 | — | ||||
| British Pound | BANT | Sell | 4,541,396 | 6,964,218 | 4/22/16 | 268,695 | — | ||||
| British Pound | DBFX | Sell | 259,936 | 387,092 | 4/22/16 | 3,861 | — | ||||
| British Pound | HSBC | Sell | 2,752,310 | 4,251,494 | 4/22/16 | 193,677 | — | ||||
| Japanese Yen | BANT | Sell | 1,365,891,350 | 11,425,410 | 4/22/16 | 33,428 | (9,181 | ) | |||
| Japanese Yen | BONY | Sell | 117,239,448 | 965,184 | 4/22/16 | — | (13,420 | ) | |||
| Japanese Yen | DBFX | Buy | 40,261,000 | 328,249 | 4/22/16 | 7,811 | — | ||||
| Japanese Yen | DBFX | Sell | 50,347,617 | 411,505 | 4/22/16 | — | (8,749 | ) | |||
| Japanese Yen | HSBC | Buy | 33,886,530 | 281,862 | 4/22/16 | 991 | — | ||||
| Japanese Yen | HSBC | Sell | 19,274,835 | 157,651 | 4/22/16 | — | (3,237 | ) | |||
| Japanese Yen | SSBT | Buy | 7,832,520 | 65,291 | 4/22/16 | 88 | — | ||||
| Euro | DBFX | Sell | 582,370 | 633,730 | 5/04/16 | — | (1,091 | ) | |||
| Euro | FBCO | Sell | 24,616 | 26,222 | 5/04/16 | — | (611 | ) | |||
| Euro | SSBT | Sell | 8,496,074 | 9,136,679 | 5/04/16 | — | (124,588 | ) | |||
| South Korean Won | BANT | Sell | 3,757,569,231 | 3,267,488 | 5/12/16 | 78,183 | — | ||||
| South Korean Won | FBCO | Sell | 302,285,263 | 262,105 | 5/12/16 | 5,535 | — | ||||
| South Korean Won | HSBC | Sell | 1,165,471,335 | 1,019,975 | 5/12/16 | 30,760 | — | ||||
| Swiss Franc | BANT | Sell | 4,211,309 | 4,228,284 | 5/12/16 | 4,804 | (5,354 | ) | |||
| Swiss Franc | BONY | Sell | 148,960 | 152,390 | 5/12/16 | 2,810 | — | ||||
| Euro | BANT | Sell | 4,206,512 | 4,522,257 | 5/18/16 | — | (65,217 | ) | |||
| Euro | DBFX | Sell | 448,390 | 481,069 | 5/18/16 | — | (7,930 | ) | |||
| Euro | FBCO | Sell | 4,068,223 | 4,375,445 | 5/18/16 | — | (61,216 | ) | |||
| Euro | HSBC | Sell | 349,118 | 375,582 | 5/18/16 | — | (5,153 | ) | |||
| Euro | SSBT | Sell | 919,642 | 982,572 | 5/18/16 | — | (20,357 | ) | |||
| British Pound | BANT | Sell | 520,748 | 775,791 | 5/23/16 | 7,920 | — | ||||
| British Pound | DBFX | Sell | 417,820 | 620,713 | 5/23/16 | 4,614 | — | ||||
| British Pound | FBCO | Sell | 4,606,149 | 7,035,196 | 5/23/16 | 243,173 | — | ||||
| British Pound | HSBC | Sell | 1,699,545 | 2,594,621 | 5/23/16 | 88,547 | — | ||||
| British Pound | SSBT | Sell | 222,772 | 334,788 | 5/23/16 | 6,299 | — | ||||
| Norwegian Krone | BANT | Sell | 114,314,656 | 13,264,023 | 5/23/16 | 345,215 | — | ||||
| Norwegian Krone | DBFX | Buy | 1,512,600 | 174,920 | 5/23/16 | — | (3,980 | ) | |||
| Norwegian Krone | DBFX | Sell | 3,062,505 | 355,455 | 5/23/16 | 9,357 | — | ||||
| Norwegian Krone | SSBT | Sell | 2,871,911 | 325,733 | 5/23/16 | 1,176 | — | ||||
| Total Forward Exchange Contracts | $ | 3,447,263 | $ | (472,357 | ) | ||||||
| Net unrealized appreciation (depreciation) | $ | 2,974,906 | |||||||||
aMay be comprised of multiple contracts with the same counterparty, currency and settlement date.
See Abbreviations on page 39.
franklintempleton.com
The accompanying notes are an integral part of these financial statements. | Annual Report 23
FRANKLIN MUTUAL FINANCIAL SERVICES FUND
| Financial Statements | |||
| Statement of Assets and Liabilities | |||
| December 31, 2015 | |||
| Assets: | |||
| Investments in securities: | |||
| Cost - Unaffiliated issuers | $ | 603,896,636 | |
| Cost - Non-controlled affiliates (Note 10) | 2,227,085 | ||
| Total cost of investments | $ | 606,123,721 | |
| Value - Unaffiliated issuers | $ | 663,555,759 | |
| Value - Non-controlled affiliates (Note 10) | 76,874 | ||
| Total value of investments | 663,632,633 | ||
| Cash | 449,368 | ||
| Restricted Cash (Note 1d) | 330,000 | ||
| Foreign currency, at value (cost $756,690) | 752,787 | ||
| Receivables: | |||
| Investment securities sold | 1,437,838 | ||
| Capital shares sold | 3,884,835 | ||
| Dividends | 388,357 | ||
| Due from brokers | 740,880 | ||
| Variation margin | 179,838 | ||
| Unrealized appreciation on OTC forward exchange contracts | 3,447,263 | ||
| Other assets | 1,018,186 | ||
| Total assets | 676,261,985 | ||
| Liabilities: | |||
| Payables: | |||
| Investment securities purchased | 15,277 | ||
| Capital shares redeemed | 1,159,339 | ||
| Management fees | 483,810 | ||
| Distribution fees | 354,417 | ||
| Transfer agent fees | 137,050 | ||
| Trustees’ fees and expenses | 24,246 | ||
| Due to brokers | 680,000 | ||
| Unrealized depreciation on OTC forward exchange contracts | 472,357 | ||
| Accrued expenses and other liabilities | 104,588 | ||
| Total liabilities | 3,431,084 | ||
| Net assets, at value | $ | 672,830,901 | |
| Net assets consist of: | |||
| Paid-in capital | $ | 739,868,145 | |
| Distributions in excess of net investment income | (721,845 | ) | |
| Net unrealized appreciation (depreciation) | 60,823,176 | ||
| Accumulated net realized gain (loss) | (127,138,575 | ) | |
| Net assets, at value | $ | 672,830,901 | |
24 Annual Report | The accompanying notes are an integral part of these financial statements.
franklintempleton.com
FRANKLIN MUTUAL FINANCIAL SERVICES FUND
FINANCIAL STATEMENTS
| Statement of Assets and Liabilities (continued) | ||
| December 31, 2015 | ||
| Class Z: | ||
| Net assets, at value | $ | 178,156,602 |
| Shares outstanding | 9,073,732 | |
| Net asset value and maximum offering price per share | $ | 19.63 |
| Class A: | ||
| Net assets, at value | $ | 360,278,065 |
| Shares outstanding | 18,295,555 | |
| Net asset value per sharea | $ | 19.69 |
| Maximum offering price per share (net asset value per share ÷ 94.25%) | $ | 20.89 |
| Class C: | ||
| Net assets, at value | $ | 132,974,879 |
| Shares outstanding | 6,780,701 | |
| Net asset value and maximum offering price per sharea | $ | 19.61 |
| Class R6: | ||
| Net assets, at value | $ | 1,421,355 |
| Shares outstanding | 71,927 | |
| Net asset value and maximum offering price per share | $ | 19.76 |
aRedemption price is equal to net asset value less contingent deferred sales charges, if applicable.
franklintempleton.com
The accompanying notes are an integral part of these financial statements. | Annual Report 25
FRANKLIN MUTUAL FINANCIAL SERVICES FUND
FINANCIAL STATEMENTS
| Statement of Operations | |||
| for the year ended December 31, 2015 | |||
| Investment income: | |||
| Dividends (net of foreign taxes of $697,683) | $ | 13,405,541 | |
| Interest | 63,706 | ||
| Income from securities loaned | 6,740 | ||
| Other income (Note 1f) | 910,985 | ||
| Total investment income | 14,386,972 | ||
| Expenses: | |||
| Management fees (Note 3a) | 4,712,925 | ||
| Distribution fees: (Note 3c) | |||
| Class A | 822,531 | ||
| Class C | 1,051,749 | ||
| Transfer agent fees: (Note 3e) | |||
| Class Z | 241,171 | ||
| Class A | 526,460 | ||
| Class C | 185,898 | ||
| Class R6 | 337 | ||
| Custodian fees (Note 4) | 55,841 | ||
| Reports to shareholders | 75,350 | ||
| Registration and filing fees | 82,321 | ||
| Professional fees | 156,657 | ||
| Trustees’ fees and expenses | 14,068 | ||
| Other | 49,124 | ||
| Total expenses | 7,974,432 | ||
| Expense reductions (Note 4) | (432 | ) | |
| Expenses waived/paid by affiliates (Note 3f) | (325 | ) | |
| Net expenses | 7,973,675 | ||
| Net investment income | 6,413,297 | ||
| Realized and unrealized gains (losses): | |||
| Net realized gain (loss) from: | |||
| Investments | 14,897,227 | ||
| Foreign currency transactions | 13,537,522 | ||
| Futures contracts | 1,882,682 | ||
| Net realized gain (loss) | 30,317,431 | ||
| Net change in unrealized appreciation (depreciation) on: | |||
| Investments | 1,783,886 | ||
| Translation of other assets and liabilities denominated in foreign currencies | (4,479,837 | ) | |
| Futures contracts | 16,219 | ||
| Net change in unrealized appreciation (depreciation) | (2,679,732 | ) | |
| Net realized and unrealized gain (loss) | 27,637,699 | ||
| Net increase (decrease) in net assets resulting from operations | $ | 34,050,996 | |
26 Annual Report | The accompanying notes are an integral part of these financial statements.
franklintempleton.com
FRANKLIN MUTUAL FINANCIAL SERVICES FUND
FINANCIAL STATEMENTS
| Statements of Changes in Net Assets | ||||||
| Year Ended December 31, | ||||||
| 2015 | 2014 | |||||
| Increase (decrease) in net assets: | ||||||
| Operations: | ||||||
| Net investment income | $ | 6,413,297 | $ | 4,750,958 | ||
| Net realized gain (loss) | 30,317,431 | 55,717,443 | ||||
| Net change in unrealized appreciation (depreciation) | (2,679,732 | ) | (15,985,768 | ) | ||
| Net increase (decrease) in net assets resulting from operations | 34,050,996 | 44,482,633 | ||||
| Distributions to shareholders from: | ||||||
| Net investment income: | ||||||
| Class Z | (2,528,422 | ) | (2,206,551 | ) | ||
| Class A | (4,347,602 | ) | (4,298,998 | ) | ||
| Class C | (866,630 | ) | (912,109 | ) | ||
| Class R6 | (18,925 | ) | (162 | ) | ||
| Total distributions to shareholders | (7,761,579 | ) | (7,417,820 | ) | ||
| Capital share transactions: (Note 2) | ||||||
| Class Z | 59,444,061 | (1,989,359 | ) | |||
| Class A | 90,685,735 | (6,235,910 | ) | |||
| Class C | 38,200,826 | (4,277,422 | ) | |||
| Class R6 | 1,458,822 | 6,199 | ||||
| Total capital share transactions | 189,789,444 | (12,496,492 | ) | |||
| Net increase (decrease) in net assets | 216,078,861 | 24,568,321 | ||||
| Net assets: | ||||||
| Beginning of year | 456,752,040 | 432,183,719 | ||||
| End of year | $ | 672,830,901 | $ | 456,752,040 | ||
| Undistributed net investment income (distributions in excess of net investment income) included in | ||||||
| net assets: | ||||||
| End of year | $ | (721,845 | ) | $ | 1,782,857 | |
franklintempleton.com
The accompanying notes are an integral part of these financial statements. | Annual Report 27
FRANKLIN MUTUAL FINANCIAL SERVICES FUND
Notes to Financial Statements
1. Organization and Significant Accounting Policies
Franklin Mutual Series Funds (Trust) is registered under the Investment Company Act of 1940 (1940 Act) as an open-end management investment company, consisting of seven separate funds and applies the specialized accounting and reporting guidance in U.S. Generally Accepted Accounting Principles (U.S. GAAP). Franklin Mutual Financial Services Fund (Fund) is included in this report. The financial statements of the remaining funds in the Trust are presented separately. The Fund offers four classes of shares: Class Z, Class A, Class C and Class R6. Each class of shares differs by its initial sales load, contingent deferred sales charges, voting rights on matters affecting a single class, its exchange privilege and fees primarily due to differing arrangements for distribution and transfer agent fees.
The following summarizes the Fund’s significant accounting policies.
a. Financial Instrument Valuation
The Fund’s investments in financial instruments are carried at fair value daily. Fair value is the price that would be received to sell an asset or paid to transfer a liability in an orderly transaction between market participants on the measurement date. The Fund calculates the net asset value per share as of 4 p.m. Eastern time each day the New York Stock Exchange (NYSE) is open for trading. Under compliance policies and procedures approved by the Trust’s Board of Trustees (the Board), the Fund’s administrator has responsibility for oversight of valuation, including leading the cross-functional Valuation and Liquidity Oversight Committee (VLOC). The VLOC provides administration and oversight of the Fund’s valuation policies and procedures, which are approved annually by the Board. Among other things, these procedures allow the Fund to utilize independent pricing services, quotations from securities and financial instrument dealers, and other market sources to determine fair value.
Equity securities and derivative financial instruments (derivatives) listed on an exchange or on the NASDAQ National Market System are valued at the last quoted sale price or the official closing price of the day, respectively. Foreign equity securities are valued as of the close of trading on the foreign stock exchange on which the security is primarily traded or as of 4 p.m. Eastern time, whichever is earlier. The value is then converted into its U.S. dollar equivalent at the foreign exchange rate in effect at 4 p.m. Eastern time on the day that the value of the security is determined. Over-the-counter (OTC) securities are valued within the range of the most recent quoted bid and ask prices. Securities that trade in multiple markets or on multiple exchanges are valued according to the broadest and most representative market. Certain equity securities are valued based upon fundamental characteristics or relationships to similar securities.
Debt securities generally trade in the OTC market rather than on a securities exchange. The Fund’s pricing services use multiple valuation techniques to determine fair value. In instances where sufficient market activity exists, the pricing services may utilize a market-based approach through which quotes from market makers are used to determine fair value. In instances where sufficient market activity may not exist or is limited, the pricing services also utilize proprietary valuation models which may consider market characteristics such as benchmark yield curves, credit spreads, estimated default rates, anticipated market interest rate volatility, coupon rates, anticipated timing of principal repayments, underlying collateral, and other unique security features in order to estimate the relevant cash flows, which are then discounted to calculate the fair value. Securities denominated in a foreign currency are converted into their U.S. dollar equivalent at the foreign exchange rate in effect at 4 p.m. Eastern time on the date that the values of the foreign debt securities are determined.
Certain derivatives trade in the OTC market. The Fund’s pricing services use various techniques including industry standard option pricing models and proprietary discounted cash flow models to determine the fair value of those instruments. The Fund’s net benefit or obligation under the derivative contract, as measured by the fair value of the contract, is included in net assets.
The Fund has procedures to determine the fair value of financial instruments for which market prices are not reliable or readily available. Under these procedures, the VLOC convenes on a regular basis to review such financial instruments and considers a number of factors, including significant unobservable valuation inputs, when arriving at fair value. The VLOC primarily employs a market-based approach which may use related or comparable assets or liabilities, recent transactions, market multiples, book values, and other relevant information for the investment to determine the fair value of the investment. An income-based valuation approach may also be used in which the anticipated future cash flows of the investment are
28 Annual Report
franklintempleton.com
FRANKLIN MUTUAL FINANCIAL SERVICES FUND
NOTES TO FINANCIAL STATEMENTS
discounted to calculate fair value. Discounts may also be applied due to the nature or duration of any restrictions on the disposition of the investments. Due to the inherent uncertainty of valuations of such investments, the fair values may differ significantly from the values that would have been used had an active market existed. The VLOC employs various methods for calibrating these valuation approaches including a regular review of key inputs and assumptions, transactional back-testing or disposition analysis, and reviews of any related market activity.
Trading in securities on foreign securities stock exchanges and OTC markets may be completed before 4 p.m. Eastern time. In addition, trading in certain foreign markets may not take place on every NYSE business day. Occasionally, events occur between the time at which trading in a foreign security is completed and the close of the NYSE that might call into question the reliability of the value of a portfolio security held by the Fund. As a result, differences may arise between the value of the Fund’s portfolio securities as determined at the foreign market close and the latest indications of value at the close of the NYSE. In order to minimize the potential for these differences, the VLOC monitors price movements following the close of trading in foreign stock markets through a series of country specific market proxies (such as baskets of American Depositary Receipts, futures contracts and exchange traded funds). These price movements are measured against established trigger thresholds for each specific market proxy to assist in determining if an event has occurred that may call into question the reliability of the values of the foreign securities held by the Fund. If such an event occurs, the securities may be valued using fair value procedures, which may include the use of independent pricing services.
When the last day of the reporting period is a non-business day, certain foreign markets may be open on those days that the NYSE is closed, which could result in differences between the value of the Fund’s portfolio securities on the last business day and the last calendar day of the reporting period. Any significant security valuation changes due to an open foreign market are adjusted and reflected by the Fund for financial reporting purposes.
b. Foreign Currency Translation
Portfolio securities and other assets and liabilities denominated in foreign currencies are translated into U.S. dollars based on the exchange rate of such currencies against U.S. dollars on the date of valuation. The Fund may enter into foreign currency
exchange contracts to facilitate transactions denominated in a foreign currency. Purchases and sales of securities, income and expense items denominated in foreign currencies are translated into U.S. dollars at the exchange rate in effect on the transaction date. Portfolio securities and assets and liabilities denominated in foreign currencies contain risks that those currencies will decline in value relative to the U.S. dollar. Occasionally, events may impact the availability or reliability of foreign exchange rates used to convert the U.S. dollar equivalent value. If such an event occurs, the foreign exchange rate will be valued at fair value using procedures established and approved by the Board.
The Fund does not separately report the effect of changes in foreign exchange rates from changes in market prices on securities held. Such changes are included in net realized and unrealized gain or loss from investments in the Statement of Operations.
Realized foreign exchange gains or losses arise from sales of foreign currencies, currency gains or losses realized between the trade and settlement dates on securities transactions and the difference between the recorded amounts of dividends, interest, and foreign withholding taxes and the U.S. dollar equivalent of the amounts actually received or paid. Net unrealized foreign exchange gains and losses arise from changes in foreign exchange rates on foreign denominated assets and liabilities other than investments in securities held at the end of the reporting period.
c. Derivative Financial Instruments
The Fund invested in derivatives in order to manage risk or gain exposure to various other investments or markets. Derivatives are financial contracts based on an underlying or notional amount, require no initial investment or an initial net investment that is smaller than would normally be required to have a similar response to changes in market factors, and require or permit net settlement. Derivatives contain various risks including the potential inability of the counterparty to fulfill their obligations under the terms of the contract, the potential for an illiquid secondary market, and/or the potential for market movements which expose the Fund to gains or losses in excess of the amounts shown in the Statement of Assets and Liabilities. Realized gain and loss and unrealized appreciation and depreciation on these contracts for the period are included in the Statement of Operations.
Derivative counterparty credit risk is managed through a formal evaluation of the creditworthiness of all potential counterparties.
franklintempleton.com
Annual Report
29
FRANKLIN MUTUAL FINANCIAL SERVICES FUND
NOTES TO FINANCIAL STATEMENTS
1. Organization and Significant Accounting
Policies (continued)
c. Derivative Financial Instruments (continued)
The Fund attempts to reduce its exposure to counterparty credit risk on OTC derivatives, whenever possible, by entering into International Swaps and Derivatives Association (ISDA) master agreements with certain counterparties. These agreements contain various provisions, including but not limited to collateral requirements, events of default, or early termination. Termination events applicable to the counterparty include certain deteriorations in the credit quality of the counterparty. Termination events applicable to the Fund include failure of the Fund to maintain certain net asset levels and/or limit the decline in net assets over various periods of time. In the event of default or early termination, the ISDA master agreement gives the non-defaulting party the right to net and close-out all transactions traded, whether or not arising under the ISDA agreement, to one net amount payable by one counterparty to the other. However, absent an event of default or early termination, OTC derivative assets and liabilities are presented gross and not offset in the Statement of Assets and Liabilities. Early termination by the counterparty may result in an immediate payment by the Fund of any net liability owed to that counterparty under the ISDA agreement. At December 31, 2015, the Fund had no OTC derivatives in a net liability position for such contracts.
Collateral requirements differ by type of derivative. Collateral or initial margin requirements are set by the broker or exchange clearing house for exchange traded and centrally cleared derivatives. Initial margin deposited is held at the exchange and can be in the form of cash and/or securities. For OTC derivatives traded under an ISDA master agreement, posting of collateral is required by either the Fund or the applicable coun-terparty if the total net exposure of all OTC derivatives with the applicable counterparty exceeds the minimum transfer amount, which typically ranges from $100,000 to $250,000, and can vary depending on the counterparty and the type of the agreement. Generally, collateral is determined at the close of Fund business each day and any additional collateral required due to changes in derivative values may be delivered by the Fund or the counterparty within a few business days. Collateral pledged and/or received by the Fund for OTC derivatives, if any, is held in segregated accounts with the Fund’s custodian/counterparty broker and can be in the form of cash and/or securities. Unrestricted cash may be invested according to the Fund’s investment objectives. To the extent that the amounts due to the Fund from its counterparties are not subject to collateralization or are not fully collateralized, the Fund bears the risk of loss from counterparty non-performance.
At December 31, 2015, the Fund received $1,141,653 in United Kingdom Treasury Bonds and U.S. Treasury, Bonds and Notes as collateral for derivatives.
The Fund entered into exchange traded futures contracts primarily to manage exposure to certain foreign currencies. A futures contract is an agreement between the Fund and a counterparty to buy or sell an asset for a specified price on a future date. Required initial margins are pledged by the Fund, and the daily change in fair value is accounted for as a variation margin payable or receivable in the Statement of Assets and Liabilities.
The Fund entered into OTC forward exchange contracts primarily to manage exposure to certain foreign currencies. A forward exchange contract is an agreement between the Fund and a counterparty to buy or sell a foreign currency at a specific exchange rate on a future date.
See Note 9 regarding other derivative information.
d. Restricted Cash
At December 31, 2015, the Fund held restricted cash in connection with investments in certain derivative securities. Restricted cash is held in a segregated account with the Fund’s custodian/counterparty broker and is reflected in the Statement of Assets and Liabilities.
e. Securities Lending
The Fund participates in an agency based securities lending program to earn additional income. The Fund receives cash collateral against the loaned securities in an amount equal to at least 102% of the fair value of the loaned securities. Collateral is maintained over the life of the loan in an amount not less than 100% of the fair value of loaned securities, as determined at the close of Fund business each day; any additional collateral required due to changes in security values is delivered to the Fund on the next business day. The collateral is deposited into a joint cash account with other funds and is used to invest in a money market fund managed by Franklin Advisers, Inc., an affiliate of the Fund, and/or a joint repurchase agreement. The Fund may receive income from the investment of cash collateral, in addition to lending fees and rebates paid by the borrower. Income from securities loaned is reported separately in the Statement of Operations. The Fund bears the market risk
30 Annual Report
franklintempleton.com
FRANKLIN MUTUAL FINANCIAL SERVICES FUND
NOTES TO FINANCIAL STATEMENTS
with respect to the collateral investment, securities loaned, and the risk that the agent may default on its obligations to the Fund. If the borrower defaults on its obligation to return the securities loaned, the Fund has the right to repurchase the securities in the open market using the collateral received. The securities lending agent has agreed to indemnify the Fund in the event of default by a third party borrower. At December 31, 2015, the Fund had no securities on loan.
f. Income and Deferred Taxes
It is the Fund’s policy to qualify as a regulated investment company under the Internal Revenue Code. The Fund intends to distribute to shareholders substantially all of its taxable income and net realized gains to relieve it from federal income and excise taxes. As a result, no provision for U.S. federal income taxes is required.
The Fund may be subject to foreign taxation related to income received, capital gains on the sale of securities and certain foreign currency transactions in the foreign jurisdictions in which it invests. Foreign taxes, if any, are recorded based on the tax regulations and rates that exist in the foreign markets in which the Fund invests. When a capital gain tax is determined to apply, the Fund records an estimated deferred tax liability in an amount that would be payable if the securities were disposed of on the valuation date. As a result of several court cases, in certain countries across the European Union, the Fund has filed additional tax reclaims for previously withheld taxes on dividends earned in those countries. These additional filings are subject to various administrative proceedings by the local jurisdictions’ tax authorities within the European Union, as well as a number of related judicial proceedings. During the year ended December 31, 2015, the Fund recognized $920,095 from Swe-den for previously withheld foreign taxes and interest on such taxes. These amounts are reflected as other income and interest in the Statement of Operations. In regards to filings in other European Union countries, uncertainty exists as to the ultimate resolution of these proceedings, the likelihood of receipt of these reclaims, and the potential timing of payment, and accordingly, no amounts are reflected in the financial statements.
The Fund may recognize an income tax liability related to its uncertain tax positions under U.S. GAAP when the uncertain tax position has a less than 50% probability that it will be sustained upon examination by the tax authorities based on its technical merits. As of December 31, 2015, the Fund has determined that no tax liability is required in its Fund’s financial statements related to uncertain tax positions for any open tax years (or expected to be taken on future tax returns). Open tax years are those that remain subject to examination and are based on each tax jurisdiction’s statute of limitation.
g. Security Transactions, Investment Income, Expenses and Distributions
Security transactions are accounted for on trade date. Realized gains and losses on security transactions are determined on a specific identification basis. Interest income and estimated expenses are accrued daily. Amortization of premium and accretion of discount on debt securities are included in interest income. Dividend income is recorded on the ex-dividend date except for certain dividends from foreign securities where the dividend rate is not available. In such cases, the dividend is recorded as soon as the information is received by the Fund. Distributions to shareholders are recorded on the ex-dividend date and are determined according to income tax regulations (tax basis). Distributable earnings determined on a tax basis may differ from earnings recorded in accordance with U.S. GAAP. These differences may be permanent or temporary. Permanent differences are reclassified among capital accounts to reflect their tax character. These reclassifications have no impact on net assets or the results of operations. Temporary differences are not reclassified, as they may reverse in subsequent periods.
Common expenses incurred by the Trust are allocated among the funds based on the ratio of net assets of each fund to the combined net assets of the Trust. Fund specific expenses are charged directly to the fund that incurred the expense.
Realized and unrealized gains and losses and net investment income, not including class specific expenses, are allocated daily to each class of shares based upon the relative proportion of net assets of each class. Differences in per share distributions, by class, are generally due to differences in class specific expenses.
h. Accounting Estimates
The preparation of financial statements in accordance with U.S. GAAP requires management to make estimates and assumptions that affect the reported amounts of assets and liabilities at the date of the financial statements and the amounts of income and expenses during the reporting period. Actual results could differ from those estimates.
franklintempleton.com
Annual Report
31
FRANKLIN MUTUAL FINANCIAL SERVICES FUND
NOTES TO FINANCIAL STATEMENTS
1. Organization and Significant Accounting
Policies (continued)
i. Guarantees and Indemnifications
Under the Trust’s organizational documents, its officers and trustees are indemnified by the Trust against certain liabilities arising out of the performance of their duties to the Trust.
Additionally, in the normal course of business, the Trust, on behalf of the Fund, enters into contracts with service providers that contain general indemnification clauses. The Trust’s maximum exposure under these arrangements is unknown as this would involve future claims that may be made against the Trust that have not yet occurred. Currently, the Trust expects the risk of loss to be remote.
2. Shares of Beneficial Interest
At December 31, 2015, there were an unlimited number of shares authorized (without par value). Transactions in the Fund’s shares were as follows:
| Year Ended December 31, | |||||||||||
| 2015 | 2014 | ||||||||||
| Shares | Amount | Shares | Amount | ||||||||
| Class Z Shares: | |||||||||||
| Shares sold | 4,075,813 | $ | 80,768,459 | 900,157 | $ | 15,916,337 | |||||
| Shares issued in reinvestment of distributions | 120,121 | 2,312,900 | 108,683 | 1,990,815 | |||||||
| Shares redeemed | (1,219,045 | ) | (23,637,298 | ) | (1,142,574 | ) | (19,896,511 | ) | |||
| Net increase (decrease) | 2,976,889 | $ | 59,444,061 | (133,734 | ) | $ | (1,989,359 | ) | |||
| Class A Shares: | |||||||||||
| Shares sold | 9,859,370 | $ | 194,934,822 | 3,011,856 | $ | 53,245,431 | |||||
| Shares issued in reinvestment of distributions | 218,808 | 4,214,727 | 226,229 | 4,156,062 | |||||||
| Shares redeemed | (5,609,806 | ) | (108,463,814 | ) | (3,597,075 | ) | (63,637,403 | ) | |||
| Net increase (decrease) | 4,468,372 | $ | 90,685,735 | (358,990 | ) | $ | (6,235,910 | ) | |||
| Class C Shares: | |||||||||||
| Shares sold | 2,695,436 | $ | 52,859,589 | 675,189 | $ | 11,864,749 | |||||
| Shares issued in reinvestment of distributions | 43,382 | 824,724 | 47,533 | 870,024 | |||||||
| Shares redeemed | (810,404 | ) | (15,483,487 | ) | (975,769 | ) | (17,012,195 | ) | |||
| Net increase (decrease) | 1,928,414 | $ | 38,200,826 | (253,047 | ) | $ | (4,277,422 | ) | |||
| Class R6 Shares: | |||||||||||
| Shares sold | 70,704 | $ | 1,447,899 | 331 | $ | 6,129 | |||||
| Shares issued in reinvestment of distributions | 964 | 18,816 | 4 | 70 | |||||||
| Shares redeemed | (412 | ) | (7,893 | ) | — | — | |||||
| Net increase (decrease) | 71,256 | $ | 1,458,822 | 335 | $ | 6,199 | |||||
3. Transactions with Affiliates
Franklin Resources, Inc. is the holding company for various subsidiaries that together are referred to as Franklin Templeton Investments. Certain officers and trustees of the Fund are also officers and/or directors of the following subsidiaries:
| Subsidiary | Affiliation |
| Franklin Mutual Advisers, LLC (Franklin Mutual) | Investment manager |
| Franklin Templeton Services, LLC (FT Services) | Administrative manager |
| Franklin Templeton Distributors, Inc. (Distributors) | Principal underwriter |
| Franklin Templeton Investor Services, LLC (Investor Services) | Transfer agent |
32 Annual Report
franklintempleton.com
FRANKLIN MUTUAL FINANCIAL SERVICES FUND
NOTES TO FINANCIAL STATEMENTS
a. Management Fees
The Fund pays an investment management fee to Franklin Mutual based on the average daily net assets of the Fund as follows:
| Annualized Fee Rate | Net Assets | |
| 0.875 | % | Up to and including $1 billion |
| 0.845 | % | Over $1 billion, up to and including $2 billion |
| 0.825 | % | Over $2 billion, up to and including $5 billion |
| 0.805 | % | In excess of $5 billion |
b. Administrative Fees
Under an agreement with Franklin Mutual, FT Services provides administrative services to the Fund. The fee is paid by Franklin Mutual based on the Fund’s average daily net assets, and is not an additional expense of the Fund.
c. Distribution Fees
The Board has adopted distribution plans for each share class, with the exception of Class Z and Class R6 shares, pursuant to Rule 12b-1 under the 1940 Act. Under the Fund’s Class A reimbursement distribution plan, the Fund reimburses Distributors for costs incurred in connection with the servicing, sale and distribution of the Fund’s shares up to the maximum annual plan rate. Under the Class A reimbursement distribution plan, costs exceeding the maximum for the current plan year cannot be reimbursed in subsequent periods. In addition, under the Fund’s Class C compensation distribution plan, the Fund pays Distributors for costs incurred in connection with the servicing, sale and distribution of the Fund’s shares up to the maximum annual plan rate. The plan year, for purposes of monitoring compliance with the maximum annual plan rates, is February 1 through January 31 for each fund.
The maximum annual plan rates, based on the average daily net assets, for each class, are as follows:
| Class A | 0.35 | % |
| Class C | 1.00 | % |
Effective August 1, 2015, the Board has set the current rate at 0.25% per year for Class A shares until further notice and approval by the Board. Prior to August 1, 2015, the Board had set the rate at 0.30% per year for Class A shares.
d. Sales Charges/Underwriting Agreements
Front-end sales charges and contingent deferred sales charges (CDSC) do not represent expenses of the Fund. These charges are deducted from the proceeds of sales of Fund shares prior to investment or from redemption proceeds prior to remittance, as applicable. Distributors has advised the Fund of the following commission transactions related to the sales and redemptions of the Fund’s shares for the year:
| Sales charges retained net of commissions paid to unaffiliated broker/dealers | $ | 190,563 |
| CDSC retained | $ | 16,769 |
e. Transfer Agent Fees
Each class of shares, except for Class R6, pays transfer agent fees to Investor Services for its performance of shareholder servicing obligations and reimburses Investor Services for out of pocket expenses incurred, including shareholding servicing fees paid to third parties. These fees are allocated daily based upon their relative proportion of such classes’ aggregate net assets. Class R6 pays Investor Services transfer agent fees specific to that class.
For the year ended December 31, 2015, the Fund paid transfer agent fees of $953,866, of which $431,556 was retained by Investor Services.
franklintempleton.com
Annual Report
33
FRANKLIN MUTUAL FINANCIAL SERVICES FUND
NOTES TO FINANCIAL STATEMENTS
3. Transactions with Affiliates (continued)
f. Waiver and Expense Reimbursements
Investor Services has contractually agreed in advance to waive or limit its fees so that the Class R6 transfer agent fees do not exceed 0.01% until April 30, 2016.
4. Expense Offset Arrangement
The Fund has entered into an arrangement with its custodian whereby credits realized as a result of uninvested cash balances are used to reduce a portion of the Fund’s custodian expenses. During the year ended December 31, 2015, the custodian fees were reduced as noted in the Statement of Operations.
5. Independent Trustees’ Retirement Plan
On January 1, 1993, the Trust adopted an Independent Trustees’ Retirement Plan (Plan). The Plan is an unfunded defined benefit plan that provides benefit payments to Trustees whose length of service and retirement age meets the eligibility requirements of the Plan. Benefits under the Plan are based on years of service and fees paid to each trustee at the time of retirement. Effective in December 1996, the Plan was closed to new participants.
During the year ended December 31, 2015, the Fund’s projected benefit obligation and benefit payments under the Plan were as follows:
| aProjected benefit obligation at December 31, 2015 | $ | 24,246 | |
| bIncrease in projected benefit obligation | $ | 1,709 | |
| Benefit payments made to retired trustees | $ | (460 | ) |
aThe projected benefit obligation is included in trustees’ fees and expenses in the Statement of Assets and Liabilities.
bThe increase in projected benefit obligation is included in trustees’ fees and expenses in the Statement of Operations.
6. Income Taxes
For tax purposes, capital losses may be carried over to offset future capital gains. Capital loss carryforwards with no expiration, if any, must be fully utilized before those losses with expiration dates.
| At December 31, 2015, capital loss carryforwards were as follows: | ||
| Capital loss carryforwards subject to expiration: | ||
| 2016 | $ | 20,044,095 |
| 2017 | 73,527,713 | |
| 2018 | 31,091,133 | |
| Total capital loss carryforwards | $ | 124,662,941 |
During the year ended December 31, 2015, the Fund utilized $25,843,125 of capital loss carryforwards.
The tax character of distributions paid during the years ended December 31, 2015 and 2014, was as follows:
| 2015 | 2014 | |||
| Distributions paid from ordinary income | $ | 7,761,579 | $ | 7,417,820 |
34 Annual Report
franklintempleton.com
FRANKLIN MUTUAL FINANCIAL SERVICES FUND
NOTES TO FINANCIAL STATEMENTS
At December 31, 2015, the cost of investments, net unrealized appreciation (depreciation) and undistributed ordinary income for income tax purposes were as follows:
| Cost of investments | $ | 608,065,092 | |
| Unrealized appreciation | $ | 104,041,482 | |
| Unrealized depreciation | (48,473,941 | ) | |
| Net unrealized appreciation (depreciation) | $ | 55,567,541 | |
| Distributable earnings – undistributed ordinary income | $ | 1,140,220 |
Differences between income and/or capital gains as determined on a book basis and a tax basis are primarily due to differing treatments of foreign currency transactions and passive foreign investment company shares.
7. Investment Transactions
Purchases and sales of investments (excluding short term securities) for the year ended December 31, 2015, aggregated $281,274,875 and $120,175,363, respectively.
8. Restricted Securities
The Fund invests in securities that are restricted under the Securities Act of 1933 (1933 Act) or which are subject to legal, contractual, or other agreed upon restrictions on resale. Restricted securities are often purchased in private placement transactions, and cannot be sold without prior registration unless the sale is pursuant to an exemption under the 1933 Act. Disposal of these securities may require greater effort and expense, and prompt sale at an acceptable price may be difficult. The Fund may have registration rights for restricted securities. The issuer generally incurs all registration costs.
At December 31, 2015, the Fund held investments in restricted securities, excluding certain securities exempt from registration under the 1933 Act deemed to be liquid, as follows:
| Shares/ | Acquisition | |||||
| Units | Issuer | Dates | Cost | Value | ||
| 4,357,178 | FIM Coinvestor Holdings I, LLC | 11/20/06 - 6/02/09 | $ | — | $ | — |
| 3,000,000 | Hightower Holding LLC, pfd., A | 3/31/08 - 1/05/10 | 2,362,324 | 3,302,700 | ||
| 968,000 | Hightower Holding LLC, pfd., A, Series 2 | 6/10/10 - 5/10/12 | 2,420,000 | 2,298,710 | ||
| Total Restricted Securities (Value is 0.83% of Net Assets) | $ | 4,782,324 | $ | 5,601,410 |
franklintempleton.com
Annual Report
35
FRANKLIN MUTUAL FINANCIAL SERIES FUNDS
NOTES TO FINANCIAL STATEMENTS
9. Other Derivative Information
At December 31, 2015, the Fund’s investments in derivative contracts are reflected in the Statement of Assets and Liabilities as follows:
| Asset Derivatives | Liability Derivatives | ||||||
| Derivative Contracts | |||||||
| Not Accounted for as | Statement of Assets and | Statement of Assets and | |||||
| Hedging Instruments | Liabilities Location | Fair Value | Liabilities Location | Fair Value | |||
| Foreign exchange contracts | Variation margin | $ | 359,328 | a | |||
| Unrealized appreciation on | 3,447,263 | Unrealized depreciation on | $ | 472,357 | |||
| OTC forward exchange | OTC forward exchange | ||||||
| contracts | contracts | ||||||
| Totals | $ | 3,806,591 | $ | 472,357 | |||
aThis amount reflects the cumulative appreciation (depreciation) of futures contracts as reported in the Statement of Investments. Only the variation margin receivable/payable at year end is separately reported within the Statement of Assets and Liabilities. Prior variation margin movements were recorded to cash upon receipt or payment.
For the year ended December 31, 2015, the effect of derivative contracts in the Fund’s Statement of Operations was as follows:
| Net Change in | ||||||||
| Unrealized | ||||||||
| Derivative Contracts | Net Realized | Appreciation | ||||||
| Not Accounted for as | Statement of Operations | Gain (Loss) | Statement of Operations | (Depreciation) | ||||
| Hedging Instruments | Locations | for the Year | Locations | for the Year | ||||
| Net realized gain (loss) from: | Net change in unrealized | |||||||
| appreciation (depreciation) on: | ||||||||
| Foreign exchange contracts | Foreign currency transactions | $ | 14,162,421 | a | Translation of other assets and | $ | (4,483,487 | )a |
| liabilities denominated in | ||||||||
| foreign currencies | ||||||||
| Futures contracts | 1,882,682 | Futures contracts | 16,219 | |||||
| Totals | $ | 16,045,103 | $ | (4,467,268 | ) |
aForward exchange contracts are included in net realized gain (loss) from foreign currency transactions and net change in unrealized appreciation (depreciation) on translation of other assets and liabilities denominated in foreign currencies in the Statement of Operations.
For the year ended December 31, 2015, the average month end fair value of derivatives represented 1.13% of average month end net assets. The average month end number of open derivative contracts for the year was 184.
See Note 1(c) regarding derivative financial instruments.
10. Holdings of 5% Voting Securities of Portfolio Companies
The 1940 Act defines “affiliated companies” to include investments in portfolio companies in which a fund owns 5% or more of the outstanding voting securities. Investments in “affiliated companies” for the Fund for the year ended December 31, 2015, were as shown below.
| Number of | Number of | |||||||
| Shares Held | Shares Held | Value | ||||||
| at Beginning | Gross | Gross | at End | at End | Investment | Realized | ||
| Name of Issuer | of Year | Additions | Reductions | of Year | of Year | Income | Gain (Loss) | |
| Non-Controlled Affiliates | ||||||||
| AB&T Financial Corp. | ||||||||
| (Value is 0.01% of Net | ||||||||
| Assets) | 226,100 | — | — | 226,100 | $ | 76,874 | $ — | $ — |
36 Annual Report
franklintempleton.com
FRANKLIN MUTUAL FINANCIAL SERVICES FUND
NOTES TO FINANCIAL STATEMENTS
11. Credit Facility
The Fund, together with other U.S. registered and foreign investment funds (collectively, Borrowers), managed by Franklin Templeton Investments, are borrowers in a joint syndicated senior unsecured credit facility totaling $2 billion (Global Credit Facility) which matured on February 12, 2016. This Global Credit Facility provides a source of funds to the Borrowers for temporary and emergency purposes, including the ability to meet future unanticipated or unusually large redemption requests. Effective February 12, 2016, the Borrowers renewed the Global Credit Facility for a one year term, maturing February 10, 2017, for a total of $2 billion.
Under the terms of the Global Credit Facility, the Fund shall, in addition to interest charged on any borrowings made by the Fund and other costs incurred by the Fund, pay its share of fees and expenses incurred in connection with the implementation and maintenance of the Global Credit Facility, based upon its relative share of the aggregate net assets of all of the Borrowers, including an annual commitment fee of 0.07% based upon the unused portion of the Global Credit Facility. Effective February 12, 2016, the annual commitment fee is 0.15%. These fees are reflected in other expenses in the Statement of Operations. During the year ended December 31, 2015, the Fund did not use the Global Credit Facility.
12. Fair Value Measurements
The Fund follows a fair value hierarchy that distinguishes between market data obtained from independent sources (observable inputs) and the Fund’s own market assumptions (unobservable inputs). These inputs are used in determining the value of the Fund’s financial instruments and are summarized in the following fair value hierarchy:
- Level 1 – quoted prices in active markets for identical financial instruments
- Level 2 – other significant observable inputs (including quoted prices for similar financial instruments, interest rates, prepay- ment speed, credit risk, etc.)
- Level 3 – significant unobservable inputs (including the Fund’s own assumptions in determining the fair value of financial instruments)
The input levels are not necessarily an indication of the risk or liquidity associated with financial instruments at that level.
For movements between the levels within the fair value hierarchy, the Fund has adopted a policy of recognizing the transfers as of the date of the underlying event which caused the movement.
A summary of inputs used as of December 31, 2015, in valuing the Fund’s assets and liabilities carried at fair value, is as follows:
| Level 1 | Level 2 | Level 3 | Total | ||||||
| Assets: | |||||||||
| Investments in Securities: | |||||||||
| Equity Investments:a | |||||||||
| Banks | $ | 179,004,702 | $ | 5,434,303 | $ | — | $ | 184,439,005 | |
| Diversified Financial Services | 14,178,974 | — | 5,601,410 | 19,780,384 | |||||
| All Other Equity Investmentsb | 378,610,992 | — | — | 378,610,992 | |||||
| Companies in Liquidation | — | 436,843 | —c | 436,843 | |||||
| Short Term Investments | 72,165,429 | 8,199,980 | — | 80,365,409 | |||||
| Total Investments in Securities | $ | 643,960,097 | $ | 14,071,126 | $ | 5,601,410 | $ | 663,632,633 | |
| Other Financial Instruments | |||||||||
| Futures Contracts | $ | 359,328 | $ | — | $ | — | $ | 359,328 | |
| Forward Exchange Contracts | — | 3,447,263 | — | 3,447,263 | |||||
| Total Other Financial Instruments | $ | 359,328 | $ | 3,447,263 | $ | — | $ | 3,806,591 | |
| Liabilities: | |||||||||
| Other Financial Instruments | |||||||||
| Forward Exchange Contracts | $ | — | $ | 472,357 | $ | — | $ | 472,357 | |
| aIncludes common, convertible preferred and preferred stocks as well as other equity investments. | |||||||||
| bFor detailed categories, see the accompanying Statement of Investments. | |||||||||
| cIncludes securities determined to have no value at December 31, 2015. | |||||||||
franklintempleton.com
Annual Report
37
FRANKLIN MUTUAL FINANCIAL SERVICES FUND
NOTES TO FINANCIAL STATEMENTS
12. Fair Value Measurements (continued)
A reconciliation of assets in which Level 3 inputs are used in determining fair value is presented when there are significant Level 3 financial instruments at the end of the year. At December 31, 2015, the reconciliation of assets, is as follows:
| Net Change in | ||||||||||||||||||
| Unrealized | ||||||||||||||||||
| Appreciation | ||||||||||||||||||
| Balance at | Transfers | Net Unrealized | (Depreciation) | |||||||||||||||
| Beginning | Purchases | Into (Out of) | Cost Basis | Net Realized | Appreciation | Balance at | on Assets Held | |||||||||||
| of Year | (Sales) | Level 3 | Adjustmentsa | Gain (Loss) | (Depreciation) | End of Year | at Year End | |||||||||||
| Assets: | ||||||||||||||||||
| Investments in Securities: | ||||||||||||||||||
| Equity Investments:b | ||||||||||||||||||
| Diversified Financial | ||||||||||||||||||
| Services | $ | 5,496,455 | $ | — | $ | — | $ | — | $ | — | $ | 104,955 | $ | 5,601,410 | $ | 104,955 | ||
| Insurance | —c | — | — | (2,914 | ) | (695,872 | ) | 698,786 | — | — | ||||||||
| Total Investments in | ||||||||||||||||||
| Securities | $ | 5,496,455 | $ | — | $ | — | $ | (2,914 | ) | $ | (695,872 | ) | $ | 803,741 | $ | 5,601,410 | $ | 104,955 |
| aMay include accretion, amortization, partnership adjustments, and/or other cost basis adjustments. | ||||||||||||||||||
| bIncludes common and preferred stocks. | ||||||||||||||||||
| cIncludes securities determined to have no value. | ||||||||||||||||||
Significant unobservable valuation inputs developed by the VLOC for material Level 3 financial instruments and impact to fair value as a result of changes in unobservable valuation inputs as of December 31, 2015, are as follows:
| Fair Value | Impact to Fair | ||||
| at End of | Amount/ | Value if Input | |||
| Description | Year Valuation Technique Unobservable Inputs | Range | Increasesa | ||
| Assets: | |||||
| Investments in Securities: | |||||
| Equity Investments:b | |||||
| Diversified Financial Services | $5,601,410 Discounted | Cost of equity | 15 | % | Decreasec |
| Cash Flow | Revenue growth rate | 6.2% - 10.8% | Increasec | ||
| Model | Adjusted EBITDA margin | 17.7% - 22.7% | Increased | ||
aRepresents the directional change in the fair value of the Level 3 financial instruments that would result from a significant and reasonable increase in the corresponding input.
A significant and reasonable decrease in input would have the opposite effect. Significant impacts, if any, to fair value and/or net assets have been indicated.
bIncludes preferred stocks.
cRepresents a significant impact to fair value and net assets.
dRepresents a significant impact to fair value but not net assets.
Abbreviations List
EBITDA - Earnings before interest, taxes, depreciation and amortization
13. Subsequent Events
The Fund has evaluated subsequent events through the issuance of the financial statements and determined that no events have occurred that require disclosure other than those already disclosed in the financial statements.
38 Annual Report
franklintempleton.com
FRANKLIN MUTUAL FINANCIAL SERVICES FUND
NOTES TO FINANCIAL STATEMENTS
| Abbreviations | ||||
| Counterparty | Currency | Selected Portfolio | ||
| BANT | Bank of America N.A. | CHF | Swiss Franc | FHLB Federal Home Loan Bank |
| BBU | Barclays Bank PLC | EUR | Euro | |
| BONY | Bank of New York Mellon | GBP | British Pound | |
| DBFX | Deutsche Bank AG | USD | United States Dollar | |
| FBCO | Credit Suisse Group AG | |||
| HSBC | HSBC Bank USA, N.A. | |||
| SSBT | State Street Bank and Trust Co., N.A. | |||
franklintempleton.com
Annual Report
39
FRANKLIN MUTUAL FINANCIAL SERVICES FUND
Report of Independent Registered Public Accounting Firm
To the Board of Trustees of Franklin Mutual Series Funds and Shareholders of Franklin Mutual Financial Services Fund:
We have audited the accompanying statement of assets and liabilities, including the statement of investments, of Franklin Mutual Financial Services Fund (the “Fund”) (one of the funds constituting Franklin Mutual Series Funds), as of December 31, 2015, and the related statement of operations for the year then ended, the statements of changes in net assets for each of the two years in the period then ended, and the financial highlights for each of the periods indicated therein. These financial statements and financial highlights are the responsibility of the Fund’s management. Our responsibility is to express an opinion on these financial statements and financial highlights based on our audits.
We conducted our audits in accordance with the standards of the Public Company Accounting Oversight Board (United States). Those standards require that we plan and perform the audit to obtain reasonable assurance about whether the financial statements and financial highlights are free of material misstatement. We were not engaged to perform an audit of the Fund’s internal control over financial reporting. Our audits included consideration of internal control over financial reporting as a basis for designing audit procedures that are appropriate in the circumstances, but not for the purpose of expressing an opinion on the effectiveness of the Fund’s internal control over financial reporting. Accordingly, we express no such opinion. An audit also includes examining, on a test basis, evidence supporting the amounts and disclosures in the financial statements and financial highlights, assessing the accounting principles used and significant estimates made by management, and evaluating the overall financial statement presentation. Our procedures included confirmation of securities owned as of December 31, 2015, by correspondence with the custodian and brokers, or by other appropriate auditing procedures where replies from the brokers were not received. We believe that our audits provide a reasonable basis for our opinion.
In our opinion, the financial statements and financial highlights referred to above present fairly, in all material respects, the financial position of Franklin Mutual Financial Services Fund (one of the funds constituting Franklin Mutual Series Funds) at December 31, 2015, the results of its operations for the year then ended, the changes in its net assets for each of the two years in the period then ended, and the financial highlights for each of the periods indicated therein, in conformity with U.S. generally accepted accounting principles.
![]()
Boston, Massachusetts
February 18, 2016
40 Annual Report
franklintempleton.com
FRANKLIN MUTUAL FINANCIAL SERVICES FUND
Tax Information (unaudited)
Under Section 854(b)(1)(A) of the Internal Revenue Code (Code), the Fund hereby reports 45.13% of the ordinary income dividends as income qualifying for the dividends received deduction for the fiscal year ended December 31, 2015.
Under Section 854(b)(1)(B) of the Code, the Fund hereby reports the maximum amount allowable but no less than $10,500,526 as qualified dividends for purposes of the maximum rate under Section 1(h)(11) of the Code for the fiscal year ended December 31, 2015. Distributions, including qualified dividend income, paid during calendar year 2015 will be reported to shareholders on Form 1099-DIV by mid-February 2016. Shareholders are advised to check with their tax advisors for information on the treatment of these amounts on their individual income tax returns.
franklintempleton.com
Annual Report
41
FRANKLIN MUTUAL FINANCIAL SERVICES FUND
Board Members and Officers
The name, year of birth and address of the officers and board members, as well as their affiliations, positions held with the Fund, principal occupations during at least the past five years and number of portfolios overseen in the Franklin Templeton Investments fund complex, are shown below. Generally, each board member serves until that person’s successor is elected and qualified.
| Independent Board Members | ||||
| Number of Portfolios in | ||||
| Name, Year of Birth | Length of | Fund Complex Overseen | Other Directorships Held | |
| and Address | Position | Time Served | by Board Member* | During at Least the Past 5 Years |
| Edward I. Altman, Ph.D. (1941) | Trustee | Since 1987 | 17 | None |
| c/o Franklin Mutual Advisers, LLC | ||||
| 101 John F. Kennedy Parkway | ||||
| Short Hills, NJ 07078-2789 | ||||
Principal Occupation During at Least the Past 5 Years:
Max L. Heine Professor of Finance, Emeritus and Director of The Credit and Debt Markets Research Program, Salomon Center, Stern School of Business, New York University; editor and author of numerous financial publications; financial consultant; an adviser to numerous financial and publishing organizations; and formerly, Vice Director, Salomon Center, Stern School of Business, New York University.
| Ann Torre Bates (1958) | Trustee | Since 1995 | 41 | Navient Corporation (loan |
| c/o Franklin Mutual Advisers, LLC | management, servicing and asset | |||
| 101 John F. Kennedy Parkway | recovery) (2014-present), Ares | |||
| Short Hills, NJ 07078-2789 | Capital Corporation (specialty finance | |||
| company) (2010-present), United | ||||
| Natural Foods, Inc. (distributor of | ||||
| natural, organic and specialty foods) | ||||
| (2013-present), Allied Capital | ||||
| Corporation (financial services) | ||||
| (2003-2010) and SLM Corporation | ||||
| (Sallie Mae) (1997-2014). |
Principal Occupation During at Least the Past 5 Years:
Director of various companies; and formerly, Executive Vice President and Chief Financial Officer, NHP Incorporated (manager of multifamily housing) (1995-1997); and Vice President and Treasurer, US Airways, Inc. (until 1995).
| Burton J. Greenwald (1929) | Trustee | Trustee since | 17 | Franklin Templeton Emerging Markets |
| c/o Franklin Mutual Advisers, LLC | and Vice | 2002 and Vice | Debt Opportunities Fund PLC and | |
| 101 John F. Kennedy Parkway | Chairman | Chairman since | Fiduciary International Ireland Limited | |
| Short Hills, NJ 07078-2789 | of the | April 2015 | (1999-2015). | |
| Board |
Principal Occupation During at Least the Past 5 Years:
Managing Director, B.J. Greenwald Associates (management consultants to the financial services industry); and formerly, Chairman, Fiduciary Trust International Funds; Executive Vice President, L.F. Rothschild Fund Management, Inc.; President and Director, Merit Mutual Funds; President, Underwriting Division and Director, National Securities & Research Corporation; Governor, Investment Company Institute; and Chairman, ICI Public Information Committee.
| Keith E. Mitchell (1954) | Trustee | Since 2009 | 17 | None |
| c/o Franklin Mutual Advisers, LLC | ||||
| 101 John F. Kennedy Parkway | ||||
| Short Hills, NJ 07078-2789 |
Principal Occupation During at Least the Past 5 Years:
Director of various boards of asset management firms; and formerly, Managing Member, Mitchell, Hartley & Bechtel Advisers, LLC (formerly, Mitchell Advisers, LLC) (advisory firm) (2003-2015) and Managing Director, Putnam Lovell NBF.
42 Annual Report
franklintempleton.com
FRANKLIN MUTUAL FINANCIAL SERVICES FUND
| Independent Board Members (continued) | ||||
| Number of Portfolios in | ||||
| Name, Year of Birth | Length of | Fund Complex Overseen | Other Directorships Held | |
| and Address | Position | Time Served | by Board Member* | During at Least the Past 5 Years |
| David W. Niemiec (1949) | Trustee | Since | 41 | Emeritus Corporation (assisted living) |
| One Franklin Parkway | April 2015 | (1999-2010) and OSI Pharmaceuticals, | ||
| San Mateo, CA 94403-1906 | Inc. (pharmaceutical products) | |||
| (2006-2010). | ||||
Principal Occupation During at Least the Past 5 Years:
Advisor, Saratoga Partners (private equity fund); and formerly, Managing Director, Saratoga Partners (1998-2001) and SBC Warburg Dillon Read (investment banking) (1997-1998); Vice Chairman, Dillon, Read & Co. Inc. (investment banking) (1991-1997); and Chief Financial Officer, Dillon, Read & Co. Inc. (1982-1997).
| Charles Rubens II (1930) | Trustee | Since 1998 | 17 | None |
| c/o Franklin Mutual Advisers, LLC | ||||
| 101 John F. Kennedy Parkway | ||||
| Short Hills, NJ 07078-2789 |
Principal Occupation During at Least the Past 5 Years:
Private investor and president of non-profit organizations; and formerly, an executive of Time, Inc.; and Trustee of Colorado College.
| Jan Hopkins Trachtman (1947) | Trustee | Since 2009 | 17 | None |
| c/o Franklin Mutual Advisers, LLC | ||||
| 101 John F. Kennedy Parkway | ||||
| Short Hills, NJ 07078-2789 |
Principal Occupation During at Least the Past 5 Years:
President and Founder, The Jan Hopkins Group (communications consulting firm); serves on Advisory Board of Knight Bagehot Fellowship; and formerly, President, Economic Club of New York (2001-2015); Anchor/Correspondent, CNN Financial News (until 2003); Managing Director and Head of Client Communications, Citigroup Private Bank (until 2005); Off-Air Reporter, ABC News’ World News Tonight; and Editor, CBS Network News.
| Robert E. Wade (1946) | Trustee | Trustee since | 41 | El Oro Ltd (investments) | |
| c/o Franklin Mutual Advisers, LLC | and | 1993 | and | (2003-present). | |
| 101 John F. Kennedy Parkway | Chairman | Chairman | |||
| Short Hills, NJ 07078-2789 | of the | of the Board | |||
| Board | since 2005 | ||||
| Principal Occupation During at Least the Past 5 Years: | |||||
| Attorney at law engaged in private practice (1972-2008) and member of various boards. | |||||
| Gregory H. Williams (1943) | Trustee | Since | 17 | None | |
| One Franklin Parkway | April 2015 | ||||
| San Mateo, CA 94403-1906 | |||||
Principal Occupation During at Least the Past 5 Years:
Private investor; Consultant; and formerly, President, University of Cincinnati (2009-2012); President, The City College of New York (2001-2009); Dean, College of Law, Ohio State University (1993-2001); and Associate Vice President, Academic Affairs and Professor of Law, University of Iowa (1977-1993).
franklintempleton.com
Annual Report
43
FRANKLIN MUTUAL FINANCIAL SERVICES FUND
| Interested Board Members and Officers | ||||
| Number of Portfolios in | ||||
| Name, Year of Birth | Length of | Fund Complex Overseen | Other Directorships Held | |
| and Address | Position | Time Served | by Board Member* | During at Least the Past 5 Years |
| **Gregory E. Johnson (1961) | Trustee | Since 2007 | 164 | None |
| One Franklin Parkway | ||||
| San Mateo, CA 94403-1906 | ||||
Principal Occupation During at Least the Past 5 Years:
Chairman of the Board, Member – Office of the Chairman, Director and Chief Executive Officer, Franklin Resources, Inc.; officer and/or director or trustee, as the case may be, of some of the other subsidiaries of Franklin Resources, Inc. and of 44 of the investment companies in Franklin Templeton Investments; Vice Chairman, Investment Company Institute; and formerly, President, Franklin Resources, Inc. (1994-2015).
| **Peter A. Langerman (1955) | Trustee, | Trustee | 7 | American International Group, Inc. |
| c/o Franklin Mutual Advisers, LLC | President, | since 2007, | (AIG) Credit Facility Trust | |
| 101 John F. Kennedy Parkway | and Chief | President, and | (2010-2011). | |
| Short Hills, NJ 07078-2702 | Executive | Chief Executive | ||
| Officer – | Officer – | |||
| Investment | Investment | |||
| Management | Management | |||
| since 2005 |
Principal Occupation During at Least the Past 5 Years:
Chairman of the Board, Chief Executive Officer and President, Franklin Mutual Advisers, LLC; and officer and/or director, as the case may be, of two of the investment companies in Franklin Templeton Investments.
| Alison E. Baur (1964) | Vice | Since 2012 | Not Applicable | Not Applicable |
| One Franklin Parkway | President | |||
| San Mateo, CA 94403-1906 |
Principal Occupation During at Least the Past 5 Years:
Deputy General Counsel, Franklin Templeton Investments; and officer of some of the other subsidiaries of Franklin Resources, Inc. and of 44 of the investment companies in Franklin Templeton Investments.
| Philippe Brugere-Trelat (1949) | Vice | Since 2005 | Not Applicable | Not Applicable |
| 101 John F. Kennedy Parkway | President | |||
| Short Hills NJ 07078-2789 |
Principal Occupation During at Least the Past 5 Years:
Executive Vice President, Franklin Mutual Advisers, LLC; officer of two of the investment companies in Franklin Templeton Investments; and formerly, Portfolio Manager of Eurovest SA (French registered Investment Company, Sicav).
| Laura F. Fergerson (1962) | Chief | Since 2009 | Not Applicable | Not Applicable |
| One Franklin Parkway | Executive | |||
| San Mateo, CA 94403-1906 | Officer – | |||
| Finance and | ||||
| Administration |
Principal Occupation During at Least the Past 5 Years:
Senior Vice President, Franklin Templeton Services, LLC; Vice President, Franklin Advisers, Inc. and Franklin Templeton Institutional, LLC; and officer of 44 of the investment companies in Franklin Templeton Investments.
| Aliya S. Gordon (1973) | Vice | Since 2009 | Not Applicable | Not Applicable |
| One Franklin Parkway | President | |||
| San Mateo, CA 94403-1906 |
Principal Occupation During at Least the Past 5 Years:
Senior Associate General Counsel, Franklin Templeton Investments; and officer of 44 of the investment companies in Franklin Templeton Investments.
44 Annual Report
franklintempleton.com
FRANKLIN MUTUAL FINANCIAL SERVICES FUND
| Interested Board Members and Officers (continued) | ||||
| Number of Portfolios in | ||||
| Name, Year of Birth | Length of | Fund Complex Overseen | Other Directorships Held | |
| and Address | Position | Time Served | by Board Member* | During at Least the Past 5 Years |
| Steven J. Gray (1955) | Secretary | Secretary | Not Applicable | Not Applicable |
| One Franklin Parkway | and Vice | since 2005 and | ||
| San Mateo, CA 94403-1906 | President | Vice President | ||
| since 2009 | ||||
Principal Occupation During at Least the Past 5 Years:
Senior Associate General Counsel, Franklin Templeton Investments; Vice President, Franklin Templeton Distributors, Inc. and Franklin Alternative Strategies Advisers, LLC; and officer of 44 of the investment companies in Franklin Templeton Investments.
| Selena L. Holmes (1965) | Vice | Since 2012 | Not Applicable | Not Applicable |
| 100 Fountain Parkway | President – | |||
| St. Petersburg, FL 33716-1205 | AML | |||
| Compliance |
Principal Occupation During at Least the Past 5 Years:
Director, Global Compliance Monitoring; Chief Compliance Officer, Franklin Alternative Strategies Advisers, LLC; Vice President, Franklin Templeton Companies, LLC; and officer of 44 of the investment companies in Franklin Templeton Investments.
| Robert G. Kubilis (1973) | Treasurer, | Since 2012 | Not Applicable | Not Applicable |
| 300 S.E. 2nd Street | Chief | |||
| Fort Lauderdale, FL 33301-1923 | Financial | |||
| Officer | ||||
| and Chief | ||||
| Accounting | ||||
| Officer |
Principal Occupation During at Least the Past 5 Years:
Treasurer, U.S. Fund Administration & Reporting, Franklin Templeton Investments; and officer of four of the investment companies in Franklin Templeton Investments.
| Kimberly H. Novotny (1972) | Vice | Since 2013 | Not Applicable | Not Applicable |
| 300 S.E. 2nd Street | President | |||
| Fort Lauderdale, FL 33301-1923 |
Principal Occupation During at Least the Past 5 Years:
Associate General Counsel, Franklin Templeton Investments; Vice President, Fiduciary Trust International of the South and Templeton Investment Counsel, LLC; Assistant Secretary, Franklin Resources, Inc.; and officer of 44 of the investment companies in Franklin Templeton Investments.
| Robert C. Rosselot (1960) | Chief | Since 2013 | Not Applicable | Not Applicable |
| 300 S.E. 2nd Street | Compliance | |||
| Fort Lauderdale, FL 33301-1923 | Officer |
Principal Occupation During at Least the Past 5 Years:
Director, Global Compliance, Franklin Templeton Investments; Vice President, Franklin Templeton Companies, LLC; officer of 44 of the investment companies in Franklin Templeton Investments; and formerly, Senior Associate General Counsel, Franklin Templeton Investments (2007-2013); and Secretary and Vice President, Templeton Group of Funds (2004-2013).
| Karen L. Skidmore (1952) | Vice | Since 2009 | Not Applicable | Not Applicable |
| One Franklin Parkway | President | |||
| San Mateo, CA 94403-1906 |
Principal Occupation During at Least the Past 5 Years:
Senior Associate General Counsel, Franklin Templeton Investments; and officer of 44 of the investment companies in Franklin Templeton Investments.
franklintempleton.com
Annual Report
45
FRANKLIN MUTUAL FINANCIAL SERVICES FUND
| Interested Board Members and Officers (continued) | ||||
| Number of Portfolios in | ||||
| Name, Year of Birth | Length of | Fund Complex Overseen | Other Directorships Held | |
| and Address | Position | Time Served | by Board Member* | During at Least the Past 5 Years |
| Navid Tofigh (1972) | Vice | Since | Not Applicable | Not Applicable |
| One Franklin Parkway | President | November 2015 | ||
| San Mateo, CA 94403-1906 | ||||
Principal Occupation During at Least the Past 5 Years:
Associate General Counsel, Franklin Templeton Investments; and officer of 44 of the investment companies in Franklin Templeton Investments.
| Craig S. Tyle (1960) | Vice | Since 2005 | Not Applicable | Not Applicable |
| One Franklin Parkway | President | |||
| San Mateo, CA 94403-1906 |
Principal Occupation During at Least the Past 5 Years:
General Counsel and Executive Vice President, Franklin Resources, Inc.; and officer of some of the other subsidiaries of Franklin Resources, Inc. and of 44 of the investment companies in Franklin Templeton Investments.
| Lori A. Weber (1964) | Vice | Since 2011 | Not Applicable | Not Applicable |
| 300 S.E. 2nd Street | President | |||
| Fort Lauderdale, FL 33301-1923 |
Principal Occupation During at Least the Past 5 Years:
Senior Associate General Counsel, Franklin Templeton Investments; Assistant Secretary, Franklin Resources, Inc.; Vice President and Secretary, Templeton Investment Counsel, LLC; and officer of 44 of the investment companies in Franklin Templeton Investments.
*We base the number of portfolios on each separate series of the U.S. registered investment companies within the Franklin Templeton Investments fund complex. These portfolios have a common investment manager or affiliated investment managers.
**Gregory E. Johnson is considered to be an interested person of the Fund under the federal securities laws due to his position as an officer and director of Franklin Resources, Inc., which is the parent company of the Fund’s investment manager and distributor. Peter A. Langerman is considered to be an interested person of the Fund under the federal securities laws due to his position as an officer of Franklin Mutual Advisers, LLC, which is an affiliate of the Fund’s investment manager.
Note 1: Officer information is current as of the date of this report. It is possible that after this date, information about officers may change.
The Fund’s Board has determined that certain of the members of the Audit Committee, including Ann Torre Bates, are audit committee financial experts, and “independent,” under those provisions of the Sarbanes-Oxley Act of 2002, and the rules and form amendments adopted by the Securities and Exchange Commission, relating to audit committee financial experts.
The Statement of Additional Information (SAI) includes additional information about the board members and is available, without charge, upon request.
Shareholders may call (800) DIAL BEN/342-5236 to request the SAI.
46 Annual Report
franklintempleton.com
FRANKLIN MUTUAL FINANCIAL SERVICES FUND
Shareholder Information
Proxy Voting Policies and Procedures
The Fund’s investment manager has established Proxy Voting Policies and Procedures (Policies) that the Fund uses to determine how to vote proxies relating to portfolio securities. Shareholders may view the Fund’s complete Policies online at franklintempleton.com. Alternatively, shareholders may request copies of the Policies free of charge by calling the Proxy Group collect at (954) 527-7678 or by sending a written request to: Franklin Templeton Companies, LLC, 300 S.E. 2nd Street, Fort Lauderdale, FL 33301, Attention: Proxy Group. Copies of the Fund’s proxy voting records are also made available online at franklintempleton.com and posted on the U.S. Securities and Exchange Commission’s website at sec.gov and reflect the most recent 12-month period ended June 30.
Quarterly Statement of Investments
The Fund files a complete statement of investments with the U.S. Securities and Exchange Commission for the first and third quarters for each fiscal year on Form N-Q. Shareholders may view the filed Form N-Q by visiting the Commission’s website at sec.gov. The filed form may also be viewed and copied at the Commission’s Public Reference Room in Washington, DC. Information regarding the operations of the Public Reference Room may be obtained by calling (800) SEC-0330.
Householding of Reports and Prospectuses
You will receive the Fund’s financial reports every six months as well as an annual updated summary prospectus (prospectus available upon request). To reduce Fund expenses, we try to identify related shareholders in a household and send only one copy of the financial reports and summary prospectus. This process, called “householding,” will continue indefinitely unless you instruct us otherwise. If you prefer not to have these documents householded, please call us at (800) 632-2301. At any time you may view current prospectuses/summary prospectuses and financial reports on our website. If you choose, you may receive these documents through electronic delivery.
franklintempleton.com
Annual Report
47
This page intentionally left blank

| Contents | |
| Annual Report | |
| Franklin Mutual Global Discovery Fund | 3 |
| Performance Summary | 8 |
| Your Fund’s Expenses | 13 |
| Financial Highlights and Statement of Investments | 15 |
| Financial Statements | 28 |
| Notes to Financial Statements | 32 |
| Report of Independent Registered | |
| Public Accounting Firm | 44 |
| Tax Information | 45 |
| Board Members and Officers | 46 |
| Shareholder Information | 51 |
Visit franklintempleton.com for fund updates, to access your account, or to find helpful financial planning tools.
2 Annual Report
franklintempleton.com
Annual Report
Franklin Mutual Global Discovery Fund
This annual report for Franklin Mutual Global Discovery Fund covers the fiscal year ended December 31, 2015.
Your Fund’s Goal and Main Investments
The Fund seeks capital appreciation, which may occasionally be short term, by investing primarily in equity securities of companies of any nation that we believe are at prices below their intrinsic value. The Fund may invest up to 100% of its assets in foreign securities.
Performance Overview
The Fund’s Class Z shares had a -3.36% cumulative total return for the 12 months ended December 31, 2015. In comparison, the MSCI World Index, which tracks stock performance in global developed markets, had a -0.32% total return, and the Standard & Poor’s 500® Index (S&P 500®), which is a broad measure of U.S. stock performance, posted a +1.38% total return.1 You can find more of Fund’s performance data in the Performance Summary beginning on page 8.
Performance data represent past performance, which does not guarantee future results. Investment return and principal value will fluctuate, and you may have a gain or loss when you sell your shares. Current performance may differ from figures shown. For most recent month-end performance, go to franklintempleton.com or call (800) 342-5236.
Economic and Market Overview
The global economy expanded moderately during the 12 months under review. As measured by the MSCI World Index, stocks in global developed markets overall were down slightly for the year despite some positive developments. Weighing on global stocks at times were worries about China’s slowing economy and tumbling stock market, declining commodity prices, geopolitical tensions between Russia and Turkey, and ongoing uncertainty over the U.S. Federal Reserve’s (Fed’s) timing for raising interest rates. Toward period-end, equity markets recovered somewhat as the Fed increased its federal funds target range for the first time in nine years, alleviating some uncertainty about a change in the U.S. monetary policy. During the year, oil prices declined sharply largely due to increased global supply that exceeded demand. Gold and other commodity prices also fell. The U.S. dollar appreciated against most currencies during the period, which reduced returns of many foreign assets in U.S. dollar terms.
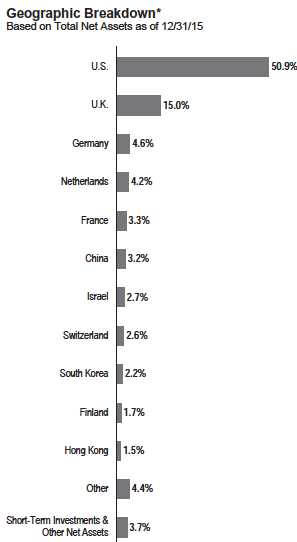
*Figures are stated as a percentage of total and may not equal 100% or may be
negative due to rounding, use of any derivatives, unsettled trades or other factors.
1. Source: Morningstar.
The indexes are unmanaged and include reinvestment of any income or distributions. One cannot invest directly in an index, and an index is not representative of the
Fund’s portfolio.
The dollar value, number of shares or principal amount, and names of all portfolio holdings are listed in the Fund’s Statement of Investments (SOI).
The SOI begins on page 20.
franklintempleton.com
Annual Report
3
FRANKLIN MUTUAL GLOBAL DISCOVERY FUND
U.S. economic growth slowed in 2015’s first quarter but strengthened in 2015’s second quarter amid healthy consumer spending. The third and fourth quarters were less robust as exports slowed and state and local governments reduced their spending. At its December meeting, the Fed increased its target range for the federal funds rate to 0.25%–0.50%, as policy-makers cited the labor market’s considerable improvement and were reasonably confident that inflation would move back to the Fed’s 2% medium-term objective. Furthermore, the Fed raised its forecast for 2016 U.S. economic growth and lowered its unemployment projections.
In Europe, U.K. economic growth gained momentum from the services sector, but the economy slowed in 2015 compared with 2014. The eurozone grew moderately and generally benefited during the year from lower oil prices, a weaker euro that supported exports, the European Central Bank’s (ECB’s) accommodative policy and expectations of further ECB stimulus. Although the eurozone’s annual inflation rate declined early in the period, it rose slightly during the rest of the period. The ECB maintained its benchmark interest rates although it reduced its bank deposit rate in December, seeking to boost the region’s slowing growth.
Japan’s economy continued to grow in 2015’s first quarter. After a decline in the second quarter of 2015, it expanded in the third quarter as capital expenditures improved. The Bank of Japan took several actions during the reporting period, including maintaining its monetary policy, lowering its economic growth and inflation forecasts, and reorganizing its stimulus program to increase exposure to long-term government bonds and exchange-traded funds.
In emerging markets, economic growth generally moderated. In China, the government’s intervention to cool domestic stock market speculation and its effective currency devaluation led to a severe slump in emerging market stocks from June through August. In October, emerging market equities gained after China expanded its monetary and fiscal stimulus to support its economy. In Brazil, falling prices for energy and other commodities coincided with an economic recession, rising unemployment and political uncertainty, leading to equity weakness and currency depreciation. Emerging equity markets recovered some of their losses after the Fed increased its target interest rate in December. Central bank actions varied across emerging markets during the 12 months under review, as some banks raised interest rates in response to rising inflation and weakening currencies, while others lowered interest rates to promote economic growth. In the recent global environment, emerging market stocks overall, as measured by the MSCI Emerging Markets Index, fell for the 12-month period.
| Top 10 Sectors/Industries | ||
| Based on Equity Securities as of 12/31/15 | ||
| % of Total | ||
| Net Assets | ||
| Banks | 14.9 | % |
| Insurance | 12.1 | % |
| Pharmaceuticals | 7.6 | % |
| Media | 5.8 | % |
| Software | 5.7 | % |
| Oil, Gas & Consumable Fuels | 5.2 | % |
| Tobacco | 5.2 | % |
| Food & Staples Retailing | 3.6 | % |
| Health Care Equipment & Supplies | 3.3 | % |
| Technology Hardware, Storage & Peripherals | 3.2 | % |
Investment Strategy
At Franklin Mutual Series, we are committed to our distinctive value approach to investing, which we believe can generate above-average risk-adjusted returns over time for our shareholders. Our major investment strategy is investing in undervalued stocks. When selecting undervalued equities, we are attracted to what we believe are fundamentally strong companies with healthy balance sheets, high-quality assets, substantial free cash flow and shareholder-oriented management teams and whose stocks are trading at discounts to our assessment of the companies’ intrinsic or business value. We also look for asset-rich companies whose shares may be trading at depressed levels due to concerns over short-term earnings disappointments, litigation, management strategy or other perceived negatives. This strict value approach is not only intended to improve the likelihood of upside potential, but it is also intended to reduce the risk of substantial declines. While the vast majority of our undervalued equity investments are made in publicly traded companies globally, we may invest occasionally in privately held companies as well.
We complement this more traditional investment strategy with two others. One is distressed investing, a highly specialized field that has proven quite profitable during certain periods over the years. Distressed investing is complex and can take many forms. The most common distressed investment the Fund undertakes is the purchase of financially troubled or bankrupt companies’ debt at a substantial discount to face value. After the financially distressed company is reorganized, often in bankruptcy court, the old debt is typically replaced with new securities issued by the financially stronger company.
The other piece of our investment strategy is participating in arbitrage situations, another highly specialized field. When companies announce proposed mergers or takeovers,
4 Annual Report
franklintempleton.com
FRANKLIN MUTUAL GLOBAL DISCOVERY FUND
commonly referred to as “deals,” the target company may trade at a discount to the bid it ultimately accepts. One form of arbi-trage involves purchasing the target company’s stock when it is trading below the value we believe it would receive in a deal. In keeping with our commitment to a relatively conservative investment approach, we typically focus our arbitrage efforts on announced deals, and eschew rumored deals or other situations we consider relatively risky.
In addition, it is our practice to hedge the Fund’s currency exposure when we deem it advantageous for our shareholders.
What is meant by “hedge”?
To hedge an investment is to take a position intended to offset potential losses/gains that may be incurred by a companion financial instrument.
Manager’s Discussion
During the 12 months under review, stocks in most global markets declined after a three-year ascent. Globally, several major central banks became more accommodative while fiscal authorities focused on budgetary discipline. Large companies also remained disciplined about operating costs, with margins at historically high levels in many industries and countries. To drive further growth, an increasing number of companies took advantage of low interest rates to finance deals. In this environment, we saw a number of opportunities.
Equity prices are typically forward looking, reflecting investors’ beliefs about how various factors and events will play out in the future. Global equity prices at period-end were down from mid-2015 highs, reflecting increased uncertainty among global investors regarding China and other emerging markets, global commodity prices, U.S. monetary policy divergence and geopolitical events. However, with the support of global quantitative easing, many corporations have been able to build strong balance sheets, focus intensely on improving efficiency, maintain historically high margins and return a significant amount of capital to shareholders.
Merger and acquisition (M&A) activity accelerated in the past 12 months, helping to support valuations. Deal volumes reached historical highs and regulators globally increased their scrutiny of potential negative effects of high concentration. Such an environment — active M&A combined with regulatory uncertainty, greater complexity and market volatility — may provide attractive investment opportunities. We seek to use a mixture of merger arbitrage positions and investments in one or both of the companies to participate in these opportunities. The traditional merger arbitrage positions are constructed solely to benefit from deal completion, while unhedged investments in one or both companies can allow the Fund to benefit from possible value creation once the deal is completed.
Distressed debt remained a difficult market in which we could find compelling new opportunities. Low interest rates have kept credit widely available, and we felt bankruptcies were limited, except in the energy and mining sectors. Increased stress in high yield markets, particularly in energy credit, has expanded the potential opportunity set for us. For non-energy firms, costs of issuing debt are climbing and these debt securities are starting to look attractive to us. Within energy, declining commodity prices increased financial pressures for a growing number of issuers. At year-end, a record level of crude oil inventories and insistence by Saudi Arabia that it will not reduce production provide little reason to expect a quick recovery in crude oil prices, implying to us an increased likelihood of new investment opportunities in energy sector debt.
Turning to Fund performance, top contributors included multinational software company Microsoft, insurer NN Group and pharmaceutical company Hospira.2
Shares of Microsoft rose as earnings improved and the company’s cloud computing services gained momentum. In April and October, Microsoft’s quarterly earnings exceeded consensus estimates despite a challenging environment for personal computer sales. Revenue outperformance and cost controls helped drive the solid results, highlighted by the strong performance of Microsoft’s cloud computing operations, which include Azure and Office365. We believe Microsoft’s cloud computing business has the potential to grow and become increasingly profitable as technology users become more comfortable relying on cloud infrastructure and applications. Supporting this belief were the company’s assertions that the growth in Office365 subscriptions began to fully offset the decline in transactional, one-time license purchases. October’s quarterly results also showed strength in the adoption of Microsoft’s new Windows 10 operating system.
NN Group is a Dutch insurer spun out of ING Groep. The company followed through successfully on its efforts to reduce expenses and improve return on equity, a measure of the amount earned on a company’s common stock investment. Results for several quarters were positive, and the company stated in November that it had reached its expense savings target a year early but would continue to push for further efficiencies. The company also periodically repurchased shares from ING Groep to help meet ING’s goal to fully divest its insurance and investment management holdings by the end of 2016, as
2. Not held at period-end.
See www.franklintempletondatasources.com for additional data provider information.
franklintempleton.com
Annual Report 5
FRANKLIN MUTUAL GLOBAL DISCOVERY FUND
required under ING’s restructuring agreement with the European Commission.
Hospira is a global pharmaceutical and medical device company specializing in injectable generic drugs and biosimilars — drugs highly similar to medications licensed by other firms. Shares rose sharply in early February following the announcement that Pfizer had reached an agreement to acquire Hospira. We believed the deal, which closed in early September, made sense as Hospira offered Pfizer a strong leadership position in injectables and an attractive high-growth generics market, and the deal positioned Pfizer as a top-tier biosimilars company with a strong pipeline. This acquisition news was in line with our views on industry consolidation and more specifically on Hospira as a highly attractive asset in the generics industry.
During the period under review, some of the Fund’s investments that negatively affected performance were retailer Macy’s, oil and gas exploration and production company Marathon Oil and electricity producer NRG Energy.
U.S.-based Macy’s operates department stores and online shopping sites under its brand names Macy’s and Bloomingdales. The company’s stock price plunged in November after announcing, after months of review by its board, that it would continue to explore real estate transactions on an individual basis but would not place its property assets into a real estate investment trust (REIT). The company stated that, in its judgment, forming a REIT did not offer sufficient upside potential, and it would explore other real estate-related structures. Shares were also hurt by weak quarterly results announced in August and November, largely driven by unseasonably warm weather and reduced buying by international visitors due to a stronger U.S. dollar.
Marathon Oil’s stock price closely followed the decline in crude oil. In October, Marathon Oil announced a dividend cut, a move that preserves capital and puts the company’s capital allocation policies more in line with its exploration and production peer group, in our analysis. We believed this move could allow for a smaller reduction in capital spending and a corresponding improvement in its production profile, which we welcomed given the returns available from the company’s resource base. The company also announced a significant reduction in its deepwater exploration program, an action we viewed favorably given the program’s lackluster returns in recent years. We continued to believe that Marathon Oil’s relatively low-cost assets would enable it to weather the current downturn with the potential to generate strong returns if the environment improves.
NRG Energy is a U.S.-based integrated wholesale power generation and retail electricity company that includes solar and renewable energy businesses. The stock price declined in 2015 as natural gas and coal prices decreased, resulting in lower revenues for NRG’s wholesale power operation which sells electricity at market rates that move in line with fuel costs. In mid-December, the price of natural gas retreated to its lowest level since 2002. Investors also became increasingly unhappy with the short-term lack of return on investment from the company’s solar power business. As a result, NRG announced in September that it would package its solar power, electric vehicle charging and renewable energy operations into a new company.
During the year, the Fund held currency forwards and futures to somewhat hedge the currency risk of the portfolio’s non-U.S. dollar investments. The currency forwards had a positive impact on the Fund’s performance, and currency futures had a negligible impact.
What is a currency forward contract?
A currency forward contract, or a currency forward, is an agreement between the Fund and a counterparty to buy or sell a foreign currency at a specific exchange rate on a future date.
What is a futures contract?
A futures contract, or a future, is an agreement between the Fund and a counterparty made through a U.S. or foreign futures exchange to buy or sell an underlying instrument or asset at a specific price on a future date.
As fellow shareholders, we found recent relative and absolute performance disappointing, but it is not uncommon for our strategy to lag the equity markets at times. We remain committed to our disciplined, value investment approach as we seek to generate attractive, long-term, risk-adjusted returns for shareholders.
| Top 10 Equity Holdings | ||
| 12/31/15 | ||
| Company | % of Total | |
| Sector/Industry, Country | Net Assets | |
| Microsoft Corp. | 2.7 | % |
| Software, U.S. | ||
| Merck & Co. Inc. | 2.1 | % |
| Pharmaceuticals, U.S. | ||
| Medtronic PLC | 2.0 | % |
| Health Care Equipment & Supplies, U.S. | ||
| NN Group NV | 1.9 | % |
| Insurance, Netherlands | ||
| ACE Ltd. | 1.8 | % |
| Insurance, U.S. | ||
| Wells Fargo & Co. | 1.7 | % |
| Banks, U.S. | ||
| British American Tobacco PLC | 1.6 | % |
| Tobacco, U.K. | ||
| Novartis AG, ADR | 1.6 | % |
| Pharmaceuticals, Switzerland | ||
| Eli Lilly & Co. | 1.6 | % |
| Pharmaceuticals, U.S. | ||
| American International Group Inc. | 1.5 | % |
| Insurance, U.S. |
6 Annual Report
franklintempleton.com
FRANKLIN MUTUAL GLOBAL DISCOVERY FUND
Thank you for your continued participation in Franklin Mutual Global Discovery Fund. We look forward to continuing to serve your investment needs.

The foregoing information reflects our analysis, opinions and portfolio holdings as of December 31, 2015, the end of the reporting period. The way we implement our main investment strategies and the resulting portfolio holdings may change depending on factors such as market and economic conditions. These opinions may not be relied upon as investment advice or an offer for a particular security. The information is not a complete analysis of every aspect of any market, country, industry, security or the Fund. Statements of fact are from sources considered reliable, but the investment manager makes no representation or warranty as to their completeness or accuracy. Although historical performance is no guarantee of future results, these insights may help you understand our investment management philosophy.
CFA® is a trademark owned by CFA Institute.
Peter Langerman has been portfolio manager for Franklin Mutual Global Discovery Fund since 2009. He has been portfolio manager for Franklin Mutual Shares Fund since 2005. He joined Franklin Templeton Investments in 1996, serving in various capacities, including President and Chief Executive Officer of Franklin Mutual Advisers and member of the management team of the Funds, including Franklin Mutual Global Discovery Fund. From 2002 to 2005, he served as director of New Jersey’s Division of Investment, overseeing employee pension funds. Between 1986 and 1996, Mr. Langerman was employed at Heine Securities Corporation, the Fund’s former manager.
Philippe Brugere-Trelat has been portfolio manager for Franklin Mutual Global Discovery Fund since 2009. He has been lead portfolio manager for Franklin Mutual European Fund since 2005 and co-portfolio manager for Franklin Mutual International Fund since 2009. He has been a member of the management team of the Franklin Mutual Series Funds since 2004, when he rejoined Franklin Templeton Investments. Previously, he was president and portfolio manager of Eurovest. Between 1984 and 1994, Mr. Brugere-Trelat was employed at Heine Securities Corporation, the Fund’s former manager.
Timothy Rankin rejoined the Franklin Mutual Series investment group in 2010 and currently serves as co-portfolio manager for Franklin Mutual Global Discovery Fund, and as a research analyst, is responsible for the analysis of the global energy and chemical industries. Mr. Rankin had previously worked at Franklin Mutual Series from 1997 through 2004. Mr. Rankin has over 20 years of experience in the investment management industry, including over 10 years with Franklin Mutual Series as a research analyst and portfolio manager. Most recently, he was managing director of Blue Harbour Group, LLC, a private investment firm focused on small- and mid-cap North American companies. Prior to his original employment with Franklin Mutual Series, Mr. Rankin was an equity analyst at Glickenhaus & Co.
franklintempleton.com
Annual Report 7
FRANKLIN MUTUAL GLOBAL DISCOVERY FUND
Performance Summary as of December 31, 2015
Your dividend income will vary depending on dividends or interest paid by securities in the Fund’s portfolio, adjusted for operating expenses of each class. Capital gain distributions are net profits realized from the sale of portfolio securities. The performance table and graphs do not reflect any taxes that a shareholder would pay on Fund dividends, capital gain distributions, if any, or any realized gains on the sale of Fund shares. Total return reflects reinvestment of the Fund’s dividends and capital gain distributions, if any, and any unrealized gains or losses.
| Net Asset Value | ||||||||
| Share Class (Symbol) | 12/31/15 | 12/31/14 | Change | |||||
| Z (MDISX) | $ | 29.35 | $ | 33.32 | -$ | 3.97 | ||
| A (TEDIX) | $ | 28.86 | $ | 32.81 | -$ | 3.95 | ||
| C (TEDSX) | $ | 28.55 | $ | 32.49 | -$ | 3.94 | ||
| R (TEDRX) | $ | 28.51 | $ | 32.43 | -$ | 3.92 | ||
| R6 (FMDRX) | $ | 29.35 | $ | 33.33 | -$ | 3.98 | ||
| Distributions1 (1/1/15–12/31/15) | ||||||||
| Dividend | Short-Term | Long-Term | ||||||
| Share Class | Income | Capital Gain | Capital Gain | Total | ||||
| Z | $ | 0.5529 | $ | 0.2677 | $ | 1.9755 | $ | 2.7961 |
| A | $ | 0.4649 | $ | 0.2677 | $ | 1.9755 | $ | 2.7081 |
| C | $ | 0.2357 | $ | 0.2677 | $ | 1.9755 | $ | 2.4789 |
| R | $ | 0.3871 | $ | 0.2677 | $ | 1.9755 | $ | 2.6303 |
| R6 | $ | 0.6041 | $ | 0.2677 | $ | 1.9755 | $ | 2.8473 |
See page 12 for Performance Summary footnotes.
8 Annual Report
franklintempleton.com
FRANKLIN MUTUAL GLOBAL DISCOVERY FUND
PERFORMANCE SUMMARY
Performance as of 12/31/152
Cumulative total return excludes sales charges. Average annual total return and value of $10,000 investment include maximum sales charges. Class Z/R/R6: no sales charges; Class A: 5.75% maximum initial sales charge; Class C: 1% contingent deferred sales charge in first year only.
| Cumulative | Average Annual | Value of $10,000 | Total Annual | |||||
| Share Class | Total Return3 | Total Return4 | Investment5 | Operating Expenses6 | ||||
| Z | 0.99 | % | ||||||
| 1-Year | -3.36 | % | -3.36 | % | $ | 9,664 | ||
| 5-Year | +41.43 | % | +7.18 | % | $ | 14,143 | ||
| 10-Year | +92.83 | % | +6.79 | % | $ | 19,283 | ||
| A | 1.29 | % | ||||||
| 1-Year | -3.63 | % | -9.16 | % | $ | 9,084 | ||
| 5-Year | +39.37 | % | +5.61 | % | $ | 13,136 | ||
| 10-Year | +87.17 | % | +5.84 | % | $ | 17,640 | ||
| C | 1.99 | % | ||||||
| 1-Year | -4.33 | % | -5.20 | % | $ | 9,480 | ||
| 5-Year | +34.59 | % | +6.12 | % | $ | 13,459 | ||
| 10-Year | +74.53 | % | +5.73 | % | $ | 17,453 | ||
| R | 1.49 | % | ||||||
| 1-Year | -3.82 | % | -3.82 | % | $ | 9,618 | ||
| 5-Year | +37.95 | % | +6.65 | % | $ | 13,795 | ||
| 10-Year | +83.43 | % | +6.25 | % | $ | 18,343 | ||
| R6 | 0.85 | % | ||||||
| 1-Year | -3.23 | % | -3.23 | % | $ | 9,677 | ||
| Since Inception (5/1/13) | +17.06 | % | +6.08 | % | $ | 11,706 |
Performance data represent past performance, which does not guarantee future results. Investment return and principal value will fluctuate, and you may have a gain or loss when you sell your shares. Current performance may differ from figures shown. For most recent month-end performance, go to franklintempleton.com or call (800) 342-5236.
See page 12 for Performance Summary footnotes.
franklintempleton.com
Annual Report 9
FRANKLIN MUTUAL GLOBAL DISCOVERY FUND
PERFORMANCE SUMMARY
Total Return Index Comparison for a Hypothetical $10,000 Investment2
Total return represents the change in value of an investment over the periods shown. It includes any applicable maximum sales charge, Fund expenses, account fees and reinvested distributions. The unmanaged indexes include reinvestment of any income or distributions. They differ from the Fund in composition and do not pay management fees or expenses. One cannot invest directly in an index.
See page 12 for Performance Summary footnotes.
10 Annual Report
franklintempleton.com
FRANKLIN MUTUAL GLOBAL DISCOVERY FUND
PERFORMANCE SUMMARY
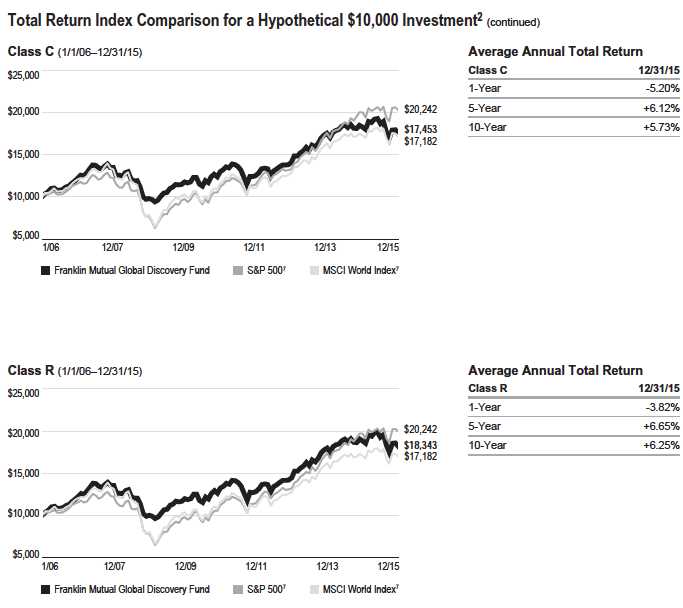
See page 12 for Performance Summary footnotes.
franklintempleton.com
Annual Report
11
FRANKLIN MUTUAL GLOBAL DISCOVERY FUND
PERFORMANCE SUMMARY
Total Return Index Comparison for a Hypothetical $10,000 Investment2 (continued)

All investments involve risks, including possible loss of principal. Value securities may not increase in price as anticipated or may decline further in value. The Fund’s investments in foreign securities involve certain risks including currency fluctuations, and economic and political uncertainties. Smaller company stocks have exhibited greater price volatility than larger company stocks, particularly over the short term. The Fund’s investments in companies engaged in mergers, reorganizations or liquidations also involve special risks as pending deals may not be completed on time or on favorable terms. The Fund may invest in lower rated bonds, which entail higher credit risk. The Fund is actively managed but there is no guarantee that the manager’s investment decisions will produce the desired results. The Fund’s prospectus also includes a description of the main investment risks.
Class Z: Class C: Class R: Class R6: | Shares are available to certain eligible investors as described in the prospectus. These shares have higher annual fees and expenses than Class A shares. Shares are available to certain eligible investors as described in the prospectus. These shares have higher annual fees and expenses than Class A shares. Shares are available to certain eligible investors as described in the prospectus. |
1. The distribution amount is the sum of the dividend payments to shareholders for the period shown and includes only estimated tax-basis net investment income and
capital gain.
2. The Fund has a fee waiver associated with any investment in a Franklin Templeton money fund, contractually guaranteed through at least its current fiscal year-end. Fund
investment results reflect the fee waiver, to the extent applicable; without this reduction, the results would have been lower.
3. Cumulative total return represents the change in value of an investment over the periods indicated.
4. Average annual total return represents the average annual change in value of an investment over the periods indicated. Return for less than one year, if any, has not
been annualized.
5. These figures represent the value of a hypothetical $10,000 investment in the Fund over the periods indicated.
6. Figures are as stated in the Fund’s current prospectus. In periods of market volatility, assets may decline significantly, causing total annual Fund operating expenses to
become higher than the figures shown.
7. Source: Morningstar. The S&P 500 is a market capitalization-weighted index of 500 stocks designed to measure total U.S. equity market performance. The MSCI World
Index is a free float-adjusted, market capitalization-weighted index designed to measure equity market performance in global developed markets.
See www.franklintempletondatasources.com for additional data provider information.
12 Annual Report
franklintempleton.com
FRANKLIN MUTUAL GLOBAL DISCOVERY FUND
Your Fund’s Expenses
As a Fund shareholder, you can incur two types of costs:
- Transaction costs, including sales charges (loads) on Fund purchases; and
- Ongoing Fund costs, including management fees, distribu- tion and service (12b-1) fees, and other Fund expenses. All mutual funds have ongoing costs, sometimes referred to as operating expenses.
The following table shows ongoing costs of investing in the Fund and can help you understand these costs and compare them with those of other mutual funds. The table assumes a $1,000 investment held for the six months indicated.
Actual Fund Expenses
The first line (Actual) for each share class listed in the table provides actual account values and expenses. The “Ending Account Value” is derived from the Fund’s actual return, which includes the effect of Fund expenses.
You can estimate the expenses you paid during the period by following these steps. Of course, your account value and expenses will differ from those in this illustration:
1. Divide your account value by $1,000.
If an account had an $8,600 value, then $8,600 ÷ $1,000 = 8.6.
2. Multiply the result by the number under the heading “Expenses Paid During Period.”
If Expenses Paid During Period were $7.50, then 8.6 × $7.50 = $64.50.
In this illustration, the estimated expenses paid this period are $64.50.
Hypothetical Example for Comparison with Other Funds
Information in the second line (Hypothetical) for each class in the table can help you compare ongoing costs of investing in the Fund with those of other mutual funds. This information may not be used to estimate the actual ending account balance or expenses you paid during the period. The hypothetical “Ending Account Value” is based on the Fund’s actual expense ratio for each class and an assumed 5% annual rate of return before expenses, which does not represent the Fund’s actual return. The figure under the heading “Expenses Paid During Period” shows the hypothetical expenses your account would have incurred under this scenario. You can compare this figure with the 5% hypothetical examples that appear in shareholder reports of other funds.
Please note that expenses shown in the table are meant to highlight ongoing costs and do not reflect any transaction costs, such as sales charges. Therefore, the second line for each class is useful in comparing ongoing costs only, and will not help you compare total costs of owning different funds. In addition, if transaction costs were included, your total costs would have been higher. Please refer to the Fund prospectus for additional information on operating expenses.
franklintempleton.com
Annual Report
13
| FRANKLIN MUTUAL GLOBAL DISCOVERY FUND |
| YOUR FUND’S EXPENSES |
| Beginning Account | Ending Account | Expenses Paid During | ||||
| Share Class | Value 7/1/15 | Value 12/31/15 | Period* 7/1/15–12/31/15 | |||
| Z | ||||||
| Actual | $ | 1,000 | $ | 939.90 | $ | 4.84 |
| Hypothetical (5% return before expenses) | $ | 1,000 | $ | 1,020.21 | $ | 5.04 |
| A | ||||||
| Actual | $ | 1,000 | $ | 938.80 | $ | 6.11 |
| Hypothetical (5% return before expenses) | $ | 1,000 | $ | 1,018.90 | $ | 6.36 |
| C | ||||||
| Actual | $ | 1,000 | $ | 935.40 | $ | 9.71 |
| Hypothetical (5% return before expenses) | $ | 1,000 | $ | 1,015.17 | $ | 10.11 |
| R | ||||||
| Actual | $ | 1,000 | $ | 937.80 | $ | 7.28 |
| Hypothetical (5% return before expenses) | $ | 1,000 | $ | 1,017.69 | $ | 7.58 |
| R6 | ||||||
| Actual | $ | 1,000 | $ | 940.80 | $ | 4.06 |
| Hypothetical (5% return before expenses) | $ | 1,000 | $ | 1,021.02 | $ | 4.23 |
*Expenses are calculated using the most recent six-month expense ratio, net of expense waivers, annualized for each class (Z: 0.99%; A: 1.25%; C: 1.99%; R: 1.49%; and R6: 0.83%), multiplied by the average account value over the period, multiplied by 184/365 to reflect the one-half year period.
14 Annual Report
franklintempleton.com
FRANKLIN MUTUAL GLOBAL DISCOVERY FUND
| Financial Highlights | |||||||||||||||
| Year Ended December 31, | |||||||||||||||
| 2015 | 2014 | 2013 | 2012 | 2011 | |||||||||||
| Class Z | |||||||||||||||
| Per share operating performance | |||||||||||||||
| (for a share outstanding throughout the year) | |||||||||||||||
| Net asset value, beginning of year | $ | 33.32 | $ | 33.73 | $ | 28.65 | $ | 27.47 | $ | 29.54 | |||||
| Income from investment operationsa: | |||||||||||||||
| Net investment incomeb | 0.53 | 0.82 | c | 0.55 | 0.56 | 0.61 | |||||||||
| Net realized and unrealized gains (losses) | (1.71 | ) | 0.97 | 6.74 | 3.21 | (1.46 | ) | ||||||||
| Total from investment operations | (1.18 | ) | 1.79 | 7.29 | 3.77 | (0.85 | ) | ||||||||
| Less distributions from: | |||||||||||||||
| Net investment income | (0.55 | ) | (0.82 | ) | (0.57 | ) | (0.57 | ) | (0.55 | ) | |||||
| Net realized gains | (2.24 | ) | (1.38 | ) | (1.64 | ) | (2.02 | ) | (0.67 | ) | |||||
| Total distributions | (2.79 | ) | (2.20 | ) | (2.21 | ) | (2.59 | ) | (1.22 | ) | |||||
| Net asset value, end of year | $ | 29.35 | $ | 33.32 | $ | 33.73 | $ | 28.65 | $ | 27.47 | |||||
| Total return | (3.36 | )% | 5.33 | % | 25.64 | % | 13.64 | % | (2.68 | )% | |||||
| Ratios to average net assets | |||||||||||||||
| Expensesd | 0.99 | %e,f | 0.99 | %e | 0.98 | %e | 1.02 | % | 1.01 | % | |||||
| Expenses incurred in connection with securities sold short | 0.02 | % | 0.03 | % | —%g | —%g | —%g | ||||||||
| Net investment income | 1.56 | % | 2.38 | %c | 1.68 | % | 1.89 | % | 2.11 | % | |||||
| Supplemental data | |||||||||||||||
| Net assets, end of year (000’s) | $ | 9,132,752 | $ | 10,375,518 | $ | 9,529,245 | $ | 7,417,041 | $ | 7,159,033 | |||||
| Portfolio turnover rate | 21.79 | % | 23.66 | % | 23.57 | % | 24.65 | % | 33.60 | % | |||||
aThe amount shown for a share outstanding throughout the period may not correlate with the Statement of Operations for the period due to the timing of sales and repurchases
of the Fund’s shares in relation to income earned and/or fluctuating fair value of the investments of the Fund.
bBased on average daily shares outstanding.
cNet investment income per share includes approximately $0.34 per share received in the form of a special dividend paid in connection with certain Fund’s holdings. Excluding
this amount, the ratio of net investment income to average net assets would have been 1.40%.
dIncludes dividend and/or interest expense on securities sold short and security borrowing fees, if any. See below for the ratios of such expenses to average net assets for the
periods presented. See Note 1(e).
eBenefit of expense reduction rounds to less than 0.01%.
fBenefit of waiver and payments by affiliates rounds to less than 0.01%.
gRounds to less than 0.01%.
franklintempleton.com
The accompanying notes are an integral part of these financial statements. | Annual Report 15
FRANKLIN MUTUAL GLOBAL DISCOVERY FUND
FINANCIAL H IGHLIGHTS
| Year Ended December 31, | |||||||||||||||
| 2015 | 2014 | 2013 | 2012 | 2011 | |||||||||||
| Class A | |||||||||||||||
| Per share operating performance | |||||||||||||||
| (for a share outstanding throughout the year) | |||||||||||||||
| Net asset value, beginning of year | $ | 32.81 | $ | 33.24 | $ | 28.27 | $ | 27.14 | $ | 29.19 | |||||
| Income from investment operationsa: | |||||||||||||||
| Net investment incomeb | 0.42 | 0.71 | c | 0.44 | 0.46 | 0.52 | |||||||||
| Net realized and unrealized gains (losses) | (1.67 | ) | 0.96 | 6.65 | 3.17 | (1.44 | ) | ||||||||
| Total from investment operations | (1.25 | ) | 1.67 | 7.09 | 3.63 | (0.92 | ) | ||||||||
| Less distributions from: | |||||||||||||||
| Net investment income | (0.46 | ) | (0.72 | ) | (0.48 | ) | (0.48 | ) | (0.46 | ) | |||||
| Net realized gains | (2.24 | ) | (1.38 | ) | (1.64 | ) | (2.02 | ) | (0.67 | ) | |||||
| Total distributions | (2.70 | ) | (2.10 | ) | (2.12 | ) | (2.50 | ) | (1.13 | ) | |||||
| Net asset value, end of year | $ | 28.86 | $ | 32.81 | $ | 33.24 | $ | 28.27 | $ | 27.14 | |||||
| Total returnd | (3.63 | )% | 5.01 | % | 25.26 | % | 13.34 | % | (2.99 | )% | |||||
| Ratios to average net assets | |||||||||||||||
| Expensese | 1.27 | %f,g | 1.29 | %f | 1.28 | %f | 1.32 | % | 1.31 | % | |||||
| Expenses incurred in connection with securities sold | |||||||||||||||
| short | 0.02 | % | 0.03 | % | —%h | —%h | —%h | ||||||||
| Net investment income | 1.28 | % | 2.08 | %c | 1.38 | % | 1.59 | % | 1.81 | % | |||||
| Supplemental data | |||||||||||||||
| Net assets, end of year (000’s) | $ | 11,274,721 | $ | 11,573,196 | $ | 10,785,375 | $ | 7,977,279 | $ | 7,617,500 | |||||
| Portfolio turnover rate | 21.79 | % | 23.66 | % | 23.57 | % | 24.65 | % | 33.60 | % | |||||
aThe amount shown for a share outstanding throughout the period may not correlate with the Statement of Operations for the period due to the timing of sales and repurchases
of the Fund’s shares in relation to income earned and/or fluctuating fair value of the investments of the Fund.
bBased on average daily shares outstanding.
cNet investment income per share includes approximately $0.34 per share received in the form of a special dividend paid in connection with certain Fund’s holdings. Excluding
this amount, the ratio of net investment income to average net assets would have been 1.10%.
dTotal return does not reflect sales commissions or contingent deferred sales charges, if applicable.
eIncludes dividend and/or interest expense on securities sold short and security borrowing fees, if any. See below for the ratios of such expenses to average net assets for the
periods presented. See Note 1(e).
fBenefit of expense reduction rounds to less than 0.01%.
gBenefit of waiver and payments by affiliates rounds to less than 0.01%.
hRounds to less than 0.01%.
16 Annual Report | The accompanying notes are an integral part of these financial statements.
franklintempleton.com
FRANKLIN MUTUAL GLOBAL DISCOVERY FUND
FINANCIAL H IGHLIGHTS
| Year Ended December 31, | |||||||||||||||
| 2015 | 2014 | 2013 | 2012 | 2011 | |||||||||||
| Class C | |||||||||||||||
| Per share operating performance | |||||||||||||||
| (for a share outstanding throughout the year) | |||||||||||||||
| Net asset value, beginning of year | $ | 32.49 | $ | 32.94 | $ | 28.05 | $ | 26.95 | $ | 28.97 | |||||
| Income from investment operationsa: | |||||||||||||||
| Net investment incomeb | 0.18 | 0.47 | c | 0.22 | 0.25 | 0.32 | |||||||||
| Net realized and unrealized gains (losses) | (1.64 | ) | 0.95 | 6.58 | 3.14 | (1.42 | ) | ||||||||
| Total from investment operations | (1.46 | ) | 1.42 | 6.80 | 3.39 | (1.10 | ) | ||||||||
| Less distributions from: | |||||||||||||||
| Net investment income | (0.24 | ) | (0.49 | ) | (0.27 | ) | (0.27 | ) | (0.25 | ) | |||||
| Net realized gains | (2.24 | ) | (1.38 | ) | (1.64 | ) | (2.02 | ) | (0.67 | ) | |||||
| Total distributions | (2.48 | ) | (1.87 | ) | (1.91 | ) | (2.29 | ) | (0.92 | ) | |||||
| Net asset value, end of year | $ | 28.55 | $ | 32.49 | $ | 32.94 | $ | 28.05 | $ | 26.95 | |||||
| Total returnd | (4.33 | )% | 4.28 | % | 24.39 | % | 12.53 | % | (3.64 | )% | |||||
| Ratios to average net assets | |||||||||||||||
| Expensese | 1.99 | %f,g | 1.99 | %f | 1.98 | %f | 2.02 | % | 2.01 | % | |||||
| Expenses incurred in connection with securities sold short | 0.02 | % | 0.03 | % | —%h | —%h | —%h | ||||||||
| Net investment income | 0.56 | % | 1.38 | %c | 0.68 | % | 0.89 | % | 1.11 | % | |||||
| Supplemental data | |||||||||||||||
| Net assets, end of year (000’s) | $ | 2,983,216 | $ | 3,077,691 | $ | 2,894,908 | $ | 2,222,484 | $ | 2,268,995 | |||||
| Portfolio turnover rate | 21.79 | % | 23.66 | % | 23.57 | % | 24.65 | % | 33.60 | % | |||||
aThe amount shown for a share outstanding throughout the period may not correlate with the Statement of Operations for the period due to the timing of sales and repurchases
of the Fund’s shares in relation to income earned and/or fluctuating fair value of the investments of the Fund.
bBased on average daily shares outstanding.
cNet investment income per share includes approximately $0.34 per share received in the form of a special dividend paid in connection with certain Fund’s holdings. Excluding
this amount, the ratio of net investment income to average net assets would have been 0.40%.
dTotal return does not reflect sales commissions or contingent deferred sales charges, if applicable.
eIncludes dividend and/or interest expense on securities sold short and security borrowing fees, if any. See below for the ratios of such expenses to average net assets for the
periods presented. See Note 1(e).
fBenefit of expense reduction rounds to less than 0.01%.
gBenefit of waiver and payments by affiliates rounds to less than 0.01%.
hRounds to less than 0.01%.
franklintempleton.com
The accompanying notes are an integral part of these financial statements. | Annual Report 17
FRANKLIN MUTUAL GLOBAL DISCOVERY FUND
FINANCIAL H IGHLIGHTS
| Year Ended December 31, | |||||||||||||||
| 2015 | 2014 | 2013 | 2012 | 2011 | |||||||||||
| Class R | |||||||||||||||
| Per share operating performance | |||||||||||||||
| (for a share outstanding throughout the year) | |||||||||||||||
| Net asset value, beginning of year | $ | 32.43 | $ | 32.88 | $ | 27.98 | $ | 26.89 | $ | 28.93 | |||||
| Income from investment operationsa: | |||||||||||||||
| Net investment incomeb | 0.35 | 0.65 | c | 0.37 | 0.39 | 0.46 | |||||||||
| Net realized and unrealized gains (losses) | (1.64 | ) | 0.93 | 6.58 | 3.14 | (1.42 | ) | ||||||||
| Total from investment operations | (1.29 | ) | 1.58 | 6.95 | 3.53 | (0.96 | ) | ||||||||
| Less distributions from: | |||||||||||||||
| Net investment income | (0.39 | ) | (0.65 | ) | (0.41 | ) | (0.42 | ) | (0.41 | ) | |||||
| Net realized gains | (2.24 | ) | (1.38 | ) | (1.64 | ) | (2.02 | ) | (0.67 | ) | |||||
| Total distributions | (2.63 | ) | (2.03 | ) | (2.05 | ) | (2.44 | ) | (1.08 | ) | |||||
| Net asset value, end of year | $ | 28.51 | $ | 32.43 | $ | 32.88 | $ | 27.98 | $ | 26.89 | |||||
| Total return | (3.82 | )% | 4.77 | % | 25.02 | % | 13.09 | % | (3.17 | )% | |||||
| Ratios to average net assets | |||||||||||||||
| Expensesd | 1.49 | %e,f | 1.49 | %e | 1.48 | %e | 1.52 | % | 1.51 | % | |||||
| Expenses incurred in connection with securities sold short | 0.02 | % | 0.03 | % | —%g | —%g | —%g | ||||||||
| Net investment income | 1.06 | % | 1.88 | %c | 1.18 | % | 1.39 | % | 1.61 | % | |||||
| Supplemental data | |||||||||||||||
| Net assets, end of year (000’s) | $ | 468,425 | $ | 528,439 | $ | 539,613 | $ | 458,142 | $ | 434,893 | |||||
| Portfolio turnover rate | 21.79 | % | 23.66 | % | 23.57 | % | 24.65 | % | 33.60 | % | |||||
aThe amount shown for a share outstanding throughout the period may not correlate with the Statement of Operations for the period due to the timing of sales and repurchases
of the Fund’s shares in relation to income earned and/or fluctuating fair value of the investments of the Fund.
bBased on average daily shares outstanding.
cNet investment income per share includes approximately $0.34 per share received in the form of a special dividend paid in connection with certain Fund’s holdings. Excluding
this amount, the ratio of net investment income to average net assets would have been 0.90%.
dIncludes dividend and/or interest expense on securities sold short and security borrowing fees, if any. See below for the ratios of such expenses to average net assets for the
periods presented. See Note 1(e).
eBenefit of expense reduction rounds to less than 0.01%.
fBenefit of waiver and payments by affiliates rounds to less than 0.01%.
gRounds to less than 0.01%.
18 Annual Report | The accompanying notes are an integral part of these financial statements.
franklintempleton.com
FRANKLIN MUTUAL GLOBAL DISCOVERY FUND
FINANCIAL H IGHLIGHTS
| Year Ended December 31, | |||||||||
| 2015 | 2014 | 2013 | a | ||||||
| Class R6 | |||||||||
| Per share operating performance | |||||||||
| (for a share outstanding throughout the year) | |||||||||
| Net asset value, beginning of year | $ | 33.33 | $ | 33.73 | $ | 31.42 | |||
| Income from investment operationsb: | |||||||||
| Net investment incomec | 0.55 | 0.85 | d | 0.40 | |||||
| Net realized and unrealized gains (losses) | (1.69 | ) | 1.00 | 4.17 | |||||
| Total from investment operations | (1.14 | ) | 1.85 | 4.57 | |||||
| Less distributions from: | |||||||||
| Net investment income | (0.60 | ) | (0.87 | ) | (0.62 | ) | |||
| Net realized gains | (2.24 | ) | (1.38 | ) | (1.64 | ) | |||
| Total distributions | (2.84 | ) | (2.25 | ) | (2.26 | ) | |||
| Net asset value, end of year | $ | 29.35 | $ | 33.33 | $ | 33.73 | |||
| Total returne | (3.23 | )% | 5.46 | % | 14.71 | % | |||
| Ratios to average net assetsf | |||||||||
| Expensesg,h | 0.84 | %i | 0.85 | % | 0.84 | % | |||
| Expenses incurred in connection with securities sold short | 0.02 | % | 0.03 | % | —%j | ||||
| Net investment income | 1.71 | % | 2.52 | %d | 1.83 | % | |||
| Supplemental data | |||||||||
| Net assets, end of year (000’s) | $ | 229,765 | $ | 137,922 | $ | 10,535 | |||
| Portfolio turnover rate | 21.79 | % | 23.66 | % | 23.57 | % | |||
aFor the period May 1, 2013 (effective date) to December 31, 2013.
bThe amount shown for a share outstanding throughout the period may not correlate with the Statement of Operations for the period due to the timing of sales and repurchases
of the Fund’s shares in relation to income earned and/or fluctuating fair value of the investments of the Fund.
cBased on average daily shares outstanding.
dNet investment income per share includes approximately $0.34 per share received in the form of a special dividend paid in connection with certain Fund’s holdings. Excluding
this amount, the ratio of net investment income to average net assets would have been 1.54%.
eTotal return is not annualized for periods less than one year.
fRatios are annualized for periods less than one year.
gIncludes dividend and/or interest expense on securities sold short and security borrowing fees, if any. See below for the ratios of such expenses to average net assets for the
periods presented. See Note 1(e).
hBenefit of expense reduction rounds to less than 0.01%.
iBenefit of waiver and payments by affiliates rounds to less than 0.01%.
jRounds to less than 0.01%.
franklintempleton.com
The accompanying notes are an integral part of these financial statements. | Annual Report 19
| FRANKLIN MUTUAL GLOBAL DISCOVERY FUND | ||||
| Statement of Investments, December 31, 2015 | ||||
| Country | Shares/Units | Value | ||
| Common Stocks and Other Equity Interests 91.9% | ||||
| Aerospace & Defense 0.5% | ||||
| B/E Aerospace Inc | United States | 2,140,150 | $ | 90,678,156 |
| aKLX Inc | United States | 1,070,075 | 32,947,609 | |
| 123,625,765 | ||||
| Auto Components 0.6% | ||||
| Cie Generale des Etablissements Michelin, B | France | 1,343,160 | 128,246,762 | |
| a,bInternational Automotive Components Group Brazil LLC | Brazil | 3,819,425 | 39,275 | |
| a,b,c,dInternational Automotive Components Group North America LLC | United States | 35,491,081 | 19,160,393 | |
| 147,446,430 | ||||
| Automobiles 1.3% | ||||
| General Motors Co | United States | 6,291,420 | 213,971,194 | |
| Hyundai Motor Co | South Korea | 699,956 | 88,736,967 | |
| 302,708,161 | ||||
| Banks 14.9% | ||||
| Barclays PLC | United Kingdom | 70,083,673 | 226,123,316 | |
| BNP Paribas SA | France | 3,905,802 | 221,595,039 | |
| Capital Bank Financial Corp., A | United States | 866,477 | 27,709,934 | |
| eCapital Bank Financial Corp., B, 144A, non-voting | United States | 2,980,444 | 95,314,599 | |
| CIT Group Inc | United States | 5,123,224 | 203,391,993 | |
| Citigroup Inc | United States | 5,809,671 | 300,650,474 | |
| Citizens Financial Group Inc | United States | 10,800,951 | 282,876,907 | |
| aCommerzbank AG | Germany | 22,356,020 | 232,448,615 | |
| HSBC Holdings PLC | United Kingdom | 22,629,178 | 178,845,624 | |
| JPMorgan Chase & Co | United States | 4,857,660 | 320,751,290 | |
| KB Financial Group Inc | South Korea | 2,889,991 | 81,513,134 | |
| PNC Financial Services Group Inc | United States | 3,118,000 | 297,176,580 | |
| aRoyal Bank of Scotland Group PLC | United Kingdom | 49,173,000 | 218,885,190 | |
| Societe Generale SA | France | 4,050,169 | 187,286,546 | |
| Standard Chartered PLC | United Kingdom | 13,393,386 | 111,281,033 | |
| SunTrust Banks Inc | United States | 4,238,534 | 181,578,797 | |
| Wells Fargo & Co | United States | 7,620,708 | 414,261,687 | |
| 3,581,690,758 | ||||
| Beverages 1.8% | ||||
| PepsiCo Inc | United States | 2,913,866 | 291,153,491 | |
| SABMiller PLC | United Kingdom | 2,213,410 | 132,765,626 | |
| 423,919,117 | ||||
| Chemicals 0.0% | ||||
| a,f,gDow Corning Corp., Contingent Distribution | United States | 11,430,153 | — | |
| Communications Equipment 2.6% | ||||
| Cisco Systems Inc | United States | 7,847,650 | 213,102,936 | |
| Nokia Corp., ADR | Finland | 26,956,874 | 189,237,255 | |
| Nokia OYJ, A | Finland | 30,217,570 | 216,473,192 | |
| 618,813,383 | ||||
| Construction Materials 1.0% | ||||
| aLafargeHolcim Ltd., B | Switzerland | 4,698,655 | 235,870,605 | |
| Consumer Finance 0.4% | ||||
| aAlly Financial Inc | United States | 4,911,500 | 91,550,360 | |
| Diversified Consumer Services 0.1% | ||||
| aCengage Learning Holdings II LP | United States | 1,149,083 | 26,428,909 | |
20 Annual Report
franklintempleton.com
FRANKLIN MUTUAL GLOBAL DISCOVERY FUND
STATEMENT O F INVESTMENTS
| Country | Shares/Units | Value | ||
| Common Stocks and Other Equity Interests (continued) | ||||
| Diversified Telecommunication Services 3.0% | ||||
| China Telecom Corp. Ltd., H | China | 483,026,220 | $ | 226,862,118 |
| Deutsche Telekom AG | Germany | 9,131,720 | 165,553,630 | |
| a,f,gGlobal Crossing Holdings Ltd., Contingent Distribution | United States | 45,658,716 | — | |
| Koninklijke KPN NV | Netherlands | 90,237,310 | 342,286,806 | |
| 734,702,554 | ||||
| Electric Utilities 1.0% | ||||
| Enel SpA | Italy | 57,851,401 | 244,577,497 | |
| Energy Equipment & Services 1.1% | ||||
| Baker Hughes Inc | United States | 5,695,389 | 262,842,202 | |
| Food & Staples Retailing 3.6% | ||||
| CVS Health Corp | United States | 2,333,967 | 228,191,954 | |
| Empire Co. Ltd., A | Canada | 7,065,456 | 131,471,725 | |
| Metro AG | Germany | 7,814,516 | 250,920,589 | |
| Walgreens Boots Alliance Inc | United States | 2,998,912 | 255,372,351 | |
| 865,956,619 | ||||
| Health Care Equipment & Supplies 3.3% | ||||
| Medtronic PLC | United States | 6,335,336 | 487,314,045 | |
| Stryker Corp | United States | 3,298,481 | 306,560,824 | |
| 793,874,869 | ||||
| Health Care Providers & Services 0.4% | ||||
| Cigna Corp | United States | 721,597 | 105,591,289 | |
| Hotels, Restaurants & Leisure 1.4% | ||||
| Accor SA | France | 6,111,782 | 265,590,119 | |
| Sands China Ltd | Hong Kong | 22,540,000 | 76,925,350 | |
| 342,515,469 | ||||
| Independent Power & Renewable Electricity Producers 0.3% | ||||
| NRG Energy Inc | United States | 6,590,837 | 77,574,152 | |
| Industrial Conglomerates 2.1% | ||||
| Jardine Matheson Holdings Ltd | Hong Kong | 324,161 | 15,796,365 | |
| Jardine Strategic Holdings Ltd | Hong Kong | 9,691,905 | 264,879,764 | |
| Koninklijke Philips NV | Netherlands | 9,200,398 | 235,457,043 | |
| 516,133,172 | ||||
| Insurance 12.1% | ||||
| ACE Ltd | United States | 3,809,680 | 445,161,108 | |
| aAlleghany Corp | United States | 81,228 | 38,821,298 | |
| The Allstate Corp | United States | 3,758,825 | 233,385,444 | |
| American International Group Inc | United States | 5,795,145 | 359,125,136 | |
| China Pacific Insurance (Group) Co. Ltd., H | China | 47,081,044 | 193,484,159 | |
| MetLife Inc | United States | 4,569,020 | 220,272,454 | |
| NN Group NV | Netherlands | 12,604,933 | 445,678,126 | |
| PartnerRe Ltd | United States | 1,511,133 | 211,165,725 | |
| PICC Property and Casualty Co. Ltd., H | China | 87,987,293 | 174,608,823 | |
| RSA Insurance Group PLC | United Kingdom | 18,896,626 | 118,791,682 | |
| White Mountains Insurance Group Ltd | United States | 172,815 | 125,603,670 | |
| XL Group PLC | Ireland | 8,946,830 | 350,536,799 | |
| 2,916,634,424 | ||||
| IT Services 0.7% | ||||
| Xerox Corp | United States | 16,670,797 | 177,210,572 |
franklintempleton.com
Annual Report
21
FRANKLIN MUTUAL GLOBAL DISCOVERY FUND
STATEMENT O F INVESTMENTS
| Country | Shares/Units | Value | ||
| Common Stocks and Other Equity Interests (continued) | ||||
| Machinery 1.3% | ||||
| Caterpillar Inc | United States | 3,330,793 | $ | 226,360,693 |
| CNH Industrial NV | United Kingdom | 6,569,123 | 45,240,400 | |
| CNH Industrial NV, special voting | United Kingdom | 7,338,645 | 50,539,963 | |
| 322,141,056 | ||||
| Marine 0.8% | ||||
| A.P. Moeller-Maersk AS, B | Denmark | 150,055 | 196,072,508 | |
| Media 5.8% | ||||
| Cablevision Systems Corp., A | United States | 2,178,810 | 69,504,039 | |
| CBS Corp., B | United States | 4,879,342 | 229,963,388 | |
| aLiberty Global PLC, C | United Kingdom | 3,085,080 | 125,778,712 | |
| Relx PLC | United Kingdom | 20,193,070 | 356,269,981 | |
| Time Warner Cable Inc | United States | 1,851,179 | 343,560,311 | |
| Time Warner Inc | United States | 2,174,747 | 140,640,888 | |
| Twenty-First Century Fox Inc., B | United States | 4,401,800 | 119,861,014 | |
| 1,385,578,333 | ||||
| Metals & Mining 0.9% | ||||
| Freeport-McMoRan Inc., B | United States | 6,454,880 | 43,699,537 | |
| ThyssenKrupp AG | Germany | 8,386,391 | 167,072,212 | |
| 210,771,749 | ||||
| Multiline Retail 0.6% | ||||
| Macy’s Inc | United States | 3,895,340 | 136,258,993 | |
| Oil, Gas & Consumable Fuels 5.2% | ||||
| Anadarko Petroleum Corp | United States | 1,013,816 | 49,251,181 | |
| Apache Corp | United States | 1,890,444 | 84,068,045 | |
| BG Group PLC | United Kingdom | 14,646,268 | 212,640,476 | |
| BP PLC | United Kingdom | 31,838,677 | 166,127,299 | |
| China Shenhua Energy Co. Ltd., H | China | 67,067,936 | 105,575,869 | |
| CONSOL Energy Inc | United States | 6,803,702 | 53,749,246 | |
| Kinder Morgan Inc | United States | 10,586,220 | 157,946,402 | |
| Marathon Oil Corp | United States | 10,776,006 | 135,669,915 | |
| Murphy Oil Corp | United States | 1,168,040 | 26,222,498 | |
| Royal Dutch Shell PLC, A | United Kingdom | 9,563,787 | 219,148,857 | |
| aWhiting Petroleum Corp | United States | 5,054,593 | 47,715,358 | |
| 1,258,115,146 | ||||
| Paper & Forest Products 0.6% | ||||
| International Paper Co | United States | 3,546,770 | 133,713,229 | |
| aVerso Corp | United States | 1,100,202 | 21,894 | |
| 133,735,123 | ||||
| Pharmaceuticals 7.6% | ||||
| Eli Lilly & Co | United States | 4,444,539 | 374,496,856 | |
| GlaxoSmithKline PLC | United Kingdom | 11,583,047 | 234,409,973 | |
| Merck & Co. Inc | United States | 9,354,960 | 494,128,988 | |
| Novartis AG, ADR | Switzerland | 4,434,247 | 381,522,612 | |
| Teva Pharmaceutical Industries Ltd., ADR | Israel | 5,428,769 | 356,344,397 | |
| 1,840,902,826 | ||||
| Semiconductors & Semiconductor Equipment 0.4% | ||||
| SK Hynix Inc | South Korea | 3,551,578 | 92,921,037 |
22 Annual Report
franklintempleton.com
FRANKLIN MUTUAL GLOBAL DISCOVERY FUND
STATEMENT O F INVESTMENTS
| Country | Shares/Units | Value | |||
| Common Stocks and Other Equity Interests (continued) | |||||
| Software 5.7% | |||||
| aCheck Point Software Technologies Ltd | Israel | 3,590,310 | $ | 292,179,428 | |
| Microsoft Corp | United States | 11,841,792 | 656,982,620 | ||
| Open Text Corp | Canada | 3,293,230 | 157,844,514 | ||
| Symantec Corp | United States | 12,534,725 | 263,229,225 | ||
| 1,370,235,787 | |||||
| Specialty Retail 1.1% | |||||
| Kingfisher PLC | United Kingdom | 54,981,343 | 267,025,964 | ||
| Technology Hardware, Storage & Peripherals 3.2% | |||||
| EMC Corp | United States | 10,498,000 | 269,588,640 | ||
| Hewlett Packard Enterprise Co | United States | 6,436,730 | 97,838,296 | ||
| HP Inc | United States | 6,436,730 | 76,210,883 | ||
| Lenovo Group Ltd | China | 72,932,361 | 74,060,203 | ||
| Samsung Electronics Co. Ltd | South Korea | 241,185 | 258,564,209 | ||
| 776,262,231 | |||||
| Tobacco 5.2% | |||||
| Altria Group Inc | United States | 4,070,986 | 236,972,095 | ||
| British American Tobacco PLC | United Kingdom | 6,977,821 | 387,845,794 | ||
| Imperial Tobacco Group PLC | United Kingdom | 4,677,039 | 247,243,314 | ||
| Philip Morris International Inc | United States | 1,484,505 | 130,502,835 | ||
| Reynolds American Inc | United States | 5,314,268 | 245,253,468 | ||
| 1,247,817,506 | |||||
| Wireless Telecommunication Services 1.3% | |||||
| Vodafone Group PLC | United Kingdom | 94,517,600 | 307,884,402 | ||
| Total Common Stocks and Other Equity Interests | |||||
| (Cost $19,482,601,747) | 22,135,388,968 | ||||
| Preferred Stocks 1.2% | |||||
| Automobiles 1.2% | |||||
| Volkswagen AG, pfd | Germany | 2,006,522 | 291,519,426 | ||
| Diversified Financial Services 0.0%† | |||||
| a,bHightower Holding LLC, pfd., A, Series 2 | United States | 3,048,000 | 7,238,086 | ||
| Total Preferred Stocks (Cost $428,701,309) | 298,757,512 | ||||
| Principal | |||||
| Amount | |||||
| Corporate Notes and Senior Floating Rate Interests 2.1% | |||||
| Avaya Inc., | |||||
| esenior note, 144A, 10.50%, 3/01/21 | United States | $ | 98,429,000 | 33,958,005 | |
| esenior secured note, 144A, 7.00%, 4/01/19 | United States | 51,741,000 | 38,805,750 | ||
| h,iTerm B-3 Loan, 4.823%, 10/26/17 | United States | 51,898,103 | 40,523,751 | ||
| h,iTerm B-6 Loan, 6.50%, 3/30/18 | United States | 34,017,476 | 25,924,140 | ||
| h,iTerm B-7 Loan, 6.25%, 5/29/20 | United States | 32,694,608 | 22,995,197 | ||
| h,iBelk Inc., Closing Date Term Loan, 5.75%, 12/10/22 | United States | 51,197,000 | 45,778,668 | ||
| h,iCengage Learning Acquisitions Inc., Original Term Loans, | |||||
| 7.00%, 3/31/20 | United States | 6,962,834 | 6,771,356 | ||
| iHeartCommunications Inc., | |||||
| senior secured note, first lien, 9.00%, 12/15/19 | United States | 95,618,000 | 71,115,888 | ||
| h,iTranche D Term Loan, 7.174%, 1/30/19 | United States | 117,978,997 | 83,175,193 | ||
| h,iTranche E Term Loan, 7.924%, 7/30/19 | United States | 37,921,652 | 26,766,353 | ||
| h,iJC Penney Corp. Inc., Term Loan, 6.00%, 5/22/18 | United States | 47,383,905 | 46,628,748 | ||
franklintempleton.com
Annual Report
23
FRANKLIN MUTUAL GLOBAL DISCOVERY FUND
STATEMENT O F INVESTMENTS
| Principal | |||||
| Country | Amount | Value | |||
| Corporate Notes and Senior Floating Rate | |||||
| Interests (continued) | |||||
| NGPL PipeCo LLC, | |||||
| esenior secured note, 144A, 9.625%, 6/01/19 | United States | $ | 62,806,000 | $ | 59,037,640 |
| h,iTerm Loan, 6.75%, 9/15/17 | United States | 3,148,200 | 2,982,920 | ||
| Total Corporate Notes and Senior Floating Rate Interests | |||||
| (Cost $640,360,416) | 504,463,609 | ||||
| Corporate Notes and Senior Floating Rate Interests in | |||||
| Reorganization 0.9% | |||||
| b,jBroadband Ventures III LLC, secured promissory note, 5.00%, 2/01/12 | United States | 8,893 | — | ||
| h,i,jCaesars Entertainment Operating Co. Inc., 1.50%, 3/01/17, | |||||
| Term B-5-B Loans | United States | 13,307,605 | 11,577,617 | ||
| Term B-6-B Loans | United States | 63,441,299 | 55,828,343 | ||
| Term B-7 Loans | United States | 46,344,115 | 38,755,266 | ||
| jSamson Investment Co., senior note, 9.75%, 2/15/20 | United States | 87,456,000 | 196,776 | ||
| h,i,jTexas Competitive Electric Holdings Co. LLC, Term Loans, | |||||
| 4.908%, 10/10/17 | United States | 142,325,613 | 43,720,720 | ||
| e,jTexas Competitive Electric Holdings Co. LLC/Texas Competitive Electric | |||||
| Holdings Finance Inc., senior secured note, first lien, 144A, | |||||
| 4.726%, 10/01/20 | United States | 118,132,000 | 39,574,220 | ||
| jWalter Energy Inc., | |||||
| h,iB Term Loan, 5.80%, 4/02/18 | United States | 55,667,214 | 15,586,820 | ||
| efirst lien, 144A, 6.33%, 10/15/19 | United States | 30,996,000 | 8,058,960 | ||
| e,ksecond lien, 144A, PIK, 11.50%, 4/01/20 | United States | 27,033,380 | 69,248 | ||
| Total Corporate Notes and Senior Floating Rate Interests | |||||
| in Reorganization (Cost $473,117,044) | 213,367,970 | ||||
| Shares | |||||
| Companies in Liquidation 0.1% | |||||
| aAdelphia Recovery Trust | United States | 45,477,593 | 181,910 | ||
| a,fAdelphia Recovery Trust, Arahova Contingent Value Vehicle, Contingent | |||||
| Distribution | United States | 5,538,790 | 11,078 | ||
| a,f,gCentury Communications Corp., Contingent Distribution | United States | 15,282,000 | — | ||
| a,bFIM Coinvestor Holdings I, LLC | United States | 30,279,560 | — | ||
| a,lLehman Brothers Holdings Inc., Bankruptcy Claim | United States | 587,363,521 | 33,039,198 | ||
| a,f,gNewPage Corp., Litigation Trust, Contingent Distribution | United States | 145,817,000 | — | ||
| a,f,gTribune Media Litigation Trust, Contingent Distribution | United States | 1,285,973 | — | ||
| Total Companies in Liquidation (Cost $59,097,054) | 33,232,186 | ||||
| Principal | |||||
| Amount | |||||
| Municipal Bonds (Cost $85,501,900) 0.3% | |||||
| Puerto Rico Commonwealth GO, Refunding, Series A, 8.00%, 7/01/35 | United States | $ | 98,292,000 | 71,507,430 | |
| Total Investments before Short Term Investments | |||||
| (Cost $21,169,379,470) | 23,256,717,675 | ||||
| Short Term Investments 2.7% | |||||
| U.S. Government and Agency Securities 2.7% | |||||
| FHLB, 1/04/16 | United States | 26,600,000 | 26,600,000 | ||
| m,nU.S. Treasury Bill, 1/07/16 - 6/09/16 | United States | 605,800,000 | 605,357,484 | ||
| Total U.S. Government and Agency Securities | |||||
| (Cost $631,946,257) | 631,957,484 | ||||
24 Annual Report
franklintempleton.com
FRANKLIN MUTUAL GLOBAL DISCOVERY FUND
STATEMENT O F INVESTMENTS
| Country | Shares | Value | ||||
| Total Investments (Cost $21,801,325,727) 99.2% | $ | 23,888,675,159 | ||||
| Securities Sold Short (0.2)% | (50,488,673 | ) | ||||
| Other Assets, less Liabilities 1.0% | 250,692,148 | |||||
| Net Assets 100.0% | $ | 24,088,878,634 | ||||
| oSecurities Sold Short (Proceeds $62,022,823) (0.2)% | ||||||
| Common Stocks (0.2)% | ||||||
| Energy Equipment & Services (0.2)% | ||||||
| Halliburton Co | United States | $ | 1,483,216 | $ | (50,488,673 | ) |
†Rounds to less than 0.1% of net assets.
aNon-income producing.
bSee Note 10 regarding restricted securities.
cAt December 31, 2015, pursuant to the Fund’s policies and the requirements of applicable securities law, the Fund is restricted from trading this security at year end.
dSee Note 12 regarding holdings of 5% voting securities.
eSecurity was purchased pursuant to Rule 144A under the Securities Act of 1933 and may be sold in transactions exempt from registration only to qualified institutional buyers
or in a public offering registered under the Securities Act of 1933. These securities have been deemed liquid under guidelines approved by the Trust’s Board of Trustees. At
December 31, 2015, the aggregate value of these securities was $274,818,422, representing 1.14% of net assets.
fContingent distributions represent the right to receive additional distributions, if any, during the reorganization of the underlying company. Shares represent total underlying
principal of debt securities.
gSecurity has been deemed illiquid because it may not be able to be sold within seven days.
hThe coupon rate shown represents the rate at period end.
iSee Note 1(g) regarding senior floating rate interests.
jSee Note 8 regarding credit risk and defaulted securities.
kIncome may be received in additional securities and/or cash.
lBankruptcy claims represent the right to receive distributions, if any, during the liquidation of the underlying pool of assets. Shares represent amount of allowed unsecured
claims.
mThe security is traded on a discount basis with no stated coupon rate.
nA portion or all of the security has been segregated as collateral for securities sold short and open forward contracts. At December 31, 2015, the value of this security and/or
cash pledged amounted to $77,190,793, representing 0.32% of net assets.
oSee Note 1(e) regarding securities sold short.
| At December, 31, 2015, the Fund had the following futures contracts outstanding. See Note 1(c). | |||||||||
| Futures Contracts | |||||||||
| Number of | Notional | Expiration | Unrealized | Unrealized | |||||
| Description | Type | Contracts | Value | Date | Appreciation | Depreciation | |||
| Currency Contracts | |||||||||
| EUR/USD | Short | 9,080 | $ | 1,235,561,000 | 3/14/16 | $ | 666,963 | $ | — |
| GBP/USD | Short | 7,333 | 675,277,638 | 3/14/16 | 17,388,249 | — | |||
| Total Futures Contracts | $ | 18,055,212 | $ | — | |||||
| Net unrealized appreciation (depreciation) | $ | 18,055,212 | |||||||
franklintempleton.com
Annual Report
25
FRANKLIN MUTUAL GLOBAL DISCOVERY FUND
STATEMENT O F INVESTMENTS
At December, 31, 2015, the Fund had the following forward exchange contracts outstanding. See Note 1(c).
| Forward Exchange Contracts | |||||||||||
| Contract | Settlement | Unrealized | Unrealized | ||||||||
| Currency | Counterpartya Type | Quantity | Amount | Date | Appreciation | Depreciation | |||||
| OTC Forward Exchange Contracts | |||||||||||
| Euro | BANT | Buy | 13,609,132 | $ | 15,013,418 | 1/06/16 | $ | — | $ | (228,257 | ) |
| Euro | BANT | Sell | 16,532,104 | 18,347,329 | 1/06/16 | 386,608 | — | ||||
| Euro | BONY | Buy | 11,080,847 | 12,224,922 | 1/06/16 | — | (186,527 | ) | |||
| Euro | BONY | Sell | 119,112,929 | 130,279,766 | 1/06/16 | 873,731 | — | ||||
| Euro | DBFX | Buy | 16,337,703 | 18,026,793 | 1/06/16 | — | (277,272 | ) | |||
| Euro | DBFX | Sell | 8,140,227 | 9,044,159 | 1/06/16 | 200,496 | — | ||||
| Euro | FBCO | Buy | 13,609,132 | 15,020,617 | 1/06/16 | — | (235,456 | ) | |||
| Euro | HSBC | Buy | 10,880,702 | 11,976,356 | 1/06/16 | — | (155,402 | ) | |||
| Euro | SSBT | Buy | 10,880,702 | 11,976,225 | 1/06/16 | — | (155,271 | ) | |||
| Euro | SSBT | Sell | 125,861,789 | 137,898,506 | 1/06/16 | 1,160,410 | — | ||||
| Canadian Dollar | DBFX | Buy | 126,757,314 | 93,473,842 | 1/19/16 | 19,720 | (1,855,366 | ) | |||
| Canadian Dollar | DBFX | Sell | 309,763,619 | 232,650,239 | 1/19/16 | 8,710,044 | (961 | ) | |||
| Canadian Dollar | HSBC | Buy | 2,598,211 | 1,940,238 | 1/19/16 | — | (61,882 | ) | |||
| Euro | BANT | Buy | 24,065,648 | 26,292,267 | 1/20/16 | — | (137,741 | ) | |||
| Euro | BANT | Sell | 3,050,480 | 3,336,798 | 1/20/16 | 21,539 | — | ||||
| Euro | BBU | Sell | 3,050,481 | 3,338,782 | 1/20/16 | 23,522 | — | ||||
| Euro | BONY | Sell | 1,721,041 | 1,883,884 | 1/20/16 | 13,458 | — | ||||
| Euro | DBFX | Buy | 36,439,889 | 39,888,019 | 1/20/16 | 266 | (285,444 | ) | |||
| Euro | DBFX | Sell | 3,482,139 | 3,803,401 | 1/20/16 | 19,015 | — | ||||
| Euro | FBCO | Buy | 24,065,599 | 26,283,901 | 1/20/16 | — | (129,427 | ) | |||
| Euro | FBCO | Sell | 118,221,737 | 129,504,842 | 1/20/16 | 1,021,556 | — | ||||
| Euro | HSBC | Buy | 27,276,524 | 29,809,597 | 1/20/16 | — | (165,493 | ) | |||
| Euro | HSBC | Sell | 114,562,246 | 125,427,473 | 1/20/16 | 921,319 | — | ||||
| Euro | SSBT | Buy | 32,706,774 | 35,797,181 | 1/20/16 | — | (251,486 | ) | |||
| Euro | SSBT | Sell | 36,271,106 | 40,593,335 | 1/20/16 | 1,173,928 | — | ||||
| British Pound | BANT | Sell | 129,525,854 | 201,570,871 | 1/21/16 | 10,645,374 | — | ||||
| British Pound | DBFX | Buy | 3,490,310 | 5,381,640 | 1/21/16 | — | (236,804 | ) | |||
| British Pound | FBCO | Buy | 6,638,855 | 10,157,607 | 1/21/16 | — | (371,710 | ) | |||
| British Pound | FBCO | Sell | 38,284,691 | 59,654,691 | 1/21/16 | 3,221,760 | — | ||||
| British Pound | HSBC | Sell | 5,716,000 | 8,850,597 | 1/21/16 | 425,020 | — | ||||
| British Pound | SSBT | Sell | 112,853,541 | 176,198,234 | 1/21/16 | 9,848,291 | — | ||||
| South Korean Won | BANT | Buy | 9,307,020,469 | 8,024,677 | 2/12/16 | — | (115,297 | ) | |||
| South Korean Won | BANT | Sell | 85,317,552,343 | 73,240,489 | 2/12/16 | 844,765 | (109,646 | ) | |||
| South Korean Won | FBCO | Buy | 5,926,604,259 | 5,008,116 | 2/12/16 | 28,487 | — | ||||
| South Korean Won | FBCO | Sell | 92,545,454,820 | 79,898,355 | 2/12/16 | 1,254,713 | (4,212 | ) | |||
| South Korean Won | HSBC | Buy | 23,315,966,356 | 19,766,265 | 2/12/16 | 84,630 | (36,300 | ) | |||
| South Korean Won | HSBC | Sell 195,246,471,584 | 167,579,055 | 2/12/16 | 1,661,459 | (8,608 | ) | ||||
| British Pound | BANT | Buy | 9,051,690 | 13,966,269 | 2/19/16 | — | (623,265 | ) | |||
| British Pound | BANT | Sell | 20,551,522 | 32,019,194 | 2/19/16 | 1,724,404 | — | ||||
| British Pound | BBU | Buy | 10,528,379 | $ | 16,497,654 | 2/19/16 | — | (977,877 | ) | ||
| British Pound | BBU | Sell | 4,536,287 | 6,884,133 | 2/19/16 | 197,238 | — | ||||
| British Pound | DBFX | Sell | 153,041,778 | 238,258,924 | 2/19/16 | 12,661,591 | — | ||||
| British Pound | FBCO | Buy | 29,011,929 | 45,448,292 | 2/19/16 | — | (2,682,102 | ) | |||
| British Pound | FBCO | Sell | 189,941,823 | 294,700,632 | 2/19/16 | 14,709,319 | — | ||||
| British Pound | HSBC | Buy | 26,196,857 | 41,273,646 | 2/19/16 | — | (2,657,125 | ) | |||
| British Pound | HSBC | Sell | 8,459,344 | 12,632,845 | 2/19/16 | 163,013 | — | ||||
| British Pound | SSBT | Buy | 7,513,981 | 11,808,248 | 2/19/16 | — | (731,965 | ) | |||
| British Pound | SSBT | Sell | 4,363,490 | 6,743,565 | 2/19/16 | 311,389 | — | ||||
| Euro | BANT | Sell | 169,656,330 | 191,329,834 | 2/22/16 | 6,791,486 | — | ||||
| Euro | BBU | Sell | 1,728,437 | 1,950,813 | 2/22/16 | 70,759 | — | ||||
| Euro | BONY | Sell | 3,661,407 | 4,152,072 | 2/22/16 | 169,492 | — | ||||
| Euro | DBFX | Sell | 36,350,413 | 40,952,439 | 2/22/16 | 1,413,419 | — | ||||
| Euro | FBCO | Sell | 36,513,895 | 41,248,814 | 2/22/16 | 1,531,971 | — | ||||
| Euro | HSBC | Sell | 197,037,482 | 222,215,579 | 2/22/16 | 7,894,243 | — | ||||
| Euro | SSBT | Sell | 33,887,636 | 38,294,048 | 2/22/16 | 1,433,836 | — | ||||
| Euro | BANT | Sell | 9,346,211 | 10,208,334 | 4/01/16 | 31,373 | — | ||||
26 Annual Report
franklintempleton.com
FRANKLIN MUTUAL GLOBAL DISCOVERY FUND
STATEMENT O F INVESTMENTS
| Forward Exchange Contracts (continued) | ||||||||||
| Contract | Settlement | Unrealized | Unrealized | |||||||
| Currency | Counterpartya Type | Quantity | Amount | Date | Appreciation | Depreciation | ||||
| OTC Forward Exchange Contracts (continued) | ||||||||||
| Euro | DBFX | Sell | 133,137,309 | 152,486,154 | 4/01/16 | $ | 7,514,767 | $ | — | |
| Euro | FBCO | Sell | 18,586,575 | 20,020,842 | 4/01/16 | — | (217,825 | ) | ||
| Euro | HSBC | Sell | 7,700,913 | 8,294,653 | 4/01/16 | — | (90,765 | ) | ||
| Euro | SSBT | Sell | 142,483,518 | 162,689,584 | 4/01/16 | 7,541,238 | — | |||
| Euro | BANT | Sell | 146,314,349 | 166,888,164 | 4/18/16 | 7,479,743 | — | |||
| Euro | BONY | Sell | 6,790,585 | 7,531,777 | 4/18/16 | 133,484 | — | |||
| Euro | DBFX | Sell | 8,229,539 | 9,124,207 | 4/18/16 | 158,184 | — | |||
| Euro | FBCO | Sell | 29,750,151 | 33,005,950 | 4/18/16 | 593,377 | — | |||
| Euro | HSBC | Sell | 155,057,810 | 176,484,358 | 4/18/16 | 7,550,001 | — | |||
| Euro | SSBT | Sell | 50,079,574 | 55,502,654 | 4/18/16 | 941,322 | — | |||
| British Pound | BANT | Sell | 154,156,289 | 237,502,342 | 4/22/16 | 10,224,903 | — | |||
| British Pound | DBFX | Sell | 10,804,223 | 16,211,569 | 4/22/16 | 282,564 | — | |||
| British Pound | FBCO | Sell | 20,499,475 | 30,870,057 | 4/22/16 | 647,040 | — | |||
| British Pound | HSBC | Sell | 107,894,382 | 166,664,452 | 4/22/16 | 7,592,389 | — | |||
| Euro | BANT | Sell | 34,281,334 | 37,594,317 | 5/04/16 | 228,145 | (2,680 | ) | ||
| Euro | FBCO | Sell | 10,893,702 | 11,789,672 | 5/04/16 | — | (85,162 | ) | ||
| Euro | HSBC | Sell | 20,587,202 | 22,641,414 | 5/04/16 | 200,043 | — | |||
| Euro | SSBT | Sell | 365,315,132 | 392,859,893 | 5/04/16 | — | (5,357,032 | ) | ||
| South Korean Won | BANT | Sell | 95,796,131,393 | 83,301,917 | 5/12/16 | 1,993,224 | — | |||
| South Korean Won | FBCO | Sell | 86,058,354,502 | 74,619,233 | 5/12/16 | 1,575,653 | — | |||
| South Korean Won | HSBC | Sell | 94,896,743,642 | 83,049,887 | 5/12/16 | 2,504,566 | — | |||
| Swiss Franc | BANT | Sell | 26,368,894 | 26,436,969 | 5/12/16 | — | (41,654 | ) | ||
| Swiss Franc | BONY | Buy | 1,896,614 | 1,908,158 | 5/12/16 | 14,803 | (18,454 | ) | ||
| Swiss Franc | FBCO | Buy | 17,727,834 | 18,044,614 | 5/12/16 | — | (243,009 | ) | ||
| Swiss Franc | HSBC | Buy | 524,446 | 530,950 | 5/12/16 | — | (4,322 | ) | ||
| Swiss Franc | SSBT | Buy | 6,220,000 | 6,340,880 | 5/12/16 | — | (94,997 | ) | ||
| Euro | BANT | Sell | 191,784,052 | 206,052,547 | 5/18/16 | — | (3,100,354 | ) | ||
| Euro | DBFX | Sell | 21,714,562 | 23,313,626 | 5/18/16 | 5,387 | (372,893 | ) | ||
| Euro | FBCO | Sell | 187,158,152 | 201,198,347 | 5/18/16 | 21,406 | (2,931,117 | ) | ||
| Euro | HSBC | Sell | 31,483,486 | 33,872,472 | 5/18/16 | 56,177 | (518,480 | ) | ||
| Euro | SSBT | Sell | 16,060,754 | 17,169,218 | 5/18/16 | 5,964 | (352,036 | ) | ||
| British Pound | BANT | Sell | 20,915,443 | 31,248,971 | 5/23/16 | 407,985 | — | |||
| British Pound | DBFX | Sell | 19,377,797 | 28,748,349 | 5/23/16 | 174,708 | — | |||
| British Pound | FBCO | Sell | 156,621,050 | 239,949,713 | 5/23/16 | 9,003,251 | — | |||
| British Pound | HSBC | Sell | 115,623,721 | 176,498,972 | 5/23/16 | 6,005,354 | — | |||
| British Pound | SSBT | Sell | 11,095,902 | 16,675,255 | 5/23/16 | 313,729 | — | |||
| Total Forward Exchange Contracts | $ | 164,833,051 | $ | (26,111,676 | ) | |||||
| Net unrealized appreciation (depreciation) | $ | 138,721,375 | ||||||||
aMay be comprised of multiple contracts with the same counterparty, currency and settlement date.
See Abbreviations on page 43.
franklintempleton.com
The accompanying notes are an integral part of these financial statements. | Annual Report 27
FRANKLIN MUTUAL GLOBAL DISCOVERY FUND
| Financial Statements | |||
| Statement of Assets and Liabilities | |||
| December 31, 2015 | |||
| Assets: | |||
| Investments in securities: | |||
| Cost - Unaffiliated issuers | $ | 21,772,230,356 | |
| Cost - Non-controlled affiliates (Note 12) | 29,095,371 | ||
| Total cost of investments | $ | 21,801,325,727 | |
| Value - Unaffiliated issuers | $ | 23,869,514,766 | |
| Value - Non-controlled affiliates (Note 12) | 19,160,393 | ||
| Total value of investments | 23,888,675,159 | ||
| Cash | 21,543,437 | ||
| Restricted Cash (Note 1d) | 25,410,000 | ||
| Foreign currency, at value (cost $17,104,464) | 17,007,664 | ||
| Receivables: | |||
| Investment securities sold | 47,344,016 | ||
| Capital shares sold | 36,784,083 | ||
| Dividends and interest | 52,728,658 | ||
| Due from brokers | 99,794,451 | ||
| Variation margin | 11,074,463 | ||
| Unrealized appreciation on OTC forward exchange contracts | 164,833,051 | ||
| Other assets | 3,478,431 | ||
| Total assets | 24,368,673,413 | ||
| Liabilities: | |||
| Payables: | |||
| Investment securities purchased | 42,327,959 | ||
| Capital shares redeemed | 79,793,010 | ||
| Management fees | 16,520,968 | ||
| Distribution fees | 10,330,238 | ||
| Transfer agent fees | 6,570,800 | ||
| Trustees’ fees and expenses | 792,511 | ||
| Due to brokers | 45,500,000 | ||
| Securities sold short, at value (proceeds $62,022,823) | 50,488,673 | ||
| Unrealized depreciation on OTC forward exchange contracts | 26,111,676 | ||
| Accrued expenses and other liabilities | 1,358,944 | ||
| Total liabilities | 279,794,779 | ||
| Net assets, at value | $ | 24,088,878,634 | |
| Net assets consist of: | |||
| Paid-in capital | $ | 21,714,601,049 | |
| Distributions in excess of net investment income | (23,539,039 | ) | |
| Net unrealized appreciation (depreciation) | 2,255,233,464 | ||
| Accumulated net realized gain (loss) | 142,583,160 | ||
| Net assets, at value | $ | 24,088,878,634 | |
28 Annual Report | The accompanying notes are an integral part of these financial statements.
franklintempleton.com
FRANKLIN MUTUAL GLOBAL DISCOVERY FUND
FINANCIAL STATEMENTS
| Statement of Assets and Liabilities (continued) | ||
| December 31, 2015 | ||
| Class Z: | ||
| Net assets, at value | $ | 9,132,751,629 |
| Shares outstanding | 311,165,223 | |
| Net asset value and maximum offering price per share | $ | 29.35 |
| Class A: | ||
| Net assets, at value | $ | 11,274,721,056 |
| Shares outstanding | 390,726,744 | |
| Net asset value per sharea | $ | 28.86 |
| Maximum offering price per share (net asset value per share ÷ 94.25%) | $ | 30.62 |
| Class C: | ||
| Net assets, at value | $ | 2,983,215,589 |
| Shares outstanding | 104,473,117 | |
| Net asset value and maximum offering price per sharea | $ | 28.55 |
| Class R: | ||
| Net assets, at value | $ | 468,425,080 |
| Shares outstanding | 16,431,588 | |
| Net asset value and maximum offering price per share | $ | 28.51 |
| Class R6: | ||
| Net assets, at value | $ | 229,765,280 |
| Shares outstanding | 7,827,943 | |
| Net asset value and maximum offering price per share | $ | 29.35 |
aRedemption price is equal to net asset value less contingent deferred sales charges, if applicable.
franklintempleton.com
The accompanying notes are an integral part of these financial statements. | Annual Report 29
FRANKLIN MUTUAL GLOBAL DISCOVERY FUND
FINANCIAL STATEMENTS
| Statement of Operations | |||
| for the year ended December 31, 2015 | |||
| Investment income: | |||
| Dividends (net of foreign taxes of $29,276,825) | $ | 574,304,943 | |
| Interest | 83,709,986 | ||
| Income from securities loaned | 2,098,789 | ||
| Other income (Note 1h) | 2,846,092 | ||
| Total investment income | 662,959,810 | ||
| Expenses: | |||
| Management fees (Note 3a) | 207,126,902 | ||
| Distribution fees: (Note 3c) | |||
| Class A | 33,425,822 | ||
| Class C | 31,494,873 | ||
| Class R | 2,591,719 | ||
| Transfer agent fees: (Note 3e) | |||
| Class Z | 15,145,280 | ||
| Class A | 17,689,114 | ||
| Class C | 4,659,028 | ||
| Class R | 768,014 | ||
| Class R6 | 6,683 | ||
| Custodian fees (Note 4) | 1,372,191 | ||
| Reports to shareholders | 1,964,267 | ||
| Registration and filing fees | 576,490 | ||
| Professional fees | 320,122 | ||
| Trustees’ fees and expenses | 728,010 | ||
| Dividends and/or interest on securities sold short | 5,528,259 | ||
| Other | 425,782 | ||
| Total expenses | 323,822,556 | ||
| Expense reductions (Note 4) | (10,268 | ) | |
| Expenses waived/paid by affiliates (Note 3f) | (16,876 | ) | |
| Net expenses | 323,795,412 | ||
| Net investment income | 339,164,398 | ||
| Realized and unrealized gains (losses): | |||
| Net realized gain (loss) from: | |||
| Investments: | |||
| Unaffiliated issuers | 1,361,640,137 | ||
| Non-controlled affiliates (Note 12) | (48,500,180 | ) | |
| Foreign currency transactions | 482,708,497 | ||
| Futures contracts | 138,026,567 | ||
| Securities sold short | 1,550,902 | ||
| Net realized gain (loss) | 1,935,425,923 | ||
| Net change in unrealized appreciation (depreciation) on: | |||
| Investments | (3,083,941,122 | ) | |
| Translation of other assets and liabilities denominated in foreign currencies | (121,174,543 | ) | |
| Futures contracts | (5,735,348 | ) | |
| Net change in unrealized appreciation (depreciation) | (3,210,851,013 | ) | |
| Net realized and unrealized gain (loss) | (1,275,425,090 | ) | |
| Net increase (decrease) in net assets resulting from operations | $ | (936,260,692 | ) |
30 Annual Report | The accompanying notes are an integral part of these financial statements.
franklintempleton.com
FRANKLIN MUTUAL GLOBAL DISCOVERY FUND
FINANCIAL STATEMENTS
| Statements of Changes in Net Assets | ||||||
| Year Ended December 31, | ||||||
| 2015 | 2014 | |||||
| Increase (decrease) in net assets: | ||||||
| Operations: | ||||||
| Net investment income | $ | 339,164,398 | $ | 529,306,080 | ||
| Net realized gain (loss) | 1,935,425,923 | 769,238,606 | ||||
| Net change in unrealized appreciation (depreciation) | (3,210,851,013 | ) | (78,174,223 | ) | ||
| Net increase (decrease) in net assets resulting from operations | (936,260,692 | ) | 1,220,370,463 | |||
| Distributions to shareholders from: | ||||||
| Net investment income: | ||||||
| Class Z | (160,624,336 | ) | (242,833,725 | ) | ||
| Class A | (169,856,805 | ) | (241,185,816 | ) | ||
| Class C | (23,086,411 | ) | (44,110,108 | ) | ||
| Class R | (5,977,705 | ) | (10,113,788 | ) | ||
| Class R6 | (4,336,706 | ) | (3,363,366 | ) | ||
| Net realized gains: | ||||||
| Class Z | (652,957,508 | ) | (405,244,066 | ) | ||
| Class A | (819,776,810 | ) | (460,043,428 | ) | ||
| Class C | (219,714,563 | ) | (124,294,638 | ) | ||
| Class R | (34,654,955 | ) | (21,543,405 | ) | ||
| Class R6 | (15,790,541 | ) | (5,256,846 | ) | ||
| Total distributions to shareholders | (2,106,776,340 | ) | (1,557,989,186 | ) | ||
| Capital share transactions: (Note 2) | ||||||
| Class Z | (117,039,628 | ) | 983,458,650 | |||
| Class A | 1,145,571,804 | 936,331,601 | ||||
| Class C | 290,521,090 | 225,941,115 | ||||
| Class R | (535,429 | ) | (5,024,677 | ) | ||
| Class R6 | 120,632,129 | 130,002,289 | ||||
| Total capital share transactions | 1,439,149,966 | 2,270,708,978 | ||||
| Net increase (decrease) in net assets | (1,603,887,066 | ) | 1,933,090,255 | |||
| Net assets: | ||||||
| Beginning of year | 25,692,765,700 | 23,759,675,445 | ||||
| End of year | $ | 24,088,878,634 | $ | 25,692,765,700 | ||
| Undistributed net investment income (distributions in excess of net investment income) included in | ||||||
| net assets: | ||||||
| End of year | $ | (23,539,039 | ) | $ | 2,877,198 | |
franklintempleton.com
The accompanying notes are an integral part of these financial statements. | Annual Report 31
FRANKLIN MUTUAL GLOBAL DISCOVERY FUND
Notes to Financial Statements
1. Organization and Significant Accounting Policies
Franklin Mutual Series Funds (Trust) is registered under the Investment Company Act of 1940 (1940 Act) as an open-end management investment company, consisting of seven separate funds and applies the specialized accounting and reporting guidance in U.S. Generally Accepted Accounting Principles (U.S. GAAP). Franklin Mutual Global Discovery Fund (Fund) is included in this report. The financial statements of the remaining funds in the Trust are presented separately. The Fund offers five classes of shares: Class Z, Class A, Class C, Class R and Class R6. Each class of shares differs by its initial sales load, contingent deferred sales charges, voting rights on matters affecting a single class, its exchange privilege and fees primarily due to differing arrangements for distribution and transfer agent fees.
The following summarizes the Fund’s significant accounting policies.
a. Financial Instrument Valuation
The Fund’s investments in financial instruments are carried at fair value daily. Fair value is the price that would be received to sell an asset or paid to transfer a liability in an orderly transaction between market participants on the measurement date. The Fund calculates the net asset value per share as of 4 p.m. Eastern time each day the New York Stock Exchange (NYSE) is open for trading. Under compliance policies and procedures approved by the Trust’s Board of Trustees (the Board), the Fund’s administrator has responsibility for oversight of valuation, including leading the cross-functional Valuation and Liquidity Oversight Committee (VLOC). The VLOC provides administration and oversight of the Fund’s valuation policies and procedures, which are approved annually by the Board. Among other things, these procedures allow the Fund to utilize independent pricing services, quotations from securities and financial instrument dealers, and other market sources to determine fair value.
Equity securities and derivative financial instruments (derivatives) listed on an exchange or on the NASDAQ National Market System are valued at the last quoted sale price or the official closing price of the day, respectively. Foreign equity securities are valued as of the close of trading on the foreign stock exchange on which the security is primarily traded or as of 4 p.m. Eastern time whichever is earlier. The value is then converted into its U.S. dollar equivalent at the foreign exchange rate in effect at 4 p.m. Eastern time on the day that the value of the security is determined. Over-the-counter (OTC) securities are valued within the range of the most recent quoted bid and ask prices. Securities that trade in multiple markets or on multiple exchanges are valued according to the broadest and most representative market. Certain equity securities are valued based upon fundamental characteristics or relationships to similar securities.
Debt securities generally trade in the OTC market rather than on a securities exchange. The Fund’s pricing services use multiple valuation techniques to determine fair value. In instances where sufficient market activity exists, the pricing services may utilize a market-based approach through which quotes from market makers are used to determine fair value. In instances where sufficient market activity may not exist or is limited, the pricing services also utilize proprietary valuation models which may consider market characteristics such as benchmark yield curves, credit spreads, estimated default rates, anticipated market interest rate volatility, coupon rates, anticipated timing of principal repayments, underlying collateral, and other unique security features in order to estimate the relevant cash flows, which are then discounted to calculate the fair value. Securities denominated in a foreign currency are converted into their U.S. dollar equivalent at the foreign exchange rate in effect at 4 p.m. Eastern time on the date that the values of the foreign debt securities are determined.
Certain derivatives trade in the OTC market. The Fund’s pricing services use various techniques including industry standard option pricing models and proprietary discounted cash flow models to determine the fair value of those instruments. The Fund’s net benefit or obligation under the derivative contract, as measured by the fair value of the contract, is included in net assets.
The Fund has procedures to determine the fair value of financial instruments for which market prices are not reliable or readily available. Under these procedures, the VLOC convenes on a regular basis to review such financial instruments and considers a number of factors, including significant unobservable valuation inputs, when arriving at fair value. The VLOC primarily employs a market-based approach which may use related or comparable assets or liabilities, recent transactions, market multiples, book values, and other relevant information for the investment to determine the fair value of the investment. An income-based valuation approach may also be used in which the anticipated future cash flows of the investment are discounted
32 Annual Report
franklintempleton.com
FRANKLIN MUTUAL GLOBAL DISCOVERY FUND
NOTES TO FINANCIAL STATEMENTS
to calculate fair value. Discounts may also be applied due to the nature or duration of any restrictions on the disposition of the investments. Due to the inherent uncertainty of valuations of such investments, the fair values may differ significantly from the values that would have been used had an active market existed. The VLOC employs various methods for calibrating these valuation approaches including a regular review of key inputs and assumptions, transactional back-testing or disposition analysis, and reviews of any related market activity.
Trading in securities on foreign securities stock exchanges and OTC markets may be completed before 4 p.m. Eastern time. In addition, trading in certain foreign markets may not take place on every NYSE business day. Occasionally, events occur between the time at which trading in a foreign security is completed and the close of the NYSE that might call into question the reliability of the value of a portfolio security held by the Fund. As a result, differences may arise between the value of the Fund’s portfolio securities as determined at the foreign market close and the latest indications of value at the close of the NYSE. In order to minimize the potential for these differences, the VLOC monitors price movements following the close of trading in foreign stock markets through a series of country specific market proxies (such as baskets of American Depositary Receipts, futures contracts and exchange traded funds). These price movements are measured against established trigger thresholds for each specific market proxy to assist in determining if an event has occurred that may call into question the reliability of the values of the foreign securities held by the Fund. If such an event occurs, the securities may be valued using fair value procedures, which may include the use of independent pricing services.
When the last day of the reporting period is a non-business day, certain foreign markets may be open on those days that the NYSE is closed, which could result in differences between the value of the Fund’s portfolio securities on the last business day and the last calendar day of the reporting period. Any significant security valuation changes due to an open foreign market are adjusted and reflected by the Fund for financial reporting purposes.
b. Foreign Currency Translation
Portfolio securities and other assets and liabilities denominated in foreign currencies are translated into U.S. dollars based on the exchange rate of such currencies against U.S. dollars on the date of valuation. The Fund may enter into foreign currency exchange contracts to facilitate transactions denominated in a foreign currency. Purchases and sales of securities, income and expense items denominated in foreign currencies are translated into U.S. dollars at the exchange rate in effect on the transaction date. Portfolio securities and assets and liabilities denominated in foreign currencies contain risks that those currencies will decline in value relative to the U.S. dollar. Occasionally, events may impact the availability or reliability of foreign exchange rates used to convert the U.S. dollar equivalent value. If such an event occurs, the foreign exchange rate will be valued at fair value using procedures established and approved by the Board.
The Fund does not separately report the effect of changes in foreign exchange rates from changes in market prices on securities held. Such changes are included in net realized and unrealized gain or loss from investments in the Statement of Operations.
Realized foreign exchange gains or losses arise from sales of foreign currencies, currency gains or losses realized between the trade and settlement dates on securities transactions and the difference between the recorded amounts of dividends, interest, and foreign withholding taxes and the U.S. dollar equivalent of the amounts actually received or paid. Net unrealized foreign exchange gains and losses arise from changes in foreign exchange rates on foreign denominated assets and liabilities other than investments in securities held at the end of the reporting period.
c. Derivative Financial Instruments
The Fund invested in derivatives in order to manage risk or gain exposure to various other investments or markets. Derivatives are financial contracts based on an underlying or notional amount, require no initial investment or an initial net investment that is smaller than would normally be required to have a similar response to changes in market factors, and require or permit net settlement. Derivatives contain various risks including the potential inability of the counterparty to fulfill their obligations under the terms of the contract, the potential for an illiquid secondary market, and/or the potential for market movements which expose the Fund to gains or losses in excess of the amounts shown in the Statement of Assets and Liabilities. Realized gain and loss and unrealized appreciation and depreciation on these contracts for the period are included in the Statement of Operations.
Derivative counterparty credit risk is managed through a formal evaluation of the creditworthiness of all potential
franklintempleton.com
Annual Report
33
FRANKLIN MUTUAL GLOBAL DISCOVERY FUND
NOTES TO FINANCIAL STATEMENTS
1. Organization and Significant Accounting
Policies (continued)
c. Derivative Financial Instruments (continued)
counterparties. The Fund attempts to reduce its exposure to counterparty credit risk on OTC derivatives, whenever possible, by entering into International Swaps and Derivatives Association (ISDA) master agreements with certain counterparties. These agreements contain various provisions, including but not limited to collateral requirements, events of default, or early termination. Termination events applicable to the counterparty include certain deteriorations in the credit quality of the counterparty. Termination events applicable to the Fund include failure of the Fund to maintain certain net asset levels and/or limit the decline in net assets over various periods of time. In the event of default or early termination, the ISDA master agreement gives the non-defaulting party the right to net and close-out all transactions traded, whether or not arising under the ISDA agreement, to one net amount payable by one counterparty to the other. However, absent an event of default or early termination, OTC derivative assets and liabilities are presented gross and not offset in the Statement of Assets and Liabilities. Early termination by the counterparty may result in an immediate payment by the Fund of any net liability owed to that counterparty under the ISDA agreement. At December 31, 2015, the Fund had OTC derivatives in a net liability position of $686,358 and the aggregate value of collateral pledged for such contracts was $633,879.
Collateral requirements differ by type of derivative. Collateral or initial margin requirements are set by the broker or exchange clearing house for exchange traded and centrally cleared derivatives. Initial margin deposited is held at the exchange and can be in the form of cash and/or securities. For OTC derivatives traded under an ISDA master agreement, posting of collateral is required by either the Fund or the applicable coun-terparty if the total net exposure of all OTC derivatives with the applicable counterparty exceeds the minimum transfer amount, which typically ranges from $100,000 to $250,000, and can vary depending on the counterparty and the type of the agreement. Generally, collateral is determined at the close of Fund business each day and any additional collateral required due to changes in derivative values may be delivered by the Fund or the counterparty within a few business days. Collateral pledged and/or received by the Fund for OTC derivatives, if any, is held in segregated accounts with the Fund’s custodian/counterparty broker and can be in the form of cash and/or securities.
Unrestricted cash may be invested according to the Fund’s investment objectives. To the extent that the amounts due to the Fund from its counterparties are not subject to collateralization or are not fully collateralized, the Fund bears the risk of loss from counterparty non-performance.
At December 31, 2015, the Fund received $54,747,499 in United Kingdom Treasury Bonds and U.S. Treasury Bonds and Notes as collateral for derivatives.
The Fund entered into exchange traded futures contracts primarily to manage exposure to certain foreign currencies. A futures contract is an agreement between the Fund and a counterparty to buy or sell an asset for a specified price on a future date. Required initial margins are pledged by the Fund, and the daily change in fair value is accounted for as a variation margin payable or receivable in the Statement of Assets and Liabilities.
The Fund entered into OTC forward exchange contracts primarily to manage exposure to certain foreign currencies. A forward exchange contract is an agreement between the Fund and a counterparty to buy or sell a foreign currency at a specific exchange rate on a future date.
See Note 11 regarding other derivative information.
d. Restricted Cash
At December 31, 2015, the Fund held restricted cash in connection with investments in certain derivative securities. Restricted cash is held in a segregated account with the Fund’s custodian/counterparty broker and is reflected in the Statement of Assets and Liabilities.
e. Securities Sold Short
The Fund is engaged in selling securities short, which obligates the Fund to replace a borrowed security with the same security at current fair value. The Fund incurs a loss if the price of the security increases between the date of the short sale and the date on which the Fund replaces the borrowed security. The Fund realizes a gain if the price of the security declines between those dates. Gains are limited to the price at which the Fund sold the security short, while losses are potentially unlimited in size.
The Fund is required to establish a margin account with the broker lending the security sold short. While the short sale is outstanding, the broker retains the proceeds of the short sale to the extent necessary to meet margin requirements until the short position is closed out. A deposit must also be maintained with
34 Annual Report
franklintempleton.com
FRANKLIN MUTUAL GLOBAL DISCOVERY FUND
NOTES TO FINANCIAL STATEMENTS
the Fund’s custodian/counterparty broker consisting of cash and/or securities having a value equal to a specified percentage of the value of the securities sold short. The Fund is obligated to pay fees for borrowing the securities sold short and is required to pay the counterparty any dividends and/or interest due on securities sold short. Such dividends and/or interest and any security borrowing fees are recorded as an expense to the Fund.
f. Securities Lending
The Fund participates in an agency based securities lending program to earn additional income. The Fund receives cash collateral against the loaned securities in an amount equal to at least 102% of the fair value of the loaned securities. Collateral is maintained over the life of the loan in an amount not less than 100% of the fair value of loaned securities, as determined at the close of Fund business each day; any additional collateral required due to changes in security values is delivered to the Fund on the next business day. The collateral is deposited into a joint cash account with other funds and is used to invest in a money market fund managed by Franklin Advisers, Inc., an affiliate of the Fund, and/or a joint repurchase agreement. The Fund may receive income from the investment of cash collateral, in addition to lending fees and rebates paid by the borrower. Income from securities loaned is reported separately in the Statement of Operations. The Fund bears the market risk with respect to the collateral investment, securities loaned, and the risk that the agent may default on its obligations to the Fund. If the borrower defaults on its obligation to return the securities loaned, the Fund has the right to repurchase the securities in the open market using the collateral received. The securities lending agent has agreed to indemnify the Fund in the event of default by a third party borrower. At December 31, 2015, the Fund had no securities on loan.
g. Senior Floating Rate Interests
The Fund invests in senior secured corporate loans that pay interest at rates which are periodically reset by reference to a base lending rate plus a spread. These base lending rates are generally the prime rate offered by a designated U.S. bank or the London InterBank Offered Rate (LIBOR). Senior secured corporate loans often require prepayment of principal from excess cash flows or at the discretion of the borrower. As a result, actual maturity may be substantially less than the stated maturity. Senior secured corporate loans in which the Fund invests are generally readily marketable, but may be subject to certain restrictions on resale.
h. Income and Deferred Taxes
It is the Fund’s policy to qualify as a regulated investment company under the Internal Revenue Code. The Fund intends to distribute to shareholders substantially all of its taxable income and net realized gains to relieve it from federal income and excise taxes. As a result, no provision for U.S. federal income taxes is required.
The Fund may be subject to foreign taxation related to income received, capital gains on the sale of securities and certain foreign currency transactions in the foreign jurisdictions in which it invests. Foreign taxes, if any, are recorded based on the tax regulations and rates that exist in the foreign markets in which the Fund invests. When a capital gain tax is determined to apply, the Fund records an estimated deferred tax liability in an amount that would be payable if the securities were disposed of on the valuation date. As a result of several court cases, in certain countries across the European Union, the Fund has filed additional tax reclaims for previously withheld taxes on dividends earned in those countries. These additional filings are subject to various administrative proceedings by the local jurisdictions’ tax authorities within the European Union, as well as a number of related judicial proceedings. During the year ended December 31, 2015, the Fund recognized $2,874,553 from Sweden for previously withheld foreign taxes and interest on such taxes. These amounts are reflected as other income and interest in the Statement of Operations. In regards to filings in other European Union countries, uncertainty exists as to the ultimate resolution of these proceedings, the likelihood of receipt of these reclaims, and the potential timing of payment, and accordingly, no amounts are reflected in the financial statements.
The Fund may recognize an income tax liability related to its uncertain tax positions under U.S. GAAP when the uncertain tax position has a less than 50% probability that it will be sustained upon examination by the tax authorities based on its technical merits. As of December 31, 2015, the Fund has determined that no tax liability is required in its Fund’s financial statements related to uncertain tax positions for any open tax years (or expected to be taken on future tax returns). Open tax years are those that remain subject to examination and are based on each tax jurisdiction’s statute of limitation.
franklintempleton.com
Annual Report
35
FRANKLIN MUTUAL GLOBAL DISCOVERY FUND
NOTES TO FINANCIAL STATEMENTS
1. Organization and Significant Accounting
Policies (continued)
i. Security Transactions, Investment Income, Expenses and Distributions
Security transactions are accounted for on trade date. Realized gains and losses on security transactions are determined on a specific identification basis. Interest income and estimated expenses are accrued daily. Amortization of premium and accretion of discount on debt securities are included in interest income. Dividend income and dividends declared on securities sold short are recorded on the ex-dividend date except for certain dividends from foreign securities where the dividend rate is not available. In such cases, the dividend is recorded as soon as the information is received by the Fund. Distributions to shareholders are recorded on the ex-dividend date and are determined according to income tax regulations (tax basis). Distributable earnings determined on a tax basis may differ from earnings recorded in accordance with U.S. GAAP. These differences may be permanent or temporary. Permanent differences are reclassified among capital accounts to reflect their tax character. These reclassifications have no impact on net assets or the results of operations. Temporary differences are not reclassified, as they may reverse in subsequent periods.
Common expenses incurred by the Trust are allocated among the funds based on the ratio of net assets of each fund to the combined net assets of the Trust. Fund specific expenses are charged directly to the fund that incurred the expense.
Realized and unrealized gains and losses and net investment income, not including class specific expenses, are allocated daily to each class of shares based upon the relative proportion of net assets of each class. Differences in per share distributions, by class, are generally due to differences in class specific expenses.
j. Accounting Estimates
The preparation of financial statements in accordance with U.S. GAAP requires management to make estimates and assumptions that affect the reported amounts of assets and liabilities at the date of the financial statements and the amounts of income and expenses during the reporting period. Actual results could differ from those estimates.
k. Guarantees and Indemnifications
Under the Trust’s organizational documents, its officers and trustees are indemnified by the Trust against certain liabilities arising out of the performance of their duties to the Trust. Additionally, in the normal course of business, the Trust, on behalf of the Fund, enters into contracts with service providers that contain general indemnification clauses. The Trust’s maximum exposure under these arrangements is unknown as this would involve future claims that may be made against the Trust that have not yet occurred. Currently, the Trust expects the risk of loss to be remote.
2. Shares of Beneficial Interest
At December 31, 2015, there were an unlimited number of shares authorized (without par value). Transactions in the Fund’s shares were as follows:
| Year Ended December 31, | ||||||||||
| 2015 | 2014 | |||||||||
| Shares | Amount | Shares | Amount | |||||||
| Class Z Shares: | ||||||||||
| Shares sold | 42,382,438 | $ | 1,417,518,812 | 46,881,605 | $ | 1,625,275,624 | ||||
| Shares issued in reinvestment of distributions | 26,156,041 | 761,748,485 | 18,056,654 | 605,754,122 | ||||||
| Shares redeemed | (68,764,363 | ) | (2,296,306,925 | ) | (36,103,244 | ) | (1,247,571,096 | ) | ||
| Net increase (decrease) | (225,884 | ) | $ | (117,039,628 | ) | 28,835,015 | $ | 983,458,650 | ||
| Class A Shares: | ||||||||||
| Shares sold | 67,815,155 | $ | 2,242,627,379 | 61,719,494 | $ | 2,100,805,860 | ||||
| Shares issued in reinvestment of distributions | 33,918,312 | 971,252,561 | 20,602,620 | 680,745,874 | ||||||
| Shares redeemed | (63,780,164 | ) | (2,068,308,136 | ) | (54,018,329 | ) | (1,845,220,133 | ) | ||
| Net increase (decrease) | 37,953,303 | $ | 1,145,571,804 | 28,303,785 | $ | 936,331,601 | ||||
36 Annual Report
franklintempleton.com
FRANKLIN MUTUAL GLOBAL DISCOVERY FUND
NOTES TO FINANCIAL STATEMENTS
| Year Ended December 31, | ||||||||||
| 2015 | 2014 | |||||||||
| Shares | Amount | Shares | Amount | |||||||
| Class C Shares: | ||||||||||
| Shares sold | 17,196,586 | $ | 560,093,583 | 13,386,983 | $ | 449,946,196 | ||||
| Shares issued in reinvestment of distributions | 7,951,692 | 225,458,453 | 4,719,640 | 154,538,611 | ||||||
| Shares redeemed | (15,414,887 | ) | (495,030,946 | ) | (11,248,942 | ) | (378,543,692 | ) | ||
| Net increase (decrease) | 9,733,391 | $ | 290,521,090 | 6,857,681 | $ | 225,941,115 | ||||
| Class R Shares: | ||||||||||
| Shares sold | 2,599,812 | $ | 84,252,120 | 2,510,654 | $ | 84,607,881 | ||||
| Shares issued in reinvestment of distributions | 1,403,754 | 39,729,502 | 948,190 | 30,987,138 | ||||||
| Shares redeemed | (3,865,140 | ) | (124,517,051 | ) | (3,577,569 | ) | (120,619,696 | ) | ||
| Net increase (decrease) | 138,426 | $ | (535,429 | ) | (118,725 | ) | $ | (5,024,677 | ) | |
| Class R6 Shares: | ||||||||||
| Shares sold | 5,836,313 | $ | 192,133,049 | 4,042,082 | $ | 137,605,135 | ||||
| Shares issued in reinvestment of distributions | 365,321 | 10,603,629 | 88,191 | 2,951,083 | ||||||
| Shares redeemed | (2,512,137 | ) | (82,104,549 | ) | (304,142 | ) | (10,553,929 | ) | ||
| Net increase (decrease) | 3,689,497 | $ | 120,632,129 | 3,826,131 | $ | 130,002,289 | ||||
3. Transactions with Affiliates
Franklin Resources, Inc. is the holding company for various subsidiaries that together are referred to as Franklin Templeton Investments. Certain officers and trustees of the Fund are also officers and/or directors of the following subsidiaries:
| Subsidiary | Affiliation |
| Franklin Mutual Advisers, LLC (Franklin Mutual) | Investment manager |
| Franklin Templeton Services, LLC (FT Services) | Administrative manager |
| Franklin Templeton Distributors, Inc. (Distributors) | Principal underwriter |
| Franklin Templeton Investor Services, LLC (Investor Services) | Transfer agent |
a. Management Fees
The Fund pays an investment management fee to Franklin Mutual based on the average daily net assets of the Fund as follows:
| Annualized Fee Rate | Net Assets | |
| 0.875 | % | Up to and including $4 billion |
| 0.845 | % | Over $4 billion, up to and including $7 billion |
| 0.825 | % | Over $7 billion, up to and including $10 billion |
| 0.805 | % | Over $10 billion, up to and including $13 billion |
| 0.785 | % | Over $13 billion, up to and including $16 billion |
| 0.765 | % | Over $16 billion, up to and including $19 billion |
| 0.745 | % | Over $19 billion, up to and including $22 billion |
| 0.725 | % | Over $22 billion, up to and including $25 billion |
| 0.705 | % | Over $25 billion, up to and including $28 billion |
| 0.685 | % | In excess of $28 billion |
franklintempleton.com
Annual Report
37
FRANKLIN MUTUAL GLOBAL DISCOVERY FUND
NOTES TO FINANCIAL STATEMENTS
3. Transactions with Affiliates (continued)
a. Management Fees (continued)
Prior to July 1, 2015, the Fund paid fees to Franklin Mutual based on the average daily net assets of the Fund as follows:
| Annualized Fee Rate | Net Assets | |
| 0.875 | % | Up to and including $4 billion |
| 0.845 | % | Over $4 billion, up to and including $7 billion |
| 0.825 | % | Over $7 billion, up to and including $10 billion |
| 0.805 | % | Over $10 billion, up to and including $13 billion |
| 0.785 | % | Over $13 billion, up to and including $16 billion |
| 0.765 | % | Over $16 billion, up to and including $19 billion |
| 0.745 | % | Over $19 billion, up to and including $22 billion |
| 0.725 | % | Over $22 billion, up to and including $25 billion |
| 0.705 | % | In excess of $25 billion |
b. Administrative Fees
Under an agreement with Franklin Mutual, FT Services provides administrative services to the Fund. The fee is paid by Franklin Mutual based on the Fund’s average daily net assets, and is not an additional expense of the Fund.
c. Distribution Fees
The Board has adopted distribution plans for each share class, with the exception of Class Z and Class R6 shares, pursuant to Rule 12b-1 under the 1940 Act. Under the Fund’s Class A reimbursement distribution plan, the Fund reimburses Distributors for costs incurred in connection with the servicing, sale and distribution of the Fund’s shares up to the maximum annual plan rate. Under the Class A reimbursement distribution plan, costs exceeding the maximum for the current plan year cannot be reimbursed in subsequent periods. In addition, under the Fund’s Class C and R compensation distribution plans, the Fund pays Distributors for costs incurred in connection with the servicing, sale and distribution of the Fund’s shares up to the maximum annual plan rate for each class. The plan year, for purposes of monitoring compliance with the maximum annual plan rates, is February 1 through January 31 for each fund.
The maximum annual plan rates, based on the average daily net assets, for each class, are as follows:
| Class A | 0.35 | % |
| Class C | 1.00 | % |
| Class R | 0.50 | % |
Effective August 1, 2015, the Board has set the current rate at 0.25% per year for Class A shares until further notice and approval by the Board. Prior to August 1, 2015, the Board had set the rate at 0.30% per year for Class A shares.
d. Sales Charges/Underwriting Agreements
Front-end sales charges and contingent deferred sales charges (CDSC) do not represent expenses of the Fund. These charges are deducted from the proceeds of sales of Fund shares prior to investment or from redemption proceeds prior to remittance, as applicable. Distributors has advised the Fund of the following commission transactions related to the sales and redemptions of the Fund’s shares for the year:
| Sales charges retained net of commissions paid to unaffiliated broker/dealers | $ | 6,522,442 |
| CDSC retained | $ | 290,544 |
38 Annual Report
franklintempleton.com
FRANKLIN MUTUAL GLOBAL DISCOVERY FUND
NOTES TO FINANCIAL STATEMENTS
e. Transfer Agent Fees
Each class of shares, except for Class R6, pays transfer agent fees to Investor Services for its performance of shareholder servicing obligations and reimburses Investor Services for out of pocket expenses incurred, including shareholding servicing fees paid to third parties. These fees are allocated daily based upon their relative proportion of such classes’ aggregate net assets. Class R6 pays Investor Services transfer agent fees specific to that class.
For the year ended December 31, 2015, the Fund paid transfer agent fees of $38,268,119, of which $12,897,211 was retained by Investor Services.
f. Investments in Affiliated Management Investment Companies
The Fund invests in an affiliated management investment company for purposes other than exercising a controlling influence over the management or policies. Management fees paid by the Fund are waived on assets invested in the affiliated management investment company, as noted in the Statement of Operations, in an amount not to exceed the management and administrative fees paid directly or indirectly by each affiliate.
| % of Affiliated | |||||||||
| Number of | Number of | Fund Shares | |||||||
| Shares Held | Shares Held | Value | Realized | Oustanding | |||||
| at Beginning | Gross | Gross | at End | at End | Investment | (Gain) | Held at End | ||
| of Year | Additions | Reductions | of Year | of Year | Income | Loss | of Year | ||
| Non-Controlled Affiliates | |||||||||
| Institutional Fiduciary Trust | |||||||||
| Money Market Portfolio | — | 60,750,000 | (60,750,000 | ) | — | $ — | $ — | $ — | —% |
g. Waiver and Expense Reimbursements
Investor Services has contractually agreed in advance to waive or limit its fees so that the Class R6 transfer agent fees do not exceed 0.01% until April 30, 2016. There were no Class R6 transfer agent fees waived during the year ended December 31, 2015.
4. Expense Offset Arrangement
The Fund has entered into an arrangement with its custodian whereby credits realized as a result of uninvested cash balances are used to reduce a portion of the Fund’s custodian expenses. During the year ended December 31, 2015, the custodian fees were reduced as noted in the Statement of Operations.
5. Independent Trustees’ Retirement Plan
On January 1, 1993, the Trust adopted an Independent Trustees’ Retirement Plan (Plan). The Plan is an unfunded defined benefit plan that provides benefit payments to Trustees whose length of service and retirement age meets the eligibility requirements of the Plan. Benefits under the Plan are based on years of service and fees paid to each trustee at the time of retirement. Effective in December 1996, the Plan was closed to new participants.
During the year ended December 31, 2015, the Fund’s projected benefit obligation and benefit payments under the Plan were as follows:
| aProjected benefit obligation at December 31, 2015 | $ | 792,511 | |
| bIncrease in projected benefit obligation | $ | 75,811 | |
| Benefit payments made to retired trustees | $ | (23,343 | ) |
| aThe projected benefit obligation is included in trustees’ fees and expenses in the Statement of Assets and Liabilities. | |||
| bThe increase in projected benefit obligation is included in trustees’ fees and expenses in the Statement of Operations. | |||
franklintempleton.com
Annual Report
39
FRANKLIN MUTUAL GLOBAL DISCOVERY FUND
NOTES TO FINANCIAL STATEMENTS
6. Income Taxes
The tax character of distributions paid during the years ended December 31, 2015 and 2014, was as follows:
| 2015 | 2014 | |||
| Distributions paid from: | ||||
| Ordinary income | $ | 571,642,375 | $ | 541,606,803 |
| Long term capital gain | 1,535,133,965 | 1,016,382,383 | ||
| $ | 2,106,776,340 | $ | 1,557,989,186 |
At December 31, 2015, the cost of investments, net unrealized appreciation (depreciation), undistributed ordinary income and undistributed long term capital gains for income tax purposes were as follows:
| Cost of investments | $ | 21,820,473,003 | |
| Unrealized appreciation | $ | 4,903,864,607 | |
| Unrealized depreciation | (2,835,662,451 | ) | |
| Net unrealized appreciation (depreciation) | $ | 2,068,202,156 | |
| Undistributed ordinary income | $ | 33,613,234 | |
| Undistributed long term capital gains | 310,479,445 | ||
| Distributable earnings | $ | 344,092,679 |
Differences between income and/or capital gains as determined on a book basis and a tax basis are primarily due to differing treatments of foreign currency transactions.
7. Investment Transactions
Purchases and sales of investments (excluding short term securities and securities sold short) for the year ended December 31, 2015, aggregated $7,017,690,031 and $5,249,386,137, respectively.
8. Credit Risk and Defaulted Securities
The Fund may purchase the pre-default or defaulted debt of distressed companies. Distressed companies are financially troubled and are about to be or are already involved in financial restructuring or bankruptcy. Risks associated with purchasing these securities include the possibility that the bankruptcy or other restructuring process takes longer than expected, or that distributions in restructuring are less than anticipated, either or both of which may result in unfavorable consequences to the Fund. If it becomes probable that the income on debt securities, including those of distressed companies, will not be collected, the Fund discontinues accruing income and recognizes an adjustment for uncollectible interest.
At December 31, 2015, the aggregate long value of distressed company securities for which interest recognition has been discontinued was $213,367,970, representing 0.89% of the Fund’s net assets. For information as to specific securities, see the accompanying Statement of Investments.
9. Concentration of Risk
Investing in foreign securities may include certain risks and considerations not typically associated with investing in U.S. securities, such as fluctuating currency values and changing local and regional economic, political and social conditions, which may result in greater market volatility. In addition, certain foreign securities may not be as liquid as U.S. securities.
40 Annual Report
franklintempleton.com
FRANKLIN MUTUAL GLOBAL DISCOVERY FUND
NOTES TO FINANCIAL STATEMENTS
10. Restricted Securities
The Fund invests in securities that are restricted under the Securities Act of 1933 (1933 Act) or which are subject to legal, contractual, or other agreed upon restrictions on resale. Restricted securities are often purchased in private placement transactions, and cannot be sold without prior registration unless the sale is pursuant to an exemption under the 1933 Act. Disposal of these securities may require greater effort and expense, and prompt sale at an acceptable price may be difficult. The Fund may have registration rights for restricted securities. The issuer generally incurs all registration costs.
At December 31, 2015, the Fund held investments in restricted securities, excluding certain securities exempt from registration under the 1933 Act deemed to be liquid, as follows:
| Principal | |||||||||||||
| Amount/ | |||||||||||||
| Shares/ | Acquisition | ||||||||||||
| Units | Issuer | Dates | Cost | Value | |||||||||
| Broadband Ventures III LLC, secured promissory | |||||||||||||
| 8,893 | note, 5.00%, 2/01/12 | 7/01/10 - 11/30/12 | $ | 8,893 | $ | — | |||||||
| 30,279,560 | FIM Coinvestor Holdings I, LLC | 11/20/06 - 6/02/09 | — | — | |||||||||
| 3,048,000 | Hightower Holding LLC, pfd., A, Series 2 | 6/10/10 - 5/10/12 | 7,620,000 | 7,238,086 | |||||||||
| 3,819,425 | International Automotive Components Group Brazil LLC | 4/13/06 - 12/26/08 | 2,536,498 | 39,275 | |||||||||
| 35,491,081 | International Automotive Components Group North America LLC | 1/12/06 - 3/18/13 | 29,095,371 | 19,160,393 | |||||||||
| Total Restricted Securities (Value is 0.11% of Net Assets) | $ | 39,260,762 | $ | 26,437,754 | |||||||||
| 11. Other Derivative Information | |||||||||||||
| At December 31, 2015, the Fund’s investments in derivative contracts are reflected in the Statement of Assets and Liabilities as | |||||||||||||
| follows: | |||||||||||||
| Asset Derivatives | Liability Derivatives | ||||||||||||
| Derivative Contracts | |||||||||||||
| Not Accounted for as | Statement of Assets and | Statement of Assets and | |||||||||||
| Hedging Instruments | Liabilities Location | Fair Value | Liabilities Location | Fair Value | |||||||||
| Foreign exchange contracts | Variation margin | $ | 18,055,212a | ||||||||||
| Unrealized appreciation on | 164,833,051 | Unrealized depreciation on | $ | 26,111,676 | |||||||||
| OTC forward exchange | OTC forward exchange | ||||||||||||
| contracts | contracts | ||||||||||||
| Totals | $ | 182,888,263 | $ | 26,111,676 | |||||||||
| aThis amount reflects the cumulative appreciation (depreciation) of futures contracts as reported in the Statement of Investments. Only the variation margin receivable/payable | |||||||||||||
| at year end is separately reported within the Statement of Assets and Liabilities. Prior variation margin movements were recorded to cash upon receipt or payment. | |||||||||||||
| For the year ended December 31, 2015, the effect of derivative contracts in the Fund’s Statement of Operations was as follows: | |||||||||||||
| Net Change in | |||||||||||||
| Unrealized | |||||||||||||
| Derivative Contracts | Net Realized | Appreciation | |||||||||||
| Not Accounted for as | Statement of Operations | Gain (Loss) | Statement of Operations | (Depreciation) | |||||||||
| Hedging Instruments | Locations | for the Year | Locations | for the Year | |||||||||
| Net realized gain (loss) from: | Net change in unrealized | ||||||||||||
| appreciation (depreciation) on: | |||||||||||||
| Foreign exchange contracts | Foreign currency | $ | 488,841,550 | Translation of other assets | $ | (121,358,984 | )a | ||||||
| transactions | and liabilities denominated | ||||||||||||
| in foreign currencies | |||||||||||||
| Futures contracts | 138,026,567 | Futures contracts | (5,735,348 | ) | |||||||||
| Totals | $ | 626,868,117 | $ | (127,094,332 | ) | ||||||||
| aForward exchange contracts are included in net realized gain (loss) from foreign currency transactions and net change in unrealized appreciation (depreciation) on translation | |||||||||||||
| of other assets and liabilities denominated in foreign currencies in the Statement of Operations. | |||||||||||||
franklintempleton.com
Annual Report
41
FRANKLIN MUTUAL GLOBAL DISCOVERY FUND
NOTES TO FINANCIAL STATEMENTS
For the year ended December 31, 2015, the average month end fair value of derivatives represented 0.89% of average month end net assets. The average month end number of open derivative contracts for the year was 220.
See Note 1(c) regarding derivative financial instruments.
12. Holdings of 5% Voting Securities of Portfolio Companies
The 1940 Act defines “affiliated companies” to include investments in portfolio companies in which a fund owns 5% or more of the outstanding voting securities. Investments in “affiliated companies” for the Fund for the year ended December 31, 2015, were as shown below.
| Number of | Number of | |||||||||||
| Shares Held | Shares Held | Value | ||||||||||
| at Beginning | Gross | Gross | at End | at End | Investment | Realized | ||||||
| Name of Issuer | of Year | Additions | Reductions | of Year | of Year | Income | Gain (Loss) | |||||
| Non-Controlled Affiliates | ||||||||||||
| International Automotive | ||||||||||||
| Components Group | ||||||||||||
| North America LLC | 35,491,081 | — | — | 35,491,081 | $ | 19,160,393 | $ | — | $ | — | ||
| NewPage Holdings | ||||||||||||
| Inc | 583,268 | — | (583,268 | )a | — | — | — | (48,500,180 | ) | |||
| Total Affiliated Securities (Value is 0.08% of Net Assets) | $ | 19,160,393 | $ | — | $ | (48,500,180 | ) | |||||
| aGross reduction was the result of a corporate action. | ||||||||||||
13. Credit Facility
The Fund, together with other U.S. registered and foreign investment funds (collectively, Borrowers), managed by Franklin Temple-ton Investments, are borrowers in a joint syndicated senior unsecured credit facility totaling $2 billion (Global Credit Facility) which matured on February 12, 2016. This Global Credit Facility provides a source of funds to the Borrowers for temporary and emergency purposes, including the ability to meet future unanticipated or unusually large redemption requests. Effective February 12, 2016, the Borrowers renewed the Global Credit Facility for a one year term, maturing February 10, 2017, for a total of $2 billion.
Under the terms of the Global Credit Facility, the Fund shall, in addition to interest charged on any borrowings made by the Fund and other costs incurred by the Fund, pay its share of fees and expenses incurred in connection with the implementation and maintenance of the Global Credit Facility, based upon its relative share of the aggregate net assets of all of the Borrowers, including an annual commitment fee of 0.07% based upon the unused portion of the Global Credit Facility. Effective February 12, 2016, the annual commitment fee is 0.15%. These fees are reflected in other expenses in the Statement of Operations. During the year ended December 31, 2015, the Fund did not use the Global Credit Facility.
14. Fair Value Measurements
The Fund follows a fair value hierarchy that distinguishes between market data obtained from independent sources (observable inputs) and the Fund’s own market assumptions (unobservable inputs). These inputs are used in determining the value of the Fund’s financial instruments and are summarized in the following fair value hierarchy:
- Level 1 – quoted prices in active markets for identical financial instruments
- Level 2 – other significant observable inputs (including quoted prices for similar financial instruments, interest rates, prepayment speed, credit risk, etc.)
- Level 3 – significant unobservable inputs (including the Fund’s own assumptions in determining the fair value of financial instruments)
The input levels are not necessarily an indication of the risk or liquidity associated with financial instruments at that level.
42 Annual Report
franklintempleton.com
FRANKLIN MUTUAL GLOBAL DISCOVERY FUND
NOTES TO FINANCIAL STATEMENTS
For movements between the levels within the fair value hierarchy, the Fund has adopted a policy of recognizing the transfers as of the date of the underlying event which caused the movement.
A summary of inputs used as of December 31, 2015, in valuing the Fund’s assets and liabilities carried at fair value, is as follows:
| Level 1 | Level 2 | Level 3 | Total | ||||||
| Assets: | |||||||||
| Investments in Securities: | |||||||||
| Equity Investments:a | |||||||||
| Auto Components | $ | 128,246,762 | $ | — | $ | 19,199,668 | $ | 147,446,430 | |
| Banks | 3,486,376,159 | 95,314,599 | — | 3,581,690,758 | |||||
| Diversified Financial Services | — | — | 7,238,086 | 7,238,086 | |||||
| Machinery | 271,601,093 | 50,539,963 | — | 322,141,056 | |||||
| All Other Equity Investmentsb | 18,375,630,150 | — | —c | 18,375,630,150 | |||||
| Corporate Bonds, Notes and Senior Floating Rate | |||||||||
| Interests | — | 504,463,609 | — | 504,463,609 | |||||
| Corporate Notes and Senior Floating Rate Interests in | |||||||||
| Reorganization | — | 213,298,722 | 69,248 | c | 213,367,970 | ||||
| Companies in Liquidation | 181,910 | 33,050,276 | —c | 33,232,186 | |||||
| Municipal Bonds | — | 71,507,430 | — | 71,507,430 | |||||
| Short Term Investments | 605,357,484 | 26,600,000 | — | 631,957,484 | |||||
| Total Investments in Securities | $ | 22,867,393,558 | $ | 994,774,599 | $ | 26,507,002 | $ | 23,888,675,159 | |
| Other Financial Instruments | |||||||||
| Futures Contracts | $ | 18,055,212 | $ | — | $ | — | $ | 18,055,212 | |
| Forward Exchange Contracts | — | 164,833,051 | — | 164,833,051 | |||||
| Total Other Financial Instruments | $ | 18,055,212 | $ | 164,833,051 | $ | — | $ | 182,888,263 | |
| Liabilities: | |||||||||
| Other Financial Instruments | |||||||||
| Securities Sold Short | $ | 50,488,673 | $ | — | $ | — | $ | 50,488,673 | |
| Forward Exchange Contracts | — | 26,111,676 | — | 26,111,676 | |||||
| Total Other Financial Instruments | $ | 50,488,673 | $ | 26,111,676 | $ | — | $ | 76,600,349 | |
aIncludes common and preferred stocks as well as other equity investments.
bFor detailed categories, see the accompanying Statement of Investments.
cIncludes securities determined to have no value at December 31, 2015.
A reconciliation of assets in which Level 3 inputs are used in determining fair value is presented when there are significant Level 3 financial instruments at the end of the year.
15. Subsequent Events
The Fund has evaluated subsequent events through the issuance of the financial statements and determined that no events have occurred that require disclosure other than those already disclosed in the financial statements.
| Abbreviations | |||||
| Counterparty | Currency | Selected Portfolio | |||
| BANT | Bank of America N.A. | EUR | Euro | ADR | American Depositary Receipt |
| BBU | Barclays Bank PLC | GBP | British Pound | FHLB | Federal Home Loan Bank |
| BONY | Bank of New York Mellon | USD | United States Dollar | GO | General Obligation |
| DBFX | Deutsche Bank AG | PIK | Payment-In-Kind | ||
| FBCO | Credit Suisse Group AG | ||||
| HSBC | HSBC Bank USA, N.A. | ||||
| SSBT | State Street Bank and Trust Co., N.A. | ||||
franklintempleton.com
Annual Report
43
FRANKLIN MUTUAL GLOBAL DISCOVERY FUND
Report of Independent Registered Public Accounting Firm
To the Board of Trustees of Franklin Mutual Series Funds and Shareholders of Franklin Mutual Global Discovery Fund:
We have audited the accompanying statement of assets and liabilities of Franklin Mutual Global Discovery Fund (the “Fund”) (one of the funds constituting Franklin Mutual Series Funds), including the statement of investments, as of December 31, 2015, and the related statement of operations for the year then ended, the statements of changes in net assets for each of the two years in the period then ended, and the financial highlights for each of the periods indicated therein. These financial statements and financial highlights are the responsibility of the Fund’s management. Our responsibility is to express an opinion on these financial statements and financial highlights based on our audits.
We conducted our audits in accordance with the standards of the Public Company Accounting Oversight Board (United States). Those standards require that we plan and perform the audit to obtain reasonable assurance about whether the financial statements and financial highlights are free of material misstatement. We were not engaged to perform an audit of the Fund’s internal control over financial reporting. Our audits included consideration of internal control over financial reporting as a basis for designing audit procedures that are appropriate in the circumstances, but not for the purpose of expressing an opinion on the effectiveness of the Fund’s internal control over financial reporting. Accordingly, we express no such opinion. An audit also includes examining, on a test basis, evidence supporting the amounts and disclosures in the financial statements and financial highlights, assessing the accounting principles used and significant estimates made by management, and evaluating the overall financial statement presentation. Our procedures included confirmation of securities owned as of December 31, 2015, by correspondence with the custodian and brokers, or by other appropriate auditing procedures where replies from the brokers were not received. We believe that our audits provide a reasonable basis for our opinion.
In our opinion, the financial statements and financial highlights referred to above present fairly, in all material respects, the financial position of Franklin Mutual Global Discovery Fund (one of the funds constituting Franklin Mutual Series Funds) at December 31, 2015, the results of its operations for the year then ended, the changes in its net assets for each of the two years in the period then ended, and the financial highlights for each of the periods indicated therein, in conformity with U.S. generally accepted accounting principles.

Boston, Massachusetts
February 18, 2016
44 Annual Report
franklintempleton.com
FRANKLIN MUTUAL GLOBAL DISCOVERY FUND
Tax Information (unaudited)
Under Section 852(b)(3)(C) of the Internal Revenue Code (Code), the Fund hereby reports the maximum amount allowable but no less than $1,535,133,965 as a long term capital gain dividend for the fiscal year ended December 31, 2015.
Under Section 871(k)(2)(C) of the Code, the Fund hereby reports the maximum amount allowable but no less than $207,760,413 as a short term capital gain dividend for purposes of the tax imposed under Section 871(a)(1)(A) of the Code for the fiscal year ended December 31, 2015.
Under Section 854(b)(1)(A) of the Code, the Fund hereby reports 42.67% of the ordinary income dividends as income qualifying for the dividends received deduction for the fiscal year ended December 31, 2015.
Under Section 854(b)(1)(B) of the Code, the Fund hereby reports the maximum amount allowable but no less than $529,213,522 as qualified dividends for purposes of the maximum rate under Section 1(h)(11) of the Code for the fiscal year ended December 31, 2015. Distributions, including qualified dividend income, paid during calendar year 2015 will be reported to shareholders on Form 1099-DIV by mid-February 2016. Shareholders are advised to check with their tax advisors for information on the treatment of these amounts on their individual income tax returns.
Under Section 871(k)(1)(C) of the Code, the Fund hereby reports the maximum amount allowable but no less than $42,644,322 as interest related dividends for purposes of the tax imposed under Section 871(a)(1)(A) of the Code for the fiscal year ended December 31, 2015.
Annual Report
45
FRANKLIN MUTUAL GLOBAL DISCOVERY FUND
Board Members and Officers
The name, year of birth and address of the officers and board members, as well as their affiliations, positions held with the Fund, principal occupations during at least the past five years and number of portfolios overseen in the Franklin Templeton Investments fund complex, are shown below. Generally, each board member serves until that person’s successor is elected and qualified.
| Independent Board Members | ||||
| Number of Portfolios in | ||||
| Name, Year of Birth | Length of | Fund Complex Overseen | Other Directorships Held | |
| and Address | Position | Time Served | by Board Member* | During at Least the Past 5 Years |
| Edward I. Altman, Ph.D. (1941) | Trustee | Since 1987 | 17 | None |
| c/o Franklin Mutual Advisers, LLC | ||||
| 101 John F. Kennedy Parkway | ||||
| Short Hills, NJ 07078-2789 | ||||
| Principal Occupation During at Least the Past 5 Years: | ||||
| Max L. Heine Professor of Finance, Emeritus and Director of The Credit and Debt Markets Research Program, Salomon Center, Stern School | ||||
| of Business, New York University; editor and author of numerous financial publications; financial consultant; an adviser to numerous financial | ||||
| and publishing organizations; and formerly, Vice Director, Salomon Center, Stern School of Business, New York University. | ||||
| Ann Torre Bates (1958) | Trustee | Since 1995 | 41 | Navient Corporation (loan |
| c/o Franklin Mutual Advisers, LLC | management, servicing and asset | |||
| 101 John F. Kennedy Parkway | recovery) (2014-present), Ares Capital | |||
| Short Hills, NJ 07078-2789 | Corporation (specialty finance | |||
| company) (2010-present), United | ||||
| Natural Foods, Inc. (distributor of | ||||
| natural, organic and specialty foods) | ||||
| (2013-present), Allied Capital | ||||
| Corporation (financial services) | ||||
| (2003-2010) and SLM Corporation | ||||
| (Sallie Mae) (1997-2014). | ||||
| Principal Occupation During at Least the Past 5 Years: | ||||
| Director of various companies; and formerly, Executive Vice President and Chief Financial Officer, NHP Incorporated (manager of multifamily | ||||
| housing) (1995-1997); and Vice President and Treasurer, US Airways, Inc. (until 1995). | ||||
| Burton J. Greenwald (1929) | Trustee | Trustee since | 17 | Franklin Templeton Emerging Markets |
| c/o Franklin Mutual Advisers, LLC | and Vice | 2002 and Vice | Debt Opportunities Fund PLC and | |
| 101 John F. Kennedy Parkway | Chairman | Chairman since | Fiduciary International Ireland Limited | |
| Short Hills, NJ 07078-2789 | of the | April 2015 | (1999-2015). | |
| Board | ||||
| Principal Occupation During at Least the Past 5 Years: | ||||
| Managing Director, B.J. Greenwald Associates (management consultants to the financial services industry); and formerly, Chairman, | ||||
| Fiduciary Trust International Funds; Executive Vice President, L.F. Rothschild Fund Management, Inc.; President and Director, Merit Mutual | ||||
| Funds; President, Underwriting Division and Director, National Securities & Research Corporation; Governor, Investment Company Institute; | ||||
| and Chairman, ICI Public Information Committee. | ||||
| Keith E. Mitchell (1954) | Trustee | Since 2009 | 17 | None |
| c/o Franklin Mutual Advisers, LLC | ||||
| 101 John F. Kennedy Parkway | ||||
| Short Hills, NJ 07078-2789 | ||||
| Principal Occupation During at Least the Past 5 Years: | ||||
| Director of various boards of asset management firms; and formerly, Managing Member, Mitchell, Hartley & Bechtel Advisers, LLC (formerly, | ||||
| Mitchell Advisers, LLC) (advisory firm) (2003-2015) and Managing Director, Putnam Lovell NBF. | ||||
| David W. Niemiec (1949) | Trustee | Since | 41 | Emeritus Corporation (assisted |
| One Franklin Parkway | April 2015 | living) (1999-2010) and OSI | ||
| San Mateo, CA 94403-1906 | Pharmaceuticals, Inc. (pharmaceutical | |||
| products) (2006-2010). | ||||
| Principal Occupation During at Least the Past 5 Years: | ||||
| Advisor, Saratoga Partners (private equity fund); and formerly, Managing Director, Saratoga Partners (1998-2001) and SBC Warburg Dillon | ||||
| Read (investment banking) (1997-1998); Vice Chairman, Dillon, Read & Co. Inc. (investment banking) (1991-1997); and Chief Financial | ||||
| Officer, Dillon, Read & Co. Inc. (1982-1997). | ||||
46 Annual Report
franklintempleton.com
FRANKLIN MUTUAL GLOBAL DISCOVERY FUND
| Independent Board Members (continued) | |||||
| Number of Portfolios in | |||||
| Name, Year of Birth | Length of | Fund Complex Overseen | Other Directorships Held | ||
| and Address | Position | Time Served | by Board Member* | During at Least the Past 5 Years | |
| Charles Rubens II (1930) | Trustee | Since 1998 | 17 | None | |
| c/o Franklin Mutual Advisers, LLC | |||||
| 101 John F. Kennedy Parkway | |||||
| Short Hills, NJ 07078-2789 | |||||
| Principal Occupation During at Least the Past 5 Years: | |||||
| Private investor and president of non-profit organizations; and formerly, an executive of Time, Inc.; and Trustee of Colorado College. | |||||
| Jan Hopkins Trachtman (1947) | Trustee | Since 2009 | 17 | None | |
| c/o Franklin Mutual Advisers, LLC | |||||
| 101 John F. Kennedy Parkway | |||||
| Short Hills, NJ 07078-2789 | |||||
| Principal Occupation During at Least the Past 5 Years: | |||||
| President and Founder, The Jan Hopkins Group (communications consulting firm); serves on Advisory Board of Knight Bagehot Fellowship; | |||||
| and formerly, President, Economic Club of New York (2001-2015); Anchor/Correspondent, CNN Financial News (until 2003); Managing | |||||
| Director and Head of Client Communications, Citigroup Private Bank (until 2005); Off-Air Reporter, ABC News’ World News Tonight; and | |||||
| Editor, CBS Network News. | |||||
| Robert E. Wade (1946) | Trustee | Trustee since | 41 | El Oro Ltd (investments) | |
| c/o Franklin Mutual Advisers, LLC | and | 1993 | and | (2003-present). | |
| 101 John F. Kennedy Parkway | Chairman | Chairman of the | |||
| Short Hills, NJ 07078-2789 | of the | Board | |||
| Board | since 2005 | ||||
| Principal Occupation During at Least the Past 5 Years: | |||||
| Attorney at law engaged in private practice (1972-2008) and member of various boards. | |||||
| Gregory H. Williams (1943) | Trustee | Since | 17 | None | |
| One Franklin Parkway | April 2015 | ||||
| San Mateo, CA 94403-1906 | |||||
| Principal Occupation During at Least the Past 5 Years: | |||||
| Private investor; Consultant; and formerly, President, University of Cincinnati (2009-2012); President, The City College of New York | |||||
| (2001-2009); Dean, College of Law, Ohio State University (1993-2001); and Associate Vice President, Academic Affairs and Professor of Law, | |||||
| University of Iowa (1977-1993). | |||||
| Interested Board Members and Officers | |||||
| Number of Portfolios in | |||||
| Name, Year of Birth | Length of | Fund Complex Overseen | Other Directorships Held | ||
| and Address | Position | Time Served | by Board Member* | During at Least the Past 5 Years | |
| **Gregory E. Johnson (1961) | Trustee | Since 2007 | 164 | None | |
| One Franklin Parkway | |||||
| San Mateo, CA 94403-1906 | |||||
| Principal Occupation During at Least the Past 5 Years: | |||||
| Chairman of the Board, Member – Office of the Chairman, Director and Chief Executive Officer, Franklin Resources, Inc.; officer and/or | |||||
| director or trustee, as the case may be, of some of the other subsidiaries of Franklin Resources, Inc. and of 44 of the investment companies in | |||||
| Franklin Templeton Investments; Vice Chairman, Investment Company Institute; and formerly, President, Franklin Resources, Inc. | |||||
| (1994-2015). | |||||
franklintempleton.com
Annual Report
47
FRANKLIN MUTUAL GLOBAL DISCOVERY FUND
| Interested Board Members and Officers (continued) | ||||
| Number of Portfolios in | ||||
| Name, Year of Birth | Length of | Fund Complex Overseen | Other Directorships Held | |
| and Address | Position | Time Served | by Board Member* | During at Least the Past 5 Years |
| **Peter A. Langerman (1955) | Trustee, | Trustee | 7 | American International Group, Inc. |
| c/o Franklin Mutual Advisers, LLC | President, | since 2007, | (AIG) Credit Facility Trust | |
| 101 John F. Kennedy Parkway | and Chief | President, and | (2010-2011). | |
| Short Hills, NJ 07078-2702 | Executive | Chief Executive | ||
| Officer – | Officer – | |||
| Investment | Investment | |||
| Management | Management | |||
| since 2005 | ||||
| Principal Occupation During at Least the Past 5 Years: | ||||
| Chairman of the Board, Chief Executive Officer and President, Franklin Mutual Advisers, LLC; and officer and/or director, as the case may be, | ||||
| of two of the investment companies in Franklin Templeton Investments. | ||||
| Alison E. Baur (1964) | Vice | Since 2012 | Not Applicable | Not Applicable |
| One Franklin Parkway | President | |||
| San Mateo, CA 94403-1906 | ||||
| Principal Occupation During at Least the Past 5 Years: | ||||
| Deputy General Counsel, Franklin Templeton Investments; and officer of some of the other subsidiaries of Franklin Resources, Inc. and of 44 | ||||
| of the investment companies in Franklin Templeton Investments. | ||||
| Philippe Brugere-Trelat (1949) | Vice | Since 2005 | Not Applicable | Not Applicable |
| 101 John F. Kennedy Parkway | President | |||
| Short Hills NJ 07078-2789 | ||||
| Principal Occupation During at Least the Past 5 Years: | ||||
| Executive Vice President, Franklin Mutual Advisers, LLC; officer of two of the investment companies in Franklin Templeton Investments; and | ||||
| formerly, Portfolio Manager of Eurovest SA (French registered Investment Company, Sicav). | ||||
| Laura F. Fergerson (1962) | Chief | Since 2009 | Not Applicable | Not Applicable |
| One Franklin Parkway | Executive | |||
| San Mateo, CA 94403-1906 | Officer – | |||
| Finance and | ||||
| Administration | ||||
| Principal Occupation During at Least the Past 5 Years: | ||||
| Senior Vice President, Franklin Templeton Services, LLC; Vice President, Franklin Advisers, Inc. and Franklin Templeton Institutional, LLC; | ||||
| and officer of 44 of the investment companies in Franklin Templeton Investments. | ||||
| Aliya S. Gordon (1973) | Vice | Since 2009 | Not Applicable | Not Applicable |
| One Franklin Parkway | President | |||
| San Mateo, CA 94403-1906 | ||||
| Principal Occupation During at Least the Past 5 Years: | ||||
| Senior Associate General Counsel, Franklin Templeton Investments; and officer of 44 of the investment companies in Franklin Templeton | ||||
| Investments. | ||||
| Steven J. Gray (1955) | Secretary | Secretary | Not Applicable | Not Applicable |
| One Franklin Parkway | and Vice | since 2005 and | ||
| San Mateo, CA 94403-1906 | President | Vice President | ||
| since 2009 | ||||
| Principal Occupation During at Least the Past 5 Years: | ||||
| Senior Associate General Counsel, Franklin Templeton Investments; Vice President, Franklin Templeton Distributors, Inc. and Franklin | ||||
| Alternative Strategies Advisers, LLC; and officer of 44 of the investment companies in Franklin Templeton Investments. | ||||
48 Annual Report
franklintempleton.com
FRANKLIN MUTUAL GLOBAL DISCOVERY FUND
| Interested Board Members and Officers (continued) | ||||
| Number of Portfolios in | ||||
| Name, Year of Birth | Length of | Fund Complex Overseen | Other Directorships Held | |
| and Address | Position | Time Served | by Board Member* | During at Least the Past 5 Years |
| Selena L. Holmes (1965) | Vice | Since 2012 | Not Applicable | Not Applicable |
| 100 Fountain Parkway | President – | |||
| St. Petersburg, FL 33716-1205 | AML | |||
| Compliance | ||||
| Principal Occupation During at Least the Past 5 Years: | ||||
| Director, Global Compliance Monitoring; Chief Compliance Officer, Franklin Alternative Strategies Advisers, LLC; Vice President, Franklin | ||||
| Templeton Companies, LLC; and officer of 44 of the investment companies in Franklin Templeton Investments. | ||||
| Robert G. Kubilis (1973) | Treasurer, | Since 2012 | Not Applicable | Not Applicable |
| 300 S.E. 2nd Street | Chief | |||
| Fort Lauderdale, FL 33301-1923 | Financial | |||
| Officer and | ||||
| Chief | ||||
| Accounting | ||||
| Officer | ||||
| Principal Occupation During at Least the Past 5 Years: | ||||
| Treasurer, U.S. Fund Administration & Reporting, Franklin Templeton Investments; and officer of four of the investment companies in Franklin | ||||
| Templeton Investments. | ||||
| Kimberly H. Novotny (1972) | Vice | Since 2013 | Not Applicable | Not Applicable |
| 300 S.E. 2nd Street | President | |||
| Fort Lauderdale, FL 33301-1923 | ||||
| Principal Occupation During at Least the Past 5 Years: | ||||
| Associate General Counsel, Franklin Templeton Investments; Vice President, Fiduciary Trust International of the South and Templeton | ||||
| Investment Counsel, LLC; Assistant Secretary, Franklin Resources, Inc.; and officer of 44 of the investment companies in Franklin Templeton | ||||
| Investments. | ||||
| Robert C. Rosselot (1960) | Chief | Since 2013 | Not Applicable | Not Applicable |
| 300 S.E. 2nd Street | Compliance | |||
| Fort Lauderdale, FL 33301-1923 | Officer | |||
| Principal Occupation During at Least the Past 5 Years: | ||||
| Director, Global Compliance, Franklin Templeton Investments; Vice President, Franklin Templeton Companies, LLC; officer of 44 of the | ||||
| investment companies in Franklin Templeton Investments; and formerly, Senior Associate General Counsel, Franklin Templeton Investments | ||||
| (2007-2013); and Secretary and Vice President, Templeton Group of Funds (2004-2013). | ||||
| Karen L. Skidmore (1952) | Vice | Since 2009 | Not Applicable | Not Applicable |
| One Franklin Parkway | President | |||
| San Mateo, CA 94403-1906 | ||||
| Principal Occupation During at Least the Past 5 Years: | ||||
| Senior Associate General Counsel, Franklin Templeton Investments; and officer of 44 of the investment companies in Franklin Templeton | ||||
| Investments. | ||||
| Navid Tofigh (1972) | Vice | Since | Not Applicable | Not Applicable |
| One Franklin Parkway | President | November 2015 | ||
| San Mateo, CA 94403-1906 | ||||
| Principal Occupation During at Least the Past 5 Years: | ||||
| Associate General Counsel, Franklin Templeton Investments; and officer of 44 of the investment companies in Franklin Templeton | ||||
| Investments. | ||||
franklintempleton.com
Annual Report
49
FRANKLIN MUTUAL GLOBAL DISCOVERY FUND
| Interested Board Members and Officers (continued) | ||||
| Number of Portfolios in | ||||
| Name, Year of Birth | Length of | Fund Complex Overseen | Other Directorships Held | |
| and Address | Position | Time Served | by Board Member* | During at Least the Past 5 Years |
| Craig S. Tyle (1960) | Vice | Since 2005 | Not Applicable | Not Applicable |
| One Franklin Parkway | President | |||
| San Mateo, CA 94403-1906 | ||||
| Principal Occupation During at Least the Past 5 Years: | ||||
| General Counsel and Executive Vice President, Franklin Resources, Inc.; and officer of some of the other subsidiaries of Franklin Resources, | ||||
| Inc. and of 44 of the investment companies in Franklin Templeton Investments. | ||||
| Lori A. Weber (1964) | Vice | Since 2011 | Not Applicable | Not Applicable |
| 300 S.E. 2nd Street | President | |||
| Fort Lauderdale, FL 33301-1923 | ||||
| Principal Occupation During at Least the Past 5 Years: | ||||
| Senior Associate General Counsel, Franklin Templeton Investments; Assistant Secretary, Franklin Resources, Inc.; Vice President and | ||||
| Secretary, Templeton Investment Counsel, LLC; and officer of 44 of the investment companies in Franklin Templeton Investments. | ||||
*We base the number of portfolios on each separate series of the U.S. registered investment companies within the Franklin Templeton Investments fund complex. These
portfolios have a common investment manager or affiliated investment managers.
**Gregory E. Johnson is considered to be an interested person of the Fund under the federal securities laws due to his position as an officer and director of Franklin
Resources, Inc., which is the parent company of the Fund’s investment manager and distributor. Peter A. Langerman is considered to be an interested person of the Fund
under the federal securities laws due to his position as an officer of Franklin Mutual Advisers, LLC, which is an affiliate of the Fund’s investment manager.
Note 1: Officer information is current as of the date of this report. It is possible that after this date, information about officers may change.
The Fund’s Board has determined that certain of the members of the Audit Committee, including Ann Torre Bates, are audit committee financial experts, and
“independent,” under those provisions of the Sarbanes-Oxley Act of 2002, and the rules and form amendments adopted by the Securities and Exchange
Commission, relating to audit committee financial experts.
The Statement of Additional Information (SAI) includes additional information about the board members and is available, without charge, upon request.
Shareholders may call (800) DIAL BEN/342-5236 to request the SAI.
50 Annual Report
franklintempleton.com
FRANKLIN MUTUAL GLOBAL DISCOVERY FUND
Shareholder Information
Proxy Voting Policies and Procedures
The Fund’s investment manager has established Proxy Voting Policies and Procedures (Policies) that the Fund uses to determine how to vote proxies relating to portfolio securities. Shareholders may view the Fund’s complete Policies online at franklintempleton.com. Alternatively, shareholders may request copies of the Policies free of charge by calling the Proxy Group collect at (954) 527-7678 or by sending a written request to: Franklin Templeton Companies, LLC, 300 S.E. 2nd Street, Fort Lauderdale, FL 33301, Attention: Proxy Group. Copies of the Fund’s proxy voting records are also made available online at franklintempleton.com and posted on the U.S. Securities and Exchange Commission’s website at sec.gov and reflect the most recent 12-month period ended June 30.
Quarterly Statement of Investments
The Fund files a complete statement of investments with the U.S. Securities and Exchange Commission for the first and third quarters for each fiscal year on Form N-Q. Shareholders may view the filed Form N-Q by visiting the Commission’s website at sec.gov. The filed form may also be viewed and copied at the Commission’s Public Reference Room in Washington, DC. Information regarding the operations of the Public Reference Room may be obtained by calling (800) SEC-0330.
Householding of Reports and Prospectuses
You will receive the Fund’s financial reports every six months as well as an annual updated summary prospectus (prospectus available upon request). To reduce Fund expenses, we try to identify related shareholders in a household and send only one copy of the financial reports and summary prospectus. This process, called “householding,” will continue indefinitely unless you instruct us otherwise. If you prefer not to have these documents householded, please call us at (800) 632-2301. At any time you may view current prospectuses/summary prospectuses and financial reports on our website. If you choose, you may receive these documents through electronic delivery.
Annual Report
51
This page intentionally left blank

| Contents | |
| Annual Report | |
| Franklin Mutual International Fund | 3 |
| Performance Summary | 8 |
| Your Fund’s Expenses | 13 |
| Financial Highlights and Statement of Investments | 15 |
| Financial Statements | 26 |
| Notes to Financial Statements | 30 |
| Report of Independent Registered | |
| Public Accounting Firm | 42 |
| Tax Information | 43 |
| Board Members and Officers | 44 |
| Shareholder Information | 49 |
Visit franklintempleton.com for fund updates, to access your account, or to find helpful financial planning tools.
2 Annual Report
franklintempleton.com
Annual Report
Franklin Mutual International Fund
This annual report for Franklin Mutual International Fund covers the fiscal year ended December 31, 2015.
Your Fund’s Goals and Main Investments
The Fund seeks capital appreciation, which may occasionally be short term, with income as a secondary goal. The Fund normally invests at least 80% of its net assets in securities of non-U.S. issuers that we believe are available at prices less than their intrinsic value. The Fund invests, to a lesser extent, in merger arbitrage securities and distressed companies.
Performance Overview
The Fund’s Class Z shares delivered a +0.15% cumulative total return for the 12 months ended December 31, 2015. In comparison, the Fund’s benchmark, the MSCI Europe, Australasia, Far East (EAFE) Index Net Return (Local Currency), which measures equity performance in global developed markets outside the U.S. and Canada, generated a total return of +5.33%.1 You can find more of the Fund’s performance data in the Performance Summary beginning on page 8.
Performance data represent past performance, which does not guarantee future results. Investment return and principal value will fluctuate, and you may have a gain or loss when you sell your shares. Current performance may differ from figures shown. For most recent month-end performance, go to franklintempleton.com or call (800) 342-5236.
Economic and Market Overview
The global economy expanded moderately during the 12 months under review. As measured by the MSCI World Index, stocks in global developed markets overall were down slightly for the year despite some positive developments. Weighing on global stocks at times were worries about China’s slowing economy and tumbling stock market, declining commodity prices, geopolitical tensions between Russia and Turkey, and ongoing uncertainty over the U.S. Federal Reserve’s (Fed’s) timing for raising interest rates. Toward period-end, equity markets recovered somewhat as the Fed increased its federal funds target range for the first time in nine years, alleviating some uncertainty about a change in the U.S. monetary policy. During the year, oil prices declined sharply
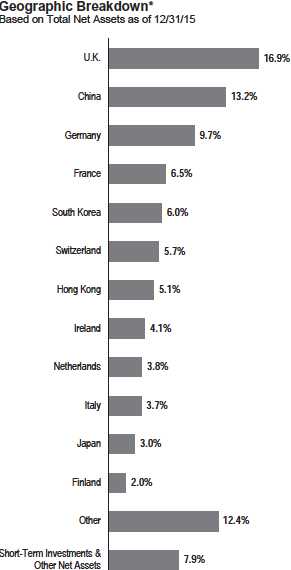
* Figures are stated as a percentage of total and may not equal 100% or may be negative due to rounding, use of any derivatives, unsettled trades or other factors.
1. Source: Morningstar.
The index is unmanaged and includes reinvestment of any income or distributions. One cannot invest directly in an index, and an index is not representative of the
Fund’s portfolio.
See www.franklintempletondatasources.com for additional data provider information.
The dollar value, number of shares or principal amount, and names of all portfolio holdings are listed in the Fund’s Statement of Investments (SOI).
The SOI begins on page 20.
franklintempleton.com
Annual Report
3
FRANKLIN MUTUAL INTERNATIONAL FUND
largely due to increased global supply that exceeded demand. Gold and other commodity prices also fell. The U.S. dollar appreciated against most currencies during the period, which reduced returns of many foreign assets in U.S. dollar terms.
In Europe, U.K. economic growth gained momentum from the services sector, but the economy slowed in 2015 compared with 2014. The eurozone grew moderately and generally benefited during the year from lower oil prices, a weaker euro that supported exports, the European Central Bank’s (ECB’s) accommodative policy and expectations of further ECB stimulus. Growth slackened in Germany and Italy, largely due to weak exports, while growth in France improved, led by higher consumer spending and business investment. Eurozone unemployment generally edged lower. Although the eurozone’s annual inflation rate declined early in the period, it rose slightly during the rest of the period. The ECB maintained its benchmark interest rates although it reduced its bank deposit rate in December, seeking to boost the region’s slowing growth.
Japan’s economy continued to grow in 2015’s first quarter. After a decline in the second quarter of 2015, it expanded in the third quarter as capital expenditures improved. The Bank of Japan took several actions during the reporting period, including maintaining its monetary policy, lowering its economic growth and inflation forecasts, and reorganizing its stimulus program to increase exposure to long-term government bonds and exchange-traded funds.
In emerging markets, economic growth generally moderated. In China, the government’s intervention to cool domestic stock market speculation and its effective currency devaluation led to a severe slump in emerging market stocks from June through August. In October, emerging market equities gained after China expanded its monetary and fiscal stimulus to support its economy. In Brazil, falling prices for energy and other commodities coincided with an economic recession, rising unemployment and political uncertainty, leading to equity weakness and currency depreciation. Emerging equity markets recovered some of their losses after the Fed increased its target interest rate in December. Central bank actions varied across emerging markets during the 12 months under review, as some banks raised interest rates in response to rising inflation and weakening currencies, while others lowered interest rates to promote economic growth. In the recent global environment, emerging market stocks overall, as measured by the MSCI Emerging Markets Index, fell for the 12-month period.
Investment Strategy
At Franklin Mutual Series, we are committed to our distinctive value approach to investing, which we believe can generate above-average risk-adjusted returns over time for our shareholders. Our major investment strategy is investing in undervalued stocks in Asia and Europe. We have the ability to invest in emerging markets, although this is unlikely to be a significant focus of our strategy. When selecting undervalued equities, we are attracted to what we believe are fundamentally strong companies with healthy balance sheets, high-quality assets, substantial free cash flow and shareholder-oriented management teams and whose stocks are trading at discounts to our assessment of the companies’ intrinsic or business value. We also look for asset-rich companies whose shares may be trading at depressed levels due to concerns over short-term earnings disappointments, litigation, management strategy or other perceived negatives. This strict value approach is not only intended to improve the likelihood of upside potential, but it is also intended to reduce the risk of substantial declines. While the vast majority of our undervalued equity investments are made in publicly traded companies internationally, we may invest occasionally in privately held companies as well.
We complement this more traditional investment strategy with two others. One is distressed investing, a highly specialized field that has proven quite profitable during certain periods over the years. Distressed investing is complex and can take many forms. The most common distressed investment the Fund undertakes is the purchase of financially troubled or bankrupt companies’ debt at a substantial discount to face value. After the financially distressed company is reorganized, the old debt is typically replaced with new securities issued by the financially stronger company.
The other piece of our investment strategy is participating in arbitrage situations, another highly specialized field. When companies announce proposed mergers or takeovers, commonly referred to as “deals,” the target company may trade at a discount to the bid it ultimately accepts. One form of arbitrage involves purchasing the target company’s stock when it is trading below the value we believe it would receive in a deal. In keeping with our commitment to a relatively conservative investment approach, we typically focus our arbitrage efforts on announced deals, and eschew rumored deals or other situations we consider relatively risky.
In addition, it is our practice to hedge the Fund’s currency exposure when we deem it advantageous for our shareholders.
What is meant by “hedge”?
To hedge an investment is to take a position intended to offset potential losses/gains that may be incurred by a companion financial instrument.
4 Annual Report
franklintempleton.com
FRANKLIN MUTUAL INTERNATIONAL FUND
Manager’s Discussion
During the 12 months under review, stocks in most global markets declined after a three-year ascent. Globally, several major central banks became more accommodative while fiscal authorities focused on budgetary discipline. Large companies also remained disciplined about operating costs, with margins at historically high levels in many industries and countries. To drive further growth, an increasing number of companies took advantage of low interest rates to finance deals. In this environment, we saw a number of opportunities.
Equity prices are typically forward looking, reflecting investors’ beliefs about how various factors and events will play out in the future. Global equity prices at period-end were down from mid-2015 highs, reflecting increased uncertainty among global investors regarding China and other emerging markets, global commodity prices, U.S. monetary policy divergence and geopolitical events. However, with the support of global quantitative easing, many corporations have been able to build strong balance sheets, focus intensely on improving efficiency, maintain historically high margins and return a significant amount of capital to shareholders.
Merger and acquisition (M&A) activity accelerated in the past 12 months, helping to support valuations. Deal volumes reached historical highs and regulators globally increased their scrutiny of potential negative effects of high concentration. Such an environment — active M&A combined with regulatory uncertainty, greater complexity and market volatility —may provide attractive investment opportunities. We seek to use a mixture of merger arbitrage positions and investments in one or both of the companies to participate in these opportunities. The traditional merger arbitrage positions are constructed solely to benefit from deal completion, while unhedged investments in one or both companies can allow the Fund to benefit from possible value creation once the deal is completed.
Distressed debt remained a difficult market in which we could find compelling new opportunities. Low interest rates have kept credit widely available, and we felt bankruptcies were limited, except in the energy and mining sectors. Increased stress in high yield markets, particularly in energy credit, has expanded the potential opportunity set for us. For non-energy firms, costs of issuing debt are climbing and these debt securities are starting to look attractive to us. Within energy, declining commodity prices increased financial pressures for a growing number of issuers. At year-end, a record level of crude oil inventories and insistence by Saudi Arabia that it will not reduce production provide little reason to expect a quick recovery in crude oil prices, implying to us
| Top 10 Sectors/Industries | ||
| Based on Equity Securities as of 12/31/15 | ||
| % of Total | ||
| Net Assets | ||
| Insurance | 15.5 | % |
| Diversified Telecommunication Services | 5.9 | % |
| Banks | 5.7 | % |
| Specialty Retail | 5.1 | % |
| Media | 4.9 | % |
| Pharmaceuticals | 4.5 | % |
| Real Estate Management & Development | 3.8 | % |
| Auto Components | 3.3 | % |
| Hotels, Restaurants & Leisure | 3.2 | % |
| Air Freight and Logistics | 3.1 | % |
an increased likelihood of new investment opportunities in energy sector debt.
Turning to Fund performance, top contributors included insurers Direct Line Insurance Group, NN Group and Ageas.
U.K.-based Direct Line Insurance Group achieved strong cash flow generation in 2015. Amid a bottoming price environment, the company focused on disciplined underwriting and lowering expenses. Such discipline resulted in a decline in new policies written and improved profitability as evidenced by the August release of better-than-expected first-half results showing earnings across all business segments exceeded expectations. The stock also had risen in May after the announcement of a special dividend to be paid following the sale of its international division, and the dividend was paid in July 2015.
NN Group is a Dutch insurer spun out of ING Groep. The company followed through successfully on its efforts to reduce expenses and improve return on equity, a measure of the amount earned on a company’s common stock investment. Results for several quarters were positive, and the company stated in November that it had reached its expense savings target a year early but would continue to push for further efficiencies. The company also periodically repurchased shares from ING Groep to help meet ING’s goal to fully divest its insurance and investment management holdings by the end of 2016, as required under ING’s restructuring agreement with the European Commission.
Headquartered in Belgium, Ageas is a diversified insurer with operations in Europe and Asia. The company’s stock price rose in 2015 as Ageas improved its underlying insurance results while focusing on cash generation. The company disclosed a solid capital position under new eurozone capitalization guidelines for insurers, reassuring investors. In late August, Ageas
franklintempleton.com
Annual Report 5
FRANKLIN MUTUAL INTERNATIONAL FUND
announced the sale of its Hong Kong life insurance business at a valuation that, in our view, was quite favorable.
During the period under review, some of the Fund’s investments that negatively affected performance were China Telecom, coal producer China Shenhua Energy and broadcaster Societe Television Francaise 1.
China Telecom is a state-owned telecommunications company operating the country’s largest fixed-line service and one of the largest mobile phone networks. The company’s stock followed China’s broad equity market decline that occurred mid-year. Also hurting the telecommunications sector were intensified mobile competition and new government guidelines intended to motivate China’s major telecommunications firms to improve broadband networks and to lower mobile data pricing. Despite the price decline in 2015, we maintained a favorable view of the stock as China Telecom was aggressively rolling out a 4G network that could, in our analysis, enable the company to gain market share and migrate subscribers to higher revenue data services.
China Shenhua Energy is an integrated coal miner and a low-cost coal producer in China that also owns transport infrastructure and coal-fired power plants. The company’s stock was negatively impacted by the price decline in China’s thermal coal and the country’s slower economic growth. However, we believed China’s coal price was approaching a bottom as many industry players incurred heavy losses. Moreover, we believed that industry supply and demand conditions in China were likely to improve further, based on a recovering real estate sector and a stronger government commitment to eliminate production that results in economic losses.
Societe Television Francaise 1 is a French broadcasting and communication services company. A weak advertising environment and shrinking audience share for the company’s TF1 channel hurt the stock price. In July, Television Francaise 1 sold its remaining stake in Eurosport to Discovery Communications in exchange for cash and the minority stakes of three French pay-TV stations that Television Francaise 1 had sold to Discovery Communications in 2012. Eurosport accounted for nearly 11% of net income for Television Francaise 1, but the sports network was also a non-core asset approaching a period of increased costs. Shares of Television Francaise 1 and other private broadcasters also retreated in September after the French foreign minister proposed lifting an advertising ban on public channels. Instead, the government increased the television license fee and a telecommunication operator tax. Although maintaining the ban was positive for private broadcasters, the serious consideration raised investors’ concerns about potential regulatory risks.
| Top 10 Equity Holdings | ||
| 12/31/15 | ||
| Company | % of Total | |
| Sector/Industry, Country | Net Assets | |
| NN Group NV | 2.0 | % |
| Insurance, Netherlands | ||
| Novartis AG | 2.0 | % |
| Pharmaceuticals, Switzerland | ||
| Deutsche Telekom AG | 1.9 | % |
| Diversified Telecommunication Services, Germany | ||
| XL Group PLC | 1.9 | % |
| Insurance, Ireland | ||
| Volkswagen AG, pfd. | 1.9 | % |
| Automobiles, Germany | ||
| Vodafone Group PLC | 1.8 | % |
| Wireless Telecommunication Services, U.K. | ||
| Liberty Global PLC, C | 1.8 | % |
| Media, U.K. | ||
| Accor SA | 1.8 | % |
| Hotels, Restaurants & Leisure, France | ||
| Dalian Wanda Commercial Properties Co. Ltd., H | 1.8 | % |
| Real Estate Management & Development, China | ||
| Koninklijke Philips NV | 1.8 | % |
| Industrial Conglomerates, Netherlands |
During the year, the Fund held currency forwards and futures to hedge a portion of the currency risk of the portfolio’s non-U.S. dollar investments. The currency forwards had a positive impact on the Fund’s performance during the period, and currency futures had a negligible impact.
What is a currency forward contract?
A currency forward contract, or a currency forward, is an agreement between the Fund and a counterparty to buy or sell a foreign currency at a specific exchange rate on a future date.
What is a futures contract?
A futures contract, or a future, is an agreement between the Fund and a counterparty made through a U.S. or foreign futures exchange to buy or sell an underlying instrument or asset at a specific price on a future date.
As fellow shareholders, we found recent relative and absolute performance disappointing, but it is not uncommon for our strategy to lag the equity markets at times. We remain committed to our disciplined, value investment approach as we seek to generate attractive, long-term, risk-adjusted returns for shareholders.
6 Annual Report
franklintempleton.com
FRANKLIN MUTUAL INTERNATIONAL FUND
Thank you for your continued participation in Franklin Mutual International Fund. We look forward to continuing to serve your investment needs.

The foregoing information reflects our analysis, opinions and portfolio holdings as of December 31, 2015, the end of the reporting period. The way we implement our main investment strategies and the resulting portfolio holdings may change depending on factors such as market and economic conditions. These opinions may not be relied upon as investment advice or an offer for a particular security. The information is not a complete analysis of every aspect of any market, country, industry, security or the Fund. Statements of fact are from sources considered reliable, but the investment manager makes no representation or warranty as to their completeness or accuracy. Although historical performance is no guarantee of future results, these insights may help you understand our investment management philosophy.
Philippe Brugere-Trelat has been a co-portfolio manager for Franklin Mutual International Fund since 2009.
Mr. Brugere-Trelat has also served as lead portfolio manager for Franklin Mutual European Fund since 2005 and as portfolio manager for Franklin Mutual Global Discovery Fund since 2009. He has been a member of the management team of the Franklin Mutual Series Funds since 2004, when he rejoined Franklin Templeton Investments. Previously, he was president and portfolio manager of Eurovest. Between 1984 and 1994, Mr. Brugere-Trelat was employed at Heine Securities Corporation, the Fund’s former manager.
Andrew Sleeman has been a co-portfolio manager for Franklin Mutual International Fund since 2009. He has also served as lead portfolio manager for Franklin Mutual Financial Services Fund since 2009. Mr. Sleeman joined Franklin Templeton Investments in 2007. Previously, he was with Fox-Pitt, Kelton, a financials specialist firm, where he focused on international financial equities. Prior to that, he worked in international equities at BNP Paribas. Mr. Sleeman also worked in Australia in the fixed income division of JP Morgan Investment Management.
CFA® is a trademark owned by CFA Institute.
franklintempleton.com
Annual Report 7
FRANKLIN MUTUAL INTERNATIONAL FUND
Performance Summary as of December 31, 2015
Your dividend income will vary depending on dividends or interest paid by securities in the Fund’s portfolio, adjusted for operating expenses of each class. Capital gain distributions are net profits realized from the sale of portfolio securities. The performance table and graphs do not reflect any taxes that a shareholder would pay on Fund dividends, capital gain distributions, if any, or any realized gains on the sale of Fund shares. Total return reflects reinvestment of the Fund’s dividends and capital gain distributions, if any, and any unrealized gains or losses.
| Net Asset Value | ||||||||
| Share Class (Symbol) | 12/31/15 | 12/31/14 | Change | |||||
| Z (FMIZX) | $ | 14.17 | $ | 14.59 | -$ | 0.42 | ||
| A (FMIAX) | $ | 14.10 | $ | 14.54 | -$ | 0.44 | ||
| C (FCMIX) | $ | 13.92 | $ | 14.38 | -$ | 0.46 | ||
| R (FRMIX) | $ | 14.05 | $ | 14.51 | -$ | 0.46 | ||
| R6 (FIMFX) | $ | 14.17 | $ | 14.59 | -$ | 0.42 | ||
| Distributions1 (1/1/15–12/31/15) | ||||||||
| Dividend | Short-Term | Long-Term | ||||||
| Share Class | Income | Capital Gain | Capital Gain | Total | ||||
| Z | $ | 0.1608 | $ | 0.0823 | $ | 0.1858 | $ | 0.4289 |
| A | $ | 0.1307 | $ | 0.0823 | $ | 0.1858 | $ | 0.3988 |
| C | $ | 0.0477 | $ | 0.0823 | $ | 0.1858 | $ | 0.3158 |
| R | $ | 0.1260 | $ | 0.0823 | $ | 0.1858 | $ | 0.3941 |
| R6 | $ | 0.1724 | $ | 0.0823 | $ | 0.1858 | $ | 0.4405 |
See page 12 for Performance Summary footnotes.
8 Annual Report
franklintempleton.com
FRANKLIN MUTUAL INTERNATIONAL FUND
PERFORMANCE SUMMARY
Performance as of 12/31/152
Cumulative total return excludes sales charges. Average annual total return and value of $10,000 investment include maximum sales charges. Class Z/R/R6: no sales charges; Class A: 5.75% maximum initial sales charge; Class C: 1% contingent deferred sales charge in first year only.
| Cumulative | Average Annual | Value of $10,000 | Total Annual Operating Expenses6 | |||||||
| Share Class | Total Return3 | Total Return4 | Investment5 | (with waiver) | (without waiver) | |||||
| Z | 1.17 | % | 1.39 | % | ||||||
| 1-Year | +0.15 | % | +0.15 | % | $ | 10,015 | ||||
| 5-Year | +21.96 | % | +4.05 | % | $ | 12,196 | ||||
| Since Inception (5/1/09) | +80.22 | % | +9.23 | % | $ | 18,022 | ||||
| A | 1.47 | % | 1.69 | % | ||||||
| 1-Year | -0.20 | % | -5.96 | % | $ | 9,404 | ||||
| 5-Year | +20.11 | % | +2.51 | % | $ | 11,321 | ||||
| Since Inception (5/1/09) | +76.65 | % | +7.94 | % | $ | 16,649 | ||||
| C | 2.17 | % | 2.39 | % | ||||||
| 1-Year | -0.93 | % | -1.90 | % | $ | 9,810 | ||||
| 5-Year | +15.93 | % | +3.00 | % | $ | 11,593 | ||||
| Since Inception (5/1/09) | +68.41 | % | +8.13 | % | $ | 16,841 | ||||
| R | 1.67 | % | 1.89 | % | ||||||
| 1-Year | -0.38 | % | -0.38 | % | $ | 9,962 | ||||
| 5-Year | +18.89 | % | +3.52 | % | $ | 11,889 | ||||
| Since Inception (5/1/09) | +74.17 | % | +8.68 | % | $ | 17,417 | ||||
| R6 | 1.02 | % | 1.24 | % | ||||||
| 1-Year | +0.23 | % | +0.23 | % | $ | 10,023 | ||||
| Since Inception (5/1/13) | +12.68 | % | +4.58 | % | $ | 11,268 | ||||
Performance data represent past performance, which does not guarantee future results. Investment return and principal value will fluctuate, and you may have a gain or loss when you sell your shares. Current performance may differ from figures shown. For most recent month-end performance, go to franklintempleton.com or call (800) 342-5236.
See page 12 for Performance Summary footnotes.
franklintempleton.com
Annual Report 9
FRANKLIN MUTUAL INTERNATIONAL FUND
PERFORMANCE SUMMARY
Total Return Index Comparison for a Hypothetical $10,000 Investment2
Total return represents the change in value of an investment over the periods shown. It includes any applicable maximum sales charge, Fund expenses, account fees and reinvested distributions. The unmanaged indexes include reinvestment of any income or distributions. They differ from the Fund in composition and does not pay management fees or expenses. One cannot invest directly in an index.
See page 12 for Performance Summary footnotes.
10 Annual Report
franklintempleton.com
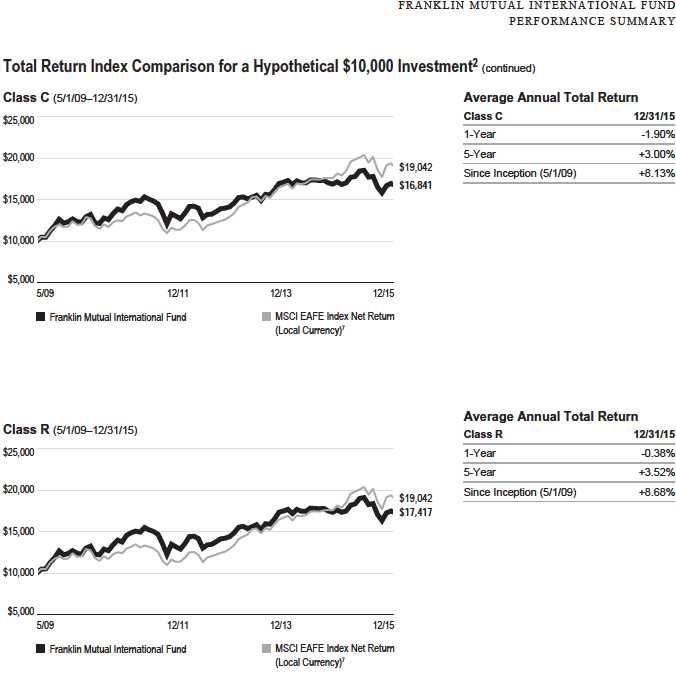
See page 12 for Performance Summary footnotes.
franklintempleton.com
Annual Report
11
FRANKLIN MUTUAL INTERNATIONAL FUND
PERFORMANCE SUMMARY
Total Return Index Comparison for a Hypothetical $10,000 Investment2 (continued)

All investments involve risks, including possible loss of principal. Value securities may not increase in price as anticipated or may decline further in value. Special risks are associated with foreign investing, including currency fluctuations, economic instability and political developments. Because the Fund invests its assets primarily in companies in a specific region, it is subject to greater risks of adverse developments in that region and/or the surrounding regions than a fund that is more broadly diversified geographically. Political, social or economic disruptions in the region, even in countries in which the Fund is not invested, may adversely affect the value of securities held by the Fund. The Fund’s investments in smaller company stocks carry an increased risk of price fluctuation, especially over the short term. The Fund’s investments in companies engaged in mergers, reorganizations or liquidations also involve special risks as pending deals may not be completed on time or on favorable terms. The Fund is actively managed but there is no guarantee that the manager’s investment decisions will produce the desired results. The Fund’s prospectus also includes a description of the main investment risks.
Class Z: Class C: Class R: Class R6: | Shares are available to certain eligible investors as described in the prospectus. These shares have higher annual fees and expenses than Class A shares. Shares are available to certain eligible investors as described in the prospectus. These shares have higher annual fees and expenses than Class A shares. Shares are available to certain eligible investors as described in the prospectus. |
1. The distribution amount is the sum of the dividend payments to shareholders for the period shown and includes only estimated tax-basis net investment income and
capital gain.
2. The Fund has an expense reduction contractually guaranteed through at least 4/30/16. The transfer agent has contractually agreed to cap transfer agency fees for Class R6
shares so that transfer agency fees for that class do not exceed 0.01% until at least 4/30/16. Investment results reflect the expense reduction and fee cap, to the extent appli-
cable; without these reductions, the results would have been lower.
3. Cumulative total return represents the change in value of an investment over the periods indicated.
4. Average annual total return represents the average annual change in value of an investment over the periods indicated. Return for less than one year, if any, has not
been annualized.
5. These figures represent the value of a hypothetical $10,000 investment in the Fund over the periods indicated.
6. Figures are as stated in the Fund’s current prospectus. In periods of market volatility, assets may decline significantly, causing total annual Fund operating expenses to
become higher than the figures shown.
7. Source: Morningstar. The MSCI EAFE Index Net Return (Local Currency) is a free float-adjusted, market capitalization-weighted index designed to measure equity market
performance in global developed markets excluding the U.S. and Canada.
See www.franklintempletondatasources.com for additional data provider information.
12 Annual Report
franklintempleton.com
FRANKLIN MUTUAL INTERNATIONAL FUND
Your Fund’s Expenses
As a Fund shareholder, you can incur two types of costs:
- Transaction costs, including sales charges (loads) on Fund purchases; and
- Ongoing Fund costs, including management fees, distribu- tion and service (12b-1) fees, and other Fund expenses. All mutual funds have ongoing costs, sometimes referred to as operating expenses.
The following table shows ongoing costs of investing in the Fund and can help you understand these costs and compare them with those of other mutual funds. The table assumes a $1,000 investment held for the six months indicated.
Actual Fund Expenses
The first line (Actual) for each share class listed in the table provides actual account values and expenses. The “Ending Account Value” is derived from the Fund’s actual return, which includes the effect of Fund expenses.
You can estimate the expenses you paid during the period by following these steps. Of course, your account value and expenses will differ from those in this illustration:
1. Divide your account value by $1,000.
If an account had an $8,600 value, then $8,600 ÷ $1,000 = 8.6.
2. Multiply the result by the number under the heading “Expenses Paid During Period.”
If Expenses Paid During Period were $7.50, then 8.6 × $7.50 = $64.50.
In this illustration, the estimated expenses paid this period are $64.50.
Hypothetical Example for Comparison with Other Funds
Information in the second line (Hypothetical) for each class in the table can help you compare ongoing costs of investing in the Fund with those of other mutual funds. This information may not be used to estimate the actual ending account balance or expenses you paid during the period. The hypothetical “Ending Account Value” is based on the actual expense ratio for each class and an assumed 5% annual rate of return before expenses, which does not represent the Fund’s actual return. The figure under the heading “Expenses Paid During Period” shows the hypothetical expenses your account would have incurred under this scenario. You can compare this figure with the 5% hypothetical examples that appear in shareholder reports of other funds.
Please note that expenses shown in the table are meant to highlight ongoing costs and do not reflect any transaction costs, such as sales charges. Therefore, the second line for each class is useful in comparing ongoing costs only, and will not help you compare total costs of owning different funds. In addition, if transaction costs were included, your total costs would have been higher. Please refer to the Fund prospectus for additional information on operating expenses.
franklintempleton.com
Annual Report
13
| FRANKLIN MUTUAL INTERNATIONAL FUND |
| YOUR FUND’S EXPENSES |
| Beginning Account | Ending Account | Expenses Paid During | ||||
| Share Class | Value 7/1/15 | Value 12/31/15 | Period* 7/1/15–12/31/15 | |||
| Z | ||||||
| Actual | $ | 1,000 | $ | 946.30 | $ | 5.64 |
| Hypothetical (5% return before expenses) | $ | 1,000 | $ | 1,019.41 | $ | 5.85 |
| A | ||||||
| Actual | $ | 1,000 | $ | 944.70 | $ | 6.91 |
| Hypothetical (5% return before expenses) | $ | 1,000 | $ | 1,018.10 | $ | 7.17 |
| C | ||||||
| Actual | $ | 1,000 | $ | 940.90 | $ | 10.52 |
| Hypothetical (5% return before expenses) | $ | 1,000 | $ | 1,014.37 | $ | 10.92 |
| R | ||||||
| Actual | $ | 1,000 | $ | 944.20 | $ | 8.09 |
| Hypothetical (5% return before expenses) | $ | 1,000 | $ | 1,016.89 | $ | 8.39 |
| R6 | ||||||
| Actual | $ | 1,000 | $ | 947.10 | $ | 5.01 |
| Hypothetical (5% return before expenses) | $ | 1,000 | $ | 1,020.06 | $ | 5.19 |
*Expenses are calculated using the most recent six-month expense ratio, net of expense waivers, annualized for each class (Z: 1.15%; A: 1.41%;
C: 2.15%; R: 1.65% and R6: 1.02%), multiplied by the average account value over the period, multiplied by 184/365 to reflect the one-half year period.
14 Annual Report
franklintempleton.com
| FRANKLIN MUTUAL INTERNATIONAL FUND | |||||||||||||||
| Financial Highlights | |||||||||||||||
| Year Ended December 31, | |||||||||||||||
| 2015 | 2014 | 2013 | 2012 | 2011 | |||||||||||
| Class Z | |||||||||||||||
| Per share operating performance | |||||||||||||||
| (for a share outstanding throughout the year) | |||||||||||||||
| Net asset value, beginning of year | $ | 14.59 | $ | 15.90 | $ | 13.58 | $ | 11.83 | $ | 13.81 | |||||
| Income from investment operationsa: | |||||||||||||||
| Net investment incomeb | 0.18 | c | 0.30 | d | 0.24 | 0.24 | 0.28 | ||||||||
| Net realized and unrealized gains (losses) | (0.17 | ) | (0.57 | ) | 2.42 | 1.68 | (1.81 | ) | |||||||
| Total from investment operations | 0.01 | (0.27 | ) | 2.66 | 1.92 | (1.53 | ) | ||||||||
| Less distributions from: | |||||||||||||||
| Net investment income | (0.16 | ) | (0.43 | ) | (0.24 | ) | (0.15 | ) | (0.30 | ) | |||||
| Net realized gains | (0.27 | ) | (0.61 | ) | (0.10 | ) | (0.02 | ) | (0.15 | ) | |||||
| Total distributions | (0.43 | ) | (1.04 | ) | (0.34 | ) | (0.17 | ) | (0.45 | ) | |||||
| Net asset value, end of year | $ | 14.17 | $ | 14.59 | $ | 15.90 | $ | 13.58 | $ | 11.83 | |||||
| Total return | 0.15 | % | (1.63 | )% | 19.71 | % | 16.30 | % | (11.08 | )% | |||||
| Ratios to average net assets | |||||||||||||||
| Expenses before waiver, payments by affiliates and expense reductione | 1.24 | % | 1.39 | % | 1.49 | % | 1.75 | % | 1.80 | % | |||||
| Expenses net of waiver, payments by affiliates and expense reductione | 1.15 | %f | 1.16 | %f | 1.17 | %f | 1.17 | % | 1.17 | % | |||||
| Expenses incurred in connection with securities sold short | —% | —%g | —% | —% | —% | ||||||||||
| Net investment income | 1.26 | %c | 1.78 | %d | 1.64 | % | 1.70 | % | 2.12 | % | |||||
| Supplemental data | |||||||||||||||
| Net assets, end of year (000’s) | $ | 49,963 | $ | 19,940 | $ | 14,732 | $ | 10,354 | $ | 6,977 | |||||
| Portfolio turnover rate | 28.64 | % | 54.78 | % | 41.47 | % | 27.97 | % | 41.26 | % | |||||
aThe amount shown for a share outstanding throughout the period may not correlate with the Statement of Operations for the period due to the timing of sales and repurchases
of the Fund’s shares in relation to income earned and/or fluctuating fair value of the investments of the Fund.
bBased on average daily shares outstanding.
cNet investment income per share includes approximately $0.08 per share related to income received in the form of a special dividend in connection with certain Fund
holdings. Excluding this amount, the ratio of net investment income to average net assets would have been 0.71%.
dNet investment income per share includes approximately $0.08 per share related to income received in the form of a special dividend in connection with certain Fund
holdings. Excluding this amount, the ratio of net investment income to average net assets would have been 1.27%.
eIncludes dividend and/or interest expense on securities sold short and security borrowing fees, if any. See below for the ratios of such expenses to average net assets for the
periods presented. See Note 1(f).
fBenefit of expense reduction rounds to less than 0.01%.
gRounds to less than 0.01%.
franklintempleton.com
The accompanying notes are an integral part of these financial statements. | Annual Report 15
FRANKLIN MUTUAL INTERNATIONAL FUND
FINANCIAL H IGHLIGHTS
| Year Ended December 31, | |||||||||||||||
| 2015 | 2014 | 2013 | 2012 | 2011 | |||||||||||
| Class A | |||||||||||||||
| Per share operating performance | |||||||||||||||
| (for a share outstanding throughout the year) | |||||||||||||||
| Net asset value, beginning of year | $ | 14.54 | $ | 15.84 | $ | 13.54 | $ | 11.81 | $ | 13.78 | |||||
| Income from investment operationsa: | |||||||||||||||
| Net investment incomeb | 0.15 | c | 0.26 | d | 0.20 | 0.18 | 0.24 | ||||||||
| Net realized and unrealized gains (losses) | (0.19 | ) | (0.57 | ) | 2.41 | 1.70 | (1.80 | ) | |||||||
| Total from investment operations | (0.04 | ) | (0.31 | ) | 2.61 | 1.88 | (1.56 | ) | |||||||
| Less distributions from: | |||||||||||||||
| Net investment income | (0.13 | ) | (0.38 | ) | (0.21 | ) | (0.13 | ) | (0.26 | ) | |||||
| Net realized gains | (0.27 | ) | (0.61 | ) | (0.10 | ) | (0.02 | ) | (0.15 | ) | |||||
| Total distributions | (0.40 | ) | (0.99 | ) | (0.31 | ) | (0.15 | ) | (0.41 | ) | |||||
| Net asset value, end of year | $ | 14.10 | $ | 14.54 | $ | 15.84 | $ | 13.54 | $ | 11.81 | |||||
| Total returne | (0.20 | )% | (1.89 | )% | 19.34 | % | 16.01 | % | (11.39 | )% | |||||
| Ratios to average net assets | |||||||||||||||
| Expenses before waiver, payments by affiliates and expense reductionf | 1.52 | % | 1.69 | % | 1.79 | % | 2.05 | % | 2.11 | % | |||||
| Expenses net of waiver, payments by affiliates and expense reductionf | 1.43 | %g | 1.46 | %g | 1.47 | %g | 1.47 | % | 1.48 | % | |||||
| Expenses incurred in connection with securities sold short | —% | —%h | —% | —% | —% | ||||||||||
| Net investment income | 0.98 | %c | 1.48 | %d | 1.34 | % | 1.40 | % | 1.81 | % | |||||
| Supplemental data | |||||||||||||||
| Net assets, end of year (000’s) | $ | 110,591 | $ | 39,810 | $ | 35,319 | $ | 18,221 | $ | 9,212 | |||||
| Portfolio turnover rate | 28.64 | % | 54.78 | % | 41.47 | % | 27.97 | % | 41.26 | % | |||||
aThe amount shown for a share outstanding throughout the period may not correlate with the Statement of Operations for the period due to the timing of sales and repurchases
of the Fund’s shares in relation to income earned and/or fluctuating fair value of the investments of the Fund.
bBased on average daily shares outstanding.
cNet investment income per share includes approximately $0.08 per share related to income received in the form of special dividends in connection with certain Fund holdings.
Excluding this amount, the ratio of net investment income to average net assets would have been 0.43%.
dNet investment income per share includes approximately $0.08 per share related to income received in the form of a special dividend in connection with certain Fund hold-
ings. Excluding this amount, the ratio of net investment income to average net assets would have been 0.97%.
eTotal return does not reflect sales commissions or contingent deferred sales charges, if applicable.
fIncludes dividend and/or interest expense on securities sold short and security borrowing fees, if any. See below for the ratios of such expenses to average net assets for the
periods presented. See Note 1(f).
gBenefit of expense reduction rounds to less than 0.01%.
hRounds to less than 0.01%.
16 Annual Report | The accompanying notes are an integral part of these financial statements.
franklintempleton.com
FRANKLIN MUTUAL INTERNATIONAL FUND
FINANCIAL H IGHLIGHTS
| Year Ended December 31, | |||||||||||||||
| 2015 | 2014 | 2013 | 2012 | 2011 | |||||||||||
| Class C | |||||||||||||||
| Per share operating performance | |||||||||||||||
| (for a share outstanding throughout the year) | |||||||||||||||
| Net asset value, beginning of year | $ | 14.38 | $ | 15.68 | $ | 13.41 | $ | 11.74 | $ | 13.71 | |||||
| Income from investment operationsa: | |||||||||||||||
| Net investment incomeb | 0.04 | c | 0.15 | d | 0.10 | 0.05 | 0.14 | ||||||||
| Net realized and unrealized gains (losses) | (0.18 | ) | (0.56 | ) | 2.38 | 1.72 | (1.78 | ) | |||||||
| Total from investment operations | (0.14 | ) | (0.41 | ) | 2.48 | 1.77 | (1.64 | ) | |||||||
| Less distributions from: | |||||||||||||||
| Net investment income | (0.05 | ) | (0.28 | ) | (0.11 | ) | (0.08 | ) | (0.18 | ) | |||||
| Net realized gains | (0.27 | ) | (0.61 | ) | (0.10 | ) | (0.02 | ) | (0.15 | ) | |||||
| Total distributions | (0.32 | ) | (0.89 | ) | (0.21 | ) | (0.10 | ) | (0.33 | ) | |||||
| Net asset value, end of year | $ | 13.92 | $ | 14.38 | $ | 15.68 | $ | 13.41 | $ | 11.74 | |||||
| Total returne | (0.93 | )% | (2.58 | )% | 18.54 | % | 15.14 | % | (11.98 | )% | |||||
| Ratios to average net assets | |||||||||||||||
| Expenses before waiver, payments by affiliates and expense reductionf | 2.24 | % | 2.39 | % | 2.49 | % | 2.75 | % | 2.80 | % | |||||
| Expenses net of waiver, payments by affiliates and expense reductionf | 2.15 | %g | 2.16 | %g | 2.17 | %g | 2.17 | % | 2.17 | % | |||||
| Expenses incurred in connection with securities sold short | —% | —%h | —% | —% | —% | ||||||||||
| Net investment income | 0.26 | %c | 0.78 | %d | 0.64 | % | 0.70 | % | 1.12 | % | |||||
| Supplemental data | |||||||||||||||
| Net assets, end of year (000’s) | $ | 34,611 | $ | 14,794 | $ | 14,198 | $ | 10,503 | $ | 2,667 | |||||
| Portfolio turnover rate | 28.64 | % | 54.78 | % | 41.47 | % | 27.97 | % | 41.26 | % | |||||
aThe amount shown for a share outstanding throughout the period may not correlate with the Statement of Operations for the period due to the timing of sales and repurchases
of the Fund’s shares in relation to income earned and/or fluctuating fair value of the investments of the Fund.
bBased on average daily shares outstanding.
cNet investment income per share includes approximately $0.08 per share related to income received in the form of special dividends in connection with certain Fund holdings.
Excluding this amount, the ratio of net investment income to average net assets would have been (0.29%).
dNet investment income per share includes approximately $0.08 per share related to income received in the form of a special dividend in connection with certain Fund
holdings. Excluding this amount, the ratio of net investment income to average net assets would have been 0.27%.
eTotal return does not reflect sales commissions or contingent deferred sales charges, if applicable.
fIncludes dividend and/or interest expense on securities sold short and security borrowing fees, if any. See below for the ratios of such expenses to average net assets for the
periods presented. See Note 1(f).
gBenefit of expense reduction rounds to less than 0.01%.
hRounds to less than 0.01%.
franklintempleton.com
The accompanying notes are an integral part of these financial statements. | Annual Report 17
FRANKLIN MUTUAL INTERNATIONAL FUND
FINANCIAL H IGHLIGHTS
| Year Ended December 31, | |||||||||||||||
| 2015 | 2014 | 2013 | 2012 | 2011 | |||||||||||
| Class R | |||||||||||||||
| Per share operating performance | |||||||||||||||
| (for a share outstanding throughout the year) | |||||||||||||||
| Net asset value, beginning of year | $ | 14.51 | $ | 15.83 | $ | 13.54 | $ | 11.82 | $ | 13.78 | |||||
| Income from investment operationsa: | |||||||||||||||
| Net investment incomeb | 0.04 | c | 0.18 | d | 0.15 | 0.11 | 0.21 | ||||||||
| Net realized and unrealized gains (losses) | (0.10 | ) | (0.52 | ) | 2.43 | 1.73 | (1.79 | ) | |||||||
| Total from investment operations | (0.06 | ) | (0.34 | ) | 2.58 | 1.84 | (1.58 | ) | |||||||
| Less distributions from: | |||||||||||||||
| Net investment income | (0.13 | ) | (0.37 | ) | (0.19 | ) | (0.10 | ) | (0.23 | ) | |||||
| Net realized gains | (0.27 | ) | (0.61 | ) | (0.10 | ) | (0.02 | ) | (0.15 | ) | |||||
| Total distributions | (0.40 | ) | (0.98 | ) | (0.29 | ) | (0.12 | ) | (0.38 | ) | |||||
| Net asset value, end of year | $ | 14.05 | $ | 14.51 | $ | 15.83 | $ | 13.54 | $ | 11.82 | |||||
| Total return | (0.38 | )% | (2.13 | )% | 19.13 | % | 15.70 | % | (11.53 | )% | |||||
| Ratios to average net assets | |||||||||||||||
| Expenses before waiver, payments by affiliates and expense reductione | 1.74 | % | 1.89 | % | 1.99 | % | 2.25 | % | 2.30 | % | |||||
| Expenses net of waiver, payments by affiliates and expense reductione | 1.65 | %f | 1.66 | %f | 1.67 | %f | 1.67 | % | 1.67 | % | |||||
| Expenses incurred in connection with securities sold short | —% | —%g | —% | —% | —% | ||||||||||
| Net investment income | 0.76 | %c | 1.28 | %d | 1.14 | % | 1.20 | % | 1.62 | % | |||||
| Supplemental data | |||||||||||||||
| Net assets, end of year (000’s) | $ | 662 | $ | 112 | $ | 90 | $ | 42 | $ | 12 | |||||
| Portfolio turnover rate | 28.64 | % | 54.78 | % | 41.47 | % | 27.97 | % | 41.26 | % | |||||
aThe amount shown for a share outstanding throughout the period may not correlate with the Statement of Operations for the period due to the timing of sales and repurchases
of the Fund’s shares in relation to income earned and/or fluctuating fair value of the investments of the Fund.
bBased on average daily shares outstanding.
cNet investment income per share includes approximately $0.08 per share related to income received in the form of special dividends in connection with certain Fund holdings.
Excluding this amount, the ratio of net investment income to average net assets would have been 0.21%.
dNet investment income per share includes approximately $0.08 per share related to income received in the form of a special dividend in connection with certain Fund hold-
ings. Excluding this amount, the ratio of net investment income to average net assets would have been 0.77%.
eIncludes dividend and/or interest expense on securities sold short and security borrowing fees, if any. See below for the ratios of such expenses to average net assets for the
periods presented. See Note 1(f).
fBenefit of expense reduction rounds to less than 0.01%.
gRounds to less than 0.01%.
18 Annual Report | The accompanying notes are an integral part of these financial statements.
franklintempleton.com
FRANKLIN MUTUAL INTERNATIONAL FUND
FINANCIAL H IGHLIGHTS
| Year Ended December 31, | |||||||||
| 2015 | 2014 | 2013 | a | ||||||
| Class R6 | |||||||||
| Per share operating performance | |||||||||
| (for a share outstanding throughout the year) | |||||||||
| Net asset value, beginning of year | $ | 14.59 | $ | 15.87 | $ | 14.26 | |||
| Income from investment operationsb: | |||||||||
| Net investment incomec | 0.22 | d | —e,f | 0.15 | |||||
| Net realized and unrealized gains (losses) | (0.20 | ) | (0.22 | ) | 1.83 | ||||
| Total from investment operations | 0.02 | (0.22 | ) | 1.98 | |||||
| Less distributions from: | |||||||||
| Net investment income | (0.17 | ) | (0.45 | ) | (0.27 | ) | |||
| Net realized gains | (0.27 | ) | (0.61 | ) | (0.10 | ) | |||
| Total distributions | (0.44 | ) | (1.06 | ) | (0.37 | ) | |||
| Net asset value, end of year | $ | 14.17 | $ | 14.59 | $ | 15.87 | |||
| Total returng | 0.23 | % | (1.46 | )% | 14.09 | % | |||
| Ratios to average net assetsh | |||||||||
| Expenses before waiver, payments by affiliates and expense reductioni | 1.06 | % | 1.24 | % | 2.89 | % | |||
| Expenses net of waiver, payments by affiliates and expense reductioni,j | 1.02 | % | 1.00 | % | 1.00 | % | |||
| Expenses incurred in connection with securities sold short | —% | —%k | —% | ||||||
| Net investment income | 1.39 | %d | 1.94 | %e | 1.81 | % | |||
| Supplemental data | |||||||||
| Net assets, end of year (000’s) | $ | 23,793 | $ | 19,398 | $ | 6 | |||
| Portfolio turnover rate | 28.64 | % | 54.78 | % | 41.47 | % | |||
aFor the period May 1, 2013 (commencement of operations) to December 31, 2013.
bThe amount shown for a share outstanding throughout the period may not correlate with the Statement of Operations for the period due to the timing of sales and repurchases
of the Fund’s shares in relation to income earned and/or fluctuating fair value of the investments of the Fund.
cBased on average daily shares outstanding.
dNet investment income per share includes approximately $0.08 per share related to income received in the form of special dividends in connection with certain Fund holdings.
Excluding this amount, the ratio of net investment income to average net assets would have been 0.84%.
eNet investment income per share includes approximately $0.08 per share related to income received in the form of a special dividend in connection with certain Fund hold-
ings. Excluding this amount, the ratio of net investment income to average net assets would have been 1.42%.
fAmount rounds to less than $0.01 per share.
gTotal return is not annualized for periods less than one year.
hRatios are annualized for periods less than one year.
iIncludes dividend and/or interest expense on securities sold short and security borrowing fees, if any. See below for the ratios of such expenses to average net assets for the
periods presented. See Note 1(f).
jBenefit of expense reduction rounds to less than 0.01%.
kRounds to less than 0.01%.
franklintempleton.com
The accompanying notes are an integral part of these financial statements. | Annual Report 19
FRANKLIN MUTUAL INTERNATIONAL FUND
| Statement of Investments, December 31, 2015 | ||||
| Country | Shares | Value | ||
| Common Stocks 88.9% | ||||
| Air Freight & Logistics 3.1% | ||||
| Deutsche Post AG | Germany | 134,781 | $ | 3,799,964 |
| Sinotrans Ltd., H | China | 5,681,000 | 3,056,685 | |
| 6,856,649 | ||||
| Auto Components 2.9% | ||||
| Cie Generale des Etablissements Michelin, B | France | 32,510 | 3,104,100 | |
| Xinyi Glass Holdings Ltd | Hong Kong | 5,686,000 | 3,345,504 | |
| 6,449,604 | ||||
| Banks 5.7% | ||||
| Barclays PLC | United Kingdom | 345,167 | 1,113,673 | |
| BNP Paribas SA | France | 32,930 | 1,868,278 | |
| HSBC Holdings PLC | United Kingdom | 382,080 | 3,019,700 | |
| KB Financial Group Inc | South Korea | 10,723 | 302,446 | |
| aRoyal Bank of Scotland Group PLC | United Kingdom | 424,822 | 1,891,022 | |
| Standard Chartered PLC | United Kingdom | 309,696 | 2,573,158 | |
| UniCredit SpA | Italy | 315,937 | 1,762,263 | |
| 12,530,540 | ||||
| Beverages 1.8% | ||||
| Coca-Cola East Japan Co. Ltd | Japan | 184,800 | 3,002,741 | |
| SABMiller PLC | United Kingdom | 15,440 | 926,128 | |
| 3,928,869 | ||||
| Capital Markets 2.3% | ||||
| aChina International Capital Corp. Ltd., H | China | 1,424,999 | 2,320,405 | |
| UBS Group AG | Switzerland | 135,310 | 2,635,979 | |
| 4,956,384 | ||||
| Chemicals 1.9% | ||||
| Arkema SA | France | 53,725 | 3,769,393 | |
| a,bCovestro AG, 144A | Germany | 10,072 | 367,991 | |
| 4,137,384 | ||||
| Communications Equipment 2.0% | ||||
| Nokia Corp., ADR | Finland | 257,320 | 1,806,386 | |
| Nokia OYJ, A | Finland | 356,803 | 2,556,072 | |
| 4,362,458 | ||||
| Construction & Engineering 1.5% | ||||
| aBalfour Beatty PLC | United Kingdom | 577,245 | 2,298,943 | |
| FLSmidth & Co. AS | Denmark | 28,340 | 990,246 | |
| 3,289,189 | ||||
| Construction Materials 1.3% | ||||
| aLafargeHolcim Ltd., B | Switzerland | 57,500 | 2,886,477 | |
| Consumer Finance 1.4% | ||||
| a,bHoist Finance AB, 144A | Sweden | 107,525 | 1,126,937 | |
| Sun Hung Kai & Co. Ltd | Hong Kong | 2,877,748 | 1,893,707 | |
| 3,020,644 | ||||
| Diversified Financial Services 1.0% | ||||
| Metro Pacific Investments Corp | Philippines | 20,375,200 | 2,257,880 | |
| Diversified Telecommunication Services 5.9% | ||||
| China Telecom Corp. Ltd., H | China | 6,995,468 | 3,285,550 |
20 Annual Report
franklintempleton.com
FRANKLIN MUTUAL INTERNATIONAL FUND
STATEMENT O F INVESTMENTS
| Country | Shares | Value | ||
| Common Stocks (continued) | ||||
| Diversified Telecommunication Services (continued) | ||||
| Deutsche Telekom AG | Germany | 233,241 | $ | 4,228,546 |
| aEuskaltel SA | Spain | 246,295 | 3,098,089 | |
| Hellenic Telecommunications Organization SA | Greece | 240,752 | 2,416,416 | |
| 13,028,601 | ||||
| Electric Utilities 1.7% | ||||
| Enel SpA | Italy | 898,503 | 3,798,588 | |
| Food & Staples Retailing 1.7% | ||||
| Metro AG | Germany | 119,356 | 3,832,467 | |
| Hotels, Restaurants & Leisure 3.2% | ||||
| Accor SA | France | 91,810 | 3,989,643 | |
| Mandarin Oriental International Ltd | Hong Kong | 851,634 | 1,320,033 | |
| Sands China Ltd | Hong Kong | 476,400 | 1,625,875 | |
| 6,935,551 | ||||
| Household Durables 1.0% | ||||
| aCairn Homes PLC | Ireland | 693,523 | 900,241 | |
| a,bCairn Homes PLC, 144A | Ireland | 1,011,251 | 1,312,673 | |
| 2,212,914 | ||||
| Industrial Conglomerates 1.8% | ||||
| Jardine Matheson Holdings Ltd | Hong Kong | 1,262 | 61,497 | |
| Koninklijke Philips NV | Netherlands | 151,479 | 3,876,658 | |
| 3,938,155 | ||||
| Insurance 15.5% | ||||
| ACE Ltd | United States | 26,507 | 3,097,343 | |
| Ageas | Belgium | 51,414 | 2,390,314 | |
| Assicurazioni Generali SpA | Italy | 136,841 | 2,515,049 | |
| China Pacific Insurance (Group) Co. Ltd., H | China | 848,845 | 3,488,412 | |
| Direct Line Insurance Group PLC | United Kingdom | 337,459 | 2,026,895 | |
| Korean Reinsurance Co | South Korea | 178,863 | 2,153,399 | |
| Lancashire Holdings Ltd | United Kingdom | 181,386 | 1,678,982 | |
| NN Group NV | Netherlands | 123,982 | 4,383,686 | |
| PICC Property and Casualty Co. Ltd., H | China | 1,258,160 | 2,496,791 | |
| RSA Insurance Group PLC | United Kingdom | 416,335 | 2,617,247 | |
| aStorebrand ASA | Norway | 318,849 | 1,260,237 | |
| UNIQA Insurance Group AG | Austria | 206,167 | 1,685,215 | |
| XL Group PLC | Ireland | 107,789 | 4,223,173 | |
| 34,016,743 | ||||
| Machinery 0.3% | ||||
| CNH Industrial NV | United Kingdom | 30,305 | 208,705 | |
| CNH Industrial NV, special voting | United Kingdom | 16,517 | 113,750 | |
| aVossloh AG | Germany | 6,344 | 410,162 | |
| 732,617 | ||||
| Marine 0.8% | ||||
| A.P. Moeller-Maersk AS, B | Denmark | 1,379 | 1,801,899 | |
| Media 4.9% | ||||
| Clear Media Ltd | Hong Kong | 2,283,000 | 2,297,685 | |
| aLiberty Global PLC, C | United Kingdom | 98,265 | 4,006,264 | |
| Nine Entertainment Co. Holdings Ltd | Australia | 1,649,899 | 2,289,717 | |
| Relx PLC | United Kingdom | 33,489 | 590,853 | |
| Societe Television Francaise 1 | France | 140,004 | 1,558,813 | |
| 10,743,332 |
franklintempleton.com
Annual Report
21
FRANKLIN MUTUAL INTERNATIONAL FUND
STATEMENT O F INVESTMENTS
| Country | Shares | Value | ||
| Common Stocks (continued) | ||||
| Metals & Mining 1.0% | ||||
| ThyssenKrupp AG | Germany | 78,272 | $ | 1,559,321 |
| Voestalpine AG | Austria | 24,327 | 749,023 | |
| 2,308,344 | ||||
| Multiline Retail 1.3% | ||||
| Hyundai Department Store Co. Ltd | South Korea | 26,541 | 2,856,639 | |
| Oil, Gas & Consumable Fuels 2.6% | ||||
| BG Group PLC | United Kingdom | 108,344 | 1,572,982 | |
| BP PLC | United Kingdom | 188,158 | 981,768 | |
| aCairn Energy PLC | United Kingdom | 396,002 | 920,475 | |
| China Shenhua Energy Co. Ltd., H | China | 906,941 | 1,427,673 | |
| Royal Dutch Shell PLC, A | United Kingdom | 33,741 | 773,156 | |
| 5,676,054 | ||||
| Pharmaceuticals 4.5% | ||||
| GlaxoSmithKline PLC | United Kingdom | 147,502 | 2,985,047 | |
| Novartis AG | Switzerland | 49,679 | 4,303,530 | |
| Teva Pharmaceutical Industries Ltd., ADR | Israel | 37,950 | 2,491,038 | |
| 9,779,615 | ||||
| Real Estate Investment Trusts (REITs) 1.2% | ||||
| Hibernia REIT PLC | Ireland | 1,686,094 | 2,578,780 | |
| Real Estate Management & Development 3.8% | ||||
| Dalian Wanda Commercial Properties Co. Ltd., H | China | 665,100 | 3,887,541 | |
| Hang Lung Properties Ltd | Hong Kong | 298,000 | 678,273 | |
| Takara Leben Co. Ltd | Japan | 654,400 | 3,680,473 | |
| 8,246,287 | ||||
| Road & Rail 1.6% | ||||
| a,cCAR Inc | China | 2,154,285 | 3,569,095 | |
| Semiconductors & Semiconductor Equipment 1.3% | ||||
| SK Hynix Inc | South Korea | 106,205 | 2,778,674 | |
| Specialty Retail 5.1% | ||||
| Baoxin Auto Group Ltd | China | 2,233,889 | 1,397,955 | |
| China ZhengTong Auto Services Holdings Ltd | China | 4,761,387 | 2,187,124 | |
| aDufry AG | Switzerland | 22,534 | 2,698,683 | |
| Hornbach Holding AG & Co. KGaA | Germany | 31,290 | 2,081,812 | |
| Kingfisher PLC | United Kingdom | 581,782 | 2,825,520 | |
| 11,191,094 | ||||
| Technology Hardware, Storage & Peripherals 2.3% | ||||
| Lenovo Group Ltd | China | 1,894,903 | 1,924,206 | |
| Samsung Electronics Co. Ltd | South Korea | 2,866 | 3,072,518 | |
| 4,996,724 | ||||
| Thrifts & Mortgage Finance 0.7% | ||||
| Genworth Mortgage Insurance Australia Ltd | Australia | 774,427 | 1,557,109 | |
| Wireless Telecommunication Services 1.8% | ||||
| Vodafone Group PLC | United Kingdom | 1,234,230 | 4,020,417 | |
| Total Common Stocks (Cost $204,044,616) | 195,275,777 |
22 Annual Report
franklintempleton.com
FRANKLIN MUTUAL INTERNATIONAL FUND
STATEMENT O F INVESTMENTS
| Country | Shares | Value | |||
| Preferred Stocks 3.2% | |||||
| Auto Components 0.4% | |||||
| aSchaeffler AG, pfd | Germany | 53,405 | $ | 942,682 | |
| Automobiles 2.8% | |||||
| Hyundai Motor Co., pfd | South Korea | 22,729 | 1,991,889 | ||
| Volkswagen AG, pfd | Germany | 27,891 | 4,052,170 | ||
| 6,044,059 | |||||
| Total Preferred Stocks (Cost $7,660,520) | 6,986,741 | ||||
| Total Investments before Short Term Investments | |||||
| (Cost $211,705,136) | 202,262,518 | ||||
| Principal | |||||
| Amount | |||||
| Short Term Investments 7.2% | |||||
| U.S. Government and Agency Securities 6.4% | |||||
| FHLB, | |||||
| 1/04/16 | United States | $ | 4,800,000 | 4,800,000 | |
| d1/05/16 | United States | 2,000,000 | 1,999,992 | ||
| dU.S. Treasury Bill, 1/07/16 - 6/09/16 | United States | 7,300,000 | 7,292,232 | ||
| Total U.S. Government and Agency Securities | |||||
| (Cost $14,090,925) | 14,092,224 | ||||
| Total Investments before Repurchase Agreements | |||||
| (Cost $225,796,061) | 216,354,742 | ||||
| eInvestments from Cash Collateral Received for | |||||
| Loaned Securities 0.8% | |||||
| Repurchase Agreements 0.8% | |||||
| fJoint Repurchase Agreement, 0.27%, 1/04/16 | |||||
| (Maturity Value $767,785) | |||||
| HSBC Securities (USA) Inc. | |||||
| Collateralized by U.S. Treasury Strips, 2/15/16 - 8/15/40 | |||||
| (valued at $783,118) | United States | 767,762 | 767,762 | ||
| fJoint Repurchase Agreement, 0.30%, 1/04/16 | |||||
| (Maturity Value $1,000,033) | |||||
| RBS Securities Inc. | |||||
| Collateralized by U.S. Treasury Note, 0.289% - 3.25%, 7/31/16 - 11/15/23 | |||||
| (valued at $1,020,005) | United States | 1,000,000 | 1,000,000 | ||
| Total Investments from Cash Collateral Received for Loaned | |||||
| Securities (Cost $1,767,762) | 1,767,762 | ||||
| Total Investments (Cost $227,563,823) 99.3% | 218,122,504 | ||||
| Other Assets, less Liabilities 0.7% | 1,496,246 | ||||
| Net Assets 100.0% | $ | 219,618,750 | |||
aNon-income producing.
bSecurity was purchased pursuant to Rule 144A under the Securities Act of 1933 and may be sold in transactions exempt from registration only to qualified institutional buyers
or in a public offering registered under the Securities Act of 1933. These securities have been deemed liquid under guidelines approved by the Trust’s Board of Trustees. At
December 31, 2015, the aggregate value of these securities was $2,807,601, representing 1.28% of net assets.
cA portion or all of the security is on loan at December 31, 2015. See Note 1(g).
dThe security is traded on a discount basis with no stated coupon rate.
eSee Note 1(g) regarding securities on loan.
fSee Note 1(c) regarding joint repurchase agreement.
franklintempleton.com
Annual Report
23
FRANKLIN MUTUAL INTERNATIONAL FUND
STATEMENT O F INVESTMENTS
| At December 31, 2015, the Fund had the following futures contracts outstanding. See Note 1(d). | ||||||||||||
| Futures Contracts | ||||||||||||
| Number of | Notional Expiration | Unrealized | Unrealized | |||||||||
| Description | Type Contracts | Value | Date Appreciation Depreciation | |||||||||
| Currency Contracts | ||||||||||||
| CHF/USD | Short | 2 | $ | 250,800 | 3/14/16 | $ | 3,274 | $ | — | |||
| EUR/USD | Short | 121 | 16,465,075 | 3/14/16 | 21,998 | — | ||||||
| GBP/USD | Short | 44 | 4,051,850 | 3/14/16 | 101,105 | — | ||||||
| Total Futures Contracts | $ | 126,377 | $ | — | ||||||||
| Net unrealized appreciation (depreciation) | $ | 126,377 | ||||||||||
| At December 31, 2015, the Fund had the following forward exchange contracts outstanding. See Note 1(d). | ||||||||||||
| Forward Exchange Contracts | ||||||||||||
| Contract | Settlement | Unrealized | Unrealized | |||||||||
| Currency | Counterpartya Type | Quantity | Amount | Date | Appreciation | Depreciation | ||||||
| OTC Forward Exchange Contracts | ||||||||||||
| Euro | BANT | Sell | 1,369,777 | $ | 1,520,179 | 1/06/16 | $ | 32,033 | $ | — | ||
| Euro | BONY | Sell | 6,750,473 | 7,383,330 | 1/06/16 | 49,517 | — | |||||
| Euro | DBFX | Sell | 146,198 | 161,614 | 1/06/16 | 2,782 | — | |||||
| Euro | SSBT | Sell | 6,815,295 | 7,462,195 | 1/06/16 | 57,958 | — | |||||
| Euro | BANT | Buy | 106,412 | 116,661 | 1/20/16 | — | (1,013 | ) | ||||
| Euro | BANT | Sell | 1,885,201 | 2,122,932 | 1/20/16 | 74,098 | — | |||||
| Euro | BBU | Sell | 63,267 | 70,034 | 1/20/16 | 1,276 | — | |||||
| Euro | BONY | Buy | 29,656 | 32,328 | 1/20/16 | — | (98 | ) | ||||
| Euro | BONY | Sell | 27,981 | 30,636 | 1/20/16 | 226 | — | |||||
| Euro | DBFX | Buy | 201,324 | 221,012 | 1/20/16 | — | (2,213 | ) | ||||
| Euro | DBFX | Sell | 626,559 | 696,816 | 1/20/16 | 15,872 | — | |||||
| Euro | FBCO | Buy | 106,410 | 116,570 | 1/20/16 | — | (924 | ) | ||||
| Euro | FBCO | Sell | 6,860,185 | 7,524,183 | 1/20/16 | 69,382 | (843 | ) | ||||
| Euro | HSBC | Buy | 125,128 | 137,059 | 1/20/16 | — | (1,070 | ) | ||||
| Euro | HSBC | Sell | 8,640,901 | 9,549,291 | 1/20/16 | 158,366 | — | |||||
| Euro | SSBT | Buy | 217,783 | 239,361 | 1/20/16 | — | (2,675 | ) | ||||
| Euro | SSBT | Sell | 1,413,344 | 1,590,164 | 1/20/16 | 54,143 | — | |||||
| Australian Dollar | HSBC | Sell | 5,080,441 | 3,664,866 | 1/29/16 | 13 | (30,850 | ) | ||||
| South Korean Won | BANT | Sell | 1,844,986,365 | 1,579,168 | 2/12/16 | 13,944 | (2,700 | ) | ||||
| South Korean Won | FBCO | Sell | 1,014,921,852 | 876,325 | 2/12/16 | 13,860 | (46 | ) | ||||
| South Korean Won | HSBC | Buy | 474,577,877 | 404,171 | 2/12/16 | 344 | (1,204 | ) | ||||
| South Korean Won | HSBC | Sell | 8,419,495,385 | 7,161,441 | 2/12/16 | 26,210 | (19,905 | ) | ||||
| British Pound | BANT | Buy | 169,115 | 261,562 | 2/19/16 | — | (12,271 | ) | ||||
| British Pound | BANT | Sell | 2,212,247 | 3,362,769 | 2/19/16 | 101,719 | — | |||||
| British Pound | BBU | Buy | 76,691 | 117,859 | 2/19/16 | — | (4,810 | ) | ||||
| British Pound | BBU | Sell | 31,290 | 47,484 | 2/19/16 | 1,360 | — | |||||
| British Pound | BONY | Sell | 18,583 | 28,577 | 2/19/16 | 1,184 | — | |||||
| British Pound | DBFX | Sell | 5,742,470 | 8,939,155 | 2/19/16 | 474,238 | — | |||||
| British Pound | FBCO | Buy | 498,051 | 774,619 | 2/19/16 | — | (40,448 | ) | ||||
| British Pound | FBCO | Sell | 6,705,882 | 10,423,570 | 2/19/16 | 538,497 | — | |||||
| British Pound | HSBC | Buy | 244,153 | 383,314 | 2/19/16 | — | (23,411 | ) | ||||
| British Pound | HSBC | Sell | 233,291 | 348,462 | 2/19/16 | 4,570 | — | |||||
| British Pound | SSBT | Buy | 245,209 | 383,253 | 2/19/16 | — | (21,792 | ) | ||||
| British Pound | SSBT | Sell | 1,099,095 | 1,653,100 | 2/19/16 | 32,935 | — | |||||
| Philippine Peso | BONY | Buy | 815,000 | 17,234 | 3/28/16 | — | (26 | ) | ||||
| Philippine Peso | BONY | Sell | 106,766,000 | 2,235,001 | 3/28/16 | — | (19,333 | ) | ||||
| Swedish Krona | BANT | Sell | 193,010 | 22,877 | 3/29/16 | — | (40 | ) | ||||
| Swedish Krona | BONY | Sell | 864,300 | 99,976 | 3/29/16 | — | (2,650 | ) | ||||
| Swedish Krona | DBFX | Sell | 3,586,806 | 428,862 | 3/29/16 | 3,772 | (800 | ) | ||||
| Swedish Krona | SSBT | Buy | 313,692 | 37,265 | 3/29/16 | 78 | (96 | ) | ||||
| Swedish Krona | SSBT | Sell | 4,852,480 | 575,110 | 3/29/16 | 102 | (1,165 | ) | ||||
| Euro | BANT | Sell | 125,853 | 140,151 | 4/18/16 | 3,035 | — | |||||
| Euro | BONY | Sell | 119,643 | 132,825 | 4/18/16 | 2,474 | — | |||||
24 Annual Report
franklintempleton.com
FRANKLIN MUTUAL INTERNATIONAL FUND
STATEMENT O F INVESTMENTS
| Forward Exchange Contracts (continued) | |||||||||||
| Contract | Settlement | Unrealized | Unrealized | ||||||||
| Currency | Counterpartya Type | Quantity | Amount | Date | Appreciation | Depreciation | |||||
| OTC Forward Exchange Contracts (continued) | |||||||||||
| Euro | DBFX | Sell | 5,963 | $ | 6,609 | 4/18/16 | $ | 112 | $ | — | |
| Euro | FBCO | Sell | 323,630 | 358,856 | 4/18/16 | 6,264 | — | ||||
| Euro | HSBC | Sell | 402,086 | 445,342 | 4/18/16 | 7,272 | — | ||||
| Euro | SSBT | Sell | 598,473 | 663,174 | 4/18/16 | 11,142 | — | ||||
| Japanese Yen | BANT | Sell | 677,227,801 | 5,662,744 | 4/22/16 | 15,918 | (6,029 | ) | |||
| Japanese Yen | BONY | Sell | 29,574,552 | 244,233 | 4/22/16 | — | (2,627 | ) | |||
| Japanese Yen | DBFX | Sell | 21,652,383 | 176,971 | 4/22/16 | — | (3,763 | ) | |||
| Japanese Yen | HSBC | Sell | 62,233,139 | 509,104 | 4/22/16 | — | (10,360 | ) | |||
| Euro | BANT | Sell | 6,600,526 | 7,218,356 | 5/04/16 | 25,112 | (1,751 | ) | |||
| Euro | BONY | Sell | 845,216 | 928,453 | 5/04/16 | 7,112 | — | ||||
| Euro | FBCO | Sell | 2,137,181 | 2,320,113 | 5/04/16 | — | (9,551 | ) | |||
| Euro | HSBC | Sell | 6,529 | 7,181 | 5/04/16 | 63 | — | ||||
| Euro | SSBT | Sell | 1,809,871 | 1,946,335 | 5/04/16 | — | (26,540 | ) | |||
| South Korean Won | BANT | Sell | 2,307,941,682 | 2,006,928 | 5/12/16 | 48,021 | — | ||||
| South Korean Won | FBCO | Sell | 953,497,553 | 826,756 | 5/12/16 | 17,458 | — | ||||
| South Korean Won | HSBC | Sell | 1,395,601,190 | 1,221,375 | 5/12/16 | 36,833 | — | ||||
| Swiss Franc | BANT | Buy | 107,710 | 108,445 | 5/12/16 | 412 | (699 | ) | |||
| Swiss Franc | BANT | Sell | 1,242,141 | 1,245,565 | 5/12/16 | 171 | (1,916 | ) | |||
| Swiss Franc | BONY | Buy | 163,783 | 163,938 | 5/12/16 | 953 | (427 | ) | |||
| Swiss Franc | DBFX | Buy | 36,651 | 36,304 | 5/12/16 | 500 | — | ||||
| Swiss Franc | FBCO | Buy | 102,059 | 102,111 | 5/12/16 | 1,174 | (801 | ) | |||
| Swiss Franc | HSBC | Buy | 127,928 | 126,825 | 5/12/16 | 2,047 | (412 | ) | |||
| Swiss Franc | SSBT | Buy | 177,466 | 177,641 | 5/12/16 | 708 | (144 | ) | |||
| Euro | BANT | Sell | 1,879,528 | 2,013,547 | 5/18/16 | — | (36,200 | ) | |||
| Euro | DBFX | Sell | 976,435 | 1,040,770 | 5/18/16 | — | (24,095 | ) | |||
| Euro | FBCO | Sell | 1,859,766 | 1,989,475 | 5/18/16 | — | (38,720 | ) | |||
| Euro | HSBC | Sell | 338,191 | 361,052 | 5/18/16 | — | (7,767 | ) | |||
| Euro | SSBT | Sell | 495,605 | 529,129 | 5/18/16 | — | (11,359 | ) | |||
| British Pound | BANT | Sell | 47,860 | 70,998 | 5/23/16 | 426 | — | ||||
| Norwegian Krone | BANT | Sell | 9,726,483 | 1,128,572 | 5/23/16 | 29,374 | — | ||||
| Norwegian Krone | DBFX | Buy | 328,960 | 38,041 | 5/23/16 | — | (865 | ) | |||
| Norwegian Krone | DBFX | Sell | 347,620 | 40,347 | 5/23/16 | 1,062 | — | ||||
| Norwegian Krone | SSBT | Sell | 1,115,172 | 127,928 | 5/23/16 | 1,903 | — | ||||
| Total Forward Exchange Contracts | $ | 1,948,025 | $ | (374,409 | ) | ||||||
| Net unrealized appreciation (depreciation) | $ | 1,573,616 | |||||||||
| aMay be comprised of multiple contracts with the same counterparty, currency and settlement date. | |||||||||||
| See Abbreviations on page 41. | |||||||||||
franklintempleton.com
The accompanying notes are an integral part of these financial statements. | Annual Report 25
| FRANKLIN MUTUAL INTERNATIONAL FUND | |||
| Financial Statements | |||
| Statement of Assets and Liabilities | |||
| December 31, 2015 | |||
| Assets: | |||
| Investments in securities: | |||
| Cost - Unaffiliated issuers | $ | 225,796,061 | |
| Cost - Repurchase agreements | 1,767,762 | ||
| Total cost of investments | $ | 227,563,823 | |
| Value - Unaffiliated issuers | $ | 216,354,742 | |
| Value - Repurchase agreements | 1,767,762 | ||
| Total value of investments (includes securities loaned in the amount of $1,673,310) | 218,122,504 | ||
| Cash | 598,397 | ||
| Restricted Cash (Note 1e) | 390,000 | ||
| Foreign currency, at value (cost $111,872) | 111,420 | ||
| Receivables: | |||
| Investment securities sold | 439,249 | ||
| Capital shares sold | 821,219 | ||
| Dividends | 216,704 | ||
| Affiliates | 18,785 | ||
| Due from brokers | 532,020 | ||
| Variation margin | 117,825 | ||
| Unrealized appreciation on OTC forward exchange contracts | 1,948,025 | ||
| Other assets | 9 | ||
| Total assets | 223,316,157 | ||
| Liabilities: | |||
| Payables: | |||
| Investment securities purchased | 545 | ||
| Capital shares redeemed | 367,264 | ||
| Management fees | 138,801 | ||
| Distribution fees | 96,690 | ||
| Trustees’ fees and expenses | 396 | ||
| Due to brokers | 910,000 | ||
| Due to custodian | 262 | ||
| Payable upon return of securities loaned | 1,767,500 | ||
| Unrealized depreciation on OTC forward exchange contracts | 374,409 | ||
| Accrued expenses and other liabilities | 41,540 | ||
| Total liabilities | 3,697,407 | ||
| Net assets, at value | $ | 219,618,750 | |
| Net assets consist of: | |||
| Paid-in capital | $ | 228,924,690 | |
| Distributions in excess of net investment income | (436,616 | ) | |
| Net unrealized appreciation (depreciation) | (7,749,521 | ) | |
| Accumulated net realized gain (loss) | (1,119,803 | ) | |
| Net assets, at value | $ | 219,618,750 | |
26 Annual Report | The accompanying notes are an integral part of these financial statements.
franklintempleton.com
FRANKLIN MUTUAL INTERNATIONAL FUND
FINANCIAL STATEMENTS
| Statement of Assets and Liabilities (continued) | ||
| December 31, 2015 | ||
| Class Z: | ||
| Net assets, at value | $ | 49,962,931 |
| Shares outstanding | 3,526,998 | |
| Net asset value and maximum offering price per share | $ | 14.17 |
| Class A: | ||
| Net assets, at value | $ | 110,590,577 |
| Shares outstanding | 7,842,022 | |
| Net asset value per sharea | $ | 14.10 |
| Maximum offering price per share (net asset value per share ÷ 94.25%) | $ | 14.96 |
| Class C: | ||
| Net assets, at value | $ | 34,610,551 |
| Shares outstanding | 2,485,667 | |
| Net asset value and maximum offering price per sharea | $ | 13.92 |
| Class R: | ||
| Net assets, at value | $ | 661,753 |
| Shares outstanding | 47,105 | |
| Net asset value and maximum offering price per share | $ | 14.05 |
| Class R6: | ||
| Net assets, at value | $ | 23,792,938 |
| Shares outstanding | 1,679,230 | |
| Net asset value and maximum offering price per share | $ | 14.17 |
aRedemption price is equal to net asset value less contingent deferred sales charges, if applicable.
franklintempleton.com
The accompanying notes are an integral part of these financial statements. | Annual Report 27
FRANKLIN MUTUAL INTERNATIONAL FUND
FINANCIAL STATEMENTS
| Statement of Operations | |||
| for the year ended December 31, 2015 | |||
| Investment income: | |||
| Dividends (net of foreign taxes of $265,279) | $ | 3,715,011 | |
| Interest | 8,780 | ||
| Income from securities loaned | 40,209 | ||
| Total investment income | 3,764,000 | ||
| Expenses: | |||
| Management fees (Note 3a) | 1,363,923 | ||
| Distribution fees: (Note 3c) | |||
| Class A | 211,150 | ||
| Class C | 265,860 | ||
| Class R | 1,686 | ||
| Transfer agent fees: (Note 3e) | |||
| Class Z | 52,133 | ||
| Class A | 135,098 | ||
| Class C | 46,702 | ||
| Class R | 592 | ||
| Class R6 | 287 | ||
| Custodian fees (Note 4) | 29,369 | ||
| Reports to shareholders | 37,706 | ||
| Registration and filing fees | 92,043 | ||
| Professional fees | 110,196 | ||
| Trustees’ fees and expenses | 3,830 | ||
| Other | 26,279 | ||
| Total expenses | 2,376,854 | ||
| Expense reductions (Note 4) | (71 | ) | |
| Expenses waived/paid by affiliates (Note 3f) | (130,753 | ) | |
| Net expenses | 2,246,030 | ||
| Net investment income | 1,517,970 | ||
| Realized and unrealized gains (losses): | |||
| Net realized gain (loss) from: | |||
| Investments | (3,131,215 | ) | |
| Foreign currency transactions | 5,437,937 | ||
| Futures contracts | 1,362,056 | ||
| Net realized gain (loss) | 3,668,778 | ||
| Net change in unrealized appreciation (depreciation) on: | |||
| Investments | (10,326,903 | ) | |
| Translation of other assets and liabilities denominated in foreign currencies | (1,627,745 | ) | |
| Futures contracts | (95,435 | ) | |
| Net change in unrealized appreciation (depreciation) | (12,050,083 | ) | |
| Net realized and unrealized gain (loss) | (8,381,305 | ) | |
| Net increase (decrease) in net assets resulting from operations | $ | (6,863,335 | ) |
28 Annual Report | The accompanying notes are an integral part of these financial statements.
franklintempleton.com
FRANKLIN MUTUAL INTERNATIONAL FUND
FINANCIAL STATEMENTS
| Statements of Changes in Net Assets | ||||||
| Year Ended December 31, | ||||||
| 2015 | 2014 | |||||
| Increase (decrease) in net assets: | ||||||
| Operations: | ||||||
| Net investment income | $ | 1,517,970 | $ | 1,057,910 | ||
| Net realized gain (loss) | 3,668,778 | 2,557,348 | ||||
| Net change in unrealized appreciation (depreciation) | (12,050,083 | ) | (5,486,165 | ) | ||
| Net increase (decrease) in net assets resulting from operations | (6,863,335 | ) | (1,870,907 | ) | ||
| Distributions to shareholders from: | ||||||
| Net investment income: | ||||||
| Class Z | (540,800 | ) | (523,715 | ) | ||
| Class A | (983,407 | ) | (944,114 | ) | ||
| Class C | (115,267 | ) | (268,761 | ) | ||
| Class R | (5,824 | ) | (2,686 | ) | ||
| Class R6 | (291,543 | ) | (446,640 | ) | ||
| Net realized gains: | ||||||
| Class Z | (662,068 | ) | (781,116 | ) | ||
| Class A | (1,747,632 | ) | (1,515,476 | ) | ||
| Class C | (600,597 | ) | (593,424 | ) | ||
| Class R | (10,302 | ) | (4,446 | ) | ||
| Class R6 | (429,291 | ) | (759,333 | ) | ||
| Total distributions to shareholders | (5,386,731 | ) | (5,839,711 | ) | ||
| Capital share transactions: (Note 2) | ||||||
| Class Z | 31,733,987 | 6,711,687 | ||||
| Class A | 78,126,822 | 7,674,681 | ||||
| Class C | 22,165,666 | 1,833,944 | ||||
| Class R | 563,842 | 32,032 | ||||
| Class R6 | 5,224,973 | 21,167,542 | ||||
| Total capital share transactions | 137,815,290 | 37,419,886 | ||||
| Net increase (decrease) in net assets | 125,565,224 | 29,709,268 | ||||
| Net assets: | ||||||
| Beginning of year | 94,053,526 | 64,344,258 | ||||
| End of year | $ | 219,618,750 | $ | 94,053,526 | ||
| Distributions in excess of net investment income, end of year | $ | (436,616 | ) | $ | (485,936 | ) |
franklintempleton.com
The accompanying notes are an integral part of these financial statements. | Annual Report 29
FRANKLIN MUTUAL INTERNATIONAL FUND
Notes to Financial Statements
1. Organization and Significant Accounting Policies
Franklin Mutual Series Funds (Trust) is registered under the Investment Company Act of 1940 (1940 Act) as an open-end management investment company, consisting of seven separate funds and applies the specialized accounting and reporting guidance in U.S. Generally Accepted Accounting Principles (U.S. GAAP). Franklin Mutual International Fund (Fund) is included in this report. The financial statements of the remaining funds in the Trust are presented separately. The Fund offers five classes of shares: Class Z, Class A, Class C, Class R and Class R6. Each class of shares differs by its initial sales load, contingent deferred sales charges, voting rights on matters affecting a single class, its exchange privilege and fees primarily due to differing arrangements for distribution and transfer agent fees.
The following summarizes the Fund’s significant accounting policies.
a. Financial Instrument Valuation
The Fund’s investments in financial instruments are carried at fair value daily. Fair value is the price that would be received to sell an asset or paid to transfer a liability in an orderly transaction between market participants on the measurement date. The Fund calculates the net asset value per share as of 4 p.m. Eastern time each day the New York Stock Exchange (NYSE) is open for trading. Under compliance policies and procedures approved by the Trust’s Board of Trustees (the Board), the Fund’s administrator has responsibility for oversight of valuation, including leading the cross-functional Valuation and Liquidity Oversight Committee (VLOC). The VLOC provides administration and oversight of the Fund’s valuation policies and procedures, which are approved annually by the Board. Among other things, these procedures allow the Fund to utilize independent pricing services, quotations from securities and financial instrument dealers, and other market sources to determine fair value.
Equity securities and derivative financial instruments (derivatives) listed on an exchange or on the NASDAQ National Market System are valued at the last quoted sale price or the official closing price of the day, respectively. Foreign equity securities are valued as of the close of trading on the foreign stock exchange on which the security is primarily traded or as of 4 p.m. Eastern time whichever is earlier. The value is then converted into its U.S. dollar equivalent at the foreign exchange rate in effect at 4 p.m. Eastern time on the day that the value of the security is determined. Over-the-counter (OTC) securities are valued within the range of the most recent quoted bid and ask prices. Securities that trade in multiple markets or on multiple exchanges are valued according to the broadest and most representative market. Certain equity securities are valued based upon fundamental characteristics or relationships to similar securities.
Debt securities generally trade in the OTC market rather than on a securities exchange. The Fund’s pricing services use multiple valuation techniques to determine fair value. In instances where sufficient market activity exists, the pricing services may utilize a market-based approach through which quotes from market makers are used to determine fair value. In instances where sufficient market activity may not exist or is limited, the pricing services also utilize proprietary valuation models which may consider market characteristics such as benchmark yield curves, credit spreads, estimated default rates, anticipated market interest rate volatility, coupon rates, anticipated timing of principal repayments, underlying collateral, and other unique security features in order to estimate the relevant cash flows, which are then discounted to calculate the fair value. Securities denominated in a foreign currency are converted into their U.S. dollar equivalent at the foreign exchange rate in effect at 4 p.m. Eastern time on the date that the values of the foreign debt securities are determined.
Repurchase agreements are valued at cost, which approximates fair value.
Certain derivatives trade in the OTC market. The Fund’s pricing services use various techniques including industry standard option pricing models and proprietary discounted cash flow models to determine the fair value of those instruments. The Fund’s net benefit or obligation under the derivative contract, as measured by the fair value of the contract, is included in net assets.
The Fund has procedures to determine the fair value of financial instruments for which market prices are not reliable or readily available. Under these procedures, the VLOC convenes on a regular basis to review such financial instruments and considers a number of factors, including significant unobservable valuation inputs, when arriving at fair value. The VLOC primarily employs a market-based approach which may use related or comparable assets or liabilities, recent transactions, market multiples, book values, and other relevant information for the investment to determine the fair value of the investment. An
30 Annual Report
franklintempleton.com
FRANKLIN MUTUAL INTERNATIONAL FUND
NOTES TO FINANCIAL STATEMENTS
income-based valuation approach may also be used in which the anticipated future cash flows of the investment are discounted to calculate fair value. Discounts may also be applied due to the nature or duration of any restrictions on the disposition of the investments. Due to the inherent uncertainty of valuations of such investments, the fair values may differ significantly from the values that would have been used had an active market existed. The VLOC employs various methods for calibrating these valuation approaches including a regular review of key inputs and assumptions, transactional back-testing or disposition analysis, and reviews of any related market activity.
Trading in securities on foreign securities stock exchanges and OTC markets may be completed before 4 p.m. Eastern time. In addition, trading in certain foreign markets may not take place on every NYSE business day. Occasionally, events occur between the time at which trading in a foreign security is completed and the close of the NYSE that might call into question the reliability of the value of a portfolio security held by the Fund. As a result, differences may arise between the value of the Fund’s portfolio securities as determined at the foreign market close and the latest indications of value at the close of the NYSE. In order to minimize the potential for these differences, the VLOC monitors price movements following the close of trading in foreign stock markets through a series of country specific market proxies (such as baskets of American Depositary Receipts, futures contracts and exchange traded funds). These price movements are measured against established trigger thresholds for each specific market proxy to assist in determining if an event has occurred that may call into question the reliability of the values of the foreign securities held by the Fund. If such an event occurs, the securities may be valued using fair value procedures, which may include the use of independent pricing services.
When the last day of the reporting period is a non-business day, certain foreign markets may be open on those days that the NYSE is closed, which could result in differences between the value of the Fund’s portfolio securities on the last business day and the last calendar day of the reporting period. Any significant security valuation changes due to an open foreign market are adjusted and reflected by the Fund for financial reporting purposes.
b. Foreign Currency Translation
Portfolio securities and other assets and liabilities denominated in foreign currencies are translated into U.S. dollars based on the exchange rate of such currencies against U.S. dollars on the date of valuation. The Fund may enter into foreign currency exchange contracts to facilitate transactions denominated in a foreign currency. Purchases and sales of securities, income and expense items denominated in foreign currencies are translated into U.S. dollars at the exchange rate in effect on the transaction date. Portfolio securities and assets and liabilities denominated in foreign currencies contain risks that those currencies will decline in value relative to the U.S. dollar. Occasionally, events may impact the availability or reliability of foreign exchange rates used to convert the U.S. dollar equivalent value. If such an event occurs, the foreign exchange rate will be valued at fair value using procedures established and approved by the Board.
The Fund does not separately report the effect of changes in foreign exchange rates from changes in market prices on securities held. Such changes are included in net realized and unrealized gain or loss from investments in the Statement of Operations.
Realized foreign exchange gains or losses arise from sales of foreign currencies, currency gains or losses realized between the trade and settlement dates on securities transactions and the difference between the recorded amounts of dividends, interest, and foreign withholding taxes and the U.S. dollar equivalent of the amounts actually received or paid. Net unrealized foreign exchange gains and losses arise from changes in foreign exchange rates on foreign denominated assets and liabilities other than investments in securities held at the end of the reporting period.
c. Joint Repurchase Agreement
The Fund enters into a joint repurchase agreement whereby its uninvested cash balance is deposited into a joint cash account with other funds managed by the investment manager or an affiliate of the investment manager and is used to invest in one or more repurchase agreements. The value and face amount of the joint repurchase agreement are allocated to the funds based on their pro-rata interest. A repurchase agreement is accounted for as a loan by the Fund to the seller, collateralized by securities which are delivered to the Fund’s custodian. The fair value, including accrued interest, of the initial collateralization is required to be at least 102% of the dollar amount invested by the funds, with the value of the underlying securities marked to market daily to maintain coverage of at least 100%. Repurchase agreements are subject to the terms of Master Repurchase Agreements (MRAs) with approved counterparties (sellers). The MRAs contain various provisions, including but not limited to events of default and maintenance of collateral for repurchase
franklintempleton.com
Annual Report
31
FRANKLIN MUTUAL INTERNATIONAL FUND
NOTES TO FINANCIAL STATEMENTS
1. Organization and Significant Accounting
Policies (continued)
c. Joint Repurchase Agreement (continued)
agreements. In the event of default by either the seller or the Fund, certain MRAs may permit the non-defaulting party to net and close-out all transactions, if any, traded under such agreements. The Fund may sell securities it holds as collateral and apply the proceeds towards the repurchase price and any other amounts owed by the seller to the Fund in the event of default by the seller. This could involve costs or delays in addition to a loss on the securities if their value falls below the repurchase price owed by the seller. The joint repurchase agreement held by the Fund at year end, as indicated in the Statement of Investments, had been entered into on December 31, 2015.
d. Derivative Financial Instruments
The Fund invested in derivatives in order to manage risk or gain exposure to various other investments or markets. Derivatives are financial contracts based on an underlying or notional amount, require no initial investment or an initial net investment that is smaller than would normally be required to have a similar response to changes in market factors, and require or permit net settlement. Derivatives contain various risks including the potential inability of the counterparty to fulfill their obligations under the terms of the contract, the potential for an illiquid secondary market, and/or the potential for market movements which expose the Fund to gains or losses in excess of the amounts shown in the Statement of Assets and Liabilities. Realized gain and loss and unrealized appreciation and depreciation on these contracts for the period are included in the Statement of Operations.
Derivative counterparty credit risk is managed through a formal evaluation of the creditworthiness of all potential counterparties. The Fund attempts to reduce its exposure to counterparty credit risk on OTC derivatives, whenever possible, by entering into International Swaps and Derivatives Association (ISDA) master agreements with certain counterparties. These agreements contain various provisions, including but not limited to collateral requirements, events of default, or early termination. Termination events applicable to the counterparty include certain deteriorations in the credit quality of the counterparty. Termination events applicable to the Fund include failure of the Fund to maintain certain net asset levels and/or limit the decline in net assets over various periods of time. In the event of default or early termination, the ISDA master agreement gives the non-defaulting party the right to net and close-out all transactions traded, whether or not arising under the ISDA agreement, to one net amount payable by one counterparty to the other. However, absent an event of default or early termination, OTC derivative assets and liabilities are presented gross and not offset in the Statement of Assets and Liabilities. Early termination by the counterparty may result in an immediate payment by the Fund of any net liability owed to that counterparty under the ISDA agreement.
Collateral requirements differ by type of derivative. Collateral or initial margin requirements are set by the broker or exchange clearing house for exchange traded and centrally cleared derivatives. Initial margin deposited is held at the exchange and can be in the form of cash and/or securities. For OTC derivatives traded under an ISDA master agreement, posting of collateral is required by either the Fund or the applicable coun-terparty if the total net exposure of all OTC derivatives with the applicable counterparty exceeds the minimum transfer amount, which typically ranges from $100,000 to $250,000, and can vary depending on the counterparty and the type of the agreement. Generally, collateral is determined at the close of Fund business each day and any additional collateral required due to changes in derivative values may be delivered by the Fund or the counterparty within a few business days. Collateral pledged and/or received by the Fund for OTC derivatives, if any, is held in segregated accounts with the Fund’s custodian/counterparty broker and can be in the form of cash and/or securities. Unrestricted cash may be invested according to the Fund’s investment objectives. To the extent that the amounts due to the Fund from its counterparties are not subject to collateralization or are not fully collateralized, the Fund bears the risk of loss from counterparty non-performance.
The Fund entered into exchange traded futures contracts primarily to manage exposure to certain foreign currencies. A futures contract is an agreement between the Fund and a counterparty to buy or sell an asset for a specified price on a future date. Required initial margins are pledged by the Fund, and the daily change in fair value is accounted for as a variation margin payable or receivable in the Statement of Assets and Liabilities.
The Fund entered into OTC forward exchange contracts primarily to manage exposure to certain foreign currencies. A forward exchange contract is an agreement between the Fund and a counterparty to buy or sell a foreign currency at a specific exchange rate on a future date.
See Note 9 regarding other derivative information.
32 Annual Report
franklintempleton.com
FRANKLIN MUTUAL INTERNATIONAL FUND
NOTES TO FINANCIAL STATEMENTS
e. Restricted Cash
At December 31, 2015, the Fund held restricted cash in connection with investments in certain derivative securities. Restricted cash is held in a segregated account with the Fund’s custodian/counterparty broker and is reflected in the Statement of Assets and Liabilities.
f. Securities Sold Short
The Fund is engaged in selling securities short, which obligates the Fund to replace a borrowed security with the same security at current fair value. The Fund incurs a loss if the price of the security increases between the date of the short sale and the date on which the Fund replaces the borrowed security. The Fund realizes a gain if the price of the security declines between those dates. Gains are limited to the price at which the Fund sold the security short, while losses are potentially unlimited in size.
The Fund is required to establish a margin account with the broker lending the security sold short. While the short sale is outstanding, the broker retains the proceeds of the short sale to the extent necessary to meet margin requirements until the short position is closed out. A deposit must also be maintained with the Fund’s custodian/counterparty broker consisting of cash and/or securities having a value equal to a specified percentage of the value of the securities sold short. The Fund is obligated to pay fees for borrowing the securities sold short and is required to pay the counterparty any dividends and/or interest due on securities sold short. Such dividends and/or interest and any security borrowing fees are recorded as an expense to the Fund. At December 31, 2015, the Fund had no securities sold short.
g. Securities Lending
The Fund participates in an agency based securities lending program to earn additional income. The Fund receives cash collateral against the loaned securities in an amount equal to at least 102% of the fair value of the loaned securities. Collateral is maintained over the life of the loan in an amount not less than 100% of the fair value of loaned securities, as determined at the close of Fund business each day; any additional collateral required due to changes in security values is delivered to the Fund on the next business day. The collateral is deposited into a joint cash account with other funds and is used to invest in a money market fund managed by Franklin Advisers, Inc., an affiliate of the Fund and/or a joint repurchase agreement as included in the Statement of Assets and Liabilities. The Fund may receive income from the investment of cash collateral, in addition to lending fees and rebates paid by the borrower. Income from securities loaned is reported separately in the Statement of Operations. The Fund bears the market risk with respect to the collateral investment, securities loaned, and the risk that the agent may default on its obligations to the Fund. If the borrower defaults on its obligation to return the securities loaned, the Fund has the right to repurchase the securities in the open market using the collateral received. The securities lending agent has agreed to indemnify the Fund in the event of default by a third party borrower.
Securities lending transactions are accounted for as secured borrowing transactions. The securities out on loan represent the collateral pledged by the Fund, and the cash collateral received for the loaned securities represents the amount borrowed by the Fund. At December 31, 2015, the Fund’s secured borrowing transactions were as follows:
| Securities lending transactionsa: | ||
| Equity investmentsb | $ | 1,767,500 |
aThe agreements open at year end can be terminated at any time.
bGross amount of recognized liabilities for securities lending transactions is included
in payable upon return of securities loaned in the Statement of Assets and Liabilities.
h. Income and Deferred Taxes
It is the Fund’s policy to qualify as a regulated investment company under the Internal Revenue Code. The Fund intends to distribute to shareholders substantially all of its taxable income and net realized gains to relieve it from federal income and excise taxes. As a result, no provision for U.S. federal income taxes is required.
The Fund may be subject to foreign taxation related to income received, capital gains on the sale of securities and certain foreign currency transactions in the foreign jurisdictions in which it invests. Foreign taxes, if any, are recorded based on the tax regulations and rates that exist in the foreign markets in which the Fund invests. When a capital gain tax is determined to apply, the Fund records an estimated deferred tax liability in an amount that would be payable if the securities were disposed of on the valuation date. As a result of several court cases, in certain countries across the European Union, the Fund has filed additional tax reclaims for previously withheld taxes on dividends earned in those countries. These additional filings are subject to various administrative proceedings by the local jurisdictions’ tax authorities within the European Union, as well as a number of related judicial proceedings. At this time, uncertainty exists as to the ultimate resolution of these proceedings, the likelihood of receipt of these reclaims, and the
franklintempleton.com
Annual Report
33
FRANKLIN MUTUAL INTERNATIONAL FUND
NOTES TO FINANCIAL STATEMENTS
1. Organization and Significant Accounting
Policies (continued)
h. Income and Deferred Taxes (continued)
potential timing of payment, and accordingly, no amounts are reflected in the financial statements.
The Fund may recognize an income tax liability related to its uncertain tax positions under U.S. GAAP when the uncertain tax position has a less than 50% probability that it will be sustained upon examination by the tax authorities based on its technical merits. As of December 31, 2015, the Fund has determined that no tax liability is required in its financial statements related to uncertain tax positions for any open tax years (or expected to be taken on future tax returns). Open tax years are those that remain subject to examination and are based on each tax jurisdiction’s statute of limitation.
i. Security Transactions, Investment Income, Expenses and Distributions
Security transactions are accounted for on trade date. Realized gains and losses on security transactions are determined on a specific identification basis. Interest income and estimated expenses are accrued daily. Amortization of premium and accretion of discount on debt securities are included in interest income. Dividend income is recorded on the ex-dividend date except for certain dividends from foreign securities where the dividend rate is not available. In such cases, the dividend is recorded as soon as the information is received by the Fund. Distributions to shareholders are recorded on the ex-dividend date and are determined according to income tax regulations (tax basis). Distributable earnings determined on a tax basis may differ from earnings recorded in accordance with U.S. GAAP. These differences may be permanent or temporary. Permanent differences are reclassified among capital accounts to reflect their tax character. These reclassifications have no impact on net assets or the results of operations. Temporary differences are not reclassified, as they may reverse in subsequent periods.
Common expenses incurred by the Trust are allocated among the funds based on the ratio of net assets of each fund to the combined net assets of the Trust. Fund specific expenses are charged directly to the fund that incurred the expense.
Realized and unrealized gains and losses and net investment income, not including class specific expenses, are allocated daily to each class of shares based upon the relative proportion of net assets of each class. Differences in per share distributions, by class, are generally due to differences in class specific expenses.
j. Accounting Estimates
The preparation of financial statements in accordance with U.S. GAAP requires management to make estimates and assumptions that affect the reported amounts of assets and liabilities at the date of the financial statements and the amounts of income and expenses during the reporting period. Actual results could differ from those estimates.
k. Guarantees and Indemnifications
Under the Trust’s organizational documents, its officers and trustees are indemnified by the Trust against certain liabilities arising out of the performance of their duties to the Trust. Additionally, in the normal course of business, the Trust, on behalf of the Fund, enters into contracts with service providers that contain general indemnification clauses. The Trust’s maximum exposure under these arrangements is unknown as this would involve future claims that may be made against the Trust that have not yet occurred. Currently, the Trust expects the risk of loss to be remote.
34 Annual Report
franklintempleton.com
FRANKLIN MUTUAL INTERNATIONAL FUND
NOTES TO FINANCIAL STATEMENTS
2. Shares of Beneficial Interest
At December 31, 2015, there were an unlimited number of shares authorized (without par value). Transactions in the Fund’s shares were as follows:
| Year Ended December 31, | ||||||||||||
| 2015 | 2014 | |||||||||||
| Shares | Amount | Shares | Amount | |||||||||
| Class Z Shares: | ||||||||||||
| Shares sold | 2,413,536 | $ | 35,531,201 | 529,983 | $ | 8,226,852 | ||||||
| Shares issued in reinvestment of distributions | 84,406 | 1,172,521 | 86,650 | 1,263,366 | ||||||||
| Shares redeemed | (337,358 | ) | (4,969,735 | ) | (176,966 | ) | (2,778,531 | ) | ||||
| Net increase (decrease) | 2,160,584 | $ | 31,733,987 | 439,667 | $ | 6,711,687 | ||||||
| Class A Shares: | ||||||||||||
| Shares sold | 7,288,961 | $ | 110,020,725 | 901,338 | $ | 13,970,519 | ||||||
| Shares issued in reinvestment of distributions | 192,281 | 2,654,730 | 165,114 | 2,404,279 | ||||||||
| Shares redeemed | (2,377,293 | ) | (34,548,633 | ) | (558,333 | ) | (8,700,117 | ) | ||||
| Net increase (decrease) | 5,103,949 | $ | 78,126,822 | 508,119 | $ | 7,674,681 | ||||||
| Class C Shares: | ||||||||||||
| Shares sold | 2,030,613 | $ | 30,447,005 | 262,947 | $ | 4,041,488 | ||||||
| Shares issued in reinvestment of distributions | 52,555 | 713,543 | 59,615 | 859,241 | ||||||||
| Shares redeemed | (626,348 | ) | (8,994,882 | ) | (199,373 | ) | (3,066,785 | ) | ||||
| Net increase (decrease) | 1,456,820 | $ | 22,165,666 | 123,189 | $ | 1,833,944 | ||||||
| Class R Shares: | ||||||||||||
| Shares sold | 39,482 | $ | 566,560 | 3,627 | $ | 57,262 | ||||||
| Shares issued in reinvestment of distributions | 1,172 | 16,126 | 490 | 7,132 | ||||||||
| Shares redeemed | (1,269 | ) | (18,844 | ) | (2,078 | ) | (32,362 | ) | ||||
| Net increase (decrease) | 39,385 | $ | 563,842 | 2,039 | $ | 32,032 | ||||||
| Class R6 Shares: | ||||||||||||
| Shares sold | 401,874 | $ | 6,037,202 | 1,298,073 | $ | 20,764,282 | ||||||
| Shares issued in reinvestment of distributions | 51,921 | 720,834 | 83,260 | 1,205,600 | ||||||||
| Shares redeemed | (104,241 | ) | (1,533,063 | ) | (52,008 | ) | (802,340 | ) | ||||
| Net increase (decrease) | 349,554 | $ | 5,224,973 | 1,329,325 | $ | 21,167,542 | ||||||
3. Transactions with Affiliates
Franklin Resources, Inc. is the holding company for various subsidiaries that together are referred to as Franklin Templeton Investments. Certain officers and trustees of the Fund are also officers and/or directors of the following subsidiaries:
| Subsidiary | Affiliation |
| Franklin Mutual Advisers, LLC (Franklin Mutual) | Investment manager |
| Franklin Templeton Services, LLC (FT Services) | Administrative manager |
| Franklin Templeton Distributors, Inc. (Distributors) | Principal underwriter |
| Franklin Templeton Investor Services, LLC (Investor Services) | Transfer agent |
a. Management Fees
The Fund pays an investment management fee to Franklin Mutual of 0.875% per year of the average daily net assets of the Fund.
franklintempleton.com
Annual Report
35
FRANKLIN MUTUAL INTERNATIONAL FUND
NOTES TO FINANCIAL STATEMENTS
3. Transactions with Affiliates (continued)
b. Administrative Fees
Under an agreement with Franklin Mutual, FT Services provides administrative services to the Fund. The fee is paid by Franklin Mutual based on the Fund’s average daily net assets, and is not an additional expense of the Fund.
c. Distribution Fees
The Board has adopted distribution plans for each share class, with the exception of Class Z and Class R6 shares, pursuant to Rule 12b-1 under the 1940 Act. Under the Fund’s Class A reimbursement distribution plan, the Fund reimburses Distributors for costs incurred in connection with the servicing, sale and distribution of the Fund’s shares up to the maximum annual plan rate. Under the Class A reimbursement distribution plan, costs exceeding the maximum for the current plan year cannot be reimbursed in subsequent periods. In addition, under the Fund’s Class C and R compensation distribution plans, the Fund pays Distributors for costs incurred in connection with the servicing, sale and distribution of the Fund’s shares up to the maximum annual plan rate for each class. The plan year, for purposes of monitoring compliance with the maximum annual plan rates, is February 1 through January 31 for each fund.
The maximum annual plan rates, based on the average daily net assets, for each class, are as follows:
| Class A | 0.35 | % |
| Class C | 1.00 | % |
| Class R | 0.50 | % |
Effective August 1, 2015, the Board has set the current rate at 0.25% per year for Class A shares until further notice and approval by the Board. Prior to August 1, 2015, the Board had set the rate at 0.30% per year for Class A shares.
d. Sales Charges/Underwriting Agreements
Front-end sales charges and contingent deferred sales charges (CDSC) do not represent expenses of the Fund. These charges are deducted from the proceeds of sales of Fund shares prior to investment or from redemption proceeds prior to remittance, as applicable. Distributors has advised the Fund of the following commission transactions related to the sales and redemptions of the Fund’s shares for the year:
| Sales charges retained net of commissions paid to unaffiliated broker/dealers | $ | 75,442 |
| CDSC retained | $ | 5,739 |
e. Transfer Agent Fees
Each class of shares, except for Class R6, pays transfer agent fees to Investor Services for its performance of shareholder servicing obligations and reimburses Investor Services for out of pocket expenses incurred, including shareholding servicing fees paid to third parties. These fees are allocated daily based upon their relative proportion of such classes’ aggregate net assets. Class R6 pays Investor Services transfer agent fees specific to that class.
For the year ended December 31, 2015, the Fund paid transfer agent fees of $234,812, of which $106,521 was retained by Investor Services.
f. Waiver and Expense Reimbursements
Franklin Mutual and Investor Services have contractually agreed in advance to waive or limit their respective fees and to assume as their own expense certain expenses otherwise payable by the Fund so that the expenses (excluding distribution fees, acquired fund fees and expenses) for each class of the Fund do not exceed 1.17%, and Class R6 does not exceed 1.02% based on the average net assets of each class (other than certain non-routine expenses or costs, including those relating to litigation, indemnification, reorganizations, and liquidations) until April 30, 2016. Prior to May 1, 2015, expenses for Class R6 were limited to 1.00%.
36 Annual Report
franklintempleton.com
FRANKLIN MUTUAL INTERNATIONAL FUND
NOTES TO FINANCIAL STATEMENTS
g. Other Affiliated Transactions
At December 31, 2015, one or more of the funds in Franklin Fund Allocator Series owned 10.51% of the Fund’s outstanding shares.
4. Expense Offset Arrangement
The Fund has entered into an arrangement with its custodian whereby credits realized as a result of uninvested cash balances are used to reduce a portion of the Fund’s custodian expenses. During the year ended December 31, 2015, the custodian fees were reduced as noted in the Statement of Operations.
5. Independent Trustees’ Retirement Plan
On January 1, 1993, the Trust adopted an Independent Trustees’ Retirement Plan (Plan). The Plan is an unfunded defined benefit plan that provides benefit payments to Trustees whose length of service and retirement age meets the eligibility requirements of the Plan. Benefits under the Plan are based on years of service and fees paid to each trustee at the time of retirement. Effective in December 1996, the Plan was closed to new participants.
During the year ended December 31, 2015, the Fund’s projected benefit obligation and benefit payments under the Plan were as follows:
| aProjected benefit obligation at December 31, 2015 | $ | 396 | |
| bIncrease in projected benefit obligation | $ | 469 | |
| Benefit payments made to retired trustees | $ | (127 | ) |
aThe projected benefit obligation is included in trustees’ fees and expenses in the Statement of Assets and Liabilities.
bThe increase in projected benefit obligation is included in trustees’ fees and expenses in the Statement of Operations.
6. Income Taxes
The tax character of distributions paid during the years ended December 31, 2015 and 2014, was as follows:
| 2015 | 2014 | |||
| Distributions paid from: | ||||
| Ordinary income | $ | 2,937,290 | $ | 2,185,916 |
| Long term capital gain | 2,449,441 | 3,653,795 | ||
| $ | 5,386,731 | $ | 5,839,711 |
At December 31, 2015, the cost of investments, net unrealized appreciation (depreciation), undistributed ordinary income and undistributed long term capital gains for income tax purposes were as follows:
| Cost of investments | $ | 228,394,912 | |
| Unrealized appreciation | $ | 8,810,085 | |
| Unrealized depreciation | (19,082,493 | ) | |
| Net unrealized appreciation (depreciation) | $ | (10,272,408 | ) |
| Undistributed ordinary income | $ | 334,176 | |
| Undistributed long term capital gains | 660,882 | ||
| Distributable earnings | $ | 995,058 |
Differences between income and/or capital gains as determined on a book basis and a tax basis are primarily due to differing treatments of foreign currency transactions.
franklintempleton.com
Annual Report
37
FRANKLIN MUTUAL INTERNATIONAL FUND
NOTES TO FINANCIAL STATEMENTS
7. Investment Transactions
Purchases and sales of investments (excluding short term securities) for the year ended December 31, 2015, aggregated $174,658,594 and $39,233,740, respectively.
8. Concentration of Risk
Investing in foreign securities may include certain risks and considerations not typically associated with investing in U.S. securities, such as fluctuating currency values and changing local and regional economic, political and social conditions, which may result in greater market volatility. In addition, certain foreign securities may not be as liquid as U.S. securities.
9. Other Derivative Information
At December 31, 2015, the Fund’s investments in derivative contracts are reflected in the Statement of Assets and Liabilities as follows:
| Asset Derivatives | Liability Derivatives | ||||||
| Derivative Contracts | |||||||
| Not Accounted for as | Statement of Assets and | Statement of Assets and | |||||
| Hedging Instruments | Liabilities Location | Fair Value | Liabilities Location | Fair Value | |||
| Foreign exchange contracts | Variation margin | $ | 126,377 | a | |||
| Unrealized appreciation on OTC | 1,948,025 | Unrealized depreciation on OTC | $ | 374,409 | |||
| forward exchange contracts | forward exchange contracts | ||||||
| Totals | $ | 2,074,402 | $ | 374,409 | |||
aThis amount reflects the cumulative appreciation (depreciation) of futures contracts as reported in the Statement of Investments. Only the variation margin receivable/payable
at year end is separately reported within the Statement of Assets and Liabilities. Prior variation margin movements were recorded to cash upon receipt or payment.
For the year ended December 31, 2015, the effect of derivative contracts in the Fund’s Statement of Operations was as follows:
| Net Change in | ||||||||
| Unrealized | ||||||||
| Derivative Contracts | Net Realized | Appreciation | ||||||
| Not Accounted for as | Statement of Operations | Gain (Loss) | Statement of Operations | (Depreciation) | ||||
| Hedging Instruments | Locations | for the Year | Locations | for the Year | ||||
| Net realized gain (loss) from: | Net change in unrealized | |||||||
| appreciation (depreciation) on: | ||||||||
| Foreign exchange contracts | Foreign currency | $ | 5,384,468 | a | Translation of other assets | $ | (1,621,580 | )a |
| transactions | and liabilities | |||||||
| denominated in foreign | ||||||||
| currencies | ||||||||
| Futures contracts | 1,362,056 | Futures contracts | (95,435 | ) | ||||
| Totals | $ | 6,746,524 | $ | (1,717,015 | ) |
aForward exchange contracts are included in net realized gain (loss) from foreign currency transactions and net change in unrealized appreciation (depreciation) on translation
of other assets and liabilities denominated in foreign currencies in the Statement of Operations.
For the year ended December 31, 2015, the average month end fair value of derivatives represented 1.58% of average month end net assets. The average month end number of open derivative contracts for the year was 252.
38 Annual Report
franklintempleton.com
FRANKLIN MUTUAL INTERNATIONAL FUND
NOTES TO FINANCIAL STATEMENTS
At December 31, 2015, the Fund’s OTC derivative assets and liabilities are as follows:
| Gross and Net Amounts | ||||
| of Assets and Liabilities | ||||
| Presented in the | ||||
| Statement of | ||||
| Assets and Liabilities | ||||
| Assetsa | Liabilitiesa | |||
| Derivatives | ||||
| Forward exchange contracts | $ | 1,948,025 | $ | 374,409 |
| aAbsent an event of default or early termination, OTC derivative assets and liabilities are presented gross and not offset in the Statement of Assets and Liabilities. | ||||
At December 31, 2015, the Fund’s OTC derivative assets, which may be offset against the Fund’s OTC derivative liabilities and collateral received from the counterparty, are as follows:
| Amounts Not Offset in the | ||||||||||||||
| Statement of Assets and Liabilities | ||||||||||||||
| Gross and Net | ||||||||||||||
| Amounts of Assets | Financial | |||||||||||||
| Presented in the | Financial | Instruments | Cash | |||||||||||
| Statement of | Instruments | Collateral | Collateral | Net Amount (Not | ||||||||||
| Assets and Liabilities | Available for Offset | Receiveda | Received | less than zero) | ||||||||||
| Counterparty | ||||||||||||||
| BANT | $ | 344,263 | $ | (62,619 | ) | $ | (85,977 | ) | $ | — | $ | 195,667 | ||
| BBU | 2,636 | (2,636 | ) | — | — | — | ||||||||
| BONY | 61,466 | (25,161 | ) | — | — | 36,305 | ||||||||
| DBFX | 498,338 | (31,736 | ) | — | (390,000 | ) | 76,602 | |||||||
| FBCO | 646,635 | (91,333 | ) | — | (520,000 | ) | 35,302 | |||||||
| HSBC | 235,718 | (94,979 | ) | (7,766 | ) | — | 132,973 | |||||||
| SSBT | 158,969 | (63,771 | ) | — | — | 95,198 | ||||||||
| Total | $ | 1,948,025 | $ | (372,235 | ) | $ | (93,743 | ) | $ | (910,000 | ) | $ | 572,047 | |
| aAt December 31, 2015, the Fund received U.S. Treasury Bonds and Notes as collateral for derivatives. | ||||||||||||||
At December 31, 2015, the Fund’s OTC derivative liabilities, which may be offset against the Fund’s OTC derivative assets and collateral pledged to the counterparty, are as follows:
| Amounts Not Offset in the | |||||||||||
| Statement of Assets and Liabilities | |||||||||||
| Gross and Net | |||||||||||
| Amounts of Liabilities | Financial | ||||||||||
| Presented in the | Financial | Instruments | Cash | ||||||||
| Statement of | Instruments | Collateral | Collateral | Net Amount (Not | |||||||
| Assets and Liabilities | Available for Offset | Pledged | Pledged | less than zero) | |||||||
| Counterparty | |||||||||||
| BANT | $ | 62,619 | $ | (62,619 | ) | $ | — | $ | — | $ | — |
| BBU | 4,810 | (2,636 | ) | — | — | 2,174 | |||||
| BONY | 25,161 | (25,161 | ) | — | — | — | |||||
| DBFX | 31,736 | (31,736 | ) | — | — | — | |||||
| FBCO | 91,333 | (91,333 | ) | — | — | — | |||||
| HSBC | 94,979 | (94,979 | ) | — | — | — | |||||
| SSBT | 63,771 | (63,771 | ) | — | — | — | |||||
| Total | $ | 374,409 | $ | (372,235 | ) | $ | — | $ | — | $ | 2,174 |
| See Note 1(d) regarding derivative financial instruments. | |||||||||||
| See Abbreviations on page 41. | |||||||||||
franklintempleton.com
Annual Report
39
FRANKLIN MUTUAL INTERNATIONAL FUND
NOTES TO FINANCIAL STATEMENTS
10. Credit Facility
The Fund, together with other U.S. registered and foreign investment funds (collectively, Borrowers), managed by Franklin Templeton Investments, are borrowers in a joint syndicated senior unsecured credit facility totaling $2 billion (Global Credit Facility) which matured on February 12, 2016. This Global Credit Facility provides a source of funds to the Borrowers for temporary and emergency purposes, including the ability to meet future unanticipated or unusually large redemption requests. Effective February 12, 2016, the Borrowers renewed the Global Credit Facility for a one year term, maturing February 10, 2017, for a total of $2 billion.
Under the terms of the Global Credit Facility, the Fund shall, in addition to interest charged on any borrowings made by the Fund and other costs incurred by the Fund, pay its share of fees and expenses incurred in connection with the implementation and maintenance of the Global Credit Facility, based upon its relative share of the aggregate net assets of all of the Borrowers, including an annual commitment fee of 0.07% based upon the unused portion of the Global Credit Facility. Effective February 12, 2016, the annual commitment fee is 0.15%. These fees are reflected in other expenses in the Statement of Operations. During the year ended December 31, 2015, the Fund did not use the Global Credit Facility.
11. Fair Value Measurements
The Fund follows a fair value hierarchy that distinguishes between market data obtained from independent sources (observable inputs) and the Fund’s own market assumptions (unobservable inputs). These inputs are used in determining the value of the Fund’s financial instruments and are summarized in the following fair value hierarchy:
- Level 1 – quoted prices in active markets for identical financial instruments
- Level 2 – other significant observable inputs (including quoted prices for similar financial instruments, interest rates, prepayment speed, credit risk, etc.)
- Level 3 – significant unobservable inputs (including the Fund’s own assumptions in determining the fair value of financial instruments)
The input levels are not necessarily an indication of the risk or liquidity associated with financial instruments at that level.
For movements between the levels within the fair value hierarchy, the Fund has adopted a policy of recognizing the transfers as of the date of the underlying event which caused the movement.
A summary of inputs used as of December 31, 2015, in valuing the Fund’s assets and liabilities carried at fair value, is as follows:
| Level 1 | Level 2 | Level 3 | Total | |||||
| Assets: | ||||||||
| Investments in Securities: | ||||||||
| Equity Investments:a | ||||||||
| Machinery | $ | 618,867 | $ | 113,750 | $ | — | $ | 732,617 |
| All Other Equity Investmentsb | 201,529,901 | — | — | 201,529,901 | ||||
| Short Term Investments | 7,292,232 | 8,567,754 | — | 15,859,986 | ||||
| Total Investments in Securities | $ | 209,441,000 | $ | 8,681,504 | $ | — | $ | 218,122,504 |
| Other Financial Instruments | ||||||||
| Futures Contracts | $ | 126,377 | $ | — | $ | — | $ | 126,377 |
| Forward Exchange Contracts | — | 1,948,025 | — | 1,948,025 | ||||
| Total Other Financial Instruments | $ | 126,377 | $ | 1,948,025 | $ | — | $ | 2,074,402 |
40 Annual Report
franklintempleton.com
FRANKLIN MUTUAL INTERNATIONAL FUND
NOTES TO FINANCIAL STATEMENTS
| Level 1 | Level 2 | Level 3 | Total | |||
| Liabilities: | ||||||
| Other Financial Instruments | ||||||
| Forward Exchange Contracts | $ — | $ | 374,409 | $ — | $ | 374,409 |
| aIncludes common and preferred stocks. | ||||||
| bFor detailed categories, see the accompanying Statement of Investments. | ||||||
A reconciliation of assets in which Level 3 inputs are used in determining fair value is presented when there are significant Level 3 financial instruments at the end of the year.
12. Subsequent Events
The Fund has evaluated subsequent events through the issuance of the financial statements and determined that no events have occurred that require disclosure other than those already disclosed in the financial statements.
| Abbreviations | |||||
| Counterparty | Currency | Selected Portfolio | |||
| BANT | Bank of America N.A. | CHF | Swiss Franc | ADR | American Depositary Receipt |
| BBU | Barclays Bank PLC | EUR | Euro | FHLB | Federal Home Loan Bank |
| BONY | Bank of New York Mellon | GBP | British Pound | ||
| DBFX | Deutsche Bank AG | USD | United States Dollar | ||
| FBCO | Credit Suisse Group AG | ||||
| HSBC | HSBC Bank USA, N.A. | ||||
| SSBT | State Street Bank and Trust Co., N.A. | ||||
franklintempleton.com
Annual Report
41
FRANKLIN MUTUAL INTERNATIONAL FUND
Report of Independent Registered Public Accounting Firm
To the Board of Trustees of Franklin Mutual Series Funds and Shareholders of Franklin Mutual International Fund:
We have audited the accompanying statement of assets and liabilities, including the statement of investments, of Franklin Mutual International Fund (the “Fund”) (one of the funds constituting Franklin Mutual Series Funds), as of December 31, 2015, and the related statement of operations for the year then ended, the statements of changes in net assets for each of the two years in the period then ended, and the financial highlights for each of the periods indicated therein. These financial statements and financial highlights are the responsibility of the Fund’s management. Our responsibility is to express an opinion on these financial statements and financial highlights based on our audits.
We conducted our audits in accordance with the standards of the Public Company Accounting Oversight Board (United States). Those standards require that we plan and perform the audit to obtain reasonable assurance about whether the financial statements and financial highlights are free of material misstatement. We were not engaged to perform an audit of the Fund’s internal control over financial reporting. Our audits included consideration of internal control over financial reporting as a basis for designing audit procedures that are appropriate in the circumstances, but not for the purpose of expressing an opinion on the effectiveness of the Fund’s internal control over financial reporting. Accordingly, we express no such opinion. An audit also includes examining, on a test basis, evidence supporting the amounts and disclosures in the financial statements and financial highlights, assessing the accounting principles used and significant estimates made by management, and evaluating the overall financial statement presentation. Our procedures included confirmation of securities owned as of December 31, 2015, by correspondence with the custodian and brokers, or by other appropriate auditing procedures where replies from the brokers were not received. We believe that our audits provide a reasonable basis for our opinion.
In our opinion, the financial statements and financial highlights referred to above present fairly, in all material respects, the financial position of Franklin Mutual International Fund (one of the funds constituting Franklin Mutual Series Funds) at December 31, 2015, the results of its operations for the year then ended, the changes in its net assets for each of the two years in the period then ended, and the financial highlights for each of the periods indicated therein, in conformity with U.S. generally accepted accounting principles.

Boston, Massachusetts
February 18, 2016
42 Annual Report
franklintempleton.com
FRANKLIN MUTUAL INTERNATIONAL FUND
Tax Information (unaudited)
Under Section 852(b)(3)(C) of the Internal Revenue Code (Code), the Fund hereby reports the maximum amount allowable but no less than $2,449,441 as a long term capital gain dividend for the fiscal year ended December 31, 2015.
Under Section 871(k)(2)(C) of the Code, the Fund hereby reports the maximum amount allowable but no less than $1,000,449 as a short term capital gain dividend for purposes of the tax imposed under Section 871(a)(1)(A) of the Code for the fiscal year ended December 31, 2015.
Under Section 854(b)(1)(B) of the Code, the Fund hereby reports the maximum amount allowable but no less than $2,697,376 as qualified dividends for purposes of the maximum rate under Section 1(h)(11) of the Code for the fiscal year ended December 31, 2015. Distributions, including qualified dividend income, paid during calendar year 2015 will be reported to shareholders on Form 1099-DIV by mid-February 2016. Shareholders are advised to check with their tax advisors for information on the treatment of these amounts on their individual income tax returns.
At December 31, 2015, more than 50% of the Fund’s total assets were invested in securities of foreign issuers. In most instances, foreign taxes were withheld from income paid to the Fund on these investments. As shown in the table below, the Fund hereby report to shareholders the foreign source income and foreign taxes paid, pursuant to Section 853 of the Code. This written statement will allow shareholders of record on December 17, 2015, to treat their proportionate share of foreign taxes paid by the Fund as having been paid directly by them. The shareholder shall consider these amounts as foreign taxes paid in the tax year in which they receive the Fund distribution.
The following table provides a detailed analysis of foreign tax paid, and foreign source income, and foreign source qualified dividends as reported by the Fund, to Class Z, Class A, Class C, Class R and Class R6 shareholders of record.
| Foreign Tax Paid | Foreign Source | Foreign Source Qualified | ||||
| Class | Per Share | Income Per Share | Dividends Per Share | |||
| Class Z | $ | 0.0176 | $ | 0.1598 | $ | 0.1081 |
| Class A | $ | 0.0176 | $ | 0.1332 | $ | 0.0903 |
| Class C | $ | 0.0176 | $ | 0.0593 | $ | 0.0400 |
| Class R | $ | 0.0176 | $ | 0.1292 | $ | 0.0876 |
| Class R6 | $ | 0.0176 | $ | 0.1704 | $ | 0.1154 |
Foreign Tax Paid Per Share (Column 1) is the amount per share available to you, as a tax credit (assuming you held your shares in the Fund for a minimum of 16 days during the 31-day period beginning 15 days before the ex-dividend date of the Fund’s distribution to which the foreign taxes relate), or, as a tax deduction.
Foreign Source Income Per Share (Column 2) is the amount per share of income dividends attributable to foreign securities held by the Fund, plus any foreign taxes withheld on these dividends. The amounts reported include foreign source qualified dividends that have not been adjusted for the rate differential applicable to such dividend income.1
Foreign Source Qualified Dividends Per Share (Column 3) is the amount per share of foreign source qualified dividends, plus any foreign taxes withheld on these dividends. These amounts represent the portion of the Foreign Source Income reported to you in column 2 that were derived from qualified foreign securities held by the Fund.1
By mid-February 2016, shareholders will receive Form 1099-DIV which will include their share of taxes paid and foreign source income distributed during the calendar year 2015. The Foreign Source Income reported on Form 1099-DIV has not been adjusted for the rate differential on foreign source qualified dividend income. Shareholders are advised to check with their tax advisors for information on the treatment of these amounts on their 2015 individual income tax returns.
1Qualified dividends are taxed at reduced long term capital gains tax rates. In determining the amount of foreign tax credit that may be applied against the U.S. tax liability of
individuals receiving foreign source qualified dividends, adjustments may be required to the foreign tax credit limitation calculation to reflect the rate differential applicable to
such dividend income. The rules however permit certain individuals to elect not to apply the rate differential adjustments for capital gains and/or dividends for any taxable year.
Please consult your tax advisor and the instructions to Form 1116 for more information.
franklintempleton.com
Annual Report
43
FRANKLIN MUTUAL INTERNATIONAL FUND
| Board Members and Officers | ||||
| The name, year of birth and address of the officers and board members, as well as their affiliations, positions held with the Fund, | ||||
| principal occupations during at least the past five years and number of portfolios overseen in the Franklin Templeton Investments | ||||
| fund complex, are shown below. Generally, each board member serves until that person’s successor is elected and qualified. | ||||
| Independent Board Members | ||||
| Number of Portfolios in | ||||
| Name, Year of Birth | Length of | Fund Complex Overseen | Other Directorships Held | |
| and Address | Position | Time Served | by Board Member* | During at Least the Past 5 Years |
| Edward I. Altman, Ph.D. (1941) | Trustee | Since 1987 | 17 | None |
| c/o Franklin Mutual Advisers, LLC | ||||
| 101 John F. Kennedy Parkway | ||||
| Short Hills, NJ 07078-2789 | ||||
| Principal Occupation During at Least the Past 5 Years: | ||||
| Max L. Heine Professor of Finance, Emeritus and Director of The Credit and Debt Markets Research Program, Salomon Center, Stern School | ||||
| of Business, New York University; editor and author of numerous financial publications; financial consultant; an adviser to numerous financial | ||||
| and publishing organizations; and formerly, Vice Director, Salomon Center, Stern School of Business, New York University. | ||||
| Ann Torre Bates (1958) | Trustee | Since 1995 | 41 | Navient Corporation (loan |
| c/o Franklin Mutual Advisers, LLC | management, servicing and asset | |||
| 101 John F. Kennedy Parkway | recovery) (2014-present), Ares Capital | |||
| Short Hills, NJ 07078-2789 | Corporation (specialty finance | |||
| company) (2010-present), United | ||||
| Natural Foods, Inc. (distributor of | ||||
| natural, organic and specialty foods) | ||||
| (2013-present), Allied Capital | ||||
| Corporation (financial services) | ||||
| (2003-2010) and SLM Corporation | ||||
| (Sallie Mae) (1997-2014). | ||||
| Principal Occupation During at Least the Past 5 Years: | ||||
| Director of various companies; and formerly, Executive Vice President and Chief Financial Officer, NHP Incorporated (manager of multifamily | ||||
| housing) (1995-1997); and Vice President and Treasurer, US Airways, Inc. (until 1995). | ||||
| Burton J. Greenwald (1929) | Trustee | Trustee since | 17 | Franklin Templeton Emerging Markets |
| c/o Franklin Mutual Advisers, LLC | and Vice | 2002 and Vice | Debt Opportunities Fund PLC and | |
| 101 John F. Kennedy Parkway | Chairman | Chairman since | Fiduciary International Ireland Limited | |
| Short Hills, NJ 07078-2789 | of the | April 2015 | (1999-2015). | |
| Board | ||||
| Principal Occupation During at Least the Past 5 Years: | ||||
| Managing Director, B.J. Greenwald Associates (management consultants to the financial services industry); and formerly, Chairman, | ||||
| Fiduciary Trust International Funds; Executive Vice President, L.F. Rothschild Fund Management, Inc.; President and Director, Merit Mutual | ||||
| Funds; President, Underwriting Division and Director, National Securities & Research Corporation; Governor, Investment Company Institute; | ||||
| and Chairman, ICI Public Information Committee. | ||||
| Keith E. Mitchell (1954) | Trustee | Since 2009 | 17 | None |
| c/o Franklin Mutual Advisers, LLC | ||||
| 101 John F. Kennedy Parkway | ||||
| Short Hills, NJ 07078-2789 | ||||
| Principal Occupation During at Least the Past 5 Years: | ||||
| Director of various boards of asset management firms; and formerly, Managing Member, Mitchell, Hartley & Bechtel Advisers, LLC (formerly, | ||||
| Mitchell Advisers, LLC) (advisory firm) (2003-2015) and Managing Director, Putnam Lovell NBF. | ||||
44 Annual Report
franklintempleton.com
FRANKLIN MUTUAL INTERNATIONAL FUND
| Independent Board Members (continued) | |||||
| Number of Portfolios in | |||||
| Name, Year of Birth | Length of | Fund Complex Overseen | Other Directorships Held | ||
| and Address | Position | Time Served | by Board Member* | During at Least the Past 5 Years | |
| David W. Niemiec (1949) | Trustee | Since | 41 | Emeritus Corporation (assisted living) | |
| One Franklin Parkway | April 2015 | (1999-2010) and OSI Pharmaceuticals, | |||
| San Mateo, CA 94403-1906 | Inc. (pharmaceutical products) | ||||
| (2006-2010). | |||||
| Principal Occupation During at Least the Past 5 Years: | |||||
| Advisor, Saratoga Partners (private equity fund); and formerly, Managing Director, Saratoga Partners (1998-2001) and SBC Warburg Dillon | |||||
| Read (investment banking) (1997-1998); Vice Chairman, Dillon, Read & Co. Inc. (investment banking) (1991-1997); and Chief Financial | |||||
| Officer, Dillon, Read & Co. Inc. (1982-1997). | |||||
| Charles Rubens II (1930) | Trustee | Since 1998 | 17 | None | |
| c/o Franklin Mutual Advisers, LLC | |||||
| 101 John F. Kennedy Parkway | |||||
| Short Hills, NJ 07078-2789 | |||||
| Principal Occupation During at Least the Past 5 Years: | |||||
| Private investor and president of non-profit organizations; and formerly, an executive of Time, Inc.; and Trustee of Colorado College. | |||||
| Jan Hopkins Trachtman (1947) | Trustee | Since 2009 | 17 | None | |
| c/o Franklin Mutual Advisers, LLC | |||||
| 101 John F. Kennedy Parkway | |||||
| Short Hills, NJ 07078-2789 | |||||
| Principal Occupation During at Least the Past 5 Years: | |||||
| President and Founder, the Jan Hopkins Group (communications consulting firm); serves on Advisory Board of Knight Bagehot Fellowship; | |||||
| and formerly, President, Economic Club of New York (2001-2015); Anchor/Correspondent, CNN Financial News (until 2003); Managing | |||||
| Director and Head of Client Communications, Citigroup Private Bank (until 2005); Off-Air Reporter, ABC News’ World News Tonight; and | |||||
| Editor, CBS Network News. | |||||
| Robert E. Wade (1946) | Trustee | Trustee since | 41 | El Oro Ltd (investments) | |
| c/o Franklin Mutual Advisers, LLC | and | 1993 | and | (2003-present). | |
| 101 John F. Kennedy Parkway | Chairman | Chairman | |||
| Short Hills, NJ 07078-2789 | of the | of the Board | |||
| Board | since 2005 | ||||
| Principal Occupation During at Least the Past 5 Years: | |||||
| Attorney at law engaged in private practice (1972-2008) and member of various boards. | |||||
| Gregory H. Williams (1943) | Trustee | Since | 17 | None | |
| One Franklin Parkway | April 2015 | ||||
| San Mateo, CA 94403-1906 | |||||
| Principal Occupation During at Least the Past 5 Years: | |||||
| Private investor; Consultant; and formerly, President, University of Cincinnati (2009-2012); President, The City College of New York | |||||
| (2001-2009); Dean, College of Law, Ohio State University (1993-2001); and Associate Vice President, Academic Affairs and Professor of Law, | |||||
| University of Iowa (1977-1993). | |||||
franklintempleton.com
Annual Report
45
FRANKLIN MUTUAL INTERNATIONAL FUND
| Interested Board Members and Officers | ||||
| Number of Portfolios in | ||||
| Name, Year of Birth | Length of | Fund Complex Overseen | Other Directorships Held | |
| and Address | Position | Time Served | by Board Member* | During at Least the Past 5 Years |
| **Gregory E. Johnson (1961) | Trustee | Since 2007 | 164 | None |
| One Franklin Parkway | ||||
| San Mateo, CA 94403-1906 | ||||
| Principal Occupation During at Least the Past 5 Years: | ||||
| Chairman of the Board, Member – Office of the Chairman, Director and Chief Executive Officer, Franklin Resources, Inc.; officer and/or | ||||
| director or trustee, as the case may be, of some of the other subsidiaries of Franklin Resources, Inc. and of 44 of the investment companies in | ||||
| Franklin Templeton Investments; Vice Chairman, Investment Company Institute; and formerly, President, Franklin Resources, Inc. | ||||
| (1994-2015). | ||||
| **Peter A. Langerman (1955) | Trustee, | Trustee | 7 | American International Group, Inc. |
| c/o Franklin Mutual Advisers, LLC | President, | since 2007, | (AIG) Credit Facility Trust | |
| 101 John F. Kennedy Parkway | and Chief | President, and | (2010-2011). | |
| Short Hills, NJ 07078-2702 | Executive | Chief Executive | ||
| Officer – | Officer – | |||
| Investment | Investment | |||
| Management | Management | |||
| since 2005 | ||||
| Principal Occupation During at Least the Past 5 Years: | ||||
| Chairman of the Board, Chief Executive Officer and President, Franklin Mutual Advisers, LLC; and officer and/or director, as the case may be, | ||||
| of two of the investment companies in Franklin Templeton Investments. | ||||
| Alison E. Baur (1964) | Vice | Since 2012 | Not Applicable | Not Applicable |
| One Franklin Parkway | President | |||
| San Mateo, CA 94403-1906 | ||||
| Principal Occupation During at Least the Past 5 Years: | ||||
| Deputy General Counsel, Franklin Templeton Investments; and officer of some of the other subsidiaries of Franklin Resources, Inc. and of 44 | ||||
| of the investment companies in Franklin Templeton Investments. | ||||
| Philippe Brugere-Trelat (1949) | Vice | Since 2005 | Not Applicable | Not Applicable |
| 101 John F. Kennedy Parkway | President | |||
| Short Hills NJ 07078-2789 | ||||
| Principal Occupation During at Least the Past 5 Years: | ||||
| Executive Vice President, Franklin Mutual Advisers, LLC; officer of two of the investment companies in Franklin Templeton Investments; and | ||||
| formerly, Portfolio Manager of Eurovest SA (French registered Investment Company, Sicav). | ||||
| Laura F. Fergerson (1962) | Chief | Since 2009 | Not Applicable | Not Applicable |
| One Franklin Parkway | Executive | |||
| San Mateo, CA 94403-1906 | Officer – | |||
| Finance and | ||||
| Administration | ||||
| Principal Occupation During at Least the Past 5 Years: | ||||
| Senior Vice President, Franklin Templeton Services, LLC; Vice President, Franklin Advisers, Inc. and Franklin Templeton Institutional, LLC; | ||||
| and officer of 44 of the investment companies in Franklin Templeton Investments. | ||||
| Aliya S. Gordon (1973) | Vice | Since 2009 | Not Applicable | Not Applicable |
| One Franklin Parkway | President | |||
| San Mateo, CA 94403-1906 | ||||
| Principal Occupation During at Least the Past 5 Years: | ||||
| Senior Associate General Counsel, Franklin Templeton Investments; and officer of 44 of the investment companies in Franklin Templeton | ||||
| Investments. | ||||
46 Annual Report
franklintempleton.com
FRANKLIN MUTUAL INTERNATIONAL FUND
| Interested Board Members and Officers (continued) | ||||
| Number of Portfolios in | ||||
| Name, Year of Birth | Length of | Fund Complex Overseen | Other Directorships Held | |
| and Address | Position | Time Served | by Board Member* | During at Least the Past 5 Years |
| Steven J. Gray (1955) | Secretary | Secretary | Not Applicable | Not Applicable |
| One Franklin Parkway | and Vice | since 2005 and | ||
| San Mateo, CA 94403-1906 | President | Vice President | ||
| since 2009 | ||||
| Principal Occupation During at Least the Past 5 Years: | ||||
| Senior Associate General Counsel, Franklin Templeton Investments; Vice President, Franklin Templeton Distributors, Inc. and Franklin | ||||
| Alternative Strategies Advisers, LLC; and officer of 44 of the investment companies in Franklin Templeton Investments. | ||||
| Selena L. Holmes (1965) | Vice | Since 2012 | Not Applicable | Not Applicable |
| 100 Fountain Parkway | President – | |||
| St. Petersburg, FL 33716-1205 | AML | |||
| Compliance | ||||
| Principal Occupation During at Least the Past 5 Years: | ||||
| Director, Global Compliance Monitoring; Chief Compliance Officer, Franklin Alternative Strategies Advisers, LLC; Vice President, Franklin | ||||
| Templeton Companies, LLC; and officer of 44 of the investment companies in Franklin Templeton Investments. | ||||
| Robert G. Kubilis (1973) | Treasurer, | Since 2012 | Not Applicable | Not Applicable |
| 300 S.E. 2nd Street | Chief | |||
| Fort Lauderdale, FL 33301-1923 | Financial | |||
| Officer and | ||||
| Chief | ||||
| Accounting | ||||
| Officer | ||||
| Principal Occupation During at Least the Past 5 Years: | ||||
| Treasurer, U.S. Fund Administration & Reporting, Franklin Templeton Investments; and officer of four of the investment companies in Franklin | ||||
| Templeton Investments. | ||||
| Kimberly H. Novotny (1972) | Vice | Since 2013 | Not Applicable | Not Applicable |
| 300 S.E. 2nd Street | President | |||
| Fort Lauderdale, FL 33301-1923 | ||||
| Principal Occupation During at Least the Past 5 Years: | ||||
| Associate General Counsel, Franklin Templeton Investments; Vice President, Fiduciary Trust International of the South and Templeton | ||||
| Investment Counsel, LLC; Assistant Secretary, Franklin Resources, Inc.; and officer of 44 of the investment companies in Franklin Templeton | ||||
| Investments. | ||||
| Robert C. Rosselot (1960) | Chief | Since 2013 | Not Applicable | Not Applicable |
| 300 S.E. 2nd Street | Compliance | |||
| Fort Lauderdale, FL 33301-1923 | Officer | |||
| Principal Occupation During at Least the Past 5 Years: | ||||
| Director, Global Compliance, Franklin Templeton Investments; Vice President, Franklin Templeton Companies, LLC; officer of 44 of the | ||||
| investment companies in Franklin Templeton Investments; and formerly, Senior Associate General Counsel, Franklin Templeton Investments | ||||
| (2007-2013); and Secretary and Vice President, Templeton Group of Funds (2004-2013). | ||||
| Karen L. Skidmore (1952) | Vice | Since 2009 | Not Applicable | Not Applicable |
| One Franklin Parkway | President | |||
| San Mateo, CA 94403-1906 | ||||
| Principal Occupation During at Least the Past 5 Years: | ||||
| Senior Associate General Counsel, Franklin Templeton Investments; and officer of 44 of the investment companies in Franklin Templeton | ||||
| Investments. | ||||
franklintempleton.com
Annual Report
47
FRANKLIN MUTUAL INTERNATIONAL FUND
| Interested Board Members and Officers (continued) | ||||
| Number of Portfolios in | ||||
| Name, Year of Birth | Length of | Fund Complex Overseen | Other Directorships Held | |
| and Address | Position | Time Served | by Board Member* | During at Least the Past 5 Years |
| Navid Tofigh (1972) | Vice | Since | Not Applicable | Not Applicable |
| One Franklin Parkway | President | November 2015 | ||
| San Mateo, CA 94403-1906 | ||||
| Principal Occupation During at Least the Past 5 Years: | ||||
| Associate General Counsel, Franklin Templeton Investments; and officer of 44 of the investment companies in Franklin Templeton | ||||
| Investments. | ||||
| Craig S. Tyle (1960) | Vice | Since 2005 | Not Applicable | Not Applicable |
| One Franklin Parkway | President | |||
| San Mateo, CA 94403-1906 | ||||
| Principal Occupation During at Least the Past 5 Years: | ||||
| General Counsel and Executive Vice President, Franklin Resources, Inc.; and officer of some of the other subsidiaries of Franklin Resources, | ||||
| Inc. and of 44 of the investment companies in Franklin Templeton Investments. | ||||
| Lori A. Weber (1964) | Vice | Since 2011 | Not Applicable | Not Applicable |
| 300 S.E. 2nd Street | President | |||
| Fort Lauderdale, FL 33301-1923 | ||||
| Principal Occupation During at Least the Past 5 Years: | ||||
| Senior Associate General Counsel, Franklin Templeton Investments; Assistant Secretary, Franklin Resources, Inc.; Vice President and | ||||
| Secretary, Templeton Investment Counsel, LLC; and officer of 44 of the investment companies in Franklin Templeton Investments. | ||||
*We base the number of portfolios on each separate series of the U.S. registered investment companies within the Franklin Templeton Investments fund complex. These
portfolios have a common investment manager or affiliated investment managers.
**Gregory E. Johnson is considered to be an interested person of the Fund under the federal securities laws due to his position as an officer and director of Franklin
Resources, Inc., which is the parent company of the Fund’s investment manager and distributor. Peter A. Langerman is considered to be an interested person of the Fund
under the federal securities laws due to his position as an officer of Franklin Mutual Advisers, LLC, which is an affiliate of the Fund’s investment manager.
Note 1: Officer information is current as of the date of this report. It is possible that after this date, information about officers may change.
The Fund’s Board has determined that certain of the members of the Audit Committee, including Ann Torre Bates, are audit committee financial experts, and
“independent,” under those provisions of the Sarbanes-Oxley Act of 2002, and the rules and form amendments adopted by the Securities and Exchange
Commission, relating to audit committee financial experts.
The Statement of Additional Information (SAI) includes additional information about the board members and is available, without charge, upon request.
Shareholders may call (800) DIAL BEN/342-5236 to request the SAI.
48 Annual Report
franklintempleton.com
FRANKLIN MUTUAL INTERNATIONAL FUND
Shareholder Information
Proxy Voting Policies and Procedures
The Fund’s investment manager has established Proxy Voting Policies and Procedures (Policies) that the Fund uses to determine how to vote proxies relating to portfolio securities. Shareholders may view the Fund’s complete Policies online at franklintempleton.com. Alternatively, shareholders may request copies of the Policies free of charge by calling the Proxy Group collect at (954) 527-7678 or by sending a written request to: Franklin Templeton Companies, LLC, 300 S.E. 2nd Street, Fort Lauderdale, FL 33301, Attention: Proxy Group. Copies of the Fund’s proxy voting records are also made available online at franklintempleton.com and posted on the U.S. Securities and Exchange Commission’s website at sec.gov and reflect the most recent 12-month period ended June 30.
Quarterly Statement of Investments
The Fund files a complete statement of investments with the U.S. Securities and Exchange Commission for the first and third quarters for each fiscal year on Form N-Q. Shareholders may view the filed Form N-Q by visiting the Commission’s website at sec.gov. The filed form may also be viewed and copied at the Commission’s Public Reference Room in Washington, DC. Information regarding the operations of the Public Reference Room may be obtained by calling (800) SEC-0330.
Householding of Reports and Prospectuses
You will receive the Fund’s financial reports every six months as well as an annual updated summary prospectus (prospectus available upon request). To reduce Fund expenses, we try to identify related shareholders in a household and send only one copy of the financial reports and summary prospectus. This process, called “householding,” will continue indefinitely unless you instruct us otherwise. If you prefer not to have these documents householded, please call us at (800) 632-2301. At any time you may view current prospectuses/summary prospectuses and financial reports on our website. If you choose, you may receive these documents through electronic delivery.
franklintempleton.com
Annual Report
49
This page intentionally left blank
This page intentionally left blank
This page intentionally left blank
| Contents | |
| Annual Report | |
| Franklin Mutual Quest Fund | 3 |
| Performance Summary | 8 |
| Your Fund’s Expenses | 13 |
| Financial Highlights and Statement of Investments | 15 |
| Financial Statements | 28 |
| Notes to Financial Statements | 32 |
| Report of Independent Registered | |
| Public Accounting Firm | 47 |
| Tax Information | 48 |
| Board Members and Officers | 49 |
| Shareholder Information | 54 |
Visit franklintempleton.com for fund updates, to access your account, or to find helpful financial planning tools.
2 Annual Report
franklintempleton.com
Annual Report
Franklin Mutual Quest Fund
This annual report for Franklin Mutual Quest Fund covers the fiscal year ended December 31, 2015. We welcome the former shareholders of Franklin Mutual Recovery Fund that now own shares of Franklin Mutual Quest Fund as a result of Franklin Mutual Recovery Fund’s reorganization that took effect on August 27, 2015.
Your Fund’s Goals and Main Investments
The Fund seeks capital appreciation, which may occasionally be short term, with income as a secondary goal, by investing primarily in equity securities of companies that we believe are at prices below their intrinsic value. The Fund may invest up to 50% of its assets in foreign securities.
Performance Overview
The Fund’s Class Z shares had a -5.55% cumulative total return for the 12 months ended December 31, 2015. In comparison, the Fund’s benchmark, the Standard & Poor’s 500 Index (S&P 500®), which is a broad measure of U.S. stock market performance, posted a +1.38% total return.1 You can find more of the Fund’s performance data in the Performance Summary beginning on page 8.
Performance data represent past performance, which does not guarantee future results. Investment return and principal value will fluctuate, and you may have a gain or loss when you sell your shares. Current performance may differ from figures shown. For most recent month-end performance, go to franklintempleton.com or call (800) 342-5236.
Economic and Market Overview
U.S. economic growth slowed in 2015’s first quarter but strengthened in 2015’s second quarter amid healthy consumer spending. The third and fourth quarters were less robust as exports slowed and state and local governments reduced their spending. At its December meeting, the U.S. Federal Reserve (Fed) increased its target range for the federal funds rate to 0.25%–0.50%, as policymakers cited the labor market’s considerable improvement and were reasonably confident that inflation would move back to the Fed’s 2% medium-term
*Figures are stated as a percentage of total and may not equal 100% or may be negative due to rounding, use of any derivatives, unsettled trades or other factors.
objective. Furthermore, the Fed raised its forecast for 2016 U.S. economic growth and lowered its unemployment projection. Despite periods of volatility, the broad U.S. stock market, as measured by the S&P 500 Index, generated a modest positive total return for 2015.
The global economy expanded moderately during the 12 months under review. As measured by the MSCI World Index, stocks in global developed markets overall were down slightly for the year despite some positive developments. Weighing on global stocks at times were worries about China’s slowing economy and tumbling stock market, declining commodity prices, geopolitical tensions between Russia and Turkey, and ongoing uncertainty over the Fed’s timing for raising interest rates. Toward period-end, equity markets recovered somewhat as the Fed increased its federal funds target range, alleviating some

1. Source: Morningstar. The index is unmanaged and includes reinvestment of any income or distributions. One cannot invest directly in an index, and an index is not
representative of the Fund’s portfolio.
See www.franklintempletondatasources.com for additional data provider information.
The dollar value, number of shares or principal amount, and names of all portfolio holdings are listed in the Fund’s Statement of Investments (SOI).
The SOI begins on page 20.
franklintempleton.com
Annual Report
3
FRANKLIN MUTUAL QUEST FUND
uncertainty about a change in the U.S. monetary policy. During the year, oil prices declined sharply largely due to increased global supply that exceeded demand. Gold and other commodity prices also fell. The U.S. dollar appreciated against most currencies during the period, which reduced returns of many foreign assets in U.S. dollar terms.
In Europe, U.K. economic growth gained momentum from the services sector, but the economy slowed in 2015 compared with 2014. The eurozone grew moderately and generally benefited during the year from lower oil prices, a weaker euro that supported exports, the European Central Bank’s (ECB’s) accommodative policy and expectations of further ECB stimulus. Although the eurozone’s annual inflation rate declined early in the period, it rose slightly during the rest of the period. The ECB maintained its benchmark interest rates although it reduced its bank deposit rate in December, seeking to boost the region’s slowing growth.
Japan’s economy continued to grow in 2015’s first quarter. After a decline in the second quarter of 2015, it expanded in the third quarter as capital expenditures improved. The Bank of Japan took several actions during the reporting period, including maintaining its monetary policy, lowering its economic growth and inflation forecasts, and reorganizing its stimulus program to increase exposure to long-term government bonds and exchange-traded funds.
China’s economy grew at a less robust pace in 2015 than in 2014, as strength in services and consumption was offset by weakness in fixed-asset investment, imports and exports, and manufacturing. The Chinese government’s efforts to promote stable growth supported China’s domestic stock market in 2015’s first half. However, tight liquidity conditions and uncertainties about the central bank’s monetary policy led China’s domestic market to correct from June through August, contributing to a global stock market correction. The government’s intervention to cool domestic stock market speculation and its effective currency devaluation led to a severe slump in emerging market stocks from June through August. Although equities in China and most other emerging markets gained in October after China expanded its monetary and fiscal stimulus, they generally declined for the remainder of the year amid concerns about declining commodity prices and China’s moderating economy.
Investment Strategy
At Franklin Mutual Series, we are committed to our distinctive value approach to investing, which we believe can generate above-average risk-adjusted returns over time for our shareholders. Our major investment strategy is investing in undervalued stocks. When selecting undervalued equities, we are attracted to what we believe are fundamentally strong companies with healthy balance sheets, high-quality assets, substantial free cash flow and shareholder-oriented management teams and whose stocks are trading at discounts to our assessment of the companies’ intrinsic or business value. We also look for asset rich companies whose shares may be trading at depressed levels due to concerns over short-term earnings disappointments, litigation, management strategy or other perceived negatives. This strict value approach is not only intended to improve the likelihood of upside potential, but it is also intended to reduce the risk of substantial declines. While the vast majority of our undervalued equity investments are made in publicly traded companies globally, we may invest occasionally in privately held companies as well.
We complement this more traditional investment strategy with two others. One is distressed investing, a highly specialized field that has proven quite profitable during certain periods over the years. Distressed investing is complex and can take many forms. The most common distressed investment the Fund undertakes is the purchase of financially troubled or bankrupt companies’ debt at a substantial discount to face value. After the financially distressed company is reorganized, often in bankruptcy court, the old debt is typically replaced with new securities issued by the financially stronger company.
The other piece of our investment strategy is participating in arbitrage situations, another highly specialized field. When companies announce proposed mergers or takeovers, commonly referred to as “deals,” the target company may trade at a discount to the bid it ultimately accepts. One form of arbitrage involves purchasing the target company’s stock when it is trading below the value we believe it would receive in a deal. In keeping with our commitment to a relatively conservative
| Top 10 Sectors/Industries | ||
| Based on Equity Securities as of 12/31/15 | ||
| % of Total | ||
| Net Assets | ||
| Insurance | 7.6 | % |
| Banks | 7.0 | % |
| Tobacco | 4.6 | % |
| Oil, Gas & Consumable Fuels | 4.5 | % |
| Technology Hardware, Storage & Peripherals | 4.0 | % |
| Media | 3.7 | % |
| Wireless Telecommunication Services | 3.1 | % |
| Pharmaceuticals | 2.9 | % |
| Real Estate Investment Trusts (REITs) | 2.5 | % |
| Diversified Telecommunication Services | 2.5 | % |
4 Annual Report
franklintempleton.com
FRANKLIN MUTUAL QUEST FUND
investment approach, we typically focus our arbitrage efforts on announced deals, and eschew rumored deals or other situations we consider relatively risky.
In addition, it is our practice to hedge the Fund’s currency exposure when we deem it advantageous for our shareholders.
What is meant by “hedge”?
To hedge an investment is to take a position intended to offset potential losses/gains that may be incurred by a companion financial instrument.
Manager’s Discussion
During the 12 months under review, stocks in most global markets declined after a three-year ascent. Globally, several major central banks became more accommodative while fiscal authorities focused on budgetary discipline. Large companies also remained disciplined about operating costs, with margins at historically high levels in many industries and countries. To drive further growth, an increasing number of companies took advantage of low interest rates to finance deals. In this environment, we saw a number of opportunities.
Equity prices are typically forward looking, reflecting investors’ beliefs about how various factors and events will play out in the future. Global equity prices at period-end were down from mid-2015 highs, reflecting increased uncertainty among global investors regarding China and other emerging markets, global commodity prices, U.S. monetary policy divergence and geopolitical events. However, with the support of global quantitative easing, many corporations have been able to build strong balance sheets, focus intensely on improving efficiency, maintain historically high margins and return a significant amount of capital to shareholders.
Merger and acquisition (M&A) activity accelerated in the past 12 months, helping to support valuations. Deal volumes reached historical highs and regulators globally increased their scrutiny of potential negative effects of high concentration. Such an environment — active M&A combined with regulatory uncertainty, greater complexity and market volatility — may provide attractive investment opportunities. We seek to use a mixture of merger arbitrage positions and investments in one or both of the companies to participate in these opportunities. The traditional merger arbitrage positions are constructed solely to benefit from deal completion, while unhedged investments in one or both companies can allow the Fund to benefit from possible value creation once the deal is completed.
Distressed debt remained a difficult market in which we could find compelling new opportunities. Low interest rates have kept credit widely available, and we felt bankruptcies were limited, except in the energy and mining sectors. Increased stress in high yield markets, particularly in energy credit, has expanded the potential opportunity set for us. For non-energy firms, costs of issuing debt are climbing and these debt securities are starting to look attractive to us. Within energy, declining commodity prices increased financial pressures for a growing number of issuers. At year-end, a record level of crude oil inventories and insistence by Saudi Arabia that it will not reduce production provide little reason to expect a quick recovery in crude oil prices, implying to us an increased likelihood of new investment opportunities in energy sector debt.
During the year, the Fund continued to have higher exposure to credit than the other Mutual Series funds, reflecting an opportunistic view of the managers to invest in stressed and distressed debt. The Fund may continue to have a larger portion of its assets invested in debt if the managers feel the opportunities are attractive.
Turning to Fund performance, top contributors included insurance company Ageas, telecommunications provider Koninklijke KPN and Imperial Tobacco.
Headquartered in Belgium, Ageas is a diversified insurer with operations in Europe and Asia. The company’s stock price rose in 2015 as Ageas improved its underlying insurance results
| Top 10 Equity Holdings | ||
| 12/31/15 | ||
| Company | % of Total | |
| Sector/Industry, Country | Net Assets | |
| Samsung Electronics Co. Ltd., ord & pfd. | 3.1 | % |
| Technology Hardware, Storage & Peripherals, South Korea | ||
| Vodafone Group PLC | 3.1 | % |
| Wireless Telecommunication Services, U.K. | ||
| Spirit Realty Capital Inc. | 2.5 | % |
| Real Estate Investment Trusts (REITs), U.S. | ||
| Koninklijke KPN NV | 2.5 | % |
| Diversified Telecommunication Services, Netherlands | ||
| White Mountains Insurance Group Ltd. | 2.4 | % |
| Insurance, U.S. | ||
| Forest City Enterprises Inc., A | 2.3 | % |
| Real Estate Management & Development, U.S. | ||
| CIT Group Inc. | 2.1 | % |
| Banks, U.S. | ||
| NRG Energy Inc. | 1.9 | % |
| Independent Power & Renewable Electricity | ||
| Producers, U.S. | ||
| RSA Insurance Group PLC | 1.9 | % |
| Insurance, U.K. | ||
| Royal Dutch Shell PLC, A | 1.9 | % |
| Oil, Gas & Consumable Fuels, U.K. |
franklintempleton.com
Annual Report 5
FRANKLIN MUTUAL QUEST FUND
while focusing on cash generation. The company disclosed a solid capital position under new eurozone capitalization guidelines for insurers, reassuring investors. In late August, Ageas announced the sale of its Hong Kong life insurance business at a valuation that, in our view, was quite favorable.
KPN is the incumbent telecommunications operator in the Netherlands. In July, management raised 2015 earnings and free cash flow guidance while announcing a special dividend that would redistribute the substantial dividend KPN received from Telefonica Deutschland. KPN holds a stake in Telefonica Deutschland that stems from a 2014 sale of its German E-Plus unit. In April, KPN sold BASE Company, a Belgium-based mobile business, as part of an ongoing process to simplify its structure to focus on its core business and improve operating performance. We also viewed positively KPN’s selection of its new chairman in February 2015 because of his management record in the industry.
U.K.-based Imperial Tobacco has global operations in over 160 countries. In 2015, Reynolds American and Lorillard, two U.S.-based tobacco manufacturers, merged. As part of an agreement with the U.S. Federal Trade Commission, the merging companies agreed to divest several of their brands to Imperial Tobacco, including Kool, Salem and Winston. We believe the price Imperial Tobacco paid for these assets was attractive and, in our view, the newly acquired brands enhance the quality of the company’s portfolio, increase its market share and provide cost saving opportunities, all of which may help it become stronger and more profitable in the U.S. market. During the period, Imperial Tobacco also reported interim and full-year financial results that exceeded market expectations, enabling the company to raise its dividend and return more cash to shareholders.
During the period under review, some of the Fund’s investments that negatively affected performance were power generation companies NRG Energy and Texas Competitive Electric Holdings (TCEH) and retailer Macy’s.
NRG Energy is a U.S.-based integrated wholesale power generation and retail electricity company that includes solar and renewable energy businesses. The stock price declined in 2015 as natural gas and coal prices fell, resulting in lower revenues for NRG’s wholesale power operation, which sells electricity at market rates that move in line with fuel costs. In mid-December, the price of natural gas retreated to its lowest level since 2002. Investors also became increasingly unhappy with the short-term lack of return on investment from the company’s solar power business. As a result, NRG announced in September that it would package its solar power, electric vehicle charging and renewable energy operations into a new company.
The value of our TCEH debt holdings declined in 2015 due to lower natural gas and coal prices that reduced the market rates for its electricity sales. Notably, in early December, natural gas retreated to its lowest price in over a decade. TCEH is a unit of Energy Future Holdings, the largest power company in Texas, which filed for bankruptcy in 2014 after defaulting on debt associated with a $45 billion leveraged buyout of the company in 2007, just as energy prices began to decline. The company intends to emerge from bankruptcy in 2016 with less leverage on its balance sheet.
U.S.-based Macy’s operates department stores and online shopping sites under its brand names Macy’s and Bloomingdales. The company’s stock price plunged in November after announcing, after months of review by its board, that it would continue to explore real estate transactions on an individual basis but would not place its property assets into a real estate investment trust (REIT). The company stated that, in its judgment, forming a REIT did not offer sufficient upside potential, and it would explore other real estate-related structures. Shares were also hurt by weak quarterly results announced in August and November, largely driven by unseasonably warm weather and reduced buying by international visitors due to a stronger U.S. dollar.
During the year, the Fund held currency forwards and futures to hedge a portion of the currency risk of the portfolio’s non-U.S. dollar investments. The currency forwards had a positive impact on the Fund’s performance, and currency futures had a negligible impact.
What is a currency forward contract?
A currency forward contract, or a currency forward, is an agreement between the Fund and a counterparty to buy or sell a foreign currency at a specific exchange rate on a future date.
What is a futures contract?
A futures contract, or a future, is an agreement between the Fund and a counterparty made through a U.S. or foreign futures exchange to buy or sell an underlying instrument or asset at a specific price on a future date.
6 Annual Report
franklintempleton.com
FRANKLIN MUTUAL QUEST FUND
As fellow shareholders, we found recent relative and absolute performance disappointing, but it is not uncommon for our strategy to lag the equity markets at times. We remain committed to our disciplined, value investment approach as we seek to generate attractive, long-term, risk-adjusted returns for shareholders. Thank you for your continued participation in Franklin Mutual Quest Fund. We look forward to continuing to serve your investment needs.

CFA® is a trademark owned by CFA Institute.
Shawn Tumulty has been a portfolio manager for Franklin Mutual Quest Fund since 2003 and a co-portfolio manager since 2010. He joined Franklin Templeton Investments in 2000. Prior to joining Franklin Templeton Investments, Mr. Tumulty was an analyst and portfolio manager at Hamilton Partners Limited.
Keith Luh has been a co-portfolio manager for Franklin Mutual Quest Fund since 2010. He is also a research analyst specializing in distressed securities, merger and capital structure arbitrage, and event-driven situations. Prior to joining Franklin Mutual Series in 2005, Mr. Luh was an analyst in global investment research at Putnam Investments, where he also helped manage a best-ideas research fund. Previously, he worked in the investment banking group at Volpe Brown Whelan and Co., LLC, and the derivative products trading group at BNP Paribas. Mr. Luh is also Adjunct Professor in Finance and Economics at the Graduate School of Business, Columbia University and the Gabelli School of Business, Fordham University.
The foregoing information reflects our analysis, opinions and portfolio holdings as of December 31, 2015, the end of the reporting period. The way we implement our main investment strategies and the resulting portfolio holdings may change depending on factors such as market and economic conditions. These opinions may not be relied upon as investment advice or an offer for a particular security. The information is not a complete analysis of every aspect of any market, country, industry, security or the Fund. Statements of fact are from sources considered reliable, but the investment manager makes no representation or warranty as to their completeness or accuracy. Although historical performance is no guarantee of future results, these insights may help you understand our investment management philosophy.
franklintempleton.com
Annual Report 7
FRANKLIN MUTUAL QUEST FUND
Performance Summary as of December 31, 2015
Your dividend income will vary depending on dividends or interest paid by securities in the Fund’s portfolio, adjusted for operating expenses of each class. Capital gain distributions are net profits realized from the sale of portfolio securities. The performance table and graphs do not reflect any taxes that a shareholder would pay on Fund dividends, capital gain distributions, if any, or any realized gains on the sale of Fund shares. Total return reflects reinvestment of the Fund’s dividends and capital gain distributions, if any, and any unrealized gains or losses.
| Net Asset Value | ||||||||
| Share Class (Symbol) | 12/31/15 | 12/31/14 | Change | |||||
| Z (MQIFX) | $ | 14.47 | $ | 16.21 | -$ | 1.74 | ||
| A (TEQIX) | $ | 14.29 | $ | 16.02 | -$ | 1.73 | ||
| C (TEMQX) | $ | 14.08 | $ | 15.78 | -$ | 1.70 | ||
| R (FMQSX) | $ | 14.14 | $ | 15.87 | -$ | 1.73 | ||
| R6 (FMQRX) | $ | 14.45 | $ | 16.19 | -$ | 1.74 | ||
| Distributions1 (1/1/15–12/31/15) | ||||||||
| Dividend | Short-Term | Long-Term | ||||||
| Share Class | Income | Capital Gain | Capital Gain | Total | ||||
| Z | $ | 0.6826 | $ | 0.0285 | $ | 0.1206 | $ | 0.8317 |
| A | $ | 0.6364 | $ | 0.0285 | $ | 0.1206 | $ | 0.7855 |
| C | $ | 0.5201 | $ | 0.0285 | $ | 0.1206 | $ | 0.6692 |
| R | $ | 0.6156 | $ | 0.0285 | $ | 0.1206 | $ | 0.7647 |
| R6 | $ | 0.6950 | $ | 0.0285 | $ | 0.1206 | $ | 0.8441 |
See page 12 for Performance Summary footnotes.
8 Annual Report
franklintempleton.com
FRANKLIN MUTUAL QUEST FUND
PERFORMANCE SUMMARY
Performance as of 12/31/152
Cumulative total return excludes sales charges. Average annual total return and value of $10,000 investment include maximum sales charges. Class Z/R/R6: no sales charges; Class A: 5.75% maximum initial sales charge; Class C: 1% contingent deferred sales charge in first year only.
| Cumulative | Average Annual | Value of $10,000 | Total Annual | |||||
| Share Class | Total Return3 | Total Return4 | Investment5 | Operating Expenses6 | ||||
| Z | 0.81 | % | ||||||
| 1-Year | -5.55 | % | -5.55 | % | $ | 9,445 | ||
| 5-Year | +36.00 | % | +6.34 | % | $ | 13,600 | ||
| 10-Year | +75.61 | % | +5.79 | % | $ | 17,561 | ||
| A | 1.11 | % | ||||||
| 1-Year | -5.85 | % | -11.27 | % | $ | 8,873 | ||
| 5-Year | +33.95 | % | +4.77 | % | $ | 12,626 | ||
| 10-Year | +70.29 | % | +4.85 | % | $ | 16,052 | ||
| C | 1.81 | % | ||||||
| 1-Year | -6.49 | % | -7.39 | % | $ | 9,261 | ||
| 5-Year | +29.35 | % | +5.28 | % | $ | 12,935 | ||
| 10-Year | +58.97 | % | +4.74 | % | $ | 15,897 | ||
| R | 1.31 | % | ||||||
| 1-Year | -6.03 | % | -6.03 | % | $ | 9,397 | ||
| 5-Year | +32.65 | % | +5.81 | % | $ | 13,265 | ||
| Since Inception (5/1/09) | +72.93 | % | +8.56 | % | $ | 17,293 | ||
| R6 | 0.74 | % | ||||||
| 1-Year | -5.54 | % | -5.54 | % | $ | 9,446 | ||
| Since Inception (5/1/13) | +12.30 | % | +4.44 | % | $ | 11,230 |
Performance data represent past performance, which does not guarantee future results. Investment return and principal value will fluctuate, and you may have a gain or loss when you sell your shares. Current performance may differ from figures shown. For most recent month-end performance, go to franklintempleton.com or call (800) 342-5236.
See page 12 for Performance Summary footnotes.
franklintempleton.com
Annual Report 9
FRANKLIN MUTUAL QUEST FUND
PERFORMANCE SUMMARY
Total Return Index Comparison for a Hypothetical $10,000 Investment2
Total return represents the change in value of an investment over the periods shown. It includes any applicable maximum sales charge, Fund expenses, account fees and reinvested distributions. The unmanaged index includes reinvestment of any income or distributions. It differs from the Fund in composition and does not pay management fees or expenses. One cannot invest directly in an index.
See page 12 for Performance Summary footnotes.
10 Annual Report
franklintempleton.com
FRANKLIN MUTUAL QUEST FUND
PERFORMANCE SUMMARY

See page 12 for Performance Summary footnotes.
franklintempleton.com
Annual Report
11
FRANKLIN MUTUAL QUEST FUND
PERFORMANCE SUMMARY
Total Return Index Comparison for a Hypothetical $10,000 Investment2 (continued)

All investments involve risks, including possible loss of principal. Value securities may not increase in price as anticipated or may decline further in value. The Fund’s investments in smaller company stocks and foreign securities involve special risks. Smaller company stocks have exhibited greater price volatility than larger company stocks, particularly over the short term. Foreign securities risks include currency fluctuations, and economic and political uncertainties. The Fund may also invest in companies engaged in mergers, reorganizations or liquidations, which involve special risks as pending deals may not be completed on time or on favorable terms, as well as lower rated bonds, which entail higher credit risk. The Fund is actively managed but there is no guarantee that the manager’s investment decisions will produce the desired results. The Fund’s prospectus also includes a description of the main investment risks.
Class Z: Class C: Class R: Class R6: | Shares are available to certain eligible investors as described in the prospectus. These shares have higher annual fees and expenses than Class A shares. Shares are available to certain eligible investors as described in the prospectus. These shares have higher annual fees and expenses than Class A shares. Shares are available to certain eligible investors as described in the prospectus. |
1. The distribution amount is the sum of the dividend payments to shareholders for the period shown and includes only estimated tax-basis net investment income and
capital gain.
2. The Fund has a fee waiver associated with any investment in a Franklin Templeton money fund, contractually guaranteed through at least its current fiscal year-end. Fund
investment results reflect the fee waiver, to the extent applicable; without this reduction, the results would have been lower.
3. Cumulative total return represents the change in value of an investment over the periods indicated.
4. Average annual total return represents the average annual change in value of an investment over the periods indicated. Return for less than one year, if any, has not
been annualized.
5. These figures represent the value of a hypothetical $10,000 investment in the Fund over the periods indicated.
6. Figures are as stated in the Fund’s current prospectus. In periods of market volatility, assets may decline significantly, causing total annual Fund operating expenses to
become higher than the figures shown.
7. Source: Morningstar. The S&P 500 is a market capitalization-weighted index of 500 stocks designed to measure total U.S. equity market performance.
See www.franklintempletondatasources.com for additional data provider information.
12 Annual Report
franklintempleton.com
FRANKLIN MUTUAL QUEST FUND
Your Fund’s Expenses
As a Fund shareholder, you can incur two types of costs:
- Transaction costs, including sales charges (loads) on Fund purchases; and
- Ongoing Fund costs, including management fees, distribu- tion and service (12b-1) fees, and other Fund expenses. All mutual funds have ongoing costs, sometimes referred to as operating expenses.
The following table shows ongoing costs of investing in the Fund and can help you understand these costs and compare them with those of other mutual funds. The table assumes a $1,000 investment held for the six months indicated.
Actual Fund Expenses
The first line (Actual) for each share class listed in the table provides actual account values and expenses. The “Ending Account Value” is derived from the Fund’s actual return, which includes the effect of Fund expenses.
You can estimate the expenses you paid during the period by following these steps. Of course, your account value and expenses will differ from those in this illustration:
1. Divide your account value by $1,000.
If an account had an $8,600 value, then $8,600 ÷ $1,000 = 8.6.
2. Multiply the result by the number under the heading “Expenses Paid During Period.”
If Expenses Paid During Period were $7.50, then 8.6 × $7.50 = $64.50.
In this illustration, the estimated expenses paid this period are $64.50.
Hypothetical Example for Comparison with Other Funds
Information in the second line (Hypothetical) for each class in the table can help you compare ongoing costs of investing in the Fund with those of other mutual funds. This information may not be used to estimate the actual ending account balance or expenses you paid during the period. The hypothetical “Ending Account Value” is based on the actual expense ratio for each class and an assumed 5% annual rate of return before expenses, which does not represent the Fund’s actual return. The figure under the heading “Expenses Paid During Period” shows the hypothetical expenses your account would have incurred under this scenario. You can compare this figure with the 5% hypothetical examples that appear in shareholder reports of other funds.
Please note that expenses shown in the table are meant to highlight ongoing costs and do not reflect any transaction costs, such as sales charges. Therefore, the second line for each class is useful in comparing ongoing costs only, and will not help you compare total costs of owning different funds. In addition, if transaction costs were included, your total costs would have been higher. Please refer to the Fund prospectus for additional information on operating expenses.
franklintempleton.com
Annual Report
13
| FRANKLIN MUTUAL QUEST FUND |
| YOUR FUND’S EXPENSES |
| Beginning Account | Ending Account | Expenses Paid During | ||||
| Share Class | Value 7/1/15 | Value 12/31/15 | Period* 7/1/15–12/31/15 | |||
| Z | ||||||
| Actual | $ | 1,000 | $ | 935.30 | $ | 3.95 |
| Hypothetical (5% return before expenses) | $ | 1,000 | $ | 1,021.12 | $ | 4.13 |
| A | ||||||
| Actual | $ | 1,000 | $ | 934.00 | $ | 5.22 |
| Hypothetical (5% return before expenses) | $ | 1,000 | $ | 1,019.81 | $ | 5.45 |
| C | ||||||
| Actual | $ | 1,000 | $ | 930.90 | $ | 8.81 |
| Hypothetical (5% return before expenses) | $ | 1,000 | $ | 1,016.08 | $ | 9.20 |
| R | ||||||
| Actual | $ | 1,000 | $ | 933.20 | $ | 6.38 |
| Hypothetical (5% return before expenses) | $ | 1,000 | $ | 1,018.60 | $ | 6.67 |
| R6 | ||||||
| Actual | $ | 1,000 | $ | 935.40 | $ | 3.56 |
| Hypothetical (5% return before expenses) | $ | 1,000 | $ | 1,021.53 | $ | 3.72 |
*Expenses are calculated using the most recent six-month expense ratio, net of expense waivers, annualized for each class (Z: 0.81%; A: 1.07%; C: 1.81%; R: 1.31%; and R6: 0.73%), multiplied by the average account value over the period, multiplied by 184/365 to reflect the one-half year period.
14 Annual Report
franklintempleton.com
FRANKLIN MUTUAL QUEST FUND
| Financial Highlights | |||||||||||||||
| Year Ended December 31, | |||||||||||||||
| 2015 | 2014 | 2013 | 2012 | 2011 | |||||||||||
| Class Z | |||||||||||||||
| Per share operating performance | |||||||||||||||
| (for a share outstanding throughout the year) | |||||||||||||||
| Net asset value, beginning of year | $ | 16.21 | $ | 18.18 | $ | 16.55 | $ | 16.24 | $ | 17.70 | |||||
| Income from investment operationsa: | |||||||||||||||
| Net investment incomeb | 0.54 | 0.78 | c | 0.54 | 0.43 | 0.51 | |||||||||
| Net realized and unrealized gains (losses) | (1.45 | ) | (0.16 | ) | 3.68 | 1.61 | (0.88 | ) | |||||||
| Total from investment operations | (0.91 | ) | 0.62 | 4.22 | 2.04 | (0.37 | ) | ||||||||
| Less distributions from: | |||||||||||||||
| Net investment income | (0.68 | ) | (0.85 | ) | (0.56 | ) | (0.43 | ) | (0.52 | ) | |||||
| Net realized gains | (0.15 | ) | (1.74 | ) | (2.03 | ) | (1.30 | ) | (0.57 | ) | |||||
| Total distributions | (0.83 | ) | (2.59 | ) | (2.59 | ) | (1.73 | ) | (1.09 | ) | |||||
| Net asset value, end of year | $ | 14.47 | $ | 16.21 | $ | 18.18 | $ | 16.55 | $ | 16.24 | |||||
| Total return | (5.55 | )% | 3.44 | % | 25.97 | % | 12.57 | % | (1.83 | )% | |||||
| Ratios to average net assets | |||||||||||||||
| Expensesd | 0.82 | %e,f | 0.81 | %e | 0.84 | %e | 0.90 | % | 0.86 | % | |||||
| Expenses incurred in connection with securities sold short | 0.03 | % | 0.04 | % | 0.07 | % | 0.11 | % | 0.06 | % | |||||
| Net investment income | 3.35 | % | 4.18 | %c | 2.93 | % | 2.48 | % | 2.90 | % | |||||
| Supplemental data | |||||||||||||||
| Net assets, end of year (000’s) | $ | 3,577,696 | $ | 4,116,651 | $ | 4,270,828 | $ | 3,582,856 | $ | 3,413,759 | |||||
| Portfolio turnover rate | 30.51 | % | 65.77 | % | 63.41 | % | 65.21 | % | 107.25 | % | |||||
aThe amount shown for a share outstanding throughout the period may not correlate with the Statement of Operations for the period due to the timing of sales and repurchases
of the Fund’s shares in relation to income earned and/or fluctuating fair value of the investments of the Fund.
bBased on average daily shares outstanding.
cNet investment income per share includes approximately $0.27 per share received in the form of a special dividend paid in connection with certain Fund’s holdings. Excluding
this amount, the ratio of net investment income to average net assets would have been 2.73%.
dIncludes dividend and/or interest expense on securities sold short and security borrowing fees, if any. See below for the ratios of such expenses to average net assets for the
periods presented. See Note 1(f).
eBenefit of expense reduction rounds to less than 0.01%.
fBenefit of waiver and payments by affiliates rounds to less than 0.01%.
franklintempleton.com
The accompanying notes are an integral part of these financial statements. | Annual Report 15
FRANKLIN MUTUAL QUEST FUND
FINANCIAL H IGHLIGHTS
| Year Ended December 31, | |||||||||||||||
| 2015 | 2014 | 2013 | 2012 | 2011 | |||||||||||
| Class A | |||||||||||||||
| Per share operating performance | |||||||||||||||
| (for a share outstanding throughout the year) | |||||||||||||||
| Net asset value, beginning of year | $ | 16.02 | $ | 18.00 | $ | 16.41 | $ | 16.12 | $ | 17.57 | |||||
| Income from investment operationsa: | |||||||||||||||
| Net investment incomeb | 0.49 | 0.71 | c | 0.48 | 0.37 | 0.45 | |||||||||
| Net realized and unrealized gains (losses) | (1.43 | ) | (0.15 | ) | 3.65 | 1.60 | (0.86 | ) | |||||||
| Total from investment operations | (0.94 | ) | 0.56 | 4.13 | 1.97 | (0.41 | ) | ||||||||
| Less distributions from: | |||||||||||||||
| Net investment income | (0.64 | ) | (0.80 | ) | (0.51 | ) | (0.38 | ) | (0.47 | ) | |||||
| Net realized gains | (0.15 | ) | (1.74 | ) | (2.03 | ) | (1.30 | ) | (0.57 | ) | |||||
| Total distributions | (0.79 | ) | (2.54 | ) | (2.54 | ) | (1.68 | ) | (1.04 | ) | |||||
| Net asset value, end of year | $ | 14.29 | $ | 16.02 | $ | 18.00 | $ | 16.41 | $ | 16.12 | |||||
| Total returnd | (5.85 | )% | 3.11 | % | 25.61 | % | 12.21 | % | (2.10 | )% | |||||
| Ratios to average net assets | |||||||||||||||
| Expensese | 1.10 | %f,g | 1.11 | %f | 1.14 | %f | 1.20 | % | 1.16 | % | |||||
| Expenses incurred in connection with securities sold short | 0.03 | % | 0.04 | % | 0.07 | % | 0.11 | % | 0.06 | % | |||||
| Net investment income | 3.07 | % | 3.88 | %c | 2.63 | % | 2.18 | % | 2.60 | % | |||||
| Supplemental data | |||||||||||||||
| Net assets, end of year (000’s) | $ | 1,203,508 | $ | 1,394,138 | $ | 1,371,789 | $ | 1,101,808 | $ | 1,093,539 | |||||
| Portfolio turnover rate | 30.51 | % | 65.77 | % | 63.41 | % | 65.21 | % | 107.25 | % | |||||
aThe amount shown for a share outstanding throughout the period may not correlate with the Statement of Operations for the period due to the timing of sales and repurchases
of the Fund’s shares in relation to income earned and/or fluctuating fair value of the investments of the Fund.
bBased on average daily shares outstanding.
cNet investment income per share includes approximately $0.27 per share received in the form of a special dividend paid in connection with certain Fund’s holdings. Excluding
this amount, the ratio of net investment income to average net assets would have been 2.43%.
dTotal return does not reflect sales commissions or contingent deferred sales charges, if applicable.
eIncludes dividend and/or interest expense on securities sold short and security borrowing fees, if any. See below for the ratios of such expenses to average net assets for the
periods presented. See Note 1(f).
fBenefit of expense reduction rounds to less than 0.01%.
gBenefit of waiver and payments by affiliates rounds to less than 0.01%.
16 Annual Report | The accompanying notes are an integral part of these financial statements.
franklintempleton.com
FRANKLIN MUTUAL QUEST FUND
FINANCIAL H IGHLIGHTS
| Year Ended December 31, | |||||||||||||||
| 2015 | 2014 | 2013 | 2012 | 2011 | |||||||||||
| Class C | |||||||||||||||
| Per share operating performance | |||||||||||||||
| (for a share outstanding throughout the year) | |||||||||||||||
| Net asset value, beginning of year | $ | 15.78 | $ | 17.76 | $ | 16.24 | $ | 15.96 | $ | 17.39 | |||||
| Income from investment operationsa: | |||||||||||||||
| Net investment incomeb | 0.36 | 0.57 | c | 0.35 | 0.25 | 0.33 | |||||||||
| Net realized and unrealized gains (losses) | (1.39 | ) | (0.14 | ) | 3.59 | 1.59 | (0.85 | ) | |||||||
| Total from investment operations | (1.03 | ) | 0.43 | 3.94 | 1.84 | (0.52 | ) | ||||||||
| Less distributions from: | |||||||||||||||
| Net investment income | (0.52 | ) | (0.67 | ) | (0.39 | ) | (0.26 | ) | (0.34 | ) | |||||
| Net realized gains | (0.15 | ) | (1.74 | ) | (2.03 | ) | (1.30 | ) | (0.57 | ) | |||||
| Total distributions | (0.67 | ) | (2.41 | ) | (2.42 | ) | (1.56 | ) | (0.91 | ) | |||||
| Net asset value, end of year | $ | 14.08 | $ | 15.78 | $ | 17.76 | $ | 16.24 | $ | 15.96 | |||||
| Total returnd | (6.49 | )% | 2.42 | % | 24.74 | % | 11.42 | % | (2.82 | )% | |||||
| Ratios to average net assets | |||||||||||||||
| Expensese | 1.82 | %f,g | 1.81 | %f | 1.84 | %f | 1.90 | % | 1.86 | % | |||||
| Expenses incurred in connection with securities sold short | 0.03 | % | 0.04 | % | 0.07 | % | 0.11 | % | 0.06 | % | |||||
| Net investment income | 2.35 | % | 3.18 | %c | 1.93 | % | 1.48 | % | 1.90 | % | |||||
| Supplemental data | |||||||||||||||
| Net assets, end of year (000’s) | $ | 337,974 | $ | 397,963 | $ | 406,304 | $ | 333,908 | $ | 338,983 | |||||
| Portfolio turnover rate | 30.51 | % | 65.77 | % | 63.41 | % | 65.21 | % | 107.25 | % | |||||
aThe amount shown for a share outstanding throughout the period may not correlate with the Statement of Operations for the period due to the timing of sales and repurchases
of the Fund’s shares in relation to income earned and/or fluctuating fair value of the investments of the Fund.
bBased on average daily shares outstanding.
cNet investment income per share includes approximately $0.27 per share received in the form of a special dividend paid in connection with certain Fund’s holdings. Excluding
this amount, the ratio of net investment income to average net assets would have been 1.73%.
dTotal return does not reflect sales commissions or contingent deferred sales charges, if applicable.
eIncludes dividend and/or interest expense on securities sold short and security borrowing fees, if any. See below for the ratios of such expenses to average net assets for the
periods presented. See Note 1(f).
fBenefit of expense reduction rounds to less than 0.01%.
gBenefit of waiver and payments by affiliates rounds to less than 0.01%.
franklintempleton.com
The accompanying notes are an integral part of these financial statements. | Annual Report 17
FRANKLIN MUTUAL QUEST FUND
FINANCIAL H IGHLIGHTS
| Year Ended December 31, | |||||||||||||||
| 2015 | 2014 | 2013 | 2012 | 2011 | |||||||||||
| Class R | |||||||||||||||
| Per share operating performance | |||||||||||||||
| (for a share outstanding throughout the year) | |||||||||||||||
| Net asset value, beginning of year | $ | 15.87 | $ | 17.84 | $ | 16.33 | $ | 16.05 | $ | 17.50 | |||||
| Income from investment operationsa: | |||||||||||||||
| Net investment incomeb | 0.44 | 0.65 | c | 0.50 | 0.33 | 0.41 | |||||||||
| Net realized and unrealized gains (losses) | (1.40 | ) | (0.13 | ) | 3.56 | 1.60 | (0.85 | ) | |||||||
| Total from investment operations | (0.96 | ) | 0.52 | 4.06 | 1.93 | (0.44 | ) | ||||||||
| Less distributions from: | |||||||||||||||
| Net investment income | (0.62 | ) | (0.75 | ) | (0.52 | ) | (0.35 | ) | (0.44 | ) | |||||
| Net realized gains | (0.15 | ) | (1.74 | ) | (2.03 | ) | (1.30 | ) | (0.57 | ) | |||||
| Total distributions | (0.77 | ) | (2.49 | ) | (2.55 | ) | (1.65 | ) | (1.01 | ) | |||||
| Net asset value, end of year | $ | 14.14 | $ | 15.87 | $ | 17.84 | $ | 16.33 | $ | 16.05 | |||||
| Total return | (6.03 | )% | 2.94 | % | 25.34 | % | 11.99 | % | (2.31 | )% | |||||
| Ratios to average net assets | |||||||||||||||
| Expensesd | 1.32 | %e,f | 1.31 | %e | 1.34 | %e | 1.40 | % | 1.36 | % | |||||
| Expenses incurred in connection with securities sold short | 0.03 | % | 0.04 | % | 0.07 | % | 0.11 | % | 0.06 | % | |||||
| Net investment income | 2.85 | % | 3.68 | %c | 2.43 | % | 1.98 | % | 2.40 | % | |||||
| Supplemental data | |||||||||||||||
| Net assets, end of year (000’s) | $ | 898 | $ | 675 | $ | 853 | $ | 212 | $ | 193 | |||||
| Portfolio turnover rate | 30.51 | % | 65.77 | % | 63.41 | % | 65.21 | % | 107.25 | % | |||||
aThe amount shown for a share outstanding throughout the period may not correlate with the Statement of Operations for the period due to the timing of sales and repurchases
of the Fund’s shares in relation to income earned and/or fluctuating fair value of the investments of the Fund.
bBased on average daily shares outstanding.
cNet investment income per share includes approximately $0.27 per share received in the form of a special dividend paid in connection with certain Fund’s holdings. Excluding
this amount, the ratio of net investment income to average net assets would have been 2.23%.
dIncludes dividend and/or interest expense on securities sold short and security borrowing fees, if any. See below for the ratios of such expenses to average net assets for the
periods presented. See Note 1(f).
eBenefit of expense reduction rounds to less than 0.01%.
fBenefit of waiver and payments by affiliates rounds to less than 0.01%.
18 Annual Report | The accompanying notes are an integral part of these financial statements.
franklintempleton.com
FRANKLIN MUTUAL QUEST FUND
FINANCIAL H IGHLIGHTS
| Year Ended December 31, | |||||||||
| 2015 | 2014 | 2013 | a | ||||||
| Class R6 | |||||||||
| Per share operating performance | |||||||||
| (for a share outstanding throughout the year) | |||||||||
| Net asset value, beginning of year | $ | 16.19 | $ | 18.19 | $ | 18.16 | |||
| Income from investment operationsb: | |||||||||
| Net investment incomec | 0.55 | 0.51 | d | 0.36 | |||||
| Net realized and unrealized gains (losses) | (1.44 | ) | 0.10 | 2.28 | |||||
| Total from investment operations | (0.89 | ) | 0.61 | 2.64 | |||||
| Less distributions from: | |||||||||
| Net investment income | (0.70 | ) | (0.87 | ) | (0.58 | ) | |||
| Net realized gains | (0.15 | ) | (1.74 | ) | (2.03 | ) | |||
| Total distributions | (0.85 | ) | (2.61 | ) | (2.61 | ) | |||
| Net asset value, end of year | $ | 14.45 | $ | 16.19 | $ | 18.19 | |||
| Total returne | (5.54 | )% | 3.53 | % | 14.83 | % | |||
| Ratios to average net assetsf | |||||||||
| Expenses before waiver, payments by affiliates and expense reductiong | 0.74 | % | 0.74 | % | 2.00 | % | |||
| Expenses net of waiver, payments by affiliates and expense reductiong,h | 0.74 | %i | 0.74 | % | 0.77 | % | |||
| Expenses incurred in connection with securities sold short | 0.03 | % | 0.04 | % | 0.07 | % | |||
| Net investment income | 3.43 | % | 4.25 | %d | 3.00 | % | |||
| Supplemental data | |||||||||
| Net assets, end of year (000’s) | $ | 41,408 | $ | 44,340 | $ | 5 | |||
| Portfolio turnover rate | 30.51 | % | 65.77 | % | 63.41 | % | |||
aFor the period May 1, 2013 (effective date) to December 31, 2013.
bThe amount shown for a share outstanding throughout the period may not correlate with the Statement of Operations for the period due to the timing of sales and repurchases
of the Fund’s shares in relation to income earned and/or fluctuating fair value of the investments of the Fund.
cBased on average daily shares outstanding.
dNet investment income per share includes approximately $0.27 per share received in the form of a special dividend paid in connection certain Fund’s holdings. Excluding this
amount, the ratio of net investment income to average net assets would have been 2.80%.
eTotal return is not annualized for periods less than one year.
fRatios are annualized for periods less than one year.
gIncludes dividend and/or interest expense on securities sold short and security borrowing fees, if any. See below for the ratios of such expenses to average net assets for the
periods presented. See Note 1(f).
hBenefit of expense reduction rounds to less than 0.01%.
iBenefit of waiver and payments by affiliates rounds to less than 0.01%.
franklintempleton.com
The accompanying notes are an integral part of these financial statements. | Annual Report 19
FRANKLIN MUTUAL QUEST FUND
| Statement of Investments, December 31, 2015 | ||||
| Shares/ | ||||
| Country | Warrants | Value | ||
| Common Stocks and Other Equity Interests 55.5% | ||||
| Auto Components 0.2% | ||||
| a,bInternational Automotive Components Group Brazil LLC | Brazil | 2,548,299 | $ | 26,204 |
| a,b,cInternational Automotive Components Group North America LLC | United States | 19,924,658 | 10,756,626 | |
| 10,782,830 | ||||
| Automobiles 1.6% | ||||
| General Motors Co | United States | 1,205,324 | 40,993,069 | |
| aGeneral Motors Co., wts., 7/10/16 | United States | 1,065,963 | 25,988,178 | |
| aGeneral Motors Co., wts., 7/10/19 | United States | 1,104,312 | 18,066,544 | |
| 85,047,791 | ||||
| Banks 7.0% | ||||
| Barclays PLC | United Kingdom | 5,864,710 | 18,922,348 | |
| BB&T Corp | United States | 1,514,207 | 57,252,167 | |
| CIT Group Inc | United States | 2,668,917 | 105,956,005 | |
| Citizens Financial Group Inc | United States | 2,664,447 | 69,781,867 | |
| Guaranty Bancorp | United States | 347,127 | 5,741,481 | |
| SunTrust Banks Inc | United States | 1,333,217 | 57,115,016 | |
| Wells Fargo & Co | United States | 900,054 | 48,926,936 | |
| 363,695,820 | ||||
| Chemicals 0.2% | ||||
| a,dAdvanced Emissions Solutions Inc | United States | 1,724,209 | 12,310,852 | |
| a,e,fDow Corning Corp., Contingent Distribution | United States | 12,089,194 | — | |
| Tronox Ltd., A | United States | 20,435 | 79,901 | |
| 12,390,753 | ||||
| Communications Equipment 0.9% | ||||
| a,b,cSorenson Communications Inc., Membership Interests | United States | 224,279 | 47,098,569 | |
| Consumer Finance 1.5% | ||||
| aAlly Financial Inc | United States | 4,185,624 | 78,020,031 | |
| Diversified Consumer Services 0.1% | ||||
| aCengage Learning Holdings II LP | United States | 317,069 | 7,292,587 | |
| Diversified Telecommunication Services 2.5% | ||||
| a,e,fGlobal Crossing Holdings Ltd., Contingent Distribution | United States | 49,411,586 | — | |
| Koninklijke KPN NV | Netherlands | 33,374,610 | 126,596,068 | |
| 126,596,068 | ||||
| Energy Equipment & Services 1.2% | ||||
| Baker Hughes Inc | United States | 341,400 | 15,755,610 | |
| a,fDeepOcean Group Holding BV | Netherlands | 91,357 | 548,142 | |
| Ensco PLC, A | United States | 1,738,880 | 26,761,363 | |
| Rowan Cos. PLC | United States | 1,161,910 | 19,694,375 | |
| 62,759,490 | ||||
| Health Care Equipment & Supplies 0.9% | ||||
| Medtronic PLC | United States | 616,633 | 47,431,410 | |
| Hotels, Restaurants & Leisure 1.0% | ||||
| aPinnacle Entertainment Inc | United States | 1,591,555 | 49,529,192 | |
| Independent Power & Renewable Electricity Producers 2.1% | ||||
| NRG Energy Inc | United States | 8,419,264 | 99,094,737 | |
| NRG Yield Inc., C | United States | 469,444 | 6,928,994 | |
| 106,023,731 | ||||
20 Annual Report
franklintempleton.com
FRANKLIN MUTUAL QUEST FUND
STATEMENT O F INVESTMENTS
| Shares/ | ||||
| Country | Warrants | Value | ||
| Common Stocks and Other Equity Interests (continued) | ||||
| Insurance 7.6% | ||||
| Ageas | Belgium | 1,844,628 | $ | 85,759,521 |
| The Allstate Corp | United States | 1,061,672 | 65,919,214 | |
| American International Group Inc | United States | 272,136 | 16,864,268 | |
| Direct Line Insurance Group PLC | United Kingdom | 84,729 | 508,912 | |
| RSA Insurance Group PLC | United Kingdom | 15,569,625 | 97,876,835 | |
| UNIQA Insurance Group AG | Austria | 55,868 | 456,667 | |
| White Mountains Insurance Group Ltd | United States | 171,770 | 124,844,154 | |
| 392,229,571 | ||||
| Internet & Catalog Retail 0.2% | ||||
| aBluestem Group Inc | United States | 4,150,000 | 12,242,500 | |
| Machinery 0.0%† | ||||
| aVossloh AG | Germany | 1,910 | 123,488 | |
| Media 3.7% | ||||
| CBS Corp., B | United States | 2,021,960 | 95,294,975 | |
| a,dLee Enterprises Inc./IA | United States | 4,824,268 | 8,104,770 | |
| a,b,dLee Enterprises Inc., wts., 12/31/22 | United States | 1,110,000 | 933,263 | |
| dNew Media Investment Group Inc | United States | 4,441,772 | 86,436,883 | |
| 190,769,891 | ||||
| Multiline Retail 0.6% | ||||
| Macy’s Inc | United States | 847,010 | 29,628,410 | |
| Oil, Gas & Consumable Fuels 4.5% | ||||
| BP PLC | United Kingdom | 14,270,737 | 74,461,605 | |
| China Shenhua Energy Co. Ltd., H | China | 17,827,995 | 28,064,172 | |
| Kinder Morgan Inc | United States | 2,285,990 | 34,106,971 | |
| Royal Dutch Shell PLC, A | United Kingdom | 4,191,857 | 96,054,070 | |
| 232,686,818 | ||||
| Pharmaceuticals 2.9% | ||||
| GlaxoSmithKline PLC | United Kingdom | 2,738,790 | 55,425,804 | |
| Merck & Co. Inc | United States | 718,690 | 37,961,206 | |
| Teva Pharmaceutical Industries Ltd., ADR | Israel | 852,561 | 55,962,104 | |
| 149,349,114 | ||||
| Real Estate Investment Trusts (REITs) 2.5% | ||||
| Spirit Realty Capital Inc | United States | 12,660,615 | 126,859,362 | |
| Real Estate Management & Development 2.3% | ||||
| aForest City Enterprises Inc., A | United States | 5,456,130 | 119,652,931 | |
| Software 1.7% | ||||
| Microsoft Corp | United States | 574,171 | 31,855,007 | |
| Symantec Corp | United States | 2,538,986 | 53,318,706 | |
| 85,173,713 | ||||
| Specialty Retail 0.4% | ||||
| aOffice Depot Inc | United States | 3,303,830 | 18,633,601 | |
| Technology Hardware, Storage & Peripherals 2.2% | ||||
| a,dEastman Kodak Co | United States | 3,728,145 | 46,750,938 | |
| a,dEastman Kodak Co., wts., 9/03/18 | United States | 48,582 | 108,338 | |
| a,dEastman Kodak Co., wts., 9/03/18 | United States | 48,582 | 88,905 | |
| Samsung Electronics Co. Ltd | South Korea | 62,463 | 66,963,933 | |
| 113,912,114 |
franklintempleton.com
Annual Report
21
FRANKLIN MUTUAL QUEST FUND
STATEMENT OF INVESTMENTS
| Shares/ | |||||
| Country | Warrants | Value | |||
| Common Stocks and Other Equity Interests (continued) | |||||
| Tobacco 4.6% | |||||
| Altria Group Inc | United States | 844,900 | $ | 49,181,629 | |
| British American Tobacco PLC | United Kingdom | 987,518 | 54,888,869 | ||
| Imperial Tobacco Group PLC | United Kingdom | 1,761,878 | 93,138,534 | ||
| Philip Morris International Inc | United States | 298,690 | 26,257,838 | ||
| Reynolds American Inc | United States | 358,368 | 16,538,683 | ||
| 240,005,553 | |||||
| Wireless Telecommunication Services 3.1% | |||||
| Vodafone Group PLC | United Kingdom | 48,509,200 | 158,015,291 | ||
| Total Common Stocks and Other Equity Interests | |||||
| (Cost $2,671,966,396) | 2,865,950,629 | ||||
| Preferred Stocks 2.2% | |||||
| Automobiles 0.4% | |||||
| Hyundai Motor Co., pfd., 2 | South Korea | 237,681 | 21,233,977 | ||
| Technology Hardware, Storage & Peripherals 1.8% | |||||
| Samsung Electronics Co. Ltd., pfd | South Korea | 100,160 | 92,975,096 | ||
| Total Preferred Stocks (Cost $124,756,128) | 114,209,073 | ||||
| Principal | |||||
| Amount | |||||
| Corporate Bonds, Notes and Senior Floating Rate | |||||
| Interests 26.9% | |||||
| d,g,hAdvanced Emissions Solutions Inc., Term Loan, 10.50%, 4/22/16 | United States | $ | 12,366,667 | 11,888,571 | |
| Advanced Micro Devices Inc., | |||||
| senior bond, 7.00%, 7/01/24 | United States | 69,431,000 | 45,477,305 | ||
| senior note, 7.50%, 8/15/22 | United States | 25,000,000 | 17,125,000 | ||
| Affinion Group Inc., | |||||
| g,h,iSecond Lien Term Loan, 8.50%, 10/31/18 | United States | 124,500,000 | 107,121,916 | ||
| senior note, 7.875%, 12/15/18 | United States | 10,000,000 | 6,500,000 | ||
| g,hTranche B Term Loans, 6.75%, 4/30/18 | United States | 16,931,601 | 15,682,895 | ||
| Avaya Inc., | |||||
| jsenior note, 144A, 10.50%, 3/01/21 | United States | 75,242,000 | 25,958,490 | ||
| jsenior secured note, 144A, 7.00%, 4/01/19 | United States | 14,003,000 | 10,502,250 | ||
| g,hTerm B-3 Loan, 4.823%, 10/26/17 | United States | 14,008,235 | 10,938,092 | ||
| g,hTerm B-6 Loan, 6.50%, 3/30/18 | United States | 8,080,130 | 6,157,730 | ||
| g,hTerm B-7 Loan, 6.25%, 5/29/20 | United States | 7,212,894 | 5,073,066 | ||
| g,hBelk Inc., Closing Date Term Loan, 5.75%, 12/10/22 | United States | 11,012,000 | 9,846,567 | ||
| g,h,iBluestem Brands Inc., Initial Term Loan, 8.50%, 11/09/20 | United States | 77,070,743 | 71,804,268 | ||
| g,hCengage Learning Acquisitions Inc., Original Term Loans, 7.00%, 3/31/20 | United States | 1,913,384 | 1,860,766 | ||
| d,g,hEastman Kodak Co., | |||||
| Second Lien Term Loan, 10.75%, 9/03/20 | United States | 51,000,000 | 42,585,000 | ||
| iTerm Loan, 7.25%, 9/03/19 | United States | 52,047,405 | 46,148,716 | ||
| GenOn Americas Generation LLC, senior bond, | |||||
| 8.50%, 10/01/21 | United States | 28,630,000 | 21,114,625 | ||
| 9.125%, 5/01/31 | United States | 90,639,000 | 63,220,703 | ||
| iHeartCommunications Inc., | |||||
| senior secured note, first lien, 9.00%, 12/15/19 | United States | 37,367,000 | 27,791,706 | ||
| g,hTranche D Term Loan, 7.174%, 1/30/19 | United States | 46,662,631 | 32,897,155 | ||
| g,hTranche E Term Loan, 7.924%, 7/30/19 | United States | 14,995,598 | 10,584,388 | ||
| g,hJC Penney Corp. Inc., Term Loan, 6.00%, 5/22/18 | United States | 12,539,517 | 12,339,675 | ||
22 Annual Report
franklintempleton.com
FRANKLIN MUTUAL QUEST FUND
STATEMENT OF INVESTMENTS
| Principal | |||||
| Country | Amount | Value | |||
| Corporate Bonds, Notes and Senior Floating Rate | |||||
| Interests (continued) | |||||
| dLee Enterprises Inc., | |||||
| g,hSecond Lien Term Loan, 12.00%, 12/15/22 | United States | $ | 25,448,045 | $ | 26,720,447 |
| jsenior secured note, first lien, 144A, 9.50%, 3/15/22 | United States | 99,050,000 | 91,497,438 | ||
| g,hMoxie Patriot LLC, Construction B-1 Term Loan, 6.75%, 12/21/20 | United States | 39,500,000 | 36,537,500 | ||
| d,g,hNew Media Holdings II LLC, Term B Loan, 7.25%, 6/04/20 | United States | 113,279,762 | 111,470,685 | ||
| NGPL PipeCo LLC, | |||||
| jsenior secured note, 144A, 9.625%, 6/01/19 | United States | 16,383,000 | 15,400,020 | ||
| g,hTerm Loan, 6.75%, 9/15/17 | United States | 838,797 | 794,760 | ||
| g,hPanda Liberty LLC, Construction B-1 Advance Term Loan, 7.50%, 8/21/20 | United States | 43,000,000 | 39,415,950 | ||
| cSorenson Communications Inc., | |||||
| g,hInitial Term Loan, 8.00%, 4/30/20 | United States | 143,542,714 | 143,542,714 | ||
| j,ksecured note, second lien, 144A, PIK, 9.00%, 10/31/20 | United States | 96,671,937 | 91,354,980 | ||
| c,j,kSorenson Holdings LLC/Finance Corp., senior note, 144A, PIK, | |||||
| 13.00%, 10/31/21 | United States | 73,470,672 | 76,409,499 | ||
| Spirit Realty Capital Inc., cvt., senior note, | |||||
| 2.875%, 5/15/19 | United States | 45,000,000 | 43,087,725 | ||
| 3.75%, 5/15/21 | United States | 35,000,000 | 33,184,550 | ||
| jSunshine Oilsands Ltd., secured note, 144A, 10.00%, 8/01/17 | Canada | 18,000,000 | 10,620,000 | ||
| g,hToys R Us-Delaware Inc., | |||||
| FILO Loans, 8.25%, 10/24/19 | United States | 9,228,000 | 9,106,929 | ||
| Term B-4 Loan, 9.75%, 4/24/20 | United States | 74,744,409 | 54,937,140 | ||
| Total Corporate Bonds, Notes and Senior Floating Rate | |||||
| Interests (Cost $1,531,397,775) | 1,386,699,221 | ||||
| Corporate Bonds, Notes and Senior Floating Rate Interests | |||||
| in Reorganization 5.6% | |||||
| b,lBroadband Ventures III LLC, secured promissory note, 5.00%, 2/01/12 | United States | 9,272 | — | ||
| lCaesars Entertainment Operating Co. Inc., | |||||
| senior secured note, first lien, 11.25%, 6/01/17 | United States | 70,000,000 | 52,850,000 | ||
| g,hTerm B-5-B Loans, 1.50%, 3/01/17 | United States | 7,325,894 | 6,373,528 | ||
| g,hTerm B-6-B Loans, 1.50%, 3/01/17 | United States | 34,925,138 | 30,734,121 | ||
| g,hTerm B-7 Loans, 1.50%, 3/01/17 | United States | 13,731,000 | 11,482,549 | ||
| lNortel Networks Corp., cvt., senior note, | |||||
| 1.75%, 4/15/12 | Canada | 78,224,000 | 66,490,400 | ||
| 2.125%, 4/15/14 | Canada | 12,968,000 | 11,024,421 | ||
| lNortel Networks Ltd., senior note, | |||||
| 10.125%, 7/15/13 | Canada | 35,000,000 | 31,412,500 | ||
| 10.75%, 7/15/16 | Canada | 20,500,000 | 18,398,750 | ||
| lNorthern Telecom Ltd., 6.875%, 9/01/23 | Canada | 20,912,000 | 7,005,520 | ||
| lSamson Investment Co., senior note, 9.75%, 2/15/20 | United States | 19,689,000 | 44,300 | ||
| g,h,lTexas Competitive Electric Holdings Co. LLC, Term Loans, | |||||
| 4.908%, 10/10/17 | United States | 104,175,133 | 32,001,351 | ||
| j,lTexas Competitive Electric Holdings Co. LLC/Texas Competitive Electric | |||||
| Holdings Finance Inc., senior secured note, first lien, 144A, | |||||
| 4.726%, 10/01/20 | United States | 40,665,000 | 13,622,775 | ||
| lWalter Energy Inc., | |||||
| g,hB Term Loan, 5.80%, 4/02/18 | United States | 13,440,403 | 3,763,313 | ||
| jfirst lien, 144A, 6.33%, 10/15/19 | United States | 7,443,000 | 1,935,180 | ||
| j,ksecond lien, 144A, PIK, 11.50%, 4/01/20 | United States | 6,473,550 | 16,582 | ||
| Total Corporate Bonds, Notes and Senior Floating Rate | |||||
| Interests in Reorganization (Cost $424,529,977) | 287,155,290 | ||||
franklintempleton.com
Annual Report
23
FRANKLIN MUTUAL QUEST FUND
STATEMENT O F INVESTMENTS
| Country | Shares | Value | ||||
| Companies in Liquidation 0.5% | ||||||
| aAdelphia Recovery Trust | United States | 49,534,842 | $ | 198,139 | ||
| a,eAdelphia Recovery Trust, Arahova Contingent Value Vehicle, Contingent | ||||||
| Distribution | United States | 5,918,407 | 11,837 | |||
| a,b,cCB FIM Coinvestors LLC | United States | 1,439,821 | — | |||
| a,e,fCentury Communications Corp., Contingent Distribution | United States | 16,323,000 | — | |||
| EME Reorganization Trust | United States | 368,387,370 | 736,775 | |||
| a,bFIM Coinvestor Holdings I, LLC | United States | 17,934,688 | — | |||
| a,e,fKGen Power Liquidating Trust, Contingent Distribution | United States | 5,519,104 | 2,154,962 | |||
| a,mLehman Brothers Holdings Inc., Bankruptcy Claim | United States | 459,471,220 | 25,845,256 | |||
| a,e,fNewPage Corp., Litigation Trust, Contingent Distribution | United States | 723,000 | — | |||
| a,e,fTribune Media Litigation Trust, Contingent Distribution | United States | 1,517,306 | — | |||
| a,e,fTropicana Litigation Trust, Contingent Distribution | United States | 12,892,000 | — | |||
| Total Companies in Liquidation (Cost $47,028,467) | 28,946,969 | |||||
| Principal | ||||||
| Amount | ||||||
| Municipal Bonds (Cost $27,640,495) 0.5% | ||||||
| Puerto Rico Commonwealth GO, Refunding, Series A, 8.00%, 7/01/35 | United States | $ | 33,599,000 | 24,443,273 | ||
| Total Investments before Short Term Investments | ||||||
| (Cost $4,827,319,238) | 4,707,404,455 | |||||
| Short Term Investments 8.3% | ||||||
| U.S. Government and Agency Securities 8.3% | ||||||
| nFHLB, 1/05/16 | United States | 39,500,000 | 39,499,842 | |||
| nU.S. Treasury Bill, | ||||||
| 5/12/16 | United States | 65,500,000 | 65,426,050 | |||
| 5/19/16 | United States | 60,000,000 | 59,926,800 | |||
| o1/07/16 - 6/09/16 | United States | 264,600,000 | 264,362,011 | |||
| Total U.S. Government and Agency Securities | ||||||
| (Cost $429,221,416) | 429,214,703 | |||||
| Total Investments (Cost $5,256,540,654) 99.5% | 5,136,619,158 | |||||
| Options Written (0.0)%† | (2,000 | ) | ||||
| Securities Sold Short (0.1)% | (5,250,135 | ) | ||||
| Other Assets, less Liabilities 0.6% | 30,116,376 | |||||
| Net Assets 100.0% | $ | 5,161,483,399 | ||||
| Number of | ||||||
| Contracts | ||||||
| pOptions Written (Premiums Received $29,458) (0.0)%† | ||||||
| Puts – Exchange-Traded | ||||||
| Semiconductors & Semiconductor Equipment (0.0)%† | ||||||
| Advanced Micro Devices Inc., January Strike Price $2, Expires, 1/15/16 | United States | 1,000 | $ | (2,000 | ) | |
| Shares | ||||||
| qSecurities Sold Short (0.1)% | ||||||
| Common Stocks (Proceeds $1,466,240) (0.0)%† | ||||||
| Oil, Gas & Consumable Fuels (0.0)%† | ||||||
| Yanzhou Coal Mining Co. Ltd., ADR | China | 301,060 | (1,378,855 | ) | ||
24 Annual Report
franklintempleton.com
FRANKLIN MUTUAL QUEST FUND
STATEMENT O F INVESTMENTS
| Principal | ||||||
| Country | Amount | Value | ||||
| qSecurities Sold Short (continued) | ||||||
| Corporate Notes (Proceeds $3,424,349) (0.1)% | ||||||
| Vulcan Materials Co., senior note, 7.00%, 6/15/18 | United States | $ | 3,472,000 | $ | (3,871,280 | ) |
| Total Securities Sold Short (Proceeds $4,890,589) | $ | (5,250,135 | ) |
†Rounds to less than 0.1% of net assets.
aNon-income producing.
bSee Note 9 regarding restricted securities.
cAt December 31, 2015, pursuant to the Fund’s policies and the requirements of applicable securities law, the Fund is restricted from trading these securities at year end.
dSee Note 11 regarding holdings of 5% voting securities.
eContingent distributions represent the right to receive additional distributions, if any, during the reorganization of the underlying company. Shares represent total underlying
principal of debt securities.
fSecurity has been deemed illiquid because it may not be able to be sold within seven days. At December 31, 2015, the aggregate value of these securities was $2,703,104,
representing 0.05% of net assets.
gSee Note 1(h) regarding senior floating rate interests.
hThe coupon rate shown represents the rate at period end.
iA portion or all of the security purchased on a delayed delivery basis. See Note 1(c).
jSecurity was purchased pursuant to Rule 144A under the Securities Act of 1933 and may be sold in transactions exempt from registration only to qualified institutional buyers
or in a public offering registered under the Securities Act of 1933. These securities have been deemed liquid under guidelines approved by the Trust’s Board of Trustees. At
December 31, 2015, the aggregate value of these securities was $337,317,214, representing 6.54% of net assets.
kIncome may be received in additional securities and/or cash.
lSee Note 8 regarding credit risk and defaulted securities.
mBankruptcy claims represent the right to receive distributions, if any, during the liquidation of the underlying pool of assets. Shares represent amount of allowed unsecured
claims.
nThe security is traded on a discount basis with no stated coupon rate.
oA portion or all of the security has been segregated as collateral for securities sold short, open forward and written options contracts. At December 31, 2015, the value of this
security and/or cash pledged amounted to $7,917,912, representing 0.15% of net assets.
pSee Note 7 regarding written options.
qSee Note 1(f) regarding securities sold short.
| At December 31, 2015, the Fund had the following futures contracts outstanding. See Note 1(d). | |||||||||
| Futures Contracts | |||||||||
| Number of | Notional | Expiration | Unrealized | Unrealized | |||||
| Description | Type | Contracts | Value | Date | Appreciation | Depreciation | |||
| Currency Contracts | |||||||||
| EUR/USD | Short | 1,486 | $ | 202,207,450 | 3/14/16 | $ | 100,933 | $ | — |
| GBP/USD | Short | 1,611 | 148,352,963 | 3/14/16 | 3,827,413 | — | |||
| Total Futures Contracts | $ | 3,928,346 | $ | — | |||||
| Net unrealized appreciation (depreciation) | $ | 3,928,346 | |||||||
franklintempleton.com
Annual Report
25
FRANKLIN MUTUAL QUEST FUND
STATEMENT O F INVESTMENTS
| At December 31, 2015, the Fund had the following forward exchange contracts outstanding. See Note 1(d). | |||||||||||
| Forward Exchange Contracts | |||||||||||
| Contract | Settlement | Unrealized | Unrealized | ||||||||
| Currency | Counterpartya Type | Quantity | Amount | Date | Appreciation | Depreciation | |||||
| OTC Forward Exchange Contracts | |||||||||||
| Euro | BANT | Buy | 14,118,150 | $ | 15,892,137 | 1/06/16 | $ | — | $ | (553,972 | ) |
| Euro | BBU | Buy | 9,370,790 | 10,349,064 | 1/06/16 | — | (168,501 | ) | |||
| Euro | BONY | Sell | 25,050,131 | 27,398,581 | 1/06/16 | 183,751 | — | ||||
| Euro | FBCO | Buy | 8,521,163 | 9,590,670 | 1/06/16 | — | (333,154 | ) | |||
| Euro | HSBC | Buy | 745,000 | 841,589 | 1/06/16 | — | (32,210 | ) | |||
| Euro | SSBT | Buy | 16,612,169 | 18,654,395 | 1/06/16 | — | (606,691 | ) | |||
| Euro | SSBT | Sell | 24,834,957 | 27,184,841 | 1/06/16 | 203,779 | — | ||||
| Euro | BANT | Buy | 8,832,987 | 9,961,754 | 1/20/16 | — | (362,071 | ) | |||
| Euro | BONY | Buy | 455,046 | 510,339 | 1/20/16 | — | (15,795 | ) | |||
| Euro | DBFX | Buy | 12,447,296 | 13,915,192 | 1/20/16 | 14 | (387,495 | ) | |||
| Euro | FBCO | Buy | 8,129,657 | 9,171,717 | 1/20/16 | — | (336,412 | ) | |||
| Euro | FBCO | Sell | 23,363,786 | 25,590,121 | 1/20/16 | 198,378 | — | ||||
| Euro | HSBC | Buy | 3,259,014 | 3,574,818 | 1/20/16 | — | (32,924 | ) | |||
| Euro | HSBC | Sell | 23,363,785 | 25,580,541 | 1/20/16 | 188,799 | — | ||||
| Euro | SSBT | Buy | 12,185,218 | 13,558,692 | 1/20/16 | 58,963 | (374,770 | ) | |||
| British Pound | BANT | Buy | 4,509,922 | 6,821,573 | 1/21/16 | — | (173,795 | ) | |||
| British Pound | BANT | Sell | 31,857,693 | 49,776,852 | 1/21/16 | 2,817,534 | — | ||||
| British Pound | BBU | Buy | 3,298,927 | 5,070,451 | 1/21/16 | — | (207,721 | ) | |||
| British Pound | FBCO | Buy | 3,632,085 | 5,582,534 | 1/21/16 | — | (228,717 | ) | |||
| British Pound | SSBT | Buy | 4,498,181 | 7,039,518 | 1/21/16 | — | (409,046 | ) | |||
| British Pound | SSBT | Sell | 25,942,950 | 40,504,728 | 1/21/16 | 2,263,941 | — | ||||
| South Korean Won | BANT | Buy | 45,471,164,915 | 38,727,984 | 2/12/16 | 232,489 | (317,738 | ) | |||
| South Korean Won | BANT | Sell | 35,087,673,156 | 30,102,788 | 2/12/16 | 330,936 | (46,686 | ) | |||
| South Korean Won | FBCO | Buy | 2,432,623,823 | 2,055,623 | 2/12/16 | 11,693 | — | ||||
| South Korean Won | FBCO | Sell | 36,266,107,565 | 31,305,712 | 2/12/16 | 487,749 | (2,044 | ) | |||
| South Korean Won | HSBC | Buy | 17,312,716,262 | 14,619,715 | 2/12/16 | 108,948 | (15,807 | ) | |||
| South Korean Won | HSBC | Sell | 90,097,369,110 | 77,392,120 | 2/12/16 | 828,425 | (3,704 | ) | |||
| British Pound | BANT | Buy | 7,019,385 | 10,720,728 | 2/19/16 | — | (373,524 | ) | |||
| British Pound | BANT | Sell | 4,390,085 | 6,745,897 | 2/19/16 | 274,517 | — | ||||
| British Pound | BONY | Buy | 3,000,000 | 4,705,170 | 2/19/16 | — | (282,900 | ) | |||
| British Pound | DBFX | Buy | 2,679,215 | 4,058,826 | 2/19/16 | — | (109,423 | ) | |||
| British Pound | DBFX | Sell | 26,464,373 | 41,231,493 | 2/19/16 | 2,220,630 | — | ||||
| British Pound | FBCO | Buy | 6,504,921 | 10,113,119 | 2/19/16 | — | (524,281 | ) | |||
| British Pound | FBCO | Sell | 37,127,492 | 57,562,540 | 2/19/16 | 2,833,281 | — | ||||
| British Pound | HSBC | Buy | 7,312,078 | 11,353,208 | 2/19/16 | — | (574,548 | ) | |||
| British Pound | SSBT | Buy | 8,904,817 | 13,548,329 | 2/19/16 | — | (421,828 | ) | |||
| British Pound | SSBT | Sell | 199,361 | 308,603 | 2/19/16 | 14,727 | — | ||||
| Euro | BANT | Buy | 1,197,914 | 1,319,528 | 2/22/16 | — | (16,535 | ) | |||
| Euro | BANT | Sell | 7,546,670 | 8,619,713 | 2/22/16 | 411,060 | — | ||||
| Euro | BONY | Buy | 576,336 | 636,589 | 2/22/16 | — | (9,698 | ) | |||
| Euro | DBFX | Buy | 1,758,342 | 1,937,124 | 2/22/16 | — | (24,542 | ) | |||
| Euro | DBFX | Sell | 262,682 | 293,912 | 2/22/16 | 8,188 | — | ||||
| Euro | FBCO | Buy | 1,197,913 | 1,319,498 | 2/22/16 | — | (16,506 | ) | |||
| Euro | HSBC | Buy | 1,143,165 | 1,256,441 | 2/22/16 | — | (13,000 | ) | |||
| Euro | HSBC | Sell | 1,682,788 | 1,891,560 | 2/22/16 | 61,160 | — | ||||
| Euro | SSBT | Buy | 1,213,875 | 1,334,844 | 2/22/16 | — | (14,490 | ) | |||
| Euro | SSBT | Sell | 2,613,862 | 2,951,058 | 2/22/16 | 107,911 | — | ||||
| British Pound | BANT | Sell | 30,595,788 | 47,261,314 | 4/22/16 | 2,152,986 | — | ||||
| British Pound | DBFX | Sell | 3,000,000 | 4,566,150 | 4/22/16 | 143,156 | — | ||||
| British Pound | HSBC | Sell | 23,033,524 | 35,579,884 | 4/22/16 | 1,620,840 | — | ||||
| Euro | FBCO | Sell | 82,092 | 87,448 | 5/04/16 | — | (2,037 | ) | |||
| Euro | SSBT | Sell | 4,693,000 | 5,117,576 | 5/04/16 | 1,905 | — | ||||
| South Korean Won | BANT | Sell | 38,147,249,902 | 33,171,893 | 5/12/16 | 793,727 | — | ||||
| South Korean Won | FBCO | Sell | 43,339,556,185 | 37,578,739 | 5/12/16 | 793,509 | — | ||||
| South Korean Won | HSBC | Sell | 33,927,191,582 | 29,691,740 | 5/12/16 | 895,424 | — | ||||
| Euro | BANT | Sell | 1,147,615 | 1,228,722 | 5/18/16 | — | (22,826 | ) | |||
26 Annual Report
franklintempleton.com
FRANKLIN MUTUAL QUEST FUND
STATEMENT OF INVESTMENTS
| Forward Exchange Contracts (continued) | |||||||||||
| Contract | Settlement | Unrealized | Unrealized | ||||||||
| Currency | Counterpartya Type | Quantity | Amount | Date | Appreciation | Depreciation | |||||
| OTC Forward Exchange Contracts (continued) | |||||||||||
| Euro | DBFX | Sell | 1,160,082 | $ | 1,240,915 | 5/18/16 | $ | — | $ | (24,230 | ) |
| Euro | FBCO | Sell | 614,332 | 666,978 | 5/18/16 | 2,018 | (5,008 | ) | |||
| Euro | HSBC | Sell | 598,334 | 649,323 | 5/18/16 | 1,616 | (4,814 | ) | |||
| Euro | SSBT | Sell | 1,187,702 | 1,268,021 | 5/18/16 | — | (27,245 | ) | |||
| British Pound | BANT | Sell | 542,000 | 804,030 | 5/23/16 | 4,821 | — | ||||
| British Pound | FBCO | Sell | 22,325,725 | 34,203,904 | 5/23/16 | 1,283,378 | — | ||||
| British Pound | HSBC | Sell | 18,899,077 | 28,925,415 | 5/23/16 | 1,057,673 | — | ||||
| Total Forward Exchange Contracts | $ | 22,597,926 | $ | (7,076,688 | ) | ||||||
| Net unrealized appreciation (depreciation) | $ | 15,521,238 | |||||||||
aMay be comprised of multiple contracts with the same counterparty, currency and settlement date.
See Abbreviations on page 46.
franklintempleton.com
The accompanying notes are an integral part of these financial statements. | Annual Report 27
| FRANKLIN MUTUAL QUEST FUND | |||
| Financial Statements | |||
| Statement of Assets and Liabilities | |||
| December 31, 2015 | |||
| Assets: | |||
| Investments in securities: | |||
| Cost - Unaffiliated issuers | $ | 4,706,371,177 | |
| Cost - Non-controlled affiliates (Note 11) | 550,169,477 | ||
| Total cost of investments | $ | 5,256,540,654 | |
| Value - Unaffiliated issuers | $ | 4,651,574,352 | |
| Value - Non-controlled affiliates (Note 11) | 485,044,806 | ||
| Total value of investments | 5,136,619,158 | ||
| Cash | 12,387,345 | ||
| Restricted Cash (Note 1e) | 1,690,000 | ||
| Foreign currency, at value (cost $3,001,398) | 3,002,438 | ||
| Receivables: | |||
| Investment securities sold | 1,672,977 | ||
| Capital shares sold | 4,636,844 | ||
| Dividends and interest | 27,736,464 | ||
| Due from brokers | 14,130,629 | ||
| Variation margin | 2,064,088 | ||
| Unrealized appreciation on OTC forward exchange contracts | 22,597,926 | ||
| Other assets | 729,112 | ||
| Total assets | 5,227,266,981 | ||
| Liabilities: | |||
| Payables: | |||
| Investment securities purchased | 30,244,605 | ||
| Capital shares redeemed | 12,822,643 | ||
| Management fees | 2,989,793 | ||
| Distribution fees | 1,109,437 | ||
| Transfer agent fees | 634,766 | ||
| Trustees’ fees and expenses | 252,488 | ||
| Options written, at value (premiums received $29,458) | 2,000 | ||
| Securities sold short, at value (proceeds $4,890,589) | 5,250,135 | ||
| Due to brokers | 5,020,000 | ||
| Unrealized depreciation on OTC forward exchange contracts | 7,076,688 | ||
| Accrued expenses and other liabilities | 381,027 | ||
| Total liabilities | 65,783,582 | ||
| Net assets, at value | $ | 5,161,483,399 | |
| Net assets consist of: | |||
| Paid-in capital | $ | 5,516,299,818 | |
| Distributions in excess of net investment income | (31,134,930 | ) | |
| Net unrealized appreciation (depreciation) | (101,005,849 | ) | |
| Accumulated net realized gain (loss) | (222,675,640 | ) | |
| Net assets, at value | $ | 5,161,483,399 | |
28 Annual Report | The accompanying notes are an integral part of these financial statements.
franklintempleton.com
FRANKLIN MUTUAL QUEST FUND
FINANCIAL STATEMENTS
| Statement of Assets and Liabilities (continued) | ||
| December 31, 2015 | ||
| Class Z: | ||
| Net assets, at value | $ | 3,577,696,058 |
| Shares outstanding | 247,295,212 | |
| Net asset value and maximum offering price per share | $ | 14.47 |
| Class A: | ||
| Net assets, at value | $ | 1,203,507,771 |
| Shares outstanding | 84,203,407 | |
| Net asset value per sharea | $ | 14.29 |
| Maximum offering price per share (net asset value per share ÷ 94.25%) | $ | 15.16 |
| Class C: | ||
| Net assets, at value | $ | 337,973,710 |
| Shares outstanding | 24,008,871 | |
| Net asset value and maximum offering price per sharea | $ | 14.08 |
| Class R: | ||
| Net assets, at value | $ | 898,021 |
| Shares outstanding | 63,526 | |
| Net asset value and maximum offering price per share | $ | 14.14 |
| Class R6: | ||
| Net assets, at value | $ | 41,407,839 |
| Shares outstanding | 2,865,030 | |
| Net asset value and maximum offering price per share | $ | 14.45 |
aRedemption price is equal to net asset value less contingent deferred sales charges, if applicable.
franklintempleton.com
The accompanying notes are an integral part of these financial statements. | Annual Report 29
FRANKLIN MUTUAL QUEST FUND
FINANCIAL STATEMENTS
| Statement of Operations | |||
| for the year ended December 31, 2015 | |||
| Investment income: | |||
| Dividends: | |||
| Unaffiliated issuers | $ | 94,493,204 | |
| Non-controlled affiliates (Note 11) | 5,009,932 | ||
| Interest: | |||
| Unaffiliated issuers | 110,449,227 | ||
| Non-controlled affiliates (Note 11) | 21,670,235 | ||
| Income from securities loaned | 4,090,824 | ||
| Other income (Note 1i) | 2,458,964 | ||
| Total investment income | 238,172,386 | ||
| Expenses: | |||
| Management fees (Note 3a) | 38,463,846 | ||
| Distribution fees: (Note 3c) | |||
| Class A | 3,766,892 | ||
| Class C | 3,785,658 | ||
| Class R | 4,176 | ||
| Transfer agent fees: (Note 3e) | |||
| Class Z | 3,360,029 | ||
| Class A | 1,141,507 | ||
| Class C | 321,425 | ||
| Class R | 709 | ||
| Class R6 | 4,824 | ||
| Custodian fees (Note 4) | 263,685 | ||
| Reports to shareholders | 297,840 | ||
| Registration and filing fees | 161,391 | ||
| Professional fees | 257,047 | ||
| Trustees’ fees and expenses | 163,415 | ||
| Dividends and/or interest on securities sold short | 1,756,712 | ||
| Other | 224,930 | ||
| Total expenses | 53,974,086 | ||
| Expense reductions (Note 4) | (2,021 | ) | |
| Expenses waived/paid by affiliates (Note 3f) | (27,292 | ) | |
| Net expenses | 53,944,773 | ||
| Net investment income | 184,227,613 | ||
| Realized and unrealized gains (losses): | |||
| Net realized gain (loss) from: | |||
| Investments: | |||
| Unaffiliated issuers | (129,058,577 | ) | |
| Non-controlled affiliates (Note 11) | 925,302 | ||
| Written options | 886,757 | ||
| Foreign currency transactions | 107,288,600 | ||
| Futures contracts | 26,132,883 | ||
| Securities sold short | 4,786,338 | ||
| Net realized gain (loss) | 10,961,303 | ||
| Net change in unrealized appreciation (depreciation) on: | |||
| Investments | (465,690,756 | ) | |
| Translation of other assets and liabilities denominated in foreign currencies | (47,830,952 | ) | |
| Written options | (1,164,572 | ) | |
| Futures contracts | (157,568 | ) | |
| Net change in unrealized appreciation (depreciation) | (514,843,848 | ) | |
| Net realized and unrealized gain (loss) | (503,882,545 | ) | |
| Net increase (decrease) in net assets resulting from operations | $ | (319,654,932 | ) |
30 Annual Report | The accompanying notes are an integral part of these financial statements.
franklintempleton.com
FRANKLIN MUTUAL QUEST FUND
FINANCIAL STATEMENTS
| Statements of Changes in Net Assets | ||||||
| Year Ended December 31, | ||||||
| 2015 | 2014 | |||||
| Increase (decrease) in net assets: | ||||||
| Operations: | ||||||
| Net investment income | $ | 184,227,613 | $ | 247,621,992 | ||
| Net realized gain (loss) | 10,961,303 | 562,800,842 | ||||
| Net change in unrealized appreciation (depreciation) | (514,843,848 | ) | (612,900,738 | ) | ||
| Net increase (decrease) in net assets resulting from operations | (319,654,932 | ) | 197,522,096 | |||
| Distributions to shareholders from: | ||||||
| Net investment income: | ||||||
| Class Z | (163,207,971 | ) | (190,782,212 | ) | ||
| Class A | (51,862,885 | ) | (60,978,852 | ) | ||
| Class C | (12,107,464 | ) | (14,917,082 | ) | ||
| Class R | (37,204 | ) | (27,118 | ) | ||
| Class R6 | (1,902,104 | ) | (2,013,042 | ) | ||
| Net realized gains: | ||||||
| Class Z | (36,346,618 | ) | (387,863,649 | ) | ||
| Class A | (12,624,545 | ) | (132,713,943 | ) | ||
| Class C | (3,609,519 | ) | (38,720,015 | ) | ||
| Class R | (8,573 | ) | (62,584 | ) | ||
| Class R6 | (400,346 | ) | (4,096,572 | ) | ||
| Total distributions to shareholders | (282,107,229 | ) | (832,175,069 | ) | ||
| Capital share transactions: (Note 2) | ||||||
| Class Z | (123,816,554 | ) | 279,883,976 | |||
| Class A | (48,647,999 | ) | 173,092,819 | |||
| Class C | (20,106,509 | ) | 35,618,735 | |||
| Class R | 330,459 | (111,703 | ) | |||
| Class R6 | 1,720,060 | 50,156,576 | ||||
| Total capital share transactions | (190,520,543 | ) | 538,640,403 | |||
| Net increase (decrease) in net assets | (792,282,704 | ) | (96,012,570 | ) | ||
| Net assets: | ||||||
| Beginning of year | 5,953,766,103 | 6,049,778,673 | ||||
| End of year | $ | 5,161,483,399 | $ | 5,953,766,103 | ||
| Distributions in excess of net investment income included in net assets: | ||||||
| End of year | $ | (31,134,930 | ) | $ | (7,376,721 | ) |
franklintempleton.com
The accompanying notes are an integral part of these financial statements. | Annual Report 31
FRANKLIN MUTUAL QUEST FUND
Notes to Financial Statements
1. Organization and Significant Accounting Policies
Franklin Mutual Series Funds (Trust) is registered under the Investment Company Act of 1940 (1940 Act) as an open-end management investment company, consisting of seven separate funds and applies the specialized accounting and reporting guidance in U.S. Generally Accepted Accounting Principles (U.S. GAAP). Franklin Mutual Quest Fund (Fund) is included in this report. The financial statements of the remaining funds in the Trust are presented separately. The Fund offers five classes of shares: Class Z, Class A, Class C, Class R and Class R6. Each class of shares differs by its initial sales load, contingent deferred sales charges, voting rights on matters affecting a single class, its exchange privilege and fees primarily due to differing arrangements for distribution and transfer agent fees.
The following summarizes the Fund’s significant accounting policies.
a. Financial Instrument Valuation
The Fund’s investments in financial instruments are carried at fair value daily. Fair value is the price that would be received to sell an asset or paid to transfer a liability in an orderly transaction between market participants on the measurement date. The Fund calculates the net asset value per share as of 4 p.m. Eastern time each day the New York Stock Exchange (NYSE) is open for trading. Under compliance policies and procedures approved by the Trust’s Board of Trustees (the Board), the Fund’s administrator has responsibility for oversight of valuation, including leading the cross-functional Valuation and Liquidity Oversight Committee (VLOC). The VLOC provides administration and oversight of the Fund’s valuation policies and procedures, which are approved annually by the Board. Among other things, these procedures allow the Fund to utilize independent pricing services, quotations from securities and financial instrument dealers, and other market sources to determine fair value.
Equity securities and derivative financial instruments (derivatives) listed on an exchange or on the NASDAQ National Market System are valued at the last quoted sale price or the official closing price of the day, respectively. Foreign equity securities are valued as of the close of trading on the foreign stock exchange on which the security is primarily traded or as of 4 p.m. Eastern time, whichever is earlier. The value is then converted into its U.S. dollar equivalent at the foreign exchange rate in effect at 4 p.m. Eastern time on the day that the value of the security is determined. Over-the-counter (OTC) securities are valued within the range of the most recent quoted bid and ask prices. Securities that trade in multiple markets or on multiple exchanges are valued according to the broadest and most representative market. Certain equity securities are valued based upon fundamental characteristics or relationships to similar securities.
Debt securities generally trade in the OTC market rather than on a securities exchange. The Fund’s pricing services use multiple valuation techniques to determine fair value. In instances where sufficient market activity exists, the pricing services may utilize a market-based approach through which quotes from market makers are used to determine fair value. In instances where sufficient market activity may not exist or is limited, the pricing services also utilize proprietary valuation models which may consider market characteristics such as benchmark yield curves, credit spreads, estimated default rates, anticipated market interest rate volatility, coupon rates, anticipated timing of principal repayments, underlying collateral, and other unique security features in order to estimate the relevant cash flows, which are then discounted to calculate the fair value. Securities denominated in a foreign currency are converted into their U.S. dollar equivalent at the foreign exchange rate in effect at 4 p.m. Eastern time on the date that the values of the foreign debt securities are determined.
Certain derivatives trade in the OTC market. The Fund’s pricing services use various techniques including industry standard option pricing models and proprietary discounted cash flow models to determine the fair value of those instruments. The Fund’s net benefit or obligation under the derivative contract, as measured by the fair value of the contract, is included in net assets.
The Fund has procedures to determine the fair value of financial instruments for which market prices are not reliable or readily available. Under these procedures, the VLOC convenes on a regular basis to review such financial instruments and considers a number of factors, including significant unobservable valuation inputs, when arriving at fair value. The VLOC primarily employs a market-based approach which may use related or comparable assets or liabilities, recent transactions, market multiples, book values, and other relevant information for the investment to determine the fair value of the investment. An income-based valuation approach may also be used in which the anticipated future cash flows of the investment are discounted to calculate fair value. Discounts may also be applied due to the
32 Annual Report
franklintempleton.com
FRANKLIN MUTUAL QUEST FUND
NOTES TO FINANCIAL STATEMENTS
nature or duration of any restrictions on the disposition of the investments. Due to the inherent uncertainty of valuations of such investments, the fair values may differ significantly from the values that would have been used had an active market existed. The VLOC employs various methods for calibrating these valuation approaches including a regular review of key inputs and assumptions, transactional back-testing or disposition analysis, and reviews of any related market activity.
Trading in securities on foreign securities stock exchanges and OTC markets may be completed before 4 p.m. Eastern time. In addition, trading in certain foreign markets may not take place on every NYSE business day. Occasionally, events occur between the time at which trading in a foreign security is completed and the close of the NYSE that might call into question the reliability of the value of a portfolio security held by the Fund. As a result, differences may arise between the value of the Fund’s portfolio securities as determined at the foreign market close and the latest indications of value at the close of the NYSE. In order to minimize the potential for these differences, the VLOC monitors price movements following the close of trading in foreign stock markets through a series of country specific market proxies (such as baskets of American Depositary Receipts, futures contracts and exchange traded funds). These price movements are measured against established trigger thresholds for each specific market proxy to assist in determining if an event has occurred that may call into question the reliability of the values of the foreign securities held by the Fund. If such an event occurs, the securities may be valued using fair value procedures, which may include the use of independent pricing services.
When the last day of the reporting period is a non-business day, certain foreign markets may be open on those days that the NYSE is closed, which could result in differences between the value of the Fund’s portfolio securities on the last business day and the last calendar day of the reporting period. Any significant security valuation changes due to an open foreign market are adjusted and reflected by the Fund for financial reporting purposes.
b. Foreign Currency Translation
Portfolio securities and other assets and liabilities denominated in foreign currencies are translated into U.S. dollars based on the exchange rate of such currencies against U.S. dollars on the date of valuation. The Fund may enter into foreign currency exchange contracts to facilitate transactions denominated in a foreign currency. Purchases and sales of securities, income and expense items denominated in foreign currencies are translated into U.S. dollars at the exchange rate in effect on the transaction date. Portfolio securities and assets and liabilities denominated in foreign currencies contain risks that those currencies will decline in value relative to the U.S. dollar. Occasionally, events may impact the availability or reliability of foreign exchange rates used to convert the U.S. dollar equivalent value. If such an event occurs, the foreign exchange rate will be valued at fair value using procedures established and approved by the Board.
The Fund does not separately report the effect of changes in foreign exchange rates from changes in market prices on securities held. Such changes are included in net realized and unrealized gain or loss from investments in the Statement of Operations.
Realized foreign exchange gains or losses arise from sales of foreign currencies, currency gains or losses realized between the trade and settlement dates on securities transactions and the difference between the recorded amounts of dividends, interest, and foreign withholding taxes and the U.S. dollar equivalent of the amounts actually received or paid. Net unrealized foreign exchange gains and losses arise from changes in foreign exchange rates on foreign denominated assets and liabilities other than investments in securities held at the end of the reporting period.
c. Securities Purchased on a When-issued or Delayed Delivery Basis
The Fund purchases securities on a when-issued or delayed delivery basis, with payment and delivery scheduled for a future date. These transactions are subject to market fluctuations and are subject to the risk that the value at delivery may be more or less than the trade date purchase price. Although the Fund will generally purchase these securities with the intention of holding the securities, it may sell the securities before the settlement date. Sufficient assets have been segregated for these securities.
d. Derivative Financial Instruments
The Fund invested in derivatives in order to manage risk or gain exposure to various other investments or markets. Derivatives are financial contracts based on an underlying or notional amount, require no initial investment or an initial net investment that is smaller than would normally be required to have a similar response to changes in market factors, and require or permit net settlement. Derivatives contain various risks including the potential inability of the counterparty to fulfill their obligations under the terms of the contract, the potential for an
franklintempleton.com
Annual Report
33
FRANKLIN MUTUAL QUEST FUND
NOTES TO FINANCIAL STATEMENTS
1. Organization and Significant Accounting
Policies (continued)
d. Derivative Financial Instruments (continued)
illiquid secondary market, and/or the potential for market movements which expose the Fund to gains or losses in excess of the amounts shown in the Statement of Assets and Liabilities. Realized gain and loss and unrealized appreciation and depreciation on these contracts for the period are included in the Statement of Operations.
Derivative counterparty credit risk is managed through a formal evaluation of the creditworthiness of all potential counter-parties. The Fund attempts to reduce its exposure to counterparty credit risk on OTC derivatives, whenever possible, by entering into International Swaps and Derivatives Association (ISDA) master agreements with certain counterparties. These agreements contain various provisions, including but not limited to collateral requirements, events of default, or early termination. Termination events applicable to the counterparty include certain deteriorations in the credit quality of the counterparty. Termination events applicable to the Fund include failure of the Fund to maintain certain net asset levels and/or limit the decline in net assets over various periods of time. In the event of default or early termination, the ISDA master agreement gives the non-defaulting party the right to net and close-out all transactions traded, whether or not arising under the ISDA agreement, to one net amount payable by one counterparty to the other. However, absent an event of default or early termination, OTC derivative assets and liabilities are presented gross and not offset in the Statement of Assets and Liabilities. Early termination by the counterparty may result in an immediate payment by the Fund of any net liability owed to that counterparty under the ISDA agreement. At December 31, 2015, the Fund had OTC derivatives in a net liability position of $500,864 and the aggregate value of collateral pledged for such contracts was $505,595.
Collateral requirements differ by type of derivative. Collateral or initial margin requirements are set by the broker or exchange clearing house for exchange traded and centrally cleared derivatives. Initial margin deposited is held at the exchange and can be in the form of cash and/or securities. For OTC derivatives traded under an ISDA master agreement, posting of collateral is required by either the Fund or the applicable counterparty if the total net exposure of all OTC derivatives with the applicable counterparty exceeds the minimum transfer amount, which typically ranges from $100,000 to $250,000, and can vary depending on the counterparty and the type of the agreement. Generally, collateral is determined at the close of Fund business each day and any additional collateral required due to changes in derivative values may be delivered by the Fund or the counter-party within a few business days. Collateral pledged and/or received by the Fund for OTC derivatives, if any, is held in segregated accounts with the Fund’s custodian/counterparty broker and can be in the form of cash and/or securities. Unrestricted cash may be invested according to the Fund’s investment objectives. To the extent that the amounts due to the Fund from its counterparties are not subject to collateralization or are not fully collateralized, the Fund bears the risk of loss from counterparty non-performance.
At December 31, 2015, the Fund received $7,798,815 in Italy Treasury Notes, United Kingdom Treasury Bonds and U.S. Treasury Bills, Bonds and Notes as collateral for derivatives.
The Fund entered into exchange traded futures contracts primarily to manage exposure to certain foreign currencies. A futures contract is an agreement between the Fund and a counterparty to buy or sell an asset for a specified price on a future date. Required initial margins are pledged by the Fund, and the daily change in fair value is accounted for as a variation margin payable or receivable in the Statement of Assets and Liabilities.
The Fund entered into OTC forward exchange contracts primarily to manage exposure to certain foreign currencies. A forward exchange contract is an agreement between the Fund and a counterparty to buy or sell a foreign currency at a specific exchange rate on a future date.
The Fund purchased or wrote exchange traded option contracts primarily to manage exposure to equity price risk. An option is a contract entitling the holder to purchase or sell a specific amount of shares or units of an asset or notional amount of a swap (swaption), at a specified price. When an option is purchased or written, an amount equal to the premium paid or received is recorded as an asset or liability, respectively. Upon exercise of an option, the acquisition cost or sales proceeds of the underlying investment is adjusted by any premium received or paid. Upon expiration of an option, any premium received or paid is recorded as a realized gain or loss. Upon closing an option other than through expiration or exercise, the difference between the premium received or paid and the cost to close the position is recorded as a realized gain or loss.
34 Annual Report
franklintempleton.com
FRANKLIN MUTUAL QUEST FUND
NOTES TO FINANCIAL STATEMENTS
See Notes 7 and 10 regarding investment transactions and other derivative information, respectively.
e. Restricted Cash
At December 31, 2015, the Fund held restricted cash in connection with investments in certain derivative securities. Restricted cash is held in a segregated account with the Fund’s custodian/counterparty broker and is reflected in the Statement of Assets and Liabilities.
f. Securities Sold Short
The Fund is engaged in selling securities short, which obligates the Fund to replace a borrowed security with the same security at current fair value. The Fund incurs a loss if the price of the security increases between the date of the short sale and the date on which the Fund replaces the borrowed security. The Fund realizes a gain if the price of the security declines between those dates. Gains are limited to the price at which the Fund sold the security short, while losses are potentially unlimited in size.
The Fund is required to establish a margin account with the broker lending the security sold short. While the short sale is outstanding, the broker retains the proceeds of the short sale to the extent necessary to meet margin requirements until the short position is closed out. A deposit must also be maintained with the Fund’s custodian/counterparty broker consisting of cash and/or securities having a value equal to a specified percentage of the value of the securities sold short. The Fund is obligated to pay fees for borrowing the securities sold short and is required to pay the counterparty any dividends and/or interest due on securities sold short. Such dividends and/or interest and any security borrowing fees are recorded as an expense to the Fund.
g. Securities Lending
The Fund participates in an agency based securities lending program to earn additional income. The Fund receives cash collateral against the loaned securities in an amount equal to at least 102% of the fair value of the loaned securities. Collateral is maintained over the life of the loan in an amount not less than 100% of the fair value of loaned securities, as determined at the close of Fund business each day; any additional collateral required due to changes in security values is delivered to the Fund on the next business day. The collateral is deposited into a joint cash account with other funds and is used to invest in a money market fund managed by Franklin Advisers, Inc., an affiliate of the Fund, and/or a joint repurchase agreement. The Fund may receive income from the investment of cash collateral, in addition to lending fees and rebates paid by the borrower. Income from securities loaned is reported separately in the Statement of Operations. The Fund bears the market risk with respect to the collateral investment, securities loaned, and the risk that the agent may default on its obligations to the Fund. If the borrower defaults on its obligation to return the securities loaned, the Fund has the right to repurchase the securities in the open market using the collateral received. The securities lending agent has agreed to indemnify the Fund in the event of default by a third party borrower. At December 31, 2015, the Fund had no securities on loan.
h. Senior Floating Rate Interests
The Fund invests in senior secured corporate loans that pay interest at rates which are periodically reset by reference to a base lending rate plus a spread. These base lending rates are generally the prime rate offered by a designated U.S. bank or the London InterBank Offered Rate (LIBOR). Senior secured corporate loans often require prepayment of principal from excess cash flows or at the discretion of the borrower. As a result, actual maturity may be substantially less than the stated maturity. Senior secured corporate loans in which the Fund invests are generally readily marketable, but may be subject to certain restrictions on resale.
i. Income and Deferred Taxes
It is the Fund’s policy to qualify as a regulated investment company under the Internal Revenue Code. The Fund intends to distribute to shareholders substantially all of its taxable income and net realized gains to relieve it from federal income and excise taxes. As a result, no provision for U.S. federal income taxes is required.
The Fund may be subject to foreign taxation related to income received, capital gains on the sale of securities and certain foreign currency transactions in the foreign jurisdictions in which it invests. Foreign taxes, if any, are recorded based on the tax regulations and rates that exist in the foreign markets in which the Fund invests. When a capital gain tax is determined to apply, the Fund records an estimated deferred tax liability in an amount that would be payable if the securities were disposed of on the valuation date. As a result of several court cases, in certain countries across the European Union, the Fund has filed additional tax reclaims for previously withheld taxes on dividends earned in those countries. These additional filings are subject to various administrative proceedings by the local
franklintempleton.com
Annual Report
35
FRANKLIN MUTUAL QUEST FUND
NOTES TO FINANCIAL STATEMENTS
1. Organization and Significant Accounting
Policies (continued)
i. Income and Deferred Taxes (continued)
jurisdictions’ tax authorities within the European Union, as well as a number of related judicial proceedings. During the year ended December 31, 2015, the Fund recognized $2,556,354 from Finland and Sweden for previously withheld foreign taxes and interest on such taxes. These amounts are reflected as other income and interest in the Statement of Operations. In regards to filings in other European Union countries, uncertainty exists as to the ultimate resolution of these proceedings, the likelihood of receipt of these reclaims, and the potential timing of payment, and accordingly, no amounts are reflected in the financial statements.
The Fund may recognize an income tax liability related to its uncertain tax positions under U.S. GAAP when the uncertain tax position has a less than 50% probability that it will be sustained upon examination by the tax authorities based on its technical merits. As of December 31, 2015, the Fund has determined that no tax liability is required in its financial statements related to uncertain tax positions for any open tax years (or expected to be taken on future tax returns). Open tax years are those that remain subject to examination and are based on each tax jurisdiction’s statute of limitation.
j. Security Transactions, Investment Income, Expenses and Distributions
Security transactions are accounted for on trade date. Realized gains and losses on security transactions are determined on a specific identification basis. Interest income and estimated expenses are accrued daily. Amortization of premium and accretion of discount on debt securities are included in interest income. Dividend income and dividends declared on securities sold short are recorded on the ex-dividend date except for certain dividends from foreign securities where the dividend rate is not available. In such cases, the dividend is recorded as soon as the information is received by the Fund. Distributions to shareholders are recorded on the ex-dividend date and are determined according to income tax regulations (tax basis). Distributable earnings determined on a tax basis may differ from earnings recorded in accordance with U.S. GAAP. These differences may be permanent or temporary. Permanent differences are reclassified among capital accounts to reflect their tax character. These reclassifications have no impact on net assets or the results of operations. Temporary differences are not reclassified, as they may reverse in subsequent periods.
Common expenses incurred by the Trust are allocated among the funds based on the ratio of net assets of each fund to the combined net assets of the Trust. Fund specific expenses are charged directly to the fund that incurred the expense.
Realized and unrealized gains and losses and net investment income, not including class specific expenses, are allocated daily to each class of shares based upon the relative proportion of net assets of each class. Differences in per share distributions, by class, are generally due to differences in class specific expenses.
k. Accounting Estimates
The preparation of financial statements in accordance with U.S. GAAP requires management to make estimates and assumptions that affect the reported amounts of assets and liabilities at the date of the financial statements and the amounts of income and expenses during the reporting period. Actual results could differ from those estimates.
l. Guarantees and Indemnifications
Under the Trust’s organizational documents, its officers and trustees are indemnified by the Trust against certain liabilities arising out of the performance of their duties to the Trust. Additionally, in the normal course of business, the Trust, on behalf of the Fund, enters into contracts with service providers that contain general indemnification clauses. The Trust’s maximum exposure under these arrangements is unknown as this would involve future claims that may be made against the Trust that have not yet occurred. Currently, the Trust expects the risk of loss to be remote.
36 Annual Report
franklintempleton.com
FRANKLIN MUTUAL QUEST FUND
NOTES TO FINANCIAL STATEMENTS
2. Shares of Beneficial Interest
At December 31, 2015, there were an unlimited number of shares authorized (without par value). Transactions in the Fund’s shares were as follows:
| Year Ended December 31, | ||||||||||||
| 2015 | 2014 | |||||||||||
| Shares | Amount | Shares | Amount | |||||||||
| Class Z Shares: | ||||||||||||
| Shares sold | 12,954,163 | $ | 207,655,082 | 13,791,131 | $ | 254,628,820 | ||||||
| Shares issued on reorganization (Note 12) | 1,132,300 | 17,641,382 | — | — | ||||||||
| Shares issued in reinvestment of distributions | 13,178,701 | 190,234,563 | 33,993,990 | 551,437,500 | ||||||||
| Shares redeemed | (33,954,727 | ) | (539,347,581 | ) | (28,713,574 | ) | (526,182,344 | ) | ||||
| Net increase (decrease) | (6,689,563 | ) | $ | (123,816,554 | ) | 19,071,547 | $ | 279,883,976 | ||||
| Class A Shares: | ||||||||||||
| Shares sold | 12,578,900 | $ | 198,023,725 | 12,523,961 | $ | 230,093,834 | ||||||
| Shares issued on merger (Note 12) | 1,141,127 | 17,539,264 | — | — | ||||||||
| Shares issued in reinvestment of distributions | 4,438,917 | 63,336,516 | 11,754,465 | 188,443,537 | ||||||||
| Shares redeemed | (20,988,500 | ) | (327,547,504 | ) | (13,468,589 | ) | (245,444,552 | ) | ||||
| Net increase (decrease) | (2,829,556 | ) | $ | (48,647,999 | ) | 10,809,837 | $ | 173,092,819 | ||||
| Class C Shares: | ||||||||||||
| Shares sold | 2,190,012 | $ | 33,809,518 | 2,624,276 | $ | 47,212,405 | ||||||
| Shares issued on reorganization (Note 12) | 448,682 | 6,761,645 | — | — | ||||||||
| Shares issued in reinvestment of distributions | 1,074,843 | 15,125,085 | 3,246,333 | 51,269,278 | ||||||||
| Shares redeemed | (4,927,958 | ) | (75,802,757 | ) | (3,524,189 | ) | (62,862,948 | ) | ||||
| Net increase (decrease) | (1,214,421 | ) | $ | (21,106,509 | ) | 2,346,420 | $ | 35,618,735 | ||||
| Class R Shares: | ||||||||||||
| Shares sold | 25,822 | $ | 411,526 | 57,363 | $ | 1,046,885 | ||||||
| Shares issued in reinvestment of distributions | 3,246 | 45,776 | 5,648 | 89,703 | ||||||||
| Shares redeemed | (8,054 | ) | (126,843 | ) | (68,294 | ) | (1,248,291 | ) | ||||
| Net increase (decrease) | 21,014 | $ | 330,459 | (5,283 | ) | $ | (111,703 | ) | ||||
| Class R6 Shares: | ||||||||||||
| Shares sold | 601,340 | $ | 9,629,497 | 2,577,392 | $ | 48,100,007 | ||||||
| Shares issued in reinvestment of distributions | 159,785 | 2,302,450 | 377,501 | 6,108,898 | ||||||||
| Shares redeemed | (634,102 | ) | (10,211,887 | ) | (217,161 | ) | (4,052,329 | ) | ||||
| Net increase (decrease) | 127,023 | $ | 1,720,060 | 2,737,732 | $ | 50,156,576 | ||||||
3. Transactions with Affiliates
Franklin Resources, Inc. is the holding company for various subsidiaries that together are referred to as Franklin Templeton Investments. Certain officers and trustees of the Fund are also officers and/or directors of the following subsidiaries:
| Subsidiary | Affiliation |
| Franklin Mutual Advisers, LLC (Franklin Mutual) | Investment manager |
| Franklin Templeton Services, LLC (FT Services) | Administrative manager |
| Franklin Templeton Distributors, Inc. (Distributors) | Principal underwriter |
| Franklin Templeton Investor Services, LLC (Investor Services) | Transfer agent |
franklintempleton.com
Annual Report
37
FRANKLIN MUTUAL QUEST FUND
NOTES TO FINANCIAL STATEMENTS
3. Transactions with Affiliates (continued)
a. Management Fees
The Fund pays an investment management fee to Franklin Mutual based on the average daily net assets of the Fund as follows:
| Annualized Fee Rate | Net Assets | |
| 0.675 | % | Up to and including $5 billion |
| 0.645 | % | Over $5 billion, up to and including $7 billion |
| 0.625 | % | Over $7 billion, up to and including $10 billion |
| 0.615 | % | In excess of $10 billion |
b. Administrative Fees
Under an agreement with Franklin Mutual, FT Services provides administrative services to the Fund. The fee is paid by Franklin Mutual based on the Fund’s average daily net assets, and is not an additional expense of the Fund.
c. Distribution Fees
The Board has adopted distribution plans for each share class, with the exception of Class Z and Class R6 shares, pursuant to Rule 12b-1 under the 1940 Act. Under the Fund’s Class A reimbursement distribution plan, the Fund reimburses Distributors for costs incurred in connection with the servicing, sale and distribution of the Fund’s shares up to the maximum annual plan rate. Under the Class A reimbursement distribution plan, costs exceeding the maximum for the current plan year cannot be reimbursed in subsequent periods. In addition, under the Fund’s Class C and R compensation distribution plans, the Fund pays Distributors for costs incurred in connection with the servicing, sale and distribution of the Fund’s shares up to the maximum annual plan rate for each class. The plan year, for purposes of monitoring compliance with the maximum annual plan rates, is February 1 through January 31 for each fund.
The maximum annual plan rates, based on the average daily net assets, for each class, are as follows:
| Class A | 0.35 | % |
| Class C | 1.00 | % |
| Class R | 0.50 | % |
Effective August 1, 2015, the Board has set the current rate at 0.25% per year for Class A shares until further notice and approval by the Board. Prior to August 1, 2015, the Board had set the rate at 0.30% per year for Class A shares.
d. Sales Charges/Underwriting Agreements
Front-end sales charges and contingent deferred sales charges (CDSC) do not represent expenses of the Fund. These charges are deducted from the proceeds of sales of Fund shares prior to investment or from redemption proceeds prior to remittance, as applicable. Distributors has advised the Fund of the following commission transactions related to the sales and redemptions of the Fund’s shares for the year:
| Sales charges retained net of commissions paid to unaffiliated | ||
| broker/dealers | $ | 485,474 |
| CDSC retained | $ | 20,907 |
e. Transfer Agent Fees
Each class of shares, except for Class R6, pays transfer agent fees to Investor Services for its performance of shareholder servicing obligations and reimburses Investor Services for out of pocket expenses incurred, including shareholding servicing fees paid to third parties. These fees are allocated daily based upon their relative proportion of such classes’ aggregate net assets. Class R6 pays Investor Services transfer agent fees specific to that class.
38 Annual Report
franklintempleton.com
FRANKLIN MUTUAL QUEST FUND
NOTES TO FINANCIAL STATEMENTS
For the year ended December 31, 2015, the Fund paid transfer agent fees of $4,828,494, of which $2,356,751 was retained by Investor Services.
f. Investments in Affiliated Management Investment Companies
The Fund invests in an affiliated management investment company for purposes other than exercising a controlling influence over the management or policies. Management fees paid by the Fund are waived on assets invested in the affiliated management investment company, as noted in the Statement of Operations, in an amount not to exceed the management and administrative fees paid directly or indirectly by each affiliate.
| % of Affiliated | ||||||||
| Number of | Number of | Fund Shares | ||||||
| Shares Held | Shares Held | Value | Outstanding | |||||
| at Beginning | Gross | Gross | at End | at End | Investment | Realized | Held at End | |
| of Year | Additions | Reductions | of Year of Year | of Year of Year | Income | Gain (Loss) | of Year | |
| Non-Controlled Affiliates | ||||||||
| Institutional Fiduciary Trust | ||||||||
| Money Market Portfolio | — | 98,750,000 | (98,750,000) | — | $ — | $ — | $ — | —% |
g. Waiver and Expense Reimbursements
Investor Services has contractually agreed in advance to waive or limit its fees so that the Class R6 transfer agent fees do not exceed 0.01% until April 30, 2016. There were no Class R6 transfer agent fees waived during the year ended December 31, 2015.
4. Expense Offset Arrangement
The Fund has entered into an arrangement with its custodian whereby credits realized as a result of uninvested cash balances are used to reduce a portion of the Fund’s custodian expenses. During the year ended December 31, 2015, the custodian fees were reduced as noted in the Statement of Operations.
5. Independent Trustees’ Retirement Plan
On January 1, 1993, the Trust adopted an Independent Trustees’ Retirement Plan (Plan). The Plan is an unfunded defined benefit plan that provides benefit payments to Trustees whose length of service and retirement age meets the eligibility requirements of the Plan. Benefits under the Plan are based on years of service and fees paid to each trustee at the time of retirement. Effective in December 1996, the Plan was closed to new participants.
During the year ended December 31, 2015, the Fund’s projected benefit obligation and benefit payments under the Plan were as follows:
| aProjected benefit obligation at December 31, 2015 | $ | 252,488 |
| bIncrease in projected benefit obligation | $ | 16,713 |
aThe projected benefit obligation is included in trustees’ fees and expenses in the Statement of Assets and Liabilities.
bThe increase in projected benefit obligation is included in trustees’ fees and expenses in the Statement of Operations.
6. Income Taxes
For tax purposes, capital losses may be carried over to offset future capital gains. Capital loss carryforwards with no expiration, if any, must be fully utilized before those losses with expiration dates.
franklintempleton.com
Annual Report
39
FRANKLIN MUTUAL QUEST FUND
NOTES TO FINANCIAL STATEMENTS
| At December 31, 2015, capital loss carryforwards were as follows: | ||||||
| Capital loss carryforwards subject to expiration: | ||||||
| 2016 | $ | 44,141,197 | ||||
| 2017 | 73,758,943 | |||||
| 2018 | 18,751,585 | |||||
| Capital loss carryforwards not subject to expiration: | ||||||
| Short term | 5,699,192 | |||||
| Long term | 53,864,143 | |||||
| Total capital loss carryforwards | $ | 196,215,060 | a | |||
| aIncludes $140,870,870 from the merged Franklin Mutual Recovery Fund, which may be carried over to offset future capital gains, subject to certain limitations. | ||||||
| 6. Income Taxes (continued) | ||||||
| The tax character of distributions paid during the years ended December 31, 2015 and 2014, was as follows: | ||||||
| 2015 | 2014 | |||||
| Distributions paid from: | ||||||
| Ordinary income | $ | 239,256,748 | $ | 465,683,084 | ||
| Long term capital gain | 42,853,418 | 366,491,985 | ||||
| $ | 282,110,166 | $ | 832,175,069 | |||
| At December 31, 2015, the cost of investments, net unrealized appreciation (depreciation) and undistributed ordinary income for | ||||||
| income tax purposes were as follows: | ||||||
| Cost of investments | $ | 5,298,050,949 | ||||
| Unrealized appreciation | $ | 565,854,239 | ||||
| Unrealized depreciation | (727,286,030 | ) | ||||
| Net unrealized appreciation (depreciation) | $ | (161,431,791 | ) | |||
| Distributable earnings – undistributed ordinary income | $ | 12,957,630 | ||||
| Differences between income and/or capital gains as determined on a book basis and a tax basis are primarily due to differing treat- | ||||||
| ments of foreign currency transactions, bond discounts and premiums, tax straddles and wash sales. | ||||||
| 7. Investment Transactions | ||||||
| Purchases and sales of investments (excluding short term securities and securities sold short) for the year ended December 31, 2015, | ||||||
| aggregated $1,593,157,037 and $1,913,240,628, respectively. | ||||||
| Transactions in options written during the year ended December 31, 2015, were as follows: | ||||||
| Number of | ||||||
| Contracts | Premiums | |||||
| Options outstanding at December 31, 2014 | 14,000 | $ | 2,112,030 | |||
| Options written | 10,300 | 598,154 | ||||
| Options expired | (3,000 | ) | (284,873 | ) | ||
| Options exercised | (7,500 | ) | (1,458,433 | ) | ||
| Options closed | (12,800 | ) | (937,420 | ) | ||
| Options outstanding at December 31, 2015 | 1,000 | $ | 29,458 | |||
See Notes 1(d) and 10 regarding derivative financial instruments and other derivative information, respectively.
40 Annual Report
franklintempleton.com
FRANKLIN MUTUAL QUEST FUND
NOTES TO FINANCIAL STATEMENTS
8. Credit Risk and Defaulted Securities
The Fund may purchase the pre-default or defaulted debt of distressed companies. Distressed companies are financially troubled and are about to be or are already involved in financial restructuring or bankruptcy. Risks associated with purchasing these securities include the possibility that the bankruptcy or other restructuring process takes longer than expected, or that distributions in restructuring are less than anticipated, either or both of which may result in unfavorable consequences to the Fund. If it becomes probable that the income on debt securities, including those of distressed companies, will not be collected, the Fund discontinues accruing income and recognizes an adjustment for uncollectible interest.
At December 31, 2015, the aggregate long value of distressed company securities for which interest recognition has been discontinued was $287,155,290, representing 5.56% of the Fund’s net assets. For information as to specific securities, see the accompanying Statement of Investments.
9. Restricted Securities
The Fund invests in securities that are restricted under the Securities Act of 1933 (1933 Act) or which are subject to legal, contractual, or other agreed upon restrictions on resale. Restricted securities are often purchased in private placement transactions, and cannot be sold without prior registration unless the sale is pursuant to an exemption under the 1933 Act. Disposal of these securities may require greater effort and expense, and prompt sale at an acceptable price may be difficult. The Fund may have registration rights for restricted securities. The issuer generally incurs all registration costs.
At December 31, 2015, the Fund held investments in restricted securities, excluding certain securities exempt from registration under the 1933 Act deemed to be liquid, as follows:
| Principal | |||||||||||||
| Amount/ | |||||||||||||
| Shares/ | Acquisition | ||||||||||||
| Warrants | Issuer | Dates | Cost | Value | |||||||||
| 9,272 | Broadband Ventures III LLC, secured promissory note, 5.00%, 2/01/12 | 7/01/10 - 11/30/12 | $ | 9,272 | $ | — | |||||||
| 1,439,821 | CB FIM Coinvestors LLC | 1/15/09 - 6/02/09 | — | — | |||||||||
| 17,934,688 | FIM Coinvestor Holdings I, LLC | 11/20/06 - 6/02/09 | — | — | |||||||||
| 2,548,299 | International Automotive Components Group Brazil LLC | 4/13/06 - 12/26/08 | 1,692,334 | 26,204 | |||||||||
| 19,924,658 | International Automotive Components Group North America LLC | 1/02/06 - 3/18/13 | 16,305,945 | 10,756,626 | |||||||||
| 1,110,000 | aLee Enterprises Inc., wts., 12/31/22 | 3/31/14 | 1,490,026 | 933,263 | |||||||||
| 224,279 | bSorenson Communications Inc., Membership Interests | 4/30/14 | — | 47,098,569 | |||||||||
| Total Restricted Securities (Value is 1.14% of Net Assets) | $ | 19,497,577 | $ | 58,814,662 | |||||||||
| aThe Fund also invests in unrestricted securities or other investments in the issuer, valued at $126,322,655 as of December 31, 2015. | |||||||||||||
| bThe Fund also invests in unrestricted securities or other investments in the issuer, valued at $234,897,694 as of December 31, 2015. | |||||||||||||
| 10. Other Derivative Information | |||||||||||||
| At December 31, 2015, the Fund’s investments in derivative contracts are reflected in the Statement of Assets and Liabilities as follows: | |||||||||||||
| Asset Derivatives | Liability Derivatives | ||||||||||||
| Derivative Contracts | |||||||||||||
| Not Accounted for as | Statement of Assets and | Statement of Assets and | |||||||||||
| Hedging Instruments | Liabilities Location | Fair Value | Liabilities Location | Fair Value | |||||||||
| Foreign exchange contracts | Variation margin | $ | 3,928,346 | a | |||||||||
| Unrealized appreciation on OTC | 22,597,926 | Unrealized depreciation on OTC | $ | 7,076,688 | |||||||||
| forward exchange contracts | forward exchange contracts | ||||||||||||
| Equity contracts | — | Options written, at value | 2,000 | ||||||||||
| Totals | $ | 26,526,272 | $ | 7,078,688 | |||||||||
aThis amount reflects the cumulative appreciation (depreciation) of futures contracts as reported in the Statement of Investments. Only the variation margin receivable/payable at year end is separately reported within the Statement of Assets and Liabilities. Prior variation margin movements were recorded to cash upon receipt or payment.
franklintempleton.com
Annual Report
41
FRANKLIN MUTUAL QUEST FUND
NOTES TO FINANCIAL STATEMENTS
10. Other Derivative Information (continued)
For the year ended December 31, 2015, the effect of derivative contracts in the Fund’s Statement of Operations was as follows:
| Net Change in | |||||||||||||||||
| Unrealized | |||||||||||||||||
| Derivative Contracts | Net Realized | Appreciation | |||||||||||||||
| Not Accounted for as | Statement of Operations | Gain (Loss) | Statement of Operations | (Depreciation) | |||||||||||||
| Hedging Instruments | Locations | for the Year | Locations | for the Year | |||||||||||||
| Net realized gain (loss) from: | Net change in unrealized | ||||||||||||||||
| appreciation (depreciation) on: | |||||||||||||||||
| Foreign exchange contracts | Foreign currency transactions | $ | 108,417,630 | a | Translation of other assets | $ | (47,944,410)a | ||||||||||
| and liabilities denominated | |||||||||||||||||
| in foreign currencies | |||||||||||||||||
| Futures contracts | 26,132,883 | Futures contracts | (157,568) | ||||||||||||||
| Equity contracts | Investments | (3,646,941 | ) | Investments | 3,626,941 | ||||||||||||
| Written options | 886,757 | Written options | (1,164,572) | ||||||||||||||
| Totals | $ | 131,790,329 | $ | (45,639,609) | |||||||||||||
| aForward exchange contracts are included in net realized gain (loss) from foreign currency transactions and net change in unrealized appreciation (depreciation) on translation | |||||||||||||||||
| of other assets and liabilities denominated in foreign currencies in the Statement of Operations. | |||||||||||||||||
| For the year ended December 31, 2015, the average month end fair value of derivatives represented 0.76% of average month end net | |||||||||||||||||
| assets. The average month end number of open derivative contracts for the year was 169. | |||||||||||||||||
| See Notes 1(d) and 7 regarding derivative financial instruments and investment transactions, respectively. | |||||||||||||||||
| 11. Holdings of 5% Voting Securities of Portfolio Companies | |||||||||||||||||
| The 1940 Act defines “affiliated companies” to include investments in portfolio companies in which a fund owns 5% or more of the | |||||||||||||||||
| outstanding voting securities. Investments in “affiliated companies” for the Fund for the year ended December 31, 2015, were as | |||||||||||||||||
| shown below. | |||||||||||||||||
| Number of | Number of | ||||||||||||||||
| Shares/Warrants/ | Shares/Warrants/ | ||||||||||||||||
| Principal Amount | Principal Amount | Value | |||||||||||||||
| Held at Beginning | Gross | Gross | Held at End of | at End | Investment | Realized | |||||||||||
| Name of Issuer | of Year | Additions | Reductions | Year | of Year | Income | Gain (Loss) | ||||||||||
| Non-Controlled Affiliates | |||||||||||||||||
| Advanced Emissions Solutions | |||||||||||||||||
| Inc | — | 1,724,209 | — | 1,724,209 | $ | 12,310,852 | $ | — | $ | — | |||||||
| Advanced Emissions Solutions | |||||||||||||||||
| Inc., Term Loan, | |||||||||||||||||
| 10.50%, 4/22/16 | — | 14,000,000 | (1,633,333) | 12,366,667 | 11,888,571 | 164,306 | 62,235 | ||||||||||
| Eastman Kodak Co | 3,207,889 | 520,256 | a | — | 3,728,145 | 46,750,938 | — | — | |||||||||
| Eastman Kodak Co., Second Lien | |||||||||||||||||
| Term Loan, 10.75%, 9/03/20 | 50,486,000 | 514,000 | a | — | 51,000,000 | 42,585,000 | 3,983,836 | — | |||||||||
| Eastman Kodak Co., Term Loan, | |||||||||||||||||
| 7.25%, 9/03/19 | 14,623,310 | 37,643,704 | a | (219,609 | ) | 52,047,405 | 46,148,716 | 970,171 | 3,103 | ||||||||
| Eastman Kodak Co., wts., | |||||||||||||||||
| 9/03/18 | 43,321 | 5,261 | a | — | 48,582 | 108,338 | — | — | |||||||||
| Eastman Kodak Co., wts., | |||||||||||||||||
| 9/03/18 | 43,321 | 5,261 | a | — | 48,582 | 88,905 | — | — | |||||||||
42 Annual Report
franklintempleton.com
FRANKLIN MUTUAL QUEST FUND
NOTES TO FINANCIAL STATEMENTS
| Number of | Number of | |||||||||||
| Shares/Warrants/ | Shares/Warrants/ | |||||||||||
| Principal Amount | Principal Amount | Value | ||||||||||
| Held at Beginning | Gross | Gross | Held at End of | at End | Investment | Realized | ||||||
| Name of Issuer | of Year | Additions | Reductions | Year | of Year | Income | Gain (Loss) | |||||
| KGen Power Liquidating Trust, | ||||||||||||
| Contingent Distribution | 5,377,461 | 141,643 | a | — | 5,519,104 | $ | — b | $ | — | $ | — | |
| Lee Enterprises Inc./IA | — | 4,824,268 | — | 4,824,268 | 8,104,770 | — | — | |||||
| Lee Enterprises Inc., Second | ||||||||||||
| Lien Term Loan, | ||||||||||||
| 12.00%, 12/15/22 | 27,750,000 | — | (2,301,955 | ) | 25,448,045 | 26,720,447 | 2,246,967 | 109,479 | ||||
| Lee Enterprises Inc., senior | ||||||||||||
| secured note, first lien, 144A, | ||||||||||||
| 9.50%, 3/15/22 | 74,255,000 | 24,795,000 | a | — | 99,050,000 | 91,497,438 | 7,034,630 | — | ||||
| Lee Enterprises Inc., wts., | ||||||||||||
| 12/31/22 | 1,110,000 | — | — | 1,110,000 | 933,263 | — | — | |||||
| New Media Investment Group | ||||||||||||
| Inc | 2,470,007 | 2,216,985 | (245,220 | ) | 4,441,772 | 86,436,883 | 5,009,932 | 731,343 | ||||
| New Media Holdings II LLC, | ||||||||||||
| Term B Loan, | ||||||||||||
| 7.25%, 6/04/20 | 114,425,000 | — | (1,145,238 | ) | 113,279,762 | 111,470,685 | 7,270,325 | 19,142 | ||||
| Total Affiliated Securities (Value is 9.40% of Net Assets) | $ | 485,044,806 | $ | 26,680,167 | $ | 925,302 | ||||||
a A portion or all of the gross additions were acquired through merger acquisitions.
b As of December 31, 2015, no longer an affiliate. Effective June 30, 2014, the common shares were converted into liquidating trust interests, which are non-voting shares.
12. Reorganization
On August 27, 2015, the Franklin Mutual Quest Fund (Surviving Fund), pursuant to a plan of reorganization approved on August 7, 2015 by shareholders of Franklin Mutual Recovery Fund (Acquired Fund), acquired 100% of the Acquired Fund’s net assets, primarily made up of investment securities, which included $(5,776,301) of unrealized appreciation (depreciation), through a tax-free exchange of 2,722,109 shares of the Surviving Fund (valued at $41,942,291). Immediately after the completion of the reorganization, the combined net assets of the Surviving Fund were $5,513,219,307.
The primary purpose for the reorganization was to reorganize the Acquired Fund from a closed-end investment company operating as an interval fund into an open-end investment company with similar investment goals and strategies that offers daily liquidity to its shareholders. The estimated cost of the reorganization was $200,000 of which the Surviving Fund and the Acquired Fund each paid 25% and Franklin Mutual paid 50%. The allocated portion of the Surviving Fund’s reorganization expenses is included with professional fees and reports to shareholders expenses in the Statement of Operations.
Assuming the reorganization had been completed on January 1, 2015, the Fund’s pro forma results of operations would have been as follows:
| Net Increase | ||||||||
| (Decrease) in | ||||||||
| Net | Net Realized | Net Assets | ||||||
| Investment | and Unrealized | from | ||||||
| Period | Income | Gain (Loss) | Operations | |||||
| For the period January 1, 2015 through December 31, 2015 | $ | 184,931,439 | $ | (506,490,317 | ) | $ | (321,558,878 | ) |
Subsequent to the reorganization, the Fund has been managed as a single entity. Accordingly, it is impracticable to identify the amount of net investment income attributable to the Acquired Fund’s assets after the completion of the reorganization.
franklintempleton.com
Annual Report
43
FRANKLIN MUTUAL QUEST FUND
NOTES TO FINANCIAL STATEMENTS
13. Credit Facility
The Fund, together with other U.S. registered and foreign investment funds (collectively, Borrowers), managed by Franklin Temple-ton Investments, are borrowers in a joint syndicated senior unsecured credit facility totaling $2 billion (Global Credit Facility) which matured on February 12, 2016. This Global Credit Facility provides a source of funds to the Borrowers for temporary and emergency purposes, including the ability to meet future unanticipated or unusually large redemption requests. Effective February 12, 2016, the Borrowers renewed the Global Credit Facility for a one year term, maturing February 10, 2017, for a total of $2 billion.
Under the terms of the Global Credit Facility, the Fund shall, in addition to interest charged on any borrowings made by the Fund and other costs incurred by the Fund, pay its share of fees and expenses incurred in connection with the implementation and maintenance of the Global Credit Facility, based upon its relative share of the aggregate net assets of all of the Borrowers, including an annual commitment fee of 0.07% based upon the unused portion of the Global Credit Facility. Effective February 12, 2016, the annual commitment fee is 0.15%. These fees are reflected in other expenses in the Statement of Operations. During the year ended December 31, 2015, the Fund did not use the Global Credit Facility.
14. Fair Value Measurements
The Fund follows a fair value hierarchy that distinguishes between market data obtained from independent sources (observable inputs) and the Fund’s own market assumptions (unobservable inputs). These inputs are used in determining the value of the Fund’s financial instruments and are summarized in the following fair value hierarchy:
- Level 1 – quoted prices in active markets for identical financial instruments
- Level 2 – other significant observable inputs (including quoted prices for similar financial instruments, interest rates, prepay- ment speed, credit risk, etc.)
- Level 3 – significant unobservable inputs (including the Fund’s own assumptions in determining the fair value of financial instruments)
The input levels are not necessarily an indication of the risk or liquidity associated with financial instruments at that level.
For movements between the levels within the fair value hierarchy, the Fund has adopted a policy of recognizing the transfers as of the date of the underlying event which caused the movement.
A summary of inputs used as of December 31, 2015, in valuing the Fund’s assets and liabilities carried at fair value, is as follows:
| Level 1 | Level 2 | Level 3 | Total | ||||||
| Assets: | |||||||||
| Investments in Securities: | |||||||||
| Equity Investments:a | |||||||||
| Auto Components | $ | — | $ | — | $ | 10,782,830 | $ | 10,782,830 | |
| Communications Equipment | — | — | 47,098,569 | 47,098,569 | |||||
| Energy Equipment & Services | 62,211,348 | — | 548,142 | 62,759,490 | |||||
| Media | 189,836,628 | 933,263 | — | 190,769,891 | |||||
| All Other Equity Investmentsb | 2,668,748,922 | — | —c | 2,668,748,922 | |||||
| Corporate Bonds, Notes and Senior Floating Rate | |||||||||
| Interests | — | 1,386,699,221 | — | 1,386,699,221 | |||||
| Corporate Bonds, Notes and Senior Floating Rate | |||||||||
| Interests in Reorganization | — | 287,138,708 | 16,582 | c | 287,155,290 | ||||
| Companies in Liquidation | 934,914 | 25,857,093 | 2,154,962 | c | 28,946,969 | ||||
| Municipal Bonds | — | 24,443,273 | — | 24,443,273 | |||||
| Short Term Investments | 389,714,861 | 39,499,842 | — | 429,214,703 | |||||
| Total Investments in Securities | $ | 3,311,446,673 | $ | 1,764,571,400 | $ | 60,601,085 | $ | 5,136,619,158 | |
44 Annual Report
franklintempleton.com
FRANKLIN MUTUAL QUEST FUND
NOTES TO FINANCIAL STATEMENTS
| Level 1 | Level 2 | Level 3 | Total | |||||
| Assets: (continued) | ||||||||
| Other Financial Instruments | ||||||||
| Futures Contracts | $ | 3,928,346 | $ | — | $ | — | $ | 3,928,346 |
| Forward Exchange Contracts | — | 22,597,926 | — | 22,597,926 | ||||
| Total Other Financial Instruments | $ | 3,928,346 | $ | 22,597,926 | $ | — | $ | 26,526,272 |
| Liabilities: | ||||||||
| Other Financial Instruments | ||||||||
| Options Written | $ | 2,000 | $ | — | $ | — | $ | 2,000 |
| Securities Sold Short | 1,378,855 | 3,871,280 | — | 5,250,135 | ||||
| Forward Exchange Contracts | — | 7,076,688 | — | 7,076,688 | ||||
| Total Other Financial Instruments | $ | 1,380,855 | $ | 10,947,968 | $ | — | $ | 12,328,823 |
aIncludes common and preferred stocks as well as other equity investments.
bFor detailed categories, see the accompanying Statement of Investments.
cIncludes securities determined to have no value at December 31, 2015.
A reconciliation of assets in which Level 3 inputs are used in determining fair value is presented when there are significant Level 3 financial instruments at the end of the year. At December 31, 2015, the reconciliation of assets, is as follows:
| Net | |||||||||||||||||||||||||||
| Change in | |||||||||||||||||||||||||||
| Unrealized | |||||||||||||||||||||||||||
| Appreciation | |||||||||||||||||||||||||||
| Net | (Depreciation) | ||||||||||||||||||||||||||
| Balance at | Purchases/ | Transfers | Net | Unrealized | Balance | on Assets | |||||||||||||||||||||
| Beginning of | Merger | Transfers Into | Out of | Cost Basis | Realized | Appreciation | at End | Held at | |||||||||||||||||||
| Year | Acquisitions | Sales | Level 3a | Level 3b Adjustmentsc Gain (Loss) | (Depreciation) | of Year | Year End | ||||||||||||||||||||
| Assets: | |||||||||||||||||||||||||||
| Investments in | �� | ||||||||||||||||||||||||||
| Securities: | |||||||||||||||||||||||||||
| Equity | |||||||||||||||||||||||||||
| Investments:d | |||||||||||||||||||||||||||
| Auto | |||||||||||||||||||||||||||
| Components . | $ | 14,353,498 | $ | 974,073 | $ | — | $ | — | $ | — | $ | — $ | — | $ | (4,544,741) $10,782,830 | $ | (4,544,741 | ) | |||||||||
| Communications | |||||||||||||||||||||||||||
| Equipment | 27,846,362 | 188,500 | — | — | — | — | — | 19,063,707 | 47,098,569 | 19,063,707 | |||||||||||||||||
| Energy | |||||||||||||||||||||||||||
| Equipment & | |||||||||||||||||||||||||||
| Services | — | 2,283,925 | — | — | — | — | — | (1,735,783 | ) | 548,142 | (1,735,783 | ) | |||||||||||||||
| Insurance | —e | — | — | — | — | (37,907 | ) | (9,051,918 | ) | 9,089,825 | — | — | |||||||||||||||
| Media | 1,831,500 | — | — | — | — | — | — | (1,831,500 | ) | — | — | ||||||||||||||||
| Real Estate | |||||||||||||||||||||||||||
| Management & | |||||||||||||||||||||||||||
| Development | 69,961,758 | — | (83,120,543 | ) | — | — | — | 83,120,543 | (69,961,758 | ) | — | — | |||||||||||||||
| Corporate Bonds, | |||||||||||||||||||||||||||
| Notes and | |||||||||||||||||||||||||||
| Senior Floating | |||||||||||||||||||||||||||
| Rate | |||||||||||||||||||||||||||
| Interests | 13,241,250 | — | — | — | (14,220,000 | ) | — | — | 978,750 | — | — | ||||||||||||||||
| Corporate Bonds, | |||||||||||||||||||||||||||
| Notes and | |||||||||||||||||||||||||||
| Senior Floating | |||||||||||||||||||||||||||
| Rate Interests in | |||||||||||||||||||||||||||
| Reorganization . | —e | — | — | 94,290 | — | — | — | (77,708 | ) | 16,582 | e | (77,708 | ) | ||||||||||||||
| Companies in | |||||||||||||||||||||||||||
| Liquidation | 1,543,815 | e | 40,664 | — | — | — | — | — | 570,483 | 2,154,962 | e | 570,483 | |||||||||||||||
| Total | |||||||||||||||||||||||||||
| Investments | |||||||||||||||||||||||||||
| in | |||||||||||||||||||||||||||
| Securities . | $ | 128,778,183 | $ | 3,487,162 | $(83,120,543) | $ | 94,290 | $ | (14,220,000 | ) | $ | (37,907) $74,068,625 | $ | (48,448,725) $60,601,085 | $ | 13,275,958 | |||||||||||
| aThe investments were transferred into Level 3 as a result of their value being determined using a significant unobservable input. | |||||||||||||||||||||||||||
| bThe investments were transferred out of Level 3 as a result of the removal of a significant unobservable valuation input. | |||||||||||||||||||||||||||
| cMay include accretion, amortization, partnership adjustments, and/or other cost basis adjustments. | |||||||||||||||||||||||||||
| dIncludes common and preferred stocks as well as other equity investments. | |||||||||||||||||||||||||||
| eIncludes securities determined to have no value. | |||||||||||||||||||||||||||
franklintempleton.com
Annual Report
45
FRANKLIN MUTUAL QUEST FUND
NOTES TO FINANCIAL STATEMENTS
14. Fair Value Measurements (continued)
Significant unobservable valuation inputs developed by the VLOC for material Level 3 financial instruments and impact to fair value as a result of changes in unobservable valuation inputs as of December 31, 2015, are as follows:
| Impact to Fair | |||||||
| Fair Value at | Valuation | Value if Input | |||||
| Description | End of Year | Technique | Unobservable Inputs | Amount | Increasesa | ||
| Assets: | |||||||
| Investments in Securities: | |||||||
| Equity Investments: | |||||||
| Auto Components | $ | 10,756,626 | Market | Discount for lack of marketability | 10 | % | Decreaseb |
| comparables | EV / EBITDA multiple | 3.8 | x | Increasec | |||
| All Other Investmentsd | $ | 49,844,459 | |||||
| Total | $ | 60,601,085 | |||||
aRepresents the directional change in the fair value of the Level 3 financial instruments that would result from a significant and reasonable increase in the corresponding input.
A significant and reasonable decrease in the input would have the opposite effect. Significant impacts, if any, to fair value and/or net assets have been indicated.
bRepresents a significant impact to fair value but not net assets.
cRepresents a significant impact to fair value and net assets.
dIncludes financial instruments with values derived using prior transaction prices or third party pricing information without adjustment for which such inputs are unobservable.
May also include fair value of immaterial financial instruments developed using various valuation techniques and unobservable inputs.
Abbreviations List
EBITDA - Earnings before interest, taxes, depreciation and amortization EV - Enterprise value
15. Subsequent Events
The Fund has evaluated subsequent events through the issuance of the financial statements and determined that no events have occurred that require disclosure other than those already disclosed in the financial statements.
| Abbreviations | |||||
| Counterparty | Currency | Selected Portfolio | |||
| BANT | Bank of America N.A. | EUR | Euro | ADR | American Depositary Receipt |
| BBU | Barclays Bank PLC | GBP | British Pound | FHLB | Federal Home Loan Bank |
| BONY | Bank of New York Mellon | USD | United States Dollar | GO | General Obligation |
| DBFX | Deutsche Bank AG | PIK | Payment-In-Kind | ||
| FBCO | Credit Suisse Group AG | ||||
| HSBC | HSBC Bank USA, N.A. | ||||
| SSBT | State Street Bank and Trust Co., N.A. | ||||
46 Annual Report
franklintempleton.com
FRANKLIN MUTUAL QUEST FUND
Report of Independent Registered Public Accounting Firm
To the Board of Trustees of Franklin Mutual Series Funds and Shareholders of the Franklin Mutual Quest Fund:
We have audited the accompanying statement of assets and liabilities, including the statement of investments, of Franklin Mutual Quest Fund (the “Fund”) (one of the funds constituting the Franklin Mutual Series Funds), as of December 31, 2015, and the related statement of operations for the year then ended, the statements of changes in net assets for each of the two years in the period then ended, and the financial highlights for each of the periods indicated therein. These financial statements and financial highlights are the responsibility of the Fund’s management. Our responsibility is to express an opinion on these financial statements and financial highlights based on our audits.
We conducted our audits in accordance with the standards of the Public Company Accounting Oversight Board (United States). Those standards require that we plan and perform the audit to obtain reasonable assurance about whether the financial statements and financial highlights are free of material misstatement. We were not engaged to perform an audit of the Fund’s internal control over financial reporting. Our audits included consideration of internal control over financial reporting as a basis for designing audit procedures that are appropriate in the circumstances, but not for the purpose of expressing an opinion on the effectiveness of the Fund’s internal control over financial reporting. Accordingly, we express no such opinion. An audit also includes examining, on a test basis, evidence supporting the amounts and disclosures in the financial statements and financial highlights, assessing the accounting principles used and significant estimates made by management, and evaluating the overall financial statement presentation. Our procedures included confirmation of securities owned as of December 31, 2015, by correspondence with the custodian and brokers, or by other appropriate auditing procedures where replies from the brokers were not received. We believe that our audits provide a reasonable basis for our opinion.
In our opinion, the financial statements and financial highlights referred to above present fairly, in all material respects, the financial position of Franklin Mutual Quest Fund (one of the funds constituting Franklin Mutual Series Funds) at December 31, 2015, the results of its operations for the year then ended, the changes in its net assets for each of the two years in the period then ended, and the financial highlights for each of the periods indicated therein, in conformity with U.S. generally accepted accounting principles.

Boston, Massachusetts
February 18, 2016
franklintempleton.com
Annual Report
47
FRANKLIN MUTUAL QUEST FUND
Tax Information (unaudited)
Under Section 852(b)(3)(C) of the Internal Revenue Code (Code), the Fund hereby reports the maximum amount allowable but no less than $42,853,418 as a long term capital gain dividend for the fiscal year ended December 31, 2015.
Under Section 871(k)(2)(C) of the Code, the Fund hereby reports the maximum amount allowable but no less than $10,129,603 as a short term capital gain dividend for purposes of the tax imposed under Section 871(a)(1)(A) of the Code for the fiscal year ended December 31, 2015.
Under Section 854(b)(1)(A) of the Code, the Fund hereby reports 29.82% of the ordinary income dividends as income qualifying for the dividends received deduction for the fiscal year ended December 31, 2015.
Under Section 854(b)(1)(B) of the Code, the Fund hereby reports the maximum amount allowable but no less than $122,592,636 as qualified dividends for purposes of the maximum rate under Section 1(h)(11) of the Code for the fiscal year ended December 31, 2015. Distributions, including qualified dividend income, paid during calendar year 2015 will be reported to shareholders on Form 1099-DIV by mid-February 2016. Shareholders are advised to check with their tax advisors for information on the treatment of these amounts on their individual income tax returns.
Under Section 871(k)(1)(C) of the Code, the Fund hereby reports the maximum amount allowable but no less than $105,868,093 as interest related dividends for purposes of the tax imposed under Section 871(a)(1)(A) of the Code for the fiscal year ended December 31, 2015.
48 Annual Report
franklintempleton.com
FRANKLIN MUTUAL QUEST FUND
| Board Members and Officers | ||||
| The name, year of birth and address of the officers and board members, as well as their affiliations, positions held with the Fund, | ||||
| principal occupations during at least the past five years and number of portfolios overseen in the Franklin Templeton Investments | ||||
| fund complex, are shown below. Generally, each board member serves until that person’s successor is elected and qualified. | ||||
| Independent Board Members | ||||
| Number of Portfolios in | ||||
| Name, Year of Birth | Length of | Fund Complex Overseen | Other Directorships Held | |
| and Address | Position | Time Served | by Board Member* | During at Least the Past 5 Years |
| Edward I. Altman, Ph.D. (1941) | Trustee | Since 1987 | 17 | None |
| c/o Franklin Mutual Advisers, LLC | ||||
| 101 John F. Kennedy Parkway | ||||
| Short Hills, NJ 07078-2789 | ||||
| Principal Occupation During at Least the Past 5 Years: | ||||
| Max L. Heine Professor of Finance, Emeritus and Director of The Credit and Debt Markets Research Program, Salomon Center, Stern School | ||||
| of Business, New York University; editor and author of numerous financial publications; financial consultant; an adviser to numerous financial | ||||
| and publishing organizations; and formerly, Vice Director, Salomon Center, Stern School of Business, New York University. | ||||
| Ann Torre Bates (1958) | Trustee | Since 1995 | 41 | Navient Corporation (loan |
| c/o Franklin Mutual Advisers, LLC | management, servicing and asset | |||
| 101 John F. Kennedy Parkway | recovery) (2014-present), Ares | |||
| Short Hills, NJ 07078-2789 | Capital Corporation (specialty finance | |||
| company) (2010-present), United | ||||
| Natural Foods, Inc. (distributor of | ||||
| natural, organic and specialty foods) | ||||
| (2013-present), Allied Capital | ||||
| Corporation (financial services) | ||||
| (2003-2010) and SLM Corporation | ||||
| (Sallie Mae) (1997-2014). | ||||
| Principal Occupation During at Least the Past 5 Years: | ||||
| Director of various companies; and formerly, Executive Vice President and Chief Financial Officer, NHP Incorporated (manager of multifamily | ||||
| housing) (1995-1997); and Vice President and Treasurer, US Airways, Inc. (until 1995). | ||||
| Burton J. Greenwald (1929) | Trustee | Trustee since | 17 | Franklin Templeton Emerging Markets |
| c/o Franklin Mutual Advisers, LLC | and Vice | 2002 and Vice | Debt Opportunities Fund PLC and | |
| 101 John F. Kennedy Parkway | Chairman | Chairman since | Fiduciary International Ireland Limited | |
| Short Hills, NJ 07078-2789 | of the | April 2015 | (1999-2015). | |
| Board | ||||
| Principal Occupation During at Least the Past 5 Years: | ||||
| Managing Director, B.J. Greenwald Associates (management consultants to the financial services industry); and formerly, Chairman, | ||||
| Fiduciary Trust International Funds; Executive Vice President, L.F. Rothschild Fund Management, Inc.; President and Director, Merit Mutual | ||||
| Funds; President, Underwriting Division and Director, National Securities & Research Corporation; Governor, Investment Company Institute; | ||||
| and Chairman, ICI Public Information Committee. | ||||
| Keith E. Mitchell (1954) | Trustee | Since 2009 | 17 | None |
| c/o Franklin Mutual Advisers, LLC | ||||
| 101 John F. Kennedy Parkway | ||||
| Short Hills, NJ 07078-2789 | ||||
| Principal Occupation During at Least the Past 5 Years: | ||||
| Director of various boards of asset management firms; and formerly, Managing Member, Mitchell, Hartley & Bechtel Advisers, LLC (formerly, | ||||
| Mitchell Advisers, LLC) (advisory firm) (2003-2015) and Managing Director, Putnam Lovell NBF. | ||||
| David W. Niemiec (1949) | Trustee | Since | 41 | Emeritus Corporation (assisted living) |
| One Franklin Parkway | April 2015 | (1999-2010) and OSI Pharmaceuticals, | ||
| San Mateo, CA 94403-1906 | Inc. (pharmaceutical products) | |||
| (2006-2010). | ||||
| Principal Occupation During at Least the Past 5 Years: | ||||
| Advisor, Saratoga Partners (private equity fund); and formerly, Managing Director, Saratoga Partners (1998-2001) and SBC Warburg Dillon | ||||
| Read (investment banking) (1997-1998); Vice Chairman, Dillon, Read & Co. Inc. (investment banking) (1991-1997); and Chief Financial | ||||
| Officer, Dillon, Read & Co. Inc. (1982-1997). | ||||
franklintempleton.com
Annual Report
49
FRANKLIN MUTUAL QUEST FUND
| Independent Board Members (continued) | |||||
| Number of Portfolios in | |||||
| Name, Year of Birth | Length of | Fund Complex Overseen | Other Directorships Held | ||
| and Address | Position | Time Served | by Board Member* | During at Least the Past 5 Years | |
| Charles Rubens II (1930) | Trustee | Since 1998 | 17 | None | |
| c/o Franklin Mutual Advisers, LLC | |||||
| 101 John F. Kennedy Parkway | |||||
| Short Hills, NJ 07078-2789 | |||||
| Principal Occupation During at Least the Past 5 Years: | |||||
| Private investor and president of non-profit organizations; and formerly, an executive of Time, Inc.; and Trustee of Colorado College. | |||||
| Jan Hopkins Trachtman (1947) | Trustee | Since 2009 | 17 | None | |
| c/o Franklin Mutual Advisers, LLC | |||||
| 101 John F. Kennedy Parkway | |||||
| Short Hills, NJ 07078-2789 | |||||
| Principal Occupation During at Least the Past 5 Years: | |||||
| President and Founder, The Jan Hopkins Group (communications consulting firm); serves on Advisory Board of Knight Bagehot Fellowship; | |||||
| and formerly, President, Economic Club of New York (2001-2015); Anchor/Correspondent, CNN Financial News (until 2003); Managing | |||||
| Director and Head of Client Communications, Citigroup Private Bank (until 2005); Off-Air Reporter, ABC News’ World News Tonight; and | |||||
| Editor, CBS Network News. | |||||
| Robert E. Wade (1946) | Trustee | Trustee since | 41 | El Oro Ltd (investments) | |
| c/o Franklin Mutual Advisers, LLC | and | 1993 | and | (2003-present). | |
| 101 John F. Kennedy Parkway | Chairman | Chairman | |||
| Short Hills, NJ 07078-2789 | of the | of the Board | |||
| Board | since 2005 | ||||
| Principal Occupation During at Least the Past 5 Years: | |||||
| Attorney at law engaged in private practice (1972-2008) and member of various boards. | |||||
| Gregory H. Williams (1943) | Trustee | Since | 17 | None | |
| One Franklin Parkway | April 2015 | ||||
| San Mateo, CA 94403-1906 | |||||
| Principal Occupation During at Least the Past 5 Years: | |||||
| Private investor; Consultant; and formerly, President, University of Cincinnati (2009-2012); President, The City College of New York | |||||
| (2001-2009); Dean, College of Law, Ohio State University (1993-2001); and Associate Vice President, Academic Affairs and Professor of Law, | |||||
| University of Iowa (1977-1993). | |||||
| Interested Board Members and Officers | |||||
| Number of Portfolios in | |||||
| Name, Year of Birth | Length of | Fund Complex Overseen | Other Directorships Held | ||
| and Address | Position | Time Served | by Board Member* | During at Least the Past 5 Years | |
| **Gregory E. Johnson (1961) | Trustee | Since 2007 | 164 | None | |
| One Franklin Parkway | |||||
| San Mateo, CA 94403-1906 | |||||
| Principal Occupation During at Least the Past 5 Years: | |||||
| Chairman of the Board, Member – Office of the Chairman, Director and Chief Executive Officer, Franklin Resources, Inc.; officer and/or | |||||
| director or trustee, as the case may be, of some of the other subsidiaries of Franklin Resources, Inc. and of 44 of the investment companies in | |||||
| Franklin Templeton Investments; Vice Chairman, Investment Company Institute; and formerly, President, Franklin Resources, Inc. | |||||
| (1994-2015). | |||||
| **Peter A. Langerman (1955) | Trustee, | Trustee | 7 | American International Group, Inc. | |
| c/o Franklin Mutual Advisers, LLC | President, | since 2007, | (AIG) Credit Facility Trust | ||
| 101 John F. Kennedy Parkway | and Chief | President, and | (2010-2011). | ||
| Short Hills, NJ 07078-2702 | Executive | Chief Executive | |||
| Officer – | Officer – | ||||
| Investment | Investment | ||||
| Management | Management | ||||
| since 2005 | |||||
| Principal Occupation During at Least the Past 5 Years: | |||||
| Chairman of the Board, Chief Executive Officer and President, Franklin Mutual Advisers, LLC; and officer and/or director, as the case may be, | |||||
| of two of the investment companies in Franklin Templeton Investments. | |||||
50 Annual Report
franklintempleton.com
FRANKLIN MUTUAL QUEST FUND
| Interested Board Members and Officers (continued) | ||||
| Number of Portfolios in | ||||
| Name, Year of Birth | Length of | Fund Complex Overseen | Other Directorships Held | |
| and Address | Position | Time Served | by Board Member* | During at Least the Past 5 Years |
| Alison E. Baur (1964) | Vice | Since 2012 | Not Applicable | Not Applicable |
| One Franklin Parkway | President | |||
| San Mateo, CA 94403-1906 | ||||
| Principal Occupation During at Least the Past 5 Years: | ||||
| Deputy General Counsel, Franklin Templeton Investments; and officer of some of the other subsidiaries of Franklin Resources, Inc. and of 44 | ||||
| of the investment companies in Franklin Templeton Investments. | ||||
| Philippe Brugere-Trelat (1949) | Vice | Since 2005 | Not Applicable | Not Applicable |
| 101 John F. Kennedy Parkway | President | |||
| Short Hills NJ 07078-2789 | ||||
| Principal Occupation During at Least the Past 5 Years: | ||||
| Executive Vice President, Franklin Mutual Advisers, LLC; officer of two of the investment companies in Franklin Templeton Investments; and | ||||
| formerly, Portfolio Manager of Eurovest SA (French registered Investment Company, Sicav). | ||||
| Laura F. Fergerson (1962) | Chief | Since 2009 | Not Applicable | Not Applicable |
| One Franklin Parkway | Executive | |||
| San Mateo, CA 94403-1906 | Officer – | |||
| Finance and | ||||
| Administration | ||||
| Principal Occupation During at Least the Past 5 Years: | ||||
| Senior Vice President, Franklin Templeton Services, LLC; Vice President, Franklin Advisers, Inc. and Franklin Templeton Institutional, LLC; | ||||
| and officer of 44 of the investment companies in Franklin Templeton Investments. | ||||
| Aliya S. Gordon (1973) | Vice | Since 2009 | Not Applicable | Not Applicable |
| One Franklin Parkway | President | |||
| San Mateo, CA 94403-1906 | ||||
| Principal Occupation During at Least the Past 5 Years: | ||||
| Senior Associate General Counsel, Franklin Templeton Investments; and officer of 44 of the investment companies in Franklin Templeton | ||||
| Investments. | ||||
| Steven J. Gray (1955) | Secretary | Secretary | Not Applicable | Not Applicable |
| One Franklin Parkway | and Vice | since 2005 and | ||
| San Mateo, CA 94403-1906 | President | Vice President | ||
| since 2009 | ||||
| Principal Occupation During at Least the Past 5 Years: | ||||
| Senior Associate General Counsel, Franklin Templeton Investments; Vice President, Franklin Templeton Distributors, Inc. and Franklin | ||||
| Alternative Strategies Advisers, LLC; and officer of 44 of the investment companies in Franklin Templeton Investments. | ||||
| Selena L. Holmes (1965) | Vice | Since 2012 | Not Applicable | Not Applicable |
| 100 Fountain Parkway | President – | |||
| St. Petersburg, FL 33716-1205 | AML | |||
| Compliance | ||||
| Principal Occupation During at Least the Past 5 Years: | ||||
| Director, Global Compliance Monitoring; Chief Compliance Officer, Franklin Alternative Strategies Advisers, LLC; Vice President, Franklin | ||||
| Templeton Companies, LLC; and officer of 44 of the investment companies in Franklin Templeton Investments. | ||||
franklintempleton.com
Annual Report
51
FRANKLIN MUTUAL QUEST FUND
| Interested Board Members and Officers (continued) | ||||
| Number of Portfolios in | ||||
| Name, Year of Birth | Length of | Fund Complex Overseen | Other Directorships Held | |
| and Address | Position | Time Served | by Board Member* | During at Least the Past 5 Years |
| Robert G. Kubilis (1973) | Treasurer, | Since 2012 | Not Applicable | Not Applicable |
| 300 S.E. 2nd Street | Chief | |||
| Fort Lauderdale, FL 33301-1923 | Financial | |||
| Officer | ||||
| and Chief | ||||
| Accounting | ||||
| Officer | ||||
| Principal Occupation During at Least the Past 5 Years: | ||||
| Treasurer, U.S. Fund Administration & Reporting, Franklin Templeton Investments; and officer of four of the investment companies in Franklin | ||||
| Templeton Investments. | ||||
| Kimberly H. Novotny (1972) | Vice | Since 2013 | Not Applicable | Not Applicable |
| 300 S.E. 2nd Street | President | |||
| Fort Lauderdale, FL 33301-1923 | ||||
| Principal Occupation During at Least the Past 5 Years: | ||||
| Associate General Counsel, Franklin Templeton Investments; Vice President, Fiduciary Trust International of the South and Templeton | ||||
| Investment Counsel, LLC; Assistant Secretary, Franklin Resources, Inc.; and officer of 44 of the investment companies in Franklin Templeton | ||||
| Investments. | ||||
| Robert C. Rosselot (1960) | Chief | Since 2013 | Not Applicable | Not Applicable |
| 300 S.E. 2nd Street | Compliance | |||
| Fort Lauderdale, FL 33301-1923 | Officer | |||
| Principal Occupation During at Least the Past 5 Years: | ||||
| Director, Global Compliance, Franklin Templeton Investments; Vice President, Franklin Templeton Companies, LLC; officer of 44 of the | ||||
| investment companies in Franklin Templeton Investments; and formerly, Senior Associate General Counsel, Franklin Templeton Investments | ||||
| (2007-2013); and Secretary and Vice President, Templeton Group of Funds (2004-2013). | ||||
| Karen L. Skidmore (1952) | Vice | Since 2009 | Not Applicable | Not Applicable |
| One Franklin Parkway | President | |||
| San Mateo, CA 94403-1906 | ||||
| Principal Occupation During at Least the Past 5 Years: | ||||
| Senior Associate General Counsel, Franklin Templeton Investments; and officer of 44 of the investment companies in Franklin Templeton | ||||
| Investments. | ||||
| Navid Tofigh (1972) | Vice | Since | Not Applicable | Not Applicable |
| One Franklin Parkway | President | November 2015 | ||
| San Mateo, CA 94403-1906 | ||||
| Principal Occupation During at Least the Past 5 Years: | ||||
| Associate General Counsel, Franklin Templeton Investments; and officer of 44 of the investment companies in Franklin Templeton | ||||
| Investments. | ||||
| Craig S. Tyle (1960) | Vice | Since 2005 | Not Applicable | Not Applicable |
| One Franklin Parkway | President | |||
| San Mateo, CA 94403-1906 | ||||
| Principal Occupation During at Least the Past 5 Years: | ||||
| General Counsel and Executive Vice President, Franklin Resources, Inc.; and officer of some of the other subsidiaries of Franklin Resources, | ||||
| Inc. and of 44 of the investment companies in Franklin Templeton Investments. | ||||
52 Annual Report
franklintempleton.com
FRANKLIN MUTUAL QUEST FUND
| Interested Board Members and Officers (continued) | ||||
| Number of Portfolios in | ||||
| Name, Year of Birth | Length of | Fund Complex Overseen | Other Directorships Held | |
| and Address | Position | Time Served | by Board Member* | During at Least the Past 5 Years |
| Lori A. Weber (1964) | Vice | Since 2011 | Not Applicable | Not Applicable |
| 300 S.E. 2nd Street | President | |||
| Fort Lauderdale, FL 33301-1923 | ||||
Principal Occupation During at Least the Past 5 Years:
Senior Associate General Counsel, Franklin Templeton Investments; Assistant Secretary, Franklin Resources, Inc.; Vice President and
Secretary, Templeton Investment Counsel, LLC; and officer of 44 of the investment companies in Franklin Templeton Investments.
*We base the number of portfolios on each separate series of the U.S. registered investment companies within the Franklin Templeton Investments fund complex.
These portfolios have a common investment manager or affiliated investment managers.
**Gregory E. Johnson is considered to be an interested person of the Fund under the federal securities laws due to his position as an officer and director of Franklin
Resources, Inc., which is the parent company of the Fund’s investment manager and distributor. Peter A. Langerman is considered to be an interested person of the
Fund under the federal securities laws due to his position as an officer of Franklin Mutual Advisers, LLC, which is an affiliate of the Fund’s investment manager.
Note 1: Officer information is current as of the date of this report. It is possible that after this date, information about officers may change.
The Fund’s Board has determined that certain of the members of the Audit Committee, including Ann Torre Bates, are audit committee financial experts, and
“independent,” under those provisions of the Sarbanes-Oxley Act of 2002, and the rules and form amendments adopted by the Securities and Exchange
Commission, relating to audit committee financial experts.
The Statement of Additional Information (SAI) includes additional information about the board members and is available, without charge, upon request.
Shareholders may call (800) DIAL BEN/342-5236 to request the SAI.
franklintempleton.com
Annual Report
53
FRANKLIN MUTUAL QUEST FUND
Shareholder Information
Proxy Voting Policies and Procedures
The Fund’s investment manager has established Proxy Voting Policies and Procedures (Policies) that the Fund uses to determine how to vote proxies relating to portfolio securities. Shareholders may view the Fund’s complete Policies online at franklintempleton.com. Alternatively, shareholders may request copies of the Policies free of charge by calling the Proxy Group collect at (954) 527-7678 or by sending a written request to: Franklin Templeton Companies, LLC, 300 S.E. 2nd Street, Fort Lauderdale, FL 33301, Attention: Proxy Group. Copies of the Fund’s proxy voting records are also made available online at franklintempleton.com and posted on the U.S. Securities and Exchange Commission’s website at sec.gov and reflect the most recent 12-month period ended June 30.
Quarterly Statement of Investments
The Fund files a complete statement of investments with the U.S. Securities and Exchange Commission for the first and third quarters for each fiscal year on Form N-Q. Shareholders may view the filed Form N-Q by visiting the Commission’s website at sec.gov. The filed form may also be viewed and copied at the Commission’s Public Reference Room in Washington, DC. Information regarding the operations of the Public Reference Room may be obtained by calling (800) SEC-0330.
Householding of Reports and Prospectuses
You will receive the Fund’s financial reports every six months as well as an annual updated summary prospectus (prospectus available upon request). To reduce Fund expenses, we try to identify related shareholders in a household and send only one copy of the financial reports and summary prospectus. This process, called “householding,” will continue indefinitely unless you instruct us otherwise. If you prefer not to have these documents householded, please call us at (800) 632-2301. At any time you may view current prospectuses/summary prospectuses and financial reports on our website. If you choose, you may receive these documents through electronic delivery.
54 Annual Report
franklintempleton.com
This page intentionally left blank
This page intentionally left blank

| Contents | |
| Annual Report | |
| Franklin Mutual Shares Fund | 3 |
| Performance Summary | 8 |
| Your Fund’s Expenses | 13 |
| Financial Highlights and Statement of Investments | 15 |
| Financial Statements | 28 |
| Notes to Financial Statements | 32 |
| Report of Independent Registered | |
| Public Accounting Firm | 45 |
| Tax Information | 46 |
| Board Members and Officers | 47 |
| Shareholder Information | 52 |
Visit franklintempleton.com for fund updates, to access your account, or to find helpful financial planning tools.
2 Annual Report
franklintempleton.com
Annual Report
Franklin Mutual Shares Fund
This annual report for Franklin Mutual Shares Fund covers the fiscal year ended December 31, 2015.
Your Fund’s Goals and Main Investments
The Fund seeks capital appreciation, with income as a secondary goal, by investing primarily in equity securities of companies that we believe are at prices below their intrinsic value. The Fund may invest up to 35% of its assets in foreign securities.
Performance Overview
The Fund’s Class Z shares had a -3.81% cumulative total return for the 12 months ended December 31, 2015. In comparison, the Fund’s benchmark, the Standard & Poor’s 500 Index (S&P 500®), which is a broad measure of U.S. stock performance, posted a +1.38% total return.1 You can find more of the Fund’s performance data in the Performance Summary beginning on page 8.
Performance data represent past performance, which does not guarantee future results. Investment return and principal value will fluctuate, and you may have a gain or loss when you sell your shares. Current performance may differ from figures shown. For most recent month-end performance, go to franklintempleton.com or call (800) 342-5236.
Economic and Market Overview
U.S. economic growth slowed in 2015’s first quarter but strengthened in 2015’s second quarter amid healthy consumer spending. The third and fourth quarters were less robust as exports slowed and state and local governments reduced their spending. At its December meeting, the U.S. Federal Reserve (Fed) increased its target range for the federal funds rate to 0.25%–0.50%, as policymakers cited the labor market’s considerable improvement and were reasonably confident that inflation would move back to the Fed’s 2% medium-term objective. Furthermore, the Fed raised its forecast for 2016 U.S. economic growth and lowered its unemployment projection. Despite periods of volatility, the broad U.S. stock market, as measured by the S&P 500, generated a modest positive total return for 2015.
The global economy expanded moderately during the 12 months under review. As measured by the MSCI World Index, stocks in global developed markets overall were down slightly for the year despite some positive developments. Weighing on global stocks at times were worries about China’s slowing economy and tumbling stock market, declining commodity prices, geopolitical tensions between Russia and Turkey, and ongoing uncertainty over the Fed’s timing for raising interest rates. Toward period-end, equity markets recovered somewhat as the Fed increased its federal funds target range, alleviating some uncertainty about a change in the U.S. monetary policy. During the year, oil prices declined sharply largely due to increased global supply that exceeded demand. Gold and other commodity prices also fell. The U.S. dollar appreciated against most currencies during the period, which reduced returns of many foreign assets in U.S. dollar terms.
Geographic Breakdown*
Based on Total Net Assets as of 12/31/15
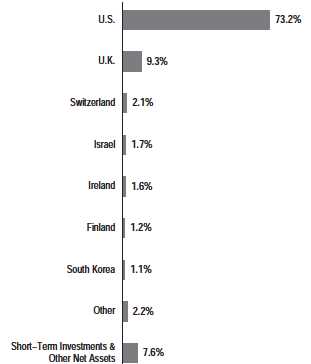
*Figures are stated as a percentage of total and may not equal 100% or may be negative due to rounding, use of any derivatives, unsettled trades or other factors.
1. Source: Morningstar.
The index is unmanaged and includes reinvestment of any income or distributions. One cannot invest directly in an index, and an index is not representative of the Fund’s
portfolio.
The dollar value, number of shares or principal amount, and names of all portfolio holdings are listed in the Fund’s Statement of Investments (SOI).
The SOI begins on page 20.
franklintempleton.com
Annual Report
3
FRANKLIN MUTUAL SHARES FUND
In Europe, U.K. economic growth gained momentum from the services sector, but the economy slowed in 2015 compared with 2014. The eurozone grew moderately and generally benefited during the year from lower oil prices, a weaker euro that supported exports, the European Central Bank’s (ECB’s) accommodative policy and expectations of further ECB stimulus. Although the eurozone’s annual inflation rate declined early in the period, it rose slightly during the rest of the period. The ECB maintained its benchmark interest rates although it reduced its bank deposit rate in December, seeking to boost the region’s slowing growth.
Investment Strategy
At Franklin Mutual Series, we are committed to our distinctive value approach to investing, which we believe can generate above-average risk-adjusted returns over time for our shareholders. Our major investment strategy is investing in undervalued stocks. When selecting undervalued equities, we are attracted to what we believe are fundamentally strong companies with healthy balance sheets, high-quality assets, substantial free cash flow and shareholder-oriented management teams and whose stocks are trading at discounts to our assessment of the companies’ intrinsic or business value. We also look for asset-rich companies whose shares may be trading at depressed levels due to concerns over short-term earnings disappointments, litigation, management strategy or other perceived negatives. This strict value approach is not only intended to improve the likelihood of upside potential, but it is also intended to reduce the risk of substantial declines. While the vast majority of our undervalued equity investments are made in publicly traded companies globally, we may invest occasionally in privately held companies as well.
We complement this more traditional investment strategy with two others. One is distressed investing, a highly specialized field that has proven quite profitable during certain periods over the years. Distressed investing is complex and can take many forms. The most common distressed investment the Fund undertakes is the purchase of financially troubled or bankrupt companies’ debt at a substantial discount to face value. After the financially distressed company is reorganized, often in bankruptcy court, the old debt is typically replaced with new securities issued by the financially stronger company.
The other piece of our investment strategy is participating in arbitrage situations, another highly specialized field. When companies announce proposed mergers or takeovers, commonly referred to as “deals,” the target company may trade at a discount to the bid it ultimately accepts. One form of arbitrage involves purchasing the target company’s stock when it is
trading below the value we believe it would receive in a deal. In keeping with our commitment to a relatively conservative investment approach, we typically focus our arbitrage efforts on announced deals, and eschew rumored deals or other situations we consider relatively risky.
In addition, it is our practice to hedge the Fund’s currency exposure when we deem it advantageous for our shareholders.
| Top 10 Sectors/Industries | ||
| Based on Equity Securities as of 12/31/15 | ||
| % of Total | ||
| Net Assets | ||
| Insurance | 12.1 | % |
| Banks | 10.7 | % |
| Pharmaceuticals | 8.1 | % |
| Media | 6.5 | % |
| Software | 6.1 | % |
| Tobacco | 6.1 | % |
| Oil, Gas & Consumable Fuels | 5.4 | % |
| Health Care Equipment & Supplies | 4.5 | % |
| Food & Staples Retailing | 3.4 | % |
| Technology Hardware, Storage & Peripherals | 3.1 | % |
What is meant by “hedge”?
To hedge an investment is to take a position intended to offset potential losses/gains that may be incurred by a companion financial instrument.
Manager’s Discussion
During the 12 months under review, stocks in most global markets declined after a three-year ascent. Globally, several major central banks became more accommodative while fiscal authorities focused on budgetary discipline. Large companies also remained disciplined about operating costs, with margins at historically high levels in many industries and countries. To drive further growth, an increasing number of companies took advantage of low interest rates to finance deals. In this environment, we saw a number of opportunities.
Equity prices are typically forward looking, reflecting investors’ beliefs about how various factors and events will play out in the future. Global equity prices at period-end were down from mid-2015 highs, reflecting increased uncertainty among global investors regarding China and other emerging markets, global commodity prices, U.S. monetary policy divergence and geopolitical events. However, with the support of global quantitative easing, many corporations have been able to build strong balance sheets, focus intensely on improving efficiency,
4 Annual Report
franklintempleton.com
FRANKLIN MUTUAL SHARES FUND
maintain historically high margins and return a significant amount of capital to shareholders.
Merger and acquisition (M&A) activity accelerated in the past 12 months, helping to support valuations. Deal volumes reached historical highs and regulators globally increased their scrutiny of potential negative effects of high concentration. Such an environment — active M&A combined with regulatory uncertainty, greater complexity and market volatility — may provide attractive investment opportunities. We seek to use a mixture of merger arbitrage positions and investments in one or both of the companies to participate in these opportunities. The traditional merger arbitrage positions are constructed solely to benefit from deal completion, while unhedged investments in one or both companies can allow the Fund to benefit from possible value creation once the deal is completed.
Distressed debt remained a difficult market in which we could find compelling new opportunities. Low interest rates have kept credit widely available, and we felt bankruptcies were limited, except in the energy and mining sectors. Increased stress in high yield markets, particularly in energy credit, has expanded the potential opportunity set for us. For non-energy firms, costs of issuing debt are climbing and these debt securities are starting to look attractive to us. Within energy, declining commodity prices increased financial pressures for a growing number of issuers. At year-end, a record level of crude oil inventories and insistence by Saudi Arabia that it will not reduce production provide little reason to expect a quick recovery in crude oil prices, implying to us an increased likelihood of new investment opportunities in energy sector debt.
Turning to Fund performance, top contributors included multinational software company Microsoft and pharmaceutical companies Hospira2 and Eli Lilly & Co.
Shares of Microsoft rose as earnings improved and the company’s cloud computing services gained momentum. In April and October, Microsoft’s quarterly earnings exceeded consensus estimates despite a challenging environment for personal computer sales. Revenue outperformance and cost controls helped drive the solid results, highlighted by the strong performance of Microsoft’s cloud computing operations, which include Azure and Office365. We believe Microsoft’s cloud computing business has the potential to grow and become increasingly profitable as technology users become more comfortable relying on cloud infrastructure and applications. Supporting this belief were the company’s assertions that the growth in Office365 subscriptions began to fully offset the decline in transactional, one-time license purchases. October’s quarterly results also showed strength in the adoption of Microsoft’s new Windows 10 operating system.
Hospira is a global pharmaceutical and medical device company specializing in injectable generic drugs and biosimilars — drugs highly similar to medications licensed by other firms. Shares rose sharply in early February following the announcement that Pfizer had reached an agreement to acquire Hospira. We believed the deal, which closed in early September, made sense as Hospira offered Pfizer a strong leadership position in injectables and an attractive high-growth generics market, and the deal positioned Pfizer as a top-tier biosimilars company with a strong pipeline. This acquisition news was in line with our views on industry consolidation and more specifically on Hospira as a highly attractive asset in the generics industry.
U.S.-based Eli Lilly & Co. performed well in 2015 as the market, in our view, gained more appreciation for the company’s strong research and development capabilities and deep pipeline. Driving the increased appreciation was Eli Lilly’s substantial progress during the year on several new product approvals including an oncology compound, regulatory submissions including for a psoriasis treatment and positive late-stage data disclosures including a drug for rheumatoid arthritis. Also, in September, Eli Lilly and drug maker Boehringer Ingelheim (a private company) announced that their jointly owned diabetes drug significantly reduced cardiovascular risk. Eli Lilly’s 2015 operating performance was also strong as the company raised its earnings guidance in July and reported solid sales performance and profit margin progress in October. We believe Eli Lilly has many attractive assets targeting end markets with high unmet medical needs that, in our assessment, position its business to generate strong long-term revenues and free cash flows.
During the period under review, some of the Fund’s investments that negatively affected performance were utility Texas Competitive Electric Holdings (TCEH), oil and gas exploration and production company Marathon Oil and natural resources company Freeport-McMoRan.
The value of our TCEH debt holdings declined in 2015 due to lower natural gas and coal prices that reduced the market rates for its electricity sales. Notably, in early December, natural gas retreated to its lowest price in over a decade. TCEH is a unit of Energy Future Holdings, the largest power company in Texas, which filed for bankruptcy in 2014 after defaulting on debt associated with a $45 billion leveraged buyout of the company in 2007, just as energy prices began to decline. The company
2. Not held at period-end.
See www.franklintempletondatasources.com for additional data provider information.
franklintempleton.com
Annual Report 5
FRANKLIN MUTUAL SHARES FUND
intends to emerge from bankruptcy in 2016 with less leverage on its balance sheet.
Marathon Oil’s stock price closely followed the decline in crude oil. In October, Marathon Oil announced a dividend cut, a move that preserves capital and puts the company’s capital allocation policies more in line with its exploration and production peer group, in our analysis. We believed this move could allow for a smaller reduction in capital spending and a corresponding improvement in its production profile, which we welcomed given the returns available from the company’s resource base. The company also announced a significant reduction in its deepwater exploration program, an action we viewed favorably given the program’s lackluster returns in recent years. We continued to believe that Marathon Oil’s relatively low-cost assets would enable it to weather the current downturn with the potential to generate strong returns if the environment improves.
Shares of Freeport-McMoRan were primarily affected by steeply falling commodity prices in 2015, such as for copper, crude oil and natural gas. Investor uncertainty regarding the company’s negotiations with Indonesia’s government also hurt the stock price. The two sides agreed to a six-month export permit extension in late July, but other important matters remained outstanding at year-end, including every-other-year negotiations of a labor contract and the long-term operating rights and investment plans of the company’s Indonesia unit. The company took steps to strengthen its financial position, including a significant cut in its 2016–2017 capital investment budget, the suspension of its dividend and an agreement with creditors to ease covenants on a $4 billion term loan, announced in December.
During the year, the Fund held currency forwards and futures to somewhat hedge the currency risk of the portfolio’s non-U.S. dollar investments. The currency forwards had a positive impact on the Fund’s performance, and currency futures had a negligible impact.
What is a currency forward contract?
A currency forward contract, or a currency forward, is an agreement between the Fund and a counterparty to buy or sell a foreign currency at a specific exchange rate on a future date.
What is a futures contract?
A futures contract, or a future, is an agreement between the Fund and a counterparty made through a U.S. or foreign futures exchange to buy or sell an underlying instrument or asset at a specific price on a future date.
| Top 10 Equity Holdings | ||
| 12/31/15 | ||
| Company | % of Total | |
| Sector/Industry, Country | Net Assets | |
| Microsoft Corp. | 3.6 | % |
| Software, U.S. | ||
| White Mountains Insurance Group Ltd. | 3.2 | % |
| Insurance, U.S. | ||
| Medtronic PLC | 3.2 | % |
| Health Care Equipment & Supplies, U.S. | ||
| Merck & Co. Inc. | 2.8 | % |
| Pharmaceuticals, U.S. | ||
| Time Warner Cable Inc. | 2.2 | % |
| Media, U.S. | ||
| PNC Financial Services Group Inc. | 2.2 | % |
| Banks, U.S. | ||
| Eli Lilly & Co. | 2.2 | % |
| Pharmaceuticals, U.S. | ||
| American International Group Inc. | 2.1 | % |
| Insurance, U.S. | ||
| British American Tobacco PLC | 1.8 | % |
| Tobacco, U.K. | ||
| ACE Ltd. | 1.7 | % |
| Insurance, U.S. |
As fellow shareholders, we found recent relative and absolute performance disappointing, but it is not uncommon for our strategy to lag the equity markets at times. We remain committed to our disciplined, value investment approach as we seek to generate attractive, long-term, risk-adjusted returns for shareholders.
6 Annual Report
franklintempleton.com
FRANKLIN MUTUAL SHARES FUND
Thank you for your continued participation in Franklin Mutual Shares Fund. We look forward to continuing to serve your investment needs.

Peter Langerman has been portfolio manager for Franklin Mutual Shares Fund since 2005. He has been portfolio manager of Franklin Mutual Global Discovery Fund since 2009. He joined Franklin Templeton Investments in 1996, serving in various capacities, including President and Chief Executive Officer of Franklin Mutual Advisers and member of the management team of the Funds, including Franklin Mutual Shares Fund. From 2002 to 2005, he served as director of New Jersey’s Division of Investment, overseeing employee pension funds. Between 1986 and 1996, Mr. Langerman was employed at Heine Securities Corporation, the Fund’s former manager.
F. David Segal has been portfolio manager for Franklin Mutual Shares Fund since 2005. He joined Franklin Templeton Investments in 2002. Previously, he was an analyst in the Structured Finance Group of MetLife from 1999 to 2002.
Debbie Turner has been assistant portfolio manager for Franklin Mutual Shares Fund since 2001. She joined Franklin Templeton Investments in 1996. Between 1993 and 1996, Ms. Turner was employed at Heine Securities Corporation, the Fund’s former manager.
The foregoing information reflects our analysis, opinions and portfolio holdings as of December 31, 2015, the end of the reporting period. The way we implement our main investment strategies and the resulting portfolio holdings may change depending on factors such as market and economic conditions. These opinions may not be relied upon as investment advice or an offer for a particular security. The information is not a complete analysis of every aspect of any market, country, industry, security or the Fund. Statements of fact are from sources considered reliable, but the investment manager makes no representation or warranty as to their completeness or accuracy. Although historical performance is no guarantee of future results, these insights may help you understand our investment management philosophy.
CFA® is a trademark owned by CFA Institute.
franklintempleton.com
Annual Report 7
FRANKLIN MUTUAL SHARES FUND
Performance Summary as of December 31, 2015
Your dividend income will vary depending on dividends or interest paid by securities in the Fund’s portfolio, adjusted for operating expenses of each class. Capital gain distributions are net profits realized from the sale of portfolio securities. The performance table and graphs do not reflect any taxes that a shareholder would pay on Fund dividends, capital gain distributions, if any, or any realized gains on the sale of Fund shares. Total return reflects reinvestment of the Fund’s dividends and capital gain distributions, if any, and any unrealized gains or losses.
| Net Asset Value | ||||||||
| Share Class (Symbol) | 12/31/15 | 12/31/14 | Change | |||||
| Z (MUTHX) | $ | 26.00 | $ | 29.52 | -$ | 3.52 | ||
| A (TESIX) | $ | 25.78 | $ | 29.29 | -$ | 3.51 | ||
| C (TEMTX) | $ | 25.54 | $ | 29.02 | -$ | 3.48 | ||
| R (TESRX) | $ | 25.66 | $ | 29.14 | -$ | 3.48 | ||
| R6 (FMSHX) | $ | 25.98 | $ | 29.51 | -$ | 3.53 | ||
| Distributions1 (1/1/15–12/31/15) | ||||||||
| Dividend | Short-Term | Long-Term | ||||||
| Share Class | Income | Capital Gain | Capital Gain | Total | ||||
| Z | $ | 0.5917 | $ | 0.0917 | $ | 1.6688 | $ | 2.3522 |
| A | $ | 0.5069 | $ | 0.0917 | $ | 1.6688 | $ | 2.2674 |
| C | $ | 0.2926 | $ | 0.0917 | $ | 1.6688 | $ | 2.0531 |
| R | $ | 0.4294 | $ | 0.0917 | $ | 1.6688 | $ | 2.1899 |
| R6 | $ | 0.6284 | $ | 0.0917 | $ | 1.6688 | $ | 2.3889 |
See page 12 for Performance Summary footnotes.
8 Annual Report
franklintempleton.com
FRANKLIN MUTUAL SHARES FUND
PERFORMANCE SUMMARY
Performance as of 12/31/152
Cumulative total return excludes sales charges. Average annual total return and value of $10,000 investment include maximum sales charges. Class Z/R/R6: no sales charges; Class A: 5.75% maximum initial sales charge; Class C: 1% contingent deferred sales charge in first year only.
| Cumulative | Average Annual | Value of $10,000 | Total Annual | |||||
| Share Class | Total Return3 | Total Return4 | Investment5 | Operating Expenses6 | ||||
| Z | 0.80 | % | ||||||
| 1-Year | -3.81 | % | -3.81 | % | $ | 9,619 | ||
| 5-Year | +50.37 | % | +8.50 | % | $ | 15,037 | ||
| 10-Year | +63.53 | % | +5.04 | % | $ | 16,353 | ||
| A | 1.10 | % | ||||||
| 1-Year | -4.10 | % | -9.62 | % | $ | 9,038 | ||
| 5-Year | +48.14 | % | +6.90 | % | $ | 13,962 | ||
| 10-Year | +58.65 | % | +4.11 | % | $ | 14,955 | ||
| C | 1.80 | % | ||||||
| 1-Year | -4.79 | % | -5.67 | % | $ | 9,433 | ||
| 5-Year | +43.06 | % | +7.42 | % | $ | 14,306 | ||
| 10-Year | +48.01 | % | +4.00 | % | $ | 14,801 | ||
| R | 1.30 | % | ||||||
| 1-Year | -4.32 | % | -4.32 | % | $ | 9,568 | ||
| 5-Year | +46.68 | % | +7.96 | % | $ | 14,668 | ||
| 10-Year | +55.51 | % | +4.51 | % | $ | 15,551 | ||
| R6 | 0.69 | % | ||||||
| 1-Year | -3.71 | % | -3.71 | % | $ | 9,629 | ||
| Since Inception (5/1/13) | +20.00 | % | +7.07 | % | $ | 12,000 |
Performance data represent past performance, which does not guarantee future results. Investment return and principal value
will fluctuate, and you may have a gain or loss when you sell your shares. Current performance may differ from figures shown.
For most recent month-end performance, go to franklintempleton.com or call (800) 342-5236.
See page 12 for Performance Summary footnotes.
franklintempleton.com
Annual Report 9
FRANKLIN MUTUAL SHARES FUND
PERFORMANCE SUMMARY
Total Return Index Comparison for a Hypothetical $10,000 Investment2
Total return represents the change in value of an investment over the periods shown. It includes any applicable maximum sales charge, Fund expenses, account fees and reinvested distributions. The unmanaged index includes reinvestment of any income or distributions. It differs from the Fund in composition and does not pay management fees or expenses. One cannot invest directly in an index.
See page 12 for Performance Summary footnotes.
10 Annual Report
franklintempleton.com

See page 12 for Performance Summary footnotes.
franklintempleton.com
Annual Report
11
FRANKLIN MUTUAL SHARES FUND
PERFORMANCE SUMMARY
Total Return Index Comparison for a Hypothetical $10,000 Investment2 (continued)
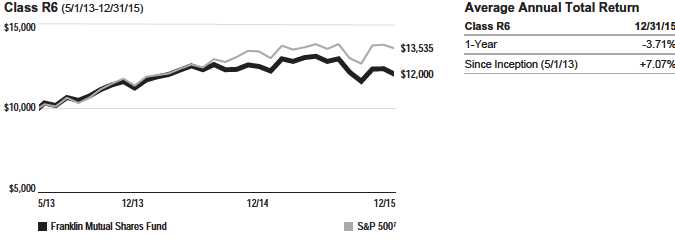
All investments involve risks, including possible loss of principal. Value securities may not increase in price as anticipated or may decline further in value.
The Fund’s investments in foreign securities involve special risks including currency fluctuations, and economic and political uncertainties. The Fund may also invest in companies engaged in mergers, reorganizations or liquidations, which involve special risks as pending deals may not be completed on time or on favorable terms, as well as lower rated bonds, which entail higher credit risk. The Fund is actively managed but there is no guarantee that the manager’s investiment decisions will produce the desired results. The Fund’s prospectus also includes a description of the main investment risks.
Class Z: Class C: Class R: Class R6: | Shares are available to certain eligible investors as described in the prospectus. These shares have higher annual fees and expenses than Class A shares. Shares are available to certain eligible investors as described in the prospectus. These shares have higher annual fees and expenses than Class A shares. Shares are available to certain eligible investors as described in the prospectus. |
1. The distribution amount is the sum of the dividend payments to shareholders for the period shown and includes only estimated tax-basis net investment income and capital gain.
2. The Fund has a fee waiver associated with any investment in a Franklin Templeton money fund, contractually guaranteed through at least its current fiscal year-end. Fund investment results reflect the fee waiver, to the extent applicable; without this reduction, the results would have been lower.
3. Cumulative total return represents the change in value of an investment over the periods indicated.
4. Average annual total return represents the average annual change in value of an investment over the periods indicated. Return for less than one year, if any, has not been annualized.
5. These figures represent the value of a hypothetical $10,000 investment in the Fund over the periods indicated.
6. Figures are as stated in the Fund’s current prospectus. In periods of market volatility, assets may decline significantly, causing total annual Fund operating expenses to become higher than the figures shown.
7. Source: Morningstar. The S&P 500 is a market capitalization-weighted index of 500 stocks designed to measure total U.S. equity market performance.
See www.franklintempletondatasources.com for additional data provider information.
12 Annual Report
franklintempleton.com
FRANKLIN MUTUAL SHARES FUND
Your Fund’s Expenses
As a Fund shareholder, you can incur two types of costs:
- Transaction costs, including sales charges (loads) on Fund purchases; and
- Ongoing Fund costs, including management fees, distribu- tion and service (12b-1) fees, and other Fund expenses. All mutual funds have ongoing costs, sometimes referred to as operating expenses.
The following table shows ongoing costs of investing in the Fund and can help you understand these costs and compare them with those of other mutual funds. The table assumes a $1,000 investment held for the six months indicated.
Actual Fund Expenses
The first line (Actual) for each share class listed in the table provides actual account values and expenses. The “Ending Account Value” is derived from the Fund’s actual return, which includes the effect of Fund expenses.
You can estimate the expenses you paid during the period by following these steps. Of course, your account value and expenses will differ from those in this illustration:
1. Divide your account value by $1,000.
If an account had an $8,600 value, then $8,600 ÷ $1,000 = 8.6.
2. Multiply the result by the number under the heading “Expenses Paid During Period.”
If Expenses Paid During Period were $7.50, then 8.6 × $7.50 = $64.50.
In this illustration, the estimated expenses paid this period are $64.50.
Hypothetical Example for Comparison with Other Funds
Information in the second line (Hypothetical) for each class in the table can help you compare ongoing costs of investing in the Fund with those of other mutual funds. This information may not be used to estimate the actual ending account balance or expenses you paid during the period. The hypothetical “Ending Account Value” is based on the actual expense ratio for each class and an assumed 5% annual rate of return before expenses, which does not represent the Fund’s actual return. The figure under the heading “Expenses Paid During Period” shows the hypothetical expenses your account would have incurred under this scenario. You can compare this figure with the 5% hypothetical examples that appear in shareholder reports of other funds.
Please note that expenses shown in the table are meant to highlight ongoing costs and do not reflect any transaction costs, such as sales charges. Therefore, the second line for each class is useful in comparing ongoing costs only, and will not help you compare total costs of owning different funds. In addition, if transaction costs were included, your total costs would have been higher. Please refer to the Fund prospectus for additional information on operating expenses.
franklintempleton.com
Annual Report
13
| FRANKLIN MUTUAL SHARES FUND |
| YOUR FUND’S EXPENSES |
| Beginning Account | Ending Account | Expenses Paid During | ||||
| Share Class | Value 7/1/15 | Value 12/31/15 | Period* 7/1/15–12/31/15 | |||
| Z | ||||||
| Actual | $ | 1,000 | $ | 939.70 | $ | 3.91 |
| Hypothetical (5% return before expenses) | $ | 1,000 | $ | 1,021.17 | $ | 4.08 |
| A | ||||||
| Actual | $ | 1,000 | $ | 938.20 | $ | 5.18 |
| Hypothetical (5% return before expenses) | $ | 1,000 | $ | 1,019.86 | $ | 5.40 |
| C | ||||||
| Actual | $ | 1,000 | $ | 934.70 | $ | 8.78 |
| Hypothetical (5% return before expenses) | $ | 1,000 | $ | 1,016.13 | $ | 9.15 |
| R | ||||||
| Actual | $ | 1,000 | $ | 937.20 | $ | 6.35 |
| Hypothetical (5% return before expenses) | $ | 1,000 | $ | 1,018.65 | $ | 6.61 |
| R6 | ||||||
| Actual | $ | 1,000 | $ | 939.90 | $ | 3.28 |
| Hypothetical (5% return before expenses) | $ | 1,000 | $ | 1,021.83 | $ | 3.41 |
*Expenses are calculated using the most recent six-month expense ratio, net of expense waivers, annualized for each class (Z: 0.80%; A:
1.06%; C: 1.80%; R: 1.30%; and R6: 0.67%), multiplied by the average account value over the period, multiplied by 184/365 to reflect the one-
half year period.
14 Annual Report
franklintempleton.com
FRANKLIN MUTUAL SHARES FUND
| Financial Highlights | |||||||||||||||
| Year Ended December 31, | |||||||||||||||
| 2015 | 2014 | 2013 | 2012 | 2011 | |||||||||||
| Class Z | |||||||||||||||
| Per share operating performance | |||||||||||||||
| (for a share outstanding throughout the year) | |||||||||||||||
| Net asset value, beginning of year | $ | 29.52 | $ | 28.34 | $ | 22.48 | $ | 19.96 | $ | 20.80 | |||||
| Income from investment operationsa: | |||||||||||||||
| Net investment incomeb | 0.54 | 0.78 | c | 0.47 | 0.39 | 0.47 | d | ||||||||
| Net realized and unrealized gains (losses) | (1.71 | ) | 1.38 | 5.83 | 2.62 | (0.80 | ) | ||||||||
| Total from investment operations | (1.17 | ) | 2.16 | 6.30 | 3.01 | (0.33 | ) | ||||||||
| Less distributions from: | |||||||||||||||
| Net investment income | (0.59 | ) | (0.98 | ) | (0.44 | ) | (0.49 | ) | (0.51 | ) | |||||
| Net realized gains | (1.76 | ) | — | — | — | — | |||||||||
| Total distributions | (2.35 | ) | (0.98 | ) | (0.44 | ) | (0.49 | ) | (0.51 | ) | |||||
| Net asset value, end of year | $ | 26.00 | $ | 29.52 | $ | 28.34 | $ | 22.48 | $ | 19.96 | |||||
| Total return | (3.81 | )% | 7.60 | % | 28.10 | % | 15.14 | % | (1.50 | )% | |||||
| Ratios to average net assets | |||||||||||||||
| Expensese | 0.81 | %f,g | 0.80 | %f | 0.79 | %f | 0.82 | % | 0.86 | % | |||||
| Expenses incurred in connection with securities sold short | 0.02 | % | 0.03 | % | —%h | —%h | —%h | ||||||||
| Net investment income | 1.82 | % | 2.67 | %c | 1.85 | % | 1.82 | % | 2.24 | %d | |||||
| Supplemental data | |||||||||||||||
| Net assets, end of year (000’s) | $ | 6,770,056 | $ | 7,363,765 | $ | 7,025,908 | $ | 7,575,308 | $ | 7,540,502 | |||||
| Portfolio turnover rate | 19.99 | % | 19.24 | % | 24.29 | % | 21.57 | % | 29.44 | % | |||||
aThe amount shown for a share outstanding throughout the period may not correlate with the Statement of Operations for the period due to the timing of sales and repurchases
of the Fund’s shares in relation to income earned and/or fluctuating fair value of the investments of the Fund.
bBased on average daily shares outstanding.
cNet investment income per share includes approximately $0.29 per share received in the form of a special dividend paid in connection with certain Fund’s holdings. Excluding
this amount, the ratio of net investment income to average net assets would have been 1.66%.
dNet investment income per share includes approximately $0.08 per share related to interest income received that had previously been deemed uncollectible. Excluding this
amount, the ratio of net investment income to average net assets would have been 1.87%.
eIncludes dividend and/or interest expense on securities sold short and security borrowing fees, if any, which vary from period to period. See Note 1(e).
fBenefit of expense reduction rounds to less than 0.01%.
gBenefit of waiver and payments by affiliates rounds to less than 0.01%.
hRounds to less than 0.01%.
franklintempleton.com
The accompanying notes are an integral part of these financial statements. | Annual Report 15
FRANKLIN MUTUAL SHARES FUND
FINANCIAL H IGHLIGHTS
| Year Ended December 31, | |||||||||||||||
| 2015 | 2014 | 2013 | 2012 | 2011 | |||||||||||
| Class A | |||||||||||||||
| Per share operating performance | |||||||||||||||
| (for a share outstanding throughout the year) | |||||||||||||||
| Net asset value, beginning of year | $ | 29.29 | $ | 28.12 | $ | 22.32 | $ | 19.81 | $ | 20.64 | |||||
| Income from investment operationsa: | |||||||||||||||
| Net investment incomeb | 0.45 | 0.69 | c | 0.40 | 0.33 | 0.40 | d | ||||||||
| Net realized and unrealized gains (losses) | (1.69 | ) | 1.37 | 5.76 | 2.60 | (0.79 | ) | ||||||||
| Total from investment operations | (1.24 | ) | 2.06 | 6.16 | 2.93 | (0.39 | ) | ||||||||
| Less distributions from: | |||||||||||||||
| Net investment income | (0.51 | ) | (0.89 | ) | (0.36 | ) | (0.42 | ) | (0.44 | ) | |||||
| Net realized gains | (1.76 | ) | — | — | — | — | |||||||||
| Total distributions | (2.27 | ) | (0.89 | ) | (0.36 | ) | (0.42 | ) | (0.44 | ) | |||||
| Net asset value, end of year | $ | 25.78 | $ | 29.29 | $ | 28.12 | $ | 22.32 | $ | 19.81 | |||||
| Total returne | (4.10 | )% | 7.30 | % | 27.74 | % | 14.75 | % | (1.79 | )% | |||||
| Ratios to average net assets | |||||||||||||||
| Expensesf | 1.09 | %g,h | 1.10 | %g | 1.09 | %g | 1.12 | % | 1.16 | % | |||||
| Expenses incurred in connection with securities sold short | 0.02 | % | 0.03 | % | —%i | —%i | —%i | ||||||||
| Net investment income | 1.54 | % | 2.37 | %c | 1.55 | % | 1.52 | % | 1.94 | %d | |||||
| Supplemental data | |||||||||||||||
| Net assets, end of year (000’s) | $ | 4,819,868 | $ | 5,392,130 | $ | 5,477,733 | $ | 4,633,895 | $ | 4,681,967 | |||||
| Portfolio turnover rate | 19.99 | % | 19.24 | % | 24.29 | % | 21.57 | % | 29.44 | % | |||||
aThe amount shown for a share outstanding throughout the period may not correlate with the Statement of Operations for the period due to the timing of sales and repurchases
of the Fund’s shares in relation to income earned and/or fluctuating fair value of the investments of the Fund.
bBased on average daily shares outstanding.
cNet investment income per share includes approximately $0.29 per share received in the form of a special dividend paid in connection with certain Fund’s holdings. Excluding
this amount, the ratio of net investment income to average net assets would have been 1.36%.
dNet investment income per share includes approximately $0.08 per share related to interest income received that had previously been deemed uncollectible. Excluding this
amount, the ratio of net investment income to average net assets would have been 1.57%.
eTotal return does not reflect sales commissions or contingent deferred sales charges, if applicable, and is not annualized for periods less than one year.
fIncludes dividend and/or interest expense on securities sold short and security borrowing fees, if any, which vary from period to period. See Note 1(e).
gBenefit of expense reduction rounds to less than 0.01%.
hBenefit of waiver and payments by affiliates rounds to less than 0.01%.
iRounds to less than 0.01%.
16 Annual Report | The accompanying notes are an integral part of these financial statements.
franklintempleton.com
FRANKLIN MUTUAL SHARES FUND
FINANCIAL H IGHLIGHTS
| Year Ended December 31, | |||||||||||||||
| 2015 | 2014 | 2013 | 2012 | 2011 | |||||||||||
| Class C | |||||||||||||||
| Per share operating performance | |||||||||||||||
| (for a share outstanding throughout the year) | |||||||||||||||
| Net asset value, beginning of year | $ | 29.02 | $ | 27.88 | $ | 22.13 | $ | 19.65 | $ | 20.46 | |||||
| Income from investment operationsa: | |||||||||||||||
| Net investment incomeb | 0.24 | 0.48 | c | 0.22 | 0.17 | 0.25 | d | ||||||||
| Net realized and unrealized gains (losses) | (1.67 | ) | 1.34 | 5.71 | 2.57 | (0.77 | ) | ||||||||
| Total from investment operations | (1.43 | ) | 1.82 | 5.93 | 2.74 | (0.52 | ) | ||||||||
| Less distributions from: | |||||||||||||||
| Net investment income | (0.29 | ) | (0.68 | ) | (0.18 | ) | (0.26 | ) | (0.29 | ) | |||||
| Net realized gains | (1.76 | ) | — | — | — | — | |||||||||
| Total distributions | (2.05 | ) | (0.68 | ) | (0.18 | ) | (0.26 | ) | (0.29 | ) | |||||
| Net asset value, end of year | $ | 25.54 | $ | 29.02 | $ | 27.88 | $ | 22.13 | $ | 19.65 | |||||
| Total returne | (4.79 | )% | 6.56 | % | 26.82 | % | 13.97 | % | (2.44 | )% | |||||
| Ratios to average net assets | |||||||||||||||
| Expensesf | 1.81 | %g,h | 1.80 | %g | 1.79 | %g | 1.82 | % | 1.86 | % | |||||
| Expenses incurred in connection with securities sold short | 0.02 | % | 0.03 | % | —%i | —%i | —%i | ||||||||
| Net investment income | 0.82 | % | 1.67 | %c | 0.85 | % | 0.82 | % | 1.24 | %d | |||||
| Supplemental data | |||||||||||||||
| Net assets, end of year (000’s) | $ | 1,101,302 | $ | 1,240,845 | $ | 1,236,603 | $ | 1,043,695 | $ | 1,065,446 | |||||
| Portfolio turnover rate | 19.99 | % | 19.24 | % | 24.29 | % | 21.57 | % | 29.44 | % | |||||
aThe amount shown for a share outstanding throughout the period may not correlate with the Statement of Operations for the period due to the timing of sales and repurchases
of the Fund’s shares in relation to income earned and/or fluctuating fair value of the investments of the Fund.
bBased on average daily shares outstanding.
cNet investment income per share includes approximately $0.29 per share received in the form of a special dividend paid in connection with certain Fund’s holdings. Excluding
this amount, the ratio of net investment income to average net assets would have been 0.66%.
dNet investment income per share includes approximately $0.08 per share related to interest income received that had previously been deemed uncollectible. Excluding this
amount, the ratio of net investment income to average net assets would have been 0.87%.
eTotal return does not reflect sales commissions or contingent deferred sales charges, if applicable, and is not annualized for periods less than one year.
fIncludes dividend and/or interest expense on securities sold short and security borrowing fees, if any, which vary from period to period. See Note 1(e).
gBenefit of expense reduction rounds to less than 0.01%.
hBenefit of waiver and payments by affiliates rounds to less than 0.01%.
iRounds to less than 0.01%.
franklintempleton.com
The accompanying notes are an integral part of these financial statements. | Annual Report 17
FRANKLIN MUTUAL SHARES FUND
FINANCIAL H IGHLIGHTS
| Year Ended December 31, | |||||||||||||||
| 2015 | 2014 | 2013 | 2012 | 2011 | |||||||||||
| Class R | |||||||||||||||
| Per share operating performance | |||||||||||||||
| (for a share outstanding throughout the year) | |||||||||||||||
| Net asset value, beginning of year | $ | 29.14 | $ | 27.98 | $ | 22.20 | $ | 19.70 | $ | 20.52 | |||||
| Income from investment operationsa: | |||||||||||||||
| Net investment incomeb | 0.38 | 0.64 | c | 0.34 | 0.28 | 0.36 | d | ||||||||
| Net realized and unrealized gains (losses) | (1.67 | ) | 1.34 | 5.73 | 2.59 | (0.78 | ) | ||||||||
| Total from investment operations | (1.29 | ) | 1.98 | 6.07 | 2.87 | (0.42 | ) | ||||||||
| Less distributions from: | |||||||||||||||
| Net investment income | (0.43 | ) | (0.82 | ) | (0.29 | ) | (0.37 | ) | (0.40 | ) | |||||
| Net realized gains | (1.76 | ) | — | — | — | — | |||||||||
| Total distributions | (2.19 | ) | (0.82 | ) | (0.29 | ) | (0.37 | ) | (0.40 | ) | |||||
| Net asset value, end of year | $ | 25.66 | $ | 29.14 | $ | 27.98 | $ | 22.20 | $ | 19.70 | |||||
| Total return | (4.32 | )% | 7.10 | % | 27.47 | % | 14.52 | % | (1.94 | )% | |||||
| Ratios to average net assets | |||||||||||||||
| Expensese | 1.31 | %f,g | 1.30 | %f | 1.29 | %f | 1.32 | % | 1.36 | % | |||||
| Expenses incurred in connection with securities sold short | 0.02 | % | 0.03 | % | —%h | —%h | —%h | ||||||||
| Net investment income | 1.32 | % | 2.17 | %c | 1.35 | % | 1.32 | % | 1.74 | %d | |||||
| Supplemental data | |||||||||||||||
| Net assets, end of year (000’s) | $ | 134,050 | $ | 172,938 | $ | 192,658 | $ | 191,304 | $ | 218,757 | |||||
| Portfolio turnover rate | 19.99 | % | 19.24 | % | 24.29 | % | 21.57 | % | 29.44 | % | |||||
aThe amount shown for a share outstanding throughout the period may not correlate with the Statement of Operations for the period due to the timing of sales and repurchases
of the Fund’s shares in relation to income earned and/or fluctuating fair value of the investments of the Fund.
bBased on average daily shares outstanding.
cNet investment income per share includes approximately $0.29 per share received in the form of a special dividend paid in connection with certain Fund’s holdings. Excluding
this amount, the ratio of net investment income to average net assets would have been 1.16%.
dNet investment income per share includes approximately $0.08 per share related to interest income received that had previously been deemed uncollectible. Excluding this
amount, the ratio of net investment income to average net assets would have been 1.37%.
eIncludes dividend and/or interest expense on securities sold short and security borrowing fees, if any, which vary from period to period. See Note 1(e).
fBenefit of expense reduction rounds to less than 0.01%.
gBenefit of waiver and payments by affiliates rounds to less than 0.01%.
hRounds to less than 0.01%.
18 Annual Report | The accompanying notes are an integral part of these financial statements.
franklintempleton.com
FRANKLIN MUTUAL SHARES FUND
FINANCIAL H IGHLIGHTS
| Year Ended December 31, | |||||||||
| 2015 | 2014 | 2013 | a | ||||||
| Class R6 | |||||||||
| Per share operating performance | |||||||||
| (for a share outstanding throughout the year) | |||||||||
| Net asset value, beginning of year | $ | 29.51 | $ | 28.33 | $ | 24.91 | |||
| Income from investment operationsb: | |||||||||
| Net investment incomec | 0.57 | 0.82 | d | 0.38 | |||||
| Net realized and unrealized gains (losses) | (1.71 | ) | 1.37 | 3.51 | |||||
| Total from investment operations | (1.14 | ) | 2.19 | 3.89 | |||||
| Less distributions from: | |||||||||
| Net investment income | (0.63 | ) | (1.01 | ) | (0.47 | ) | |||
| Net realized gains | (1.76 | ) | — | — | |||||
| Total distributions | (2.39 | ) | (1.01 | ) | (0.47 | ) | |||
| Net asset value, end of year | $ | 25.98 | $ | 29.51 | $ | 28.33 | |||
| Total returne | (3.71 | )% | 7.72 | % | 15.70 | % | |||
| Ratios to average net assetsf | |||||||||
| Expensesg,h | 0.69 | %i | 0.69 | % | 0.67 | % | |||
| Expenses incurred in connection with securities sold short | 0.02 | % | 0.03 | % | —%j | ||||
| Net investment income | 1.94 | % | 2.78 | %d | 1.97 | % | |||
| Supplemental data | |||||||||
| Net assets, end of year (000’s) | $ | 1,923,466 | $ | 2,249,991 | $ | 2,221,889 | |||
| Portfolio turnover rate | 19.99 | % | 19.24 | % | 24.29 | % | |||
aFor the period May 1, 2013 (effective date) to December 31, 2013.
bThe amount shown for a share outstanding throughout the period may not correlate with the Statement of Operations for the period due to the timing of sales and repurchases
of the Fund’s shares in relation to income earned and/or fluctuating fair value of the investments of the Fund.
cBased on average daily shares outstanding.
dNet investment income per share includes approximately $0.29 per share received in the form of a special dividend paid in connection with certain Fund’s holdings. Excluding
this amount, the ratio of net investment income to average net assets would have been 1.77%.
eTotal return is not annualized for periods less than one year.
fRatios are annualized for periods less than one year.
gIncludes dividend and/or interest expense on securities sold short and security borrowing fees, if any, which vary from period to period. See Note 1(e).
hBenefit of expense reduction rounds to less than 0.01%.
iBenefit of waiver and payments by affiliates rounds to less than 0.01%.
jRounds to less than 0.01%.
franklintempleton.com
The accompanying notes are an integral part of these financial statements. | Annual Report 19
| FRANKLIN MUTUAL SHARES FUND | ||||
| Statement of Investments, December 31, 2015 | ||||
| Country | Shares | Value | ||
| Common Stocks and Other Equity Interests 88.0% | ||||
| Aerospace & Defense 1.4% | ||||
| B/E Aerospace Inc | United States | 1,412,070 | $ | 59,829,405 |
| Huntington Ingalls Industries Inc | United States | 989,432 | 125,509,449 | |
| aKLX Inc | United States | 706,035 | 21,738,818 | |
| 207,077,672 | ||||
| Auto Components 0.2% | ||||
| a,b,cInternational Automotive Components Group Brazil LLC | Brazil | 7,234,813 | 74,395 | |
| a,b,c,dInternational Automotive Components Group North America LLC | United States | 63,079,866 | 34,054,612 | |
| 34,129,007 | ||||
| Automobiles 1.4% | ||||
| General Motors Co | United States | 6,183,080 | 210,286,551 | |
| Banks 10.7% | ||||
| Barclays PLC | United Kingdom | 38,190,870 | 123,221,940 | |
| CIT Group Inc | United States | 3,544,866 | 140,731,180 | |
| Citigroup Inc | United States | 3,362,406 | 174,004,511 | |
| Citizens Financial Group Inc | United States | 6,757,671 | 176,983,404 | |
| Columbia Banking System Inc | United States | 872,485 | 28,364,487 | |
| aFCB Financial Holdings Inc., A | United States | 1,647,570 | 58,966,530 | |
| cGuaranty Bancorp | United States | 1,146,366 | 18,960,894 | |
| JPMorgan Chase & Co | United States | 3,550,940 | 234,468,568 | |
| PNC Financial Services Group Inc | United States | 3,438,533 | 327,726,580 | |
| State Bank Financial Corp | United States | 1,467,000 | 30,851,010 | |
| SunTrust Banks Inc | United States | 2,963,080 | 126,938,347 | |
| Wells Fargo & Co | United States | 2,531,930 | 137,635,715 | |
| 1,578,853,166 | ||||
| Beverages 1.9% | ||||
| Molson Coors Brewing Co., B | United States | 926,900 | 87,054,448 | |
| PepsiCo Inc | United States | 1,930,319 | 192,877,474 | |
| 279,931,922 | ||||
| Chemicals 0.1% | ||||
| a,e,fDow Corning Corp., Contingent Distribution | United States | 12,630,547 | — | |
| FMC Corp | United States | 253,832 | 9,932,446 | |
| 9,932,446 | ||||
| Communications Equipment 2.7% | ||||
| Cisco Systems Inc | United States | 8,126,460 | 220,674,021 | |
| Nokia Corp., ADR | Finland | 10,897,776 | 76,502,388 | |
| Nokia OYJ, A | Finland | 13,670,039 | 97,929,680 | |
| 395,106,089 | ||||
| Construction Materials 0.7% | ||||
| aLafargeHolcim Ltd., B | Switzerland | 1,946,175 | 97,697,208 | |
| Consumer Finance 0.4% | ||||
| aAlly Financial Inc | United States | 3,254,500 | 60,663,880 | |
| Containers & Packaging 0.8% | ||||
| WestRock Co | United States | 2,648,821 | 120,839,214 | |
| Diversified Consumer Services 0.1% | ||||
| aCengage Learning Holdings II LP | United States | 837,095 | 19,253,185 | |
20 Annual Report
franklintempleton.com
FRANKLIN MUTUAL SHARES FUND
STATEMENT OF INVESTMENTS
| Country | Shares | Value | ||
| Common Stocks and Other Equity Interests (continued) | ||||
| Diversified Telecommunication Services 0.8% | ||||
| a,e,fGlobal Crossing Holdings Ltd., Contingent Distribution | United States | 105,649,309 | $ | — |
| Koninklijke KPN NV | Netherlands | 30,410,640 | 115,353,182 | |
| 115,353,182 | ||||
| Energy Equipment & Services 1.1% | ||||
| Baker Hughes Inc | United States | 3,663,252 | 169,059,080 | |
| Food & Staples Retailing 3.4% | ||||
| CVS Health Corp | United States | 1,528,221 | 149,414,167 | |
| The Kroger Co | United States | 3,789,256 | 158,504,579 | |
| Walgreens Boots Alliance Inc | United States | 2,283,129 | 194,419,850 | |
| 502,338,596 | ||||
| Health Care Equipment & Supplies 4.5% | ||||
| Medtronic PLC | United States | 6,050,204 | 465,381,692 | |
| Stryker Corp | United States | 2,053,179 | 190,822,456 | |
| 656,204,148 | ||||
| Health Care Providers & Services 0.5% | ||||
| Cigna Corp | United States | 492,860 | 72,120,204 | |
| Household Products 0.2% | ||||
| Energizer Holdings Inc | United States | 635,933 | 21,659,878 | |
| Independent Power & Renewable Electricity Producers 0.4% | ||||
| NRG Energy Inc | United States | 4,399,652 | 51,783,904 | |
| Insurance 12.1% | ||||
| ACE Ltd | United States | 2,165,470 | 253,035,169 | |
| aAlleghany Corp | United States | 377,389 | 180,365,525 | |
| The Allstate Corp | United States | 2,478,208 | 153,871,935 | |
| American International Group Inc | United States | 5,079,039 | 314,748,047 | |
| MetLife Inc | United States | 3,551,930 | 171,238,545 | |
| cWhite Mountains Insurance Group Ltd | United States | 655,346 | 476,312,026 | |
| XL Group PLC | Ireland | 6,076,710 | 238,085,498 | |
| 1,787,656,745 | ||||
| IT Services 1.1% | ||||
| Xerox Corp | United States | 15,854,785 | 168,536,364 | |
| Machinery 1.8% | ||||
| Caterpillar Inc | United States | 2,219,257 | 150,820,706 | |
| CNH Industrial NV | United Kingdom | 4,351,332 | 29,966,861 | |
| CNH Industrial NV, special voting | United Kingdom | 5,296,616 | 36,476,867 | |
| cFederal Signal Corp | United States | 3,360,800 | 53,268,680 | |
| 270,533,114 | ||||
| Marine 0.9% | ||||
| A.P. Moeller-Maersk AS, B | Denmark | 100,690 | 131,568,697 | |
| Media 6.5% | ||||
| Cablevision Systems Corp., A | United States | 1,331,662 | 42,480,018 | |
| CBS Corp., B | United States | 3,336,259 | 157,237,887 | |
| Relx PLC | United Kingdom | 9,892,030 | 174,526,872 | |
| Time Warner Cable Inc | United States | 1,769,704 | 328,439,365 | |
| Time Warner Inc | United States | 1,428,918 | 92,408,127 | |
| Twenty-First Century Fox Inc., B | United States | 6,210,501 | 169,111,942 | |
| 964,204,211 |
franklintempleton.com
Annual Report
21
FRANKLIN MUTUAL SHARES FUND
STATEMENT OF INVESTMENTS
| Country | Shares | Value | ||
| Common Stocks and Other Equity Interests (continued) | ||||
| Metals & Mining 0.8% | ||||
| Freeport-McMoRan Inc., B | United States | 5,933,533 | $ | 40,170,018 |
| ThyssenKrupp AG | Germany | 3,973,743 | 79,164,212 | |
| 119,334,230 | ||||
| Multiline Retail 0.6% | ||||
| Macy’s Inc | United States | 2,389,270 | 83,576,665 | |
| Oil, Gas & Consumable Fuels 5.4% | ||||
| Anadarko Petroleum Corp | United States | 654,473 | 31,794,298 | |
| Apache Corp | United States | 1,332,734 | 59,266,681 | |
| BG Group PLC | United Kingdom | 8,345,068 | 121,157,092 | |
| BP PLC | United Kingdom | 15,851,497 | 82,709,667 | |
| CONSOL Energy Inc | United States | 4,672,924 | 36,916,100 | |
| Kinder Morgan Inc | United States | 9,361,520 | 139,673,878 | |
| Marathon Oil Corp | United States | 9,259,413 | 116,576,010 | |
| Murphy Oil Corp | United States | 1,576,220 | 35,386,139 | |
| Royal Dutch Shell PLC, A | United Kingdom | 6,548,282 | 150,050,238 | |
| aWhiting Petroleum Corp | United States | 3,124,439 | 29,494,704 | |
| 803,024,807 | ||||
| Paper & Forest Products 1.0% | ||||
| International Paper Co | United States | 4,045,267 | 152,506,566 | |
| Personal Products 0.3% | ||||
| Edgewell Personal Care Co | United States | 635,933 | 49,838,069 | |
| Pharmaceuticals 8.1% | ||||
| Eli Lilly & Co | United States | 3,779,041 | 318,421,995 | |
| Merck & Co. Inc | United States | 7,732,600 | 408,435,932 | |
| Novartis AG, ADR | Switzerland | 2,478,378 | 213,239,643 | |
| Teva Pharmaceutical Industries Ltd., ADR | Israel | 3,757,920 | 246,669,869 | |
| 1,186,767,439 | ||||
| Real Estate Investment Trusts (REITs) 0.9% | ||||
| cAlexander’s Inc | United States | 326,675 | 125,479,134 | |
| Real Estate Management & Development 0.1% | ||||
| aForestar Group Inc | United States | 886,386 | 9,697,063 | |
| Software 6.1% | ||||
| CA Inc | United States | 5,509,612 | 157,354,519 | |
| Microsoft Corp | United States | 9,580,700 | 531,537,236 | |
| Symantec Corp | United States | 10,127,147 | 212,670,087 | |
| 901,561,842 | ||||
| Specialty Retail 0.5% | ||||
| aOffice Depot Inc | United States | 12,286,390 | 69,295,240 | |
| Technology Hardware, Storage & Peripherals 3.1% | ||||
| EMC Corp | United States | 6,467,600 | 166,087,968 | |
| Hewlett Packard Enterprise Co | United States | 5,001,424 | 76,021,645 | |
| HP Inc | United States | 5,001,424 | 59,216,860 | |
| Samsung Electronics Co. Ltd | South Korea | 147,228 | 157,836,894 | |
| 459,163,367 | ||||
| Tobacco 6.1% | ||||
| Altria Group Inc | United States | 3,092,600 | 180,020,246 | |
| British American Tobacco PLC | United Kingdom | 4,864,275 | 270,369,303 |
22 Annual Report
franklintempleton.com
FRANKLIN MUTUAL SHARES FUND
STATEMENT OF INVESTMENTS
| Country | Shares | Value | |||
| Common Stocks and Other Equity Interests (continued) | |||||
| Tobacco (continued) | |||||
| Imperial Tobacco Group PLC | United Kingdom | 3,810,199 | $ | 201,419,365 | |
| Philip Morris International Inc | United States | 944,754 | 83,053,324 | ||
| Reynolds American Inc | United States | 3,497,440 | 161,406,856 | ||
| 896,269,094 | |||||
| Wireless Telecommunication Services 1.3% | |||||
| Vodafone Group PLC | United Kingdom | 58,574,055 | 190,800,845 | ||
| Total Common Stocks and Other Equity Interests | |||||
| (Cost $10,343,185,032) | 12,972,102,824 | ||||
| Convertible Preferred Stocks (Cost $755,800) 0.0%† | |||||
| Banks 0.0%† | |||||
| Columbia Banking System Inc., cvt. pfd., B | United States | 7,558 | 2,864,003 | ||
| Principal | |||||
| Amount | |||||
| Corporate Notes and Senior Floating Rate Interests 2.9% | |||||
| Avaya Inc., | |||||
| gsenior note, 144A, 10.50%, 3/01/21 | United States | $ | 67,859,000 | 23,411,355 | |
| gsenior secured note, 144A, 7.00%, 4/01/19 | United States | 37,416,000 | 28,062,000 | ||
| h,iTerm B-3 Loan, 4.823%, 10/26/17 | United States | 37,242,834 | 29,080,434 | ||
| h,iTerm B-6 Loan, 6.50%, 3/30/18 | United States | 22,002,294 | 16,767,574 | ||
| h,iTerm B-7 Loan, 6.25%, 5/29/20 | United States | 19,969,656 | 14,045,318 | ||
| h,iBelk Inc., Closing Date Term Loan, 5.75%, 12/10/22 | United States | 31,190,000 | 27,889,069 | ||
| h,iCengage Learning Acquisitions Inc., Original Term Loans, 7.00%, | |||||
| 3/31/20 | United States | 5,127,370 | 4,986,367 | ||
| iHeartCommunications Inc., | |||||
| senior secured note, first lien, 9.00%, 12/15/19 | United States | 74,295,000 | 55,256,906 | ||
| h,iTranche D Term Loan, 7.174%, 1/30/19 | United States | 94,620,527 | 66,707,471 | ||
| h,iTranche E Term Loan, 7.924%, 7/30/19 | United States | 30,412,812 | 21,466,366 | ||
| h,iJC Penney Corp. Inc., Term Loan, 6.00%, 5/22/18 | United States | 33,477,529 | 32,943,998 | ||
| NGPL PipeCo LLC, | |||||
| gsenior secured note, 144A, 9.625%, 6/01/19 | United States | 43,741,000 | 41,116,540 | ||
| h,iTerm Loan, 6.75%, 9/15/17 | United States | 2,192,556 | 2,077,447 | ||
| h,iToys R Us-Delaware Inc., | |||||
| FILO Loans, 8.25%, 10/24/19 | United States | 8,171,000 | 8,063,797 | ||
| Term B-4 Loan, 9.75%, 4/24/20 | United States | 78,582,182 | 57,757,904 | ||
| Total Corporate Notes and Senior Floating Rate | |||||
| Interests (Cost $545,267,897) | 429,632,546 | ||||
| Corporate Notes and Senior Floating Rate Interests in | |||||
| Reorganization 1.2% | |||||
| b,jBroadband Ventures III LLC, secured promissory note, 5.00%, 2/01/12 | United States | 19,594 | — | ||
| h,i,jCaesars Entertainment Operating Co. Inc., 1.50%, 3/01/17, | |||||
| Term B-5-B Loans | United States | 9,541,623 | 8,301,212 | ||
| Term B-6-B Loans | United States | 45,490,495 | 40,031,636 | ||
| Term B-7 Loans | United States | 30,701,720 | 25,674,313 | ||
| jSamson Investment Co., senior note, 9.75%, 2/15/20 | United States | 55,052,000 | 123,867 | ||
| h,i,jTexas Competitive Electric Holdings Co. LLC, Term Loans, 4.908%, | |||||
| 10/10/17 | United States | 194,177,556 | 59,649,015 | ||
| g,jTexas Competitive Electric Holdings Co. LLC/Texas Competitive Electric | |||||
| Holdings Finance Inc., senior secured note, first lien, 144A, 4.726%, | |||||
| 10/01/20 | United States | 98,672,000 | 33,055,120 | ||
franklintempleton.com
Annual Report
23
FRANKLIN MUTUAL SHARES FUND
STATEMENT OF INVESTMENTS
| Principal | ||||||
| Country | Amount | Value | ||||
| Corporate Notes and Senior Floating Rate Interests in | ||||||
| Reorganization (continued) | ||||||
| jWalter Energy Inc., | ||||||
| h,iB Term Loan, 5.80%, 4/02/18 | United States | $ | 35,970,965 | $ | 10,071,870 | |
| g first lien, 144A, 6.33%, 10/15/19 | United States | 20,046,000 | 5,211,960 | |||
| g,ksecond lien, 144A, PIK, 11.50%, 4/01/20 | United States | 17,468,800 | 44,748 | |||
| Total Corporate Notes and Senior Floating Rate Interests | ||||||
| in Reorganization (Cost $421,438,338) | 182,163,741 | |||||
| Shares | ||||||
| Companies in Liquidation 0.2% | ||||||
| aAdelphia Recovery Trust | United States | 99,967,609 | 399,870 | |||
| a,eAdelphia Recovery Trust, Arahova Contingent Value Vehicle, Contingent | ||||||
| Distribution | United States | 12,005,115 | 24,010 | |||
| a,b,c,dCB FIM Coinvestors LLC | United States | 43,105,703 | — | |||
| a,e,fCentury Communications Corp., Contingent Distribution | United States | 33,138,000 | — | |||
| a,bFIM Coinvestor Holdings I, LLC | United States | 53,924,666 | — | |||
| a,lLehman Brothers Holdings Inc., Bankruptcy Claim | United States | 420,480,670 | 23,652,038 | |||
| a,e,fTribune Media Litigation Trust, Contingent Distribution | United States | 995,739 | — | |||
| a,e,fTropicana Litigation Trust, Contingent Distribution | United States | 76,355,000 | — | |||
| Total Companies in Liquidation (Cost $49,649,798) | 24,075,918 | |||||
| Principal | ||||||
| Amount | ||||||
| Municipal Bonds (Cost $56,072,960) 0.3% | ||||||
| Puerto Rico Commonwealth GO, Refunding, Series A, 8.00%, 7/01/35 | United States | $ | 64,157,000 | 46,674,217 | ||
| Total Investments before Short Term Investments | ||||||
| (Cost $11,416,369,825) | 13,657,513,249 | |||||
| Short Term Investments 7.0% | ||||||
| U.S. Government and Agency Securities 7.0% | ||||||
| mFHLB, 1/04/16 - 1/05/16 | United States | 33,700,000 | 33,699,920 | |||
| mU.S. Treasury Bill, | ||||||
| n4/28/16 | United States | 148,000,000 | 147,881,452 | |||
| 1/07/16 - 6/09/16 | United States | 850,200,000 | 849,463,820 | |||
| Total U.S. Government and Agency Securities | ||||||
| (Cost $1,031,012,892) | 1,031,045,192 | |||||
| Total Investments (Cost $12,447,382,717) 99.6% | 14,688,558,441 | |||||
| Securities Sold Short (0.2)% | (30,612,512 | ) | ||||
| Other Assets, less Liabilities 0.6% | 90,796,363 | |||||
| Net Assets 100.0% | $ | 14,748,742,292 | ||||
24 Annual Report
franklintempleton.com
FRANKLIN MUTUAL SHARES FUND
STATEMENT OF INVESTMENTS
| Country | Shares | Value | |||
| oSecurities Sold Short (Proceeds $37,605,949) (0.2)% | |||||
| Common Stocks (0.2)% | |||||
| Energy Equipment & Services (0.2)% | |||||
| Halliburton Co | United States | 899,310 | $ | (30,612,512 | ) |
†Rounds to less than 0.1% of net assets.
aNon-income producing.
bSee Note 9 regarding restricted securities.
cSee Note 11 regarding holdings of 5% voting securities.
dAt December 31, 2015, pursuant to the Fund’s policies and the requirements of applicable securities law, the Fund is restricted from trading these securities at year end.
eContingent distributions represent the right to receive additional distributions, if any, during the reorganization of the underlying company. Shares represent total underlying
principal of debt securities.
fSecurity has been deemed illiquid because it may not be able to be sold within seven days.
gSecurity was purchased pursuant to Rule 144A under the Securities Act of 1933 and may be sold in transactions exempt from registration only to qualified institutional buyers
or in a public offering registered under the Securities Act of 1933. These securities have been deemed liquid under guidelines approved by the Trust’s Board of Trustees. At
December 31, 2015, the aggregate value of these securities was $130,901,723, representing 0.89% of net assets.
hSee Note 1(g) regarding senior floating rate interests.
iThe coupon rate shown represents the rate at period end.
jSee Note 8 regarding credit risk and defaulted securities.
kIncome may be received in additional securities and/or cash.
lBankruptcy Claim represent the right to receive distributions, if any, during the liquidation of the underlying pool of assets. Shares represent the amount of allowed unsecured
claims.
mThe security is traded on a discount basis with no stated coupon rate.
nA portion or all of the security has been segregated as collateral for securities sold short and open forward contracts. At December 31, 2015, the value of this security and/or
cash pledged amounted to $46,723,618, representing 0.32% of net assets.
oSee Note 1(e) regarding securities sold short.
| At December 31, 2015, the Fund had the following futures contracts outstanding. See Note 1(c). | |||||||||
| Futures Contracts | |||||||||
| Number of | Notional | Expiration | Unrealized | Unrealized | |||||
| Description | Type | Contracts | Value | Date | Appreciation | Depreciation | |||
| Currency Contracts | |||||||||
| EUR/USD | Short | 1,950 | $ | 265,346,250 | 3/14/16 | $ | 132,284 | $ | — |
| GBP/USD | Short | 3,923 | 361,259,263 | 3/14/16 | 9,368,937 | — | |||
| Total Futures Contracts | $ | 9,501,221 | $ | — | |||||
| Net unrealized appreciation (depreciation) | $ | 9,501,221 | |||||||
franklintempleton.com
Annual Report
25
FRANKLIN MUTUAL SHARES FUND
STATEMENT OF INVESTMENTS
| At December 31, 2015, the Fund had the following forward exchange contracts outstanding. See Note 1(c). | |||||||||||
| Forward Exchange Contracts | |||||||||||
| Contract | Settlement | Unrealized | Unrealized | ||||||||
| Currency | Counterpartya Type | Quantity | Amount | Date | Appreciation | Depreciation | |||||
| OTC Forward Exchange Contracts | |||||||||||
| Euro | BANT | Buy | 1,901,002 | $ | 2,097,161 | 1/06/16 | $ | — | $ | (31,884 | ) |
| Euro | BONY | Buy | 1,547,836 | 1,707,647 | 1/06/16 | — | (26,055 | ) | |||
| Euro | BONY | Sell | 18,015,829 | 19,704,813 | 1/06/16 | 132,152 | — | ||||
| Euro | FBCO | Buy | 1,901,002 | 2,098,166 | 1/06/16 | — | (32,890 | ) | |||
| Euro | DBFX | Buy | 2,282,158 | 2,518,101 | 1/06/16 | — | (38,731 | ) | |||
| Euro | HSBC | Buy | 1,519,879 | 1,672,926 | 1/06/16 | — | (21,707 | ) | |||
| Euro | HSBC | Sell | 1,735,000 | 1,916,030 | 1/06/16 | 31,100 | — | ||||
| Euro | SSBT | Buy | 1,519,879 | 1,672,908 | 1/06/16 | — | (21,689 | ) | |||
| Euro | SSBT | Sell | 19,596,078 | 21,467,227 | 1/06/16 | 177,760 | — | ||||
| Euro | BANT | Buy | 3,619,658 | 3,950,780 | 1/20/16 | — | (16,939 | ) | |||
| Euro | BANT | Sell | 1,276,000 | 1,389,355 | 1/20/16 | 2,599 | — | ||||
| Euro | FBCO | Buy | 3,619,650 | 3,950,835 | 1/20/16 | — | (17,002 | ) | |||
| Euro | FBCO | Sell | 18,079,025 | 19,792,591 | 1/20/16 | 144,321 | — | ||||
| Euro | DBFX | Buy | 5,324,378 | 5,825,954 | 1/20/16 | 25 | (39,450 | ) | |||
| Euro | HSBC | Buy | 3,912,870 | 4,272,725 | 1/20/16 | — | (20,221 | ) | |||
| Euro | HSBC | Sell | 16,803,025 | 18,397,296 | 1/20/16 | 135,782 | — | ||||
| Euro | SSBT | Buy | 13,134,650 | 14,390,437 | 1/20/16 | 301 | (116,011 | ) | |||
| Euro | SSBT | Sell | 638,000 | 694,552 | 1/20/16 | 1,174 | — | ||||
| British Pound | BANT | Sell | 54,558,348 | 85,165,581 | 1/21/16 | 4,744,728 | — | ||||
| British Pound | FBCO | Buy | 9,902,050 | 15,575,277 | 1/21/16 | — | (979,320 | ) | |||
| British Pound | SSBT | Buy | 9,149,496 | 14,416,925 | 1/21/16 | — | (930,258 | ) | |||
| British Pound | SSBT | Sell | 54,527,362 | 85,133,571 | 1/21/16 | 4,758,392 | — | ||||
| South Korean Won | BANT | Buy | 1,216,110,264 | 1,048,552 | 2/12/16 | — | (15,065 | ) | |||
| South Korean Won | BANT | Sell | 21,626,794,522 | 18,578,272 | 2/12/16 | 232,971 | (33,787 | ) | |||
| South Korean Won | FBCO | Buy | 1,868,787,599 | 1,579,168 | 2/12/16 | 8,983 | — | ||||
| South Korean Won | FBCO | Sell | 17,893,968,537 | 15,458,947 | 2/12/16 | 252,991 | (866 | ) | |||
| South Korean Won | HSBC | Buy | 10,095,464,584 | 8,607,699 | 2/12/16 | 3,231 | (31,507 | ) | |||
| South Korean Won | HSBC | Sell | 82,740,554,088 | 71,113,551 | 2/12/16 | 801,565 | (3,375 | ) | |||
| British Pound | BANT | Buy | 4,735,827 | 7,222,690 | 2/19/16 | — | (241,655 | ) | |||
| British Pound | BANT | Sell | 22,668,782 | 34,334,243 | 2/19/16 | 918,422 | — | ||||
| British Pound | BBU | Buy | 5,131,071 | 8,040,234 | 2/19/16 | — | (476,575 | ) | |||
| British Pound | FBCO | Buy | 18,530,181 | 28,747,066 | 2/19/16 | — | (1,431,913 | ) | |||
| British Pound | FBCO | Sell | 64,454,124 | 99,774,550 | 2/19/16 | 4,763,380 | — | ||||
| British Pound | DBFX | Buy | 2,222,287 | 3,364,578 | 2/19/16 | — | (88,727 | ) | |||
| British Pound | DBFX | Sell | 41,186,128 | 64,167,987 | 2/19/16 | 3,455,934 | — | ||||
| British Pound | HSBC | Buy | 23,497,912 | 36,276,630 | 2/19/16 | — | (1,638,597 | ) | |||
| British Pound | SSBT | Buy | 7,910,877 | 12,173,283 | 2/19/16 | — | (511,940 | ) | |||
| British Pound | SSBT | Sell | 3,300,005 | 4,978,173 | 2/19/16 | 113,669 | — | ||||
| Euro | BANT | Sell | 3,131,054 | 3,528,707 | 2/22/16 | 123,002 | — | ||||
| Euro | BBU | Sell | 241,581 | 272,662 | 2/22/16 | 9,890 | — | ||||
| Euro | FBCO | Sell | 6,737,521 | 7,610,030 | 2/22/16 | 281,503 | — | ||||
| Euro | DBFX | Sell | 5,753,022 | 6,481,256 | 2/22/16 | 223,587 | — | ||||
| Euro | HSBC | Sell | 8,570,062 | 9,677,698 | 2/22/16 | 355,882 | — | ||||
| Euro | SSBT | Sell | 6,310,502 | 7,132,307 | 2/22/16 | 268,256 | — | ||||
| Euro | FBCO | Sell | 2,114,771 | 2,276,523 | 4/01/16 | — | (26,222 | ) | |||
| Euro | DBFX | Sell | 31,486,182 | 35,831,750 | 4/01/16 | 1,546,879 | — | ||||
| Euro | HSBC | Sell | 1,409,848 | 1,518,547 | 4/01/16 | — | (16,617 | ) | |||
| Euro | SSBT | Sell | 26,880,634 | 30,786,928 | 4/01/16 | 1,516,975 | — | ||||
| Euro | BANT | Sell | 26,981,859 | 30,844,534 | 4/18/16 | 1,447,995 | — | ||||
| Euro | FBCO | Sell | 4,329,887 | 4,779,060 | 4/18/16 | 61,680 | — | ||||
| Euro | DBFX | Sell | 602,647 | 667,946 | 4/18/16 | 11,366 | — | ||||
| Euro | HSBC | Sell | 30,800,037 | 35,025,895 | 4/18/16 | 1,469,479 | — | ||||
| Euro | SSBT | Sell | 903,632 | 1,000,219 | 4/18/16 | 15,719 | — | ||||
| British Pound | BANT | Sell | 60,250,067 | 93,068,278 | 4/22/16 | 4,239,720 | — | ||||
| British Pound | HSBC | Sell | 45,358,247 | 70,064,884 | 4/22/16 | 3,191,802 | — | ||||
| Euro | FBCO | Sell | 719,179 | 766,104 | 5/04/16 | — | (17,847 | ) | |||
| Euro | SSBT | Sell | 32,088,149 | 34,507,595 | 5/04/16 | — | (470,545 | ) | |||
| South Korean Won | BANT | Sell | 19,424,290,316 | 16,890,876 | 5/12/16 | 404,160 | — | ||||
26 Annual Report
franklintempleton.com
FRANKLIN MUTUAL SHARES FUND
STATEMENT OF INVESTMENTS
| Forward Exchange Contracts (continued) | |||||||||||
| Contract | Settlement | Unrealized | Unrealized | ||||||||
| Currency | Counterpartya Type | Quantity | Amount | Date | Appreciation | Depreciation | |||||
| OTC Forward Exchange Contracts (continued) | |||||||||||
| South Korean Won | FBCO | Sell | 17,783,154,743 | $ | 15,419,367 | 5/12/16 | $ | 325,594 | $ | — | |
| South Korean Won | HSBC | Sell | 39,218,880,241 | 34,322,817 | 5/12/16 | 1,035,086 | — | ||||
| Euro | BANT | Sell | 17,864,629 | 19,188,352 | 5/18/16 | — | (294,181 | ) | |||
| Euro | FBCO | Sell | 16,560,633 | 17,810,666 | 5/18/16 | 3,427 | (253,201 | ) | |||
| Euro | DBFX | Sell | 3,469,759 | 3,723,128 | 5/18/16 | 2,360 | (63,228 | ) | |||
| Euro | HSBC | Sell | 4,418,882 | 4,797,655 | 5/18/16 | 19,846 | (41,267 | ) | |||
| Euro | SSBT | Sell | 2,042,345 | 2,186,840 | 5/18/16 | 2,613 | (43,082 | ) | |||
| British Pound | FBCO | Sell | 53,938,838 | 82,636,457 | 5/23/16 | 3,100,636 | — | ||||
| British Pound | HSBC | Sell | 46,868,071 | 71,732,520 | 5/23/16 | 2,622,938 | — | ||||
| Total Forward Exchange Contracts | $ | 42,959,875 | $ | (7,992,354 | ) | ||||||
| Net unrealized appreciation (depreciation) | $ | 34,967,521 | |||||||||
aMay be comprised of multiple contracts with the same counterparty, currency and settlement date.
See Abbreviations on page 44.
franklintempleton.com
The accompanying notes are an integral part of these financial statements. | Annual Report 27
| FRANKLIN MUTUAL SHARES FUND | |||
| Financial Statements | |||
| Statement of Assets and Liabilities | |||
| December 31, 2015 | |||
| Assets: | |||
| Investments in securities: | |||
| Cost - Unaffiliated issuers | $ | 12,166,898,555 | |
| Cost - Non-controlled affiliates (Note 11) | 280,484,162 | ||
| Total cost of investments | $ | 12,447,382,717 | |
| Value - Unaffiliated issuers | $ | 13,980,408,700 | |
| Value - Non-controlled affiliates (Note 11) | 708,149,741 | ||
| Total value of investments | 14,688,558,441 | ||
| Cash | 6,008,269 | ||
| Restricted Cash (Note 1d) | 4,440,000 | ||
| Foreign currency, at value (cost $4,881,627) | 4,870,445 | ||
| Receivables: | |||
| Investment securities sold | 10,765,122 | ||
| Capital shares sold | 10,576,993 | ||
| Dividends and interest | 34,620,874 | ||
| Due from brokers | 46,233,712 | ||
| Variation margin | 3,816,588 | ||
| Unrealized appreciation on OTC forward exchange contracts | 42,959,875 | ||
| Other assets | 3,905,475 | ||
| Total assets | 14,856,755,794 | ||
| Liabilities: | |||
| Payables: | |||
| Investment securities purchased | 26,715,293 | ||
| Capital shares redeemed | 17,192,120 | ||
| Management fees | 8,166,064 | ||
| Distribution fees | 4,057,267 | ||
| Transfer agent fees | 2,606,534 | ||
| Trustees’ fees and expenses | 748,123 | ||
| Securities sold short, at value (proceeds $37,605,949) | 30,612,512 | ||
| Due to brokers | 9,350,000 | ||
| Unrealized depreciation on OTC forward exchange contracts | 7,992,354 | ||
| Accrued expenses and other liabilities | 573,235 | ||
| Total liabilities | 108,013,502 | ||
| Net assets, at value | $ | 14,748,742,292 | |
| Net assets consist of: | |||
| Paid-in capital | $ | 12,301,063,789 | |
| Distributions in excess of net investment income | (21,109,495 | ) | |
| Net unrealized appreciation (depreciation) | 2,292,453,841 | ||
| Accumulated net realized gain (loss) | 176,334,157 | ||
| Net assets, at value | $ | 14,748,742,292 | |
28 Annual Report | The accompanying notes are an integral part of these financial statements.
franklintempleton.com
FRANKLIN MUTUAL SHARES FUND
FINANCIAL STATEMENTS
| Statement of Assets and Liabilities (continued) | ||
| December 31, 2015 | ||
| Class Z: | ||
| Net assets, at value | $ | 6,770,056,119 |
| Shares outstanding | 260,425,502 | |
| Net asset value and maximum offering price per share | $ | 26.00 |
| Class A: | ||
| Net assets, at value | $ | 4,819,867,902 |
| Shares outstanding | 186,977,562 | |
| Net asset value per sharea | $ | 25.78 |
| Maximum offering price per share (net asset value per share ÷ 94.25%) | $ | 27.35 |
| Class C: | ||
| Net assets, at value | $ | 1,101,302,332 |
| Shares outstanding | 43,121,708 | |
| Net asset value and maximum offering price per sharea | $ | 25.54 |
| Class R: | ||
| Net assets, at value | $ | 134,050,265 |
| Shares outstanding | 5,224,530 | |
| Net asset value and maximum offering price per share | $ | 25.66 |
| Class R6: | ||
| Net assets, at value | $ | 1,923,465,674 |
| Shares outstanding | 74,027,291 | |
| Net asset value and maximum offering price per share | $ | 25.98 |
aRedemption price is equal to net asset value less contingent deferred sales charges, if applicable.
franklintempleton.com
The accompanying notes are an integral part of these financial statements. | Annual Report 29
FRANKLIN MUTUAL SHARES FUND
FINANCIAL STATEMENTS
| Statement of Operations | |||
| for the year ended December 31, 2015 | |||
| Investment income: | |||
| Dividends: | |||
| Unaffiliated issuers | $ | 342,820,923 | |
| Non-controlled affiliates (Note 11) | 6,527,542 | ||
| Interest | 65,791,819 | ||
| Income from securities loaned | 1,777,630 | ||
| Other income (Note 1h) | 3,828,505 | ||
| Total investment income | 420,746,419 | ||
| Expenses: | |||
| Management fees (Note 3a) | 103,489,413 | ||
| Distribution fees: (Note 3c) | |||
| Class A | 14,740,393 | ||
| Class C | 12,066,760 | ||
| Class R | 780,338 | ||
| Transfer agent fees: (Note 3e) | |||
| Class Z | 9,014,510 | ||
| Class A | 6,503,581 | ||
| Class C | 1,491,650 | ||
| Class R | 193,340 | ||
| Class R6 | 8,951 | ||
| Custodian fees (Note 4) | 397,155 | ||
| Reports to shareholders | 847,174 | ||
| Registration and filing fees | 249,824 | ||
| Professional fees | 256,054 | ||
| Trustees’ fees and expenses | 453,494 | ||
| Dividends and/or interest on securities sold short | 3,593,935 | ||
| Other | 292,696 | ||
| Total expenses | 154,379,268 | ||
| Expense reductions (Note 4) | (2,970 | ) | |
| Expenses waived/paid by affiliates (Note 3f) | (10,031 | ) | |
| Net expenses | 154,366,267 | ||
| Net investment income | 266,380,152 | ||
| Realized and unrealized gains (losses): | |||
| Net realized gain (loss) from: | |||
| Investments | 963,986,457 | ||
| Foreign currency transactions | 101,227,382 | ||
| Futures contracts | 36,321,120 | ||
| Securities sold short | 1,002,726 | ||
| Net realized gain (loss) | 1,102,537,685 | ||
| Net change in unrealized appreciation (depreciation) on: | |||
| Investments | (1,950,390,000 | ) | |
| Translation of other assets and liabilities denominated in foreign currencies | (32,775,338 | ) | |
| Futures contracts | 2,743,779 | ||
| Net change in unrealized appreciation (depreciation) | (1,980,421,559 | ) | |
| Net realized and unrealized gain (loss) | (877,883,874 | ) | |
| Net increase (decrease) in net assets resulting from operations | $ | (611,503,722 | ) |
30 Annual Report | The accompanying notes are an integral part of these financial statements.
franklintempleton.com
FRANKLIN MUTUAL SHARES FUND
FINANCIAL STATEMENTS
| Statements of Changes in Net Assets | ||||||
| Year Ended December 31, | ||||||
| 2015 | 2014 | |||||
| Increase (decrease) in net assets: | ||||||
| Operations: | ||||||
| Net investment income | $ | 266,380,152 | $ | 410,619,019 | ||
| Net realized gain (loss) | 1,102,537,685 | 553,059,954 | ||||
| Net change in unrealized appreciation (depreciation) | (1,980,421,559 | ) | 216,900,748 | |||
| Net increase (decrease) in net assets resulting from operations | (611,503,722 | ) | 1,180,579,721 | |||
| Distributions to shareholders from: | ||||||
| Net investment income: | ||||||
| Class Z | (143,955,672 | ) | (239,045,203 | ) | ||
| Class A | (88,556,211 | ) | (160,771,009 | ) | ||
| Class C | (11,852,920 | ) | (28,860,009 | ) | ||
| Class R | (2,112,252 | ) | (4,880,076 | ) | ||
| Class R6 | (43,006,986 | ) | (76,100,480 | ) | ||
| Net realized gains: | ||||||
| Class Z | (428,103,004 | ) | — | |||
| Class A | (307,474,440 | ) | — | |||
| Class C | (71,195,451 | ) | — | |||
| Class R | (8,639,243 | ) | — | |||
| Class R6 | (120,486,342 | ) | — | |||
| Total distributions to shareholders | (1,225,382,521 | ) | (509,656,777 | ) | ||
| Capital share transactions: (Note 2) | ||||||
| Class Z | 251,525,140 | 45,622,128 | ||||
| Class A | 30,013,668 | (311,543,956 | ) | |||
| Class C | (637,580 | ) | (45,734,382 | ) | ||
| Class R | (22,173,401 | ) | (27,313,743 | ) | ||
| Class R6 | (92,769,124 | ) | (67,074,130 | ) | ||
| Total capital share transactions | 165,958,703 | (406,044,083 | ) | |||
| Net increase (decrease) in net assets | (1,670,927,540 | ) | 264,878,861 | |||
| Net assets: | ||||||
| Beginning of year | 16,419,669,832 | 16,154,790,971 | ||||
| End of year | $ | 14,748,742,292 | $ | 16,419,669,832 | ||
| Undistributed net investment income (distributions in excess of net investment income) included in | ||||||
| net assets: | ||||||
| End of year | $ | (21,109,495 | ) | $ | 3,557,868 | |
franklintempleton.com
The accompanying notes are an integral part of these financial statements. | Annual Report 31
FRANKLIN MUTUAL SHARES FUND
Notes to Financial Statements
1. Organization and Significant Accounting Policies
Franklin Mutual Series Funds (Trust) is registered under the Investment Company Act of 1940 (1940 Act) as an open-end management investment company, consisting of seven separate funds and applies the specialized accounting and reporting guidance in U.S. Generally Accepted Accounting Principles (U.S. GAAP). Franklin Mutual Shares Fund (Fund) is included in this report. The financial statements of the remaining funds in the Trust are presented separately. The Fund offers five classes of shares: Class Z, Class A, Class C, Class R and Class R6. Each class of shares differs by its initial sales load, contingent deferred sales charges, voting rights on matters affecting a single class, its exchange privilege and fees primarily due to differing arrangements for distribution and transfer agent fees.
The following summarizes the Fund’s significant accounting policies.
a. Financial Instrument Valuation
The Fund’s investments in financial instruments are carried at fair value daily. Fair value is the price that would be received to sell an asset or paid to transfer a liability in an orderly transaction between market participants on the measurement date. The Fund calculates the net asset value per share as of 4 p.m. Eastern time each day the New York Stock Exchange (NYSE) is open for trading. Under compliance policies and procedures approved by the Trust’s Board of Trustees (the Board), the Fund’s administrator has responsibility for oversight of valuation, including leading the cross-functional Valuation and Liquidity Oversight Committee (VLOC). The VLOC provides administration and oversight of the Fund’s valuation policies and procedures, which are approved annually by the Board. Among other things, these procedures allow the Fund to utilize independent pricing services, quotations from securities and financial instrument dealers, and other market sources to determine fair value.
Equity securities and derivative financial instruments (derivatives) listed on an exchange or on the NASDAQ National Market System are valued at the last quoted sale price or the official closing price of the day, respectively. Foreign equity securities are valued as of the close of trading on the foreign stock exchange on which the security is primarily traded or as of 4 p.m. Eastern time, whichever is earlier. The value is then converted into its U.S. dollar equivalent at the foreign exchange rate in effect at 4 p.m. Eastern time on the day that the value of the security is determined. Over-the-counter (OTC) securities are valued within the range of the most recent quoted bid and ask prices. Securities that trade in multiple markets or on multiple exchanges are valued according to the broadest and most representative market. Certain equity securities are valued based upon fundamental characteristics or relationships to similar securities.
Debt securities generally trade in the OTC market rather than on a securities exchange. The Fund’s pricing services use multiple valuation techniques to determine fair value. In instances where sufficient market activity exists, the pricing services may utilize a market-based approach through which quotes from market makers are used to determine fair value. In instances where sufficient market activity may not exist or is limited, the pricing services also utilize proprietary valuation models which may consider market characteristics such as benchmark yield curves, credit spreads, estimated default rates, anticipated market interest rate volatility, coupon rates, anticipated timing of principal repayments, underlying collateral, and other unique security features in order to estimate the relevant cash flows, which are then discounted to calculate the fair value. Securities denominated in a foreign currency are converted into their U.S. dollar equivalent at the foreign exchange rate in effect at 4 p.m. Eastern time on the date that the values of the foreign debt securities are determined.
Certain derivatives trade in the OTC market. The Fund’s pricing services use various techniques including industry standard option pricing models and proprietary discounted cash flow models to determine the fair value of those instruments. The Fund’s net benefit or obligation under the derivative contract, as measured by the fair value of the contract, is included in net assets.
The Fund has procedures to determine the fair value of financial instruments for which market prices are not reliable or readily available. Under these procedures, the VLOC convenes on a regular basis to review such financial instruments and considers a number of factors, including significant unobservable valuation inputs, when arriving at fair value. The VLOC primarily employs a market-based approach which may use related or comparable assets or liabilities, recent transactions, market multiples, book values, and other relevant information for the investment to determine the fair value of the investment. An income-based valuation approach may also be used in which the anticipated future cash flows of the investment are discounted to calculate fair value. Discounts may also be applied due to the nature or duration of any restrictions on the disposition of the
32 Annual Report
franklintempleton.com
FRANKLIN MUTUAL SHARES FUND
NOTES TO FINANCIAL STATEMENTS
investments. Due to the inherent uncertainty of valuations of such investments, the fair values may differ significantly from the values that would have been used had an active market existed. The VLOC employs various methods for calibrating these valuation approaches including a regular review of key inputs and assumptions, transactional back-testing or disposition analysis, and reviews of any related market activity.
Trading in securities on foreign securities stock exchanges and OTC markets may be completed before 4 p.m. Eastern time. In addition, trading in certain foreign markets may not take place on every NYSE business day. Occasionally, events occur between the time at which trading in a foreign security is completed and the close of the NYSE that might call into question the reliability of the value of a portfolio security held by the Fund. As a result, differences may arise between the value of the Fund’s portfolio securities as determined at the foreign market close and the latest indications of value at the close of the NYSE. In order to minimize the potential for these differences, the VLOC monitors price movements following the close of trading in foreign stock markets through a series of country specific market proxies (such as baskets of American Depositary Receipts, futures contracts and exchange traded funds). These price movements are measured against established trigger thresholds for each specific market proxy to assist in determining if an event has occurred that may call into question the reliability of the values of the foreign securities held by the Fund. If such an event occurs, the securities may be valued using fair value procedures, which may include the use of independent pricing services.
When the last day of the reporting period is a non-business day, certain foreign markets may be open on those days that the NYSE is closed, which could result in differences between the value of the Fund’s portfolio securities on the last business day and the last calendar day of the reporting period. Any significant security valuation changes due to an open foreign market are adjusted and reflected by the Fund for financial reporting purposes.
b. Foreign Currency Translation
Portfolio securities and other assets and liabilities denominated in foreign currencies are translated into U.S. dollars based on the exchange rate of such currencies against U.S. dollars on the date of valuation. The Fund may enter into foreign currency exchange contracts to facilitate transactions denominated in a foreign currency. Purchases and sales of securities, income and expense items denominated in foreign currencies are translated into U.S. dollars at the exchange rate in effect on the transaction date. Portfolio securities and assets and liabilities denominated in foreign currencies contain risks that those currencies will decline in value relative to the U.S. dollar. Occasionally, events may impact the availability or reliability of foreign exchange rates used to convert the U.S. dollar equivalent value. If such an event occurs, the foreign exchange rate will be valued at fair value using procedures established and approved by the Board.
The Fund does not separately report the effect of changes in foreign exchange rates from changes in market prices on securities held. Such changes are included in net realized and unrealized gain or loss from investments in the Statement of Operations.
Realized foreign exchange gains or losses arise from sales of foreign currencies, currency gains or losses realized between the trade and settlement dates on securities transactions and the difference between the recorded amounts of dividends, interest, and foreign withholding taxes and the U.S. dollar equivalent of the amounts actually received or paid. Net unrealized foreign exchange gains and losses arise from changes in foreign exchange rates on foreign denominated assets and liabilities other than investments in securities held at the end of the reporting period.
c. Derivative Financial Instruments
The Fund invested in derivatives in order to manage risk or gain exposure to various other investments or markets. Derivatives are financial contracts based on an underlying or notional amount, require no initial investment or an initial net investment that is smaller than would normally be required to have a similar response to changes in market factors, and require or permit net settlement. Derivatives contain various risks including the potential inability of the counterparty to fulfill their obligations under the terms of the contract, the potential for an illiquid secondary market, and/or the potential for market movements which expose the Fund to gains or losses in excess of the amounts shown in the Statement of Assets and Liabilities. Realized gain and loss and unrealized appreciation and depreciation on these contracts for the period are included in the Statement of Operations.
Derivative counterparty credit risk is managed through a formal evaluation of the creditworthiness of all potential counterparties. The Fund attempts to reduce its exposure to counterparty credit risk on OTC derivatives, whenever possible, by entering into International Swaps and Derivatives Association (ISDA) master
franklintempleton.com
Annual Report
33
FRANKLIN MUTUAL SHARES FUND
NOTES TO FINANCIAL STATEMENTS
1. Organization and Significant Accounting
Policies (continued)
c. Derivative Financial Instruments (continued)
agreements with certain counterparties. These agreements contain various provisions, including but not limited to collateral requirements, events of default, or early termination. Termination events applicable to the counterparty include certain deteriorations in the credit quality of the counterparty. Termination events applicable to the Fund include failure of the Fund to maintain certain net asset levels and/or limit the decline in net assets over various periods of time. In the event of default or early termination, the ISDA master agreement gives the non-defaulting party the right to net and close-out all transactions traded, whether or not arising under the ISDA agreement, to one net amount payable by one counterparty to the other. However, absent an event of default or early termination, OTC derivative assets and liabilities are presented gross and not offset in the Statement of Assets and Liabilities. Early termination by the counterparty may result in an immediate payment by the Fund of any net liability owed to that counterparty under the ISDA agreement. At December 31, 2015, the Fund had OTC derivatives in a net liability position of $466,685 and the aggregate value of collateral pledged for such contracts was $212,829.
Collateral requirements differ by type of derivative. Collateral or initial margin requirements are set by the broker or exchange clearing house for exchange traded and centrally cleared derivatives. Initial margin deposited is held at the exchange and can be in the form of cash and/or securities. For OTC derivatives traded under an ISDA master agreement, posting of collateral is required by either the Fund or the applicable coun-terparty if the total net exposure of all OTC derivatives with the applicable counterparty exceeds the minimum transfer amount, which typically ranges from $100,000 to $250,000, and can vary depending on the counterparty and the type of the agreement. Generally, collateral is determined at the close of Fund business each day and any additional collateral required due to changes in derivative values may be delivered by the Fund or the counterparty within a few business days. Collateral pledged and/or received by the Fund for OTC derivatives, if any, is held in segregated accounts with the Fund’s custodian/counterparty broker and can be in the form of cash and/or securities. Unrestricted cash may be invested according to the Fund’s investment objectives. To the extent that the amounts due to the Fund from its counterparties are not subject to collateralization or are not fully collateralized, the Fund bears the risk of loss from counterparty non-performance.
At December 31, 2015, the Fund received $18,087,714 in United Kingdom Treasury Bonds and U.S. Treasury Bonds and Notes as collateral for derivatives.
The Fund entered into exchange traded futures contracts primarily to manage exposure to certain foreign currencies. A futures contract is an agreement between the Fund and a counterparty to buy or sell an asset for a specified price on a future date. Required initial margins are pledged by the Fund, and the daily change in fair value is accounted for as a variation margin payable or receivable in the Statement of Assets and Liabilities.
The Fund entered into OTC forward exchange contracts primarily to manage exposure to certain foreign currencies. A forward exchange contract is an agreement between the Fund and a counterparty to buy or sell a foreign currency at a specific exchange rate on a future date.
See Note 10 regarding other derivative information.
d. Restricted Cash
At December 31, 2015, the Fund held restricted cash in connection with investments in certain derivative securities. Restricted cash is held in a segregated account with the Fund’s custodian/counterparty broker and is reflected in the Statement of Assets and Liabilities.
e. Securities Sold Short
The Fund is engaged in selling securities short, which obligates the Fund to replace a borrowed security with the same security at current fair value. The Fund incurs a loss if the price of the security increases between the date of the short sale and the date on which the Fund replaces the borrowed security. The Fund realizes a gain if the price of the security declines between those dates. Gains are limited to the price at which the Fund sold the security short, while losses are potentially unlimited in size.
The Fund is required to establish a margin account with the broker lending the security sold short. While the short sale is outstanding, the broker retains the proceeds of the short sale to the extent necessary to meet margin requirements until the short position is closed out. A deposit must also be maintained with the Fund’s custodian/counterparty broker consisting of cash and/or securities having a value equal to a specified percentage of the value of the securities sold short. The Fund is obligated
34 Annual Report
franklintempleton.com
FRANKLIN MUTUAL SHARES FUND
NOTES TO FINANCIAL STATEMENTS
to pay fees for borrowing the securities sold short and is required to pay the counterparty any dividends and/or interest due on securities sold short. Such dividends and/or interest and any security borrowing fees are recorded as an expense to the Fund.
f. Securities Lending
The Fund participates in an agency based securities lending program to earn additional income. The Fund receives cash collateral against the loaned securities in an amount equal to at least 102% of the fair value of the loaned securities. Collateral is maintained over the life of the loan in an amount not less than 100% of the fair value of loaned securities, as determined at the close of Fund business each day; any additional collateral required due to changes in security values is delivered to the Fund on the next business day. The collateral is deposited into a joint cash account with other funds and is used to invest in a money market fund managed by Franklin Advisers, Inc., an affiliate of the Fund, and/or a joint repurchase agreement. The Fund may receive income from the investment of cash collateral, in addition to lending fees and rebates paid by the borrower. Income from securities loaned is reported separately in the Statement of Operations. The Fund bears the market risk with respect to the collateral investment, securities loaned, and the risk that the agent may default on its obligations to the Fund. If the borrower defaults on its obligation to return the securities loaned, the Fund has the right to repurchase the securities in the open market using the collateral received. The securities lending agent has agreed to indemnify the Fund in the event of default by a third party borrower. At December 31, 2015, the Fund had no securities on loan.
g. Senior Floating Rate Interests
The Fund invests in senior secured corporate loans that pay interest at rates which are periodically reset by reference to a base lending rate plus a spread. These base lending rates are generally the prime rate offered by a designated U.S. bank or the London InterBank Offered Rate (LIBOR). Senior secured corporate loans often require prepayment of principal from excess cash flows or at the discretion of the borrower. As a result, actual maturity may be substantially less than the stated maturity. Senior secured corporate loans in which the Fund invests are generally readily marketable, but may be subject to certain restrictions on resale.
h. Income and Deferred Taxes
It is the Fund’s policy to qualify as a regulated investment company under the Internal Revenue Code. The Fund intends to distribute to shareholders substantially all of its taxable income and net realized gains to relieve it from federal income and excise taxes. As a result, no provision for U.S. federal income taxes is required.
The Fund may be subject to foreign taxation related to income received, capital gains on the sale of securities and certain foreign currency transactions in the foreign jurisdictions in which it invests. Foreign taxes, if any, are recorded based on the tax regulations and rates that exist in the foreign markets in which the Fund invests. When a capital gain tax is determined to apply, the Fund records an estimated deferred tax liability in an amount that would be payable if the securities were disposed of on the valuation date. As a result of several court cases, in certain countries across the European Union, the Fund has filed additional tax reclaims for previously withheld taxes on dividends earned in those countries. These additional filings are subject to various administrative proceedings by the local jurisdictions’ tax authorities within the European Union, as well as a number of related judicial proceedings. During the year ended December 31, 2015, the Fund recognized $3,866,790 from Swe-den for previously withheld foreign taxes and interest on such taxes. These amounts are reflected as other income and interest in the Statement of Operations. In regards to filings in other European Union countries, uncertainty exists as to the ultimate resolution of these proceedings, the likelihood of receipt of these reclaims, and the potential timing of payment, and accordingly, no amounts are reflected in the financial statements.
The Fund may recognize an income tax liability related to its uncertain tax positions under U.S. GAAP when the uncertain tax position has a less than 50% probability that it will be sustained upon examination by the tax authorities based on its technical merits. As of December 31, 2015, the Fund has determined that no tax liability is required in its financial statements related to uncertain tax positions for any open tax years (or expected to be taken on future tax returns). Open tax years are those that remain subject to examination and are based on each tax jurisdiction’s statute of limitation.
franklintempleton.com
Annual Report
35
FRANKLIN MUTUAL SHARES FUND
NOTES TO FINANCIAL STATEMENTS
1. Organization and Significant Accounting
Policies (continued)
i. Security Transactions, Investment Income, Expenses and Distributions
Security transactions are accounted for on trade date. Realized gains and losses on security transactions are determined on a specific identification basis. Interest income and estimated expenses are accrued daily. Amortization of premium and accretion of discount on debt securities are included in interest income. Dividend income and dividends declared on securities sold short are recorded on the ex-dividend date except for certain dividends from foreign securities where the dividend rate is not available. In such cases, the dividend is recorded as soon as the information is received by the Fund. Distributions to shareholders are recorded on the ex-dividend date and are determined according to income tax regulations (tax basis). Distributable earnings determined on a tax basis may differ from earnings recorded in accordance with U.S. GAAP. These differences may be permanent or temporary. Permanent differences are reclassified among capital accounts to reflect their tax character. These reclassifications have no impact on net assets or the results of operations. Temporary differences are not reclassified, as they may reverse in subsequent periods.
Common expenses incurred by the Trust are allocated among the funds based on the ratio of net assets of each fund to the combined net assets of the Trust. Fund specific expenses are charged directly to the fund that incurred the expense.
Realized and unrealized gains and losses and net investment income, not including class specific expenses, are allocated daily to each class of shares based upon the relative proportion of net assets of each class. Differences in per share distributions, by class, are generally due to differences in class specific expenses.
j. Accounting Estimates
The preparation of financial statements in accordance with U.S. GAAP requires management to make estimates and assumptions that affect the reported amounts of assets and liabilities at the date of the financial statements and the amounts of income and expenses during the reporting period. Actual results could differ from those estimates.
k. Guarantees and Indemnifications
Under the Trust’s organizational documents, its officers and trustees are indemnified by the Trust against certain liabilities arising out of the performance of their duties to the Trust. Additionally, in the normal course of business, the Trust, on behalf of the Fund, enters into contracts with service providers that contain general indemnification clauses. The Trust’s maximum exposure under these arrangements is unknown as this would involve future claims that may be made against the Trust that have not yet occurred. Currently, the Trust expects the risk of loss to be remote.
2. Shares of Beneficial Interest
At December 31, 2015, there were an unlimited number of shares authorized (without par value). Transactions in the Fund’s shares were as follows:
| Year Ended December 31, | ||||||||||
| 2015 | 2014 | |||||||||
| Shares | Amount | Shares | Amount | |||||||
| Class Z Shares: | ||||||||||
| Shares sold | 18,527,093 | $ | 545,265,061 | 22,793,740 | $ | 670,723,079 | ||||
| Shares issued in reinvestment of distributions | 20,294,629 | 521,881,031 | 7,266,342 | 217,049,081 | ||||||
| Shares redeemed | (27,833,775 | ) | (815,620,952 | ) | (28,537,599 | ) | (842,150,032 | ) | ||
| Net increase (decrease) | 10,987,947 | $ | 251,525,140 | 1,522,483 | $ | 45,622,128 | ||||
| Class A Shares: | ||||||||||
| Shares sold | 15,761,911 | $ | 457,551,710 | 17,328,653 | $ | 506,435,075 | ||||
| Shares issued in reinvestment of distributions | 14,388,011 | 366,862,039 | 5,000,232 | 148,238,236 | ||||||
| Shares redeemed | (27,287,017 | ) | (794,400,081 | ) | (33,005,127 | ) | (966,217,267 | ) | ||
| Net increase (decrease) | 2,862,905 | $ | 30,013,668 | (10,676,242 | ) | $ | (311,543,956 | ) | ||
36 Annual Report
franklintempleton.com
FRANKLIN MUTUAL SHARES FUND
NOTES TO FINANCIAL STATEMENTS
| Year Ended December 31, | ||||||||||
| 2015 | 2014 | |||||||||
| Shares | Amount | Shares | Amount | |||||||
| Class C Shares: | ||||||||||
| Shares sold | 3,234,045 | $ | 92,690,292 | 3,259,585 | $ | 93,998,595 | ||||
| Shares issued in reinvestment of distributions | 3,117,765 | 78,828,425 | 926,812 | 27,251,988 | ||||||
| Shares redeemed | (5,988,237 | ) | (172,156,297 | ) | (5,790,089 | ) | (166,984,965 | ) | ||
| Net increase (decrease) | 363,573 | $ | (637,580 | ) | (1,603,692 | ) | $ | (45,734,382 | ) | |
| Class R Shares: | ||||||||||
| Shares sold | 602,956 | $ | 17,551,336 | 768,981 | $ | 22,249,134 | ||||
| Shares issued in reinvestment of distributions | 420,635 | 10,682,958 | 164,329 | 4,850,146 | ||||||
| Shares redeemed | (1,732,914 | ) | (50,407,695 | ) | (1,884,250 | ) | (54,413,023 | ) | ||
| Net increase (decrease) | (709,323 | ) | $ | (22,173,401 | ) | (950,940 | ) | $ | (27,313,743 | ) |
| Class R6 Shares: | ||||||||||
| Shares sold | 827,212 | $ | 24,011,578 | 3,360,357 | $ | 98,879,499 | ||||
| Shares issued in reinvestment of distributions | 6,362,712 | 163,493,328 | 2,548,288 | 76,100,480 | ||||||
| Shares redeemed | (9,407,142 | ) | (280,274,030 | ) | (8,093,000 | ) | (242,054,109 | ) | ||
| Net increase (decrease) | (2,217,218 | ) | $ | (92,769,124 | ) | (2,184,355 | ) | $ | (67,074,130 | ) |
3. Transactions with Affiliates
Franklin Resources, Inc. is the holding company for various subsidiaries that together are referred to as Franklin Templeton Investments. Certain officers and trustees of the Fund are also officers and/or directors of the following subsidiaries:
| Subsidiary | Affiliation |
| Franklin Mutual Advisers, LLC (Franklin Mutual) | Investment manager |
| Franklin Templeton Services, LLC (FT Services) | Administrative manager |
| Franklin Templeton Distributors, Inc. (Distributors) | Principal underwriter |
| Franklin Templeton Investor Services, LLC (Investor Services) | Transfer agent |
a. Management Fees
The Fund pays an investment management fee to Franklin Mutual based on the average daily net assets of the Fund as follows:
| Annualized Fee Rate | Net Assets | |
| 0.675 | % | Up to and including $5 billion |
| 0.645 | % | Over $5 billion, up to and including $10 billion |
| 0.625 | % | Over $10 billion, up to and including $15 billion |
| 0.595 | % | Over $15 billion, up to and including $20 billion |
| 0.585 | % | Over $20 billion, up to and including $25 billion |
| 0.565 | % | Over $25 billion, up to and including $30 billion |
| 0.555 | % | Over $30 billion, up to and including $35 billion |
| 0.545 | % | In excess of $35 billion |
b. Administrative Fees
Under an agreement with Franklin Mutual, FT Services provides administrative services to the Fund. The fee is paid by Franklin Mutual based on the Fund’s average daily net assets, and is not an additional expense of the Fund.
franklintempleton.com
Annual Report
37
FRANKLIN MUTUAL SHARES FUND
NOTES TO FINANCIAL STATEMENTS
3. Transactions with Affiliates (continued)
c. Distribution Fees
The Board has adopted distribution plans for each share class, with the exception of Class Z and Class R6 shares, pursuant to Rule 12b-1 under the 1940 Act. Under the Fund’s Class A reimbursement distribution plan, the Fund reimburses Distributors for costs incurred in connection with the servicing, sale and distribution of the Fund’s shares up to the maximum annual plan rate. Under the Class A reimbursement distribution plan, costs exceeding the maximum for the current plan year cannot be reimbursed in subsequent periods. In addition, under the Fund’s Class C and R compensation distribution plans, the Fund pays Distributors for costs incurred in connection with the servicing, sale and distribution of the Fund’s shares up to the maximum annual plan rate for each class. The plan year, for purposes of monitoring compliance with the maximum annual plan rates, is February 1 through January 31 for each fund.
The maximum annual plan rates, based on the average daily net assets, for each class, are as follows:
| Class A | 0.35 | % |
| Class C | 1.00 | % |
| Class R | 0.50 | % |
Effective August 1, 2015, the Board has set the current rate at 0.25% per year for Class A shares until further notice and approval by the Board. Prior to August 1, 2015, the Board had set the rate at 0.30% per year for Class A shares.
d. Sales Charges/Underwriting Agreements
Front-end sales charges and contingent deferred sales charges (CDSC) do not represent expenses of the Fund. These charges are deducted from the proceeds of sales of Fund shares prior to investment or from redemption proceeds prior to remittance, as applicable. Distributors has advised the Fund of the following commission transactions related to the sales and redemptions of the Fund’s shares for the year:
| Sales charges retained net of commissions paid to unaffiliated | ||
| broker/dealers | $ | 1,166,877 |
| CDSC retained | $ | 40,332 |
e. Transfer Agent Fees
Each class of shares, except for Class R6, pays transfer agent fees to Investor Services for its performance of shareholder servicing obligations and reimburses Investor Services for out of pocket expenses incurred, including shareholding servicing fees paid to third parties. These fees are allocated daily based upon their relative proportion of such classes’ aggregate net assets. Class R6 pays Investor Services transfer agent fees specific to that class.
For the year ended December 31, 2015, the Fund paid transfer agent fees of $17,212,032, of which $7,449,161 was retained by Investor Services.
f. Investments in Affiliated Management Investment Companies
The Fund invests in an affiliated management investment company for purposes other than exercising a controlling influence over the management or policies. Management fees paid by the Fund are waived on assets invested in the affiliated management investment company, as noted in the Statement of Operations, in an amount not to exceed the management and administrative fees paid directly or indirectly by each affiliate.
38 Annual Report
franklintempleton.com
FRANKLIN MUTUAL SHARES FUND
NOTES TO FINANCIAL STATEMENTS
| % of Affiliated | |||||||||
| Number of | Number of | Fund Shares | |||||||
| Shares Held | Shares Held | Value | Outstanding | ||||||
| at Beginning | Gross | Gross | at End | at End | Investment | Realized | Held at End | ||
| of Year | Additions | Reductions | of Year | of Year | Income | Gain (Loss) | of Year | ||
| Non-Controlled | |||||||||
| Affiliates | |||||||||
| Institutional | |||||||||
| Fiduciary | |||||||||
| Trust Money | |||||||||
| Market | |||||||||
| Portfolio | — | 35,000,000 | (35,000,000 | ) | — | $ — | $ — | $ — | —% |
g. Waiver and Expense Reimbursements
Investor Services has contractually agreed in advance to waive or limit its fees so that the Class R6 transfer agent fees do not exceed 0.01% until April 30, 2016. There were no Class R6 transfer agent fees waived during the year ended December 31, 2015.
h. Other Affiliated Transactions
At December 31, 2015, one or more of the funds in Franklin Fund Allocator Series owned 12.28% of the Fund’s outstanding shares.
4. Expense Offset Arrangement
The Fund has entered into an arrangement with its custodian whereby credits realized as a result of uninvested cash balances are used to reduce a portion of the Fund’s custodian expenses. During the year ended December 31, 2015, the custodian fees were reduced as noted in the Statement of Operations.
5. Independent Trustees’ Retirement Plan
On January 1, 1993, the Trust adopted an Independent Trustees’ Retirement Plan (Plan). The Plan is an unfunded defined benefit plan that provides benefit payments to Trustees whose length of service and retirement age meets the eligibility requirements of the Plan. Benefits under the Plan are based on years of service and fees paid to each trustee at the time of retirement. Effective in December 1996, the Plan was closed to new participants.
During the year ended December 31, 2015, the Fund’s projected benefit obligation and benefit payments under the Plan were as follows:
| aProjected benefit obligation at December 31, 2015 | $ | 748,123 | |
| bIncrease in projected benefit obligation | $ | 46,930 | |
| Benefit payments made to retired trustees | $ | (14,491 | ) |
aThe projected benefit obligation is included in trustees’ fees and expenses in the Statement of Assets and Liabilities.
bThe increase in projected benefit obligation is included in trustees’ fees and expenses in the Statement of Operations.
6. Income Taxes
The tax character of distributions paid during the years ended December 31, 2015 and 2014, was as follows:
| 2015 | 2014 | |||
| Distributions paid from: | ||||
| Ordinary income | $ | 338,174,840 | $ | 509,656,777 |
| Long term capital gain | 887,207,681 | — | ||
| $ | 1,225,382,521 | $ | 509,656,777 |
franklintempleton.com
Annual Report
39
FRANKLIN MUTUAL SHARES FUND
NOTES TO FINANCIAL STATEMENTS
6. Income Taxes (continued)
At December 31, 2015, the cost of investments, net unrealized appreciation (depreciation), undistributed ordinary income and undistributed long term capital gains for income tax purposes were as follows:
| Cost of investments | $ | 12,473,350,842 | |
| Unrealized appreciation | $ | 4,002,452,769 | |
| Unrealized depreciation | (1,787,245,170 | ) | |
| Net unrealized appreciation (depreciation) | $ | 2,215,207,599 | |
| Undistributed ordinary income | $ | 29,001,244 | |
| Undistributed long term capital gains | 204,572,715 | ||
| Distributable earnings | $ | 233,573,959 |
Differences between income and/or capital gains as determined on a book basis and a tax basis are primarily due to differing treatments of foreign currency transactions.
7. Investment Transactions
Purchases and sales of investments (excluding short term securities and securities sold short) for the year ended December 31, 2015, aggregated $2,965,646,584 and $3,414,024,382, respectively.
8. Credit Risk and Defaulted Securities
The Fund may purchase the pre-default or defaulted debt of distressed companies. Distressed companies are financially troubled and are about to be or are already involved in financial restructuring or bankruptcy. Risks associated with purchasing these securities include the possibility that the bankruptcy or other restructuring process takes longer than expected, or that distributions in restructuring are less than anticipated, either or both of which may result in unfavorable consequences to the Fund. If it becomes probable that the income on debt securities, including those of distressed companies, will not be collected, the Fund discontinues accruing income and recognizes an adjustment for uncollectible interest.
At December 31, 2015, the aggregate long value of distressed company securities for which interest recognition has been discontinued was $182,163,741, representing 1.24% of the Fund’s net assets. For information as to specific securities, see the accompanying Statement of Investments.
9. Restricted Securities
The Fund invests in securities that are restricted under the Securities Act of 1933 (1933 Act) or which are subject to legal, contractual, or other agreed upon restrictions on resale. Restricted securities are often purchased in private placement transactions, and cannot be sold without prior registration unless the sale is pursuant to an exemption under the 1933 Act. Disposal of these securities may require greater effort and expense, and prompt sale at an acceptable price may be difficult. The Fund may have registration rights for restricted securities. The issuer generally incurs all registration costs.
40 Annual Report
franklintempleton.com
FRANKLIN MUTUAL SHARES FUND
NOTES TO FINANCIAL STATEMENTS
At December 31, 2015, the Fund held investments in restricted securities, excluding certain securities exempt from registration under the 1933 Act deemed to be liquid, as follows:
| Principal | |||||||||||
| Amount/ | Acquisition | ||||||||||
| Shares | Issuer | Dates | Cost | Value | |||||||
| 19,594 | Broadband Ventures III LLC, secured promissory note, 5.00%, 2/01/12 | 7/01/10 - 11/30/12 | $ | 19,594 | $ | — | |||||
| 43,105,703 | CB FIM Coinvestors LLC | 1/15/09 - 6/02/09 | — | — | |||||||
| 53,924,666 | FIM Coinvestor Holdings I, LLC | 11/20/06 - 6/02/09 | — | — | |||||||
| 7,234,813 | International Automotive Components Group Brazil LLC | 4/13/06 - 12/26/08 | 4,804,678 | 74,395 | |||||||
| 63,079,866 | International Automotive Components Group North America LLC | 1/12/06 - 3/18/13 | 51,662,536 | 34,054,612 | |||||||
| Total Restricted Securities (Value is 0.23% of Net Assets) | $ | 56,486,808 | $ | 34,129,007 | |||||||
| 10. Other Derivative Information | |||||||||||
| At December 31, 2015, the Fund’s investments in derivative contracts are reflected in the Statement of Assets and Liabilities | |||||||||||
| as follows: | |||||||||||
| Asset Derivatives | Liability Derivatives | ||||||||||
| Derivative Contracts | |||||||||||
| Not Accounted for as | Statement of Assets and | Statement of Assets and | |||||||||
| Hedging Instruments | Liabilities Location | Fair Value | Liabilities Location | Fair Value | |||||||
| Foreign exchange contracts | Variation margin | 9,501,221a | |||||||||
| Unrealized appreciation on OTC | 42,959,875 Unrealized depreciation on OTC | $ | 7,992,354 | ||||||||
| forward exchange contracts | forward exchange contracts | ||||||||||
| Totals | 52,461,096 | $ | 7,992,354 | ||||||||
| aThis amount reflects the cumulative appreciation (depreciation) of futures contracts as reported in the Statement of Investments. Only the variation margin receivable/payable | |||||||||||
| at year end is separately reported within the Statement of Assets and Liabilities. Prior variation margin movements were recorded to cash upon receipt or payment. | |||||||||||
| For the year ended December 31, 2015, the effect of derivative contracts in the Fund’s Statement of Operations was as follows: | |||||||||||
| Net Change in | |||||||||||
| Unrealized | |||||||||||
| Derivative Contracts | Net Realized | Appreciation | |||||||||
| Not Accounted for as | Statement of Operations | Gain (Loss) | Statement of Operations | (Depreciation) | |||||||
| Hedging Instruments | Locations | for the Year | Locations | for the Year | |||||||
| Net realized gain (loss) from: | Net change in unrealized | ||||||||||
| appreciation (depreciation) on: | |||||||||||
| Foreign exchange contracts | Foreign currency transactions | 106,274,514 | Translation of other assets | $ | (32,763,562 | )a | |||||
| and liabilities denominated | |||||||||||
| in foreign currencies | |||||||||||
| Futures contracts | 36,321,120 | Futures contracts | 2,743,779 | ||||||||
| Totals | 142,595,634 | $ | (30,019,783 | ) | |||||||
| aForward exchange contracts are included in net realized gain (loss) from foreign currency transactions and net change in unrealized appreciation (depreciation) on translation | |||||||||||
| of other assets and liabilities denominated in foreign currencies in the Statement of Operations. | |||||||||||
| For the year ended December 31, 2015, the average month end fair value of derivatives represented 0.42% of average month end net assets. The average month end number of open derivative contracts for the year was 199. | |||||||||||
| See Note 1(c) regarding derivative financial instruments. | |||||||||||
franklintempleton.com
Annual Report
41
FRANKLIN MUTUAL SHARES FUND
NOTES TO FINANCIAL STATEMENTS
11. Holdings of 5% Voting Securities of Portfolio Companies
The 1940 Act defines “affiliated companies” to include investments in portfolio companies in which a fund owns 5% or more of the outstanding voting securities. Investments in “affiliated companies” for the Fund for the year ended December 31, 2015, were as shown below.
| Number of | Number of | |||||||||
| Shares Held | Shares Held | Value | ||||||||
| at Beginning | Gross | Gross | at End | at End | Investment | Realized | ||||
| Name of Issuer | of Year | Additions | Reductions | of Year | of Year | Income | Gain (Loss) | |||
| Controlled Affiliatesa | ||||||||||
| CB FIM Coinvestors LLC | 43,105,703 | — | — | 43,105,703 | $ | — | $ | — | $ | — |
| Non-Controlled Affiliates | ||||||||||
| Alexander’s Inc | 326,675 | — | — | 326,675 | $ | 125,479,134 | $ | 4,573,450 | $ | — |
| Federal Signal Corp | 3,360,800 | — | — | 3,360,800 | 53,268,680 | 840,200 | — | |||
| Guaranty Bancorp | 1,146,366 | — | — | 1,146,366 | 18,960,894 | 458,546 | — | |||
| International Automotive | ||||||||||
| Components Group | ||||||||||
| Brazil LLC | 7,234,813 | — | — | 7,234,813 | 74,395 | — | — | |||
| International Automotive | ||||||||||
| Components Group North | ||||||||||
| America LLC | 63,079,866 | — | — | 63,079,866 | 34,054,612 | — | — | |||
| White Mountains Insurance | ||||||||||
| Group Ltd | 655,346 | — | — | 655,346 | 476,312,026 | 655,346 | — | |||
| Total Non-Controlled Affiliates | 708,149,741 | 6,527,542 | — | |||||||
| Total Affiliated Securities (Value is 4.80% of Net Assets) | $ | 708,149,741 | $ | 6,527,542 | $ | — | ||||
| aIssuer in which the Fund owns 25% or more of the outstanding voting securities. | ||||||||||
12. Credit Facility
The Fund, together with other U.S. registered and foreign investment funds (collectively, Borrowers), managed by Franklin Templeton Investments, are borrowers in a joint syndicated senior unsecured credit facility totaling $2 billion (Global Credit Facility) which matured on February 12, 2016. This Global Credit Facility provides a source of funds to the Borrowers for temporary and emergency purposes, including the ability to meet future unanticipated or unusually large redemption requests. Effective February 12, 2016, the Borrowers renewed the Global Credit Facility for a one year term, maturing February 10, 2017, for a total of $2 billion.
Under the terms of the Global Credit Facility, the Fund shall, in addition to interest charged on any borrowings made by the Fund and other costs incurred by the Fund, pay its share of fees and expenses incurred in connection with the implementation and maintenance of the Global Credit Facility, based upon its relative share of the aggregate net assets of all of the Borrowers, including an annual commitment fee of 0.07% based upon the unused portion of the Global Credit Facility. Effective February 12, 2016, the annual commitment fee is 0.15%. These fees are reflected in other expenses in the Statement of Operations. During the year ended December 31, 2015, the Fund did not use the Global Credit Facility.
13. Fair Value Measurements
The Fund follows a fair value hierarchy that distinguishes between market data obtained from independent sources (observable inputs) and the Fund’s own market assumptions (unobservable inputs). These inputs are used in determining the value of the Fund’s financial instruments and are summarized in the following fair value hierarchy:
- Level 1 – quoted prices in active markets for identical financial instruments
- Level 2 – other significant observable inputs (including quoted prices for similar financial instruments, interest rates, prepayment speed, credit risk, etc.)
- Level 3 – significant unobservable inputs (including the Fund’s own assumptions in determining the fair value of financial instruments)
42 Annual Report
franklintempleton.com
FRANKLIN MUTUAL SHARES FUND
NOTES TO FINANCIAL STATEMENTS
The input levels are not necessarily an indication of the risk or liquidity associated with financial instruments at that level.
For movements between the levels within the fair value hierarchy, the Fund has adopted a policy of recognizing the transfers as of the date of the underlying event which caused the movement.
A summary of inputs used as of December 31, 2015, in valuing the Fund’s assets and liabilities carried at fair value, is as follows:
| Level 1 | Level 2 | Level 3 | Total | ||||||
| Assets: | |||||||||
| Investments in Securities: | |||||||||
| Equity Investments:a | |||||||||
| Auto Components | $ | — | $ | — | $ | 34,129,007 | $ | 34,129,007 | |
| Banks | 1,578,853,166 | 2,864,003 | — | 1,581,717,169 | |||||
| Machinery | 234,056,247 | 36,476,867 | — | 270,533,114 | |||||
| All Other Equity Investmentsb | 11,088,587,537 | — | —c | 11,088,587,537 | |||||
| Corporate Notes and Senior Floating Rate Interests | — | 429,632,546 | — | 429,632,546 | |||||
| Corporate Notes and Senior Floating Rate Interests in | |||||||||
| Reorganization | — | 182,118,993 | 44,748 | c | 182,163,741 | ||||
| Companies in Liquidation | 399,870 | 23,676,048 | —c | 24,075,918 | |||||
| Municipal Bonds | — | 46,674,217 | — | 46,674,217 | |||||
| Short Term Investments | 997,345,272 | 33,699,920 | — | 1,031,045,192 | |||||
| Total Investments in Securities | $ | 13,899,242,092 | $ | 755,142,594 | $ | 34,173,755 | $ | 14,688,558,441 | |
| Other Financial Instruments | |||||||||
| Futures Contracts | $ | 9,501,221 | $ | — | $ | — | $ | 9,501,221 | |
| Forward Exchange Contracts | — | 42,959,875 | — | 42,959,875 | |||||
| Total Other Financial Instruments | $ | 9,501,221 | $ | 42,959,875 | $ | — | $ | 52,461,096 | |
| Liabilities: | |||||||||
| Other Financial Instruments | |||||||||
| Securities Sold Short | $ | 30,612,512 | $ | — | $ | — | $ | 30,612,512 | |
| Forward Exchange Contracts | — | 7,992,354 | — | 7,992,354 | |||||
| Total Other Financial Instruments | $ | 30,612,512 | $ | 7,992,354 | $ | — | $ | 38,604,866 | |
a Includes common and convertible preferred stocks as well as other equity investments.
bFor detailed categories, see the accompanying Statement of Investments.
cIncludes securities determined to have no value at December 31, 2015.
A reconciliation of assets in which Level 3 inputs are used in determining fair value is presented when there are significant Level 3
financial instruments at the end of the year.
franklintempleton.com
Annual Report
43
FRANKLIN MUTUAL SHARES FUND
NOTES TO FINANCIAL STATEMENTS
14. Subsequent Events
The Fund has evaluated subsequent events through the issuance of the financial statements and determined that no events have occurred that require disclosure other than those already disclosed in the financial statements.
| Abbreviations | |||||
| Counterparty | Currency | Selected Portfolio | |||
| BANT | Bank of America N.A. | EUR | Euro | ADR | American Depositary Receipt |
| BBU | Barclays Bank PLC | GBP | British Pound | FHLB | Federal Home Loan Bank |
| BONY | Bank of New York Mellon | USD | United States Dollar | GO | General Obligation |
| DBFX | Deutsche Bank AG | PIK | Payment-In-Kind | ||
| FBCO | Credit Suisse Group AG | ||||
| HSBC | HSBC Bank USA, N.A. | ||||
| SSBT | State Street Bank and Trust Co., N.A. | ||||
44 Annual Report
franklintempleton.com
FRANKLIN MUTUAL SHARES FUND
Report of Independent Registered Public Accounting Firm
To the Board of Trustees of Franklin Mutual Series Funds and Shareholders of Franklin Mutual Shares Fund:
We have audited the accompanying statement of assets and liabilities of Franklin Mutual Shares Fund (the “Fund”) (one of the funds constituting Franklin Mutual Series Funds), including the statement of investments, as of December 31, 2015, and the related statement of operations for the year then ended, the statements of changes in net assets for each of the two years in the period then ended, and the financial highlights for each of the periods indicated therein. These financial statements and financial highlights are the responsibility of the Fund’s management. Our responsibility is to express an opinion on these financial statements and financial highlights based on our audits.
We conducted our audits in accordance with the standards of the Public Company Accounting Oversight Board (United States). Those standards require that we plan and perform the audit to obtain reasonable assurance about whether the financial statements and financial highlights are free of material misstatement. We were not engaged to perform an audit of the Fund’s internal control over financial reporting. Our audits included consideration of internal control over financial reporting as a basis for designing audit procedures that are appropriate in the circumstances, but not for the purpose of expressing an opinion on the effectiveness of the Fund’s internal control over financial reporting. Accordingly, we express no such opinion. An audit also includes examining, on a test basis, evidence supporting the amounts and disclosures in the financial statements and financial highlights, assessing the accounting principles used and significant estimates made by management, and evaluating the overall financial statement presentation. Our procedures included confirmation of securities owned as of December 31, 2015, by correspondence with the custodian and brokers, or by other appropriate auditing procedures where replies from the brokers were not received. We believe that our audits provide a reasonable basis for our opinion.
In our opinion, the financial statements and financial highlights referred to above present fairly, in all material respects, the financial position of Franklin Mutual Shares Fund (one of the funds constituting Franklin Mutual Series Funds) at December 31, 2015, the results of its operations for the year then ended, the changes in its net assets for each of the two years in the period then ended, and the financial highlights for each of the periods indicated therein, in conformity with U.S. generally accepted accounting principles.

Boston, Massachusetts
February 18, 2016
franklintempleton.com
Annual Report
45
FRANKLIN MUTUAL SHARES FUND
Tax Information (unaudited)
Under Section 852(b)(3)(C) of the Internal Revenue Code (Code), the Fund hereby reports the maximum amount allowable but no less than $887,207,681 as a long term capital gain dividend for the fiscal year ended December 31, 2015.
Under Section 871(k)(2)(C) of the Code, the Fund hereby reports the maximum amount allowable but no less than $48,690,798 as a short term capital gain dividend for purposes of the tax imposed under Section 871(a)(1)(A) of the Code for the fiscal year ended December 31, 2015.
Under Section 854(b)(1)(A) of the Code, the Fund hereby reports 61.10% of the ordinary income dividends as income qualifying for the dividends received deduction for the fiscal year ended December 31, 2015.
Under Section 854(b)(1)(B) of the Code, the Fund hereby reports the maximum amount allowable but no less than $321,363,815 as qualified dividends for purposes of the maximum rate under Section 1(h)(11) of the Code for the fiscal year ended December 31, 2015. Distributions, including qualified dividend income, paid during calendar year 2015 will be reported to shareholders on Form 1099-DIV by mid-February 2016. Shareholders are advised to check with their tax advisors for information on the treatment of these amounts on their individual income tax returns.
Under Section 871(k)(1)(C) of the Code, the Fund hereby reports the maximum amount allowable but no less than $44,473,279 as interest related dividends for purposes of the tax imposed under Section 871(a)(1)(A) of the Code for the fiscal year ended December 31, 2015.
46 Annual Report
franklintempleton.com
FRANKLIN MUTUAL SHARES FUND
Board Members and Officers
The name, year of birth and address of the officers and board members, as well as their affiliations, positions held with the Fund, principal occupations during at least the past five years and number of portfolios overseen in the Franklin Templeton Investments fund complex, are shown below. Generally, each board member serves until that person’s successor is elected and qualified.
| Independent Board Members | ||||
| Number of Portfolios in | ||||
| Name, Year of Birth | Length of | Fund Complex Overseen | Other Directorships Held | |
| and Address | Position | Time Served | by Board Member* | During at Least the Past 5 Years |
| Edward I. Altman, Ph.D. (1941) | Trustee | Since 1987 | 17 | None |
| c/o Franklin Mutual Advisers, LLC | ||||
| 101 John F. Kennedy Parkway | ||||
| Short Hills, NJ 07078-2789 | ||||
| Principal Occupation During at Least the Past 5 Years: | ||||
| Max L. Heine Professor of Finance, Emeritus and Director of The Credit and Debt Markets Research Program, Salomon Center, Stern School | ||||
| of Business, New York University; editor and author of numerous financial publications; financial consultant; an adviser to numerous financial | ||||
| and publishing organizations; and formerly, Vice Director, Salomon Center, Stern School of Business, New York University. | ||||
| Ann Torre Bates (1958) | Trustee | Since 1995 | 41 | Navient Corporation (loan |
| c/o Franklin Mutual Advisers, LLC | management, servicing and asset | |||
| 101 John F. Kennedy Parkway | recovery) (2014-present), Ares Capital | |||
| Short Hills, NJ 07078-2789 | Corporation (specialty finance | |||
| company) (2010-present), United | ||||
| Natural Foods, Inc. (distributor of | ||||
| natural, organic and specialty foods) | ||||
| (2013-present), Allied Capital | ||||
| Corporation (financial services) | ||||
| (2003-2010) and SLM Corporation | ||||
| (Sallie Mae) (1997-2014). | ||||
| Principal Occupation During at Least the Past 5 Years: | ||||
| Director of various companies; and formerly, Executive Vice President and Chief Financial Officer, NHP Incorporated (manager of multifamily | ||||
| housing) (1995-1997); and Vice President and Treasurer, US Airways, Inc. (until 1995). | ||||
| Burton J. Greenwald (1929) | Trustee | Trustee since | 17 | Franklin Templeton Emerging Markets |
| c/o Franklin Mutual Advisers, LLC | and Vice | 2002 and Vice | Debt Opportunities Fund PLC and | |
| 101 John F. Kennedy Parkway | Chairman | Chairman since | Fiduciary International Ireland Limited | |
| Short Hills, NJ 07078-2789 | of the | April 2015 | (1999-2015). | |
| Board | ||||
| Principal Occupation During at Least the Past 5 Years: | ||||
| Managing Director, B.J. Greenwald Associates (management consultants to the financial services industry); and formerly, Chairman, | ||||
| Fiduciary Trust International Funds; Executive Vice President, L.F. Rothschild Fund Management, Inc.; President and Director, Merit Mutual | ||||
| Funds; President, Underwriting Division and Director, National Securities & Research Corporation; Governor, Investment Company Institute; | ||||
| and Chairman, ICI Public Information Committee. | ||||
| Keith E. Mitchell (1954) | Trustee | Since 2009 | 17 | None |
| c/o Franklin Mutual Advisers, LLC | ||||
| 101 John F. Kennedy Parkway | ||||
| Short Hills, NJ 07078-2789 | ||||
| Principal Occupation During at Least the Past 5 Years: | ||||
| Director of various boards of asset management firms; and formerly, Managing Member, Mitchell, Hartley & Bechtel Advisers, LLC (formerly, | ||||
| Mitchell Advisers, LLC) (advisory firm) (2003-2015) and Managing Director, Putnam Lovell NBF. | ||||
| David W. Niemiec (1949) | Trustee | Since | 41 | Emeritus Corporation (assisted |
| One Franklin Parkway | April 2015 | living) (1999-2010) and OSI | ||
| San Mateo, CA 94403-1906 | Pharmaceuticals, Inc. (pharmaceutical | |||
| products) (2006-2010). | ||||
| Principal Occupation During at Least the Past 5 Years: | ||||
| Advisor, Saratoga Partners (private equity fund); and formerly, Managing Director, Saratoga Partners (1998-2001) and SBC Warburg Dillon | ||||
| Read (investment banking) (1997-1998); Vice Chairman, Dillon, Read & Co. Inc. (investment banking) (1991-1997); and Chief Financial | ||||
| Officer, Dillon, Read & Co. Inc. (1982-1997). | ||||
franklintempleton.com
Annual Report
47
FRANKLIN MUTUAL SHARES FUND
| Independent Board Members (continued) | |||||
| Number of Portfolios in | |||||
| Name, Year of Birth | Length of | Fund Complex Overseen | Other Directorships Held | ||
| and Address | Position | Time Served | by Board Member* | During at Least the Past 5 Years | |
| Charles Rubens II (1930) | Trustee | Since 1998 | 17 | None | |
| c/o Franklin Mutual Advisers, LLC | |||||
| 101 John F. Kennedy Parkway | |||||
| Short Hills, NJ 07078-2789 | |||||
| Principal Occupation During at Least the Past 5 Years: | |||||
| Private investor and president of non-profit organizations; and formerly, an executive of Time, Inc.; and Trustee of Colorado College. | |||||
| Jan Hopkins Trachtman (1947) | Trustee | Since 2009 | 17 | None | |
| c/o Franklin Mutual Advisers, LLC | |||||
| 101 John F. Kennedy Parkway | |||||
| Short Hills, NJ 07078-2789 | |||||
| Principal Occupation During at Least the Past 5 Years: | |||||
| President and Founder, The Jan Hopkins Group (communications consulting firm); serves on Advisory Board of Knight Bagehot Fellowship; | |||||
| and formerly, President, Economic Club of New York (2001-2015); Anchor/Correspondent, CNN Financial News (until 2003); Managing | |||||
| Director and Head of Client Communications, Citigroup Private Bank (until 2005); Off-Air Reporter, ABC News’ World News Tonight; and | |||||
| Editor, CBS Network News. | |||||
| Robert E. Wade (1946) | Trustee | Trustee since | 41 | El Oro Ltd (investments) | |
| c/o Franklin Mutual Advisers, LLC | and | 1993 | and | (2003-present). | |
| 101 John F. Kennedy Parkway | Chairman | Chairman of the | |||
| Short Hills, NJ 07078-2789 | of the | Board | |||
| Board | since 2005 | ||||
| Principal Occupation During at Least the Past 5 Years: | |||||
| Attorney at law engaged in private practice (1972-2008) and member of various boards. | |||||
| Gregory H. Williams (1943) | Trustee | Since | 17 | None | |
| One Franklin Parkway | April 2015 | ||||
| San Mateo, CA 94403-1906 | |||||
| Principal Occupation During at Least the Past 5 Years: | |||||
| Private investor; Consultant; and formerly, President, University of Cincinnati (2009-2012); President, The City College of New York | |||||
| (2001-2009); Dean, College of Law, Ohio State University (1993-2001); and Associate Vice President, Academic Affairs and Professor of Law, | |||||
| University of Iowa (1977-1993). | |||||
| Interested Board Members and Officers | |||||
| Number of Portfolios in | |||||
| Name, Year of Birth | Length of | Fund Complex Overseen | Other Directorships Held | ||
| and Address | Position | Time Served | by Board Member* | During at Least the Past 5 Years | |
| **Gregory E. Johnson (1961) | Trustee | Since 2007 | 164 | None | |
| One Franklin Parkway | |||||
| San Mateo, CA 94403-1906 | |||||
| Principal Occupation During at Least the Past 5 Years: | |||||
| Chairman of the Board, Member – Office of the Chairman, Director and Chief Executive Officer, Franklin Resources, Inc.; officer and/or | |||||
| director or trustee, as the case may be, of some of the other subsidiaries of Franklin Resources, Inc. and of 44 of the investment companies in | |||||
| Franklin Templeton Investments; Vice Chairman, Investment Company Institute; and formerly, President, Franklin Resources, Inc. | |||||
| (1994-2015). | |||||
48 Annual Report
franklintempleton.com
FRANKLIN MUTUAL SHARES FUND
| Interested Board Members and Officers (continued) | ||||
| Number of Portfolios in | ||||
| Name, Year of Birth | Length of | Fund Complex Overseen | Other Directorships Held | |
| and Address | Position | Time Served | by Board Member* | During at Least the Past 5 Years |
| **Peter A. Langerman (1955) | Trustee, | Trustee | 7 | American International Group, Inc. |
| c/o Franklin Mutual Advisers, LLC | President, | since 2007, | (AIG) Credit Facility Trust | |
| 101 John F. Kennedy Parkway | and Chief | President, and | (2010-2011). | |
| Short Hills, NJ 07078-2702 | Executive | Chief Executive | ||
| Officer – | Officer – | |||
| Investment | Investment | |||
| Management | Management | |||
| since 2005 | ||||
| Principal Occupation During at Least the Past 5 Years: | ||||
| Chairman of the Board, Chief Executive Officer and President, Franklin Mutual Advisers, LLC; and officer and/or director, as the case may be, | ||||
| of two of the investment companies in Franklin Templeton Investments. | ||||
| Alison E. Baur (1964) | Vice | Since 2012 | Not Applicable | Not Applicable |
| One Franklin Parkway | President | |||
| San Mateo, CA 94403-1906 | ||||
| Principal Occupation During at Least the Past 5 Years: | ||||
| Deputy General Counsel, Franklin Templeton Investments; and officer of some of the other subsidiaries of Franklin Resources, Inc. and of 44 | ||||
| of the investment companies in Franklin Templeton Investments. | ||||
| Philippe Brugere-Trelat (1949) | Vice | Since 2005 | Not Applicable | Not Applicable |
| 101 John F. Kennedy Parkway | President | |||
| Short Hills NJ 07078-2789 | ||||
| Principal Occupation During at Least the Past 5 Years: | ||||
| Executive Vice President, Franklin Mutual Advisers, LLC; officer of two of the investment companies in Franklin Templeton Investments; and | ||||
| formerly, Portfolio Manager of Eurovest SA (French registered Investment Company, Sicav). | ||||
| Laura F. Fergerson (1962) | Chief | Since 2009 | Not Applicable | Not Applicable |
| One Franklin Parkway | Executive | |||
| San Mateo, CA 94403-1906 | Officer – | |||
| Finance and | ||||
| Administration | ||||
| Principal Occupation During at Least the Past 5 Years: | ||||
| Senior Vice President, Franklin Templeton Services, LLC; Vice President, Franklin Advisers, Inc. and Franklin Templeton Institutional, LLC; | ||||
| and officer of 44 of the investment companies in Franklin Templeton Investments. | ||||
| Aliya S. Gordon (1973) | Vice | Since 2009 | Not Applicable | Not Applicable |
| One Franklin Parkway | President | |||
| San Mateo, CA 94403-1906 | ||||
| Principal Occupation During at Least the Past 5 Years: | ||||
| Senior Associate General Counsel, Franklin Templeton Investments; and officer of 44 of the investment companies in Franklin Templeton | ||||
| Investments. | ||||
| Steven J. Gray (1955) | Secretary | Secretary | Not Applicable | Not Applicable |
| One Franklin Parkway | and Vice | since 2005 and | ||
| San Mateo, CA 94403-1906 | President | Vice President | ||
| since 2009 | ||||
| Principal Occupation During at Least the Past 5 Years: | ||||
| Senior Associate General Counsel, Franklin Templeton Investments; Vice President, Franklin Templeton Distributors, Inc. and Franklin | ||||
| Alternative Strategies Advisers, LLC; and officer of 44 of the investment companies in Franklin Templeton Investments. | ||||
franklintempleton.com
Annual Report
49
FRANKLIN MUTUAL SHARES FUND
| Interested Board Members and Officers (continued) | ||||
| Number of Portfolios in | ||||
| Name, Year of Birth | Length of | Fund Complex Overseen | Other Directorships Held | |
| and Address | Position | Time Served | by Board Member* | During at Least the Past 5 Years |
| Selena L. Holmes (1965) | Vice | Since 2012 | Not Applicable | Not Applicable |
| 100 Fountain Parkway | President – | |||
| St. Petersburg, FL 33716-1205 | AML | |||
| Compliance | ||||
| Principal Occupation During at Least the Past 5 Years: | ||||
| Director, Global Compliance Monitoring; Chief Compliance Officer, Franklin Alternative Strategies Advisers, LLC; Vice President, Franklin | ||||
| Templeton Companies, LLC; and officer of 44 of the investment companies in Franklin Templeton Investments. | ||||
| Robert G. Kubilis (1973) | Treasurer, | Since 2012 | Not Applicable | Not Applicable |
| 300 S.E. 2nd Street | Chief | |||
| Fort Lauderdale, FL 33301-1923 | Financial | |||
| Officer and | ||||
| Chief | ||||
| Accounting | ||||
| Officer | ||||
| Principal Occupation During at Least the Past 5 Years: | ||||
| Treasurer, U.S. Fund Administration & Reporting, Franklin Templeton Investments; and officer of four of the investment companies in Franklin | ||||
| Templeton Investments. | ||||
| Kimberly H. Novotny (1972) | Vice | Since 2013 | Not Applicable | Not Applicable |
| 300 S.E. 2nd Street | President | |||
| Fort Lauderdale, | ||||
| FL 33301-1923 | ||||
| Principal Occupation During at Least the Past 5 Years: | ||||
| Associate General Counsel, Franklin Templeton Investments; Vice President, Fiduciary Trust International of the South and Templeton | ||||
| Investment Counsel, LLC; Assistant Secretary, Franklin Resources, Inc.; and officer of 44 of the investment companies in Franklin Templeton | ||||
| Investments. | ||||
| Robert C. Rosselot (1960) | Chief | Since 2013 | Not Applicable | Not Applicable |
| 300 S.E. 2nd Street | Compliance | |||
| Fort Lauderdale, | Officer | |||
| FL 33301-1923 | ||||
| Principal Occupation During at Least the Past 5 Years: | ||||
| Director, Global Compliance, Franklin Templeton Investments; Vice President, Franklin Templeton Companies, LLC; officer of 44 of the | ||||
| investment companies in Franklin Templeton Investments; and formerly, Senior Associate General Counsel, Franklin Templeton Investments | ||||
| (2007-2013); and Secretary and Vice President, Templeton Group of Funds (2004-2013). | ||||
| Karen L. Skidmore (1952) | Vice | Since 2009 | Not Applicable | Not Applicable |
| One Franklin Parkway | President | |||
| San Mateo, CA 94403-1906 | ||||
| Principal Occupation During at Least the Past 5 Years: | ||||
| Senior Associate General Counsel, Franklin Templeton Investments; and officer of 44 of the investment companies in Franklin Templeton | ||||
| Investments. | ||||
| Navid Tofigh (1972) | Vice | Since | Not Applicable | Not Applicable |
| One Franklin Parkway | President | November 2015 | ||
| San Mateo, CA 94403-1906 | ||||
| Principal Occupation During at Least the Past 5 Years: | ||||
| Associate General Counsel, Franklin Templeton Investments; and officer of 44 of the investment companies in Franklin Templeton | ||||
| Investments. | ||||
50 Annual Report
franklintempleton.com
FRANKLIN MUTUAL SHARES FUND
| Interested Board Members and Officers (continued) | ||||
| Number of Portfolios in | ||||
| Name, Year of Birth | Length of | Fund Complex Overseen | Other Directorships Held | |
| and Address | Position | Time Served | by Board Member* | During at Least the Past 5 Years |
| Craig S. Tyle (1960) | Vice | Since 2005 | Not Applicable | Not Applicable |
| One Franklin Parkway | President | |||
| San Mateo, CA 94403-1906 | ||||
| Principal Occupation During at Least the Past 5 Years: | ||||
| General Counsel and Executive Vice President, Franklin Resources, Inc.; and officer of some of the other subsidiaries of Franklin Resources, | ||||
| Inc. and of 44 of the investment companies in Franklin Templeton Investments. | ||||
| Lori A. Weber (1964) | Vice | Since 2011 | Not Applicable | Not Applicable |
| 300 S.E. 2nd Street | President | |||
| Fort Lauderdale, FL 33301-1923 | ||||
| Principal Occupation During at Least the Past 5 Years: | ||||
| Senior Associate General Counsel, Franklin Templeton Investments; Assistant Secretary, Franklin Resources, Inc.; Vice President and | ||||
| Secretary, Templeton Investment Counsel, LLC; and officer of 44 of the investment companies in Franklin Templeton Investments. | ||||
| *We base the number of portfolios on each separate series of the U.S. registered investment companies within the Franklin Templeton Investments fund complex. These | ||||
| portfolios have a common investment manager or affiliated investment managers. | ||||
| **Gregory E. Johnson is considered to be an interested person of the Fund under the federal securities laws due to his position as an officer and director of Franklin | ||||
| Resources, Inc., which is the parent company of the Fund’s investment manager and distributor. Peter A. Langerman is considered to be an interested person of the Fund | ||||
| under the federal securities laws due to his position as an officer of Franklin Mutual Advisers, LLC, which is an affiliate of the Fund’s investment manager. | ||||
| Note 1: Officer information is current as of the date of this report. It is possible that after this date, information about officers may change. | ||||
| The Fund’s Board has determined that certain of the members of the Audit Committee, including Ann Torre Bates, are audit committee financial experts, and | ||||
| “independent,” under those provisions of the Sarbanes-Oxley Act of 2002, and the rules and form amendments adopted by the Securities and Exchange | ||||
| Commission, relating to audit committee financial experts. | ||||
| The Statement of Additional Information (SAI) includes additional information about the board members and is available, without charge, upon request. | ||||
| Shareholders may call (800) DIAL BEN/342-5236 to request the SAI. | ||||
franklintempleton.com
Annual Report
51
FRANKLIN MUTUAL SHARES FUND
Shareholder Information
Proxy Voting Policies and Procedures
The Fund’s investment manager has established Proxy Voting Policies and Procedures (Policies) that the Fund uses to determine how to vote proxies relating to portfolio securities. Shareholders may view the Fund’s complete Policies online at franklintempleton.com. Alternatively, shareholders may request copies of the Policies free of charge by calling the Proxy Group collect at (954) 527-7678 or by sending a written request to: Franklin Templeton Companies, LLC, 300 S.E. 2nd Street, Fort Lauderdale, FL 33301, Attention: Proxy Group. Copies of the Fund’s proxy voting records are also made available online at franklintempleton.com and posted on the U.S. Securities and Exchange Commission’s website at sec.gov and reflect the most recent 12-month period ended June 30.
Quarterly Statement of Investments
The Fund files a complete statement of investments with the U.S. Securities and Exchange Commission for the first and third quarters for each fiscal year on Form N-Q. Shareholders may view the filed Form N-Q by visiting the Commission’s website at sec.gov. The filed form may also be viewed and copied at the Commission’s Public Reference Room in Washington, DC. Information regarding the operations of the Public Reference Room may be obtained by calling (800) SEC-0330.
Householding of Reports and Prospectuses
You will receive the Fund’s financial reports every six months as well as an annual updated summary prospectus (prospectus available upon request). To reduce Fund expenses, we try to identify related shareholders in a household and send only one copy of the financial reports and summary prospectus. This process, called “householding,” will continue indefinitely unless you instruct us otherwise. If you prefer not to have these documents householded, please call us at (800) 632-2301. At any time you may view current prospectuses/summary prospectuses and financial reports on our website. If you choose, you may receive these documents through electronic delivery.
52 Annual Report
franklintempleton.com
Item 2. Code of Ethics.
(a) The Registrant has adopted a code of ethics that applies to its principal executive officers and principal financial and accounting officer.
(c) N/A
(d) N/A
(f) Pursuant to Item 12(a)(1), the Registrant is attaching as an exhibit a copy of its code of ethics that applies to its principal executive officers and principal financial and accounting officer.
Item 3. Audit Committee Financial Expert.
(a)(1) The registrant has an audit committee financial expert serving on its audit committee.
(2) The audit committee financial expert is Ann Torre Bates, and she is “independent” as defined under the relevant Securities and Exchange Commission Rules and Releases.
Item 4. Principal Accountant Fees and Services.
(a) Audit Fees
The aggregate fees paid to the principal accountant for professional services rendered by the principal accountant for the audit of the registrant’s annual financial statements or for services that are normally provided by the principal accountant in connection with statutory and regulatory filings or engagements were $537,536 for the fiscal year ended December 31, 2015 and $535,460 for the fiscal year ended December 31, 2014.
(b) Audit-Related Fees
There were no fees paid to the principal accountant for assurance and related services rendered by the principal accountant to the registrant that are reasonably related to the performance of the audit of the registrant's financial statements and are not reported under paragraph (a) of Item 4.
There were no fees paid to the principal accountant for assurance and related services rendered by the principal accountant to the registrant's investment adviser and any entity controlling, controlled by or under common control with the investment adviser that provides ongoing services to the registrant that are reasonably related to the performance of the audit of their financial statements.
(c) Tax Fees
The aggregate fees paid to the principal accountant for professional services rendered by the principal accountant to the registrant for tax compliance, tax advice and tax planning were $2,918 the fiscal year ended December 31, 2015 and $6,022 for the fiscal year ended December 31, 2014. The services for which these fees were paid included identifying passive foreign investment company to manage exposure to tax liabilities.
The aggregate fees paid to the principal accountant for professional services rendered by the principal accountant to the registrant’s investment adviser and any entity controlling, controlled by or under common control with the investment adviser that provides ongoing services to the registrant for tax compliance, tax advice and tax planning were $82,835 for the fiscal year ended December 31, 2015 and $81,000 for the fiscal year ended December 31, 2014. The services for which these fees were paid included technical tax consultation for withholding tax report to foreign governments, application of local country tax laws and tax advice.
(d) All Other Fees
There were no fees paid to the principal accountant for products and services rendered by the principal accountant to the registrant not reported in paragraphs (a)-(c) of Item 4.
There were no fees paid to the principal accountant for products and services rendered by the principal accountant to the registrant’s investment adviser and any entity controlling, controlled by or under common control with the investment adviser that provides ongoing services to the registrant other than services reported in paragraphs (a)-(c) of Item 4.
(e) (1) The registrant’s audit committee is directly responsible for approving the services to be provided by the auditors, including:
(i) pre-approval of all audit and audit related services;
(ii) pre-approval of all non-audit related services to be provided to the Fund by the auditors;
(iii) pre-approval of all non-audit related services to be provided to the registrant by the auditors to the registrant’s investment adviser or to any entity that controls, is controlled by or is under common control with the registrant’s investment adviser and that provides ongoing services to the registrant where the non-audit services relate directly to the operations or financial reporting of the registrant; and
(iv) establishment by the audit committee, if deemed necessary or appropriate, as an alternative to committee pre-approval of services to be provided by the auditors, as required by paragraphs (ii) and (iii) above, of policies and procedures to permit such services to be pre-approved by other means, such as through establishment of guidelines or by action of a designated member or members of the committee; provided the policies and procedures are detailed as to the particular service and the committee is informed of each service and such policies and procedures do not include delegation of audit committee responsibilities, as contemplated under the Securities Exchange Act of 1934, to management; subject, in the case of (ii) through (iv), to any waivers, exceptions or exemptions that may be available under applicable law or rules.
(e) (2) None of the services provided to the registrant described in paragraphs (b)-(d) of Item 4 were approved by the audit committee pursuant to paragraph (c)(7)(i)(C) of Rule 2-01 of regulation S-X.
(f) No disclosures are required by this Item 4(f).
(g) The aggregate non-audit fees paid to the principal accountant for services rendered by the principal accountant to the registrant and the registrant’s investment adviser and any entity controlling, controlled by or under common control with the investment adviser that provides ongoing services to the registrant were $85,753 for the fiscal year ended December 31, 2015 and $87,022 for the fiscal year ended December 31, 2014.
(h) The registrant’s audit committee of the board has considered whether the provision of non-audit services that were rendered to the registrant’s investment adviser (not including any sub-adviser whose role is primarily portfolio management and is subcontracted with or overseen by another investment adviser), and any entity controlling, controlled by, or under common control with the investment adviser that provides ongoing services to the registrant that were not pre-approved pursuant to paragraph (c)(7)(ii) of Rule 2-01 of Regulation S-X is compatible with maintaining the principal accountant’s independence.
Item 5. Audit Committee of Listed Registrants. N/A
Item 6. Schedule of Investments. N/A
Item 7. Disclosure of Proxy Voting Policies and Procedures for
Closed-End Management Investment Companies. N/A
Item 8. Portfolio Managers of Closed-End Management Investment Companies. N/A
Item 9. Purchases of Equity Securities by Closed-End Management Investment Company and Affiliated Purchasers. N/A
Item 10. Submission of Matters to a Vote of Security Holders.
There have been no changes to the procedures by which shareholders may recommend nominees to the Registrant's board of trustees that would require disclosure herein.
Item 11. Controls and Procedures.
(a) Evaluation of Disclosure Controls and Procedures. The Registrant maintains disclosure controls and procedures that are designed to ensure that information required to be disclosed in the Registrant’s filings under the Securities Exchange Act of 1934 and the Investment Company Act of 1940 is recorded, processed, summarized and reported within the periods specified in the rules and forms of the Securities and Exchange Commission. Such information is accumulated and communicated to the Registrant’s management, including its principal executive officer and principal financial officer, as appropriate, to allow timely decisions regarding required disclosure. The Registrant’s management, including the principal executive officer and the principal financial officer, recognizes that any set of controls and procedures, no matter how well designed and operated, can provide only reasonable assurance of achieving the desired control objectives.
Within 90 days prior to the filing date of this Shareholder Report on Form N-CSR, the Registrant had carried out an evaluation, under the supervision and with the participation of the Registrant’s management, including the Registrant’s principal executive officer and the Registrant’s principal financial officer, of the effectiveness of the design and operation of the Registrant’s disclosure controls and procedures. Based on such evaluation, the Registrant’s principal executive officer and principal financial officer concluded that the Registrant’s disclosure controls and procedures are effective.
(b) Changes in Internal Controls. There have been no changes in the Registrant’s internal controls or in other factors that could materially affect the internal controls over financial reporting subsequent to the date of their evaluation in connection with the preparation of this Shareholder Report on Form N-CSR.
Item 12. Exhibits.
(a)(1) Code of Ethics
(a)(2) Certifications pursuant to Section 302 of the Sarbanes-Oxley Act of 2002 of Laura F. Fergerson, Chief Executive Officer - Finance and Administration, and Robert G. Kubilis, Chief Financial Officer and Chief Accounting Officer
(b) Certifications pursuant to Section 906 of the Sarbanes-Oxley Act of 2002 of Laura F. Fergerson, Chief Executive Officer - Finance and Administration, and Robert G. Kubilis, Chief Financial Officer and Chief Accounting Officer
SIGNATURES
Pursuant to the requirements of the Securities Exchange Act of 1934 and the Investment Company Act of 1940, the registrant has duly caused this report to be signed on its behalf by the undersigned, thereunto duly authorized.
FRANKLIN MUTUAL SERIES FUNDS
By /s/ Laura F. Fergerson
Laura F. Fergerson
Chief Executive Officer –
Finance and Administration
Date February 26, 2016
Pursuant to the requirements of the Securities Exchange Act of 1934 and the Investment Company Act of 1940, this report has been signed below by the following persons on behalf of the registrant and in the capacities and on the dates indicated.
By /s/ Laura F. Fergerson
Laura F. Fergerson
Chief Executive Officer –
Finance and Administration
Date February 26, 2016
By /s/ Robert G. Kubilis
Robert G. Kubilis
Chief Financial Officer and
Chief Accounting Officer
Date: February 26, 2016