UNITED STATES
SECURITIES AND EXCHANGE COMMISSION
Washington, DC 20549
FORMN-CSR
CERTIFIED SHAREHOLDER REPORT OF REGISTERED
MANAGEMENT INVESTMENT COMPANIES
Investment Company Act file number811-05387
Franklin Mutual Series Funds
(Exact name of registrant as specified in charter)
101 John F. Kennedy Parkway, Short Hills, NJ 07078-2705
(Address of principal executive offices) (Zip code)
Craig S. Tyle, One Franklin Parkway, San Mateo, CA 94403-1906
(Name and address of agent for service)
Registrant’s telephone number, including area code: (210)912-2100
Date of fiscal year end: 12/31
Date of reporting period: 12/31/18
| Item 1. | Reports to Stockholders. |
 | Annual Report and Shareholder Letter
December 31, 2018 |
Internet Delivery of Fund Reports Unless You Request Paper Copies:Effective January 1, 2021, as permitted by the SEC, paper copies of the Fund’s shareholder reports will no longer be sent by mail, unless you specifically request them from the Fund or your financial intermediary. Instead, the reports will be made available on a website, and you will be notified by mail each time a report is posted and provided with a website link to access the report.
If you already elected to receive shareholder reports electronically, you will not be affected by this change and you need not take any action. If you have not signed up for electronic delivery, we would encourage you to join fellow shareholders who have. You may elect to receive shareholder reports and other communications electronically from the Fund by calling (800)632-2301 or by contacting your financial intermediary.
You may elect to continue to receive paper copies of all your future shareholder reports free of charge by contacting your financial intermediary or, if you invest directly with a Fund, calling (800)632-2301 to let the Fund know of your request. Your election to receive reports in paper will apply to all funds held in your account.
Franklin Templeton
Successful investing begins with ambition. And achievement only comes when you reach for it. That’s why we continually strive to deliver better outcomes for investors. No matter what your goals are, our deep, global investment expertise allows us to offer solutions that can help.
During our more than 70 years of experience, we’ve managed through all kinds of markets—up, down and those in between. We’re always preparing for what may come next. It’s because of this, combined with our strength as one of the world’s largest asset managers that we’ve earned the trust of millions of investors around the world.
Dear Franklin Mutual Beacon Fund Shareholder:
Investors started 2018 seemingly with the wind at their back. The primary tailwinds were strong corporate earnings growth in most developed markets, healthy consumer and business investment spending, and the positive effect of major U.S. tax cuts. In addition, the global economy continued its steady expansion since the financial crisis of 2008–2009. Unemployment continued to decline in the U.S. and other developed markets, while U.S. wage growth showed some signs of accelerating. As a result, equity markets reached new highs in August and September. However, volatility and market downturns soon made their mark on 2018. As measured by the Chicago Board Options Exchange Volatility Index (VIX), 2017 was the least volatile year on record for the Standard & Poor’s 500® Index (S&P 500®), but the VIX surged in February to its highest level since the summer of 2015 and surged again in October and December. Heightened trade tensions between the U.S. and China, geopolitical events in Europe and a growing belief that corporate earnings and economic growth will likely decelerate in 2019 hindered equity markets. A flattening U.S. Treasury yield curve, wider credit spreads and growing market concern that the U.S. Federal Reserve may raise interest rates too aggressively were also important drivers of market turbulence. For the period ended December 31, 2018, U.S. stocks, as measured by the S&P 500, had a-4.38% total return.1 Stocks in global developed markets, as measured by the MSCI World Index, had a-8.20% total return, while investment-grade bonds, as measured by the Bloomberg Barclays U.S. Aggregate Bond Index, posted a +0.01% total return.1
While equity markets were broadly down for the year, there were pockets of positive performance concentrated in areas of growth and innovation, such as software, information technology services and segments of the health care sector. It is no surprise, therefore, that growth stocks managed to perform better than value stocks during the period. The Russell 1000® Growth Index had a-1.51% total return, while the Russell 1000® Value Index had a-8.27% total return.1
The return of volatility is an appropriate reminder that securities markets are dynamic. We believe active, professional investment management serves investors well since market volatility is more the norm than uninterrupted positive returns. Valuation is an essential factor in our analysis and we always ask ourselves if current and potential investments represent an attractive balance of risk and reward. We remain committed to abottom-up stock-picking process that is disciplined and driven by rigorous fundamental analysis that attempts to limit downside risk. In our view, investing in underappreciated and misunderstood companies with identifiable catalysts for unlocking shareholder value can offer significant upside potential as well as a degree of downside protection.
We also recognize the important role of financial advisors in today’s markets and encourage investors to continue to seek their advice. Amid changing markets and economic conditions, we are confident investors with a well-diversified portfolio and
1. Source: Morningstar. Frank Russell Company is the source and owner of the trademarks, service marks and copyrights related to the Russell Indexes. Russell® is a trademark of Frank Russell Company.
See www.franklintempletondatasources.com for additional data provider information.
| Not FDIC Insured | | | May Lose Value | | | No Bank Guarantee |
franklintempleton.com |
Not part of the annual report |
1 |
a patient, long-term outlook will be well positioned for the years ahead.
On the following pages, the Fund’s portfolio management team reviews investment decisions that pertain to performance during the past 12 months in light of the economic environment and other factors. Please remember all securities markets fluctuate, as do mutual fund share prices.
We thank you for investing with Franklin Templeton, welcome your questions and comments, and look forward to continuing to serve your investment needs in the years ahead.
Sincerely,

Peter A. Langerman
Chairman, President and Chief Executive Officer
Franklin Mutual Advisers, LLC
This letter reflects our analysis and opinions as of December 31, 2018, unless otherwise indicated. The information is not a complete analysis of every aspect of any market, country, industry, security or fund. Statements of fact are from sources considered reliable.
Visitfranklintempleton.comfor fund updates, to access your account, or to find helpful financial planning tools.
2 |
Not part of the annual report |
franklintempleton.com |
This annual report for Franklin Mutual Beacon Fund covers the fiscal year ended December 31, 2018.
Your Fund’s Goal and Main Investments
The Fund seeks capital appreciation, which may occasionally be short term, with income as a secondary goal. Under normal market conditions, the Fund invests primarily in equity securities of U.S. and foreign companies that the investment manager believes are available at market prices less than their intrinsic value. The equity securities in which the Fund invests are primarily common stock, with a current focus onmid- andlarge-cap companies. To a lesser extent, the Fund also invests in merger arbitrage securities and the debt and equity of distressed companies. The Fund may invest a substantial portion, potentially up to 100% of its assets, in foreign securities, which may include sovereign debt and participations in foreign government debt. The Geographic Composition bar chart on this page lists the leading countries where the Fund invests.
Performance Overview
The Fund’s Class Z shares had a-8.24% cumulative total return for the 12 months ended December 31, 2018. In comparison, the Fund’s benchmark, the MSCI World Index (USD), which tracks stock performance in global developed markets, had a-8.20% total return.1 You can find more of the Fund’s performance data in the Performance Summary beginning on page 10.
Performance data represent past performance, which does not guarantee future results. Investment return and principal value will fluctuate, and you may have a gain or loss when you sell your shares. Current performance may differ from figures shown. For most recentmonth-end performance, go tofranklintempleton.comor call(800)342-5236.
Economic and Market Overview
The global economy expanded during the 12 months under review, despite weakness in certain regions. Global developed and emerging market stocks were aided at certain points during
Geographic Composition*
Based on Total Net Assets as of 12/31/18
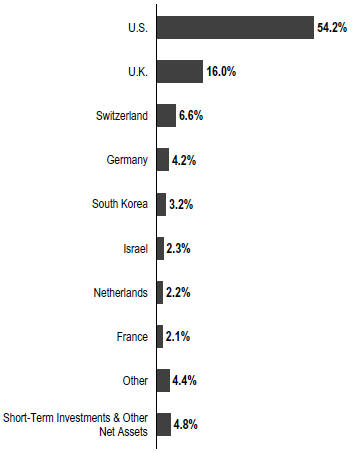
*Figures are stated as a percentage of total and may not equal 100% or may be negative due to rounding, use of any derivatives, unsettled trades or other factors. The Fund held 41.0% of total net assets in foreign securities.
the period by higher crude oil prices, upbeat economic data, easing trade tensions and encouraging corporate earnings reports, as well as indications of a slower pace of interest-rate increases from the U.S. Federal Reserve (Fed).
However, various factors weighed on global markets during the period, including concerns about tighter regulation of technology companies, political uncertainties in the U.S. and the European Union, and major central banks’ interest-rate path and unwinding of monetary stimulus measures. Markets were further pressured by U.S. trade disputes with its allies and China, and their impact on global growth and corporate
1. Source: Morningstar.
The index is unmanaged and includes reinvestment of any income or distributions. It does not reflect any fees, expenses or sales charges. One cannot invest directly in an index, and an index is not representative of the Fund’s portfolio.
The dollar value, number of shares or principal amount, and names of all portfolio holdings are listed in the Fund’s Statement of Investments (SOI). The SOI begins on page 19.
franklintempleton.com |
Annual Report |
3 |
FRANKLIN MUTUAL BEACON FUND
earnings. In this environment, global stocks, as measured by the MSCI All Country World Index, had a-8.93% total return for the 12 months ended December 31, 2018.1
The U.S. economy grew during the12-month period. After moderating for three consecutive quarters, the economy grew faster in 2018’s second quarter, driven by consumer spending, business investment, exports and government spending. However, growth moderated in the third quarter due to declines in exports and housing investment. The unemployment rate declined from 4.1% in December 2017 to 3.9% atperiod-end.2 Annual inflation, as measured by the Consumer Price Index, decreased from 2.1% in December 2017 to 1.9% atperiod-end.2 The Fed raised its target range for the federal funds rate four times during the period, to 2.25%–2.50%, and continued reducing its balance sheet as part of an ongoing plan to normalize monetary policy. At its December meeting, the Fed reduced the projected 2019 rate increases to two, compared to three projected previously.
In Europe, the U.K.’s quarterly economic growth moderated in 2018’s first quarter, but accelerated in 2018’s second and third quarters. The Bank of England raised its key policy rate once during the review period. After moderating in 2018’s first quarter, the eurozone’s quarterly growth remained stable in the second quarter, but eased in the third quarter. The bloc’s annual inflation rate ended the period higher than in December 2017. The European Central Bank (ECB) kept its benchmark interest rate unchanged during the period. In December 2018, the ECB confirmed its plan to conclude its bond purchase program at the end of 2018 and reiterated it expects key interest rates to remain unchanged through the summer of 2019.
In Asia, Japan’s quarterly gross domestic product (GDP) grew in 2018’s second quarter, following a contraction in the first quarter, but contracted again in the third quarter. The Bank of Japan left its benchmark interest rate unchanged during the period and continued its monetary stimulus measures.
In emerging markets, Brazil’s quarterly GDP growth remained stable in 2018’s first and second quarters, but accelerated in the third quarter. The Central Bank of Brazil lowered its benchmark interest rate twice during the period. Russia’s annual GDP growth rate accelerated in 2018’s first and second quarters, but moderated in the third quarter. After lowering its key rate twice early in the period, the Bank of Russia raised it twice in the period’s second half to curtail inflation risks. China’s annual GDP grew at a stable rate in 2018’s first
quarter, but it moderated in the second and third quarters. The People’s Bank of China left its benchmark interest rate unchanged during the period, but it took measures to improve financial liquidity to mitigate the negative effects of the U.S.-China trade dispute and support economic growth. Overall, emerging market stocks, as measured by the MSCI Emerging Markets Index, had a-14.25% total return during the period.1
Investment Strategy
At Franklin Mutual Series, we are committed to our distinctive value approach to investing, which we believe can generate above-average risk-adjusted returns over time for our shareholders. Our major investment strategy is investing in undervalued stocks. When selecting undervalued equities, we are attracted to what we believe are fundamentally strong companies with healthy balance sheets, high-quality assets, substantial free cash flow and shareholder-oriented management teams and whose stocks are trading at discounts to our assessment of the companies’ intrinsic or business value. We also look for asset-rich companies whose shares may be trading at depressed levels due to concerns over short-term earnings disappointments, litigation, management strategy or other perceived negatives. This strict value approach is not only intended to improve the likelihood of upside potential, but also reduces the risk of substantial declines, in our opinion. While the vast majority of our undervalued equity investments are made in publicly traded companies globally, we may invest occasionally in privately held companies as well.
To a lesser extent, we complement this more traditional investment strategy with two others. One is distressed investing, a highly specialized field that has proven quite profitable during certain periods over the years. Distressed investing is complex and can take many forms. The most common distressed investment the Fund undertakes is the purchase of financially troubled or bankrupt companies’ debt at a substantial discount to face value. After the financially distressed company is reorganized, often in bankruptcy court, the old debt is typically replaced with new securities issued by the financially stronger company.
The other piece of our investment strategy is participating in arbitrage situations, another highly specialized field. When companies announce proposed mergers or takeovers, commonly referred to as “deals,” the target company may trade at a discount to the bid it ultimately accepts. One form of
2. Source: U.S. Bureau of Labor Statistics.
4 |
Annual Report |
franklintempleton.com |
FRANKLIN MUTUAL BEACON FUND
arbitrage involves purchasing the target company’s stock when it is trading below the value we believe it would receive in a deal. In keeping with our commitment to a relatively conservative investment approach, we typically focus our arbitrage efforts on announced deals, and avoid rumored deals or other situations we consider relatively risky. In addition, it is our practice to hedge the Fund’s currency exposure when we deem it advantageous for our shareholders.
What is meant by “hedge”?
To hedge an investment is to take a position intended to offset potential losses/gains that may be incurred by a companion financial instrument.
Manager’s Discussion
In 2018, corporate profits in the U.S. and other developed markets continued their impressive year-over-year growth. In addition, labor markets showed further improvement, consumer spending was solid, and U.S. corporate tax reforms encouraged companies to buy back more stock, raise dividends and increase capital expenditures. Those positive fundamentals were periodically overshadowed by political and economic concerns, particularly in the final three months of the year.
As major U.S. equity markets established newall-time highs in 2018, overall U.S. equity market valuations (e.g.,price-to-earnings,price-to-book orprice-to-sales) became increasingly unattractive, in our analysis. The equity marketsell-off in the fourth quarter helped to return valuations to more reasonable levels. Thesell-off and rise in volatility yielded an opportunity for us to seek out stocks with strong corporate fundamentals and valuations whose risk/reward profiles seemed to us to have become more favorable.
In 2019, policy events may have considerable influence, for better or worse, on economic growth, investor sentiment and financial market performance and volatility. Markets are likely to be particularly sensitive to developments in U.S.-China trade relations, monetary policy moves by the Fed and other major central banks, oil production decisions by OPEC (The Organization of the Petroleum Exporting Countries) and other oil producing countries, the outcome of Brexit, China’s response to its slowing economy and potential political discord in Washington, D.C.
Europe’s equity market overall was trading at an attractively lowerprice-to-earnings multiple and higher dividend yield than the U.S. equity market atperiod-end. We also saw an increase in investor activism, which we viewed as encouraging. However, those favorable factors were offset in part by
Top 10 Sectors/Industries
Based on Equity Securities as of 12/31/18
| % of Total Net Assets | ||||
Pharmaceuticals | 12.4% | |||
Banks | 8.8% | |||
Media | 6.1% | |||
Oil, Gas & Consumable Fuels | 5.7% | |||
Technology Hardware, Storage & Peripherals | 5.1% | |||
Software | 5.1% | |||
Insurance | 4.5% | |||
Health Care Equipment & Supplies | 4.3% | |||
Hotels, Restaurants & Leisure | 3.9% | |||
Entertainment | 3.3% | |||
economic data, which showed increased slowing of economic activity across the region. From an investment standpoint, we are hopeful that 2019 will be a year of potential resolution and clarity. The biggest political event will likely be Brexit, as a resolution to the situation remained unclear as ofperiod-end. The uncertainty around the terms and timing of a deal continued to undermine consumer and corporate confidence. From our perspective, we believe the European Union and the U.K. will ultimately reach an agreement that makes sense for both sides, and we believe the approval of such an agreement would likely have a significantly positive effect on investor, consumer and corporate sentiment in the U.K. We will also pay close attention to structural reform efforts in France and the political transition in Germany. In December, Chancellor Angela Merkel stepped down as leader of the Christian Democratic Union but stated her intention to remain in office for the remaining three years of her term as Chancellor.
In Asia, economic and financial market weakness in China has been brought on by multiple factors. The U.S.-China trade conflict has disrupted manufacturing activity and supply chains. As trade tensions escalated in 2018, manufacturers accelerated production to avoid upcoming tariffs. Atyear-end, supply chains were filled with inventory, while manufacturing activity was weak. Entering 2019, the near-term question is how long the inventory overhang will last, while the more significant question is to what extent the trade conflict will alter supply chains in the medium to long term. Amid the trade conflict, China has proven resolute in its attempt to dampen the reliance on leverage, which has weighed on economic activity as well. While the government has enacted some stimulus measures, such as tax cuts, they may be less impactful than prior stimulus through fiscal spending. Meanwhile, government social policies impacting personal freedoms have had a negative effect on consumer sentiment.
franklintempleton.com |
Annual Report |
5 |
FRANKLIN MUTUAL BEACON FUND
Investment Spotlight
In all market environments, we seek to invest prudently in securities that we believe represent good value. We do this by seeking securities that trade at a discount to our estimate of intrinsic value, taking into account the quality of the asset, the sustainability of returns, and the growth potential of the business. We also believe the potential to deliver the best risk-adjusted return over a full market cycle requires us to be focused on applying our cross-asset approach: owning equities and debt—in certain cases multiple securities across the capital structure of a company—across geographies and sectors with an emphasis on corporate actions as catalysts. Our health care sector positions are a good example of our investment process. They have been carefully selected over a number of years, and in 2018, many of our long-standing sector investments appreciated significantly. Collectively our sector exposure outperformed the health care sector within the MSCI World Index.
Within the health care sector, our investment process has generally been focused on finding innovative companies that are market leaders and that invest substantial amounts of capital into research and development (R&D) as a means to sustain and grow market positions. In addition, many of our positions have been in diversified pharmaceutical companies that also have long-duration cash flows through their leading positions in animal health, vaccine, andover-the-counter medicine businesses. These businesses can offer downside protection in years when pharmaceutical R&D is less successful or in years when important products lose patent protection. These businesses are attractive and have been undervalued by the market. This undervaluation allowed us to build positions, and in 2018, some of this undervaluation was reversed.
Eli Lilly and Merck are quintessential examples of our investment process. They are leading innovation-driven pharmaceutical companies that invest substantial amounts of capital into R&D to develop transformative medicines. Both companies have introduced innovative new products in the past many years like Trulicity for diabetes and Keytruda for oncology that we believe will continue to offer substantial long-term revenue growth. The management teams at both companies take a long-term view and focus on enhancing their market positions through both internal and external innovation. Acquiring late stage innovation can be expensive, which is why Lilly and Merck take a prudent approach to generally focusing
on early stage assets. Competition is typically less intense for early stage assets, and they can add value through their own development process and pass along that value to shareholders. Shareholder focus also comes through at both companies by their return of excess capital to shareholders through large dividends and share buybacks.
In our view, both companies also have strong, long-duration assets. Lilly and Merck are the fourth and third largest players in animal health, respectively. In September 2018, Lilly sold some shares of Elanco3, its animal health division, through an initial public offering to create additional shareholder value, while Merck started providing segment level profit disclosures so investors could better appreciate the contribution and value of their animal health business. Merck is also the second largest player in vaccines, a highly attractive business that is underappreciated, in our opinion.
Another common feature between Lilly and Merck is their strong balance sheets. Both companies also generate substantial amounts of free cash flows, with a significant proportion returned to shareholders in the form of dividends and share buybacks. In addition, the two companies are focused on managing their business more efficiently and improving their operating margins, which we believe will lead to additional earnings growth over the next several years. The Top 10 Sectors/Industries table on page 5 lists pharmaceuticals and also other leading industries in which the Fund currently invests.
Mergers and Acquisitions
In health care and elsewhere, merger and acquisition (M&A) activity remained healthy in 2018. The market received some clarity regarding the regulatory environment when a federal judge ruled in favor of AT&T4 and Time Warner3, and against the U.S. Department of Justice, in its antitrust lawsuit. However, economic, financial market and geopolitical uncertainty that arose in the second half of the year caused the pace of activity to slow. In our view, it was notable that health care has become one of the busier sectors for M&A as it is relatively more insulated from economic uncertainty. The strength and path of M&A activity in 2019 will likely depend in large part on how the uncertainties carrying over from 2018 play out and how they affect equity markets. From our
3. Not a Fund holding.
4. Not held atperiod-end.
See www.franklintempletondatasources.com for additional data provider information.
6 |
Annual Report |
franklintempleton.com |
FRANKLIN MUTUAL BEACON FUND
experience, ups and downs in equity market performance and levels of deal activity have tended to move in a similar direction.
Credit Markets
Finding mispriced risk in credit markets was challenging in 2018. Low interest rates kept credit widely available, default rates remained at historically low levels and we continued to witness a loosening in debt covenant terms, which include restrictions on financial activities by the borrower or parameters for specific financial metrics. Liberal interpretations of credit agreements and bond indentures in order to shift valuable assets beyond the reach of creditors were an ongoing challenge. In such an environment, we found more opportunities investing in short-term mispriced risk rather than long-term restructurings.
However, we are hopeful that more opportunities may emerge in 2019, especially if we are starting to enter latter stages of the business cycle. U.S. monetary policy is becoming less accommodative, economic growth appears to be downshifting into a slower pace, earnings growth is set to slow, and geopolitical uncertainty is on the rise. These dynamics have already contributed to a general rise in financial market volatility. At the same time, the amount of lower-rated investment-grade credit stands at a historically high level on an absolute basis and relative to corporate debt markets overall. We believe default rates and the pace of corporate downgrades could begin to pick up in 2019. As a result, 2019 could bring a rise in fallen-angel opportunities (bonds downgraded from investment-grade to junk status) and idiosyncratic opportunities inout-of-favor industries. We will continue to look for opportunities across the capital structures of companies with liquidity-enhancing events, such as asset sales, the ability to issue secured debt within existing agreements, and free cash flow that could buy time for a company to weather its financial storm.
Fund Performance
Turning to Fund performance, top positive contributors included U.S.-based pharmaceutical company Eli Lilly, global research-driven pharmaceutical company Merck and U.K.-basedpay-TV provider Sky4.
Shares of Eli Lilly were boosted in large part by a series of strong quarterly results during 2018. Attractive corporate fundamentals and fewer investor concerns regarding the direct impact on the pharmaceutical industry from the Trump administration’s efforts to lower prescription drug prices helped push the stock higher. We believe Eli Lilly continues to have a
Top 10 Equity Holdings
12/31/18
Company Sector/Industry, Country | % of Total Net Assets | |||
Novartis AG | 4.6% | |||
Pharmaceuticals, Switzerland | ||||
Medtronic PLC | 4.3% | |||
Health Care Equipment & Supplies, U.S. | ||||
GlaxoSmithKline PLC | 3.3% | |||
Pharmaceuticals, U.K. | ||||
The Walt Disney Co. | 3.3% | |||
Entertainment, U.S. | ||||
Sensata Technologies Holding PLC | 3.3% | |||
Electrical Equipment, U.S. | ||||
Samsung Electronics Co. Ltd. | 3.2% | |||
Technology Hardware, Storage & Peripherals, South Korea | ||||
Standard Chartered PLC | 3.2% | |||
Banks, U.K. | ||||
Cognizant Technology Solutions Corp. | 3.1% | |||
IT Services, U.S. | ||||
Wells Fargo & Co. | 3.0% | |||
Banks, U.S. | ||||
British American Tobacco PLC | 2.8% | |||
Tobacco, U.K. | ||||
strong product growth story and room for further margin expansion, in addition to having solid research and development capabilities.
Merck is a global research-driven pharmaceutical company with strong market positions in oncology, diabetes, vaccines and animal health. Investors remained upbeat about its future prospects, particularly its Keytruda oncology drug. Merck released clinical trial results, which showed that for the first-line treatment of metastatic nonsquamousnon-small lung cancer patients, Keytruda combined with chemotherapy substantially extended survival of patients compared with chemotherapy alone. The Keytruda results set a high bar for competition and appeared to enhance Keytruda’s prospects to gain share in the sizeable market for lung cancer treatment. Results from a competitor, Bristol-Myers Squibb3, were less compelling in a different clinical trial in lung cancer. In October 2018, Merck raised its dividend and authorized a new large share buyback plan.
In February 2018, shares of Sky jumped when U.S.-based cable company Comcast4 made a surprise bid for the company. The Comcast bid was considerably higher than a prior bid by Twenty-First Century Fox4, which already owned a substantial portion of Sky. In July 2018, Twenty-First Century Fox raised its bid for Sky, but Comcast promptly offered a higher
franklintempleton.com |
Annual Report |
7 |
FRANKLIN MUTUAL BEACON FUND
counter-bid. The stock rose again in September 2018 when The Panel on Takeovers and Mergers in the U.K. announced that Comcast had won the mandatory auction for Sky, and Twenty-First Century Fox subsequently agreed to sell its stake of Sky to Comcast. The acquisition of Sky was officially completed in October 2018.
During the period under review, Fund investments that detracted from performance included U.K.-based British American Tobacco, U.S.-based industrials company General Electric (GE) and U.S.-based insurer American International Group (AIG). British American Tobacco is listed among the Fund’s largest positions in the Top 10 Equity Holdings table on page 7.
Shares of British American Tobacco faced downward pressure due to potential additional U.S. regulation and concerns regarding next generation products. In March 2018, the U.S. Food and Drug Administration (FDA) issued an Advance Notice of Proposed Rulemaking, which started the process of examining the possibility of regulating nicotine levels in combustible cigarettes. The process may not result in regulation, but if it does, many experts believe the review could take seven to 10 years. Meanwhile, JUUL, produced by JUUL Labs3, has emerged as a popular e-cigarette for young U.S. consumers. It is unclear to what degree JUUL is cannibalizing the combustible market, but it has hurt investor sentiment toward the industry. In November, shares of British American Tobacco and industry peers dropped, as the FDA revisited the possibility of banning menthol as a flavor in cigarettes, which would take years with many steps to complete, and in our opinion, an FDA proposal would face litigation from the industry. Industry experts have suggested that it might not survive legal challenges.
GE is a multi-industrial company with a diverse set of businesses in power generation, health care and aviation. During 2018, the stock suffered a number of setbacks starting in January with a greater-than-expected charge related to long-term care policies in its insurance subsidiary. In June, the stock was removed from the Dow Jones Industrial Average and in September, GE stated that fan blades in some of its power-plant turbines were experiencing oxidation problems. In October, S&P Global Ratings, a bond rating agency, cut GE’s debt rating, while GE cut its dividend and stated that the Securities and Exchange Commission was expanding an ongoing investigation to include an accounting write-down related to its power-generation division. Amid the negative events in 2018, management took the first steps in what amounts to a breakup of GE, announcing in May 2018 the merger of its transportation operations into Wabtec3 and plans
tospin-off its health care division and divest its stake inoil-services firm Baker Hughes3. In October 2018, GE unexpectedly replaced chief executive officer (CEO) John Flannery, who spent his entire career at GE, with Larry Culp, a former CEO of Danaher3, an industrial company. We believe Culp made some prudent initial moves, and that his plan to reduce debt and strengthen GE’s balance sheet is a step in the right direction to restoring investor confidence in the company.
Shares of AIG slipped in early 2018 as investors reacted negatively to the price AIG paid to acquire Validus Holdings3, a provider of insurance and reinsurance products. The acquisition price represented a significant premium to Validus’ stock price immediately prior to the announcement. However, we believe the acquisition made strategic sense as Validus gives AIG a complementary group of profitable insurance and reinsurance businesses. The stock price slipped further in October 2018, due to larger-than-expected catastrophe-related losses announced ahead of quarterly results. The losses were due to multiple typhoons in Japan, Hurricane Florence and wildfires in California. Investors tend to look beyond uncharacteristic weather-related losses. However, we believe AIG’s series of operating challenges and negative surprises in prior years, such as additional commercial reserves and increases in loss estimates on current business, likely factored into the stock’s significant decline.
During the period, the Fund held currency forwards and futures seeking to hedge most of the currency risk of the portfolio’snon-U.S. dollar investments. The hedges had a positive overall impact on the Fund’s performance because of the appreciation of the U.S. dollar versus the hedged currencies.
What is a currency forward?
A currency forward is a direct agreement between the Fund and a counterparty to buy or sell a foreign currency in exchange for another currency at a specific exchange rate on a future date.
What is a future?
A future is an agreement between the Fund and a counterparty made through a U.S. or foreign futures exchange to buy or sell an underlying instrument or asset at a specific price on a future date.
As fellow shareholders, we found recent relative and absolute performance disappointing, but it is not uncommon for our strategy to lag the equity markets at times. We remain committed to our disciplined, value investment approach as we seek to generate attractive, long-term, risk-adjusted returns for shareholders.
8 |
Annual Report |
franklintempleton.com |
FRANKLIN MUTUAL BEACON FUND
Thank you for your participation in Franklin Mutual Beacon Fund. We look forward to continuing to serve your investment needs.
 |
Christian Correa, CFA Co-Portfolio Manager | |
 |
Mandana Hormozi Co-Portfolio Manager | |
 |
Aman Gupta, CFA Co-Portfolio Manager | |


The foregoing information reflects our analysis, opinions and portfolio holdings as of December 31, 2018, the end of the reporting period. The way we implement our main investment strategies and the resulting portfolio holdings may change depending on factors such as market and economic conditions. These opinions may not be relied upon as investment advice or an offer for a particular security. The information is not a complete analysis of every aspect of any market, country, industry, security or the Fund. Statements of fact are from sources considered reliable, but the investment manager makes no representation or warranty as to their completeness or accuracy. Although historical performance is no guarantee of future results, these insights may help you understand our investment management philosophy.
CFA® is a trademark owned by CFA Institute.
franklintempleton.com |
Annual Report |
9 |
FRANKLIN MUTUAL BEACON FUND
Performance Summary as of December 31, 2018
The performance table and graphs do not reflect any taxes that a shareholder would pay on Fund dividends, capital gain distributions, if any, or any realized gains on the sale of Fund shares. Total return reflects reinvestment of the Fund’s dividends and capital gain distributions, if any, and any unrealized gains or losses. Your dividend income will vary depending on dividends or interest paid by securities in the Fund’s portfolio, adjusted for operating expenses of each class. Capital gain distributions are net profits realized from the sale of portfolio securities.
Performance as of 12/31/18
Cumulative total return excludes sales charges. Average annual total return includes maximum sales charges. Sales charges will vary depending on the size of the investment and the class of share purchased. The maximum is 5.50% and the minimum is 0%.Class A:5.50% maximum initial sales charge. For other share classes, visitfranklintempleton.com.
| Share Class | | Cumulative Total Return1 |
| | Average Annual Total Return2 |
| ||
Z | ||||||||
1-Year | -8.24% | -8.24% | ||||||
5-Year | +24.81% | +4.53% | ||||||
10-Year | +164.78% | +10.23% | ||||||
A3 | ||||||||
1-Year | -8.49% | -13.53% | ||||||
5-Year | +23.16% | +3.08% | ||||||
10-Year | +157.09% | +9.29% | ||||||
Performance data represent past performance, which does not guarantee future results. Investment return and principal value will fluctuate, and you may have a gain or loss when you sell your shares. Current performance may differ from figures shown. For most recentmonth-end performance, go tofranklintempleton.comor call(800)342-5236.
See page 12 for Performance Summary footnotes.
10 |
Annual Report |
franklintempleton.com |
FRANKLIN MUTUAL BEACON FUND
PERFORMANCE SUMMARY
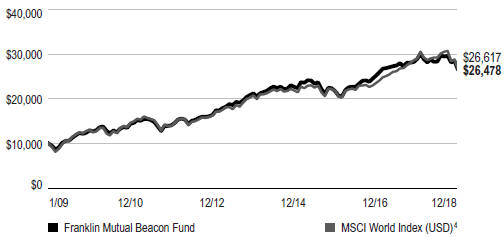
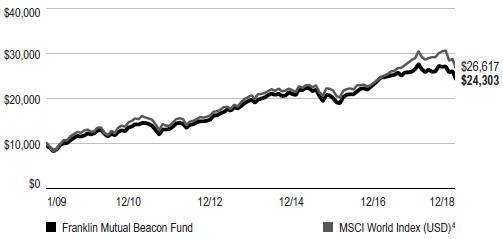
Total Return Index Comparison for a Hypothetical $10,000 Investment
Total return represents the change in value of an investment over the periods shown. It includes any applicable maximum sales charge, Fund expenses, account fees and reinvested distributions. The unmanaged index includes reinvestment of any income or distributions. It differs from the Fund in composition and does not pay management fees or expenses. One cannot invest directly in an index.
Class Z (1/1/09–12/31/18)
Class A(1/1/09–12/31/18)
See page 12 for Performance Summary footnotes.
franklintempleton.com |
Annual Report |
11 |
FRANKLIN MUTUAL BEACON FUND
PERFORMANCE SUMMARY
Distributions(1/1/18–12/31/18)
| Share Class | Net Investment Income | Long-Term Capital Gain | Total | |||||||||
Z | $0.3098 | $1.1480 | $1.4578 | |||||||||
A | $0.2717 | $1.1480 | $1.4197 | |||||||||
C | $0.0151 | $1.1480 | $1.1631 | |||||||||
R | $0.2313 | $1.1480 | $1.3793 | |||||||||
R6 | $0.3208 | $1.1480 | $1.4688 | |||||||||
Total Annual Operating Expenses5
| Share Class | ||||
Z | 0.78 | % | ||
A | 1.03 | % | ||
Each class of shares is available to certain eligible investors and has different annual fees and expenses, as described in the prospectus.
All investments involve risks, including possible loss of principal. Value securities may not increase in price as anticipated or may decline further in value. Special risks are associated with foreign investing, including currency fluctuations, economic instability and political developments. Because the Fund may invest its assets in companies in a specific region, including Europe, it is subject to greater risks of adverse developments in that region and/or the surrounding regions than a fund that is more broadly diversified geographically. Current political and financial uncertainty surrounding the European Union may increase market volatility and the economic risk of investing in companies in Europe. Smaller-company stocks have exhibited greater price volatility than larger-company stocks, particularly over the short term. The Fund’s investments in companies engaged in mergers, reorganizations or liquidations also involve special risks as pending deals may not be completed on time or on favorable terms. The Fund may invest in lower-rated bonds, which entail higher credit risk. The Fund is actively managed but there is no guarantee that the manager’s investment decisions will produce the desired results. The Fund’s prospectus also includes a description of the main investment risks.
1. Cumulative total return represents the change in value of an investment over the periods indicated.
2. Average annual total return represents the average annual change in value of an investment over the periods indicated. Return for less than one year, if any, has not been annualized.
3. Prior to 9/10/18, these shares were offered at a higher initial sales charge of 5.75%, thus actual returns would have differed. Total returns with sales charges have been restated to reflect the current maximum initial sales charge of 5.50%.
4. Source: Morningstar. The MSCI World Index (USD) is a free float-adjusted, market capitalization-weighted index designed to measure equity market performance in global developed markets.
5. Figures are as stated in the Fund’s current prospectus and may differ from the expense ratios disclosed in the Your Fund’s Expenses and Financial Highlights sections in this report. In periods of market volatility, assets may decline significantly, causing total annual Fund operating expenses to become higher than the figures shown.
See www.franklintempletondatasources.com for additional data provider information.
12 |
Annual Report |
franklintempleton.com |
FRANKLIN MUTUAL BEACON FUND
As a Fund shareholder, you can incur two types of costs: (1) transaction costs, including sales charges (loads) on Fund purchases and redemptions; and (2) ongoing Fund costs, including management fees, distribution and service(12b-1) fees, and other Fund expenses. All mutual funds have ongoing costs, sometimes referred to as operating expenses. The table below shows ongoing costs of investing in the Fund and can help you understand these costs and compare them with those of other mutual funds. The table assumes a $1,000 investment held for the six months indicated.
Actual Fund Expenses
The table below provides information about actual account values and actual expenses in the columns under the heading “Actual.” In these columns the Fund’s actual return, which includes the effect of Fund expenses, is used to calculate the “Ending Account Value” for each class of shares. You can estimate the expenses you paid during the period by following these steps (ofcourse, your account value and expenses will differ from those in this illustration):Divide your account value by $1,000 (ifyour account had an $8,600 value, then $8,600 ÷ $1,000 = 8.6).Then multiply the result by the number in the row for your class of shares under the headings “Actual” and “Expenses Paid During Period” (if Actual Expenses Paid During Period were $7.50, then 8.6 x $7.50 = $64.50). In this illustration, the actual expenses paid this period are $64.50.
Hypothetical Example for Comparison with Other Funds
Under the heading “Hypothetical” in the table, information is provided about hypothetical account values and hypothetical expenses based on the Fund’s actual expense ratio and an assumed rate of return of 5% per year before expenses, which is not the Fund’s actual return. This information may not be used to estimate the actual ending account balance or expenses you paid for the period, but it can help you compare ongoing costs of investing in the Fund with those of other funds. To do so, compare this 5% hypothetical example for the class of shares you hold with the 5% hypothetical examples that appear in the shareholder reports of other funds.
Please note that expenses shown in the table are meant to highlight ongoing costs and do not reflect any transactional costs. Therefore, information under the heading “Hypothetical” is useful in comparing ongoing costs only, and will not help you compare total costs of owning different funds. In addition, if transactional costs were included, your total costs would have been higher.
Actual (actual return after expenses) | Hypothetical (5% annual return before expenses) | |||||||||||||||||
| Share Class | Beginning Account Value 7/1/18 | Ending Account Value 12/31/18 | Expenses Paid During Period 7/1/18–12/31/181,2 | Ending Account Value 12/31/18 | Expenses Paid During Period 7/1/18–12/31/181,2 | Net Annualized Expense | ||||||||||||
| Z | $1,000 | $935.10 | $3.80 | $1,021.27 | $3.97 | 0.78% | ||||||||||||
| A | $1,000 | $933.80 | $5.02 | $1,020.01 | $5.24 | 1.03% | ||||||||||||
| C | $1,000 | $930.30 | $8.66 | $1,016.23 | $9.05 | 1.78% | ||||||||||||
| R | $1,000 | $932.90 | $6.24 | $1,018.75 | $6.51 | 1.28% | ||||||||||||
| R6 | $1,000 | $935.10 | $3.51 | $1,021.58 | $3.67 | 0.72% | ||||||||||||
1. Expenses are equal to the annualized expense ratio for thesix-month period as indicated above—in the far right column—multiplied by the simple average account value over the period indicated, and then multiplied by 184/365 to reflect theone-half year period.
2. Reflects expenses after fee waivers and expense reimbursements. Does not include acquired fund fees and expenses.
franklintempleton.com |
Annual Report |
13 |
FRANKLIN MUTUAL BEACON FUND
| Year Ended December 31, | ||||||||||||||||||||
| 2018 | 2017 | 2016 | 2015 | 2014 | ||||||||||||||||
Class Z | ||||||||||||||||||||
| Per share operating performance | ||||||||||||||||||||
(for a share outstanding throughout the year) | ||||||||||||||||||||
Net asset value, beginning of year | $16.61 | $15.30 | $14.30 | $16.59 | $16.91 | |||||||||||||||
Income from investment operationsa: | ||||||||||||||||||||
Net investment incomeb | 0.29 | 0.29 | 0.37 | c | 0.29 | 0.54d | ||||||||||||||
Net realized and unrealized gains (losses) | (1.68 | ) | 1.90 | 1.93 | (0.99 | ) | 0.62 | |||||||||||||
Total from investment operations | (1.39 | ) | 2.19 | 2.30 | (0.70 | ) | 1.16 | |||||||||||||
Less distributions from: | ||||||||||||||||||||
Net investment income | (0.31 | ) | (0.31 | ) | (0.37 | ) | (0.37 | ) | (0.69) | |||||||||||
Net realized gains | (1.15 | ) | (0.57 | ) | (0.93 | ) | (1.22 | ) | (0.79) | |||||||||||
Total distributions | (1.46 | ) | (0.88 | ) | (1.30 | ) | (1.59 | ) | (1.48) | |||||||||||
Net asset value, end of year | $13.76 | $16.61 | $15.30 | $14.30 | $16.59 | |||||||||||||||
Total return | (8.24)% | 14.39% | 16.11% | (4.14)% | 6.82% | |||||||||||||||
Ratios to average net assets | ||||||||||||||||||||
Expensese,f | 0.80% | g | 0.78% | 0.80% | 0.84% | g | 0.83% | |||||||||||||
Expenses incurred in connection with securities sold short | 0.01% | —% | 0.01% | 0.04% | 0.04% | |||||||||||||||
Net investment income | 1.77% | 1.78% | 2.48% | c | 1.73% | 3.14%d | ||||||||||||||
| Supplemental data | ||||||||||||||||||||
Net assets, end of year (000’s) | $2,271,217 | $2,700,327 | $2,564,120 | $2,420,165 | $2,774,929 | |||||||||||||||
Portfolio turnover rate | 47.20% | 24.80% | 30.94% | 35.80% | 40.06% | |||||||||||||||
aThe amount shown for a share outstanding throughout the period may not correlate with the Statement of Operations for the period due to the timing of sales and repurchases of the Fund’s shares in relation to income earned and/or fluctuating fair value of the investments of the Fund.
bBased on average daily shares outstanding.
cNet investment income per share includes approximately $0.10 per share related to income received in the form of special dividends in connection with certain Fund holdings. Excluding this amount, the ratio of net investment income to average net assets would have been 1.81%.
dNet investment income per share includes approximately $0.24 per share related to income received in the form of a special dividend in connection with certain Fund holdings. Excluding this amount, the ratio of net investment income to average net assets would have been 1.74%.
eIncludes dividend and/or interest expense on securities sold short and security borrowing fees, if any. See below for the ratios of such expenses to average net assets for the periods presented. See Note 1(d).
fBenefit of expense reduction rounds to less than 0.01%.
gBenefit of waiver and payments by affiliates rounds to less than 0.01%.
14 |
Annual Report | The accompanying notes are an integral part of these financial statements. |
franklintempleton.com |
FRANKLIN MUTUAL BEACON FUND
FINANCIAL HIGHLIGHTS
| Year Ended December 31, | ||||||||||||||||||||
| 2018 | 2017 | 2016 | 2015 | 2014 | ||||||||||||||||
Class A | ||||||||||||||||||||
| Per share operating performance | ||||||||||||||||||||
(for a share outstanding throughout the year) | ||||||||||||||||||||
Net asset value, beginning of year | $16.47 | $15.18 | $14.20 | $16.47 | $16.80 | |||||||||||||||
Income from investment operationsa: | ||||||||||||||||||||
Net investment incomeb | 0.25 | 0.25 | 0.33 | c | 0.24 | 0.49d | ||||||||||||||
Net realized and unrealized gains (losses) | (1.67 | ) | 1.87 | 1.91 | (0.97 | ) | 0.60 | |||||||||||||
Total from investment operations | (1.42 | ) | 2.12 | 2.24 | (0.73 | ) | 1.09 | |||||||||||||
Less distributions from: | ||||||||||||||||||||
Net investment income | (0.27 | ) | (0.26 | ) | (0.33 | ) | (0.32 | ) | (0.63) | |||||||||||
Net realized gains | (1.15 | ) | (0.57 | ) | (0.93 | ) | (1.22 | ) | (0.79) | |||||||||||
Total distributions | (1.42 | ) | (0.83 | ) | (1.26 | ) | (1.54 | ) | (1.42) | |||||||||||
Net asset value, end of year | $13.63 | $16.47 | $15.18 | $14.20 | $16.47 | |||||||||||||||
Total returne | (8.49)% | 14.09% | 15.80% | (4.33)% | 6.48% | |||||||||||||||
Ratios to average net assets | ||||||||||||||||||||
Expensesf,g | 1.05% | h | 1.03% | 1.05% | 1.12% | h | 1.13% | |||||||||||||
Expenses incurred in connection with securities sold short | 0.01% | —% | 0.01% | 0.04% | 0.04% | |||||||||||||||
Net investment income | 1.52% | 1.53% | 2.23% | c | 1.45% | 2.84%d | ||||||||||||||
| Supplemental data | ||||||||||||||||||||
Net assets, end of year (000’s) | $890,294 | $983,048 | $992,306 | $1,019,568 | $1,101,706 | |||||||||||||||
Portfolio turnover rate | 47.20% | 24.80% | 30.94% | 35.80% | 40.06% | |||||||||||||||
aThe amount shown for a share outstanding throughout the period may not correlate with the Statement of Operations for the period due to the timing of sales and repurchases of the Fund’s shares in relation to income earned and/or fluctuating fair value of the investments of the Fund.
bBased on average daily shares outstanding.
cNet investment income per share includes approximately $0.10 per share related to income received in the form of special dividends in connection with certain Fund holdings. Excluding this amount, the ratio of net investment income to average net assets would have been 1.56%.
dNet investment income per share includes approximately $0.24 per share related to income received in the form of a special dividend in connection with certain Fund holdings. Excluding this amount, the ratio of net investment income to average net assets would have been 1.44%.
eTotal return does not reflect sales commissions or contingent deferred sales charges, if applicable.
fIncludes dividend and/or interest expense on securities sold short and security borrowing fees, if any. See below for the ratios of such expenses to average net assets for the periods presented. See Note 1(d).
gBenefit of expense reduction rounds to less than 0.01%.
hBenefit of waiver and payments by affiliates rounds to less than 0.01%.
franklintempleton.com |
The accompanying notes are an integral part of these financial statements. | Annual Report |
15 |
FRANKLIN MUTUAL BEACON FUND
FINANCIAL HIGHLIGHTS
| Year Ended December 31, | ||||||||||||||||||||
| 2018 | 2017 | 2016 | 2015 | 2014 | ||||||||||||||||
Class C | ||||||||||||||||||||
| Per share operating performance | ||||||||||||||||||||
(for a share outstanding throughout the year) | ||||||||||||||||||||
Net asset value, beginning of year | $16.34 | $15.06 | $14.10 | $16.36 | $16.70 | |||||||||||||||
Income from investment operationsa: | ||||||||||||||||||||
Net investment incomeb | 0.13 | 0.12 | 0.22 | c | 0.12 | 0.37d | ||||||||||||||
Net realized and unrealized gains (losses) | (1.65 | ) | 1.86 | 1.88 | (0.96 | ) | 0.59 | |||||||||||||
Total from investment operations | (1.52 | ) | 1.98 | 2.10 | (0.84 | ) | 0.96 | |||||||||||||
Less distributions from: | ||||||||||||||||||||
Net investment income | (0.02 | ) | (0.13 | ) | (0.21 | ) | (0.20 | ) | (0.51) | |||||||||||
Net realized gains | (1.15 | ) | (0.57 | ) | (0.93 | ) | (1.22 | ) | (0.79) | |||||||||||
Total distributions | (1.17 | ) | (0.70 | ) | (1.14 | ) | (1.42 | ) | (1.30) | |||||||||||
Net asset value, end of year | $13.65 | $16.34 | $15.06 | $14.10 | $16.36 | |||||||||||||||
Total returne | (9.19)% | 13.25% | 14.94% | (5.06)% | 5.78% | |||||||||||||||
Ratios to average net assets | ||||||||||||||||||||
Expensesf,g | 1.80% | h | 1.78% | 1.80% | 1.84% | h | 1.83% | |||||||||||||
Expenses incurred in connection with securities sold short | 0.01% | —% | 0.01% | 0.04% | 0.04% | |||||||||||||||
Net investment income | 0.77% | 0.78% | 1.48% | c | 0.73% | 2.14%d | ||||||||||||||
| Supplemental data | ||||||||||||||||||||
Net assets, end of year (000’s) | $59,828 | $260,113 | $275,138 | $285,333 | $320,832 | |||||||||||||||
Portfolio turnover rate | 47.20% | 24.80% | 30.94% | 35.80% | 40.06% | |||||||||||||||
aThe amount shown for a share outstanding throughout the period may not correlate with the Statement of Operations for the period due to the timing of sales and repurchases of the Fund’s shares in relation to income earned and/or fluctuating fair value of the investments of the Fund.
bBased on average daily shares outstanding.
cNet investment income per share includes approximately $0.10 per share related to income received in the form of special dividends in connection with certain Fund holdings. Excluding this amount, the ratio of net investment income to average net assets would have been 0.81%.
dNet investment income per share includes approximately $0.24 per share related to income received in the form of a special dividend in connection with certain Fund holdings. Excluding this amount, the ratio of net investment income to average net assets would have been 0.74%.
eTotal return does not reflect sales commissions or contingent deferred sales charges, if applicable.
fIncludes dividend and/or interest expense on securities sold short and security borrowing fees, if any. See below for the ratios of such expenses to average net assets for the periods presented. See Note 1(d).
gBenefit of expense reduction rounds to less than 0.01%.
hBenefit of waiver and payments by affiliates rounds to less than 0.01%.
16 |
Annual Report | The accompanying notes are an integral part of these financial statements. |
franklintempleton.com |
FRANKLIN MUTUAL BEACON FUND
FINANCIAL HIGHLIGHTS
| Year Ended December 31, | ||||||||||||||||||||
| 2018 | 2017 | 2016 | 2015 | 2014 | ||||||||||||||||
Class R | ||||||||||||||||||||
| Per share operating performance | ||||||||||||||||||||
(for a share outstanding throughout the year) | ||||||||||||||||||||
Net asset value, beginning of year | $16.28 | $15.01 | $14.05 | $16.33 | $16.68 | |||||||||||||||
Income from investment operationsa: | ||||||||||||||||||||
Net investment incomeb | 0.20 | 0.21 | 0.30 | c | 0.20 | 0.44d | ||||||||||||||
Net realized and unrealized gains (losses) | (1.64 | ) | 1.84 | 1.89 | (0.97 | ) | 0.61 | |||||||||||||
Total from investment operations | (1.44 | ) | 2.05 | 2.19 | (0.77 | ) | 1.05 | |||||||||||||
Less distributions from: | ||||||||||||||||||||
Net investment income | (0.23 | ) | (0.21 | ) | (0.30 | ) | (0.29 | ) | (0.61) | |||||||||||
Net realized gains | (1.15 | ) | (0.57 | ) | (0.93 | ) | (1.22 | ) | (0.79) | |||||||||||
Total distributions | (1.38 | ) | (0.78 | ) | (1.23 | ) | (1.51 | ) | (1.40) | |||||||||||
Net asset value, end of year | $13.46 | $16.28 | $15.01 | $14.05 | $16.33 | |||||||||||||||
Total return | (8.65)% | 13.76% | 15.58% | (4.61)% | 6.31% | |||||||||||||||
Ratios to average net assets | ||||||||||||||||||||
Expensese,f | 1.30% | g | 1.28% | 1.30% | 1.34% | g | 1.33% | |||||||||||||
Expenses incurred in connection with securities sold short | 0.01% | —% | 0.01% | 0.04% | 0.04% | |||||||||||||||
Net investment income | 1.27% | 1.28% | 1.98% | c | 1.23% | 2.64%d | ||||||||||||||
| Supplemental data | ||||||||||||||||||||
Net assets, end of year (000’s) | $1,662 | $1,601 | $2,035 | $2,343 | $2,246 | |||||||||||||||
Portfolio turnover rate | 47.20% | 24.80% | 30.94% | 35.80% | 40.06% | |||||||||||||||
aThe amount shown for a share outstanding throughout the period may not correlate with the Statement of Operations for the period due to the timing of sales and repurchases of the Fund’s shares in relation to income earned and/or fluctuating fair value of the investments of the Fund.
bBased on average daily shares outstanding.
cNet investment income per share includes approximately $0.10 per share related to income received in the form of special dividends in connection with certain Fund holdings. Excluding this amount, the ratio of net investment income to average net assets would have been 1.31%.
dNet investment income per share includes approximately $0.24 per share related to income received in the form of a special dividend in connection with certain Fund holdings. Excluding this amount, the ratio of net investment income to average net assets would have been 1.24%.
eIncludes dividend and/or interest expense on securities sold short and security borrowing fees, if any. See below for the ratios of such expenses to average net assets for the periods presented. See Note 1(d).
fBenefit of expense reduction rounds to less than 0.01%.
gBenefit of waiver and payments by affiliates rounds to less than 0.01%.
franklintempleton.com |
The accompanying notes are an integral part of these financial statements. | Annual Report |
17 |
FRANKLIN MUTUAL BEACON FUND
FINANCIAL HIGHLIGHTS
| Year Ended December 31, | ||||||||||||||||||||
| 2018 | 2017 | 2016 | 2015 | 2014 | ||||||||||||||||
Class R6 | ||||||||||||||||||||
| Per share operating performance | ||||||||||||||||||||
(for a share outstanding throughout the year) | ||||||||||||||||||||
Net asset value, beginning of year | $16.60 | $15.30 | $14.30 | $16.58 | $16.88 | |||||||||||||||
Income from investment operationsa: | ||||||||||||||||||||
Net investment incomeb | 0.30 | 0.37 | 0.38 | c | 0.30 | 0.56d | ||||||||||||||
Net realized and unrealized gains (losses) | (1.68 | ) | 1.82 | 1.93 | (0.98 | ) | 0.63 | |||||||||||||
Total from investment operations | (1.38 | ) | 2.19 | 2.31 | (0.68 | ) | 1.19 | |||||||||||||
Less distributions from: | ||||||||||||||||||||
Net investment income | (0.32 | ) | (0.32 | ) | (0.38 | ) | (0.38 | ) | (0.70) | |||||||||||
Net realized gains | (1.15 | ) | (0.57 | ) | (0.93 | ) | (1.22 | ) | (0.79) | |||||||||||
Total distributions | (1.47 | ) | (0.89 | ) | (1.31 | ) | (1.60 | ) | (1.49) | |||||||||||
Net asset value, end of year | $13.75 | $16.60 | $15.30 | $14.30 | $16.58 | |||||||||||||||
Total return | (8.18)% | 14.42% | 16.20% | (3.98)% | 6.91% | |||||||||||||||
Ratios to average net assets | ||||||||||||||||||||
Expenses before waiver and payments by affiliatese | 0.75% | 0.72% | 0.71% | 0.74% | 0.74% | |||||||||||||||
Expenses net of waiver and payments by affiliatese,f | 0.73% | 0.71% | 0.71% | 0.74% | g | 0.74% | ||||||||||||||
Expenses incurred in connection with securities sold short | 0.01% | —% | 0.01% | 0.04% | 0.04% | |||||||||||||||
Net investment income | 1.84% | 1.85% | 2.57% | c | 1.83% | 3.23%d | ||||||||||||||
| Supplemental data | ||||||||||||||||||||
Net assets, end of year (000’s) | $79,358 | $106,845 | $604 | $48,844 | $50,868 | |||||||||||||||
Portfolio turnover rate | 47.20% | 24.80% | 30.94% | 35.80% | 40.06% | |||||||||||||||
aThe amount shown for a share outstanding throughout the period may not correlate with the Statement of Operations for the period due to the timing of sales and repurchases of the Fund’s shares in relation to income earned and/or fluctuating fair value of the investments of the Fund.
bBased on average daily shares outstanding.
cNet investment income per share includes approximately $0.10 per share related to income received in the form of special dividends in connection with certain Fund holdings. Excluding this amount, the ratio of net investment income to average net assets would have been 1.90%.
dNet investment income per share includes approximately $0.24 per share related to income received in the form of a special dividend in connection with certain Fund holdings. Excluding this amount, the ratio of net investment income to average net assets would have been 1.83%.
eIncludes dividend and/or interest expense on securities sold short and security borrowing fees, if any. See below for the ratios of such expenses to average net assets for the periods presented. See Note 1(d).
fBenefit of expense reduction rounds to less than 0.01%.
gBenefit of waiver and payments by affiliates rounds to less than 0.01%.
18 |
Annual Report | The accompanying notes are an integral part of these financial statements. |
franklintempleton.com |
FRANKLIN MUTUAL BEACON FUND
Statement of Investments, December 31, 2018
| Country | Shares/ Warrants | Value | ||||||||||
| ||||||||||||
Common Stocks and Other Equity Interests 87.3% | ||||||||||||
Aerospace & Defense 2.1% | ||||||||||||
BAE Systems PLC | United Kingdom | 11,814,998 | $ | 69,188,011 | ||||||||
|
| |||||||||||
Auto Components 0.1% | ||||||||||||
a,b,cInternational Automotive Components Group Brazil LLC | Brazil | 2,846,329 | 120,619 | |||||||||
a,b,cInternational Automotive Components Group North America LLC | United States | 22,836,904 | 2,722,159 | |||||||||
|
| |||||||||||
| 2,842,778 | ||||||||||||
|
| |||||||||||
Banks 8.8% | ||||||||||||
JPMorgan Chase & Co. | United States | 890,830 | 86,962,826 | |||||||||
Standard Chartered PLC | United Kingdom | 13,443,194 | 104,454,934 | |||||||||
Wells Fargo & Co. | United States | 2,124,250 | 97,885,440 | |||||||||
|
| |||||||||||
| 289,303,200 | ||||||||||||
|
| |||||||||||
Biotechnology 1.1% | ||||||||||||
Shire PLC | United Kingdom | 644,845 | 37,580,872 | |||||||||
|
| |||||||||||
Chemicals 2.0% | ||||||||||||
BASF SE | Germany | 956,972 | 66,659,457 | |||||||||
a,b,dDow Corning Corp., Contingent Distribution | United States | 12,598,548 | — | |||||||||
|
| |||||||||||
| 66,659,457 | ||||||||||||
|
| |||||||||||
Communications Equipment 1.9% | ||||||||||||
Cisco Systems Inc. | United States | 1,458,142 | 63,181,293 | |||||||||
|
| |||||||||||
Consumer Finance 2.5% | ||||||||||||
Capital One Financial Corp. | United States | 1,102,998 | 83,375,619 | |||||||||
|
| |||||||||||
Diversified Telecommunication Services 2.2% | ||||||||||||
Koninklijke KPN NV | Netherlands | 24,353,643 | 71,435,271 | |||||||||
|
| |||||||||||
Electrical Equipment 3.3% | ||||||||||||
aSensata Technologies Holding PLC | United States | 2,429,802 | 108,952,322 | |||||||||
|
| |||||||||||
Entertainment 3.3% | ||||||||||||
The Walt Disney Co. | United States | 994,700 | 109,068,855 | |||||||||
|
| |||||||||||
Food & Staples Retailing 0.2% | ||||||||||||
aRite Aid Corp. | United States | 8,457,611 | 5,990,526 | |||||||||
|
| |||||||||||
Health Care Equipment & Supplies 4.3% | ||||||||||||
Medtronic PLC | United States | 1,576,090 | 143,361,146 | |||||||||
|
| |||||||||||
Hotels, Restaurants & Leisure 3.9% | ||||||||||||
Accor SA | France | 1,604,708 | 68,233,205 | |||||||||
Sands China Ltd. | Macau | 13,934,400 | 61,036,961 | |||||||||
|
| |||||||||||
| 129,270,166 | ||||||||||||
|
| |||||||||||
Industrial Conglomerates 1.0% | ||||||||||||
General Electric Co. | United States | 4,584,600 | 34,705,422 | |||||||||
|
| |||||||||||
Insurance 4.5% | ||||||||||||
American International Group Inc. | United States | 1,514,000 | 59,666,740 | |||||||||
The Hartford Financial Services Group Inc. | United States | 2,006,000 | 89,166,700 | |||||||||
|
| |||||||||||
| 148,833,440 | ||||||||||||
|
| |||||||||||
Interactive Media & Services 2.5% | ||||||||||||
aBaidu Inc., ADR | China | 516,947 | 81,987,794 | |||||||||
|
| |||||||||||
IT Services 3.1% | ||||||||||||
Cognizant Technology Solutions Corp., A | United States | 1,629,630 | 103,448,912 | |||||||||
|
| |||||||||||
franklintempleton.com |
Annual Report |
19 |
FRANKLIN MUTUAL BEACON FUND
STATEMENT OF INVESTMENTS
| Country | Shares/ Warrants | Value | ||||||||||
| ||||||||||||
Common Stocks and Other Equity Interests (continued) | ||||||||||||
Media 6.1% | ||||||||||||
aCharter Communications Inc., A | United States | 312,587 | $ | 89,077,917 | ||||||||
aCumulus Media Inc., A | United States | 30,173 | 325,869 | |||||||||
aCumulus Media Inc., B | United States | 57,236 | 543,742 | |||||||||
aCumulus Media Inc., wts., 6/04/38 | United States | 13,170 | 125,115 | |||||||||
aDiscovery Inc., C | United States | 2,709,700 | 62,539,876 | |||||||||
aLiberty Global PLC, C | United Kingdom | 2,435,700 | 50,272,848 | |||||||||
|
| |||||||||||
| 202,885,367 | ||||||||||||
|
| |||||||||||
Metals & Mining 0.2% | ||||||||||||
Warrior Met Coal Inc. | United States | 207,416 | 5,000,800 | |||||||||
|
| |||||||||||
Oil, Gas & Consumable Fuels 5.7% | ||||||||||||
Kinder Morgan Inc. | United States | 4,414,700 | 67,898,086 | |||||||||
Royal Dutch Shell PLC, A | United Kingdom | 2,206,089 | 64,849,084 | |||||||||
The Williams Cos. Inc. | United States | 2,581,832 | 56,929,396 | |||||||||
|
| |||||||||||
| 189,676,566 | ||||||||||||
|
| |||||||||||
Pharmaceuticals 13.3% | ||||||||||||
Eli Lilly & Co. | United States | 767,312 | 88,793,345 | |||||||||
GlaxoSmithKline PLC | United Kingdom | 5,783,258 | 109,977,483 | |||||||||
Merck & Co. Inc. | United States | 1,163,977 | 88,939,482 | |||||||||
Novartis AG, ADR | Switzerland | 1,774,190 | 152,243,244 | |||||||||
|
| |||||||||||
| 439,953,554 | ||||||||||||
|
| |||||||||||
Software 5.1% | ||||||||||||
aCheck Point Software Technologies Ltd. | Israel | 734,812 | 75,428,452 | |||||||||
aRed Hat Inc. | United States | 207,100 | 36,375,044 | |||||||||
Symantec Corp. | United States | 2,955,337 | 55,841,092 | |||||||||
|
| |||||||||||
| 167,644,588 | ||||||||||||
|
| |||||||||||
Specialty Retail 2.0% | ||||||||||||
Dufry AG | Switzerland | 708,780 | 67,547,069 | |||||||||
|
| |||||||||||
Technology Hardware, Storage & Peripherals 1.9% | ||||||||||||
Western Digital Corp. | United States | 1,676,500 | 61,980,205 | |||||||||
|
| |||||||||||
Thrifts & Mortgage Finance 1.4% | ||||||||||||
Indiabulls Housing Finance Ltd. | India | 3,646,376 | 44,752,884 | |||||||||
|
| |||||||||||
Tobacco 2.8% | ||||||||||||
British American Tobacco PLC | United Kingdom | 2,851,046 | 90,894,907 | |||||||||
|
| |||||||||||
Wireless Telecommunication Services 2.0% | ||||||||||||
aT-Mobile U.S. Inc. | United States | 1,020,000 | 64,882,200 | |||||||||
|
| |||||||||||
Total Common Stocks and Other Equity Interests (Cost $2,711,462,123) | 2,884,403,224 | |||||||||||
|
| |||||||||||
Management Investment Companies (Cost $27,875,091) 0.8% | ||||||||||||
Diversified Financial Services 0.8% | ||||||||||||
aAltaba Inc. | United States | 430,920 | 24,967,505 | |||||||||
|
| |||||||||||
Preferred Stocks 5.4% | ||||||||||||
Automobiles 2.2% | ||||||||||||
ePorsche Automobil Holding SE, 3.429%, pfd. | Germany | 1,225,551 | 72,080,616 | |||||||||
|
| |||||||||||
Technology Hardware, Storage & Peripherals 3.2% | ||||||||||||
eSamsung Electronics Co. Ltd., 4.46%, pfd. | South Korea | 3,738,607 | 106,581,401 | |||||||||
|
| |||||||||||
Total Preferred Stocks (Cost $131,568,444) | 178,662,017 | |||||||||||
|
| |||||||||||
20 |
Annual Report |
franklintempleton.com |
FRANKLIN MUTUAL BEACON FUND
STATEMENT OF INVESTMENTS
| Country | Principal Amount | Value | ||||||||||
| ||||||||||||
Corporate Notes and Senior Floating Rate Interests 2.1% | ||||||||||||
f,gCumulus Media New Holdings Inc., Term Loan, 7.03%,(1-month USD LIBOR + 4.50%), 5/13/22 | United States | $ | 10,762,620 | $ | 10,213,274 | |||||||
Frontier Communications Corp., | ||||||||||||
senior note, 10.50%, 9/15/22 | United States | 16,691,000 | 11,683,700 | |||||||||
senior note, 11.00%, 9/15/25 | United States | 23,907,000 | 15,000,447 | |||||||||
f,gVeritas US Inc., | ||||||||||||
Term Loan B1, 7.022%,(1-month USD LIBOR + 4.50%), 1/27/23 | United States | 13,060,226 | 11,237,241 | |||||||||
Term Loan B1, 7.303%,(3-month USD LIBOR + 4.50%), 1/27/23 | United States | 4,281,659 | 3,684,012 | |||||||||
hVeritas US Inc./Veritas Bermuda Ltd., | ||||||||||||
senior note, 144A, 7.50%, 2/01/23 | United States | 2,766,000 | 2,268,120 | |||||||||
senior note, 144A, 10.50%, 2/01/24 | United States | 22,708,000 | 15,044,050 | |||||||||
|
| |||||||||||
Total Corporate Notes and Senior Floating Rate Interests (Cost $86,351,756) | 69,130,844 | |||||||||||
|
| |||||||||||
Corporate Notes and Senior Floating Rate Interests in Reorganization 0.8% | ||||||||||||
b,c,iBroadband Ventures III LLC, secured promissory note, 5.00%, 2/01/12 | United States | 10,848 | — | |||||||||
iiHeartCommunications Inc., | ||||||||||||
senior secured note, first lien, 9.00%, 12/15/19 | United States | 18,873,000 | 12,739,275 | |||||||||
f,gTranche D Term Loan, 8.443%,(3-month USD LIBOR + 6.75%), 1/30/19 | United States | 15,813,483 | 10,696,081 | |||||||||
f,gTranche E Term Loan, 9.193%,(3-month USD LIBOR + 7.50%), 7/30/19 | United States | 5,080,935 | 3,435,068 | |||||||||
|
| |||||||||||
Total Corporate Notes and Senior Floating Rate Interests in Reorganization (Cost $38,808,737) | 26,870,424 | |||||||||||
|
| |||||||||||
| Shares | ||||||||||||
|
| |||||||||||
Companies in Liquidation 0.0%† | ||||||||||||
a,b,dTribune Media, Litigation Trust, Contingent Distribution | United States | 502,429 | — | |||||||||
a,dVistra Energy Corp., Litigation Trust, Contingent Distribution | United States | 46,282,735 | 41,654 | |||||||||
|
| |||||||||||
Total Companies in Liquidation (Cost $1,582,525) | 41,654 | |||||||||||
|
| |||||||||||
Total Investments before Short Term Investments (Cost $2,997,648,676) | 3,184,075,668 | |||||||||||
|
| |||||||||||
Principal Amount | ||||||||||||
|
| |||||||||||
Short Term Investments 2.9% | ||||||||||||
U.S. Government and Agency Securities 2.9% | ||||||||||||
jFHLB, 1/02/19 | United States | $ | 9,300,000 | 9,300,000 | ||||||||
jU.S. Treasury Bill, | ||||||||||||
1/02/19 - 4/25/19 | United States | 58,700,000 | 58,462,883 | |||||||||
k1/10/19 - 6/06/19 | United States | 27,800,000 | 27,587,969 | |||||||||
|
| |||||||||||
Total U.S. Government and Agency Securities | ||||||||||||
(Cost $95,347,792) | 95,350,852 | |||||||||||
|
| |||||||||||
Total Investments (Cost $3,092,996,468) 99.3% | 3,279,426,520 | |||||||||||
Securities Sold Short (1.2)% | (39,553,897 | ) | ||||||||||
Other Assets, less Liabilities 1.9% | 62,485,882 | |||||||||||
|
| |||||||||||
Net Assets 100.0% | $ | 3,302,358,505 | ||||||||||
|
| |||||||||||
franklintempleton.com |
Annual Report |
21 |
FRANKLIN MUTUAL BEACON FUND
STATEMENT OF INVESTMENTS
| Country | Shares | Value | ||||||||||
| ||||||||||||
lSecurities Sold Short (1.2)% | ||||||||||||
Common Stocks (1.2)% | ||||||||||||
Internet & Direct Marketing Retail (0.6)% | ||||||||||||
Alibaba Group Holding Ltd., ADR | China | 155,131 | $ | (21,263,806 | ) | |||||||
|
| |||||||||||
Pharmaceuticals (0.6)% | ||||||||||||
Takeda Pharmaceutical Co. Ltd. | Japan | 541,051 | (18,290,091 | ) | ||||||||
|
| |||||||||||
Total Securities Sold Short (Proceeds $ 49,678,223) | $ | (39,553,897 | ) | |||||||||
|
| |||||||||||
†Rounds to less than 0.1% of net assets.
aNon-income producing.
bFair valued using significant unobservable inputs. See Note 14 regarding fair value measurements.
cSee Note 10 regarding restricted securities.
dContingent distributions represent the right to receive additional distributions, if any, during the reorganization of the underlying company. Shares represent total underlying principal of debt securities.
eVariable rate security. The rate shown represents the yield at period end.
fThe coupon rate shown represents the rate at period end.
gSee Note 1(f) regarding senior floating rate interests.
hSecurity was purchased pursuant to Rule 144A under the Securities Act of 1933 and may be sold in transactions exempt from registration only to qualified institutional buyers or in a public offering registered under the Securities Act of 1933. These securities have been deemed liquid under guidelines approved by the Trust’s Board of Trustees. At December 31, 2018, the aggregate value of these securities was $17,312,170, representing 0.5% of net assets.
iSee Note 8 regarding credit risk and defaulted securities.
jThe security was issued on a discount basis with no stated coupon rate.
kA portion or all of the security has been segregated as collateral for securities sold short. At December 31, 2018, the aggregate value of these securities pledged amounted to $15,493,632, representing 0.5% of net assets.
lSee Note 1(d) regarding securities sold short.
At December 31, 2018, the Fund had the following futures contracts outstanding. See Note 1(c).
Futures Contracts
| Description | Type | Number of Contracts | Notional Amount* | Expiration Date | Value/ Unrealized Appreciation (Depreciation) | |||||||||||||||
| ||||||||||||||||||||
| Currency Contracts | ||||||||||||||||||||
EUR/USD | Short | 952 | $137,117,750 | 3/18/19 | $ 20,449 | |||||||||||||||
GBP/USD | Short | 1,150 | 91,928,125 | 3/18/19 | 190,027 | |||||||||||||||
|
| |||||||||||||||||||
Total Futures Contracts | $210,476 | |||||||||||||||||||
|
| |||||||||||||||||||
*As of period end.
22 |
Annual Report |
franklintempleton.com |
FRANKLIN MUTUAL BEACON FUND
STATEMENT OF INVESTMENTS
At December 31, 2018, the Fund had the following forward exchange contracts outstanding. See Note 1(c).
Forward Exchange Contracts
| Currency | Counterpartya | Type | Quantity | Contract Amount | Settlement Date | Unrealized Appreciation | Unrealized Depreciation | |||||||||||||||||||||
| ||||||||||||||||||||||||||||
| OTC Forward Exchange Contracts | ||||||||||||||||||||||||||||
Euro | BOFA | Buy | 514,089 | $ | 587,389 | 1/14/19 | $ | 2,386 | $ | — | ||||||||||||||||||
Euro | HSBK | Buy | 277,777 | 316,930 | 1/14/19 | 1,743 | — | |||||||||||||||||||||
Euro | HSBK | Sell | 793,770 | 937,700 | 1/14/19 | 27,069 | — | |||||||||||||||||||||
Euro | UBSW | Buy | 1,904 | 2,176 | 1/14/19 | 8 | — | |||||||||||||||||||||
British Pound | BOFA | Buy | 207,683 | 263,151 | 1/16/19 | 1,919 | — | |||||||||||||||||||||
British Pound | HSBK | Buy | 1,659,952 | 2,103,056 | 1/16/19 | 15,580 | — | |||||||||||||||||||||
British Pound | SSBT | Sell | 22,932,950 | 30,563,775 | 1/16/19 | 1,293,904 | — | |||||||||||||||||||||
British Pound | UBSW | Buy | 496,188 | 627,061 | 1/16/19 | 6,236 | — | |||||||||||||||||||||
British Pound | BOFA | Sell | 2,400,269 | 3,159,408 | 2/14/19 | 91,565 | — | |||||||||||||||||||||
British Pound | BONY | Sell | 3,000,000 | 3,958,700 | 2/14/19 | 124,327 | — | |||||||||||||||||||||
British Pound | HSBK | Sell | 3,962,799 | 5,217,835 | 2/14/19 | 152,886 | — | |||||||||||||||||||||
British Pound | UBSW | Sell | 11,000,000 | 14,463,243 | 2/14/19 | 403,875 | — | |||||||||||||||||||||
South Korean Won | BONY | Sell | 3,620,832,500 | 3,272,330 | 2/15/19 | 16,280 | — | |||||||||||||||||||||
South Korean Won | HSBK | Buy | 10,853,517,380 | 9,629,812 | 2/15/19 | 130,263 | — | |||||||||||||||||||||
South Korean Won | HSBK | Sell | 47,975,040,092 | 43,220,481 | 2/15/19 | 78,714 | — | |||||||||||||||||||||
South Korean Won | UBSW | Buy | 4,409,345,698 | 3,928,540 | 2/15/19 | 36,584 | — | |||||||||||||||||||||
South Korean Won | UBSW | Sell | 18,391,848,448 | 16,565,502 | 2/15/19 | 26,551 | — | |||||||||||||||||||||
South Korean Won | UBSW | Sell | 19,077,483,100 | 16,907,841 | 2/15/19 | — | (247,670 | ) | ||||||||||||||||||||
Euro | BOFA | Buy | 2,600,955 | 2,982,914 | 2/20/19 | 10,109 | — | |||||||||||||||||||||
Euro | BOFA | Sell | 593,336 | 705,526 | 2/20/19 | 22,750 | — | |||||||||||||||||||||
Euro | BONY | Buy | 4,765,990 | 5,458,238 | 2/20/19 | 26,178 | — | |||||||||||||||||||||
Euro | BONY | Sell | 4,607,719 | 5,347,138 | 2/20/19 | 44,850 | — | |||||||||||||||||||||
Euro | HSBK | Buy | 978,837 | 1,121,202 | 2/20/19 | 5,185 | — | |||||||||||||||||||||
Euro | HSBK | Sell | 595,411 | 708,200 | 2/20/19 | 23,036 | — | |||||||||||||||||||||
Euro | SSBT | Buy | 704,673 | 806,889 | 2/20/19 | 4,007 | — | |||||||||||||||||||||
Euro | SSBT | Sell | 4,010,232 | 4,636,971 | 2/20/19 | 22,236 | — | |||||||||||||||||||||
Euro | UBSW | Buy | 756,243 | 866,106 | 2/20/19 | 4,134 | — | |||||||||||||||||||||
Euro | BOFA | Buy | 2,591,262 | 2,991,019 | 4/18/19 | 5,690 | — | |||||||||||||||||||||
Euro | BOFA | Sell | 173,877 | 202,016 | 4/18/19 | 932 | — | |||||||||||||||||||||
Euro | BOFA | Sell | 1,921,837 | 2,222,086 | 4/18/19 | — | (457 | ) | ||||||||||||||||||||
Euro | BONY | Sell | 175,899 | 204,370 | 4/18/19 | 949 | — | |||||||||||||||||||||
Euro | BONY | Sell | 2,025,583 | 2,341,270 | 4/18/19 | — | (1,251 | ) | ||||||||||||||||||||
Euro | HSBK | Buy | 823,233 | 950,173 | 4/18/19 | 1,869 | — | |||||||||||||||||||||
Euro | HSBK | Sell | 500,000 | 577,100 | 4/18/19 | — | (1,134 | ) | ||||||||||||||||||||
Euro | SSBT | Sell | 539,982 | 621,946 | 4/18/19 | — | (2,525 | ) | ||||||||||||||||||||
Euro | UBSW | Buy | 600,954 | 693,822 | 4/18/19 | 1,162 | — | |||||||||||||||||||||
Euro | UBSW | Sell | 317,370 | 367,790 | 4/18/19 | 761 | — | |||||||||||||||||||||
Euro | UBSW | Sell | 1,920,017 | 2,206,718 | 4/18/19 | — | (13,720 | ) | ||||||||||||||||||||
British Pound | BONY | Sell | 3,132,966 | 4,074,773 | 4/24/19 | 57,270 | — | |||||||||||||||||||||
British Pound | UBSW | Sell | 3,995,039 | 5,240,400 | 4/24/19 | 117,433 | — | |||||||||||||||||||||
Euro | BOFA | Sell | 9,189,964 | 10,649,835 | 5/07/19 | 4,378 | — | |||||||||||||||||||||
Euro | BONY | Sell | 5,200,000 | 5,977,390 | 5/07/19 | — | (46,179 | ) | ||||||||||||||||||||
Euro | HSBK | Sell | 3,316,744 | 3,830,296 | 5/07/19 | — | (11,748 | ) | ||||||||||||||||||||
Euro | HSBK | Sell | 27,571,569 | 32,057,463 | 5/07/19 | 119,147 | — | |||||||||||||||||||||
Euro | SSBT | Sell | 94,796 | 110,672 | 5/07/19 | 863 | — | |||||||||||||||||||||
Euro | UBSW | Sell | 6,554,346 | 7,526,900 | 5/07/19 | — | (65,514 | ) | ||||||||||||||||||||
Euro | UBSW | Sell | 9,892,595 | 11,466,388 | 5/07/19 | 7,017 | — | |||||||||||||||||||||
South Korean Won | BONY | Sell | 4,439,872,340 | 4,004,575 | 5/17/19 | — | (3,143 | ) | ||||||||||||||||||||
South Korean Won | HSBK | Sell | 5,943,138,476 | 5,353,214 | 5/17/19 | — | (11,450 | ) | ||||||||||||||||||||
franklintempleton.com |
Annual Report |
23 |
FRANKLIN MUTUAL BEACON FUND
STATEMENT OF INVESTMENTS
Forward Exchange Contracts(continued)
| Currency | Counterpartya | Type | Quantity | Contract Amount | Settlement Date | Unrealized Appreciation | Unrealized Depreciation | |||||||||||||||||||||
| ||||||||||||||||||||||||||||
| OTC Forward Exchange Contracts(continued) |
| |||||||||||||||||||||||||||
South Korean Won | UBSW | Sell | 33,206,907,922 | $ | 29,698,043 | 5/17/19 | $ | — | $ | (276,674 | ) | |||||||||||||||||
Euro | HSBK | Sell | 557,670 | 642,759 | 5/21/19 | — | (4,021 | ) | ||||||||||||||||||||
Euro | SSBT | Sell | 2,500,000 | 2,887,650 | 5/21/19 | — | (11,827 | ) | ||||||||||||||||||||
Euro | SSBT | Sell | 54,672,573 | 63,663,478 | 5/21/19 | 254,730 | — | |||||||||||||||||||||
British Pound | BOFA | Sell | 36,906,347 | 47,733,779 | 5/28/19 | 331,731 | — | |||||||||||||||||||||
British Pound | UBSW | Sell | 4,176,956 | 5,319,984 | 5/28/19 | — | (44,846 | ) | ||||||||||||||||||||
|
| |||||||||||||||||||||||||||
Total Forward Exchange Contracts | $ | 3,476,307 | $ | (742,159 | ) | |||||||||||||||||||||||
|
| |||||||||||||||||||||||||||
Net unrealized appreciation (depreciation) |
| $ | 2,734,148 | |||||||||||||||||||||||||
|
| |||||||||||||||||||||||||||
aMay be comprised of multiple contracts with the same counterparty, currency and settlement date.
See Note 11 regarding other derivative information.
See Abbreviations on page 42.
24 |
Annual Report | The accompanying notes are an integral part of these financial statements. |
franklintempleton.com |
FRANKLIN MUTUAL BEACON FUND
Statement of Assets and Liabilities
December 31, 2018
Assets: | ||||
Investments in securities: | ||||
Cost - Unaffiliated issuers | $ | 3,092,996,468 | ||
|
| |||
Value - Unaffiliated issuers | $ | 3,279,426,520 | ||
Cash | 317,423 | |||
Receivables: | ||||
Investment securities sold | 2,299,112 | |||
Capital shares sold | 10,438,943 | |||
Dividends and interest | 10,500,510 | |||
European Union tax reclaims | 3,590,373 | |||
Deposits with brokers for: | ||||
Securities sold short | 44,159,501 | |||
Futures contracts | 5,172,350 | |||
Unrealized appreciation on OTC forward exchange contracts | 3,476,307 | |||
Other assets | 470 | |||
|
| |||
Total assets | 3,359,381,509 | |||
|
| |||
Liabilities: | ||||
Payables: | ||||
Capital shares redeemed | 11,505,343 | |||
Management fees | 1,929,241 | |||
Distribution fees | 505,575 | |||
Transfer agent fees | 620,201 | |||
Trustees’ fees and expenses | 277,183 | |||
Variation margin on futures contracts | 442,675 | |||
Securities sold short, at value (proceeds $49,678,223) | 39,553,897 | |||
Unrealized depreciation on OTC forward exchange contracts | 742,159 | |||
Deferred tax | 1,170,447 | |||
Accrued expenses and other liabilities | 276,283 | |||
|
| |||
Total liabilities | 57,023,004 | |||
|
| |||
Net assets, at value | $ | 3,302,358,505 | ||
|
| |||
Net assets consist of: | ||||
Paid-in capital | $ | 3,025,246,633 | ||
Total distributable earnings (loss) | 277,111,872 | |||
|
| |||
Net assets, at value | $ | 3,302,358,505 | ||
|
|
franklintempleton.com |
The accompanying notes are an integral part of these financial statements. | Annual Report |
25 |
FRANKLIN MUTUAL BEACON FUND
FINANCIAL STATEMENTS
Statement of Assets and Liabilities(continued)
December 31, 2018
| Class Z: | ||||
Net assets, at value | $ | 2,271,216,822 | ||
|
| |||
Shares outstanding | 165,101,679 | |||
|
| |||
Net asset value and maximum offering price per share | $13.76 | |||
|
| |||
| Class A: | ||||
Net assets, at value | $ | 890,293,923 | ||
|
| |||
Shares outstanding | 65,328,586 | |||
|
| |||
Net asset value per sharea | $13.63 | |||
|
| |||
Maximum offering price per share (net asset value per share ÷ 94.50%) | $14.42 | |||
|
| |||
| Class C: | ||||
Net assets, at value | $ | 59,828,464 | ||
|
| |||
Shares outstanding | 4,381,711 | |||
|
| |||
Net asset value and maximum offering price per sharea | $13.65 | |||
|
| |||
| Class R: | ||||
Net assets, at value | $ | 1,661,537 | ||
|
| |||
Shares outstanding | 123,410 | |||
|
| |||
Net asset value and maximum offering price per share | $13.46 | |||
|
| |||
| Class R6: | ||||
Net assets, at value | $ | 79,357,759 | ||
|
| |||
Shares outstanding | 5,770,966 | |||
|
| |||
Net asset value and maximum offering price per share | $13.75 | |||
|
|
aRedemption price is equal to net asset value less contingent deferred sales charges, if applicable.
26 |
Annual Report | The accompanying notes are an integral part of these financial statements. |
franklintempleton.com |
FRANKLIN MUTUAL BEACON FUND
FINANCIAL STATEMENTS
Statement of Operations
for the year ended December 31, 2018
Investment income: | ||||
Dividends: (net of foreign taxes)* | ||||
Unaffiliated issuers | $ 86,138,340 | |||
Interest: | ||||
Unaffiliated issuers | 10,609,792 | |||
Income from securities loaned: | ||||
Unaffiliated issuers (net of fees and rebates) | 33,178 | |||
Non-controlled affiliates (Note 3f) | 20,195 | |||
Other income (Note 1g) | 1,042,396 | |||
|
| |||
Total investment income | 97,843,901 | |||
|
| |||
Expenses: | ||||
Management fees (Note 3a) | 25,808,103 | |||
Distribution fees: (Note 3c) | ||||
Class A | 2,330,762 | |||
Class C | 2,038,800 | |||
Class R | 9,055 | |||
Transfer agent fees: | ||||
Class Z | 2,268,365 | |||
Class A | 817,109 | |||
Class C | 178,772 | |||
Class R | 1,587 | |||
Class R6 | 38,336 | |||
Custodian fees (Note 4) | 202,127 | |||
Reports to shareholders | 190,182 | |||
Registration and filing fees | 107,687 | |||
Professional fees | 112,321 | |||
Trustees’ fees and expenses | 233,836 | |||
Dividends on securities sold short | 245,449 | |||
Other | 80,976 | |||
|
| |||
Total expenses | 34,663,467 | |||
Expense reductions (Note 4) | (29,916 | ) | ||
Expenses waived/paid by affiliates (Note 3f and 3g) | (22,860 | ) | ||
|
| |||
Net expenses | 34,610,691 | |||
|
| |||
Net investment income | 63,233,210 | |||
|
| |||
Realized and unrealized gains (losses): | ||||
Net realized gain (loss) from: | ||||
Investments:# | ||||
Unaffiliated issuers | 297,508,315 | |||
Non-controlled affiliates (Note 3f and 12) | 10,196 | |||
Foreign currency transactions | (993,030 | ) | ||
Forward exchange contracts | 12,657,327 | |||
Futures contracts | 17,946,424 | |||
Securities sold short | (1,132,196 | ) | ||
|
| |||
Net realized gain (loss) | 325,997,036 | |||
|
| |||
Net change in unrealized appreciation (depreciation) on: | ||||
Investments: | ||||
Unaffiliated issuers | (729,501,793 | ) | ||
Translation of other assets and liabilities denominated in foreign currencies | (311,658 | ) | ||
Forward exchange contracts | 21,388,656 | |||
Futures contracts | 4,450,073 | |||
Securities sold short | 9,551,893 | |||
Change in deferred taxes on unrealized appreciation | (498,289 | ) | ||
|
| |||
Net change in unrealized appreciation (depreciation) | (694,921,118 | ) | ||
|
| |||
Net realized and unrealized gain (loss) | (368,924,082 | ) | ||
|
|
franklintempleton.com |
The accompanying notes are an integral part of these financial statements. | Annual Report |
27 |
FRANKLIN MUTUAL BEACON FUND
FINANCIAL STATEMENTS
Statement of Operations(continued)
for the year ended December 31, 2018
Net increase (decrease) in net assets resulting from operations | $(305,690,872 | ) | ||
|
| |||
*Foreign taxes withheld on dividends | $ | 3,722,763 | ||
#Net of foreign taxes | $ | 155,569 | ||
28 |
Annual Report | The accompanying notes are an integral part of these financial statements. |
franklintempleton.com |
FRANKLIN MUTUAL BEACON FUND
FINANCIAL STATEMENTS
Statements of Changes in Net Assets
| Year Ended December 31, | ||||||||
|
| |||||||
| 2018 | 2017 | |||||||
| ||||||||
Increase (decrease) in net assets: | ||||||||
Operations: | ||||||||
Net investment income | $ | 63,233,210 | $ | 65,956,895 | ||||
Net realized gain (loss) | 325,997,036 | 183,147,634 | ||||||
Net change in unrealized appreciation (depreciation) | (694,921,118 | ) | 281,136,333 | |||||
|
| |||||||
Net increase (decrease) in net assets resulting from operations | (305,690,872 | ) | 530,240,862 | |||||
|
| |||||||
Distributions to shareholders: (Note 1h) | ||||||||
Class Z | (221,433,179 | ) | (139,862,559 | ) | ||||
Class A | (83,941,345 | ) | (48,591,653 | ) | ||||
Class C | (5,683,570 | ) | (11,029,993 | ) | ||||
Class R | (157,769 | ) | (88,349 | ) | ||||
Class R6 | (7,782,384 | ) | (4,128,902 | ) | ||||
|
| |||||||
Total distributions to shareholders | (318,998,247 | ) | (203,701,456 | ) | ||||
|
| |||||||
Capital share transactions: (Note 2) | ||||||||
Class Z | 540,717 | (86,429,444 | ) | |||||
Class A | 72,748,807 | (92,158,566 | ) | |||||
Class C | (185,991,052 | ) | (38,165,096 | ) | ||||
Class R | 390,017 | (607,336 | ) | |||||
Class R6 | (12,575,413 | ) | 108,551,501 | |||||
|
| |||||||
Total capital share transactions | (124,886,924 | ) | (108,808,941 | ) | ||||
|
| |||||||
Net increase (decrease) in net assets | (749,576,043 | ) | 217,730,465 | |||||
Net assets: | ||||||||
Beginning of year | 4,051,934,548 | 3,834,204,083 | ||||||
|
| |||||||
End of year (Note 1h) | $ | 3,302,358,505 | $ | 4,051,934,548 | ||||
|
| |||||||
franklintempleton.com |
The accompanying notes are an integral part of these financial statements. | Annual Report |
29 |
FRANKLIN MUTUAL BEACON FUND
1. Organization and Significant Accounting Policies
Franklin Mutual Series Funds (Trust) is registered under the Investment Company Act of 1940 (1940 Act) as anopen-end management investment company, consisting of seven separate funds and applies the specialized accounting and reporting guidance in U.S. Generally Accepted Accounting Principles (U.S. GAAP). Franklin Mutual Beacon Fund (Fund) is included in this report. The Fund offers five classes of shares: Class Z, Class A, Class C, Class R and Class R6. Beginning on October 19, 2018, Class C shares automatically convert to Class A shares after they have been held for 10 years. Each class of shares may differ by its initial sales load, contingent deferred sales charges, voting rights on matters affecting a single class, its exchange privilege and fees due to differing arrangements for distribution and transfer agent fees.
The following summarizes the Fund’s significant accounting policies.
a. Financial Instrument Valuation
The Fund’s investments in financial instruments are carried at fair value daily. Fair value is the price that would be received to sell an asset or paid to transfer a liability in an orderly transaction between market participants on the measurement date. The Fund calculates the net asset value (NAV) per share each business day as of 4 p.m. Eastern time or the regularly scheduled close of the New York Stock Exchange (NYSE), whichever is earlier. Under compliance policies and procedures approved by the Trust’s Board of Trustees (the Board), the Fund’s administrator has responsibility for oversight of valuation, including leading the cross-functional Valuation Committee (VC). The Fund may utilize independent pricing services, quotations from securities and financial instrument dealers, and other market sources to determine fair value.
Equity securities and derivative financial instruments listed on an exchange or on the NASDAQ National Market System are valued at the last quoted sale price or the official closing price of the day, respectively. Foreign equity securities are valued as of the close of trading on the foreign stock exchange on which the security is primarily traded, or as of 4 p.m. Eastern time. The value is then converted into its U.S. dollar equivalent at the foreign exchange rate in effect at 4 p.m. Eastern time on the day that the value of the security is determined.Over-the-counter (OTC) securities are valued within the range of the most recent quoted bid and ask prices. Securities that trade in multiple
markets or on multiple exchanges are valued according to the broadest and most representative market. Certain equity securities are valued based upon fundamental characteristics or relationships to similar securities.
Debt securities generally trade in the OTC market rather than on a securities exchange. The Fund’s pricing services use multiple valuation techniques to determine fair value. In instances where sufficient market activity exists, the pricing services may utilize a market-based approach through which quotes from market makers are used to determine fair value. In instances where sufficient market activity may not exist or is limited, the pricing services also utilize proprietary valuation models which may consider market characteristics such as benchmark yield curves, credit spreads, estimated default rates, anticipated market interest rate volatility, coupon rates, anticipated timing of principal repayments, underlying collateral, and other unique security features in order to estimate the relevant cash flows, which are then discounted to calculate the fair value.
Investments inopen-end mutual funds are valued at the closing NAV.
Certain derivative financial instruments trade in the OTC market. The Fund’s pricing services use various techniques including industry standard option pricing models and proprietary discounted cash flow models to determine the fair value of those instruments. The Fund’s net benefit or obligation under the derivative contract, as measured by the fair value of the contract, is included in net assets.
The Fund has procedures to determine the fair value of financial instruments for which market prices are not reliable or readily available. Under these procedures, the Fund primarily employs a market-based approach which may use related or comparable assets or liabilities, recent transactions, market multiples, book values, and other relevant information for the investment to determine the fair value of the investment. An income-based valuation approach may also be used in which the anticipated future cash flows of the investment are discounted to calculate fair value. Discounts may also be applied due to the nature or duration of any restrictions on the disposition of the investments. Due to the inherent uncertainty of valuations of such investments, the fair values may differ significantly from the values that would have been used had an active market existed.
30 |
Annual Report |
franklintempleton.com |
FRANKLIN MUTUAL BEACON FUND
NOTES TO FINANCIAL STATEMENTS
Trading in securities on foreign securities stock exchanges and OTC markets may be completed before 4 p.m. Eastern time. In addition, trading in certain foreign markets may not take place on every Fund’s business day. Occasionally, events occur between the time at which trading in a foreign security is completed and 4 p.m. Eastern time that might call into question the reliability of the value of a portfolio security held by the Fund. As a result, differences may arise between the value of the Fund’s portfolio securities as determined at the foreign market close and the latest indications of value at 4 p.m. Eastern time. In order to minimize the potential for these differences, the VC monitors price movements following the close of trading in foreign stock markets through a series of country specific market proxies (such as baskets of American Depositary Receipts, futures contracts and exchange traded funds). These price movements are measured against established trigger thresholds for each specific market proxy to assist in determining if an event has occurred that may call into question the reliability of the values of the foreign securities held by the Fund. If such an event occurs, the securities may be valued using fair value procedures, which may include the use of independent pricing services. At December 31, 2018, a market event occurred resulting in a portion of the securities held by the Fund being valued using fair value procedures.
When the last day of the reporting period is anon-business day, certain foreign markets may be open on those days that the Fund’s NAV is not calculated, which could result in differences between the value of the Fund’s portfolio securities on the last business day and the last calendar day of the reporting period. Any significant security valuation changes due to an open foreign market are adjusted and reflected by the Fund for financial reporting purposes.
b. Foreign Currency Translation
Portfolio securities and other assets and liabilities denominated in foreign currencies are translated into U.S. dollars based on the exchange rate of such currencies against U.S. dollars on the date of valuation. The Fund may enter into foreign currency exchange contracts to facilitate transactions denominated in a foreign currency. Purchases and sales of securities, income and expense items denominated in foreign currencies are translated into U.S. dollars at the exchange rate in effect on the transaction date. Portfolio securities and assets and liabilities denominated in foreign currencies contain risks that those currencies will decline in value relative to the U.S. dollar. Occasionally, events may impact the availability or reliability of foreign exchange
rates used to convert the U.S. dollar equivalent value. If such an event occurs, the foreign exchange rate will be valued at fair value using procedures established and approved by the Board.
The Fund does not separately report the effect of changes in foreign exchange rates from changes in market prices on securities held. Such changes are included in net realized and unrealized gain or loss from investments in the Statement of Operations.
Realized foreign exchange gains or losses arise from sales of foreign currencies, currency gains or losses realized between the trade and settlement dates on securities transactions and the difference between the recorded amounts of dividends, interest, and foreign withholding taxes and the U.S. dollar equivalent of the amounts actually received or paid. Net unrealized foreign exchange gains and losses arise from changes in foreign exchange rates on foreign denominated assets and liabilities other than investments in securities held at the end of the reporting period.
c. Derivative Financial Instruments
The Fund invested in derivative financial instruments in order to manage risk or gain exposure to various other investments or markets. Derivatives are financial contracts based on an underlying or notional amount, require no initial investment or an initial net investment that is smaller than would normally be required to have a similar response to changes in market factors, and require or permit net settlement. Derivatives contain various risks including the potential inability of the counterparty to fulfill their obligations under the terms of the contract, the potential for an illiquid secondary market, and/or the potential for market movements which expose the Fund to gains or losses in excess of the amounts shown in the Statement of Assets and Liabilities. Realized gain and loss and unrealized appreciation and depreciation on these contracts for the period are included in the Statement of Operations.
Derivative counterparty credit risk is managed through a formal evaluation of the creditworthiness of all potential counterparties. The Fund attempts to reduce its exposure to counterparty credit risk on OTC derivatives, whenever possible, by entering into International Swaps and Derivatives Association (ISDA) master agreements with certain counterparties. These agreements contain various provisions, including but not limited to collateral requirements, events of default, or early termination. Termination events applicable to
franklintempleton.com |
Annual Report |
31 |
FRANKLIN MUTUAL BEACON FUND
NOTES TO FINANCIAL STATEMENTS
1. Organization and Significant Accounting Policies(continued)
c. Derivative Financial Instruments(continued)
the counterparty include certain deteriorations in the credit quality of the counterparty. Termination events applicable to the Fund include failure of the Fund to maintain certain net asset levels and/or limit the decline in net assets over various periods of time. In the event of default or early termination, the ISDA master agreement gives thenon-defaulting party the right to net andclose-out all transactions traded, whether or not arising under the ISDA agreement, to one net amount payable by one counterparty to the other. However, absent an event of default or early termination, OTC derivative assets and liabilities are presented gross and not offset in the Statement of Assets and Liabilities. Early termination by the counterparty may result in an immediate payment by the Fund of any net liability owed to that counterparty under the ISDA agreement. At December 31, 2018, the Fund had OTC derivatives in a net liability position of $44,663.
Collateral requirements differ by type of derivative. Collateral or initial margin requirements are set by the broker or exchange clearing house for exchange traded and centrally cleared derivatives. Initial margin deposited is held at the exchange and can be in the form of cash and/or securities. For OTC derivatives traded under an ISDA master agreement, posting of collateral is required by either the Fund or the applicable counterparty if the total net exposure of all OTC derivatives with the applicable counterparty exceeds the minimum transfer amount, which typically ranges from $100,000 to $250,000, and can vary depending on the counterparty and the type of the agreement. Generally, collateral is determined at the close of Fund business each day and any additional collateral required due to changes in derivative values may be delivered by the Fund or the counterparty the next business day, or within a few business days. Collateral pledged and/or received by the Fund for OTC derivatives, if any, is held in segregated accounts with the Fund’s custodian/counterparty broker and can be in the form of cash and/or securities. Unrestricted cash may be invested according to the Fund’s investment objectives. To the extent that the amounts due to the Fund from its counterparties are not subject to collateralization or are not fully collateralized, the Fund bears the risk of loss from counterpartynon-performance.
At December 31, 2018, the Fund received $3,753,889 in U.K. Treasury Bonds and U.S. Treasury Bills, Bonds and Notes as collateral for derivatives.
The Fund entered into exchange traded futures contracts primarily to manage exposure to certain foreign currencies. A futures contract is an agreement between the Fund and a counterparty to buy or sell an asset at a specified price on a future date. Required initial margins are pledged by the Fund, and the daily change in fair value is accounted for as a variation margin payable or receivable in the Statement of Assets and Liabilities.
The Fund entered into OTC forward exchange contracts primarily to manage exposure to certain foreign currencies. A forward exchange contract is an agreement between the Fund and a counterparty to buy or sell a foreign currency at a specific exchange rate on a future date.
See Note 11 regarding other derivative information.
d. Securities Sold Short
The Fund is engaged in selling securities short, which obligates the Fund to replace a borrowed security with the same security at current fair value. The Fund incurs a loss if the price of the security increases between the date of the short sale and the date on which the Fund replaces the borrowed security. The Fund realizes a gain if the price of the security declines between those dates. Gains are limited to the price at which the Fund sold the security short, while losses are potentially unlimited in size.
The Fund is required to establish a margin account with the broker lending the security sold short. While the short sale is outstanding, the broker retains the proceeds of the short sale to the extent necessary to meet margin requirements until the short position is closed out. A deposit must also be maintained with the Fund’s custodian/counterparty broker consisting of cash and/or securities having a value equal to a specified percentage of the value of the securities sold short. The Fund is obligated to pay fees for borrowing the securities sold short and is required to pay the counterparty any dividends and/or interest due on securities sold short. Such dividends and/or interest and any security borrowing fees are recorded as an expense to the Fund.
e. Securities Lending
The Fund participates in an agency based securities lending program to earn additional income. The Fund receives cash collateral against the loaned securities in an amount equal to at
32 |
Annual Report |
franklintempleton.com |
FRANKLIN MUTUAL BEACON FUND
NOTES TO FINANCIAL STATEMENTS
least 102% of the fair value of the loaned securities. Collateral is maintained over the life of the loan in an amount not less than 100% of the fair value of loaned securities, as determined at the close of Fund business each day; any additional collateral required due to changes in security values is delivered to the Fund on the next business day. The collateral is deposited into a joint cash account with other funds and is used to invest in a money market fund managed by Franklin Advisers, Inc., an affiliate of the Fund, and/or a joint repurchase agreement. The Fund may receive income from the investment of cash collateral, in addition to lending fees and rebates paid by the borrower. Income from securities loaned, net of fees paid to the securities lending agent and/or third-party vendor, is reported separately in the Statement of Operations. The Fund bears the market risk with respect to the collateral investment, securities loaned, and the risk that the agent may default on its obligations to the Fund. If the borrower defaults on its obligation to return the securities loaned, the Fund has the right to repurchase the securities in the open market using the collateral received. The securities lending agent has agreed to indemnify the Fund in the event of default by a third party borrower. At December 31, 2018, the Fund had no securities on loan.
f. Senior Floating Rate Interests
The Fund invests in senior secured corporate loans that pay interest at rates which are periodically reset by reference to a base lending rate plus a spread. These base lending rates are generally the prime rate offered by a designated U.S. bank or the London InterBank Offered Rate (LIBOR). Senior secured corporate loans often require prepayment of principal from excess cash flows or at the discretion of the borrower. As a result, actual maturity may be substantially less than the stated maturity. Senior secured corporate loans in which the Fund invests are generally readily marketable, but may be subject to certain restrictions on resale.
g. Income and Deferred Taxes
It is the Fund’s policy to qualify as a regulated investment company under the Internal Revenue Code. The Fund intends to distribute to shareholders substantially all of its taxable income and net realized gains to relieve it from federal income and excise taxes. As a result, no provision for U.S. federal income taxes is required.
The Fund may be subject to foreign taxation related to income received, capital gains on the sale of securities and certain foreign currency transactions in the foreign jurisdictions in
which it invests. Foreign taxes, if any, are recorded based on the tax regulations and rates that exist in the foreign markets in which the Fund invests. When a capital gain tax is determined to apply, the Fund records an estimated deferred tax liability in an amount that would be payable if the securities were disposed of on the valuation date.
As a result of several court cases, in certain countries across the European Union, the Fund filed additional tax reclaims for previously withheld taxes on dividends earned in those countries (EU reclaims). These additional filings are subject to various administrative proceedings by the local jurisdictions’ tax authorities within the European Union, as well as a number of related judicial proceedings. Income recognized, if any, for EU reclaims is reflected as other income in the Statement of Operations and any related receivable, if any, is reflected as European Union tax reclaims in the Statement of Assets and Liabilities. When uncertainty exists as to the ultimate resolution of these proceedings, the likelihood of receipt of these EU reclaims, and the potential timing of payment, no amounts are reflected in the financial statements. For U.S. income tax purposes, EU reclaims received by the Fund, if any, reduce the amounts of foreign taxes Fund shareholders can use as tax credits in their individual income tax returns.
The Fund may recognize an income tax liability related to its uncertain tax positions under U.S. GAAP when the uncertain tax position has a less than 50% probability that it will be sustained upon examination by the tax authorities based on its technical merits. As of December 31, 2018, the Fund has determined that no tax liability is required in its financial statements related to uncertain tax positions for any open tax years (or expected to be taken in future tax years). Open tax years are those that remain subject to examination and are based on the statute of limitations in each jurisdiction in which the Fund invests.
h. Security Transactions, Investment Income, Expenses and Distributions
Security transactions are accounted for on trade date. Realized gains and losses on security transactions are determined on a specific identification basis. Interest income and estimated expenses are accrued daily. Amortization of premium and accretion of discount on debt securities are included in interest income. Dividend income and dividends declared on securities sold short are recorded on theex-dividend date except for certain dividends from securities where the dividend rate is not
franklintempleton.com |
Annual Report |
33 |
FRANKLIN MUTUAL BEACON FUND
NOTES TO FINANCIAL STATEMENTS
1. Organization and Significant Accounting Policies(continued)
h. Security Transactions, Investment Income, Expenses and Distributions(continued)
available. In such cases, the dividend is recorded as soon as the information is received by the Fund. Distributions to shareholders are recorded on theex-dividend date. Distributable earnings are determined according to income tax regulations (tax basis) and may differ from earnings recorded in accordance with U.S. GAAP. These differences may be permanent or temporary. Permanent differences are reclassified among capital accounts to reflect their tax character. These reclassifications have no impact on net assets or the results of operations. Temporary differences are not reclassified, as they may reverse in subsequent periods.*
Common expenses incurred by the Trust are allocated among the Funds based on the ratio of net assets of each Fund to the combined net assets of the Trust or based on the ratio of number of shareholders of each Fund to the combined number of shareholders of the Trust. Fund specific expenses are charged directly to the Fund that incurred the expense.
Realized and unrealized gains and losses and net investment income, excluding class specific expenses, are allocated daily to each class of shares based upon the relative proportion of net assets of each class. Differences in per share distributions by class are generally due to differences in class specific expenses.
i. Accounting Estimates
The preparation of financial statements in accordance with U.S. GAAP requires management to make estimates and assumptions that affect the reported amounts of assets and liabilities at the date of the financial statements and the amounts of income and expenses during the reporting period. Actual results could differ from those estimates.
j. Guarantees and Indemnifications
Under the Trust’s organizational documents, its officers and trustees are indemnified by the Trust against certain liabilities arising out of the performance of their duties to the Trust. Additionally, in the normal course of business, the Trust, on behalf of the Fund, enters into contracts with service providers that contain general indemnification clauses. The Trust’s maximum exposure under these arrangements is unknown as this would involve future claims that may be made against the Trust that have not yet occurred. Currently, the Trust expects the risk of loss to be remote.
*Effective during the current reporting period, it is no longer required to present certain line items in the Statements of Changes in Net Assets. The below prior period amounts affected by this change are shown as they were in the prior year Statements of Changes in Net Assets.
For the year ended December 31, 2017, distributions to shareholders were as follows:
Distributions from net investment income : | ||||
Class Z | $ | (48,496,718 | ) | |
Class A | (15,320,414 | ) | ||
Class C | (2,055,677 | ) | ||
Class R | (23,201 | ) | ||
Class R6 | (1,872,829 | ) | ||
Distributions from net realized gains: | ||||
Class Z | (91,365,841 | ) | ||
Class A | (33,271,239 | ) | ||
Class C | (8,974,316 | ) | ||
Class R | (65,148 | ) | ||
Class R6 | (2,256,073 | ) |
For the year ended December 31, 2017, undistributed net investment income included in net assets was $1,171,624.
34 |
Annual Report |
franklintempleton.com |
FRANKLIN MUTUAL BEACON FUND
NOTES TO FINANCIAL STATEMENTS
2. Shares of Beneficial Interest
At December 31, 2018, there were an unlimited number of shares authorized (without par value). Transactions in the Fund’s shares were as follows:
| Year Ended December 31, | ||||||||||||||||
| 2018 | 2017 | |||||||||||||||
| Shares | Amount | Shares | Amount | |||||||||||||
| Class Z Shares: | ||||||||||||||||
Shares sold | 8,257,116 | $ | 133,575,147 | 12,158,938 | $ | 199,279,041 | ||||||||||
Shares issued in reinvestment of distributions | 15,183,241 | 206,770,472 | 7,927,106 | 130,651,385 | ||||||||||||
Shares redeemed | (20,924,183 | ) | (339,804,902 | ) | (25,064,661 | ) | (416,359,870 | ) | ||||||||
Net increase (decrease) | 2,516,174 | $ | 540,717 | (4,978,617 | ) | $ | (86,429,444 | ) | ||||||||
| Class A Shares: | ||||||||||||||||
Shares solda | 13,762,741 | $ | 220,038,461 | 5,808,494 | $ | 94,712,185 | ||||||||||
Shares issued in reinvestment of distributions | 6,066,419 | 81,741,950 | 2,889,127 | 47,191,652 | ||||||||||||
Shares redeemed | (14,199,056 | ) | (229,031,604 | ) | (14,375,309 | ) | (234,062,403 | ) | ||||||||
Net increase (decrease) | 5,630,104 | $ | 72,748,807 | (5,677,688 | ) | $ | (92,158,566 | ) | ||||||||
| Class C Shares: | ||||||||||||||||
Shares sold | 777,745 | $ | 12,227,859 | 1,150,062 | $ | 18,503,214 | ||||||||||
Shares issued in reinvestment of distributions | 398,415 | 5,563,069 | 672,846 | 10,882,501 | ||||||||||||
Shares redeemeda | (12,713,218 | ) | (203,781,980 | ) | (4,170,647 | ) | (67,550,811 | ) | ||||||||
Net increase (decrease) | (11,537,058 | ) | $ | (185,991,052 | ) | (2,347,739 | ) | $ | (38,165,096 | ) | ||||||
| Class R Shares: | ||||||||||||||||
Shares sold | 27,604 | $ | 454,716 | 32,014 | $ | 516,552 | ||||||||||
Shares issued in reinvestment of distributions | 11,829 | 157,768 | 5,476 | 88,349 | ||||||||||||
Shares redeemed | (14,360 | ) | (222,467 | ) | (74,775 | ) | (1,212,237 | ) | ||||||||
Net increase (decrease) | 25,073 | $ | 390,017 | (37,285 | ) | $ | (607,336 | ) | ||||||||
| Class R6 Shares: | ||||||||||||||||
Shares sold | 1,125,287 | $ | 18,530,681 | 6,649,392 | $ | 112,866,490 | ||||||||||
Shares issued in reinvestment of distributions | 570,780 | 7,773,465 | 249,808 | 4,128,902 | ||||||||||||
Shares redeemed | (2,360,255 | ) | (38,879,559 | ) | (503,515 | ) | (8,443,891 | ) | ||||||||
Net increase (decrease) | (664,188 | ) | $ | (12,575,413 | ) | 6,395,685 | $ | 108,551,501 | ||||||||
aMay include a portion of Class C shares that were automatically converted to Class A.
3. Transactions with Affiliates
Franklin Resources, Inc. is the holding company for various subsidiaries that together are referred to as Franklin Templeton. Certain officers and trustees of the Fund are also officers and/or directors of the following subsidiaries:
| Subsidiary | Affiliation | |
Franklin Mutual Advisers, LLC (Franklin Mutual) | Investment manager | |
Franklin Templeton Services, LLC (FT Services) | Administrative manager | |
Franklin Templeton Distributors, Inc. (Distributors) | Principal underwriter | |
Franklin Templeton Investor Services, LLC (Investor Services) | Transfer agent |
franklintempleton.com |
Annual Report |
35 |
FRANKLIN MUTUAL BEACON FUND
NOTES TO FINANCIAL STATEMENTS
3. Transactions with Affiliates(continued)
a. Management Fees
The Fund pays an investment management fee to Franklin Mutual based on the average daily net assets of the Fund as follows:
| Annualized Fee Rate | Net Assets | |||
0.675% | Up to and including $5 billion | |||
0.645% | Over $5 billion, up to and including $7 billion | |||
0.625% | Over $7 billion, up to and including $10 billion | |||
0.615% | In excess of $10 billion | |||
For the year ended December 31, 2018, the gross effective investment management fee rate was 0.675% of the Fund’s average daily net assets.
b. Administrative Fees
Under an agreement with Franklin Mutual, FT Services provides administrative services to the Fund. The fee is paid by Franklin Mutual based on the Fund’s average daily net assets, and is not an additional expense of the Fund.
c. Distribution Fees
The Board has adopted distribution plans for each share class, with the exception of Class Z and Class R6 shares, pursuant to Rule12b-1 under the 1940 Act. Under the Fund’s Class A reimbursement distribution plan, the Fund reimburses Distributors for costs incurred in connection with the servicing, sale and distribution of the Fund’s shares up to the maximum annual plan rate. Under the Class A reimbursement distribution plan, costs exceeding the maximum for the current plan year cannot be reimbursed in subsequent periods. In addition, under the Fund’s Class C and R compensation distribution plans, the Fund pays Distributors for costs incurred in connection with the servicing, sale and distribution of the Fund’s shares up to the maximum annual plan rate for each class. The plan year, for purposes of monitoring compliance with the maximum annual plan rates, is February 1 through January 31.
The maximum annual plan rates, based on the average daily net assets, for each class, are as follows:
Class A | 0.35 | % | ||
Class C | 1.00 | % | ||
Class R | 0.50 | % |
The Board has set the current rate at 0.25% per year for Class A shares until further notice and approval by the Board.
d. Sales Charges/Underwriting Agreements
Front-end sales charges and contingent deferred sales charges (CDSC) do not represent expenses of the Fund. These charges are deducted from the proceeds of sales of Fund shares prior to investment or from redemption proceeds prior to remittance, as applicable. Distributors has advised the Fund of the following commission transactions related to the sales and redemptions of the Fund’s shares for the year:
Sales charges retained net of commissions paid to unaffiliated brokers/dealers | $ | 70,223 | ||
CDSC retained | $ | 9,451 |
Effective September 10, 2018, the Board approved changes to certainfront-end sales charges and dealer commissions on Class A shares. Further details are disclosed in the Fund’s Prospectus.
36 |
Annual Report |
franklintempleton.com |
FRANKLIN MUTUAL BEACON FUND
NOTES TO FINANCIAL STATEMENTS
e. Transfer Agent Fees
Each class of shares pays transfer agent fees to Investor Services for its performance of shareholder servicing obligations. The fees are based on an annualized asset based fee of 0.02% plus a transaction based fee. In addition, each class reimburses Investor Services for out of pocket expenses incurred and, except for Class R6, reimburses shareholder servicing fees paid to third parties. These fees are allocated daily based upon their relative proportion of such classes’ aggregate net assets. Class R6 pays Investor Services transfer agent fees specific to that class.
For the year ended December 31, 2018, the Fund paid transfer agent fees of $3,304,169, of which $1,629,059 was retained by Investor Services.
f. Investments in Affiliated Management Investment Companies
The Fund invests in one or more affiliated management investment companies for purposes other than exercising a controlling influence over the management or policies. Management fees paid by the Fund are waived on assets invested in the affiliated management investment companies, as noted in the Statement of Operations, in an amount not to exceed the management and administrative fees paid directly or indirectly by each affiliate. During the year ended December 31, 2018, the Fund held investments in affiliated management investment companies as follows:
| Number of Shares Held at Beginning of Year | Gross Additions | Gross Reductions | Number of Shares Held at End of Year | Value at End of Year | Income from securities loaned | Realized Gain (Loss) | Net Change in Unrealized Appreciation (Depreciation) | |||||||||||||||||||||||||
| Non-Controlled Affiliates | ||||||||||||||||||||||||||||||||
Institutional Fiduciary Trust Money Market Portfolio, 1.99% | — | 16,525,000 | (16,525,000 | ) | — | $ — | $20,195 | $ — | $ — | |||||||||||||||||||||||
g. Waiver and Expense Reimbursements
Investor Services has voluntarily agreed in advance to waive or limit its fees so that the Class R6 transfer agent fees do not exceed 0.02% based on the average net assets of the class. Investor Services may discontinue this waiver in the future.
4. Expense Offset Arrangement
The Fund has entered into an arrangement with its custodian whereby credits realized as a result of uninvested cash balances are used to reduce a portion of the Fund’s custodian expenses. During the year ended December 31, 2018, the custodian fees were reduced as noted in the Statement of Operations.
5. Independent Trustees’ Retirement Plan
On January 1, 1993, the Trust adopted an Independent Trustees’ Retirement Plan (Plan). The Plan is an unfunded defined benefit plan that provides benefit payments to Trustees whose length of service and retirement age meets the eligibility requirements of the Plan. Benefits under the Plan are based on years of service and fees paid to each trustee at the time of retirement. Effective in December 1996, the Plan was closed to new participants.
During the year ended December 31, 2018, the Fund’s projected benefit obligation and benefit payments under the Plan were as follows:
franklintempleton.com |
Annual Report |
37 |
FRANKLIN MUTUAL BEACON FUND
NOTES TO FINANCIAL STATEMENTS
5. Independent Trustees’ Retirement Plan(continued)
aProjected benefit obligation at December 31, 2018 | $ | 277,183 | ||
bIncrease in projected benefit obligation | $ | 60,374 | ||
Benefit payments made to retired trustees | $ | (4,114 | ) |
aThe projected benefit obligation is included in trustees’ fees and expenses in the Statement of Assets and Liabilities.
bThe increase in projected benefit obligation is included in trustees’ fees and expenses in the Statement of Operations.
6. Income Taxes
The tax character of distributions paid during the years ended December 31, 2018 and 2017, was as follows:
| 2018 | 2017 | |||||||
|
| |||||||
Distributions paid from: | ||||||||
Ordinary income | $ | 65,063,571 | $ | 78,895,649 | ||||
Long term capital gain | 253,934,676 | 124,805,807 | ||||||
|
| |||||||
| $ | 318,998,247 | $ | 203,701,456 | |||||
|
| |||||||
At December 31, 2018, the cost of investments, net unrealized appreciation (depreciation), undistributed ordinary income and undistributed long term capital gains for income tax purposes were as follows:
Cost of investments | $ | 3,058,994,182 | ||
|
| |||
Unrealized appreciation | $ | 495,689,764 | ||
Unrealized depreciation | (311,859,312 | ) | ||
|
| |||
Net unrealized appreciation (depreciation) | $ | 183,830,452 | ||
|
| |||
Distributable earnings: | ||||
Undistributed ordinary income | $ | 31,553,512 | ||
Undistributed long term capital gains | 59,636,597 | |||
|
| |||
Total distributable earnings | $ | 91,190,109 | ||
|
| |||
Differences between income and/or capital gains as determined on a book basis and a tax basis are primarily due to differing treatments of foreign currency transactions and passive foreign investment company shares.
The Fund utilized a tax accounting practice to treat a portion of the proceeds from capital shares redeemed as a distribution from realized capital gains.
7. Investment Transactions
Purchases and sales of investments (excluding short term securities and securities sold short) for the year ended December 31, 2018, aggregated $1,729,279,007 and $1,973,753,487, respectively.
8. Credit Risk and Defaulted Securities
The Fund may purchase thepre-default or defaulted debt of distressed companies. Distressed companies are financially troubled and could be or are already involved in financial restructuring or bankruptcy. Risks associated with purchasing these securities include the possibility that the bankruptcy or other restructuring process takes longer than expected, or that distributions in restructuring are
38 |
Annual Report |
franklintempleton.com |
FRANKLIN MUTUAL BEACON FUND
NOTES TO FINANCIAL STATEMENTS
less than anticipated, either or both of which may result in unfavorable consequences to the Fund. If it becomes probable that the income on debt securities, including those of distressed companies, will not be collected, the Fund discontinues accruing income and recognizes an adjustment for uncollectible interest.
At December 31, 2018, the aggregate long value of distressed company securities for which interest recognition has been discontinued was $26,870,424, representing 0.8% of the Fund’s net assets. For information as to specific securities, see the accompanying Statement of Investments.
9. Concentration of Risk
Investing in foreign securities may include certain risks and considerations not typically associated with investing in U.S. securities, such as fluctuating currency values and changing local and regional economic, political and social conditions, which may result in greater market volatility. Current political and financial uncertainty surrounding the European Union may increase market volatility and the economic risk of investing in securities in Europe. In addition, certain foreign securities may not be as liquid as U.S. securities.
10. Restricted Securities
The Fund invests in securities that are restricted under the Securities Act of 1933 (1933 Act). Restricted securities are often purchased in private placement transactions, and cannot be sold without prior registration unless the sale is pursuant to an exemption under the 1933 Act. Disposal of these securities may require greater effort and expense, and prompt sale at an acceptable price may be difficult. The Fund may have registration rights for restricted securities. The issuer generally incurs all registration costs.
At December 31, 2018, investments in restricted securities, excluding securities exempt from registration under the 1933 Act deemed to be liquid, were as follows:
| Principal Amount/ Shares | Issuer | Acquisition Date | Cost | Value | ||||||||||||
| 10,848 | Broadband Ventures III LLC, secured promissory note, 5.00%, 2/01/12 | 7/01/10 - 11/30/12 | $ | 10,848 | $ | — | ||||||||||
| 2,846,329 | International Automotive Components Group Brazil LLC | 4/13/06 - 12/26/08 | 1,890,264 | 120,619 | ||||||||||||
| 22,836,904 | International Automotive Components Group North America LLC | 1/12/06 - 3/18/13 | 18,692,218 | 2,722,159 | ||||||||||||
Total Restricted Securities(Value is 0.1% of Net Assets) | $ | 20,593,330 | $ | 2,842,778 | ||||||||||||
11. Other Derivative Information
At December 31, 2018, the Fund’s investments in derivative contracts are reflected in the Statement of Assets and Liabilities as follows:
| Asset Derivatives | Liability Derivatives | |||||||||||||||||||||||
Derivative Contracts Not Accounted for as Hedging Instruments | Statement of Assets and Liabilities Location | Fair Value | Statement of Assets and Liabilities Location | Fair Value | ||||||||||||||||||||
Foreign exchange contracts | Variation margin on futures contracts | $ | 210,476 | a | Variation margin on futures contracts | $ — | ||||||||||||||||||
Unrealized appreciation on OTC forward exchange contracts | 3,476,307 | Unrealized depreciation on OTC forward exchange contracts | 742,159 | |||||||||||||||||||||
|
| |||||||||||||||||||||||
Totals | $ | 3,686,783 | $742,159 | |||||||||||||||||||||
|
| |||||||||||||||||||||||
aThis amount reflects the cumulative appreciation (depreciation) of futures contracts as reported in the Statement of Investments. Only the variation margin receivable/ payable at year end is separately reported within the Statement of Assets and Liabilities. Prior variation margin movements were recorded to cash upon receipt or payment.
franklintempleton.com |
Annual Report |
39 |
FRANKLIN MUTUAL BEACON FUND
NOTES TO FINANCIAL STATEMENTS
11. Other Derivative Information(continued)
For the year ended December 31, 2018, the effect of derivative contracts in the Fund’s Statement of Operations was as follows:
Derivative Contracts Not Accounted for as Hedging Instruments | Statement of Operations Location | Net Realized Gain (Loss) for the Year | Statement of Operations Location | Net Change in Unrealized Appreciation (Depreciation) for the Year | ||||||||||||||||||||
| Net realized gain (loss) from: | Net change in unrealized appreciation (depreciation) on: | |||||||||||||||||||||||
| Foreign exchange contracts | Forward exchange contracts | $12,657,327 | Forward exchange contracts | $21,388,656 | ||||||||||||||||||||
| Futures contracts | 17,946,424 | Futures contracts | 4,450,073 | |||||||||||||||||||||
Totals | $30,603,751 | $25,838,729 | ||||||||||||||||||||||
For the year ended December 31, 2018, the average month end notional amount of futures contracts represented $298,479,662. The average month end contract value of forward exchange contracts was $615,763,216.
See Note 1(c) regarding derivative financial instruments.
12. Holdings of 5% Voting Securities of Portfolio Companies
The 1940 Act defines “affiliated companies” to include investments in portfolio companies in which a fund owns 5% or more of the outstanding voting securities. During the year ended December 31, 2018, investments in “affiliated companies” were as follows:
| Name of Issuer | Number of Shares Held at Beginning of Year | Gross Additions | Gross Reductions | Number of Shares Held at End of Year | Value at End of Year | Dividend Income | Realized Gain | Net Change in Unrealized Appreciation (Depreciation) | ||||||||||||||||||||||||||||
| Non-Controlled Affiliates | ||||||||||||||||||||||||||||||||||||
CB FIM Coinvestors LLC | 15,831,950 | — | (15,831,950 | )a | — | $— | $— | $10,196 | $— | |||||||||||||||||||||||||||
aGross reduction was the result of a corporate action.
13. Credit Facility
The Fund, together with other U.S. registered and foreign investment funds (collectively, Borrowers), managed by Franklin Templeton, are borrowers in a joint syndicated senior unsecured credit facility totaling $2 billion (Global Credit Facility) which matured on February 8, 2019. This Global Credit Facility provides a source of funds to the Borrowers for temporary and emergency purposes, including the ability to meet future unanticipated or unusually large redemption requests. Effective February 8, 2019, the Borrowers renewed the Global Credit Facility for a one year term, maturing February 7, 2020, for a total of $2 billion.
Under the terms of the Global Credit Facility, the Fund shall, in addition to interest charged on any borrowings made by the Fund and other costs incurred by the Fund, pay its share of fees and expenses incurred in connection with the implementation and maintenance of the Global Credit Facility, based upon its relative share of the aggregate net assets of all of the Borrowers, including an annual commitment fee of 0.15% based upon the unused portion of the Global Credit Facility. These fees are reflected in other expenses in the Statement of Operations. During the year ended December 31, 2018, the Fund did not use the Global Credit Facility.
40 |
Annual Report |
franklintempleton.com |
FRANKLIN MUTUAL BEACON FUND
NOTES TO FINANCIAL STATEMENTS
14. Fair Value Measurements
The Fund follows a fair value hierarchy that distinguishes between market data obtained from independent sources (observable inputs) and the Fund’s own market assumptions (unobservable inputs). These inputs are used in determining the value of the Fund’s financial instruments and are summarized in the following fair value hierarchy:
| • | Level 1 – quoted prices in active markets for identical financial instruments |
| • | Level 2 – other significant observable inputs (including quoted prices for similar financial instruments, interest rates, prepayment speed, credit risk, etc.) |
| • | Level 3 – significant unobservable inputs (including the Fund’s own assumptions in determining the fair value of financial instruments) |
The input levels are not necessarily an indication of the risk or liquidity associated with financial instruments at that level.
A summary of inputs used as of December 31, 2018, in valuing the Fund’s assets and liabilities carried at fair value, is as follows:
| Level 1 | Level 2 | Level 3 | Total | |||||||||||||
| ||||||||||||||||
| Assets: | ||||||||||||||||
Investments in Securities:a | ||||||||||||||||
Equity Investments:b | ||||||||||||||||
Auto Components | $ | — | $ | — | $ | 2,842,778 | $ | 2,842,778 | ||||||||
Automobiles | — | 72,080,616 | — | 72,080,616 | ||||||||||||
Chemicals | — | 66,659,457 | — | c | 66,659,457 | |||||||||||
Media | 202,216,510 | 668,857 | — | 202,885,367 | ||||||||||||
Specialty Retail | — | 67,547,069 | — | 67,547,069 | ||||||||||||
All Other Equity Investments | 2,676,017,459 | — | — | 2,676,017,459 | ||||||||||||
Corporate Notes and Senior Floating Rate Interests | — | 69,130,844 | — | 69,130,844 | ||||||||||||
Corporate Notes and Senior Floating Rate Interests in Reorganization | — | 26,870,424 | — | c | 26,870,424 | |||||||||||
Companies in Liquidation | — | 41,654 | — | c | 41,654 | |||||||||||
Short Term Investments | 86,050,852 | 9,300,000 | — | 95,350,852 | ||||||||||||
|
| |||||||||||||||
Total Investments in Securities | $ | 2,964,284,821 | $ | 312,298,921 | $ | 2,842,778 | $ | 3,279,426,520 | ||||||||
|
| |||||||||||||||
Other Financial Instruments: | ||||||||||||||||
Futures Contracts | $ | 210,476 | $ | — | $ | — | $ | 210,476 | ||||||||
Forward Exchange Contracts | — | 3,476,307 | — | 3,476,307 | ||||||||||||
|
| |||||||||||||||
Total Other Financial Instruments | $ | 210,476 | $ | 3,476,307 | $ | — | $ | 3,686,783 | ||||||||
|
| |||||||||||||||
| Liabilities: | ||||||||||||||||
Other Financial Instruments: | ||||||||||||||||
Securities Sold Shorta | $ | 39,553,897 | $ | — | $ | — | $ | 39,553,897 | ||||||||
Forward Exchange Contracts | — | 742,159 | — | 742,159 | ||||||||||||
|
| |||||||||||||||
Total Other Financial Instruments | $ | 39,553,897 | $ | 742,159 | $ | — | $ | 40,296,056 | ||||||||
|
| |||||||||||||||
aFor detailed categories, see the accompanying Statement of Investments.
bIncludes common, preferred stocks and management investment companies as well as other equity interests.
cIncludes securities determined to have no value at December 31, 2018.
A reconciliation of assets in which Level 3 inputs are used in determining fair value is presented when there are significant Level 3 financial instruments at the beginning and/or end of the year.
franklintempleton.com |
Annual Report |
41 |
FRANKLIN MUTUAL BEACON FUND
NOTES TO FINANCIAL STATEMENTS
15. New Accounting Pronouncements
In August 2018, the Financial Accounting Standards Board issued Accounting Standards Update (ASU)No. 2018-14, Compensation—Retirement Benefits—Defined Benefit Plans—General (Subtopic715-20): Disclosure Framework—Changes to the Disclosure Requirements for Defined Benefit Plans. The amendments in the ASU modify the disclosure requirements for employers that sponsor defined benefit pension or other postretirement plans. The ASU is effective for annual reporting periods ending after December 15, 2020. Management is currently evaluating the impact, if any, of applying this provision.
16. Subsequent Events
The Fund has evaluated subsequent events through the issuance of the financial statements and determined that no events have occurred that require disclosure other than those already disclosed in the financial statements.
Abbreviations
| Counterparty | Currency | Selected Portfolio | ||||||||
| BOFA | Bank of America Corp. | EUR | Euro | ADR | American Depositary Receipt | |||||
| BONY | The Bank of New York Mellon Corp. | GBP | British Pound | FHLB | Federal Home Loan Bank | |||||
| HSBK | HSBC Bank PLC | USD | United States Dollar | LIBOR | London InterBank Offered Rate | |||||
| SSBT | State Street Bank and Trust Co., N.A. | |||||||||
| UBSW | UBS AG | |||||||||
42 |
Annual Report |
franklintempleton.com |
FRANKLIN MUTUAL BEACON FUND
Report of Independent Registered Public Accounting Firm
To the Board of Trustees of Franklin Mutual Series Funds and Shareholders of Franklin Mutual Beacon Fund:
Opinion on the Financial Statements
We have audited the accompanying statement of assets and liabilities of Franklin Mutual Beacon Fund (the “Fund”) (one of the funds constituting Franklin Mutual Series Funds), including the schedule of investments, as of December 31, 2018, and the related statement of operations for the year then ended, the statements of changes in net assets for each of the two years in the period then ended, the financial highlights for each of the five years in the period then ended and the related notes (collectively referred to as the “financial statements”). In our opinion, the financial statements present fairly, in all material respects, the financial position of Franklin Mutual Beacon Fund (one of the funds constituting Franklin Mutual Series Funds) at December 31, 2018, the results of its operations for the year then ended, the changes in its net assets for each of the two years in the period then ended and its financial highlights for each of the five years in the period then ended, in conformity with U.S. generally accepted accounting principles.
Basis for Opinion
These financial statements are the responsibility of the Fund’s management. Our responsibility is to express an opinion on the Fund’s financial statements based on our audits. We are a public accounting firm registered with the Public Company Accounting Oversight Board (United States) (“PCAOB”) and are required to be independent with respect to the Fund in accordance with the U.S. federal securities laws and the applicable rules and regulations of the Securities and Exchange Commission and the PCAOB.
We conducted our audits in accordance with the standards of the PCAOB. Those standards require that we plan and perform the audit to obtain reasonable assurance about whether the financial statements are free of material misstatement, whether due to error or fraud. The Fund is not required to have, nor were we engaged to perform, an audit of the Fund’s internal control over financial reporting. As part of our audits, we are required to obtain an understanding of internal control over financial reporting, but not for the purpose of expressing an opinion on the effectiveness of the Fund’s internal control over financial reporting. Accordingly, we express no such opinion.
Our audits included performing procedures to assess the risks of material misstatement of the financial statements, whether due to error or fraud, and performing procedures that respond to those risks. Such procedures included examining, on a test basis, evidence regarding the amounts and disclosures in the financial statements. Our procedures included confirmation of securities owned as of December 31, 2018, by correspondence with the custodian and brokers. Our audits also included evaluating the accounting principles used and significant estimates made by management, as well as evaluating the overall presentation of the financial statements. We believe that our audits provide a reasonable basis for our opinion.

We have served as the auditor of one or more Franklin investment companies since 1987.
Boston, Massachusetts
February 20, 2019
franklintempleton.com |
Annual Report |
43 |
FRANKLIN MUTUAL BEACON FUND
Under Section 852(b)(3)(C) of the Internal Revenue Code, the Fund hereby reports the maximum amount allowable but no less than $285,113,004 as a long term capital gain dividend for the fiscal year ended December 31, 2018.
Under Section 854(b)(1)(A) of the Internal Revenue Code, the Fund hereby reports 52.54% of the ordinary income dividends as income qualifying for the dividends received deduction for the fiscal year ended December 31, 2018.
Under Section 854(b)(1)(B) of the Internal Revenue Code, the Fund hereby reports the maximum amount allowable but no less than $79,392,478 as qualified dividends for purposes of the maximum rate under Section 1(h)(11) of the Internal Revenue Code for the fiscal year ended December 31, 2018. Distributions, including qualified dividend income, paid during calendar year 2018 will be reported to shareholders on Form1099-DIV bymid-February 2019. Shareholders are advised to check with their tax advisors for information on the treatment of these amounts on their individual income tax returns.
Under Section 871(k)(1)(C) of the Internal Revenue Code, the Fund hereby reports the maximum amount allowable but no less than $7,219,593 as interest related dividends for purposes of the tax imposed under Section 871(a)(1)(A) of the Internal Revenue Code for the fiscal year ended December 31, 2018.
44 |
Annual Report |
franklintempleton.com |
FRANKLIN MUTUAL SERIES FUNDS
The name, year of birth and address of the officers and board members, as well as their affiliations, positions held with the Trust, principal occupations during at least the past five years and number of U.S. registered portfolios overseen in the Franklin Templeton Investments fund complex, are shown below. Generally, each board member serves until that person’s successor is elected and qualified.
Independent Board Members
Name, Year of Birth and Address | Position | Length of Time Served | Number of Portfolios in Fund Complex Overseen by Board Member* | Other Directorships Held During at Least the Past 5 Years | ||||
Edward I. Altman, Ph.D. (1941) | Trustee | Since 1987 | 14 | None | ||||
c/o Franklin Mutual Advisers, LLC | ||||||||
101 John F. Kennedy Parkway | ||||||||
Short Hills, NJ 07078-2716 | ||||||||
| Principal Occupation During at Least the Past 5 Years: | ||||||||
Max L. Heine Professor of Finance, Emeritus and Director of The Credit and Debt Markets Research Program, Salomon Center, Stern School of Business, New York University; editor and author of numerous financial publications; financial consultant; an adviser to numerous financial and publishing organizations; andformerly, Vice Director, Salomon Center, Stern School of Business, New York University.
| ||||||||
Ann Torre Bates (1958) c/o Franklin Mutual Advisers, LLC 101 John F. Kennedy Parkway Short Hills, NJ 07078-2716 | Trustee | Since 1995 | 38 | Ares Capital Corporation (specialty finance company) (2010-present), United Natural Foods, Inc. (distributor of natural, organic and specialty foods) (2013-present), Allied Capital Corporation (financial services) (2003-2010), SLM Corporation (Sallie Mae) (1997-2014) and Navient Corporation (loan management, servicing and asset recovery) (2014-2016). | ||||
| Principal Occupation During at Least the Past 5 Years: | ||||||||
Director of various companies; andformerly, Executive Vice President and Chief Financial Officer, NHP Incorporated (manager of multifamily housing) (1995-1997); and Vice President and Treasurer, US Airways, Inc. (until 1995).
| ||||||||
Burton J. Greenwald (1929) c/o Franklin Mutual Advisers, LLC 101 John F. Kennedy Parkway Short Hills, NJ 07078-2716 | Trustee and Vice Chairman | Trustee since 2002 and Vice Chairman since 2015 | 14 | Franklin Templeton Emerging Markets Debt Opportunities Fund PLC (1999-present) and Fiduciary International Ireland Limited (1999-2015). | ||||
| Principal Occupation During at Least the Past 5 Years: | ||||||||
Managing Director, B.J. Greenwald Associates (management consultants to the financial services industry); andformerly, Chairman, Fiduciary Trust International Funds; Executive Vice President, L.F. Rothschild Fund Management, Inc.; President and Director, Merit Mutual Funds; President, Underwriting Division and Director, National Securities & Research Corporation; Governor, Investment Company Institute; and Chairman, ICI Public Information Committee.
| ||||||||
Jan Hopkins Trachtman (1947) c/o Franklin Mutual Advisers, LLC 101 John F. Kennedy Parkway Short Hills, NJ 07078-2716 | Trustee | Since 2009 | 14 | FinTech Acquisition Corp. III (special purpose fintech acquisition company) (2018-present) | ||||
| Principal Occupation During at Least the Past 5 Years: | ||||||||
President and Founder, The Jan Hopkins Group (communications consulting firm); serves on Advisory Board of Knight Bagehot Fellowship; andformerly, President, Economic Club of New York (2007-2015); Anchor/Correspondent, CNN Financial News (until 2003); Managing Director and Head of Client Communications, Citigroup Private Bank (until 2005);Off-Air reporter, ABC News’ World News Tonight; and Editor, CBS Network News.
| ||||||||
Keith Mitchell (1954) | Trustee | Since 2009 | 14 | None | ||||
c/o Franklin Mutual Advisers, LLC | ||||||||
101 John F. Kennedy Parkway | ||||||||
Short Hills, NJ 07078-2716 | ||||||||
Principal Occupation During at Least the Past 5 Years: | ||||||||
Director of various boards of asset management firms; andformerly, Managing Member, Mitchell, Hartley & Bechtel Advisers, LLC (formerly, Mitchell Advisers, LLC) (advisory firm) (2003-2015) and Managing Director, Putman Lovell NBF.
| ||||||||
franklintempleton.com |
Annual Report |
45 |
FRANKLIN MUTUAL SERIES FUNDS
Independent Board Members(continued)
Name, Year of Birth and Address | Position | Length of Time Served | Number of Portfolios in Fund Complex Overseen by Board Member* | Other Directorships Held During at Least the Past 5 Years | ||||
David W. Niemiec (1949) c/o Franklin Mutual Advisers, LLC 101 John F. Kennedy Parkway Short Hills, NJ 07078-2716 | Trustee | Since 2015 | 38 | Hess Midstream Partners LP (oil and gas midstream infrastructure) (2017-present). | ||||
| Principal Occupation During at Least the Past 5 Years: | ||||||||
Advisor, Saratoga Partners (private equity fund); andformerly, Managing Director, Saratoga Partners (1998-2001) and SBC Warburg Dillon Read (investment banking) (1997-1998); Vice Chairman, Dillon, Read & Co. Inc. (investment banking) (1991-1997); and Chief Financial Officer, Dillon, Read & Co. Inc. (1982-1997).
| ||||||||
Charles Rubens II (1930) | Trustee | Since 1998 | 14 | None | ||||
c/o Franklin Mutual Advisers, LLC | ||||||||
101 John F. Kennedy Parkway | ||||||||
Short Hills, NJ 07078-2716 | ||||||||
| Principal Occupation During at Least the Past 5 Years: | ||||||||
Private investor and president ofnon-profit organizations; andformerly, an executive of Time, Inc.; and Trustee of Colorado College.
| ||||||||
Robert E. Wade (1946) c/o Franklin Mutual Advisers, LLC 101 John F. Kennedy Parkway Short Hills, NJ 07078-2716 | Trustee and Chairman of the Board | Trustee since 1993 and Chairman of the Board since 2005 | 38 | El Oro Ltd (investments) (2003-present). | ||||
| Principal Occupation During at Least the Past 5 Years: | ||||||||
Attorney at law engaged in private practice as a sole practitioner (1972-2008) and member of various boards.
| ||||||||
Gregory H. Williams (1943) | Trustee | Since 2015 | 14 | None | ||||
c/o Franklin Mutual Advisers, LLC | ||||||||
101 John F. Kennedy Parkway | ||||||||
Short Hills, NJ 07078-2716 | ||||||||
| Principal Occupation During at Least the Past 5 Years: | ||||||||
Private investor; Consultant; andformerly, President, University of Cincinnati (2009-2012); President, The City College of New York (2001-2009); Dean, College of Law, Ohio State University (1993-2001); and Associate Vice President, Academic Affairs and Professor of Law, University of Iowa (1977-1993).
| ||||||||
Interested Board Members and Officers
| ||||||||
Name, Year of Birth and Address | Position | Length of Time Served | Number of Portfolios in Fund Complex Overseen by Board Member* | Other Directorships Held During at Least the Past 5 Years | ||||
**Gregory E. Johnson (1961) | Trustee | Since 2007 | 150 | None | ||||
One Franklin Parkway | ||||||||
San Mateo, CA 94403-1906 | ||||||||
| Principal Occupation During at Least the Past 5 Years: | ||||||||
Chairman of the Board, Member – Office of the Chairman, Director and Chief Executive Officer, Franklin Resources, Inc.; officer and/or director or trustee, as the case may be, of some of the other subsidiaries of Franklin Resources, Inc. and of 42 of the investment companies in Franklin Templeton Investments; Vice Chairman, Investment Company Institute; andformerly, President, Franklin Resources, Inc. (1994-2015).
| ||||||||
**Peter A. Langerman (1955) c/o Franklin Mutual Advisers, LLC 101 John F. Kennedy Parkway Short Hills, NJ 07078-2716 | Trustee, President, and Chief Executive Officer – Investment Management | Trustee since 2007, President, and Chief Executive Officer – Investment Management since 2005 | 7 | American International Group, Inc. (AIG) Credit Facility Trust (2010-2011). | ||||
| Principal Occupation During at Least the Past 5 Years: | ||||||||
Chairman of the Board, Chief Executive Officer and President, Franklin Mutual Advisers, LLC; President and Chief Investment Officer, Franklin Advisory Services, LLC; and officer and/or director, as the case may be, of three of the investment companies in Franklin Templeton Investments.
| ||||||||
46 |
Annual Report |
franklintempleton.com |
FRANKLIN MUTUAL SERIES FUNDS
Interested Board Members and Officers(continued)
Name, Year of Birth and Address | Position | Length of Time Served | Number of Portfolios in Fund Complex Overseen by Board Member* | Other Directorships Held During at Least the Past 5 Years | ||||
Alison E. Baur (1964) | Vice President | Since 2012 | Not Applicable | Not Applicable | ||||
One Franklin Parkway | ||||||||
San Mateo, CA 94403-1906 | ||||||||
| Principal Occupation During at Least the Past 5 Years: | ||||||||
Deputy General Counsel, Franklin Templeton Investments; and officer of some of the other subsidiaries of Franklin Resources, Inc. and of 44 of the investment companies in Franklin Templeton Investments.
| ||||||||
Aliya S. Gordon (1973) | Vice President | Since 2009 | Not Applicable | Not Applicable | ||||
One Franklin Parkway | ||||||||
San Mateo, CA 94403-1906 | ||||||||
| Principal Occupation During at Least the Past 5 Years: | ||||||||
Senior Associate General Counsel, Franklin Templeton Investments; and officer of 44 of the investment companies in Franklin Templeton Investments.
| ||||||||
Steven J. Gray (1955) One Franklin Parkway San Mateo, CA 94403-1906 | Vice President and Secretary | Vice President since 2009 and Secretary since 2005 | Not Applicable | Not Applicable | ||||
| Principal Occupation During at Least the Past 5 Years: | ||||||||
Senior Associate General Counsel, Franklin Templeton Investments; Vice President, Franklin Templeton Distributors, Inc. and FASA, LLC; and officer of 44 of the investment companies in Franklin Templeton Investments.
| ||||||||
Matthew T. Hinkle (1971) One Franklin Parkway San Mateo, CA 94403-1906 | Chief Executive Officer – Finance and Administration | Since 2017 | Not Applicable | Not Applicable | ||||
| Principal Occupation During at Least the Past 5 Years: | ||||||||
Senior Vice President, Franklin Templeton Services, LLC; officer of 44 of the investment companies in Franklin Templeton Investments; andformerly, Vice President, Global Tax (2012-April 2017) and Treasurer/Assistant Treasurer, Franklin Templeton Investments (2009-2017).
| ||||||||
Robert G. Kubilis (1973) 300 S.E. 2nd Street Fort Lauderdale, FL 33301-1923 | Chief Financial Officer, Chief Accounting Officer and Treasurer | Since 2012 | Not Applicable | Not Applicable | ||||
| Principal Occupation During at Least the Past 5 Years: | ||||||||
Treasurer, U.S. Fund Administration & Reporting, Franklin Templeton Investments; and officer of 16 of the investment companies in Franklin Templeton Investments.
| ||||||||
Robert Lim (1948) One Franklin Parkway San Mateo, CA 94403-1906 | Vice President – AML Compliance | Since 2016 | Not Applicable | Not Applicable | ||||
| Principal Occupation During at Least the Past 5 Years: | ||||||||
Vice President, Franklin Templeton Companies, LLC; Chief Compliance Officer, Franklin Templeton Distributors, Inc. and Franklin Templeton Investor Services, LLC; and officer of 44 of the investment companies in Franklin Templeton Investments.
| ||||||||
Kimberly H. Novotny (1972) | Vice President | Since 2013 | Not Applicable | Not Applicable | ||||
300 S.E. 2nd Street | ||||||||
Fort Lauderdale, FL 33301-1923 | ||||||||
| Principal Occupation During at Least the Past 5 Years: | ||||||||
Associate General Counsel, Franklin Templeton Investments; Vice President and Corporate Secretary, Fiduciary Trust International of the South; Vice President, Templeton Investment Counsel, LLC; Assistant Secretary, Franklin Resources, Inc.; and officer of 44 of the investment companies in Franklin Templeton Investments.
| ||||||||
franklintempleton.com |
Annual Report |
47 |
FRANKLIN MUTUAL SERIES FUNDS
Interested Board Members and Officers(continued)
Name, Year of Birth and Address | Position | Length of Time Served | Number of Portfolios in Fund Complex Overseen by Board Member* | Other Directorships Held During at Least the Past 5 Years | ||||
Robert C. Rosselot (1960) 300 S.E. 2nd Street Fort Lauderdale, FL 33301-1923 | Chief Compliance Officer | Since 2013 | Not Applicable | Not Applicable | ||||
| Principal Occupation During at Least the Past 5 Years: | ||||||||
Director, Global Compliance, Franklin Templeton Investments; Vice President, Franklin Templeton Companies, LLC; officer of 44 of the investment companies in Franklin Templeton Investments; andformerly, Senior Associate General Counsel, Franklin Templeton Investments (2007-2013); and Secretary and Vice President, Templeton Group of Funds (2004-2013).
| ||||||||
Navid J. Tofigh (1972) | Vice President | Since 2015 | Not Applicable | Not Applicable | ||||
One Franklin Parkway | ||||||||
San Mateo, CA 94403-1906 | ||||||||
| Principal Occupation During at Least the Past 5 Years: | ||||||||
Associate General Counsel, Franklin Templeton Investments; and officer of 44 of the investment companies in Franklin Templeton Investments.
| ||||||||
Craig S. Tyle (1960) | Vice President | Since 2005 | Not Applicable | Not Applicable | ||||
One Franklin Parkway | ||||||||
San Mateo, CA 94403-1906 | ||||||||
| Principal Occupation During at Least the Past 5 Years: | ||||||||
General Counsel and Executive Vice President, Franklin Resources, Inc.; and officer of some of the other subsidiaries of Franklin Resources, Inc. and of 44 of the investment companies in Franklin Templeton Investments.
| ||||||||
Lori A. Weber (1964) | Vice President | Since 2011 | Not Applicable | Not Applicable | ||||
300 S.E. 2nd Street | ||||||||
Fort Lauderdale, FL 33301-1923 | ||||||||
| Principal Occupation During at Least the Past 5 Years: | ||||||||
Senior Associate General Counsel, Franklin Templeton Investments; Assistant Secretary, Franklin Resources, Inc.; Vice President and Secretary, Templeton Investment Counsel, LLC; and officer of 44 of the investment companies in Franklin Templeton Investments.
| ||||||||
48 |
Annual Report |
franklintempleton.com |
FRANKLIN MUTUAL SERIES FUNDS
*We base the number of portfolios on each separate series of the U.S. registered investment companies within the Franklin Templeton Investments fund complex. These portfolios have a common investment manager or affiliated investment managers.
**Gregory E. Johnson is considered to be an interested person of the Fund under the federal securities laws due to his position as an officer and director of Franklin Resources, Inc. (Resources), which is the parent company of the Fund’s investment manager and distributor. Peter A. Langerman is considered to be an interested person of the Fund under the federal securities laws due to his position as an officer of Franklin Mutual Advisers, LLC, which is the Fund’s investment manager.
Note 1: Officer information is current as of the date of this report. It is possible that after this date, information about officers may change.
The Sarbanes-Oxley Act of 2002 and Rules adopted by the U.S. Securities and Exchange Commission require the Fund to disclose whether the Fund’s Audit Committee includes at least one member who is an audit committee financial expert within the meaning of such Act and Rules. The Fund’s Board has determined that there is at least one such financial expert on the Audit Committee and has designated each of Edward I. Altman, Ph.D., Ann Torre Bates and David W. Niemiec as an audit committee financial expert. The Board believes that Messrs. Altman and Niemiec and Ms. Bates qualify as such an expert in view of their extensive business background and experience. Mr. Altman has served as a member of the Fund Audit Committee since 1987. He currently serves as a Max L. Hine Professor of Finance, Emeritus and Director of The Credit and Debt Markets Research Program, Salomon Center, Stern School of Business, New York University. Ms. Bates has served as a member of the Fund Audit Committee since 1995. She currently serves as a director of Ares Capital Corporation (2010-present) and United Natural Foods, Inc. (2013-present) and was formerly a director of Navient Corporation from 2014 to 2016, SLM Corporation from 1997 to 2014 and Allied Capital Corporation from 2003 to 2010, Executive Vice President and Chief Financial Officer of NHP Incorporated from 1995 to 1997 and Vice President and Treasurer of US Airways, Inc. until 1995. Mr. Niemiec has served as a member of the Fund Audit Committee since 2015, currently serves as an Advisor to Saratoga Partners and was formerly its Managing Director from 1998 to 2001 and serves as a director of Hess Midstream Partners LP (2017-present). Mr. Niemiec was formerly a director of Emeritus Corporation from 1999 to 2010 and OSI Pharmaceuticals, Inc. from 2006 to 2010, Managing Director of SBC Warburg Dillon Read from 1997 to 1998, and was Vice Chairman from 1991 to 1997 and Chief Financial Officer from 1982 to 1997 of Dillon, Read & Co. Inc. As a result of such background and experience, the Board believes that Messrs. Altman and Niemiec and Ms. Bates have each acquired an understanding of generally accepted accounting principles and financial statements, the general application of such principles in connection with the accounting estimates, accruals and reserves, and analyzing and evaluating financial statements that present a breadth and level of complexity of accounting issues generally comparable to those of the Fund, as well as an understanding of internal controls and procedures for financial reporting and an understanding of audit committee functions. Messrs. Altman and Niemiec and Ms. Bates are independent Board members as that term is defined under the applicable U.S. Securities and Exchange Commission Rules and Releases.
The Statement of Additional Information (SAI) includes additional information about the board members and is available, without charge, upon request. Shareholders may call (800) DIALBEN/342-5236 to request the SAI.
franklintempleton.com |
Annual Report |
49 |
FRANKLIN MUTUAL SERIES FUNDS
FRANKLIN MUTUAL BEACON FUND
Proxy Voting Policies and Procedures
The Fund’s investment manager has established Proxy Voting Policies and Procedures (Policies) that the Fund uses to determine how to vote proxies relating to portfolio securities. Shareholders may view the Fund’s complete Policies online at franklintempleton.com. Alternatively, shareholders may request copies of the Policies free of charge by calling the Proxy Group collect at (954)527-7678 or by sending a written request to: Franklin Templeton Companies, LLC, 300 S.E. 2nd Street, Fort Lauderdale, FL 33301, Attention: Proxy Group. Copies of the Fund’s proxy voting records are also made available online at franklintempleton.com and posted on the U.S. Securities and Exchange Commission’s website at sec.gov and reflect the most recent12-month period ended June 30.
Quarterly Statement of Investments
The Trust, on behalf of the Fund, files a complete statement of investments with the U.S. Securities and Exchange Commission for the first and third quarters for each fiscal year on FormN-Q. Shareholders may view the filed FormN-Q by visiting the Commission’s website at sec.gov. The filed form may also be viewed and copied at the Commission’s Public Reference Room in Washington, DC. Information regarding the operations of the Public Reference Room may be obtained by calling(800) SEC-0330.
Householding of Reports and Prospectuses
You will receive the Fund’s financial reports every six months as well as an annual updated summary prospectus (prospectus available upon request). To reduce Fund expenses, we try to identify related shareholders in a household and send only one copy of the financial reports and summary prospectus. This process, called “householding,” will continue indefinitely unless you instruct us otherwise. If you prefer not to have these documents householded, please call us at (800)632-2301. At any time you may view current prospectuses/summary prospectuses and financial reports on our website. If you choose, you may receive these documents through electronic delivery.
50 |
Annual Report |
franklintempleton.com |
This page intentionally left blank.
This page intentionally left blank.
 | Annual Report and Shareholder Letter Franklin Mutual Beacon Fund
Investment Manager Franklin Mutual Advisers, LLC
Distributor Franklin Templeton Distributors, Inc. (800) DIAL BEN®/342-5236 franklintempleton.com
Shareholder Services (800)632-2301 - (Class A, C, R & R6) (800)448-FUND - (Class Z) | |||
Authorized for distribution only when accompanied or preceded by a summary prospectus and/or prospectus. Investors should carefully consider a fund’s investment goals, risks, charges and expenses before investing. A prospectus contains this and other information; please read it carefully before investing.
To help ensure we provide you with quality service, all calls to and from our service areas are monitored and/or recorded. | ||||
| © 2019 Franklin Templeton Investments. All rights reserved. | 476 A 02/19 | |||
| Annual Report and Shareholder Letter
December 31, 2018 |
Internet Delivery of Fund Reports Unless You Request Paper Copies: Effective January 1, 2021, as permitted by the SEC, paper copies of the Fund’s shareholder reports will no longer be sent by mail, unless you specifically request them from the Fund or your financial intermediary. Instead, the reports will be made available on a website, and you will be notified by mail each time a report is posted and provided with a website link to access the report.
If you already elected to receive shareholder reports electronically, you will not be affected by this change and you need not take any action. If you have not signed up for electronic delivery, we would encourage you to join fellow shareholders who have. You may elect to receive shareholder reports and other communications electronically from the Fund by calling (800)632-2301 or by contacting your financial intermediary.
You may elect to continue to receive paper copies of all your future shareholder reports free of charge by contacting your financial intermediary or, if you invest directly with a Fund, calling (800)632-2301 to let the Fund know of your request. Your election to receive reports in paper will apply to all funds held in your account.
Franklin Templeton
Successful investing begins with ambition. And achievement only comes when you reach for it. That’s why we continually strive to deliver better outcomes for investors. No matter what your goals are, our deep, global investment expertise allows us to offer solutions that can help.
During our more than 70 years of experience, we’ve managed through all kinds of markets—up, down and those in between. We’re always preparing for what may come next. It’s because of this, combined with our strength as one of the world’s largest asset managers that we’ve earned the trust of millions of investors around the world.
Dear Franklin Mutual Global Discovery Fund Shareholder:
Investors started 2018 seemingly with the wind at their back. The primary tailwinds were strong corporate earnings growth in most developed markets, healthy consumer and business investment spending, and the positive effect of major U.S. tax cuts. In addition, the global economy continued its steady expansion since the financial crisis of 2008–2009. Unemployment continued to decline in the U.S. and other developed markets, while U.S. wage growth showed some signs of accelerating. As a result, equity markets reached new highs in August and September. However, volatility and market downturns soon made their mark on 2018. As measured by the Chicago Board Options Exchange Volatility Index (VIX), 2017 was the least volatile year on record for the Standard & Poor’s 500® Index (S&P 500®), but the VIX surged in February 2018 and jumped again in October and December 2018. Heightened trade tensions between the U.S. and China, geopolitical events in Europe and a growing belief that corporate earnings and economic growth will likely decelerate in 2019 hindered equity markets. A flattening U.S. Treasury yield curve, wider credit spreads and growing market concern that the U.S. Federal Reserve may raise interest rates too aggressively were also important drivers of market turbulence. For the period ended December 31, 2018, U.S. stocks, as measured by the S&P 500, had a-4.38% total return.1 Stocks in global developed markets, as measured by the MSCI World Index (USD), had a-8.20% total return.1
While equity markets were broadly down for the year, there were pockets of positive performance concentrated in areas of growth and innovation, such as software, information technology services and
segments of the health care sector. It is no surprise, therefore, that growth stocks managed to perform better than value stocks during the period. The MSCI World Growth Index (USD) had a-6.42% total return, while the MSCI World Value Index (USD) had a-10.09% total return.1
The return of volatility is an appropriate reminder that securities markets are dynamic. We believe active, professional investment management serves investors well since market volatility is more the norm than uninterrupted positive returns. Valuation is an essential factor in our analysis and we always ask ourselves if current and potential investments represent an attractive balance of risk and reward. We remain committed to abottom-up stock-picking process that is disciplined and driven by rigorous fundamental analysis that attempts to limit downside risk. In our view, investing in underappreciated and misunderstood companies with identifiable catalysts for unlocking shareholder value can offer significant upside potential as well as a degree of downside protection.
We also recognize the important role of financial advisors in today’s markets and encourage investors to continue to seek their advice. Amid changing markets and economic conditions, we are confident investors with a well-diversified portfolio and a patient, long-term outlook will be well positioned for the years ahead.
On the following pages, the Fund’s portfolio management team reviews investment decisions that pertain to performance during the past 12 months in light of the economic environment
1. Source: Morningstar.
See www.franklintempletondatasources.com for additional data provider information.
| Not FDIC Insured | | | May Lose Value | | | No Bank Guarantee |
franklintempleton.com |
Not part of the annual report |
1 |
and other factors. Please remember all securities markets fluctuate, as do mutual fund share prices.
We thank you for investing with Franklin Templeton, welcome your questions and comments, and look forward to continuing to serve your investment needs in the years ahead.
Sincerely,

Peter A. Langerman
Chairman, President and Chief Executive Officer
Franklin Mutual Advisers, LLC
This letter reflects our analysis and opinions as of December 31, 2018, unless otherwise indicated. The information is not a complete analysis of every aspect of any market, country, industry, security or fund. Statements of fact are from sources considered reliable.
Visitfranklintempleton.comfor fund updates, to access your account, or to find helpful financial planning tools.
2 |
Not part of the annual report |
franklintempleton.com |
Franklin Mutual Global Discovery Fund
This annual report for Franklin Mutual Global Discovery Fund covers the fiscal year ended December 31, 2018.
Your Fund’s Goal and Main Investments
The Fund seeks capital appreciation. Under normal market conditions, the Fund invests primarily in equity securities of U.S. and foreign companies that the investment manager believes are available at market prices less than their intrinsic value. The equity securities in which the Fund invests are primarily common stock, with a current focus onmid- and large cap companies. To a lesser extent, the Fund also invests in merger arbitrage securities and the debt and equity of distressed companies. The Fund may invest a substantial portion, potentially up to 100% of its assets, in foreign securities, which may include sovereign debt and participations in foreign government debt. The Geographic Composition bar chart on this page lists the leading countries where the Fund invests.
Performance Overview
The Fund’s Class Z shares had a-10.78% cumulative total return for the 12 months ended December 31, 2018. For comparison, the Fund’s benchmark, the MSCI World Index (USD), which tracks stock performance in global developed markets, had a-8.20% total return.1 You can find more of the Fund’s performance data in the Performance Summary beginning on page 10.
Performance data represent past performance, which does not guarantee future results. Investment return and principal value will fluctuate, and you may have a gain or loss when you sell your shares. Current performance may differ from figures shown. For most recentmonth-end performance, go tofranklintempleton.comor call(800)342-5236.
Economic and Market Overview
The global economy expanded during the 12 months under review, despite weakness in certain regions. Global developed and emerging market stocks were aided at certain points during the period by higher crude oil prices, upbeat economic data,
Geographic Composition*
Based on Total Net Assets as of 12/31/18
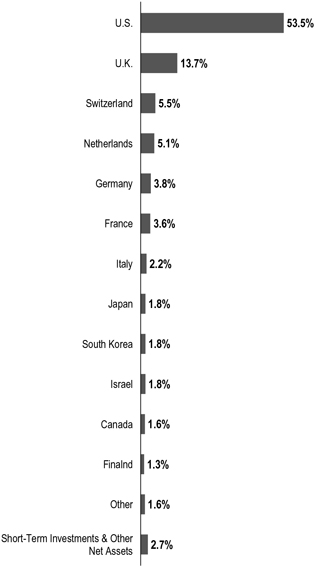
*Figures are stated as a percentage of total and may not equal 100% or may be negative due to rounding, use of any derivatives, unsettled trades or other factors.
easing trade tensions and encouraging corporate earnings reports, as well as indications of a slower pace of interest-rate increases from the U.S. Federal Reserve (Fed).
1. Source: Morningstar.
The index is unmanaged and includes reinvestment of any income or distributions. It does not reflect any fees, expenses or sales charges. One cannot invest directly in an index, and an index is not representative of the Fund’s portfolio.
The dollar value, number of shares or principal amount, and names of all portfolio holdings are listed in the Fund’s Statement of Investments (SOI). The SOI begins on page 19.
franklintempleton.com |
Annual Report |
3 |
FRANKLIN MUTUAL GLOBAL DISCOVERY FUND
However, various factors weighed on global markets during the period, including concerns about tighter regulation of technology companies, political uncertainties in the U.S. and the European Union, and major central banks’ interest-rate path and unwinding of monetary stimulus measures. Markets were further pressured by U.S. trade disputes with its allies and China, and their impact on global growth and corporate earnings. In this environment, global stocks, as measured by the MSCI All Country World Index, had a-8.93% total return for the 12 months ended December 31, 2018.1
The U.S. economy grew during the12-month period. After moderating for three consecutive quarters, the economy grew faster in 2018’s second quarter, driven by consumer spending, business investment, exports and government spending. However, growth moderated in the third quarter due to declines in exports and housing investment. The unemployment rate declined from 4.1% in December 2017 to 3.9% atperiod-end.2 Annual inflation, as measured by the Consumer Price Index, decreased from 2.1% in December 2017 to 1.9% atperiod-end.2 The Fed raised its target range for the federal funds rate four times during the period, to 2.25%–2.50%, and continued reducing its balance sheet as part of an ongoing plan to normalize monetary policy. At its December meeting, the Fed reduced the projected 2019 rate increases to two, compared to three projected previously.
In Europe, the U.K.’s quarterly economic growth moderated in 2018’s first quarter, but accelerated in 2018’s second and third quarters. The Bank of England raised its key policy rate once during the review period. After moderating in 2018’s first quarter, the eurozone’s quarterly growth remained stable in the second quarter, but eased in the third quarter. The bloc’s annual inflation rate ended the period higher than in December 2017. The European Central Bank (ECB) kept its benchmark interest rate unchanged during the period. In December 2018, the ECB confirmed its plan to conclude its bond purchase program at the end of 2018 and reiterated it expects key interest rates to remain unchanged through the summer of 2019.
In Asia, Japan’s quarterly gross domestic product (GDP) grew in 2018’s second quarter, following a contraction in the first quarter, but contracted again in the third quarter. The Bank of Japan left its benchmark interest rate unchanged during the period and continued its monetary stimulus measures.
In emerging markets, Brazil’s quarterly GDP growth remained stable in 2018’s first and second quarters, but accelerated in the
third quarter. The Central Bank of Brazil lowered its benchmark interest rate twice during the period. Russia’s annual GDP growth rate accelerated in 2018’s first and second quarters, but moderated in the third quarter. After lowering its key rate twice early in the period, the Bank of Russia raised it twice in the period’s second half to curtail inflation risks. China’s annual GDP grew at a stable rate in 2018’s first quarter, but it moderated in the second and third quarters. The People’s Bank of China left its benchmark interest rate unchanged during the period, but it took measures to improve financial liquidity to mitigate the negative effects of the U.S.-China trade dispute and support economic growth. Overall, emerging market stocks, as measured by the MSCI Emerging Markets Index, had a-14.25% total return during the period.1
Investment Strategy
At Franklin Mutual Series, we are committed to our distinctive value approach to investing, which we believe can generate above-average risk-adjusted returns over time for our shareholders. Our major investment strategy is investing in undervalued stocks. When selecting undervalued equities, we are attracted to what we believe are fundamentally strong companies with healthy balance sheets, high-quality assets, substantial free cash flow and shareholder-oriented management teams and whose stocks are trading at discounts to our assessment of the companies’ intrinsic or business value. We also look for asset-rich companies whose shares may be trading at depressed levels due to concerns over short-term earnings disappointments, litigation, management strategy or other perceived negatives. This strict value approach is not only intended to improve the likelihood of upside potential, but also reduces the risk of substantial declines, in our opinion. While the vast majority of our undervalued equity investments are made in publicly traded companies globally, we may invest occasionally in privately held companies as well.
To a lesser extent, we complement this more traditional investment strategy with two others. One is distressed investing, a highly specialized field that has proven quite profitable during certain periods over the years. Distressed investing is complex and can take many forms. The most common distressed investment the Fund undertakes is the purchase of financially troubled or bankrupt companies’ debt at a substantial discount to face value. After the financially distressed company is reorganized, often in bankruptcy court,
2. Source: U.S. Bureau of Labor Statistics.
4 |
Annual Report |
franklintempleton.com |
FRANKLIN MUTUAL GLOBAL DISCOVERY FUND
the old debt is typically replaced with new securities issued by the financially stronger company.
The other piece of our investment strategy is participating in arbitrage situations, another highly specialized field. When companies announce proposed mergers or takeovers, commonly referred to as “deals,” the target company may trade at a discount to the bid it ultimately accepts. One form of arbitrage involves purchasing the target company’s stock when it is trading below the value we believe it would receive in a deal. In keeping with our commitment to a relatively conservative investment approach, we typically focus our arbitrage efforts on announced deals, and avoid rumored deals or other situations we consider relatively risky. In addition, it is our practice to hedge the Fund’s currency exposure when we deem it advantageous for our shareholders.
What is meant by “hedge”?
To hedge an investment is to take a position intended to offset potential losses/gains that may be incurred by a companion financial instrument.
Manager’s Discussion
In 2018, corporate profits in the U.S. and other developed markets continued their impressive year-over-year growth. In addition, labor markets showed further improvement, consumer spending was solid, and U.S. corporate tax reforms encouraged companies to buy back more stock, raise dividends and increase capital expenditures. Those positive fundamentals were periodically overshadowed by political and economic concerns, particularly in the final three months of the year.
As major U.S. equity markets established newall-time highs in 2018, overall U.S. equity market valuations (e.g.,price-to-earnings,price-to-book orprice-to-sales) became increasingly unattractive, in our analysis. The equity marketsell-off in the fourth-quarter helped to return valuations to more reasonable levels. Thesell-off and rise in volatility yielded an opportunity for us to seek out stocks with strong corporate fundamentals and valuations whose risk/reward profiles seemed to us to have become more favorable.
In 2019, policy events may have considerable influence, for better or worse, on economic growth, investor sentiment and financial market performance and volatility. Markets are likely to be particularly sensitive to developments in U.S.-China trade relations, monetary policy moves by the Fed and other major central banks, oil production decisions by OPEC (The Organization of the Petroleum Exporting Countries) and other oil producing countries, the outcome of Brexit, China’s
| Top 10 Sectors/Industries | ||||
| Based on Equity Securities as of 12/31/18 | ||||
| % of Total Net Assets | ||||
Banks | 11.9% | |||
Pharmaceuticals | 9.9% | |||
Oil, Gas & Consumable Fuels | 9.8% | |||
Insurance | 9.8% | |||
Health Care Equipment & Supplies | 4.4% | |||
Software | 3.6% | |||
Technology Hardware, Storage & Peripherals | 3.6% | |||
Media | 3.3% | |||
Automobiles | 3.2% | |||
Tobacco | 2.9% | |||
response to its slowing economy and potential political discord in Washington, D.C.
Europe’s equity market overall was trading at an attractively lowerprice-to-earnings multiple and higher dividend yield than the U.S. equity market atperiod-end. We also saw an increase in investor activism, which we viewed as encouraging. However, those favorable factors were offset in part by economic data, which showed increased slowing of economic activity across the region. From an investment standpoint, we are hopeful that 2019 will be a year of potential resolution and clarity. The biggest political event will likely be Brexit, as a resolution to the situation remained unclear as ofperiod-end. The uncertainty around the terms and timing of a deal continued to undermine consumer and corporate confidence. From our perspective, we believe the European Union and the U.K. will ultimately reach an agreement that makes sense for both sides, and we believe the approval of such an agreement would likely have a significantly positive effect on investor, consumer and corporate sentiment in the U.K. We will also pay close attention to structural reform efforts in France and the political transition in Germany. In December, Chancellor Angela Merkel stepped down as leader of the Christian Democratic Union but stated her intention to remain in office for the remaining three years of her term as Chancellor.
In Asia, economic and financial market weakness in China has been brought on by multiple factors. The U.S.-China trade conflict has disrupted manufacturing activity and supply chains. As trade tensions escalated in 2018, manufacturers accelerated production to avoid upcoming tariffs. Atyear-end, supply chains were filled with inventory, while manufacturing activity was weak. Entering 2019, the near-term question is how long the inventory overhang will last, while the more significant question is to what extent the trade conflict will alter supply chains in the medium to long term. Amid the trade conflict,
franklintempleton.com |
Annual Report |
5 |
FRANKLIN MUTUAL GLOBAL DISCOVERY FUND
China has proven resolute in its attempt to dampen the reliance on leverage, which has hindered economic activity as well. While the government has enacted some stimulus measures, such as tax cuts, they may be less impactful than prior stimulus through fiscal spending. Meanwhile, government social policies impacting personal freedoms have had a negative effect on consumer sentiment.
Investment Spotlight
In all market environments, we seek to invest prudently in securities that we believe represent good value. We do this by seeking securities that trade at a discount to our estimate of intrinsic value, taking into account the quality of the asset, the sustainability of returns, and the growth potential of the business. We also believe the potential to deliver the best risk-adjusted return over a full market cycle requires us to be focused on applying our cross-asset approach: owning equities and debt—in certain cases multiple securities across the capital structure of a company—across geographies and sectors with an emphasis on corporate actions as catalysts. Our health care sector positions are a good example of our investment process. They have been carefully selected over a number of years, and in 2018, many of our long-standing sector investments appreciated significantly. Collectively our sector exposure outperformed the health care sector within the MSCI World Index (USD).
Within the health care sector, our investment process has generally been focused on finding innovative companies that are market leaders and that invest substantial amounts of capital into research and development (R&D) as a means to sustain and grow market positions. In addition, many of our positions have been in diversified pharmaceutical companies that also have long-duration cash flows through their leading positions in animal health, vaccine, andover-the-counter medicine businesses. These businesses can offer downside protection in years when pharmaceutical R&D is less successful or in years when important products lose patent protection. These businesses are attractive and have been undervalued by the market. This undervaluation allowed us to build positions, and in 2018, some of this undervaluation was reversed.
Eli Lilly and Merck are quintessential examples of our investment process. They are leading innovation-driven pharmaceutical companies that invest substantial amounts of capital into R&D to develop transformative medicines. Both
companies have introduced innovative new products in the past many years like Trulicity for diabetes and Keytruda for oncology that we believe will continue to offer substantial long-term revenue growth. The management teams at both companies take a long-term view and focus on enhancing their market positions through both internal and external innovation. Acquiring late stage innovation can be expensive, which is why Lilly and Merck take a prudent approach to generally focusing on early stage assets. Competition is typically less intense for early stage assets, and they can add value through their own development process and pass along that value to shareholders. Shareholder focus also comes through at both companies by their return of excess capital to shareholders through large dividends and share buybacks.
In our view, both companies also have strong, long-duration assets. Lilly and Merck are the fourth and third largest players in animal health, respectively. In September 2018, Lilly sold some shares of Elanco3, its animal health division, through an initial public offering to create additional shareholder value, while Merck started providing segment level profit disclosures so investors could better appreciate the contribution and value of their animal health business. Merck is also the second largest player in vaccines, a highly attractive business that is underappreciated, in our opinion.
Another common feature between Lilly and Merck is their strong balance sheets. Both companies also generate substantial amounts of free cash flows, with a significant proportion returned to shareholders in the form of dividends and share buybacks. In addition, the two companies are focused on managing their business more efficiently and improving their operating margins, which we believe will lead to additional earnings growth over the next several years. The Top 10 Sectors/Industries table on page 5 lists pharmaceuticals and also other leading industries in which the Fund currently invests.
Mergers and Acquisitions
In health care and elsewhere, merger and acquisition (M&A) activity remained healthy in 2018. The market received some clarity regarding the regulatory environment when a federal judge ruled in favor of AT&T and Time Warner4, and against the U.S. Department of Justice, in its antitrust lawsuit. However, economic, financial market and geopolitical uncertainty that arose in the second half of the year caused the
3. Not a Fund holding.
4. Not held atperiod-end.
See www.franklintempletondatasources.com for additional data provider information.
6 |
Annual Report |
franklintempleton.com |
FRANKLIN MUTUAL GLOBAL DISCOVERY FUND
pace of activity to slow. In our view, it was notable that health care has become one of the busier sectors for M&A as it is relatively more insulated from economic uncertainty. The strength and path of M&A activity in 2019 will likely depend in large part on how the uncertainties carrying over from 2018 play out and how they affect equity markets. From our experience, ups and downs in equity market performance and levels of deal activity have tended to move in a similar direction.
Credit Markets
Finding mispriced risk in credit markets was challenging in 2018. Low interest rates kept credit widely available, default rates remained at historically low levels and we continued to witness a loosening in debt covenant terms, which include restrictions on financial activities by the borrower or parameters for specific financial metrics. Liberal interpretations of credit agreements and bond indentures in order to shift valuable assets beyond the reach of creditors were an ongoing challenge. In such an environment, we found more opportunities investing in short-term mispriced risk rather than long-term restructurings.
However, we are hopeful that more opportunities may emerge in 2019, especially if we are starting to enter latter stages of the business cycle. U.S. monetary policy is becoming less accommodative, economic growth appears to be downshifting into a slower pace, earnings growth is set to slow, and geopolitical uncertainty is on the rise. These dynamics have already contributed to a general rise in financial market volatility. At the same time, the amount of lower-rated investment-grade credit stands at a historically high level on an absolute basis and relative to corporate debt markets overall. We believe default rates and the pace of corporate downgrades could begin to pick up in 2019. As a result, 2019 could bring a rise in fallen-angel opportunities (bonds downgraded from investment-grade to junk status) and idiosyncratic opportunities inout-of-favor industries. We will continue to look for opportunities across the capital structures of companies with liquidity-enhancing events, such as asset sales, the ability to issue secured debt within existing agreements, and free cash flow that could buy time for a company to weather its financial storm.
Fund Performance
Turning to Fund performance, top positive contributors included U.S.-based pharmaceutical company Eli Lilly, global research-driven pharmaceutical company Merck and U.K.-basedpay-TV provider Sky. Eli Lilly and Merck are
| Top 10 Equity Holdings | ||||
| 12/31/18 | ||||
Company Sector/Industry, Country | % of Total Net Assets | |||
| Medtronic PLC Health Care Equipment & Supplies, U.S. | 3.4% | |||
| Novartis AG Pharmaceuticals, Switzerland | 3.4% | |||
| The Walt Disney Co. Entertainment, U.S. | 2.8% | |||
| GlaxoSmithKline PLC Pharmaceuticals, U.K. | 2.5% | |||
| Royal Dutch Shell PLC Oil, Gas & Consumable Fuels, U.K. | 2.4% | |||
| NN Group NV Insurance, Netherlands | 2.3% | |||
| Eli Lilly & Co. Pharmaceuticals, U.S. | 2.3% | |||
| Enel SpA Electric Utilities, Italy | 2.2% | |||
| Merck & Co. Inc. Pharmaceuticals, U.S. | 2.0% | |||
| Volkswagen AG Automobiles, Germany | 2.0% | |||
listed among the Fund’s largest positions in the Top 10 Equity Holdings table on this page.
Shares of Eli Lilly were boosted in large part by a series of strong quarterly results during 2018. Attractive corporate fundamentals and fewer investor concerns regarding the direct impact on the pharmaceutical industry from the Trump administration’s efforts to lower prescription drug prices helped push the stock higher. We believe Eli Lilly continues to have a strong product growth story and room for further margin expansion, in addition to having solid research and development capabilities.
Merck is a global research-driven pharmaceutical company with strong market positions in oncology, diabetes, vaccines and animal health. Investors remained upbeat about its future prospects, particularly its Keytruda oncology drug. Merck released clinical trial results, which showed that for the first-line treatment of metastatic nonsquamousnon-small lung cancer patients, Keytruda combined with chemotherapy substantially extended survival of patients compared with chemotherapy alone. The Keytruda results set a high bar for competition and appeared to enhance Keytruda’s prospects to gain share in the sizeable market for lung cancer treatment. Results from a competitor, Bristol-Myers Squibb3, were less compelling in a different clinical trial in lung cancer. In
franklintempleton.com |
Annual Report |
7 |
FRANKLIN MUTUAL GLOBAL DISCOVERY FUND
October 2018, Merck raised its dividend and authorized a new large share buyback plan.
In February 2018, shares of Sky jumped when U.S.-based cable company Comcast3 made a surprise bid for the company. The Comcast bid was considerably higher than a prior bid by Twenty-First Century Fox3, which already owned a substantial portion of Sky. In July 2018, Twenty-First Century Fox raised its bid for Sky, but Comcast promptly offered a highercounter-bid. The stock rose again in September 2018 when The Panel on Takeovers and Mergers in the U.K. announced that Comcast had won the mandatory auction for Sky, and Twenty-First Century Fox subsequently agreed to sell its stake of Sky to Comcast. The acquisition of Sky was officially completed in October 2018.
During the period under review, Fund investments that detracted from performance included U.K.-based British American Tobacco, U.S.-based industrials company General Electric (GE) and U.S.-based bank Citizens Financial Group.
Shares of British American Tobacco faced downward pressure due to potential additional U.S. regulation and concerns regarding next generation products. In March 2018, the U.S. Food and Drug Administration (FDA) issued an Advance Notice of Proposed Rulemaking, which started the process of examining the possibility of regulating nicotine levels in combustible cigarettes. The process may not result in regulation, but if it does, many experts believe the review could take seven to 10 years. Meanwhile, JUUL, produced by JUUL Labs3, has emerged as a populare-cigarette for young U.S. consumers. It is unclear to what degree JUUL is cannibalizing the combustible market, but it has hurt investor sentiment toward the industry. In November, shares of British American Tobacco and industry peers dropped, as the FDA revisited the possibility of banning menthol as a flavor in cigarettes, which would take years with many steps to complete, and in our opinion, an FDA proposal would face litigation from the industry. Industry experts have suggested that it might not survive legal challenges.
GE is a multi-industrial company with a diverse set of businesses in power generation, health care and aviation. During 2018, the stock suffered a number of setbacks starting in January with a greater-than-expected charge related to long-term care policies in its insurance subsidiary. In June, the stock was removed from the Dow Jones Industrial Average and in September, GE stated that fan blades in some of its power-plant turbines were experiencing oxidation problems. In October, S&P Global Ratings, a bond rating agency, cut GE’s debt rating, while GE cut its dividend and stated that the
Securities and Exchange Commission was expanding an ongoing investigation to include an accounting write-down related to its power-generation division. Amid the negative events in 2018, management took the first steps in what amounts to a breakup of GE, announcing in May 2018 the merger of its transportation operations into Wabtec3 and plans tospin-off its health care division and divest its stake inoil-services firm Baker Hughes. In October 2018, GE unexpectedly replaced chief executive officer (CEO) John Flannery, who spent his entire career at GE, with Larry Culp, a former CEO of Danaher3, an industrial company. We believe Culp made some prudent initial moves, and that his plan to reduce debt and strengthen GE’s balance sheet is a step in the right direction to restoring investor confidence in the company.
Citizens Financial Group is a regional bank focused on the Northeastern U.S. The stock slipped in the second half of the year due to fears of slowing global economic activity negatively affecting the U.S. economy, leading to lower U.S. interest rates, rising credit costs and slower revenue and earnings growth for the industry. In addition, the U.S. Treasury yield curve flattened and inverted in the latter stages of the year and credit spreads widened. On a long-term basis, we believe Citizens remains well positioned to continue driving improved results through a combination of capital deployment, balance sheet optimization and cost controls.
During the period, the Fund held currency forwards and futures seeking to hedge most of the currency risk of the portfolio’snon-U.S. dollar investments. The hedges had a positive overall impact on the Fund’s performance because of the appreciation of the U.S. dollar versus the hedged currencies.
What is a currency forward?
A currency forward is a direct agreement between the Fund and a counterparty to buy or sell a foreign currency in exchange for another currency at a specific exchange rate on a future date.
What is a future?
A future is an agreement between the Fund and a counterparty made through a U.S. or foreign futures exchange to buy or sell an underlying instrument or asset at a specific price on a future date.
As fellow shareholders, we found recent relative and absolute performance disappointing, but it is not uncommon for our strategy to lag the equity markets at times. We remain committed to our disciplined, value investment approach as we seek to generate attractive, long-term, risk-adjusted returns for shareholders.
8 |
Annual Report |
franklintempleton.com |
FRANKLIN MUTUAL GLOBAL DISCOVERY FUND
Thank you for your participation in Franklin Mutual Global Discovery Fund. We look forward to continuing to serve your investment needs.
 |
Peter A. Langerman Co-Portfolio Manager | |
 |
Timothy Rankin, CFA Co-Portfolio Manager | |
 |
Christian Correa, CFA Co-Portfolio Manager | |


The foregoing information reflects our analysis, opinions and portfolio holdings as of December 31, 2018, the end of the reporting period. The way we implement our main investment strategies and the resulting portfolio holdings may change depending on factors such as market and economic conditions. These opinions may not be relied upon as investment advice or an offer for a particular security. The information is not a complete analysis of every aspect of any market, country, industry, security or the Fund. Statements of fact are from sources considered reliable, but the investment manager makes no representation or warranty as to their completeness or accuracy. Although historical performance is no guarantee of future results, these insights may help you understand our investment management philosophy.
CFA® is a trademark owned by CFA Institute.
franklintempleton.com |
Annual Report |
9 |
FRANKLIN MUTUAL GLOBAL DISCOVERY FUND
Performance Summary as of December 31, 2018
The performance table and graphs do not reflect any taxes that a shareholder would pay on Fund dividends, capital gain distributions, if any, or any realized gains on the sale of Fund shares. Total return reflects reinvestment of the Fund’s dividends and capital gain distributions, if any, and any unrealized gains or losses. Your dividend income will vary depending on dividends or interest paid by securities in the Fund’s portfolio, adjusted for operating expenses of each class. Capital gain distributions are net profits realized from the sale of portfolio securities.
Performance as of 12/31/18
Cumulative total return excludes sales charges. Average annual total return includes maximum sales charges. Sales charges will vary depending on the size of the investment and the class of share purchased. The maximum is 5.50% and the minimum is 0%.Class A:5.50% maximum initial sales charge. For other share classes, visitfranklintempleton.com.
| Share Class | | Cumulative Total Return1 | | | Average Annual Total Return | 2 | ||
| Z | ||||||||
1-Year | -10.78% | -10.78% | ||||||
5-Year | +12.58% | +2.40% | ||||||
10-Year | +111.34% | +7.77% | ||||||
| A3 | ||||||||
1-Year | -10.99% | -15.89% | ||||||
5-Year | +11.08% | +0.98% | ||||||
10-Year | +105.44% | +6.86% | ||||||
Performance data represent past performance, which does not guarantee future results. Investment return and principal value will fluctuate, and you may have a gain or loss when you sell your shares. Current performance may differ from figures shown. For most recentmonth-end performance, go tofranklintempleton.comor call(800)342-5236.
See page 12 for Performance Summary footnotes.
10 |
Annual Report |
franklintempleton.com |
FRANKLIN MUTUAL GLOBAL DISCOVERY FUND
PERFORMANCE SUMMARY
Total Return Index Comparison for a Hypothetical $10,000 Investment
Total return represents the change in value of an investment over the periods shown. It includes any applicable maximum sales charge, Fund expenses, account fees and reinvested distributions. The unmanaged index includes reinvestment of any income or distributions. It differs from the Fund in composition and does not pay management fees or expenses. One cannot invest directly in an index.
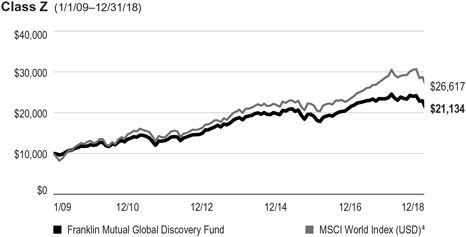
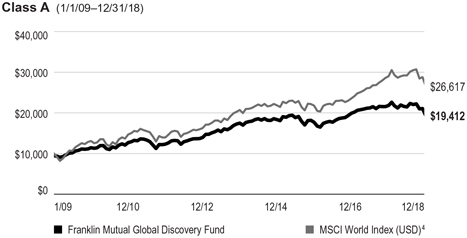
See page 12 for Performance Summary footnotes.
franklintempleton.com |
Annual Report |
11 |
FRANKLIN MUTUAL GLOBAL DISCOVERY FUND
PERFORMANCE SUMMARY
Distributions(1/1/18–12/31/18)
| Share Class | Net Investment Income | Short-Term Capital Gain | Long-Term Capital Gain | Total | ||||||||||||
Z | $0.6426 | $0.3064 | $1.0651 | $2.0141 | ||||||||||||
A | $0.5640 | $0.3064 | $1.0651 | $1.9355 | ||||||||||||
C | $0.1023 | $0.3064 | $1.0651 | $1.4738 | ||||||||||||
R | $0.4668 | $0.3064 | $1.0651 | $1.8383 | ||||||||||||
R6 | $0.6779 | $0.3064 | $1.0651 | $2.0494 | ||||||||||||
Total Annual Operating Expenses5
| Share Class | ||||
Z | 0.96% | |||
A | 1.21% | |||
Each class of shares is available to certain eligible investors and has different annual fees and expenses, as described in the prospectus.
All investments involve risks, including possible loss of principal. Value securities may not increase in price as anticipated or may decline further in value. Special risks are associated with foreign investing, including currency fluctuations, economic instability and political developments. Because the Fund may invest its assets in companies in a specific region, including Europe, it is subject to greater risks of adverse developments in that region and/or the surrounding regions than a fund that is more broadly diversified geographically. Current political and financial uncertainty surrounding the European Union may increase market volatility and the economic risk of investing in companies in Europe. Smaller-company stocks have exhibited greater price volatility than larger-company stocks, particularly over the short term. The Fund’s investments in companies engaged in mergers, reorganizations or liquidations also involve special risks as pending deals may not be completed on time or on favorable terms. The Fund may invest in lower-rated bonds, which entail higher credit risk. The Fund is actively managed but there is no guarantee that the manager’s investment decisions will produce the desired results. The Fund’s prospectus also includes a description of the main investment risks.
1. Cumulative total return represents the change in value of an investment over the periods indicated.
2. Average annual total return represents the average annual change in value of an investment over the periods indicated. Return for less than one year, if any, has not been annualized.
3. Prior to 9/10/18, these shares were offered at a higher initial sales charge of 5.75%, thus actual returns would have differed. Total returns with sales charges have been restated to reflect the current maximum initial sales charge of 5.50%.
4. Source: Morningstar. The MSCI World Index (USD) is a free float-adjusted, market capitalization-weighted index designed to measure equity market performance in global developed markets.
5. Figures are as stated in the Fund’s current prospectus and may differ from the expense ratios disclosed in the Your Fund’s Expenses and Financial Highlights sections in this report. In periods of market volatility, assets may decline significantly, causing total annual Fund operating expenses to become higher than the figures shown.
See www.franklintempletondatasources.com for additional data provider information.
12 |
Annual Report |
franklintempleton.com |
FRANKLIN MUTUAL GLOBAL DISCOVERY FUND
As a Fund shareholder, you can incur two types of costs: (1) transaction costs, including sales charges (loads) on Fund purchases and redemptions; and (2) ongoing Fund costs, including management fees, distribution and service(12b-1) fees, and other Fund expenses. All mutual funds have ongoing costs, sometimes referred to as operating expenses. The table below shows ongoing costs of investing in the Fund and can help you understand these costs and compare them with those of other mutual funds. The table assumes a $1,000 investment held for the six months indicated.
Actual Fund Expenses
The table below provides information about actual account values and actual expenses in the columns under the heading “Actual.” In these columns the Fund’s actual return, which includes the effect of Fund expenses, is used to calculate the “Ending Account Value” for each class of shares. You can estimate the expenses you paid during the period by following these steps (of course, your account value and expenses will differ from those in this illustration): Divide your account value by $1,000 (if your account had an $8,600 value, then $8,600 ÷ $1,000 = 8.6). Then multiply the result by the number in the row for your class of shares under the headings “Actual” and “Expenses Paid During Period” (if Actual Expenses Paid During Period were $7.50, then 8.6 x $7.50 = $64.50). In this illustration, the actual expenses paid this period are $64.50.
Hypothetical Example for Comparison with Other Funds
Under the heading “Hypothetical” in the table, information is provided about hypothetical account values and hypothetical expenses based on the Fund’s actual expense ratio and an assumed rate of return of 5% per year before expenses, which is not the Fund’s actual return. This information may not be used to estimate the actual ending account balance or expenses you paid for the period, but it can help you compare ongoing costs of investing in the Fund with those of other funds. To do so, compare this 5% hypothetical example for the class of shares you hold with the 5% hypothetical examples that appear in the shareholder reports of other funds.
Please note that expenses shown in the table are meant to highlight ongoing costs and do not reflect any transactional costs. Therefore, information under the heading “Hypothetical” is useful in comparing ongoing costs only, and will not help you compare total costs of owning different funds. In addition, if transactional costs were included, your total costs would have been higher.
Actual (actual return after expenses) | Hypothetical (5% annual return before expenses) | |||||||||||||||||
| Share Class | Beginning Account Value 7/1/18 | Ending Account Value 12/31/18 | Expenses Paid During Period 7/1/18–12/31/181,2 | Ending Account Value 12/31/18 | Expenses Paid During Period 7/1/18–12/31/181,2 | Net Annualized Expense Ratio2 | ||||||||||||
| Z | $1,000 | $905.60 | $4.61 | $1,020.37 | $4.89 | 0.96% | ||||||||||||
| A | $1,000 | $904.60 | $5.81 | $1,019.11 | $6.16 | 1.21% | ||||||||||||
| C | $1,000 | $900.80 | $9.39 | $1,015.32 | $9.96 | 1.96% | ||||||||||||
| R | $1,000 | $903.20 | $7.00 | $1,017.85 | $7.43 | 1.46% | ||||||||||||
| R6 | $1,000 | $906.10 | $4.18 | $1,020.82 | $4.43 | 0.87% | ||||||||||||
1. Expenses are equal to the annualized expense ratio for thesix-month period as indicated above—in the far right column—multiplied by the simple average account value over the period indicated, and then multiplied by 184/365 to reflect theone-half year period.
2. Reflects expenses after fee waivers and expense reimbursements. Does not include acquired fund fees and expenses.
franklintempleton.com |
Annual Report |
13 |
FRANKLIN MUTUAL GLOBAL DISCOVERY FUND
| Year Ended December 31, | ||||||||||||||||||||
| 2018 | 2017 | 2016 | 2015 | 2014 | ||||||||||||||||
| Class Z | ||||||||||||||||||||
| Per share operating performance (for a share outstanding throughout the year) | ||||||||||||||||||||
Net asset value, beginning of year | $32.42 | $31.12 | $29.35 | $33.32 | $33.73 | |||||||||||||||
Income from investment operationsa: | ||||||||||||||||||||
Net investment incomeb | 0.58 | 0.76 | c | 0.67 | d | 0.53 | 0.82 | e | ||||||||||||
Net realized and unrealized gains (losses) | (4.13 | ) | 2.29 | 3.08 | (1.71 | ) | 0.97 | |||||||||||||
Total from investment operations | (3.55 | ) | 3.05 | 3.75 | (1.18 | ) | 1.79 | |||||||||||||
Less distributions from: | ||||||||||||||||||||
Net investment income | (0.64 | ) | (0.79 | ) | (0.69 | ) | (0.55 | ) | (0.82 | ) | ||||||||||
Net realized gains | (1.37 | ) | (0.96 | ) | (1.29 | ) | (2.24 | ) | (1.38 | ) | ||||||||||
Total distributions | (2.01 | ) | (1.75 | ) | (1.98 | ) | (2.79 | ) | (2.20 | ) | ||||||||||
Net asset value, end of year | $26.86 | $32.42 | $31.12 | $29.35 | $33.32 | |||||||||||||||
Total return | (10.78)% | 9.84% | 12.86% | (3.36)% | 5.33% | |||||||||||||||
Ratios to average net assets | ||||||||||||||||||||
Expensesf,g | 0.97% | h | 0.96% | 0.99% | h | 0.99% | h | 0.99% | ||||||||||||
Expenses incurred in connection with securities sold short | —% | i | —% | 0.01% | 0.02% | 0.03% | ||||||||||||||
Net investment income | 1.82% | 2.30% | c | 2.27% | d | 1.56% | 2.38% | e | ||||||||||||
| Supplemental data | ||||||||||||||||||||
Net assets, end of year (000’s) | $5,114,274 | $7,175,981 | $8,354,865 | $9,132,752 | $10,375,518 | |||||||||||||||
Portfolio turnover rate | 14.70% | 17.50% | 17.01% | 21.79% | 23.66% | |||||||||||||||
aThe amount shown for a share outstanding throughout the period may not correlate with the Statement of Operations for the period due to the timing of sales and repurchases of the Fund’s shares in relation to income earned and/or fluctuating fair value of the investments of the Fund.
bBased on average daily shares outstanding.
cNet investment income per share includes approximately $0.20 per share related to income received in the form of special dividends in connection with certain Fund holdings. Excluding this amount, the ratio of net investment income to average net assets would have been 1.68%.
dNet investment income per share includes approximately $0.10 per share related to income received in the form of special dividends in connection with certain Fund holdings. Excluding this amount, the ratio of net investment income to average net assets would have been 1.94%.
eNet investment income per share includes approximately $0.34 per share related to income received in the form of special dividends in connection with certain Fund holdings. Excluding this amount, the ratio of net investment income to average net assets would have been 1.40%.
fIncludes dividend and/or interest expense on securities sold short and security borrowing fees, if any. See below for the ratios of such expenses to average net assets for the periods presented. See Note 1(d).
gBenefit of expense reduction rounds to less than 0.01%.
hBenefit of waiver and payments by affiliates rounds to less than 0.01%.
iRounds to less than 0.01%.
14 |
Annual Report | The accompanying notes are an integral part of these financial statements. |
franklintempleton.com |
FRANKLIN MUTUAL GLOBAL DISCOVERY FUND
FINANCIAL HIGHLIGHTS
| Year Ended December 31, | ||||||||||||||||||||
| 2018 | 2017 | 2016 | 2015 | 2014 | ||||||||||||||||
| Class A | ||||||||||||||||||||
| Per share operating performance (for a share outstanding throughout the year) | ||||||||||||||||||||
Net asset value, beginning of year | $31.80 | $30.57 | $28.86 | $32.81 | $33.24 | |||||||||||||||
Income from investment operationsa: | ||||||||||||||||||||
Net investment incomeb | 0.49 | 0.66 | c | 0.59 | d | 0.42 | 0.71 | e | ||||||||||||
Net realized and unrealized gains (losses) | (4.04 | ) | 2.25 | 3.01 | (1.67 | ) | 0.96 | |||||||||||||
Total from investment operations | (3.55 | ) | 2.91 | 3.60 | (1.25 | ) | 1.67 | |||||||||||||
Less distributions from: | ||||||||||||||||||||
Net investment income | (0.56 | ) | (0.72 | ) | (0.60 | ) | (0.46 | ) | (0.72 | ) | ||||||||||
Net realized gains | (1.37 | ) | (0.96 | ) | (1.29 | ) | (2.24 | ) | (1.38 | ) | ||||||||||
Total distributions | (1.93 | ) | (1.68 | ) | (1.89 | ) | (2.70 | ) | (2.10 | ) | ||||||||||
Net asset value, end of year | $26.32 | $31.80 | $30.57 | $28.86 | $32.81 | |||||||||||||||
Total returnf | (10.99)% | 9.57% | 12.56% | (3.63)% | 5.01% | |||||||||||||||
Ratios to average net assets | ||||||||||||||||||||
Expensesg,h | 1.22% | i | 1.21% | 1.24% | i | 1.27% | i | 1.29% | ||||||||||||
Expenses incurred in connection with securities sold short | —% | j | —% | 0.01% | 0.02% | 0.03% | ||||||||||||||
Net investment income | 1.57% | 2.05% | c | 2.02% | d | 1.28% | 2.08% | e | ||||||||||||
| Supplemental data | ||||||||||||||||||||
Net assets, end of year (000’s) | $7,461,444 | $9,589,033 | $10,498,722 | $11,274,721 | $11,573,196 | |||||||||||||||
Portfolio turnover rate | 14.70% | 17.50% | 17.01% | 21.79% | 23.66% | |||||||||||||||
aThe amount shown for a share outstanding throughout the period may not correlate with the Statement of Operations for the period due to the timing of sales and repurchases of the Fund’s shares in relation to income earned and/or fluctuating fair value of the investments of the Fund.
bBased on average daily shares outstanding.
cNet investment income per share includes approximately $0.20 per share related to income received in the form of special dividends in connection with certain Fund holdings. Excluding this amount, the ratio of net investment income to average net assets would have been 1.43%.
dNet investment income per share includes approximately $0.10 per share related to income received in the form of special dividends in connection with certain Fund holdings. Excluding this amount, the ratio of net investment income to average net assets would have been 1.69%.
eNet investment income per share includes approximately $0.34 per share related to income received in the form of special dividends in connection with certain Fund holdings. Excluding this amount, the ratio of net investment income to average net assets would have been 1.10%.
fTotal return does not reflect sales commissions or contingent deferred sales charges, if applicable.
gIncludes dividend and/or interest expense on securities sold short and security borrowing fees, if any. See below for the ratios of such expenses to average net assets for the periods presented. See Note 1(d).
hBenefit of expense reduction rounds to less than 0.01%.
iBenefit of waiver and payments by affiliates rounds to less than 0.01%.
jRounds to less than 0.01%.
franklintempleton.com |
The accompanying notes are an integral part of these financial statements. | Annual Report |
15 |
FRANKLIN MUTUAL GLOBAL DISCOVERY FUND
FINANCIAL HIGHLIGHTS
| Year Ended December 31, | ||||||||||||||||||||
| 2018 | 2017 | 2016 | 2015 | 2014 | ||||||||||||||||
| Class C | ||||||||||||||||||||
| Per share operating performance (for a share outstanding throughout the year) | ||||||||||||||||||||
Net asset value, beginning of year | $31.44 | $30.22 | $28.55 | $32.49 | $32.94 | |||||||||||||||
Income from investment operationsa: | ||||||||||||||||||||
Net investment incomeb | 0.26 | 0.41 | c | 0.36 | d | 0.18 | 0.47 | e | ||||||||||||
Net realized and unrealized gains (losses) | (3.98 | ) | 2.23 | 2.97 | (1.64 | ) | 0.95 | |||||||||||||
Total from investment operations | (3.72 | ) | 2.64 | 3.33 | (1.46 | ) | 1.42 | |||||||||||||
Less distributions from: | ||||||||||||||||||||
Net investment income | (0.10 | ) | (0.46 | ) | (0.37 | ) | (0.24 | ) | (0.49 | ) | ||||||||||
Net realized gains | (1.37 | ) | (0.96 | ) | (1.29 | ) | (2.24 | ) | (1.38 | ) | ||||||||||
Total distributions | (1.47 | ) | (1.42 | ) | (1.66 | ) | (2.48 | ) | (1.87 | ) | ||||||||||
Net asset value, end of year | $26.25 | $31.44 | $30.22 | $28.55 | $32.49 | |||||||||||||||
Total returnf | (11.70)% | 8.78% | 11.70% | (4.33)% | 4.28% | |||||||||||||||
Ratios to average net assets | ||||||||||||||||||||
Expensesg,h | 1.97% | i | 1.96% | 1.99% | i | 1.99% | i | 1.99% | ||||||||||||
Expenses incurred in connection with securities sold short | —% | j | —% | 0.01% | 0.02% | 0.03% | ||||||||||||||
Net investment income | 0.82% | 1.30% | c | 1.27% | d | 0.56% | 1.38% | e | ||||||||||||
| Supplemental data | ||||||||||||||||||||
Net assets, end of year (000’s) | $1,054,412 | $2,438,507 | $2,758,563 | $2,983,216 | $3,077,691 | |||||||||||||||
Portfolio turnover rate | 14.70% | 17.50% | 17.01% | 21.79% | 23.66% | |||||||||||||||
aThe amount shown for a share outstanding throughout the period may not correlate with the Statement of Operations for the period due to the timing of sales and repurchases of the Fund’s shares in relation to income earned and/or fluctuating fair value of the investments of the Fund.
bBased on average daily shares outstanding.
cNet investment income per share includes approximately $0.20 per share related to income received in the form of special dividends in connection with certain Fund holdings. Excluding this amount, the ratio of net investment income to average net assets would have been 0.68%.
dNet investment income per share includes approximately $0.10 per share related to income received in the form of special dividends in connection with certain Fund holdings. Excluding this amount, the ratio of net investment income to average net assets would have been 0.94%.
eNet investment income per share includes approximately $0.34 per share related to income received in the form of special dividends in connection with certain Fund holdings. Excluding this amount, the ratio of net investment income to average net assets would have been 0.40%.
fTotal return does not reflect sales commissions or contingent deferred sales charges, if applicable.
gIncludes dividend and/or interest expense on securities sold short and security borrowing fees, if any. See below for the ratios of such expenses to average net assets for the periods presented. See Note 1(d).
hBenefit of expense reduction rounds to less than 0.01%.
iBenefit of waiver and payments by affiliates rounds to less than 0.01%.
jRounds to less than 0.01%.
16 |
Annual Report | The accompanying notes are an integral part of these financial statements. |
franklintempleton.com |
FRANKLIN MUTUAL GLOBAL DISCOVERY FUND
FINANCIAL HIGHLIGHTS
| Year Ended December 31, | ||||||||||||||||||||
| 2018 | 2017 | 2016 | 2015 | 2014 | ||||||||||||||||
| Class R | ||||||||||||||||||||
| Per share operating performance (for a share outstanding throughout the year) | ||||||||||||||||||||
Net asset value, beginning of year | $31.37 | $30.17 | $28.51 | $32.43 | $32.88 | |||||||||||||||
Income from investment operationsa: | ||||||||||||||||||||
Net investment incomeb | 0.41 | 0.57 | c | 0.50 | d | 0.35 | 0.65 | e | ||||||||||||
Net realized and unrealized gains (losses) | (3.97 | ) | 2.22 | 2.98 | (1.64 | ) | 0.93 | |||||||||||||
Total from investment operations | (3.56 | ) | 2.79 | 3.48 | (1.29 | ) | 1.58 | |||||||||||||
Less distributions from: | ||||||||||||||||||||
Net investment income | (0.47 | ) | (0.63 | ) | (0.53 | ) | (0.39 | ) | (0.65 | ) | ||||||||||
Net realized gains | (1.37 | ) | (0.96 | ) | (1.29 | ) | (2.24 | ) | (1.38 | ) | ||||||||||
Total distributions | (1.84 | ) | (1.59 | ) | (1.82 | ) | (2.63 | ) | (2.03 | ) | ||||||||||
Net asset value, end of year | $25.97 | $31.37 | $30.17 | $28.51 | $32.43 | |||||||||||||||
Total return | (11.24)% | 9.31% | 12.28% | (3.82)% | 4.77% | |||||||||||||||
Ratios to average net assets | ||||||||||||||||||||
Expensesf,g | 1.47% | h | 1.46% | 1.49% | h | 1.49% | h | 1.49% | ||||||||||||
Expenses incurred in connection with securities sold short | —% | i | —% | 0.01% | 0.02% | 0.03% | ||||||||||||||
Net investment income | 1.32% | 1.80% | c | 1.77% | d | 1.06% | 1.88% | e | ||||||||||||
| Supplemental data | ||||||||||||||||||||
Net assets, end of year (000’s) | $274,086 | $398,692 | $444,813 | $468,425 | $528,439 | |||||||||||||||
Portfolio turnover rate | 14.70% | 17.50% | 17.01% | 21.79% | 23.66% | |||||||||||||||
aThe amount shown for a share outstanding throughout the period may not correlate with the Statement of Operations for the period due to the timing of sales and repurchases of the Fund’s shares in relation to income earned and/or fluctuating fair value of the investments of the Fund.
bBased on average daily shares outstanding.
cNet investment income per share includes approximately $0.20 per share related to income received in the form of special dividends in connection with certain Fund holdings. Excluding this amount, the ratio of net investment income to average net assets would have been 1.18%.
dNet investment income per share includes approximately $0.10 per share related to income received in the form of special dividends in connection with certain Fund holdings. Excluding this amount, the ratio of net investment income to average net assets would have been 1.44%.
eNet investment income per share includes approximately $0.34 per share related to income received in the form of special dividends in connection with certain Fund holdings. Excluding this amount, the ratio of net investment income to average net assets would have been 0.90%.
fIncludes dividend and/or interest expense on securities sold short and security borrowing fees, if any. See below for the ratios of such expenses to average net assets for the periods presented. See Note 1(d).
gBenefit of expense reduction rounds to less than 0.01%.
hBenefit of waiver and payments by affiliates rounds to less than 0.01%.
iRounds to less than 0.01%.
franklintempleton.com |
The accompanying notes are an integral part of these financial statements. | Annual Report |
17 |
FRANKLIN MUTUAL GLOBAL DISCOVERY FUND
FINANCIAL HIGHLIGHTS
| Year Ended December 31, | ||||||||||||||||||||
| 2018 | 2017 | 2016 | 2015 | 2014 | ||||||||||||||||
Class R6 | ||||||||||||||||||||
| Per share operating performance (for a share outstanding throughout the year) | ||||||||||||||||||||
Net asset value, beginning of year | $32.41 | $31.13 | $29.35 | $33.33 | $33.73 | |||||||||||||||
Income from investment operationsa: | ||||||||||||||||||||
Net investment incomeb | 0.62 | 0.75 | c | 0.61 | d | 0.55 | 0.85 | e | ||||||||||||
Net realized and unrealized gains (losses) | (4.13 | ) | 2.34 | 3.19 | (1.69 | ) | 1.00 | |||||||||||||
Total from investment operations | (3.51 | ) | 3.09 | 3.80 | (1.14 | ) | 1.85 | |||||||||||||
Less distributions from: | ||||||||||||||||||||
Net investment income | (0.68 | ) | (0.85 | ) | (0.73 | ) | (0.60 | ) | (0.87 | ) | ||||||||||
Net realized gains | (1.37 | ) | (0.96 | ) | (1.29 | ) | (2.24 | ) | (1.38 | ) | ||||||||||
Total distributions | (2.05 | ) | (1.81 | ) | (2.02 | ) | (2.84 | ) | (2.25 | ) | ||||||||||
Net asset value, end of year. | $26.85 | $32.41 | $31.13 | $29.35 | $33.33 | |||||||||||||||
Total return | (10.67)% | 9.98% | 13.02% | (3.23)% | 5.46% | |||||||||||||||
Ratios to average net assets | ||||||||||||||||||||
Expenses before waiver and payments by affiliatesf | 0.88% | 0.84% | 0.85% | 0.84% | 0.85% | |||||||||||||||
Expenses net of waiver and payments by affiliatesf,g | 0.87% | 0.84% | 0.85% | h | 0.84% | h | 0.85% | |||||||||||||
Expenses incurred in connection with securities sold short | —% | i | —% | 0.01% | 0.02% | 0.03% | ||||||||||||||
Net investment income | 1.92% | 2.42% | c | 2.41% | d | 1.71% | 2.52% | e | ||||||||||||
| Supplemental data | ||||||||||||||||||||
Net assets, end of year (000’s) | $1,418,812 | $2,221,338 | $528,617 | $229,765 | $137,922 | |||||||||||||||
Portfolio turnover rate | 14.70% | 17.50% | 17.01% | 21.79% | 23.66% | |||||||||||||||
aThe amount shown for a share outstanding throughout the period may not correlate with the Statement of Operations for the period due to the timing of sales and repurchases of the Fund’s shares in relation to income earned and/or fluctuating fair value of the investments of the Fund.
bBased on average daily shares outstanding.
cNet investment income per share includes approximately $0.20 per share related to income received in the form of special dividends in connection with certain Fund holdings. Excluding this amount, the ratio of net investment income to average net assets would have been 1.80%.
dNet investment income per share includes approximately $0.10 per share related to income received in the form of special dividends in connection with certain Fund holdings. Excluding this amount, the ratio of net investment income to average net assets would have been 2.08%.
eNet investment income per share includes approximately $0.34 per share related to income received in the form of special dividends in connection with certain Fund holdings. Excluding this amount, the ratio of net investment income to average net assets would have been 1.54%.
fIncludes dividend and/or interest expense on securities sold short and security borrowing fees, if any. See below for the ratios of such expenses to average net assets for the periods presented. See Note 1(d).
gBenefit of expense reduction rounds to less than 0.01%.
hBenefit of waiver and payments by affiliates rounds to less than 0.01%.
iRounds to less than 0.01%.
18 |
Annual Report | The accompanying notes are an integral part of these financial statements. |
franklintempleton.com |
FRANKLIN MUTUAL GLOBAL DISCOVERY FUND
Statement of Investments, December 31, 2018
| Country | | Shares/ Units/ Warrants | | Value | ||||||||
| ||||||||||||
Common Stocks and Other Equity Interests 93.0% | ||||||||||||
Aerospace & Defense 0.8% | ||||||||||||
BAE Systems PLC | United Kingdom | 21,584,405 | $ | 126,397,148 | ||||||||
|
| |||||||||||
Auto Components 0.4% | ||||||||||||
a,b,c International Automotive Components Group Brazil LLC | Brazil | 3,819,425 | 161,855 | |||||||||
a,b,c,d International Automotive Components Group North America LLC | United States | 35,491,081 | 4,230,537 | |||||||||
Toyo Tire Corp. | Japan | 4,446,741 | 55,787,125 | |||||||||
|
| |||||||||||
| 60,179,517 | ||||||||||||
|
| |||||||||||
Automobiles 1.2% | ||||||||||||
General Motors Co. | United States | 5,350,852 | 178,985,999 | |||||||||
|
| |||||||||||
Banks 11.9% | ||||||||||||
Barclays PLC | United Kingdom | 36,257,633 | 69,596,752 | |||||||||
BNP Paribas SA | France | 3,102,600 | 140,332,004 | |||||||||
CIT Group Inc. | United States | 3,769,060 | 144,241,926 | |||||||||
Citigroup Inc. | United States | 4,720,240 | 245,735,694 | |||||||||
Citizens Financial Group Inc. | United States | 9,225,010 | 274,259,547 | |||||||||
First Horizon National Corp. | United States | 7,743,203 | 101,900,552 | |||||||||
HSBC Holdings PLC | United Kingdom | 16,067,494 | 132,550,269 | |||||||||
JPMorgan Chase & Co. | United States | 1,959,756 | 191,311,381 | |||||||||
Societe Generale SA | France | 5,157,188 | 164,391,322 | |||||||||
Standard Chartered PLC | United Kingdom | 12,656,750 | 98,344,187 | |||||||||
Wells Fargo & Co. | United States | 5,713,404 | 263,273,656 | |||||||||
|
| |||||||||||
| 1,825,937,290 | ||||||||||||
|
| |||||||||||
Biotechnology 0.6% | ||||||||||||
Shire PLC | United Kingdom | 1,624,235 | 94,658,666 | |||||||||
|
| |||||||||||
Building Products 1.2% | ||||||||||||
Johnson Controls International PLC | United States | 6,119,300 | 181,437,245 | |||||||||
|
| |||||||||||
Capital Markets 1.3% | ||||||||||||
Credit Suisse Group AG | Switzerland | 6,243,791 | 68,288,021 | |||||||||
Deutsche Bank AG | Germany | 6,644,039 | 52,989,745 | |||||||||
Guotai Junan Securities Co. Ltd. | China | 41,520,689 | 83,990,513 | |||||||||
|
| |||||||||||
| 205,268,279 | ||||||||||||
|
| |||||||||||
Chemicals 1.3% | ||||||||||||
BASF SE | Germany | 2,946,786 | 205,263,219 | |||||||||
a,b,e Dow Corning Corp., Contingent Distribution | United States | 11,430,153 | — | |||||||||
|
| |||||||||||
| 205,263,219 | ||||||||||||
|
| |||||||||||
Communications Equipment 2.8% | ||||||||||||
Cisco Systems Inc. | United States | 5,552,130 | 240,573,793 | |||||||||
Nokia OYJ, A | Finland | 28,555,604 | 164,576,619 | |||||||||
Nokia OYJ, ADR | Finland | 4,767,871 | 27,749,009 | |||||||||
|
| |||||||||||
| 432,899,421 | ||||||||||||
|
| |||||||||||
Construction Materials 1.0% | ||||||||||||
LafargeHolcim Ltd., B | Switzerland | 3,691,245 | 152,403,248 | |||||||||
|
| |||||||||||
Consumer Finance 1.7% | ||||||||||||
Ally Financial Inc. | United States | 4,094,210 | 92,774,799 | |||||||||
Capital One Financial Corp. | United States | 2,190,465 | 165,577,249 | |||||||||
|
| |||||||||||
| 258,352,048 | ||||||||||||
|
| |||||||||||
Containers & Packaging 1.0% | ||||||||||||
International Paper Co. | United States | 3,679,148 | 148,490,413 | |||||||||
|
| |||||||||||
franklintempleton.com |
Annual Report |
19 |
FRANKLIN MUTUAL GLOBAL DISCOVERY FUND
STATEMENT OF INVESTMENTS
| Country | Shares/ Units/ Warrants | Value | ||||||||||
| ||||||||||||
Common Stocks and Other Equity Interests(continued) | ||||||||||||
Diversified Financial Services 0.9% | ||||||||||||
Voya Financial Inc. | United States | 3,426,353 | $ | 137,533,809 | ||||||||
|
| |||||||||||
Diversified Telecommunication Services 2.6% | ||||||||||||
AT&T Inc. | United States | 4,600,757 | 131,305,605 | |||||||||
Koninklijke KPN NV | Netherlands | 92,169,805 | 270,356,884 | |||||||||
|
| |||||||||||
| 401,662,489 | ||||||||||||
|
| |||||||||||
Electric Utilities 2.5% | ||||||||||||
Enel SpA | Italy | 57,664,238 | 334,308,347 | |||||||||
a PG&E Corp. | United States | 2,115,252 | 50,237,235 | |||||||||
|
| |||||||||||
| 384,545,582 | ||||||||||||
|
| |||||||||||
Energy Equipment & Services 1.1% | ||||||||||||
Baker Hughes a GE Co., A | United States | 7,502,843 | 161,311,125 | |||||||||
|
| |||||||||||
Entertainment 2.8% | ||||||||||||
The Walt Disney Co. | United States | 3,912,400 | 428,994,660 | |||||||||
|
| |||||||||||
Food & Staples Retailing 1.3% | ||||||||||||
Walgreens Boots Alliance Inc. | United States | 2,833,972 | 193,645,307 | |||||||||
|
| |||||||||||
Health Care Equipment & Supplies 4.4% | ||||||||||||
Koninklijke Philips NV | Netherlands | 4,161,597 | 147,485,301 | |||||||||
Medtronic PLC | United States | 5,808,484 | 528,339,705 | |||||||||
|
| |||||||||||
| 675,825,006 | ||||||||||||
|
| |||||||||||
Health Care Providers & Services 1.3% | ||||||||||||
CVS Health Corp. | United States | 3,061,866 | 200,613,460 | |||||||||
|
| |||||||||||
Hotels, Restaurants & Leisure 2.3% | ||||||||||||
Accor SA | France | 5,757,306 | 244,804,313 | |||||||||
Sands China Ltd. | Macau | 25,499,100 | 111,693,906 | |||||||||
|
| |||||||||||
| 356,498,219 | ||||||||||||
|
| |||||||||||
Independent Power & Renewable Electricity Producers 0.6% | ||||||||||||
a Vistra Energy Corp. | United States | 3,709,858 | 84,918,650 | |||||||||
|
| |||||||||||
Industrial Conglomerates 0.8% | ||||||||||||
General Electric Co. | United States | 16,950,050 | 128,311,879 | |||||||||
|
| |||||||||||
Insurance 9.8% | ||||||||||||
Alleghany Corp. | United States | 76,761 | 47,846,667 | |||||||||
American International Group Inc. | United States | 5,102,618 | 201,094,175 | |||||||||
China Pacific Insurance Group Co. Ltd., H | China | 44,491,587 | 144,034,446 | |||||||||
Chubb Ltd. | United States | 2,015,798 | 260,400,786 | |||||||||
The Hartford Financial Services Group Inc. | United States | 5,478,587 | 243,523,192 | |||||||||
MetLife Inc. | United States | 2,126,666 | 87,320,906 | |||||||||
NN Group NV | Netherlands | 8,886,859 | 354,353,178 | |||||||||
RSA Insurance Group PLC | United Kingdom | 13,308,282 | 87,165,038 | |||||||||
T&D Holdings Inc. | Japan | 6,611,212 | 77,150,914 | |||||||||
|
| |||||||||||
| 1,502,889,302 | ||||||||||||
|
| |||||||||||
IT Services 1.4% | ||||||||||||
Cognizant Technology Solutions Corp., A | United States | 3,420,390 | 217,126,357 | |||||||||
|
| |||||||||||
Machinery 0.8% | ||||||||||||
CNH Industrial NV | United Kingdom | 5,804,196 | 52,444,855 | |||||||||
CNH Industrial NV, special voting | United Kingdom | 7,338,645 | 66,309,644 | |||||||||
|
| |||||||||||
| 118,754,499 | ||||||||||||
|
| |||||||||||
20 |
Annual Report |
franklintempleton.com |
FRANKLIN MUTUAL GLOBAL DISCOVERY FUND
STATEMENT OF INVESTMENTS
| Country | Shares/ Units/ Warrants | Value | ||||||||||
| ||||||||||||
Common Stocks and Other Equity Interests (continued) | ||||||||||||
Media 3.3% | ||||||||||||
a Charter Communications Inc., A | United States | 840,665 | $ | 239,564,305 | ||||||||
a Cumulus Media Inc., A | United States | 215,987 | 2,332,660 | |||||||||
a Cumulus Media Inc., B | United States | 322,030 | 3,059,285 | |||||||||
a Cumulus Media Inc., wts., 6/04/38 | United States | 243,863 | 2,316,698 | |||||||||
a DISH Network Corp., A | United States | 4,143,726 | 103,468,838 | |||||||||
a Liberty Global PLC, C | United Kingdom | 7,299,000 | 150,651,360 | |||||||||
|
| |||||||||||
| 501,393,146 | ||||||||||||
|
| |||||||||||
Metals & Mining 0.4% | ||||||||||||
thyssenkrupp AG | Germany | 1,648,271 | 28,315,165 | |||||||||
Warrior Met Coal Inc. | United States | 1,230,858 | 29,675,986 | |||||||||
|
| |||||||||||
| 57,991,151 | ||||||||||||
|
| |||||||||||
Oil, Gas & Consumable Fuels 9.8% | ||||||||||||
Anadarko Petroleum Corp. | United States | 1,866,600 | 81,831,744 | |||||||||
BP PLC | United Kingdom | 24,503,699 | 154,976,147 | |||||||||
Canadian Natural Resources Ltd. | Canada | 7,822,700 | 188,783,280 | |||||||||
Crescent Point Energy Corp. | Canada | 19,234,400 | 58,339,438 | |||||||||
JXTG Holdings Inc. | Japan | 14,684,167 | 77,266,050 | |||||||||
Kinder Morgan Inc. | United States | 15,908,858 | 244,678,236 | |||||||||
Marathon Oil Corp. | United States | 5,921,464 | 84,913,794 | |||||||||
Plains All American Pipeline LP | United States | 5,573,200 | 111,686,928 | |||||||||
Royal Dutch Shell PLC, A (EUR Traded) | United Kingdom | 6,246,107 | 183,607,424 | |||||||||
Royal Dutch Shell PLC, A (GBP Traded) | United Kingdom | 6,164,658 | 181,403,646 | |||||||||
The Williams Cos. Inc. | United States | 6,364,035 | 140,326,972 | |||||||||
|
| |||||||||||
| 1,507,813,659 | ||||||||||||
|
| |||||||||||
Pharmaceuticals 10.2% | ||||||||||||
Eli Lilly & Co. | United States | 3,027,417 | 350,332,695 | |||||||||
GlaxoSmithKline PLC | United Kingdom | 19,892,359 | 378,283,587 | |||||||||
Merck & Co. Inc. | United States | 4,132,828 | 315,789,387 | |||||||||
Novartis AG, ADR | Switzerland | 6,066,244 | 520,544,398 | |||||||||
|
| |||||||||||
| 1,564,950,067 | ||||||||||||
|
| |||||||||||
Semiconductors & Semiconductor Equipment 0.7% | ||||||||||||
a Renesas Electronics Corp. | Japan | 23,512,917 | 107,266,957 | |||||||||
|
| |||||||||||
Software 3.6% | ||||||||||||
a Avaya Holdings Corp., wts., 12/15/22 | United States | 401,411 | 822,893 | |||||||||
a Check Point Software Technologies Ltd. | Israel | 2,703,472 | 277,511,401 | |||||||||
aRed Hat Inc. | United States | 505,600 | 88,803,584 | |||||||||
Symantec Corp. | United States | 9,568,159 | 180,790,364 | |||||||||
|
| |||||||||||
| 547,928,242 | ||||||||||||
|
| |||||||||||
Specialty Retail 0.7% | ||||||||||||
Dufry AG | Switzerland | 1,124,346 | 107,150,706 | |||||||||
|
| |||||||||||
Technology Hardware, Storage & Peripherals 3.6% | ||||||||||||
Hewlett Packard Enterprise Co. | United States | 10,039,360 | 132,619,946 | |||||||||
Samsung Electronics Co. Ltd. | South Korea | 8,138,650 | 282,807,692 | |||||||||
Western Digital Corp. | United States | 3,527,471 | 130,410,603 | |||||||||
|
| |||||||||||
| 545,838,241 | ||||||||||||
|
| |||||||||||
franklintempleton.com |
Annual Report |
21 |
FRANKLIN MUTUAL GLOBAL DISCOVERY FUND
STATEMENT OF INVESTMENTS
| Country | Shares/ Units/ Warrants | Value | ||||||||||
Common Stocks and Other Equity Interests(continued) | ||||||||||||
Tobacco 2.9% | ||||||||||||
Altria Group Inc. | United States | 2,606,727 | $ | 128,746,247 | ||||||||
British American Tobacco PLC | United Kingdom | 5,783,513 | 184,385,616 | |||||||||
British American Tobacco PLC, ADR | United Kingdom | 2,178,905 | 69,419,913 | |||||||||
Imperial Brands PLC | United Kingdom | 1,937,431 | 58,728,748 | |||||||||
|
| |||||||||||
| 441,280,524 | ||||||||||||
|
| |||||||||||
Total Common Stocks and Other Equity Interests (Cost $13,291,976,331) | 14,244,515,530 | |||||||||||
|
| |||||||||||
Management Investment Companies (Cost $112,851,576) 0.6% | ||||||||||||
Diversified Financial Services 0.6% | ||||||||||||
a Altaba Inc. | United States | 1,722,000 | 99,772,680 | |||||||||
|
| |||||||||||
Preferred Stocks (Cost $391,187,079) 2.0% | ||||||||||||
Automobiles 2.0% | ||||||||||||
f Volkswagen AG, 2.845%, pfd. | Germany | 1,896,164 | 302,367,006 | |||||||||
|
| |||||||||||
| Principal Amount | ||||||||||||
Corporate Notes and Senior Floating Rate Interests 1.5% | ||||||||||||
g,h Cumulus Media New Holdings Inc., Term Loan, 7.03%,(1-month USD LIBOR + 4.50%), 5/13/22 | United States | $ | 60,554,439 | 57,463,619 | ||||||||
Frontier Communications Corp., | ||||||||||||
senior note, 10.50%, 9/15/22 | United States | 117,895,000 | 82,526,500 | |||||||||
senior note, 11.00%, 9/15/25 | United States | 133,179,000 | 83,563,164 | |||||||||
|
| |||||||||||
Total Corporate Notes and Senior Floating Rate Interests (Cost $290,112,149) | 223,553,283 | |||||||||||
|
| |||||||||||
Corporate Notes and Senior Floating Rate Interests in Reorganization 1.1% | ||||||||||||
b,c,i Broadband Ventures III LLC, secured promissory note, 5.00%, 2/01/12 | United States | 8,893 | — | |||||||||
i iHeartCommunications Inc., | United States | 95,618,000 | 64,542,150 | |||||||||
g,h Tranche D Term Loan, 8.443%,(3-month USD LIBOR + 6.75%), 1/30/19 | United States | 117,978,997 | 79,799,814 | |||||||||
g,h Tranche E Term Loan, 9.193%,(3-month USD LIBOR + 7.50%), 7/30/19 | United States | 37,921,652 | 25,637,691 | |||||||||
|
| |||||||||||
Total Corporate Notes and Senior Floating Rate Interests in Reorganization (Cost $245,871,832) | 169,979,655 | |||||||||||
|
| |||||||||||
| Shares | ||||||||||||
Companies in Liquidation 0.0%† | ||||||||||||
a,b,e Avaya Holdings Corp., Contingent Distribution | United States | 123,916,000 | — | |||||||||
a,b,e Avaya Inc., Contingent Distribution | United States | 168,607,601 | — | |||||||||
a,b,e NewPage Corp., Litigation Trust, Contingent Distribution | United States | 145,817,000 | — | |||||||||
a,b,e Tribune Media, Litigation Trust, Contingent Distribution | United States | 1,300,519 | — | |||||||||
a,e Vistra Energy Corp., Litigation Trust, Contingent Distribution | United States | 142,325,613 | 128,093 | |||||||||
|
| |||||||||||
Total Companies in Liquidation (Cost $4,889,193) | 128,093 | |||||||||||
|
| |||||||||||
Total Investments before Short Term Investments (Cost $14,336,888,160) | 15,040,316,247 | |||||||||||
|
| |||||||||||
22 |
Annual Report |
franklintempleton.com |
FRANKLIN MUTUAL GLOBAL DISCOVERY FUND
STATEMENT OF INVESTMENTS
| Country | Principal Amount | Value | ||||||||||
| ||||||||||||
Short Term Investments 1.1% | ||||||||||||
U.S. Government and Agency Securities 1.1% | ||||||||||||
jU.S. Treasury Bill, | ||||||||||||
4/25/19—5/16/19 | United States | $ | 74,000,000 | $ | 73,391,905 | |||||||
k5/30/19—6/06/19 | United States | 100,000,000 | 98,952,012 | |||||||||
|
| |||||||||||
Total U.S. Government and Agency Securities | ||||||||||||
(Cost $172,335,750) | 172,343,917 | |||||||||||
|
| |||||||||||
Total Investments (Cost $14,509,223,910) 99.3% | 15,212,660,164 | |||||||||||
Securities Sold Short (0.9)% | (131,039,275 | ) | ||||||||||
Other Assets, less Liabilities 1.6% | 241,408,342 | |||||||||||
|
| |||||||||||
Net Assets 100.0% | $ | 15,323,029,231 | ||||||||||
|
| |||||||||||
| Shares | ||||||||||||
|
| |||||||||||
lSecurities Sold Short (0.9)% | ||||||||||||
Common Stocks (0.9)% | ||||||||||||
Internet & Direct Marketing Retail (0.6)% | ||||||||||||
Alibaba Group Holding Ltd., ADR | China | 619,920 | (84,972,434) | |||||||||
|
| |||||||||||
Pharmaceuticals (0.3)% | ||||||||||||
Takeda Pharmaceutical Co. Ltd. | Japan | 1,362,733 | (46,066,841) | |||||||||
|
| |||||||||||
Total Securities Sold Short (Proceeds $165,751,941) | $ | (131,039,275) | ||||||||||
|
| |||||||||||
†Rounds to less than 0.1% of net assets.
aNon-income producing.
bFair valued using significant unobservable inputs. See Note 14 regarding fair value measurements.
cSee Note 10 regarding restricted securities.
dSee Note 12 regarding holdings of 5% voting securities.
eContingent distributions represent the right to receive additional distributions, if any, during the reorganization of the underlying company. Shares represent total underlying principal of debt securities.
fVariable rate security. The rate shown represents the yield at period end.
gThe coupon rate shown represents the rate at period end.
hSee Note 1(f) regarding senior floating rate interests.
iSee Note 8 regarding credit risk and defaulted securities.
jThe security was issued on a discount basis with no stated coupon rate.
kA portion or all of the security has been segregated as collateral for securities sold short. At December 31, 2018, the aggregate value of these securities pledged amounted to $53,244,007, representing 0.3% of net assets.
lSee Note 1(d) regarding securities sold short.
franklintempleton.com |
Annual Report |
23 |
FRANKLIN MUTUAL GLOBAL DISCOVERY FUND
STATEMENT OF INVESTMENTS
At December 31, 2018, the Fund had the following futures contracts outstanding. See Note 1(c).
| Futures Contracts | ||||||||||||||||||||
| Description | Type | Number of Contracts | Notional Amount* | Expiration Date | Value/ Unrealized Appreciation (Depreciation) | |||||||||||||||
| Currency Contracts | ||||||||||||||||||||
EUR/USD | Short | 7,997 | $ | 1,151,817,906 | 3/18/19 | $171,874 | ||||||||||||||
GBP/USD | Short | 4,928 | 393,932,000 | 3/18/19 | 814,303 | |||||||||||||||
|
| |||||||||||||||||||
Total Futures Contracts | $986,177 | |||||||||||||||||||
|
| |||||||||||||||||||
*As of period end.
At December 31, 2018, the Fund had the following forward exchange contracts outstanding. See Note 1(c).
| Forward Exchange Contracts | ||||||||||||||||||||||||||||
| Currency | Counterpartya | Type | Quantity | Contract Amount | Settlement Date | Unrealized Appreciation | Unrealized Depreciation | |||||||||||||||||||||
| OTC Forward Exchange Contracts |
| |||||||||||||||||||||||||||
Euro | BOFA | Buy | 44,471,405 | $ | 50,749,345 | 1/14/19 | $ | 269,298 | $ | — | ||||||||||||||||||
Euro | BONY | Sell | 105,953,256 | 125,813,135 | 1/14/19 | 4,261,059 | — | |||||||||||||||||||||
Euro | HSBK | Buy | 40,549,596 | 46,297,602 | 1/14/19 | 221,853 | — | |||||||||||||||||||||
Euro | SSBT | Buy | 29,133,423 | 33,196,362 | 1/14/19 | 226,188 | — | |||||||||||||||||||||
Euro | SSBT | Sell | 131,454,469 | 156,121,436 | 1/14/19 | 5,313,768 | — | |||||||||||||||||||||
Euro | UBSW | Buy | 33,375,381 | 38,058,504 | 1/14/19 | 230,519 | — | |||||||||||||||||||||
Swiss Franc | HSBK | Buy | 1,742,861 | 1,762,226 | 1/14/19 | 14,612 | — | |||||||||||||||||||||
Swiss Franc | UBSW | Buy | 10,948,761 | 11,068,118 | 1/14/19 | 94,087 | — | |||||||||||||||||||||
Swiss Franc | UBSW | Sell | 79,630,516 | 79,946,304 | 1/14/19 | — | (1,236,597 | ) | ||||||||||||||||||||
British Pound | BOFA | Buy | 4,449,926 | 5,637,776 | 1/16/19 | 41,772 | — | |||||||||||||||||||||
British Pound | HSBK | Buy | 5,630,327 | 7,147,186 | 1/16/19 | 38,935 | — | |||||||||||||||||||||
British Pound | SSBT | Sell | 186,479,840 | 248,530,075 | 1/16/19 | 10,521,409 | — | |||||||||||||||||||||
British Pound | UBSW | Buy | 761,434 | 962,267 | 1/16/19 | 9,570 | — | |||||||||||||||||||||
British Pound | UBSW | Sell | 17,190,457 | 22,161,336 | 2/14/19 | 189,793 | — | |||||||||||||||||||||
South Korean Won | BONY | Sell | 10,580,245,000 | 9,561,902 | 2/15/19 | 47,570 | — | |||||||||||||||||||||
South Korean Won | HSBK | Buy | 19,984,836,775 | 17,737,019 | 2/15/19 | 234,433 | — | |||||||||||||||||||||
South Korean Won | HSBK | Sell | 65,325,687,402 | 58,845,156 | 2/15/19 | 100,742 | — | |||||||||||||||||||||
South Korean Won | UBSW | Buy | 17,208,605,268 | 15,272,517 | 2/15/19 | 202,398 | — | |||||||||||||||||||||
South Korean Won | UBSW | Sell | 160,512,695,008 | 144,573,470 | 2/15/19 | 231,718 | — | |||||||||||||||||||||
Japanese Yen | HSBK | Buy | 655,786,278 | 5,933,847 | 2/19/19 | 73,099 | — | |||||||||||||||||||||
Japanese Yen | UBSW | Buy | 411,120,929 | 3,729,696 | 2/19/19 | 36,136 | — | |||||||||||||||||||||
Japanese Yen | UBSW | Sell | 9,596,174,218 | 85,462,655 | 2/19/19 | — | (2,437,473 | ) | ||||||||||||||||||||
Euro | BOFA | Sell | 10,797,489 | 12,839,111 | 2/20/19 | 414,007 | — | |||||||||||||||||||||
Euro | BONY | Sell | 33,924,941 | 39,582,719 | 2/20/19 | 543,927 | — | |||||||||||||||||||||
Euro | HSBK | Sell | 17,809,661 | 21,234,245 | 2/20/19 | 739,953 | — | |||||||||||||||||||||
Euro | SSBT | Sell | 28,860,057 | 33,573,127 | 2/20/19 | 362,702 | — | |||||||||||||||||||||
Euro | UBSW | Sell | 6,263,761 | 7,408,589 | 2/20/19 | 200,627 | — | |||||||||||||||||||||
Euro | BONY | Sell | 198,604,610 | 231,628,585 | 4/10/19 | 2,108,222 | — | |||||||||||||||||||||
Euro | SSBT | Sell | 198,604,611 | 231,652,418 | 4/10/19 | 2,132,054 | — | |||||||||||||||||||||
Euro | BOFA | Sell | 1,460,577 | 1,688,763 | 4/18/19 | — | (347 | ) | ||||||||||||||||||||
Euro | BOFA | Sell | 162,868,996 | 191,844,318 | 4/18/19 | 3,491,603 | — | |||||||||||||||||||||
Euro | BONY | Sell | 1,539,423 | 1,779,342 | 4/18/19 | — | (951 | ) | ||||||||||||||||||||
24 |
Annual Report |
franklintempleton.com |
FRANKLIN MUTUAL GLOBAL DISCOVERY FUND
STATEMENT OF INVESTMENTS
| Forward Exchange Contracts(continued) | ||||||||||||||||||||||||||||
| Currency | Counterpartya | Type | Quantity | Contract Amount | Settlement Date | Unrealized Appreciation | Unrealized Depreciation | |||||||||||||||||||||
| OTC Forward Exchange Contracts(continued) |
| |||||||||||||||||||||||||||
Euro | BONY | Sell | 1,867,562 | $ | 2,169,846 | 4/18/19 | $ | 10,071 | $ | — | ||||||||||||||||||
Euro | HSBK | Sell | 4,070,482 | 4,698,151 | 4/18/19 | — | (9,230 | ) | ||||||||||||||||||||
Euro | HSBK | Sell | 161,022,897 | 189,731,669 | 4/18/19 | 3,513,908 | — | |||||||||||||||||||||
Euro | UBSW | Sell | 4,925,892 | 5,661,435 | 4/18/19 | — | (35,198 | ) | ||||||||||||||||||||
Euro | BOFA | Sell | 6,350,792 | 7,258,143 | 5/07/19 | — | (98,479 | ) | ||||||||||||||||||||
Euro | BOFA | Sell | 109,713,348 | 127,141,862 | 5/07/19 | 52,265 | — | |||||||||||||||||||||
Euro | HSBK | Sell | 9,816,864 | 11,328,522 | 5/07/19 | — | (43,122 | ) | ||||||||||||||||||||
Euro | HSBK | Sell | 44,717,074 | 51,992,541 | 5/07/19 | 193,239 | — | |||||||||||||||||||||
Euro | UBSW | Sell | 117,577,354 | 136,282,120 | 5/07/19 | 83,027 | — | |||||||||||||||||||||
South Korean Won | BONY | Sell | 10,824,592,957 | 9,763,320 | 5/17/19 | — | (7,662 | ) | ||||||||||||||||||||
South Korean Won | HSBK | Sell | 18,991,957,143 | 17,106,789 | 5/17/19 | — | (36,588 | ) | ||||||||||||||||||||
South Korean Won | UBSW | Sell | 82,261,627,033 | 73,579,273 | 5/17/19 | — | (675,429 | ) | ||||||||||||||||||||
Euro | BOFA | Sell | 9,997,594 | 11,510,530 | 5/21/19 | — | (84,588 | ) | ||||||||||||||||||||
Euro | HSBK | Sell | 10,002,406 | 11,515,380 | 5/21/19 | — | (85,319 | ) | ||||||||||||||||||||
Euro | SSBT | Sell | 135,728,920 | 158,049,541 | 5/21/19 | 632,388 | — | |||||||||||||||||||||
British Pound | BOFA | Sell | 17,268,642 | 22,361,682 | 5/28/19 | 182,056 | — | |||||||||||||||||||||
|
| |||||||||||||||||||||||||||
Total Forward Exchange Contracts |
| $ | 37,019,008 | $ | (4,750,983 | ) | ||||||||||||||||||||||
|
| |||||||||||||||||||||||||||
Net unrealized appreciation (depreciation) |
| $ | 32,268,025 | |||||||||||||||||||||||||
|
| |||||||||||||||||||||||||||
aMay be comprised of multiple contracts with the same counterparty, currency and settlement date.
See Note 11 regarding other derivative information.
See Abbreviations on page 43.
franklintempleton.com |
Annual Report |
25 |
FRANKLIN MUTUAL GLOBAL DISCOVERY FUND
Statement of Assets and Liabilities
December 31, 2018
Assets: | ||||
Investments in securities: | ||||
Cost - Unaffiliated issuers | $ | 14,480,128,539 | ||
Cost -Non-controlled affiliates (Note 3f and 12) | 29,095,371 | |||
|
| |||
Value - Unaffiliated issuers | $ | 15,208,429,627 | ||
Value -Non-controlled affiliates (Note 3f and 12) | 4,230,537 | |||
Foreign currency, at value (cost $1,553,481) | 1,553,117 | |||
Receivables: | ||||
Investment securities sold | 78,160,888 | |||
Capital shares sold | 16,971,344 | |||
Dividends and interest | 49,701,036 | |||
European Union tax reclaims | 8,528,146 | |||
Deposits with brokers for: | ||||
Securities sold short | 144,499,743 | |||
OTC derivative contracts | 2,260,000 | |||
Futures contracts | 31,783,830 | |||
Unrealized appreciation on OTC forward exchange contracts | 37,019,008 | |||
Other assets | 43,817 | |||
|
| |||
Total assets | 15,583,181,093 | |||
|
| |||
Liabilities: | ||||
Payables: | ||||
Investment securities purchased | 4,769,662 | |||
Capital shares redeemed | 92,197,403 | |||
Management fees | 11,407,570 | |||
Distribution fees | 5,616,400 | |||
Transfer agent fees | 4,225,576 | |||
Trustees’ fees and expenses | 1,055,082 | |||
Variation margin on futures contracts | 2,239,738 | |||
Funds advanced by custodian | 1,257,347 | |||
Securities sold short, at value (proceeds $165,751,941) | 131,039,275 | |||
Unrealized depreciation on OTC forward exchange contracts | 4,750,983 | |||
Accrued expenses and other liabilities | 1,592,826 | |||
|
| |||
Total liabilities | 260,151,862 | |||
|
| |||
Net assets, at value | $ | 15,323,029,231 | ||
|
| |||
Net assets consist of: | ||||
Paid-in capital | $ | 14,289,365,488 | ||
Total distributable earnings (loss) | 1,033,663,743 | |||
|
| |||
Net assets, at value | $ | 15,323,029,231 | ||
|
|
26 |
Annual Report | The accompanying notes are an integral part of these financial statements. |
franklintempleton.com |
FRANKLIN MUTUAL GLOBAL DISCOVERY FUND
FINANCIAL STATEMENTS
Statement of Assets and Liabilities(continued)
December 31, 2018
| Class Z: | ||||
Net assets, at value | $5,114,274,406 | |||
|
| |||
Shares outstanding | 190,373,213 | |||
|
| |||
Net asset value and maximum offering price per share | $26.86 | |||
|
| |||
| Class A: | ||||
Net assets, at value | $7,461,444,275 | |||
|
| |||
Shares outstanding | 283,469,919 | |||
|
| |||
Net asset value per sharea | $26.32 | |||
|
| |||
Maximum offering price per share (net asset value per share ÷ 94.50%) | $27.85 | |||
|
| |||
| Class C: | ||||
Net assets, at value | $1,054,411,956 | |||
|
| |||
Shares outstanding | 40,161,804 | |||
|
| |||
Net asset value and maximum offering price per sharea | $26.25 | |||
|
| |||
| Class R: | ||||
Net assets, at value | $ 274,086,126 | |||
|
| |||
Shares outstanding | 10,555,737 | |||
|
| |||
Net asset value and maximum offering price per share | $25.97 | |||
|
| |||
| Class R6: | ||||
Net assets, at value | $1,418,812,468 | |||
|
| |||
Shares outstanding | 52,835,647 | |||
|
| |||
Net asset value and maximum offering price per share | $26.85 | |||
|
| |||
aRedemption price is equal to net asset value less contingent deferred sales charges, if applicable.
franklintempleton.com |
The accompanying notes are an integral part of these financial statements. | Annual Report |
27 |
FRANKLIN MUTUAL GLOBAL DISCOVERY FUND
FINANCIAL STATEMENTS
Statement of Operations
for the year ended December 31, 2018
Investment income: | ||||
Dividends: (net of foreign taxes)* | ||||
Unaffiliated issuers | $ | 491,287,166 | ||
Interest: | ||||
Unaffiliated issuers | 53,764,855 | |||
Income from securities loaned: | ||||
Unaffiliated issuers (net of fees and rebates) | 121,459 | |||
Non-controlled affiliates (Note 3f) | 9,364 | |||
Other income (Note 1g) | 2,160,890 | |||
|
| |||
Total investment income | 547,343,734 | |||
|
| |||
Expenses: | ||||
Management fees (Note 3a) | 160,492,765 | |||
Distribution fees: (Note 3c) | ||||
Class A | 22,005,203 | |||
Class C | 20,131,008 | |||
Class R | 1,744,314 | |||
Transfer agent fees: (Note 3e) | ||||
Class Z | 7,896,012 | |||
Class A | 10,584,220 | |||
Class C | 2,421,172 | |||
Class R | 420,791 | |||
Class R6 | 499,110 | |||
Custodian fees (Note 4) | 1,051,732 | |||
Reports to shareholders | 1,387,957 | |||
Registration and filing fees | 253,196 | |||
Professional fees | 538,024 | |||
Trustees’ fees and expenses | 1,206,669 | |||
Dividends on securities sold short | 878,680 | |||
Other | 833,493 | |||
|
| |||
Total expenses | 232,344,346 | |||
Expense reductions (Note 4) | (158,096 | ) | ||
Expenses waived/paid by affiliates (Note 3f and 3g) | (119,926 | ) | ||
|
| |||
Net expenses | 232,066,324 | |||
|
| |||
Net investment income | 315,277,410 | |||
|
| |||
Realized and unrealized gains (losses): | ||||
Net realized gain (loss) from: | ||||
Investments: | ||||
Unaffiliated issuers | 1,085,651,942 | |||
Foreign currency transactions | (4,131,595 | ) | ||
Forward exchange contracts | 69,523,335 | |||
Futures contracts | 107,674,569 | |||
Securities sold short | 4,326,934 | |||
|
| |||
Net realized gain (loss) | 1,263,045,185 | |||
|
| |||
Net change in unrealized appreciation (depreciation) on: | ||||
Investments: | ||||
Unaffiliated issuers | (3,754,835,370 | ) | ||
Non-controlled affiliates (Note 3f and 12) | (19,150,100 | ) | ||
Translation of other assets and liabilities denominated in foreign currencies | (903,954 | ) | ||
Forward exchange contracts | 141,683,362 | |||
Futures contracts | 29,915,219 | |||
Securities sold short | 33,311,551 | |||
|
| |||
Net change in unrealized appreciation (depreciation) | (3,569,979,292 | ) | ||
|
| |||
Net realized and unrealized gain (loss) | (2,306,934,107 | ) | ||
|
| |||
Net increase (decrease) in net assets resulting from operations | $ | (1,991,656,697 | ) | |
|
| |||
*Foreign taxes withheld on dividends | $ | 30,855,053 | ||
28 |
Annual Report | The accompanying notes are an integral part of these financial statements. |
franklintempleton.com |
FRANKLIN MUTUAL GLOBAL DISCOVERY FUND
FINANCIAL STATEMENTS
Statements of Changes in Net Assets
| Year Ended December 31, | ||||||||
|
| |||||||
| 2018 | 2017 | |||||||
| ||||||||
Increase (decrease) in net assets: | ||||||||
Operations: | ||||||||
Net investment income | $ | 315,277,410 | $ | 464,583,587 | ||||
Net realized gain (loss) | 1,263,045,185 | 665,444,446 | ||||||
Net change in unrealized appreciation (depreciation) | (3,569,979,292 | ) | 940,826,950 | |||||
|
| |||||||
Net increase (decrease) in net assets resulting from operations | (1,991,656,697 | ) | 2,070,854,983 | |||||
|
| |||||||
Distributions to shareholders: (Note 1h) | ||||||||
Class Z | (374,006,499 | ) | (405,979,001 | ) | ||||
Class A | (521,977,539 | ) | (496,550,626 | ) | ||||
Class C | (57,992,699 | ) | (109,241,075 | ) | ||||
Class R | (18,330,147 | ) | (19,953,815 | ) | ||||
Class R6 | (102,685,299 | ) | (94,640,192 | ) | ||||
|
| |||||||
Total distributions to shareholders | (1,074,992,183 | ) | (1,126,364,709 | ) | ||||
|
| |||||||
Capital share transactions: (Note 2) | ||||||||
Class Z | (1,016,045,824 | ) | (1,590,803,172 | ) | ||||
Class A | (656,381,733 | ) | (1,344,720,248 | ) | ||||
Class C | (1,164,168,030 | ) | (436,509,197 | ) | ||||
Class R | (70,948,671 | ) | (64,928,952 | ) | ||||
Class R6 | (526,328,702 | ) | 1,730,442,445 | |||||
|
| |||||||
Total capital share transactions | (3,433,872,960 | ) | (1,706,519,124 | ) | ||||
|
| |||||||
Net increase (decrease) in net assets | (6,500,521,840 | ) | (762,028,850 | ) | ||||
Net assets: | ||||||||
Beginning of year | 21,823,551,071 | 22,585,579,921 | ||||||
|
| |||||||
End of year (Note 1h) | $ | 15,323,029,231 | $ | 21,823,551,071 | ||||
|
| |||||||
franklintempleton.com |
The accompanying notes are an integral part of these financial statements. | Annual Report |
29 |
FRANKLIN MUTUAL GLOBAL DISCOVERY FUND
1. Organization and Significant Accounting Policies
Franklin Mutual Series Funds (Trust) is registered under the Investment Company Act of 1940 (1940 Act) as anopen-end management investment company, consisting of seven separate funds and applies the specialized accounting and reporting guidance in U.S. Generally Accepted Accounting Principles (U.S. GAAP). Franklin Mutual Global Discovery Fund (Fund) is included in this report. The Fund offers five classes of shares: Class Z, Class A, Class C, Class R and Class R6. Beginning on October 19, 2018, Class C shares automatically convert to Class A shares after they have been held for 10 years. Each class of shares may differ by its initial sales load, contingent deferred sales charges, voting rights on matters affecting a single class, its exchange privilege and fees due to differing arrangements for distribution and transfer agent fees.
The following summarizes the Fund’s significant accounting policies.
a. Financial Instrument Valuation
The Fund’s investments in financial instruments are carried at fair value daily. Fair value is the price that would be received to sell an asset or paid to transfer a liability in an orderly transaction between market participants on the measurement date. The Fund calculates the net asset value (NAV) per share each business day as of 4 p.m. Eastern time or the regularly scheduled close of the New York Stock Exchange (NYSE), whichever is earlier. Under compliance policies and procedures approved by the Trust’s Board of Trustees (the Board), the Fund’s administrator has responsibility for oversight of valuation, including leading the cross-functional Valuation Committee (VC). The Fund may utilize independent pricing services, quotations from securities and financial instrument dealers, and other market sources to determine fair value.
Equity securities and derivative financial instruments listed on an exchange or on the NASDAQ National Market System are valued at the last quoted sale price or the official closing price of the day, respectively. Foreign equity securities are valued as of the close of trading on the foreign stock exchange on which the security is primarily traded, or as of 4 p.m. Eastern time. The value is then converted into its U.S. dollar equivalent at the foreign exchange rate in effect at 4 p.m. Eastern time on the day that the value of the security is determined.Over-the-counter (OTC) securities are valued within the range of the most recent quoted bid and ask prices. Securities that trade in multiple
markets or on multiple exchanges are valued according to the broadest and most representative market. Certain equity securities are valued based upon fundamental characteristics or relationships to similar securities.
Debt securities generally trade in the OTC market rather than on a securities exchange. The Fund’s pricing services use multiple valuation techniques to determine fair value. In instances where sufficient market activity exists, the pricing services may utilize a market-based approach through which quotes from market makers are used to determine fair value. In instances where sufficient market activity may not exist or is limited, the pricing services also utilize proprietary valuation models which may consider market characteristics such as benchmark yield curves, credit spreads, estimated default rates, anticipated market interest rate volatility, coupon rates, anticipated timing of principal repayments, underlying collateral, and other unique security features in order to estimate the relevant cash flows, which are then discounted to calculate the fair value.
Investments inopen-end mutual funds are valued at the closing NAV.
Certain derivative financial instruments trade in the OTC market. The Fund’s pricing services use various techniques including industry standard option pricing models and proprietary discounted cash flow models to determine the fair value of those instruments. The Fund’s net benefit or obligation under the derivative contract, as measured by the fair value of the contract, is included in net assets.
The Fund has procedures to determine the fair value of financial instruments for which market prices are not reliable or readily available. Under these procedures, the Fund primarily employs a market-based approach which may use related or comparable assets or liabilities, recent transactions, market multiples, book values, and other relevant information for the investment to determine the fair value of the investment. An income-based valuation approach may also be used in which the anticipated future cash flows of the investment are discounted to calculate fair value. Discounts may also be applied due to the nature or duration of any restrictions on the disposition of the investments. Due to the inherent uncertainty of valuations of such investments, the fair values may differ significantly from the values that would have been used had an active market existed.
30 |
Annual Report |
franklintempleton.com |
FRANKLIN MUTUAL GLOBAL DISCOVERY FUND
NOTES TO FINANCIAL STATEMENTS
Trading in securities on foreign securities stock exchanges and OTC markets may be completed before 4 p.m. Eastern time. In addition, trading in certain foreign markets may not take place on every Fund’s business day. Occasionally, events occur between the time at which trading in a foreign security is completed and 4 p.m. Eastern time that might call into question the reliability of the value of a portfolio security held by the Fund. As a result, differences may arise between the value of the Fund’s portfolio securities as determined at the foreign market close and the latest indications of value at 4 p.m. Eastern time. In order to minimize the potential for these differences, the VC monitors price movements following the close of trading in foreign stock markets through a series of country specific market proxies (such as baskets of American Depositary Receipts, futures contracts and exchange traded funds). These price movements are measured against established trigger thresholds for each specific market proxy to assist in determining if an event has occurred that may call into question the reliability of the values of the foreign securities held by the Fund. If such an event occurs, the securities may be valued using fair value procedures, which may include the use of independent pricing services. At December 31, 2018, a market event occurred resulting in a portion of the securities held by the Fund being valued using fair value procedures.
When the last day of the reporting period is anon-business day, certain foreign markets may be open on those days that the Fund’s NAV is not calculated, which could result in differences between the value of the Fund’s portfolio securities on the last business day and the last calendar day of the reporting period. Any significant security valuation changes due to an open foreign market are adjusted and reflected by the Fund for financial reporting purposes.
b. Foreign Currency Translation
Portfolio securities and other assets and liabilities denominated in foreign currencies are translated into U.S. dollars based on the exchange rate of such currencies against U.S. dollars on the date of valuation. The Fund may enter into foreign currency exchange contracts to facilitate transactions denominated in a foreign currency. Purchases and sales of securities, income and expense items denominated in foreign currencies are translated into U.S. dollars at the exchange rate in effect on the transaction date. Portfolio securities and assets and liabilities denominated in foreign currencies contain risks that those currencies will decline in value relative to the U.S. dollar. Occasionally, events may impact the availability or reliability of foreign exchange
rates used to convert the U.S. dollar equivalent value. If such an event occurs, the foreign exchange rate will be valued at fair value using procedures established and approved by the Board.
The Fund does not separately report the effect of changes in foreign exchange rates from changes in market prices on securities held. Such changes are included in net realized and unrealized gain or loss from investments in the Statement of Operations.
Realized foreign exchange gains or losses arise from sales of foreign currencies, currency gains or losses realized between the trade and settlement dates on securities transactions and the difference between the recorded amounts of dividends, interest, and foreign withholding taxes and the U.S. dollar equivalent of the amounts actually received or paid. Net unrealized foreign exchange gains and losses arise from changes in foreign exchange rates on foreign denominated assets and liabilities other than investments in securities held at the end of the reporting period.
c. Derivative Financial Instruments
The Fund invested in derivative financial instruments in order to manage risk or gain exposure to various other investments or markets. Derivatives are financial contracts based on an underlying or notional amount, require no initial investment or an initial net investment that is smaller than would normally be required to have a similar response to changes in market factors, and require or permit net settlement. Derivatives contain various risks including the potential inability of the counterparty to fulfill their obligations under the terms of the contract, the potential for an illiquid secondary market, and/or the potential for market movements which expose the Fund to gains or losses in excess of the amounts shown in the Statement of Assets and Liabilities. Realized gain and loss and unrealized appreciation and depreciation on these contracts for the period are included in the Statement of Operations.
Derivative counterparty credit risk is managed through a formal evaluation of the creditworthiness of all potential counter-parties. The Fund attempts to reduce its exposure to counterparty credit risk on OTC derivatives, whenever possible, by entering into International Swaps and Derivatives Association (ISDA) master agreements with certain counterparties. These agreements contain various provisions, including but not limited to collateral requirements, events of default, or early termination. Termination events applicable to
franklintempleton.com |
Annual Report |
31 |
FRANKLIN MUTUAL GLOBAL DISCOVERY FUND
NOTES TO FINANCIAL STATEMENTS
1. Organization and Significant Accounting Policies(continued)
c. Derivative Financial Instruments(continued)
the counterparty include certain deteriorations in the credit quality of the counterparty. Termination events applicable to the Fund include failure of the Fund to maintain certain net asset levels and/or limit the decline in net assets over various periods of time. In the event of default or early termination, the ISDA master agreement gives thenon-defaulting party the right to net andclose-out all transactions traded, whether or not arising under the ISDA agreement, to one net amount payable by one counterparty to the other. However, absent an event of default or early termination, OTC derivative assets and liabilities are presented gross and not offset in the Statement of Assets and Liabilities. Early termination by the counterparty may result in an immediate payment by the Fund of any net liability owed to that counterparty under the ISDA agreement. At December 31, 2018, the Fund had OTC derivatives in a net liability position of $3,106,822 and the aggregate value of collateral pledged for such contracts was $2,260,000.
Collateral requirements differ by type of derivative. Collateral or initial margin requirements are set by the broker or exchange clearing house for exchange traded and centrally cleared derivatives. Initial margin deposited is held at the exchange and can be in the form of cash and/or securities. For OTC derivatives traded under an ISDA master agreement, posting of collateral is required by either the Fund or the applicable counterparty if the total net exposure of all OTC derivatives with the applicable counterparty exceeds the minimum transfer amount, which typically ranges from $100,000 to $250,000, and can vary depending on the counterparty and the type of the agreement. Generally, collateral is determined at the close of Fund business each day and any additional collateral required due to changes in derivative values may be delivered by the Fund or the counterparty the next business day, or within a few business days. Collateral pledged and/or received by the Fund for OTC derivatives, if any, is held in segregated accounts with the Fund’s custodian/counterparty broker and can be in the form of cash and/or securities. Unrestricted cash may be invested according to the Fund’s investment objectives. To the extent that the amounts due to the Fund from its counterparties are not subject to collateralization or are not fully collateralized, the Fund bears the risk of loss from counterpartynon-performance.
At December 31, 2018, the Fund received $39,012,714 in U.K. Treasury Bonds and U.S. Treasury Bonds and Notes as collateral for derivatives.
The Fund entered into exchange traded futures contracts primarily to manage exposure to certain foreign currencies. A futures contract is an agreement between the Fund and a counterparty to buy or sell an asset at a specified price on a future date. Required initial margins are pledged by the Fund, and the daily change in fair value is accounted for as a variation margin payable or receivable in the Statement of Assets and Liabilities.
The Fund entered into OTC forward exchange contracts primarily to manage exposure to certain foreign currencies. A forward exchange contract is an agreement between the Fund and a counterparty to buy or sell a foreign currency at a specific exchange rate on a future date.
See Note 11 regarding other derivative information.
d. Securities Sold Short
The Fund is engaged in selling securities short, which obligates the Fund to replace a borrowed security with the same security at current fair value. The Fund incurs a loss if the price of the security increases between the date of the short sale and the date on which the Fund replaces the borrowed security. The Fund realizes a gain if the price of the security declines between those dates. Gains are limited to the price at which the Fund sold the security short, while losses are potentially unlimited in size.
The Fund is required to establish a margin account with the broker lending the security sold short. While the short sale is outstanding, the broker retains the proceeds of the short sale to the extent necessary to meet margin requirements until the short position is closed out. A deposit must also be maintained with the Fund’s custodian/counterparty broker consisting of cash and/or securities having a value equal to a specified percentage of the value of the securities sold short. The Fund is obligated to pay fees for borrowing the securities sold short and is required to pay the counterparty any dividends and/or interest due on securities sold short. Such dividends and/or interest and any security borrowing fees are recorded as an expense to the Fund.
e. Securities Lending
The Fund participates in an agency based securities lending program to earn additional income. The Fund receives cash collateral against the loaned securities in an amount equal to at
32 |
Annual Report |
franklintempleton.com |
FRANKLIN MUTUAL GLOBAL DISCOVERY FUND
NOTES TO FINANCIAL STATEMENTS
least 102% of the fair value of the loaned securities. Collateral is maintained over the life of the loan in an amount not less than 100% of the fair value of loaned securities, as determined at the close of Fund business each day; any additional collateral required due to changes in security values is delivered to the Fund on the next business day. The collateral is deposited into a joint cash account with other funds and is used to invest in a money market fund managed by Franklin Advisers, Inc., an affiliate of the Fund, and/or a joint repurchase agreement. The Fund may receive income from the investment of cash collateral, in addition to lending fees and rebates paid by the borrower. Income from securities loaned, net of fees paid to the securities lending agent and/or third-party vendor, is reported separately in the Statement of Operations. The Fund bears the market risk with respect to the collateral investment, securities loaned, and the risk that the agent may default on its obligations to the Fund. If the borrower defaults on its obligation to return the securities loaned, the Fund has the right to repurchase the securities in the open market using the collateral received. The securities lending agent has agreed to indemnify the Fund in the event of default by a third party borrower. At December 31, 2018, the Fund had no securities on loan.
f. Senior Floating Rate Interests
The Fund invests in senior secured corporate loans that pay interest at rates which are periodically reset by reference to a base lending rate plus a spread. These base lending rates are generally the prime rate offered by a designated U.S. bank or the London InterBank Offered Rate (LIBOR). Senior secured corporate loans often require prepayment of principal from excess cash flows or at the discretion of the borrower. As a result, actual maturity may be substantially less than the stated maturity. Senior secured corporate loans in which the Fund invests are generally readily marketable, but may be subject to certain restrictions on resale.
g. Income and Deferred Taxes
It is the Fund’s policy to qualify as a regulated investment company under the Internal Revenue Code. The Fund intends to distribute to shareholders substantially all of its taxable income and net realized gains to relieve it from federal income and excise taxes. As a result, no provision for U.S. federal income taxes is required.
The Fund may be subject to foreign taxation related to income received, capital gains on the sale of securities and certain foreign currency transactions in the foreign jurisdictions in
which it invests. Foreign taxes, if any, are recorded based on the tax regulations and rates that exist in the foreign markets in which the Fund invests. When a capital gain tax is determined to apply, the Fund records an estimated deferred tax liability in an amount that would be payable if the securities were disposed of on the valuation date.
As a result of several court cases, in certain countries across the European Union, the Fund filed additional tax reclaims for previously withheld taxes on dividends earned in those countries (EU reclaims). These additional filings are subject to various administrative proceedings by the local jurisdictions’ tax authorities within the European Union, as well as a number of related judicial proceedings. Income recognized, if any, for EU reclaims is reflected as other income in the Statement of Operations and any related receivable, if any, is reflected as European Union tax reclaims in the Statement of Assets and Liabilities. When uncertainty exists as to the ultimate resolution of these proceedings, the likelihood of receipt of these EU reclaims, and the potential timing of payment, no amounts are reflected in the financial statements. For U.S. income tax purposes, EU reclaims received by the Fund, if any, reduce the amounts of foreign taxes Fund shareholders can use as tax credits in their individual income tax returns. In the event that EU reclaims received by the Fund during the fiscal year exceed foreign withholding taxes paid, and the Fund previously passed foreign tax credit on to its shareholders, the Fund may enter into a closing agreement with the Internal Revenue Service (IRS) in order to pay the associated tax liability on behalf of the Fund’s shareholders. During the fiscal year ended December 31, 2018, the Fund recorded an estimated liability of $425,500 and plans to file a closing agreement with the IRS before the filing of the tax return.
The Fund may recognize an income tax liability related to its uncertain tax positions under U.S. GAAP when the uncertain tax position has a less than 50% probability that it will be sustained upon examination by the tax authorities based on its technical merits. As of December 31, 2018, the Fund has determined that no tax liability is required in its financial statements related to uncertain tax positions for any open tax years (or expected to be taken in future tax years). Open tax years are those that remain subject to examination and are based on the statute of limitations in each jurisdiction in which the Fund invests.
franklintempleton.com |
Annual Report |
33 |
FRANKLIN MUTUAL GLOBAL DISCOVERY FUND
NOTES TO FINANCIAL STATEMENTS
1. Organization and Significant Accounting Policies(continued)
h. Security Transactions, Investment Income, Expenses and Distributions
Security transactions are accounted for on trade date. Realized gains and losses on security transactions are determined on a specific identification basis. Interest income and estimated expenses are accrued daily. Amortization of premium and accretion of discount on debt securities are included in interest income. Dividend income and dividends declared on securities sold short are recorded on theex-dividend date except for certain dividends from securities where the dividend rate is not available. In such cases, the dividend is recorded as soon as the information is received by the Fund. Distributions to shareholders are recorded on theex-dividend date. Distributable earnings are determined according to income tax regulations (tax basis) and may differ from earnings recorded in accordance with U.S. GAAP. These differences may be permanent or temporary. Permanent differences are reclassified among capital accounts to reflect their tax character. These reclassifications have no impact on net assets or the results of operations. Temporary differences are not reclassified, as they may reverse in subsequent periods.*
Common expenses incurred by the Trust are allocated among the Funds based on the ratio of net assets of each Fund to the combined net assets of the Trust or based on the ratio of number of shareholders of each Fund to the combined number of shareholders of the Trust. Fund specific expenses are charged directly to the Fund that incurred the expense.
Realized and unrealized gains and losses and net investment income, excluding class specific expenses, are allocated daily to each class of shares based upon the relative proportion of net assets of each class. Differences in per share distributions by class are generally due to differences in class specific expenses.
i. Accounting Estimates
The preparation of financial statements in accordance with U.S. GAAP requires management to make estimates and assumptions that affect the reported amounts of assets and liabilities at the date of the financial statements and the amounts of income and expenses during the reporting period. Actual results could differ from those estimates.
j. Guarantees and Indemnifications
Under the Trust’s organizational documents, its officers and trustees are indemnified by the Trust against certain liabilities arising out of the performance of their duties to the Trust. Additionally, in the normal course of business, the Trust, on behalf of the Fund, enters into contracts with service providers that contain general indemnification clauses. The Trust’s maximum exposure under these arrangements is unknown as this would involve future claims that may be made against the Trust that have not yet occurred. Currently, the Trust expects the risk of loss to be remote.
*Effective during the current reporting period, it is no longer required to present certain line items in the Statements of Changes in Net Assets. The below prior period amounts affected by this change are shown as they were in the prior year Statements of Changes in Net Assets.
For the year ended December 31, 2017, distributions to shareholders were as follows:
Distributions from net investment income : | ||||
Class Z | $ | (172,580,188 | ) | |
Class A | (209,942,027 | ) | ||
Class C | (34,634,111 | ) | ||
Class R | (7,828,860 | ) | ||
Class R6 | (54,145,296 | ) | ||
Distributions from net realized gains: | ||||
Class Z | (233,398,813 | ) | ||
Class A | (286,608,599 | ) | ||
Class C | (74,606,964 | ) | ||
Class R | (12,124,955 | ) | ||
Class R6 | (40,494,896 | ) |
34 |
Annual Report |
franklintempleton.com |
FRANKLIN MUTUAL GLOBAL DISCOVERY FUND
NOTES TO FINANCIAL STATEMENTS
For the year ended December 31, 2017, undistributed net investment income included in net assets was $7,087,401.
2. Shares of Beneficial Interest
At December 31, 2018, there were an unlimited number of shares authorized (without par value). Transactions in the Fund’s shares were as follows:
| Year Ended December 31, | ||||||||||||||||
| 2018 | 2017 | |||||||||||||||
| Shares | Amount | Shares | Amount | |||||||||||||
| Class Z Shares: | ||||||||||||||||
Shares sold | 23,075,260 | $ | 743,381,791 | 68,835,996 | $ | 2,244,877,670 | ||||||||||
Shares issued in reinvestment of distributions | 12,874,929 | 339,549,151 | 11,449,535 | 372,018,771 | ||||||||||||
Shares redeemed | (66,928,248 | ) | (2,098,976,766 | ) | (127,366,615 | ) | (4,207,699,613 | ) | ||||||||
Net increase (decrease) | (30,978,059 | ) | $ | (1,016,045,824 | ) | (47,081,084 | ) | $ | (1,590,803,172 | ) | ||||||
| Class A Shares: | ||||||||||||||||
Shares solda | 39,540,409 | $ | 1,238,132,295 | 31,207,860 | $ | 1,003,437,365 | ||||||||||
Shares issued in reinvestment of distributions | 19,765,773 | 510,690,925 | 15,223,548 | 484,999,519 | ||||||||||||
Shares redeemed | (77,371,791 | ) | (2,405,204,953 | ) | (88,369,392 | ) | (2,833,157,132 | ) | ||||||||
Net increase (decrease) | (18,065,609 | ) | $ | (656,381,733 | ) | (41,937,984 | ) | $ | (1,344,720,248 | ) | ||||||
| Class C Shares: | ||||||||||||||||
Shares sold | 3,686,938 | $ | 114,177,734 | 6,673,104 | $ | 211,439,458 | ||||||||||
Shares issued in reinvestment of distributions | 2,158,214 | 55,791,403 | 3,370,430 | 105,965,772 | ||||||||||||
Shares redeemeda | (43,253,998 | ) | (1,334,137,167 | ) | (23,753,704 | ) | (753,914,427 | ) | ||||||||
Net increase (decrease) | (37,408,846 | ) | $ | (1,164,168,030 | ) | (13,710,170 | ) | $ | (436,509,197 | ) | ||||||
| Class R Shares: | ||||||||||||||||
Shares sold | 952,638 | $ | 29,475,566 | 1,801,733 | $ | 57,024,664 | ||||||||||
Shares issued in reinvestment of distributions | 699,971 | 17,846,355 | 615,390 | 19,331,426 | ||||||||||||
Shares redeemed | (3,807,349 | ) | (118,270,592 | ) | (4,451,909 | ) | (141,285,042 | ) | ||||||||
Net increase (decrease) | (2,154,740 | ) | $ | (70,948,671 | ) | (2,034,786 | ) | $ | (64,928,952 | ) | ||||||
| Class R6 Shares: | ||||||||||||||||
Shares sold | 12,000,653 | $ | 384,806,245 | 54,624,980 | $ | 1,832,959,818 | ||||||||||
Shares issued in reinvestment of distributions | 3,572,465 | 94,139,840 | 2,637,145 | 85,609,397 | ||||||||||||
Shares redeemed | (31,266,192 | ) | (1,005,274,787 | ) | (5,716,616 | ) | (188,126,770 | ) | ||||||||
Net increase (decrease) | (15,693,074 | ) | $ | (526,328,702 | ) | 51,545,509 | $ | 1,730,442,445 | ||||||||
aMay include a portion of Class C shares that were automatically converted to Class A.
3. Transactions with Affiliates
Franklin Resources, Inc. is the holding company for various subsidiaries that together are referred to as Franklin Templeton. Certain officers and trustees of the Fund are also officers and/or directors of the following subsidiaries:
| Subsidiary | Affiliation | |
Franklin Mutual Advisers, LLC (Franklin Mutual) | Investment manager | |
Franklin Templeton Services, LLC (FT Services) | Administrative manager | |
Franklin Templeton Distributors, Inc. (Distributors) | Principal underwriter | |
Franklin Templeton Investor Services, LLC (Investor Services) | Transfer agent |
franklintempleton.com |
Annual Report |
35 |
FRANKLIN MUTUAL GLOBAL DISCOVERY FUND
NOTES TO FINANCIAL STATEMENTS
3. Transactions with Affiliates(continued)
a. Management Fees
The Fund pays an investment management fee to Franklin Mutual based on the average daily net assets of the Fund as follows:
| Annualized Fee Rate | Net Assets | |||
0.875% | Up to and including $4 billion | |||
0.845% | Over $4 billion, up to and including $7 billion | |||
0.825% | Over $7 billion, up to and including $10 billion | |||
0.805% | Over $10 billion, up to and including $13 billion | |||
0.785% | Over $13 billion, up to and including $16 billion | |||
0.765% | Over $16 billion, up to and including $19 billion | |||
0.745% | Over $19 billion, up to and including $22 billion | |||
0.725% | Over $22 billion, up to and including $25 billion | |||
0.705% | Over $25 billion, up to and including $28 billion | |||
0.685% | In excess of $28 billion | |||
For the year ended December 31, 2018, the gross effective investment management fee rate was 0.818% of the Fund’s average daily net assets.
b. Administrative Fees
Under an agreement with Franklin Mutual, FT Services provides administrative services to the Fund. The fee is paid by Franklin Mutual based on the Fund’s average daily net assets, and is not an additional expense of the Fund.
c. Distribution Fees
The Board has adopted distribution plans for each share class, with the exception of Class Z and Class R6 shares, pursuant to Rule12b-1 under the 1940 Act. Under the Fund’s Class A reimbursement distribution plan, the Fund reimburses Distributors for costs incurred in connection with the servicing, sale and distribution of the Fund’s shares up to the maximum annual plan rate. Under the Class A reimbursement distribution plan, costs exceeding the maximum for the current plan year cannot be reimbursed in subsequent periods. In addition, under the Fund’s Class C and R compensation distribution plans, the Fund pays Distributors for costs incurred in connection with the servicing, sale and distribution of the Fund’s shares up to the maximum annual plan rate for each class. The plan year, for purposes of monitoring compliance with the maximum annual plan rates, is February 1 through January 31.
The maximum annual plan rates, based on the average daily net assets, for each class, are as follows:
Class A | 0.35 | % | ||
Class C | 1.00 | % | ||
Class R | 0.50 | % |
The Board has set the current rate at 0.25% per year for Class A shares until further notice and approval by the Board.
36 |
Annual Report |
franklintempleton.com |
FRANKLIN MUTUAL GLOBAL DISCOVERY FUND
NOTES TO FINANCIAL STATEMENTS
d. Sales Charges/Underwriting Agreements
Front-end sales charges and contingent deferred sales charges (CDSC) do not represent expenses of the Fund. These charges are deducted from the proceeds of sales of Fund shares prior to investment or from redemption proceeds prior to remittance, as applicable. Distributors has advised the Fund of the following commission transactions related to the sales and redemptions of the Fund’s shares for the year:
Sales charges retained net of commissions paid to unaffiliated brokers/dealers | $ | 1,186,803 | ||
CDSC retained | $ | 108,069 |
Effective September 10, 2018, the Board approved changes to certainfront-end sales charges and dealer commissions on Class A shares. Further details are disclosed in the Fund’s Prospectus.
e. Transfer Agent Fees
Each class of shares pays transfer agent fees to Investor Services for its performance of shareholder servicing obligations. The fees are based on an annualized asset based fee of 0.02% plus a transaction based fee. In addition, each class reimburses Investor Services for out of pocket expenses incurred and, except for Class R6 reimburses shareholder servicing fees paid to third parties. These fees are allocated daily based upon their relative proportion of such classes’ aggregate net assets. Class R6 pays Investor Services transfer agent fees specific to that class.
For the year ended December 31, 2018, the Fund paid transfer agent fees of $21,821,305, of which $8,488,539 was retained by Investor Services.
f. Investments in Affiliated Management Investment Companies
The Fund invests in one or more affiliated management investment companies for purposes other than exercising a controlling influence over the management or policies. Management fees paid by the Fund are waived on assets invested in the affiliated management investment companies, as noted in the Statement of Operations, in an amount not to exceed the management and administrative fees paid directly or indirectly by each affiliate. During the year ended December 31, 2018, the Fund held investments in affiliated management investment companies as follows:
| Number of Shares Held at Beginning of Year | Gross Additions | Gross Reductions | Number of Shares Held at End of Year | Value at End of Year | Income from securities loaned | Realized Gain (Loss) | Net Change in Unrealized Appreciation (Depreciation) | |||||||||||||||||||||||||
| Non-Controlled Affiliates | ||||||||||||||||||||||||||||||||
Institutional Fiduciary Trust Money Market Portfolio, 1.99% | — | 39,234,000 | (39,234,000 | ) | — | $ — | $9,364 | $ — | $ — | |||||||||||||||||||||||
g. Waiver and Expense Reimbursements
Investor Services has voluntarily agreed in advance to waive or limit its fees so that the Class R6 transfer agent fees do not exceed 0.02% based on the average net assets of the class. Investor Services may discontinue this waiver in the future.
4. Expense Offset Arrangement
The Fund has entered into an arrangement with its custodian whereby credits realized as a result of uninvested cash balances are used to reduce a portion of the Fund’s custodian expenses. During the year ended December 31, 2018, the custodian fees were reduced as noted in the Statement of Operations.
franklintempleton.com |
Annual Report |
37 |
FRANKLIN MUTUAL GLOBAL DISCOVERY FUND
NOTES TO FINANCIAL STATEMENTS
5. Independent Trustees’ Retirement Plan
On January 1, 1993, the Trust adopted an Independent Trustees’ Retirement Plan (Plan). The Plan is an unfunded defined benefit plan that provides benefit payments to Trustees whose length of service and retirement age meets the eligibility requirements of the Plan. Benefits under the Plan are based on years of service and fees paid to each trustee at the time of retirement. Effective in December 1996, the Plan was closed to new participants.
During the year ended December 31, 2018, the Fund’s projected benefit obligation and benefit payments under the Plan were as follows:
aProjected benefit obligation at December 31, 2018 | $ | 1,055,082 | ||
bIncrease in projected benefit obligation | $ | 297,849 | ||
Benefit payments made to retired trustees | $ | (21,377 | ) |
aThe projected benefit obligation is included in trustees’ fees and expenses in the Statement of Assets and Liabilities.
bThe increase in projected benefit obligation is included in trustees’ fees and expenses in the Statement of Operations.
6. Income Taxes
For tax purposes, the Fund may elect to defer any portion of a post-October capital loss or late-year ordinary loss to the first day of the following fiscal year. At December 31, 2018, the Fund deferred post-October capital losses of $7,188,295.
The tax character of distributions paid during the years ended December 31, 2018 and 2017, was as follows:
| 2018 | 2017 | |||||||
|
| |||||||
Distributions paid from: | ||||||||
Ordinary income | $ | 484,685,209 | $ | 544,846,066 | ||||
Long term capital gain | 590,306,974 | 581,518,643 | ||||||
|
| |||||||
| $ | 1,074,992,183 | $ | 1,126,364,709 | |||||
|
| |||||||
At December 31, 2018, the cost of investments, net unrealized appreciation (depreciation), undistributed ordinary income and undistributed long term capital gains for income tax purposes were as follows:
Cost of investments | $ | 14,415,917,874 | ||
|
| |||
Unrealized appreciation | $ | 2,901,255,712 | ||
Unrealized depreciation | (2,202,253,147 | ) | ||
|
| |||
Net unrealized appreciation (depreciation) | $ | 699,002,565 | ||
|
| |||
Distributable earnings: | ||||
Undistributed ordinary income | $ | 6,657,437 | ||
Undistributed long term capital gains | 328,500,105 | |||
|
| |||
Total distributable earnings | $ | 335,157,542 | ||
|
| |||
Differences between income and/or capital gains as determined on a book basis and a tax basis are primarily due to differing treatment of foreign currency transactions.
The Fund utilized a tax accounting practice to treat a portion of the proceeds from capital shares redeemed as a distribution from realized capital gains.
38 |
Annual Report |
franklintempleton.com |
FRANKLIN MUTUAL GLOBAL DISCOVERY FUND
NOTES TO FINANCIAL STATEMENTS
7. Investment Transactions
Purchases and sales of investments (excluding short term securities and securities sold short) for the year ended December 31, 2018, aggregated $2,751,306,778 and $6,055,645,724, respectively.
8. Credit Risk and Defaulted Securities
The Fund may purchase thepre-default or defaulted debt of distressed companies. Distressed companies are financially troubled and could be or are already involved in financial restructuring or bankruptcy. Risks associated with purchasing these securities include the possibility that the bankruptcy or other restructuring process takes longer than expected, or that distributions in restructuring are less than anticipated, either or both of which may result in unfavorable consequences to the Fund. If it becomes probable that the income on debt securities, including those of distressed companies, will not be collected, the Fund discontinues accruing income and recognizes an adjustment for uncollectible interest.
At December 31, 2018, the aggregate long value of distressed company securities for which interest recognition has been discontinued was $169,979,655, representing 1.1% of the Fund’s net assets. For information as to specific securities, see the accompanying Statement of Investments.
9. Concentration of Risk
Investing in foreign securities may include certain risks and considerations not typically associated with investing in U.S. securities, such as fluctuating currency values and changing local and regional economic, political and social conditions, which may result in greater market volatility. Current political and financial uncertainty surrounding the European Union may increase market volatility and the economic risk of investing in securities in Europe. In addition, certain foreign securities may not be as liquid as U.S. securities.
10. Restricted Securities
The Fund invests in securities that are restricted under the Securities Act of 1933 (1933 Act). Restricted securities are often purchased in private placement transactions, and cannot be sold without prior registration unless the sale is pursuant to an exemption under the 1933 Act. Disposal of these securities may require greater effort and expense, and prompt sale at an acceptable price may be difficult. The Fund may have registration rights for restricted securities. The issuer generally incurs all registration costs.
At December 31, 2018, investments in restricted securities, excluding securities exempt from registration under the 1933 Act deemed to be liquid, were as follows:
| Principal Amount/ Shares | Issuer | Acquisition Date | Cost | Value | ||||||||||||
| 8,893 | Broadband Ventures III LLC, secured promissory note, 5.00%, 2/01/12 | 7/01/10 - 11/30/12 | $ | 8,893 | $ | — | ||||||||||
| 3,819,425 | International Automotive Components Group Brazil LLC | 4/13/06 - 12/26/08 | 2,536,498 | 161,855 | ||||||||||||
| 35,491,081 | International Automotive Components Group North America LLC | 1/12/06 - 3/18/13 | 29,095,371 | 4,230,537 | ||||||||||||
|
| |||||||||||||||
Total Restricted Securities(Value is 0.0%†of Net Assets) | $ | 31,640,762 | $ | 4,392,392 | ||||||||||||
|
| |||||||||||||||
†Rounds to less than 0.1% of net assets.
franklintempleton.com |
Annual Report |
39 |
FRANKLIN MUTUAL GLOBAL DISCOVERY FUND
NOTES TO FINANCIAL STATEMENTS
11. Other Derivative Information
At December 31, 2018, the Fund’s investments in derivative contracts are reflected in the Statement of Assets and Liabilities as follows:
| Asset Derivatives | Liability Derivatives | |||||||||||
| Derivative Contracts Not Accounted for as Hedging Instruments | Statement of Assets and Liabilities Location | Fair Value | Statement of Assets and Liabilities Location | Fair Value | ||||||||
Foreign exchange contracts | Variation margin on futures contracts | $ | 986,177 | a | Variation margin on futures contracts | $ | — | |||||
Unrealized appreciation on OTC forward exchange contracts | 37,019,008 | Unrealized depreciation on OTC forward exchange contracts | 4,750,983 | |||||||||
|
|
|
| |||||||||
Totals | $ | 38,005,185 | $ | 4,750,983 | ||||||||
|
|
|
| |||||||||
aThis amount reflects the cumulative appreciation (depreciation) of futures contracts as reported in the Statement of Investments. Only the variation margin receivable/ payable at year end is separately reported within the Statement of Assets and Liabilities. Prior variation margin movements were recorded to cash upon receipt or payment.
For the year ended December 31, 2018, the effect of derivative contracts in the Fund’s Statement of Operations was as follows:
| Derivative Contracts Not Accounted for as Hedging Instruments | Statement of Operations Location | Net Realized Gain (Loss) for the Year | Statement of Operations Location | Net Change in Unrealized Appreciation (Depreciation) for the Year | ||||||||
Net realized gain (loss) from: | Net change in unrealized appreciation (depreciation) on: | |||||||||||
Foreign exchange contracts | Forward exchange contracts | $ | 69,523,335 | Forward exchange contracts | $ | 141,683,362 | ||||||
Futures contracts | 107,674,569 | Futures contracts | 29,915,219 | |||||||||
|
|
|
| |||||||||
Totals | $ | 177,197,904 | $ | 171,598,581 | ||||||||
|
|
|
| |||||||||
For the year ended December 31, 2018, the average month end notional amount of futures contracts represented $1,900,848,046. The average month end contract value of forward exchange contracts was $3,800,878,751.
See Note 1(c) regarding derivative financial instruments.
12. Holdings of 5% Voting Securities of Portfolio Companies
The 1940 Act defines “affiliated companies” to include investments in portfolio companies in which a fund owns 5% or more of the outstanding voting securities. During the year ended December 31, 2018, investments in “affiliated companies” were as follows:
| Name of Issuer | Number of Shares Held at Beginning of Year | Gross Additions | Gross Reductions | Number of Shares Held at End of Year | Value at End of Year | Dividend Income | Realized Gain (Loss) | Net Change in Unrealized Appreciation (Depreciation) | ||||||||||||||||||||||||
| Non-Controlled Affiliates | ||||||||||||||||||||||||||||||||
International Automotive Components Group North America LLC (Value is 0.0%†of Net Assets) | 35,491,081 | — | — | 35,491,081 | $4,230,537 | $— | $— | $(19,150,100 | ) | |||||||||||||||||||||||
|
| |||||||||||||||||||||||||||||||
†Rounds to less than 0.1% of net assets.
40 |
Annual Report |
franklintempleton.com |
FRANKLIN MUTUAL GLOBAL DISCOVERY FUND
NOTES TO FINANCIAL STATEMENTS
13. Credit Facility
The Fund, together with other U.S. registered and foreign investment funds (collectively, Borrowers), managed by Franklin Templeton, are borrowers in a joint syndicated senior unsecured credit facility totaling $2 billion (Global Credit Facility) which matured on February 8, 2019. This Global Credit Facility provides a source of funds to the Borrowers for temporary and emergency purposes, including the ability to meet future unanticipated or unusually large redemption requests. Effective February 8, 2019, the Borrowers renewed the Global Credit Facility for a one year term, maturing February 7, 2020, for a total of $2 billion.
Under the terms of the Global Credit Facility, the Fund shall, in addition to interest charged on any borrowings made by the Fund and other costs incurred by the Fund, pay its share of fees and expenses incurred in connection with the implementation and maintenance of the Global Credit Facility, based upon its relative share of the aggregate net assets of all of the Borrowers, including an annual commitment fee of 0.15% based upon the unused portion of the Global Credit Facility. These fees are reflected in other expenses in the Statement of Operations. During the year ended December 31, 2018, the Fund did not use the Global Credit Facility.
14. Fair Value Measurements
The Fund follows a fair value hierarchy that distinguishes between market data obtained from independent sources (observable inputs) and the Fund’s own market assumptions (unobservable inputs). These inputs are used in determining the value of the Fund’s financial instruments and are summarized in the following fair value hierarchy:
| • | Level 1 – quoted prices in active markets for identical financial instruments |
| • | Level 2 – other significant observable inputs (including quoted prices for similar financial instruments, interest rates, prepayment speed, credit risk, etc.) |
| • | Level 3 – significant unobservable inputs (including the Fund’s own assumptions in determining the fair value of financial instruments) |
The input levels are not necessarily an indication of the risk or liquidity associated with financial instruments at that level.
franklintempleton.com |
Annual Report |
41 |
FRANKLIN MUTUAL GLOBAL DISCOVERY FUND
NOTES TO FINANCIAL STATEMENTS
14. Fair Value Measurements(continued)
A summary of inputs used as of December 31, 2018, in valuing the Fund’s assets and liabilities carried at fair value, is as follows:
| Level 1 | Level 2 | Level 3 | Total | |||||||||||||
| Assets: | ||||||||||||||||
Investments in Securities:a | ||||||||||||||||
Equity Investments:b | ||||||||||||||||
Auto Components | $ | 55,787,125 | $ | — | $ | 4,392,392 | $ | 60,179,517 | ||||||||
Automobiles | 178,985,999 | 302,367,006 | — | 481,353,005 | ||||||||||||
Capital Markets | 83,990,513 | 121,277,766 | — | 205,268,279 | ||||||||||||
Chemicals | — | 205,263,219 | — | c | 205,263,219 | |||||||||||
Construction Materials | — | 152,403,248 | — | 152,403,248 | ||||||||||||
Electric Utilities | 50,237,235 | 334,308,347 | — | 384,545,582 | ||||||||||||
Machinery | — | 118,754,499 | — | 118,754,499 | ||||||||||||
Media | 496,017,163 | 5,375,983 | — | 501,393,146 | ||||||||||||
Metals & Mining | 29,675,986 | 28,315,165 | — | 57,991,151 | ||||||||||||
Software | 547,105,349 | 822,893 | — | 547,928,242 | ||||||||||||
Specialty Retail | — | 107,150,706 | — | 107,150,706 | ||||||||||||
All Other Equity Investments | 11,824,424,622 | — | — | 11,824,424,622 | ||||||||||||
Corporate Notes and Senior Floating Rate Interests | — | 223,553,283 | — | 223,553,283 | ||||||||||||
Corporate Notes and Senior Floating Rate Interests in Reorganization | — | 169,979,655 | — | c | 169,979,655 | |||||||||||
Companies in Liquidation | — | 128,093 | — | c | 128,093 | |||||||||||
Short Term Investments | 172,343,917 | — | — | 172,343,917 | ||||||||||||
|
| |||||||||||||||
Total Investments in Securities | $ | 13,438,567,909 | $ | 1,769,699,863 | $ | 4,392,392 | $ | 15,212,660,164 | ||||||||
|
| |||||||||||||||
Other Financial Instruments: | ||||||||||||||||
Futures Contracts | $ | 986,177 | $ | — | $ | — | $ | 986,177 | ||||||||
Forward Exchange Contracts | — | 37,019,008 | — | 37,019,008 | ||||||||||||
|
| |||||||||||||||
Total Other Financial Instruments | $ | 986,177 | $ | 37,019,008 | $ | — | $ | 38,005,185 | ||||||||
|
| |||||||||||||||
| Liabilities: | ||||||||||||||||
Other Financial Instruments: | ||||||||||||||||
Securities Sold Shorta | $ | 131,039,275 | $ | — | $ | — | $ | 131,039,275 | ||||||||
Forward Exchange Contracts | — | 4,750,983 | — | 4,750,983 | ||||||||||||
|
| |||||||||||||||
Total Other Financial Instruments | $ | 131,039,275 | $ | 4,750,983 | $ | — | $ | 135,790,258 | ||||||||
|
| |||||||||||||||
aFor detailed categories, see the accompanying Statement of Investments.
bIncludes common, preferred stocks and management investment companies as well as other equity interests.
cIncludes securities determined to have no value at December 31, 2018.
A reconciliation of assets in which Level 3 inputs are used in determining fair value is presented when there are significant Level 3 financial instruments at the beginning and/or end of the year.
15. New Accounting Pronouncements
In August 2018, the Financial Accounting Standards Board issued Accounting Standards Update (ASU)No. 2018-14, Compensation—Retirement Benefits—Defined Benefit Plans—General (Subtopic715-20): Disclosure Framework—Changes to the Disclosure Requirements for Defined Benefit Plans. The amendments in the ASU modify the disclosure requirements for employers that sponsor defined benefit pension or other postretirement plans. The ASU is effective for annual reporting periods ending after December 15, 2020. Management is currently evaluating the impact, if any, of applying this provision.
42 |
Annual Report |
franklintempleton.com |
FRANKLIN MUTUAL GLOBAL DISCOVERY FUND
NOTES TO FINANCIAL STATEMENTS
16. Subsequent Events
The Fund has evaluated subsequent events through the issuance of the financial statements and determined that no events have occurred that require disclosure other than those already disclosed in the financial statements.
Abbreviations
| Counterparty | Currency | Selected Portfolio | ||||||||||
| BOFA | Bank of America Corp. | EUR | Euro | ADR | American Depositary Receipt | |||||||
| BONY | The Bank of New York Mellon Corp. | GBP | British Pound | LIBOR | London InterBank Offered Rate | |||||||
| HSBK | HSBC Bank PLC | USD | United States Dollar | |||||||||
| SSBT | State Street Bank and Trust Co., N.A. | |||||||||||
| UBSW | UBS AG | |||||||||||
franklintempleton.com |
Annual Report |
43 |
FRANKLIN MUTUAL GLOBAL DISCOVERY FUND
Report of Independent Registered Public Accounting Firm
To the Board of Trustees of Franklin Mutual Series Funds and Shareholders of Franklin Mutual Global Discovery Fund:
Opinion on the Financial Statements
We have audited the accompanying statement of assets and liabilities of Franklin Mutual Global Discovery Fund (the “Fund”) (one of the funds constituting Franklin Mutual Series Funds), including the schedule of investments, as of December 31, 2018, and the related statement of operations for the year then ended, the statements of changes in net assets for each of the two years in the period then ended, the financial highlights for each of the five years in the period then ended and the related notes (collectively referred to as the “financial statements”). In our opinion, the financial statements present fairly, in all material respects, the financial position of Franklin Mutual Global Discovery Fund (one of the funds constituting Franklin Mutual Series Funds) at December 31, 2018, the results of its operations for the year then ended, the changes in its net assets for each of the two years in the period then ended and its financial highlights for each of the five years in the period then ended, in conformity with U.S. generally accepted accounting principles.
Basis for Opinion
These financial statements are the responsibility of the Fund’s management. Our responsibility is to express an opinion on the Fund’s financial statements based on our audits. We are a public accounting firm registered with the Public Company Accounting Oversight Board (United States) (“PCAOB”) and are required to be independent with respect to the Fund in accordance with the U.S. federal securities laws and the applicable rules and regulations of the Securities and Exchange Commission and the PCAOB.
We conducted our audits in accordance with the standards of the PCAOB. Those standards require that we plan and perform the audit to obtain reasonable assurance about whether the financial statements are free of material misstatement, whether due to error or fraud. The Fund is not required to have, nor were we engaged to perform, an audit of the Fund’s internal control over financial reporting. As part of our audits, we are required to obtain an understanding of internal control over financial reporting, but not for the purpose of expressing an opinion on the effectiveness of the Fund’s internal control over financial reporting. Accordingly, we express no such opinion.
Our audits included performing procedures to assess the risks of material misstatement of the financial statements, whether due to error or fraud, and performing procedures that respond to those risks. Such procedures included examining, on a test basis, evidence regarding the amounts and disclosures in the financial statements. Our procedures included confirmation of securities owned as of December 31, 2018, by correspondence with the custodian and brokers or by other appropriate auditing procedures where replies from others were not received. Our audits also included evaluating the accounting principles used and significant estimates made by management, as well as evaluating the overall presentation of the financial statements. We believe that our audits provide a reasonable basis for our opinion.

We have served as the auditor of one or more Franklin investment companies since 1987.
Boston, Massachusetts
February 20, 2019
44 |
Annual Report |
franklintempleton.com |
FRANKLIN MUTUAL GLOBAL DISCOVERY FUND
Under Section 852(b)(3)(C) of the Internal Revenue Code, the Fund hereby reports the maximum amount allowable but no less than $785,195,960 as a long term capital gain dividend for the fiscal year ended December 31, 2018.
Under Section 871(k)(2)(C) of the Internal Revenue Code, the Fund hereby reports the maximum amount allowable but no less than $169,808,690 as a short term capital gain dividend for purposes of the tax imposed under Section 871(a)(1)(A) of the Internal Revenue Code for the fiscal year ended December 31, 2018.
Under Section 854(b)(1)(A) of the Internal Revenue Code, the Fund hereby reports 38.85% of the ordinary income dividends as income qualifying for the dividends received deduction for the fiscal year ended December 31, 2018.
Under Section 854(b)(1)(B) of the Internal Revenue Code, the Fund hereby reports the maximum amount allowable but no less than $466,791,035 as qualified dividends for purposes of the maximum rate under Section 1(h)(11) of the Internal Revenue Code for the fiscal year ended December 31, 2018. Distributions, including qualified dividend income, paid during calendar year 2018 will be reported to shareholders on Form1099-DIV bymid-February 2019. Shareholders are advised to check with their tax advisors for information on the treatment of these amounts on their individual income tax returns.
Under Section 871(k)(1)(C) of the Internal Revenue Code, the Fund hereby reports the maximum amount allowable but no less than $36,247,061 as interest related dividends for purposes of the tax imposed under Section 871(a)(1)(A) of the Internal Revenue Code for the fiscal year ended December 31, 2018.
franklintempleton.com |
Annual Report |
45 |
FRANKLIN MUTUAL SERIES FUNDS
The name, year of birth and address of the officers and board members, as well as their affiliations, positions held with the Trust, principal occupations during at least the past five years and number of U.S. registered portfolios overseen in the Franklin Templeton Investments fund complex, are shown below. Generally, each board member serves until that person’s successor is elected and qualified.
Independent Board Members
Name, Year of Birth and Address | Position | Length of Time Served | Number of Portfolios in Fund Complex Overseen by Board Member* | Other Directorships Held During at Least the Past 5 Years | ||||
Edward I. Altman, Ph.D. (1941) | Trustee | Since 1987 | 14 | None | ||||
c/o Franklin Mutual Advisers, LLC | ||||||||
101 John F. Kennedy Parkway | ||||||||
Short Hills, NJ 07078-2716 | ||||||||
| Principal Occupation During at Least the Past 5 Years: | ||||||||
Max L. Heine Professor of Finance, Emeritus and Director of The Credit and Debt Markets Research Program, Salomon Center, Stern School of Business, New York University; editor and author of numerous financial publications; financial consultant; an adviser to numerous financial and publishing organizations; andformerly, Vice Director, Salomon Center, Stern School of Business, New York University.
| ||||||||
Ann Torre Bates (1958) c/o Franklin Mutual Advisers, LLC 101 John F. Kennedy Parkway Short Hills, NJ 07078-2716 | Trustee | Since 1995 | 38 | Ares Capital Corporation (specialty finance company) (2010-present), United Natural Foods, Inc. (distributor of natural, organic and specialty foods) (2013-present), Allied Capital Corporation (financial services) (2003-2010), SLM Corporation (Sallie Mae) (1997-2014) and Navient Corporation (loan management, servicing and asset recovery) (2014-2016). | ||||
| Principal Occupation During at Least the Past 5 Years: | ||||||||
Director of various companies; andformerly, Executive Vice President and Chief Financial Officer, NHP Incorporated (manager of multifamily housing) (1995-1997); and Vice President and Treasurer, US Airways, Inc. (until 1995).
| ||||||||
Burton J. Greenwald (1929) c/o Franklin Mutual Advisers, LLC 101 John F. Kennedy Parkway Short Hills, NJ 07078-2716 | Trustee and Vice Chairman | Trustee since 2002 and Vice Chairman since 2015 | 14 | Franklin Templeton Emerging Markets Debt Opportunities Fund PLC (1999-present) and Fiduciary International Ireland Limited (1999-2015). | ||||
| Principal Occupation During at Least the Past 5 Years: | ||||||||
Managing Director, B.J. Greenwald Associates (management consultants to the financial services industry); andformerly, Chairman, Fiduciary Trust International Funds; Executive Vice President, L.F. Rothschild Fund Management, Inc.; President and Director, Merit Mutual Funds; President, Underwriting Division and Director, National Securities & Research Corporation; Governor, Investment Company Institute; and Chairman, ICI Public Information Committee.
| ||||||||
Jan Hopkins Trachtman (1947) c/o Franklin Mutual Advisers, LLC 101 John F. Kennedy Parkway Short Hills, NJ 07078-2716 | Trustee | Since 2009 | 14 | FinTech Acquisition Corp. III (special purpose fintech acquisition company) (2018-present) | ||||
| Principal Occupation During at Least the Past 5 Years: | ||||||||
President and Founder, The Jan Hopkins Group (communications consulting firm); serves on Advisory Board of Knight Bagehot Fellowship; andformerly, President, Economic Club of New York (2007-2015); Anchor/Correspondent, CNN Financial News (until 2003); Managing Director and Head of Client Communications, Citigroup Private Bank (until 2005);Off-Air reporter, ABC News’ World News Tonight; and Editor, CBS Network News.
| ||||||||
Keith Mitchell (1954) | Trustee | Since 2009 | 14 | None | ||||
c/o Franklin Mutual Advisers, LLC | ||||||||
101 John F. Kennedy Parkway | ||||||||
Short Hills, NJ 07078-2716 | ||||||||
Principal Occupation During at Least the Past 5 Years: | ||||||||
| Director of various boards of asset management firms; andformerly, Managing Member, Mitchell, Hartley & Bechtel Advisers, LLC (formerly, Mitchell Advisers, LLC) (advisory firm) (2003-2015) and Managing Director, Putman Lovell NBF. | ||||||||
46 |
Annual Report |
franklintempleton.com |
FRANKLIN MUTUAL SERIES FUNDS
Independent Board Members(continued)
Name, Year of Birth and Address | Position | Length of Time Served | Number of Portfolios in Fund Complex Overseen by Board Member* | Other Directorships Held During at Least the Past 5 Years | ||||
David W. Niemiec (1949) c/o Franklin Mutual Advisers, LLC 101 John F. Kennedy Parkway Short Hills, NJ 07078-2716 | Trustee | Since 2015 | 38 | Hess Midstream Partners LP (oil and gas midstream infrastructure) (2017-present). | ||||
| Principal Occupation During at Least the Past 5 Years: | ||||||||
Advisor, Saratoga Partners (private equity fund); and formerly, Managing Director, Saratoga Partners (1998-2001) and SBC Warburg Dillon Read (investment banking) (1997-1998); Vice Chairman, Dillon, Read & Co. Inc. (investment banking) (1991-1997); and Chief Financial Officer, Dillon, Read & Co. Inc. (1982-1997).
| ||||||||
Charles Rubens II (1930) | Trustee | Since 1998 | 14 | None | ||||
c/o Franklin Mutual Advisers, LLC | ||||||||
101 John F. Kennedy Parkway | ||||||||
Short Hills, NJ 07078-2716 | ||||||||
| Principal Occupation During at Least the Past 5 Years: | ||||||||
Private investor and president ofnon-profit organizations; andformerly, an executive of Time, Inc.; and Trustee of Colorado College.
| ||||||||
Robert E. Wade (1946) c/o Franklin Mutual Advisers, LLC 101 John F. Kennedy Parkway Short Hills, NJ 07078-2716 | Trustee and Chairman of the Board | Trustee since 1993 and Chairman of the Board since 2005 | 38 | El Oro Ltd (investments) (2003-present). | ||||
| Principal Occupation During at Least the Past 5 Years: | ||||||||
Attorney at law engaged in private practice as a sole practitioner (1972-2008) and member of various boards.
| ||||||||
Gregory H. Williams (1943) | Trustee | Since 2015 | 14 | None | ||||
c/o Franklin Mutual Advisers, LLC | ||||||||
101 John F. Kennedy Parkway | ||||||||
Short Hills, NJ 07078-2716 | ||||||||
| Principal Occupation During at Least the Past 5 Years: | ||||||||
Private investor; Consultant; and formerly, President, University of Cincinnati (2009-2012); President, The City College of New York (2001-2009); Dean, College of Law, Ohio State University (1993-2001); and Associate Vice President, Academic Affairs and Professor of Law, University of Iowa (1977-1993).
| ||||||||
Interested Board Members and Officers
| ||||||||
Name, Year of Birth and Address | Position | Length of Time Served | Number of Portfolios in Fund Complex Overseen by Board Member* | Other Directorships Held During at Least the Past 5 Years | ||||
**Gregory E. Johnson (1961) | Trustee | Since 2007 | 150 | None | ||||
One Franklin Parkway | ||||||||
San Mateo, CA 94403-1906 | ||||||||
| Principal Occupation During at Least the Past 5 Years: | ||||||||
Chairman of the Board, Member – Office of the Chairman, Director and Chief Executive Officer, Franklin Resources, Inc.; officer and/or director or trustee, as the case may be, of some of the other subsidiaries of Franklin Resources, Inc. and of 42 of the investment companies in Franklin Templeton Investments; Vice Chairman, Investment Company Institute; and formerly, President, Franklin Resources, Inc. (1994-2015).
| ||||||||
**Peter A. Langerman (1955) c/o Franklin Mutual Advisers, LLC 101 John F. Kennedy Parkway Short Hills, NJ 07078-2716 | Trustee, President, and Chief Executive Officer – Investment Management | Trustee since 2007, President, and Chief Executive Officer – Investment Management since 2005 | 7 | American International Group, Inc. (AIG) Credit Facility Trust (2010-2011). | ||||
| Principal Occupation During at Least the Past 5 Years: | ||||||||
Chairman of the Board, Chief Executive Officer and President, Franklin Mutual Advisers, LLC; President and Chief Investment Officer, Franklin Advisory Services, LLC; and officer and/or director, as the case may be, of three of the investment companies in Franklin Templeton Investments.
| ||||||||
franklintempleton.com |
Annual Report |
47 |
FRANKLIN MUTUAL SERIES FUNDS
Interested Board Members and Officers(continued)
Name, Year of Birth
| Position
| Length of
| Number of Portfolios in
| Other Directorships Held During
| ||||
| Alison E. Baur (1964) One Franklin Parkway San Mateo, CA 94403-1906 | Vice President | Since 2012 | Not Applicable | Not Applicable | ||||
| Principal Occupation During at Least the Past 5 Years: | ||||||||
Deputy General Counsel, Franklin Templeton Investments; and officer of some of the other subsidiaries of Franklin Resources, Inc. and of 44 of the investment companies in Franklin Templeton Investments.
| ||||||||
| Aliya S. Gordon (1973) One Franklin Parkway San Mateo, CA 94403-1906 | Vice President | Since 2009 | Not Applicable | Not Applicable | ||||
| Principal Occupation During at Least the Past 5 Years: | ||||||||
Senior Associate General Counsel, Franklin Templeton Investments; and officer of 44 of the investment companies in Franklin Templeton Investments.
| ||||||||
| Steven J. Gray (1955) One Franklin Parkway San Mateo, CA 94403-1906 | Vice President and Secretary | Vice President since 2009 and Secretary since 2005 | Not Applicable | Not Applicable | ||||
| Principal Occupation During at Least the Past 5 Years: | ||||||||
Senior Associate General Counsel, Franklin Templeton Investments; Vice President, Franklin Templeton Distributors, Inc. and FASA, LLC; and officer of 44 of the investment companies in Franklin Templeton Investments.
| ||||||||
| Matthew T. Hinkle (1971) One Franklin Parkway San Mateo, CA 94403-1906 | Chief Executive Officer – Finance and Administration | Since 2017 | Not Applicable | Not Applicable | ||||
| Principal Occupation During at Least the Past 5 Years: | ||||||||
Senior Vice President, Franklin Templeton Services, LLC; officer of 44 of the investment companies in Franklin Templeton Investments; andformerly, Vice President, Global Tax (2012-April 2017) and Treasurer/Assistant Treasurer, Franklin Templeton Investments (2009-2017).
| ||||||||
| Robert G. Kubilis (1973) 300 S.E. 2nd Street Fort Lauderdale, FL 33301-1923 | Chief Financial Officer, Chief Accounting Officer and Treasurer | Since 2012 | Not Applicable | Not Applicable | ||||
| Principal Occupation During at Least the Past 5 Years: | ||||||||
Treasurer, U.S. Fund Administration & Reporting, Franklin Templeton Investments; and officer of 16 of the investment companies in Franklin Templeton Investments.
| ||||||||
| Robert Lim (1948) One Franklin Parkway San Mateo, CA 94403-1906 | Vice President – AML Compliance | Since 2016 | Not Applicable | Not Applicable | ||||
| Principal Occupation During at Least the Past 5 Years: | ||||||||
Vice President, Franklin Templeton Companies, LLC; Chief Compliance Officer, Franklin Templeton Distributors, Inc. and Franklin Templeton Investor Services, LLC; and officer of 44 of the investment companies in Franklin Templeton Investments.
| ||||||||
| Kimberly H. Novotny (1972) 300 S.E. 2nd Street Fort Lauderdale, FL 33301-1923 | Vice President | Since 2013 | Not Applicable | Not Applicable | ||||
| Principal Occupation During at Least the Past 5 Years: | ||||||||
Associate General Counsel, Franklin Templeton Investments; Vice President and Corporate Secretary, Fiduciary Trust International of the South; Vice President, Templeton Investment Counsel, LLC; Assistant Secretary, Franklin Resources, Inc.; and officer of 44 of the investment companies in Franklin Templeton Investments.
| ||||||||
48 |
Annual Report |
franklintempleton.com |
FRANKLIN MUTUAL SERIES FUNDS
Interested Board Members and Officers(continued)
Name, Year of Birth
| Position
| Length of
| Number of Portfolios in
| Other Directorships Held During
| ||||
| Robert C. Rosselot (1960) 300 S.E. 2nd Street Fort Lauderdale, FL 33301-1923 | Chief Compliance Officer | Since 2013 | Not Applicable | Not Applicable | ||||
| Principal Occupation During at Least the Past 5 Years: | ||||||||
Director, Global Compliance, Franklin Templeton Investments; Vice President, Franklin Templeton Companies, LLC; officer of 44 of the investment companies in Franklin Templeton Investments; andformerly, Senior Associate General Counsel, Franklin Templeton Investments (2007-2013); and Secretary and Vice President, Templeton Group of Funds (2004-2013).
| ||||||||
| Navid J. Tofigh (1972) One Franklin Parkway San Mateo, CA 94403-1906 | Vice President | Since 2015 | Not Applicable | Not Applicable | ||||
| Principal Occupation During at Least the Past 5 Years: | ||||||||
Associate General Counsel, Franklin Templeton Investments; and officer of 44 of the investment companies in Franklin Templeton Investments.
| ||||||||
| Craig S. Tyle (1960) One Franklin Parkway San Mateo, CA 94403-1906 | Vice President | Since 2005 | Not Applicable | Not Applicable | ||||
| Principal Occupation During at Least the Past 5 Years: | ||||||||
General Counsel and Executive Vice President, Franklin Resources, Inc.; and officer of some of the other subsidiaries of Franklin Resources, Inc. and of 44 of the investment companies in Franklin Templeton Investments.
| ||||||||
| Lori A. Weber (1964) 300 S.E. 2nd Street Fort Lauderdale, FL 33301-1923 | Vice President | Since 2011 | Not Applicable | Not Applicable | ||||
| Principal Occupation During at Least the Past 5 Years: | ||||||||
Senior Associate General Counsel, Franklin Templeton Investments; Assistant Secretary, Franklin Resources, Inc.; Vice President and Secretary, Templeton Investment Counsel, LLC; and officer of 44 of the investment companies in Franklin Templeton Investments.
| ||||||||
franklintempleton.com |
Annual Report |
49 |
FRANKLIN MUTUAL SERIES FUNDS
*We base the number of portfolios on each separate series of the U.S. registered investment companies within the Franklin Templeton Investments fund complex. These portfolios have a common investment manager or affiliated investment managers.
**Gregory E. Johnson is considered to be an interested person of the Fund under the federal securities laws due to his position as an officer and director of Franklin Resources, Inc. (Resources), which is the parent company of the Fund’s investment manager and distributor. Peter A. Langerman is considered to be an interested person of the Fund under the federal securities laws due to his position as an officer of Franklin Mutual Advisers, LLC, which is the Fund’s investment manager.
Note 1: Officer information is current as of the date of this report. It is possible that after this date, information about officers may change.
The Sarbanes-Oxley Act of 2002 and Rules adopted by the U.S. Securities and Exchange Commission require the Fund to disclose whether the Fund’s Audit Committee includes at least one member who is an audit committee financial expert within the meaning of such Act and Rules. The Fund’s Board has determined that there is at least one such financial expert on the Audit Committee and has designated each of Edward I. Altman, Ph.D., Ann Torre Bates and David W. Niemiec as an audit committee financial expert. The Board believes that Messrs. Altman and Niemiec and Ms. Bates qualify as such an expert in view of their extensive business background and experience. Mr. Altman has served as a member of the Fund Audit Committee since 1987. He currently serves as a Max L. Hine Professor of Finance, Emeritus and Director of The Credit and Debt Markets Research Program, Salomon Center, Stern School of Business, New York University. Ms. Bates has served as a member of the Fund Audit Committee since 1995. She currently serves as a director of Ares Capital Corporation (2010-present) and United Natural Foods, Inc. (2013-present) and was formerly a director of Navient Corporation from 2014 to 2016, SLM Corporation from 1997 to 2014 and Allied Capital Corporation from 2003 to 2010, Executive Vice President and Chief Financial Officer of NHP Incorporated from 1995 to 1997 and Vice President and Treasurer of US Airways, Inc. until 1995. Mr. Niemiec has served as a member of the Fund Audit Committee since 2015, currently serves as an Advisor to Saratoga Partners and was formerly its Managing Director from 1998 to 2001 and serves as a director of Hess Midstream Partners LP (2017-present). Mr. Niemiec was formerly a director of Emeritus Corporation from 1999 to 2010 and OSI Pharmaceuticals, Inc. from 2006 to 2010, Managing Director of SBC Warburg Dillon Read from 1997 to 1998, and was Vice Chairman from 1991 to 1997 and Chief Financial Officer from 1982 to 1997 of Dillon, Read & Co. Inc. As a result of such background and experience, the Board believes that Messrs. Altman and Niemiec and Ms. Bates have each acquired an understanding of generally accepted accounting principles and financial statements, the general application of such principles in connection with the accounting estimates, accruals and reserves, and analyzing and evaluating financial statements that present a breadth and level of complexity of accounting issues generally comparable to those of the Fund, as well as an understanding of internal controls and procedures for financial reporting and an understanding of audit committee functions. Messrs. Altman and Niemiec and Ms. Bates are independent Board members as that term is defined under the applicable U.S. Securities and Exchange Commission Rules and Releases.
The Statement of Additional Information (SAI) includes additional information about the board members and is available, without charge, upon request. Shareholders may call (800) DIALBEN/342-5236 to request the SAI.
50 |
Annual Report |
franklintempleton.com |
FRANKLIN MUTUAL SERIES FUNDS
FRANKLIN MUTUAL GLOBAL DISCOVERY FUND
Proxy Voting Policies and Procedures
The Fund’s investment manager has established Proxy Voting Policies and Procedures (Policies) that the Fund uses to determine how to vote proxies relating to portfolio securities. Shareholders may view the Fund’s complete Policies online at franklintempleton.com. Alternatively, shareholders may request copies of the Policies free of charge by calling the Proxy Group collect at (954)527-7678 or by sending a written request to: Franklin Templeton Companies, LLC, 300 S.E. 2nd Street, Fort Lauderdale, FL 33301, Attention: Proxy Group. Copies of the Fund’s proxy voting records are also made available online at franklintempleton.com and posted on the U.S. Securities and Exchange Commission’s website at sec.gov and reflect the most recent12-month period ended June 30.
Quarterly Statement of Investments
The Trust, on behalf of the Fund, files a complete statement of investments with the U.S. Securities and Exchange Commission for the first and third quarters for each fiscal year on FormN-Q. Shareholders may view the filed FormN-Q by visiting the Commission’s website at sec.gov. The filed form may also be viewed and copied at the Commission’s Public Reference Room in Washington, DC. Information regarding the operations of the Public Reference Room may be obtained by calling(800) SEC-0330.
Householding of Reports and Prospectuses
You will receive the Fund’s financial reports every six months as well as an annual updated summary prospectus (prospectus available upon request). To reduce Fund expenses, we try to identify related shareholders in a household and send only one copy of the financial reports and summary prospectus. This process, called “householding,” will continue indefinitely unless you instruct us otherwise. If you prefer not to have these documents householded, please call us at (800)632-2301. At any time you may view current prospectuses/summary prospectuses and financial reports on our website. If you choose, you may receive these documents through electronic delivery.
franklintempleton.com |
Annual Report |
51 |
This page intentionally left blank.
 | Annual Report and Shareholder Letter Franklin Mutual Global Discovery Fund
Investment Manager Franklin Mutual Advisers, LLC
Distributor Franklin Templeton Distributors, Inc. (800) DIAL BEN® /342-5236 franklintempleton.com
Shareholder Services (800)632-2301 - (Class A, C, R & R6) (800)448-FUND - (Class Z) | |||
Authorized for distribution only when accompanied or preceded by a summary prospectus and/or prospectus. Investors should carefully consider a fund’s investment goals, risks, charges and expenses before investing. A prospectus contains this and other information; please read it carefully before investing.
To help ensure we provide you with quality service, all calls to and from our service areas are monitored and/or recorded. | ||||
| © 2019 Franklin Templeton Investments. All rights reserved. | 477 A 02/19 | |||
| Annual Report and Shareholder Letter
December 31, 2018 |


Internet Delivery of Fund Reports Unless You Request Paper Copies:Effective January 1, 2021, as permitted by the SEC, paper copies of the Fund’s shareholder reports will no longer be sent by mail, unless you specifically request them from the Fund or your financial intermediary. Instead, the reports will be made available on a website, and you will be notified by mail each time a report is posted and provided with a website link to access the report.
If you already elected to receive shareholder reports electronically, you will not be affected by this change and you need not take any action. If you have not signed up for electronic delivery, we would encourage you to join fellow shareholders who have. You may elect to receive shareholder reports and other communications electronically from the Fund by calling(800) 632-2301 or by contacting your financial intermediary.
You may elect to continue to receive paper copies of all your future shareholder reports free of charge by contacting your financial intermediary or, if you invest directly with a Fund, calling (800)632-2301 to let the Fund know of your request. Your election to receive reports in paper will apply to all funds held in your account.
Franklin Templeton
Successful investing begins with ambition. And achievement only comes when you reach for it. That’s why we continually strive to deliver better outcomes for investors. No matter what your goals are, our deep, global investment expertise allows us to offer solutions that can help.
During our more than 70 years of experience, we’ve managed through all kinds of markets—up, down and those in between. We’re always preparing for what may come next. It’s because of this, combined with our strength as one of the world’s largest asset managers that we’ve earned the trust of millions of investors around the world.
Dear Franklin Mutual European Fund Shareholder:
Investors started 2018 seemingly with the wind at their back. The primary tailwinds were strong corporate earnings growth in most developed markets, healthy consumer and business investment spending, and the positive effect of major U.S. tax cuts. In addition, the global economy continued its steady expansion since the financial crisis of 2008–2009. Unemployment continued to decline in the U.S. and other developed markets, while U.S. wage growth showed some signs of accelerating. As a result, equity markets rose to new highs. However, volatility and market downturns soon made their mark on 2018. As measured by the EURO STOXX 50® Volatility (VSTOXX) Index, volatility reached a record low in December 2017, but the VSTOXX surged in February 2018 to its highest level since the summer of 2016 and moved higher again in October and December. U.S. trade tensions with Europe and China, the possibility of Brexit without an agreement, Italy’s budget disagreement with the European Commission, and a growing belief that corporate earnings and economic growth will likely decelerate in 2019 hindered equity markets. Despite European central banks keeping rates low, a flattening U.S. Treasury yield curve, wider credit spreads and growing market concern that the U.S. Federal Reserve may raise interest rates too quickly were also important drivers of European market turbulence. For the period ended December 31, 2018, European stocks, as measured by the MSCI Europe (Net Dividends) Index (EURO), had a-10.57% total return.1 Global developed markets, as measured by the MSCI World Index (USD), had a-8.20% total return, while
1. Source: Morningstar.
See www.franklintempletondatasources.com for additional data provider information.
investment-grade bonds, as measured by the Bloomberg Barclays Global Aggregate Bond Index, had a-1.20% total return.1
The return of volatility is a reminder that securities markets are dynamic. We believe active, professional investment management serves investors well since market volatility is more the norm than uninterrupted positive returns. Valuation is an essential factor in our analysis and we always ask ourselves if current and potential investments represent an attractive balance of risk and reward. We remain committed to abottom-up stock-picking process that is disciplined and driven by rigorous fundamental analysis that attempts to limit downside risk. In our view, investing in underappreciated and misunderstood companies with identifiable catalysts for unlocking shareholder value can offer significant upside potential as well as a degree of downside protection.
We also recognize the important role of financial advisors in today’s markets and encourage investors to continue to seek their advice. Amid changing markets and economic conditions, we are confident investors with a well-diversified portfolio and a patient, long-term outlook will be well positioned for the years ahead.
On the following pages, the Fund’s portfolio management team reviews investment decisions that pertain to performance during the past 12 months in light of the economic environment
| Not FDIC Insured | | | May Lose Value | | | No Bank Guarantee |
franklintempleton.com | Not part of the annual report | 1 | ||||
and other factors. Please remember all securities markets fluctuate, as do mutual fund share prices.
We thank you for investing with Franklin Templeton, welcome your questions and comments, and look forward to continuing to serve your investment needs in the years ahead.
Sincerely,

Peter A. Langerman
Chairman, President and Chief Executive Officer
Franklin Mutual Advisers, LLC
This letter reflects our analysis and opinions as of December 31, 2018, unless otherwise indicated. The information is not a complete analysis of every aspect of any market, country, industry, security or fund. Statements of fact are from sources considered reliable.
Visitfranklintempleton.comfor fund updates, to access your account, or to find helpful financial planning tools.
2 |
Not part of the annual report | franklintempleton.com | ||
This annual report for Franklin Mutual European Fund covers the fiscal year ended December 31, 2018.
Your Fund’s Goal and Main Investments
The Fund seeks capital appreciation, which may occasionally be short term, with income as a secondary goal, by investing at least 80% of its net assets in securities of European companies that the investment manager believes are available at market prices less than their intrinsic value. The equity securities in which the Fund invests are primarily common stock, with a focus onmid- and large cap companies. To a lesser extent, the Fund also invests in merger arbitrage securities and the debt and equity of distressed companies. The Geographic Composition bar chart on this page lists the leading European countries where the Fund invests.
Performance Overview
The Fund’s Class Z shares had a-11.12% cumulative total return for the 12 months ended December 31, 2018. For comparison, the Fund’s benchmark, the MSCI Europe (Net Dividends) Index, which tracks equity performance in Europe’s developed markets, had a-10.59% total return in local currency terms.1 Also for comparison, the MSCI Europe (Net Dividends) Index had a-14.86% total return in U.S. dollar terms.1 You can find more of the Fund’s performance data in the Performance Summary beginning on page 8.
Performance data represent past performance, which does not guarantee future results. Investment return and principal value will fluctuate, and you may have a gain or loss when you sell your shares. Current performance may differ from figures shown. For most recentmonth-end performance, go tofranklintempleton.comor call(800)342-5236.
Economic and Market Overview
The global economy expanded during the 12 months under review, despite weakness in certain regions. Global developed and emerging market stocks were aided at certain points during the period by higher crude oil prices, upbeat economic data, easing trade tensions and encouraging corporate earnings
Geographic Composition*
Based on Total Net Assets as of 12/31/18
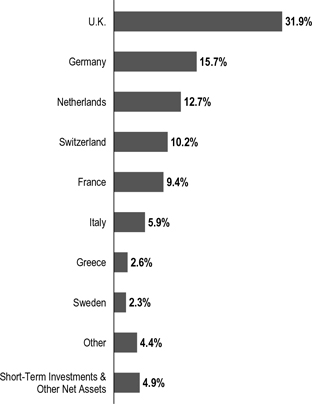
*Figures are stated as a percentage of total and may not equal 100% or may be negative due to rounding, use of any derivatives, unsettled trades or other factors.
reports, as well as indications of a slower pace of interest-rate increases from the U.S. Federal Reserve (Fed).
However, various factors weighed on global markets during the period, including concerns about tighter regulation of technology companies, political uncertainties in the U.S. and the European Union, and major central banks’ interest-rate path and unwinding of monetary stimulus measures. Markets were further pressured by U.S. trade disputes with its allies and China, and their impact on global growth and corporate earnings. In this environment, global stocks, as measured by the MSCI All Country World Index, had a-8.93% total return for the 12 months ended December 31, 2018.1
1. Source: Morningstar.
The index is unmanaged and includes reinvestment of any income or distributions (after the deduction of certain withholding taxes). It does not reflect any fees, expenses or sales charges. One cannot invest directly in an index, and an index is not representative of the Fund’s portfolio.
The dollar value, number of shares or principal amount, and names of all portfolio holdings are listed in the Fund’s Statement of Investments (SOI). The SOI begins on page 17.
franklintempleton.com | Annual Report | 3 | ||||
FRANKLIN MUTUAL EUROPEAN FUND
In Europe, the U.K.’s quarterly economic growth moderated in 2018’s first quarter, but accelerated in 2018’s second and third quarters. The Bank of England raised its key policy rate once during the review period. After moderating in 2018’s first quarter, the eurozone’s quarterly growth remained stable in the second quarter, but eased in the third quarter. The bloc’s annual inflation rate ended the period higher than in December 2017. The European Central Bank (ECB) kept its benchmark interest rate unchanged during the period. In December 2018, the ECB confirmed its plan to conclude its bond purchase program at the end of 2018 and reiterated it expects key interest rates to remain unchanged through the summer of 2019.
Investment Strategy
We follow a distinctive value investment approach that combines investments in what we believe are undervalued common stocks with, to a lesser extent, distressed debt investing and merger arbitrage. Our style aims to provide our shareholders with superior risk-adjusted results over time. We employ rigorous, fundamental analysis to find compelling situations. In our opinion, successful investing is as much about assessing risk and containing losses as it is about achieving profits. In choosing investments, we look at the market price of an individual company’s securities relative to our evaluation of its intrinsic value based on factors including book value, cash flow generation, long-term earnings potential and earnings multiples. We may invest in bankrupt or distressed companies if we believe the market overreacted to adverse developments or failed to appreciate positive changes. In addition, it is our practice to hedge the Fund’s currency exposure when we deem it advantageous for our shareholders.
What is meant by "hedge"?
|
To hedge an investment is to take a position intended to offset |
Manager’s Discussion
In 2018, corporate profits in developed markets continued their impressive year-over-year growth. Labor markets showed further improvement, consumer spending was solid, and U.S. corporate tax reforms encouraged companies to buy back more stock, raise dividends and increase capital expenditures. Those positive fundamentals were periodically overshadowed by political and economic concerns, particularly in the final three months of the year.
With the decline in European equity markets, particularly in the fourth quarter, we have seen increasingly attractive valuations
Top 10 Sectors/Industries | ||||
| Based on Equity Securities as of 12/31/18 | ||||
| % of Total Net Assets | ||||
| ||||
Insurance | 12.4% | |||
| ||||
Banks | 9.9% | |||
| ||||
Oil, Gas & Consumable Fuels | 7.1% | |||
| ||||
Pharmaceuticals | 6.1% | |||
| ||||
Diversified Telecommunication Services | 5.5% | |||
| ||||
Construction Materials | 5.0% | |||
| ||||
Trading Companies & Distributors | 3.7% | |||
| ||||
Auto Components | 3.7% | |||
| ||||
Automobiles | 3.6% | |||
| ||||
Electric Utilities | 3.5% | |||
| ||||
(e.g.,price-to-earnings,price-to-book orprice-to-sales) compared to U.S. equity markets, which reached historically high levels in 2018. Thesell-off and rise in volatility yielded an opportunity to seek out stocks with strong corporate fundamentals and valuations whose risk/reward profiles seemed to us to have become more favorable. In addition to offering attractive valuation opportunities, Europe’s equity markets have seen an increase in investor activism, which we view as encouraging.
In 2019, policy events may have considerable influence, for better or worse, on economic growth, investor sentiment and financial market performance and volatility. Markets are likely to be particularly sensitive to developments in U.S.-China trade relations, monetary policy moves by European and other major central banks, in particular the Fed, oil production decisions by OPEC (The Organization of the Petroleum Exporting Countries) and other oil producing countries, the outcome of Brexit, China’s response to its slowing economy and potential political discord in Washington, D.C.
From an investment standpoint, we anticipate 2019 will be a year of resolution and clarity. The biggest political event will likely be Brexit. With the looming March 29, 2019 Article 50 deadline, how the situation will be resolved remained unclear. The uncertainty around the terms and timing of a deal continued to undermine consumer and corporate confidence. From our perspective, we believe the European Union and the U.K. will ultimately reach an agreement that makes sense for both sides, and we believe the approval of such an agreement would likely have a significantly positive effect on investor, consumer and corporate sentiment in the U.K. We will also pay close attention to structural reform efforts in France and the political transition in Germany. In December, Chancellor Angela Merkel stepped down as leader of the Christian
4 | Annual Report | franklintempleton.com | ||
FRANKLIN MUTUAL EUROPEAN FUND
| Top 10 Equity Holdings | ||||
| 12/31/18 | ||||
Company Sector/Industry, Country | % of Total Net Assets | |||
| ||||
| Enel SpA Electric Utilities, Italy | 3.5% | |||
| ||||
| Accor SA Hotels, Restaurants & Leisure, France | 3.5% | |||
| ||||
| NN Group NV Insurance, Netherlands | 3.5% | |||
| ||||
| Novartis AG Pharmaceuticals, Switzerland | 3.5% | |||
| ||||
| LafargeHolcim Ltd. Construction Materials, Switzerland | 3.2% | |||
| ||||
| GlaxoSmithKline PLC Pharmaceuticals, U.K. | 3.0% | |||
| ||||
| Koninklijke KPN NV Diversified Telecommunication Services, Netherlands | 2.9% | |||
| ||||
| Hellenic Telecommunications Organization SA Diversified Telecommunication Services, Greece | 2.6% | |||
| ||||
| Royal Dutch Shell PLC Oil, Gas & Consumable Fuels, U.K. | 2.6% | |||
| ||||
| Standard Chartered PLC Banks, U.K. | 2.6% | |||
| ||||
Democratic Union but stated her intention to remain in office for the remaining three years of her term as Chancellor.
In all market environments, we seek to invest prudently in securities that we believe represent good value. We do this by seeking securities that trade at a discount to our estimate of intrinsic value, taking into account the quality of the asset, the sustainability of returns, and the growth potential of the business. We also believe the potential to deliver the best risk-adjusted return over a full market cycle requires us to be focused on applying our cross-asset approach: owning equities and debt—in certain cases multiple securities across the capital structure of a company—across geographies and sectors with an emphasis on corporate actions as catalysts.
Investment Spotlight
Our insurance industry positions are a good example of our investment process. The Top 10 Sectors/Industries table on page 4 lists insurance and also other leading industries in which the Fund currently invests. The insurance industry has been an area of significant interest for Mutual Series since the Great Recession. We were able to find quality insurers trading at discounts to intrinsic value during the post-crisis period of
financial services recapitalization, followed by the restructuring of the financial services industry in Europe. During the past 10 years, insurance industry trends have provided investment opportunities for value investors. With interest rates at secular low levels, insurers have focused on operational efficiencies, cash flow from underwriting, and rational capital structures to maintain acceptable profitability. Life insurance businesses have mainly focused on improving returns through cost savings and capital rationalization, while property casualty businesses have emphasized better underwriting and capital management.
After several years of equity market outperformance, insurers were hurt by increased natural catastrophe losses around the globe in both 2017 and 2018, jitters regarding global economic growth prospects and a widening of credit spreads. Despite these headwinds, we think valuations atyear-end remained attractive, and our holdings have idiosyncratic catalysts that provide attractive return potential. In addition, the large natural catastrophe losses suffered by property and casualty insurers should present an opportunity for them to increase premiums as they adjust risk profiles.
Mutual Series has owned the Netherlands-based NN Group since its 2014 initial public offering (IPO). NN Group was spun out of ING Groep2 and consists of life insurance, other insurance and asset management operations in Europe and Japan. The initial investment case revolved around the rationalization of capital and cost efficiencies. In 2017, NN Group acquired Dutch insurer Delta Lloyd at an attractive internal rate of return with the potential for significant synergies from the combined company. Since the IPO, the company has returned a significant amount of capital to shareholders and lowered expenses, while maintaining one of the strongest balance sheets in the industry. We expect additional progress on the integration of Delta Lloyd to generate increased cash flow in the future. NN Group is listed among the Fund’s largest positions in the Top 10 Equity Holdings table on this page.
Mergers and Acquisitions
Elsewhere, merger and acquisition activity (M&A) remained healthy in 2018. Since many European M&A transactions involve approval from the U.S. Department of Justice (DOJ), we were encouraged by greater clarity regarding the regulatory environment when a federal judge ruled in favor of AT&T2 and Time Warner2, and against the DOJ, in its antitrust lawsuit. However, economic, financial market and geopolitical
2. Not a Fund holding.
franklintempleton.com | Annual Report | 5 | ||||
FRANKLIN MUTUAL EUROPEAN FUND
uncertainty that arose in the second half of the year caused the pace of activity to slow. In our view, it was notable that health care has become one of the busier sectors for M&A as it is relatively more insulated from economic uncertainty. The strength and path of M&A activity in 2019 will likely depend in large part on how the uncertainties carrying over from 2018 play out and how they affect equity markets. From our experience, ups and downs in equity market performance and levels of deal activity have tended to move in a similar direction.
Credit Markets
Finding mispriced risk in credit markets remains difficult as we have seen few large corporate bankruptcies in Europe and with the continued low interest-rate environment, we do not anticipate this will change in the near future.
Fund Performance
Turning to Fund performance, top positive contributors included France-based automaker Peugeot, Finland-based global communications and information technology company Nokia and U.K.-basedpay-TV provider Sky3.
Shares of Peugeot rallied through the first three quarters of 2018. Positive global economic fundamentals and quarterly results which showed its restructuring of Opel Vauxhall (OV), acquired from General Motors2 in 2017, was going better than investors had been expecting, helped push the stock price higher. We believe the acquisition should enable Peugeot to increase its profit margins and cash flow through additional product development improvements, greater vehicle production efficiency and the utilization of better powertrains (engine, transmission, drive shaft and differential) in its Opel and Vauxhall vehicles. However, shares of Peugeot and other major automakers retreated in the last quarter of 2018 due to signs of slower global economic growth and passenger vehicle sales, as well as U.S.-China trade tensions.
Nokia announced solid fourth-quarter and full-year 2017 results in February 2018, particularly better-than-expected profits for 2017 and significant improvement in cash flow. Management also issued a new earnings target for 2020 that was higher than many investors had anticipated. In August, Nokia announced a larger-than-expected network equipment agreement withT-Mobile2 as part ofT-Mobile’s effort to deploy a 5G network in the U.S. Nokia also announced a large loan from the
European Investment Bank to support research and development efforts in 5G technology. In our view, Nokia is serious about further cost cutting and cash flow improvement related to its acquisition of Alcatel in 2016, and it remains on course to reach its 2020 earnings target.
In February 2018, shares of Sky jumped when U.S.-based cable company Comcast2 made a surprise bid for the company. The Comcast bid was considerably higher than a prior bid by Twenty-First Century Fox2, which already owned a substantial portion of Sky. In July 2018, Twenty-First Century Fox raised its bid for Sky, but Comcast promptly offered a highercounter-bid. The stock rose again in September 2018 when The Panel on Takeovers and Mergers in the U.K. announced that Comcast had won the mandatory auction for Sky, and Twenty-First Century Fox subsequently agreed to sell its stake of Sky to Comcast. The acquisition of Sky was officially completed in October 2018.
During the period under review, Fund investments that detracted from performance included Germany-based global auto parts supplier Schaeffler, France-based electrical equipment distributor Rexel and U.K.-based global mobile telecommunications company Vodafone Group.
In January 2018, Schaeffler provided investors with an upbeat initial estimate for fourth-quarter and full-year 2017 revenues. However, final results released in February fell considerably short of its initial estimates. In addition, management downgraded its outlook for 2018, stating that increased expenses related to an acceleration of its production efficiency program would hurt 2018 earnings. In the latter stages of 2018, shares of automakers and suppliers, including Schaeffler, were hurt by signs of broad slowdown in global economic growth and passenger vehicle sales, as well as escalating trade tensions between the U.S. and China. In October, Schaeffler issued a profit warning, which cited softer auto sales in China as the primary driver. Following its missteps in early 2018, management has taken steps to repair its credibility and improve communication with investors. We also believe Schaeffler’s ongoing efficiency and investment program has been improving profitability and its positioning for increasing electric vehicle production by automakers.
Rexel is a distributor of low voltage electrical equipment headquartered in Paris. In April 2018, shares of Rexel dropped in response to slightly weaker-than-expected quarterly revenue
3. Not held atperiod-end.
See www.franklintempletondatasources.com for additional data provider information.
6 | Annual Report | franklintempleton.com | ||
FRANKLIN MUTUAL EUROPEAN FUND
and earnings, although free cash flow showed significant improvement. In our view, the results were negatively affected by investments in digital technology and bonus accruals and otherone-off factors. In September 2018, the offices of Rexel and three other electrical goods companies in France were searched by French police on suspicion of cartel pricing and corruption. All companies denied wrongdoing, and Rexel had previously stated that it relies on a legal method of obtaining price quotations from suppliers and uses the information to propose prices to final customers. In the final quarter of 2018, Rexel followed the general decline in European equity markets, driven by signs of softening global economic growth and geopolitical events in Europe. Nonetheless, we believe the positive catalysts for Rexel remain in place, as its reorganization efforts and branch openings in the U.S. have begun to produce positive results.
In May 2018, Vodafone Group provided an outlook for its fiscal year ending March 2019 that fell short of market expectations, with much of the growth forecast to come in the latter part of the year. The stock came under further downward pressure from weaker-than-expected revenue growth due in part to price cuts in Spain and a new mobile competitor in Italy. Management stated that conditions in those two markets were likely to experience further short-term deterioration, leading to uncertainty regarding Vodafone’s ability to meet its earnings growth guidance for the fiscal year. However, we balanced the negative near-term events against the positive announcements of a merger of Vodafone’s operations in India with Idea Cellular2, which closed at the end of August 2018, and the August announcement of a merger and deconsolidation of its Australian subsidiary. In addition, we believed the newly appointed chief executive officer’s statements regarding the likely initial public offering of Vodafone’s New Zealand business and the announcement of a three-year net cost cutting plan and multi-brand strategy to improve competitiveness across all market segments as positive for 2019.
During the period, the Fund held currency forwards and futures seeking to hedge most of the currency risk of the portfolio’snon-U.S. dollar investments. The hedges had a positive overall impact on the Fund’s performance because of the appreciation of the U.S. dollar versus the hedged currencies.
What is a currency forward?
|
A currency forward is a direct agreement between the Fund and a counterparty to buy or sell a foreign currency in exchange for another currency at a specific exchange rate on a future date.
|
What is a future?
|
A future is an agreement between the Fund and a counterparty made through a U.S. or foreign futures exchange to buy or sell an underlying instrument or asset at a specific price on a future date.
|
As fellow shareholders, we found recent relative and absolute performance disappointing, but it is not uncommon for the performance of our strategy to diverge from European equity market returns at times. We remain committed to our disciplined, value investment approach as we seek to generate attractive, long-term, risk-adjusted returns for shareholders.
Thank you for your participation in Franklin Mutual European Fund. We look forward to continuing to serve your investment needs.
|
Katrina Dudley, CFA Co-Portfolio Manager |


 |  | |
Mandana Hormozi Co-Portfolio Manager |
The foregoing information reflects our analysis, opinions and portfolio holdings as of December 31, 2018, the end of the reporting period. The way we implement our main investment strategies and the resulting portfolio holdings may change depending on factors such as market and economic conditions. These opinions may not be relied upon as investment advice or an offer for a particular security. The information is not a complete analysis of every aspect of any market, country, industry, security or the Fund. Statements of fact are from sources considered reliable, but the investment manager makes no representation or warranty as to their completeness or accuracy. Although historical performance is no guarantee of future results, these insights may help you understand our investment management philosophy.
CFA® is a trademark owned by CFA Institute.
franklintempleton.com | Annual Report | 7 | ||||
FRANKLIN MUTUAL EUROPEAN FUND
Performance Summary as of December 31, 2018
The performance table and graphs do not reflect any taxes that a shareholder would pay on Fund dividends, capital gain distributions, if any, or any realized gains on the sale of Fund shares. Total return reflects reinvestment of the Fund’s dividends and capital gain distributions, if any, and any unrealized gains or losses. Your dividend income will vary depending on dividends or interest paid by securities in the Fund’s portfolio, adjusted for operating expenses of each class. Capital gain distributions are net profits realized from the sale of portfolio securities.
Performance as of 12/31/18
Cumulative total return excludes sales charges. Average annual total return includes maximum sales charges. Sales charges will vary depending on the size of the investment and the class of share purchased. The maximum is 5.50% and the minimum is 0%.Class A:5.50% maximum initial sales charge. For other share classes, visitfranklintempleton.com.
| Share Class | | Cumulative Total Return | 1 | | Average Annual Total Return | 2 | ||
| ||||||||
| Z | ||||||||
1-Year | -11.12% | -11.12% | ||||||
| ||||||||
5-Year | -2.70% | -0.55% | ||||||
| ||||||||
10-Year | +78.32% | +5.95% | ||||||
| ||||||||
| A3 | ||||||||
1-Year | -11.29% | -16.16% | ||||||
| ||||||||
5-Year | -3.98% | -1.92% | ||||||
| ||||||||
10-Year | +73.39% | +5.06% | ||||||
| ||||||||
Performance data represent past performance, which does not guarantee future results. Investment return and principal value will fluctuate, and you may have a gain or loss when you sell your shares. Current performance may differ from figures shown. For most recentmonth-end performance, go tofranklintempleton.comor call(800)342-5236.
See page 10 for Performance Summary footnotes.
| 8 |
Annual Report | franklintempleton.com | ||
FRANKLIN MUTUAL EUROPEAN FUND
PERFORMANCE SUMMARY
Total Return Index Comparison for a Hypothetical $10,000 Investment
Total return represents the change in value of an investment over the periods shown. It includes any applicable maximum sales charge, Fund expenses, account fees and reinvested distributions. The unmanaged indexes include reinvestment of any income or distributions. They differ from the Fund in composition and do not pay management fees or expenses. One cannot invest directly in an index.
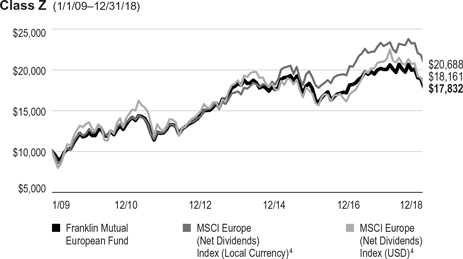
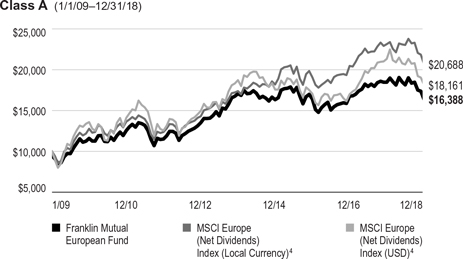
See page 10 for Performance Summary footnotes.
franklintempleton.com | Annual Report | 9 | ||||
FRANKLIN MUTUAL EUROPEAN FUND
PERFORMANCE SUMMARY
Distributions(1/1/18–12/31/18)
| Share Class | Net Investment Income | |||
| ||||
Z
| $0.7273 | |||
| ||||
A
| $0.6784 | |||
| ||||
C
| $0.3900 | |||
| ||||
R
| $0.6304 | |||
| ||||
R6
| $0.7548 | |||
| ||||
Total Annual Operating Expenses5
| Share Class | ||||
| ||||
Z
| 1.04% | |||
| ||||
A
| 1.29% | |||
| ||||
Each class of shares is available to certain eligible investors and has different annual fees and expenses, as described in the prospectus.
All investments involve risks, including possible loss of principal. Value securities may not increase in price as anticipated or may decline further in value. Special risks are associated with foreign investing, including currency fluctuations, economic instability and political developments. Because the Fund may invest its assets in companies in a specific region, including Europe, it is subject to greater risks of adverse developments in that region and/or the surrounding regions than a fund that is more broadly diversified geographically. Current political and financial uncertainty surrounding the European Union may increase market volatility and the economic risk of investing in companies in Europe. The Fund’s investments in smaller company stocks carry an increased risk of price fluctuation, especially over the short term. The Fund’s investments in companies engaged in mergers, reorganizations or liquidations also involve special risks as pending deals may not be completed on time or on favorable terms. The Fund is actively managed but there is no guarantee that the manager’s investment decisions will produce the desired results. The Fund’s prospectus also includes a description of the main investment risks.
1. Cumulative total return represents the change in value of an investment over the periods indicated.
2. Average annual total return represents the average annual change in value of an investment over the periods indicated. Return for less than one year, if any, has not been annualized.
3. Prior to 9/10/18, these shares were offered at a higher initial sales charge of 5.75%, thus actual returns would have differed. Total returns with sales charges have been restated to reflect the current maximum initial sales charge of 5.50%.
4. Source: Morningstar. The MSCI Europe Index (Local Currency and U.S. Dollar) is a market capitalization-weighted index designed to measure equity market performance of developed markets in Europe. The Net Dividends Index reflects the deduction of withholding taxes on reinvested dividends.
5. Figures are as stated in the Fund’s current prospectus and may differ from the expense ratios disclosed in the Your Fund’s Expenses and Financial Highlights sections in this report. In periods of market volatility, assets may decline significantly, causing total annual Fund operating expenses to become higher than the figures shown.
See www.franklintempletondatasources.com for additional data provider information.
10 | Annual Report | franklintempleton.com | ||
FRANKLIN MUTUAL EUROPEAN FUND
As a Fund shareholder, you can incur two types of costs: (1) transaction costs, including sales charges (loads) on Fund purchases and redemptions; and (2) ongoing Fund costs, including management fees, distribution and service(12b-1) fees, and other Fund expenses. All mutual funds have ongoing costs, sometimes referred to as operating expenses. The table below shows ongoing costs of investing in the Fund and can help you understand these costs and compare them with those of other mutual funds. The table assumes a $1,000 investment held for the six months indicated.
Actual Fund Expenses
The table below provides information about actual account values and actual expenses in the columns under the heading “Actual.” In these columns the Fund’s actual return, which includes the effect of Fund expenses, is used to calculate the “Ending Account Value” for each class of shares. You can estimate the expenses you paid during the period by following these steps (of course, your account value and expenses will differ from those in this illustration): Divide your account value by $1,000 (if your account had an $8,600 value, then $8,600 ÷ $1,000 = 8.6). Then multiply the result by the number in the row for your class of shares under the headings “Actual” and “Expenses Paid During Period” (if Actual Expenses Paid During Period were $7.50, then 8.6 x $7.50 = $64.50). In this illustration, the actual expenses paid this period are $64.50.
Hypothetical Example for Comparison with Other Funds
Under the heading “Hypothetical” in the table, information is provided about hypothetical account values and hypothetical expenses based on the Fund’s actual expense ratio and an assumed rate of return of 5% per year before expenses, which is not the Fund’s actual return. This information may not be used to estimate the actual ending account balance or expenses you paid for the period, but it can help you compare ongoing costs of investing in the Fund with those of other funds. To do so, compare this 5% hypothetical example for the class of shares you hold with the 5% hypothetical examples that appear in the shareholder reports of other funds.
Please note that expenses shown in the table are meant to highlight ongoing costs and do not reflect any transactional costs. Therefore, information under the heading “Hypothetical” is useful in comparing ongoing costs only, and will not help you compare total costs of owning different funds. In addition, if transactional costs were included, your total costs would have been higher.
| Actual (actual return after expenses) | Hypothetical (5% annual return before expenses) | |||||||||||
| Share Class | Beginning Account Value 7/1/18 | Ending Account Value 12/31/18 | Expenses Period | Ending Account Value 12/31/18 | Expenses Paid During Period 7/1/18–12/31/181,2 | Net Annualized Expense Ratio2 | ||||||
|
|
|
| |||||||||
Z | $1,000 | $904.00 | $5.04 | $1,019.91 | $ 5.35 | 1.05% | ||||||
A | $1,000 | $903.10 | $6.24 | $1,018.65 | $ 6.61 | 1.30% | ||||||
C | $1,000 | $899.90 | $9.82 | $1,014.87 | $10.41 | 2.05% | ||||||
R | $1,000 | $902.20 | $7.43 | $1,017.39 | $ 7.88 | 1.55% | ||||||
R6 | $1,000 | $905.30 | $4.42 | $1,020.57 | $ 4.69 | 0.92% | ||||||
1. Expenses are equal to the annualized expense ratio for thesix-month period as indicated above—in the far right column—multiplied by the simple average account value over the period indicated, and then multiplied by 184/365 to reflect theone-half year period.
2. Reflects expenses after fee waivers and expense reimbursements. Does not include acquired fund fees and expenses.
franklintempleton.com | Annual Report | 11 | ||||
FRANKLIN MUTUAL EUROPEAN FUND
| Year Ended December 31, | ||||||||||||||||||||
| 2018 | 2017 | 2016 | 2015 | 2014 | ||||||||||||||||
| ||||||||||||||||||||
| Class Z | ||||||||||||||||||||
| Per share operating performance (for a share outstanding throughout the year) | ||||||||||||||||||||
Net asset value, beginning of year | $20.93 | $19.20 | $19.48 | $20.86 | $24.76 | |||||||||||||||
|
| |||||||||||||||||||
| Income from investment operationsa: | ||||||||||||||||||||
Net investment incomeb | 0.49 | 0.35 | 0.63 | c | 0.42 | 0.73 | d | |||||||||||||
Net realized and unrealized gains (losses) | (2.80 | ) | 1.65 | (0.17 | ) | (0.27 | ) | (1.73 | ) | |||||||||||
|
| |||||||||||||||||||
Total from investment operations | (2.31 | ) | 2.00 | 0.46 | 0.15 | (1.00 | ) | |||||||||||||
|
| |||||||||||||||||||
Less distributions from: | ||||||||||||||||||||
Net investment income | (0.73 | ) | (0.27 | ) | (0.47 | ) | (0.46 | ) | (0.67 | ) | ||||||||||
Net realized gains | — | — | (0.27 | ) | (1.07 | ) | (2.23 | ) | ||||||||||||
|
| |||||||||||||||||||
Total distributions | (0.73 | ) | (0.27 | ) | (0.74 | ) | (1.53 | ) | (2.90 | ) | ||||||||||
|
| |||||||||||||||||||
Net asset value, end of year | $17.89 | $20.93 | $19.20 | $19.48 | $20.86 | |||||||||||||||
|
| |||||||||||||||||||
Total return | (11.12)% | 10.45% | 2.40% | 0.82% | (4.00)% | |||||||||||||||
| Ratios to average net assets | ||||||||||||||||||||
Expensese | 1.04% | f,g | 1.04% | f | 1.06% | f,g | 1.05% | 1.04% | f | |||||||||||
Expenses incurred in connection with securities sold short | —% | h | —% | —% | —% | h | 0.01% | |||||||||||||
Net investment income | 2.38% | 1.75% | 3.42% | c | 1.93% | 2.93% | d | |||||||||||||
| Supplemental data | ||||||||||||||||||||
Net assets, end of year (000’s) | $958,149 | $1,328,622 | $1,175,972 | $1,355,780 | $1,128,769 | |||||||||||||||
Portfolio turnover rate | 35.42% | 17.33% | 16.43% | 32.59% | 54.05% | |||||||||||||||
aThe amount shown for a share outstanding throughout the period may not correlate with the Statement of Operations for the period due to the timing of sales and repurchases of the Fund’s shares in relation to income earned and/or fluctuating fair value of the investments of the Fund.
bBased on average daily shares outstanding.
cNet investment income per share includes approximately $0.17 per share related to a nonrecurring distribution. The amount, although initially recorded as dividend income, is subject to recharacterization once the issuer provides information regarding the actual composition of the distribution. Excluding this amount, the ratio of net investment income to average net assets would have been 2.50%.
dNet investment income per share includes approximately $0.29 per share related to income received in the form of a special dividend in connection with certain Fund holdings. Excluding this amount, the ratio of net investment income to average net assets would have been 1.74%.
eIncludes dividend and/or interest expense on securities sold short and security borrowing fees, if any. See below for the ratios of such expenses to average net assets for the periods presented. See Note 1(d).
fBenefit of expense reduction rounds to less than 0.01%.
gBenefit of waiver and payments by affiliates rounds to less than 0.01%.
hRounds to less than 0.01%.
| 12 |
Annual Report | The accompanying notes are an integral part of these financial statements. | franklintempleton.com | ||
FRANKLIN MUTUAL EUROPEAN FUND
FINANCIAL HIGHLIGHTS
| Year Ended December 31, | ||||||||||||||||||||
| 2018 | 2017 | 2016 | 2015 | 2014 | ||||||||||||||||
| ||||||||||||||||||||
| Class A | ||||||||||||||||||||
| Per share operating performance (for a share outstanding throughout the year) | ||||||||||||||||||||
Net asset value, beginning of year | $20.33 | $18.66 | $18.95 | $20.33 | $24.21 | |||||||||||||||
|
| |||||||||||||||||||
| Income from investment operationsa: | ||||||||||||||||||||
Net investment incomeb | 0.41 | 0.31 | 0.57 | c | 0.35 | 0.61 | d | |||||||||||||
Net realized and unrealized gains (losses) | (2.69 | ) | 1.58 | (0.18 | ) | (0.26 | ) | (1.66 | ) | |||||||||||
|
| |||||||||||||||||||
Total from investment operations | (2.28 | ) | 1.89 | 0.39 | 0.09 | (1.05 | ) | |||||||||||||
|
| |||||||||||||||||||
Less distributions from: | ||||||||||||||||||||
Net investment income | (0.68 | ) | (0.22 | ) | (0.41 | ) | (0.40 | ) | (0.60 | ) | ||||||||||
Net realized gains | — | — | (0.27 | ) | (1.07 | ) | (2.23 | ) | ||||||||||||
|
| |||||||||||||||||||
Total distributions | (0.68 | ) | (0.22 | ) | (0.68 | ) | (1.47 | ) | (2.83 | ) | ||||||||||
|
| |||||||||||||||||||
Net asset value, end of year | $17.37 | $20.33 | $18.66 | $18.95 | $20.33 | |||||||||||||||
|
| |||||||||||||||||||
Total returne | (11.29)% | 10.14% | 2.12% | 0.57% | (4.31)% | |||||||||||||||
| Ratios to average net assets | ||||||||||||||||||||
Expensesf | 1.29% | g,h | 1.29% | g | 1.31% | g,h | 1.33% | 1.34% | g | |||||||||||
Expenses incurred in connection with securities sold short | —% | i | —% | —% | —% | i | 0.01% | |||||||||||||
Net investment income | 2.13% | 1.50% | 3.17% | c | 1.65% | 2.63% | d | |||||||||||||
| Supplemental data | ||||||||||||||||||||
Net assets, end of year (000’s) | $564,038 | $714,915 | $769,297 | $1,033,307 | $843,836 | |||||||||||||||
Portfolio turnover rate | 35.42% | 17.33% | 16.43% | 32.59% | 54.05% | |||||||||||||||
aThe amount shown for a share outstanding throughout the period may not correlate with the Statement of Operations for the period due to the timing of sales and repurchases of the Fund’s shares in relation to income earned and/or fluctuating fair value of the investments of the Fund.
bBased on average daily shares outstanding.
cNet investment income per share includes approximately $0.17 per share related to a nonrecurring distribution. The amount, although initially recorded as dividend income, is subject to recharacterization once the issuer provides information regarding the actual composition of the distribution. Excluding this amount, the ratio of net investment income to average net assets would have been 2.25%.
dNet investment income per share includes approximately $0.29 per share related to income received in the form of a special dividend in connection with certain Fund holdings. Excluding this amount, the ratio of net investment income to average net assets would have been 1.44%.
eTotal return does not reflect sales commissions or contingent deferred sales charges, if applicable.
fIncludes dividend and/or interest expense on securities sold short and security borrowing fees, if any. See below for the ratios of such expenses to average net assets for the periods presented. See Note 1(d).
gBenefit of expense reduction rounds to less than 0.01%.
hBenefit of waiver and payments by affiliates rounds to less than 0.01%.
iRounds to less than 0.01%.
| franklintempleton.com |
The accompanying notes are an integral part of these financial statements. | Annual Report | 13 | ||||
FRANKLIN MUTUAL EUROPEAN FUND
FINANCIAL HIGHLIGHTS
| Year Ended December 31, | ||||||||||||||||||
| 2018 | 2017 | 2016 | 2015 | 2014 | ||||||||||||||
| ||||||||||||||||||
| Class C | ||||||||||||||||||
Per share operating performance (for a share outstanding throughout the year) | ||||||||||||||||||
Net asset value, beginning of year | $20.38 | $18.70 | $18.97 | $20.37 | $24.25 | |||||||||||||
|
| |||||||||||||||||
| Income from investment operationsa: | ||||||||||||||||||
Net investment incomeb | 0.29 | 0.15 | 0.44 | c | 0.19 | 0.43d | ||||||||||||
Net realized and unrealized gains (losses) | (2.72 | ) | 1.60 | (0.19 | ) | (0.25 | ) | (1.64) | ||||||||||
|
| |||||||||||||||||
Total from investment operations | (2.43 | ) | 1.75 | 0.25 | (0.06 | ) | (1.21) | |||||||||||
|
| |||||||||||||||||
Less distributions from: | ||||||||||||||||||
Net investment income | (0.39 | ) | (0.07 | ) | (0.25 | ) | (0.27 | ) | (0.44) | |||||||||
Net realized gains | — | — | (0.27 | ) | (1.07 | ) | (2.23) | |||||||||||
|
| |||||||||||||||||
Total distributions | (0.39 | ) | (0.07 | ) | (0.52 | ) | (1.34 | ) | (2.67) | |||||||||
|
| |||||||||||||||||
Net asset value, end of year | $17.56 | $20.38 | $18.70 | $18.97 | $20.37 | |||||||||||||
|
| |||||||||||||||||
Total returne | (11.96)% | 9.37% | 1.32% | (0.16)% | (4.97)% | |||||||||||||
| Ratios to average net assets | ||||||||||||||||||
Expensesf | 2.04%g,h | 2.04%g | 2.06%g,h | 2.05% | 2.04%g | |||||||||||||
Expenses incurred in connection with securities sold short | —%i | —% | —% | —%i | 0.01% | |||||||||||||
Net investment income | 1.38% | 0.75% | 2.42%c | 0.93% | 1.93%d | |||||||||||||
| Supplemental data | ||||||||||||||||||
Net assets, end of year (000’s) | $78,149 | $179,123 | $209,196 | $291,752 | $216,258 | |||||||||||||
Portfolio turnover rate | 35.42% | 17.33% | 16.43% | 32.59% | 54.05% | |||||||||||||
aThe amount shown for a share outstanding throughout the period may not correlate with the Statement of Operations for the period due to the timing of sales and repurchases of the Fund’s shares in relation to income earned and/or fluctuating fair value of the investments of the Fund.
bBased on average daily shares outstanding.
cNet investment income per share includes approximately $0.17 per share related to a nonrecurring distribution. The amount, although initially recorded as dividend income, is subject to recharacterization once the issuer provides information regarding the actual composition of the distribution. Excluding this amount, the ratio of net investment income to average net assets would have been 1.50%.
dNet investment income per share includes approximately $0.29 per share related to income received in the form of a special dividend in connection with certain Fund holdings. Excluding this amount, the ratio of net investment income to average net assets would have been 0.74%.
eTotal return does not reflect sales commissions or contingent deferred sales charges, if applicable.
fIncludes dividend and/or interest expense on securities sold short and security borrowing fees, if any. See below for the ratios of such expenses to average net assets for the periods presented. See Note 1(d).
gBenefit of expense reduction rounds to less than 0.01%.
hBenefit of waiver and payments by affiliates rounds to less than 0.01%.
iRounds to less than 0.01%.
| 14 |
Annual Report | The accompanying notes are an integral part of these financial statements. | franklintempleton.com | ||
FRANKLIN MUTUAL EUROPEAN FUND
FINANCIAL HIGHLIGHTS
| Year Ended December 31, | ||||||||||||||||||||
| 2018 | 2017 | 2016 | 2015 | 2014 | ||||||||||||||||
| ||||||||||||||||||||
| Class R | ||||||||||||||||||||
Per share operating performance (for a share outstanding throughout the year) | ||||||||||||||||||||
Net asset value, beginning of year | $19.97 | $18.35 | $18.62 | $20.04 | $23.95 | |||||||||||||||
|
| |||||||||||||||||||
| Income from investment operationsa: | ||||||||||||||||||||
Net investment incomeb | 0.35 | 0.22 | 0.52c | 0.27 | 0.41d | |||||||||||||||
Net realized and unrealized gains (losses) | (2.64 | ) | 1.60 | (0.18 | ) | (0.23 | ) | (1.49 | ) | |||||||||||
|
| |||||||||||||||||||
Total from investment operations | (2.29 | ) | 1.82 | 0.34 | 0.04 | (1.08 | ) | |||||||||||||
|
| |||||||||||||||||||
Less distributions from: | ||||||||||||||||||||
Net investment income | (0.63 | ) | (0.20 | ) | (0.34 | ) | (0.39 | ) | (0.60 | ) | ||||||||||
Net realized gains | — | — | (0.27 | ) | (1.07 | ) | (2.23 | ) | ||||||||||||
|
| |||||||||||||||||||
Total distributions | (0.63 | ) | (0.20 | ) | (0.61 | ) | (1.46 | ) | (2.83 | ) | ||||||||||
|
| |||||||||||||||||||
Net asset value, end of year | $17.05 | $19.97 | $18.35 | $18.62 | $20.04 | |||||||||||||||
|
| |||||||||||||||||||
Total return | (11.54)% | 9.92% | 1.86% | 0.37% | (4.52)% | |||||||||||||||
| Ratios to average net assets | ||||||||||||||||||||
Expensese | 1.54% | f,g | 1.54% | f | 1.56% | f,g | 1.55% | 1.54% | f | |||||||||||
Expenses incurred in connection with securities sold short | —% | h | —% | —% | —% | h | 0.01% | |||||||||||||
Net investment income | 1.88% | 1.25% | 2.92% | c | 1.43% | 2.43% | d | |||||||||||||
| Supplemental data | ||||||||||||||||||||
Net assets, end of year (000’s) | $731 | $821 | $626 | $997 | $421 | |||||||||||||||
Portfolio turnover rate | 35.42% | 17.33% | 16.43% | 32.59% | 54.05% | |||||||||||||||
aThe amount shown for a share outstanding throughout the period may not correlate with the Statement of Operations for the period due to the timing of sales and repurchases of the Fund’s shares in relation to income earned and/or fluctuating fair value of the investments of the Fund.
bBased on average daily shares outstanding.
cNet investment income per share includes approximately $0.17 per share related to a nonrecurring distribution. The amount, although initially recorded as dividend income, is subject to recharacterization once the issuer provides information regarding the actual composition of the distribution. Excluding this amount, the ratio of net investment income to average net assets would have been 2.00%.
dNet investment income per share includes approximately $0.29 per share related to income received in the form of a special dividend in connection with certain Fund holdings. Excluding this amount, the ratio of net investment income to average net assets would have been 1.24%.
eIncludes dividend and/or interest expense on securities sold short and security borrowing fees, if any. See below for the ratios of such expenses to average net assets for the periods presented. See Note 1(d).
fBenefit of expense reduction rounds to less than 0.01%.
gBenefit of waiver and payments by affiliates rounds to less than 0.01%.
hRounds to less than 0.01%.
franklintempleton.com | The accompanying notes are an integral part of these financial statements. | Annual Report | 15 | ||||
FRANKLIN MUTUAL EUROPEAN FUND
FINANCIAL HIGHLIGHTS
| Year Ended December 31, | ||||||||||||||||||
| 2018 | 2017 | 2016 | 2015 | 2014 | ||||||||||||||
| ||||||||||||||||||
| Class R6 | ||||||||||||||||||
Per share operating performance (for a share outstanding throughout the year) | ||||||||||||||||||
Net asset value, beginning of year | $20.91 | $19.19 | $19.47 | $20.85 | $24.75 | |||||||||||||
|
| |||||||||||||||||
| Income from investment operationsa: | ||||||||||||||||||
Net investment incomeb | 0.56 | 0.41 | 0.66 | c | 0.46 | 0.75d | ||||||||||||
Net realized and unrealized gains (losses) | (2.85 | ) | 1.62 | (0.17 | ) | (0.28 | ) | (1.71) | ||||||||||
|
| |||||||||||||||||
Total from investment operations | (2.29 | ) | 2.03 | 0.49 | 0.18 | (0.96) | ||||||||||||
|
| |||||||||||||||||
Less distributions from: | ||||||||||||||||||
Net investment income | (0.75 | ) | (0.31 | ) | (0.50 | ) | (0.49 | ) | (0.71) | |||||||||
Net realized gains | — | — | (0.27 | ) | (1.07 | ) | (2.23) | |||||||||||
|
| |||||||||||||||||
Total distributions | (0.75 | ) | (0.31 | ) | (0.77 | ) | (1.56 | ) | (2.94) | |||||||||
|
| |||||||||||||||||
Net asset value, end of year | $17.87 | $20.91 | $19.19 | $19.47 | $20.85 | |||||||||||||
|
| |||||||||||||||||
Total return | (10.94)% | 10.63% | 2.53% | 0.98% | (3.88)% | |||||||||||||
| Ratios to average net assets | ||||||||||||||||||
Expenses before waiver and payments by affiliatese | 0.92% | 0.88% | 0.89% | 0.89% | 0.89% | |||||||||||||
Expenses net of waiver and payments by affiliatese | 0.91% | f | 0.88% | f | 0.89% | f,g | 0.89% | 0.89%f | ||||||||||
Expenses incurred in connection with securities sold short | —% | h | —% | —% | —% | h | 0.01% | |||||||||||
Net investment income | 2.51% | 1.91% | 3.59%c | 2.09% | 3.08%d | |||||||||||||
| Supplemental data | ||||||||||||||||||
Net assets, end of year (000’s) | $149,796 | $294,660 | $311,784 | $373,904 | $334,396 | |||||||||||||
Portfolio turnover rate | 35.42% | 17.33% | 16.43% | 32.59% | 54.05% | |||||||||||||
aThe amount shown for a share outstanding throughout the period may not correlate with the Statement of Operations for the period due to the timing of sales and repurchases of the Fund’s shares in relation to income earned and/or fluctuating fair value of the investments of the Fund.
bBased on average daily shares outstanding.
cNet investment income per share includes approximately $0.17 per share related to a nonrecurring distribution. The amount, although initially recorded as dividend income, is subject to recharacterization once the issuer provides information regarding the actual composition of the distribution. Excluding this amount, the ratio of net investment income to average net assets would have been 2.67%.
dNet investment income per share includes approximately $0.29 per share related to income received in the form of a special dividend in connection with certain Fund holdings. Excluding this amount, the ratio of net investment income to average net assets would have been 1.89%.
eIncludes dividend and/or interest expense on securities sold short and security borrowing fees, if any. See below for the ratios of such expenses to average net assets for the periods presented. See Note 1(d).
fBenefit of expense reduction rounds to less than 0.01%.
gBenefit of waiver and payments by affiliates rounds to less than 0.01%.
hRounds to less than 0.01%.
| 16 |
Annual Report | The accompanying notes are an integral part of these financial statements. | franklintempleton.com | ||
FRANKLIN MUTUAL EUROPEAN FUND
Statement of Investments, December 31, 2018
| Country | Shares | Value | ||||||||||
Common Stocks 91.1% | ||||||||||||
| Auto Components 1.9% | ||||||||||||
Cie Generale des Etablissements Michelin SCA | France | 342,111 | $ | 33,985,600 | ||||||||
|
| |||||||||||
| Automobiles 1.0% | ||||||||||||
Peugeot SA | France | 807,802 | 17,257,430 | |||||||||
|
| |||||||||||
| Banks 9.9% | ||||||||||||
AIB Group PLC | Ireland | 6,137,609 | 25,801,548 | |||||||||
Barclays PLC | United Kingdom | 13,780,463 | 26,451,685 | |||||||||
HSBC Holdings PLC | United Kingdom | 2,444,399 | 20,165,294 | |||||||||
ING Groep NV | Netherlands | 2,355,324 | 25,395,050 | |||||||||
Societe Generale SA | France | 271,029 | 8,639,362 | |||||||||
Standard Chartered PLC | United Kingdom | 5,861,827 | 45,546,970 | |||||||||
UniCredit SpA | Italy | 1,948,691 | 22,073,595 | |||||||||
|
| |||||||||||
| 174,073,504 | ||||||||||||
|
| |||||||||||
| Biotechnology 0.9% | ||||||||||||
Shire PLC | United Kingdom | 266,629 | 15,538,851 | |||||||||
|
| |||||||||||
| Capital Markets 3.2% | ||||||||||||
Credit Suisse Group AG | Switzerland | 2,572,571 | 28,136,077 | |||||||||
Deutsche Bank AG | Germany | 3,582,241 | 28,570,277 | |||||||||
|
| |||||||||||
| 56,706,354 | ||||||||||||
|
| |||||||||||
| Chemicals 1.6% | ||||||||||||
BASF SE | Germany | 407,471 | 28,383,062 | |||||||||
|
| |||||||||||
| Commercial Services & Supplies 1.2% | ||||||||||||
G4S PLC | United Kingdom | 8,137,683 | 20,438,643 | |||||||||
|
| |||||||||||
| Communications Equipment 1.6% | ||||||||||||
Nokia OYJ, A | Finland | 1,913,359 | 11,027,403 | |||||||||
Nokia OYJ, ADR | Finland | 3,051,032 | 17,757,006 | |||||||||
|
| |||||||||||
| 28,784,409 | ||||||||||||
|
| |||||||||||
| Construction Materials 5.0% | ||||||||||||
HeidelbergCement AG | Germany | 500,319 | 30,669,794 | |||||||||
LafargeHolcim Ltd., B | Switzerland | 1,372,438 | 56,664,895 | |||||||||
|
| |||||||||||
| 87,334,689 | ||||||||||||
|
| |||||||||||
| Diversified Telecommunication Services 5.5% | ||||||||||||
Hellenic Telecommunications Organization SA | Greece | 4,197,398 | 45,785,283 | |||||||||
Koninklijke KPN NV | Netherlands | 17,390,589 | 51,010,908 | |||||||||
|
| |||||||||||
| 96,796,191 | ||||||||||||
|
| |||||||||||
| Electric Utilities 3.5% | ||||||||||||
Enel SpA | Italy | 10,642,224 | 61,698,280 | |||||||||
|
| |||||||||||
| Electrical Equipment 1.9% | ||||||||||||
Osram Licht AG | Germany | 764,465 | 33,269,875 | |||||||||
|
| |||||||||||
| Health Care Equipment & Supplies 1.0% | ||||||||||||
Koninklijke Philips NV | Netherlands | 488,612 | 17,316,210 | |||||||||
|
| |||||||||||
| Hotels, Restaurants & Leisure 3.5% | ||||||||||||
Accor SA | France | 1,439,660 | 61,215,259 | |||||||||
|
| |||||||||||
| Household Durables 2.6% | ||||||||||||
Husqvarna AB, B | Sweden | 2,085,623 | 15,489,208 | |||||||||
JM AB | Sweden | 1,249,153 | 24,477,791 | |||||||||
| a,bNeinor Homes SA, 144A | Spain | 334,815 | 4,987,203 | |||||||||
|
| |||||||||||
| 44,954,202 | ||||||||||||
|
| |||||||||||
franklintempleton.com | Annual Report | 17 | ||||
FRANKLIN MUTUAL EUROPEAN FUND
STATEMENT OF INVESTMENTS
| Country | Shares | Value | ||||||||||
Common Stocks(continued) | ||||||||||||
| Insurance 12.4% | ||||||||||||
ASR Nederland NV | Netherlands | 916,601 | $ | 36,317,347 | ||||||||
Direct Line Insurance Group PLC | United Kingdom | 10,995,115 | 44,686,584 | |||||||||
Lancashire Holdings Ltd. | United Kingdom | 4,178,619 | 32,239,141 | |||||||||
NN Group NV | Netherlands | 1,526,383 | 60,862,748 | |||||||||
RSA Insurance Group PLC | United Kingdom | 6,461,913 | 42,323,486 | |||||||||
|
| |||||||||||
| 216,429,306 | ||||||||||||
|
| |||||||||||
| Machinery 3.4% | ||||||||||||
CNH Industrial NV, special voting | United Kingdom | 833,461 | 7,530,886 | |||||||||
CNH Industrial NV | United Kingdom | 2,753,906 | 24,883,412 | |||||||||
Vossloh AG | Germany | 558,342 | 27,151,664 | |||||||||
|
| |||||||||||
| 59,565,962 | ||||||||||||
|
| |||||||||||
| Marine 1.4% | ||||||||||||
A.P. Moeller-Maersk AS, B | Denmark | 19,498 | 24,527,891 | |||||||||
|
| |||||||||||
| Media 2.0% | ||||||||||||
aLiberty Global PLC, C | United Kingdom | 1,675,100 | 34,574,064 | |||||||||
|
| |||||||||||
| Metals & Mining 1.1% | ||||||||||||
thyssenkrupp AG | Germany | 1,110,929 | 19,084,324 | |||||||||
|
| |||||||||||
| Oil, Gas & Consumable Fuels 7.1% | ||||||||||||
BP PLC | United Kingdom | 5,708,169 | 36,101,898 | |||||||||
aCairn Energy PLC | United Kingdom | 11,686,571 | 22,354,948 | |||||||||
Royal Dutch Shell PLC, A (EUR Traded) | United Kingdom | 458,553 | 13,479,394 | |||||||||
Royal Dutch Shell PLC, A (GBP Traded) | United Kingdom | 1,095,418 | 32,234,200 | |||||||||
Saras SpA | Italy | 10,256,302 | 19,900,372 | |||||||||
|
| |||||||||||
| 124,070,812 | ||||||||||||
|
| |||||||||||
| Pharmaceuticals 6.5% | ||||||||||||
GlaxoSmithKline PLC | United Kingdom | 2,789,992 | 53,055,959 | |||||||||
Novartis AG | Switzerland | 703,087 | 60,251,061 | |||||||||
|
| |||||||||||
| 113,307,020 | ||||||||||||
|
| |||||||||||
| Road & Rail 0.0% | ||||||||||||
a,c,d,eEuro Wagon LP | Jersey Islands | 16,127,149 | — | |||||||||
|
| |||||||||||
| Semiconductors & Semiconductor Equipment 1.8% | ||||||||||||
BE Semiconductor Industries NV | Netherlands | 1,500,194 | 31,762,245 | |||||||||
|
| |||||||||||
| Software 0.8% | ||||||||||||
aAvast PLC | United Kingdom | 4,021,611 | 14,565,108 | |||||||||
|
| |||||||||||
| Specialty Retail 2.5% | ||||||||||||
Dufry AG | Switzerland | 347,239 | 33,092,041 | |||||||||
Hornbach Holding AG & Co. KGaA | Germany | 213,786 | 10,089,856 | |||||||||
|
| |||||||||||
| 43,181,897 | ||||||||||||
|
| |||||||||||
| Tobacco 1.6% | ||||||||||||
British American Tobacco PLC | United Kingdom | 881,269 | 28,095,956 | |||||||||
|
| |||||||||||
| Trading Companies & Distributors 3.7% | ||||||||||||
Kloeckner & Co. SE | Germany | 3,031,653 | 20,928,314 | |||||||||
Rexel SA | France | 4,154,655 | 44,271,752 | |||||||||
|
| |||||||||||
| 65,200,066 | ||||||||||||
|
| |||||||||||
| Wireless Telecommunication Services 2.5% | ||||||||||||
Vodafone Group PLC | United Kingdom | 22,564,874 | 43,998,281 | |||||||||
|
| |||||||||||
Total Common Stocks (Cost $1,812,156,431) | 1,596,115,491 | |||||||||||
|
| |||||||||||
| 18 |
Annual Report | franklintempleton.com | ||
FRANKLIN MUTUAL EUROPEAN FUND
STATEMENT OF INVESTMENTS
| Country | Shares | Value | ||||||||||||
Preferred Stocks 4.4% | ||||||||||||||
Auto Components 1.8% | ||||||||||||||
fSchaeffler AG, 7.398%, pfd | Germany | 3,633,679 | $ | 30,954,926 | ||||||||||
|
| |||||||||||||
Automobiles 2.6% | ||||||||||||||
fVolkswagen AG, 2.845%, pfd | Germany | 285,343 | 45,501,501 | |||||||||||
|
| |||||||||||||
Total Preferred Stocks (Cost $90,946,579) | 76,456,427 | |||||||||||||
|
| |||||||||||||
Total Investments before Short Term Investments (Cost $1,903,103,010) | 1,672,571,918 | |||||||||||||
|
| |||||||||||||
| Principal Amount | ||||||||||||||
Short Term Investments 2.5% | ||||||||||||||
U.S. Government and Agency Securities 2.5% | ||||||||||||||
gFHLB, 1/02/19 | United States | $ | 5,500,000 | 5,500,000 | ||||||||||
gU.S. Treasury Bill, | ||||||||||||||
1/02/19 | United States | 21,000,000 | 21,000,000 | |||||||||||
1/03/19 - 4/25/19 | United States | 12,500,000 | 12,458,805 | |||||||||||
h5/09/19 | United States | 5,000,000 | 4,956,118 | |||||||||||
|
| |||||||||||||
Total U.S. Government and Agency Securities |
| 43,914,923 |
| |||||||||||
|
| |||||||||||||
Total Investments (Cost $1,947,014,314) 98.0% | 1,716,486,841 | |||||||||||||
Securities Sold Short (0.4)% | (7,562,155 | ) | ||||||||||||
Other Assets, less Liabilities 2.4% | 41,938,389 | |||||||||||||
�� |
| |||||||||||||
Net Assets 100.0% | $ | 1,750,863,075 | ||||||||||||
|
| |||||||||||||
| Shares | ||||||||||||||
iSecurities Sold Short (Proceeds $9,077,678) (0.4)% | ||||||||||||||
Common Stocks (0.4)% | ||||||||||||||
Pharmaceuticals (0.4)% | ||||||||||||||
Takeda Pharmaceutical Co. Ltd. | Japan | 223,701 | (7,562,155 | ) | ||||||||||
|
| |||||||||||||
aNon-income producing.
bSecurity was purchased pursuant to Rule 144A under the Securities Act of 1933 and may be sold in transactions exempt from registration only to qualified institutional buyers or in a public offering registered under the Securities Act of 1933. This security has been deemed liquid under guidelines approved by the Trust’s Board of Trustees. At December 31, 2018, the value of this security was $4,987,203, representing 0.3% of net assets.
cSee Note 11 regarding holdings of 5% voting securities.
dFair valued using significant unobservable inputs. See Note 13 regarding fair value measurements.
eSee Note 9 regarding restricted securities.
fVariable rate security. The rate shown represents the yield at period end.
gThe security was issued on a discount basis with no stated coupon rate.
hA portion or all of the security has been segregated as collateral for securities sold short. At December 31, 2018, the value of this security pledged amounted to $2,250,078, representing 0.1% of net assets.
iSee Note 1(d) regarding securities sold short.
franklintempleton.com | Annual Report | 19 | ||||
FRANKLIN MUTUAL EUROPEAN FUND
STATEMENT OF INVESTMENTS
At December 31, 2018, the Fund had the following futures contracts outstanding. See Note 1(c).
Futures Contracts
| Description | Type | | Number of Contracts |
| | Notional Amount | * | | Expiration Date |
| Value/ Unrealized Appreciation (Depreciation) | |||||
| Currency Contracts | ||||||||||||||||
EUR/USD | Short | 3,017 | $ | 434,542,281 | 3/18/19 | $ 64,851 | ||||||||||
GBP/USD | Short | 1,900 | 151,881,250 | 3/18/19 | 313,942 | |||||||||||
| ||||||||||||||||
Total Futures Contracts | $378,793 | |||||||||||||||
| ||||||||||||||||
*As of period end.
At December 31, 2018, the Fund had the following forward exchange contracts outstanding. See Note 1(c).
Forward Exchange Contracts
| Currency | Counterparty | a | Type | Quantity | | Contract Amount | | | Settlement Date | | | Unrealized Appreciation | | | Unrealized Depreciation | | ||||||||||||
| OTC Forward Exchange Contracts |
| |||||||||||||||||||||||||||
Euro | BOFA | Buy | 42,361,994 | $ | 48,431,506 | 1/14/19 | $ | 167,172 | $ | — | ||||||||||||||||||
Euro | BOFA | Sell | 4,540,537 | 5,400,106 | 1/14/19 | 191,095 | — | |||||||||||||||||||||
Euro | BONY | Buy | 4,102,879 | 4,674,779 | 1/14/19 | 32,140 | — | |||||||||||||||||||||
Euro | BONY | Sell | 51,837,542 | 61,553,971 | 1/14/19 | 2,084,720 | — | |||||||||||||||||||||
Euro | HSBK | Buy | 22,359,927 | 25,534,901 | 1/14/19 | 116,937 | — | |||||||||||||||||||||
Euro | HSBK | Sell | 2,216,504 | 2,622,701 | 1/14/19 | 79,875 | — | |||||||||||||||||||||
Euro | SSBT | Buy | 11,766,291 | 13,441,618 | 1/14/19 | 56,949 | — | |||||||||||||||||||||
Euro | SSBT | Sell | 59,058,182 | 70,136,344 | 1/14/19 | 2,383,404 | — | |||||||||||||||||||||
Euro | UBSW | Buy | 18,869,068 | 21,491,407 | 1/14/19 | 155,634 | — | |||||||||||||||||||||
Euro | UBSW | Sell | 2,275,487 | 2,685,490 | 1/14/19 | 74,997 | — | |||||||||||||||||||||
Swiss Franc | HSBK | Buy | 1,946,140 | 1,967,764 | 1/14/19 | 16,316 | — | |||||||||||||||||||||
Swiss Franc | UBSW | Buy | 19,855,463 | 20,124,148 | 1/14/19 | 118,393 | — | |||||||||||||||||||||
Swiss Franc | UBSW | Sell | 108,574,882 | 109,005,453 | 1/14/19 | — | (1,686,079 | ) | ||||||||||||||||||||
British Pound | HSBK | Buy | 1,761,152 | 2,225,621 | 1/16/19 | 22,180 | — | |||||||||||||||||||||
British Pound | HSBK | Buy | 8,411,840 | 10,782,456 | 1/16/19 | — | (46,224 | ) | ||||||||||||||||||||
British Pound | SSBT | Sell | 32,550,029 | 43,380,888 | 1/16/19 | 1,836,510 | — | |||||||||||||||||||||
British Pound | UBSW | Buy | 900,722 | 1,138,293 | 1/16/19 | 11,320 | — | |||||||||||||||||||||
Norwegian Krone | BONY | Buy | 1,150,000 | 136,180 | 1/25/19 | — | (3,033 | ) | ||||||||||||||||||||
Norwegian Krone | BONY | Buy | 37,706,435 | 4,326,315 | 1/25/19 | 39,327 | — | |||||||||||||||||||||
Norwegian Krone | BONY | Sell | 38,856,435 | 4,686,512 | 1/25/19 | 187,723 | — | |||||||||||||||||||||
Swedish Krona | BONY | Sell | 341,356,901 | 37,730,312 | 1/31/19 | — | (901,645 | ) | ||||||||||||||||||||
Swedish Krona | SSBT | Sell | 4,543,000 | 502,998 | 1/31/19 | — | (11,142 | ) | ||||||||||||||||||||
British Pound | HSBK | Sell | 2,179,786 | 2,889,132 | 2/14/19 | 103,094 | — | |||||||||||||||||||||
British Pound | SSBT | Sell | 144,969 | 190,294 | 2/14/19 | 5,005 | — | |||||||||||||||||||||
British Pound | UBSW | Sell | 77,691,822 | 100,145,623 | 2/14/19 | 845,809 | — | |||||||||||||||||||||
Euro | BOFA | Sell | 9,165,723 | 10,802,146 | 2/20/19 | 254,781 | — | |||||||||||||||||||||
Euro | BONY | Sell | 60,109,629 | 69,595,799 | 2/20/19 | 425,237 | — | |||||||||||||||||||||
Euro | HSBK | Sell | 2,435,388 | 2,896,724 | 2/20/19 | 94,225 | — | |||||||||||||||||||||
Euro | SSBT | Sell | 57,165,262 | 66,099,335 | 2/20/19 | 316,974 | — | |||||||||||||||||||||
Euro | BONY | Sell | 7,073,005 | 8,249,105 | 4/10/19 | 75,081 | — | |||||||||||||||||||||
Euro | SSBT | Sell | 7,073,005 | 8,249,953 | 4/10/19 | 75,930 | — | |||||||||||||||||||||
Euro | BOFA | Sell | 35,851,104 | 42,235,827 | 4/18/19 | 775,187 | — | |||||||||||||||||||||
| 20 |
Annual Report | franklintempleton.com | ||
FRANKLIN MUTUAL EUROPEAN FUND
STATEMENT OF INVESTMENTS
Forward Exchange Contracts(continued)
| Currency | Counterparty | a | Type | Quantity | | Contract Amount |
| | Settlement Date |
| | Unrealized Appreciation |
| | Unrealized Depreciation |
| ||||||||||||
| ||||||||||||||||||||||||||||
| OTC Forward Exchange Contracts(continued) | ||||||||||||||||||||||||||||
Euro | HSBK | Sell | 35,851,103 | $ | 42,242,996 | 4/18/19 | $ | 782,358 | $ | — | ||||||||||||||||||
Euro | UBSW | Sell | 869,218 | 1,008,037 | 4/18/19 | 2,815 | — | |||||||||||||||||||||
British Pound | BOFA | Sell | 50,582 | 66,483 | 4/24/19 | 1,620 | — | |||||||||||||||||||||
British Pound | BONY | Sell | 7,854,243 | 10,254,967 | 4/24/19 | 183,219 | — | |||||||||||||||||||||
British Pound | UBSW | Sell | 62,329,683 | 81,655,601 | 4/24/19 | 1,728,254 | — | |||||||||||||||||||||
Euro | BOFA | Sell | 35,899,355 | 41,602,147 | 5/07/19 | 17,102 | — | |||||||||||||||||||||
Euro | BONY | Sell | 1,000,000 | 1,149,498 | 5/07/19 | — | (8,881 | ) | ||||||||||||||||||||
Euro | HSBK | Sell | 2,893,817 | 3,332,520 | 5/07/19 | — | (19,616 | ) | ||||||||||||||||||||
Euro | HSBK | Sell | 36,974,325 | 42,971,122 | 5/07/19 | 140,853 | — | |||||||||||||||||||||
Euro | SSBT | Sell | 164,970 | 192,599 | 5/07/19 | 1,501 | — | |||||||||||||||||||||
Euro | UBSW | Sell | 581,699 | 666,343 | 5/07/19 | — | (7,484 | ) | ||||||||||||||||||||
Euro | UBSW | Sell | 35,899,355 | 41,597,301 | 5/07/19 | 12,255 | — | |||||||||||||||||||||
Euro | SSBT | Sell | 3,171,868 | 3,661,811 | 5/21/19 | — | (16,892 | ) | ||||||||||||||||||||
Euro | SSBT | Sell | 106,744,796 | 124,298,977 | 5/21/19 | 497,345 | — | |||||||||||||||||||||
British Pound | BOFA | Sell | 323,852 | 413,559 | 5/28/19 | — | (2,392 | ) | ||||||||||||||||||||
British Pound | BOFA | Sell | 11,720,674 | 15,177,434 | 5/28/19 | 123,548 | — | |||||||||||||||||||||
|
| |||||||||||||||||||||||||||
Total Forward Exchange Contracts |
| $ | 14,036,885 | $ | (2,703,388 | ) | ||||||||||||||||||||||
|
| |||||||||||||||||||||||||||
Net unrealized appreciation (depreciation) |
| $ | 11,333,497 | |||||||||||||||||||||||||
|
| |||||||||||||||||||||||||||
aMay be comprised of multiple contracts with the same counterparty, currency and settlement date.
See Note 10 regarding other derivative information.
See Abbreviations on page 38.
franklintempleton.com | The accompanying notes are an integral part of these financial statements. | Annual Report | 21 | ||||
FRANKLIN MUTUAL EUROPEAN FUND
Statement of Assets and Liabilities
December 31, 2018
Assets: | ||||
Investments in securities: | ||||
Cost - Unaffiliated issuers | $ | 1,940,731,805 | ||
Cost - Controlled affiliates (Note 3f and 11) | 6,282,509 | |||
|
| |||
Value - Unaffiliated issuers | $ | 1,716,486,841 | ||
Value - Controlled affiliates (Note 3f and 11) | — | |||
Cash | 47,120 | |||
Receivables: | ||||
Investment securities sold | 11,500,550 | |||
Capital shares sold | 8,438,142 | |||
Dividends | 7,359,104 | |||
European Union tax reclaims | 3,609,184 | |||
Deposits with brokers for: | ||||
Securities sold short | 9,155,898 | |||
Futures contracts | 12,078,370 | |||
Unrealized appreciation on OTC forward exchange contracts | 14,036,885 | |||
Other assets | 288 | |||
|
| |||
Total assets | 1,782,712,382 | |||
|
| |||
Liabilities: | ||||
Payables: | ||||
Investment securities purchased | 3,396 | |||
Capital shares redeemed | 18,050,113 | |||
Management fees | 1,334,519 | |||
Distribution fees | 398,398 | |||
Transfer agent fees | 528,343 | |||
Trustees’ fees and expenses | 125,786 | |||
Variation margin on futures contracts | 857,738 | |||
Securities sold short, at value (proceeds $9,077,678) | 7,562,155 | |||
Unrealized depreciation on OTC forward exchange contracts | 2,703,388 | |||
Accrued expenses and other liabilities | 285,471 | |||
|
| |||
Total liabilities | 31,849,307 | |||
|
| |||
Net assets, at value | $ | 1,750,863,075 | ||
|
| |||
Net assets consist of: | ||||
Paid-in capital | $ | 2,011,371,699 | ||
Total distributable earnings (loss) | (260,508,624 | ) | ||
|
| |||
Net assets, at value | $ | 1,750,863,075 | ||
|
|
| 22 |
Annual Report | The accompanying notes are an integral part of these financial statements. | franklintempleton.com | ||
FRANKLIN MUTUAL EUROPEAN FUND
FINANCIAL STATEMENTS
Statement of Assets and Liabilities(continued)
December 31, 2018
| Class Z: | ||||
Net assets, at value | $958,149,478 | |||
|
| |||
Shares outstanding | 53,549,071 | |||
|
| |||
Net asset value and maximum offering price per share | $17.89 | |||
|
| |||
| Class A: | ||||
Net assets, at value | $564,038,158 | |||
|
| |||
Shares outstanding | 32,474,018 | |||
|
| |||
Net asset value per sharea | $17.37 | |||
|
| |||
Maximum offering price per share (net asset value per share ÷ 94.50%) | $18.38 | |||
|
| |||
| Class C: | ||||
Net assets, at value | $ 78,148,610 | |||
|
| |||
Shares outstanding | 4,449,439 | |||
|
| |||
Net asset value and maximum offering price per sharea | $17.56 | |||
|
| |||
| Class R: | ||||
Net assets, at value | $ 731,131 | |||
|
| |||
Shares outstanding | 42,888 | |||
|
| |||
Net asset value and maximum offering price per share | $17.05 | |||
|
| |||
| Class R6: | ||||
Net assets, at value | $149,795,698 | |||
|
| |||
Shares outstanding | 8,381,057 | |||
|
| |||
Net asset value and maximum offering price per share | $17.87 | |||
|
| |||
aRedemption price is equal to net asset value less contingent deferred sales charges, if applicable.
| franklintempleton.com |
The accompanying notes are an integral part of these financial statements. | Annual Report | 23 | ||||
FRANKLIN MUTUAL EUROPEAN FUND
FINANCIAL STATEMENTS
Statement of Operations
for the year ended December 31, 2018
Investment income: | ||||
Dividends: (net of foreign taxes)* | ||||
Unaffiliated issuers | $ 74,982,085 | |||
Interest: | ||||
Unaffiliated issuers | 2,625,735 | |||
Income from securities loaned: | ||||
Non-controlled affiliates (Note 3f) | 1,745 | |||
Other income (Note 1f) | 781,233 | |||
|
| |||
Total investment income | 78,390,798 | |||
|
| |||
Expenses: | ||||
Management fees (Note 3a) | 19,593,157 | |||
Distribution fees: (Note 3c) | ||||
Class A | 1,670,380 | |||
Class C | 1,476,052 | |||
Class R | 4,235 | |||
Transfer agent fees: (Note 3e) | ||||
Class Z | 1,793,245 | |||
Class A | 971,311 | |||
Class C | 214,611 | |||
Class R | 1,234 | |||
Class R6 | 61,123 | |||
Custodian fees (Note 4) | 257,377 | |||
Reports to shareholders | 132,640 | |||
Registration and filing fees | 105,049 | |||
Professional fees | 156,812 | |||
Trustees’ fees and expenses | 141,192 | |||
Dividends on securities sold short | 25,832 | |||
Other | 71,516 | |||
|
| |||
Total expenses | 26,675,766 | |||
Expense reductions (Note 4) | (19,865 | ) | ||
Expenses waived/paid by affiliates (Note 3f and 3g) | (13,582 | ) | ||
|
| |||
Net expenses | 26,642,319 | |||
|
| |||
Net investment income | 51,748,479 | |||
|
| |||
Realized and unrealized gains (losses): | ||||
Net realized gain (loss) from: | ||||
Investments: | ||||
Unaffiliated issuers | 83,589,320 | |||
Foreign currency transactions | 769,317 | |||
Forward exchange contracts | 43,649,772 | |||
Futures contracts | 40,356,225 | |||
|
| |||
Net realized gain (loss) | 168,364,634 | |||
|
| |||
Net change in unrealized appreciation (depreciation) on: | ||||
Investments: | ||||
Unaffiliated issuers | (507,165,874 | ) | ||
Translation of other assets and liabilities denominated in foreign currencies | (541,911 | ) | ||
Forward exchange contracts | 37,444,807 | |||
Futures contracts | 11,212,420 | |||
Securities sold short | 1,515,523 | |||
|
| |||
Net change in unrealized appreciation (depreciation) | (457,535,035 | ) | ||
|
| |||
Net realized and unrealized gain (loss) | (289,170,401 | ) | ||
|
| |||
Net increase (decrease) in net assets resulting from operations | $237,421,922 | ) | ||
|
| |||
*Foreign taxes withheld on dividends | $ 8,339,541 | |||
| 24 |
Annual Report | The accompanying notes are an integral part of these financial statements. | franklintempleton.com | ||
FRANKLIN MUTUAL EUROPEAN FUND
FINANCIAL STATEMENTS
Statements of Changes in Net Assets
| Year Ended December 31, | ||||||||
| 2018 | 2017 | |||||||
| ||||||||
Increase (decrease) in net assets: | ||||||||
Operations: | ||||||||
Net investment income | $ | 51,748,479 | $ | 41,754,082 | ||||
Net realized gain (loss) | 168,364,634 | (36,941,433 | ) | |||||
Net change in unrealized appreciation (depreciation) | (457,535,035 | ) | 245,053,933 | |||||
|
| |||||||
Net increase (decrease) in net assets resulting from operations | (237,421,922 | ) | 249,866,582 | |||||
|
| |||||||
Distributions to shareholders: (Note 1g) | ||||||||
Class Z | (39,537,213 | ) | (17,540,243 | ) | ||||
Class A | (21,635,584 | ) | (7,669,484 | ) | ||||
Class C | (2,285,511 | ) | (661,962 | ) | ||||
Class R | (26,901 | ) | (7,585 | ) | ||||
Class R6 | (6,073,341 | ) | (4,427,392 | ) | ||||
|
| |||||||
Total distributions to shareholders | (69,558,550 | ) | (30,306,666 | ) | ||||
|
| |||||||
Capital share transactions: (Note 2) | ||||||||
Class Z | (197,936,001 | ) | 43,359,185 | |||||
Class A | (56,127,793 | ) | (118,591,024 | ) | ||||
Class C | (84,206,336 | ) | (47,346,696 | ) | ||||
Class R | 38,579 | 141,266 | ||||||
Class R6 | (122,065,613 | ) | (45,857,168 | ) | ||||
|
| |||||||
Total capital share transactions | (460,297,164 | ) | (168,294,437 | ) | ||||
|
| |||||||
Net increase (decrease) in net assets | (767,277,636 | ) | 51,265,479 | |||||
Net assets: | ||||||||
Beginning of year | 2,518,140,711 | 2,466,875,232 | ||||||
|
| |||||||
End of year (Note 1g) | $ | 1,750,863,075 | $ | 2,518,140,711 | ||||
|
| |||||||
franklintempleton.com | The accompanying notes are an integral part of these financial statements. | Annual Report | 25 | ||
FRANKLIN MUTUAL EUROPEAN FUND
1. Organization and Significant Accounting
Policies
Franklin Mutual Series Funds (Trust) is registered under the Investment Company Act of 1940 (1940 Act) as anopen-end management investment company, consisting of seven separate funds and applies the specialized accounting and reporting guidance in U.S. Generally Accepted Accounting Principles (U.S. GAAP). Franklin Mutual European Fund (Fund) is included in this report. The Fund offers five classes of shares: Class Z, Class A, Class C, Class R and Class R6. Beginning on October 19, 2018, Class C shares automatically convert to Class A shares after they have been held for 10 years. Each class of shares may differ by its initial sales load, contingent deferred sales charges, voting rights on matters affecting a single class, its exchange privilege and fees due to differing arrangements for distribution and transfer agent fees.
The following summarizes the Fund’s significant accounting policies.
a. Financial Instrument Valuation
The Fund’s investments in financial instruments are carried at fair value daily. Fair value is the price that would be received to sell an asset or paid to transfer a liability in an orderly transaction between market participants on the measurement date. The Fund calculates the net asset value (NAV) per share each business day as of 4 p.m. Eastern time or the regularly scheduled close of the New York Stock Exchange (NYSE), whichever is earlier. Under compliance policies and procedures approved by the Trust’s Board of Trustees (the Board), the Fund’s administrator has responsibility for oversight of valuation, including leading the cross-functional Valuation Committee (VC). The Fund may utilize independent pricing services, quotations from securities and financial instrument dealers, and other market sources to determine fair value.
Equity securities and derivative financial instruments listed on an exchange or on the NASDAQ National Market System are valued at the last quoted sale price or the official closing price of the day, respectively. Foreign equity securities are valued as of the close of trading on the foreign stock exchange on which the security is primarily traded, or as of 4 p.m. Eastern time. The value is then converted into its U.S. dollar equivalent at the foreign exchange rate in effect at 4 p.m. Eastern time on the day that the value of the security is determined.Over-the-counter (OTC) securities are valued within the range of the most recent quoted bid and ask prices. Securities that trade in multiple
markets or on multiple exchanges are valued according to the broadest and most representative market. Certain equity securities are valued based upon fundamental characteristics or relationships to similar securities.
Debt securities generally trade in the OTC market rather than on a securities exchange. The Fund’s pricing services use multiple valuation techniques to determine fair value. In instances where sufficient market activity exists, the pricing services may utilize a market-based approach through which quotes from market makers are used to determine fair value. In instances where sufficient market activity may not exist or is limited, the pricing services also utilize proprietary valuation models which may consider market characteristics such as benchmark yield curves, credit spreads, estimated default rates, anticipated market interest rate volatility, coupon rates, anticipated timing of principal repayments, underlying collateral, and other unique security features in order to estimate the relevant cash flows, which are then discounted to calculate the fair value.
Investments inopen-end mutual funds are valued at the closing NAV.
Certain derivative financial instruments trade in the OTC market. The Fund’s pricing services use various techniques including industry standard option pricing models and proprietary discounted cash flow models to determine the fair value of those instruments. The Fund’s net benefit or obligation under the derivative contract, as measured by the fair value of the contract, is included in net assets.
The Fund has procedures to determine the fair value of financial instruments for which market prices are not reliable or readily available. Under these procedures, the Fund primarily employs a market-based approach which may use related or comparable assets or liabilities, recent transactions, market multiples, book values, and other relevant information for the investment to determine the fair value of the investment. An income-based valuation approach may also be used in which the anticipated future cash flows of the investment are discounted to calculate fair value. Discounts may also be applied due to the nature or duration of any restrictions on the disposition of the investments. Due to the inherent uncertainty of valuations of such investments, the fair values may differ significantly from the values that would have been used had an active market existed.
| 26 |
Annual Report | franklintempleton.com | ||
FRANKLIN MUTUAL EUROPEAN FUND
NOTES TO FINANCIAL STATEMENTS
Trading in securities on foreign securities stock exchanges and OTC markets may be completed before 4 p.m. Eastern time. In addition, trading in certain foreign markets may not take place on every Fund’s business day. Occasionally, events occur between the time at which trading in a foreign security is completed and 4 p.m. Eastern time that might call into question the reliability of the value of a portfolio security held by the Fund. As a result, differences may arise between the value of the Fund’s portfolio securities as determined at the foreign market close and the latest indications of value at 4 p.m. Eastern time. In order to minimize the potential for these differences, the VC monitors price movements following the close of trading in foreign stock markets through a series of country specific market proxies (such as baskets of American Depositary Receipts, futures contracts and exchange traded funds). These price movements are measured against established trigger thresholds for each specific market proxy to assist in determining if an event has occurred that may call into question the reliability of the values of the foreign securities held by the Fund. If such an event occurs, the securities may be valued using fair value procedures, which may include the use of independent pricing services. At December 31, 2018, a market event occurred resulting in a portion of the securities held by the Fund being valued using fair value procedures.
When the last day of the reporting period is anon-business day, certain foreign markets may be open on those days that the Fund’s NAV is not calculated, which could result in differences between the value of the Fund’s portfolio securities on the last business day and the last calendar day of the reporting period. Any significant security valuation changes due to an open foreign market are adjusted and reflected by the Fund for financial reporting purposes.
b. Foreign Currency Translation
Portfolio securities and other assets and liabilities denominated in foreign currencies are translated into U.S. dollars based on the exchange rate of such currencies against U.S. dollars on the date of valuation. The Fund may enter into foreign currency exchange contracts to facilitate transactions denominated in a foreign currency. Purchases and sales of securities, income and expense items denominated in foreign currencies are translated into U.S. dollars at the exchange rate in effect on the transaction date. Portfolio securities and assets and liabilities denominated in foreign currencies contain risks that those currencies will decline in value relative to the U.S. dollar. Occasionally, events may impact the availability or reliability of foreign exchange
rates used to convert the U.S. dollar equivalent value. If such an event occurs, the foreign exchange rate will be valued at fair value using procedures established and approved by the Board.
The Fund does not separately report the effect of changes in foreign exchange rates from changes in market prices on securities held. Such changes are included in net realized and unrealized gain or loss from investments in the Statement of Operations.
Realized foreign exchange gains or losses arise from sales of foreign currencies, currency gains or losses realized between the trade and settlement dates on securities transactions and the difference between the recorded amounts of dividends, interest, and foreign withholding taxes and the U.S. dollar equivalent of the amounts actually received or paid. Net unrealized foreign exchange gains and losses arise from changes in foreign exchange rates on foreign denominated assets and liabilities other than investments in securities held at the end of the reporting period.
c. Derivative Financial Instruments
The Fund invested in derivative financial instruments in order to manage risk or gain exposure to various other investments or markets. Derivatives are financial contracts based on an underlying or notional amount, require no initial investment or an initial net investment that is smaller than would normally be required to have a similar response to changes in market factors, and require or permit net settlement. Derivatives contain various risks including the potential inability of the counterparty to fulfill their obligations under the terms of the contract, the potential for an illiquid secondary market, and/or the potential for market movements which expose the Fund to gains or losses in excess of the amounts shown in the Statement of Assets and Liabilities. Realized gain and loss and unrealized appreciation and depreciation on these contracts for the period are included in the Statement of Operations.
Derivative counterparty credit risk is managed through a formal evaluation of the creditworthiness of all potential counterparties. The Fund attempts to reduce its exposure to counterparty credit risk on OTC derivatives, whenever possible, by entering into International Swaps and Derivatives Association (ISDA) master agreements with certain counterparties. These agreements contain various provisions, including but not limited to collateral requirements, events of default, or early termination. Termination events applicable to
franklintempleton.com | Annual Report | 27 | ||||
FRANKLIN MUTUAL EUROPEAN FUND
NOTES TO FINANCIAL STATEMENTS
1. Organization and Significant Accounting
Policies(continued)
c. Derivative Financial Instruments (continued)
the counterparty include certain deteriorations in the credit quality of the counterparty. Termination events applicable to the Fund include failure of the Fund to maintain certain net asset levels and/or limit the decline in net assets over various periods of time. In the event of default or early termination, the ISDA master agreement gives thenon-defaulting party the right to net andclose-out all transactions traded, whether or not arising under the ISDA agreement, to one net amount payable by one counterparty to the other. However, absent an event of default or early termination, OTC derivative assets and liabilities are presented gross and not offset in the Statement of Assets and Liabilities. Early termination by the counterparty may result in an immediate payment by the Fund of any net liability owed to that counterparty under the ISDA agreement. At December 31, 2018, the Fund had no OTC derivatives in a net liability position for such contracts.
Collateral requirements differ by type of derivative. Collateral or initial margin requirements are set by the broker or exchange clearing house for exchange traded and centrally cleared derivatives. Initial margin deposited is held at the exchange and can be in the form of cash and/or securities. For OTC derivatives traded under an ISDA master agreement, posting of collateral is required by either the Fund or the applicable counterparty if the total net exposure of all OTC derivatives with the applicable counterparty exceeds the minimum transfer amount, which typically ranges from $100,000 to $250,000, and can vary depending on the counterparty and the type of the agreement. Generally, collateral is determined at the close of Fund business each day and any additional collateral required due to changes in derivative values may be delivered by the Fund or the counterparty the next business day, or within a few business days. Collateral pledged and/or received by the Fund for OTC derivatives, if any, is held in segregated accounts with the Fund’s custodian/counterparty broker and can be in the form of cash and/or securities. Unrestricted cash may be invested according to the Fund’s investment objectives. To the extent that the amounts due to the Fund from its counterparties are not subject to collateralization or are not fully collateralized, the Fund bears the risk of loss from counterpartynon-performance.
At December 31, 2018, the Fund received $14,289,885 in U.K. Treasury Bonds and U.S. Treasury Bills, Bonds and Notes as collateral for derivatives.
The Fund entered into exchange traded futures contracts primarily to manage exposure to certain foreign currencies. A futures contract is an agreement between the Fund and a counterparty to buy or sell an asset at a specified price on a future date. Required initial margins are pledged by the Fund, and the daily change in fair value is accounted for as a variation margin payable or receivable in the Statement of Assets and Liabilities.
The Fund entered into OTC forward exchange contracts primarily to manage exposure to certain foreign currencies. A forward exchange contract is an agreement between the Fund and a counterparty to buy or sell a foreign currency at a specific exchange rate on a future date.
See Note 10 regarding other derivative information.
d. Securities Sold Short
The Fund is engaged in selling securities short, which obligates the Fund to replace a borrowed security with the same security at current fair value. The Fund incurs a loss if the price of the security increases between the date of the short sale and the date on which the Fund replaces the borrowed security. The Fund realizes a gain if the price of the security declines between those dates. Gains are limited to the price at which the Fund sold the security short, while losses are potentially unlimited in size.
The Fund is required to establish a margin account with the broker lending the security sold short. While the short sale is outstanding, the broker retains the proceeds of the short sale to the extent necessary to meet margin requirements until the short position is closed out. A deposit must also be maintained with the Fund’s custodian/counterparty broker consisting of cash and/or securities having a value equal to a specified percentage of the value of the securities sold short. The Fund is obligated to pay fees for borrowing the securities sold short and is required to pay the counterparty any dividends and/or interest due on securities sold short. Such dividends and/or interest and any security borrowing fees are recorded as an expense to the Fund.
e. Securities Lending
The Fund participates in an agency based securities lending program to earn additional income. The Fund receives cash collateral against the loaned securities in an amount equal to at
28 |
Annual Report |
franklintempleton.com |
FRANKLIN MUTUAL EUROPEAN FUND
NOTES TO FINANCIAL STATEMENTS
least 102% of the fair value of the loaned securities. Collateral is maintained over the life of the loan in an amount not less than 100% of the fair value of loaned securities, as determined at the close of Fund business each day; any additional collateral required due to changes in security values is delivered to the Fund on the next business day. The collateral is deposited into a joint cash account with other funds and is used to invest in a money market fund managed by Franklin Advisers, Inc., an affiliate of the Fund, and/or a joint repurchase agreement. The Fund may receive income from the investment of cash collateral, in addition to lending fees and rebates paid by the borrower. Income from securities loaned, net of fees paid to the securities lending agent and/or third-party vendor, is reported separately in the Statement of Operations. The Fund bears the market risk with respect to the collateral investment, securities loaned, and the risk that the agent may default on its obligations to the Fund. If the borrower defaults on its obligation to return the securities loaned, the Fund has the right to repurchase the securities in the open market using the collateral received. The securities lending agent has agreed to indemnify the Fund in the event of default by a third party borrower. At December 31, 2018, the Fund had no securities on loan.
f. Income and Deferred Taxes
It is the Fund’s policy to qualify as a regulated investment company under the Internal Revenue Code. The Fund intends to distribute to shareholders substantially all of its taxable income and net realized gains to relieve it from federal income and excise taxes. As a result, no provision for U.S. federal income taxes is required.
The Fund may be subject to foreign taxation related to income received, capital gains on the sale of securities and certain foreign currency transactions in the foreign jurisdictions in which it invests. Foreign taxes, if any, are recorded based on the tax regulations and rates that exist in the foreign markets in which the Fund invests. When a capital gain tax is determined to apply, the Fund records an estimated deferred tax liability in an amount that would be payable if the securities were disposed of on the valuation date.
As a result of several court cases, in certain countries across the European Union, the Fund filed additional tax reclaims for previously withheld taxes on dividends earned in those countries (EU reclaims). These additional filings are subject to various administrative proceedings by the local jurisdictions’ tax authorities within the European Union, as well as a number
of related judicial proceedings. Income recognized, if any, for EU reclaims is reflected as other income in the Statement of Operations and any related receivable, if any, is reflected as European Union tax reclaims in the Statement of Assets and Liabilities. When uncertainty exists as to the ultimate resolution of these proceedings, the likelihood of receipt of these EU reclaims, and the potential timing of payment, no amounts are reflected in the financial statements. For U.S. income tax purposes, EU reclaims received by the Fund, if any, reduce the amounts of foreign taxes Fund shareholders can use as tax credits in their individual income tax returns.
The Fund may recognize an income tax liability related to its uncertain tax positions under U.S. GAAP when the uncertain tax position has a less than 50% probability that it will be sustained upon examination by the tax authorities based on its technical merits. As of December 31, 2018, the Fund has determined that no tax liability is required in its financial statements related to uncertain tax positions for any open tax years (or expected to be taken in future tax years). Open tax years are those that remain subject to examination and are based on the statute of limitations in each jurisdiction in which the Fund invests.
g. Security Transactions, Investment Income, Expenses and Distributions
Security transactions are accounted for on trade date. Realized gains and losses on security transactions are determined on a specific identification basis. Interest income and estimated expenses are accrued daily. Amortization of premium and accretion of discount on debt securities are included in interest income. Dividend income and dividends declared on securities sold short are recorded on theex-dividend date except for certain dividends from securities where the dividend rate is not available. In such cases, the dividend is recorded as soon as the information is received by the Fund. Distributions to shareholders are recorded on theex-dividend date. Distributable earnings are determined according to income tax regulations (tax basis) and may differ from earnings recorded in accordance with U.S. GAAP. These differences may be permanent or temporary. Permanent differences are reclassified among capital accounts to reflect their tax character. These reclassifications have no impact on net assets or the results of operations. Temporary differences are not reclassified, as they may reverse in subsequent periods.*
franklintempleton.com |
Annual Report |
29 |
FRANKLIN MUTUAL EUROPEAN FUND
NOTES TO FINANCIAL STATEMENTS
1. Organization and Significant Accounting
Policies(continued)
g. Security Transactions, Investment Income, Expenses and Distributions(continued)
Common expenses incurred by the Trust are allocated among the Funds based on the ratio of net assets of each Fund to the combined net assets of the Trust or based on the ratio of number of shareholders of each Fund to the combined number of shareholders of the Trust. Fund specific expenses are charged directly to the Fund that incurred the expense.
Realized and unrealized gains and losses and net investment income, excluding class specific expenses, are allocated daily to each class of shares based upon the relative proportion of net assets of each class. Differences in per share distributions by class are generally due to differences in class specific expenses.
h. Accounting Estimates
The preparation of financial statements in accordance with U.S. GAAP requires management to make estimates and assumptions that affect the reported amounts of assets and
liabilities at the date of the financial statements and the amounts of income and expenses during the reporting period. Actual results could differ from those estimates.
i. Guarantees and Indemnifications
Under the Trust’s organizational documents, its officers and trustees are indemnified by the Trust against certain liabilities arising out of the performance of their duties to the Trust. Additionally, in the normal course of business, the Trust, on behalf of the Fund, enters into contracts with service providers that contain general indemnification clauses. The Trust’s maximum exposure under these arrangements is unknown as this would involve future claims that may be made against the Trust that have not yet occurred. Currently, the Trust expects the risk of loss to be remote.
*Effective during the current reporting period, it is no longer required to present certain line items in the Statements of Changes in Net Assets. The below prior period amounts affected by this change are shown as they were in the prior year Statements of Changes in Net Assets.
For the year ended December 31, 2017, distributions to shareholders were as follows:
Distributions from net investment income :
Class Z | $ | (17,540,243 | ) | |
Class A | (7,669,484 | ) | ||
Class C | (661,962 | ) | ||
Class R | (7,585 | ) | ||
Class R6 | (4,427,392 | ) |
For the year ended December 31, 2017, undistributed net investment income included in net assets was $21,175,134.
30 |
Annual Report |
franklintempleton.com |
FRANKLIN MUTUAL EUROPEAN FUND
NOTES TO FINANCIAL STATEMENTS
2. Shares of Beneficial Interest
At December 31, 2018, there were an unlimited number of shares authorized (without par value). Transactions in the Fund’s shares were as follows:
| Year Ended December 31, | ||||||||||||||||
| 2018 | 2017 | |||||||||||||||
| Shares | Amount | Shares | Amount | |||||||||||||
| Class Z Shares: | ||||||||||||||||
Shares sold | 15,870,789 | $ | 328,884,286 | 17,236,906 | $ | 350,944,087 | ||||||||||
Shares issued in reinvestment of distributions | 2,023,721 | 37,225,839 | 789,963 | 16,435,905 | ||||||||||||
Shares redeemed | (27,834,376 | ) | (564,046,126 | ) | (15,782,895 | ) | (324,020,807 | ) | ||||||||
|
| |||||||||||||||
Net increase (decrease) | (9,939,866 | ) | $ | (197,936,001 | ) | 2,243,974 | $ | 43,359,185 | ||||||||
|
| |||||||||||||||
| Class A Shares: | ||||||||||||||||
Shares solda | 6,861,993 | $ | 134,662,400 | 15,602,529 | $ | 310,200,219 | ||||||||||
Shares issued in reinvestment of distributions | 870,701 | 15,538,916 | 287,521 | 5,802,513 | ||||||||||||
Shares redeemed | (10,421,209 | ) | (206,329,109 | ) | (21,954,991 | ) | (434,593,756 | ) | ||||||||
|
| |||||||||||||||
Net increase (decrease) | (2,688,515 | ) | $ | (56,127,793 | ) | (6,064,941 | ) | $ | (118,591,024 | ) | ||||||
|
| |||||||||||||||
| Class C Shares: | ||||||||||||||||
Shares sold | 486,940 | $ | 9,826,395 | 1,180,124 | $ | 23,513,530 | ||||||||||
Shares issued in reinvestment of distributions | 117,682 | 2,203,229 | 32,119 | 639,507 | ||||||||||||
Shares redeemeda | (4,944,916 | ) | (96,235,960 | ) | (3,606,833 | ) | (71,499,733 | ) | ||||||||
|
| |||||||||||||||
Net increase (decrease) | (4,340,294 | ) | $ | (84,206,336 | ) | (2,394,590 | ) | $ | (47,346,696 | ) | ||||||
|
| |||||||||||||||
| Class R Shares: | ||||||||||||||||
Shares sold | 8,109 | $ | 162,976 | 16,679 | $ | 329,815 | ||||||||||
Shares issued in reinvestment of distributions | 1,528 | 26,901 | 382 | 7,585 | ||||||||||||
Shares redeemed | (7,860 | ) | (151,298 | ) | (10,067 | ) | (196,134 | ) | ||||||||
|
| |||||||||||||||
Net increase (decrease) | 1,777 | $ | 38,579 | 6,994 | $ | 141,266 | ||||||||||
|
| |||||||||||||||
| Class R6 Shares: | ||||||||||||||||
Shares sold | 1,059,999 | $ | 21,160,059 | 3,235,565 | $ | 65,830,080 | ||||||||||
Shares issued in reinvestment of distributions | 261,913 | 4,800,226 | 185,294 | 3,853,120 | ||||||||||||
Shares redeemed | (7,032,513 | ) | (148,025,898 | ) | (5,580,242 | ) | (115,540,368 | ) | ||||||||
|
| |||||||||||||||
Net increase (decrease) | (5,710,601 | ) | $ | (122,065,613 | ) | (2,159,383 | ) | $ | (45,857,168 | ) | ||||||
|
| |||||||||||||||
aMay include a portion of Class C shares that were automatically converted to Class A.
3. Transactions with Affiliates
Franklin Resources, Inc. is the holding company for various subsidiaries that together are referred to as Franklin Templeton. Certain officers and trustees of the Fund are also officers and/or directors of the following subsidiaries:
| Subsidiary | Affiliation | |
Franklin Mutual Advisers, LLC (Franklin Mutual)
| Investment manager | |
Franklin Templeton Services, LLC (FT Services)
| Administrative manager | |
Franklin Templeton Distributors, Inc. (Distributors)
| Principal underwriter | |
Franklin Templeton Investor Services, LLC (Investor Services)
| Transfer agent | |
| franklintempleton.com |
Annual Report |
|
31 |
| ||
FRANKLIN MUTUAL EUROPEAN FUND
NOTES TO FINANCIAL STATEMENTS
3. Transactions with Affiliates(continued)
a. Management Fees
The Fund pays an investment management fee to Franklin Mutual based on the average daily net assets of the Fund as follows:
| Annualized Fee Rate | Net Assets | |
0.875% | Up to and including $1 billion | |
0.845% | Over $1 billion, up to and including $2 billion | |
0.825% | Over $2 billion, up to and including $5 billion | |
0.805% | In excess of $5 billion | |
For the year ended December 31, 2018, the gross effective investment management fee rate was 0.856% of the Fund’s average daily net assets.
b. Administrative Fees
Under an agreement with Franklin Mutual, FT Services provides administrative services to the Fund. The fee is paid by Franklin Mutual based on the Fund’s average daily net assets, and is not an additional expense of the Fund.
c. Distribution Fees
The Board has adopted distribution plans for each share class, with the exception of Class Z and Class R6 shares, pursuant to Rule12b-1 under the 1940 Act. Under the Fund’s Class A reimbursement distribution plan, the Fund reimburses Distributors for costs incurred in connection with the servicing, sale and distribution of the Fund’s shares up to the maximum annual plan rate. Under the Class A reimbursement distribution plan, costs exceeding the maximum for the current plan year cannot be reimbursed in subsequent periods. In addition, under the Fund’s Class C and R compensation distribution plans, the Fund pays Distributors for costs incurred in connection with the servicing, sale and distribution of the Fund’s shares up to the maximum annual plan rate for each class. The plan year, for purposes of monitoring compliance with the maximum annual plan rates, is February 1 through January 31.
The maximum annual plan rates, based on the average daily net assets, for each class, are as follows:
Class A | 0.35% | |||
Class C | 1.00% | |||
Class R | 0.50% |
The Board has set the current rate at 0.25% per year for Class A shares until further notice and approval by the Board.
d. Sales Charges/Underwriting Agreements
Front-end sales charges and contingent deferred sales charges (CDSC) do not represent expenses of the Fund. These charges are deducted from the proceeds of sales of Fund shares prior to investment or from redemption proceeds prior to remittance, as applicable. Distributors has advised the Fund of the following commission transactions related to the sales and redemptions of the Fund’s shares for the year:
Sales charges retained net of commissions paid to | $ | 48,231 | ||
CDSC retained | $ | 16,930 |
Effective September 10, 2018, the Board approved changes to certainfront-end sales charges and dealer commissions on Class A shares. Further details are disclosed in the Fund’s Prospectus.
| 32 |
Annual Report | franklintempleton.com | ||
FRANKLIN MUTUAL EUROPEAN FUND
NOTES TO FINANCIAL STATEMENTS
e. Transfer Agent Fees
Each class of shares pays transfer agent fees to Investor Services for its performance of shareholder servicing obligations. The fees are based on an annualized asset based fee of 0.02% plus a transaction based fee. In addition, each class reimburses Investor Services for out of pocket expenses incurred and, except for Class R6, reimburses shareholder servicing fees paid to third parties. These fees are allocated daily based upon their relative proportion of such classes’ aggregate net assets. Class R6 pays Investor Services transfer agent fees specific to that class.
For the year ended December 31, 2018, the Fund paid transfer agent fees of $3,041,524, of which $1,097,353 was retained by Investor Services.
f. Investments in Affiliated Management Investment Companies
The Fund invests in one or more affiliated management investment companies for purposes other than exercising a controlling influence over the management or policies. Management fees paid by the Fund are waived on assets invested in the affiliated management investment companies, as noted in the Statement of Operations, in an amount not to exceed the management and administrative fees paid directly or indirectly by each affiliate. During the year ended December 31, 2018, the Fund held investments in affiliated management investment companies as follows:
| Number of Shares Held at Beginning of Year | Gross Additions | Gross Reductions | Number of Shares Held at End of Year | Value at End of Year | Income from securities loaned | Realized Gain (Loss) | Net Change in Unrealized Appreciation (Depreciation) | |||||||||||||||||||||||||
Non-Controlled Affiliates | ||||||||||||||||||||||||||||||||
Institutional Fiduciary Trust Money Market Portfolio, 1.99% | — | 938,000 | (938,000 | ) | — | $ — | $1,745 | $ — | $ — | |||||||||||||||||||||||
|
| |||||||||||||||||||||||||||||||
g. Waiver and Expense Reimbursements
Investor Services has voluntarily agreed in advance to waive or limit its fees so that the Class R6 transfer agent fees do not exceed 0.02% based on the average net assets of the class. Investor Services may discontinue this waiver in the future.
h. Other Affiliated Transactions
At December 31, 2018, one or more of the funds in Franklin Fund Allocator Series owned 6.2% of the Fund’s outstanding shares.
i. Interfund Transactions
The Fund engaged in purchases and sales of investments with funds or other accounts that have common investment managers (or affiliated investment managers), directors, trustees or officers. During the year ended December 31, 2018, these purchase and sale transactions aggregated $1,820,107 and $—, respectively.
4. Expense Offset Arrangement
The Fund has entered into an arrangement with its custodian whereby credits realized as a result of uninvested cash balances are used to reduce a portion of the Fund’s custodian expenses. During the year ended December 31, 2018, the custodian fees were reduced as noted in the Statement of Operations.
5. Independent Trustees’ Retirement Plan
On January 1, 1993, the Trust adopted an Independent Trustees’ Retirement Plan (Plan). The Plan is an unfunded defined benefit plan that provides benefit payments to Trustees whose length of service and retirement age meets the eligibility requirements of the Plan. Benefits under the Plan are based on years of service and fees paid to each trustee at the time of retirement. Effective in December 1996, the Plan was closed to new participants.
franklintempleton.com | Annual Report | 33 | ||||
FRANKLIN MUTUAL EUROPEAN FUND
NOTES TO FINANCIAL STATEMENTS
5. Independent Trustees’ Retirement Plan(continued)
During the year ended December 31, 2018, the Fund’s projected benefit obligation and benefit payments under the Plan were as follows:
aProjected benefit obligation at December 31, 2018 | $ | 125,786 | ||||||
bIncrease in projected benefit obligation | $ | 33,573 | ||||||
Benefit payments made to retired trustees | $ | (2,507 | ) | |||||
aThe projected benefit obligation is included in trustees’ fees and expenses in the Statement of Assets and Liabilities.
bThe increase in projected benefit obligation is included in trustees’ fees and expenses in the Statement of Operations.
6. Income Taxes
For tax purposes, capital losses may be carried over to offset future capital gains.
At December 31, 2018, the capital loss carryforwards were as follows:
Capital loss carryforwards not subject to expiration: | ||||
Short Term | $ | 26,173,614 | ||
Long Term | 12,955,592 | |||
|
| |||
Total capital loss carryforwards | $ | 39,129,206 | ||
|
|
During the year ended December 31, 2018, the Fund utilized $214,998,777 of capital loss carryforwards.
The tax character of distributions paid during the years ended December 31, 2018 and 2017, was as follows:
| 2018 | 2017 | |||||||
|
| |||||||
Distributions paid from ordinary income | $ | 69,558,550 | $ | 30,306,666 | ||||
|
| |||||||
At December 31, 2018, the cost of investments, net unrealized appreciation (depreciation) and undistributed ordinary income for income tax purposes were as follows:
Cost of investments | $ | 1,946,108,213 | ||
|
| |||
Unrealized appreciation | $ | 128,651,040 | ||
Unrealized depreciation | (354,105,020) | |||
|
| |||
Net unrealized appreciation (depreciation) | $ | (225,453,980) | ||
|
| |||
Distributable earnings: | ||||
Undistributed ordinary income | $ | 686,227 | ||
|
| |||
Differences between income and/or capital gains as determined on a book basis and a tax basis are primarily due to differing treatment of foreign currency transactions.
7. Investment Transactions
Purchases and sales of investments (excluding short term securities and securities sold short) for the year ended December 31, 2018, aggregated $744,776,763 and $954,906,946, respectively.
| 34 |
Annual Report | franklintempleton.com | ||
FRANKLIN MUTUAL EUROPEAN FUND
NOTES TO FINANCIAL STATEMENTS
8. Concentration of Risk
Investing in foreign securities may include certain risks and considerations not typically associated with investing in U.S. securities, such as fluctuating currency values and changing local and regional economic, political and social conditions, which may result in greater market volatility. Current political and financial uncertainty surrounding the European Union may increase market volatility and the economic risk of investing in securities in Europe. In addition, certain foreign securities may not be as liquid as U.S. securities.
9. Restricted Securities
The Fund invests in securities that are restricted under the Securities Act of 1933 (1933 Act). Restricted securities are often purchased in private placement transactions, and cannot be sold without prior registration unless the sale is pursuant to an exemption under the 1933 Act. Disposal of these securities may require greater effort and expense, and prompt sale at an acceptable price may be difficult. The Fund may have registration rights for restricted securities. The issuer generally incurs all registration costs.
At December 31, 2018, investments in restricted securities, excluding securities exempt from registration under the 1933 Act deemed to be liquid, were as follows:
| Shares | Issuer | Acquisition Date | Cost | Value | ||||||||||||
|
| |||||||||||||||
| 16,127,149 | Euro Wagon LP (Value is —% of Net Assets) | 12/08/05 - 1/02/08 | $ | 6,282,509 | $ — | |||||||||||
|
| |||||||||||||||
10. Other Derivative Information
At December 31, 2018, the Fund’s investments in derivative contracts are reflected in the Statement of Assets and Liabilities as follows:
Asset Derivatives | Liability Derivatives | |||||||||||
Derivative Contracts Not Accounted for as Hedging Instruments | Statement of Assets and Liabilities Location | Fair Value | Statement of Assets and Liabilities Location | Fair Value | ||||||||
| ||||||||||||
Foreign exchange contracts | Variation margin on futures contracts | $ | 378,793 | a | Variation margin on futures contracts | $ | — | |||||
Unrealized appreciation on OTC forward exchange contracts | 14,036,885 | Unrealized depreciation on OTC forward exchange contracts | 2,703,388 | |||||||||
|
|
|
| |||||||||
Totals | $ | 14,415,678 | $ | 2,703,388 | ||||||||
|
|
|
| |||||||||
aThis amount reflects the cumulative appreciation (depreciation) of futures contracts as reported in the Statement of Investments. Only the variation margin receivable/ payable at year end is separately reported within the Statement of Assets and Liabilities. Prior variation margin movements were recorded to cash upon receipt or payment.
For the year ended December 31, 2018, the effect of derivative contracts in the Fund’s Statement of Operations was as follows:
Derivative Contracts Not Accounted for as Hedging Instruments | Statement of Operations Location | Net Realized Gain (Loss) for the Year | Statement of Operations Location | Net Change in Unrealized Appreciation (Depreciation) for the Year | ||||||||
| ||||||||||||
Net realized gain (loss) from: | Net change in unrealized appreciation (depreciation) on: | |||||||||||
Foreign exchange contracts | Forward exchange contracts | $43,649,772 | Forward exchange contracts | $37,444,807 | ||||||||
Futures contracts | 40,356,225 | Futures contracts | 11,212,420 | |||||||||
|
|
|
| |||||||||
Totals | $84,005,997 | $48,657,227 | ||||||||||
|
|
|
| |||||||||
franklintempleton.com | Annual Report | 35 | ||
FRANKLIN MUTUAL EUROPEAN FUND
NOTES TO FINANCIAL STATEMENTS
10. Other Derivative Information(continued)
For the year ended December 31, 2018, the average month end notional amount of futures contracts represented $681,668,407. The average month end contract value of forward exchange contracts was $1,264,108,979.
See Note 1(c) regarding derivative financial instruments.
11. Holdings of 5% Voting Securities of Portfolio Companies
The 1940 Act defines “affiliated companies” to include investments in portfolio companies in which a fund owns 5% or more of the outstanding voting securities. During the year ended December 31, 2018, investments in “affiliated companies” were as follows:
| Name of Issuer | Number of Shares Held at Beginning of Year | Gross Additions | Gross Reductions | Number of Shares Held at End of Year | Value at End of Year | Dividend Income | Realized Gain (Loss) | Net Change in Unrealized Appreciation (Depreciation) | ||||||||||||||||||||||||
| Controlled Affiliatesa | ||||||||||||||||||||||||||||||||
Euro Wagon LP (Value is —% of Net Assets) | 16,127,149 | — | — | 16,127,149 | $— | $— | $— | $— | ||||||||||||||||||||||||
aIssuer in which the Fund owns 25% or more of the outstanding voting securities.
12. Credit Facility
The Fund, together with other U.S. registered and foreign investment funds (collectively, Borrowers), managed by Franklin Templeton, are borrowers in a joint syndicated senior unsecured credit facility totaling $2 billion (Global Credit Facility) which matured on February 8, 2019. This Global Credit Facility provides a source of funds to the Borrowers for temporary and emergency purposes, including the ability to meet future unanticipated or unusually large redemption requests. Effective February 8, 2019, the Borrowers renewed the Global Credit Facility for a one year term, maturing February 7, 2020, for a total of $2 billion.
Under the terms of the Global Credit Facility, the Fund shall, in addition to interest charged on any borrowings made by the Fund and other costs incurred by the Fund, pay its share of fees and expenses incurred in connection with the implementation and maintenance of the Global Credit Facility, based upon its relative share of the aggregate net assets of all of the Borrowers, including an annual commitment fee of 0.15% based upon the unused portion of the Global Credit Facility. These fees are reflected in other expenses in the Statement of Operations. During the year ended December 31, 2018, the Fund did not use the Global Credit Facility.
13. Fair Value Measurements
The Fund follows a fair value hierarchy that distinguishes between market data obtained from independent sources (observable inputs) and the Fund’s own market assumptions (unobservable inputs). These inputs are used in determining the value of the Fund’s financial instruments and are summarized in the following fair value hierarchy:
| • | Level 1 – quoted prices in active markets for identical financial instruments |
| • | Level 2 – other significant observable inputs (including quoted prices for similar financial instruments, interest rates, prepayment speed, credit risk, etc.) |
| • | Level 3 – significant unobservable inputs (including the Fund’s own assumptions in determining the fair value of financial instruments) |
The input levels are not necessarily an indication of the risk or liquidity associated with financial instruments at that level.
| 36 |
Annual Report | franklintempleton.com | ||
FRANKLIN MUTUAL EUROPEAN FUND
NOTES TO FINANCIAL STATEMENTS
A summary of inputs used as of December 31, 2018, in valuing the Fund’s assets and liabilities carried at fair value, is as follows:
| Level 1 | Level 2 | Level 3 | Total | |||||||||||||
| ||||||||||||||||
| Assets: | ||||||||||||||||
Investments in Securities:a | ||||||||||||||||
Equity Investments:b | ||||||||||||||||
Auto Components | $ | 33,985,600 | $ | 30,954,926 | $ | — | $ | 64,940,526 | ||||||||
Automobiles | 17,257,430 | 45,501,501 | — | 62,758,931 | ||||||||||||
Banks | 126,198,361 | 47,875,143 | — | 174,073,504 | ||||||||||||
Capital Markets | — | 56,706,354 | — | 56,706,354 | ||||||||||||
Chemicals | — | 28,383,062 | — | 28,383,062 | ||||||||||||
Construction Materials | — | 87,334,689 | — | 87,334,689 | ||||||||||||
Electric Utilities | — | 61,698,280 | — | 61,698,280 | ||||||||||||
Electrical Equipment | — | 33,269,875 | — | 33,269,875 | ||||||||||||
Household Durables | 4,987,203 | 39,966,999 | — | 44,954,202 | ||||||||||||
Machinery | — | 59,565,962 | — | 59,565,962 | ||||||||||||
Marine | — | 24,527,891 | — | 24,527,891 | ||||||||||||
Metals & Mining | — | 19,084,324 | — | 19,084,324 | ||||||||||||
Oil, Gas & Consumable Fuels | 104,170,440 | 19,900,372 | — | 124,070,812 | ||||||||||||
Pharmaceuticals | 53,055,959 | 60,251,061 | — | 113,307,020 | ||||||||||||
Specialty Retail | — | 43,181,897 | — | 43,181,897 | ||||||||||||
Trading Companies & Distributors | 44,271,752 | 20,928,314 | — | 65,200,066 | ||||||||||||
All Other Equity Investments | 609,514,523 | — | — | c | 609,514,523 | |||||||||||
Short Term Investments | 38,414,923 | 5,500,000 | — | 43,914,923 | ||||||||||||
|
| |||||||||||||||
Total Investments in Securities | $ | 1,031,856,191 | $ | 684,630,650 | $ | — | $ | 1,716,486,841 | ||||||||
|
| |||||||||||||||
Other Financial Instruments: | ||||||||||||||||
Futures Contracts | $ | 378,793 | $ | — | $ | — | $ | 378,793 | ||||||||
Forward Exchange Contracts | — | 14,036,885 | — | 14,036,885 | ||||||||||||
|
| |||||||||||||||
Total Other Financial Instruments | $ | 378,793 | $ | 14,036,885 | $ | — | $ | 14,415,678 | ||||||||
|
| |||||||||||||||
| Liabilities: | ||||||||||||||||
Other Financial Instruments: | ||||||||||||||||
Securities Sold Shorta | $ | 7,562,155 | $ | — | $ | — | $ | 7,562,155 | ||||||||
Forward Exchange Contracts | — | 2,703,388 | — | 2,703,388 | ||||||||||||
|
| |||||||||||||||
Total Other Financial Instruments | $ | 7,562,155 | $ | 2,703,388 | $ | — | $ | 10,265,543 | ||||||||
|
| |||||||||||||||
aFor detailed categories, see the accompanying Statement of Investments.
bIncludes common and preferred stocks.
cIncludes securities determined to have no value at December 31, 2018.
A reconciliation of assets in which Level 3 inputs are used in determining fair value is presented when there are significant Level 3 financial instruments at the beginning and/or end of the year.
14. New Accounting Pronouncements
In August 2018, the Financial Accounting Standards Board issued Accounting Standards Update (ASU)No. 2018-14, Compensation—Retirement Benefits—Defined Benefit Plans—General (Subtopic715-20): Disclosure Framework—Changes to the Disclosure Requirements for Defined Benefit Plans. The amendments in the ASU modify the disclosure requirements for employers that sponsor defined benefit pension or other postretirement plans. The ASU is effective for annual reporting periods ending after December 15, 2020. Management is currently evaluating the impact, if any, of applying this provision.
franklintempleton.com |
Annual Report |
|
37 |
| ||
FRANKLIN MUTUAL EUROPEAN FUND
NOTES TO FINANCIAL STATEMENTS
15. Subsequent Events
The Fund has evaluated subsequent events through the issuance of the financial statements and determined that no events have occurred that require disclosure other than those already disclosed in the financial statements.
Abbreviations
| Counterparty | Currency | Selected Portfolio | ||||||||
BOFA |
Bank of America Corp. |
EUR |
Euro |
ADR |
American Depositary Receipt | |||||
| BONY | The Bank of New York Mellon Corp. | GBP | British Pound | FHLB | Federal Home Loan Bank | |||||
| HSBK | HSBC Bank PLC | USD | United States Dollar | |||||||
| SSBT | State Street Bank and Trust Co., N.A. | |||||||||
| UBSW | UBS AG | |||||||||
| 38 |
Annual Report | franklintempleton.com | ||
FRANKLIN MUTUAL EUROPEAN FUND
Report of Independent Registered Public Accounting Firm
To the Board of Trustees of Franklin Mutual Series Funds and Shareholders of Franklin Mutual European Fund:
Opinion on the Financial Statements
We have audited the accompanying statement of assets and liabilities of Franklin Mutual European Fund (the “Fund”) (one of the funds constituting Franklin Mutual Series Funds), including the schedule of investments, as of December 31, 2018, and the related statement of operations for the year then ended, the statements of changes in net assets for each of the two years in the period then ended, the financial highlights for each of the five years in the period then ended and the related notes (collectively referred to as the “financial statements”). In our opinion, the financial statements present fairly, in all material respects, the financial position of Franklin Mutual European Fund (one of the funds constituting Franklin Mutual Series Funds) at December 31, 2018, the results of its operations for the year then ended, the changes in its net assets for each of the two years in the period then ended and its financial highlights for each of the five years in the period then ended, in conformity with U.S. generally accepted accounting principles.
Basis for Opinion
These financial statements are the responsibility of the Fund’s management. Our responsibility is to express an opinion on the Fund’s financial statements based on our audits. We are a public accounting firm registered with the Public Company Accounting Oversight Board (United States) (“PCAOB”) and are required to be independent with respect to the Fund in accordance with the U.S. federal securities laws and the applicable rules and regulations of the Securities and Exchange Commission and the PCAOB.
We conducted our audits in accordance with the standards of the PCAOB. Those standards require that we plan and perform the audit to obtain reasonable assurance about whether the financial statements are free of material misstatement, whether due to error or fraud. The Fund is not required to have, nor were we engaged to perform, an audit of the Fund’s internal control over financial reporting. As part of our audits, we are required to obtain an understanding of internal control over financial reporting, but not for the purpose of expressing an opinion on the effectiveness of the Fund’s internal control over financial reporting. Accordingly, we express no such opinion.
Our audits included performing procedures to assess the risks of material misstatement of the financial statements, whether due to error or fraud, and performing procedures that respond to those risks. Such procedures included examining, on a test basis, evidence regarding the amounts and disclosures in the financial statements. Our procedures included confirmation of securities owned as of December 31, 2018, by correspondence with the custodian and brokers or by other appropriate auditing procedures where replies from others were not received. Our audits also included evaluating the accounting principles used and significant estimates made by management, as well as evaluating the overall presentation of the financial statements. We believe that our audits provide a reasonable basis for our opinion.

We have served as the auditor of one or more Franklin investment companies since 1987.
Boston, Massachusetts
February 20, 2019
franklintempleton.com | Annual Report | 39 | ||||
FRANKLIN MUTUAL EUROPEAN FUND
Under Section 854(b)(1)(B) of the Internal Revenue Code, the Fund hereby reports the maximum amount allowable but no less than $76,112,927 as qualified dividends for purposes of the maximum rate under Section 1(h)(11) of the Internal Revenue Code for the fiscal year ended December 31, 2018. Distributions, including qualified dividend income, paid during calendar year 2018 will be reported to shareholders on Form1099-DIV bymid-February 2019. Shareholders are advised to check with their tax advisors for information on the treatment of these amounts on their individual income tax returns.
At December 31, 2018, more than 50% of the Fund’s total assets were invested in securities of foreign issuers. In most instances, foreign taxes were withheld from income paid to the Fund on these investments. As shown in the table below, the Fund hereby reports to shareholders the foreign source income and foreign taxes paid, pursuant to Section 853 of the Internal Revenue Code. This written statement will allow shareholders of record on December 20, 2018, to treat their proportionate share of foreign taxes paid by the Fund as having been paid directly by them. The shareholder shall consider these amounts as foreign taxes paid in the tax year in which they receive the Fund distribution.
The following table provides a detailed analysis of foreign tax paid, foreign source income and foreign source qualified dividends as reported by the Fund, to Class Z, Class A, Class C, Class R and Class R6 shareholders of record.
| Class | Foreign Tax Paid Per Share | Foreign Source Income Per Share | Foreign Source Qualified Dividends Per Share | |||||||||
Class Z | $0.0842 | $0.6717 | $0.6095 | |||||||||
Class A | $0.0842 | $0.6353 | $0.5764 | |||||||||
Class C | $0.0842 | $0.4191 | $0.3802 | |||||||||
Class R | $0.0842 | $0.5994 | $0.5438 | |||||||||
Class R6 | $0.0842 | $0.6916 | $0.6274 | |||||||||
Foreign Tax Paid Per Share (Column 1) is the amount per share available to you, as a tax credit (assuming you held your shares in the Fund for a minimum of 16 days during the31-day period beginning 15 days before theex-dividend date of the Fund’s distribution to which the foreign taxes relate), or, as a tax deduction.
Foreign Source Income Per Share (Column 2) is the amount per share of income dividends attributable to foreign securities held by the Fund, plus any foreign taxes withheld on these dividends. The amounts reported include foreign source qualified dividends that have not been adjusted for the rate differential applicable to such dividend income.1
Foreign Source Qualified Dividends Per Share (Column 3) is the amount per share of foreign source qualified dividends, plus any foreign taxes withheld on these dividends. These amounts represent the portion of the Foreign Source Income reported to you in column 2 that were derived from qualified foreign securities held by the Fund.1
Bymid-February 2019, shareholders will receive Form1099-DIV which will include their share of taxes paid and foreign source income distributed during the calendar year 2018. The Foreign Source Income reported on Form1099-DIV has not been adjusted for the rate differential on foreign source qualified dividend income. Shareholders are advised to check with their tax advisors for information on the treatment of these amounts on their 2018 individual income tax returns.
1Qualified dividends are taxed at reduced long term capital gains tax rates. In determining the amount of foreign tax credit that may be applied against the U.S. tax liability of individuals receiving foreign source qualified dividends, adjustments may be required to the foreign tax credit limitation calculation to reflect the rate differential applicable to such dividend income. The rules however permit certain individuals to elect not to apply the rate differential adjustments for capital gains and/or dividends for any taxable year. Please consult your tax advisor and the instructions to Form 1116 for more information.
| 40 |
Annual Report | franklintempleton.com |
FRANKLIN MUTUAL SERIES FUNDS
The name, year of birth and address of the officers and board members, as well as their affiliations, positions held with the Trust, principal occupations during at least the past five years and number of U.S. registered portfolios overseen in the Franklin Templeton Investments fund complex, are shown below. Generally, each board member serves until that person’s successor is elected and qualified.
Independent Board Members
Name, Year of Birth
| Position
| Length of
| Number of Portfolios in
| Other Directorships Held During
| ||||
| Edward I. Altman, Ph.D. (1941) c/o Franklin Mutual Advisers, LLC 101 John F. Kennedy Parkway Short Hills, NJ 07078-2716 | Trustee | Since 1987 | 14 | None | ||||
| Principal Occupation During at Least the Past 5 Years: | ||||||||
Max L. Heine Professor of Finance, Emeritus and Director of The Credit and Debt Markets Research Program, Salomon Center, Stern School of Business, New York University; editor and author of numerous financial publications; financial consultant; an adviser to numerous financial and publishing organizations; andformerly, Vice Director, Salomon Center, Stern School of Business, New York University.
| ||||||||
| Ann Torre Bates (1958) c/o Franklin Mutual Advisers, LLC 101 John F. Kennedy Parkway Short Hills, NJ 07078-2716 | Trustee | Since 1995 | 38 | Ares Capital Corporation (specialty finance company) (2010-present), United Natural Foods, Inc. (distributor of natural, organic and specialty foods) (2013-present), Allied Capital Corporation (financial services) (2003-2010), SLM Corporation (Sallie Mae) (1997-2014) and Navient Corporation (loan management, servicing and asset recovery) (2014-2016). | ||||
| Principal Occupation During at Least the Past 5 Years: | ||||||||
Director of various companies; andformerly, Executive Vice President and Chief Financial Officer, NHP Incorporated (manager of multifamily housing) (1995-1997); and Vice President and Treasurer, US Airways, Inc. (until 1995).
| ||||||||
| Burton J. Greenwald (1929) c/o Franklin Mutual Advisers, LLC 101 John F. Kennedy Parkway Short Hills, NJ 07078-2716 | Trustee and Vice Chairman | Trustee since 2002 and Vice Chairman since 2015 | 14 | Franklin Templeton Emerging Markets Debt Opportunities Fund PLC (1999-present) and Fiduciary International Ireland Limited (1999-2015). | ||||
| Principal Occupation During at Least the Past 5 Years: | ||||||||
Managing Director, B.J. Greenwald Associates (management consultants to the financial services industry); andformerly, Chairman, Fiduciary Trust International Funds; Executive Vice President, L.F. Rothschild Fund Management, Inc.; President and Director, Merit Mutual Funds; President, Underwriting Division and Director, National Securities & Research Corporation; Governor, Investment Company Institute; and Chairman, ICI Public Information Committee.
| ||||||||
| Jan Hopkins Trachtman (1947) c/o Franklin Mutual Advisers, LLC 101 John F. Kennedy Parkway Short Hills, NJ 07078-2716 | Trustee | Since 2009 | 14 | FinTech Acquisition Corp. III (special purpose fintech acquisition company) (2018-present) | ||||
| Principal Occupation During at Least the Past 5 Years: | ||||||||
President and Founder, The Jan Hopkins Group (communications consulting firm); serves on Advisory Board of Knight Bagehot Fellowship; andformerly, President, Economic Club of New York (2007-2015); Anchor/Correspondent, CNN Financial News (until 2003); Managing Director and Head of Client Communications, Citigroup Private Bank (until 2005);Off-Air reporter, ABC News’ World News Tonight; and Editor, CBS Network News.
| ||||||||
| Keith Mitchell (1954) c/o Franklin Mutual Advisers, LLC 101 John F. Kennedy Parkway Short Hills, NJ 07078-2716 | Trustee | Since 2009 | 14 | None | ||||
| Principal Occupation During at Least the Past 5 Years: | ||||||||
Director of various boards of asset management firms; andformerly, Managing Member, Mitchell, Hartley & Bechtel Advisers, LLC (formerly, Mitchell Advisers, LLC) (advisory firm) (2003-2015) and Managing Director, Putman Lovell NBF.
| ||||||||
franklintempleton.com | Annual Report | 41 | ||||
FRANKLIN MUTUAL SERIES FUNDS
Independent Board Members(continued)
Name, Year of Birth
| Position
| Length of
| Number of Portfolios in
| Other Directorships Held During
| ||||
| David W. Niemiec (1949) c/o Franklin Mutual Advisers, LLC 101 John F. Kennedy Parkway Short Hills, NJ 07078-2716 | Trustee | Since 2015 | 38 | Hess Midstream Partners LP (oil and gas midstream infrastructure) (2017-present). | ||||
| Principal Occupation During at Least the Past 5 Years: | ||||||||
Advisor, Saratoga Partners (private equity fund); andformerly, Managing Director, Saratoga Partners (1998-2001) and SBC Warburg Dillon Read (investment banking) (1997-1998); Vice Chairman, Dillon, Read & Co. Inc. (investment banking) (1991-1997); and Chief Financial Officer, Dillon, Read & Co. Inc. (1982-1997).
| ||||||||
| Charles Rubens II (1930) c/o Franklin Mutual Advisers, LLC 101 John F. Kennedy Parkway Short Hills, NJ 07078-2716 | Trustee | Since 1998 | 14 | None | ||||
| Principal Occupation During at Least the Past 5 Years: | ||||||||
Private investor and president ofnon-profit organizations; andformerly, an executive of Time, Inc.; and Trustee of Colorado College.
| ||||||||
| Robert E. Wade (1946) c/o Franklin Mutual Advisers, LLC 101 John F. Kennedy Parkway Short Hills, NJ 07078-2716 | Trustee and Chairman of the Board | Trustee since 1993 and Chairman of the Board since 2005 | 38 | El Oro Ltd (investments) (2003-present). | ||||
| Principal Occupation During at Least the Past 5 Years: | ||||||||
Attorney at law engaged in private practice as a sole practitioner (1972-2008) and member of various boards.
| ||||||||
| Gregory H. Williams (1943) c/o Franklin Mutual Advisers, LLC 101 John F. Kennedy Parkway Short Hills, NJ 07078-2716 | Trustee | Since 2015 | 14 | None | ||||
| Principal Occupation During at Least the Past 5 Years: | ||||||||
Private investor; Consultant; andformerly, President, University of Cincinnati (2009-2012); President, The City College of New York (2001-2009); Dean, College of Law, Ohio State University (1993-2001); and Associate Vice President, Academic Affairs and Professor of Law, University of Iowa (1977-1993).
| ||||||||
Interested Board Members and Officers
Name, Year of Birth
| Position
| Length of
| Number of Portfolios in
| Other Directorships Held During
| ||||
| **Gregory E. Johnson (1961) One Franklin Parkway San Mateo, CA 94403-1906 | Trustee | Since 2007 | 150 | None | ||||
| Principal Occupation During at Least the Past 5 Years: | ||||||||
Chairman of the Board, Member – Office of the Chairman, Director and Chief Executive Officer, Franklin Resources, Inc.; officer and/or director or trustee, as the case may be, of some of the other subsidiaries of Franklin Resources, Inc. and of 42 of the investment companies in Franklin Templeton Investments; Vice Chairman, Investment Company Institute; andformerly, President, Franklin Resources, Inc. (1994-2015).
| ||||||||
| **Peter A. Langerman (1955) c/o Franklin Mutual Advisers, LLC 101 John F. Kennedy Parkway Short Hills, NJ 07078-2716 | Trustee, President, and Chief Executive Officer – Investment Management | Trustee since 2007, President, and Chief Executive Officer – Investment Management since 2005 | 7 | American International Group, Inc. (AIG) Credit Facility Trust (2010-2011). | ||||
| Principal Occupation During at Least the Past 5 Years: | ||||||||
Chairman of the Board, Chief Executive Officer and President, Franklin Mutual Advisers, LLC; President and Chief Investment Officer, Franklin Advisory Services, LLC; and officer and/or director, as the case may be, of three of the investment companies in Franklin Templeton Investments.
| ||||||||
| 42 |
Annual Report | franklintempleton.com | ||
FRANKLIN MUTUAL SERIES FUNDS
Interested Board Members and Officers(continued)
Name, Year of Birth
| Position
| Length of
| Number of Portfolios in
| Other Directorships Held During
| ||||
| Alison E. Baur (1964) One Franklin Parkway San Mateo, CA 94403-1906 | Vice President | Since 2012 | Not Applicable | Not Applicable | ||||
| Principal Occupation During at Least the Past 5 Years: | ||||||||
Deputy General Counsel, Franklin Templeton Investments; and officer of some of the other subsidiaries of Franklin Resources, Inc. and of 44 of the investment companies in Franklin Templeton Investments.
| ||||||||
| Aliya S. Gordon (1973) One Franklin Parkway San Mateo, CA 94403-1906 | Vice President | Since 2009 | Not Applicable | Not Applicable | ||||
| Principal Occupation During at Least the Past 5 Years: | ||||||||
Senior Associate General Counsel, Franklin Templeton Investments; and officer of 44 of the investment companies in Franklin Templeton Investments.
| ||||||||
| Steven J. Gray (1955) One Franklin Parkway San Mateo, CA 94403-1906 | Vice President and Secretary | Vice President since 2009 and Secretary since 2005 | Not Applicable | Not Applicable | ||||
| Principal Occupation During at Least the Past 5 Years: | ||||||||
Senior Associate General Counsel, Franklin Templeton Investments; Vice President, Franklin Templeton Distributors, Inc. and FASA, LLC; and officer of 44 of the investment companies in Franklin Templeton Investments.
| ||||||||
| Matthew T. Hinkle (1971) One Franklin Parkway San Mateo, CA 94403-1906 | Chief Executive Officer – Finance and Administration | Since 2017 | Not Applicable | Not Applicable | ||||
| Principal Occupation During at Least the Past 5 Years: | ||||||||
Senior Vice President, Franklin Templeton Services, LLC; officer of 44 of the investment companies in Franklin Templeton Investments; andformerly, Vice President, Global Tax (2012-April 2017) and Treasurer/Assistant Treasurer, Franklin Templeton Investments (2009-2017).
| ||||||||
| Robert G. Kubilis (1973) 300 S.E. 2nd Street Fort Lauderdale, FL 33301-1923 | Chief Financial Officer, Chief Accounting Officer and Treasurer | Since 2012 | Not Applicable | Not Applicable | ||||
| Principal Occupation During at Least the Past 5 Years: | ||||||||
Treasurer, U.S. Fund Administration & Reporting, Franklin Templeton Investments; and officer of 16 of the investment companies in Franklin Templeton Investments.
| ||||||||
| Robert Lim (1948) One Franklin Parkway San Mateo, CA 94403-1906 | Vice President –AML Compliance | Since 2016 | Not Applicable | Not Applicable | ||||
| Principal Occupation During at Least the Past 5 Years: | ||||||||
Vice President, Franklin Templeton Companies, LLC; Chief Compliance Officer, Franklin Templeton Distributors, Inc. and Franklin Templeton Investor Services, LLC; and officer of 44 of the investment companies in Franklin Templeton Investments.
| ||||||||
| Kimberly H. Novotny (1972) 300 S.E. 2nd Street Fort Lauderdale, FL 33301-1923 | Vice President | Since 2013 | Not Applicable | Not Applicable | ||||
| Principal Occupation During at Least the Past 5 Years: | ||||||||
Associate General Counsel, Franklin Templeton Investments; Vice President and Corporate Secretary, Fiduciary Trust International of the South; Vice President, Templeton Investment Counsel, LLC; Assistant Secretary, Franklin Resources, Inc.; and officer of 44 of the investment companies in Franklin Templeton Investments.
| ||||||||
franklintempleton.com | Annual Report | 43 | ||||
FRANKLIN MUTUAL SERIES FUNDS
Interested Board Members and Officers(continued)
Name, Year of Birth and Address | Position | Length of Time Served | Number of Portfolios in Fund Complex Overseen by Board Member* | Other Directorships Held During at Least the Past 5 Years | ||||
| Robert C. Rosselot (1960) | Chief | Since 2013 | Not Applicable | Not Applicable | ||||
| 300 S.E. 2nd Street Fort Lauderdale, FL 33301-1923 | Compliance Officer | |||||||
| Principal Occupation During at Least the Past 5 Years: | ||||||||
| Director, Global Compliance, Franklin Templeton Investments; Vice President, Franklin Templeton Companies, LLC; officer of 44 of the investment companies in Franklin Templeton Investments; andformerly, Senior Associate General Counsel, Franklin Templeton Investments (2007-2013); and Secretary and Vice President, Templeton Group of Funds (2004-2013). | ||||||||
| Navid J. Tofigh (1972) | Vice President | Since 2015 | Not Applicable | Not Applicable | ||||
| One Franklin Parkway San Mateo, CA 94403-1906 | ||||||||
| Principal Occupation During at Least the Past 5 Years: | ||||||||
Associate General Counsel, Franklin Templeton Investments; and officer of 44 of the investment companies in Franklin Templeton Investments.
| ||||||||
| Craig S. Tyle (1960) | Vice President | Since 2005 | Not Applicable | Not Applicable | ||||
| One Franklin Parkway San Mateo, CA 94403-1906 | ||||||||
| Principal Occupation During at Least the Past 5 Years: | ||||||||
| General Counsel and Executive Vice President, Franklin Resources, Inc.; and officer of some of the other subsidiaries of Franklin Resources, Inc. and of 44 of the investment companies in Franklin Templeton Investments. | ||||||||
| Lori A. Weber (1964) | Vice President | Since 2011 | Not Applicable | Not Applicable | ||||
| 300 S.E. 2nd Street Fort Lauderdale, FL 33301-1923 | ||||||||
| Principal Occupation During at Least the Past 5 Years: | ||||||||
| Senior Associate General Counsel, Franklin Templeton Investments; Assistant Secretary, Franklin Resources, Inc.; Vice President and Secretary, Templeton Investment Counsel, LLC; and officer of 44 of the investment companies in Franklin Templeton Investments. | ||||||||
| 44 |
Annual Report | franklintempleton.com | ||
FRANKLIN MUTUAL SERIES FUNDS
*We base the number of portfolios on each separate series of the U.S. registered investment companies within the Franklin Templeton Investments fund complex. These portfolios have a common investment manager or affiliated investment managers.
**Gregory E. Johnson is considered to be an interested person of the Fund under the federal securities laws due to his position as an officer and director of Franklin Resources, Inc. (Resources), which is the parent company of the Fund’s investment manager and distributor. Peter A. Langerman is considered to be an interested person of the Fund under the federal securities laws due to his position as an officer of Franklin Mutual Advisers, LLC, which is the Fund’s investment manager.
Note 1: Officer information is current as of the date of this report. It is possible that after this date, information about officers may change.
The Sarbanes-Oxley Act of 2002 and Rules adopted by the U.S. Securities and Exchange Commission require the Fund to disclose whether the Fund’s Audit Committee includes at least one member who is an audit committee financial expert within the meaning of such Act and Rules. The Fund’s Board has determined that there is at least one such financial expert on the Audit Committee and has designated each of Edward I. Altman, Ph.D., Ann Torre Bates and David W. Niemiec as an audit committee financial expert. The Board believes that Messrs. Altman and Niemiec and Ms. Bates qualify as such an expert in view of their extensive business background and experience. Mr. Altman has served as a member of the Fund Audit Committee since 1987. He currently serves as a Max L. Hine Professor of Finance, Emeritus and Director of The Credit and Debt Markets Research Program, Salomon Center, Stern School of Business, New York University. Ms. Bates has served as a member of the Fund Audit Committee since 1995. She currently serves as a director of Ares Capital Corporation (2010-present) and United Natural Foods, Inc. (2013-present) and was formerly a director of Navient Corporation from 2014 to 2016, SLM Corporation from 1997 to 2014 and Allied Capital Corporation from 2003 to 2010, Executive Vice President and Chief Financial Officer of NHP Incorporated from 1995 to 1997 and Vice President and Treasurer of US Airways, Inc. until 1995. Mr. Niemiec has served as a member of the Fund Audit Committee since 2015, currently serves as an Advisor to Saratoga Partners and was formerly its Managing Director from 1998 to 2001 and serves as a director of Hess Midstream Partners LP (2017-present). Mr. Niemiec was formerly a director of Emeritus Corporation from 1999 to 2010 and OSI Pharmaceuticals, Inc. from 2006 to 2010, Managing Director of SBC Warburg Dillon Read from 1997 to 1998, and was Vice Chairman from 1991 to 1997 and Chief Financial Officer from 1982 to 1997 of Dillon, Read & Co. Inc. As a result of such background and experience, the Board believes that Messrs. Altman and Niemiec and Ms. Bates have each acquired an understanding of generally accepted accounting principles and financial statements, the general application of such principles in connection with the accounting estimates, accruals and reserves, and analyzing and evaluating financial statements that present a breadth and level of complexity of accounting issues generally comparable to those of the Fund, as well as an understanding of internal controls and procedures for financial reporting and an understanding of audit committee functions. Messrs. Altman and Niemiec and Ms. Bates are independent Board members as that term is defined under the applicable U.S. Securities and Exchange Commission Rules and Releases.
The Statement of Additional Information (SAI) includes additional information about the board members and is available, without charge, upon request. Shareholders may call (800) DIALBEN/342-5236 to request the SAI.
franklintempleton.com | Annual Report | 45 | ||||
FRANKLIN MUTUAL SERIES FUNDS
FRANKLIN MUTUAL EUROPEAN FUND
Proxy Voting Policies and Procedures
The Fund’s investment manager has established Proxy Voting Policies and Procedures (Policies) that the Fund uses to determine how to vote proxies relating to portfolio securities. Shareholders may view the Fund’s complete Policies online at franklintempleton.com. Alternatively, shareholders may request copies of the Policies free of charge by calling the Proxy Group collect at (954)527-7678 or by sending a written request to: Franklin Templeton Companies, LLC, 300 S.E. 2nd Street, Fort Lauderdale, FL 33301, Attention: Proxy Group. Copies of the Fund’s proxy voting records are also made available online at franklintempleton.com and posted on the U.S. Securities and Exchange Commission’s website at sec.gov and reflect the most recent12-month period ended June 30.
Quarterly Statement of Investments
The Trust, on behalf of the Fund, files a complete statement of investments with the U.S. Securities and Exchange Commission for the first and third quarters for each fiscal year on FormN-Q. Shareholders may view the filed FormN-Q by visiting the Commission’s website at sec.gov. The filed form may also be viewed and copied at the Commission’s Public Reference Room in Washington, DC. Information regarding the operations of the Public Reference Room may be obtained by calling(800) SEC-0330.
Householding of Reports and Prospectuses
You will receive the Fund’s financial reports every six months as well as an annual updated summary prospectus (prospectus available upon request). To reduce Fund expenses, we try to identify related shareholders in a household and send only one copy of the financial reports and summary prospectus. This process, called “householding,” will continue indefinitely unless you instruct us otherwise. If you prefer not to have these documents householded, please call us at (800)632-2301. At any time you may view current prospectuses/summary prospectuses and financial reports on our website. If you choose, you may receive these documents through electronic delivery.
| 46 |
Annual Report | franklintempleton.com | ||
This page intentionally left blank.
This page intentionally left blank.
 | Annual Report and Shareholder Letter Franklin Mutual European Fund
Investment Manager Franklin Mutual Advisers, LLC
Distributor Franklin Templeton Distributors, Inc. (800) DIAL BEN®/342-5236 franklintempleton.com
Shareholder Services (800)632-2301 - (Class A, C, R & R6) (800)448-FUND - (Class Z) | |||||||
Authorized for distribution only when accompanied or preceded by a summary prospectus and/or prospectus. Investors should carefully consider a fund’s investment goals, risks, charges and expenses before investing. A prospectus contains this and other information; please read it carefully before investing.
To help ensure we provide you with quality service, all calls to and from our service areas are monitored and/or recorded. | ||||||||
| © 2019 Franklin Templeton Investments. All rights reserved. | 478 A 02/19 | |||||||
 | Annual Report and Shareholder Letter
December 31, 2018 |
Internet Delivery of Fund Reports Unless You Request Paper Copies: Effective January 1, 2021, as permitted by the SEC, paper copies of the Fund’s shareholder reports will no longer be sent by mail, unless you specifically request them from the Fund or your financial intermediary. Instead, the reports will be made available on a website, and you will be notified by mail each time a report is posted and provided with a website link to access the report.
If you already elected to receive shareholder reports electronically, you will not be affected by this change and you need not take any action. If you have not signed up for electronic delivery, we would encourage you to join fellow shareholders who have. You may elect to receive shareholder reports and other communications electronically from the Fund by calling(800) 632-2301 or by contacting your financial intermediary.
You may elect to continue to receive paper copies of all your future shareholder reports free of charge by contacting your financial intermediary or, if you invest directly with a Fund, calling(800) 632-2301 to let the Fund know of your request. Your election to receive reports in paper will apply to all funds held in your account.
Franklin Templeton
Successful investing begins with ambition. And achievement only comes when you reach for it. That’s why we continually strive to deliver better outcomes for investors. No matter what your goals are, our deep, global investment expertise allows us to offer solutions that can help.
During our more than 70 years of experience, we’ve managed through all kinds of markets—up, down and those in between. We’re always preparing for what may come next. It’s because of this, combined with our strength as one of the world’s largest asset managers that we’ve earned the trust of millions of investors around the world.
Dear Franklin Mutual Quest Fund Shareholder:
Investors started 2018 seemingly with the wind at their back. The primary tailwinds were strong corporate earnings growth in most developed markets, healthy consumer and business investment spending, and the positive effect of major U.S. tax cuts. In addition, the global economy continued its steady expansion since the financial crisis of 2008–2009. Unemployment continued to decline in the U.S. and other developed markets, while U.S. wage growth showed some signs of accelerating. As a result, equity markets reached new highs in August and September. However, volatility and market downturns soon made their mark on 2018. As measured by the Chicago Board Options Exchange Volatility Index (VIX), 2017 was the least volatile year on record for the Standard & Poor’s 500® Index (S&P 500®), but the VIX surged in February 2018 and jumped again in October and December 2018. Heightened trade tensions between the U.S. and China, geopolitical events in Europe and a growing belief that corporate earnings and economic growth will likely decelerate in 2019 hindered equity markets. A flattening U.S. Treasury yield curve, wider credit spreads and growing market concern that the U.S. Federal Reserve may raise interest rates too aggressively were also important drivers of market turbulence. For the period ended December 31, 2018, U.S. stocks, as measured by the S&P 500, had a-4.38% total return.1 Stocks in global developed markets, as measured by the MSCI World Index (USD), had a-8.20% total return, while investment-grade bonds, as measured by the Bloomberg Barclays U.S. Aggregate Bond Index, posted a +0.01% total return.1
While equity markets were broadly down for the year, there were pockets of positive performance concentrated in areas of growth and innovation, such as software, information technology services and segments of the health care sector. It is no surprise, therefore, that growth stocks managed to perform better than value stocks during the period. The MSCI World Growth Index (USD) had a-6.42% total return, while the MSCI World Value Index (USD) had a-10.09% total return.1
The return of volatility is an appropriate reminder that securities markets are dynamic. We believe active, professional investment management serves investors well since market volatility is more the norm than uninterrupted positive returns. Valuation is an essential factor in our analysis and we always ask ourselves if current and potential investments represent an attractive balance of risk and reward. We remain committed to abottom-up stock-picking process that is disciplined and driven by rigorous fundamental analysis that attempts to limit downside risk. In our view, investing in underappreciated and misunderstood companies with identifiable catalysts for unlocking shareholder value can offer significant upside potential as well as a degree of downside protection.
We also recognize the important role of financial advisors in today’s markets and encourage investors to continue to seek their advice. Amid changing markets and economic conditions, we are confident investors with a well-diversified portfolio and
1. Source: Morningstar.
See www.franklintempletondatasources.com for additional data provider information.
| Not FDIC Insured | May Lose Value | No Bank Guarantee |
franklintempleton.com | Not part of the annual report | 1 | ||||
a patient, long-term outlook will be well positioned for the years ahead.
On the following pages, the Fund’s portfolio management team reviews investment decisions that pertain to performance during the past 12 months in light of the economic environment and other factors. Please remember all securities markets fluctuate, as do mutual fund share prices.
We thank you for investing with Franklin Templeton, welcome your questions and comments, and look forward to continuing to serve your investment needs in the years ahead.
Sincerely,

Peter A. Langerman
Chairman, President and Chief Executive Officer
Franklin Mutual Advisers, LLC
This letter reflects our analysis and opinions as of December 31, 2018, unless otherwise indicated. The information is not a complete analysis of every aspect of any market, country, industry, security or fund. Statements of fact are from sources considered reliable.
Visitfranklintempleton.comfor fund updates, to access your account, or to find helpful financial planning tools.
| 2 |
Not part of the annual report | franklintempleton.com | ||||
This annual report for Franklin Mutual Quest Fund covers the fiscal year ended December 31, 2018.
Your Fund’s Goal and Main Investments
The Fund seeks capital appreciation, which may occasionally be short term, with income as a secondary goal. Under normal market conditions, the Fund invests substantially to primarily in equity securities of U.S. and foreign companies that the investment manager believes are available at market prices less than their intrinsic value. The equity securities in which the Fund invests are primarily common stock, with a current focus onmid- andlarge-cap companies. To a lesser extent, the Fund also invests in merger arbitrage securities and the debt and equity of distressed companies. The Fund may invest a substantial portion, potentially up to 100% of its assets, in foreign securities, which may include sovereign debt and participations in foreign government debt. The Geographic Composition bar chart on this page lists the leading countries where the Fund invests.
Performance Overview
The Fund’s Class Z shares had a-7.14% cumulative total return for the 12 months ended December 31, 2018. In comparison, the Fund’s benchmark, the MSCI World Index (USD), which tracks stock performance in global developed markets, had a total return of-8.20%.1 Also for comparison, the Fund’s secondary benchmark, the Bloomberg Barclays U.S. Corporate High Yield Index, which measures the U.S. corporate market ofnon-investment grade,fixed-rate corporate bonds, defined as the middle or lower ratings of Moody’s, Fitch and Standard & Poor’s, had a-2.08% total return.1 You can find more of the Fund’s performance data in the Performance Summary beginning on page 10.
Geographic Composition*
Based on Total Net Assets as of 12/31/18
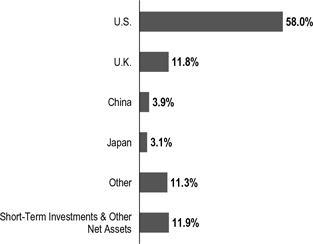
*Figures are stated as a percentage of total and may not equal 100% or may be negative due to rounding, use of any derivatives, unsettled trades or other factors.
Performance data represent past performance, which does not guarantee future results. Investment return and principal value will fluctuate, and you may have a gain or loss when you sell your shares. Current performance may differ from figures shown. For most recentmonth-end performance, go tofranklintempleton.comor call(800) 342-5236.
Economic and Market Overview
The global economy expanded during the 12 months under review, despite weakness in certain regions. Global developed and emerging market stocks were aided at certain points during the period by higher crude oil prices, upbeat economic data, easing trade tensions and encouraging corporate earnings reports, as well as indications of a slower pace of interest-rate increases from the U.S. Federal Reserve (Fed).
However, various factors weighed on global markets during the period, including concerns about tighter regulation of technology companies, political uncertainties in the U.S. and the European Union, and major central banks’ interest-rate path and unwinding of monetary stimulus measures. Markets were
1. Source: Morningstar.
The indexes are unmanaged and include reinvestment of any income or distributions. They do not reflect any fees, expenses or sales charges. One cannot invest directly in an index, and an index is not representative of the Fund’s portfolio.
The dollar value, number of shares or principal amount, and names of all portfolio holdings are listed in the Fund’s Statement of Investments (SOI). The SOI begins on page 19.
franklintempleton.com | Annual Report | 3 | ||||
FRANKLIN MUTUAL QUEST FUND
further pressured by U.S. trade disputes with its allies and China, and their impact on global growth and corporate earnings. In this environment, global stocks, as measured by the MSCI All Country World Index, had a-8.93% total return for the 12 months ended December 31, 2018.1
The U.S. economy grew during the12-month period. After moderating for three consecutive quarters, the economy grew faster in 2018’s second quarter, driven by consumer spending, business investment, exports and government spending. However, growth moderated in the third quarter due to declines in exports and housing investment. The unemployment rate declined from 4.1% in December 2017 to 3.9% atperiod-end.2 Annual inflation, as measured by the Consumer Price Index, decreased from 2.1% in December 2017 to 1.9% atperiod-end.2 The Fed raised its target range for the federal funds rate four times during the period, to 2.25%–2.50%, and continued reducing its balance sheet as part of an ongoing plan to normalize monetary policy. At its December meeting, the Fed reduced the projected 2019 rate increases to two, compared to three projected previously.
In Europe, the U.K.’s quarterly economic growth moderated in 2018’s first quarter, but accelerated in 2018’s second and third quarters. The Bank of England raised its key policy rate once during the review period. After moderating in 2018’s first quarter, the eurozone’s quarterly growth remained stable in the second quarter, but eased in the third quarter. The bloc’s annual inflation rate ended the period higher than in December 2017. The European Central Bank (ECB) kept its benchmark interest rate unchanged during the period. In December 2018, the ECB confirmed its plan to conclude its bond purchase program at the end of 2018 and reiterated it expects key interest rates to remain unchanged through the summer of 2019.
In Asia, Japan’s quarterly gross domestic product (GDP) grew in 2018’s second quarter, following a contraction in the first quarter, but contracted again in the third quarter. The Bank of Japan left its benchmark interest rate unchanged during the period and continued its monetary stimulus measures.
In emerging markets, Brazil’s quarterly GDP growth remained stable in 2018’s first and second quarters, but accelerated in the third quarter. The Central Bank of Brazil lowered its benchmark interest rate twice during the period. Russia’s annual GDP growth rate accelerated in 2018’s first and second quarters, but moderated in the third quarter. After lowering its key rate twice early in the period, the Bank of Russia raised it
twice in the period’s second half to curtail inflation risks. China’s annual GDP grew at a stable rate in 2018’s first quarter, but it moderated in the second and third quarters. The People’s Bank of China left its benchmark interest rate unchanged during the period, but it took measures to improve financial liquidity to mitigate the negative effects of the U.S.-China trade dispute and support economic growth. Overall, emerging market stocks, as measured by the MSCI Emerging Markets Index, had a-14.25% total return during the period.1
Investment Strategy
At Franklin Mutual Series, we are committed to our distinctive value approach to investing, which we believe can generate above-average risk-adjusted returns over time for our shareholders. Our major investment strategy is investing in undervalued stocks. When selecting undervalued equities, we are attracted to what we believe are fundamentally strong companies with healthy balance sheets, high-quality assets, substantial free cash flow and shareholder-oriented management teams and whose stocks are trading at discounts to our assessment of the companies’ intrinsic or business value. We also look for asset-rich companies whose shares may be trading at depressed levels due to concerns over short-term earnings disappointments, litigation, management strategy or other perceived negatives. This strict value approach is not only intended to improve the likelihood of upside potential, but also reduces the risk of substantial declines, in our opinion. While the vast majority of our undervalued equity investments are made in publicly traded companies globally, we may invest occasionally in privately held companies as well.
To a lesser extent, we complement this more traditional investment strategy with two others. One is distressed investing, a highly specialized field that has proven quite profitable during certain periods over the years. Distressed investing is complex and can take many forms. The most common distressed investment the Fund undertakes is the purchase of financially troubled or bankrupt companies’ debt at a substantial discount to face value. After the financially distressed company is reorganized, often in bankruptcy court, the old debt is typically replaced with new securities issued by the financially stronger company.
The other piece of our investment strategy is participating in arbitrage situations, another highly specialized field. When companies announce proposed mergers or takeovers,
2. Source: U.S. Bureau of Labor Statistics.
4 | Annual Report | franklintempleton.com | ||
FRANKLIN MUTUAL QUEST FUND
commonly referred to as “deals,” the target company may trade at a discount to the bid it ultimately accepts. One form of arbitrage involves purchasing the target company’s stock when it is trading below the value we believe it would receive in a deal. In keeping with our commitment to a relatively conservative investment approach, we typically focus our arbitrage efforts on announced deals, and avoid rumored deals or other situations we consider relatively risky. The current percentages of the Fund’s assets devoted to these investment strategies are listed in the Asset Allocation bar chart on this page. In addition, it is our practice to hedge the Fund’s currency exposure when we deem it advantageous for our shareholders.
What is meant by “hedge”?
To hedge an investment is to take a position intended to offset potential losses/gains that may be incurred by a companion financial instrument.
| ||
Manager’s Discussion
In 2018, corporate profits in the U.S. and other developed markets continued their impressive year-over-year growth. In addition, labor markets showed further improvement, consumer spending was solid, and U.S. corporate tax reforms encouraged companies to buy back more stock, raise dividends and increase capital expenditures. Those positive fundamentals were periodically overshadowed by political and economic concerns, particularly in the final three months of the year.
As major U.S. equity markets established newall-time highs in 2018, overall U.S. equity market valuations (e.g.,price-to-earnings,price-to-book orprice-to-sales) became increasingly unattractive, in our analysis. The equity marketsell-off in the fourth quarter helped to return valuations to more reasonable levels. Thesell-off and rise in volatility yielded an opportunity for us to seek out stocks with strong corporate fundamentals and valuations whose risk/reward profiles seemed to us to have become more favorable.
In 2019, policy events may have considerable influence, for better or worse, on economic growth, investor sentiment and financial market performance and volatility. Markets are likely to be particularly sensitive to developments in U.S.-China trade relations, monetary policy moves by the Fed and other major central banks, oil production decisions by OPEC (The Organization of the Petroleum Exporting Countries) and other oil producing countries, the outcome of Brexit, China’s response to its slowing economy and potential political discord in Washington, D.C.
Asset Allocation*
Based on Total Net Assets as of 12/31/18
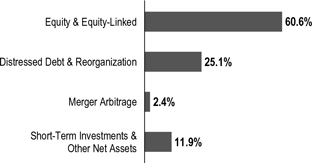
*Figures are stated as a percentage of total and may not equal 100% or may be negative due to rounding, use of any derivatives, unsettled trades or other factors.
Europe’s equity market overall was trading at an attractively lowerprice-to-earnings multiple and higher dividend yield than the U.S. equity market atperiod-end. We also saw an increase in investor activism, which we viewed as encouraging. However, those favorable factors were offset in part by economic data, which showed increased slowing of economic activity across the region. From an investment standpoint, we are hopeful that 2019 will be a year of potential resolution and clarity. The biggest political event will likely be Brexit, as a resolution to the situation remained unclear as ofperiod-end. The uncertainty around the terms and timing of a deal continued to undermine consumer and corporate confidence. From our perspective, we believe the European Union and the U.K. will ultimately reach an agreement that makes sense for both sides, and we believe the approval of such an agreement would likely have a significantly positive effect on investor, consumer and corporate sentiment in the U.K. We will also pay close attention to structural reform efforts in France and the political transition in Germany. In December, Chancellor Angela Merkel stepped down as leader of the Christian Democratic Union but stated her intention to remain in office for the remaining three years of her term as Chancellor.
In Asia, economic and financial market weakness in China has been brought on by multiple factors. The U.S.-China trade conflict has disrupted manufacturing activity and supply chains. As trade tensions escalated in 2018, manufacturers accelerated production to avoid upcoming tariffs. Atyear-end, supply chains were filled with inventory, while manufacturing activity was weak. Entering 2019, the near-term question is how long the inventory overhang will last, while the more significant question is to what extent the trade conflict will alter supply chains in the medium to long term. Amid the trade conflict, China has proven resolute in its attempt to dampen the reliance on leverage, which has weighed on economic activity as well. While the government has enacted some stimulus measures,
| franklintempleton.com |
Annual Report | 5 | ||||
FRANKLIN MUTUAL QUEST FUND
such as tax cuts, they may be less impactful than prior stimulus through fiscal spending. Meanwhile, government social policies impacting personal freedoms have had a negative effect on consumer sentiment.
Investment Spotlight
In all market environments, we seek to invest prudently in securities that we believe represent good value. We do this by seeking securities that trade at a discount to our estimate of intrinsic value, taking into account the quality of the asset, the sustainability of returns, and the growth potential of the business. We also believe the potential to deliver the best risk-adjusted return over a full market cycle requires us to be focused on applying our cross-asset approach: owning equities and debt—in certain cases multiple securities across the capital structure of a company—across geographies and sectors with an emphasis on corporate actions as catalysts. Our health care sector positions are a good example of our investment process. They have been carefully selected over a number of years, and in 2018, many of our long-standing sector investments appreciated significantly. Collectively our sector exposure outperformed the health care sector within the MSCI World Index (USD).
Within the health care sector, our investment process has generally been focused on finding innovative companies that are market leaders and that invest substantial amounts of capital into research and development (R&D) as a means to sustain and grow market positions. In addition, many of our positions have been in diversified pharmaceutical companies that also have long-duration cash flows through their leading positions in animal health, vaccine, andover-the-counter medicine businesses. These businesses can offer downside protection in years when pharmaceutical R&D is less successful or in years when important products lose patent protection. These businesses are attractive and have been undervalued by the market. This undervaluation allowed us to build positions, and in 2018, some of this undervaluation was reversed.
Eli Lilly and Merck are quintessential examples of our investment process. They are leading innovation-driven pharmaceutical companies that invest substantial amounts of capital into R&D to develop transformative medicines. Both companies have introduced innovative new products in the past many years like Trulicity for diabetes and Keytruda for oncology that we believe will continue to offer substantial long-term revenue growth. The management teams at both
Top 10 Sectors/Industries
Based on Equity Securities as of 12/31/18
% of Total Net Assets | ||||
Insurance | 9.4% | |||
Oil, Gas & Consumable Fuels | 6.1% | |||
Tobacco | 5.9% | |||
Media | 4.9% | |||
Banks | 3.5% | |||
Communications Equipment | 3.5% | |||
Interactive Media & Services | 3.4% | |||
Diversified Telecommunication Services | 3.2% | |||
Wireless Telecommunication Services | 3.2% | |||
Semiconductors & Semiconductor Equipment | 2.7% | |||
companies take a long-term view and focus on enhancing their market positions through both internal and external innovation. Acquiring late stage innovation can be expensive, which is why Lilly and Merck take a prudent approach to generally focusing on early stage assets. Competition is typically less intense for early stage assets, and they can add value through their own development process and pass along that value to shareholders. Shareholder focus also comes through at both companies by their return of excess capital to shareholders through large dividends and share buybacks.
In our view, both companies also have strong, long-duration assets. Lilly and Merck are the fourth and third largest players in animal health, respectively. In September 2018, Lilly sold some shares of Elanco3, its animal health division, through an initial public offering to create additional shareholder value, while Merck started providing segment level profit disclosures so investors could better appreciate the contribution and value of their animal health business. Merck is also the second largest player in vaccines, a highly attractive business that is underappreciated, in our opinion.
Another common feature between Lilly and Merck is their strong balance sheets. Both companies also generate substantial amounts of free cash flows, with a significant proportion returned to shareholders in the form of dividends and share buybacks. In addition, the two companies are focused on managing their business more efficiently and improving their operating margins, which we believe will lead to additional earnings growth over the next several years.
3. Not a Fund holding.
| 6 |
Annual Report | franklintempleton.com | ||
FRANKLIN MUTUAL QUEST FUND
Mergers and Acquisitions
In health care and elsewhere, merger and acquisition (M&A) activity remained healthy in 2018. The market received some clarity regarding the regulatory environment when a federal judge ruled in favor of AT&T and Time Warner4, and against the U.S. Department of Justice, in its antitrust lawsuit. However, economic, financial market and geopolitical uncertainty that arose in the second half of the year caused the pace of activity to slow. In our view, it was notable that health care has become one of the busier sectors for M&A as it is relatively more insulated from economic uncertainty. The strength and path of M&A activity in 2019 will likely depend in large part on how the uncertainties carrying over from 2018 play out and how they affect equity markets. From our experience, ups and downs in equity market performance and levels of deal activity have tended to move in a similar direction.
Credit Markets
Finding mispriced risk in credit markets was challenging in 2018. Low interest rates kept credit widely available, default rates remained at historically low levels and we continued to witness a loosening in debt covenant terms, which include restrictions on financial activities by the borrower or parameters for specific financial metrics. Liberal interpretations of credit agreements and bond indentures in order to shift valuable assets beyond the reach of creditors were an ongoing challenge. In such an environment, we found more opportunities investing in short-term mispriced risk rather than long-term restructurings.
However, we are hopeful that more opportunities may emerge in 2019, especially if we are starting to enter latter stages of the business cycle. U.S. monetary policy is becoming less accommodative, economic growth appears to be downshifting into a slower pace, earnings growth is set to slow, and geopolitical uncertainty is on the rise. These dynamics have already contributed to a general rise in financial market volatility. At the same time, the amount of lower-rated investment-grade credit stands at a historically high level on an absolute basis and relative to corporate debt markets overall. We believe default rates and the pace of corporate downgrades could begin to pick up in 2019. As a result, 2019 could bring a rise in fallen-angel opportunities (bonds downgraded from investment-grade to junk status) and idiosyncratic opportunities inout-of-favor industries. We will continue to look for
opportunities across the capital structures of companies with liquidity-enhancing events, such as asset sales, the ability to issue secured debt within existing agreements, and free cash flow that could buy time for a company to weather its financial storm.
Fund Performance
Turning to Fund performance, top positive contributors included U.K.-basedpay-TV provider Sky4, U.S.-based pharmaceutical company Eli Lilly4 and France-based automaker Peugeot4.
In February 2018, shares of Sky jumped when U.S.-based cable company Comcast4 made a surprise bid for the company. The Comcast bid was considerably higher than a prior bid by Twenty-First Century Fox4, which already owned a substantial portion of Sky. In July 2018, Twenty-First Century Fox raised its bid for Sky, but Comcast promptly offered a highercounter-bid. The stock rose again in September 2018 when The Panel on Takeovers and Mergers in the U.K. announced that Comcast had won the mandatory auction for Sky, and Twenty-Century Fox subsequently agreed to sell its stake of Sky to Comcast. The acquisition of Sky was officially completed in October 2018. The Top 10 Sectors/Industries table on page 6 lists media and also other leading industries in which the Fund currently invests.
Shares of Eli Lilly were boosted in large part by a series of strong quarterly results during 2018. Attractive corporate fundamentals and fewer investor concerns regarding the direct impact on the pharmaceutical industry from the Trump administration’s efforts to lower prescription drug prices helped push the stock higher. We believe Eli Lilly continues to have a strong product growth story and room for further margin expansion, in addition to having solid research and development capabilities.
Shares of Peugeot rallied through the first three quarters of 2018. Positive global economic fundamentals and quarterly results which showed its restructuring of Opel Vauxhall (OV), acquired from General Motors in 2017, was going better than investors had been expecting, helped push the stock price higher. We believe the acquisition should enable Peugeot to increase its profit margins and cash flow through additional product development improvements, greater vehicle production efficiency and the utilization of better powertrains (engine, transmission, drive shaft and differential) in its Opel and
4. Not held atperiod-end.
See www.franklintempletondatasources.com for additional data provider information.
franklintempleton.com | Annual Report | 7 | ||||
FRANKLIN MUTUAL QUEST FUND
Vauxhall vehicles. However, shares of Peugeot and other major automakers retreated in the last quarter of 2018 due to signs of slower global economic growth and passenger vehicle sales, as well as U.S.-China trade tensions.
During the period under review, Fund investments that detracted from performance included U.K.-based British American Tobacco, U.K.-based global mobile telecommunications company Vodafone Group and Canada-based exploration and production company Crescent Point Energy. British American Tobacco and Vodafone Group are listed among the Fund’s largest positions in the Top 10 Equity Holdings table on this page.
Shares of British American Tobacco faced downward pressure due to potential additional U.S. regulation and concerns regarding next generation products. In March 2018, the U.S. Food and Drug Administration (FDA) issued an Advance Notice of Proposed Rulemaking, which started the process of examining the possibility of regulating nicotine levels in combustible cigarettes. The process may not result in regulation, but if it does, many experts believe the review could take seven to 10 years. Meanwhile, JUUL, produced by JUUL Labs3, has emerged as a populare-cigarette for young U.S. consumers. It is unclear to what degree JUUL is cannibalizing the combustible market, but it has hurt investor sentiment toward the industry. In November, shares of British American Tobacco and industry peers dropped, as the FDA revisited the possibility of banning menthol as a flavor in cigarettes, which would take years with many steps to complete, and in our opinion, an FDA proposal would face litigation from the industry. Industry experts have suggested that it might not survive legal challenges.
In May 2018, Vodafone Group provided an outlook for its fiscal year ending March 2019 that fell short of market expectations, with much of the growth forecast to come in the latter part of the year. The stock came under further downward pressure from weaker-than-expected revenue growth due in part to price cuts in Spain and a new mobile competitor in Italy. Management stated that conditions in those two markets were likely to experience further short-term deterioration, leading to uncertainty regarding Vodafone’s ability to meet its earnings growth guidance for the fiscal year. However, we balanced the negative near-term events against the positive announcements of a merger of Vodafone’s operations in India with Idea Cellular3, which closed at the end of August 2018, and the August announcement of a merger and deconsolidation of its Australian subsidiary. In addition, we believed the newly appointed chief executive officer’s statements regarding the likely initial public offering of Vodafone’s New Zealand
Top 10 Equity Holdings
12/31/18
Company Sector/Industry, Country | % of Total Net Assets | |||
Sorenson Communications LLC Communications Equipment, U.S. | 3.5% | |||
British American Tobacco PLC Tobacco, U.K. | 3.5% | |||
Baidu Inc. Interactive Media & Services, China | 3.4% | |||
Vodafone Group PLC Wireless Telecommunication Services, U.K. | 2.9% | |||
The Hartford Financial Services Group Inc. Insurance, U.S. | 2.8% | |||
AT&T Inc. Diversified Telecommunication Services, U.S. | 2.5% | |||
JXTG Holdings Inc. Oil, Gas & Consumable Fuels, Japan | 2.5% | |||
Everest Re Group Ltd. Insurance, U.S. | 2.1% | |||
Imperial Brands PLC Tobacco, U.K. | 2.1% | |||
Vistra Energy Corp. Independent Power & Renewable Electricity Producers, | 2.0% | |||
business and the announcement of a three-year net cost cutting plan and multi-brand strategy to improve competitiveness across all market segments as positive for 2019.
Crescent Point Energy has significant exposure to oil production and its shares generally followed lower oil prices during the latter stages of 2018 despite some positive changes at the company. The company hired a new chief executive officer and had some changes to the executive team and the board of directors. The new management team launched a strategic plan targeting cost reduction, asset sales, a stronger balance sheet and better capital allocation, which we believe are the right things to focus on. So far, Crescent Point’s new management team delivered solid third-quarter results with good progress on its cost reduction program, which we believe will help build credibility. If management continues to follow through on its strategic plan, we believe the stock’s deep valuation discount versus peers may narrow.
During the period, the Fund held currency forwards and futures seeking to hedge most of the currency risk of the portfolio’snon-U.S. dollar investments. The hedges had a positive overall impact on the Fund’s performance because of the appreciation of the U.S. dollar versus the hedged currencies.
As fellow shareholders, we found recent absolute performance disappointing. With that said, we take a long term investment
| 8 |
Annual Report | franklintempleton.com | ||
FRANKLIN MUTUAL QUEST FUND
What is a currency forward?
A currency forward is a direct agreement between the Fund and a counterparty to buy or sell a foreign currency in exchange for another currency at a specific exchange rate on a future date.
What is a future?
A future is an agreement between the Fund and a counterparty made through a U.S. or foreign futures exchange to buy or sell an underlying instrument or asset at a specific price on a future date.
approach and treat periods of heightened volatility, such as the second half of 2018, as an invitation to upgrade the portfolio and/or deploy capital into more compelling opportunities as they are revealed in periods of uncertainty. Further, we remain committed to our disciplined, value investment approach as we seek to generate attractive, long-term, risk-adjusted returns for shareholders.
Thank you for your participation in Franklin Mutual Quest Fund. We look forward to continuing to serve your investment needs.
 |
Shawn M. Tumulty Co-Portfolio Manager | |
 |
Keith Luh, CFA Co-Portfolio Manager |


The foregoing information reflects our analysis, opinions and portfolio holdings as of December 31, 2018, the end of the reporting period. The way we implement our main investment strategies and the resulting portfolio holdings may change depending on factors such as market and economic conditions. These opinions may not be relied upon as investment advice or an offer for a particular security. The information is not a complete analysis of every aspect of any market, country, industry, security or the Fund. Statements of fact are from sources considered reliable, but the investment manager makes no representation or warranty as to their completeness or accuracy. Although historical performance is no guarantee of future results, these insights may help you understand our investment management philosophy.
CFA® is a trademark owned by CFA Institute.
| franklintempleton.com |
Annual Report | 9 | ||||
FRANKLIN MUTUAL QUEST FUND
Performance Summary as of December 31, 2018
The performance table and graphs do not reflect any taxes that a shareholder would pay on Fund dividends, capital gain distributions, if any, or any realized gains on the sale of Fund shares. Total return reflects reinvestment of the Fund’s dividends and capital gain distributions, if any, and any unrealized gains or losses. Your dividend income will vary depending on dividends or interest paid by securities in the Fund’s portfolio, adjusted for operating expenses of each class. Capital gain distributions are net profits realized from the sale of portfolio securities.
Performance as of 12/31/18
Cumulative total return excludes sales charges. Average annual total return includes maximum sales charges. Sales charges will vary depending on the size of the investment and the class of share purchased. The maximum is 5.50% and the minimum is 0%.Class A:5.50% maximum initial sales charge. For other share classes, visitfranklintempleton.com.
| Share Class | | Cumulative Total Return1 | | | Average Annual Total Return2 | | ||
Z | ||||||||
1-Year | -7.14%4 | -7.14%4 | ||||||
5-Year | +13.13% | +2.50% | ||||||
10-Year | +109.22% | +7.66% | ||||||
A3 | ||||||||
1-Year | -7.36%4 | -12.45% | ||||||
5-Year | +11.62% | +1.07% | ||||||
10-Year | +103.37% | +6.75% | ||||||
Performance data represent past performance, which does not guarantee future results. Investment return and principal value will fluctuate, and you may have a gain or loss when you sell your shares. Current performance may differ from figures shown. For most recentmonth-end performance, go tofranklintempleton.comor call(800)342-5236.
See page 12 for Performance Summary footnotes.
| 10 |
Annual Report | franklintempleton.com | ||
FRANKLIN MUTUAL QUEST FUND
PERFORMANCE SUMMARY
Total Return Index Comparison for a Hypothetical $10,000 Investment
Total return represents the change in value of an investment over the periods shown. It includes any applicable maximum sales charge, Fund expenses, account fees and reinvested distributions. The unmanaged indexes include reinvestment of any income or distributions. They differ from the Fund in composition and do not pay management fees or expenses. One cannot invest directly in an index.
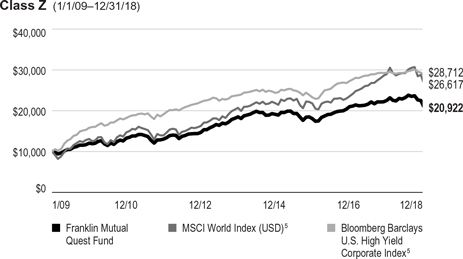

See page 12 for Performance Summary footnotes.
franklintempleton.com |
Annual Report |
11 |
FRANKLIN MUTUAL QUEST FUND
PERFORMANCE SUMMARY
Distributions(1/1/18–12/31/18)
| Share Class | Net Investment Income | Short-Term Capital Gain | Long-Term Capital Gain | Total | ||||||||||||
Z | $0.5806 | $0.2336 | $0.9681 | $1.7823 | ||||||||||||
A | $0.5441 | $0.2336 | $0.9681 | $1.7458 | ||||||||||||
C | $0.3061 | $0.2336 | $0.9681 | $1.5078 | ||||||||||||
R | $0.5203 | $0.2336 | $0.9681 | $1.7220 | ||||||||||||
R6 | $0.5902 | $0.2336 | $0.9681 | $1.7919 | ||||||||||||
Total Annual Operating Expenses6
| Share Class | ||||
Z | 0.79 | % | ||
A | 1.04 | % | ||
Each class of shares is available to certain eligible investors and has different annual fees and expenses, as described in the prospectus.
All investments involve risks, including possible loss of principal. Value securities may not increase in price as anticipated or may decline further in value. Special risks are associated with foreign investing, including currency fluctuations, economic instability and political developments. Because the Fund may invest its assets in companies in a specific region, including Europe, it is subject to greater risks of adverse developments in that region and/or the surrounding regions than a fund that is more broadly diversified geographically. Current political and financial uncertainty surrounding the European Union may increase market volatility and the economic risk of investing in companies in Europe. Smaller-company stocks have exhibited greater price volatility than larger-company stocks, particularly over the short term. The Fund’s investments in companies engaged in mergers, reorganizations or liquidations also involve special risks as pending deals may not be completed on time or on favorable terms. The Fund may invest in lower-rated bonds, which entail higher credit risk. The Fund is actively managed but there is no guarantee that the manager’s investment decisions will produce the desired results. The Fund’s prospectus also includes a description of the main investment risks.
1. Cumulative total return represents the change in value of an investment over the periods indicated.
2. Average annual total return represents the average annual change in value of an investment over the periods indicated. Return for less than one year, if any, has not been annualized.
3. Prior to 9/10/18, these shares were offered at a higher initial sales charge of 5.75%, thus actual returns would have differed. Total returns with sales charges have been restated to reflect the current maximum initial sales charge of 5.50%.
4. Total return information is based on net asset values calculated for shareholder transactions. Certain adjustments were made to the net assets of the Fund at 12/31/17 for financial reporting purposes, and as a result, the total returns based on those net asset values differ from the adjusted total returns reported in the Financial Highlights.
5. Source: Morningstar. The MSCI World Index (USD) is a free float-adjusted, market capitalization-weighted index designed to measure equity market performance in global developed markets. The Bloomberg Barclays U.S. Corporate High Yield Index measures the U.S. corporate market ofnon-investment grade, fixed-rate corporate bonds, defined as the middle or lower ratings of Moody’s, Fitch and Standard & Poor’s (Ba1/BB+/BB+).
6. Figures are as stated in the Fund’s current prospectus and may differ from the expense ratios disclosed in the Your Fund’s Expenses and Financial Highlights sections in this report. In periods of market volatility, assets may decline significantly, causing total annual Fund operating expenses to become higher than the figures shown.
See www.franklintempletondatasources.com for additional data provider information.
| 12 |
Annual Report | franklintempleton.com | ||
FRANKLIN MUTUAL QUEST FUND
As a Fund shareholder, you can incur two types of costs: (1) transaction costs, including sales charges (loads) on Fund purchases and redemptions; and (2) ongoing Fund costs, including management fees, distribution and service(12b-1) fees, and other Fund expenses. All mutual funds have ongoing costs, sometimes referred to as operating expenses. The table below shows ongoing costs of investing in the Fund and can help you understand these costs and compare them with those of other mutual funds. The table assumes a $1,000 investment held for the six months indicated.
Actual Fund Expenses
The table below provides information about actual account values and actual expenses in the columns under the heading “Actual.” In these columns the Fund’s actual return, which includes the effect of Fund expenses, is used to calculate the “Ending Account Value” for each class of shares. You can estimate the expenses you paid during the period by following these steps(of course, your account value and expenses will differ from those in this illustration): Divide your account value by $1,000(if your account had an $8,600 value, then $8,600 ÷ $1,000 = 8.6). Then multiply the result by the number in the row for your class of shares under the headings “Actual” and “Expenses Paid During Period”(if Actual Expenses Paid During Period were $7.50, then 8.6 x $7.50 = $64.50). In this illustration, the actual expenses paid this period are $64.50.
Hypothetical Example for Comparison with Other Funds
Under the heading “Hypothetical” in the table, information is provided about hypothetical account values and hypothetical expenses based on the Fund’s actual expense ratio and an assumed rate of return of 5% per year before expenses, which is not the Fund’s actual return. This information may not be used to estimate the actual ending account balance or expenses you paid for the period, but it can help you compare ongoing costs of investing in the Fund with those of other funds. To do so, compare this 5% hypothetical example for the class of shares you hold with the 5% hypothetical examples that appear in the shareholder reports of other funds.
Please note that expenses shown in the table are meant to highlight ongoing costs and do not reflect any transactional costs. Therefore, information under the heading “Hypothetical” is useful in comparing ongoing costs only, and will not help you compare total costs of owning different funds. In addition, if transactional costs were included, your total costs would have been higher.
Actual (actual return after expenses) | Hypothetical (5% annual return before expenses) | |||||||||||||||||
Share Class | Beginning Account Value 7/1/18 | Ending Account Value 12/31/18 | Expenses Period | Ending Account Value 12/31/18 | Expenses Paid During Period 7/1/18–12/31/181,2 | Net Annualized Expense Ratio2 | ||||||||||||
Z | $1,000 | $901.30 | $3.64 | $1,021.37 | $3.87 | 0.76% | ||||||||||||
A | $1,000 | $900.50 | $4.84 | $1,020.11 | $5.14 | 1.01% | ||||||||||||
C | $1,000 | $897.20 | $8.42 | $1,016.33 | $8.94 | 1.76% | ||||||||||||
R | $1,000 | $899.40 | $6.03 | $1,018.85 | $6.41 | 1.26% | ||||||||||||
R6 | $1,000 | $901.90 | $3.45 | $1,021.58 | $3.67 | 0.72% | ||||||||||||
1. Expenses are equal to the annualized expense ratio for thesix-month period as indicated above—in the far right column—multiplied by the simple average account value over the period indicated, and then multiplied by 184/365 to reflect theone-half year period.
2. Reflects expenses after fee waivers and expense reimbursements. Does not include acquired fund fees and expenses.
| franklintempleton.com |
Annual Report | 13 | ||||
FRANKLIN MUTUAL QUEST FUND
| Year Ended December 31, | |||||||||||||||||||||||||
| 2018 | 2017 | 2016 | 2015 | 2014 | |||||||||||||||||||||
Class Z | |||||||||||||||||||||||||
| Per share operating performance | |||||||||||||||||||||||||
(for a share outstanding throughout the year) | |||||||||||||||||||||||||
Net asset value, beginning of year | $15.83 | $15.52 | $14.47 | $16.21 | $18.18 | ||||||||||||||||||||
Income from investment operationsa: | |||||||||||||||||||||||||
Net investment incomeb | 0.48 | 0.58 | 0.87 | c | 0.54 | 0.78 | d | ||||||||||||||||||
Net realized and unrealized gains (losses) | (1.58 | ) | 0.49 | 1.47 | (1.45 | ) | (0.16 | ) | |||||||||||||||||
Total from investment operations | (1.10 | ) | 1.07 | 2.34 | (0.91 | ) | 0.62 | ||||||||||||||||||
Less distributions from: | |||||||||||||||||||||||||
Net investment income | (0.58 | ) | (0.63 | ) | (1.01 | ) | (0.68 | ) | (0.85 | ) | |||||||||||||||
Net realized gains | (1.20 | ) | (0.13 | ) | (0.28 | ) | (0.15 | ) | (1.74 | ) | |||||||||||||||
Total distributions | (1.78 | ) | (0.76 | ) | (1.29 | ) | (0.83 | ) | (2.59 | ) | |||||||||||||||
Net asset value, end of year | $12.95 | $15.83 | $15.52 | $14.47 | $16.21 | ||||||||||||||||||||
Total return | (6.85)% | 6.92% | 16.26% | (5.55)% | 3.44% | ||||||||||||||||||||
Ratios to average net assets | |||||||||||||||||||||||||
Expensese,f | 0.78% | 0.79% | 0.79% | g | 0.82% | g | 0.81% | ||||||||||||||||||
Expenses incurred in connection with securities sold short | —% | h | —% | 0.01% | 0.03% | 0.04% | |||||||||||||||||||
Net investment income | 2.96% | 3.65% | 5.74% | c | 3.35% | 4.18% | d | ||||||||||||||||||
| Supplemental data | |||||||||||||||||||||||||
Net assets, end of year (000’s) | $3,054,792 | $3,667,351 | $3,683,095 | $3,577,696 | $4,116,651 | ||||||||||||||||||||
Portfolio turnover rate | 115.52% | 32.90% | 44.04% | 30.51% | 65.77% | ||||||||||||||||||||
aThe amount shown for a share outstanding throughout the period may not correlate with the Statement of Operations for the period due to the timing of sales and repurchases of the Fund’s shares in relation to income earned and/or fluctuating fair value of the investments of the Fund.
bBased on average daily shares outstanding.
cNet investment income per share includes approximately $0.05 per share related to income received in the form of special dividends in connection with certain Fund holdings. Excluding this amount, the ratio of net investment income to average net assets would have been 5.42%.
dNet investment income per share includes approximately $0.27 per share related to income received in the form of special dividends in connection with certain Fund holdings. Excluding this amount, the ratio of net investment income to average net assets would have been 2.73%.
eIncludes dividend and/or interest expense on securities sold short and security borrowing fees, if any. See below for the ratios of such expenses to average net assets for the periods presented. See Note 1(e).
fBenefit of expense reduction rounds to less than 0.01%.
gBenefit of waiver and payments by affiliates rounds to less than 0.01%.
hRounds to less than 0.01%.
| 14 |
Annual Report | The accompanying notes are an integral part of these financial statements. | franklintempleton.com | ||
FRANKLIN MUTUAL QUEST FUND
FINANCIAL HIGHLIGHTS
| Year Ended December 31, | |||||||||||||||||||||||||
| 2018 | 2017 | 2016 | 2015 | 2014 | |||||||||||||||||||||
Class A | |||||||||||||||||||||||||
| Per share operating performance | |||||||||||||||||||||||||
(for a share outstanding throughout the year) | |||||||||||||||||||||||||
Net asset value, beginning of year | $15.60 | $15.32 | $14.29 | $16.02 | $18.00 | ||||||||||||||||||||
Income from investment operationsa: | |||||||||||||||||||||||||
Net investment incomeb | 0.43 | 0.53 | 0.83 | c | 0.49 | 0.71 | d | ||||||||||||||||||
Net realized and unrealized gains (losses) | (1.54 | ) | 0.46 | 1.45 | (1.43 | ) | (0.15 | ) | |||||||||||||||||
Total from investment operations | (1.11 | ) | 0.99 | 2.28 | (0.94 | ) | 0.56 | ||||||||||||||||||
Less distributions from: | |||||||||||||||||||||||||
Net investment income | (0.54 | ) | (0.58 | ) | (0.97 | ) | (0.64 | ) | (0.80 | ) | |||||||||||||||
Net realized gains | (1.20 | ) | (0.13 | ) | (0.28 | ) | (0.15 | ) | (1.74 | ) | |||||||||||||||
Total distributions | (1.74 | ) | (0.71 | ) | (1.25 | ) | (0.79 | ) | (2.54 | ) | |||||||||||||||
Net asset value, end of year | $12.75 | $15.60 | $15.32 | $14.29 | $16.02 | ||||||||||||||||||||
Total returne | (7.00)% | 6.54% | 16.04% | (5.85)% | 3.11% | ||||||||||||||||||||
Ratios to average net assets | |||||||||||||||||||||||||
Expensesf,g | 1.03% | 1.04% | 1.04% | h | 1.10% | h | 1.11% | ||||||||||||||||||
Expenses incurred in connection with securities sold short | —% | i | —% | 0.01% | 0.03% | 0.04% | |||||||||||||||||||
Net investment income | 2.71% | 3.40% | 5.49% | c | 3.07% | 3.88% | d | ||||||||||||||||||
| Supplemental data | |||||||||||||||||||||||||
Net assets, end of year (000’s) | $1,067,382 | $1,153,870 | $1,216,085 | $1,203,508 | $1,394,138 | ||||||||||||||||||||
Portfolio turnover rate | 115.52% | 32.90% | 44.04% | 30.51% | 65.77% | ||||||||||||||||||||
aThe amount shown for a share outstanding throughout the period may not correlate with the Statement of Operations for the period due to the timing of sales and repurchases of the Fund’s shares in relation to income earned and/or fluctuating fair value of the investments of the Fund.
bBased on average daily shares outstanding.
cNet investment income per share includes approximately $0.05 per share related to income received in the form of special dividends in connection with certain Fund holdings. Excluding this amount, the ratio of net investment income to average net assets would have been 5.17%.
dNet investment income per share includes approximately $0.27 per share related to income received in the form of special dividends in connection with certain Fund holdings. Excluding this amount, the ratio of net investment income to average net assets would have been 2.43%.
eTotal return does not reflect sales commissions or contingent deferred sales charges, if applicable.
fIncludes dividend and/or interest expense on securities sold short and security borrowing fees, if any. See below for the ratios of such expenses to average net assets for the periods presented. See Note 1(e).
gBenefit of expense reduction rounds to less than 0.01%.
hBenefit of waiver and payments by affiliates rounds to less than 0.01%.
iRounds to less than 0.01%.
| franklintempleton.com |
The accompanying notes are an integral part of these financial statements. | Annual Report | 15 | ||||
FRANKLIN MUTUAL QUEST FUND
FINANCIAL HIGHLIGHTS
| Year Ended December 31, | |||||||||||||||||||||||||
| 2018 | 2017 | 2016 | 2015 | 2014 | |||||||||||||||||||||
Class C | |||||||||||||||||||||||||
| Per share operating performance | |||||||||||||||||||||||||
(for a share outstanding throughout the year) | |||||||||||||||||||||||||
Net asset value, beginning of year | $15.35 | $15.06 | $14.08 | $15.78 | $17.76 | ||||||||||||||||||||
Income from investment operationsa: | |||||||||||||||||||||||||
Net investment incomeb | 0.29 | 0.41 | 0.70 | c | 0.36 | 0.57 | d | ||||||||||||||||||
Net realized and unrealized gains (losses) | (1.49 | ) | 0.47 | 1.41 | (1.39 | ) | (0.14 | ) | |||||||||||||||||
Total from investment operations | (1.20 | ) | 0.88 | 2.11 | (1.03 | ) | 0.43 | ||||||||||||||||||
Less distributions from: | |||||||||||||||||||||||||
Net investment income | (0.31 | ) | (0.46 | ) | (0.85 | ) | (0.52 | ) | (0.67 | ) | |||||||||||||||
Net realized gains | (1.20 | ) | (0.13 | ) | (0.28 | ) | (0.15 | ) | (1.74 | ) | |||||||||||||||
Total distributions | (1.51 | ) | (0.59 | ) | (1.13 | ) | (0.67 | ) | (2.41 | ) | |||||||||||||||
Net asset value, end of year | $12.64 | $15.35 | $15.06 | $14.08 | $15.78 | ||||||||||||||||||||
Total returne | (7.77)% | 5.89% | 15.10% | (6.49)% | 2.42% | ||||||||||||||||||||
Ratios to average net assets | |||||||||||||||||||||||||
Expensesf,g | 1.78% | 1.79% | 1.79% | h | 1.82% | h | 1.81% | ||||||||||||||||||
Expenses incurred in connection with securities sold short | —% | i | —% | 0.01% | 0.03% | 0.04% | |||||||||||||||||||
Net investment income | 1.96% | 2.65% | 4.74% | c | 2.35% | 3.18% | d | ||||||||||||||||||
| Supplemental data | |||||||||||||||||||||||||
Net assets, end of year (000’s) | $141,619 | $309,160 | $343,624 | $337,974 | $397,963 | ||||||||||||||||||||
Portfolio turnover rate | 115.52% | 32.90% | 44.04% | 30.51% | 65.77% | ||||||||||||||||||||
aThe amount shown for a share outstanding throughout the period may not correlate with the Statement of Operations for the period due to the timing of sales and repurchases of the Fund’s shares in relation to income earned and/or fluctuating fair value of the investments of the Fund.
bBased on average daily shares outstanding.
cNet investment income per share includes approximately $0.05 per share related to income received in the form of special dividends in connection with certain Fund holdings. Excluding this amount, the ratio of net investment income to average net assets would have been 4.42%.
dNet investment income per share includes approximately $0.27 per share related to income received in the form of special dividends in connection with certain Fund holdings. Excluding this amount, the ratio of net investment income to average net assets would have been 1.73%.
eTotal return does not reflect sales commissions or contingent deferred sales charges, if applicable.
fIncludes dividend and/or interest expense on securities sold short and security borrowing fees, if any. See below for the ratios of such expenses to average net assets for the periods presented. See Note 1(e).
gBenefit of expense reduction rounds to less than 0.01%.
hBenefit of waiver and payments by affiliates rounds to less than 0.01%.
iRounds to less than 0.01%.
| 16 |
Annual Report | The accompanying notes are an integral part of these financial statements. | franklintempleton.com | ||
FRANKLIN MUTUAL QUEST FUND
FINANCIAL HIGHLIGHTS
| Year Ended December 31, | |||||||||||||||||||||||||
| 2018 | 2017 | 2016 | 2015 | 2014 | |||||||||||||||||||||
Class R | |||||||||||||||||||||||||
| Per share operating performance | |||||||||||||||||||||||||
(for a share outstanding throughout the year) | |||||||||||||||||||||||||
Net asset value, beginning of year | $15.40 | $15.14 | $14.14 | $15.87 | $17.84 | ||||||||||||||||||||
Income from investment operationsa: | |||||||||||||||||||||||||
Net investment incomeb | 0.39 | 0.50 | 0.78 | c | 0.44 | 0.65 | d | ||||||||||||||||||
Net realized and unrealized gains (losses) | (1.53 | ) | 0.46 | 1.43 | (1.40 | ) | (0.13 | ) | |||||||||||||||||
Total from investment operations | (1.14 | ) | 0.96 | 2.21 | (0.96 | ) | 0.52 | ||||||||||||||||||
Less distributions from: | |||||||||||||||||||||||||
Net investment income | (0.52 | ) | (0.57 | ) | (0.93 | ) | (0.62 | ) | (0.75 | ) | |||||||||||||||
Net realized gains | (1.20 | ) | (0.13 | ) | (0.28 | ) | (0.15 | ) | (1.74 | ) | |||||||||||||||
Total distributions | (1.72 | ) | (0.70 | ) | (1.21 | ) | (0.77 | ) | (2.49 | ) | |||||||||||||||
Net asset value, end of year | $12.54 | $15.40 | $15.14 | $14.14 | $15.87 | ||||||||||||||||||||
Total return | (7.31)% | 6.38% | 15.69% | (6.03)% | 2.94% | ||||||||||||||||||||
Ratios to average net assets | |||||||||||||||||||||||||
Expensese,f | 1.28% | 1.29% | 1.29% | g | 1.32% | g | 1.31% | ||||||||||||||||||
Expenses incurred in connection with securities sold short | —% | h | —% | 0.01% | 0.03% | 0.04% | |||||||||||||||||||
Net investment income | 2.46% | 3.15% | 5.24% | c | 2.85% | 3.68% | d | ||||||||||||||||||
| Supplemental data | |||||||||||||||||||||||||
Net assets, end of year (000’s) | $2,929 | $1,774 | $880 | $898 | $675 | ||||||||||||||||||||
Portfolio turnover rate | 115.52% | 32.90% | 44.04% | 30.51% | 65.77% | ||||||||||||||||||||
aThe amount shown for a share outstanding throughout the period may not correlate with the Statement of Operations for the period due to the timing of sales and repurchases of the Fund’s shares in relation to income earned and/or fluctuating fair value of the investments of the Fund.
bBased on average daily shares outstanding.
cNet investment income per share includes approximately $0.05 per share related to income received in the form of special dividends in connection with certain Fund holdings. Excluding this amount, the ratio of net investment income to average net assets would have been 4.92%.
dNet investment income per share includes approximately $0.27 per share related to income received in the form of special dividends in connection with certain Fund holdings. Excluding this amount, the ratio of net investment income to average net assets would have been 2.23%.
eIncludes dividend and/or interest expense on securities sold short and security borrowing fees, if any. See below for the ratios of such expenses to average net assets for the periods presented. See Note 1(e).
fBenefit of expense reduction rounds to less than 0.01%.
gBenefit of waiver and payments by affiliates rounds to less than 0.01%.
hRounds to less than 0.01%.
| franklintempleton.com |
The accompanying notes are an integral part of these financial statements. | Annual Report | 17 | ||||
FRANKLIN MUTUAL QUEST FUND
FINANCIAL HIGHLIGHTS
| Year Ended December 31, | |||||||||||||||||||||||||
| 2018 | 2017 | 2016 | 2015 | 2014 | |||||||||||||||||||||
Class R6 | |||||||||||||||||||||||||
| Per share operating performance | |||||||||||||||||||||||||
(for a share outstanding throughout the year) | |||||||||||||||||||||||||
Net asset value, beginning of year | $15.81 | $15.51 | $14.45 | $16.19 | $18.19 | ||||||||||||||||||||
Income from investment operationsa: | |||||||||||||||||||||||||
Net investment incomeb | 0.49 | 0.64 | 0.88 | c | 0.55 | 0.51 | d | ||||||||||||||||||
Net realized and unrealized gains (losses) | (1.57 | ) | 0.43 | 1.48 | (1.44 | ) | 0.10 | ||||||||||||||||||
Total from investment operations | (1.08 | ) | 1.07 | 2.36 | (0.89 | ) | 0.61 | ||||||||||||||||||
Less distributions from: | |||||||||||||||||||||||||
Net investment income | (0.59 | ) | (0.64 | ) | (1.02 | ) | (0.70 | ) | (0.87 | ) | |||||||||||||||
Net realized gains | (1.20 | ) | (0.13 | ) | (0.28 | ) | (0.15 | ) | (1.74 | ) | |||||||||||||||
Total distributions | (1.79 | ) | (0.77 | ) | (1.30 | ) | (0.85 | ) | (2.61 | ) | |||||||||||||||
Net asset value, end of year | $12.94 | $15.81 | $15.51 | $14.45 | $16.19 | ||||||||||||||||||||
Total return | (6.73)% | 6.94% | 16.44% | (5.54)% | 3.53% | ||||||||||||||||||||
Ratios to average net assets | |||||||||||||||||||||||||
Expenses before waiver and payments by affiliatese | 0.74% | 0.72% | 0.71% | 0.74% | 0.74% | ||||||||||||||||||||
Expenses net of waiver and payments by affiliatese,f | 0.72% | 0.72% | 0.71% | g | 0.74% | g | 0.74% | ||||||||||||||||||
Expenses incurred in connection with securities sold short | —% | h | —% | 0.01% | 0.03% | 0.04% | |||||||||||||||||||
Net investment income | 3.02% | 3.72% | 5.82% | c | 3.43% | 4.25% | d | ||||||||||||||||||
| Supplemental data | |||||||||||||||||||||||||
Net assets, end of year (000’s) | $116,012 | $123,863 | $52,277 | $41,408 | $44,340 | ||||||||||||||||||||
Portfolio turnover rate | 115.52% | 32.90% | 44.04% | 30.51% | 65.77% | ||||||||||||||||||||
aThe amount shown for a share outstanding throughout the period may not correlate with the Statement of Operations for the period due to the timing of sales and repurchases of the Fund’s shares in relation to income earned and/or fluctuating fair value of the investments of the Fund.
bBased on average daily shares outstanding.
cNet investment income per share includes approximately $0.05 per share related to income received in the form of special dividends in connection with certain Fund holdings. Excluding this amount, the ratio of net investment income to average net assets would have been 5.50%.
dNet investment income per share includes approximately $0.27 per share related to income received in the form of special dividends in connection with certain Fund holdings. Excluding this amount, the ratio of net investment income to average net assets would have been 2.80%.
eIncludes dividend and/or interest expense on securities sold short and security borrowing fees, if any. See below for the ratios of such expenses to average net assets for the periods presented. See Note 1(e).
fBenefit of expense reduction rounds to less than 0.01%.
gBenefit of waiver and payments by affiliates rounds to less than 0.01%.
hRounds to less than 0.01%.
| 18 |
Annual Report | The accompanying notes are an integral part of these financial statements. | franklintempleton.com | ||
FRANKLIN MUTUAL QUEST FUND
Statement of Investments, December 31, 2018
| Country | Shares/ Warrants | Value | ||||||||||||
Common Stocks and Other Equity Interests 59.9% | ||||||||||||||
Aerospace & Defense 0.5% | ||||||||||||||
BAE Systems PLC | United Kingdom | 3,623,080 | $ | 21,216,567 | ||||||||||
|
| |||||||||||||
Auto Components 0.3% | ||||||||||||||
Cie Generale des Etablissements Michelin SCA | France | 129,718 | 12,886,297 | |||||||||||
| a,b,c | International Automotive Components Group Brazil LLC | Brazil | 2,548,299 | 107,989 | ||||||||||
| a,b,c | International Automotive Components Group North America LLC | United States | 19,924,658 | 2,375,020 | ||||||||||
|
| |||||||||||||
| 15,369,306 | ||||||||||||||
|
| |||||||||||||
Banks 3.5% | ||||||||||||||
AIB Group PLC | Ireland | 7,170,891 | 30,145,304 | |||||||||||
Barclays PLC | United Kingdom | 12,877,511 | 24,718,464 | |||||||||||
BNP Paribas SA | France | 784,792 | 35,496,498 | |||||||||||
Citigroup Inc. | United States | 277,600 | 14,451,856 | |||||||||||
Citizens Financial Group Inc. | United States | 580,400 | 17,255,292 | |||||||||||
Guaranty Bancorp | United States | 347,127 | 7,202,885 | |||||||||||
Societe Generale SA | France | 822,896 | 26,230,760 | |||||||||||
|
| |||||||||||||
| 155,501,059 | ||||||||||||||
|
| |||||||||||||
Chemicals 0.8% | ||||||||||||||
| d | Advanced Emissions Solutions Inc. | United States | 1,724,209 | 18,190,405 | ||||||||||
BASF SE | Germany | 215,133 | 14,985,442 | |||||||||||
| a,b,e | Dow Corning Corp., Contingent Distribution | United States | 12,089,194 | — | ||||||||||
|
| |||||||||||||
| 33,175,847 | ||||||||||||||
|
| |||||||||||||
Communications Equipment 3.5% | ||||||||||||||
| a,b,c | Sorenson Communications LLC, Membership Interests | United States | 224,279 | 155,100,344 | ||||||||||
|
| |||||||||||||
Consumer Finance 0.4% | ||||||||||||||
Capital One Financial Corp. | United States | 244,314 | 18,467,695 | |||||||||||
|
| |||||||||||||
Diversified Consumer Services 0.1% | ||||||||||||||
| a,b | Affinion Group Inc., wts., 11/10/22 | United States | 549,716 | 3,664,436 | ||||||||||
|
| |||||||||||||
Diversified Financial Services 1.4% | ||||||||||||||
Voya Financial Inc. | United States | 1,492,186 | 59,896,346 | |||||||||||
|
| |||||||||||||
Diversified Telecommunication Services 3.2% | ||||||||||||||
AT&T Inc. | United States | 3,873,537 | 110,550,746 | |||||||||||
Koninklijke KPN NV | Netherlands | 10,927,438 | 32,052,884 | |||||||||||
|
| |||||||||||||
| 142,603,630 | ||||||||||||||
|
| |||||||||||||
Equity Real Estate Investment Trusts (REITs) 0.3% | ||||||||||||||
Mid-America Apartment Communities Inc. | United States | 43,765 | 4,188,310 | |||||||||||
Vornado Realty Trust | United States | 181,193 | 11,239,402 | |||||||||||
|
| |||||||||||||
| 15,427,712 | ||||||||||||||
|
| |||||||||||||
Food & Staples Retailing 0.3% | ||||||||||||||
| a | Rite Aid Corp. | United States | 17,137,837 | 12,138,730 | ||||||||||
|
| |||||||||||||
Food Products 0.8% | ||||||||||||||
Bunge Ltd. | United States | 699,700 | 37,391,968 | |||||||||||
|
| |||||||||||||
Health Care Equipment & Supplies 0.4% | ||||||||||||||
Medtronic PLC | United States | 214,243 | 19,487,543 | |||||||||||
|
| |||||||||||||
Household Durables 0.3% | ||||||||||||||
Lennar Corp., A | United States | 313,000 | 12,253,950 | |||||||||||
Pandora AS | Denmark | 14,596 | 595,898 | |||||||||||
|
| |||||||||||||
| 12,849,848 | ||||||||||||||
|
| |||||||||||||
franklintempleton.com | Annual Report | 19 | ||||
FRANKLIN MUTUAL QUEST FUND
STATEMENT OF INVESTMENTS
| Country | Shares/ Warrants | Value | ||||||||||||
Common Stocks and Other Equity Interests(continued) | ||||||||||||||
Independent Power & Renewable Electricity Producers 2.0% | ||||||||||||||
| a | Vistra Energy Corp. | United States | 3,858,672 | $ | 88,325,002 | |||||||||
|
| |||||||||||||
Insurance 9.4% | ||||||||||||||
ASR Nederland NV | Netherlands | 857,335 | 33,969,124 | |||||||||||
| a | Brighthouse Financial Inc. | United States | 2,024,648 | 61,711,271 | ||||||||||
China Pacific Insurance Group Co. Ltd., H | China | 7,005,000 | 22,677,575 | |||||||||||
Chubb Ltd. | United States | 249,500 | 32,230,410 | |||||||||||
Everest Re Group Ltd. | United States | 424,666 | 92,475,268 | |||||||||||
The Hartford Financial Services Group Inc. | United States | 2,773,390 | 123,277,185 | |||||||||||
Lancashire Holdings Ltd. | United Kingdom | 3,354,996 | 25,884,674 | |||||||||||
RSA Insurance Group PLC | United Kingdom | 2,846,951 | 18,646,629 | |||||||||||
|
| |||||||||||||
| 410,872,136 | ||||||||||||||
|
| |||||||||||||
Interactive Media & Services 3.4% | ||||||||||||||
| a | Baidu Inc., ADR | China | 936,393 | 148,511,930 | ||||||||||
|
| |||||||||||||
Machinery 1.6% | ||||||||||||||
| a | Navistar International Corp. | United States | 2,159,525 | 56,039,674 | ||||||||||
Terex Corp. | United States | 495,518 | 13,661,431 | |||||||||||
|
| |||||||||||||
| 69,701,105 | ||||||||||||||
|
| |||||||||||||
Media 4.9% | ||||||||||||||
| a | Charter Communications Inc., A | United States | 283,789 | 80,871,351 | ||||||||||
| a | Cumulus Media Inc., A | United States | 51,173 | 552,668 | ||||||||||
| a | Cumulus Media Inc., B | United States | 76,298 | 724,831 | ||||||||||
| a | Cumulus Media Inc., wts., 6/04/38 | United States | 57,778 | 548,891 | ||||||||||
| a | Discovery Inc., C | United States | 1,129,269 | 26,063,529 | ||||||||||
| a,d | Lee Enterprises Inc./IA | United States | 4,824,268 | 10,179,206 | ||||||||||
| a,b,c,d | Lee Enterprises Inc., wts., 12/31/22 | United States | 1,110,000 | 217,582 | ||||||||||
| a | Liberty Global PLC, C | United Kingdom | 2,786,789 | 57,519,325 | ||||||||||
| d | New Media Investment Group Inc. | United States | 3,205,203 | 37,084,199 | ||||||||||
|
| |||||||||||||
| 213,761,582 | ||||||||||||||
|
| |||||||||||||
Metals & Mining 0.2% | ||||||||||||||
Warrior Met Coal Inc. | United States | 296,595 | 7,150,906 | |||||||||||
|
| |||||||||||||
Oil, Gas & Consumable Fuels 6.1% | ||||||||||||||
Canadian Natural Resources Ltd. | Canada | 731,900 | 17,662,761 | |||||||||||
Crescent Point Energy Corp. | Canada | 14,542,753 | 44,109,306 | |||||||||||
JXTG Holdings Inc. | Japan | 20,923,737 | 110,097,802 | |||||||||||
Kinder Morgan Inc. | United States | 5,436,070 | 83,606,757 | |||||||||||
The Williams Cos. Inc. | United States | 492,600 | 10,861,830 | |||||||||||
|
| |||||||||||||
| 266,338,456 | ||||||||||||||
|
| |||||||||||||
Pharmaceuticals 2.5% | ||||||||||||||
Novartis AG, ADR | Switzerland | 273,206 | 23,443,807 | |||||||||||
Perrigo Co. PLC | United States | 1,384,442 | 53,647,128 | |||||||||||
| a | Teva Pharmaceutical Industries Ltd., ADR | Israel | 1,978,724 | 30,511,924 | ||||||||||
|
| |||||||||||||
| 107,602,859 | ||||||||||||||
|
| |||||||||||||
Semiconductors & Semiconductor Equipment 2.7% | ||||||||||||||
BE Semiconductor Industries NV. | Netherlands | 720,592 | 15,256,440 | |||||||||||
| a | Micron Technology Inc. | United States | 2,480,500 | 78,706,265 | ||||||||||
| a | Renesas Electronics Corp. | Japan | 5,599,714 | 25,546,140 | ||||||||||
|
| |||||||||||||
| 119,508,845 | ||||||||||||||
|
| |||||||||||||
| 20 |
Annual Report | franklintempleton.com | ||
FRANKLIN MUTUAL QUEST FUND
STATEMENT OF INVESTMENTS
| Country | Shares/ Warrants | Value | ||||||||||||
Common Stocks and Other Equity Interests(continued) | ||||||||||||||
Software 1.1% | ||||||||||||||
| a | Avaya Holdings Corp., wts., 12/15/22 | United States | 338,090 | $ | 693,084 | |||||||||
| a | Check Point Software Technologies Ltd. | Israel | 453,038 | 46,504,351 | ||||||||||
|
| |||||||||||||
| 47,197,435 | ||||||||||||||
|
| |||||||||||||
Specialty Retail 0.7% | ||||||||||||||
Dufry AG | Switzerland | 333,758 | 31,807,295 | |||||||||||
|
| |||||||||||||
Technology Hardware, Storage & Peripherals 0.4% | ||||||||||||||
Western Digital Corp. | United States | 452,800 | 16,740,016 | |||||||||||
|
| |||||||||||||
Tobacco 5.9% | ||||||||||||||
Altria Group Inc. | United States | 219,100 | 10,821,349 | |||||||||||
British American Tobacco PLC | United Kingdom | 4,861,205 | 154,981,286 | |||||||||||
Imperial Brands PLC | United Kingdom | 3,048,037 | 92,394,204 | |||||||||||
|
| |||||||||||||
| 258,196,839 | ||||||||||||||
|
| |||||||||||||
Wireless Telecommunication Services 3.2% | ||||||||||||||
| a | T-Mobile U.S. Inc. | United States | 221,200 | 14,070,532 | ||||||||||
Vodafone Group PLC | United Kingdom | 64,388,168 | 125,547,731 | |||||||||||
|
| |||||||||||||
| 139,618,263 | ||||||||||||||
|
| |||||||||||||
Total Common Stocks and Other Equity Interests | 2,627,623,700 | |||||||||||||
|
| |||||||||||||
Management Investment Companies (Cost $18,167,507) 0.4% |
| |||||||||||||
Diversified Financial Services 0.4% | ||||||||||||||
| a | Altaba Inc. | United States | 302,900 | 17,550,026 | ||||||||||
|
| |||||||||||||
Convertible Preferred Stocks 0.7% | ||||||||||||||
Multi-Utilities 0.7% | ||||||||||||||
Sempra Energy, 6.00%, cvt. pfd., A | United States | 250,200 | 23,796,522 | |||||||||||
Sempra Energy, 6.75%, cvt. pfd., B | United States | 51,100 | 4,928,084 | |||||||||||
|
| |||||||||||||
Total Convertible Preferred Stocks (Cost $30,306,178) | 28,724,606 | |||||||||||||
|
| |||||||||||||
Preferred Stocks 2.1% | ||||||||||||||
Auto Components 0.8% | ||||||||||||||
| f | Schaeffler AG, 7.398%, pfd. | Germany | 3,994,296 | 34,026,984 | ||||||||||
|
| |||||||||||||
Automobiles 0.5% | ||||||||||||||
| f | Volkswagen AG, 2.845%, pfd. | Germany | 145,960 | 23,275,143 | ||||||||||
|
| |||||||||||||
Technology Hardware, Storage & Peripherals 0.8% | ||||||||||||||
| f | Samsung Electronics Co. Ltd., 4.46%, pfd. | South Korea | 1,162,517 | 33,141,405 | ||||||||||
|
| |||||||||||||
Total Preferred Stocks (Cost $85,220,853) | 90,443,532 | |||||||||||||
|
| |||||||||||||
| Principal Amount* | ||||||||||||||
Corporate Bonds, Notes and Senior Floating Rate Interests 22.1% | ||||||||||||||
| g,h | Affinion Group Inc., Term Loans, 10.39%,(3-month USD LIBOR + 7.75%), 5/10/22 | United States | $ | 21,470,505 | 21,161,866 | |||||||||
| i | Banff Merger Sub Inc., senior note, 144A, 9.75%, 9/01/26 | United States | 50,000,000 | 45,875,000 | ||||||||||
| i | CCO Holdings LLC/CCO Holdings Capital Corp., | |||||||||||||
senior bond, 144A, 5.75%, 2/15/26 | United States | 2,000,000 | 1,965,000 | |||||||||||
senior bond, 144A, 5.50%, 5/01/26 | United States | 27,978,000 | 26,963,798 | |||||||||||
franklintempleton.com | Annual Report | 21 | ||||
FRANKLIN MUTUAL QUEST FUND
STATEMENT OF INVESTMENTS
| Country | Principal Amount* | Value | ||||||||||||
Corporate Bonds, Notes and Senior Floating Rate Interests(continued) |
| |||||||||||||
| g,h | Community Health Systems Inc., 2021 Term H Loans, 5.957%,(3-month USD LIBOR + 3.25%), 1/15/21 | United States | $ | 75,345,127 | $ | 72,387,831 | ||||||||
| g,h | Cumulus Media New Holdings Inc., Term Loan, 7.03%,(1-month USD LIBOR + 4.50%), 5/13/22 | United States | 14,347,039 | 13,614,738 | ||||||||||
Envision Healthcare Corp., | ||||||||||||||
isenior note, 144A, 8.75%, 10/15/26 | United States | 140,000,000 | 121,450,000 | |||||||||||
g,h,jTerm Loan B, 6.272%,(1-month USD LIBOR + 3.75%), 10/11/25 | United States | 21,000,000 | 19,664,169 | |||||||||||
Frontier Communications Corp., | ||||||||||||||
senior note, 10.50%, 9/15/22 | United States | 77,063,000 | 53,944,100 | |||||||||||
senior note, 11.00%, 9/15/25 | United States | 41,812,000 | 26,234,939 | |||||||||||
| g,h,j | JC Penney Corp. Inc., Term B Loan, 6.772%,(1-month USD LIBOR + 4.25%), 6/23/23 | United States | 22,926,000 | 19,681,971 | ||||||||||
| d | Lee Enterprises Inc., | |||||||||||||
h Second Lien Term Loan, 12.00%, 12/15/22 | United States | 46,754,653 | 47,222,199 | |||||||||||
isenior secured note, first lien, 144A, 9.50%, 3/15/22 | United States | 97,050,000 | 99,476,250 | |||||||||||
McDermott Technology Americas Inc., | ||||||||||||||
isenior note, 144A, 10.625%, 5/01/24 | United States | 10,000,000 | 8,475,000 | |||||||||||
g,hTerm Loan, 7.522%,(1-month USD LIBOR + 5.00%), 5/09/25 | United States | 9,974,874 | 9,338,976 | |||||||||||
| i | Navistar International Corp., senior note, 144A, 6.625%, 11/01/25 | United States | 39,270,000 | 38,091,900 | ||||||||||
Perrigo Finance Unlimited Co., senior note, 4.375%, 3/15/26 | United States | 20,000,000 | 18,186,612 | |||||||||||
| i | Rite Aid Corp., senior note, 144A, 6.125%, 4/01/23 | United States | 37,132,000 | 29,473,525 | ||||||||||
Sorenson Communications LLC, | ||||||||||||||
g,hInitial Term Loan, 8.56%,(3-month USD LIBOR + 5.75%), 4/30/20 | United States | 139,170,854 | 138,475,000 | |||||||||||
i,ksecured note, second lien, 144A, PIK, 9.00%, 10/31/20 | United States | 96,671,937 | 94,738,498 | |||||||||||
| i,k | Sorenson Holdings LLC/Finance Corp., senior note, 144A, PIK, 13.85%, 10/31/21 | United States | 20,117,561 | 20,620,500 | ||||||||||
| g,h | Veritas US Inc., | |||||||||||||
Term Loan B1, 7.022%,(1-month USD LIBOR + 4.50%), 1/27/23 | United States | 17,442,455 | 15,007,785 | |||||||||||
Term Loan B1, 7.303%,(3-month USD LIBOR + 4.50%), 1/27/23 | United States | 5,718,328 | 4,920,147 | |||||||||||
| i | Veritas US Inc./Veritas Bermuda Ltd., | |||||||||||||
senior note, 144A, 7.50%, 2/01/23 | United States | 3,682,000 | 3,019,240 | |||||||||||
senior note, 144A, 10.50%, 2/01/24 | United States | 30,222,000 | 20,022,075 | |||||||||||
|
| |||||||||||||
Total Corporate Bonds, Notes and Senior Floating Rate Interests |
| 970,011,119 | ||||||||||||
|
| |||||||||||||
Corporate Notes and Senior Floating Rate Interests in |
| |||||||||||||
| b,c,l | Broadband Ventures III LLC, secured promissory note, 5.00%, 2/01/12 | United States | 9,272 | — | ||||||||||
| l | iHeartCommunications Inc., | |||||||||||||
senior secured note, first lien, 9.00%, 12/15/19 | United States | 72,867,000 | 49,185,225 | |||||||||||
g,hTranche D Term Loan, 8.443%,(3-month USD LIBOR + 6.75%), 1/30/19 | United States | 46,662,631 | 31,562,137 | |||||||||||
g,hTranche E Term Loan, 9.193%,(3-month USD LIBOR + 7.50%), 7/30/19 | United States | 14,995,598 | 10,138,074 | |||||||||||
| b,c,l | Sunshine Oilsands Ltd., secured note, 144A, 10.00%, 8/01/17 | Canada | 17,873,000 | 3,563,602 | ||||||||||
| g,h,l | Toys RUS-Delaware Inc., TermB-4 Loan, 10.067%,(3-month USD LIBOR + 8.75%), 4/24/20 | United States | 71,037,808 | 35,163,715 | ||||||||||
|
| |||||||||||||
Total Corporate Notes and Senior Floating Rate Interests in |
| 129,612,753 | ||||||||||||
|
| |||||||||||||
| 22 |
Annual Report | franklintempleton.com | ||
FRANKLIN MUTUAL QUEST FUND
STATEMENT OF INVESTMENTS
| Country | Shares | Value | ||||||||||||
Companies in Liquidation 0.0%† | ||||||||||||||
| a,b,e | Avaya Holdings Corp., Contingent Distribution | United States | 82,902,380 | $ | — | |||||||||
| a,b,e | Avaya Inc., Contingent Distribution | United States | 60,987,608 | — | ||||||||||
| a,b,e | NewPage Corp., Litigation Trust, Contingent Distribution | United States | 723,000 | — | ||||||||||
| a,e | Nortel Networks Corp., Contingent Distribution | Canada | 31,192,000 | 857,780 | ||||||||||
| a,e | Nortel Networks Ltd., Contingent Distribution | Canada | 20,912,000 | 54,894 | ||||||||||
| a,b,e | Tribune Media, Litigation Trust, Contingent Distribution | United States | 1,514,115 | — | ||||||||||
| a,e | Vistra Energy Corp., Litigation Trust, Contingent Distribution | United States | 104,175,133 | 93,758 | ||||||||||
|
| |||||||||||||
Total Companies in Liquidation (Cost $10,258,499) | 1,006,432 | |||||||||||||
|
| |||||||||||||
| Number of Contracts | Notional Amount# | |||||||||||||
Options Purchased 0.0%† | ||||||||||||||
Calls - Exchange-Traded | ||||||||||||||
Baidu Inc., ADR, January Srike Price $195, Expires 1/18/19 | 100 | 10,000 | 1,600 | |||||||||||
Micron Technology Inc., January Srike Price $50, Expires 1/18/19 | 4,500 | 450,000 | 4,500 | |||||||||||
|
| |||||||||||||
Total Options Purchased (Cost $919,623) | 6,100 | |||||||||||||
|
| |||||||||||||
Total Investments before Short Term Investments | 3,864,978,268 | |||||||||||||
|
| |||||||||||||
| Country | Principal Amount* | |||||||||||||
Short Term Investments 11.5% | ||||||||||||||
U.S. Government and Agency Securities 11.5% | ||||||||||||||
| m | FHLB, 1/02/19 | United States | $ | 16,700,000 | 16,700,000 | |||||||||
| m | U.S. Treasury Bill, | |||||||||||||
1/02/19 | United States | 50,000,000 | 50,000,000 | |||||||||||
1/08/19 | United States | 50,000,000 | 49,981,045 | |||||||||||
1/24/19 | United States | 50,000,000 | 49,929,342 | |||||||||||
2/14/19 | United States | 50,000,000 | 49,854,861 | |||||||||||
1/03/19 - 4/25/19 | United States | 150,500,000 | 150,021,908 | |||||||||||
5/09/19 | United States | 50,000,000 | 49,561,181 | |||||||||||
n 5/16/19 | United States | 50,000,000 | 49,538,454 | |||||||||||
n 5/30/19 - 6/13/19 | United States | 40,000,000 | 39,565,615 | |||||||||||
|
| |||||||||||||
Total U.S. Government and Agency Securities | 505,152,406 | |||||||||||||
|
| |||||||||||||
Total Investments (Cost $4,937,298,258) 99.7% | 4,370,130,674 | |||||||||||||
Options Written (0.2)% | (9,682,165 | ) | ||||||||||||
Securities Sold Short (0.1)% | (5,471,761 | ) | ||||||||||||
Other Assets, less Liabilities 0.6% | 27,756,898 | |||||||||||||
|
| |||||||||||||
Net Assets 100.0% | $ | 4,382,733,646 | ||||||||||||
|
| |||||||||||||
franklintempleton.com | Annual Report | 23 | ||||
FRANKLIN MUTUAL QUEST FUND
STATEMENT OF INVESTMENTS
| Number of Contracts | Notional Amount# | Value | ||||||||||||
| o | Options Written (0.2)% | |||||||||||||
Puts - Exchange-Traded | ||||||||||||||
Micron Technology Inc., January Strike Price $40, Expires 1/18/19 | 10,070 | 1,007,000 | $ | (8,478,940 | ) | |||||||||
Perrigo Co. PLC, January Strike Price $75, Expires 1/18/19 | 5 | 500 | (18,225 | ) | ||||||||||
PG&E Corp., January Strike Price $25, Expires 1/18/19 | 5,000 | 500,000 | (1,185,000 | ) | ||||||||||
|
| |||||||||||||
Total Options Written (Premiums Received $3,634,397) | $ | (9,682,165 | ) | |||||||||||
|
| |||||||||||||
| Country | Shares | |||||||||||||
| p | Securities Sold Short (0.1)% | |||||||||||||
Common Stocks (0.1)% | ||||||||||||||
Equity Real Estate Investment Trusts (REITs) (0.1)% | ||||||||||||||
Seritage Growth Properties, A | United States | 126,850 | (4,101,061 | ) | ||||||||||
|
| |||||||||||||
Internet & Direct Marketing Retail (0.0)%† | ||||||||||||||
Alibaba Group Holding Ltd., ADR | China | 10,000 | (1,370,700 | ) | ||||||||||
|
| |||||||||||||
Total Securities Sold Short (Proceeds $6,812,019) | $ | (5,471,761 | ) | |||||||||||
|
| |||||||||||||
†Rounds to less than 0.1% of net assets.
*The principal amount is stated in U.S. dollars unless otherwise indicated.
#Notional amount is the number of units specified in the contract, and can include currency units, bushels, shares, pounds barrels or other units. Currency units are stated in U.S. dollars unless otherwise indicated.
aNon-income producing.
bFair valued using significant unobservable inputs. See Note 14 regarding fair value measurements.
cSee Note 10 regarding restricted securities.
dSee Note 12 regarding holdings of 5% voting securities.
eContingent distributions represent the right to receive additional distributions, if any, during the reorganization of the underlying company. Shares represent total underlying principal of debt securities.
fVariable rate security. The rate shown represents the yield at period end.
gThe coupon rate shown represents the rate at period end.
hSee Note 1(f) regarding senior floating rate interests.
iSecurity was purchased pursuant to Rule 144A under the Securities Act of 1933 and may be sold in transactions exempt from registration only to qualified institutional buyers or in a public offering registered under the Securities Act of 1933. These securities have been deemed liquid under guidelines approved by the Trust’s Board of Trustees. At December 31, 2018, the aggregate value of these securities was $510,170,786, representing 11.6% of net assets.
jA portion or all of the security purchased on a delayed delivery basis. See Note 1(c).
kIncome may be received in additional securities and/or cash.
lSee Note 8 regarding credit risk and defaulted securities.
mThe security was issued on a discount basis with no stated coupon rate.
nA portion or all of the security has been segregated as collateral for securities sold short and open written options contracts. At December 31, 2018, the aggregate value of these securities pledged amounted to $26,086,439, representing 0.6% of net assets.
oSee Note 1(d) regarding written options.
pSee Note 1(e) regarding securities sold short.
| 24 |
Annual Report | franklintempleton.com | ||
FRANKLIN MUTUAL QUEST FUND
STATEMENT OF INVESTMENTS
At December 31, 2018, the Fund had the following futures contracts outstanding. See Note 1(d).
Futures Contracts
| Description | Type | Number of Contracts | Notional Amount* | Expiration Date | Value/ Unrealized Appreciation (Depreciation) | |||||||||||||||
| Currency Contracts | ||||||||||||||||||||
EUR/USD | Short | 781 | $112,488,406 | 3/18/19 | $ 16,770 | |||||||||||||||
GBP/USD | Short | 815 | 65,149,063 | 3/18/19 | 134,639 | |||||||||||||||
Total Futures Contracts | $151,409 | |||||||||||||||||||
*As of period end.
At December 31, 2018, the Fund had the following forward exchange contracts outstanding. See Note 1(d).
| Forward Exchange Contracts | ||||||||||||||||||||||||||||
| Currency | Counterpartya | Type | Quantity | Contract Amount | Settlement Date | Unrealized Appreciation | Unrealized Depreciation | |||||||||||||||||||||
| OTC Forward Exchange Contracts |
| |||||||||||||||||||||||||||
Euro | BOFA | Sell | 1,682,979 | $ | 1,995,273 | 1/14/19 | $ | 64,519 | $ | — | ||||||||||||||||||
Euro | BONY | Buy | 4,841,000 | 5,491,267 | 1/14/19 | 62,442 | — | |||||||||||||||||||||
Euro | HSBK | Buy | 3,795,592 | 4,359,668 | 1/14/19 | — | (5,275 | ) | ||||||||||||||||||||
Euro | HSBK | Buy | 7,742,730 | 8,828,725 | 1/14/19 | 53,917 | — | |||||||||||||||||||||
Euro | SSBT | Buy | 9,264,439 | 10,684,173 | 1/14/19 | — | (55,789 | ) | ||||||||||||||||||||
Euro | SSBT | Buy | 18,679,990 | 21,159,048 | 1/14/19 | 271,076 | — | |||||||||||||||||||||
Euro | UBSW | Sell | 42,640,772 | 49,600,057 | 1/14/19 | 681,555 | — | |||||||||||||||||||||
British Pound | BOFA | Buy | 2,644,232 | 3,350,908 | 1/16/19 | 23,989 | — | |||||||||||||||||||||
British Pound | BOFA | Sell | 520,961 | 683,386 | 1/16/19 | 18,471 | — | |||||||||||||||||||||
British Pound | BONY | Buy | 2,860,216 | 3,633,476 | 1/16/19 | 17,087 | — | |||||||||||||||||||||
British Pound | HSBK | Buy | 1,163,880 | 1,472,374 | 1/16/19 | 13,113 | — | |||||||||||||||||||||
British Pound | HSBK | Buy | 13,604,870 | 17,438,980 | 1/16/19 | — | (74,761 | ) | ||||||||||||||||||||
British Pound | HSBK | Sell | 849,319 | 1,103,446 | 1/16/19 | 19,440 | — | |||||||||||||||||||||
British Pound | SSBT | Buy | 958,132 | 1,214,499 | 1/16/19 | 8,387 | — | |||||||||||||||||||||
British Pound | SSBT | Buy | 2,950,000 | 3,780,056 | 1/16/19 | — | (14,901 | ) | ||||||||||||||||||||
British Pound | SSBT | Sell | 17,631,738 | 23,325,575 | 1/16/19 | 821,768 | — | |||||||||||||||||||||
British Pound | UBSW | Buy | 787,942 | 998,526 | 1/16/19 | 7,143 | — | |||||||||||||||||||||
British Pound | UBSW | Sell | 5,967,254 | 7,721,693 | 1/16/19 | 105,545 | — | |||||||||||||||||||||
British Pound | BOFA | Sell | 46,877,604 | 61,670,952 | 2/14/19 | 1,755,544 | — | |||||||||||||||||||||
British Pound | BONY | Sell | 8,915,740 | 11,819,215 | 2/14/19 | 423,790 | — | |||||||||||||||||||||
British Pound | HSBK | Buy | 3,052,513 | 3,863,108 | 2/14/19 | 38,384 | — | |||||||||||||||||||||
British Pound | HSBK | Sell | 6,174,141 | 7,989,530 | 2/14/19 | 98,208 | — | |||||||||||||||||||||
British Pound | UBSW | Buy | 2,054,105 | 2,599,645 | 2/14/19 | 25,757 | — | |||||||||||||||||||||
British Pound | UBSW | Sell | 34,486,900 | 44,457,800 | 2/14/19 | 379,252 | — | |||||||||||||||||||||
South Korean Won | BONY | Sell | 1,620,788,150 | 1,464,788 | 2/15/19 | 7,287 | — | |||||||||||||||||||||
South Korean Won | HSBK | Buy | 9,289,718,847 | 8,278,958 | 2/15/19 | 74,864 | — | |||||||||||||||||||||
South Korean Won | HSBK | Sell | 15,238,928,156 | 13,729,649 | 2/15/19 | 25,975 | — | |||||||||||||||||||||
South Korean Won | UBSW | Buy | 8,979,090,853 | 8,005,382 | 2/15/19 | 69,107 | — | |||||||||||||||||||||
South Korean Won | UBSW | Sell | 4,492,182,529 | 4,042,454 | 2/15/19 | 2,839 | — | |||||||||||||||||||||
South Korean Won | UBSW | Sell | 7,537,483,500 | 6,694,451 | 2/15/19 | — | (83,665 | ) | ||||||||||||||||||||
Euro | BOFA | Buy | 14,392,022 | 16,483,179 | 2/20/19 | 78,299 | — | |||||||||||||||||||||
Euro | BOFA | Sell | 11,922,857 | 14,043,347 | 2/20/19 | 323,238 | — | |||||||||||||||||||||
franklintempleton.com | Annual Report | 25 | ||||
FRANKLIN MUTUAL QUEST FUND
STATEMENT OF INVESTMENTS
Forward Exchange Contracts(continued)
|
| |||||||||||||||||||||||||||
| Currency | Counterpartya | Type | Quantity | Contract Amount | Settlement Date | Unrealized Appreciation | Unrealized Depreciation | |||||||||||||||||||||
| OTC Forward Exchange Contracts(continued) |
| |||||||||||||||||||||||||||
Euro | BONY | Buy | 1,080,000 | $ | 1,231,502 | 2/20/19 | $ | 11,297 | $ | — | ||||||||||||||||||
Euro | BONY | Sell | 39,938,511 | 46,219,802 | 2/20/19 | 260,954 | — | |||||||||||||||||||||
Euro | HSBK | Buy | 2,761,643 | 3,157,813 | 2/20/19 | 20,122 | — | |||||||||||||||||||||
Euro | HSBK | Sell | 7,171,641 | 8,442,384 | 2/20/19 | 189,689 | — | |||||||||||||||||||||
Euro | SSBT | Buy | 26,483,873 | 30,276,418 | 2/20/19 | 199,636 | — | |||||||||||||||||||||
Euro | SSBT | Sell | 43,673,972 | 50,687,371 | 2/20/19 | 429,980 | — | |||||||||||||||||||||
Euro | UBSW | Buy | 11,837,735 | 13,488,785 | 2/20/19 | 133,370 | — | |||||||||||||||||||||
Euro | UBSW | Sell | 30,621,670 | 36,077,114 | 2/20/19 | 839,529 | — | |||||||||||||||||||||
British Pound | BOFA | Sell | 20,537,861 | 26,994,143 | 4/24/19 | 657,787 | — | |||||||||||||||||||||
British Pound | BONY | Sell | 8,444,536 | 11,048,478 | 4/24/19 | 219,780 | — | |||||||||||||||||||||
British Pound | SSBT | Sell | 7,902,049 | 10,367,561 | 4/24/19 | 234,511 | — | |||||||||||||||||||||
British Pound | UBSW | Sell | 64,124,829 | 83,971,526 | 4/24/19 | 1,742,208 | — | |||||||||||||||||||||
Euro | BONY | Sell | 4,328,745 | 4,975,884 | 5/07/19 | — | (38,442 | ) | ||||||||||||||||||||
South Korean Won | BONY | Sell | 2,059,403,700 | 1,857,494 | 5/17/19 | — | (1,458 | ) | ||||||||||||||||||||
South Korean Won | HSBK | Sell | 13,624,861,962 | 12,272,439 | 5/17/19 | — | (26,248 | ) | ||||||||||||||||||||
South Korean Won | UBSW | Sell | 10,198,195,503 | 9,121,821 | 5/17/19 | — | (83,735 | ) | ||||||||||||||||||||
Euro | HSBK | Sell | 7,000,000 | 8,085,560 | 5/21/19 | — | (32,976 | ) | ||||||||||||||||||||
Euro | UBSW | Sell | 10,774,803 | 12,426,322 | 5/21/19 | — | (70,196 | ) | ||||||||||||||||||||
British Pound | BOFA | Sell | 3,100,000 | 3,951,446 | 5/28/19 | — | (30,155 | ) | ||||||||||||||||||||
British Pound | BOFA | Sell | 39,485,330 | 51,130,739 | 5/28/19 | 416,277 | — | |||||||||||||||||||||
British Pound | UBSW | Sell | 3,255,729 | 4,146,468 | 5/28/19 | — | (35,148 | ) | ||||||||||||||||||||
Total Forward Exchange Contracts |
| $ | 10,826,136 | $ | (552,749 | ) | ||||||||||||||||||||||
Net unrealized appreciation (depreciation) |
| $ | 10,273,387 | |||||||||||||||||||||||||
aMay be comprised of multiple contracts with the same counterparty, currency and settlement date.
See Note 11 regarding other derivative information.
See Abbreviations on page 46.
| 26 |
Annual Report | The accompanying notes are an integral part of these financial statements. | franklintempleton.com | ||
FRANKLIN MUTUAL QUEST FUND
Statement of Assets and Liabilities
December 31, 2018
Assets: | ||
Investments in securities: | ||
Cost - Unaffiliated issuers | $4,712,531,107 | |
Cost -Non-controlled affiliates (Note 12) | 224,767,151 | |
Value - Unaffiliated issuers | $4,157,760,833 | |
Value -Non-controlled affiliates (Note 12) | 212,369,841 | |
Cash | 936,579 | |
Foreign currency, at value (cost $4,648,014) | 4,647,932 | |
Receivables: | ||
Investment securities sold | 12,329,160 | |
Capital shares sold | 19,409,584 | |
Dividends and interest | 27,049,251 | |
European Union tax reclaims | 678,204 | |
Deposits with brokers for: | ||
Securities sold short | 5,598,869 | |
Futures contracts | 3,805,100 | |
Unrealized appreciation on OTC forward exchange contracts | 10,826,136 | |
Other assets | 602 | |
Total assets | 4,455,412,091 | |
Liabilities: | ||
Payables: | ||
Investment securities purchased | 31,582,350 | |
Capital shares redeemed | 20,510,648 | |
Management fees | 2,593,424 | |
Distribution fees | 749,443 | |
Transfer agent fees | 555,671 | |
Trustees’ fees and expenses | 325,839 | |
Variation margin on futures contracts | 323,025 | |
Options written, at value (premiums received $3,634,397) | 9,682,165 | |
Securities sold short, at value (proceeds $6,812,019) | 5,471,761 | |
Unrealized depreciation on OTC forward exchange contracts | 552,749 | |
Accrued expenses and other liabilities | 331,370 | |
Total liabilities | 72,678,445 | |
Net assets, at value | $4,382,733,646 | |
Net assets consist of: | ||
Paid-in capital | $5,039,901,053 | |
Total distributable earnings (loss) | (657,167,407) | |
Net assets, at value | $4,382,733,646 |
| franklintempleton.com |
The accompanying notes are an integral part of these financial statements. | Annual Report | 27 | ||||
FRANKLIN MUTUAL QUEST FUND
FINANCIAL STATEMENTS
Statement of Assets and Liabilities(continued)
December 31, 2018
| Class Z: | ||||
Net assets, at value | $ | 3,054,791,977 | ||
Shares outstanding | 235,860,626 | |||
Net asset value and maximum offering price per share | $12.95 | |||
| Class A: | ||||
Net assets, at value | $ | 1,067,382,000 | ||
Shares outstanding | 83,706,781 | |||
Net asset value per sharea | $12.75 | |||
Maximum offering price per share (net asset value per share ÷ 94.50%) | $13.49 | |||
| Class C: | ||||
Net assets, at value | $ | 141,618,743 | ||
Shares outstanding | 11,208,122 | |||
Net asset value and maximum offering price per sharea | $12.64 | |||
| Class R: | ||||
Net assets, at value | $ | 2,928,533 | ||
Shares outstanding | 233,513 | |||
Net asset value and maximum offering price per share | $12.54 | |||
| Class R6: | ||||
Net assets, at value | $ | 116,012,393 | ||
Shares outstanding | 8,968,411 | |||
Net asset value and maximum offering price per share | $12.94 | |||
aRedemption price is equal to net asset value less contingent deferred sales charges, if applicable.
| 28 |
Annual Report | The accompanying notes are an integral part of these financial statements. | franklintempleton.com | ||
FRANKLIN MUTUAL QUEST FUND
FINANCIAL STATEMENTS
Statement of Operations
for the year ended December 31, 2018
Investment income: | ||
Dividends: (net of foreign taxes)* | ||
Unaffiliated issuers | $ 70,483,620 | |
Non-controlled affiliates (Note 12) | 8,060,815 | |
Interest: | ||
Unaffiliated issuers | 93,741,565 | |
Non-controlled affiliates (Note 12) | 16,242,426 | |
Total investment income | 188,528,426 | |
Expenses: | ||
Management fees (Note 3a) | 34,004,202 | |
Distribution fees: (Note 3c) | ||
Class A | 2,832,709 | |
Class C | 2,682,478 | |
Class R | 12,976 | |
Transfer agent fees: (Note 3e) | ||
Class Z | 2,661,719 | |
Class A | 858,081 | |
Class C | 203,220 | |
Class R | 1,977 | |
Class R6 | 51,462 | |
Custodian fees (Note 4) | 184,714 | |
Reports to shareholders | 257,040 | |
Registration and filing fees | 125,792 | |
Professional fees | 301,257 | |
Trustees’ fees and expenses | 307,899 | |
Dividends on securities sold short | 85,034 | |
Other | 139,093 | |
Total expenses | 44,709,653 | |
Expense reductions (Note 4) | (53,182) | |
Expenses waived/paid by affiliates (Note 3f) | (26,682) | |
Net expenses | 44,629,789 | |
Net investment income | 143,898,637 | |
Realized and unrealized gains (losses): | ||
Net realized gain (loss) from: | ||
Investments:# | ||
Unaffiliated issuers | 351,560,640 | |
Non-controlled affiliates (Note 12) | (37,212,425) | |
Written options | 7,714,755 | |
Foreign currency transactions | (2,002,644) | |
Forward exchange contracts | 15,828,101 | |
Futures contracts | 12,355,366 | |
Securities sold short | 6,259,980 | |
Net realized gain (loss) | 354,503,773 | |
Net change in unrealized appreciation (depreciation) on: | ||
Investments: | ||
Unaffiliated issuers | (879,741,850) | |
Non-controlled affiliates (Note 12) | 34,888,173 | |
Translation of other assets and liabilities denominated in foreign currencies | (240,598) | |
Forward exchange contracts | 21,687,122 | |
Written options | (7,361,465) | |
Futures contracts | 2,649,713 | |
Securities sold short | 1,340,258 | |
Change in deferred taxes on unrealized appreciation | 680,769 | |
Net change in unrealized appreciation (depreciation) | (826,097,878) |
| franklintempleton.com |
The accompanying notes are an integral part of these financial statements. | Annual Report | 29 | ||||
FRANKLIN MUTUAL QUEST FUND
FINANCIAL STATEMENTS
Statement of Operations(continued)
for the year ended December 31, 2018
Net realized and unrealized gain (loss) | (471,594,105) | |
Net increase (decrease) in net assets resulting from operations | $(327,695,468) |
*Foreign taxes withheld on dividends | $ | 3,932,837 | ||
#Net of foreign taxes | $ | 541,756 |
| 30 |
Annual Report | The accompanying notes are an integral part of these financial statements. | franklintempleton.com | ||
FRANKLIN MUTUAL QUEST FUND
FINANCIAL STATEMENTS
Statements of Changes in Net Assets
| Year Ended December 31, | ||||||||
| 2018 | 2017 | |||||||
Increase (decrease) in net assets: | ||||||||
Operations: | ||||||||
Net investment income | $ | 143,898,637 | $ | 188,827,274 | ||||
Net realized gain (loss) | 354,503,773 | 37,699,757 | ||||||
Net change in unrealized appreciation (depreciation) | (826,097,878 | ) | 122,317,207 | |||||
Net increase (decrease) in net assets resulting from operations | (327,695,468 | ) | 348,844,238 | |||||
Distributions to shareholders: (Note 1h) | ||||||||
Class Z | (375,929,219 | ) | (172,576,004 | ) | ||||
Class A | (130,844,029 | ) | (52,162,156 | ) | ||||
Class C | (15,959,447 | ) | (11,931,942 | ) | ||||
Class R | (352,629 | ) | (74,588 | ) | ||||
Class R6 | (14,194,157 | ) | (4,916,992 | ) | ||||
Total distributions to shareholders | (537,279,481 | ) | (241,661,682 | ) | ||||
Capital share transactions: (Note 2) | ||||||||
Class Z | (10,462,191 | ) | (94,442,773 | ) | ||||
Class A | 126,783,503 | (85,348,310 | ) | |||||
Class C | (141,318,519 | ) | (41,119,296 | ) | ||||
Class R | 1,767,885 | 879,482 | ||||||
Class R6 | 14,919,716 | 72,905,275 | ||||||
Total capital share transactions | (8,309,606 | ) | (147,125,622 | ) | ||||
Net increase (decrease) in net assets | (873,284,555 | ) | (39,943,066 | ) | ||||
Net assets: | ||||||||
Beginning of year | 5,256,018,201 | 5,295,961,267 | ||||||
End of year (Note 1h) | $ | 4,382,733,646 | $ | 5,256,018,201 | ||||
franklintempleton.com | The accompanying notes are an integral part of these financial statements. | Annual Report | 31 | ||||
FRANKLIN MUTUAL QUEST FUND
1. Organization and Significant Accounting Policies
Franklin Mutual Series Funds (Trust) is registered under the Investment Company Act of 1940 (1940 Act) as anopen-end management investment company, consisting of seven separate funds and applies the specialized accounting and reporting guidance in U.S. Generally Accepted Accounting Principles (U.S. GAAP). Franklin Mutual Quest Fund (Fund) is included in this report. The Fund offers five classes of shares: Class Z, Class A, Class C, Class R and Class R6. Beginning on October 19, 2018, Class C shares automatically convert to Class A shares after they have been held for 10 years. Each class of shares may differ by its initial sales load, contingent deferred sales charges, voting rights on matters affecting a single class, its exchange privilege and fees due to differing arrangements for distribution and transfer agent fees.
The following summarizes the Fund’s significant accounting policies.
a. Financial Instrument Valuation
The Fund’s investments in financial instruments are carried at fair value daily. Fair value is the price that would be received to sell an asset or paid to transfer a liability in an orderly transaction between market participants on the measurement date. The Fund calculates the net asset value (NAV) per share each business day as of 4 p.m. Eastern time or the regularly scheduled close of the New York Stock Exchange (NYSE), whichever is earlier. Under compliance policies and procedures approved by the Trust’s Board of Trustees (the Board), the Fund’s administrator has responsibility for oversight of valuation, including leading the cross-functional Valuation Committee (VC). The Fund may utilize independent pricing services, quotations from securities and financial instrument dealers, and other market sources to determine fair value.
Equity securities and derivative financial instruments listed on an exchange or on the NASDAQ National Market System are valued at the last quoted sale price or the official closing price of the day, respectively. Foreign equity securities are valued as of the close of trading on the foreign stock exchange on which the security is primarily traded, or as of 4 p.m. Eastern time. The value is then converted into its U.S. dollar equivalent at the foreign exchange rate in effect at 4 p.m. Eastern time on the day that the value of the security is determined.Over-the-counter (OTC) securities are valued within the range of the most recent quoted bid and ask prices. Securities that trade in multiple
markets or on multiple exchanges are valued according to the broadest and most representative market. Certain equity securities are valued based upon fundamental characteristics or relationships to similar securities.
Debt securities generally trade in the OTC market rather than on a securities exchange. The Fund’s pricing services use multiple valuation techniques to determine fair value. In instances where sufficient market activity exists, the pricing services may utilize a market-based approach through which quotes from market makers are used to determine fair value. In instances where sufficient market activity may not exist or is limited, the pricing services also utilize proprietary valuation models which may consider market characteristics such as benchmark yield curves, credit spreads, estimated default rates, anticipated market interest rate volatility, coupon rates, anticipated timing of principal repayments, underlying collateral, and other unique security features in order to estimate the relevant cash flows, which are then discounted to calculate the fair value.
Certain derivative financial instruments trade in the OTC market. The Fund’s pricing services use various techniques including industry standard option pricing models and proprietary discounted cash flow models to determine the fair value of those instruments. The Fund’s net benefit or obligation under the derivative contract, as measured by the fair value of the contract, is included in net assets.
The Fund has procedures to determine the fair value of financial instruments for which market prices are not reliable or readily available. Under these procedures, the Fund primarily employs a market-based approach which may use related or comparable assets or liabilities, recent transactions, market multiples, book values, and other relevant information for the investment to determine the fair value of the investment. An income-based valuation approach may also be used in which the anticipated future cash flows of the investment are discounted to calculate fair value. Discounts may also be applied due to the nature or duration of any restrictions on the disposition of the investments. Due to the inherent uncertainty of valuations of such investments, the fair values may differ significantly from the values that would have been used had an active market existed.
Trading in securities on foreign securities stock exchanges and OTC markets may be completed before 4 p.m. Eastern time. In addition, trading in certain foreign markets may not take place on every Fund’s business day. Occasionally, events occur
| 32 |
Annual Report | franklintempleton.com | ||
FRANKLIN MUTUAL QUEST FUND
NOTES TO FINANCIAL STATEMENTS
between the time at which trading in a foreign security is completed and 4 p.m. Eastern time that might call into question the reliability of the value of a portfolio security held by the Fund. As a result, differences may arise between the value of the Fund’s portfolio securities as determined at the foreign market close and the latest indications of value at 4 p.m. Eastern time. In order to minimize the potential for these differences, the VC monitors price movements following the close of trading in foreign stock markets through a series of country specific market proxies (such as baskets of American Depositary Receipts, futures contracts and exchange traded funds). These price movements are measured against established trigger thresholds for each specific market proxy to assist in determining if an event has occurred that may call into question the reliability of the values of the foreign securities held by the Fund. If such an event occurs, the securities may be valued using fair value procedures, which may include the use of independent pricing services. At December 31, 2018, a market event occurred resulting in a portion of the securities held by the Fund being valued using fair value procedures.
When the last day of the reporting period is anon-business day, certain foreign markets may be open on those days that the Fund’s NAV is not calculated, which could result in differences between the value of the Fund’s portfolio securities on the last business day and the last calendar day of the reporting period. Any significant security valuation changes due to an open foreign market are adjusted and reflected by the Fund for financial reporting purposes.
b. Foreign Currency Translation
Portfolio securities and other assets and liabilities denominated in foreign currencies are translated into U.S. dollars based on the exchange rate of such currencies against U.S. dollars on the date of valuation. The Fund may enter into foreign currency exchange contracts to facilitate transactions denominated in a foreign currency. Purchases and sales of securities, income and expense items denominated in foreign currencies are translated into U.S. dollars at the exchange rate in effect on the transaction date. Portfolio securities and assets and liabilities denominated in foreign currencies contain risks that those currencies will decline in value relative to the U.S. dollar. Occasionally, events may impact the availability or reliability of foreign exchange rates used to convert the U.S. dollar equivalent value. If such an event occurs, the foreign exchange rate will be valued at fair value using procedures established and approved by the Board.
The Fund does not separately report the effect of changes in foreign exchange rates from changes in market prices on securities held. Such changes are included in net realized and unrealized gain or loss from investments in the Statement of Operations.
Realized foreign exchange gains or losses arise from sales of foreign currencies, currency gains or losses realized between the trade and settlement dates on securities transactions and the difference between the recorded amounts of dividends, interest, and foreign withholding taxes and the U.S. dollar equivalent of the amounts actually received or paid. Net unrealized foreign exchange gains and losses arise from changes in foreign exchange rates on foreign denominated assets and liabilities other than investments in securities held at the end of the reporting period.
c. Securities Purchased on a Delayed Delivery Basis
The Fund purchases securities on a delayed delivery basis, with payment and delivery scheduled for a future date. These transactions are subject to market fluctuations and are subject to the risk that the value at delivery may be more or less than the trade date purchase price. Although the Fund will generally purchase these securities with the intention of holding the securities, it may sell the securities before the settlement date. Sufficient assets have been segregated for these securities.
d. Derivative Financial Instruments
The Fund invested in derivative financial instruments in order to manage risk or gain exposure to various other investments or markets. Derivatives are financial contracts based on an underlying or notional amount, require no initial investment or an initial net investment that is smaller than would normally be required to have a similar response to changes in market factors, and require or permit net settlement. Derivatives contain various risks including the potential inability of the counterparty to fulfill their obligations under the terms of the contract, the potential for an illiquid secondary market, and/or the potential for market movements which expose the Fund to gains or losses in excess of the amounts shown in the Statement of Assets and Liabilities. Realized gain and loss and unrealized appreciation and depreciation on these contracts for the period are included in the Statement of Operations.
Derivative counterparty credit risk is managed through a formal evaluation of the creditworthiness of all potential counter-parties. The Fund attempts to reduce its exposure to
| franklintempleton.com |
Annual Report | 33 | ||||
FRANKLIN MUTUAL QUEST FUND
NOTES TO FINANCIAL STATEMENTS
1. Organization and Significant Accounting
Policies (continued)
d. Derivative Financial Instruments(continued)
counterparty credit risk on OTC derivatives, whenever possible, by entering into International Swaps and Derivatives Association (ISDA) master agreements with certain counterparties. These agreements contain various provisions, including but not limited to collateral requirements, events of default, or early termination. Termination events applicable to the counterparty include certain deteriorations in the credit quality of the counterparty. Termination events applicable to the Fund include failure of the Fund to maintain certain net asset levels and/or limit the decline in net assets over various periods of time. In the event of default or early termination, the ISDA master agreement gives thenon-defaulting party the right to net andclose-out all transactions traded, whether or not arising under the ISDA agreement, to one net amount payable by one counterparty to the other. However, absent an event of default or early termination, OTC derivative assets and liabilities are presented gross and not offset in the Statement of Assets and Liabilities. Early termination by the counterparty may result in an immediate payment by the Fund of any net liability owed to that counterparty under the ISDA agreement. At December 31, 2018, the Fund had no OTC derivatives in a net liability position for such contracts.
Collateral requirements differ by type of derivative. Collateral or initial margin requirements are set by the broker or exchange clearing house for exchange traded and centrally cleared derivatives. Initial margin deposited is held at the exchange and can be in the form of cash and/or securities. For OTC derivatives traded under an ISDA master agreement, posting of collateral is required by either the Fund or the applicable counterparty if the total net exposure of all OTC derivatives with the applicable counterparty exceeds the minimum transfer amount, which typically ranges from $100,000 to $250,000, and can vary depending on the counterparty and the type of the agreement. Generally, collateral is determined at the close of Fund business each day and any additional collateral required due to changes in derivative values may be delivered by the Fund or the counterparty the next business day, or within a few business days. Collateral pledged and/or received by the Fund for OTC derivatives, if any, is held in segregated accounts with the Fund’s custodian/counterparty broker and can be in the form of cash and/or securities. Unrestricted cash may be invested according to the Fund’s investment objectives. To the extent
that the amounts due to the Fund from its counterparties are not subject to collateralization or are not fully collateralized, the Fund bears the risk of loss from counterpartynon-performance.
At December 31, 2018, the Fund received $11,910,188 in U.K. Treasury Bonds and U.S. Treasury Bills, Bonds and Notes as collateral for derivatives.
The Fund entered into exchange traded futures contracts primarily to manage exposure to certain foreign currencies. A futures contract is an agreement between the Fund and a counterparty to buy or sell an asset at a specified price on a future date. Required initial margins are pledged by the Fund, and the daily change in fair value is accounted for as a variation margin payable or receivable in the Statement of Assets and Liabilities.
The Fund entered into OTC forward exchange contracts primarily to manage exposure to certain foreign currencies. A forward exchange contract is an agreement between the Fund and a counterparty to buy or sell a foreign currency at a specific exchange rate on a future date.
The Fund purchased or wrote exchange traded option contracts primarily to manage exposure to equity price risk. An option is a contract entitling the holder to purchase or sell a specific amount of shares or units of an asset or notional amount of a swap (swaption), at a specified price. When an option is purchased or written, an amount equal to the premium paid or received is recorded as an asset or liability, respectively. Upon exercise of an option, the acquisition cost or sales proceeds of the underlying investment is adjusted by any premium received or paid. Upon expiration of an option, any premium received or paid is recorded as a realized gain or loss. Upon closing an option other than through expiration or exercise, the difference between the premium received or paid and the cost to close the position is recorded as a realized gain or loss.
See Note 11 regarding other derivative information.
e. Securities Sold Short
The Fund is engaged in selling securities short, which obligates the Fund to replace a borrowed security with the same security at current fair value. The Fund incurs a loss if the price of the security increases between the date of the short sale and the date on which the Fund replaces the borrowed security. The Fund
| 34 |
Annual Report | franklintempleton.com | ||
FRANKLIN MUTUAL QUEST FUND
NOTES TO FINANCIAL STATEMENTS
realizes a gain if the price of the security declines between those dates. Gains are limited to the price at which the Fund sold the security short, while losses are potentially unlimited in size.
The Fund is required to establish a margin account with the broker lending the security sold short. While the short sale is outstanding, the broker retains the proceeds of the short sale to the extent necessary to meet margin requirements until the short position is closed out. A deposit must also be maintained with the Fund’s custodian/counterparty broker consisting of cash and/or securities having a value equal to a specified percentage of the value of the securities sold short. The Fund is obligated to pay fees for borrowing the securities sold short and is required to pay the counterparty any dividends and/or interest due on securities sold short. Such dividends and/or interest and any security borrowing fees are recorded as an expense to the Fund.
f. Senior Floating Rate Interests
The Fund invests in senior secured corporate loans that pay interest at rates which are periodically reset by reference to a base lending rate plus a spread. These base lending rates are generally the prime rate offered by a designated U.S. bank or the London InterBank Offered Rate (LIBOR). Senior secured corporate loans often require prepayment of principal from excess cash flows or at the discretion of the borrower. As a result, actual maturity may be substantially less than the stated maturity. Senior secured corporate loans in which the Fund invests are generally readily marketable, but may be subject to certain restrictions on resale.
g. Income and Deferred Taxes
It is the Fund’s policy to qualify as a regulated investment company under the Internal Revenue Code. The Fund intends to distribute to shareholders substantially all of its taxable income and net realized gains to relieve it from federal income and excise taxes. As a result, no provision for U.S. federal income taxes is required.
The Fund may be subject to foreign taxation related to income received, capital gains on the sale of securities and certain foreign currency transactions in the foreign jurisdictions in which it invests. Foreign taxes, if any, are recorded based on the tax regulations and rates that exist in the foreign markets in which the Fund invests. When a capital gain tax is determined to apply, the Fund records an estimated deferred tax liability in an amount that would be payable if the securities were disposed of on the valuation date.
As a result of several court cases, in certain countries across the European Union, the Fund filed additional tax reclaims for previously withheld taxes on dividends earned in those countries (EU reclaims). These additional filings are subject to various administrative proceedings by the local jurisdictions’ tax authorities within the European Union, as well as a number of related judicial proceedings. Income recognized, if any, for EU reclaims is reflected as other income in the Statement of Operations and any related receivable, if any, is reflected as European Union tax reclaims in the Statement of Assets and Liabilities. When uncertainty exists as to the ultimate resolution of these proceedings, the likelihood of receipt of these EU reclaims, and the potential timing of payment, no amounts are reflected in the financial statements. For U.S. income tax purposes, EU reclaims received by the Fund, if any, reduce the amounts of foreign taxes Fund shareholders can use as tax credits in their individual income tax returns.
The Fund may recognize an income tax liability related to its uncertain tax positions under U.S. GAAP when the uncertain tax position has a less than 50% probability that it will be sustained upon examination by the tax authorities based on its technical merits. As of December 31, 2018, the Fund has determined that no tax liability is required in its financial statements related to uncertain tax positions for any open tax years (or expected to be taken in future tax years). Open tax years are those that remain subject to examination and are based on the statute of limitations in each jurisdiction in which the Fund invests.
h. Security Transactions, Investment Income, Expenses and Distributions
Security transactions are accounted for on trade date. Realized gains and losses on security transactions are determined on a specific identification basis. Interest income and estimated expenses are accrued daily. Amortization of premium and accretion of discount on debt securities are included in interest income. Dividend income and dividends declared on securities sold short are recorded on theex-dividend date except for certain dividends from securities where the dividend rate is not available. In such cases, the dividend is recorded as soon as the information is received by the Fund. Distributions to shareholders are recorded on theex-dividend date. Distributable earnings are determined according to income tax regulations (tax basis) and may differ from earnings recorded in accordance with U.S. GAAP. These differences may be permanent or temporary. Permanent differences are reclassified among capital
| franklintempleton.com |
Annual Report | 35 | ||||
FRANKLIN MUTUAL QUEST FUND
NOTES TO FINANCIAL STATEMENTS
1. Organization and Significant Accounting
Policies(continued)
h. Security Transactions, Investment Income, Expenses
and Distributions(continued)
accounts to reflect their tax character. These reclassifications have no impact on net assets or the results of operations. Temporary differences are not reclassified, as they may reverse in subsequent periods.*
Common expenses incurred by the Trust are allocated among the Funds based on the ratio of net assets of each Fund to the combined net assets of the Trust or based on the ratio of number of shareholders of each Fund to the combined number of shareholders of the Trust. Fund specific expenses are charged directly to the Fund that incurred the expense.
Realized and unrealized gains and losses and net investment income, excluding class specific expenses, are allocated daily to each class of shares based upon the relative proportion of net assets of each class. Differences in per share distributions by class are generally due to differences in class specific expenses.
i. Accounting Estimates
The preparation of financial statements in accordance with U.S. GAAP requires management to make estimates and assumptions that affect the reported amounts of assets and liabilities at the date of the financial statements and the amounts of income and expenses during the reporting period. Actual results could differ from those estimates.
j. Guarantees and Indemnifications
Under the Trust’s organizational documents, its officers and trustees are indemnified by the Trust against certain liabilities arising out of the performance of their duties to the Trust. Additionally, in the normal course of business, the Trust, on behalf of the Fund, enters into contracts with service providers that contain general indemnification clauses. The Trust’s maximum exposure under these arrangements is unknown as this would involve future claims that may be made against the Trust that have not yet occurred. Currently, the Trust expects the risk of loss to be remote.
*Effective during the current reporting period, it is no longer required to present certain line items in the Statements of Changes in Net Assets. The below prior period amounts affected by this change are shown as they were in the prior year Statements of Changes in Net Assets.
For the year ended December 31, 2017, distributions to shareholders were as follows:
Distributions from net investment income : | ||||
Class Z | $ | (141,121,394 | ) | |
Class A | (42,192,676 | ) | ||
Class C | (9,158,365 | ) | ||
Class R | (62,381 | ) | ||
Class R6 | (4,613,009 | ) | ||
Distributions from net realized gains: | ||||
Class Z | (31,454,610 | ) | ||
Class A | (9,969,480 | ) | ||
Class C | (2,773,577 | ) | ||
Class R | (12,207 | ) | ||
Class R6 | (303,983 | ) |
For the year ended December 31, 2017, distributions in excess of net investment income included in net assets was $(4,820,394).
| 36 |
Annual Report | franklintempleton.com | ||
FRANKLIN MUTUAL QUEST FUND
NOTES TO FINANCIAL STATEMENTS
2. Shares of Beneficial Interest
At December 31, 2018, there were an unlimited number of shares authorized (without par value). Transactions in the Fund’s shares were as follows:
| Year Ended December 31, | ||||||||||||||||
| 2018 | 2017 | |||||||||||||||
| Shares | Amount | Shares | Amount | |||||||||||||
| Class Z Shares: | ||||||||||||||||
Shares sold | 19,486,438 | $ | 309,433,086 | 27,728,870 | $ | 439,840,070 | ||||||||||
Shares issued in reinvestment of distributions | 27,534,405 | 355,938,444 | 10,319,549 | 163,868,714 | ||||||||||||
Shares redeemed | (42,815,519 | ) | (675,833,721 | ) | (43,674,171 | ) | (698,151,557 | ) | ||||||||
Net increase (decrease) | 4,205,324 | $ | (10,462,191 | ) | (5,625,752 | ) | $ | (94,442,773 | ) | |||||||
| Class A Shares: | ||||||||||||||||
Shares solda | 18,112,061 | $ | 282,062,168 | 13,056,163 | $ | 204,059,076 | ||||||||||
Shares issued in reinvestment of distributions | 10,086,321 | 128,317,894 | 3,269,611 | 51,185,442 | ||||||||||||
Shares redeemed | (18,481,020 | ) | (283,596,559 | ) | (21,720,286 | ) | (340,592,828 | ) | ||||||||
Net increase (decrease) | 9,717,362 | $ | 126,783,503 | (5,394,512 | ) | $ | (85,348,310 | ) | ||||||||
| Class C Shares: | ||||||||||||||||
Shares sold | 2,391,188 | $ | 36,406,068 | 3,143,553 | $ | 48,265,137 | ||||||||||
Shares issued in reinvestment of distributions | 1,234,078 | 15,734,249 | 767,506 | 11,797,949 | ||||||||||||
Shares redeemeda | (12,562,392 | ) | (193,458,836 | ) | (6,578,117 | ) | (101,182,382 | ) | ||||||||
Net increase (decrease) | (8,937,126 | ) | $ | (141,318,519 | ) | (2,667,058 | ) | $ | (41,119,296 | ) | ||||||
| Class R Shares: | ||||||||||||||||
Shares sold | 121,081 | $ | 1,898,376 | 93,915 | $ | 1,451,999 | ||||||||||
Shares issued in reinvestment of distributions | 28,180 | 352,629 | 4,829 | 74,588 | ||||||||||||
Shares redeemed | (30,958 | ) | (483,120 | ) | (41,676 | ) | (647,105 | ) | ||||||||
Net increase (decrease) | 118,303 | $ | 1,767,885 | 57,068 | $ | 879,482 | ||||||||||
| Class R6 Shares: | ||||||||||||||||
Shares sold | 2,288,195 | $ | 36,596,048 | 6,529,553 | $ | 105,932,665 | ||||||||||
Shares issued in reinvestment of distributions | 1,096,020 | 14,150,067 | 310,142 | 4,916,992 | ||||||||||||
Shares redeemed | (2,247,945 | ) | (35,826,399 | ) | (2,378,788 | ) | (37,944,382 | ) | ||||||||
Net increase (decrease) | 1,136,270 | $ | 14,919,716 | 4,460,907 | $ | 72,905,275 | ||||||||||
aMay include a portion of Class C shares that were automatically converted to Class A.
3. Transactions with Affiliates
Franklin Resources, Inc. is the holding company for various subsidiaries that together are referred to as Franklin Templeton. Certain officers and trustees of the Fund are also officers and/or directors of the following subsidiaries:
| Subsidiary | Affiliation | |||
Franklin Mutual Advisers, LLC (Franklin Mutual) | Investment manager | |||
Franklin Templeton Services, LLC (FT Services) | Administrative manager | |||
Franklin Templeton Distributors, Inc. (Distributors) | Principal underwriter | |||
Franklin Templeton Investor Services, LLC (Investor Services) | Transfer agent |
franklintempleton.com |
Annual Report |
37 |
FRANKLIN MUTUAL QUEST FUND
NOTES TO FINANCIAL STATEMENTS
3. Transactions with Affiliates(continued)
a. Management Fees
The Fund pays an investment management fee to Franklin Mutual based on the average daily net assets of the Fund as follows:
| Annualized Fee Rate | Net Assets | |||
0.675% | Up to and including $5 billion | |||
0.645% | Over $5 billion, up to and including $7 billion | |||
0.625% | Over $7 billion, up to and including $10 billion | |||
0.615% | In excess of $10 billion |
For the year ended December 31, 2018, the gross effective investment management fee rate was 0.675% of the Fund’s average daily net assets.
b. Administrative Fees
Under an agreement with Franklin Mutual, FT Services provides administrative services to the Fund. The fee is paid by Franklin Mutual based on the Fund’s average daily net assets, and is not an additional expense of the Fund.
c. Distribution Fees
The Board has adopted distribution plans for each share class, with the exception of Class Z and Class R6 shares, pursuant to Rule12b-1 under the 1940 Act. Under the Fund’s Class A reimbursement distribution plan, the Fund reimburses Distributors for costs incurred in connection with the servicing, sale and distribution of the Fund’s shares up to the maximum annual plan rate. Under the Class A reimbursement distribution plan, costs exceeding the maximum for the current plan year cannot be reimbursed in subsequent periods. In addition, under the Fund’s Class C and R compensation distribution plans, the Fund pays Distributors for costs incurred in connection with the servicing, sale and distribution of the Fund’s shares up to the maximum annual plan rate for each class. The plan year, for purposes of monitoring compliance with the maximum annual plan rates, is February 1 through January 31.
The maximum annual plan rates, based on the average daily net assets, for each class, are as follows:
Class A | 0.35 | % | ||
Class C | 1.00 | % | ||
Class R | 0.50 | % |
The Board has set the current rate at 0.25% per year for Class A shares until further notice and approval by the Board.
d. Sales Charges/Underwriting Agreements
Front-end sales charges and contingent deferred sales charges (CDSC) do not represent expenses of the Fund. These charges are deducted from the proceeds of sales of Fund shares prior to investment or from redemption proceeds prior to remittance, as applicable. Distributors has advised the Fund of the following commission transactions related to the sales and redemptions of the Fund’s shares for the year:
Sales charges retained net of commissions paid to unaffiliated brokers/dealers | $ | 212,044 | ||
CDSC retained | $ | 15,616 |
Effective September 10, 2018, the Board approved changes to certainfront-end sales charges and dealer commissions on Class A shares. Further details are disclosed in the Fund’s Prospectus.
38 |
Annual Report |
franklintempleton.com |
FRANKLIN MUTUAL QUEST FUND
NOTES TO FINANCIAL STATEMENTS
e. Transfer Agent Fees
Each class of shares pays transfer agent fees to Investor Services for its performance of shareholder servicing obligations. The fees are based on an annualized asset based fee of 0.02% plus a transaction based fee. In addition, each class reimburses Investor Services for out of pocket expenses incurred and, except for Class R6 reimburses shareholder servicing fees paid to third parties. These fees are allocated daily based upon their relative proportion of such classes’ aggregate net assets. Class R6 pays Investor Services transfer agent fees specific to that class.
For the year ended December 31, 2018, the Fund paid transfer agent fees of $3,776,459, of which $2,016,676 was retained by Investor Services.
f. Waiver and Expense Reimbursements
Investor Services has voluntarily agreed in advance to waive or limit its fees so that the Class R6 transfer agent fees do not exceed 0.02% based on the average net assets of the class. Investor Services may discontinue this waiver in the future.
4. Expense Offset Arrangement
The Fund has entered into an arrangement with its custodian whereby credits realized as a result of uninvested cash balances are used to reduce a portion of the Fund’s custodian expenses. During the year ended December 31, 2018, the custodian fees were reduced as noted in the Statement of Operations.
5. Independent Trustees’ Retirement Plan
On January 1, 1993, the Trust adopted an Independent Trustees’ Retirement Plan (Plan). The Plan is an unfunded defined benefit plan that provides benefit payments to Trustees whose length of service and retirement age meets the eligibility requirements of the Plan. Benefits under the Plan are based on years of service and fees paid to each trustee at the time of retirement. Effective in December 1996, the Plan was closed to new participants.
During the year ended December 31, 2018, the Fund’s projected benefit obligation and benefit payments under the Plan were as follows:
aProjected benefit obligation at December 31, 2018 | $ | 325,839 | ||||||
bIncrease in projected benefit obligation | $ | 81,688 | ||||||
Benefit payments made to retired trustees | $ | (5,416 | ) | |||||
aThe projected benefit obligation is included in trustees’ fees and expenses in the Statement of Assets and Liabilities.
bThe increase in projected benefit obligation is included in trustees’ fees and expenses in the Statement of Operations.
6. Income Taxes
For tax purposes, capital losses may be carried over to offset future capital gains. At December 31, 2018, the Fund had long-term capital loss carryforwards of $5,625,011, not subject to expiration, which is from the acquired Franklin Mutual Recovery Fund, which may be carried over to offset future capital gains, subject to certain limitations.
During the year ended December 31, 2018, the Fund utilized $41,936,870 of capital loss carryforwards.
On December 31, 2018, the Fund had expired capital loss carryforwards of $18,751,585, which were reclassified topaid-in capital.
For tax purposes, the Fund may elect to defer any portion of a post-October capital loss or late-year ordinary loss to the first day of the following fiscal year. At December 31, 2018, the Fund deferred post-October capital losses of $15,196,442.
| franklintempleton.com |
Annual Report | 39 | ||||
FRANKLIN MUTUAL QUEST FUND
NOTES TO FINANCIAL STATEMENTS
6. Income Taxes(continued)
The tax character of distributions paid during the years ended December 31, 2018 and 2017, was as follows:
| 2018 | 2017 | |||||||
|
| |||||||
Distributions paid from: | ||||||||
Ordinary income | $ | 242,783,398 | $ | 229,143,200 | ||||
Long term capital gain | 294,496,083 | 12,518,482 | ||||||
|
| |||||||
| $ | 537,279,481 | $ | 241,661,682 | |||||
|
| |||||||
At December 31, 2018, the cost of investments, net unrealized appreciation (depreciation) and undistributed ordinary income for income tax purposes were as follows:
Cost of investments | $ | 5,006,291,199 | ||
|
| |||
Unrealized appreciation | $ | 248,019,542 | ||
Unrealized depreciation | (888,903,550) | |||
|
| |||
Net unrealized appreciation (depreciation) | $ | (640,884,008) | ||
|
| |||
Distributable earnings: | ||||
Undistributed ordinary income | $ | 4,789,380 | ||
|
| |||
Differences between income and/or capital gains as determined on a book basis and a tax basis are primarily due to differing treatments of foreign currency transactions and wash sales.
The Fund utilized a tax accounting practice to treat a portion of the proceeds from capital shares redeemed as a distribution from realized capital gains.
7. Investment Transactions
Purchases and sales of investments (excluding short term securities and securities sold short) for the year ended December 31, 2018, aggregated $4,962,627,185 and $5,068,940,096, respectively.
8. Credit Risk and Defaulted Securities
The Fund may purchase thepre-default or defaulted debt of distressed companies. Distressed companies are financially troubled and could be or are already involved in financial restructuring or bankruptcy. Risks associated with purchasing these securities include the possibility that the bankruptcy or other restructuring process takes longer than expected, or that distributions in restructuring are less than anticipated, either or both of which may result in unfavorable consequences to the Fund. If it becomes probable that the income on debt securities, including those of distressed companies, will not be collected, the Fund discontinues accruing income and recognizes an adjustment for uncollectible interest.
At December 31, 2018, the aggregate long value of distressed company securities for which interest recognition has been discontinued was $129,612,753, representing 3.0% of the Fund’s net assets. For information as to specific securities, see the accompanying Statement of Investments.
| 40 |
Annual Report | franklintempleton.com | ||
FRANKLIN MUTUAL QUEST FUND
NOTES TO FINANCIAL STATEMENTS
9. Concentration of Risk
Investing in foreign securities may include certain risks and considerations not typically associated with investing in U.S. securities, such as fluctuating currency values and changing local and regional economic, political and social conditions, which may result in greater market volatility. Current political and financial uncertainty surrounding the European Union may increase market volatility and the economic risk of investing in securities in Europe. In addition, certain foreign securities may not be as liquid as U.S. securities.
10. Restricted Securities
The Fund invests in securities that are restricted under the Securities Act of 1933 (1933 Act). Restricted securities are often purchased in private placement transactions, and cannot be sold without prior registration unless the sale is pursuant to an exemption under the 1933 Act. Disposal of these securities may require greater effort and expense, and prompt sale at an acceptable price may be difficult. The Fund may have registration rights for restricted securities. The issuer generally incurs all registration costs.
At December 31, 2018, investments in restricted securities, excluding securities exempt from registration under the 1933 Act deemed to be liquid, were as follows:
| Principal Amount/ Shares/ Warrants | Issuer | Acquisition Date | Cost | Value | ||||||||||
| 9,272 | Broadband Ventures III LLC, secured promissory note, 5.00%, 2/01/12 | 7/01/10 - 11/30/12 | $ | 9,272 | $ | — | ||||||||
| 2,548,299 | International Automotive Components Group Brazil LLC | 4/13/06 - 12/26/08 | 1,692,334 | 107,989 | ||||||||||
| 19,924,658 | International Automotive Components Group North America LLC | 1/02/06 - 3/18/13 | 16,305,945 | 2,375,020 | ||||||||||
| 1,110,000 | aLee Enterprises Inc., wts., 12/31/22 | 3/31/14 | 1,490,026 | 217,582 | ||||||||||
| 224,279 | bSorenson Communications LLC, Membership Interests | 4/30/14 | — | 155,100,344 | ||||||||||
| 17,873,000 | Sunshine Oilsands Ltd., secured note, 144A, 10.00%, 8/01/17 | 8/04/14 | 17,706,373 | 3,563,602 | ||||||||||
|
| |||||||||||||
Total Restricted Securities(Value is 3.7% of Net Assets) | $ | 37,203,950 | $ | 161,364,537 | ||||||||||
|
| |||||||||||||
aThe Fund also invests in unrestricted securities or other investments in the issuer, valued at $156,877,655 as of December 31, 2018.
bThe Fund also invests in unrestricted securities or other investments in the issuer, valued at $253,833,998 as of December 31, 2018.
11. Other Derivative Information
At December 31, 2018, the Fund’s investments in derivative contracts are reflected in the Statement of Assets and Liabilities as follows:
Asset Derivatives | Liability Derivatives | |||||||||||
Derivative Contracts Not Accounted for as Hedging Instruments | Statement of Assets and Liabilities Location | Fair Value | Statement of Assets and Liabilities Location | Fair Value | ||||||||
| ||||||||||||
Foreign exchange contracts | Variation margin on futures contracts | $ | 151,409 | a | Variation margin on futures contracts | $ | — | |||||
Unrealized appreciation on OTC forward exchange contracts | 10,826,136 | Unrealized depreciation on OTC forward exchange contracts | 552,749 | |||||||||
Equity contracts | Investments in securities, at value | 6,100 | b | Options written, at value | 9,682,165 | |||||||
|
|
|
| |||||||||
Totals | $ | 10,983,645 | $ | 10,234,914 | ||||||||
|
|
|
| |||||||||
aThis amount reflects the cumulative appreciation (depreciation) of futures contracts as reported in the Statement of Investments. Only the variation margin receivable/ payable at year end is separately reported within the Statement of Assets and Liabilities. Prior variation margin movements were recorded to cash upon receipt or payment.
bPurchased option contracts are included in investments in securities, at value in the Statement of Assets and Liabilities.
| franklintempleton.com |
Annual Report | 41 | ||||
FRANKLIN MUTUAL QUEST FUND
NOTES TO FINANCIAL STATEMENTS
11. Other Derivative Information(continued)
For the year ended December 31, 2018, the effect of derivative contracts in the Fund’s Statement of Operations was as follows:
Derivative Contracts Not Accounted for as Hedging Instruments | Statement of Operations Location | Net Realized Gain (Loss) for the Year | Statement of Operations Location | Net Change in Unrealized Appreciation (Depreciation) for the Year | ||||||||
| ||||||||||||
| Net realized gain (loss) from: | Net change in unrealized appreciation (depreciation) on: | |||||||||||
Foreign exchange contracts | Forward exchange contracts | $15,828,101 | Forward exchange contracts | $21,687,122 | ||||||||
| Futures contracts | 12,355,366 | Futures contracts | 2,649,713 | |||||||||
Equity contracts | Investments | (3,532,714)a | Investments | (900,236)a | ||||||||
| Written options | 7,714,755 | Written options | (7,361,465) | |||||||||
|
|
|
| |||||||||
Totals | $32,365,508 | $16,075,134 | ||||||||||
|
|
|
| |||||||||
aPurchased option contracts are included in net realized gain (loss) from investments and net change in unrealized appreciation (depreciation) on investments in the Statement of Operations.
For the year ended December 31, 2018, the average month end notional amount of futures contracts and options represented $198,852,455 and 1,604,208 shares, respectively. The average month end contract value of forward exchange contracts was $563,615,472.
See Note 1(d) regarding derivative financial instruments.
12. Holdings of 5% Voting Securities of Portfolio Companies
The 1940 Act defines “affiliated companies” to include investments in portfolio companies in which a fund owns 5% or more of the outstanding voting securities. During the year ended December 31, 2018, investments in “affiliated companies” were as follows:
| Name of Issuer | Number of Shares/ Warrants/ Principal Amount Held at Beginning of Year | Gross Additions | Gross Reductions | Number of Shares/ Warrants/ Principal Amount Held at End of Year | Value at End of Year | Investment Income | Realized Gain (Loss) | Net Change in Unrealized Appreciation (Depreciation) | ||||||||||||||||||||||||
| Non-Controlled Affiliates | ||||||||||||||||||||||||||||||||
| Dividends | ||||||||||||||||||||||||||||||||
Advanced Emissions Solutions Inc. | 1,724,209 | — | — | 1,724,209 | $18,190,405 | $1,724,209 | $ — | $ 1,534,546 | ||||||||||||||||||||||||
Eastman Kodak Co. | 2,613,836 | — | (2,613,836 | ) | — | — | — | (35,037,722) | 40,973,441 | |||||||||||||||||||||||
Eastman Kodak Co., wts., 9/03/18 | 48,582 | — | (48,582 | ) | — | — | — | (1,462,104) | 1,558,221 | |||||||||||||||||||||||
Eastman Kodak Co., wts., 9/03/18 | 48,582 | — | (48,582 | ) | — | — | — | (1,296,546) | 1,379,940 | |||||||||||||||||||||||
Lee Enterprises Inc./IA | 4,824,268 | — | — | 4,824,268 | 10,179,206 | — | — | (1,157,824) | ||||||||||||||||||||||||
Lee Enterprises Inc., wts., 12/31/22 | 1,110,000 | — | — | 1,110,000 | 217,582 | — | — | (271,140) | ||||||||||||||||||||||||
New Media Investment Group Inc. | 4,932,482 | 811,410 | (2,538,689 | ) | 3,205,203 | 37,084,199 | 6,336,606 | (550,515) | (6,336,242) | |||||||||||||||||||||||
|
| |||||||||||||||||||||||||||||||
| $65,671,392 | $8,060,815 | $(38,346,887) | $37,680,942 | |||||||||||||||||||||||||||||
|
| |||||||||||||||||||||||||||||||
| 42 |
Annual Report | franklintempleton.com | ||
FRANKLIN MUTUAL QUEST FUND
NOTES TO FINANCIAL STATEMENTS
| Name of Issuer | Number of Shares/ Warrants/ Principal Amount Held at Beginning of Year | Gross Additions | Gross Reductions | Number of Shares/ Warrants/ Principal Amount Held at End of Year | Value at End of Year | Investment Income | Realized Gain (Loss) | Net Change in Unrealized Appreciation (Depreciation) | ||||||||||||||||||||||||
| Non-Controlled Affiliates(continued) |
| |||||||||||||||||||||||||||||||
| Interest | ||||||||||||||||||||||||||||||||
Eastman Kodak Co., Term Loan, 7.819%, (LIBOR + 6.25%), 9/03/19 | 37,302,241 | — | (37,302,241 | ) | — | $ — | $ 254,019 | $ (786,094 | ) | $ 3,495,088 | ||||||||||||||||||||||
Lee Enterprises Inc., Second Lien Term Loan, | 56,941,414 | — | (10,186,761 | ) | 46,754,653 | 47,222,199 | 3,105,659 | 151,645 | (2,185,128 | ) | ||||||||||||||||||||||
Lee Enterprises Inc., senior secured note, first lien, 144A, 9.50%, 3/15/22 | 99,050,000 | — | (2,000,000 | ) | 97,050,000 | 99,476,250 | 9,287,556 | 100,000 | (1,722,917 | ) | ||||||||||||||||||||||
New Media Holdings II LLC, Fourth Amendment Replacement Term Loans, 8.127%, (LIBOR + 6.25%), 7/14/22 | 111,005,571 | — | (111,005,571 | ) | — | — | 3,595,192 | 1,668,911 | (2,379,812 | ) | ||||||||||||||||||||||
|
| |||||||||||||||||||||||||||||||
| $146,698,449 | $16,242,426 | $ 1,134,462 | $ (2,792,769 | ) | ||||||||||||||||||||||||||||
|
| |||||||||||||||||||||||||||||||
Total Affiliated Securities(Value is 4.8% of Net Assets) |
| $212,369,841 | $24,303,241 | $(37,212,425 | ) | $34,888,173 | ||||||||||||||||||||||||||
|
| |||||||||||||||||||||||||||||||
13. Credit Facility
The Fund, together with other U.S. registered and foreign investment funds (collectively, Borrowers), managed by Franklin Templeton, are borrowers in a joint syndicated senior unsecured credit facility totaling $2 billion (Global Credit Facility) which matured on February 8, 2019. This Global Credit Facility provides a source of funds to the Borrowers for temporary and emergency purposes, including the ability to meet future unanticipated or unusually large redemption requests. Effective February 8, 2019, the Borrowers renewed the Global Credit Facility for a one year term, maturing February 7, 2020, for a total of $2 billion.
Under the terms of the Global Credit Facility, the Fund shall, in addition to interest charged on any borrowings made by the Fund and other costs incurred by the Fund, pay its share of fees and expenses incurred in connection with the implementation and maintenance of the Global Credit Facility, based upon its relative share of the aggregate net assets of all of the Borrowers, including an annual commitment fee of 0.15% based upon the unused portion of the Global Credit Facility. These fees are reflected in other expenses in the Statement of Operations. During the year ended December 31, 2018, the Fund did not use the Global Credit Facility.
14. Fair Value Measurements
The Fund follows a fair value hierarchy that distinguishes between market data obtained from independent sources (observable inputs) and the Fund’s own market assumptions (unobservable inputs). These inputs are used in determining the value of the Fund’s financial instruments and are summarized in the following fair value hierarchy:
| • | Level 1 – quoted prices in active markets for identical financial instruments |
| • | Level 2 – other significant observable inputs (including quoted prices for similar financial instruments, interest rates, prepayment speed, credit risk, etc.) |
| • | Level 3 – significant unobservable inputs (including the Fund’s own assumptions in determining the fair value of financial instruments) |
| franklintempleton.com |
Annual Report | 43 | ||||
FRANKLIN MUTUAL QUEST FUND
NOTES TO FINANCIAL STATEMENTS
14. Fair Value Measurements(continued)
The input levels are not necessarily an indication of the risk or liquidity associated with financial instruments at that level.
A summary of inputs used as of December 31, 2018, in valuing the Fund’s assets and liabilities carried at fair value, is as follows:
| Level 1 | Level 2 | Level 3 | Total | |||||||||||||
| Assets: | ||||||||||||||||
Investments in Securities:a | ||||||||||||||||
Equity Investments:b | ||||||||||||||||
Auto Components | $ | 12,886,297 | $ | 34,026,984 | $ | 2,483,009 | $ | 49,396,290 | ||||||||
Automobiles | — | 23,275,143 | — | 23,275,143 | ||||||||||||
Banks | 125,355,755 | 30,145,304 | — | 155,501,059 | ||||||||||||
Chemicals | 18,190,405 | 14,985,442 | — | c | 33,175,847 | |||||||||||
Communications Equipment | — | — | 155,100,344 | 155,100,344 | ||||||||||||
Diversified Consumer Services | — | — | 3,664,436 | 3,664,436 | ||||||||||||
Household Durables | 12,253,950 | 595,898 | — | 12,849,848 | ||||||||||||
Media | 212,270,278 | 1,273,722 | 217,582 | 213,761,582 | ||||||||||||
Software | 46,504,351 | 693,084 | — | 47,197,435 | ||||||||||||
Specialty Retail | — | 31,807,295 | — | 31,807,295 | ||||||||||||
All Other Equity Investments | 2,038,612,585 | — | — | 2,038,612,585 | ||||||||||||
Corporate Bonds, Notes and Senior Floating Rate Interests | — | 970,011,119 | — | 970,011,119 | ||||||||||||
Corporate Notes and Senior Floating Rate Interests in Reorganization | — | 126,049,151 | 3,563,602 | c | 129,612,753 | |||||||||||
Companies in Liquidation | — | 1,006,432 | — | c | 1,006,432 | |||||||||||
Options Purchased | 6,100 | — | — | 6,100 | ||||||||||||
Short Term Investments | 488,452,406 | 16,700,000 | — | 505,152,406 | ||||||||||||
|
| |||||||||||||||
Total Investments in Securities | $ | 2,954,532,127 | $ | 1,250,569,574 | $ | 165,028,973 | $ | 4,370,130,674 | ||||||||
|
| |||||||||||||||
Other Financial Instruments: | ||||||||||||||||
Futures Contracts | $ | 151,409 | $ | — | $ | — | $ | 151,409 | ||||||||
Forward Exchange Contracts | — | 10,826,136 | — | 10,826,136 | ||||||||||||
|
| |||||||||||||||
Total Other Financial Instruments | $ | 151,409 | $ | 10,826,136 | $ | — | $ | 10,977,545 | ||||||||
|
| |||||||||||||||
| Liabilities: | ||||||||||||||||
Other Financial Instruments: | ||||||||||||||||
Options Written | $ | 9,682,165 | $ | — | $ | — | $ | 9,682,165 | ||||||||
Securities Sold Shorta | 5,471,761 | — | — | 5,471,761 | ||||||||||||
Forward Exchange Contracts | — | 552,749 | — | 552,749 | ||||||||||||
|
| |||||||||||||||
Total Other Financial Instruments | $ | 15,153,926 | $ | 552,749 | $ | — | $ | 15,706,675 | ||||||||
|
| |||||||||||||||
aFor detailed categories, see the accompanying Statement of Investments.
bIncludes common, preferred and convertible preferred stocks and management investment companies as well as other equity interests.
cIncludes securities determined to have no value at December 31, 2018.
44 |
Annual Report |
franklintempleton.com |
FRANKLIN MUTUAL QUEST FUND
NOTES TO FINANCIAL STATEMENTS
A reconciliation of assets in which Level 3 inputs are used in determining fair value is presented when there are significant Level 3 financial instruments at the beginning and/or end of the year. At December 31, 2018, the reconciliation of assets is as follows:
| Balance at Beginning of Year | Purchases (Sales) | Transfer Into(Out of) Level 3a | Cost Basis Adjustmentsb | Net Realized Gain (Loss) | Net Unrealized Appreciation (Depreciation) | Balance at End of Year | Net Change in Unrealized Appreciation (Depreciation) on Assets Held at Year End | |||||||||||||||||||||||||
| Assets: | ||||||||||||||||||||||||||||||||
Investments in Securities: | ||||||||||||||||||||||||||||||||
Equity Investments:c | ||||||||||||||||||||||||||||||||
Auto Components | $ | 13,213,236 | $— | $ | — | $ — | $ — | $(10,730,227 | ) | $ 2,483,009 | $(10,730,227 | ) | ||||||||||||||||||||
Communications Equipment | 160,414,954 | — | — | — | — | (5,314,610 | ) | 155,100,344 | (5,314,610 | ) | ||||||||||||||||||||||
Diversified Consumer Services | 10,164,359 | — | — | — | — | (6,499,923 | ) | 3,664,436 | (6,499,923 | ) | ||||||||||||||||||||||
Media | 488,722 | — | — | — | — | (271,140 | ) | 217,582 | (271,140 | ) | ||||||||||||||||||||||
Software | 575,122 | — | (1,234,029 | ) | — | — | 658,907 | — | — | |||||||||||||||||||||||
Corporate Notes and Senior Floating Rate Interests in Reorganization | 8,657,697 | d | — | — | — | — | (5,094,095 | ) | 3,563,602 | d | (5,094,095 | ) | ||||||||||||||||||||
Companies in Liquidation | 1,680,146 | d | — | (1,738,082 | ) | (54,760 | ) | 54,760 | 57,936 | — | d | — | ||||||||||||||||||||
|
| |||||||||||||||||||||||||||||||
Total | $ | 195,194,236 | $— | $ | (2,972,111 | ) | $(54,760 | ) | $54,760 | $(27,193,152 | ) | $165,028,973 | $(27,909,995 | ) | ||||||||||||||||||
|
| |||||||||||||||||||||||||||||||
aThe investments were transferred out of Level 3 as a result of the removal of a significant unobservable valuation input.
bMay include accretion, amortization, partnership adjustments, and/or other cost basis adjustments.
cIncludes common stocks as well as other equity investments.
dIncludes securities determined to have no value.
Significant unobservable valuation inputs for material Level 3 financial instruments and impact to fair value as a result of changes in unobservable valuation inputs as of December 31, 2018, are as follows:
| Description | Fair Value at End of Year | Valuation Technique | Unobservable Inputs | Amount | Impact to Fair Value if Input Increasesa | |||||||||||
| Assets: | ||||||||||||||||
Investments in Securities: | ||||||||||||||||
Equity Investments: | ||||||||||||||||
Communications Equipment | $ | 155,100,344 | Market transaction | Transaction price weighting | 50% | Increaseb | ||||||||||
Market comparables | EV / EBITDA multiple | 4.1x | Increaseb | |||||||||||||
All Other Investmentsc | 9,928,629 | |||||||||||||||
Total | $ | 165,028,973 | ||||||||||||||
aRepresents the directional change in the fair value of the Level 3 financial instruments that would result from a significant and reasonable increase in the corresponding input. A significant and reasonable decrease in the input would have the opposite effect. Significant impacts, if any, to fair value and/or net assets have been indicated.
bRepresents a significant impact to fair value and net assets.
cIncludes fair value of immaterial financial instruments developed using various valuation techniques and unobservable inputs. May also include financial instruments with values derived using private transaction prices ornon-public third party pricing information which is unobservable.
Abbreviations List
| EBITDA | Earnings before interest, taxes, depreciation and amortization | |||||
| EV | Enterprise value |
franklintempleton.com |
Annual Report |
45 |
FRANKLIN MUTUAL QUEST FUND
NOTES TO FINANCIAL STATEMENTS
15. New Accounting Pronouncements
In August 2018, the Financial Accounting Standards Board issued Accounting Standards Update (ASU) No.2018-14, Compensation—Retirement Benefits—Defined Benefit Plans—General (Subtopic715-20): Disclosure Framework—Changes to the Disclosure Requirements for Defined Benefit Plans. The amendments in the ASU modify the disclosure requirements for employers that sponsor defined benefit pension or other postretirement plans. The ASU is effective for annual reporting periods ending after December 15, 2020. Management is currently evaluating the impact, if any, of applying this provision.
16. Subsequent Events
The Fund has evaluated subsequent events through the issuance of the financial statements and determined that no events have occurred that require disclosure other than those already disclosed in the financial statements.
Abbreviations
| Counterparty | Currency | Selected Portfolio | ||||||||
| BOFA | Bank of America Corp. | EUR | Euro | ADR | American Depositary Receipt | |||||
| BONY | The Bank of New York Mellon Corp. | GBP | British Pound | FHLB | Federal Home Loan Bank | |||||
| HSBK | HSBC Bank PLC | USD | United States Dollar | LIBOR | London InterBank Offered Rate | |||||
| SSBT | State Street Bank and Trust Co., N.A. | PIK | Payment-In-Kind | |||||||
| UBSW | UBS AG | |||||||||
46 |
Annual Report |
franklintempleton.com |
FRANKLIN MUTUAL QUEST FUND
Report of Independent Registered Public Accounting Firm
To the Board of Trustees of Franklin Mutual Series Funds and Shareholders of Franklin Mutual Quest Fund:
Opinion on the Financial Statements
We have audited the accompanying statement of assets and liabilities of Franklin Mutual Quest Fund (the “Fund”) (one of the funds constituting Franklin Mutual Series Funds), including the schedule of investments, as of December 31, 2018, and the related statement of operations for the year then ended, the statements of changes in net assets for each of the two years in the period then ended, the financial highlights for each of the five years in the period then ended and the related notes (collectively referred to as the “financial statements”). In our opinion, the financial statements present fairly, in all material respects, the financial position of Franklin Mutual Quest Fund (one of the funds constituting Franklin Mutual Series Funds) at December 31, 2018, the results of its operations for the year then ended, the changes in its net assets for each of the two years in the period then ended and its financial highlights for each of the five years in the period then ended, in conformity with U.S. generally accepted accounting principles.
Basis for Opinion
These financial statements are the responsibility of the Fund’s management. Our responsibility is to express an opinion on the Fund’s financial statements based on our audits. We are a public accounting firm registered with the Public Company Accounting Oversight Board (United States) (“PCAOB”) and are required to be independent with respect to the Fund in accordance with the U.S. federal securities laws and the applicable rules and regulations of the Securities and Exchange Commission and the PCAOB.
We conducted our audits in accordance with the standards of the PCAOB. Those standards require that we plan and perform the audit to obtain reasonable assurance about whether the financial statements are free of material misstatement, whether due to error or fraud. The Fund is not required to have, nor were we engaged to perform, an audit of the Fund’s internal control over financial reporting. As part of our audits, we are required to obtain an understanding of internal control over financial reporting, but not for the purpose of expressing an opinion on the effectiveness of the Fund’s internal control over financial reporting. Accordingly, we express no such opinion.
Our audits included performing procedures to assess the risks of material misstatement of the financial statements, whether due to error or fraud, and performing procedures that respond to those risks. Such procedures included examining, on a test basis, evidence regarding the amounts and disclosures in the financial statements. Our procedures included confirmation of securities owned as of December 31, 2018, by correspondence with the custodian and brokers or by other appropriate auditing procedures where replies from others were not received. Our audits also included evaluating the accounting principles used and significant estimates made by management, as well as evaluating the overall presentation of the financial statements. We believe that our audits provide a reasonable basis for our opinion.

We have served as the auditor of one or more Franklin investment companies since 1987.
Boston, Massachusetts
February 20, 2019
franklintempleton.com |
Annual Report |
47 |
FRANKLIN MUTUAL QUEST FUND
Under Section 852(b)(3)(C) of the Internal Revenue Code, the Fund hereby reports the maximum amount allowable but no less than $307,338,113 as a long term capital gain dividend for the fiscal year ended December 31, 2018.
Under Section 871(k)(2)(C) of the Internal Revenue Code, the Fund hereby reports the maximum amount allowable but no less than $71,042,189 as a short term capital gain dividend for purposes of the tax imposed under Section 871(a)(1)(A) of the Internal Revenue Code for the fiscal year ended December 31, 2018.
Under Section 854(b)(1)(A) of the Internal Revenue Code, the Fund hereby reports 6.44% of the ordinary income dividends as income qualifying for the dividends received deduction for the fiscal year ended December 31, 2018.
Under Section 854(b)(1)(B) of the Internal Revenue Code, the Fund hereby reports the maximum amount allowable but no less than $72,618,074 as qualified dividends for purposes of the maximum rate under Section 1(h)(11) of the Internal Revenue Code for the fiscal year ended December 31, 2018. Distributions, including qualified dividend income, paid during calendar year 2018 will be reported to shareholders on Form1099-DIV bymid-February 2019. Shareholders are advised to check with their tax advisors for information on the treatment of these amounts on their individual income tax returns.
Under Section 871(k)(1)(C) of the Internal Revenue Code, the Fund hereby reports the maximum amount allowable but no less than $93,093,041 as interest related dividends for purposes of the tax imposed under Section 871(a)(1)(A) of the Internal Revenue Code for the fiscal year ended December 31, 2018.
48 |
Annual Report |
franklintempleton.com |
FRANKLIN MUTUAL SERIES FUNDS
The name, year of birth and address of the officers and board members, as well as their affiliations, positions held with the Trust, principal occupations during at least the past five years and number of U.S. registered portfolios overseen in the Franklin Templeton Investments fund complex, are shown below. Generally, each board member serves until that person’s successor is elected and qualified.
Independent Board Members
Name, Year of Birth and Address | Position | Length of Time Served | Number of Portfolios in Fund Complex Overseen by Board Member* | Other Directorships Held During at Least the Past 5 Years | ||||
Edward I. Altman, Ph.D. (1941) c/o Franklin Mutual Advisers, LLC 101 John F. Kennedy Parkway Short Hills, NJ 07078-2716 | Trustee | Since 1987 | 14 | None | ||||
Principal Occupation During at Least the Past 5 Years: Max L. Heine Professor of Finance, Emeritus and Director of The Credit and Debt Markets Research Program, Salomon Center, Stern School of Business, New York University; editor and author of numerous financial publications; financial consultant; an adviser to numerous financial and publishing organizations; andformerly,Vice Director, Salomon Center, Stern School of Business, New York University. | ||||||||
Ann Torre Bates (1958) c/o Franklin Mutual Advisers, LLC 101 John F. Kennedy Parkway Short Hills, NJ 07078-2716 | Trustee | Since 1995 | 38 | Ares Capital Corporation (specialty finance company) (2010-present), United Natural Foods, Inc. (distributor of natural, organic and specialty foods) (2013-present), Allied Capital Corporation (financial services) (2003-2010), SLM Corporation (Sallie Mae) (1997-2014) and Navient Corporation (loan management, servicing and asset recovery) (2014-2016). | ||||
Principal Occupation During at Least the Past 5 Years: Director of various companies; andformerly,Executive Vice President and Chief Financial Officer, NHP Incorporated (manager of multifamily housing) (1995-1997); and Vice President and Treasurer, US Airways, Inc. (until 1995). | ||||||||
Burton J. Greenwald (1929) c/o Franklin Mutual Advisers, LLC 101 John F. Kennedy Parkway Short Hills, NJ 07078-2716 | Trustee and Vice Chairman | Trustee since 2002 and Vice Chairman since 2015 | 14 | Franklin Templeton Emerging Markets Debt Opportunities Fund PLC (1999-present) and Fiduciary International Ireland Limited (1999-2015). | ||||
Principal Occupation During at Least the Past 5 Years: Managing Director, B.J. Greenwald Associates (management consultants to the financial services industry); andformerly,Chairman, Fiduciary Trust International Funds; Executive Vice President, L.F. Rothschild Fund Management, Inc.; President and Director, Merit Mutual Funds; President, Underwriting Division and Director, National Securities & Research Corporation; Governor, Investment Company Institute; and Chairman, ICI Public Information Committee. | ||||||||
Jan Hopkins Trachtman (1947) c/o Franklin Mutual Advisers, LLC 101 John F. Kennedy Parkway Short Hills, NJ 07078-2716 | Trustee | Since 2009 | 14 | FinTech Acquisition Corp. III (special purpose fintech acquisition company) (2018-present) | ||||
Principal Occupation During at Least the Past 5 Years: President and Founder, The Jan Hopkins Group (communications consulting firm); serves on Advisory Board of Knight Bagehot Fellowship; andformerly,President, Economic Club of New York (2007-2015); Anchor/Correspondent, CNN Financial News (until 2003); Managing Director and Head of Client Communications, Citigroup Private Bank (until 2005);Off-Air reporter, ABC News’ World News Tonight; and Editor, CBS Network News. | ||||||||
Keith Mitchell (1954) c/o Franklin Mutual Advisers, LLC 101 John F. Kennedy Parkway Short Hills, NJ 07078-2716 | Trustee | Since 2009 | 14 | None | ||||
Principal Occupation During at Least the Past 5 Years: Director of various boards of asset management firms; andformerly,Managing Member, Mitchell, Hartley & Bechtel Advisers, LLC (formerly, Mitchell Advisers, LLC) (advisory firm) (2003-2015) and Managing Director, Putman Lovell NBF. | ||||||||
franklintempleton.com | Annual Report | 49 | ||||
FRANKLIN MUTUAL SERIES FUNDS
Independent Board Members(continued)
Name, Year of Birth and Address | Position | Length of Time Served | Number of Portfolios in Fund Complex Overseen by Board Member* | Other Directorships Held During at Least the Past 5 Years | ||||
David W. Niemiec (1949) c/o Franklin Mutual Advisers, LLC 101 John F. Kennedy Parkway Short Hills, NJ 07078-2716 | Trustee | Since 2015 | 38 | Hess Midstream Partners LP (oil and gas midstream infrastructure)(2017-present). | ||||
| Principal Occupation During at Least the Past 5 Years: | ||||||||
| Advisor, Saratoga Partners (private equity fund); andformerly, Managing Director, Saratoga Partners (1998-2001) and SBC Warburg Dillon Read (investment banking) (1997-1998); Vice Chairman, Dillon, Read & Co. Inc. (investment banking) (1991-1997); and Chief Financial Officer, Dillon, Read & Co. Inc. (1982-1997). | ||||||||
Charles Rubens II (1930) c/o Franklin Mutual Advisers, LLC 101 John F. Kennedy Parkway Short Hills, NJ 07078-2716 | Trustee | Since 1998 | 14 | None | ||||
| Principal Occupation During at Least the Past 5 Years: | ||||||||
| Private investor and president ofnon-profit organizations; andformerly, an executive of Time, Inc.; and Trustee of Colorado College. | ||||||||
Robert E. Wade (1946) c/o Franklin Mutual Advisers, LLC 101 John F. Kennedy Parkway Short Hills, NJ 07078-2716 | Trustee and Chairman of the Board | Trustee since 1993 and Chairman of the Board since 2005 | 38 | El Oro Ltd (investments)(2003-present). | ||||
| Principal Occupation During at Least the Past 5 Years: | ||||||||
| Attorney at law engaged in private practice as a sole practitioner (1972-2008) and member of various boards. | ||||||||
Gregory H. Williams (1943) c/o Franklin Mutual Advisers, LLC 101 John F. Kennedy Parkway Short Hills, NJ 07078-2716 | Trustee | Since 2015 | 14 | None | ||||
| Principal Occupation During at Least the Past 5 Years: | ||||||||
| Private investor; Consultant; andformerly, President, University of Cincinnati (2009-2012); President, The City College of New York (2001-2009); Dean, College of Law, Ohio State University (1993-2001); and Associate Vice President, Academic Affairs and Professor of Law, University of Iowa (1977-1993). | ||||||||
Interested Board Members and Officers
Name, Year of Birth and Address | Position | Length of Time Served | Number of Portfolios in Fund Complex Overseen by Board Member* | Other Directorships Held During at Least the Past 5 Years | ||||
**Gregory E. Johnson (1961) One Franklin Parkway San Mateo, CA 94403-1906 | Trustee | Since 2007 | 150 | None | ||||
| Principal Occupation During at Least the Past 5 Years: | ||||||||
| Chairman of the Board, Member – Office of the Chairman, Director and Chief Executive Officer, Franklin Resources, Inc.; officer and/or director or trustee, as the case may be, of some of the other subsidiaries of Franklin Resources, Inc. and of 42 of the investment companies in Franklin Templeton Investments; Vice Chairman, Investment Company Institute; andformerly, President, Franklin Resources, Inc.(1994-2015). | ||||||||
**Peter A. Langerman (1955) c/o Franklin Mutual Advisers, LLC 101 John F. Kennedy Parkway Short Hills, NJ 07078-2716 | Trustee, President, and Chief Executive Officer – Investment Management | Trustee since 2007, President, and Chief Executive Officer – Investment Management since 2005 | 7 | American International Group, Inc. (AIG) Credit Facility Trust (2010-2011). | ||||
| Principal Occupation During at Least the Past 5 Years: | ||||||||
| Chairman of the Board, Chief Executive Officer and President, Franklin Mutual Advisers, LLC; President and Chief Investment Officer, Franklin Advisory Services, LLC; and officer and/or director, as the case may be, of three of the investment companies in Franklin Templeton Investments. | ||||||||
| 50 |
Annual Report | franklintempleton.com | ||
FRANKLIN MUTUAL SERIES FUNDS
Interested Board Members and Officers(continued)
Name, Year of Birth and Address | Position | Length of Time Served | Number of Portfolios in Fund Complex Overseen by Board Member* | Other Directorships Held During at Least the Past 5 Years | ||||
Alison E. Baur (1964) One Franklin Parkway San Mateo, CA 94403-1906 | Vice President | Since 2012 | Not Applicable | Not Applicable | ||||
| Principal Occupation During at Least the Past 5 Years: | ||||||||
| Deputy General Counsel, Franklin Templeton Investments; and officer of some of the other subsidiaries of Franklin Resources, Inc. and of 44 of the investment companies in Franklin Templeton Investments. | ||||||||
Aliya S. Gordon (1973) One Franklin Parkway San Mateo, CA 94403-1906 | Vice President | Since 2009 | Not Applicable | Not Applicable | ||||
| Principal Occupation During at Least the Past 5 Years: | ||||||||
| Senior Associate General Counsel, Franklin Templeton Investments; and officer of 44 of the investment companies in Franklin Templeton Investments. | ||||||||
Steven J. Gray (1955) One Franklin Parkway San Mateo, CA 94403-1906 | Vice President and Secretary | Vice President since 2009 and Secretary since 2005 | Not Applicable | Not Applicable | ||||
| Principal Occupation During at Least the Past 5 Years: | ||||||||
| Senior Associate General Counsel, Franklin Templeton Investments; Vice President, Franklin Templeton Distributors, Inc. and FASA, LLC; and officer of 44 of the investment companies in Franklin Templeton Investments. | ||||||||
Matthew T. Hinkle (1971) One Franklin Parkway San Mateo, CA 94403-1906 | Chief Executive Officer – Finance and Administration | Since 2017 | Not Applicable | Not Applicable | ||||
| Principal Occupation During at Least the Past 5 Years: | ||||||||
| Senior Vice President, Franklin Templeton Services, LLC; officer of 44 of the investment companies in Franklin Templeton Investments; andformerly, Vice President, Global Tax (2012-April 2017) and Treasurer/Assistant Treasurer, Franklin Templeton Investments (2009-2017). | ||||||||
Robert G. Kubilis (1973) 300 S.E. 2nd Street Fort Lauderdale, FL 33301-1923 | Chief Financial Officer, Chief Accounting Officer and Treasurer | Since 2012 | Not Applicable | Not Applicable | ||||
| Principal Occupation During at Least the Past 5 Years: | ||||||||
| Treasurer, U.S. Fund Administration & Reporting, Franklin Templeton Investments; and officer of 16 of the investment companies in Franklin Templeton Investments. | ||||||||
Robert Lim (1948) One Franklin Parkway San Mateo, CA 94403-1906 | Vice President – AML Compliance | Since 2016 | Not Applicable | Not Applicable | ||||
| Principal Occupation During at Least the Past 5 Years: | ||||||||
| Vice President, Franklin Templeton Companies, LLC; Chief Compliance Officer, Franklin Templeton Distributors, Inc. and Franklin Templeton Investor Services, LLC; and officer of 44 of the investment companies in Franklin Templeton Investments. | ||||||||
Kimberly H. Novotny (1972) 300 S.E. 2nd Street Fort Lauderdale, FL 33301-1923 | Vice President | Since 2013 | Not Applicable | Not Applicable | ||||
| Principal Occupation During at Least the Past 5 Years: | ||||||||
| Associate General Counsel, Franklin Templeton Investments; Vice President and Corporate Secretary, Fiduciary Trust International of the South; Vice President, Templeton Investment Counsel, LLC; Assistant Secretary, Franklin Resources, Inc.; and officer of 44 of the investment companies in Franklin Templeton Investments. | ||||||||
franklintempleton.com | Annual Report | 51 | ||||
FRANKLIN MUTUAL SERIES FUNDS
Interested Board Members and Officers(continued)
Name, Year of Birth and Address | Position | Length of Time Served | Number of Portfolios in Fund Complex Overseen by Board Member* | Other Directorships Held During at Least the Past 5 Years | ||||
Robert C. Rosselot (1960) 300 S.E. 2nd Street Fort Lauderdale, FL 33301-1923 | Chief Compliance Officer | Since 2013 | Not Applicable | Not Applicable | ||||
| Principal Occupation During at Least the Past 5 Years: | ||||||||
| Director, Global Compliance, Franklin Templeton Investments; Vice President, Franklin Templeton Companies, LLC; officer of 44 of the investment companies in Franklin Templeton Investments; andformerly, Senior Associate General Counsel, Franklin Templeton Investments (2007-2013); and Secretary and Vice President, Templeton Group of Funds (2004-2013). | ||||||||
Navid J. Tofigh (1972) One Franklin Parkway San Mateo, CA 94403-1906 | Vice President | Since 2015 | Not Applicable | Not Applicable | ||||
| Principal Occupation During at Least the Past 5 Years: | ||||||||
| Associate General Counsel, Franklin Templeton Investments; and officer of 44 of the investment companies in Franklin Templeton Investments. | ||||||||
Craig S. Tyle (1960) One Franklin Parkway San Mateo, CA 94403-1906 | Vice President | Since 2005 | Not Applicable | Not Applicable | ||||
| Principal Occupation During at Least the Past 5 Years: | ||||||||
| General Counsel and Executive Vice President, Franklin Resources, Inc.; and officer of some of the other subsidiaries of Franklin Resources, Inc. and of 44 of the investment companies in Franklin Templeton Investments. | ||||||||
Lori A. Weber (1964) 300 S.E. 2nd Street Fort Lauderdale, FL 33301-1923 | Vice President | Since 2011 | Not Applicable | Not Applicable | ||||
| Principal Occupation During at Least the Past 5 Years: | ||||||||
| Senior Associate General Counsel, Franklin Templeton Investments; Assistant Secretary, Franklin Resources, Inc.; Vice President and Secretary, Templeton Investment Counsel, LLC; and officer of 44 of the investment companies in Franklin Templeton Investments. | ||||||||
| 52 |
Annual Report | franklintempleton.com | ||
FRANKLIN MUTUAL SERIES FUNDS
*We base the number of portfolios on each separate series of the U.S. registered investment companies within the Franklin Templeton Investments fund complex. These portfolios have a common investment manager or affiliated investment managers.
**Gregory E. Johnson is considered to be an interested person of the Fund under the federal securities laws due to his position as an officer and director of Franklin Resources, Inc. (Resources), which is the parent company of the Fund’s investment manager and distributor. Peter A. Langerman is considered to be an interested person of the Fund under the federal securities laws due to his position as an officer of Franklin Mutual Advisers, LLC, which is the Fund’s investment manager.
Note 1: Officer information is current as of the date of this report. It is possible that after this date, information about officers may change.
The Sarbanes-Oxley Act of 2002 and Rules adopted by the U.S. Securities and Exchange Commission require the Fund to disclose whether the Fund’s Audit Committee includes at least one member who is an audit committee financial expert within the meaning of such Act and Rules. The Fund’s Board has determined that there is at least one such financial expert on the Audit Committee and has designated each of Edward I. Altman, Ph.D., Ann Torre Bates and David W. Niemiec as an audit committee financial expert. The Board believes that Messrs. Altman and Niemiec and Ms. Bates qualify as such an expert in view of their extensive business background and experience. Mr. Altman has served as a member of the Fund Audit Committee since 1987. He currently serves as a Max L. Hine Professor of Finance, Emeritus and Director of The Credit and Debt Markets Research Program, Salomon Center, Stern School of Business, New York University. Ms. Bates has served as a member of the Fund Audit Committee since 1995. She currently serves as a director of Ares Capital Corporation (2010-present) and United Natural Foods, Inc. (2013-present) and was formerly a director of Navient Corporation from 2014 to 2016, SLM Corporation from 1997 to 2014 and Allied Capital Corporation from 2003 to 2010, Executive Vice President and Chief Financial Officer of NHP Incorporated from 1995 to 1997 and Vice President and Treasurer of US Airways, Inc. until 1995. Mr. Niemiec has served as a member of the Fund Audit Committee since 2015, currently serves as an Advisor to Saratoga Partners and was formerly its Managing Director from 1998 to 2001 and serves as a director of Hess Midstream Partners LP (2017-present). Mr. Niemiec was formerly a director of Emeritus Corporation from 1999 to 2010 and OSI Pharmaceuticals, Inc. from 2006 to 2010, Managing Director of SBC Warburg Dillon Read from 1997 to 1998, and was Vice Chairman from 1991 to 1997 and Chief Financial Officer from 1982 to 1997 of Dillon, Read & Co. Inc. As a result of such background and experience, the Board believes that Messrs. Altman and Niemiec and Ms. Bates have each acquired an understanding of generally accepted accounting principles and financial statements, the general application of such principles in connection with the accounting estimates, accruals and reserves, and analyzing and evaluating financial statements that present a breadth and level of complexity of accounting issues generally comparable to those of the Fund, as well as an understanding of internal controls and procedures for financial reporting and an understanding of audit committee functions. Messrs. Altman and Niemiec and Ms. Bates are independent Board members as that term is defined under the applicable U.S. Securities and Exchange Commission Rules and Releases.
The Statement of Additional Information (SAI) includes additional information about the board members and is available, without charge, upon request. Shareholders may call (800) DIALBEN/342-5236 to request the SAI.
| franklintempleton.com |
Annual Report | 53 | ||||
FRANKLIN MUTUAL SERIES FUNDS
FRANKLIN MUTUAL QUEST FUND
Proxy Voting Policies and Procedures
The Fund’s investment manager has established Proxy Voting Policies and Procedures (Policies) that the Fund uses to determine how to vote proxies relating to portfolio securities. Shareholders may view the Fund’s complete Policies online at franklintempleton.com. Alternatively, shareholders may request copies of the Policies free of charge by calling the Proxy Group collect at (954)527-7678 or by sending a written request to: Franklin Templeton Companies, LLC, 300 S.E. 2nd Street, Fort Lauderdale, FL 33301, Attention: Proxy Group. Copies of the Fund’s proxy voting records are also made available online at franklintempleton.com and posted on the U.S. Securities and Exchange Commission’s website at sec.gov and reflect the most recent12-month period ended June 30.
Quarterly Statement of Investments
The Trust, on behalf of the Fund, files a complete statement of investments with the U.S. Securities and Exchange Commission for the first and third quarters for each fiscal year on FormN-Q. Shareholders may view the filed FormN-Q by visiting the Commission’s website at sec.gov. The filed form may also be viewed and copied at the Commission’s Public Reference Room in Washington, DC. Information regarding the operations of the Public Reference Room may be obtained by calling(800) SEC-0330.
Householding of Reports and Prospectuses
You will receive the Fund’s financial reports every six months as well as an annual updated summary prospectus (prospectus available upon request). To reduce Fund expenses, we try to identify related shareholders in a household and send only one copy of the financial reports and summary prospectus. This process, called “householding,” will continue indefinitely unless you instruct us otherwise. If you prefer not to have these documents householded, please call us at (800)632-2301. At any time you may view current prospectuses/summary prospectuses and financial reports on our website. If you choose, you may receive these documents through electronic delivery.
54 |
Annual Report |
franklintempleton.com |
This page intentionally left blank.
This page intentionally left blank.
 | Annual Report and Shareholder Letter Franklin Mutual Quest Fund
Investment Manager Franklin Mutual Advisers, LLC
Distributor Franklin Templeton Distributors, Inc. (800) DIAL BEN®/342-5236 franklintempleton.com
Shareholder Services (800)632-2301 - (Class A, C, R & R6) (800)448-FUND - (Class Z) | |||
Authorized for distribution only when accompanied or preceded by a summary prospectus and/or prospectus. Investors should carefully consider a fund’s investment goals, risks, charges and expenses before investing. A prospectus contains this and other information; please read it carefully before investing.
To help ensure we provide you with quality service, all calls to and from our service areas are monitored and/or recorded. | ||||
| © 2019 Franklin Templeton Investments. All rights reserved. | 475 A 02/19 | |||
 | Annual Report and Shareholder Letter December 31, 2018 |

Internet Delivery of Fund Reports Unless You Request Paper Copies:Effective January 1, 2021, as permitted by the SEC, paper copies of the Fund’s shareholder reports will no longer be sent by mail, unless you specifically request them from the Fund or your financial intermediary. Instead, the reports will be made available on a website, and you will be notified by mail each time a report is posted and provided with a website link to access the report.
If you already elected to receive shareholder reports electronically, you will not be affected by this change and you need not take any action. If you have not signed up for electronic delivery, we would encourage you to join fellow shareholders who have. You may elect to receive shareholder reports and other communications electronically from the Fund by calling (800)632-2301 or by contacting your financial intermediary.
You may elect to continue to receive paper copies of all your future shareholder reports free of charge by contacting your financial intermediary or, if you invest directly with a Fund, calling (800)632-2301 to let the Fund know of your request. Your election to receive reports in paper will apply to all funds held in your account.
Franklin Templeton
Successful investing begins with ambition. And achievement only comes when you reach for it. That’s why we continually strive to deliver better outcomes for investors. No matter what your goals are, our deep, global investment expertise allows us to offer solutions that can help.
During our more than 70 years of experience, we’ve managed through all kinds of markets—up, down and those in between. We’re always preparing for what may come next. It’s because of this, combined with our strength as one of the world’s largest asset managers that we’ve earned the trust of millions of investors around the world.
Dear Franklin Mutual Shares Fund Shareholder:
Investors started 2018 seemingly with the wind at their back. The primary tailwinds were strong corporate earnings growth in most developed markets, healthy consumer and business investment spending, and the positive effect of major U.S. tax cuts. In addition, the global economy continued its steady expansion since the financial crisis of 2008–2009.
Unemployment continued to decline in the U.S. and other developed markets, while U.S. wage growth showed some signs of accelerating. As a result, equity markets reached new highs in August and September. However, volatility and market downturns soon made their mark on 2018. As measured by the Chicago Board Options Exchange Volatility Index (VIX), 2017 was the least volatile year on record for the Standard & Poor’s 500® Index (S&P 500®), but the VIX surged in February 2018 and jumped again in October and December 2018. Heightened trade tensions between the U.S. and China, growing market concern that the U.S. Federal Reserve (Fed) may raise interest rates too aggressively, geopolitical events in Europe and a growing belief that corporate earnings and economic growth will likely decelerate in 2019 hindered equity markets. A flattening U.S. Treasury yield curve and wider credit spreads were also important drivers of market turbulence. For the period ended December 31, 2018, U.S. stocks, as measured by the S&P 500, had a-4.38% total return.1 Stocks in global developed markets, as measured by the MSCI World Index (USD), had a-8.20% total return.1 The negative performance for the year was the result of a sharp market decline in the fourth quarter, with the S&P 500 and MSCI World Index returning-13.52% and-13.31%, respectively.1
While equity markets were broadly down for the year, there were pockets of positive performance concentrated in areas of growth and innovation, such as software, information technology services and segments of the health care sector. It is no surprise, therefore, that growth stocks managed to perform better than value stocks during the period. The Russell 1000® Growth Index had a-1.51% total return, while the Russell 1000® Value Index had a-8.27% total return.1
The return of volatility is an appropriate reminder that securities markets are dynamic. We believe active, professional investment management serves investors well since market volatility is more the norm than uninterrupted positive returns. Valuation is an essential factor in our analysis and we always ask ourselves if current and potential investments represent an attractive balance of risk and reward. We remain committed to abottom-up stock-picking process that is disciplined and driven by rigorous fundamental analysis that attempts to limit downside risk. In our view, investing in underappreciated and misunderstood companies with identifiable catalysts for unlocking shareholder value can offer significant upside potential as well as a degree of downside protection.
We also recognize the important role of financial advisors in today’s markets and encourage investors to continue to seek their advice. Amid changing markets and economic conditions, we are confident investors with a well-diversified portfolio and a patient, long-term outlook will be well positioned for the years ahead.
1. Source: Morningstar. Frank Russell Company is the source and owner of the trademarks, service marks and copyrights related to the Russell Indexes. Russell® is a trademark of Frank Russell Company.
See www.franklintempletondatasources.com for additional data provider information.
| Not FDIC Insured | | | May Lose Value | | | No Bank Guarantee |
franklintempleton.com |
Not part of the annual report |
1 |
On the following pages, the Fund’s portfolio management team reviews investment decisions that pertain to performance during the past 12 months in light of the economic environment and other factors. Please remember all securities markets fluctuate, as do mutual fund share prices.
We thank you for investing with Franklin Templeton, welcome your questions and comments, and look forward to continuing to serve your investment needs in the years ahead.
Sincerely,
Peter A. Langerman
Chairman, President and Chief Executive Officer
Franklin Mutual Advisers, LLC
This letter reflects our analysis and opinions as of December 31, 2018, unless otherwise indicated. The information is not a complete analysis of every aspect of any market, country, industry, security or fund. Statements of fact are from sources considered reliable.
Contents
Visitfranklintempleton.comfor fund updates, to access your account, or to find helpful financial planning tools.
2 |
Not part of the annual report |
franklintempleton.com |
This annual report for Franklin Mutual Shares Fund covers the fiscal year ended December 31, 2018.
Your Fund’s Goal and Main Investments
The Fund seeks capital appreciation, which may occasionally be short term, with income as a secondary goal. Under normal market conditions, the Fund invests primarily in equity securities, primarily common stock, of U.S. and foreign companies that the investment manager believes are available at market prices less than their intrinsic value. To a lesser extent, the Fund also invests in merger arbitrage securities and the debt and equity of distressed companies. The Fund may invest up to 35% of its assets in foreign securities, which may include sovereign debt and participations in foreign government debt. The Geographic Composition bar chart on this page lists the leading countries where the Fund invests.
Performance Overview
The Fund’s Class Z shares had a cumulative total return of-8.95% for the 12 months ended December 31, 2018. For comparison, the Fund’s benchmark, the Standard & Poor’s 500 Index (S&P 500), which is a broad measure of U.S. stock performance, had a total return of-4.38%.1 You can find more of the Fund’s performance data in the Performance Summary beginning on page 10.
Performance data represent past performance, which does not guarantee future results. Investment return and principal value will fluctuate, and you may have a gain or loss when you sell your shares. Current performance may differ from figures shown. For most recentmonth-end performance, go tofranklintempleton.comor call(800)342-5236.
Economic and Market Overview
The global economy expanded during the 12 months under review, despite weakness in certain regions. Global developed and emerging market stocks were aided at certain points during the period by higher crude oil prices, upbeat economic data, easing trade tensions and encouraging corporate earnings
Geographic Composition*
Based on Total Net Assets as of 12/31/18
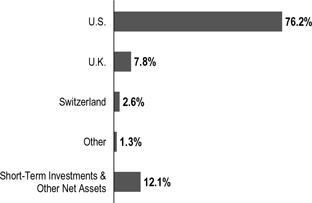
*Figures are stated as a percentage of total and may not equal 100% or may be negative due to rounding, use of any derivatives, unsettled trades or other factors.
reports, as well as indications of a slower pace of interest-rate increases from the U.S. Federal Reserve (Fed).
However, various factors weighed on global markets during the period, including concerns about tighter regulation of technology companies, political uncertainties in the U.S. and the European Union, and major central banks’ interest-rate path and unwinding of monetary stimulus measures. Markets were further pressured by U.S. trade disputes with its allies and China, and their impact on global growth and corporate earnings. In this environment, global stocks, as measured by the MSCI All Country World Index, had a-8.93% total return for the 12 months ended December 31, 2018.1
The U.S. economy grew during the12-month period. After moderating for three consecutive quarters, the economy grew faster in 2018’s second quarter, driven by consumer spending, business investment, exports and government spending. However, growth moderated in the third quarter due to declines in exports and housing investment. The unemployment rate declined from 4.1% in December 2017 to 3.9% atperiod-end.2 Annual inflation, as measured by the Consumer Price Index, decreased from 2.1% in December 2017 to 1.9% at
1. Source: Morningstar.
The index is unmanaged and includes reinvestment of any income or distributions. It does not reflect any fees, expenses or sales charges. One cannot invest directly in an index, and an index is not representative of the Fund’s portfolio.
2. Source: U.S. Bureau of Labor Statistics.
The dollar value, number of shares or principal amount, and names of all portfolio holdings are listed in the Fund’s Statement of Investments (SOI). The SOI begins on page 19.
franklintempleton.com |
Annual Report |
3 |
FRANKLIN MUTUAL SHARES FUND
period-end.2 The Fed raised its target range for the federal funds rate four times during the period, to 2.25%–2.50%, and continued reducing its balance sheet as part of an ongoing plan to normalize monetary policy. At its December meeting, the Fed reduced the projected 2019 rate increases to two, compared to three projected previously.
In Europe, the U.K.’s quarterly economic growth moderated in 2018’s first quarter, but accelerated in 2018’s second and third quarters. The Bank of England raised its key policy rate once during the review period. After moderating in 2018’s first quarter, the eurozone’s quarterly growth remained stable in the second quarter, but eased in the third quarter. The bloc’s annual inflation rate ended the period higher than in December 2017. The European Central Bank (ECB) kept its benchmark interest rate unchanged during the period. In December 2018, the ECB confirmed its plan to conclude its bond purchase program at the end of 2018 and reiterated it expects key interest rates to remain unchanged through the summer of 2019.
In Asia, Japan’s quarterly gross domestic product (GDP) grew in 2018’s second quarter, following a contraction in the first quarter, but contracted again in the third quarter. The Bank of Japan left its benchmark interest rate unchanged during the period and continued its monetary stimulus measures.
In emerging markets, Brazil’s quarterly GDP growth remained stable in 2018’s first and second quarters, but accelerated in the third quarter. The Central Bank of Brazil lowered its benchmark interest rate twice during the period. Russia’s annual GDP growth rate accelerated in 2018’s first and second quarters, but moderated in the third quarter. After lowering its key rate twice early in the period, the Bank of Russia raised it twice in the period’s second half to curtail inflation risks. China’s annual GDP grew at a stable rate in 2018’s first quarter, but it moderated in the second and third quarters. The People’s Bank of China left its benchmark interest rate unchanged during the period, but it took measures to improve financial liquidity to mitigate the negative effects of the U.S.-China trade dispute and support economic growth. Overall, emerging market stocks, as measured by the MSCI Emerging Markets Index, had a-14.25% total return during the period.1
Investment Strategy
At Franklin Mutual Series, we are committed to our distinctive value approach to investing, which we believe can generate above-average risk-adjusted returns over time for our shareholders. Our major investment strategy is investing in undervalued stocks. When selecting undervalued equities, we are attracted to what we believe are fundamentally strong
companies with healthy balance sheets, high-quality assets, substantial free cash flow and shareholder-oriented management teams and whose stocks are trading at discounts to our assessment of the companies’ intrinsic or business value. We also look for asset-rich companies whose shares may be trading at depressed levels due to concerns over short-term earnings disappointments, litigation, management strategy or other perceived negatives. This strict value approach is not only intended to improve the likelihood of upside potential, but also reduces the risk of substantial declines, in our opinion. While the vast majority of our undervalued equity investments are made in publicly traded companies globally, we may invest occasionally in privately held companies as well.
To a lesser extent, we complement this more traditional investment strategy with two others. One is distressed investing, a highly specialized field that has proven quite profitable during certain periods over the years. Distressed investing is complex and can take many forms. The most common distressed investment the Fund undertakes is the purchase of financially troubled or bankrupt companies’ debt at a substantial discount to face value. After the financially distressed company is reorganized, often in bankruptcy court, the old debt is typically replaced with new securities issued by the financially stronger company.
The other piece of our investment strategy is participating in arbitrage situations, another highly specialized field. When companies announce proposed mergers or takeovers, commonly referred to as “deals,” the target company may trade at a discount to the bid it ultimately accepts. One form of arbitrage involves purchasing the target company’s stock when it is trading below the value we believe it would receive in a deal. In keeping with our commitment to a relatively conservative investment approach, we typically focus our arbitrage efforts on announced deals, and avoid rumored deals or other situations we consider relatively risky. In addition, it is our practice to hedge the Fund’s currency exposure when we deem it advantageous for our shareholders.
What is meant by “hedge”?
To hedge an investment is to take a position intended to offset potential losses/gains that may be incurred by a companion financial instrument.
Manager’s Discussion
In 2018, corporate profits in the U.S. and other developed markets continued their impressive year-over-year growth. In addition, labor markets showed further improvement, consumer
4 |
Annual Report |
franklintempleton.com |
FRANKLIN MUTUAL SHARES FUND
spending was solid, and U.S. corporate tax reforms encouraged companies to buy back stock, raise dividends and increase capital expenditures. Those positive fundamentals were periodically overshadowed by political and economic concerns, particularly in the final three months of the year.
As major U.S. equity markets established newall-time highs in 2018, overall U.S. equity market valuations (e.g.,price-to-earnings,price-to-book orprice-to-sales) became increasingly unattractive, in our analysis. The equity marketsell-off in the fourth-quarter helped to return valuations to more reasonable levels. Thesell-off and rise in volatility yielded an opportunity for us to seek out stocks with strong corporate fundamentals and valuations whose risk/reward profiles seemed to us to have become more favorable.
In 2019, policy events may have considerable influence, for better or worse, on economic growth, investor sentiment and financial market performance and volatility. Markets are likely to be particularly sensitive to developments in U.S.-China trade relations, monetary policy moves by the Fed and other major central banks, oil production decisions by OPEC (The Organization of the Petroleum Exporting Countries) and other oil producing countries, the outcome of Brexit, China’s response to its slowing economy and potential political discord in Washington, D.C.
Europe’s equity market overall was trading at an attractively lowerprice-to-earnings multiple and higher dividend yield than the U.S. equity market atperiod-end. We also saw an increase in investor activism, which we viewed as encouraging. However, those favorable factors were offset in part by economic data, which showed increased slowing of economic activity across the region. From an investment standpoint, we are hopeful that 2019 will be a year of potential resolution and clarity. The biggest political event will likely be Brexit, as a resolution to the situation remained unclear as ofperiod-end. The uncertainty around the terms and timing of a deal continued to undermine consumer and corporate confidence. From our perspective, we believe the European Union and the U.K. will ultimately reach an agreement that makes sense for both sides, and we believe the approval of such an agreement would likely have a significantly positive effect on investor, consumer and corporate sentiment. We will also pay close attention to structural reform efforts in France and the political transition in Germany. In December, Chancellor Angela Merkel stepped down as leader of the Christian Democratic Union but stated her intention to remain in office for the remaining three years of her term as Chancellor.
| Top 10 Sectors/Industries | ||||
| Based on Equity Securities as of 12/31/18 | ||||
| % of Total Net Assets | ||||
Banks | 9.5% | |||
Insurance | 8.2% | |||
Oil, Gas & Consumable Fuels | 8.1% | |||
Pharmaceuticals | 7.1% | |||
Media | 4.8% | |||
Health Care Equipment & Supplies | 3.7% | |||
Technology Hardware, Storage & Peripherals | 3.2% | |||
Food & Staples Retailing | 2.9% | |||
Tobacco | 2.9% | |||
Household Durables | 2.6% | |||
Developments in Asia also weighed on U.S. equity markets, as the U.S.-China trade conflict has disrupted manufacturing activity and supply chains. Amid the trade conflict, China has proven resolute in its attempt to dampen the reliance on leverage, which has hindered economic activity as well. While the government has enacted some stimulus measures, such as tax cuts, they may be less impactful than prior stimulus through fiscal spending.
Investment Spotlight
In all market environments, we seek to invest prudently in securities that we believe represent good value. We do this by seeking securities that trade at a discount to our estimate of intrinsic value, taking into account the quality of the asset, the sustainability of returns, and the growth potential of the business. We also believe the potential to deliver the best risk-adjusted return over a full market cycle requires us to be focused on applying our cross-asset approach: owning equities and debt—in certain cases multiple securities across the capital structure of a company—across geographies and sectors with an emphasis on corporate actions as catalysts. Our health care sector positions are a good example of our investment process. They have been carefully selected over a number of years, and in 2018, many of our long-standing sector investments appreciated significantly. Collectively our sector exposure outperformed the health care sector within the MSCI World Index (USD).
Within the health care sector, our investment process has generally been focused on finding innovative companies that are market leaders and that invest substantial amounts of capital into research and development (R&D) as a means to sustain and grow market positions. In addition, many of our positions have been in diversified pharmaceutical companies that also have long-duration cash flows through their leading positions
franklintempleton.com |
Annual Report |
5 |
FRANKLIN MUTUAL SHARES FUND
in animal health, vaccine, andover-the-counter medicine businesses. These businesses can offer downside protection in years when pharmaceutical R&D is less successful or in years when important products lose patent protection. These businesses are attractive and have been undervalued by the market. This undervaluation allowed us to build positions, and in 2018, some of this undervaluation was reversed.
Eli Lilly and Merck are quintessential examples of our investment process. They are leading innovation-driven pharmaceutical companies that invest substantial amounts of capital into R&D to develop transformative medicines. Both companies have introduced innovative new products in the past many years like Trulicity for diabetes and Keytruda for oncology that we believe will continue to offer substantial long-term revenue growth. The management teams at both companies take a long-term view and focus on enhancing their market positions through both internal and external innovation. Acquiring late stage innovation can be expensive, which is why Lilly and Merck take a prudent approach to generally focusing on early stage assets. Competition is typically less intense for early stage assets, and they can add value through their own development process and pass along that value to shareholders. Shareholder focus also comes through at both companies by their return of excess capital to shareholders through large dividends and share buybacks.
In our view, both companies also have strong, long-duration assets. Lilly and Merck are the fourth and third largest players in animal health, respectively. In September 2018, Lilly sold some shares of Elanco3, its animal health division, through an initial public offering to create additional shareholder value, while Merck started providing segment level profit disclosures so investors could better appreciate the contribution and value of their animal health business. Merck is also the second largest player in vaccines, a highly attractive business that is underappreciated, in our opinion.
Another common feature between Lilly and Merck is their strong balance sheets. Both companies also generate substantial amounts of free cash flows, with a significant proportion returned to shareholders in the form of dividends and share buybacks. In addition, the two companies are focused on managing their business more efficiently and improving their operating margins, which we believe will lead to additional earnings growth over the next several years. The Top 10
Sectors/Industries table on page 5 lists pharmaceuticals and also other leading industries in which the Fund currently invests.
Mergers and Acquisitions
In health care and elsewhere, merger and acquisition (M&A) activity remained healthy in 2018. The market received some clarity regarding the regulatory environment when a federal judge ruled in favor of AT&T and Time Warner4, and against the U.S. Department of Justice, in its antitrust lawsuit. However, economic, financial market and geopolitical uncertainty that arose in the second half of the year caused the pace of activity to slow. In our view, it was notable that health care has become one of the busier sectors for M&A as it is relatively more insulated from economic uncertainty. The strength and path of M&A activity in 2019 will likely depend in large part on how the uncertainties carrying over from 2018 play out and how they affect equity markets. From our experience, ups and downs in equity market performance and levels of deal activity have tended to move in a similar direction.
Credit Markets
Finding mispriced risk in credit markets was challenging in 2018. Low interest rates kept credit widely available, default rates remained at historically low levels and we continued to witness a loosening in debt covenant terms, which include restrictions on financial activities by the borrower or parameters for specific financial metrics. Liberal interpretations of credit agreements and bond indentures in order to shift valuable assets beyond the reach of creditors were an ongoing challenge. In such an environment, we found more opportunities investing in short-term mispriced risk rather than long-term restructurings.
However, we are hopeful that more opportunities may emerge in 2019, especially if we are starting to enter latter stages of the business cycle. U.S. monetary policy is becoming less accommodative, economic growth appears to be downshifting into a slower pace, earnings growth is set to slow, and geopolitical uncertainty is on the rise. These dynamics have already contributed to a general rise in financial market volatility. At the same time, the amount of lower-rated investment-grade credit stands at a historically high level on an absolute basis and relative to corporate debt markets overall.
3. Not a Fund holding.
4. Not held atperiod-end.
See www.franklintempletondatasources.com for additional data provider information.
6 |
Annual Report |
franklintempleton.com |
FRANKLIN MUTUAL SHARES FUND
We believe default rates and the pace of corporate downgrades could begin to pick up in 2019. As a result, 2019 could bring a rise in fallen-angel opportunities (bonds downgraded from investment-grade to junk status) and idiosyncratic opportunities inout-of-favor industries. We will continue to look for opportunities across the capital structures of companies with liquidity-enhancing events, such as asset sales, the ability to issue secured debt within existing agreements, and free cash flow that could buy time for a company to weather its financial storm.
Fund Performance
Turning to Fund performance, top positive contributors included U.S.-based pharmaceutical company Eli Lilly, global research-driven pharmaceutical company Merck and multinational software company Microsoft. Eli Lilly and Merck are listed among the Fund’s largest positions in the Top 10 Equity Holdings table on this page.
Shares of Eli Lilly were boosted in large part by a series of strong quarterly results during 2018. Attractive corporate fundamentals and fewer investor concerns regarding the direct impact on the pharmaceutical industry from the Trump administration’s efforts to lower prescription drug prices helped push the stock higher. We believe Eli Lilly continues to have a strong product growth story and room for further margin expansion, in addition to having solid research and development capabilities.
Merck is a global research-driven pharmaceutical company with strong market positions in oncology, diabetes, vaccines and animal health. Investors remained upbeat about its future prospects, particularly its Keytruda oncology drug. Merck released clinical trial results, which showed that for the first-line treatment of metastatic nonsquamousnon-small lung cancer patients, Keytruda combined with chemotherapy substantially extended survival of patients compared with chemotherapy alone. The Keytruda results set a high bar for competition and appeared to enhance Keytruda’s prospects to gain share in the sizeable market for lung cancer treatment. Results from a competitor, Bristol-Myers Squibb3, were less compelling in a different clinical trial in lung cancer. In October 2018, Merck raised its dividend and authorized a new large share buyback plan.
Microsoft continued to reap the rewards of its rapidly growing cloud computing business and its efforts to move Microsoft Office software clients to a subscription-based service. In 2018, Microsoft reported solid quarterly growth in revenues and earnings per share. In April 2018, it also increased its operating margin estimate for the fiscal year ended June 30, 2018. We
| Top 10 Equity Holdings | ||||
| 12/31/18 | ||||
Company Sector/Industry, Country | % of Total Net Assets | |||
| Medtronic PLC Health Care Equipment & Supplies, U.S. | 3.7% | |||
| Novartis AG Pharmaceuticals, Switzerland | 2.6% | |||
| Merck & Co. Inc. Pharmaceuticals, U.S. | 2.5% | |||
| The Walt Disney Co. Entertainment, U.S. | 2.4% | |||
| Eli Lilly & Co. Pharmaceuticals, U.S. | 2.3% | |||
| JPMorgan Chase & Co. Banks, U.S. | 2.2% | |||
| Cisco Systems Inc. Communications Equipment, U.S. | 2.0% | |||
| Charter Communications Inc. Media, U.S. | 2.0% | |||
| Royal Dutch Shell PLC Oil, Gas & Consumable Fuels, U.K. | 1.9% | |||
| Wells Fargo & Co. Banks, U.S. | 1.9% | |||
believe Microsoft’s cloud computing and subscription-based services can continue to grow at a strong pace, which may likely further lift its operating margin. We exited the position as the stock price reached our estimate of fair value.
During the period under review, Fund investments that detracted from performance included U.K.-based British American Tobacco, U.S.-based insurer American International Group (AIG) and U.S.-based industrials company General Electric (GE).
Shares of British American Tobacco faced downward pressure due to potential additional U.S. regulation and concerns regarding next generation products. In March 2018, the U.S. Food and Drug Administration (FDA) issued an Advance Notice of Proposed Rulemaking, which started the process of examining the possibility of regulating nicotine levels in combustible cigarettes. The process may not result in regulation, but if it does, many experts believe the review could take seven to 10 years. Meanwhile, JUUL, produced by JUUL Labs3, has emerged as a populare-cigarette for young U.S. consumers. It is unclear to what degree JUUL is cannibalizing the combustible market, but it has hurt investor sentiment toward the industry. In November, shares of British American Tobacco and industry peers dropped, as the FDA revisited the possibility of banning menthol as a flavor in cigarettes, which would take years with many steps to complete, and in our
franklintempleton.com |
Annual Report |
7 |
FRANKLIN MUTUAL SHARES FUND
opinion, an FDA proposal would face litigation from the industry. Industry experts have suggested that it might not survive legal challenges.
Shares of AIG slipped in early 2018 as investors reacted negatively to the price AIG paid to acquire Validus Holdings3, a provider of insurance and reinsurance products. The acquisition price represented a significant premium to Validus’ stock price immediately prior to the announcement. However, we believe the acquisition made strategic sense as Validus gives AIG a complementary group of profitable insurance and reinsurance businesses. The stock price slipped further in October 2018, due to larger-than-expected catastrophe-related losses announced ahead of quarterly results. The losses were due to multiple typhoons in Japan, Hurricane Florence and wildfires in California. Investors tend to look beyond uncharacteristic weather-related losses. However, we believe AIG’s series of operating challenges and negative surprises in prior years, such as additional commercial reserves and increases in loss estimates on current business, likely factored into the stock’s significant decline.
GE is a multi-industrial company with a diverse set of businesses in power generation, health care and aviation. During 2018, the stock suffered a number of setbacks starting in January with a greater-than-expected charge related to long-term care policies in its insurance subsidiary. In June, the stock was removed from the Dow Jones Industrial Average and in September, GE stated that fan blades in some of its power-plant turbines were experiencing oxidation problems. In October, S&P Global Ratings, a bond rating agency, cut GE’s debt rating, while GE cut its dividend and stated that the Securities and Exchange Commission was expanding an ongoing investigation to include an accounting write-down related to its power-generation division. Amid the negative events in 2018, management took the first steps in what amounts to a breakup of GE, announcing in May 2018 the merger of its transportation operations into Wabtec3 and plans tospin-off its health care division and divest its stake inoil-services firm Baker Hughes. In October 2018, GE unexpectedly replaced chief executive officer (CEO) John Flannery, who spent his entire career at GE, with Larry Culp, a former CEO of Danaher3, an industrial company. We believe Culp made some prudent initial moves, and that his plan to reduce debt and strengthen GE’s balance sheet is a step in the right direction to restoring investor confidence in the company.
During the period, the Fund held currency forwards and futures seeking to hedge most of the currency risk of the portfolio’snon-U.S. dollar investments. The hedges had a positive overall
impact on the Fund’s performance because of the appreciation of the U.S. dollar versus the hedged currencies.
What is a currency forward? A currency forward is a direct agreement between the Fund and a counterparty to buy or sell a foreign currency in exchange for another currency at a specific exchange rate on a future date. | ||
What is a future? A future is an agreement between the Fund and a counterparty made through a U.S. or foreign futures exchange to buy or sell an underlying instrument or asset at a specific price on a future date. | ||
As fellow shareholders, we found recent relative and absolute performance disappointing, but it is not uncommon for our strategy to lag the equity markets at times. We remain committed to our disciplined, value investment approach as we seek to generate attractive, long-term, risk-adjusted returns for shareholders.
8 |
Annual Report |
franklintempleton.com |
FRANKLIN MUTUAL SHARES FUND
Thank you for your participation in Franklin Mutual Shares Fund. We look forward to continuing to serve your investment needs.
 |
Peter A. Langerman Co-Portfolio Manager | |
 |
F. David Segal, CFA Co-Portfolio Manager | |
 |
Debbie A. Turner, CFA Assistant Portfolio Manager | |


The foregoing information reflects our analysis, opinions and portfolio holdings as of December 31, 2018, the end of the reporting period. The way we implement our main investment strategies and the resulting portfolio holdings may change depending on factors such as market and economic conditions. These opinions may not be relied upon as investment advice or an offer for a particular security. The information is not a complete analysis of every aspect of any market, country, industry, security or the Fund. Statements of fact are from sources considered reliable, but the investment manager makes no representation or warranty as to their completeness or accuracy. Although historical performance is no guarantee of future results, these insights may help you understand our investment management philosophy.
CFA® is a trademark owned by CFA Institute.
franklintempleton.com |
Annual Report |
9 |
FRANKLIN MUTUAL SHARES FUND
Performance Summary as of December 31, 2018
The performance table and graphs do not reflect any taxes that a shareholder would pay on Fund dividends, capital gain distributions, if any, or any realized gains on the sale of Fund shares. Total return reflects reinvestment of the Fund’s dividends and capital gain distributions, if any, and any unrealized gains or losses. Your dividend income will vary depending on dividends or interest paid by securities in the Fund’s portfolio, adjusted for operating expenses of each class. Capital gain distributions are net profits realized from the sale of portfolio securities.
Performance as of 12/31/18
Cumulative total return excludes sales charges. Average annual total return includes maximum sales charges. Sales charges will vary depending on the size of the investment and the class of share purchased. The maximum is 5.50% and the minimum is 0%.Class A:5.50% maximum initial sales charge. For other share classes, visitfranklintempleton.com.
| Share Class | | Cumulative Total Return1 | | | Average Annual Total Return2 |
| ||
Z | ||||||||
1-Year | -8.95% | -8.95% | ||||||
5-Year | +18.48% | +3.45% | ||||||
10-Year | +146.61% | +9.45% | ||||||
A3 | ||||||||
1-Year | -9.18% | -14.17% | ||||||
5-Year | +16.92% | +2.01% | ||||||
10-Year | +139.74% | +8.52% | ||||||
Performance data represent past performance, which does not guarantee future results. Investment return and principal value will fluctuate, and you may have a gain or loss when you sell your shares. Current performance may differ from figures shown. For most recentmonth-end performance, go tofranklintempleton.comor call(800)342-5236.
See page 12 for Performance Summary footnotes.
10 |
Annual Report |
franklintempleton.com |
FRANKLIN MUTUAL SHARES FUND
PERFORMANCE SUMMARY
Total Return Index Comparison for a Hypothetical $10,000 Investment
Total return represents the change in value of an investment over the periods shown. It includes any applicable maximum sales charge, Fund expenses, account fees and reinvested distributions. The unmanaged index includes reinvestment of any income or distributions. It differs from the Fund in composition and does not pay management fees or expenses. One cannot invest directly in an index.
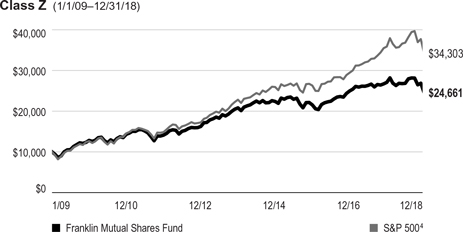
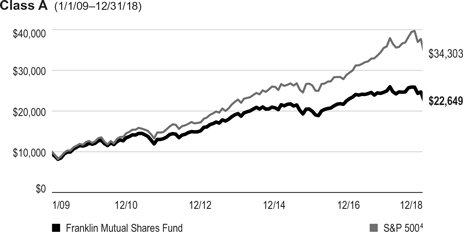
See page 12 for Performance Summary footnotes.
franklintempleton.com |
Annual Report |
11 |
FRANKLIN MUTUAL SHARES FUND
PERFORMANCE SUMMARY
Distributions(1/1/18–12/31/18)
| Share Class | Net Investment Income | Short-Term Capital Gain | Long-Term Capital Gain | Total | ||||||||||||
Z | $0.5286 | $0.0583 | $1.1914 | $1.7783 | ||||||||||||
A | $0.4610 | $0.0583 | $1.1914 | $1.7107 | ||||||||||||
C | $0.0258 | $0.0583 | $1.1914 | $1.2755 | ||||||||||||
R | $0.3605 | $0.0583 | $1.1914 | $1.6102 | ||||||||||||
R6 | $0.5493 | $0.0583 | $1.1914 | $1.7990 | ||||||||||||
Total Annual Operating Expenses5
| Share Class | ||||
Z | 0.78 | % | ||
A | 1.03 | % | ||
Each class of shares is available to certain eligible investors and has different annual fees and expenses, as described in the prospectus.
All investments involve risks, including possible loss of principal. Value securities may not increase in price as anticipated or may decline further in value. Special risks are associated with foreign investing, including currency fluctuations, economic instability and political developments. The Fund’s investments in companies engaged in mergers, reorganizations or liquidations also involve special risks as pending deals may not be completed on time or on favorable terms. The Fund may invest in lower rated bonds, which entail higher credit risk. The Fund is actively managed but there is no guarantee that the manager’s investment decisions will produce the desired results. The Fund’s prospectus also includes a description of the main investment risks.
1. Cumulative total return represents the change in value of an investment over the periods indicated.
2. Average annual total return represents the average annual change in value of an investment over the periods indicated. Return for less than one year, if any, has not been annualized.
3. Prior to 9/10/18, these shares were offered at a higher initial sales charge of 5.75%, thus actual returns would have differed. Total returns with sales charges have been restated to reflect the current maximum initial sales charge of 5.50%.
4. Source: Morningstar. The S&P 500 is a market capitalization-weighted index of 500 stocks designed to measure total U.S. equity market performance.
5. Figures are as stated in the Fund’s current prospectus and may differ from the expense ratios disclosed in the Your Fund’s Expenses and Financial Highlights sections in this report. In periods of market volatility, assets may decline significantly, causing total annual Fund operating expenses to become higher than the figures shown.
See www.franklintempletondatasources.com for additional data provider information.
12 |
Annual Report |
franklintempleton.com |
FRANKLIN MUTUAL SHARES FUND
As a Fund shareholder, you can incur two types of costs: (1) transaction costs, including sales charges (loads) on Fund purchases and redemptions; and (2) ongoing Fund costs, including management fees, distribution and service(12b-1) fees, and other Fund expenses. All mutual funds have ongoing costs, sometimes referred to as operating expenses. The table below shows ongoing costs of investing in the Fund and can help you understand these costs and compare them with those of other mutual funds. The table assumes a $1,000 investment held for the six months indicated.
Actual Fund Expenses
The table below provides information about actual account values and actual expenses in the columns under the heading “Actual.” In these columns the Fund’s actual return, which includes the effect of Fund expenses, is used to calculate the “Ending Account Value” for each class of shares. You can estimate the expenses you paid during the period by following these steps (ofcourse, your account value and expenses will differ from those in this illustration):Divide your account value by $1,000 (ifyour account had an $8,600 value, then $8,600 ÷ $1,000 = 8.6). Then multiply the result by the number in the row for your class of shares under the headings “Actual” and “Expenses Paid During Period” (ifActual Expenses Paid During Period were $7.50, then 8.6 x $7.50 = $64.50). In this illustration, the actual expenses paid this period are $64.50.
Hypothetical Example for Comparison with Other Funds
Under the heading “Hypothetical” in the table, information is provided about hypothetical account values and hypothetical expenses based on the Fund’s actual expense ratio and an assumed rate of return of 5% per year before expenses, which is not the Fund’s actual return. This information may not be used to estimate the actual ending account balance or expenses you paid for the period, but it can help you compare ongoing costs of investing in the Fund with those of other funds. To do so, compare this 5% hypothetical example for the class of shares you hold with the 5% hypothetical examples that appear in the shareholder reports of other funds.
Please note that expenses shown in the table are meant to highlight ongoing costs and do not reflect any transactional costs. Therefore, information under the heading “Hypothetical” is useful in comparing ongoing costs only, and will not help you compare total costs of owning different funds. In addition, if transactional costs were included, your total costs would have been higher.
| Actual (actual return after expenses) | Hypothetical (5% annual return before expenses) | |||||||||||||||||
| Share Class | Beginning Account Value 7/1/18 | Ending Account Value 12/31/18 | Expenses Paid During Period 7/1/18–12/31/181,2 | Ending Account Value 12/31/18 | Expenses Paid During Period 7/1/18–12/31/181,2 | Net Annualized Expense Ratio2 | ||||||||||||
| Z | $1,000 | $918.50 | $3.63 | $1,021.42 | $3.82 | 0.75% | ||||||||||||
| A | $1,000 | $917.30 | $4.83 | $1,020.16 | $5.09 | 1.00% | ||||||||||||
| C | $1,000 | $913.40 | $8.44 | $1,016.38 | $8.89 | 1.75% | ||||||||||||
| R | $1,000 | $916.00 | $6.04 | $1,018.90 | $6.36 | 1.25% | ||||||||||||
| R6 | $1,000 | $918.60 | $3.34 | $1,021.73 | $3.52 | 0.69% | ||||||||||||
1. Expenses are equal to the annualized expense ratio for thesix-month period as indicated above—in the far right column—multiplied by the simple average account value over the period indicated, and then multiplied by 184/365 to reflect theone-half year period.
2. Reflects expenses after fee waivers and expense reimbursements. Does not include acquired fund fees and expenses.
franklintempleton.com |
Annual Report |
|
13 |
|
FRANKLIN MUTUAL SHARES FUND
| Year Ended December 31, | ||||||||||||||||||||
| 2018 | 2017 | 2016 | 2015 | 2014 | ||||||||||||||||
Class Z | ||||||||||||||||||||
| Per share operating performance | ||||||||||||||||||||
(for a share outstanding throughout the year) | ||||||||||||||||||||
Net asset value, beginning of year | $28.63 | $28.22 | $26.00 | $29.52 | $28.34 | |||||||||||||||
Income from investment operationsa: | ||||||||||||||||||||
Net investment incomeb | 0.51 | 0.65 | c | 0.63 | d | 0.54 | 0.78 | e | ||||||||||||
Net realized and unrealized gains (losses) | (3.11 | ) | 1.73 | 3.48 | (1.71 | ) | 1.38 | |||||||||||||
Total from investment operations | (2.60 | ) | 2.38 | 4.11 | (1.17 | ) | 2.16 | |||||||||||||
Less distributions from: | ||||||||||||||||||||
Net investment income | (0.53 | ) | (0.68 | ) | (0.64 | ) | (0.59 | ) | (0.98 | ) | ||||||||||
Net realized gains | (1.25 | ) | (1.29 | ) | (1.25 | ) | (1.76 | ) | — | |||||||||||
Total distributions | (1.78 | ) | (1.97 | ) | (1.89 | ) | (2.35 | ) | (0.98 | ) | ||||||||||
Net asset value, end of year. | $24.25 | $28.63 | $28.22 | $26.00 | $29.52 | |||||||||||||||
Total return | (8.95)% | 8.49% | 15.88% | (3.81)% | 7.60% | |||||||||||||||
Ratios to average net assets | ||||||||||||||||||||
Expensesf,g | 0.76% | h | 0.78% | 0.80% | h | 0.81% | h | 0.80% | ||||||||||||
Expenses incurred in connection with securities sold short | —% | i | —% | 0.01% | 0.02% | 0.03% | ||||||||||||||
Net investment income | 1.77% | 2.23% | c | 2.33% | d | 1.82% | 2.67% | e | ||||||||||||
| Supplemental data | ||||||||||||||||||||
Net assets, end of year (000’s) | $5,189,476 | $6,229,996 | $7,681,881 | $6,770,056 | $7,363,765 | |||||||||||||||
Portfolio turnover rate | 20.72% | 18.15% | 20.56% | 19.99% | 19.24% | |||||||||||||||
aThe amount shown for a share outstanding throughout the period may not correlate with the Statement of Operations for the period due to the timing of sales and repurchases of the Fund’s shares in relation to income earned and/or fluctuating fair value of the investments of the Fund.
bBased on average daily shares outstanding.
cNet investment income per share includes approximately $0.16 per share related to income received in the form of special dividends in connection with certain Fund holdings. Excluding this amount, the ratio of net investment income to average net assets would have been 1.69%.
dNet investment income per share includes approximately $0.10 per share related to income received in the form of special dividends in connection with certain Fund holdings. Excluding this amount, the ratio of net investment income to average net assets would have been 1.96%.
eNet investment income per share includes approximately $0.29 per share related to income received in the form of a special dividend in connection with certain Fund holdings. Excluding this amount, the ratio of net investment income to average net assets would have been 1.66%.
fIncludes dividend and/or interest expense on securities sold short and security borrowing fees, if any. See below for the ratios of such expenses to average net assets for the periods presented. See Note 1(d).
gBenefit of expense reduction rounds to less than 0.01%.
hBenefit of waiver and payments by affiliates rounds to less than 0.01%.
iRounds to less than 0.01%.
14 |
Annual Report | The accompanying notes are an integral part of these financial statements. |
franklintempleton.com |
FRANKLIN MUTUAL SHARES FUND
FINANCIAL HIGHLIGHTS
| Year Ended December 31, | ||||||||||||||||||||
| 2018 | 2017 | 2016 | 2015 | 2014 | ||||||||||||||||
Class A | ||||||||||||||||||||
| Per share operating performance | ||||||||||||||||||||
(for a share outstanding throughout the year) | ||||||||||||||||||||
Net asset value, beginning of year | $28.35 | $27.97 | $25.78 | $29.29 | $28.12 | |||||||||||||||
Income from investment operationsa: | ||||||||||||||||||||
Net investment incomeb | 0.43 | 0.58 | c | 0.56 | d | 0.45 | 0.69 | e | ||||||||||||
Net realized and unrealized gains (losses) | (3.07 | ) | 1.70 | 3.45 | (1.69 | ) | 1.37 | |||||||||||||
Total from investment operations | (2.64 | ) | 2.28 | 4.01 | (1.24 | ) | 2.06 | |||||||||||||
Less distributions from: | ||||||||||||||||||||
Net investment income | (0.46 | ) | (0.61 | ) | (0.57 | ) | (0.51 | ) | (0.89) | |||||||||||
Net realized gains | (1.25 | ) | (1.29 | ) | (1.25 | ) | (1.76 | ) | — | |||||||||||
Total distributions | (1.71 | ) | (1.90 | ) | (1.82 | ) | (2.27 | ) | (0.89) | |||||||||||
Net asset value, end of year. | $24.00 | $28.35 | $27.97 | $25.78 | $29.29 | |||||||||||||||
Total returnf | (9.18)% | 8.21% | 15.61% | (4.10)% | 7.30% | |||||||||||||||
Ratios to average net assets | ||||||||||||||||||||
Expensesg,h | 1.01% | i | 1.03% | 1.05% | i | 1.09% | i | 1.10% | ||||||||||||
Expenses incurred in connection with securities sold short | —% | j | —% | 0.01% | 0.02% | 0.03% | ||||||||||||||
Net investment income | 1.52% | 1.98% | c | 2.08% | d | 1.54% | 2.37%e | |||||||||||||
| Supplemental data | ||||||||||||||||||||
Net assets, end of year (000’s) | $3,852,134 | $4,386,829 | $4,737,576 | $4,819,868 | $5,392,130 | |||||||||||||||
Portfolio turnover rate | 20.72% | 18.15% | 20.56% | 19.99% | 19.24% | |||||||||||||||
aThe amount shown for a share outstanding throughout the period may not correlate with the Statement of Operations for the period due to the timing of sales and repurchases of the Fund’s shares in relation to income earned and/or fluctuating fair value of the investments of the Fund.
bBased on average daily shares outstanding.
cNet investment income per share includes approximately $0.16 per share related to income received in the form of special dividends in connection with certain Fund holdings. Excluding this amount, the ratio of net investment income to average net assets would have been 1.44%.
dNet investment income per share includes approximately $0.10 per share related to income received in the form of special dividends in connection with certain Fund holdings. Excluding this amount, the ratio of net investment income to average net assets would have been 1.71%.
eNet investment income per share includes approximately $0.29 per share related to income received in the form of a special dividend in connection with certain Fund holdings. Excluding this amount, the ratio of net investment income to average net assets would have been 1.36%.
fTotal return does not reflect sales commissions or contingent deferred sales charges, if applicable.
gIncludes dividend and/or interest expense on securities sold short and security borrowing fees, if any. See below for the ratios of such expenses to average net assets for the periods presented. See Note 1(d).
hBenefit of expense reduction rounds to less than 0.01%.
iBenefit of waiver and payments by affiliates rounds to less than 0.01%.
jRounds to less than 0.01%.
franklintempleton.com |
The accompanying notes are an integral part of these financial statements. | Annual Report |
15 |
FRANKLIN MUTUAL SHARES FUND
FINANCIAL HIGHLIGHTS
| Year Ended December 31, | ||||||||||||||||||||
| 2018 | 2017 | 2016 | 2015 | 2014 | ||||||||||||||||
Class C | ||||||||||||||||||||
| Per share operating performance (for a share outstanding throughout the year) | ||||||||||||||||||||
Net asset value, beginning of year | $28.04 | $27.68 | $25.54 | $29.02 | $27.88 | |||||||||||||||
Income from investment operationsa: | ||||||||||||||||||||
Net investment incomeb | 0.21 | 0.35 | c | 0.35 | d | 0.24 | 0.48 | e | ||||||||||||
Net realized and unrealized gains (losses) | (3.00 | ) | 1.67 | 3.40 | (1.67 | ) | 1.34 | |||||||||||||
Total from investment operations | (2.79 | ) | 2.02 | 3.75 | (1.43 | ) | 1.82 | |||||||||||||
Less distributions from: | ||||||||||||||||||||
Net investment income | (0.03 | ) | (0.37 | ) | (0.36 | ) | (0.29 | ) | (0.68) | |||||||||||
Net realized gains | (1.25 | ) | (1.29 | ) | (1.25 | ) | (1.76 | ) | — | |||||||||||
Total distributions | (1.28 | ) | (1.66 | ) | (1.61 | ) | (2.05 | ) | (0.68) | |||||||||||
Net asset value, end of year. | $23.97 | $28.04 | $27.68 | $25.54 | $29.02 | |||||||||||||||
Total returnf | (9.87)% | 7.37% | 14.77% | (4.79)% | 6.56% | |||||||||||||||
Ratios to average net assets | ||||||||||||||||||||
Expensesg,h | 1.76% | i | 1.78% | 1.80% | i | 1.81% | i | 1.80% | ||||||||||||
Expenses incurred in connection with securities sold short | —% | j | —% | 0.01% | 0.02% | 0.03% | ||||||||||||||
Net investment income | 0.77% | 1.23% | c | 1.33% | d | 0.82% | 1.67% | e | ||||||||||||
| Supplemental data | ||||||||||||||||||||
Net assets, end of year (000’s) | $309,756 | $995,665 | $1,114,760 | $1,101,302 | $1,240,845 | |||||||||||||||
Portfolio turnover rate | 20.72% | 18.15% | 20.56% | 19.99% | 19.24% | |||||||||||||||
aThe amount shown for a share outstanding throughout the period may not correlate with the Statement of Operations for the period due to the timing of sales and repurchases of the Fund’s shares in relation to income earned and/or fluctuating fair value of the investments of the Fund.
bBased on average daily shares outstanding.
cNet investment income per share includes approximately $0.16 per share related to income received in the form of special dividends in connection with certain Fund holdings. Excluding this amount, the ratio of net investment income to average net assets would have been 0.69%.
dNet investment income per share includes approximately $0.10 per share related to income received in the form of special dividends in connection with certain Fund holdings. Excluding this amount, the ratio of net investment income to average net assets would have been 0.96%.
eNet investment income per share includes approximately $0.29 per share related to income received in the form of a special dividend in connection with certain Fund holdings. Excluding this amount, the ratio of net investment income to average net assets would have been 0.66%.
fTotal return does not reflect sales commissions or contingent deferred sales charges, if applicable.
gIncludes dividend and/or interest expense on securities sold short and security borrowing fees, if any. See below for the ratios of such expenses to average net assets for the periods presented. See Note 1(d).
hBenefit of expense reduction rounds to less than 0.01%.
iBenefit of waiver and payments by affiliates rounds to less than 0.01%.
jRounds to less than 0.01%.
16 |
Annual Report | The accompanying notes are an integral part of these financial statements. |
franklintempleton.com |
FRANKLIN MUTUAL SHARES FUND
FINANCIAL HIGHLIGHTS
| Year Ended December 31, | ||||||||||||||||||||
| 2018 | 2017 | 2016 | 2015 | 2014 | ||||||||||||||||
Class R | ||||||||||||||||||||
| Per share operating performance (for a share outstanding throughout the year) | ||||||||||||||||||||
Net asset value, beginning of year | $28.21 | $27.83 | $25.66 | $29.14 | $27.98 | |||||||||||||||
Income from investment operationsa: | ||||||||||||||||||||
Net investment incomeb | 0.36 | 0.50 | c | 0.49 | d | 0.38 | 0.64 | e | ||||||||||||
Net realized and unrealized gains (losses) | (3.05 | ) | 1.70 | 3.42 | (1.67 | ) | 1.34 | |||||||||||||
Total from investment operations | (2.69 | ) | 2.20 | 3.91 | (1.29 | ) | 1.98 | |||||||||||||
Less distributions from: | ||||||||||||||||||||
Net investment income | (0.36 | ) | (0.53 | ) | (0.49 | ) | (0.43 | ) | (0.82 | ) | ||||||||||
Net realized gains | (1.25 | ) | (1.29 | ) | (1.25 | ) | (1.76 | ) | — | |||||||||||
Total distributions | (1.61 | ) | (1.82 | ) | (1.74 | ) | (2.19 | ) | (0.82 | ) | ||||||||||
Net asset value, end of year. | $23.91 | $28.21 | $27.83 | $25.66 | $29.14 | |||||||||||||||
Total return | (9.41)% | 7.96% | 15.31% | (4.32)% | 7.10% | |||||||||||||||
Ratios to average net assets | ||||||||||||||||||||
Expensesf,g | 1.26% | h | 1.28% | 1.30% | h | 1.31% | h | 1.30% | ||||||||||||
Expenses incurred in connection with securities sold short | —% | i | —% | 0.01% | 0.02% | 0.03% | ||||||||||||||
Net investment income | 1.27% | 1.73% | c | 1.83% | d | 1.32% | 2.17% | e | ||||||||||||
| Supplemental data | ||||||||||||||||||||
Net assets, end of year (000’s) | $74,345 | $107,660 | $123,013 | $134,050 | $172,938 | |||||||||||||||
Portfolio turnover rate | 20.72% | 18.15% | 20.56% | 19.99% | 19.24% | |||||||||||||||
aThe amount shown for a share outstanding throughout the period may not correlate with the Statement of Operations for the period due to the timing of sales and repurchases of the Fund’s shares in relation to income earned and/or fluctuating fair value of the investments of the Fund.
bBased on average daily shares outstanding.
cNet investment income per share includes approximately $0.16 per share related to income received in the form of special dividends in connection with certain Fund holdings. Excluding this amount, the ratio of net investment income to average net assets would have been 1.19%.
dNet investment income per share includes approximately $0.10 per share related to income received in the form of special dividends in connection with certain Fund holdings. Excluding this amount, the ratio of net investment income to average net assets would have been 1.46%.
eNet investment income per share includes approximately $0.29 per share related to income received in the form of a special dividend in connection with certain Fund holdings. Excluding this amount, the ratio of net investment income to average net assets would have been 1.16%.
fIncludes dividend and/or interest expense on securities sold short and security borrowing fees, if any. See below for the ratios of such expenses to average net assets for the periods presented. See Note 1(d).
gBenefit of expense reduction rounds to less than 0.01%.
hBenefit of waiver and payments by affiliates rounds to less than 0.01%.
iRounds to less than 0.01%.
franklintempleton.com |
The accompanying notes are an integral part of these financial statements. | Annual Report |
17 |
FRANKLIN MUTUAL SHARES FUND
FINANCIAL HIGHLIGHTS
| Year Ended December 31, | ||||||||||||||||||||
| 2018 | 2017 | 2016 | 2015 | 2014 | ||||||||||||||||
Class R6 | ||||||||||||||||||||
| Per share operating performance (for a share outstanding throughout the year) | ||||||||||||||||||||
Net asset value, beginning of year | $28.61 | $28.21 | $25.98 | $29.51 | $28.33 | |||||||||||||||
Income from investment operationsa: | ||||||||||||||||||||
Net investment incomeb | 0.53 | 0.70 | c | 0.66 | d | 0.57 | 0.82 | e | ||||||||||||
Net realized and unrealized gains (losses) | (3.11 | ) | 1.71 | 3.49 | (1.71 | ) | 1.37 | |||||||||||||
Total from investment operations | (2.58 | ) | 2.41 | 4.15 | (1.14 | ) | 2.19 | |||||||||||||
Less distributions from: | ||||||||||||||||||||
Net investment income | (0.55 | ) | (0.72 | ) | (0.67 | ) | (0.63 | ) | (1.01 | ) | ||||||||||
Net realized gains | (1.25 | ) | (1.29 | ) | (1.25 | ) | (1.76 | ) | — | |||||||||||
Total distributions | (1.80 | ) | (2.01 | ) | (1.92 | ) | (2.39 | ) | (1.01 | ) | ||||||||||
Net asset value, end of year. | $24.23 | $28.61 | $28.21 | $25.98 | $29.51 | |||||||||||||||
Total return | (8.88)% | 8.61% | 16.05% | (3.71)% | 7.72% | |||||||||||||||
Ratios to average net assets | ||||||||||||||||||||
Expensesf,g | 0.69% | h | 0.67% | 0.68% | h | 0.69% | h | 0.69% | ||||||||||||
Expenses incurred in connection with securities sold short | —% | i | —% | 0.01% | 0.02% | 0.03% | ||||||||||||||
Net investment income | 1.84% | 2.34% | c | 2.45% | d | 1.94% | 2.78% | e | ||||||||||||
| Supplemental data | ||||||||||||||||||||
Net assets, end of year (000’s) | $3,160,186 | $3,741,430 | $1,896,497 | $1,923,466 | $2,249,991 | |||||||||||||||
Portfolio turnover rate | 20.72% | 18.15% | 20.56% | 19.99% | 19.24% | |||||||||||||||
aThe amount shown for a share outstanding throughout the period may not correlate with the Statement of Operations for the period due to the timing of sales and repurchases of the Fund’s shares in relation to income earned and/or fluctuating fair value of the investments of the Fund.
bBased on average daily shares outstanding.
cNet investment income per share includes approximately $0.16 per share related to income received in the form of special dividends in connection with certain Fund holdings. Excluding this amount, the ratio of net investment income to average net assets would have been 1.80%.
dNet investment income per share includes approximately $0.10 per share related to income received in the form of special dividends in connection with certain Fund holdings. Excluding this amount, the ratio of net investment income to average net assets would have been 2.08%.
eNet investment income per share includes approximately $0.29 per share related to income received in the form of a special dividend in connection with certain Fund holdings. Excluding this amount, the ratio of net investment income to average net assets would have been 1.77%.
fIncludes dividend and/or interest expense on securities sold short and security borrowing fees, if any. See below for the ratios of such expenses to average net assets for the periods presented. See Note 1(d).
gBenefit of expense reduction rounds to less than 0.01%.
hBenefit of waiver and payments by affiliates rounds to less than 0.01%.
iRounds to less than 0.01%.
18 |
Annual Report | The accompanying notes are an integral part of these financial statements. |
franklintempleton.com |
FRANKLIN MUTUAL SHARES FUND
Statement of Investments, December 31, 2018
| Country | Shares/ Units/ Warrants | Value | ||||||||||
| Common Stocks and Other Equity Interests 83.7% | ||||||||||||
| Aerospace & Defense 0.8% | ||||||||||||
BAE Systems PLC | United Kingdom | 18,114,621 | $ | 106,078,274 | ||||||||
|
| |||||||||||
| Auto Components 0.5% | ||||||||||||
The Goodyear Tire & Rubber Co. | United States | 2,382,274 | 48,622,212 | |||||||||
a,b,c,dInternational Automotive Components Group Brazil LLC | Brazil | 7,234,813 | 306,590 | |||||||||
a,b,c,dInternational Automotive Components Group North America LLC | United States | 63,079,866 | 7,519,120 | |||||||||
|
| |||||||||||
| 56,447,922 | ||||||||||||
|
| |||||||||||
| Automobiles 1.2% | ||||||||||||
General Motors Co. | United States | 4,507,470 | 150,774,871 | |||||||||
|
| |||||||||||
| Banks 9.5% | ||||||||||||
Barclays PLC | United Kingdom | 38,190,870 | 73,307,613 | |||||||||
CIT Group Inc. | United States | 2,759,673 | 105,612,686 | |||||||||
Citigroup Inc. | United States | 3,576,406 | 186,187,696 | |||||||||
Citizens Financial Group Inc. | United States | 6,757,671 | 200,905,559 | |||||||||
Columbia Banking System Inc. | United States | 88,096 | 3,197,004 | |||||||||
aFCB Financial Holdings Inc., A | United States | 1,647,570 | 55,325,401 | |||||||||
Guaranty Bancorp | United States | 1,146,366 | 23,787,094 | |||||||||
JPMorgan Chase & Co. | United States | 2,871,890 | 280,353,902 | |||||||||
State Bank Financial Corp. | United States | 1,467,000 | 31,672,530 | |||||||||
Wells Fargo & Co. | United States | 5,171,930 | 238,322,534 | |||||||||
|
| |||||||||||
| 1,198,672,019 | ||||||||||||
|
| |||||||||||
| Biotechnology 0.6% | ||||||||||||
Shire PLC | United Kingdom | 1,258,054 | 73,318,032 | |||||||||
|
| |||||||||||
| Building Products 1.1% | ||||||||||||
Johnson Controls International PLC | United States | 4,783,800 | 141,839,670 | |||||||||
|
| |||||||||||
| Chemicals 0.0% | ||||||||||||
a,c,eDow Corning Corp., Contingent Distribution | United States | 12,630,547 | — | |||||||||
|
| |||||||||||
| Communications Equipment 2.0% | ||||||||||||
Cisco Systems Inc. | United States | 5,851,060 | 253,526,430 | |||||||||
|
| |||||||||||
| Construction & Engineering 0.6% | ||||||||||||
Fluor Corp. | United States | 2,399,827 | 77,274,429 | |||||||||
|
| |||||||||||
| Consumer Finance 1.7% | ||||||||||||
Ally Financial Inc. | United States | 2,870,838 | 65,053,190 | |||||||||
Capital One Financial Corp. | United States | 2,011,505 | 152,049,663 | |||||||||
|
| |||||||||||
| 217,102,853 | ||||||||||||
|
| |||||||||||
| Containers & Packaging 1.5% | ||||||||||||
International Paper Co. | United States | 3,741,837 | 151,020,541 | |||||||||
WestRock Co. | United States | 1,125,212 | 42,488,005 | |||||||||
|
| |||||||||||
| 193,508,546 | ||||||||||||
|
| |||||||||||
| Diversified Financial Services 1.1% | ||||||||||||
Voya Financial Inc. | United States | 3,413,030 | 136,999,024 | |||||||||
|
| |||||||||||
| Diversified Telecommunication Services 1.8% | ||||||||||||
AT&T Inc. | United States | 4,727,562 | 134,924,619 | |||||||||
Koninklijke KPN NV | Netherlands | 30,410,640 | 89,201,945 | |||||||||
|
| |||||||||||
| 224,126,564 | ||||||||||||
|
| |||||||||||
| Electric Utilities 0.3% | ||||||||||||
aPG&E Corp. | United States | 1,595,750 | 37,899,063 | |||||||||
|
| |||||||||||
franklintempleton.com | Annual Report | 19 | ||||
FRANKLIN MUTUAL SHARES FUND
STATEMENT OF INVESTMENTS
| Country | Shares/ Units/ Warrants | Value | ||||||||||
Common Stocks and Other Equity Interests(continued) | ||||||||||||
| Electrical Equipment 1.6% | ||||||||||||
aSensata Technologies Holding PLC | United States | 4,363,870 | $ | 195,675,931 | ||||||||
|
| |||||||||||
| Energy Equipment & Services 1.1% | ||||||||||||
Baker Hughes a GE Co., A | United States | 5,908,552 | 127,033,868 | |||||||||
aMcDermott International Inc. | United States | 2,645,956 | 17,304,552 | |||||||||
|
| |||||||||||
| 144,338,420 | ||||||||||||
|
| |||||||||||
| Entertainment 2.4% | ||||||||||||
The Walt Disney Co. | United States | 2,716,200 | 297,831,330 | |||||||||
|
| |||||||||||
| Equity Real Estate Investment Trusts (REITs) 1.8% | ||||||||||||
bAlexander’s Inc. | United States | 326,675 | 99,550,939 | |||||||||
Vornado Realty Trust | United States | 2,036,522 | 126,325,460 | |||||||||
|
| |||||||||||
| 225,876,399 | ||||||||||||
|
| |||||||||||
| Food & Staples Retailing 2.9% | ||||||||||||
The Kroger Co. | United States | 7,402,986 | 203,582,115 | |||||||||
Walgreens Boots Alliance Inc. | United States | 2,446,029 | 167,137,162 | |||||||||
|
| |||||||||||
| 370,719,277 | ||||||||||||
|
| |||||||||||
| Health Care Equipment & Supplies 3.7% | ||||||||||||
Medtronic PLC | United States | 5,180,794 | 471,245,022 | |||||||||
|
| |||||||||||
| Health Care Providers & Services 1.6% | ||||||||||||
CVS Health Corp. | United States | 3,015,915 | 197,602,751 | |||||||||
|
| |||||||||||
| Household Durables 2.6% | ||||||||||||
Lennar Corp., A | United States | 2,378,700 | 93,126,105 | |||||||||
Newell Brands Inc. | United States | 8,753,495 | 162,727,472 | |||||||||
Toll Brothers Inc. | United States | 1,993,600 | 65,649,248 | |||||||||
|
| |||||||||||
| 321,502,825 | ||||||||||||
|
| |||||||||||
| Household Products 0.6% | ||||||||||||
Energizer Holdings Inc. | United States | 1,787,933 | 80,725,175 | |||||||||
|
| |||||||||||
| Independent Power & Renewable Electricity Producers 0.6% | ||||||||||||
aVistra Energy Corp. | United States | 3,124,828 | 71,527,313 | |||||||||
|
| |||||||||||
| Industrial Conglomerates 0.8% | ||||||||||||
General Electric Co. | United States | 13,594,500 | 102,910,365 | |||||||||
|
| |||||||||||
| Insurance 8.2% | ||||||||||||
Alleghany Corp. | United States | 377,389 | 235,234,111 | |||||||||
American International Group Inc. | United States | 5,664,539 | 223,239,482 | |||||||||
aBrighthouse Financial Inc. | United States | 2,373,200 | 72,335,136 | |||||||||
Chubb Ltd. | United States | 1,446,258 | 186,827,608 | |||||||||
The Hartford Financial Services Group Inc. | United States | 3,734,899 | 166,016,261 | |||||||||
MetLife Inc. | United States | 3,551,930 | 145,842,246 | |||||||||
|
| |||||||||||
| 1,029,494,844 | ||||||||||||
|
| |||||||||||
| IT Services 1.5% | ||||||||||||
Cognizant Technology Solutions Corp., A | United States | 2,991,050 | 189,871,854 | |||||||||
|
| |||||||||||
| Machinery 0.7% | ||||||||||||
CNH Industrial NV | United Kingdom | 4,351,332 | 39,317,241 | |||||||||
CNH Industrial NV, special voting | United Kingdom | 5,296,616 | 47,858,525 | |||||||||
|
| |||||||||||
| 87,175,766 | ||||||||||||
|
| |||||||||||
| 20 |
Annual Report | franklintempleton.com | ||
FRANKLIN MUTUAL SHARES FUND
STATEMENT OF INVESTMENTS
| Country | Shares/ Units/ Warrants | Value | ||||||||||
Common Stocks and Other Equity Interests(continued) | ||||||||||||
| Media 4.8% | ||||||||||||
aCharter Communications Inc., A | United States | 865,529 | $ | 246,649,799 | ||||||||
Comcast Corp., A | United States | 5,111,400 | 174,043,170 | |||||||||
aCumulus Media Inc., A | United States | 151,572 | 1,636,978 | |||||||||
aCumulus Media Inc., B | United States | 225,990 | 2,146,905 | |||||||||
aCumulus Media Inc., wts., 6/04/38 | United States | 171,135 | 1,625,782 | |||||||||
aDiscovery Inc., C | United States | 4,772,200 | 110,142,376 | |||||||||
aDISH Network Corp., A | United States | 2,879,437 | 71,899,542 | |||||||||
|
| |||||||||||
| 608,144,552 | ||||||||||||
|
| |||||||||||
| Metals & Mining 0.4% | ||||||||||||
thyssenkrupp AG | Germany | 1,557,406 | 26,754,222 | |||||||||
Warrior Met Coal Inc. | United States | 795,602 | 19,181,964 | |||||||||
|
| |||||||||||
| 45,936,186 | ||||||||||||
|
| |||||||||||
| Oil, Gas & Consumable Fuels 8.1% | ||||||||||||
Anadarko Petroleum Corp. | United States | 3,198,080 | 140,203,827 | |||||||||
BP PLC | United Kingdom | 14,266,349 | 90,228,981 | |||||||||
Kinder Morgan Inc. | United States | 11,533,040 | 177,378,156 | |||||||||
Marathon Oil Corp. | United States | 10,959,685 | 157,161,883 | |||||||||
Plains All American Pipeline LP | United States | 3,862,400 | 77,402,496 | |||||||||
Royal Dutch Shell PLC, A (EUR Traded) | United Kingdom | 4,955,823 | 145,678,884 | |||||||||
Royal Dutch Shell PLC, A (GBP Traded) | United Kingdom | 3,159,359 | 92,968,538 | |||||||||
The Williams Cos. Inc. | United States | 6,351,184 | 140,043,607 | |||||||||
|
| |||||||||||
| 1,021,066,372 | ||||||||||||
|
| |||||||||||
| Pharmaceuticals 7.4% | ||||||||||||
Eli Lilly & Co. | United States | 2,539,343 | 293,852,772 | |||||||||
Merck & Co. Inc. | United States | 4,078,310 | 311,623,667 | |||||||||
Novartis AG, ADR | Switzerland | 3,798,680 | 325,964,731 | |||||||||
|
| |||||||||||
| 931,441,170 | ||||||||||||
|
| |||||||||||
| Professional Services 0.5% | ||||||||||||
RELX PLC | United Kingdom | 3,153,086 | 64,999,025 | |||||||||
|
| |||||||||||
| Software 2.3% | ||||||||||||
aAvaya Holdings Corp., wts., 12/15/22 | United States | 276,741 | 567,319 | |||||||||
aRed Hat Inc. | United States | 625,300 | 109,827,692 | |||||||||
Symantec Corp. | United States | 9,445,251 | 178,468,018 | |||||||||
|
| |||||||||||
| 288,863,029 | ||||||||||||
|
| |||||||||||
| Technology Hardware, Storage & Peripherals 3.2% | ||||||||||||
Apple Inc. | United States | 86,089 | 13,579,679 | |||||||||
Hewlett Packard Enterprise Co. | United States | 7,491,354 | 98,960,786 | |||||||||
Samsung Electronics Co. Ltd. | South Korea | 5,521,050 | 191,849,436 | |||||||||
Western Digital Corp. | United States | 2,716,857 | 100,442,203 | |||||||||
|
| |||||||||||
| 404,832,104 | ||||||||||||
|
| |||||||||||
| Tobacco 2.9% | ||||||||||||
Altria Group Inc. | United States | 2,351,460 | 116,138,609 | |||||||||
British American Tobacco PLC | United Kingdom | 4,377,848 | 139,571,261 | |||||||||
British American Tobacco PLC, ADR | United Kingdom | 1,655,688 | 52,750,220 | |||||||||
Imperial Brands PLC | United Kingdom | 1,751,865 | 53,103,743 | |||||||||
|
| |||||||||||
| 361,563,833 | ||||||||||||
|
| |||||||||||
franklintempleton.com | Annual Report | 21 | ||||
FRANKLIN MUTUAL SHARES FUND
STATEMENT OF INVESTMENTS
| Country | Shares/ Units/ Warrants | Value | ||||||||||
Common Stocks and Other Equity Interests(continued) | ||||||||||||
| Wireless Telecommunication Services 1.3% | ||||||||||||
aT-Mobile U.S. Inc. | United States | 2,480,000 | $ | 157,752,800 | ||||||||
|
| |||||||||||
Total Common Stocks and Other Equity Interests | 10,538,664,040 | |||||||||||
|
| |||||||||||
Management Investment Companies (Cost $132,971,382) 1.0% | ||||||||||||
| Diversified Financial Services 1.0% | ||||||||||||
aAltaba Inc. | United States | 2,134,452 | 123,670,149 | |||||||||
|
| |||||||||||
| Principal Amount | ||||||||||||
Corporate Notes and Senior Floating Rate Interests 3.0% | ||||||||||||
fBanff Merger Sub Inc., senior note, 144A, 9.75%, 9/01/26 | United States | $ | 68,188,000 | 62,562,490 | ||||||||
g,hCumulus Media New Holdings Inc., Term Loan, 7.03%,(1-month USD LIBOR + 4.50%), 5/13/22 | United States | 42,495,071 | 40,326,038 | |||||||||
Frontier Communications Corp., | ||||||||||||
senior note, 10.50%, 9/15/22 | United States | 82,365,000 | 57,655,500 | |||||||||
senior note, 11.00%, 9/15/25 | United States | 93,006,000 | 58,356,615 | |||||||||
fMcDermott Technology Americas Inc., senior note, 144A, 10.625%, 5/01/24 | United States | 36,543,000 | 30,970,192 | |||||||||
g,hVeritas US Inc., | ||||||||||||
Term Loan B1, 7.022%,(1-month USD LIBOR + 4.50%), 1/27/23 | United States | 50,611,385 | 43,546,896 | |||||||||
Term Loan B1, 7.303%,(3-month USD LIBOR + 4.50%), 1/27/23 | United States | 16,592,417 | 14,276,398 | |||||||||
fVeritas US Inc./Veritas Bermuda Ltd., | ||||||||||||
senior note, 144A, 7.50%, 2/01/23 | United States | 10,656,000 | 8,737,920 | |||||||||
senior note, 144A, 10.50%, 2/01/24 | United States | 87,705,000 | 58,104,562 | |||||||||
|
| |||||||||||
Total Corporate Notes and Senior Floating Rate Interests | 374,536,611 | |||||||||||
|
| |||||||||||
Corporate Notes and Senior Floating Rate Interests in | ||||||||||||
c,d,iBroadband Ventures III LLC, secured promissory note, 5.00%, 2/01/12 | United States | 19,594 | — | |||||||||
iiHeartCommunications Inc., | ||||||||||||
senior secured note, first lien, 9.00%, 12/15/19 | United States | 74,295,000 | 50,149,125 | |||||||||
g,hTranche D Term Loan, 8.443%,(3-month USD LIBOR + 6.75%), 1/30/19 | United States | 94,620,526 | 64,000,378 | |||||||||
g,hTranche E Term Loan, 9.193%,(3-month USD LIBOR + 7.50%), 7/30/19 | United States | 30,412,812 | 20,561,189 | |||||||||
g,h,iToys RUS-Delaware Inc., TermB-4 Loan, 10.067%,(3-month USD LIBOR + 8.75%), 4/24/20 | United States | 74,685,265 | 36,969,206 | |||||||||
|
| |||||||||||
Total Corporate Notes and Senior Floating Rate Interests in Reorganization (Cost $266,203,476) | 171,679,898 | |||||||||||
|
| |||||||||||
| Shares | ||||||||||||
Companies in Liquidation 0.0%† | ||||||||||||
a,c,eAvaya Holdings Corp., Contingent Distribution | United States | 67,859,000 | — | |||||||||
a,c,eAvaya Inc., Contingent Distribution | United States | 131,491,378 | — | |||||||||
a,c,eTribune Media, Litigation Trust, Contingent Distribution | United States | 1,007,002 | — | |||||||||
| 22 |
Annual Report | franklintempleton.com | ||
FRANKLIN MUTUAL SHARES FUND
STATEMENT OF INVESTMENTS
| Country | Shares | Value | ||||||||||
Companies in Liquidation(continued) | ||||||||||||
a,eVistra Energy Corp., Litigation Trust, Contingent Distribution | United States | 194,177,556 | $ | 174,760 | ||||||||
|
| |||||||||||
Total Companies in Liquidation (Cost $6,601,885) | 174,760 | |||||||||||
|
| |||||||||||
Total Investments before Short Term Investments | 11,208,725,458 | |||||||||||
|
| |||||||||||
| Principal Amount | ||||||||||||
Short Term Investments 10.6% | ||||||||||||
| U.S. Government and Agency Securities 10.6% | ||||||||||||
jFHLB, 1/02/19 | United States | $ | 23,600,000 | 23,600,000 | ||||||||
jU.S. Treasury Bill, | ||||||||||||
1/03/19 | United States | 150,000,000 | 149,990,515 | |||||||||
k1/24/19 | United States | 100,000,000 | 99,858,685 | |||||||||
1/02/19 - 6/13/19 | United States | 1,069,000,000 | 1,064,131,677 | |||||||||
|
| |||||||||||
Total U.S. Government and Agency Securities | 1,337,580,877 | |||||||||||
|
| |||||||||||
Total Investments (Cost $11,361,755,289) 99.7% | 12,546,306,335 | |||||||||||
Securities Sold Short (1.2)% | (148,540,745 | ) | ||||||||||
Other Assets, less Liabilities 1.5% | 188,131,236 | |||||||||||
|
| |||||||||||
Net Assets 100.0% | $ | 12,585,896,826 | ||||||||||
|
| |||||||||||
| Shares | ||||||||||||
lSecurities Sold Short (1.2)% | ||||||||||||
| Common Stocks (1.2)% | ||||||||||||
| Internet & Direct Marketing Retail (0.9)% | ||||||||||||
Alibaba Group Holding Ltd., ADR | China | 823,372 | (112,859,600 | ) | ||||||||
|
| |||||||||||
| Pharmaceuticals (0.3)% | ||||||||||||
Takeda Pharmaceutical Co. Ltd. | Japan | 1,055,507 | (35,681,145 | ) | ||||||||
|
| |||||||||||
Total Securities Sold Short (Proceeds $174,046,070) | $ | (148,540,745 | ) | |||||||||
|
| |||||||||||
franklintempleton.com | Annual Report | 23 | ||||
FRANKLIN MUTUAL SHARES FUND
STATEMENT OF INVESTMENTS
†Rounds to less than 0.1% of net assets.
aNon-income producing.
bSee Note 11 regarding holdings of 5% voting securities.
cFair valued using significant unobservable inputs. See Note 13 regarding fair value measurements.
dSee Note 9 regarding restricted securities.
eContingent distributions represent the right to receive additional distributions, if any, during the reorganization of the underlying company. Shares represent total underlying principal of debt securities.
fSecurity was purchased pursuant to Rule 144A under the Securities Act of 1933 and may be sold in transactions exempt from registration only to qualified institutional buyers or in a public offering registered under the Securities Act of 1933. These securities have been deemed liquid under guidelines approved by the Trust’s Board of Trustees. At December 31, 2018, the aggregate value of these securities was $160,375,164, representing 1.3% of net assets.
gThe coupon rate shown represents the rate at period end.
hSee Note 1(f) regarding senior floating rate interests.
iSee Note 8 regarding credit risk and defaulted securities.
jThe security was issued on a discount basis with no stated coupon rate.
kA portion or all of the security has been segregated as collateral for securities sold short. At December 31, 2018, the value of this security pledged amounted to $67,454,552, representing 0.5% of net assets.
lSee Note 1(d) regarding securities sold short.
At December 31, 2018, the Fund had the following futures contracts outstanding. See Note 1(c).
Futures Contracts
Description | Type | | Number of Contracts | | | Notional Amount | * | | Expiration Date | | Value/ Unrealized Appreciation (Depreciation) | | ||||||||
| ||||||||||||||||||||
| Currency Contracts | ||||||||||||||||||||
EUR/USD | Short | 862 | $ | 124,154,938 | 3/18/19 | $ 18,533 | ||||||||||||||
GBP/USD | Short | 2,702 | 215,991,125 | 3/18/19 | 446,480 | |||||||||||||||
|
| |||||||||||||||||||
Total Futures Contracts | $465,013 | |||||||||||||||||||
|
| |||||||||||||||||||
*As of period end.
| 24 |
Annual Report | franklintempleton.com | ||
FRANKLIN MUTUAL SHARES FUND
STATEMENT OF INVESTMENTS
At December 31, 2018, the Fund had the following forward exchange contracts outstanding. See Note 1(c).
Forward Exchange Contracts
| Currency | Counterparty | a | Type | Quantity | | Contract Amount |
| | Settlement Date |
| | Unrealized Appreciation |
| | Unrealized Depreciation |
| ||||||||||||
| ||||||||||||||||||||||||||||
| OTC Forward Exchange Contracts |
| |||||||||||||||||||||||||||
Euro | BOFA | Buy | 22,984,735 | $ | 26,190,537 | 1/14/19 | $ 178,092 | $ — | ||||||||||||||||||||
Euro | BONY | Sell | 29,029,468 | 34,470,752 | 1/14/19 | 1,167,461 | — | |||||||||||||||||||||
Euro | HSBK | Buy | 40,156,645 | 45,753,694 | 1/14/19 | 314,957 | — | |||||||||||||||||||||
Euro | HSBK | Sell | 3,184,810 | 3,749,741 | 1/14/19 | 96,051 | — | |||||||||||||||||||||
Euro | SSBT | Buy | 10,367,564 | 11,809,439 | 1/14/19 | 84,474 | — | |||||||||||||||||||||
Euro | SSBT | Sell | 50,378,205 | 59,842,146 | 1/14/19 | 2,047,082 | — | |||||||||||||||||||||
Euro | UBSW | Buy | 7,415,299 | 8,436,166 | 1/14/19 | 70,841 | — | |||||||||||||||||||||
British Pound | BOFA | Buy | 2,596,054 | 3,289,858 | 1/16/19 | 23,549 | — | |||||||||||||||||||||
British Pound | BOFA | Sell | 4,427,482 | 5,888,817 | 1/16/19 | 237,916 | — | |||||||||||||||||||||
British Pound | HSBK | Buy | 4,018,408 | 5,098,978 | 1/16/19 | 29,811 | — | |||||||||||||||||||||
British Pound | HSBK | Sell | 3,654,007 | 4,875,256 | 1/16/19 | 211,560 | — | |||||||||||||||||||||
British Pound | UBSW | Buy | 677,452 | 856,134 | 1/16/19 | 8,514 | — | |||||||||||||||||||||
South Korean Won | BONY | Sell | 7,177,365,000 | 6,486,548 | 2/15/19 | 32,270 | — | |||||||||||||||||||||
South Korean Won | HSBK | Buy | 13,557,197,210 | 12,032,336 | 2/15/19 | 159,034 | — | |||||||||||||||||||||
South Korean Won | HSBK | Sell | 71,566,552,326 | 64,465,326 | 2/15/19 | 108,787 | — | |||||||||||||||||||||
South Korean Won | UBSW | Buy | 11,673,873,446 | 10,360,481 | 2/15/19 | 137,302 | — | |||||||||||||||||||||
South Korean Won | UBSW | Sell | 38,246,441,630 | 34,448,495 | 2/15/19 | 55,213 | — | |||||||||||||||||||||
Euro | BONY | Sell | 8,405,312 | 9,718,222 | 2/20/19 | 45,892 | — | |||||||||||||||||||||
Euro | HSBK | Sell | 11,994,483 | 14,179,256 | 2/20/19 | 376,723 | — | |||||||||||||||||||||
Euro | SSBT | Sell | 9,373,805 | 10,874,007 | 2/20/19 | 87,193 | — | |||||||||||||||||||||
Euro | BONY | Sell | 5,437,745 | 6,341,933 | 4/10/19 | 57,723 | — | |||||||||||||||||||||
Euro | SSBT | Sell | 5,437,746 | 6,342,587 | 4/10/19 | 58,375 | — | |||||||||||||||||||||
Euro | BOFA | Sell | 10,516,735 | 12,389,660 | 4/18/19 | 227,397 | — | |||||||||||||||||||||
Euro | HSBK | Sell | 10,516,734 | 12,391,763 | 4/18/19 | 229,500 | — | |||||||||||||||||||||
British Pound | UBSW | Sell | 44,604,887 | 58,439,762 | 4/24/19 | 1,241,489 | — | |||||||||||||||||||||
Euro | HSBK | Sell | 6,989,274 | 8,126,429 | 5/07/19 | 30,203 | — | |||||||||||||||||||||
South Korean Won | BONY | Sell | 7,343,124,345 | 6,623,184 | 5/17/19 | — | (5,198 | ) | ||||||||||||||||||||
South Korean Won | HSBK | Sell | 56,232,780,334 | 50,651,036 | 5/17/19 | — | (108,333 | ) | ||||||||||||||||||||
South Korean Won | UBSW | Sell | 55,844,969,521 | 49,950,778 | 5/17/19 | — | (458,528 | ) | ||||||||||||||||||||
Euro | HSBK | Sell | 7,279,653 | 8,390,382 | 5/21/19 | — | (52,492 | ) | ||||||||||||||||||||
Euro | SSBT | Sell | 23,290,869 | 27,121,053 | 5/21/19 | 108,517 | — | |||||||||||||||||||||
British Pound | BOFA | Sell | 92,809,023 | 120,164,658 | 5/28/19 | 961,916 | — | |||||||||||||||||||||
|
| |||||||||||||||||||||||||||
Total Forward Exchange Contracts | $ 8,387,842 | $ (624,551 | ) | |||||||||||||||||||||||||
|
| |||||||||||||||||||||||||||
Net unrealized appreciation (depreciation) | $ 7,763,291 | |||||||||||||||||||||||||||
|
| |||||||||||||||||||||||||||
aMay be comprised of multiple contracts with the same counterparty, currency and settlement date.
See Note 10 regarding other derivative information.
See Abbreviations on page 43.
franklintempleton.com |
The accompanying notes are an integral part of these financial statements. | | Annual Report | 25 | |||||
FRANKLIN MUTUAL SHARES FUND
Statement of Assets and Liabilities
December 31, 2018
Assets: | ||||
Investments in securities: | ||||
Cost - Unaffiliated issuers | $11,292,576,386 | |||
Cost -Non-controlled affiliates (Note 3f and 11) | 69,178,903 | |||
|
| |||
Value - Unaffiliated issuers | $12,438,929,686 | |||
Value -Non-controlled affiliates (Note 3f and 11) | 107,376,649 | |||
Cash | 1,049,841 | |||
Foreign currency, at value (cost $1,473,326) | 1,473,326 | |||
Receivables: | ||||
Investment securities sold | 3,735,682 | |||
Capital shares sold | 15,641,423 | |||
Dividends and interest | 34,842,532 | |||
European Union tax reclaims | 7,177,446 | |||
Deposits with brokers for: | ||||
Securities sold short | 160,083,230 | |||
Futures contracts | 8,921,380 | |||
Unrealized appreciation on OTC forward exchange contracts | 8,387,842 | |||
Other assets | 1,788 | |||
|
| |||
Total assets | 12,787,620,825 | |||
|
| |||
Liabilities: | ||||
Payables: | ||||
Investment securities purchased | 12,225,832 | |||
Capital shares redeemed | 26,497,982 | |||
Management fees | 7,191,971 | |||
Distribution fees | 2,368,070 | |||
Transfer agent fees | 1,750,479 | |||
Trustees’ fees and expenses | 955,705 | |||
Variation margin on futures contracts | 919,800 | |||
Securities sold short, at value (proceeds $174,046,070) | 148,540,745 | |||
Unrealized depreciation on OTC forward exchange contracts | 624,551 | |||
Accrued expenses and other liabilities | 648,864 | |||
|
| |||
Total liabilities | 201,723,999 | |||
|
| |||
Net assets, at value | $12,585,896,826 | |||
|
| |||
Net assets consist of: | ||||
Paid-in capital | $10,995,202,122 | |||
Total distributable earnings (loss) | 1,590,694,704 | |||
|
| |||
Net assets, at value | $12,585,896,826 | |||
|
| |||
| 26 |
Annual Report | The accompanying notes are an integral part of these financial statements. | franklintempleton.com | ||
FRANKLIN MUTUAL SHARES FUND
FINANCIAL STATEMENTS
Statement of Assets and Liabilities(continued)
December 31, 2018
| Class Z: | ||||
Net assets, at value | $5,189,476,003 | |||
|
| |||
Shares outstanding | 214,006,966 | |||
|
| |||
Net asset value and maximum offering price per share | $24.25 | |||
|
| |||
| Class A: | ||||
Net assets, at value | $3,852,134,274 | |||
|
| |||
Shares outstanding | 160,510,109 | |||
|
| |||
Net asset value per sharea | $24.00 | |||
|
| |||
Maximum offering price per share (net asset value per share ÷ 94.50%) | $25.40 | |||
|
| |||
| Class C: | ||||
Net assets, at value | $ 309,755,931 | |||
|
| |||
Shares outstanding | 12,923,293 | |||
|
| |||
Net asset value and maximum offering price per sharea | $23.97 | |||
|
| |||
| Class R: | ||||
Net assets, at value | $ 74,344,680 | |||
|
| |||
Shares outstanding | 3,109,359 | |||
|
| |||
Net asset value and maximum offering price per share | $23.91 | |||
|
| |||
| Class R6: | ||||
Net assets, at value | $3,160,185,938 | |||
|
| |||
Shares outstanding | 130,438,414 | |||
|
| |||
Net asset value and maximum offering price per share | $24.23 | |||
|
| |||
aRedemption price is equal to net asset value less contingent deferred sales charges, if applicable.
| franklintempleton.com |
The accompanying notes are an integral part of these financial statements. | Annual Report | 27 | ||||
FRANKLIN MUTUAL SHARES FUND
FINANCIAL STATEMENTS
Statement of Operations
for the year ended December 31, 2018
Investment income: | ||||
Dividends: (net of foreign taxes)* | ||||
Unaffiliated issuers | $ | 304,973,581 | ||
Non-controlled affiliates (Note 3f and 11) | 5,880,150 | |||
Interest: | ||||
Unaffiliated issuers | 60,120,731 | |||
Income from securities loaned: | ||||
Unaffiliated issuers (net of fees and rebates) | 87,926 | |||
Non-controlled affiliates (Note 3f) | 2,237 | |||
Other income (Note 1g) | 1,743,290 | |||
|
| |||
Total investment income | 372,807,915 | |||
|
| |||
Expenses: | ||||
Management fees (Note 3a) | 95,371,099 | |||
Distribution fees: (Note 3c) | ||||
Class A | 10,441,697 | |||
Class C | 8,070,000 | |||
Class R | 476,521 | |||
Transfer agent fees: (Note 3e) | ||||
Class Z | 5,437,817 | |||
Class A | 3,792,749 | |||
Class C | 733,080 | |||
Class R | 86,939 | |||
Class R6 | 774,618 | |||
Custodian fees (Note 4) | 419,425 | |||
Reports to shareholders | 727,921 | |||
Registration and filing fees | 198,616 | |||
Professional fees | 384,486 | |||
Trustees’ fees and expenses | 895,295 | |||
Dividends on securities sold short | 632,410 | |||
Other | 308,809 | |||
|
| |||
Total expenses | 128,751,482 | |||
Expense reductions (Note 4) | (94,069 | ) | ||
Expenses waived/paid by affiliates (Note 3f and 3g) | (48,100 | ) | ||
|
| |||
Net expenses | 128,609,313 | |||
|
| |||
Net investment income | 244,198,602 | |||
|
| |||
Realized and unrealized gains (losses): | ||||
Net realized gain (loss) from: | ||||
Investments: | ||||
Unaffiliated issuers | 1,018,447,400 | |||
Controlled affiliates (Note 3f and 11) | 27,760 | |||
Non-controlled affiliates (Note 3f and 11) | 30,054 | |||
Foreign currency transactions | (2,661,002 | ) | ||
Forward exchange contracts | 28,266,598 | |||
Futures contracts | 31,843,852 | |||
Securities sold short | 3,081,811 | |||
|
| |||
Net realized gain (loss) | 1,079,036,473 | |||
|
| |||
Net change in unrealized appreciation (depreciation) on: | ||||
Investments: | ||||
Unaffiliated issuers | (2,589,264,773 | ) | ||
Non-controlled affiliates (Note 3f and 11) | (63,741,134 | ) | ||
Translation of other assets and liabilities denominated in foreign currencies | (464,358 | ) | ||
Forward exchange contracts | 39,902,692 | |||
Futures contracts | 6,968,472 | |||
Securities sold short | 24,544,932 | |||
|
| |||
Net change in unrealized appreciation (depreciation) | (2,582,054,169 | ) | ||
|
| |||
Net realized and unrealized gain (loss) | (1,503,017,696 | ) | ||
|
|
| 28 |
Annual Report | The accompanying notes are an integral part of these financial statements. | franklintempleton.com | ||
FRANKLIN MUTUAL SHARES FUND
FINANCIAL STATEMENTS
Statement of Operations(continued)
for the year ended December 31, 2018
Net increase (decrease) in net assets resulting from operations | $ | (1,258,819,094 | ) | |
|
|
*Foreign taxes withheld on dividends | $ | 8,272,037 |
| franklintempleton.com |
The accompanying notes are an integral part of these financial statements. | Annual Report | 29 | ||||
FRANKLIN MUTUAL SHARES FUND
FINANCIAL STATEMENTS
Statements of Changes in Net Assets
| Year Ended December 31, | ||||||||
| 2018 | 2017 | |||||||
| ||||||||
Increase (decrease) in net assets: | ||||||||
Operations: | ||||||||
Net investment income | $ | 244,198,602 | $ | 329,366,264 | ||||
Net realized gain (loss) | 1,079,036,473 | 565,295,714 | ||||||
Net change in unrealized appreciation (depreciation) | (2,582,054,169 | ) | 361,422,610 | |||||
|
| |||||||
Net increase (decrease) in net assets resulting from operations | (1,258,819,094 | ) | 1,256,084,588 | |||||
|
| |||||||
Distributions to shareholders: (Note 1h) | ||||||||
Class Z | (359,738,797 | ) | (440,140,182 | ) | ||||
Class A | (258,843,422 | ) | (284,207,900 | ) | ||||
Class C | (16,133,984 | ) | (57,527,176 | ) | ||||
Class R | (4,696,240 | ) | (6,815,560 | ) | ||||
Class R6 | (218,275,931 | ) | (221,876,421 | ) | ||||
|
| |||||||
Total distributions to shareholders | (857,688,374 | ) | (1,010,567,239 | ) | ||||
|
| |||||||
Capital share transactions: (Note 2) | ||||||||
Class Z | (162,098,601 | ) | (1,618,916,627 | ) | ||||
Class A | 114,605,103 | (431,662,396 | ) | |||||
Class C | (631,170,380 | ) | (138,671,413 | ) | ||||
Class R | (21,048,937 | ) | (17,540,464 | ) | ||||
Class R6 | (59,462,529 | ) | 1,869,126,723 | |||||
|
| |||||||
Total capital share transactions | (759,175,344 | ) | (337,664,177 | ) | ||||
|
| |||||||
Net increase (decrease) in net assets | (2,875,682,812 | ) | (92,146,828 | ) | ||||
Net assets: | ||||||||
Beginning of year | 15,461,579,638 | 15,553,726,466 | ||||||
|
| |||||||
End of year (Note 1h) | $ | 12,585,896,826 | $ | 15,461,579,638 | ||||
|
| |||||||
| 30 |
Annual Report | The accompanying notes are an integral part of these financial statements. | franklintempleton.com | ||
FRANKLIN MUTUAL SHARES FUND
1. Organization and Significant Accounting
Policies
Franklin Mutual Series Funds (Trust) is registered under the Investment Company Act of 1940 (1940 Act) as anopen-end management investment company, consisting of seven separate funds and applies the specialized accounting and reporting guidance in U.S. Generally Accepted Accounting Principles (U.S. GAAP). Franklin Mutual Shares Fund (Fund) is included in this report. The Fund offers five classes of shares: Class Z, Class A, Class C, Class R and Class R6. Beginning on October 19, 2018, Class C shares automatically convert to Class A shares after they have been held for 10 years. Each class of shares may differ by its initial sales load, contingent deferred sales charges, voting rights on matters affecting a single class, its exchange privilege and fees due to differing arrangements for distribution and transfer agent fees.
The following summarizes the Fund’s significant accounting policies.
a. Financial Instrument Valuation
The Fund’s investments in financial instruments are carried at fair value daily. Fair value is the price that would be received to sell an asset or paid to transfer a liability in an orderly transaction between market participants on the measurement date. The Fund calculates the net asset value (NAV) per share each business day as of 4 p.m. Eastern time or the regularly scheduled close of the New York Stock Exchange (NYSE), whichever is earlier. Under compliance policies and procedures approved by the Trust’s Board of Trustees (the Board), the Fund’s administrator has responsibility for oversight of valuation, including leading the cross-functional Valuation Committee (VC). The Fund may utilize independent pricing services, quotations from securities and financial instrument dealers, and other market sources to determine fair value.
Equity securities and derivative financial instruments listed on an exchange or on the NASDAQ National Market System are valued at the last quoted sale price or the official closing price of the day, respectively. Foreign equity securities are valued as of the close of trading on the foreign stock exchange on which the security is primarily traded, or as of 4 p.m. Eastern time. The value is then converted into its U.S. dollar equivalent at the foreign exchange rate in effect at 4 p.m. Eastern time on the day that the value of the security is determined.Over-the-counter (OTC) securities are valued within the range of the most recent quoted bid and ask prices. Securities that trade in multiple
markets or on multiple exchanges are valued according to the broadest and most representative market. Certain equity securities are valued based upon fundamental characteristics or relationships to similar securities.
Debt securities generally trade in the OTC market rather than on a securities exchange. The Fund’s pricing services use multiple valuation techniques to determine fair value. In instances where sufficient market activity exists, the pricing services may utilize a market-based approach through which quotes from market makers are used to determine fair value. In instances where sufficient market activity may not exist or is limited, the pricing services also utilize proprietary valuation models which may consider market characteristics such as benchmark yield curves, credit spreads, estimated default rates, anticipated market interest rate volatility, coupon rates, anticipated timing of principal repayments, underlying collateral, and other unique security features in order to estimate the relevant cash flows, which are then discounted to calculate the fair value.
Investments inopen-end mutual funds are valued at the closing NAV.
Certain derivative financial instruments trade in the OTC market. The Fund’s pricing services use various techniques including industry standard option pricing models and proprietary discounted cash flow models to determine the fair value of those instruments. The Fund’s net benefit or obligation under the derivative contract, as measured by the fair value of the contract, is included in net assets.
The Fund has procedures to determine the fair value of financial instruments for which market prices are not reliable or readily available. Under these procedures, the Fund primarily employs a market-based approach which may use related or comparable assets or liabilities, recent transactions, market multiples, book values, and other relevant information for the investment to determine the fair value of the investment. An income-based valuation approach may also be used in which the anticipated future cash flows of the investment are discounted to calculate fair value. Discounts may also be applied due to the nature or duration of any restrictions on the disposition of the investments. Due to the inherent uncertainty of valuations of such investments, the fair values may differ significantly from the values that would have been used had an active market existed.
| franklintempleton.com |
Annual Report | 31 | ||||
FRANKLIN MUTUAL SHARES FUND
NOTES TO FINANCIAL STATEMENTS
1. Organization and Significant Accounting
Policies(continued)
a. Financial Instrument Valuation(continued)
Trading in securities on foreign securities stock exchanges and OTC markets may be completed before 4 p.m. Eastern time. In addition, trading in certain foreign markets may not take place on every Fund’s business day. Occasionally, events occur between the time at which trading in a foreign security is completed and 4 p.m. Eastern time that might call into question the reliability of the value of a portfolio security held by the Fund. As a result, differences may arise between the value of the Fund’s portfolio securities as determined at the foreign market close and the latest indications of value at 4 p.m. Eastern time. In order to minimize the potential for these differences, the VC monitors price movements following the close of trading in foreign stock markets through a series of country specific market proxies (such as baskets of American Depositary Receipts, futures contracts and exchange traded funds). These price movements are measured against established trigger thresholds for each specific market proxy to assist in determining if an event has occurred that may call into question the reliability of the values of the foreign securities held by the Fund. If such an event occurs, the securities may be valued using fair value procedures, which may include the use of independent pricing services. At December 31, 2018, a market event occurred resulting in a portion of the securities held by the Fund being valued using fair value procedures.
When the last day of the reporting period is anon-business day, certain foreign markets may be open on those days that the Fund’s NAV is not calculated, which could result in differences between the value of the Fund’s portfolio securities on the last business day and the last calendar day of the reporting period. Any significant security valuation changes due to an open foreign market are adjusted and reflected by the Fund for financial reporting purposes.
b. Foreign Currency Translation
Portfolio securities and other assets and liabilities denominated in foreign currencies are translated into U.S. dollars based on the exchange rate of such currencies against U.S. dollars on the date of valuation. The Fund may enter into foreign currency exchange contracts to facilitate transactions denominated in a foreign currency. Purchases and sales of securities, income and expense items denominated in foreign currencies are translated into U.S. dollars at the exchange rate in effect on the transaction
date. Portfolio securities and assets and liabilities denominated in foreign currencies contain risks that those currencies will decline in value relative to the U.S. dollar. Occasionally, events may impact the availability or reliability of foreign exchange rates used to convert the U.S. dollar equivalent value. If such an event occurs, the foreign exchange rate will be valued at fair value using procedures established and approved by the Board.
The Fund does not separately report the effect of changes in foreign exchange rates from changes in market prices on securities held. Such changes are included in net realized and unrealized gain or loss from investments in the Statement of Operations.
Realized foreign exchange gains or losses arise from sales of foreign currencies, currency gains or losses realized between the trade and settlement dates on securities transactions and the difference between the recorded amounts of dividends, interest, and foreign withholding taxes and the U.S. dollar equivalent of the amounts actually received or paid. Net unrealized foreign exchange gains and losses arise from changes in foreign exchange rates on foreign denominated assets and liabilities other than investments in securities held at the end of the reporting period.
c. Derivative Financial Instruments
The Fund invested in derivative financial instruments in order to manage risk or gain exposure to various other investments or markets. Derivatives are financial contracts based on an underlying or notional amount, require no initial investment or an initial net investment that is smaller than would normally be required to have a similar response to changes in market factors, and require or permit net settlement. Derivatives contain various risks including the potential inability of the counterparty to fulfill their obligations under the terms of the contract, the potential for an illiquid secondary market, and/or the potential for market movements which expose the Fund to gains or losses in excess of the amounts shown in the Statement of Assets and Liabilities. Realized gain and loss and unrealized appreciation and depreciation on these contracts for the period are included in the Statement of Operations.
Derivative counterparty credit risk is managed through a formal evaluation of the creditworthiness of all potential counterparties. The Fund attempts to reduce its exposure to counterparty credit risk on OTC derivatives, whenever possible, by entering into International Swaps and Derivatives
| 32 |
Annual Report | franklintempleton.com | ||
FRANKLIN MUTUAL SHARES FUND
NOTES TO FINANCIAL STATEMENTS
Association (ISDA) master agreements with certain counterparties. These agreements contain various provisions, including but not limited to collateral requirements, events of default, or early termination. Termination events applicable to the counterparty include certain deteriorations in the credit quality of the counterparty. Termination events applicable to the Fund include failure of the Fund to maintain certain net asset levels and/or limit the decline in net assets over various periods of time. In the event of default or early termination, the ISDA master agreement gives thenon-defaulting party the right to net andclose-out all transactions traded, whether or not arising under the ISDA agreement, to one net amount payable by one counterparty to the other. However, absent an event of default or early termination, OTC derivative assets and liabilities are presented gross and not offset in the Statement of Assets and Liabilities. Early termination by the counterparty may result in an immediate payment by the Fund of any net liability owed to that counterparty under the ISDA agreement. At December 31, 2018, the Fund had no OTC derivatives in a net liability position for such contracts.
Collateral requirements differ by type of derivative. Collateral or initial margin requirements are set by the broker or exchange clearing house for exchange traded and centrally cleared derivatives. Initial margin deposited is held at the exchange and can be in the form of cash and/or securities. For OTC derivatives traded under an ISDA master agreement, posting of collateral is required by either the Fund or the applicable counterparty if the total net exposure of all OTC derivatives with the applicable counterparty exceeds the minimum transfer amount, which typically ranges from $100,000 to $250,000, and can vary depending on the counterparty and the type of the agreement. Generally, collateral is determined at the close of Fund business each day and any additional collateral required due to changes in derivative values may be delivered by the Fund or the counterparty the next business day, or within a few business days. Collateral pledged and/or received by the Fund for OTC derivatives, if any, is held in segregated accounts with the Fund’s custodian/counterparty broker and can be in the form of cash and/or securities. Unrestricted cash may be invested according to the Fund’s investment objectives. To the extent that the amounts due to the Fund from its counterparties are not subject to collateralization or are not fully collateralized, the Fund bears the risk of loss from counterpartynon-performance.
At December 31, 2018, the Fund received $9,083,691 in U.K. Treasury Bonds and U.S. Treasury Bills, Bonds and Notes as collateral for derivatives.
The Fund entered into exchange traded futures contracts primarily to manage exposure to certain foreign currencies. A futures contract is an agreement between the Fund and a counterparty to buy or sell an asset at a specified price on a future date. Required initial margins are pledged by the Fund, and the daily change in fair value is accounted for as a variation margin payable or receivable in the Statement of Assets and Liabilities.
The Fund entered into OTC forward exchange contracts primarily to manage exposure to certain foreign currencies. A forward exchange contract is an agreement between the Fund and a counterparty to buy or sell a foreign currency at a specific exchange rate on a future date.
See Note 10 regarding other derivative information.
d. Securities Sold Short
The Fund is engaged in selling securities short, which obligates the Fund to replace a borrowed security with the same security at current fair value. The Fund incurs a loss if the price of the security increases between the date of the short sale and the date on which the Fund replaces the borrowed security. The Fund realizes a gain if the price of the security declines between those dates. Gains are limited to the price at which the Fund sold the security short, while losses are potentially unlimited in size.
The Fund is required to establish a margin account with the broker lending the security sold short. While the short sale is outstanding, the broker retains the proceeds of the short sale to the extent necessary to meet margin requirements until the short position is closed out. A deposit must also be maintained with the Fund’s custodian/counterparty broker consisting of cash and/or securities having a value equal to a specified percentage of the value of the securities sold short. The Fund is obligated to pay fees for borrowing the securities sold short and is required to pay the counterparty any dividends and/or interest due on securities sold short. Such dividends and/or interest and any security borrowing fees are recorded as an expense to the Fund.
e. Securities Lending
The Fund participates in an agency based securities lending program to earn additional income. The Fund receives cash collateral against the loaned securities in an amount equal to at
| franklintempleton.com |
Annual Report | 33 | ||||
FRANKLIN MUTUAL SHARES FUND
NOTES TO FINANCIAL STATEMENTS
1. Organization and Significant Accounting Policies(continued)
e. Securities Lending(continued)
least 102% of the fair value of the loaned securities. Collateral is maintained over the life of the loan in an amount not less than 100% of the fair value of loaned securities, as determined at the close of Fund business each day; any additional collateral required due to changes in security values is delivered to the Fund on the next business day. The collateral is deposited into a joint cash account with other funds and is used to invest in a money market fund managed by Franklin Advisers, Inc., an affiliate of the Fund, and/or a joint repurchase agreement. The Fund may receive income from the investment of cash collateral, in addition to lending fees and rebates paid by the borrower. Income from securities loaned, net of fees paid to the securities lending agent and/or third-party vendor, is reported separately in the Statement of Operations. The Fund bears the market risk with respect to the collateral investment, securities loaned, and the risk that the agent may default on its obligations to the Fund. If the borrower defaults on its obligation to return the securities loaned, the Fund has the right to repurchase the securities in the open market using the collateral received. The securities lending agent has agreed to indemnify the Fund in the event of default by a third party borrower. At December 31, 2018, the Fund had no securities on loan.
f. Senior Floating Rate Interests
The Fund invests in senior secured corporate loans that pay interest at rates which are periodically reset by reference to a base lending rate plus a spread. These base lending rates are generally the prime rate offered by a designated U.S. bank or the London InterBank Offered Rate (LIBOR). Senior secured corporate loans often require prepayment of principal from excess cash flows or at the discretion of the borrower. As a result, actual maturity may be substantially less than the stated maturity. Senior secured corporate loans in which the Fund invests are generally readily marketable, but may be subject to certain restrictions on resale.
g. Income and Deferred Taxes
It is the Fund’s policy to qualify as a regulated investment company under the Internal Revenue Code. The Fund intends to distribute to shareholders substantially all of its taxable income
and net realized gains to relieve it from federal income and excise taxes. As a result, no provision for U.S. federal income taxes is required.
The Fund may be subject to foreign taxation related to income received, capital gains on the sale of securities and certain foreign currency transactions in the foreign jurisdictions in which it invests. Foreign taxes, if any, are recorded based on the tax regulations and rates that exist in the foreign markets in which the Fund invests. When a capital gain tax is determined to apply, the Fund records an estimated deferred tax liability in an amount that would be payable if the securities were disposed of on the valuation date.
As a result of several court cases, in certain countries across the European Union, the Fund filed additional tax reclaims for previously withheld taxes on dividends earned in those countries (EU reclaims). These additional filings are subject to various administrative proceedings by the local jurisdictions’ tax authorities within the European Union, as well as a number of related judicial proceedings. Income recognized, if any, for EU reclaims is reflected as other income in the Statement of Operations and any related receivable, if any, is reflected as European Union tax reclaims in the Statement of Assets and Liabilities. When uncertainty exists as to the ultimate resolution of these proceedings, the likelihood of receipt of these EU reclaims, and the potential timing of payment, no amounts are reflected in the financial statements. For U.S. income tax purposes, EU reclaims received by the Fund, if any, reduce the amounts of foreign taxes Fund shareholders can use as tax credits in their individual income tax returns.
The Fund may recognize an income tax liability related to its uncertain tax positions under U.S. GAAP when the uncertain tax position has a less than 50% probability that it will be sustained upon examination by the tax authorities based on its technical merits. As of December 31, 2018, the Fund has determined that no tax liability is required in its financial statements related to uncertain tax positions for any open tax years (or expected to be taken in future tax years). Open tax years are those that remain subject to examination and are based on the statute of limitations in each jurisdiction in which the Fund invests.
| 34 |
Annual Report | franklintempleton.com | ||
FRANKLIN MUTUAL SHARES FUND
NOTES TO FINANCIAL STATEMENTS
h. Security Transactions, Investment Income, Expenses and Distributions
Security transactions are accounted for on trade date. Realized gains and losses on security transactions are determined on a specific identification basis. Interest income and estimated expenses are accrued daily. Amortization of premium and accretion of discount on debt securities are included in interest income. Dividend income and dividends declared on securities sold short are recorded on theex-dividend date except for certain dividends from securities where the dividend rate is not available. In such cases, the dividend is recorded as soon as the information is received by the Fund. Distributions to shareholders are recorded on theex-dividend date. Distributable earnings are determined according to income tax regulations (tax basis) and may differ from earnings recorded in accordance with U.S. GAAP. These differences may be permanent or temporary. Permanent differences are reclassified among capital accounts to reflect their tax character. These reclassifications have no impact on net assets or the results of operations. Temporary differences are not reclassified, as they may reverse in subsequent periods.*
Common expenses incurred by the Trust are allocated among the Funds based on the ratio of net assets of each Fund to the combined net assets of the Trust or based on the ratio of number of shareholders of each Fund to the combined number of shareholders of the Trust. Fund specific expenses are charged directly to the Fund that incurred the expense.
Realized and unrealized gains and losses and net investment income, excluding class specific expenses, are allocated daily to each class of shares based upon the relative proportion of net assets of each class. Differences in per share distributions by class are generally due to differences in class specific expenses.
i. Accounting Estimates
The preparation of financial statements in accordance with U.S. GAAP requires management to make estimates and assumptions that affect the reported amounts of assets and liabilities at the date of the financial statements and the amounts of income and expenses during the reporting period. Actual results could differ from those estimates.
j. Guarantees and Indemnifications
Under the Trust’s organizational documents, its officers and trustees are indemnified by the Trust against certain liabilities arising out of the performance of their duties to the Trust. Additionally, in the normal course of business, the Trust, on behalf of the Fund, enters into contracts with service providers that contain general indemnification clauses. The Trust’s maximum exposure under these arrangements is unknown as this would involve future claims that may be made against the Trust that have not yet occurred. Currently, the Trust expects the risk of loss to be remote.
*Effective during the current reporting period, it is no longer required to present certain line items in the Statements of Changes in Net Assets. The below prior period amounts affected by this change are shown as they were in the prior year Statements of Changes in Net Assets.
For the year ended December 31, 2017, distributions to shareholders were as follows:
Distributions from net investment income : | ||||
Class Z | $(143,391,184) | |||
Class A | (90,135,244 | ) | ||
Class C | (12,762,513 | ) | ||
Class R | (1,950,214 | ) | ||
Class R6 | (87,386,307 | ) | ||
Distributions from net realized gains: | ||||
Class Z | (296,748,998 | ) | ||
Class A | (194,072,656 | ) | ||
Class C | (44,764,663 | ) | ||
Class R | (4,865,346 | ) | ||
Class R6 | (134,490,114 | ) |
For the year ended December 31, 2017, undistributed net investment income (loss) included in net assets was $2,054,424.
| franklintempleton.com |
Annual Report | 35 | ||||
FRANKLIN MUTUAL SHARES FUND
NOTES TO FINANCIAL STATEMENTS
2. Shares of Beneficial Interest
At December 31, 2018, there were an unlimited number of shares authorized (without par value). Transactions in the Fund’s shares were as follows:
| Year Ended December 31, | ||||||||||||||||
|
| |||||||||||||||
| 2018 | 2017 | |||||||||||||||
|
| |||||||||||||||
| Shares | Amount | Shares | Amount | |||||||||||||
| ||||||||||||||||
| Class Z Shares: | ||||||||||||||||
Shares sold | 10,029,587 | $ | 284,766,342 | 23,691,795 | $ | 696,267,462 | ||||||||||
Shares issued in reinvestment of distributions | 13,492,550 | 320,309,753 | 13,747,109 | 395,547,594 | ||||||||||||
Shares redeemed | (27,123,733 | ) | (767,174,696 | ) | (92,023,346 | ) | (2,710,731,683 | ) | ||||||||
|
| |||||||||||||||
Net increase (decrease) | (3,601,596 | ) | $ | (162,098,601 | ) | (54,584,442 | ) | $ | (1,618,916,627 | ) | ||||||
|
| |||||||||||||||
| Class A Shares: | ||||||||||||||||
Shares solda | 25,412,499 | $ | 710,808,675 | 17,964,808 | $ | 522,017,079 | ||||||||||
Shares issued in reinvestment of distributions | 10,148,432 | 238,431,075 | 9,145,140 | 260,399,623 | ||||||||||||
Shares redeemed | (29,787,083 | ) | (834,634,647 | ) | (41,761,357 | ) | (1,214,079,098 | ) | ||||||||
|
| |||||||||||||||
Net increase (decrease) | 5,773,848 | $ | 114,605,103 | (14,651,409 | ) | $ | (431,662,396 | ) | ||||||||
|
| |||||||||||||||
| Class C Shares: | ||||||||||||||||
Shares sold | 2,074,273 | $ | 57,275,560 | 2,533,117 | $ | 72,481,356 | ||||||||||
Shares issued in reinvestment of distributions | 675,227 | 15,942,868 | 2,024,489 | 56,971,259 | ||||||||||||
Shares redeemeda | (25,329,240 | ) | �� | (704,388,808 | ) | (9,333,970 | ) | (268,124,028 | ) | |||||||
|
| |||||||||||||||
Net increase (decrease) | (22,579,740 | ) | $ | (631,170,380 | ) | (4,776,364 | ) | $ | (138,671,413 | ) | ||||||
|
| |||||||||||||||
| Class R Shares: | ||||||||||||||||
Shares sold | 347,792 | $ | 9,776,448 | 622,054 | $ | 17,981,440 | ||||||||||
Shares issued in reinvestment of distributions | 199,115 | 4,662,921 | 239,266 | 6,777,153 | ||||||||||||
Shares redeemed | (1,253,910 | ) | (35,488,306 | ) | (1,464,599 | ) | (42,299,057 | ) | ||||||||
|
| |||||||||||||||
Net increase (decrease) | (707,003 | ) | $ | (21,048,937 | ) | (603,279 | ) | $ | (17,540,464 | ) | ||||||
|
| |||||||||||||||
| Class R6 Shares: | ||||||||||||||||
Shares sold | 14,420,824 | $ | 412,295,163 | 63,378,950 | $ | 1,870,087,713 | ||||||||||
Shares issued in reinvestment of distributions | 9,195,249 | 218,103,352 | 7,729,991 | 221,874,105 | ||||||||||||
Shares redeemed | (23,959,670 | ) | (689,861,044 | ) | (7,551,970 | ) | (222,835,095 | ) | ||||||||
|
| |||||||||||||||
Net increase (decrease) | (343,597 | ) | $ | (59,462,529 | ) | 63,556,971 | $ | 1,869,126,723 | ||||||||
|
| |||||||||||||||
aMay include a portion of Class C shares that were automatically converted to Class A.
3. Transactions with Affiliates
Franklin Resources, Inc. is the holding company for various subsidiaries that together are referred to as Franklin Templeton. Certain officers and trustees of the Fund are also officers and/or directors of the following subsidiaries:
| Subsidiary | Affiliation | |
Franklin Mutual Advisers, LLC (Franklin Mutual)
| Investment manager
| |
Franklin Templeton Services, LLC (FT Services)
| Administrative manager
| |
Franklin Templeton Distributors, Inc. (Distributors)
| Principal underwriter
| |
Franklin Templeton Investor Services, LLC (Investor Services)
| Transfer agent
| |
| 36 |
Annual Report | franklintempleton.com | ||
FRANKLIN MUTUAL SHARES FUND
NOTES TO FINANCIAL STATEMENTS
a. Management Fees
The Fund pays an investment management fee to Franklin Mutual based on the average daily net assets of the Fund as follows:
| Annualized Fee Rate | Net Assets | |
0.675%
| Up to and including $5 billion
| |
0.645%
| Over $5 billion, up to and including $10 billion
| |
0.625%
| Over $10 billion, up to and including $15 billion
| |
0.595%
| Over $15 billion, up to and including $20 billion
| |
0.585%
| Over $20 billion, up to and including $25 billion
| |
0.565%
| Over $25 billion, up to and including $30 billion
| |
0.555%
| Over $30 billion, up to and including $35 billion
| |
0.545%
| In excess of $35 billion
| |
For the year ended December 31, 2018, the gross effective investment management fee rate was 0.649% of the Fund’s average daily net assets.
b. Administrative Fees
Under an agreement with Franklin Mutual, FT Services provides administrative services to the Fund. The fee is paid by Franklin Mutual based on the Fund’s average daily net assets, and is not an additional expense of the Fund.
c. Distribution Fees
The Board has adopted distribution plans for each share class, with the exception of Class Z and Class R6 shares, pursuant to Rule12b-1 under the 1940 Act. Under the Fund’s Class A reimbursement distribution plan, the Fund reimburses Distributors for costs incurred in connection with the servicing, sale and distribution of the Fund’s shares up to the maximum annual plan rate. Under the Class A reimbursement distribution plan, costs exceeding the maximum for the current plan year cannot be reimbursed in subsequent periods. In addition, under the Fund’s Class C and R compensation distribution plans, the Fund pays Distributors for costs incurred in connection with the servicing, sale and distribution of the Fund’s shares up to the maximum annual plan rate for each class. The plan year, for purposes of monitoring compliance with the maximum annual plan rates, is February 1 through January 31.
The maximum annual plan rates, based on the average daily net assets, for each class, are as follows:
Class A | 0.35% | |||
Class C | 1.00% | |||
Class R | 0.50% | |||
The Board has set the current rate at 0.25% per year for Class A shares until further notice and approval by the Board.
d. Sales Charges/Underwriting Agreements
Front-end sales charges and contingent deferred sales charges (CDSC) do not represent expenses of the Fund. These charges are deducted from the proceeds of sales of Fund shares prior to investment or from redemption proceeds prior to remittance, as applicable. Distributors has advised the Fund of the following commission transactions related to the sales and redemptions of the Fund’s shares for the year:
Sales charges retained net of commissions paid to unaffiliated brokers/dealers | $ | 307,621 | ||
CDSC retained | $ | 22,051 | ||
franklintempleton.com | Annual Report | 37 | ||||
FRANKLIN MUTUAL SHARES FUND
NOTES TO FINANCIAL STATEMENTS
3. Transactions with Affiliates(continued)
d. Sales Charges/Underwriting Agreements(continued)
Effective September 10, 2018, the Board approved changes to certainfront-end sales charges and dealer commissions on Class A shares. Further details are disclosed in the Fund’s Prospectus.
e. Transfer Agent Fees
Each class of shares pays transfer agent fees to Investor Services for its performance of shareholder servicing obligations. The fees are based on an annualized asset based fee of 0.02% plus a transaction based fee. In addition, each class reimburses Investor Services for out of pocket expenses incurred and, except for Class R6 reimburses shareholder servicing fees paid to third parties. These fees are allocated daily based upon their relative proportion of such classes’ aggregate net assets. Class R6 pays Investor Services transfer agent fees specific to that class.
For the year ended December 31, 2018, the Fund paid transfer agent fees of $10,825,203, of which $5,695,664 was retained by Investor Services.
f. Investments in Affiliated Management Investment Companies
The Fund invests in one or more affiliated management investment companies for purposes other than exercising a controlling influence over the management or policies. Management fees paid by the Fund are waived on assets invested in the affiliated management investment companies, as noted in the Statement of Operations, in an amount not to exceed the management and administrative fees paid directly or indirectly by each affiliate. During the year ended December 31, 2018, the Fund held investments in affiliated management investment companies as follows:
| Number of Shares Held at Beginning of Year | Gross Additions | Gross Reductions | Number of Shares Held at End of Year | Value at End of Year | Income from securities loaned | Realized Gain (Loss) | Net Change in Unrealized Appreciation (Depreciation) | |||||||||||||||||||||||||
| Non-Controlled Affiliates | ||||||||||||||||||||||||||||||||
Institutional Fiduciary Trust Money Market Portfolio, 1.99% | — | 26,728,000 | (26,728,000 | ) | — | $ — | $2,237 | $ — | $ — | |||||||||||||||||||||||
|
| |||||||||||||||||||||||||||||||
g. Waiver and Expense Reimbursements
Investor Services has voluntarily agreed in advance to waive or limit its fees so that the Class R6 transfer agent fees do not exceed 0.02% based on the average net assets of the class. Investor Services may discontinue this waiver in the future.
h. Other Affiliated Transactions
At December 31, 2018, one or more of the funds in Franklin Fund Allocator Series owned 11.3% of the Fund’s outstanding shares.
4. Expense Offset Arrangement
The Fund has entered into an arrangement with its custodian whereby credits realized as a result of uninvested cash balances are used to reduce a portion of the Fund’s custodian expenses. During the year ended December 31, 2018, the custodian fees were reduced as noted in the Statement of Operations.
| 38 |
Annual Report | franklintempleton.com | ||
FRANKLIN MUTUAL SHARES FUND
NOTES TO FINANCIAL STATEMENTS
5. Independent Trustees’ Retirement Plan
On January 1, 1993, the Trust adopted an Independent Trustees’ Retirement Plan (Plan). The Plan is an unfunded defined benefit plan that provides benefit payments to Trustees whose length of service and retirement age meets the eligibility requirements of the Plan. Benefits under the Plan are based on years of service and fees paid to each trustee at the time of retirement. Effective in December 1996, the Plan was closed to new participants.
During the year ended December 31, 2018, the Fund’s projected benefit obligation and benefit payments under the Plan were as follows:
aProjected benefit obligation at December 31, 2018 | $ | 955,705 | |||
bIncrease in projected benefit obligation | $ | 232,125 | |||
Benefit payments made to retired trustees | $ | (15,790 | ) | ||
aThe projected benefit obligation is included in trustees’ fees and expenses in the Statement of Assets and Liabilities.
bThe increase in projected benefit obligation is included in trustees’ fees and expenses in the Statement of Operations.
6. Income Taxes
The tax character of distributions paid during the years ended December 31, 2018 and 2017, was as follows:
| 2018 | 2017 | |||||||||
|
| |||||||||
Distributions paid from: | ||||||||||
Ordinary income | $ | 273,584,591 | $ | 367,181,482 | ||||||
Long term capital gain | 584,103,783 | 643,385,757 | ||||||||
|
| |||||||||
| $ | 857,688,374 | $ | 1,010,567,239 | |||||||
|
| |||||||||
At December 31, 2018, the cost of investments, net unrealized appreciation (depreciation), undistributed ordinary income and undistributed long term capital gains for income tax purposes were as follows:
Cost of investments | $ | 11,206,385,757 | ||
|
| |||
Unrealized appreciation | $ | 2,440,010,903 | ||
Unrealized depreciation | (1,240,390,266) | |||
|
| |||
Net unrealized appreciation (depreciation) | $ | 1,199,620,637 | ||
|
| |||
Distributable earnings: | ||||
Undistributed ordinary income | $ | 9,116,741 | ||
Undistributed long term capital gains | 375,725,587 | |||
|
| |||
Total distributable earnings | $ | 384,842,328 | ||
|
| |||
Differences between income and/or capital gains as determined on a book basis and a tax basis are primarily due to differing treatment of foreign currency transactions.
The Fund utilized a tax accounting practice to treat a portion of the proceeds from capital shares redeemed as a distribution from realized capital gains.
7. Investment Transactions
Purchases and sales of investments (excluding short term securities and securities sold short) for the year ended December 31, 2018, aggregated $2,810,237,178 and $4,542,869,806, respectively.
franklintempleton.com | Annual Report | 39 | ||||
FRANKLIN MUTUAL SHARES FUND
NOTES TO FINANCIAL STATEMENTS
8. Credit Risk and Defaulted Securities
The Fund may purchase thepre-default or defaulted debt of distressed companies. Distressed companies are financially troubled and could be or are already involved in financial restructuring or bankruptcy. Risks associated with purchasing these securities include the possibility that the bankruptcy or other restructuring process takes longer than expected, or that distributions in restructuring are less than anticipated, either or both of which may result in unfavorable consequences to the Fund. If it becomes probable that the income on debt securities, including those of distressed companies, will not be collected, the Fund discontinues accruing income and recognizes an adjustment for uncollectible interest.
At December 31, 2018, the aggregate long value of distressed company securities for which interest recognition has been discontinued was $171,679,898, representing 1.4% of the Fund’s net assets. For information as to specific securities, see the accompanying Statement of Investments.
9. Restricted Securities
The Fund invests in securities that are restricted under the Securities Act of 1933 (1933 Act). Restricted securities are often purchased in private placement transactions, and cannot be sold without prior registration unless the sale is pursuant to an exemption under the 1933 Act. Disposal of these securities may require greater effort and expense, and prompt sale at an acceptable price may be difficult. The Fund may have registration rights for restricted securities. The issuer generally incurs all registration costs.
At December 31, 2018, investments in restricted securities, excluding securities exempt from registration under the 1933 Act deemed to be liquid, were as follows:
| Principal Amount/ Shares | Issuer | Acquisition Date | Cost | Value | ||||||||||||
|
| |||||||||||||||
| 19,594 | Broadband Ventures III LLC, secured promissory note, 5.00%, 2/01/12 | 7/01/10 - 11/30/12 | $ | 19,594 | $ | — | ||||||||||
| 7,234,813 | International Automotive Components Group Brazil LLC | 4/13/06 - 12/26/08 | 4,804,678 | 306,590 | ||||||||||||
| 63,079,866 | International Automotive Components Group North America LLC | 1/12/06 - 3/18/13 | 51,662,536 | 7,519,120 | ||||||||||||
|
| |||||||||||||||
| Total Restricted Securities(Value is 0.1% of Net Assets) | $ | 56,486,808 | $ | 7,825,710 | ||||||||||||
|
| |||||||||||||||
10. Other Derivative Information
At December 31, 2018, the Fund’s investments in derivative contracts are reflected in the Statement of Assets and Liabilities as follows:
Asset Derivatives | Liability Derivatives | |||||||||||
Derivative Contracts Not Accounted for as Hedging Instruments | Statement of Assets and Liabilities Location | Fair Value | Statement of Assets and Liabilities Location | Fair Value | ||||||||
| ||||||||||||
Foreign exchange contracts | Variation margin on futures contracts | $ | 465,013 | a | Variation margin on futures | $ | — | |||||
Unrealized appreciation on OTC forward exchange contracts | 8,387,842 | Unrealized depreciation on OTC forward exchange contracts | 624,551 | |||||||||
|
|
|
| |||||||||
Totals | $ | 8,852,855 | $ | 624,551 | ||||||||
|
|
|
| |||||||||
aThis amount reflects the cumulative appreciation (depreciation) of futures contracts as reported in the Statement of Investments. Only the variation margin receivable/payable at year end is separately reported within the Statement of Assets and Liabilities. Prior variation margin movements were recorded to cash upon receipt or payment.
| 40 |
Annual Report | franklintempleton.com | ||
FRANKLIN MUTUAL SHARES FUND
NOTES TO FINANCIAL STATEMENTS
For the year ended December 31, 2018, the effect of derivative contracts in the Fund’s Statement of Operations was as follows:
Derivative Contracts Not Accounted for as Hedging Instruments | Statement of Operations Location | Net Realized Gain (Loss) for the Year | Statement of Operations Location | Net Change in Unrealized Appreciation (Depreciation) for the Year | ||||||||
| ||||||||||||
| Net realized gain (loss) from: | Net change in unrealized appreciation (depreciation) on:
| |||||||||||
Foreign exchange contracts | Forward exchange contracts | $ | 28,266,598 | Forward exchange contracts | $ | 39,902,692 | ||||||
| Futures contracts | 31,843,852 | Futures contracts | 6,968,472 | |||||||||
|
|
|
| |||||||||
Totals | $ | 60,110,450 | $ | 46,871,164 | ||||||||
|
|
|
| |||||||||
For the year ended December 31, 2018, the average month end notional amount of futures contracts represented $518,598,030. The average month end contract value of forward exchange contracts was $1,138,324,591.
See Note 1(c) regarding derivative financial instruments.
11. Holdings of 5% Voting Securities of Portfolio Companies
The 1940 Act defines “affiliated companies” to include investments in portfolio companies in which a fund owns 5% or more of the outstanding voting securities. During the year ended December 31, 2018, investments in “affiliated companies” were as follows:
| Name of Issuer | Number of Shares Held at Beginning of Year | Gross Additions | Gross Reductions | Number of Shares Held at End of Year | Value at End of Year | Dividend Income | Realized Gain (Loss) | Net Change in Unrealized Appreciation (Depreciation) | ||||||||||||||||||||||||
| ||||||||||||||||||||||||||||||||
Controlled Affiliatesa | ||||||||||||||||||||||||||||||||
CB FIM Coinvestors LLC | 43,105,703 | — | (43,105,703 | )b | — | $ | — | $ | — | $ | 27,760 | $ | — | |||||||||||||||||||
|
| |||||||||||||||||||||||||||||||
Non-Controlled Affiliates | ||||||||||||||||||||||||||||||||
Alexander’s Inc. | 326,675 | — | — | 326,675 | $ | 99,550,939 | $ | 5,880,150 | $ | 30,054 | c | $ | (29,763,360 | ) | ||||||||||||||||||
International Automotive Components Group Brazil LLC | 7,234,813 | — | — | 7,234,813 | 306,590 | — | — | 58,544 | ||||||||||||||||||||||||
International Automotive Components Group North America LLC | 63,079,866 | — | — | 63,079,866 | 7,519,120 | — | — | (34,036,318 | ) | |||||||||||||||||||||||
|
| |||||||||||||||||||||||||||||||
TotalNon-Controlled Affiliates |
| $ | 107,376,649 | $ | 5,880,150 | $ | 30,054 | $ | (63,741,134 | ) | ||||||||||||||||||||||
|
| |||||||||||||||||||||||||||||||
Total Affiliated Securities(Value is 0.9% of Net Assets) |
| $ | 107,376,649 | $ | 5,880,150 | $ | 57,814 | $ | (63,741,134 | ) | ||||||||||||||||||||||
|
| |||||||||||||||||||||||||||||||
aIssuer in which the Fund owns 25% or more of the outstanding voting securities.
bGross reduction was the result of a corporate action.
cRealized gain distribution from REITs.
12. Credit Facility
The Fund, together with other U.S. registered and foreign investment funds (collectively, Borrowers), managed by Franklin Templeton, are borrowers in a joint syndicated senior unsecured credit facility totaling $2 billion (Global Credit Facility) which matured on February 8, 2019. This Global Credit Facility provides a source of funds to the Borrowers for temporary and emergency purposes, including the ability to meet future unanticipated or unusually large redemption requests. Effective February 8, 2019, the Borrowers renewed the Global Credit Facility for a one year term, maturing February 7, 2020, for a total of $2 billion.
franklintempleton.com | Annual Report | 41 | ||||
FRANKLIN MUTUAL SHARES FUND
NOTES TO FINANCIAL STATEMENTS
12. Credit Facility(continued)
Under the terms of the Global Credit Facility, the Fund shall, in addition to interest charged on any borrowings made by the Fund and other costs incurred by the Fund, pay its share of fees and expenses incurred in connection with the implementation and maintenance of the Global Credit Facility, based upon its relative share of the aggregate net assets of all of the Borrowers, including an annual commitment fee of 0.15% based upon the unused portion of the Global Credit Facility. These fees are reflected in other expenses in the Statement of Operations. During the year ended December 31, 2018, the Fund did not use the Global Credit Facility.
13. Fair Value Measurements
The Fund follows a fair value hierarchy that distinguishes between market data obtained from independent sources (observable inputs) and the Fund’s own market assumptions (unobservable inputs). These inputs are used in determining the value of the Fund’s financial instruments and are summarized in the following fair value hierarchy:
| • | Level 1 – quoted prices in active markets for identical financial instruments |
| • | Level 2 – other significant observable inputs (including quoted prices for similar financial instruments, interest rates, prepayment speed, credit risk, etc.) |
| • | Level 3 – significant unobservable inputs (including the Fund’s own assumptions in determining the fair value of financial instruments) |
The input levels are not necessarily an indication of the risk or liquidity associated with financial instruments at that level.
A summary of inputs used as of December 31, 2018, in valuing the Fund’s assets and liabilities carried at fair value, is as follows:
| Level 1 | Level 2 | Level 3 | Total | |||||||||||||
| ||||||||||||||||
| Assets: | ||||||||||||||||
Investments in Securities:a | ||||||||||||||||
Equity Investments:b | ||||||||||||||||
Auto Components | $ | 48,622,212 | $ | — | $ | 7,825,710 | $ | 56,447,922 | ||||||||
Machinery | — | 87,175,766 | — | 87,175,766 | ||||||||||||
Media | 604,371,865 | 3,772,687 | — | 608,144,552 | ||||||||||||
Metals & Mining | 19,181,964 | 26,754,222 | — | 45,936,186 | ||||||||||||
Software | 288,295,710 | 567,319 | — | 288,863,029 | ||||||||||||
All Other Equity Investments | 9,575,766,734 | — | — | c | 9,575,766,734 | |||||||||||
Corporate Notes and Senior Floating Rate Interests | — | 374,536,611 | — | 374,536,611 | ||||||||||||
Corporate Notes and Senior Floating Rate Interests in Reorganization | — | 171,679,898 | — | c | 171,679,898 | |||||||||||
Companies in Liquidation | — | 174,760 | — | c | 174,760 | |||||||||||
Short Term Investments | 1,313,980,877 | 23,600,000 | — | 1,337,580,877 | ||||||||||||
|
| |||||||||||||||
Total Investments in Securities | $ | 11,850,219,362 | $ | 688,261,263 | $ | 7,825,710 | $ | 12,546,306,335 | ||||||||
|
| |||||||||||||||
Other Financial Instruments: | ||||||||||||||||
Futures Contracts | $ | 465,013 | $ | — | $ | — | $ | 465,013 | ||||||||
Forward Exchange Contracts | — | 8,387,842 | — | 8,387,842 | ||||||||||||
|
| |||||||||||||||
Total Other Financial Instruments | $ | 465,013 | $ | 8,387,842 | $ | — | $ | 8,852,855 | ||||||||
|
| |||||||||||||||
| 42 |
Annual Report | franklintempleton.com | ||
FRANKLIN MUTUAL SHARES FUND
NOTES TO FINANCIAL STATEMENTS
| Level 1 | Level 2 | Level 3 | Total | |||||||||||||
| ||||||||||||||||
Liabilities: | ||||||||||||||||
Other Financial Instruments: | ||||||||||||||||
Securities Sold Shorta | $ | 148,540,745 | $ | — | $ | — | $ | 148,540,745 | ||||||||
Forward Exchange Contracts | — | 624,551 | — | 624,551 | ||||||||||||
|
| |||||||||||||||
Total Other Financial Instruments | $ | 148,540,745 | $ | 624,551 | $ | — | $ | 149,165,296 | ||||||||
|
| |||||||||||||||
aFor detailed categories, see the accompanying Statement of Investments.
bIncludes common stocks and management investment companies as well as other equity interests.
cIncludes securities determined to have no value at December 31, 2018.
A reconciliation of assets in which Level 3 inputs are used in determining fair value is presented when there are significant Level 3 financial instruments at the beginning and/or end of the year.
14. New Accounting Pronouncements
In August 2018, the Financial Accounting Standards Board issued Accounting Standards Update (ASU)No. 2018-14, Compensation—Retirement Benefits—Defined Benefit Plans—General (Subtopic715-20): Disclosure Framework—Changes to the Disclosure Requirements for Defined Benefit Plans. The amendments in the ASU modify the disclosure requirements for employers that sponsor defined benefit pension or other postretirement plans. The ASU is effective for annual reporting periods ending after December 15, 2020. Management is currently evaluating the impact, if any, of applying this provision.
15. Subsequent Events
The Fund has evaluated subsequent events through the issuance of the financial statements and determined that no events have occurred that require disclosure other than those already disclosed in the financial statements.
Abbreviations
Counterparty | Currency | Selected Portfolio | ||||||||||
| BOFA | Bank of America Corp. | EUR | Euro | ADR | American Depositary Receipt | |||||||
| BONY | The Bank of New York Mellon Corp. | GBP | British Pound | FHLB | Federal Home Loan Bank | |||||||
| HSBK | HSBC Bank PLC | USD | United States Dollar | LIBOR | London InterBank Offered Rate | |||||||
| SSBT | State Street Bank and Trust Co., N.A. | |||||||||||
| UBSW | UBS AG | |||||||||||
franklintempleton.com | Annual Report | 43 | ||||
FRANKLIN MUTUAL SHARES FUND
Report of Independent Registered Public Accounting Firm
To the Board of Trustees of Franklin Mutual Series Funds and Shareholders of Franklin Mutual Shares Fund:
Opinion on the Financial Statements
We have audited the accompanying statement of assets and liabilities of Franklin Mutual Shares Fund (the “Fund”) (one of the funds constituting Franklin Mutual Series Funds), including the schedule of investments, as of December 31, 2018, and the related statement of operations for the year then ended, the statements of changes in net assets for each of the two years in the period then ended, the financial highlights for each of the five years in the period then ended and the related notes (collectively referred to as the “financial statements”). In our opinion, the financial statements present fairly, in all material respects, the financial position of Franklin Mutual Shares Fund (one of the funds constituting Franklin Mutual Series Funds) at December 31, 2018, the results of its operations for the year then ended, the changes in its net assets for each of the two years in the period then ended and its financial highlights for each of the five years in the period then ended, in conformity with U.S. generally accepted accounting principles.
Basis for Opinion
These financial statements are the responsibility of the Fund’s management. Our responsibility is to express an opinion on the Fund’s financial statements based on our audits. We are a public accounting firm registered with the Public Company Accounting Oversight Board (United States) (“PCAOB”) and are required to be independent with respect to the Fund in accordance with the U.S. federal securities laws and the applicable rules and regulations of the Securities and Exchange Commission and the PCAOB.
We conducted our audits in accordance with the standards of the PCAOB. Those standards require that we plan and perform the audit to obtain reasonable assurance about whether the financial statements are free of material misstatement, whether due to error or fraud. The Fund is not required to have, nor were we engaged to perform, an audit of the Fund’s internal control over financial reporting. As part of our audits, we are required to obtain an understanding of internal control over financial reporting, but not for the purpose of expressing an opinion on the effectiveness of the Fund’s internal control over financial reporting. Accordingly, we express no such opinion.
Our audits included performing procedures to assess the risks of material misstatement of the financial statements, whether due to error or fraud, and performing procedures that respond to those risks. Such procedures included examining, on a test basis, evidence regarding the amounts and disclosures in the financial statements. Our procedures included confirmation of securities owned as of December 31, 2018, by correspondence with the custodian or by other appropriate auditing procedures where replies from others were not received. Our audits also included evaluating the accounting principles used and significant estimates made by management, as well as evaluating the overall presentation of the financial statements. We believe that our audits provide a reasonable basis for our opinion.

We have served as the auditor of one or more Franklin investment companies since 1987.
Boston, Massachusetts
February 20, 2019
| 44 |
Annual Report | franklintempleton.com | ||
FRANKLIN MUTUAL SHARES FUND
Under Section 852(b)(3)(C) of the Internal Revenue Code, the Fund hereby reports the maximum amount allowable but no less than $682,605,704 as a long term capital gain dividend for the fiscal year ended December 31, 2018.
Under Section 871(k)(2)(C) of the Internal Revenue Code, the Fund hereby reports the maximum amount allowable but no less than $28,582,586 as a short term capital gain dividend for purposes of the tax imposed under Section 871(a)(1)(A) of the Internal Revenue Code for the fiscal year ended December 31, 2018.
Under Section 854(b)(1)(A) of the Internal Revenue Code, the Fund hereby reports 70.18% of the ordinary income dividends as income qualifying for the dividends received deduction for the fiscal year ended December 31, 2018.
Under Section 854(b)(1)(B) of the Internal Revenue Code, the Fund hereby reports the maximum amount allowable but no less than $287,866,117 as qualified dividends for purposes of the maximum rate under Section 1(h)(11) of the Internal Revenue Code for the fiscal year ended December 31, 2018. Distributions, including qualified dividend income, paid during calendar year 2018 will be reported to shareholders on Form1099-DIV bymid-February 2019. Shareholders are advised to check with their tax advisors for information on the treatment of these amounts on their individual income tax returns.
franklintempleton.com | Annual Report | 45 | ||||
FRANKLIN MUTUAL SERIES FUNDS
The name, year of birth and address of the officers and board members, as well as their affiliations, positions held with the Trust, principal occupations during at least the past five years and number of U.S. registered portfolios overseen in the Franklin Templeton Investments fund complex, are shown below. Generally, each board member serves until that person’s successor is elected and qualified.
Independent Board Members
Name,Year of Birth
| Position | Length of Time Served | Number of Portfolios in Fund Complex Overseen by Board Member* | Other Directorships Held During at Least the Past 5 Years | ||||
Edward I. Altman, Ph.D. (1941) c/o Franklin Mutual Advisers, LLC | Trustee | Since 1987 | 14 | None | ||||
| Principal Occupation During at Least the Past 5 Years: | ||||||||
Max L. Heine Professor of Finance, Emeritus and Director of The Credit and Debt Markets Research Program, Salomon Center, Stern School of Business, New York University; editor and author of numerous financial publications; financial consultant; an adviser to numerous financial and publishing organizations; andformerly, Vice Director, Salomon Center, Stern School of Business, New York University.
| ||||||||
Ann Torre Bates (1958) c/o Franklin Mutual Advisers, LLC | Trustee | Since 1995 | 38 | Ares Capital Corporation (specialty finance company) (2010-present), United Natural Foods, Inc. (distributor of natural, organic and specialty foods) (2013-present), Allied Capital Corporation (financial services) (2003-2010), SLM Corporation (Sallie Mae) (1997-2014) and Navient Corporation (loan management, servicing and asset recovery) (2014-2016). | ||||
| Principal Occupation During at Least the Past 5 Years: | ||||||||
Director of various companies; andformerly, Executive Vice President and Chief Financial Officer, NHP Incorporated (manager of multifamily housing) (1995-1997); and Vice President and Treasurer, US Airways, Inc. (until 1995).
| ||||||||
Burton J. Greenwald (1929) c/o Franklin Mutual Advisers, LLC | Trustee and Vice Chairman | Trustee since 2002 and Vice Chairman since 2015 | 14 | Franklin Templeton Emerging Markets Debt Opportunities Fund PLC (1999-present) and Fiduciary International Ireland Limited (1999-2015). | ||||
| Principal Occupation During at Least the Past 5 Years: | ||||||||
Managing Director, B.J. Greenwald Associates (management consultants to the financial services industry); andformerly, Chairman, Fiduciary Trust International Funds; Executive Vice President, L.F. Rothschild Fund Management, Inc.; President and Director, Merit Mutual Funds; President, Underwriting Division and Director, National Securities & Research Corporation; Governor, Investment Company Institute; and Chairman, ICI Public Information Committee.
| ||||||||
Jan Hopkins Trachtman c/o Franklin Mutual Advisers, LLC | Trustee | Since 2009 | 14 | FinTech Acquisition Corp. III (special purpose fintech acquisition company) (2018-present) | ||||
| Principal Occupation During at Least the Past 5 Years: | ||||||||
President and Founder, The Jan Hopkins Group (communications consulting firm); serves on Advisory Board of Knight Bagehot Fellowship; andformerly, President, Economic Club of New York (2007-2015); Anchor/Correspondent, CNN Financial News (until 2003); Managing Director and Head of Client Communications, Citigroup Private Bank (until 2005);Off-Air reporter, ABC News’ World News Tonight; and Editor, CBS Network News.
| ||||||||
Keith Mitchell (1954) c/o Franklin Mutual Advisers, LLC | Trustee | Since 2009 | 14 | None | ||||
| Principal Occupation During at Least the Past 5 Years: |
| Director of various boards of asset management firms; andformerly, Managing Member, Mitchell, Hartley & Bechtel Advisers, LLC (formerly, Mitchell Advisers, LLC) (advisory firm) (2003-2015) and Managing Director, Putman Lovell NBF. |
| 46 |
Annual Report | franklintempleton.com | ||
FRANKLIN MUTUAL SERIES FUNDS
Independent Board Members (continued)
Name,Year of Birth
| Position
| Length of
| Number of Portfolios in
| Other Directorships Held During
| ||||
David W. Niemiec (1949) c/o Franklin Mutual Advisers, LLC | Trustee | Since 2015 | 38 | Hess Midstream Partners LP (oil and gas midstream infrastructure) (2017-present). | ||||
| Principal Occupation During at Least the Past 5 Years: |
Advisor, Saratoga Partners (private equity fund); andformerly, Managing Director, Saratoga Partners (1998-2001) and SBC Warburg Dillon Read (investment banking) (1997-1998); Vice Chairman, Dillon, Read & Co. Inc. (investment banking) (1991-1997); and Chief Financial Officer, Dillon, Read & Co. Inc. (1982-1997).
|
Charles Rubens II (1930) c/o Franklin Mutual Advisers, LLC | Trustee | Since 1998 | 14 | None | ||||
| Principal Occupation During at Least the Past 5 Years: |
Private investor and president ofnon-profit organizations; andformerly, an executive of Time, Inc.; and Trustee of Colorado College.
|
Robert E. Wade (1946) c/o Franklin Mutual Advisers, LLC | Trustee and Chairman of the Board | Trustee since 1993 and Chairman of the Board since 2005 | 38 | El Oro Ltd (investments) (2003-present). | ||||
| Principal Occupation During at Least the Past 5 Years: |
Attorney at law engaged in private practice as a sole practitioner (1972-2008) and member of various boards.
|
Gregory H. Williams (1943) c/o Franklin Mutual Advisers, LLC | Trustee | Since 2015 | 14 | None | ||||
| Principal Occupation During at Least the Past 5 Years: |
Private investor; Consultant; andformerly, President, University of Cincinnati (2009-2012); President, The City College of New York (2001-2009); Dean, College of Law, Ohio State University (1993-2001); and Associate Vice President, Academic Affairs and Professor of Law, University of Iowa (1977-1993).
|
Interested Board Members and Officers
| ||||||||
Name,Year of Birth
| Position
| Length of Time
| Number of Portfolios in
| Other Directorships Held During
| ||||
**Gregory E. Johnson (1961) One Franklin Parkway | Trustee | Since 2007 | 150 | None | ||||
| Principal Occupation During at Least the Past 5 Years: |
Chairman of the Board, Member – Office of the Chairman, Director and Chief Executive Officer, Franklin Resources, Inc.; officer and/or director or trustee, as the case may be, of some of the other subsidiaries of Franklin Resources, Inc. and of 42 of the investment companies in Franklin Templeton Investments; Vice Chairman, Investment Company Institute; andformerly, President, Franklin Resources, Inc. (1994-2015).
|
**Peter A. Langerman (1955) c/o Franklin Mutual Advisers, LLC | Trustee, President, and Chief Executive Officer – Investment Management | Trustee since 2007, President, and Chief Executive Officer – Investment Management since 2005 | 7 | American International Group, Inc. (AIG) Credit Facility Trust (2010-2011). | ||||
Principal Occupation During at Least the Past 5 Years: |
Chairman of the Board, Chief Executive Officer and President, Franklin Mutual Advisers, LLC; President and Chief Investment Officer, Franklin Advisory Services, LLC; and officer and/or director, as the case may be, of three of the investment companies in Franklin Templeton Investments.
|
| franklintempleton.com |
Annual Report | 47 | ||||
FRANKLIN MUTUAL SERIES FUNDS
Interested Board Members and Officers(continued)
Name, Year of Birth
| Position
| Length of
| Number of Portfolios in
| Other Directorships Held During
| ||||
| Alison E. Baur (1964) One Franklin Parkway San Mateo, CA 94403-1906 | Vice President | Since 2012 | Not Applicable | Not Applicable | ||||
| Principal Occupation During at Least the Past 5 Years: | ||||||||
Deputy General Counsel, Franklin Templeton Investments; and officer of some of the other subsidiaries of Franklin Resources, Inc. and of 44 of the investment companies in Franklin Templeton Investments.
| ||||||||
| Aliya S. Gordon (1973) One Franklin Parkway San Mateo, CA 94403-1906 | Vice President | Since 2009 | Not Applicable | Not Applicable | ||||
| Principal Occupation During at Least the Past 5 Years: | ||||||||
Senior Associate General Counsel, Franklin Templeton Investments; and officer of 44 of the investment companies in Franklin Templeton Investments.
| ||||||||
| Steven J. Gray (1955) One Franklin Parkway San Mateo, CA 94403-1906 | Vice President and Secretary | Vice President since 2009 and Secretary since 2005 | Not Applicable | Not Applicable | ||||
| Principal Occupation During at Least the Past 5 Years: | ||||||||
Senior Associate General Counsel, Franklin Templeton Investments; Vice President, Franklin Templeton Distributors, Inc. and FASA, LLC; and officer of 44 of the investment companies in Franklin Templeton Investments.
| ||||||||
| Matthew T. Hinkle (1971) One Franklin Parkway San Mateo, CA 94403-1906 | Chief Executive Officer – Finance and Administration | Since 2017 | Not Applicable | Not Applicable | ||||
| Principal Occupation During at Least the Past 5 Years: | ||||||||
Senior Vice President, Franklin Templeton Services, LLC; officer of 44 of the investment companies in Franklin Templeton Investments; andformerly, Vice President, Global Tax (2012-April 2017) and Treasurer/Assistant Treasurer, Franklin Templeton Investments (2009-2017).
| ||||||||
| Robert G. Kubilis (1973) 300 S.E. 2nd Street Fort Lauderdale, FL 33301-1923 | Chief Financial Officer, Chief Accounting Officer and Treasurer | Since 2012 | Not Applicable | Not Applicable | ||||
| Principal Occupation During at Least the Past 5 Years: | ||||||||
Treasurer, U.S. Fund Administration & Reporting, Franklin Templeton Investments; and officer of 16 of the investment companies in Franklin Templeton Investments.
| ||||||||
| Robert Lim (1948) One Franklin Parkway San Mateo, CA 94403-1906 | Vice President – AML Compliance | Since 2016 | Not Applicable | Not Applicable | ||||
| Principal Occupation During at Least the Past 5 Years: | ||||||||
Vice President, Franklin Templeton Companies, LLC; Chief Compliance Officer, Franklin Templeton Distributors, Inc. and Franklin Templeton Investor Services, LLC; and officer of 44 of the investment companies in Franklin Templeton Investments.
| ||||||||
| Kimberly H. Novotny (1972) 300 S.E. 2nd Street Fort Lauderdale, FL 33301-1923 | Vice President | Since 2013 | Not Applicable | Not Applicable | ||||
| Principal Occupation During at Least the Past 5 Years: | ||||||||
Associate General Counsel, Franklin Templeton Investments; Vice President and Corporate Secretary, Fiduciary Trust International of the South; Vice President, Templeton Investment Counsel, LLC; Assistant Secretary, Franklin Resources, Inc.; and officer of 44 of the investment companies in Franklin Templeton Investments.
| ||||||||
| 48 |
Annual Report | franklintempleton.com | ||
FRANKLIN MUTUAL SERIES FUNDS
Interested Board Members and Officers(continued)
| ||||||||
Name, Year of Birth
| Position
| Length of Time
| Number of Portfolios in
| Other Directorships Held During at
| ||||
Robert C. Rosselot (1960) 300 S.E. 2nd Street Fort Lauderdale, FL 33301-1923
| Chief Compliance Officer | Since 2013 | Not Applicable | Not Applicable | ||||
| Principal Occupation During at Least the Past 5 Years: |
Director, Global Compliance, Franklin Templeton Investments; Vice President, Franklin Templeton Companies, LLC; officer of 44 of the investment companies in Franklin Templeton Investments; andformerly, Senior Associate General Counsel, Franklin Templeton Investments (2007-2013); and Secretary and Vice President, Templeton Group of Funds (2004-2013).
|
Navid J. Tofigh (1972) One Franklin Parkway San Mateo, CA 94403-1906
| Vice President | Since 2015 | Not Applicable | Not Applicable | ||||
| Principal Occupation During at Least the Past 5 Years: |
Associate General Counsel, Franklin Templeton Investments; and officer of 44 of the investment companies in Franklin Templeton Investments. |
Craig S. Tyle (1960) One Franklin Parkway San Mateo, CA 94403-1906 | Vice President | Since 2005 | Not Applicable | Not Applicable | ||||
| Principal Occupation During at Least the Past 5 Years: |
General Counsel and Executive Vice President, Franklin Resources, Inc.; and officer of some of the other subsidiaries of Franklin Resources, Inc. and of 44 of the investment companies in Franklin Templeton Investments.
|
Lori A. Weber (1964) 300 S.E. 2nd Street Fort Lauderdale, FL 33301-1923 | Vice President | Since 2011 | Not Applicable | Not Applicable | ||||
| Principal Occupation During at Least the Past 5 Years: |
Senior Associate General Counsel, Franklin Templeton Investments; Assistant Secretary, Franklin Resources, Inc.; Vice President and Secretary, Templeton Investment Counsel, LLC; and officer of 44 of the investment companies in Franklin Templeton Investments.
|
| franklintempleton.com |
Annual Report | 49 | ||||
FRANKLIN MUTUAL SERIES FUNDS
*We base the number of portfolios on each separate series of the U.S. registered investment companies within the Franklin Templeton Investments fund complex. These portfolios have a common investment manager or affiliated investment managers.
**Gregory E. Johnson is considered to be an interested person of the Fund under the federal securities laws due to his position as an officer and director of Franklin Resources, Inc. (Resources), which is the parent company of the Fund’s investment manager and distributor. Peter A. Langerman is considered to be an interested person of the Fund under the federal securities laws due to his position as an officer of Franklin Mutual Advisers, LLC, which is the Fund’s investment manager.
Note 1: Officer information is current as of the date of this report. It is possible that after this date, information about officers may change.
The Sarbanes-Oxley Act of 2002 and Rules adopted by the U.S. Securities and Exchange Commission require the Fund to disclose whether the Fund’s Audit Committee includes at least one member who is an audit committee financial expert within the meaning of such Act and Rules. The Fund’s Board has determined that there is at least one such financial expert on the Audit Committee and has designated each of Edward I. Altman, Ph.D., Ann Torre Bates and David W. Niemiec as an audit committee financial expert. The Board believes that Messrs. Altman and Niemiec and Ms. Bates qualify as such an expert in view of their extensive business background and experience. Mr. Altman has served as a member of the Fund Audit Committee since 1987. He currently serves as a Max L. Hine Professor of Finance, Emeritus and Director of The Credit and Debt Markets Research Program, Salomon Center, Stern School of Business, New York University. Ms. Bates has served as a member of the Fund Audit Committee since 1995. She currently serves as a director of Ares Capital Corporation (2010-present) and United Natural Foods, Inc. (2013-present) and was formerly a director of Navient Corporation from 2014 to 2016, SLM Corporation from 1997 to 2014 and Allied Capital Corporation from 2003 to 2010, Executive Vice President and Chief Financial Officer of NHP Incorporated from 1995 to 1997 and Vice President and Treasurer of US Airways, Inc. until 1995. Mr. Niemiec has served as a member of the Fund Audit Committee since 2015, currently serves as an Advisor to Saratoga Partners and was formerly its Managing Director from 1998 to 2001 and serves as a director of Hess Midstream Partners LP (2017-present). Mr. Niemiec was formerly a director of Emeritus Corporation from 1999 to 2010 and OSI Pharmaceuticals, Inc. from 2006 to 2010, Managing Director of SBC Warburg Dillon Read from 1997 to 1998, and was Vice Chairman from 1991 to 1997 and Chief Financial Officer from 1982 to 1997 of Dillon, Read & Co. Inc. As a result of such background and experience, the Board believes that Messrs. Altman and Niemiec and Ms. Bates have each acquired an understanding of generally accepted accounting principles and financial statements, the general application of such principles in connection with the accounting estimates, accruals and reserves, and analyzing and evaluating financial statements that present a breadth and level of complexity of accounting issues generally comparable to those of the Fund, as well as an understanding of internal controls and procedures for financial reporting and an understanding of audit committee functions. Messrs. Altman and Niemiec and Ms. Bates are independent Board members as that term is defined under the applicable U.S. Securities and Exchange Commission Rules and Releases.
The Statement of Additional Information (SAI) includes additional information about the board members and is available, without charge, upon request. Shareholders may call (800) DIALBEN/342-5236 to request the SAI.
| 50 |
Annual Report | franklintempleton.com | ||
FRANKLIN MUTUAL SERIES FUNDS
FRANKLIN MUTUAL SHARES FUND
Proxy Voting Policies and Procedures
The Fund’s investment manager has established Proxy Voting Policies and Procedures (Policies) that the Fund uses to determine how to vote proxies relating to portfolio securities. Shareholders may view the Fund’s complete Policies online at franklintempleton.com. Alternatively, shareholders may request copies of the Policies free of charge by calling the Proxy Group collect at (954)527-7678 or by sending a written request to: Franklin Templeton Companies, LLC, 300 S.E. 2nd Street, Fort Lauderdale, FL 33301, Attention: Proxy Group. Copies of the Fund’s proxy voting records are also made available online at franklintempleton.com and posted on the U.S. Securities and Exchange Commission’s website at sec.gov and reflect the most recent12-month period ended June 30.
Quarterly Statement of Investments
The Trust, on behalf of the Fund, files a complete statement of investments with the U.S. Securities and Exchange Commission for the first and third quarters for each fiscal year on FormN-Q. Shareholders may view the filed FormN-Q by visiting the Commission’s website at sec.gov. The filed form may also be viewed and copied at the Commission’s Public Reference Room in Washington, DC. Information regarding the operations of the Public Reference Room may be obtained by calling(800) SEC-0330.
Householding of Reports and Prospectuses
You will receive the Fund’s financial reports every six months as well as an annual updated summary prospectus (prospectus available upon request). To reduce Fund expenses, we try to identify related shareholders in a household and send only one copy of the financial reports and summary prospectus. This process, called “householding,” will continue indefinitely unless you instruct us otherwise. If you prefer not to have these documents householded, please call us at (800)632-2301. At any time you may view current prospectuses/summary prospectuses and financial reports on our website. If you choose, you may receive these documents through electronic delivery.
| franklintempleton.com |
Annual Report | 51 | ||||
This page intentionally left blank.
| Annual Report and Shareholder Letter Franklin Mutual Shares Fund
Investment Manager Franklin Mutual Advisers, LLC
Distributor Franklin Templeton Distributors, Inc. (800) DIAL BEN® /342-5236 franklintempleton.com
Shareholder Services (800)632-2301 - (Class A, C, R & R6) (800)448-FUND - (Class Z) | |||||||
Authorized for distribution only when accompanied or preceded by a summary prospectus and/or prospectus. Investors should carefully consider a fund’s investment goals, risks, charges and expenses before investing. A prospectus contains this and other information; please read it carefully before investing.
To help ensure we provide you with quality service, all calls to and from our service areas are monitored and/or recorded. | ||||||||
| © 2019 Franklin Templeton Investments. All rights reserved. | 474 A 02/19 | |||||||

 | Annual Report and Shareholder Letter
December 31, 2018 |

Internet Delivery of Fund Reports Unless You Request Paper Copies: Effective January 1, 2021, as permitted by the SEC, paper copies of the Fund’s shareholder reports will no longer be sent by mail, unless you specifically request them from the Fund or your financial intermediary. Instead, the reports will be made available on a website, and you will be notified by mail each time a report is posted and provided with a website link to access the report.
If you already elected to receive shareholder reports electronically, you will not be affected by this change and you need not take any action. If you have not signed up for electronic delivery, we would encourage you to join fellow shareholders who have. You may elect to receive shareholder reports and other communications electronically from the Fund by calling (800)632-2301 or by contacting your financial intermediary.
You may elect to continue to receive paper copies of all your future shareholder reports free of charge by contacting your financial intermediary or, if you invest directly with a Fund, calling (800)632-2301 to let the Fund know of your request. Your election to receive reports in paper will apply to all funds held in your account.
Franklin Templeton
Successful investing begins with ambition. And achievement only comes when you reach for it. That’s why we continually strive to deliver better outcomes for investors. No matter what your goals are, our deep, global investment expertise allows us to offer solutions that can help.
During our more than 70 years of experience, we’ve managed through all kinds of markets—up, down and those in between. We’re always preparing for what may come next. It’s because of this, combined with our strength as one of the world’s largest asset managers that we’ve earned the trust of millions of investors around the world.
Dear Franklin Mutual Financial Services Fund Shareholder:
Investors started 2018 seemingly with the wind at their back. The primary tailwinds were strong corporate earnings growth in most developed markets, healthy consumer and business investment spending, and the positive effect of major U.S. tax cuts. In addition, the global economy continued its steady expansion since the financial crisis of 2008–2009. Unemployment continued to decline in the U.S. and other developed markets, while U.S. wage growth showed some signs of accelerating. As a result, equity markets reached new highs in August and September. However, volatility and market downturns soon made their mark on 2018. As measured by the Chicago Board Options Exchange Volatility Index (VIX), 2017 was the least volatile year on record for the Standard & Poor’s 500® Index (S&P 500®), but the VIX surged in February 2018 and jumped again in October and December 2018. Heightened trade tensions between the U.S. and China, geopolitical events in Europe and a growing belief that corporate earnings and economic growth will likely decelerate in 2019 hindered equity markets. A flattening U.S. Treasury yield curve, wider credit spreads and growing market concern that the U.S. Federal Reserve may raise interest rates too aggressively were also important drivers of market turbulence. For the period ended December 31, 2018, U.S. stocks, as measured by the S&P 500, had a-4.38% total return.1 Stocks in global developed markets, as measured by the MSCI World Index (USD), had a-8.20% total return.1
While equity markets were broadly down for the year, there were pockets of positive performance concentrated in areas of growth and innovation, such as software, information
1. Source: Morningstar.
See www.franklintempletondatasources.com for additional data provider information.
technology services and segments of the health care sector. It is no surprise, therefore, that growth stocks managed to perform better than value stocks during the period. The MSCI World Growth Index (USD) had a-6.42% total return, while the MSCI World Value Index (USD) had a-10.09% total return.1
The return of volatility is an appropriate reminder that securities markets are dynamic. We believe active, professional investment management serves investors well since market volatility is more the norm than uninterrupted positive returns. Valuation is an essential factor in our analysis and we always ask ourselves if current and potential investments represent an attractive balance of risk and reward. We remain committed to abottom-up stock-picking process that is disciplined and driven by rigorous fundamental analysis that attempts to limit downside risk. In our view, investing in underappreciated and misunderstood companies with identifiable catalysts for unlocking shareholder value can offer significant upside potential as well as a degree of downside protection.
We also recognize the important role of financial advisors in today’s markets and encourage investors to continue to seek their advice. Amid changing markets and economic conditions, we are confident investors with a well-diversified portfolio and a patient, long-term outlook will be well positioned for the years ahead.
On the following pages, the Fund’s portfolio management team reviews investment decisions that pertain to performance during the past 12 months in light of the economic environment
| Not FDIC Insured | | | May Lose Value | | | No Bank Guarantee |
franklintempleton.com |
Not part of the annual report |
1 |
and other factors. Please remember all securities markets fluctuate, as do mutual fund share prices.
We thank you for investing with Franklin Templeton, welcome your questions and comments, and look forward to continuing to serve your investment needs in the years ahead.
Sincerely,

Peter A. Langerman
Chairman, President and Chief Executive Officer
Franklin Mutual Advisers, LLC
This letter reflects our analysis and opinions as of December 31, 2018, unless otherwise indicated. The information is not a complete analysis of every aspect of any market, country, industry, security or fund. Statements of fact are from sources considered reliable.
Visitfranklintempleton.comfor fund updates, to access your account, or to find helpful financial planning tools.
2 |
Not part of the annual report |
franklintempleton.com |
Franklin Mutual Financial Services Fund
This annual report for Franklin Mutual Financial Services Fund covers the fiscal year ended December 31, 2018.
Your Fund’s Goal and Main Investments
The Fund seeks capital appreciation, which may occasionally be short term, with income as a secondary goal. Under normal market conditions, the Fund invests at least 80% of its net assets in securities of financial services companies that the investment manager believes are available at market prices less than their intrinsic value. The equity securities in which the Fund invests are primarily common stock with a current focus onmid- and large cap companies. To a lesser extent, the Fund also invests in merger arbitrage securities and the debt and equity of distressed companies. The Fund may invest in foreign securities without limit. The Geographic Composition bar chart on this page lists the leading countries where the Fund invests.
Performance Overview
The Fund’s Class Z shares had a cumulative total return of-16.49% for the 12 months ended December 31, 2018. For comparison, the Fund’s primary benchmark, the MSCI World Financials Index (USD), which captures large and midcap representation across 23 developed markets countries, had a-16.46% total return, while its secondary benchmark, the Standard & Poor’s 500 (S&P 500®) Financials Index, which tracks financials stocks in the S&P 500 Index, had a-13.03% total return.1 You can find more of the Fund’s performance data in the Performance Summary beginning on page 9.
Performance data represent past performance, which does not guarantee future results. Investment return and principal value will fluctuate, and you may have a gain or loss when you sell your shares. Current performance may differ from figures shown. For most recentmonth-end performance, go tofranklintempleton.comor call(800)342-5236.
Economic and Market Overview
The global economy expanded during the 12 months under review, despite weakness in certain regions. Global developed and emerging market stocks were aided at certain points during
Geographic Composition*
Based on Total Net Assets as of 12/31/18
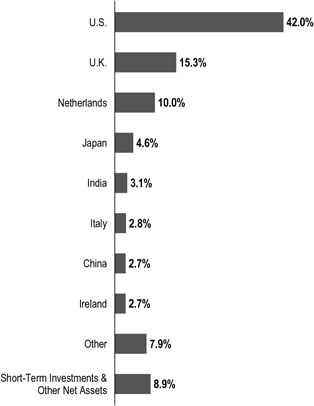
*Figures are stated as a percentage of total and may not equal 100% or may be negative due to rounding, use of any derivatives, unsettled trades or other factors.
the period by higher crude oil prices, upbeat economic data, easing trade tensions and encouraging corporate earnings reports, as well as indications of a slower pace of interest-rate increases from the U.S. Federal Reserve (Fed).
However, various factors weighed on global markets during the period, including concerns about tighter regulation of technology companies, political uncertainties in the U.S. and the European Union, and major central banks’ interest-rate path and unwinding of monetary stimulus measures. Markets were further pressured by U.S. trade disputes with its allies and China, and their impact on global growth and corporate earnings. In this environment, global stocks, as measured by
1. Source: Morningstar.
The indexes are unmanaged and include reinvestment of any income or distributions. They do not reflect any fees, expenses or sales charges. One cannot invest directly in an index, and an index is not representative of the Fund’s portfolio.
The dollar value, number of shares or principal amount, and names of all portfolio holdings are listed in the Fund’s Statement of Investments (SOI). The SOI begins on page 17.
franklintempleton.com |
Annual Report |
3 |
FRANKLIN MUTUAL FINANCIAL SERVICES FUND
the MSCI All Country World Index, had a-8.93% total return for the 12 months ended December 31, 2018.1
The U.S. economy grew during the12-month period. After moderating for three consecutive quarters, the economy grew faster in 2018’s second quarter, driven by consumer spending, business investment, exports and government spending. However, growth moderated in the third quarter due to declines in exports and housing investment. The unemployment rate declined from 4.1% in December 2017 to 3.9% atperiod-end.2 Annual inflation, as measured by the Consumer Price Index, decreased from 2.1% in December 2017 to 1.9% atperiod-end.2 The Fed raised its target range for the federal funds rate four times during the period, to 2.25%–2.50%, and continued reducing its balance sheet as part of an ongoing plan to normalize monetary policy. At its December meeting, the Fed reduced the projected 2019 rate increases to two, compared to three projected previously.
In Europe, the U.K.’s quarterly economic growth moderated in 2018’s first quarter, but accelerated in 2018’s second and third quarters. The Bank of England raised its key policy rate once during the review period. After moderating in 2018’s first quarter, the eurozone’s quarterly growth remained stable in the second quarter, but eased in the third quarter. The bloc’s annual inflation rate ended the period higher than in December 2017. The European Central Bank (ECB) kept its benchmark interest rate unchanged during the period. In December 2018, the ECB confirmed its plan to conclude its bond purchase program at the end of 2018 and reiterated it expects key interest rates to remain unchanged through the summer of 2019.
In Asia, Japan’s quarterly gross domestic product (GDP) grew in 2018’s second quarter, following a contraction in the first quarter, but contracted again in the third quarter. The Bank of Japan left its benchmark interest rate unchanged during the period and continued its monetary stimulus measures.
In emerging markets, Brazil’s quarterly GDP growth remained stable in 2018’s first and second quarters, but accelerated in the third quarter. The Central Bank of Brazil lowered its benchmark interest rate twice during the period. Russia’s annual GDP growth rate accelerated in 2018’s first and second quarters, but moderated in the third quarter. After lowering its key rate twice early in the period, the Bank of Russia raised it twice in the period’s second half to curtail inflation risks. China’s annual GDP grew at a stable rate in 2018’s first quarter, but it moderated in the second and third quarters. The
People’s Bank of China left its benchmark interest rate unchanged during the period, but it took measures to improve financial liquidity to mitigate the negative effects of the U.S.-China trade dispute and support economic growth. Overall, emerging market stocks, as measured by the MSCI Emerging Markets Index, had a-14.25% total return during the period.1
Investment Strategy
We strive to provide investors with superior risk-adjusted returns over time through our distinctive, value investment style, which includes investments in undervalued common stocks, and to a significantly lesser extent, distressed debt and merger arbitrage. Rigorous fundamental analysis drives our investment process. We attempt to determine each investment’s intrinsic value as well as the price at which we would be willing to commit shareholder funds. While valuation remains our key consideration, we utilize numerous fundamental factors such as return on equity, financial leverage and long-term earnings power. We also consider factors such as management quality and competitive position. As always, our approach to investing is as much about assessing risk and containing losses as it is about achieving profits. In addition, it is our practice to hedge the Fund’s currency exposure when we deem it advantageous for our shareholders.
What is return on equity?
Return on equity is a measure of profitability, expressed as a percentage, calculated by dividing a company’s net income by total shareholder equity for a given period. Return on equity tells common shareholders how effectually their money is being employed. Comparing percentages for current and prior periods also reveals trends, and comparison with industry composites reveals how well a company is holding its own against its competitors.
What is meant by “hedge”?
To hedge an investment is to take a position intended to offset potential losses/gains that may be incurred by a companion financial instrument.
Manager’s Discussion
In 2018, corporate profits in the U.S. and other developed markets continued their impressive year-over-year growth. In addition, labor markets showed further improvement, consumer spending was solid, and U.S. corporate tax reforms encouraged
2. Source: U.S. Bureau of Labor Statistics.
4 |
Annual Report |
franklintempleton.com |
FRANKLIN MUTUAL FINANCIAL SERVICES FUND
companies to buy back more stock, raise dividends and increase capital expenditures. Those positive fundamentals were periodically overshadowed by political and economic concerns, particularly in the final three months of the year.
As major U.S. equity markets established newall-time highs in 2018, overall U.S. equity market valuations (e.g.,price-to-earnings,price-to-book orprice-to-sales) became increasingly unattractive, in our analysis. The equity marketsell-off in the fourth-quarter helped to return valuations to more reasonable levels. Thesell-off and rise in volatility yielded an opportunity for us to seek out stocks with strong corporate fundamentals and valuations whose risk/reward profiles seemed to us to have become more favorable.
In 2019, policy events may have considerable influence, for better or worse, on economic growth, investor sentiment and financial market performance and volatility. Markets are likely to be particularly sensitive to developments in U.S.-China trade relations, monetary policy moves by the Fed and other major central banks, oil production decisions by OPEC (The Organization of the Petroleum Exporting Countries) and other oil producing countries, the outcome of Brexit, China’s response to its slowing economy and potential political discord in Washington, D.C.
Europe’s equity market overall was trading at an attractively lowerprice-to-earnings multiple and higher dividend yield than the U.S. equity market atperiod-end. We also saw an increase in investor activism, which we viewed as encouraging. However, those favorable factors were offset in part by economic data, which showed increased slowing of economic activity across the region. From an investment standpoint, we are hopeful that 2019 will be a year of potential resolution and clarity. The biggest political event will likely be Brexit, as a resolution to the situation remained unclear as ofperiod-end. The uncertainty around the terms and timing of a deal continued to undermine consumer and corporate confidence. From our perspective, we believe the European Union and the U.K. will ultimately reach an agreement that makes sense for both sides, and we believe the approval of such an agreement would likely have a significantly positive effect on investor, consumer and corporate sentiment in the U.K. We will also pay close attention to structural reform efforts in France, policy decisions from a populist coalition government in Italy and the political transition in Germany. In December, Chancellor Angela Merkel stepped down as leader of the Christian Democratic Union but stated her intention to remain in office for the remaining three years of her term as Chancellor.
Portfolio Composition*
Based on Total Net Assets as of 12/31/18
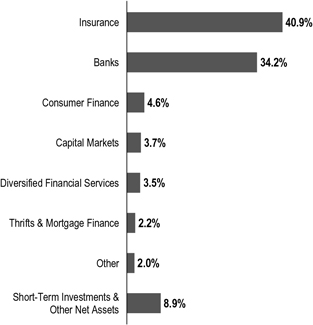
*Figures are stated as a percentage of total and may not equal 100% or may be negative due to rounding, use of any derivatives, unsettled trades or other factors.
In Asia, economic and financial market weakness in China has been brought on by multiple factors. The U.S.-China trade conflict has disrupted manufacturing activity and supply chains. As trade tensions escalated in 2018, manufacturers accelerated production to avoid upcoming tariffs. Atyear-end, supply chains were filled with inventory, while manufacturing activity was weak. Entering 2019, the near-term question is how long the inventory overhang will last, while the more significant question is to what extent the trade conflict will alter supply chains in the medium to long term. Amid the trade conflict, China has proven resolute in its attempt to dampen the reliance on leverage, which has hindered economic activity as well. While the government has enacted some stimulus measures, such as tax cuts, they may be less impactful than prior stimulus through fiscal spending. Meanwhile, government social policies impacting personal freedoms have had a negative effect on consumer sentiment.
Investment Spotlight
The insurance industry has been an area of significant interest for Mutual Series since the Great Recession. The Portfolio Composition bar chart on this page lists insurance and also other leading industries in which the Fund currently invests. We were able to find quality insurers trading at discounts to our estimate of intrinsic value during the post-crisis period of financial services recapitalization, followed by the restructuring
franklintempleton.com |
Annual Report |
5 |
FRANKLIN MUTUAL FINANCIAL SERVICES FUND
of the financial services industry in Europe, and finally capital rationalization in the U.S. financials sector. During the past 10 years, insurance industry trends have provided investment opportunities for value investors. The Mutual Series investment process focuses on finding companies trading below our estimate of intrinsic value and with potential catalysts for value creation. With interest rates at secular low levels, insurers have focused on operational efficiencies, cash flow from underwriting, and rational capital structures to maintain acceptable profitability. Life insurance businesses have mainly focused on improving returns through cost savings and capital rationalization, while property casualty businesses have emphasized better underwriting and capital management.
After several years of equity market outperformance, insurers were hurt by increased natural catastrophe losses around the globe in both 2017 and 2018, jitters regarding global economic growth prospects and a widening of credit spreads. Despite these headwinds, we think valuations atyear-end remained attractive, and our holdings have idiosyncratic catalysts that provide attractive return potential. In addition, the large natural catastrophe losses suffered by property and casualty insurers should present an opportunity for them to increase premiums as they adjust risk profiles.
Mutual Series has owned the Netherlands-based NN Group since its 2014 initial public offering (IPO). NN Group was spun out of ING Groep3 and consists of life insurance, other insurance and asset management operations in Europe and Japan. The initial investment case revolved around the rationalization of capital and cost efficiencies. In 2017, NN Group acquired Dutch insurer Delta Lloyd at an attractive internal rate of return with the potential for significant synergies from the combined company. Since the IPO, the company has returned a significant amount of capital to shareholders and lowered expenses, while maintaining one of the strongest balance sheets in the industry. We expect additional progress on the integration of Delta Lloyd to generate increased cash flow in the future. NN Group is listed among the Fund’s largest positions in the Top 10 Equity Holdings table on this page.
Fund Performance
Turning to Fund performance, top positive contributors included Norway-based securities trading market operator Oslo Bors, global insurer XL Group and international insurer Ageas.
Top 10 Equity Holdings
12/31/18
Company Sector/Industry, Country | % of Total Net Assets | |||
NN Group NV | 4.8% | |||
Insurance, Netherlands | ||||
The Hartford Financial Services Group Inc. | 4.0% | |||
Insurance, U.S. | ||||
Alleghany Corp. | 3.6% | |||
Insurance, U.S. | ||||
American International Group Inc. | 3.6% | |||
Insurance, U.S. | ||||
JPMorgan Chase & Co. | 3.6% | |||
Banks, U.S. | ||||
Voya Financial Inc. | 3.5% | |||
Diversified Financial Services, U.S. | ||||
Everest Re Group Ltd. | 3.4% | |||
Insurance, U.S. | ||||
ASR Nederland NV | 3.1% | |||
Insurance, Netherlands | ||||
HSBC Holdings PLC | 3.0% | |||
Banks, U.K. | ||||
Wells Fargo & Co. | 3.0% | |||
Banks, U.S. | ||||
Oslo Bors offers the only regulated markets for securities trading in Norway. In December 2018, Euronext3, an operator of stock and derivatives markets in Europe, made anall-cash bid for Oslo Bors at a 21% premium to the stock price prior to the announcement. We believe the acquisition makes sense for both companies and see few reasons for it to face resistance from competition regulators. Subsequent to the announcement of the transaction the Fund exited the position.
Shares of XL Group, a global insurance and reinsurance company, rallied in early 2018, aided by generally upbeat quarterly results. We exited the position in March, following the announcement of XL Group’s acquisition by AXA3, another global insurer, at a substantial premium to XL Group’s closing price prior to the announcement.
Ageas is a diversified insurance company with operations in Belgium, the U.K., Portugal, Turkey and Asia. It announced a greater-than-expected dividend increase in February 2018 and solid quarterly results in May 2018, despite investor concerns about potentially higher weather-related losses. Ageas had done a good job overall with improving its cash generation, as well as increasing its regulatory capital base. In November 2018, we sold our position in Ageas, as our original investment catalysts
3. Not a Fund holding.
See www.franklintempletondatasources.com for additional data provider information.
6 |
Annual Report |
franklintempleton.com |
FRANKLIN MUTUAL FINANCIAL SERVICES FUND
had largely played out and its reorganization plan, announced in September 2018, did not alter our investment thesis or estimate of fair value.
During the period under review, Fund investments that detracted from performance included U.S.-based insurer American International Group (AIG), U.S.-based diversified financial services company Citigroup and U.S.-based bank Citizen’s Financial Group.
Shares of AIG slipped in early 2018 as investors reacted negatively to the price AIG paid to acquire Validus Holdings3, a provider of insurance and reinsurance products. The acquisition price represented a significant premium to Validus’ stock price immediately prior to the announcement. However, we believe the acquisition made strategic sense as Validus gives AIG a complementary group of profitable insurance and reinsurance businesses. The stock price slipped further in October 2018, due to larger-than-expected catastrophe-related losses announced ahead of quarterly results. The losses were due to multiple typhoons in Japan, Hurricane Florence and wildfires in California. Investors tend to look beyond uncharacteristic weather-related losses. However, we believe AIG’s series of operating challenges and negative surprises in prior years, such as additional commercial reserves and increases in loss estimates on current business, likely factored into the stock’s significant decline.
Citigroup followed the steep decline among financials sector companies in the final quarter of 2018. Citigroup announced generally positive quarterly results throughout 2018, including October. However, mounting evidence of a global economic slowdown, a widening of credit spreads and the ongoing global trade dispute led investors to become increasingly concerned that a U.S. recession is more likely in the next two years. Additionally, some investors believe the flat or inverted yield curve, which occurred in December 2018, has historically been an early indicator of an impending economic downturn. Although we do not subscribe to the notion that a recession is imminent in the U.S., we are confident Citigroup is well positioned to weather a potential economic slowdown.
Citizens Financial Group is a regional bank focused on the Northeastern U.S. The stock slipped in the second half of the year due to fears of slowing global economic activity negatively affecting the U.S. economy, leading to lower U.S. interest rates, rising credit costs and slower revenue and earnings growth for the industry. In addition, the U.S. Treasury yield curve flattened and inverted in the latter stages of the year and credit spreads widened. On a long-term basis, we believe Citizens remains well positioned to continue driving improved
results through a combination of capital deployment, balance sheet optimization and cost controls.
During the period, the Fund held currency forwards and futures seeking to hedge most of the currency risk of the portfolio’snon-U.S. dollar investments. The hedges had a positive overall impact on the Fund’s performance because of the appreciation of the U.S. dollar versus the hedged currencies.
What is a currency forward?
A currency forward is a direct agreement between the Fund and a counterparty to buy or sell a foreign currency in exchange for another currency at a specific exchange rate on a future date.
What is a future?
A future is an agreement between the Fund and a counterparty made through a U.S. or foreign futures exchange to buy or sell an underlying instrument or asset at a specific price on a future date.
As fellow shareholders, we found recent relative and absolute performance disappointing, but it is not uncommon for our strategy to lag the equity markets at times. We remain committed to our disciplined, value investment approach as we seek to generate attractive, long-term, risk-adjusted returns for shareholders.
franklintempleton.com |
Annual Report |
7 |
FRANKLIN MUTUAL FINANCIAL SERVICES FUND
Thank you for your participation in Franklin Mutual Financial Services Fund. We look forward to continuing to serve your investment needs.
 |
Andrew Sleeman, CFA Co-Portfolio Manager | |
 |
Andrew B. Dinnhaupt, CFA Co-Portfolio Manager | |

The foregoing information reflects our analysis, opinions and portfolio holdings as of December 31, 2018, the end of the reporting period. The way we implement our main investment strategies and the resulting portfolio holdings may change depending on factors such as market and economic conditions. These opinions may not be relied upon as investment advice or an offer for a particular security. The information is not a complete analysis of every aspect of any market, country, industry, security or the Fund. Statements of fact are from sources considered reliable, but the investment manager makes no representation or warranty as to their completeness or accuracy. Although historical performance is no guarantee of future results, these insights may help you understand our investment management philosophy.
CFA® is a trademark owned by CFA Institute.
8 |
Annual Report |
franklintempleton.com |
FRANKLIN MUTUAL FINANCIAL SERVICES FUND
Performance Summary as of December 31, 2018
The performance table and graphs do not reflect any taxes that a shareholder would pay on Fund dividends, capital gain distributions, if any, or any realized gains on the sale of Fund shares. Total return reflects reinvestment of the Fund’s dividends and capital gain distributions, if any, and any unrealized gains or losses. Your dividend income will vary depending on dividends or interest paid by securities in the Fund’s portfolio, adjusted for operating expenses of each class. Capital gain distributions are net profits realized from the sale of portfolio securities.
Performance as of 12/31/18
Cumulative total return excludes sales charges. Average annual total return includes maximum sales charges. Sales charges will vary depending on the size of the investment and the class of share purchased. The maximum is 5.50% and the minimum is 0%.Class A:5.50% maximum initial sales charge. For other share classes, visitfranklintempleton.com.
| Share Class | | Cumulative Total Return | 1 | | Average Annual Total Return | 2 | ||
Z | ||||||||
1-Year | -16.49% | -16.49% | ||||||
5-Year | +27.80% | +5.03% | ||||||
10-Year | +126.55% | +8.52% | ||||||
A3 | ||||||||
1-Year | -16.72% | -21.30% | ||||||
5-Year | +26.03% | +3.55% | ||||||
10-Year | +120.09% | +7.60% | ||||||
Performance data represent past performance, which does not guarantee future results. Investment return and principal value will fluctuate, and you may have a gain or loss when you sell your shares. Current performance may differ from figures shown. For most recentmonth-end performance, go tofranklintempleton.comor call(800)342-5236.
See page 11 for Performance Summary footnotes.
franklintempleton.com |
Annual Report |
9 |
FRANKLIN MUTUAL FINANCIAL SERVICES FUND
PERFORMANCE SUMMARY
Total Return Index Comparison for a Hypothetical $10,000 Investment
Total return represents the change in value of an investment over the periods shown. It includes any applicable maximum sales charge, Fund expenses, account fees and reinvested distributions. The unmanaged indexes include reinvestment of any income or distributions. They differ from the Fund in composition and do not pay management fees or expenses. One cannot invest directly in an index.
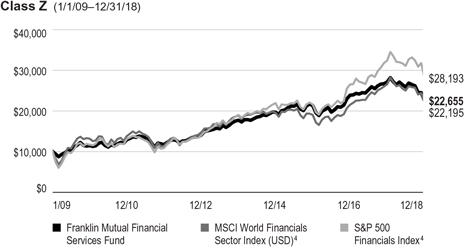
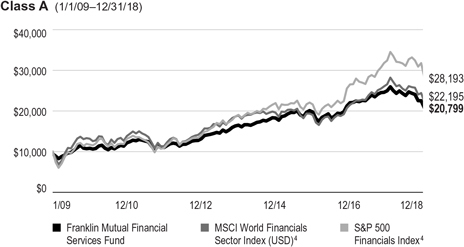
See page 11 for Performance Summary footnotes.
10 |
Annual Report |
franklintempleton.com |
FRANKLIN MUTUAL FINANCIAL SERVICES FUND
PERFORMANCE SUMMARY
Distributions(1/1/18–12/31/18)
| Share Class | Net Investment Income | Long-Term Capital Gain | Total | |||||||||
| Z | $0.1712 | $0.5183 | $0.6895 | |||||||||
| A | $0.1180 | $0.5183 | $0.6363 | |||||||||
| C | $0.0587 | $0.5183 | $0.5770 | |||||||||
| R6 | $0.2030 | $0.5183 | $0.7213 | |||||||||
Total Annual Operating Expenses5
| Share Class | ||||
Z | 1.09% | |||
A | 1.34% | |||
Each class of shares is available to certain eligible investors and has different annual fees and expenses, as described in the prospectus.
All investments involve risks, including possible loss of principal. Value securities may not increase in price as anticipated or may decline further in value. Special risks are associated with foreign investing, including currency fluctuations, economic instability and political developments. Investing in a single-sector fund involves special risks, including greater sensitivity to economic, political or regulatory developments impacting the sector. Because the Fund may invest its assets in companies in a specific region, including Europe, it is subject to greater risks of adverse developments in that region and/or the surrounding regions than a fund that is more broadly diversified geographically. Current political and financial uncertainty surrounding the European Union may increase market volatility and the economic risk of investing in companies in Europe. Smaller-company stocks have exhibited greater price volatility than larger-company stocks, particularly over the short term. The Fund’s investments in companies engaged in mergers, reorganizations or liquidations also involve special risks as pending deals may not be completed on time or on favorable terms. The Fund may invest in lower-rated bonds, which entail higher credit risk. The Fund is actively managed but there is no guarantee that the manager’s investment decisions will produce the desired results. The Fund’s prospectus also includes a description of the main investment risks.
1. Cumulative total return represents the change in value of an investment over the periods indicated.
2. Average annual total return represents the average annual change in value of an investment over the periods indicated. Return for less than one year, if any, has not been annualized.
3. Prior to 9/10/18, these shares were offered at a higher initial sales charge of 5.75%, thus actual returns would have differed. Total returns with sales charges have been restated to reflect the current maximum initial sales charge of 5.50%.
4. Source: Morningstar. The MSCI World Financials Index (USD) captures large and midcap representation across 23 developed markets countries. The S&P 500 Financials Index is market capitalization-weighted and consists of all financial stocks in the S&P 500. The S&P 500 is a market capitalization-weighted index of 500 stocks designed to measure total U.S. equity market performance.
5. Figures are as stated in the Fund’s current prospectus and may differ from the expense ratios disclosed in the Your Fund’s Expenses and Financial Highlights sections in this report. In periods of market volatility, assets may decline significantly, causing total annual Fund operating expenses to become higher than the figures shown.
See www.franklintempletondatasources.com for additional data provider information.
franklintempleton.com |
Annual Report |
11 |
FRANKLIN MUTUAL FINANCIAL SERVICES FUND
As a Fund shareholder, you can incur two types of costs: (1) transaction costs, including sales charges (loads) on Fund purchases and redemptions; and (2) ongoing Fund costs, including management fees, distribution and service(12b-1) fees, and other Fund expenses. All mutual funds have ongoing costs, sometimes referred to as operating expenses. The table below shows ongoing costs of investing in the Fund and can help you understand these costs and compare them with those of other mutual funds. The table assumes a $1,000 investment held for the six months indicated.
Actual Fund Expenses
The table below provides information about actual account values and actual expenses in the columns under the heading “Actual.” In these columns the Fund’s actual return, which includes the effect of Fund expenses, is used to calculate the “Ending Account Value” for each class of shares. You can estimate the expenses you paid during the period by following these steps (of course, your account value and expenses will differ from those in this illustration): Divide your account value by $1,000 (if your account had an $8,600 value, then $8,600 ÷ $1,000 = 8.6). Then multiply the result by the number in the row for your class of shares under the headings “Actual” and “Expenses Paid During Period” (if Actual Expenses Paid During Period were $7.50, then 8.6 x $7.50 =$64.50). In this illustration, the actual expenses paid this period are $64.50.
Hypothetical Example for Comparison with Other Funds
Under the heading “Hypothetical” in the table, information is provided about hypothetical account values and hypothetical expenses based on the Fund’s actual expense ratio and an assumed rate of return of 5% per year before expenses, which is not the Fund’s actual return. This information may not be used to estimate the actual ending account balance or expenses you paid for the period, but it can help you compare ongoing costs of investing in the Fund with those of other funds. To do so, compare this 5% hypothetical example for the class of shares you hold with the 5% hypothetical examples that appear in the shareholder reports of other funds.
Please note that expenses shown in the table are meant to highlight ongoing costs and do not reflect any transactional costs. Therefore, information under the heading “Hypothetical” is useful in comparing ongoing costs only, and will not help you compare total costs of owning different funds. In addition, if transactional costs were included, your total costs would have been higher.
Actual (actual return after expenses) | Hypothetical (5% annual return before expenses) | |||||||||||||||||
Share Class | Beginning Account Value 7/1/18 | Ending Account Value 12/31/18 | Expenses Paid During 7/1/18–12/31/181,2 | Ending Account Value 12/31/18 | Expenses Paid During 7/1/18–12/31/181,2 | Net Annualized Expense Ratio2 | ||||||||||||
| Z | $ 1,000 | $ 875.00 | $ 5.25 | $ 1,019.61 | $ 5.65 | 1.11% | ||||||||||||
| A | $ 1,000 | $ 873.60 | $ 6.42 | $ 1,018.35 | $ 6.92 | 1.36% | ||||||||||||
| C | $ 1,000 | $ 870.30 | $ 9.95 | $ 1,014.57 | $ 10.71 | 2.11% | ||||||||||||
| R6 | $ 1,000 | $ 875.10 | $ 4.68 | $ 1,020.21 | $ 5.04 | 0.99% | ||||||||||||
1. Expenses are equal to the annualized expense ratio for thesix-month period as indicated above—in the far right column—multiplied by the simple average account value over the period indicated, and then multiplied by 184/365 to reflect theone-half year period.
2. Reflects expenses after fee waivers and expense reimbursements. Does not include acquired fund fees and expenses.
12 |
Annual Report |
franklintempleton.com |
FRANKLIN MUTUAL FINANCIAL SERVICES FUND
| ||||||||||||||||||||
| Year Ended December 31, | ||||||||||||||||||||
| 2018 | 2017 | 2016 | 2015 | 2014 | ||||||||||||||||
| Class Z | ||||||||||||||||||||
Per share operating performance | ||||||||||||||||||||
(for a share outstanding throughout the year) | ||||||||||||||||||||
Net asset value, beginning of year | $24.14 | $21.65 | $19.63 | $18.40 | $16.90 | |||||||||||||||
Income from investment operationsa: | ||||||||||||||||||||
Net investment incomeb | 0.38 | c | 0.22 | 0.31 | d | 0.30 | e | 0.25 | ||||||||||||
Net realized and unrealized gains (losses) | (4.37 | ) | 2.76 | 2.00 | 1.23 | 1.62 | ||||||||||||||
Total from investment operations | (3.99 | ) | 2.98 | 2.31 | 1.53 | 1.87 | ||||||||||||||
Less distributions from: | ||||||||||||||||||||
Net investment income | (0.17 | ) | (0.49 | ) | (0.29 | ) | (0.30 | ) | (0.37 | ) | ||||||||||
Net realized gains | (0.52 | ) | — | — | — | — | ||||||||||||||
Total distributions | (0.69 | ) | (0.49 | ) | (0.29 | ) | (0.30 | ) | (0.37 | ) | ||||||||||
Net asset value, end of year | $19.46 | $24.14 | $21.65 | $19.63 | $18.40 | |||||||||||||||
Total return | (16.49)% | 13.77% | 11.79% | 8.34% | 11.07% | |||||||||||||||
Ratios to average net assets | ||||||||||||||||||||
Expensesf | 1.09% | g | 1.09% | 1.13% | g | 1.13% | 1.14% | |||||||||||||
Net investment income | 1.61% | c | 0.95% | 1.64% | d | 1.53% | e | 1.44% | ||||||||||||
| Supplemental data | ||||||||||||||||||||
Net assets, end of year (000’s) | $142,212 | $210,825 | $162,687 | $178,157 | $112,156 | |||||||||||||||
Portfolio turnover rate | 33.11% | 67.89% | 34.58% | 25.43% | 33.69% | |||||||||||||||
aThe amount shown for a share outstanding throughout the period may not correlate with the Statement of Operations for the period due to the timing of sales and repurchases of the Fund’s shares in relation to income earned and/or fluctuating fair value of the investments of the Fund.
bBased on average daily shares outstanding.
cNet investment income per share includes approximately $0.08 per share related to income received in the form of special dividends in connection with certain Fund holdings. Excluding this amount, the ratio of net investment income to average net assets would have been 1.29%.
dNet investment income per share includes approximately $0.05 per share related to income received in the form of special dividends in connection with certain Fund holdings. Excluding this amount, the ratio of net investment income to average net assets would have been 1.38%.
eNet investment income per share includes approximately $0.14 per share related to income received in the form of special dividends in connection with certain Fund holdings. Excluding this amount, the ratio of net investment income to average net assets would have been 0.81%.
fBenefit of expense reduction rounds to less than 0.01%.
gBenefit of waiver and payments by affiliates rounds to less than 0.01%.
franklintempleton.com |
The accompanying notes are an integral part of these financial statements. | Annual Report |
13 |
FRANKLIN MUTUAL FINANCIAL SERVICES FUND
FINANCIAL HIGHLIGHTS
| Year Ended December 31, | ||||||||||||||||||||
| 2018 | 2017 | 2016 | 2015 | 2014 | ||||||||||||||||
Class A | ||||||||||||||||||||
| Per share operating performance | ||||||||||||||||||||
(for a share outstanding throughout the year) | ||||||||||||||||||||
Net asset value, beginning of year | $24.21 | $21.70 | $19.69 | $18.46 | $16.96 | |||||||||||||||
Income from investment operationsa: | ||||||||||||||||||||
Net investment incomeb | 0.31 | c | 0.16 | 0.26 | d | 0.25 | e | 0.20 | ||||||||||||
Net realized and unrealized gains (losses) | (4.36 | ) | 2.78 | 1.99 | 1.23 | 1.61 | ||||||||||||||
Total from investment operations | (4.05 | ) | 2.94 | 2.25 | 1.48 | 1.81 | ||||||||||||||
Less distributions from: | ||||||||||||||||||||
Net investment income | (0.12 | ) | (0.43 | ) | (0.24 | ) | (0.25 | ) | (0.31 | ) | ||||||||||
Net realized gains | (0.52 | ) | — | — | — | — | ||||||||||||||
Total distributions | (0.64 | ) | (0.43 | ) | (0.24 | ) | (0.25 | ) | (0.31 | ) | ||||||||||
Net asset value, end of year | $19.52 | $24.21 | $21.70 | $19.69 | $18.46 | |||||||||||||||
Total returnf | (16.72)% | 13.55% | 11.46% | 8.05% | 10.71% | |||||||||||||||
Ratios to average net assets | ||||||||||||||||||||
Expensesg | 1.34% | h | 1.34% | 1.38% | h | 1.41% | 1.44% | |||||||||||||
Net investment income | 1.36% | c | 0.70% | 1.39% | d | 1.25% | e | 1.14% | ||||||||||||
| Supplemental data | ||||||||||||||||||||
Net assets, end of year (000’s) | $298,878 | $368,850 | $346,008 | $360,278 | $255,242 | |||||||||||||||
Portfolio turnover rate | 33.11% | 67.89% | 34.58% | 25.43% | 33.69% | |||||||||||||||
aThe amount shown for a share outstanding throughout the period may not correlate with the Statement of Operations for the period due to the timing of sales and repurchases of the Fund’s shares in relation to income earned and/or fluctuating fair value of the investments of the Fund.
bBased on average daily shares outstanding.
cNet investment income per share includes approximately $0.08 per share related to income received in the form of special dividends in connection with certain Fund holdings. Excluding this amount, the ratio of net investment income to average net assets would have been 1.04%.
dNet investment income per share includes approximately $0.05 per share related to income received in the form of special dividends in connection with certain Fund holdings. Excluding this amount, the ratio of net investment income to average net assets would have been 1.13%.
eNet investment income per share includes approximately $0.14 per share related to income received in the form of special dividends in connection with certain Fund holdings. Excluding this amount, the ratio of net investment income to average net assets would have been 0.53%.
fTotal return does not reflect sales commissions or contingent deferred sales charges, if applicable.
gBenefit of expense reduction rounds to less than 0.01%.
hBenefit of waiver and payments by affiliates rounds to less than 0.01%.
14 |
Annual Report | The accompanying notes are an integral part of these financial statements. |
franklintempleton.com |
FRANKLIN MUTUAL FINANCIAL SERVICES FUND
FINANCIAL HIGHLIGHTS
| Year Ended December 31, | ||||||||||||||||||||
| 2018 | 2017 | 2016 | 2015 | 2014 | ||||||||||||||||
Class C | ||||||||||||||||||||
| Per share operating performance | ||||||||||||||||||||
(for a share outstanding throughout the year) | ||||||||||||||||||||
Net asset value, beginning of year | $24.08 | $21.60 | $19.61 | $18.41 | $16.92 | |||||||||||||||
Income from investment operationsa: | ||||||||||||||||||||
Net investment income (loss)b | 0.15 | c | (0.01 | ) | 0.12 | d | 0.10 | e | 0.08 | |||||||||||
Net realized and unrealized gains (losses) | (4.33 | ) | 2.74 | 1.96 | 1.24 | 1.60 | ||||||||||||||
Total from investment operations | (4.18 | ) | 2.73 | 2.08 | 1.34 | 1.68 | ||||||||||||||
Less distributions from: | ||||||||||||||||||||
Net investment income | (0.06 | ) | (0.25 | ) | (0.09 | ) | (0.14 | ) | (0.19 | ) | ||||||||||
Net realized gains | (0.52 | ) | — | — | — | — | ||||||||||||||
Total distributions | (0.58 | ) | (0.25 | ) | (0.09 | ) | (0.14 | ) | (0.19 | ) | ||||||||||
Net asset value, end of year | $19.32 | $24.08 | $21.60 | $19.61 | $18.41 | |||||||||||||||
Total returnf | (17.35)% | 12.66% | 10.64% | 7.30% | 9.93% | |||||||||||||||
Ratios to average net assets | ||||||||||||||||||||
Expensesg | 2.09% | h | 2.09% | 2.13% | h | 2.13% | 2.14% | |||||||||||||
Net investment income (loss) | 0.61% | c | (0.05)% | 0.64% | d | 0.53% | e | 0.44% | ||||||||||||
| Supplemental data | ||||||||||||||||||||
Net assets, end of year (000’s) | $58,610 | $134,117 | $128,766 | $132,975 | $89,341 | |||||||||||||||
Portfolio turnover rate | 33.11% | 67.89% | 34.58% | 25.43% | 33.69% | |||||||||||||||
aThe amount shown for a share outstanding throughout the period may not correlate with the Statement of Operations for the period due to the timing of sales and repurchases of the Fund’s shares in relation to income earned and/or fluctuating fair value of the investments of the Fund.
bBased on average daily shares outstanding.
cNet investment income per share includes approximately $0.08 per share related to income received in the form of special dividends in connection with certain Fund holdings. Excluding this amount, the ratio of net investment income to average net assets would have been 0.29%.
dNet investment income per share includes approximately $0.05 per share related to income received in the form of special dividends in connection with certain Fund holdings. Excluding this amount, the ratio of net investment income to average net assets would have been 0.38%.
eNet investment income per share includes approximately $0.14 per share related to income received in the form of special dividends in connection with certain Fund holdings. Excluding this amount, the ratio of net investment income to average net assets would have been (0.19)%.
fTotal return does not reflect sales commissions or contingent deferred sales charges, if applicable.
gBenefit of expense reduction rounds to less than 0.01%.
hBenefit of waiver and payments by affiliates rounds to less than 0.01%.
franklintempleton.com |
The accompanying notes are an integral part of these financial statements. | Annual Report |
15 |
FRANKLIN MUTUAL FINANCIAL SERVICES FUND
FINANCIAL HIGHLIGHTS
| Year Ended December 31, | ||||||||||||||||||||
| 2018 | 2017 | 2016 | 2015 | 2014 | ||||||||||||||||
Class R6 | ||||||||||||||||||||
| Per share operating performance | ||||||||||||||||||||
(for a share outstanding throughout the year) | ||||||||||||||||||||
Net asset value, beginning of year | $24.30 | $21.79 | $19.76 | $18.52 | $16.88 | |||||||||||||||
Income from investment operationsa: | ||||||||||||||||||||
Net investment incomeb | 0.41 | c | 0.25 | 0.32 | d | 0.07 | e | 0.25 | ||||||||||||
Net realized and unrealized gains (losses) | (4.41 | ) | 2.78 | 2.03 | 1.49 | 1.66 | ||||||||||||||
Total from investment operations | (4.00 | ) | 3.03 | 2.35 | 1.56 | 1.91 | ||||||||||||||
Less distributions from: | ||||||||||||||||||||
Net investment income | (0.20 | ) | (0.52 | ) | (0.32 | ) | (0.32 | ) | (0.27 | ) | ||||||||||
Net realized gains | (0.52 | ) | — | — | — | — | ||||||||||||||
Total distributions | (0.72 | ) | (0.52 | ) | (0.32 | ) | (0.32 | ) | (0.27 | ) | ||||||||||
Net asset value, end of year | $19.58 | $24.30 | $21.79 | $19.76 | $18.52 | |||||||||||||||
Total return | (16.41)% | 13.92% | 11.93% | 8.55% | 11.23% | |||||||||||||||
Ratios to average net assets | ||||||||||||||||||||
Expenses before waiver and payments by affiliates | 1.06% | 0.97% | 0.99% | 1.16% | 2.61% | |||||||||||||||
Expenses net of waiver and payments by affiliatesf | 0.97% | 0.95% | 0.96% | 0.96% | 0.97% | |||||||||||||||
Net investment income | 1.73% | c | 1.09% | 1.81% | d | 1.70% | e | 1.61% | ||||||||||||
| Supplemental data | ||||||||||||||||||||
Net assets, end of year (000’s) | $3,371 | $4,523 | $2,601 | $1,421 | $12 | |||||||||||||||
Portfolio turnover rate | 33.11% | 67.89% | 34.58% | 25.43% | 33.69% | |||||||||||||||
aThe amount shown for a share outstanding throughout the period may not correlate with the Statement of Operations for the period due to the timing of sales and repurchases of the Fund’s shares in relation to income earned and/or fluctuating fair value of the investments of the Fund.
bBased on average daily shares outstanding.
cNet investment income per share includes approximately $0.08 per share related to income received in the form of special dividends in connection with certain Fund holdings. Excluding this amount, the ratio of net investment income to average net assets would have been 1.41%.
dNet investment income per share includes approximately $0.05 per share related to income received in the form of special dividends in connection with certain Fund holdings. Excluding this amount, the ratio of net investment income to average net assets would have been 1.55%.
eNet investment income per share includes approximately $0.14 per share related to income received in the form of special dividends in connection with certain Fund holdings. Excluding this amount, the ratio of net investment income to average net assets would have been 0.98%.
fBenefit of expense reduction rounds to less than 0.01%.
16 |
Annual Report | The accompanying notes are an integral part of these financial statements. |
franklintempleton.com |
FRANKLIN MUTUAL FINANCIAL SERVICES FUND
Statement of Investments, December 31, 2018
| Country | Shares | Value | ||||||||||
| ||||||||||||
Common Stocks 91.1% | ||||||||||||
Banks 34.2% | ||||||||||||
a,b AB&T Financial Corp. | United States | 226,100 | $ | 126,616 | ||||||||
AIB Group PLC | Ireland | 2,267,537 | 9,532,370 | |||||||||
Barclays PLC | United Kingdom | 2,700,433 | 5,183,499 | |||||||||
CIT Group Inc. | United States | 123,611 | 4,730,593 | |||||||||
Citigroup Inc. | United States | 180,610 | 9,402,557 | |||||||||
Citizens Financial Group Inc. | United States | 487,200 | 14,484,456 | |||||||||
a Credito Valtellinese SpA. | Italy | 117,345,631 | 9,866,444 | |||||||||
a FCB Financial Holdings Inc., A | United States | 114,987 | 3,861,263 | |||||||||
First Horizon National Corp. | United States | 386,229 | 5,082,774 | |||||||||
Guaranty Bancorp. | United States | 44,161 | 916,341 | |||||||||
HSBC Holdings PLC | United Kingdom | 1,823,653 | 15,044,393 | |||||||||
ING Groep NV | Netherlands | 974,255 | 10,504,396 | |||||||||
JPMorgan Chase & Co. | United States | 183,680 | 17,930,842 | |||||||||
Shinsei Bank Ltd. | Japan | 1,134,000 | 13,543,850 | |||||||||
Societe Generale SA | France | 144,470 | 4,605,148 | |||||||||
Southern National Bancorp of Virginia Inc. | United States | 649,760 | 8,589,827 | |||||||||
Standard Chartered PLC | United Kingdom | 1,728,056 | 13,427,164 | |||||||||
State Bank Financial Corp. | United States | 63,760 | 1,376,578 | |||||||||
UniCredit SpA. | Italy | 404,554 | 4,582,543 | |||||||||
Wells Fargo & Co. | United States | 323,670 | 14,914,714 | |||||||||
Yes Bank Ltd. | India | 1,738,037 | 4,541,830 | |||||||||
|
| |||||||||||
| 172,248,198 | ||||||||||||
|
| |||||||||||
Capital Markets 3.7% | ||||||||||||
Credit Suisse Group AG | Switzerland | 719,393 | 7,867,964 | |||||||||
Deutsche Bank AG | Germany | 991,436 | 7,907,230 | |||||||||
Guotai Junan Securities Co. Ltd. | China | 1,396,063 | 2,824,039 | |||||||||
|
| |||||||||||
| 18,599,233 | ||||||||||||
|
| |||||||||||
Consumer Finance 4.6% | ||||||||||||
Capital One Financial Corp. | United States | 132,810 | 10,039,108 | |||||||||
c Hoist Finance AB, 144A | Sweden | 1,286,396 | 6,280,227 | |||||||||
Sun Hung Kai & Co. Ltd. | Hong Kong | 14,145,704 | 6,684,005 | |||||||||
|
| |||||||||||
| 23,003,340 | ||||||||||||
|
| |||||||||||
Diversified Financial Services 3.5% | ||||||||||||
Voya Financial Inc. | United States | 436,050 | 17,503,047 | |||||||||
|
| |||||||||||
Household Durables 1.9% | ||||||||||||
a Cairn Homes PLC | Ireland | 3,177,704 | 3,895,884 | |||||||||
a,c Neinor Homes SA, 144A | Spain | 380,000 | 5,660,252 | |||||||||
|
| |||||||||||
| 9,556,136 | ||||||||||||
|
| |||||||||||
Insurance 40.9% | ||||||||||||
Alleghany Corp. | United States | 29,137 | 18,161,675 | |||||||||
American International Group Inc. | United States | 456,658 | 17,996,892 | |||||||||
ASR Nederland NV | Netherlands | 397,362 | 15,744,183 | |||||||||
a Brighthouse Financial Inc. | United States | 152,300 | 4,642,104 | |||||||||
China Life Insurance Co. Ltd., H | China | 5,331,000 | 11,328,502 | |||||||||
Chubb Ltd. | United States | 71,050 | 9,178,239 | |||||||||
Direct Line Insurance Group PLC | United Kingdom | 2,400,878 | 9,757,700 | |||||||||
Everest Re Group Ltd. | United States | 79,900 | 17,399,024 | |||||||||
The Hartford Financial Services Group Inc. | United States | 458,972 | 20,401,305 | |||||||||
Lancashire Holdings Ltd. | United Kingdom | 1,466,448 | 11,314,031 | |||||||||
MetLife Inc. | United States | 339,170 | �� | 13,926,320 | ||||||||
NN Group NV | Netherlands | 605,115 | 24,128,258 | |||||||||
franklintempleton.com |
Annual Report |
17 |
FRANKLIN MUTUAL FINANCIAL SERVICES FUND
STATEMENT OF INVESTMENTS
| Country | Shares | Value | ||||||||||
Common Stocks(continued) | ||||||||||||
Insurance(continued) | ||||||||||||
RSA Insurance Group PLC | United Kingdom | 1,772,670 | $ | 11,610,428 | ||||||||
Sabre Insurance Group PLC | United Kingdom | 3,137,265 | 10,922,176 | |||||||||
T&D Holdings Inc. | Japan | 812,169 | 9,477,775 | |||||||||
|
| |||||||||||
| 205,988,612 | ||||||||||||
|
| |||||||||||
Real Estate Management & Development 0.1% | ||||||||||||
aDolphin Capital Investors Ltd. | Greece | 3,979,650 | 296,890 | |||||||||
|
| |||||||||||
Thrifts & Mortgage Finance 2.2% | ||||||||||||
Indiabulls Housing Finance Ltd. | India | 907,348 | 11,136,109 | |||||||||
|
| |||||||||||
Total Common Stocks (Cost $521,142,563) | 458,331,565 | |||||||||||
|
| |||||||||||
| Principal Amount | ||||||||||||
|
| |||||||||||
Short Term Investments 5.8% | ||||||||||||
U.S. Government and Agency Securities 5.8% | ||||||||||||
dFHLB, 1/02/19. | United States | $ | 5,000,000 | 5,000,000 | ||||||||
dU.S. Treasury Bill, | ||||||||||||
1/02/19 | United States | 10,000,000 | 10,000,000 | |||||||||
1/29/19 - 6/06/19 | United States | 14,000,000 | 13,902,644 | |||||||||
|
| |||||||||||
Total U.S. Government and Agency Securities | ||||||||||||
(Cost $28,900,870) | 28,902,644 | |||||||||||
|
| |||||||||||
Total Investments (Cost $550,043,433) 96.9% | 487,234,209 | |||||||||||
Other Assets, less Liabilities 3.1% | 15,837,505 | |||||||||||
|
| |||||||||||
Net Assets 100.0% | $ | 503,071,714 | ||||||||||
|
| |||||||||||
aNon-income producing.
bSee Note 10 regarding holdings of 5% voting securities.
cSecurity was purchased pursuant to Rule 144A under the Securities Act of 1933 and may be sold in transactions exempt from registration only to qualified institutional buyers or in a public offering registered under the Securities Act of 1933. These securities have been deemed liquid under guidelines approved by the Trust’s Board of Trustees. At December 31, 2018, the aggregate value of these securities was $11,940,479, representing 2.4% of net assets.
dThe security was issued on a discount basis with no stated coupon rate.
18 |
Annual Report |
franklintempleton.com |
FRANKLIN MUTUAL FINANCIAL SERVICES FUND
STATEMENT OF INVESTMENTS
At December 31, 2018, the Fund had the following futures contracts outstanding. See Note 1(c).
Futures Contracts
| Description | Type | Number of Contracts | Notional Amount* | Expiration Date | Value/ Unrealized Appreciation (Depreciation) | |||||||||||||||
Currency Contracts | ||||||||||||||||||||
EUR/USD | Short | 157 | $ | 22,612,906 | 3/18/19 | $ 3,373 | ||||||||||||||
GBP/USD | Short | 141 | 11,271,188 | 3/18/19 | 23,296 | |||||||||||||||
|
| |||||||||||||||||||
Total Futures Contracts | $26,669 | |||||||||||||||||||
|
| |||||||||||||||||||
*As of period end.
At December 31, 2018, the Fund had the following forward exchange contracts outstanding. See Note 1(c).
Forward Exchange Contracts
| Currency | Counterpartya | Type | Quantity | Contract Amount | Settlement Date | Unrealized Appreciation | Unrealized Depreciation | |||||||||||||||||||||
OTC Forward Exchange Contracts | ||||||||||||||||||||||||||||
Euro | BOFA | Buy | 3,626,218 | $ | 4,141,545 | 1/14/19 | $ | 18,538 | $ | — | ||||||||||||||||||
Euro | BOFA | Sell | 459,463 | 546,444 | 1/14/19 | 19,337 | — | |||||||||||||||||||||
Euro | BONY | Sell | 3,545,867 | 4,210,504 | 1/14/19 | 142,602 | — | |||||||||||||||||||||
Euro | HSBK | Buy | 4,571,795 | 5,222,665 | 1/14/19 | 22,205 | — | |||||||||||||||||||||
Euro | HSBK | Sell | 1,292,738 | 1,516,764 | 1/14/19 | 33,704 | — | |||||||||||||||||||||
Euro | SSBT | Buy | 1,724,501 | 1,967,926 | 1/14/19 | 10,463 | — | |||||||||||||||||||||
Euro | SSBT | Sell | 3,545,867 | 4,210,603 | 1/14/19 | 142,701 | — | |||||||||||||||||||||
Euro | UBSW | Buy | 314,009 | 356,725 | 1/14/19 | 3,513 | — | |||||||||||||||||||||
Euro | UBSW | Sell | 1,392,588 | 1,634,585 | 1/14/19 | 36,975 | — | |||||||||||||||||||||
Swiss Franc | HSBK | Buy | 200,779 | 203,010 | 1/14/19 | 1,683 | — | |||||||||||||||||||||
Swiss Franc | UBSW | Buy | 1,261,466 | 1,275,210 | 1/14/19 | 10,849 | — | |||||||||||||||||||||
Swiss Franc | UBSW | Sell | 9,174,824 | 9,211,209 | 1/14/19 | — | (142,478 | ) | ||||||||||||||||||||
British Pound | BOFA | Buy | 441,747 | 559,829 | 1/16/19 | 3,983 | — | |||||||||||||||||||||
British Pound | BOFA | Sell | 1,463,955 | 1,935,567 | 1/16/19 | 67,087 | — | |||||||||||||||||||||
British Pound | BONY | Sell | 600,000 | 794,642 | 1/16/19 | 28,848 | — | |||||||||||||||||||||
British Pound | HSBK | Buy | 78,790 | 100,995 | 1/16/19 | — | (433 | ) | ||||||||||||||||||||
British Pound | HSBK | Buy | 922,622 | 1,173,068 | 1/16/19 | 4,497 | — | |||||||||||||||||||||
British Pound | HSBK | Sell | 603,526 | 794,445 | 1/16/19 | 24,151 | — | |||||||||||||||||||||
British Pound | SSBT | Sell | 5,657,185 | 7,538,884 | 1/16/19 | 318,484 | — | |||||||||||||||||||||
Norwegian Krone | BONY | Buy | 3,090,000 | 365,910 | 1/25/19 | — | (8,150 | ) | ||||||||||||||||||||
Norwegian Krone | BONY | Buy | 101,043,565 | 11,593,415 | 1/25/19 | 105,386 | — | |||||||||||||||||||||
Norwegian Krone | BONY | Sell | 104,133,565 | 12,559,556 | 1/25/19 | 502,996 | — | |||||||||||||||||||||
Swedish Krona | BONY | Buy | 33,196,170 | 3,680,481 | 1/31/19 | 76,388 | — | |||||||||||||||||||||
Swedish Krona | BONY | Sell | 88,751,799 | 9,800,680 | 1/31/19 | — | (243,515 | ) | ||||||||||||||||||||
British Pound | BOFA | Sell | 1,259,780 | 1,657,304 | 2/14/19 | 47,148 | — | |||||||||||||||||||||
British Pound | UBSW | Sell | 24,911,783 | 32,115,399 | 2/14/19 | 275,041 | — | |||||||||||||||||||||
Japanese Yen | HSBK | Buy | 144,449,485 | 1,306,994 | 2/19/19 | 16,151 | — | |||||||||||||||||||||
Japanese Yen | UBSW | Buy | 89,047,257 | 807,838 | 2/19/19 | 7,827 | — | |||||||||||||||||||||
Japanese Yen | UBSW | Sell | 2,763,061,303 | 24,607,573 | 2/19/19 | — | (701,831 | ) | ||||||||||||||||||||
Euro | BOFA | Buy | 865,336 | 992,026 | 2/20/19 | 3,751 | — | |||||||||||||||||||||
Euro | BOFA | Sell | 1,643,545 | 1,932,687 | 2/20/19 | 41,394 | — | |||||||||||||||||||||
Euro | BONY | Sell | 12,487,642 | 14,446,407 | 2/20/19 | 76,376 | — | |||||||||||||||||||||
franklintempleton.com |
Annual Report |
19 |
FRANKLIN MUTUAL FINANCIAL SERVICES FUND
STATEMENT OF INVESTMENTS
Forward Exchange Contracts(continued)
| Currency | Counterpartya | Type | Quantity | Contract Amount | Settlement Date | Unrealized Appreciation | Unrealized Depreciation | |||||||||||||||||
OTC Forward Exchange Contracts (continued) | ||||||||||||||||||||||||
Euro | HSBK | Buy | 523,180 | $ | 598,889 | 2/20/19 | $ | 3,155 | $ | — | ||||||||||||||
Euro | HSBK | Sell | 757,417 | 903,186 | 2/20/19 | 31,596 | — | |||||||||||||||||
Euro | SSBT | Buy | 247,468 | 283,459 | 2/20/19 | 1,312 | — | |||||||||||||||||
Euro | SSBT | Sell | 12,457,061 | 14,411,843 | 2/20/19 | 77,002 | — | |||||||||||||||||
Euro | UBSW | Buy | 686,976 | 786,633 | 2/20/19 | 3,899 | — | |||||||||||||||||
Euro | UBSW | Sell | 500,000 | 591,385 | 2/20/19 | 16,015 | — | |||||||||||||||||
Euro | BONY | Sell | 3,126,509 | 3,646,385 | 4/10/19 | 33,188 | — | |||||||||||||||||
Euro | HSBK | Sell | 2,176,356 | 2,552,953 | 4/10/19 | 37,815 | — | |||||||||||||||||
Euro | SSBT | Sell | 3,126,508 | 3,646,759 | 4/10/19 | 33,564 | — | |||||||||||||||||
Euro | BOFA | Sell | 2,503,362 | 2,949,186 | 4/18/19 | 54,129 | — | |||||||||||||||||
Euro | HSBK | Sell | 2,503,363 | 2,949,688 | 4/18/19 | 54,629 | — | |||||||||||||||||
British Pound | BONY | Sell | 3,269,703 | 4,301,888 | 4/24/19 | 109,044 | — | |||||||||||||||||
British Pound | SSBT | Sell | 1,996,353 | 2,648,434 | 4/24/19 | 88,446 | — | |||||||||||||||||
Euro | BOFA | Sell | 3,466,219 | 4,016,845 | 5/07/19 | 1,651 | — | |||||||||||||||||
Euro | HSBK | Sell | 6,031,888 | 7,003,436 | 5/07/19 | 16,226 | — | |||||||||||||||||
Euro | UBSW | Sell | 3,466,218 | 4,016,377 | 5/07/19 | 1,183 | — | |||||||||||||||||
Euro | SSBT | Sell | 11,539,429 | 13,437,088 | 5/21/19 | 53,764 | — | |||||||||||||||||
British Pound | BOFA | Sell | 3,084,432 | 3,993,632 | 5/28/19 | 32,026 | — | |||||||||||||||||
British Pound | BOFA | Sell | 3,627,432 | 4,632,238 | 5/28/19 | — | (26,790 | ) | ||||||||||||||||
British Pound | HSBK | Sell | 68,927 | 89,123 | 5/28/19 | 594 | — | |||||||||||||||||
British Pound | UBSW | Sell | 381,801 | 494,619 | 5/28/19 | 4,238 | — | |||||||||||||||||
|
| |||||||||||||||||||||||
Total Forward Exchange Contracts | $ | 2,695,554 | $ (1,123,197 | ) | ||||||||||||||||||||
|
| |||||||||||||||||||||||
Net unrealized appreciation (depreciation) | $ | 1,572,357 | ||||||||||||||||||||||
|
| |||||||||||||||||||||||
aMay be comprised of multiple contracts with the same counterparty, currency and settlement date.
See Note 9 regarding other derivative information.
See Abbreviations on page 35.
20 |
Annual Report | The accompanying notes are an integral part of these financial statements. |
franklintempleton.com |
FRANKLIN MUTUAL FINANCIAL SERVICES FUND
Statement of Assets and Liabilities
December 31, 2018
Assets: | ||||
Investments in securities: | ||||
Cost - Unaffiliated issuers | $ | 547,816,678 | ||
Cost -Non-controlled affiliates (Note 3f and 10) | 2,226,755 | |||
|
| |||
Value - Unaffiliated issuers | $ | 487,107,593 | ||
Value -Non-controlled affiliates (Note 3f and 10) | 126,616 | |||
Cash | 31,258 | |||
Foreign currency, at value (cost $407,939) | 407,939 | |||
Receivables: | ||||
Investment securities sold | 15,114,002 | |||
Capital shares sold | 734,369 | |||
Dividends | 592,634 | |||
European Union tax reclaims | 876,747 | |||
Deposits with brokers for: | ||||
Futures contracts | 722,650 | |||
Unrealized appreciation on OTC forward exchange contracts | 2,695,554 | |||
Other assets | 852 | |||
|
| |||
Total assets | 508,410,214 | |||
|
| |||
Liabilities: | ||||
Payables: | ||||
Investment securities purchased | 500,999 | |||
Capital shares redeemed | 2,650,490 | |||
Management fees | 389,698 | |||
Distribution fees | 246,350 | |||
Transfer agent fees | 155,255 | |||
Trustees’ fees and expenses | 32,913 | |||
Variation margin on futures contracts | 57,800 | |||
Unrealized depreciation on OTC forward exchange contracts | 1,123,197 | |||
Accrued expenses and other liabilities | 181,798 | |||
|
| |||
Total liabilities | 5,338,500 | |||
|
| |||
Net assets, at value | $ | 503,071,714 | ||
|
| |||
Net assets consist of: | ||||
Paid-in capital | $ | 579,912,794 | ||
Total distributable earnings (loss) | (76,841,080 | ) | ||
|
| |||
Net assets, at value | $ | 503,071,714 | ||
|
|
franklintempleton.com |
The accompanying notes are an integral part of these financial statements. | Annual Report |
21 |
FRANKLIN MUTUAL FINANCIAL SERVICES FUND
FINANCIAL STATEMENTS
Statement of Assets and Liabilities(continued)
December 31, 2018
| Class Z: | ||||
Net assets, at value | $ | 142,212,397 | ||
|
| |||
Shares outstanding | 7,308,453 | |||
|
| |||
Net asset value and maximum offering price per share | $19.46 | |||
|
| |||
| Class A: | ||||
Net assets, at value | $ | 298,878,050 | ||
|
| |||
Shares outstanding | 15,314,883 | |||
|
| |||
Net asset value per sharea | $19.52 | |||
|
| |||
Maximum offering price per share (net asset value per share ÷ 94.50%) | $20.66 | |||
|
| |||
| Class C: | ||||
Net assets, at value | $ | 58,610,215 | ||
|
| |||
Shares outstanding | 3,033,375 | |||
|
| |||
Net asset value and maximum offering price per sharea | $19.32 | |||
|
| |||
| Class R6: | ||||
Net assets, at value | $ | 3,371,052 | ||
|
| |||
Shares outstanding | 172,132 | |||
|
| |||
Net asset value and maximum offering price per share | $19.58 | |||
|
|
aRedemption price is equal to net asset value less contingent deferred sales charges, if applicable.
22 |
Annual Report | The accompanying notes are an integral part of these financial statements. |
franklintempleton.com |
FRANKLIN MUTUAL FINANCIAL SERVICES FUND
FINANCIAL STATEMENTS
Statement of Operations
for the year ended December 31, 2018
Investment income: | ||||
Dividends: (net of foreign taxes)* | ||||
Unaffiliated issuers | $ | 17,195,830 | ||
Interest: | ||||
Unaffiliated issuers | 718,243 | |||
Income from securities loaned: | ||||
Unaffiliated issuers (net of fees and rebates) | 27,077 | |||
Non-controlled affiliates (Note 3f) | 2,684 | |||
|
| |||
Total investment income | 17,943,834 | |||
|
| |||
Expenses: | ||||
Management fees (Note 3a) | 5,836,559 | |||
Distribution fees: (Note 3c) | ||||
Class A | 882,004 | |||
Class C | 1,149,070 | |||
Transfer agent fees: (Note 3e) | ||||
Class Z | 278,529 | |||
Class A | 505,167 | |||
Class C | 164,556 | |||
Class R6 | 4,850 | |||
Custodian fees (Note 4) | 93,181 | |||
Reports to shareholders | 93,480 | |||
Registration and filing fees. | 73,603 | |||
Professional fees | 123,980 | |||
Trustees’ fees and expenses | 40,590 | |||
Other | 40,679 | |||
|
| |||
Total expenses | 9,286,248 | |||
Expense reductions (Note 4) | (3,659 | ) | ||
Expenses waived/paid by affiliates (Note 3f and 3g) | (4,540 | ) | ||
|
| |||
Net expenses | 9,278,049 | |||
|
| |||
Net investment income. | 8,665,785 | |||
|
| |||
Realized and unrealized gains (losses): | ||||
Net realized gain (loss) from: | ||||
Investments: | ||||
Unaffiliated issuers | (2,099,878 | ) | ||
Foreign currency transactions. | (176,248 | ) | ||
Forward exchange contracts. | 9,416,277 | |||
Futures contracts | 2,272,296 | |||
|
| |||
Net realized gain (loss) | 9,412,447 | |||
|
| |||
Net change in unrealized appreciation (depreciation) on: | ||||
Investments: | ||||
Unaffiliated issuers | (134,334,117 | ) | ||
Non-controlled affiliates (Note 3f and 10) | (2,261 | ) | ||
Translation of other assets and liabilities denominated in foreign currencies | (26,369 | ) | ||
Forward exchange contracts. | 5,181,019 | |||
Futures contracts | 554,851 | |||
Change in deferred taxes on unrealized appreciation. | 646,818 | |||
|
| |||
Net change in unrealized appreciation (depreciation) | (127,980,059 | ) | ||
|
| |||
Net realized and unrealized gain (loss) | (118,567,612 | ) | ||
|
| |||
Net increase (decrease) in net assets resulting from operations | $ | (109,901,827 | ) | |
|
| |||
*Foreign taxes withheld on dividends | $ | 1,194,166 | ||
franklintempleton.com |
The accompanying notes are an integral part of these financial statements. | Annual Report |
�� 23 |
FRANKLIN MUTUAL FINANCIAL SERVICES FUND
FINANCIAL STATEMENTS
Statements of Changes in Net Assets
| Year Ended December 31, | ||||||||
| 2018 | 2017 | |||||||
Increase (decrease) in net assets: | ||||||||
Operations: | ||||||||
Net investment income | $ | 8,665,785 | $ | 4,252,474 | ||||
Net realized gain (loss) | 9,412,447 | 88,325,620 | ||||||
Net change in unrealized appreciation (depreciation) | (127,980,059 | ) | (7,117,836 | ) | ||||
Net increase (decrease) in net assets resulting from operations | (109,901,827 | ) | 85,460,258 | |||||
Distributions to shareholders: (Note 1f) | ||||||||
Class Z | (4,996,108 | ) | (4,211,056 | ) | ||||
Class A | (9,609,536 | ) | (6,418,111 | ) | ||||
Class C | (1,856,107 | ) | (1,393,532 | ) | ||||
Class R6 | (115,264 | ) | (93,577 | ) | ||||
Total distributions to shareholders | (16,577,015 | ) | (12,116,276 | ) | ||||
Capital share transactions: (Note 2) | ||||||||
Class Z | (32,948,539 | ) | 27,417,572 | |||||
Class A | 734,715 | (15,335,232 | ) | |||||
Class C | (56,197,465 | ) | (8,715,929 | ) | ||||
Class R6 | (354,486 | ) | 1,544,299 | |||||
Total capital share transactions | (88,765,775 | ) | 4,910,710 | |||||
Net increase (decrease) in net assets | (215,244,617 | ) | 78,254,692 | |||||
Net assets: | ||||||||
Beginning of year | 718,316,331 | 640,061,639 | ||||||
End of year (Note 1f) | $ | 503,071,714 | $ | 718,316,331 | ||||
24 |
Annual Report | The accompanying notes are an integral part of these financial statements. |
franklintempleton.com |
FRANKLIN MUTUAL FINANCIAL SERVICES FUND
1. Organization and Significant Accounting Policies
Franklin Mutual Series Funds (Trust) is registered under the Investment Company Act of 1940 (1940 Act) as anopen-end management investment company, consisting of seven separate funds and applies the specialized accounting and reporting guidance in U.S. Generally Accepted Accounting Principles (U.S. GAAP). Franklin Mutual Financial Services Fund (Fund) is included in this report. The Fund offers four classes of shares: Class Z, Class A, Class C and Class R6. Beginning on October 19, 2018, Class C shares automatically convert to Class A shares after they have been held for 10 years. Each class of shares may differ by its initial sales load, contingent deferred sales charges, voting rights on matters affecting a single class, its exchange privilege and fees due to differing arrangements for distribution and transfer agent fees.
The following summarizes the Fund’s significant accounting policies.
a. Financial Instrument Valuation
The Fund’s investments in financial instruments are carried at fair value daily. Fair value is the price that would be received to sell an asset or paid to transfer a liability in an orderly transaction between market participants on the measurement date. The Fund calculates the net asset value (NAV) per share each business day as of 4 p.m. Eastern time or the regularly scheduled close of the New York Stock Exchange (NYSE), whichever is earlier. Under compliance policies and procedures approved by the Trust’s Board of Trustees (the Board), the Fund’s administrator has responsibility for oversight of valuation, including leading the cross-functional Valuation Committee (VC). The Fund may utilize independent pricing services, quotations from securities and financial instrument dealers, and other market sources to determine fair value.
Equity securities and derivative financial instruments listed on an exchange or on the NASDAQ National Market System are valued at the last quoted sale price or the official closing price of the day, respectively. Foreign equity securities are valued as of the close of trading on the foreign stock exchange on which the security is primarily traded, or as of 4 p.m. Eastern time. The value is then converted into its U.S. dollar equivalent at the foreign exchange rate in effect at 4 p.m. Eastern time on the day that the value of the security is determined.Over-the-counter (OTC) securities are valued within the range of the most recent quoted bid and ask prices. Securities that trade in multiple
markets or on multiple exchanges are valued according to the broadest and most representative market. Certain equity securities are valued based upon fundamental characteristics or relationships to similar securities.
Debt securities generally trade in the OTC market rather than on a securities exchange. The Fund’s pricing services use multiple valuation techniques to determine fair value. In instances where sufficient market activity exists, the pricing services may utilize a market-based approach through which quotes from market makers are used to determine fair value. In instances where sufficient market activity may not exist or is limited, the pricing services also utilize proprietary valuation models which may consider market characteristics such as benchmark yield curves, credit spreads, estimated default rates, anticipated market interest rate volatility, coupon rates, anticipated timing of principal repayments, underlying collateral, and other unique security features in order to estimate the relevant cash flows, which are then discounted to calculate the fair value.
Investments inopen-end mutual funds are valued at the closing NAV.
Certain derivative financial instruments trade in the OTC market. The Fund’s pricing services use various techniques including industry standard option pricing models and proprietary discounted cash flow models to determine the fair value of those instruments. The Fund’s net benefit or obligation under the derivative contract, as measured by the fair value of the contract, is included in net assets.
The Fund has procedures to determine the fair value of financial instruments for which market prices are not reliable or readily available. Under these procedures, the Fund primarily employs a market-based approach which may use related or comparable assets or liabilities, recent transactions, market multiples, book values, and other relevant information for the investment to determine the fair value of the investment. An income-based valuation approach may also be used in which the anticipated future cash flows of the investment are discounted to calculate fair value. Discounts may also be applied due to the nature or duration of any restrictions on the disposition of the investments. Due to the inherent uncertainty of valuations of such investments, the fair values may differ significantly from the values that would have been used had an active market existed.
franklintempleton.com |
Annual Report |
25 |
FRANKLIN MUTUAL FINANCIAL SERVICES FUND
NOTES TO FINANCIAL STATEMENTS
1. Organization and Significant Accounting
Policies(continued)
a. Financial Instrument Valuation(continued)
Trading in securities on foreign securities stock exchanges and OTC markets may be completed before 4 p.m. Eastern time. In addition, trading in certain foreign markets may not take place on every Fund’s business day. Occasionally, events occur between the time at which trading in a foreign security is completed and 4 p.m. Eastern time that might call into question the reliability of the value of a portfolio security held by the Fund. As a result, differences may arise between the value of the Fund’s portfolio securities as determined at the foreign market close and the latest indications of value at 4 p.m. Eastern time. In order to minimize the potential for these differences, the VC monitors price movements following the close of trading in foreign stock markets through a series of country specific market proxies (such as baskets of American Depositary Receipts, futures contracts and exchange traded funds). These price movements are measured against established trigger thresholds for each specific market proxy to assist in determining if an event has occurred that may call into question the reliability of the values of the foreign securities held by the Fund. If such an event occurs, the securities may be valued using fair value procedures, which may include the use of independent pricing services. At December 31, 2018, a market event occurred resulting in a portion of the securities held by the Fund being valued using fair value procedures.
When the last day of the reporting period is anon-business day, certain foreign markets may be open on those days that the Fund’s NAV is not calculated, which could result in differences between the value of the Fund’s portfolio securities on the last business day and the last calendar day of the reporting period. Any significant security valuation changes due to an open foreign market are adjusted and reflected by the Fund for financial reporting purposes.
b. Foreign Currency Translation
Portfolio securities and other assets and liabilities denominated in foreign currencies are translated into U.S. dollars based on the exchange rate of such currencies against U.S. dollars on the date of valuation. The Fund may enter into foreign currency exchange contracts to facilitate transactions denominated in a foreign currency. Purchases and sales of securities, income and expense items denominated in foreign currencies are translated into U.S. dollars at the exchange rate in effect on the transaction
date. Portfolio securities and assets and liabilities denominated in foreign currencies contain risks that those currencies will decline in value relative to the U.S. dollar. Occasionally, events may impact the availability or reliability of foreign exchange rates used to convert the U.S. dollar equivalent value. If such an event occurs, the foreign exchange rate will be valued at fair value using procedures established and approved by the Board.
The Fund does not separately report the effect of changes in foreign exchange rates from changes in market prices on securities held. Such changes are included in net realized and unrealized gain or loss from investments in the Statement of Operations.
Realized foreign exchange gains or losses arise from sales of foreign currencies, currency gains or losses realized between the trade and settlement dates on securities transactions and the difference between the recorded amounts of dividends, interest, and foreign withholding taxes and the U.S. dollar equivalent of the amounts actually received or paid. Net unrealized foreign exchange gains and losses arise from changes in foreign exchange rates on foreign denominated assets and liabilities other than investments in securities held at the end of the reporting period.
c. Derivative Financial Instruments
The Fund invested in derivative financial instruments in order to manage risk or gain exposure to various other investments or markets. Derivatives are financial contracts based on an underlying or notional amount, require no initial investment or an initial net investment that is smaller than would normally be required to have a similar response to changes in market factors, and require or permit net settlement. Derivatives contain various risks including the potential inability of the counterparty to fulfill their obligations under the terms of the contract, the potential for an illiquid secondary market, and/or the potential for market movements which expose the Fund to gains or losses in excess of the amounts shown in the Statement of Assets and Liabilities. Realized gain and loss and unrealized appreciation and depreciation on these contracts for the period are included in the Statement of Operations.
Derivative counterparty credit risk is managed through a formal evaluation of the creditworthiness of all potential counter-parties. The Fund attempts to reduce its exposure to counterparty credit risk on OTC derivatives, whenever possible, by entering into International Swaps and Derivatives
26 |
Annual Report |
franklintempleton.com |
FRANKLIN MUTUAL FINANCIAL SERVICES FUND
NOTES TO FINANCIAL STATEMENTS
Association (ISDA) master agreements with certain counterparties. These agreements contain various provisions, including but not limited to collateral requirements, events of default, or early termination. Termination events applicable to the counterparty include certain deteriorations in the credit quality of the counterparty. Termination events applicable to the Fund include failure of the Fund to maintain certain net asset levels and/or limit the decline in net assets over various periods of time. In the event of default or early termination, the ISDA master agreement gives thenon-defaulting party the right to net andclose-out all transactions traded, whether or not arising under the ISDA agreement, to one net amount payable by one counterparty to the other. However, absent an event of default or early termination, OTC derivative assets and liabilities are presented gross and not offset in the Statement of Assets and Liabilities. Early termination by the counterparty may result in an immediate payment by the Fund of any net liability owed to that counterparty under the ISDA agreement. At December 31, 2018, the Fund had OTC derivatives in a net liability position of $484,769.
Collateral requirements differ by type of derivative. Collateral or initial margin requirements are set by the broker or exchange clearing house for exchange traded and centrally cleared derivatives. Initial margin deposited is held at the exchange and can be in the form of cash and/or securities. For OTC derivatives traded under an ISDA master agreement, posting of collateral is required by either the Fund or the applicable counterparty if the total net exposure of all OTC derivatives with the applicable counterparty exceeds the minimum transfer amount, which typically ranges from $100,000 to $250,000, and can vary depending on the counterparty and the type of the agreement. Generally, collateral is determined at the close of Fund business each day and any additional collateral required due to changes in derivative values may be delivered by the Fund or the counterparty the next business day, or within a few business days. Collateral pledged and/or received by the Fund for OTC derivatives, if any, is held in segregated accounts with the Fund’s custodian/counterparty broker and can be in the form of cash and/or securities. Unrestricted cash may be invested according to the Fund’s investment objectives. To the extent that the amounts due to the Fund from its counterparties are not subject to collateralization or are not fully collateralized, the Fund bears the risk of loss from counterpartynon-performance.
At December 31, 2018, the Fund received $2,476,204 in U.K. Treasury Bonds and U.S. Treasury Bills, Bonds and Notes as collateral for derivatives.
The Fund entered into exchange traded futures contracts primarily to manage exposure to certain foreign currencies. A futures contract is an agreement between the Fund and a counterparty to buy or sell an asset at a specified price on a future date. Required initial margins are pledged by the Fund, and the daily change in fair value is accounted for as a variation margin payable or receivable in the Statement of Assets and Liabilities.
The Fund entered into OTC forward exchange contracts primarily to manage exposure to certain foreign currencies. A forward exchange contract is an agreement between the Fund and a counterparty to buy or sell a foreign currency at a specific exchange rate on a future date.
See Note 9 regarding other derivative information.
d. Securities Lending
The Fund participates in an agency based securities lending program to earn additional income. The Fund receives cash collateral against the loaned securities in an amount equal to at least 102% of the fair value of the loaned securities. Collateral is maintained over the life of the loan in an amount not less than 100% of the fair value of loaned securities, as determined at the close of Fund business each day; any additional collateral required due to changes in security values is delivered to the Fund on the next business day. The collateral is deposited into a joint cash account with other funds and is used to invest in a money market fund managed by Franklin Advisers, Inc., an affiliate of the Fund, and/or a joint repurchase agreement. The Fund may receive income from the investment of cash collateral, in addition to lending fees and rebates paid by the borrower. Income from securities loaned, net of fees paid to the securities lending agent and/or third-party vendor, is reported separately in the Statement of Operations. The Fund bears the market risk with respect to the collateral investment, securities loaned, and the risk that the agent may default on its obligations to the Fund. If the borrower defaults on its obligation to return the securities loaned, the Fund has the right to repurchase the securities in the open market using the collateral received. The securities lending agent has agreed to indemnify the Fund in the event of default by a third party borrower. At December 31, 2018, the Fund had no securities on loan.
franklintempleton.com |
Annual Report |
27 |
FRANKLIN MUTUAL FINANCIAL SERVICES FUND
NOTES TO FINANCIAL STATEMENTS
1. Organization and Significant Accounting
Policies(continued)
e. Income and Deferred Taxes
It is the Fund’s policy to qualify as a regulated investment company under the Internal Revenue Code. The Fund intends to distribute to shareholders substantially all of its taxable income and net realized gains to relieve it from federal income and excise taxes. As a result, no provision for U.S. federal income taxes is required.
The Fund may be subject to foreign taxation related to income received, capital gains on the sale of securities and certain foreign currency transactions in the foreign jurisdictions in which it invests. Foreign taxes, if any, are recorded based on the tax regulations and rates that exist in the foreign markets in which the Fund invests. When a capital gain tax is determined to apply, the Fund records an estimated deferred tax liability in an amount that would be payable if the securities were disposed of on the valuation date.
As a result of several court cases, in certain countries across the European Union, the Fund filed additional tax reclaims for previously withheld taxes on dividends earned in those countries (EU reclaims). These additional filings are subject to various administrative proceedings by the local jurisdictions’ tax authorities within the European Union, as well as a number of related judicial proceedings. Income recognized, if any, for EU reclaims is reflected as other income in the Statement of Operations and any related receivable, if any, is reflected as European Union tax reclaims in the Statement of Assets and Liabilities. When uncertainty exists as to the ultimate resolution of these proceedings, the likelihood of receipt of these EU reclaims, and the potential timing of payment, no amounts are reflected in the financial statements. For U.S. income tax purposes, EU reclaims received by the Fund, if any, reduce the amounts of foreign taxes Fund shareholders can use as tax credits in their individual income tax returns.
The Fund may recognize an income tax liability related to its uncertain tax positions under U.S. GAAP when the uncertain tax position has a less than 50% probability that it will be sustained upon examination by the tax authorities based on its technical merits. As of December 31, 2018, the Fund has determined that no tax liability is required in its financial statements related to uncertain tax positions for any open tax years (or expected to be taken in future tax years). Open tax
years are those that remain subject to examination and are based on the statute of limitations in each jurisdiction in which the Fund invests.
f. Security Transactions, Investment Income, Expenses and Distributions
Security transactions are accounted for on trade date. Realized gains and losses on security transactions are determined on a specific identification basis. Interest income and estimated expenses are accrued daily. Amortization of premium and accretion of discount on debt securities are included in interest income. Dividend income is recorded on theex-dividend date except for certain dividends from securities where the dividend rate is not available. In such cases, the dividend is recorded as soon as the information is received by the Fund. Distributions to shareholders are recorded on theex-dividend date. Distributable earnings are determined according to income tax regulations (tax basis) and may differ from earnings recorded in accordance with U.S. GAAP. These differences may be permanent or temporary. Permanent differences are reclassified among capital accounts to reflect their tax character. These reclassifications have no impact on net assets or the results of operations. Temporary differences are not reclassified, as they may reverse in subsequent periods.*
Common expenses incurred by the Trust are allocated among the Funds based on the ratio of net assets of each Fund to the combined net assets of the Trust or based on the ratio of number of shareholders of each Fund to the combined number of shareholders of the Trust. Fund specific expenses are charged directly to the Fund that incurred the expense.
Realized and unrealized gains and losses and net investment income, excluding class specific expenses, are allocated daily to each class of shares based upon the relative proportion of net assets of each class. Differences in per share distributions by class are generally due to differences in class specific expenses.
g. Accounting Estimates
The preparation of financial statements in accordance with U.S. GAAP requires management to make estimates and assumptions that affect the reported amounts of assets and liabilities at the date of the financial statements and the amounts of income and expenses during the reporting period. Actual results could differ from those estimates.
28 |
Annual Report |
franklintempleton.com |
FRANKLIN MUTUAL FINANCIAL SERVICES FUND
NOTES TO FINANCIAL STATEMENTS
h. Guarantees and Indemnifications
Under the Trust’s organizational documents, its officers and trustees are indemnified by the Trust against certain liabilities arising out of the performance of their duties to the Trust. Additionally, in the normal course of business, the Trust, on behalf of the Fund, enters into contracts with service providers
that contain general indemnification clauses. The Trust’s maximum exposure under these arrangements is unknown as this would involve future claims that may be made against the Trust that have not yet occurred. Currently, the Trust expects the risk of loss to be remote.
*Effective during the current reporting period, it is no longer required to present certain line items in the Statements of Changes in Net Assets. The below prior period amounts affected by this change are shown as they were in the prior year Statements of Changes in Net Assets.
For the year ended December 31, 2017, distributions to shareholders were as follows:
Distributions from net investment income: | ||||
Class Z | $ | (4,211,056 | ) | |
Class A | (6,418,111 | ) | ||
Class C | (1,393,532 | ) | ||
Class R6 | (93,577 | ) |
For the year ended December 31, 2017, distributions in excess of net investment income included in net assets was $(6,913,596).
2. Shares of Beneficial Interest
At December 31, 2018, there were an unlimited number of shares authorized (without par value). Transactions in the Fund’s shares were as follows:
| Year Ended December 31, | ||||||||||||||||
| 2018 | 2017 | |||||||||||||||
| Shares | Amount | Shares | Amount | |||||||||||||
Class Z Shares: | ||||||||||||||||
Shares sold | 1,795,911 | $ | 42,587,212 | 2,575,987 | $ | 58,323,294 | ||||||||||
Shares issued in reinvestment of distributions | 232,915 | 4,484,624 | 156,102 | 3,762,873 | ||||||||||||
Shares redeemed | (3,453,297 | ) | (80,020,375 | ) | (1,515,027 | ) | (34,668,595 | ) | ||||||||
Net increase (decrease) | (1,424,471 | ) | $ | (32,948,539 | ) | 1,217,062 | $ | 27,417,572 | ||||||||
Class A Shares: | ||||||||||||||||
Shares solda | 3,840,652 | $ | 88,515,496 | 3,502,833 | $ | 79,651,690 | ||||||||||
Shares issued in reinvestment of distributions | 483,446 | 9,333,950 | 257,411 | 6,217,199 | ||||||||||||
Shares redeemed | (4,247,680 | ) | (97,114,731 | ) | (4,464,692 | ) | (101,204,121 | ) | ||||||||
Net increase (decrease) | 76,418 | $ | 734,715 | (704,448 | ) | $ | (15,335,232 | ) | ||||||||
Class C Shares: | ||||||||||||||||
Shares sold | 619,361 | $ | 14,593,999 | 998,768 | $ | 22,519,991 | ||||||||||
Shares issued in reinvestment of distributions | 92,903 | 1,798,559 | 56,775 | 1,357,536 | ||||||||||||
Shares redeemeda | (3,248,605 | ) | (72,590,023 | ) | (1,447,619 | ) | (32,593,456 | ) | ||||||||
Net increase (decrease) | (2,536,341 | ) | $ | (56,197,465 | ) | (392,076 | ) | $ | (8,715,929 | ) | ||||||
franklintempleton.com |
Annual Report |
29 |
FRANKLIN MUTUAL FINANCIAL SERVICES FUND
NOTES TO FINANCIAL STATEMENTS
2. Shares of Beneficial Interest(continued)
| Year Ended December 31, | ||||||||||||||||
| 2018 | 2017 | |||||||||||||||
| Shares | Amount | Shares | Amount | |||||||||||||
Class R6 Shares: | ||||||||||||||||
Shares sold | 79,359 | $ | 1,851,756 | 109,161 | $ | 2,521,815 | ||||||||||
Shares issued in reinvestment of distributions | 5,949 | 115,264 | 3,853 | 93,577 | ||||||||||||
Shares redeemed | (99,309 | ) | (2,321,506 | ) | (46,239 | ) | (1,071,093 | ) | ||||||||
Net increase (decrease) | (14,001 | ) | $ | (354,486 | ) | 66,775 | $ | 1,544,299 | ||||||||
aMay include a portion of Class C shares that were automatically converted to Class A.
3. Transactions with Affiliates
Franklin Resources, Inc. is the holding company for various subsidiaries that together are referred to as Franklin Templeton. Certain officers and trustees of the Fund are also officers and/or directors of the following subsidiaries:
| Subsidiary | Affiliation | |
Franklin Mutual Advisers, LLC (Franklin Mutual) | Investment manager | |
Franklin Templeton Services, LLC (FT Services) | Administrative manager | |
Franklin Templeton Distributors, Inc. (Distributors) | Principal underwriter | |
Franklin Templeton Investor Services, LLC (Investor Services) | Transfer agent | |
a. Management Fees
The Fund pays an investment management fee to Franklin Mutual based on the average daily net assets of the Fund as follows:
| Annualized Fee Rate | Net Assets | |
0.875% | Up to and including $1 billion | |
0.845% | Over $1 billion, up to and including $2 billion | |
0.825% | Over $2 billion, up to and including $5 billion | |
0.805% | In excess of $5 billion | |
For the year ended December 31, 2018, the gross effective investment management fee rate was 0.875% of the Fund’s average daily net assets.
b. Administrative Fees
Under an agreement with Franklin Mutual, FT Services provides administrative services to the Fund. The fee is paid by Franklin Mutual based on the Fund’s average daily net assets, and is not an additional expense of the Fund.
c. Distribution Fees
The Board has adopted distribution plans for each share class, with the exception of Class Z and Class R6 shares, pursuant to Rule12b-1 under the 1940 Act. Under the Fund’s Class A reimbursement distribution plan, the Fund reimburses Distributors for costs incurred in connection with the servicing, sale and distribution of the Fund’s shares up to the maximum annual plan rate. Under the Class A reimbursement distribution plan, costs exceeding the maximum for the current plan year cannot be reimbursed in subsequent periods. In addition, under the Fund’s Class C compensation distribution plan, the Fund pays Distributors for costs incurred in connection with the servicing, sale and distribution of the Fund’s shares up to the maximum annual plan rate. The plan year, for purposes of monitoring compliance with the maximum annual plan rates, is February 1 through January 31.
30 |
Annual Report |
franklintempleton.com |
FRANKLIN MUTUAL FINANCIAL SERVICES FUND
NOTES TO FINANCIAL STATEMENTS
The maximum annual plan rates, based on the average daily net assets, for each class, are as follows:
Class A | 0.35% | |||
Class C | 1.00% |
The Board has set the current rate at 0.25% per year for Class A shares until further notice and approval by the Board.
d. Sales Charges/Underwriting Agreements
Front-end sales charges and contingent deferred sales charges (CDSC) do not represent expenses of the Fund. These charges are deducted from the proceeds of sales of Fund shares prior to investment or from redemption proceeds prior to remittance, as applicable. Distributors has advised the Fund of the following commission transactions related to the sales and redemptions of the Fund’s shares for the year:
Sales charges retained net of commissions paid to unaffiliated brokers/dealers. | $ | 77,928 | ||
CDSC retained | $ | 10,781 |
Effective September 10, 2018, the Board approved changes to certainfront-end sales charges and dealer commissions on Class A shares. Further details are disclosed in the Fund’s Prospectus.
e. Transfer Agent Fees
Each class of shares pays transfer agent fees to Investor Services for its performance of shareholder servicing obligations. The fees are based on an annualized asset based fee of 0.02% plus a transaction based fee. In addition, each class reimburses Investor Services for out of pocket expenses incurred and, except for Class R6 reimburses shareholder servicing fees paid to third parties. These fees are allocated daily based upon their relative proportion of such classes’ aggregate net assets. Class R6 pays Investor Services transfer agent fees specific to that class.
For the year ended December 31, 2018, the Fund paid transfer agent fees of $953,102, of which $447,877 was retained by Investor Services.
f. Investments in Affiliated Management Investment Companies
The Fund invests in one or more affiliated management investment companies for purposes other than exercising a controlling influence over the management or policies. Management fees paid by the Fund are waived on assets invested in the affiliated management investment companies, as noted in the Statement of Operations, in an amount not to exceed the management and administrative fees paid directly or indirectly by each affiliate. During the year ended December 31, 2018, the Fund held investments in affiliated management investment companies as follows:
| Number of Shares Held at Beginning of Year | Gross Additions | Gross Reductions | Number of Shares Held at End of Year | Value at End of Year | Income from securities loaned | Realized Gain (Loss) | Net Change in Unrealized Appreciation (Depreciation) | |||||||||||||||||||||||||
Non-Controlled Affiliates | ||||||||||||||||||||||||||||||||
Institutional Fiduciary Trust Money Market Portfolio, | ||||||||||||||||||||||||||||||||
1.99% | — | 5,128,000 | (5,128,000 | ) | — | $ — | $2,684 | $ — | $ — | |||||||||||||||||||||||
|
| |||||||||||||||||||||||||||||||
g. Waiver and Expense Reimbursements
Investor Services has voluntarily agreed in advance to waive or limit its fees so that the Class R6 transfer agent fees do not exceed 0.03% based on the average net assets of the class. Investor Services may discontinue this waiver in the future. Prior to May 1, 2018, the Class R6 transfer agent fees were limited to 0.01%.
franklintempleton.com |
Annual Report |
31 |
FRANKLIN MUTUAL FINANCIAL SERVICES FUND
NOTES TO FINANCIAL STATEMENTS
4. Expense Offset Arrangement
The Fund has entered into an arrangement with its custodian whereby credits realized as a result of uninvested cash balances are used to reduce a portion of the Fund’s custodian expenses. During the year ended December 31, 2018, the custodian fees were reduced as noted in the Statement of Operations.
5. Independent Trustees’ Retirement Plan
On January 1, 1993, the Trust adopted an Independent Trustees’ Retirement Plan (Plan). The Plan is an unfunded defined benefit plan that provides benefit payments to Trustees whose length of service and retirement age meets the eligibility requirements of the Plan. Benefits under the Plan are based on years of service and fees paid to each trustee at the time of retirement. Effective in December 1996, the Plan was closed to new participants.
During the year ended December 31, 2018, the Fund’s projected benefit obligation and benefit payments under the Plan were as follows:
aProjected benefit obligation at December 31, 2018 | $ | 32,913 | ||
bIncrease in projected benefit obligation | $ | 9,731 | ||
Benefit payments made to retired trustees | $ | (725 | ) |
aThe projected benefit obligation is included in trustees’ fees and expenses in the Statement of Assets and Liabilities.
bThe increase in projected benefit obligation is included in trustees’ fees and expenses in the Statement of Operations.
6. Income Taxes
During the year ended December 31, 2018, the Fund utilized $7,872,500 of capital loss carryforwards.
For tax purposes, the Fund may elect to defer any portion of a post-October capital loss to the first day of the following fiscal year. At December 31, 2018, the Fund deferred post-October capital losses of $6,531,857.
The tax character of distributions paid during the years ended December 31, 2018 and 2017, was as follows:
| 2018 | 2017 | |||||||
Distributions paid from: | ||||||||
Ordinary income | $ | 3,323,724 | $ | 12,116,276 | ||||
Long term capital gain | 13,253,291 | — | ||||||
| $ | 16,577,015 | $ | 12,116,276 | |||||
At December 31, 2018, the cost of investments, net unrealized appreciation (depreciation) and undistributed ordinary income for income tax purposes were as follows:
Cost of investments | $ | 556,271,534 | ||
|
| |||
Unrealized appreciation | $ | 27,254,713 | ||
Unrealized depreciation | (94,691,962 | ) | ||
|
| |||
Net unrealized appreciation (depreciation) | $ | (67,437,249 | ) | |
|
| |||
Distributable earnings: | ||||
Undistributed ordinary income | $ | 192,288 | ||
|
| |||
Differences between income and/or capital gains as determined on a book basis and a tax basis are primarily due to differing treatments of foreign currency transactions and passive foreign investment company shares.
32 |
Annual Report |
franklintempleton.com |
FRANKLIN MUTUAL FINANCIAL SERVICES FUND
NOTES TO FINANCIAL STATEMENTS
The Fund utilized a tax accounting practice to treat a portion of the proceeds from capital shares redeemed as a distribution from realized capital gains.
7. Investment Transactions
Purchases and sales of investments (excluding short term securities) for the year ended December 31, 2018, aggregated $205,111,945 and $294,424,202, respectively.
8. Concentration of Risk
Investing in foreign securities may include certain risks and considerations not typically associated with investing in U.S. securities, such as fluctuating currency values and changing local and regional economic, political and social conditions, which may result in greater market volatility. Current political and financial uncertainty surrounding the European Union may increase market volatility and the economic risk of investing in securities in Europe. In addition, certain foreign securities may not be as liquid as U.S. securities.
9. Other Derivative Information
At December 31, 2018, the Fund’s investments in derivative contracts are reflected in the Statement of Assets and Liabilities as follows:
Asset Derivatives | Liability Derivatives | |||||||||||
| Derivative Contracts Not Accounted for as Hedging Instruments | Statement of Location | Fair Value | Statement of Location | Fair Value | ||||||||
Foreign exchange contracts | Variation margin on futures contracts | $ | 26,669 | a | Variation margin on futures contracts | $ | — | |||||
Unrealized appreciation on OTC forward exchange contracts | 2,695,554 | Unrealized depreciation on OTC forward exchange contracts | 1,123,197 | |||||||||
Totals | $ | 2,722,223 | $ | 1,123,197 | ||||||||
aThis amount reflects the cumulative appreciation (depreciation) of futures contracts as reported in the Statement of Investments. Only the variation margin receivable/ payable at year end is separately reported within the Statement of Assets and Liabilities. Prior variation margin movements were recorded to cash upon receipt or payment.
For the year ended December 31, 2018, the effect of derivative contracts in the Fund’s Statement of Operations was as follows:
| Derivative Contracts Not Accounted for as Hedging Instruments | Statement of Operations Location | Net Realized Gain (Loss) for the Year | Statement of Operations Location | Net Change in Unrealized Appreciation (Depreciation) for the Year | ||||||||
| Net realized gain (loss) from: | Net change in unrealized appreciation (depreciation) on: | |||||||||||
Foreign exchange contracts | Forward exchange contracts | $ 9,416,277 | Forward exchange contracts | $5,181,019 | ||||||||
| Futures contracts | 2,272,296 | Futures contracts | 554,851 | |||||||||
Totals | $11,688,573 | $5,735,870 | ||||||||||
For the year ended December 31, 2018, the average month end notional amount of futures contracts represented $37,368,458. The average month end contract value of forward exchange contracts was $252,184,801.
See Note 1(c) regarding derivative financial instruments.
franklintempleton.com |
Annual Report |
33 |
FRANKLIN MUTUAL FINANCIAL SERVICES FUND
NOTES TO FINANCIAL STATEMENTS
10. Holdings of 5% Voting Securities of Portfolio Companies
The 1940 Act defines “affiliated companies” to include investments in portfolio companies in which a fund owns 5% or more of the outstanding voting securities. During the year ended December 31, 2018, investments in “affiliated companies” were as follows:
| Name of Issuer | Number of Shares Held at Beginning of Year | Gross Additions | Gross Reductions | Number of Shares Held at End of Year | Value at End of Year | Dividend Income | Realized Gain (Loss) | Net Change in Unrealized Appreciation (Depreciation) | ||||||||||||||||||||||||
Non-Controlled Affiliates | ||||||||||||||||||||||||||||||||
AB&T Financial Corp. (Value is | 226,100 | — | — | 226,100 | $126,616 | $— | $— | $(2,261 | ) | |||||||||||||||||||||||
|
| |||||||||||||||||||||||||||||||
†Rounds to less than 0.1% of net assets.
11. Credit Facility
The Fund, together with other U.S. registered and foreign investment funds (collectively, Borrowers), managed by Franklin Templeton, are borrowers in a joint syndicated senior unsecured credit facility totaling $2 billion (Global Credit Facility) which matured on February 8, 2019. This Global Credit Facility provides a source of funds to the Borrowers for temporary and emergency purposes, including the ability to meet future unanticipated or unusually large redemption requests. Effective February 8, 2019, the Borrowers renewed the Global Credit Facility for a one year term, maturing February 7, 2020, for a total of $2 billion.
Under the terms of the Global Credit Facility, the Fund shall, in addition to interest charged on any borrowings made by the Fund and other costs incurred by the Fund, pay its share of fees and expenses incurred in connection with the implementation and maintenance of the Global Credit Facility, based upon its relative share of the aggregate net assets of all of the Borrowers, including an annual commitment fee of 0.15% based upon the unused portion of the Global Credit Facility. These fees are reflected in other expenses in the Statement of Operations. During the year ended December 31, 2018, the Fund did not use the Global Credit Facility.
12. Fair Value Measurements
The Fund follows a fair value hierarchy that distinguishes between market data obtained from independent sources (observable inputs) and the Fund’s own market assumptions (unobservable inputs). These inputs are used in determining the value of the Fund’s financial instruments and are summarized in the following fair value hierarchy:
| • | Level 1 – quoted prices in active markets for identical financial instruments |
| • | Level 2 – other significant observable inputs (including quoted prices for similar financial instruments, interest rates, prepayment speed, credit risk, etc.) |
| • | Level 3 – significant unobservable inputs (including the Fund’s own assumptions in determining the fair value of financial instruments) |
The input levels are not necessarily an indication of the risk or liquidity associated with financial instruments at that level.
34 |
Annual Report |
franklintempleton.com |
FRANKLIN MUTUAL FINANCIAL SERVICES FUND
NOTES TO FINANCIAL STATEMENTS
A summary of inputs used as of December 31, 2018, in valuing the Fund’s assets and liabilities carried at fair value, is as follows:
| Level 1 | Level 2 | Level 3 | Total | |||||||||||||
Assets: | ||||||||||||||||
Investments in Securities:a | ||||||||||||||||
Equity Investments: | ||||||||||||||||
Banks | $ | 148,266,841 | $ | 23,981,357 | $ | — | $ | 172,248,198 | ||||||||
Capital Markets. | 2,824,039 | 15,775,194 | — | 18,599,233 | ||||||||||||
Consumer Finance | 16,723,113 | 6,280,227 | — | 23,003,340 | ||||||||||||
All Other Equity Investments | 244,480,794 | — | — | 244,480,794 | ||||||||||||
Short Term Investments | 23,902,644 | 5,000,000 | — | 28,902,644 | ||||||||||||
|
| |||||||||||||||
Total Investments in Securities | $ | 436,197,431 | $ | 51,036,778 | $ | — | $ | 487,234,209 | ||||||||
|
| |||||||||||||||
Other Financial Instruments: | ||||||||||||||||
Futures Contracts | $ | 26,669 | $ | — | $ | — | $ | 26,669 | ||||||||
Forward Exchange Contracts | — | 2,695,554 | — | 2,695,554 | ||||||||||||
|
| |||||||||||||||
Total Other Financial Instruments | $ | 26,669 | $ | 2,695,554 | $ | — | $ | 2,722,223 | ||||||||
|
| |||||||||||||||
Liabilities: | ||||||||||||||||
Other Financial Instruments: | ||||||||||||||||
Forward Exchange Contracts | $ | — | $ | 1,123,197 | $ | — | $ | 1,123,197 | ||||||||
|
| |||||||||||||||
aFor detailed categories, see the accompanying Statement of Investments.
13. New Accounting Pronouncements
In August 2018, the Financial Accounting Standards Board issued Accounting Standards Update (ASU)No. 2018-14, Compensation—Retirement Benefits—Defined Benefit Plans—General (Subtopic715-20): Disclosure Framework—Changes to the Disclosure Requirements for Defined Benefit Plans. The amendments in the ASU modify the disclosure requirements for employers that sponsor defined benefit pension or other postretirement plans. The ASU is effective for annual reporting periods ending after December 15, 2020. Management is currently evaluating the impact, if any, of applying this provision.
14. Subsequent Events
The Fund has evaluated subsequent events through the issuance of the financial statements and determined that no events have occurred that require disclosure other than those already disclosed in the financial statements.
Abbreviations
| Counterparty | Currency | Selected Portfolio | ||||||||
| BOFA | Bank of America Corp. | EUR | Euro | FHLB | Federal Home Loan Bank | |||||
| BONY | The Bank of New York Mellon Corp. | GBP | British Pound | |||||||
| HSBK | HSBC Bank PLC | USD | United States Dollar | |||||||
| SSBT | State Street Bank and Trust Co., N.A. | |||||||||
| UBSW | UBS AG | |||||||||
franklintempleton.com |
Annual Report |
35 |
FRANKLIN MUTUAL FINANCIAL SERVICES FUND
Report of Independent Registered Public Accounting Firm
To the Board of Trustees of Franklin Mutual Series Funds and Shareholders of Franklin Mutual Financial Services Fund:
Opinion on the Financial Statements
We have audited the accompanying statement of assets and liabilities of Franklin Mutual Financial Services Fund (the “Fund”) (one of the funds constituting Franklin Mutual Series Funds), including the schedule of investments, as of December 31, 2018, and the related statement of operations for the year then ended, the statements of changes in net assets for each of the two years in the period then ended, the financial highlights for each of the five years in the period then ended and the related notes (collectively referred to as the “financial statements”). In our opinion, the financial statements present fairly, in all material respects, the financial position of Franklin Mutual Financial Services Fund (one of the funds constituting Franklin Mutual Series Funds) at December 31, 2018, the results of its operations for the year then ended, the changes in its net assets for each of the two years in the period then ended and its financial highlights for each of the five years in the period then ended, in conformity with U.S. generally accepted accounting principles.
Basis for Opinion
These financial statements are the responsibility of the Fund’s management. Our responsibility is to express an opinion on the Fund’s financial statements based on our audits. We are a public accounting firm registered with the Public Company Accounting Oversight Board (United States) (“PCAOB”) and are required to be independent with respect to the Fund in accordance with the U.S. federal securities laws and the applicable rules and regulations of the Securities and Exchange Commission and the PCAOB.
We conducted our audits in accordance with the standards of the PCAOB. Those standards require that we plan and perform the audit to obtain reasonable assurance about whether the financial statements are free of material misstatement, whether due to error or fraud. The Fund is not required to have, nor were we engaged to perform, an audit of the Fund’s internal control over financial reporting. As part of our audits, we are required to obtain an understanding of internal control over financial reporting, but not for the purpose of expressing an opinion on the effectiveness of the Fund’s internal control over financial reporting. Accordingly, we express no such opinion.
Our audits included performing procedures to assess the risks of material misstatement of the financial statements, whether due to error or fraud, and performing procedures that respond to those risks. Such procedures included examining, on a test basis, evidence regarding the amounts and disclosures in the financial statements. Our procedures included confirmation of securities owned as of December 31, 2018, by correspondence with the custodian and brokers or by other appropriate auditing procedures where replies from others were not received. Our audits also included evaluating the accounting principles used and significant estimates made by management, as well as evaluating the overall presentation of the financial statements. We believe that our audits provide a reasonable basis for our opinion.

We have served as the auditor of one or more Franklin investment companies since 1987.
Boston, Massachusetts
February 20, 2019
36 |
Annual Report |
franklintempleton.com |
FRANKLIN MUTUAL FINANCIAL SERVICES FUND
Under Section 852(b)(3)(C) of the Internal Revenue Code, the Fund hereby reports the maximum amount allowable but no less than $15,313,361 as a long term capital gain dividend for the fiscal year ended December 31, 2018.
Under Section 854(b)(1)(A) of the Internal Revenue Code, the Fund hereby reports 100.00% of the ordinary income dividends as income qualifying for the dividends received deduction for the fiscal year ended December 31, 2018.
Under Section 854(b)(1)(B) of the Internal Revenue Code, the Fund hereby reports the maximum amount allowable but no less than $15,851,747 as qualified dividends for purposes of the maximum rate under Section 1(h)(11) of the Internal Revenue Code for the fiscal year ended December 31, 2018. Distributions, including qualified dividend income, paid during calendar year 2018 will be reported to shareholders on Form1099-DIV bymid-February 2019. Shareholders are advised to check with their tax advisors for information on the treatment of these amounts on their individual income tax returns.
franklintempleton.com |
Annual Report |
37 |
FRANKLIN MUTUAL SERIES FUNDS
The name, year of birth and address of the officers and board members, as well as their affiliations, positions held with the Trust, principal occupations during at least the past five years and number of U.S. registered portfolios overseen in the Franklin Templeton Investments fund complex, are shown below. Generally, each board member serves until that person’s successor is elected and qualified.
Independent Board Members
Name, Year of Birth and Address
| Position
| Length of
| Number of Portfolios in
| Other Directorships Held During at Least the Past 5 Years
| ||||
Edward I. Altman, Ph.D. (1941) c/o Franklin Mutual Advisers, LLC 101 John F. Kennedy Parkway Short Hills, NJ 07078-2716 | Trustee | Since 1987 | 14 | None | ||||
Principal Occupation During at Least the Past 5 Years: | ||||||||
Max L. Heine Professor of Finance, Emeritus and Director of The Credit and Debt Markets Research Program, Salomon Center, Stern School of Business, New York University; editor and author of numerous financial publications; financial consultant; an adviser to numerous financial and publishing organizations; andformerly, Vice Director, Salomon Center, Stern School of Business, New York University.
| ||||||||
Ann Torre Bates (1958) c/o Franklin Mutual Advisers, LLC 101 John F. Kennedy Parkway Short Hills, NJ 07078-2716 | Trustee | Since 1995 | 38 | Ares Capital Corporation (specialty finance company) (2010-present), United Natural Foods, Inc. (distributor of natural, organic and specialty foods) (2013-present), Allied Capital Corporation (financial services) (2003-2010), SLM Corporation (Sallie Mae) (1997-2014) and Navient Corporation (loan management, servicing and asset recovery) (2014-2016). | ||||
Principal Occupation During at Least the Past 5 Years: | ||||||||
Director of various companies; andformerly, Executive Vice President and Chief Financial Officer, NHP Incorporated (manager of multifamily housing) (1995-1997); and Vice President and Treasurer, US Airways, Inc. (until 1995).
| ||||||||
Burton J. Greenwald (1929) c/o Franklin Mutual Advisers, LLC 101 John F. Kennedy Parkway Short Hills, NJ 07078-2716 | Trustee and Vice Chairman | Trustee since 2002 and Vice Chairman since 2015 | 14 | Franklin Templeton Emerging Markets Debt Opportunities Fund PLC (1999-present) and Fiduciary International Ireland Limited (1999-2015). | ||||
Principal Occupation During at Least the Past 5 Years: | ||||||||
Managing Director, B.J. Greenwald Associates (management consultants to the financial services industry); andformerly, Chairman, Fiduciary Trust International Funds; Executive Vice President, L.F. Rothschild Fund Management, Inc.; President and Director, Merit Mutual Funds; President, Underwriting Division and Director, National Securities & Research Corporation; Governor, Investment Company Institute; and Chairman, ICI Public Information Committee.
| ||||||||
Jan Hopkins Trachtman (1947) c/o Franklin Mutual Advisers, LLC 101 John F. Kennedy Parkway Short Hills, NJ 07078-2716 | Trustee | Since 2009 | 14 | FinTech Acquisition Corp. III (special purpose fintech acquisition company) (2018-present) | ||||
Principal Occupation During at Least the Past 5 Years: | ||||||||
President and Founder, The Jan Hopkins Group (communications consulting firm); serves on Advisory Board of Knight Bagehot Fellowship; andformerly, President, Economic Club of New York (2007-2015); Anchor/Correspondent, CNN Financial News (until 2003); Managing Director and Head of Client Communications, Citigroup Private Bank (until 2005);Off-Air reporter, ABC News’ World News Tonight; and Editor, CBS Network News.
| ||||||||
Keith Mitchell (1954) c/o Franklin Mutual Advisers, LLC 101 John F. Kennedy Parkway Short Hills, NJ 07078-2716 | Trustee | Since 2009 | 14 | None | ||||
Principal Occupation During at Least the Past 5 Years: | ||||||||
Director of various boards of asset management firms; andformerly, Managing Member, Mitchell, Hartley & Bechtel Advisers, LLC (formerly, Mitchell Advisers, LLC) (advisory firm) (2003-2015) and Managing Director, Putman Lovell NBF.
| ||||||||
38 |
Annual Report |
franklintempleton.com |
FRANKLIN MUTUAL SERIES FUNDS
Independent Board Members(continued)
Name, Year of Birth
| Position
| Length of
| Number of Portfolios in
| Other Directorships Held During
| ||||
David W. Niemiec (1949) c/o Franklin Mutual Advisers, LLC 101 John F. Kennedy Parkway Short Hills, NJ 07078-2716
|
Trustee |
Since 2015 |
38 |
Hess Midstream Partners LP (oil and gas midstream infrastructure) | ||||
| Principal Occupation During at Least the Past 5 Years: | ||||||||
Advisor, Saratoga Partners (private equity fund); andformerly, Managing Director, Saratoga Partners (1998-2001) and SBC Warburg Dillon Read (investment banking) (1997-1998); Vice Chairman, Dillon, Read & Co. Inc. (investment banking) (1991-1997); and Chief Financial Officer, Dillon, Read & Co. Inc. (1982-1997).
| ||||||||
Charles Rubens II (1930) c/o Franklin Mutual Advisers, LLC 101 John F. Kennedy Parkway Short Hills, NJ 07078-2716
|
Trustee |
Since 1998 |
14 |
None | ||||
| Principal Occupation During at Least the Past 5 Years: | ||||||||
Private investor and president ofnon-profit organizations; andformerly, an executive of Time, Inc.; and Trustee of Colorado College.
| ||||||||
Robert E. Wade (1946) c/o Franklin Mutual Advisers, LLC 101 John F. Kennedy Parkway Short Hills, NJ 07078-2716
|
Trustee and Chairman
|
Trustee since 1993 and Chairman of the Board since 2005
|
38 |
El Oro Ltd (investments) | ||||
| Principal Occupation During at Least the Past 5 Years: | ||||||||
Attorney at law engaged in private practice as a sole practitioner (1972-2008) and member of various boards.
| ||||||||
Gregory H. Williams (1943) c/o Franklin Mutual Advisers, LLC 101 John F. Kennedy Parkway Short Hills, NJ 07078-2716
|
Trustee |
Since 2015 |
14 |
None | ||||
| Principal Occupation During at Least the Past 5 Years: | ||||||||
Private investor; Consultant; andformerly, President, University of Cincinnati (2009-2012); President, The City College of New York (2001-2009); Dean, College of Law, Ohio State University (1993-2001); and Associate Vice President, Academic Affairs and Professor of Law, University of Iowa (1977-1993).
| ||||||||
Interested Board Members and Officers
Name, Year of Birth
| Position
| Length of
| Number of Portfolios in
| Other Directorships Held During
| ||||
**Gregory E. Johnson (1961) |
Trustee |
Since 2007 |
150 |
None | ||||
| One Franklin Parkway | ||||||||
San Mateo, CA 94403-1906
| ||||||||
| Principal Occupation During at Least the Past 5 Years: | ||||||||
Chairman of the Board, Member – Office of the Chairman, Director and Chief Executive Officer, Franklin Resources, Inc.; officer and/or director or trustee, as the case may be, of some of the other subsidiaries of Franklin Resources, Inc. and of 42 of the investment companies in Franklin Templeton Investments; Vice Chairman, Investment Company Institute; andformerly, President, Franklin Resources, Inc. (1994-2015).
| ||||||||
**Peter A. Langerman (1955) |
Trustee, |
Trustee since |
7 |
American International Group, Inc. | ||||
c/o Franklin Mutual Advisers, LLC 101 John F. Kennedy Parkway Short Hills, NJ 07078-2716 | President, and Chief Executive Officer – Investment Management | 2007, President, and Chief Executive Officer – Investment Management since 2005
| (AIG) Credit Facility Trust (2010-2011). | |||||
| Principal Occupation During at Least the Past 5 Years: | ||||||||
Chairman of the Board, Chief Executive Officer and President, Franklin Mutual Advisers, LLC; President and Chief Investment Officer, Franklin Advisory Services, LLC; and officer and/or director, as the case may be, of three of the investment companies in Franklin Templeton Investments.
| ||||||||
franklintempleton.com |
Annual Report |
39 |
FRANKLIN MUTUAL SERIES FUNDS
Interested Board Members and Officers(continued)
Name,Year of Birth and Address
| Position
| Length of Time Served
| Number of Portfolios in Fund Complex Overseen
| Other Directorships Held During
| ||||
Alison E. Baur (1964) |
Vice President |
Since 2012 |
Not Applicable |
Not Applicable | ||||
One Franklin Parkway San Mateo, CA 94403-1906 | ||||||||
Principal Occupation During at Least the Past 5 Years: | ||||||||
Deputy General Counsel, Franklin Templeton Investments; and officer of some of the other subsidiaries of Franklin Resources, Inc. and of 44 of the investment companies in Franklin Templeton Investments.
| ||||||||
Aliya S. Gordon (1973) |
Vice President |
Since 2009 |
Not Applicable |
Not Applicable | ||||
One Franklin Parkway San Mateo, CA 94403-1906 | ||||||||
Principal Occupation During at Least the Past 5 Years: | ||||||||
Senior Associate General Counsel, Franklin Templeton Investments; and officer of 44 of the investment companies in Franklin Templeton Investments.
| ||||||||
Steven J. Gray (1955) |
Vice President |
Vice President |
Not Applicable |
Not Applicable | ||||
One Franklin Parkway | and Secretary | since 2009 and | ||||||
San Mateo, CA 94403-1906 | Secretary | |||||||
| since 2005 | ||||||||
Principal Occupation During at Least the Past 5 Years: | ||||||||
Senior Associate General Counsel, Franklin Templeton Investments; Vice President, Franklin Templeton Distributors, Inc. and FASA, LLC; and officer of 44 of the investment companies in Franklin Templeton Investments.
| ||||||||
Matthew T. Hinkle (1971) |
Chief Executive |
Since 2017 |
Not Applicable |
Not Applicable | ||||
One Franklin Parkway | Officer – | |||||||
San Mateo, CA 94403-1906 | Finance and | |||||||
| Administration | ||||||||
Principal Occupation During at Least the Past 5 Years: | ||||||||
Senior Vice President, Franklin Templeton Services, LLC; officer of 44 of the investment companies in Franklin Templeton Investments; andformerly, Vice President, Global Tax (2012-April 2017) and Treasurer/Assistant Treasurer, Franklin Templeton Investments (2009-2017).
| ||||||||
Robert G. Kubilis (1973) |
Chief Financial |
Since 2012 |
Not Applicable |
Not Applicable | ||||
300 S.E. 2nd Street | Officer, | |||||||
Fort Lauderdale, FL 33301-1923 | Chief | |||||||
| Accounting | ||||||||
| Officer and | ||||||||
| Treasurer | ||||||||
Principal Occupation During at Least the Past 5 Years: | ||||||||
Treasurer, U.S. Fund Administration & Reporting, Franklin Templeton Investments; and officer of 16 of the investment companies in Franklin Templeton Investments.
| ||||||||
Robert Lim (1948) |
Vice President |
Since 2016 |
Not Applicable |
Not Applicable | ||||
One Franklin Parkway | – AML | |||||||
San Mateo, CA 94403-1906 | Compliance | |||||||
Principal Occupation During at Least the Past 5 Years: | ||||||||
Vice President, Franklin Templeton Companies, LLC; Chief Compliance Officer, Franklin Templeton Distributors, Inc. and Franklin Templeton Investor Services, LLC; and officer of 44 of the investment companies in Franklin Templeton Investments.
| ||||||||
Kimberly H. Novotny (1972) |
Vice President |
Since 2013 |
Not Applicable |
Not Applicable | ||||
300 S.E. 2nd Street | ||||||||
Fort Lauderdale, FL 33301-1923 | ||||||||
Principal Occupation During at Least the Past 5 Years: | ||||||||
| Associate General Counsel, Franklin Templeton Investments; Vice President and Corporate Secretary, Fiduciary Trust International of the South; Vice President, Templeton Investment Counsel, LLC; Assistant Secretary, Franklin Resources, Inc.; and officer of 44 of the investment companies in Franklin Templeton Investments. | ||||||||
40 |
Annual Report |
franklintempleton.com |
FRANKLIN MUTUAL SERIES FUNDS
Interested Board Members and Officers(continued)
Name, Year of Birth
| Position
| Length of
| Number of Portfolios in by Board Member*
| Other Directorships Held During
| ||||
Robert C. Rosselot (1960) |
Chief Compliance Officer |
Since 2013 |
Not Applicable |
Not Applicable | ||||
Principal Occupation During at Least the Past 5 Years: | ||||||||
Director, Global Compliance, Franklin Templeton Investments; Vice President, Franklin Templeton Companies, LLC; officer of 44 of the investment companies in Franklin Templeton Investments; andformerly, Senior Associate General Counsel, Franklin Templeton Investments (2007-2013); and Secretary and Vice President, Templeton Group of Funds (2004-2013).
| ||||||||
| Navid J. Tofigh (1972) One Franklin Parkway San Mateo, CA 94403-1906 | Vice President | Since 2015 | Not Applicable | Not Applicable | ||||
| Principal Occupation During at Least the Past 5 Years: | ||||||||
Associate General Counsel, Franklin Templeton Investments; and officer of 44 of the investment companies in Franklin Templeton Investments.
| ||||||||
| Craig S. Tyle (1960) One Franklin Parkway San Mateo, CA 94403-1906 | Vice President | Since 2005 | Not Applicable | Not Applicable | ||||
Principal Occupation During at Least the Past 5 Years: | ||||||||
General Counsel and Executive Vice President, Franklin Resources, Inc.; and officer of some of the other subsidiaries of Franklin Resources, Inc. and of 44 of the investment companies in Franklin Templeton Investments.
| ||||||||
| Lori A. Weber (1964) 300 S.E. 2nd Street Fort Lauderdale, FL 33301-1923 | Vice President | Since 2011 | Not Applicable | Not Applicable | ||||
| Principal Occupation During at Least the Past 5 Years: | ||||||||
Senior Associate General Counsel, Franklin Templeton Investments; Assistant Secretary, Franklin Resources, Inc.; Vice President and Secretary, Templeton Investment Counsel, LLC; and officer of 44 of the investment companies in Franklin Templeton Investments.
| ||||||||
franklintempleton.com |
Annual Report |
41 |
FRANKLIN MUTUAL SERIES FUNDS
*We base the number of portfolios on each separate series of the U.S. registered investment companies within the Franklin Templeton Investments fund complex. These portfolios have a common investment manager or affiliated investment managers.
**Gregory E. Johnson is considered to be an interested person of the Fund under the federal securities laws due to his position as an officer and director of Franklin Resources, Inc. (Resources), which is the parent company of the Fund’s investment manager and distributor. Peter A. Langerman is considered to be an interested person of the Fund under the federal securities laws due to his position as an officer of Franklin Mutual Advisers, LLC, which is the Fund’s investment manager.
Note 1: Officer information is current as of the date of this report. It is possible that after this date, information about officers may change.
The Sarbanes-Oxley Act of 2002 and Rules adopted by the U.S. Securities and Exchange Commission require the Fund to disclose whether the Fund’s Audit Committee includes at least one member who is an audit committee financial expert within the meaning of such Act and Rules. The Fund’s Board has determined that there is at least one such financial expert on the Audit Committee and has designated each of Edward I. Altman, Ph.D., Ann Torre Bates and David W. Niemiec as an audit committee financial expert. The Board believes that Messrs. Altman and Niemiec and Ms. Bates qualify as such an expert in view of their extensive business background and experience. Mr. Altman has served as a member of the Fund Audit Committee since 1987. He currently serves as a Max L. Hine Professor of Finance, Emeritus and Director of The Credit and Debt Markets Research Program, Salomon Center, Stern School of Business, New York University. Ms. Bates has served as a member of the Fund Audit Committee since 1995. She currently serves as a director of Ares Capital Corporation (2010-present) and United Natural Foods, Inc. (2013-present) and was formerly a director of Navient Corporation from 2014 to 2016, SLM Corporation from 1997 to 2014 and Allied Capital Corporation from 2003 to 2010, Executive Vice President and Chief Financial Officer of NHP Incorporated from 1995 to 1997 and Vice President and Treasurer of US Airways, Inc. until 1995. Mr. Niemiec has served as a member of the Fund Audit Committee since 2015, currently serves as an Advisor to Saratoga Partners and was formerly its Managing Director from 1998 to 2001 and serves as a director of Hess Midstream Partners LP (2017-present). Mr. Niemiec was formerly a director of Emeritus Corporation from 1999 to 2010 and OSI Pharmaceuticals, Inc. from 2006 to 2010, Managing Director of SBC Warburg Dillon Read from 1997 to 1998, and was Vice Chairman from 1991 to 1997 and Chief Financial Officer from 1982 to 1997 of Dillon, Read & Co. Inc. As a result of such background and experience, the Board believes that Messrs. Altman and Niemiec and Ms. Bates have each acquired an understanding of generally accepted accounting principles and financial statements, the general application of such principles in connection with the accounting estimates, accruals and reserves, and analyzing and evaluating financial statements that present a breadth and level of complexity of accounting issues generally comparable to those of the Fund, as well as an understanding of internal controls and procedures for financial reporting and an understanding of audit committee functions. Messrs. Altman and Niemiec and Ms. Bates are independent Board members as that term is defined under the applicable U.S. Securities and Exchange Commission Rules and Releases.
The Statement of Additional Information (SAI) includes additional information about the board members and is available, without charge, upon request. Shareholders may call (800) DIALBEN/342-5236 to request the SAI.
42 |
Annual Report |
franklintempleton.com |
FRANKLIN MUTUAL SERIES FUNDS
FRANKLIN MUTUAL FINANCIAL SERVICES FUND
Proxy Voting Policies and Procedures
The Fund’s investment manager has established Proxy Voting Policies and Procedures (Policies) that the Fund uses to determine how to vote proxies relating to portfolio securities. Shareholders may view the Fund’s complete Policies online at franklintempleton.com. Alternatively, shareholders may request copies of the Policies free of charge by calling the Proxy Group collect at (954)527-7678 or by sending a written request to: Franklin Templeton Companies, LLC, 300 S.E. 2nd Street, Fort Lauderdale, FL 33301, Attention: Proxy Group. Copies of the Fund’s proxy voting records are also made available online at franklintempleton.com and posted on the U.S. Securities and Exchange Commission’s website at sec.gov and reflect the most recent12-month period ended June 30.
Quarterly Statement of Investments
The Trust, on behalf of the Fund, files a complete statement of investments with the U.S. Securities and Exchange Commission for the first and third quarters for each fiscal year on FormN-Q.
Shareholders may view the filed FormN-Q by visiting the Commission’s website at sec.gov. The filed form may also be viewed and copied at the Commission’s Public Reference Room in Washington, DC. Information regarding the operations of the Public Reference Room may be obtained by calling(800) SEC-0330.
Householding of Reports and Prospectuses
You will receive the Fund’s financial reports every six months as well as an annual updated summary prospectus (prospectus available upon request). To reduce Fund expenses, we try to identify related shareholders in a household and send only one copy of the financial reports and summary prospectus. This process, called “householding,” will continue indefinitely unless you instruct us otherwise. If you prefer not to have these documents householded, please call us at (800)632-2301. At any time you may view current prospectuses/summary prospectuses and financial reports on our website. If you choose, you may receive these documents through electronic delivery.
franklintempleton.com |
Annual Report |
43 |
This page intentionally left blank.
 | Annual Report and Shareholder Letter Franklin Mutual Financial Services Fund
Investment Manager Franklin Mutual Advisers, LLC
Distributor Franklin Templeton Distributors, Inc. (800) DIAL BEN®/342-5236 franklintempleton.com
Shareholder Services (800)632-2301 - (Class A, C & R6) (800)448-FUND - (Class Z) | |||
Authorized for distribution only when accompanied or preceded by a summary prospectus and/or prospectus. Investors should carefully consider a fund’s investment goals, risks, charges and expenses before investing. A prospectus contains this and other information; please read it carefully before investing.
To help ensure we provide you with quality service, all calls to and from our service areas are monitored and/or recorded. | ||||
| © 2019 Franklin Templeton Investments. All rights reserved. | 479 A 02/19 | |||
| Annual Report and Shareholder Letter
December 31, 2018 |

Internet Delivery of Fund Reports Unless You Request Paper Copies:Effective January 1, 2021, as permitted by the SEC, paper copies of the Fund’s shareholder reports will no longer be sent by mail, unless you specifically request them from the Fund or your financial intermediary. Instead, the reports will be made available on a website, and you will be notified by mail each time a report is posted and provided with a website link to access the report.
If you already elected to receive shareholder reports electronically, you will not be affected by this change and you need not take any action. If you have not signed up for electronic delivery, we would encourage you to join fellow shareholders who have. You may elect to receive shareholder reports and other communications electronically from the Fund by calling(800) 632-2301 or by contacting your financial intermediary.
You may elect to continue to receive paper copies of all your future shareholder reports free of charge by contacting your financial intermediary or, if you invest directly with a Fund, calling (800)632-2301 to let the Fund know of your request. Your election to receive reports in paper will apply to all funds held in your account.
Franklin Templeton
Successful investing begins with ambition. And achievement only comes when you reach for it. That’s why we continually strive to deliver better outcomes for investors. No matter what your goals are, our deep, global investment expertise allows us to offer solutions that can help.
During our more than 70 years of experience, we’ve managed through all kinds of markets—up, down and those in between. We’re always preparing for what may come next. It’s because of this, combined with our strength as one of the world’s largest asset managers that we’ve earned the trust of millions of investors around the world.
Dear Franklin Mutual International Fund Shareholder:
Investors started 2018 seemingly with the wind at their back. The primary tailwinds were strong corporate earnings growth in most developed markets, healthy consumer and business investment spending, and the positive effect of major U.S. tax cuts. In addition, the global economy continued its steady expansion since the financial crisis of 2008–2009. Unemployment continued to decline in the U.S. and other developed markets, while U.S. wage growth showed some signs of accelerating. As a result, equity markets reached new highs. However, volatility and market downturns soon made their mark on 2018. As measured by the EURO STOXX 50® Volatility (VSTOXX) Index and the Chicago Board Options Exchange Volatility Index (VIX), volatility surged in February 2018 and moved higher again in October and December. U.S. trade tensions with Europe and China, a slowdown in China’s economic growth, the possibility of Brexit without an agreement and a growing belief that corporate earnings and economic growth will likely decelerate in 2019 hindered equity markets. A flattening U.S. Treasury yield curve, wider credit spreads and growing market concern that the U.S. Federal Reserve may raise interest rates too quickly were also important drivers of market turbulence. For the period ended December 31, 2018, U.S. stocks, as measured by the Standard & Poor’s® 500 Index (S&P 500®), had a-4.38% total return.1 Stocks in global developed markets, as measured by the MSCI World Index (USD), had a-8.20% total return, while investment-grade bonds, as measured by the Bloomberg Barclays Global Aggregate Bond Index, had a-1.20% total return.1
While equity markets were broadly down for the year, there were pockets of positive performance concentrated in areas of growth and innovation, such as software, information technology services and segments of the health care sector. It is no surprise, therefore, that growth stocks managed to perform better than value stocks during the period. The MSCI World Growth Index (USD) had a-6.42% total return, while the MSCI World Value Index (USD) had a-10.09% total return.1
The return of volatility is an appropriate reminder that securities markets are dynamic. We believe active, professional investment management serves investors well since market volatility is more the norm than uninterrupted positive returns. Valuation is an essential factor in our analysis and we always ask ourselves if current and potential investments represent an attractive balance of risk and reward. We remain committed to abottom-up stock-picking process that is disciplined and driven by rigorous fundamental analysis that attempts to limit downside risk. In our view, investing in underappreciated and misunderstood companies with identifiable catalysts for unlocking shareholder value can offer meaningful upside potential as well as a degree of downside protection.
We also recognize the important role of financial advisors in today’s markets and encourage investors to continue to seek their advice. Amid changing markets and economic conditions, we are confident investors with a well-diversified portfolio and a patient, long-term outlook will be well positioned for the years ahead.
1. Source: Morningstar.
See www.franklintempletondatasources.com for additional data provider information.
| Not FDIC Insured | | | May Lose Value | | | No Bank Guarantee |
franklintempleton.com |
Not part of the annual report |
1 |
On the following pages, the Fund’s portfolio management team reviews investment decisions that pertain to performance during the past 12 months in light of the economic environment and other factors. Please remember all securities markets fluctuate, as do mutual fund share prices.
We thank you for investing with Franklin Templeton, welcome your questions and comments, and look forward to continuing to serve your investment needs in the years ahead.
Sincerely,

Peter A. Langerman
Chairman, President and Chief Executive Officer
Franklin Mutual Advisers, LLC
This letter reflects our analysis and opinions as of December 31, 2018, unless otherwise indicated. The information is not a complete analysis of every aspect of any market, country, industry, security or fund. Statements of fact are from sources considered reliable.
Visitfranklintempleton.comfor fund updates, to access your account, or to find helpful financial planning tools.
2 |
Not part of the annual report |
franklintempleton.com |
Annual Report
Franklin Mutual International Fund
This annual report for Franklin Mutual International Fund covers the fiscal year ended December 31, 2018.
Your Fund’s Goal and Main Investments
The Fund seeks capital appreciation, which may occasionally be short term, with income as a secondary goal. Under normal market conditions, the Fund invests at least 80% of its net assets in securities ofnon-U.S. issuers, primarily Asian and European companies. The investment manager focuses the Fund’s investments on securities believed to be available at market prices less than their intrinsic value. The equity securities in which the Fund invests are primarily common stocks, with a current focus onmid- andlarge-cap companies. To a lesser extent, the Fund also invests in merger arbitrage securities and the debt and equity of distressed companies. The Geographic Composition bar chart on page 4 lists the leading countries where the Fund invests.
Performance Overview
The Fund’s Class Z shares had a-17.52% cumulative total return for the 12 months ended December 31, 2018. In comparison, the Fund’s benchmark, the MSCI All Country World Index (ACWI) ex USA Net Return (Local Currency), which is a free float-adjusted,1 market capitalization-weighted index designed to measure equity market performance in global developed and emerging markets, had a-10.65% total return.2 Also for comparison, the Fund’s secondary benchmark, the MSCI ACWI ex USA Net Return (USD) had a-14.20% total return.2 You can find more of the Fund’s performance data in the Performance Summary beginning on page 9.
Performance data represent past performance, which does not guarantee future results. Investment return and principal value will fluctuate, and you may have a gain or loss when you sell your shares. Current performance may differ from figures shown. For most recentmonth-end performance, go tofranklintempleton.comor call(800) 342-5236.
Economic and Market Overview
The global economy expanded during the 12 months under review, despite weakness in certain regions. Global developed and emerging market stocks were aided at certain points during the period by higher crude oil prices, upbeat economic data, easing trade tensions and encouraging corporate earnings reports, as well as indications of a slower pace of interest-rate increases from the U.S. Federal Reserve (Fed).
However, various factors weighed on global markets during the period, including concerns about tighter regulation of technology companies, political uncertainties in the U.S. and the European Union, and major central banks’ interest-rate path and unwinding of monetary stimulus measures. Markets were further pressured by U.S. trade disputes with its allies and China, and their impact on global growth and corporate earnings. In this environment, global stocks, as measured by the MSCI All Country World Index (USD), had a-8.93% total return for the 12 months ended December 31, 2018.2
The U.S. economy grew during the12-month period. After moderating for three consecutive quarters, the economy grew faster in 2018’s second quarter, driven by consumer spending, business investment, exports and government spending. However, growth moderated in the third quarter due to declines in exports and housing investment. The unemployment rate declined from 4.1% in December 2017 to 3.9% atperiod-end.3 Annual inflation, as measured by the Consumer Price Index, decreased from 2.1% in December 2017 to 1.9% atperiod-end.3 The Fed raised its target range for the federal funds rate four times during the period, to 2.25%–2.50%, and
1. A “free float-adjusted” index means that companies with larger proportions of their shares being actively traded, rather than being held by company insiders, governments or cross held by other companies, receive higher weightings within the index.
2. Source: Morningstar.
The indexes are unmanaged and include reinvestment of any income or distributions. They do not reflect any fees, expenses or sales charges. One cannot invest directly in an index, and an index is not representative of the Fund’s portfolio.
3. Source: U.S. Bureau of Labor Statistics.
The dollar value, number of shares or principal amount, and names of all portfolio holdings are listed in the Fund’s Statement of Investments (SOI). The SOI begins on page 18.
franklintempleton.com | Annual Report | 3 | ||||
FRANKLIN MUTUAL INTERNATIONAL FUND
continued reducing its balance sheet as part of an ongoing plan to normalize monetary policy. At its December meeting, the Fed reduced the projected 2019 rate increases to two, compared to three projected previously.
In Europe, the U.K.’s quarterly economic growth moderated in 2018’s first quarter, but accelerated in 2018’s second and third quarters. The Bank of England raised its key policy rate once during the review period. After moderating in 2018’s first quarter, the eurozone’s quarterly growth remained stable in the second quarter, but eased in the third quarter. The bloc’s annual inflation rate ended the period higher than in December 2017. The European Central Bank (ECB) kept its benchmark interest rate unchanged during the period. In December 2018, the ECB confirmed its plan to conclude its bond purchase program at the end of 2018 and reiterated it expects key interest rates to remain unchanged through the summer of 2019.
In Asia, Japan’s quarterly gross domestic product (GDP) grew in 2018’s second quarter, following a contraction in the first quarter, but contracted again in the third quarter. The Bank of Japan left its benchmark interest rate unchanged during the period and continued its monetary stimulus measures.
In emerging markets, Brazil’s quarterly GDP growth remained stable in 2018’s first and second quarters, but accelerated in the third quarter. The Central Bank of Brazil lowered its benchmark interest rate twice during the period. Russia’s annual GDP growth rate accelerated in 2018’s first and second quarters, but moderated in the third quarter. After lowering its key rate twice early in the period, the Bank of Russia raised it twice in the period’s second half to curtail inflation risks. China’s annual GDP grew at a stable rate in 2018’s first quarter, but it moderated in the second and third quarters. The People’s Bank of China left its benchmark interest rate unchanged during the period, but it took measures to improve financial liquidity to mitigate the negative effects of the U.S.-China trade dispute and support economic growth. Overall, emerging market stocks, as measured by the MSCI Emerging Markets Index, had a-14.25% total return during the period.2
Investment Strategy
At Franklin Mutual Series, we are committed to our distinctive value approach to investing, which we believe can generate above-average risk-adjusted returns over time for our shareholders. Our major investment strategy is investing in undervalued stocks in Asia and Europe. We have the ability to invest in emerging markets, although this is unlikely to be a significant focus of our strategy. When selecting undervalued equities, we are attracted to what we believe are fundamentally
Geographic Composition*
Based on Total Net Assets as of 12/31/18
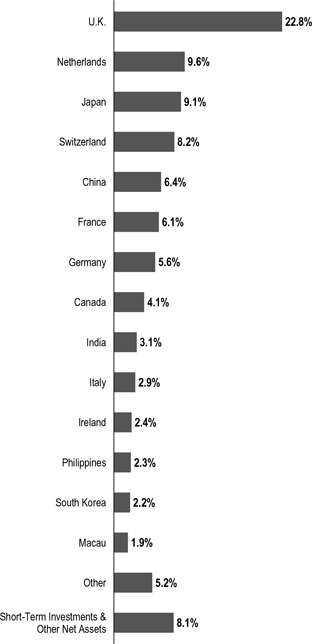
*Figures are stated as a percentage of total and may not equal 100% or may be negative due to rounding, use of any derivatives, unsettled trades or other factors.
strong companies with healthy balance sheets, high-quality assets, substantial free cash flow and shareholder-oriented management teams and whose stocks are trading at discounts to our assessment of the companies’ intrinsic or business value. We also look for asset-rich companies whose shares may be trading at depressed levels due to concerns over short-term earnings disappointments, litigation, management strategy or other perceived negatives. This strict value approach is not only intended to improve the likelihood of upside potential, but also
4 |
Annual Report |
franklintempleton.com |
FRANKLIN MUTUAL INTERNATIONAL FUND
reduces the risk of substantial declines, in our opinion. While the vast majority of our undervalued equity investments are made in publicly traded companies internationally, we may invest occasionally in privately held companies as well.
To a significantly lesser extent, we complement this more traditional investment strategy with two others. One is distressed investing, a highly specialized field that has proven quite profitable during certain periods over the years. Distressed investing is complex and can take many forms. The most common distressed investment the Fund undertakes is the purchase of financially troubled or bankrupt companies’ debt at a substantial discount to face value. After the financially distressed company is reorganized, the old debt is typically replaced with new securities issued by the financially stronger company.
The other piece of our investment strategy is participating in arbitrage situations, another highly specialized field. When companies announce proposed mergers or takeovers, commonly referred to as “deals,” the target company may trade at a discount to the bid it ultimately accepts. One form of arbitrage involves purchasing the target company’s stock when it is trading below the value we believe it would receive in a deal. In keeping with our commitment to a relatively conservative investment approach, we typically focus our arbitrage efforts on announced deals, and avoid rumored deals or other situations we consider relatively risky. In addition, it is our practice to hedge the Fund’s currency exposure when we deem it advantageous for our shareholders.
What is meant by "hedge"?
To hedge an investment is to take a position intended to offset potential losses/gains that may be incurred by a companion financial instrument.
|
Manager’s Discussion
In 2018, corporate profits in the U.S. and other developed markets continued their impressive year-over-year growth. In addition, labor markets showed further improvement, consumer spending was solid, and U.S. corporate tax reforms encouraged companies to buy back more stock, raise dividends and increase capital expenditures. Those positive fundamentals were periodically overshadowed by political and economic concerns, particularly in the final three months of the year.
As major U.S. equity markets established newall-time highs in 2018, overall U.S. equity market valuations (e.g.,price-to-earnings,price-to-book orprice-to-sales) became increasingly unattractive, in our analysis. The equity market
Top 10 Sectors/Industries
Based on Equity Securities as of 12/31/18
| % of Total Net Assets | ||||
| Insurance | 17.2% | |||
| Banks | 11.6% | |||
| Oil, Gas & Consumable Fuels | 9.5% | |||
| Pharmaceuticals | 6.4% | |||
| Semiconductors & Semiconductor Equipment | 4.1% | |||
| Automobiles | 3.6% | |||
| Capital Markets | 3.5% | |||
| Hotels, Restaurants & Leisure | 3.5% | |||
| Interactive Media & Services | 3.1% | |||
| Auto Components | 2.8% | |||
sell-off in the fourth quarter helped to return valuations to more reasonable levels. Thesell-off and rise in volatility yielded an opportunity for us to seek out stocks with strong corporate fundamentals and valuations whose risk/reward profiles seemed to us to have become more favorable.
In 2019, policy events may have considerable influence, for better or worse, on economic growth, investor sentiment and financial market performance and volatility. Markets are likely to be particularly sensitive to developments in U.S.-China trade relations, monetary policy moves by the Fed and other major central banks, oil production decisions by OPEC (The Organization of the Petroleum Exporting Countries) and other oil producing countries, the outcome of Brexit, China’s response to its slowing economy and potential political discord in Washington, D.C.
Europe’s equity market overall was trading at an attractively lowerprice-to-earnings multiple and higher dividend yield than the U.S. equity market atperiod-end. We also saw an increase in investor activism, which we viewed as encouraging. However, those favorable factors were offset in part by economic data, which showed increased slowing of economic activity across the region. From an investment standpoint, we are hopeful that 2019 will be a year of potential resolution and clarity. The biggest political event will likely be Brexit, as a resolution to the situation remained unclear as ofperiod-end. The uncertainty around the terms and timing of a deal continued to undermine consumer and corporate confidence. From our perspective, we believe the European Union and the U.K. will ultimately reach an agreement that makes sense for both sides, and we believe the approval of such an agreement would likely have a significantly positive effect on investor, consumer and corporate sentiment in the U.K. We will also pay close attention to structural reform efforts in France, policy decisions from a populist coalition government in Italy and the
franklintempleton.com |
|
Annual Report |
5 |
FRANKLIN MUTUAL INTERNATIONAL FUND
political transition in Germany. In December, Chancellor Angela Merkel stepped down as leader of the Christian Democratic Union but stated her intention to remain in office for the remaining three years of her term as Chancellor.
In Asia, economic and financial market weakness in China has been brought on by multiple factors. The U.S.-China trade conflict has disrupted manufacturing activity and supply chains. As trade tensions escalated in 2018, manufacturers accelerated production in order to avoid upcoming tariffs. Atyear-end, supply chains were filled with inventory, while manufacturing activity was weak. Entering 2019, the near-term question is how long the inventory overhang will last, while the more significant question is to what extent the trade conflict will alter supply chains in the medium to long term. Amid the trade conflict, China has proven resolute in its attempt to dampen the reliance on leverage, which has hindered economic activity as well. While the government has enacted some stimulus measures, such as tax cuts, they may be less impactful than prior stimulus through fiscal spending. Meanwhile, government social policies impacting personal freedoms have had a negative effect on consumer sentiment.
Investment Spotlight
The insurance industry has been an area of significant interest for Mutual Series since the Great Recession. The Top 10 Sectors/Industries table on page 5 lists insurance and also other leading industries in which the Fund currently invests. We were able to find quality insurers trading at discounts to our estimate of intrinsic value during the post-crisis period of financial services recapitalization, followed by the restructuring of the financial services industry in Europe, and finally capital rationalization in the U.S. financials sector. During the past 10 years, insurance industry trends have provided investment opportunities for value investors. The Mutual Series investment process focuses on finding companies trading below our estimate of intrinsic value and with potential catalysts for value creation. With interest rates at secular low levels, insurers have focused on operational efficiencies, cash flow from underwriting, and rational capital structures to maintain acceptable profitability. Life insurance businesses have mainly focused on improving returns through cost savings and capital rationalization, while property casualty businesses have emphasized better underwriting and capital management.
After several years of equity market outperformance, insurers were hurt by increased natural catastrophe losses around the
| Top 10 Equity Holdings | ||||
| 12/31/18 | ||||
Company Sector/Industry, Country | % of Total Net Assets | |||
Novartis AG | 3.5% | |||
| Pharmaceuticals, Switzerland | ||||
NN Group NV | 2.9% | |||
| Insurance, Netherlands | ||||
GlaxoSmithKline PLC | 2.9% | |||
| Pharmaceuticals, U.K. | ||||
Sabre Insurance Group PLC | 2.5% | |||
| Insurance, U.K. | ||||
BE Semiconductor Industries NV | 2.3% | |||
| Semiconductors & Semiconductor Equipment, Netherlands | ||||
Metro Pacific Investments Corp. | 2.3% | |||
| Diversified Financial Services, Philippines | ||||
BP PLC | 2.2% | |||
| Oil, Gas & Consumable Fuels, U.K. | ||||
Indiabulls Housing Finance Ltd. | 2.2% | |||
| Thrifts & Mortgage Finance, India | ||||
Samsung Electronics Co. Ltd. | 2.2% | |||
Technology Hardware, Storage & Peripherals, South Korea | ||||
Shinsei Bank Ltd. | 2.2% | |||
| Banks, Japan | ||||
globe in both 2017 and 2018, jitters regarding global economic growth prospects and a widening of credit spreads. Despite these headwinds, we think valuations atyear-end remained attractive, and our holdings have idiosyncratic catalysts that provide attractive return potential. In addition, the large natural catastrophe losses suffered by property and casualty insurers should present an opportunity for them to increase premiums as they adjust risk profiles.
Mutual Series has owned the Netherlands-based NN Group since its 2014 initial public offering (IPO). NN Group was spun out of ING Groep4 and consists of life insurance, other insurance and asset management operations in Europe and Japan. The initial investment case revolved around the rationalization of capital and cost efficiencies. In 2017, NN Group acquired Dutch insurer Delta Lloyd at an attractive internal rate of return with the potential for significant synergies from the combined company. Since the IPO, the company has returned a significant amount of capital to shareholders and lowered expenses, while maintaining one of the strongest balance sheets in the industry. We expect additional progress on the integration of Delta Lloyd to
4. Not a Fund holding.
| 6 |
Annual Report | franklintempleton.com | ||
FRANKLIN MUTUAL INTERNATIONAL FUND
generate increased cash flow in the future. NN Group is listed among the Fund’s largest positions in the Top 10 Equity Holdings table on page 6.
Fund Performance
Turning to Fund performance, top positive contributors included Japan-based petroleum refiner JXTG Holdings, Netherlands-based Royal Philips5 and global insurer XL Group.
JXTG Holdings, the largest refiner in Japan, benefited from refining industry consolidation in the country. Its profit significantly increased year-over-year, largely driven by a higher refining margin due to a more disciplined industry. Moreover, JXTG became more capital disciplined, and increased dividends and share buybacks. We exited the position in September 2018.
Koninklijke Philips5 is near the end of its restructuring efforts. In line with our initial investment thesis, the company has almost fully pivoted its business model from being an industrial conglomerate to becoming a focused health care technology company. In April 2018, Philips reported better-than-expected results, particularly strong order growth overall and sales growth within its diagnostics and treatment business. The positive results increased our confidence in management’s ability to deliver on its long-term strategy and targets.
Shares of XL Group, a global insurance and reinsurance company, rallied in early 2018, aided by generally upbeat quarterly results. We exited the position in March, following the announcement of XL Group’s acquisition by AXA4, another global insurer, at a substantial premium to XL Group’s closing price prior to the announcement.
During the period under review, Fund investments that detracted from performance included Japan-based semiconductor manufacturer Renesas Electronics, Canada-based exploration and production company Crescent Point Energy and U.S.-based tire company Toyo Tire.
Renesas Electronics is a Japan-based manufacturer of semiconductors for the automotive, industrial and communication markets. In 2016, an earthquake in Japan caused a chip shortage in the supply chain. Production subsequently accelerated in 2017, as customers double ordered and did not adjust quickly enough to the eventual drop off in demand, leading to excess inventories. In 2018, production and capacity utilization remained below optimal levels, as Renesas
continued to reduce inventories. In addition, investors reacted negatively to Renesas’ announced purchase of Integrated Devices Technology (IDT) at a nearly 30% premium to IDT’s price before the announcement. While the deal weakens Renesas’ balance sheet, we believed the transaction made strategic sense given IDT’s complementary product portfolio and cross-selling opportunities in the long run.
Crescent Point Energy has significant exposure to oil production and its shares generally followed lower oil prices during the latter stages of 2018 despite some positive changes at the company. The company hired a new chief executive officer and had some changes to the executive team and the board of directors. The new management team launched a strategic plan targeting cost reduction, asset sales, a stronger balance sheet and better capital allocation, which we believe are the right things to focus on. So far, Crescent Point’s new management team delivered solid third-quarter results with good progress on its cost reduction program, which we believe will help build credibility. If management continues to follow through on its strategic plan, we believe the stock’s deep valuation discount versus peers may narrow.
Toyo Tire is a niche tire company with a focus on large, specialty tires for sports utility vehicles (SUVs) and pickup trucks in the U.S. A lower share price in the first half of 2018 was driven by exchange rate headwinds, larger losses at itsnon-core auto parts business and investor pessimism toward the tire industry. However, Toyo’s main tire business performed satisfactorily due to its favorable exposure to specialty tires. Shares slid further in the fourth quarter, as management unexpectedly announced a private placement of 21% of new shares to Mitsubishi4. While management stated the deal would enable closer cooperation, we believed management did not provide concrete synergies or economic rationale to offset the substantial dilution suffered by existing shareholders. The deal also reflected poorly on corporate governance. We expressed our concerns to Toyo’s management and made our concerns public.
During the period, the Fund held currency forwards and futures seeking to hedge most of the currency risk of the portfolio’snon-U.S. dollar investments. The hedges had a positive overall impact on the Fund’s performance because of the appreciation of the U.S. dollar versus the hedged currencies.
5. Not held atperiod-end.
See www.franklintempletondatasources.com for additional data provider information.
franklintempleton.com | Annual Report | 7 | ||||
FRANKLIN MUTUAL INTERNATIONAL FUND
What is a currency forward?
A currency forward is a direct agreement between the Fund and a counterparty to buy or sell a foreign currency in exchange for another currency at a specific exchange rate on a future date.
|
What is a future?
A future is an agreement between the Fund and a counterparty made through a U.S. or foreign futures exchange to buy or sell an underlying instrument or asset at a specific price on a future date.
|
As fellow shareholders, we found recent relative and absolute performance disappointing, but it is not uncommon for our strategy to lag the equity markets at times. We remain committed to our disciplined, value investment approach as we seek to generate attractive, long-term, risk-adjusted returns for shareholders.
Thank you for your participation in Franklin Mutual International Fund. We look forward to continuing to serve your investment needs.
 |  | |
Andrew Sleeman, CFA Co-Portfolio Manager |
 |  | |
Timothy Rankin, CFA Co-Portfolio Manager |
The foregoing information reflects our analysis, opinions and portfolio holdings as of December 31, 2018, the end of the reporting period. The way we implement our main investment strategies and the resulting portfolio holdings may change depending on factors such as market and economic conditions. These opinions may not be relied upon as investment advice or an offer for a particular security. The information is not a complete analysis of every aspect of any market, country, industry, security or the Fund. Statements of fact are from sources considered reliable, but the investment manager makes no representation or warranty as to their completeness or accuracy. Although historical performance is no guarantee of future results, these insights may help you understand our investment management philosophy.
CFA® is a trademark owned by CFA Institute.
| 8 |
Annual Report | franklintempleton.com | ||
FRANKLIN MUTUAL INTERNATIONAL FUND
Performance Summary as of December 31, 2018
The performance table and graphs do not reflect any taxes that a shareholder would pay on Fund dividends, capital gain distributions, if any, or any realized gains on the sale of Fund shares. Total return reflects reinvestment of the Fund’s dividends and capital gain distributions, if any, and any unrealized gains or losses. Your dividend income will vary depending on dividends or interest paid by securities in the Fund’s portfolio, adjusted for operating expenses of each class. Capital gain distributions are net profits realized from the sale of portfolio securities.
Performance as of 12/31/181
Cumulative total return excludes sales charges. Average annual total return includes maximum sales charges. Sales charges will vary depending on the size of the investment and the class of share purchased. The maximum is 5.50% and the minimum is 0%.Class A:5.50% maximum initial sales charge. For other share classes, visitfranklintempleton.com.
| Share Class | | Cumulative Total Return2 | | | Average Annual Total Return | 3 | ||
| ||||||||
| Z | ||||||||
1-Year | -17.52% | -17.52% | ||||||
| ||||||||
5-Year | -4.29% | -0.87% | ||||||
| ||||||||
Since Inception (5/1/09) | +75.09% | +5.96% | ||||||
| ||||||||
| A4 | ||||||||
1-Year | -17.73% | -22.23% | ||||||
| ||||||||
5-Year | -5.56% | -2.25% | ||||||
| ||||||||
Since Inception (5/1/09) | +70.38% | +5.05% | ||||||
| ||||||||
Performance data represent past performance, which does not guarantee future results. Investment return and principal value will fluctuate, and you may have a gain or loss when you sell your shares. Current performance may differ from figures shown. For most recentmonth-end performance, go tofranklintempleton.comor call(800)342-5236.
See page 11 for Performance Summary footnotes.
franklintempleton.com | Annual Report | 9 | ||||
FRANKLIN MUTUAL INTERNATIONAL FUND
PERFORMANCE SUMMARY
Total Return Index Comparison for a Hypothetical $10,000 Investment1
Total return represents the change in value of an investment over the periods shown. It includes any applicable maximum sales charge, Fund expenses, account fees and reinvested distributions. The unmanaged indexes include reinvestment of any income or distributions. They differ from the Fund in composition and do not pay management fees or expenses. One cannot invest directly in an index.
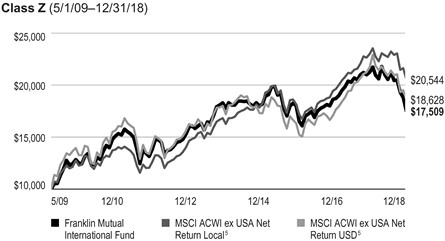

See page 11 for Performance Summary footnotes.
| 10 |
Annual Report | franklintempleton.com | ||
FRANKLIN MUTUAL INTERNATIONAL FUND
PERFORMANCE SUMMARY
Distributions(1/1/18–12/31/18)
| Share Class | Net Investment Income | Long-Term Capital Gain | Total | |||||||||
Z | $0.2518 | $0.0922 | $0.3440 | |||||||||
A | $0.2117 | $0.0922 | $0.3039 | |||||||||
C | $0.0359 | $0.0922 | $0.1281 | |||||||||
R | $0.1815 | $0.0922 | $0.2737 | |||||||||
R6 | $0.2798 | $0.0922 | $0.3720 | |||||||||
Total Annual Operating Expenses6
| Share Class | With Fee Waiver | Without Fee Waiver | ||||||||||
Z | 0.97% | 1.17% | ||||||||||
A | 1.22% | 1.42% | ||||||||||
Each class of shares is available to certain eligible investors and has different annual fees and expenses, as described in the prospectus.
All investments involve risks, including possible loss of principal. Value securities may not increase in price as anticipated or may decline further in value. Special risks are associated with foreign investing, including currency fluctuations, economic instability and political developments; investments in emerging markets involve heightened risks related to the same factors. Because the Fund may invest its assets in companies in a specific region, including Europe, it is subject to greater risks of adverse developments in that region and/or the surrounding regions than a fund that is more broadly diversified geographically. Current political and financial uncertainty surrounding the European Union may increase market volatility and the economic risk of investing in companies in Europe. Smaller-company stocks have exhibited greater price volatility than larger-company stocks, particularly over the short term. The Fund’s investments in companies engaged in mergers, reorganizations or liquidations also involve special risks as pending deals may not be completed on time or on favorable terms. The Fund may invest in lower-rated bonds, which entail higher credit risk. The Fund is actively managed but there is no guarantee that the manager’s investment decisions will produce the desired results. The Fund’s prospectus also includes a description of the main investment risks.
1. The Fund has an expense reduction contractually guaranteed through 4/30/19. Fund investment results reflect the expense reduction; without this reduction, the results would have been lower.
2. Cumulative total return represents the change in value of an investment over the periods indicated.
3. Average annual total return represents the average annual change in value of an investment over the periods indicated. Return for less than one year, if any, has not been annualized.
4. Prior to 9/10/18, these shares were offered at a higher initial sales charge of 5.75%, thus actual returns would have differed. Total returns with sales charges have been restated to reflect the current maximum initial sales charge of 5.50%.
5. Source: Morningstar. the MSCI ACWI ex USA Net Return (Local Currency and U.S. dollar) is a free float-adjusted, market capitalization-weighted index designed to measure equity market performance in global developed and emerging markets.
6. Figures are as stated in the Fund’s current prospectus and may differ from the expense ratios disclosed in the Your Fund’s Expenses and Financial
Highlights sections in this report. In periods of market volatility, assets may decline significantly, causing total annual Fund operating expenses to become higher than the figures shown.
See www.franklintempletondatasources.com for additional data provider information.
| franklintempleton.com |
Annual Report | 11 | ||||
FRANKLIN MUTUAL INTERNATIONAL FUND
As a Fund shareholder, you can incur two types of costs: (1) transaction costs, including sales charges (loads) on Fund purchases and redemptions; and (2) ongoing Fund costs, including management fees, distribution and service(12b-1) fees, and other Fund expenses. All mutual funds have ongoing costs, sometimes referred to as operating expenses. The table below shows ongoing costs of investing in the Fund and can help you understand these costs and compare them with those of other mutual funds. The table assumes a $1,000 investment held for the six months indicated.
Actual Fund Expenses
The table below provides information about actual account values and actual expenses in the columns under the heading “Actual.” In these columns the Fund’s actual return, which includes the effect of Fund expenses, is used to calculate the “Ending Account Value” for each class of shares. You can estimate the expenses you paid during the period by following these steps (of course, your account value and expenses will differ from those in this illustration): Divide your account value by $1,000 (if your account had an $8,600 value, then $8,600 ÷ $1,000 = 8.6). Then multiply the result by the number in the row for your class of shares under the headings “Actual” and “Expenses Paid During Period” (if Actual Expenses Paid During Period were $7.50, then 8.6 x $7.50 =$64.50). In this illustration, the actual expenses paid this period are $64.50.
Hypothetical Example for Comparison with Other Funds
Under the heading “Hypothetical” in the table, information is provided about hypothetical account values and hypothetical expenses based on the Fund’s actual expense ratio and an assumed rate of return of 5% per year before expenses, which is not the Fund’s actual return. This information may not be used to estimate the actual ending account balance or expenses you paid for the period, but it can help you compare ongoing costs of investing in the Fund with those of other funds. To do so, compare this 5% hypothetical example for the class of shares you hold with the 5% hypothetical examples that appear in the shareholder reports of other funds.
Please note that expenses shown in the table are meant to highlight ongoing costs and do not reflect any transactional costs. Therefore, information under the heading “Hypothetical” is useful in comparing ongoing costs only, and will not help you compare total costs of owning different funds. In addition, if transactional costs were included, your total costs would have been higher.
| Actual (actual return after expenses) | Hypothetical (5% annual return before expenses) | |||||||||||
| Share Class | Beginning Value 7/1/18 | Ending Account Value 12/31/18 | Expenses Paid During Period 7/1/18–12/31/181,2 | Ending Account Value 12/31/18 | Expenses Paid During Period 7/1/18–12/31/181,2 | Net Annualized Expense Ratio2 | ||||||
|
|
|
| |||||||||
Z | $1,000 | $852.00 | $4.53 | $1,020.32 | $ 4.94 | 0.97% | ||||||
A | $1,000 | $850.50 | $5.69 | $1,019.06 | $ 6.21 | 1.22% | ||||||
C | $1,000 | $847.40 | $9.17 | $1,015.27 | $10.01 | 1.97% | ||||||
R | $1,000 | $850.00 | $6.85 | $1,017.80 | $ 7.48 | 1.47% | ||||||
R6 | $1,000 | $852.70 | $3.88 | $1,021.02 | $ 4.23 | 0.83% | ||||||
1. Expenses are equal to the annualized expense ratio for thesix-month period as indicated above—in the far right column—multiplied by the simple average account value over the period indicated, and then multiplied by 184/365 to reflect theone-half year period.
2. Reflects expenses after fee waivers and expense reimbursements. Does not include acquired fund fees and expenses.
| 12 |
Annual Report | franklintempleton.com | ||
FRANKLIN MUTUAL INTERNATIONAL FUND
| Year Ended December 31, | ||||||||||||||||||||
| 2018 | 2017 | 2016 | 2015 | 2014 | ||||||||||||||||
Class Z | ||||||||||||||||||||
| Per share operating performance | ||||||||||||||||||||
(for a share outstanding throughout the year) | ||||||||||||||||||||
Net asset value, beginning of year | $15.96 | $14.32 | $14.17 | $14.59 | $15.90 | |||||||||||||||
Income from investment operationsa: | ||||||||||||||||||||
Net investment incomeb | 0.31 | 0.21 | 0.27 | c | 0.18 | d | 0.30 | e | ||||||||||||
Net realized and unrealized gains (losses) | (3.11 | ) | 1.78 | 0.20 | (0.17 | ) | (0.57 | ) | ||||||||||||
Total from investment operations | (2.80 | ) | 1.99 | 0.47 | 0.01 | (0.27 | ) | |||||||||||||
Less distributions from: | ||||||||||||||||||||
Net investment income | (0.25 | ) | (0.35 | ) | (0.27 | ) | (0.16 | ) | (0.43 | ) | ||||||||||
Net realized gains | (0.09 | ) | — | (0.05 | ) | (0.27 | ) | (0.61 | ) | |||||||||||
Total distributions | (0.34 | ) | (0.35 | ) | (0.32 | ) | (0.43 | ) | (1.04 | ) | ||||||||||
Net asset value, end of year | $12.82 | $15.96 | $14.32 | $14.17 | $14.59 | |||||||||||||||
Total return | (17.52)% | 13.99% | 3.34% | 0.15% | (1.63)% | |||||||||||||||
Ratios to average net assets | ||||||||||||||||||||
Expenses before waiver and payments by affiliatesf | 1.21% | 1.17% | 1.22% | 1.24% | 1.39% | |||||||||||||||
Expenses net of waiver and payments by affiliatesf,g | 0.99% | 1.16% | 1.17% | 1.15% | 1.16% | |||||||||||||||
Expenses incurred in connection with securities sold short | —% | —% | —% | —% | —% | h | ||||||||||||||
Net investment income | 2.00% | 1.41% | 2.07% | c | 1.26% | d | 1.78% | e | ||||||||||||
Supplemental data | ||||||||||||||||||||
Net assets, end of year (000’s) | $52,271 | $86,274 | $40,875 | $49,963 | $19,940 | |||||||||||||||
Portfolio turnover rate | 28.75% | 38.77% | 24.87% | 28.64% | 54.78% | |||||||||||||||
aThe amount shown for a share outstanding throughout the period may not correlate with the Statement of Operations for the period due to the timing of sales and repurchases of the Fund’s shares in relation to income earned and/or fluctuating fair value of the investments of the Fund.
bBased on average daily shares outstanding.
cNet investment income per share includes approximately $0.06 per share related to income received in the form of special dividends in connection with certain Fund holdings. Excluding this amount, the ratio of net investment income to average net assets would have been 1.63%.
dNet investment income per share includes approximately $0.08 per share related to income received in the form of special dividends in connection with certain Fund holdings. Excluding this amount, the ratio of net investment income to average net assets would have been 0.71%.
eNet investment income per share includes approximately $0.08 per share related to income received in the form of special dividends in connection with certain Fund holdings. Excluding this amount, the ratio of net investment income to average net assets would have been 1.27%.
fIncludes dividend and/or interest expense on securities sold short and security borrowing fees, if any. See below for the ratios of such expenses to average net assets for the periods presented. See Note 1(d).
gBenefit of expense reduction rounds to less than 0.01%.
hRounds to less than 0.01%.
| franklintempleton.com |
The accompanying notes are an integral part of these financial statements. | Annual Report | 13 | ||||
FRANKLIN MUTUAL INTERNATIONAL FUND
FINANCIAL HIGHLIGHTS
| Year Ended December 31, | ||||||||||||||||||||
| 2018 | 2017 | 2016 | 2015 | 2014 | ||||||||||||||||
Class A | ||||||||||||||||||||
| Per share operating performance | ||||||||||||||||||||
(for a share outstanding throughout the year) | ||||||||||||||||||||
Net asset value, beginning of year | $15.90 | $14.25 | $14.10 | $14.54 | $15.84 | |||||||||||||||
Income from investment operationsa: | ||||||||||||||||||||
Net investment incomeb | 0.27 | 0.18 | 0.24 | c | 0.15 | d | 0.26 | e | ||||||||||||
Net realized and unrealized gains (losses) | (3.10 | ) | 1.78 | 0.19 | (0.19 | ) | (0.57 | ) | ||||||||||||
Total from investment operations | (2.83 | ) | 1.96 | 0.43 | (0.04 | ) | (0.31 | ) | ||||||||||||
Less distributions from: | ||||||||||||||||||||
Net investment income | (0.21 | ) | (0.31 | ) | (0.23 | ) | (0.13 | ) | (0.38 | ) | ||||||||||
Net realized gains | (0.09 | ) | — | (0.05 | ) | (0.27 | ) | (0.61 | ) | |||||||||||
Total distributions | (0.30 | ) | (0.31 | ) | (0.28 | ) | (0.40 | ) | (0.99 | ) | ||||||||||
Net asset value, end of year | $12.77 | $15.90 | $14.25 | $14.10 | $14.54 | |||||||||||||||
Total returnf | (17.73)% | 13.67% | 3.14% | (0.20)% | (1.89)% | |||||||||||||||
Ratios to average net assets | ||||||||||||||||||||
Expenses before waiver and payments by affiliatesg | 1.46% | 1.42% | 1.47% | 1.52% | 1.69% | |||||||||||||||
Expenses net of waiver and payments by affiliatesg,h | 1.24% | 1.41% | 1.42% | 1.43% | 1.46% | |||||||||||||||
Expenses incurred in connection with securities sold short | —% | —% | —% | —% | —% | i | ||||||||||||||
Net investment income | 1.75% | 1.16% | 1.82% | c | 0.98% | d | 1.48% | e | ||||||||||||
Supplemental data | ||||||||||||||||||||
Net assets, end of year (000’s) | $53,082 | $82,965 | $82,626 | $110,591 | $39,810 | |||||||||||||||
Portfolio turnover rate | 28.75% | 38.77% | 24.87% | 28.64% | 54.78% | |||||||||||||||
aThe amount shown for a share outstanding throughout the period may not correlate with the Statement of Operations for the period due to the timing of sales and repurchases of the Fund’s shares in relation to income earned and/or fluctuating fair value of the investments of the Fund.
bBased on average daily shares outstanding.
cNet investment income per share includes approximately $0.06 per share related to income received in the form of special dividends in connection with certain Fund holdings. Excluding this amount, the ratio of net investment income to average net assets would have been 1.38%.
dNet investment income per share includes approximately $0.08 per share related to income received in the form of special dividends in connection with certain Fund holdings. Excluding this amount, the ratio of net investment income to average net assets would have been 0.43%.
eNet investment income per share includes approximately $0.08 per share related to income received in the form of special dividends in connection with certain Fund holdings. Excluding this amount, the ratio of net investment income to average net assets would have been 0.97%.
fTotal return does not reflect sales commissions or contingent deferred sales charges, if applicable.
gIncludes dividend and/or interest expense on securities sold short and security borrowing fees, if any. See below for the ratios of such expenses to average net assets for the periods presented. See Note 1(d).
hBenefit of expense reduction rounds to less than 0.01%.
iRounds to less than 0.01%.
| 14 |
Annual Report | The accompanying notes are an integral part of these financial statements. | franklintempleton.com | ||
FRANKLIN MUTUAL INTERNATIONAL FUND
FINANCIAL HIGHLIGHTS
| Year Ended December 31, | ||||||||||||||||||||
| 2018 | 2017 | 2016 | 2015 | 2014 | ||||||||||||||||
Class C | ||||||||||||||||||||
| Per share operating performance | ||||||||||||||||||||
(for a share outstanding throughout the year) | ||||||||||||||||||||
Net asset value, beginning of year | $15.69 | $14.08 | $13.92 | $14.38 | $15.68 | |||||||||||||||
Income from investment operationsa: | ||||||||||||||||||||
Net investment incomeb | 0.16 | 0.08 | 0.15 | c | 0.04 | d | 0.15 | e | ||||||||||||
Net realized and unrealized gains (losses) | (3.04 | ) | 1.72 | 0.18 | (0.18 | ) | (0.56 | ) | ||||||||||||
Total from investment operations | (2.88 | ) | 1.80 | 0.33 | (0.14 | ) | (0.41 | ) | ||||||||||||
Less distributions from: | ||||||||||||||||||||
Net investment income | (0.04 | ) | (0.19 | ) | (0.12 | ) | (0.05 | ) | (0.28 | ) | ||||||||||
Net realized gains | (0.09 | ) | — | (0.05 | ) | (0.27 | ) | (0.61 | ) | |||||||||||
Total distributions | (0.13 | ) | (0.19 | ) | (0.17 | ) | (0.32 | ) | (0.89 | ) | ||||||||||
Net asset value, end of year | $12.68 | $15.69 | $14.08 | $13.92 | $14.38 | |||||||||||||||
Total returnf | (18.39)% | 12.79% | 2.44% | (0.93)% | (2.58)% | |||||||||||||||
Ratios to average net assets | ||||||||||||||||||||
Expenses before waiver and payments by affiliatesg | 2.21% | 2.17% | 2.22% | 2.24% | 2.39% | |||||||||||||||
Expenses net of waiver and payments by affiliatesg,h | 1.99% | 2.16% | 2.17% | 2.15% | 2.16% | |||||||||||||||
Expenses incurred in connection with securities sold short | —% | —% | —% | —% | —% | i | ||||||||||||||
Net investment income | 1.00% | 0.41% | 1.07% | c | 0.26% | d | 0.78% | e | ||||||||||||
Supplemental data | ||||||||||||||||||||
Net assets, end of year (000’s) | $13,685 | $29,109 | $25,860 | $34,611 | $14,794 | |||||||||||||||
Portfolio turnover rate | 28.75% | 38.77% | 24.87% | 28.64% | 54.78% | |||||||||||||||
aThe amount shown for a share outstanding throughout the period may not correlate with the Statement of Operations for the period due to the timing of sales and repurchases of the Fund’s shares in relation to income earned and/or fluctuating fair value of the investments of the Fund.
bBased on average daily shares outstanding.
cNet investment income per share includes approximately $0.06 per share related to income received in the form of special dividends in connection with certain Fund holdings. Excluding this amount, the ratio of net investment income to average net assets would have been 0.63%.
dNet investment income per share includes approximately $0.08 per share related to income received in the form of special dividends in connection with certain Fund holdings. Excluding this amount, the ratio of net investment income to average net assets would have been (0.29)%.
eNet investment income per share includes approximately $0.08 per share related to income received in the form of special dividends in connection with certain Fund holdings. Excluding this amount, the ratio of net investment income to average net assets would have been 0.27%.
fTotal return does not reflect sales commissions or contingent deferred sales charges, if applicable.
gIncludes dividend and/or interest expense on securities sold short and security borrowing fees, if any. See below for the ratios of such expenses to average net assets for the periods presented. See Note 1(d).
hBenefit of expense reduction rounds to less than 0.01%.
iRounds to less than 0.01%.
| franklintempleton.com |
The accompanying notes are an integral part of these financial statements. | Annual Report | 15 | ||||
FRANKLIN MUTUAL INTERNATIONAL FUND
FINANCIAL HIGHLIGHTS
| Year Ended December 31, | ||||||||||||||||||||
| 2018 | 2017 | 2016 | 2015 | 2014 | ||||||||||||||||
Class R | ||||||||||||||||||||
| Per share operating performance | ||||||||||||||||||||
(for a share outstanding throughout the year) | ||||||||||||||||||||
Net asset value, beginning of year | $15.80 | $14.19 | $14.05 | $14.51 | $15.83 | |||||||||||||||
Income from investment operationsa: | ||||||||||||||||||||
Net investment incomeb | 0.23 | 0.10 | 0.20 | c | 0.04 | d | 0.18 | e | ||||||||||||
Net realized and unrealized gains (losses) | (3.07 | ) | 1.80 | 0.20 | (0.10 | ) | (0.52 | ) | ||||||||||||
Total from investment operations | (2.84 | ) | 1.90 | 0.40 | (0.06 | ) | (0.34 | ) | ||||||||||||
Less distributions from: | ||||||||||||||||||||
Net investment income | (0.18 | ) | (0.29 | ) | (0.21 | ) | (0.13 | ) | (0.37 | ) | ||||||||||
Net realized gains | (0.09 | ) | — | (0.05 | ) | (0.27 | ) | (0.61 | ) | |||||||||||
Total distributions | (0.27 | ) | (0.29 | ) | (0.26 | ) | (0.40 | ) | (0.98 | ) | ||||||||||
Net asset value, end of year | $12.69 | $15.80 | $14.19 | $14.05 | $14.51 | |||||||||||||||
Total return | (17.96)% | 13.43% | 2.90% | (0.38)% | (2.13)% | |||||||||||||||
Ratios to average net assets | ||||||||||||||||||||
Expenses before waiver and payments by affiliatesf | 1.71% | 1.64% | 1.72% | 1.74% | 1.89% | |||||||||||||||
Expenses net of waiver and payments by affiliatesf,g | 1.49% | 1.63% | 1.67% | 1.65% | 1.66% | |||||||||||||||
Expenses incurred in connection with securities sold short | —% | —% | —% | —% | —% | h | ||||||||||||||
Net investment income | 1.50% | 0.94% | 1.57% | c | 0.76% | d | 1.28% | e | ||||||||||||
Supplemental data | ||||||||||||||||||||
Net assets, end of year (000’s) | $1,673 | $1,867 | $694 | $662 | $112 | |||||||||||||||
Portfolio turnover rate | 28.75% | 38.77% | 24.87% | 28.64% | 54.78% | |||||||||||||||
aThe amount shown for a share outstanding throughout the period may not correlate with the Statement of Operations for the period due to the timing of sales and repurchases of the Fund’s shares in relation to income earned and/or fluctuating fair value of the investments of the Fund.
bBased on average daily shares outstanding.
cNet investment income per share includes approximately $0.06 per share related to income received in the form of special dividends in connection with certain Fund holdings. Excluding this amount, the ratio of net investment income to average net assets would have been 1.13%.
dNet investment income per share includes approximately $0.08 per share related to income received in the form of special dividends in connection with certain Fund holdings. Excluding this amount, the ratio of net investment income to average net assets would have been 0.21%.
eNet investment income per share includes approximately $0.08 per share related to income received in the form of special dividends in connection with certain Fund holdings. Excluding this amount, the ratio of net investment income to average net assets would have been 0.77%.
fIncludes dividend and/or interest expense on securities sold short and security borrowing fees, if any. See below for the ratios of such expenses to average net assets for the periods presented. See Note 1(d).
gBenefit of expense reduction rounds to less than 0.01%.
hRounds to less than 0.01%.
| 16 |
Annual Report | The accompanying notes are an integral part of these financial statements. | franklintempleton.com | ||
FRANKLIN MUTUAL INTERNATIONAL FUND
FINANCIAL HIGHLIGHTS
| Year Ended December 31, | ||||||||||||||||||||
| 2018 | 2017 | 2016 | 2015 | 2014 | ||||||||||||||||
Class R6 | ||||||||||||||||||||
| Per share operating performance | ||||||||||||||||||||
(for a share outstanding throughout the year) | ||||||||||||||||||||
Net asset value, beginning of year | $15.97 | $14.32 | $14.17 | $14.59 | $15.87 | |||||||||||||||
Income from investment operationsa: | ||||||||||||||||||||
Net investment incomeb | 0.33 | 0.24 | 0.33 | c | 0.22 | d | — | e,f | ||||||||||||
Net realized and unrealized gains (losses) | (3.11 | ) | 1.78 | 0.17 | (0.20 | ) | (0.22 | ) | ||||||||||||
Total from investment operations | (2.78 | ) | 2.02 | 0.50 | 0.02 | (0.22 | ) | |||||||||||||
Less distributions from: | ||||||||||||||||||||
Net investment income | (0.28 | ) | (0.37 | ) | (0.30 | ) | (0.17 | ) | (0.45 | ) | ||||||||||
Net realized gains | (0.09 | ) | — | (0.05 | ) | (0.27 | ) | (0.61 | ) | |||||||||||
Total distributions | (0.37 | ) | (0.37 | ) | (0.35 | ) | (0.44 | ) | (1.06 | ) | ||||||||||
Net asset value, end of year. | $12.82 | $15.97 | $14.32 | $14.17 | $14.59 | |||||||||||||||
Total return | (17.40)% | 14.11% | 3.58% | 0.23% | (1.46)% | |||||||||||||||
Ratios to average net assets | ||||||||||||||||||||
Expenses before waiver and payments by affiliatesg | 1.11% | 1.03% | 1.06% | 1.06% | 1.24% | |||||||||||||||
Expenses net of waiver and payments by affiliatesg,h | 0.85% | 1.01% | 1.00% | 1.02% | 1.00% | |||||||||||||||
Expenses incurred in connection with securities sold short | —% | —% | —% | —% | —% | i | ||||||||||||||
Net investment income | 2.14% | 1.56% | 2.24% | c | 1.39% | d | 1.94% | e | ||||||||||||
Supplemental data | ||||||||||||||||||||
Net assets, end of year (000’s) | $20,128 | $25,697 | $16,687 | $23,793 | $19,398 | |||||||||||||||
Portfolio turnover rate | 28.75% | 38.77% | 24.87% | 28.64% | 54.78% | |||||||||||||||
aThe amount shown for a share outstanding throughout the period may not correlate with the Statement of Operations for the period due to the timing of sales and repurchases of the Fund’s shares in relation to income earned and/or fluctuating fair value of the investments of the Fund.
bBased on average daily shares outstanding.
cNet investment income per share includes approximately $0.06 per share related to income received in the form of special dividends in connection with certain Fund holdings. Excluding this amount, the ratio of net investment income to average net assets would have been 1.80%.
dNet investment income per share includes approximately $0.08 per share related to income received in the form of special dividends in connection with certain Fund holdings. Excluding this amount, the ratio of net investment income to average net assets would have been 0.84%.
eNet investment income per share includes approximately $0.08 per share related to income received in the form of special dividends in connection with certain Fund holdings. Excluding this amount, the ratio of net investment income to average net assets would have been 1.42%.
fAmount rounds to less than $0.01 per share.
gIncludes dividend and/or interest expense on securities sold short and security borrowing fees, if any. See below for the ratios of such expenses to average net assets for the periods presented. See Note 1(d).
hBenefit of expense reduction rounds to less than 0.01%.
iRounds to less than 0.01%.
The accompanying notes are an integral part of these financial statements. | Annual Report 17
| franklintempleton.com |
The accompanying notes are an integral part of these financial statements. | Annual Report | 17 | ||||
FRANKLIN MUTUAL INTERNATIONAL FUND
Statement of Investments, December 31, 2018
| Country | Shares | Value | ||||||||||
Common Stocks 90.4% | ||||||||||||
Auto Components 2.8% | ||||||||||||
Cie Generale des Etablissements Michelin SCA | France | 14,989 | $ | 1,489,020 | ||||||||
Toyo Tire Corp. | Japan | 200,351 | 2,513,528 | |||||||||
|
| |||||||||||
| 4,002,548 | ||||||||||||
|
| |||||||||||
Automobiles 2.1% | ||||||||||||
Peugeot SA | France | 138,705 | 2,963,216 | |||||||||
|
| |||||||||||
Banks 11.6% | ||||||||||||
AIB Group PLC | Ireland | 516,975 | 2,173,282 | |||||||||
a Credito Valtellinese SpA | Italy | 28,038,943 | 2,357,520 | |||||||||
HSBC Holdings PLC | United Kingdom | 338,807 | 2,795,019 | |||||||||
ING Groep NV | Netherlands | 176,098 | 1,898,685 | |||||||||
Shinsei Bank Ltd. | Japan | 255,900 | 3,056,324 | |||||||||
Standard Chartered PLC | United Kingdom | 366,605 | 2,848,557 | |||||||||
Yes Bank Ltd. | India | 493,352 | 1,289,225 | |||||||||
|
| |||||||||||
| 16,418,612 | ||||||||||||
|
| |||||||||||
Capital Markets 3.5% | ||||||||||||
Credit Suisse Group AG | Switzerland | 169,007 | 1,848,421 | |||||||||
Deutsche Bank AG | Germany | 288,000 | 2,296,953 | |||||||||
Guotai Junan Securities Co. Ltd. | China | 398,064 | 805,227 | |||||||||
|
| |||||||||||
| 4,950,601 | ||||||||||||
|
| |||||||||||
Chemicals 1.4% | ||||||||||||
BASF SE | Germany | 28,169 | 1,962,158 | |||||||||
|
| |||||||||||
Communications Equipment 1.5% | ||||||||||||
Nokia OYJ, A | Finland | 356,803 | 2,056,389 | |||||||||
|
| |||||||||||
Construction Materials 1.7% | ||||||||||||
LafargeHolcim Ltd., B | Switzerland | 57,170 | 2,360,421 | |||||||||
|
| |||||||||||
Consumer Finance 2.4% | ||||||||||||
b Hoist Finance AB, 144A | Sweden | 419,206 | 2,046,577 | |||||||||
Sun Hung Kai & Co. Ltd. | Hong Kong | 2,877,748 | 1,359,769 | |||||||||
|
| |||||||||||
| 3,406,346 | ||||||||||||
|
| |||||||||||
Diversified Financial Services 2.3% | ||||||||||||
Metro Pacific Investments Corp. | Philippines | 36,164,200 | 3,196,226 | |||||||||
|
| |||||||||||
Diversified Telecommunication Services 1.5% | ||||||||||||
Koninklijke KPN NV | Netherlands | 743,128 | 2,179,779 | |||||||||
|
| |||||||||||
Hotels, Restaurants & Leisure 3.5% | ||||||||||||
Accor SA | France | 51,000 | 2,168,553 | |||||||||
Sands China Ltd. | Macau | 624,400 | 2,735,064 | |||||||||
|
| |||||||||||
| 4,903,617 | ||||||||||||
|
| |||||||||||
Household Durables 2.1% | ||||||||||||
a Cairn Homes PLC | Ireland | 1,005,848 | 1,233,176 | |||||||||
a,b Neinor Homes SA, 144A | Spain | 115,583 | 1,721,655 | |||||||||
|
| |||||||||||
| 2,954,831 | ||||||||||||
|
| |||||||||||
Independent Power & Renewable Electricity Producers 2.0% | ||||||||||||
China Longyuan Power Group Corp. | China | 4,208,700 | 2,864,743 | |||||||||
|
| |||||||||||
Insurance 17.2% | ||||||||||||
ASR Nederland NV | Netherlands | 54,769 | 2,170,044 | |||||||||
China Pacific Insurance Group Co. Ltd., H | China | 879,045 | 2,845,769 | |||||||||
Direct Line Insurance Group PLC | United Kingdom | 739,157 | 3,004,098 | |||||||||
Lancashire Holdings Ltd. | United Kingdom | 388,658 | 2,998,598 | |||||||||
| 18 |
Annual Report | franklintempleton.com | ||
FRANKLIN MUTUAL INTERNATIONAL FUND
STATEMENT OF INVESTMENTS
| Country | Shares | Value | ||||||||||
Common Stocks(continued) | ||||||||||||
| Insurance(continued) | ||||||||||||
NN Group NV | Netherlands | 103,498 | $ | 4,126,862 | ||||||||
RSA Insurance Group PLC | United Kingdom | 389,405 | 2,550,480 | |||||||||
Sabre Insurance Group PLC | United Kingdom | 1,028,590 | 3,580,966 | |||||||||
T&D Holdings Inc. | Japan | 248,433 | 2,899,141 | |||||||||
|
| |||||||||||
| 24,175,958 | ||||||||||||
|
| |||||||||||
| Interactive Media & Services 3.1% | ||||||||||||
a Baidu Inc., ADR | China | 16,131 | 2,558,377 | |||||||||
Yahoo Japan Corp. | Japan | 734,600 | 1,836,500 | |||||||||
|
| |||||||||||
| 4,394,877 | ||||||||||||
|
| |||||||||||
| Oil, Gas & Consumable Fuels 9.5% | ||||||||||||
BP PLC | United Kingdom | 495,900 | 3,136,370 | |||||||||
Canadian Natural Resources Ltd. | Canada | 84,900 | 2,048,871 | |||||||||
Crescent Point Energy Corp. | Canada | 585,600 | 1,776,170 | |||||||||
Husky Energy Inc. | Canada | 190,100 | 1,965,135 | |||||||||
Royal Dutch Shell PLC, B | United Kingdom | 90,231 | 2,692,570 | |||||||||
Saras SpA | Italy | 877,091 | 1,701,826 | |||||||||
|
| |||||||||||
| 13,320,942 | ||||||||||||
|
| |||||||||||
| Pharmaceuticals 6.4% | ||||||||||||
GlaxoSmithKline PLC | United Kingdom | 213,777 | 4,065,296 | |||||||||
Novartis AG | Switzerland | 57,144 | 4,896,957 | |||||||||
|
| |||||||||||
| 8,962,253 | |||||||||||
|
| |||||||||||
| Semiconductors & Semiconductor Equipment 4.1% | ||||||||||||
BE Semiconductor Industries NV | Netherlands | 151,191 | 3,201,030 | |||||||||
a Renesas Electronics Corp. | Japan | 552,862 | 2,522,180 | |||||||||
|
| |||||||||||
| 5,723,210 | ||||||||||||
|
| |||||||||||
| Specialty Retail 2.8% | ||||||||||||
Dufry AG | Switzerland | 25,336 | 2,414,533 | |||||||||
Hornbach Holding AG & Co. KGaA | Germany | 31,290 | 1,476,764 | |||||||||
|
| |||||||||||
| 3,891,297 | |||||||||||
|
| |||||||||||
| Technology Hardware, Storage & Peripherals 2.2% | ||||||||||||
Samsung Electronics Co. Ltd. | South Korea | 88,900 | 3,089,161 | |||||||||
|
| |||||||||||
| Thrifts & Mortgage Finance 2.2% | ||||||||||||
Indiabulls Housing Finance Ltd. | India | 252,641 | 3,100,726 | |||||||||
|
| |||||||||||
| Tobacco 1.3% | ||||||||||||
British American Tobacco PLC | United Kingdom | 58,254 | 1,857,210 | |||||||||
|
| |||||||||||
| Trading Companies & Distributors 1.4% | ||||||||||||
Rexel SA | France | 180,233 | 1,920,552 | |||||||||
|
| |||||||||||
| Wireless Telecommunication Services 1.8% | ||||||||||||
Vodafone Group PLC | United Kingdom | 1,324,860 | 2,583,288 | |||||||||
|
| |||||||||||
Total Common Stocks (Cost $153,702,338) | 127,238,961 | |||||||||||
|
| |||||||||||
Preferred Stocks (Cost $1,772,943) 1.5% | ||||||||||||
| Automobiles 1.5% | ||||||||||||
c Volkswagen AG, 2.845%, pfd | Germany | 13,606 | 2,169,647 | |||||||||
|
| |||||||||||
Total Investments before Short Term Investments | 129,408,608 | |||||||||||
|
| |||||||||||
franklintempleton.com | Annual Report | 19 | ||||
FRANKLIN MUTUAL INTERNATIONAL FUND
STATEMENT OF INVESTMENTS
| Country | Principal Amount | Value | ||||||||||
Short Term Investments 8.3% | ||||||||||||
U.S. Government and Agency Securities 8.3% | ||||||||||||
d FHLB, 1/02/19 | United States | $ | 2,700,000 | $ | 2,700,000 | |||||||
d U.S. Treasury Bill, | ||||||||||||
1/02/19 | United States | 5,000,000 | 5,000,000 | |||||||||
1/24/19 | United States | 2,000,000 | 1,997,174 | |||||||||
5/09/19 | United States | 2,000,000 | 1,982,447 | |||||||||
|
| |||||||||||
Total U.S. Government and Agency Securities | 11,679,621 | |||||||||||
|
| |||||||||||
Total Investments (Cost $167,154,032) 100.2% | 141,088,229 | |||||||||||
Other Assets, less Liabilities (0.2)% | (249,286 | ) | ||||||||||
|
| |||||||||||
Net Assets 100.0% | $ | 140,838,943 | ||||||||||
|
| |||||||||||
aNon-income producing.
bSecurity was purchased pursuant to Rule 144A under the Securities Act of 1933 and may be sold in transactions exempt from registration only to qualified institutional buyers or in a public offering registered under the Securities Act of 1933. These securities have been deemed liquid under guidelines approved by the Trust’s Board of Trustees. At December 31, 2018, the aggregate value of these securities was $3,768,232, representing 2.7% of net assets.
cVariable rate security. The rate shown represents the yield at period end.
dThe security was issued on a discount basis with no stated coupon rate.
At December 31, 2018, the Fund had the following futures contracts outstanding. See Note 1(c).
Futures Contracts
| Description | Type | Number of Contracts | Notional Amount* | Expiration Date | Value/ Unrealized Appreciation (Depreciation) | |||||||||||||||
| Currency Contracts | ||||||||||||||||||||
EUR/USD | Short | 135 | $19,444,219 | 3/18/19 | $ 2,898 | |||||||||||||||
GBP/USD | Short | 68 | 5,435,750 | 3/18/19 | 11,234 | |||||||||||||||
|
| |||||||||||||||||||
Total Futures Contracts | $14,132 | |||||||||||||||||||
|
| |||||||||||||||||||
*As of period end.
| 20 |
Annual Report | franklintempleton.com | ||
FRANKLIN MUTUAL INTERNATIONAL FUND
STATEMENT OF INVESTMENTS
At December 31, 2018, the Fund had the following forward exchange contracts outstanding. See Note 1(c).
| Forward Exchange Contracts | ||||||||||||||||||||||||||||
| Currency | Counterpartya | Type | Quantity | Contract Amount | Settlement Date | Unrealized Appreciation | Unrealized Depreciation | |||||||||||||||||||||
| OTC Forward Exchange Contracts | ||||||||||||||||||||||||||||
Euro | BOFA | Buy | 1,451,149 | $ | 1,655,795 | 1/14/19 | $ | 8,998 | $ | — | ||||||||||||||||||
Euro | BONY | Sell | 3,723,755 | 4,421,736 | 1/14/19 | 149,756 | — | |||||||||||||||||||||
Euro | HSBK | Buy | 2,219,586 | 2,534,428 | 1/14/19 | 11,931 | — | |||||||||||||||||||||
Euro | HSBK | Sell | 197,620 | 233,836 | 1/14/19 | 7,122 | — | |||||||||||||||||||||
Euro | SSBT | Buy | 686,857 | 784,115 | 1/14/19 | 3,863 | — | |||||||||||||||||||||
Euro | SSBT | Sell | 13,983,121 | 16,613,947 | 1/14/19 | 572,181 | — | |||||||||||||||||||||
Euro | UBSW | Buy | 1,257,874 | 1,435,095 | 1/14/19 | 7,968 | — | |||||||||||||||||||||
Euro | UBSW | Sell | 148,209 | 174,110 | 1/14/19 | 4,081 | — | |||||||||||||||||||||
Swiss Franc | HSBK | Buy | 47,237 | 47,762 | 1/14/19 | 396 | — | |||||||||||||||||||||
Swiss Franc | UBSW | Buy | 296,258 | 299,486 | 1/14/19 | 2,547 | — | |||||||||||||||||||||
Swiss Franc | UBSW | Sell | 2,155,417 | 2,163,964 | 1/14/19 | — | (33,472 | ) | ||||||||||||||||||||
British Pound | BOFA | Buy | 528,462 | 669,810 | 1/16/19 | 4,679 | — | |||||||||||||||||||||
British Pound | HSBK | Buy | 187,094 | 236,744 | 1/16/19 | 2,049 | — | |||||||||||||||||||||
British Pound | SSBT | Sell | 2,936,461 | 3,913,554 | 1/16/19 | 165,679 | — | |||||||||||||||||||||
British Pound | UBSW | Buy | 75,334 | 95,204 | 1/16/19 | 947 | — | |||||||||||||||||||||
South Korean Won | BONY | Sell | 233,809,059 | 208,833 | 1/18/19 | — | (1,213 | ) | ||||||||||||||||||||
South Korean Won | HSBK | Buy | 406,270,942 | 360,096 | 1/18/19 | 4,883 | — | |||||||||||||||||||||
South Korean Won | HSBK | Sell | 748,940,399 | 668,912 | 1/18/19 | — | (3,908 | ) | ||||||||||||||||||||
South Korean Won | UBSW | Sell | 2,823,946,484 | 2,521,831 | 1/18/19 | — | (15,095 | ) | ||||||||||||||||||||
Swedish Krona | BONY | Buy | 10,817,845 | 1,199,382 | 1/31/19 | 24,893 | — | |||||||||||||||||||||
Swedish Krona | BONY | Sell | 28,922,111 | 3,193,810 | 1/31/19 | — | (79,355 | ) | ||||||||||||||||||||
Philippine Peso | BONY | Sell | 164,610,098 | 3,129,470 | 2/04/19 | — | (3,624 | ) | ||||||||||||||||||||
British Pound | BOFA | Sell | 300,000 | 397,914 | 2/14/19 | 14,477 | — | |||||||||||||||||||||
British Pound | HSBK | Sell | 189,744 | 251,491 | 2/14/19 | 8,974 | — | |||||||||||||||||||||
British Pound | UBSW | Sell | 5,325,697 | 6,865,702 | 2/14/19 | 58,799 | — | |||||||||||||||||||||
Japanese Yen | HSBK | Buy | 49,328,591 | 446,315 | 2/19/19 | 5,530 | — | |||||||||||||||||||||
Japanese Yen | UBSW | Buy | 29,946,527 | 271,675 | 2/19/19 | 2,632 | — | |||||||||||||||||||||
Japanese Yen | UBSW | Sell | 931,126,799 | 8,292,531 | 2/19/19 | — | (236,511 | ) | ||||||||||||||||||||
Euro | BONY | Sell | 619,305 | 716,040 | 2/20/19 | 3,381 | — | |||||||||||||||||||||
Euro | SSBT | Sell | 619,306 | 716,094 | 2/20/19 | 3,434 | — | |||||||||||||||||||||
Euro | UBSW | Sell | 117,435 | 134,970 | 4/18/19 | — | (839 | ) | ||||||||||||||||||||
British Pound | BONY | Sell | 230,531 | 301,302 | 4/24/19 | 5,684 | — | |||||||||||||||||||||
British Pound | UBSW | Sell | 3,722,872 | 4,877,576 | 4/24/19 | 103,619 | — | |||||||||||||||||||||
Euro | HSBK | Sell | 274,646 | 316,282 | 5/07/19 | — | (1,862 | ) | ||||||||||||||||||||
Euro | HSBK | Sell | 1,138,655 | 1,321,003 | 5/07/19 | 2,009 | — | |||||||||||||||||||||
Euro | SSBT | Sell | 16,109 | 18,807 | 5/07/19 | 147 | — | |||||||||||||||||||||
Euro | SSBT | Sell | 1,260,725 | 1,468,052 | 5/21/19 | 5,874 | — | |||||||||||||||||||||
British Pound | BOFA | Sell | 7,465,829 | 9,667,726 | 5/28/19 | 78,709 | — | |||||||||||||||||||||
British Pound | HSBK | Sell | 27,252 | 35,237 | 5/28/19 | 235 | — | |||||||||||||||||||||
British Pound | SSBT | Sell | 185,000 | 238,211 | 5/28/19 | 599 | — | |||||||||||||||||||||
|
| |||||||||||||||||||||||||||
Total Forward Exchange Contracts |
| $ | 1,266,076 | $ | (375,879 | ) | ||||||||||||||||||||||
|
| |||||||||||||||||||||||||||
Net unrealized appreciation (depreciation) |
| $ | 890,197 | |||||||||||||||||||||||||
|
| |||||||||||||||||||||||||||
aMay be comprised of multiple contracts with the same counterparty, currency and settlement date.
See Note 9 regarding other derivative information.
See Abbreviations on page 38.
franklintempleton.com |
The accompanying notes are an integral part of these financial statements. | |
Annual Report |
21 |
FRANKLIN MUTUAL INTERNATIONAL FUND
Statement of Assets and Liabilities
December 31, 2018
Assets: | ||||
Investments in securities: | ||||
Cost - Unaffiliated issuers | $ | 167,154,032 | ||
|
| |||
Value - Unaffiliated issuers | $ | 141,088,229 | ||
Cash | 101,156 | |||
Foreign currency, at value (cost $32,830) | 32,829 | |||
Receivables: | ||||
Capital shares sold | 416,961 | |||
Dividends | 542,509 | |||
European Union tax reclaims | 48,563 | |||
Affiliates | 9,339 | |||
Deposits with brokers for: | ||||
Futures contracts | 481,060 | |||
Unrealized appreciation on OTC forward exchange contracts | 1,266,076 | |||
Other assets | 25 | |||
|
| |||
Total assets | 143,986,747 | |||
|
| |||
Liabilities: | ||||
Payables: | ||||
Capital shares redeemed | 2,542,406 | |||
Management fees | 55,213 | |||
Distribution fees | 51,922 | |||
Trustees’ fees and expenses | 2,899 | |||
Variation margin on futures contracts | 33,062 | |||
Unrealized depreciation on OTC forward exchange contracts | 375,879 | |||
Accrued expenses and other liabilities | 86,423 | |||
|
| |||
Total liabilities | 3,147,804 | |||
|
| |||
Net assets, at value | $ | 140,838,943 | ||
|
| |||
Net assets consist of: | ||||
Paid-in capital | $ | 169,187,591 | ||
Total distributable earnings (loss) | (28,348,648 | ) | ||
|
| |||
Net assets, at value | $ | 140,838,943 | ||
|
|
22 |
Annual Report | The accompanying notes are an integral part of these financial statements. |
franklintempleton.com |
FRANKLIN MUTUAL INTERNATIONAL FUND
FINANCIAL STATEMENTS
Statement of Assets and Liabilities(continued)
December 31, 2018
| Class Z: | ||||
Net assets, at value | $ | 52,270,864 | ||
|
| |||
Shares outstanding | 4,077,294 | |||
|
| |||
Net asset value and maximum offering price per share | $12.82 | |||
|
| |||
| Class A: | ||||
Net assets, at value | $ | 53,081,844 | ||
|
| |||
Shares outstanding | 4,155,906 | |||
|
| |||
Net asset value per sharea | $12.77 | |||
|
| |||
Maximum offering price per share (net asset value per share ÷ 94.50%) | $13.51 | |||
|
| |||
| Class C: | ||||
Net assets, at value | $ | 13,684,904 | ||
|
| |||
Shares outstanding | 1,078,950 | |||
|
| |||
Net asset value and maximum offering price per sharea | $12.68 | |||
|
| |||
| Class R: | ||||
Net assets, at value | $ | 1,673,403 | ||
|
| |||
Shares outstanding | 131,886 | |||
|
| |||
Net asset value and maximum offering price per share | $12.69 | |||
|
| |||
| Class R6: | ||||
Net assets, at value | $ | 20,127,928 | ||
|
| |||
Shares outstanding | 1,570,140 | |||
|
| |||
Net asset value and maximum offering price per share | $12.82 | |||
|
| |||
aRedemption price is equal to net asset value less contingent deferred sales charges, if applicable.
| franklintempleton.com |
The accompanying notes are an integral part of these financial statements. | Annual Report | 23 | ||||
FRANKLIN MUTUAL INTERNATIONAL FUND
FINANCIAL STATEMENTS
Statement of Operations
for the year ended December 31, 2018
Investment income: | ||||
Dividends: (net of foreign taxes)* | ||||
Unaffiliated issuers | $ | 5,582,595 | ||
Interest: | ||||
Unaffiliated issuers | 207,564 | |||
Income from securities loaned: | ||||
Unaffiliated issuers (net of fees and rebates) | 6,629 | |||
Non-controlled affiliates (Note 3f) | 679 | |||
Other income (Note 1f) | 46,160 | |||
|
| |||
Total investment income | 5,843,627 | |||
|
| |||
Expenses: | ||||
Management fees (Note 3a) | 1,710,684 | |||
Distribution fees: (Note 3c) | ||||
Class A | 178,557 | |||
Class C | 232,026 | |||
Class R | 9,902 | |||
Transfer agent fees: (Note 3e) | ||||
Class Z | 141,571 | |||
Class A | 135,360 | |||
Class C | 43,919 | |||
Class R | 3,727 | |||
Class R6 | 19,765 | |||
Custodian fees (Note 4) | 34,279 | |||
Reports to shareholders | 44,465 | |||
Registration and filing fees | 79,067 | |||
Professional fees | 82,662 | |||
Trustees’ fees and expenses | 12,042 | |||
Other | 30,250 | |||
|
| |||
Total expenses | 2,758,276 | |||
Expense reductions (Note 4) | (2,379 | ) | ||
Expenses waived/paid by affiliates (Note 3f and 3g) | (440,885 | ) | ||
|
| |||
Net expenses | 2,315,012 | |||
|
| |||
Net investment income | 3,528,615 | |||
|
| |||
Realized and unrealized gains (losses): | ||||
Net realized gain (loss) from: | ||||
Investments:# | ||||
Unaffiliated issuers | 6,026,036 | |||
Foreign currency transactions | (32,809 | ) | ||
Forward exchange contracts | 2,367,152 | |||
Futures contracts | 1,559,890 | |||
|
| |||
Net realized gain (loss) | 9,920,269 | |||
|
| |||
Net change in unrealized appreciation (depreciation) on: | ||||
Investments: | ||||
Unaffiliated issuers | (50,995,072 | ) | ||
Translation of other assets and liabilities denominated in foreign currencies | (18,751 | ) | ||
Forward exchange contracts | 3,845,145 | |||
Futures contracts | 396,088 | |||
Change in deferred taxes on unrealized appreciation | 244,572 | |||
|
| |||
Net change in unrealized appreciation (depreciation) | (46,528,018 | ) | ||
|
| |||
Net realized and unrealized gain (loss) | (36,607,749 | ) | ||
|
| |||
Net increase (decrease) in net assets resulting from operations | $(33,079,134 | ) | ||
|
| |||
*Foreign taxes withheld on dividends | $ 511,074 | |||
#Net of foreign taxes | $ 119,767 | |||
| 24 |
Annual Report | The accompanying notes are an integral part of these financial statements. | franklintempleton.com | ||
FRANKLIN MUTUAL INTERNATIONAL FUND
FINANCIAL STATEMENTS
Statements of Changes in Net Assets
| Year Ended December 31, | ||||||||
|
| |||||||
| 2018 | 2017 | |||||||
| ||||||||
Increase (decrease) in net assets: | ||||||||
Operations: | ||||||||
Net investment income | $ | 3,528,615 | $ | 2,319,028 | ||||
Net realized gain (loss) | 9,920,269 | (1,282,671 | ) | |||||
Net change in unrealized appreciation (depreciation) | (46,528,018 | ) | 22,778,947 | |||||
|
| |||||||
Net increase (decrease) in net assets resulting from operations | (33,079,134 | ) | 23,815,304 | |||||
|
| |||||||
Distributions to shareholders: (Note 1g) | ||||||||
Class Z | (1,369,385 | ) | (1,857,997 | ) | ||||
Class A | (1,270,437 | ) | (1,574,566 | ) | ||||
Class C | (150,699 | ) | (348,684 | ) | ||||
Class R | (35,634 | ) | (35,346 | ) | ||||
Class R6 | (566,278 | ) | (569,536 | ) | ||||
|
| |||||||
Total distributions to shareholders | (3,392,433 | ) | (4,386,129 | ) | ||||
|
| |||||||
Capital share transactions: (Note 2) | ||||||||
Class Z | (20,389,727 | ) | 39,322,326 | |||||
Class A | (16,207,014 | ) | (7,963,782 | ) | ||||
Class C | (11,485,192 | ) | 226,100 | |||||
Class R | 206,051 | 1,060,015 | ||||||
Class R6 | (724,964 | ) | 7,095,104 | |||||
|
| |||||||
Total capital share transactions | (48,600,846 | ) | 39,739,763 | |||||
|
| |||||||
Net increase (decrease) in net assets | (85,072,413 | ) | 59,168,938 | |||||
Net assets: | ||||||||
Beginning of year | 225,911,356 | 166,742,418 | ||||||
|
| |||||||
End of year (Note 1g) | $ | 140,838,943 | $ | 225,911,356 | ||||
|
| |||||||
franklintempleton.com |
The accompanying notes are an integral part of these financial statements. | Annual Report |
|
25 |
|
FRANKLIN MUTUAL INTERNATIONAL FUND
1. Organization and Significant Accounting Policies
Franklin Mutual Series Funds (Trust) is registered under the Investment Company Act of 1940 (1940 Act) as anopen-end management investment company, consisting of seven separate funds and applies the specialized accounting and reporting guidance in U.S. Generally Accepted Accounting Principles (U.S. GAAP). Franklin Mutual International Fund (Fund) is included in this report. The Fund offers five classes of shares: Class Z, Class A, Class C, Class R and Class R6. Beginning on October 19, 2018, Class C shares automatically convert to Class A shares after they have been held for 10 years. Each class of shares may differ by its initial sales load, contingent deferred sales charges, voting rights on matters affecting a single class, its exchange privilege and fees due to differing arrangements for distribution and transfer agent fees.
The following summarizes the Fund’s significant accounting policies.
a. Financial Instrument Valuation
The Fund’s investments in financial instruments are carried at fair value daily. Fair value is the price that would be received to sell an asset or paid to transfer a liability in an orderly transaction between market participants on the measurement date. The Fund calculates the net asset value (NAV) per share each business day as of 4 p.m. Eastern time or the regularly scheduled close of the New York Stock Exchange (NYSE), whichever is earlier. Under compliance policies and procedures approved by the Trust’s Board of Trustees (the Board), the Fund’s administrator has responsibility for oversight of valuation, including leading the cross-functional Valuation Committee (VC). The Fund may utilize independent pricing services, quotations from securities and financial instrument dealers, and other market sources to determine fair value.
Equity securities and derivative financial instruments listed on an exchange or on the NASDAQ National Market System are valued at the last quoted sale price or the official closing price of the day, respectively. Foreign equity securities are valued as of the close of trading on the foreign stock exchange on which the security is primarily traded, or as of 4 p.m. Eastern time. The value is then converted into its U.S. dollar equivalent at the foreign exchange rate in effect at 4 p.m. Eastern time on the day that the value of the security is determined.Over-the-counter (OTC) securities are valued within the range of the most recent quoted bid and ask prices. Securities that trade in multiple markets or on multiple exchanges
are valued according to the broadest and most representative market. Certain equity securities are valued based upon fundamental characteristics or relationships to similar securities.
Debt securities generally trade in the OTC market rather than on a securities exchange. The Fund’s pricing services use multiple valuation techniques to determine fair value. In instances where sufficient market activity exists, the pricing services may utilize a market-based approach through which quotes from market makers are used to determine fair value. In instances where sufficient market activity may not exist or is limited, the pricing services also utilize proprietary valuation models which may consider market characteristics such as benchmark yield curves, credit spreads, estimated default rates, anticipated market interest rate volatility, coupon rates, anticipated timing of principal repayments, underlying collateral, and other unique security features in order to estimate the relevant cash flows, which are then discounted to calculate the fair value.
Investments inopen-end mutual funds are valued at the closing NAV.
Certain derivative financial instruments trade in the OTC market. The Fund’s pricing services use various techniques including industry standard option pricing models and proprietary discounted cash flow models to determine the fair value of those instruments. The Fund’s net benefit or obligation under the derivative contract, as measured by the fair value of the contract, is included in net assets.
The Fund has procedures to determine the fair value of financial instruments for which market prices are not reliable or readily available. Under these procedures, the Fund primarily employs a market-based approach which may use related or comparable assets or liabilities, recent transactions, market multiples, book values, and other relevant information for the investment to determine the fair value of the investment. An income-based valuation approach may also be used in which the anticipated future cash flows of the investment are discounted to calculate fair value. Discounts may also be applied due to the nature or duration of any restrictions on the disposition of the investments. Due to the inherent uncertainty of valuations of such investments, the fair values may differ significantly from the values that would have been used had an active market existed.
26 |
Annual Report |
franklintempleton.com |
FRANKLIN MUTUAL INTERNATIONAL FUND
NOTES TO FINANCIAL STATEMENTS
Trading in securities on foreign securities stock exchanges and OTC markets may be completed before 4 p.m. Eastern time. In addition, trading in certain foreign markets may not take place on every Fund’s business day. Occasionally, events occur between the time at which trading in a foreign security is completed and 4 p.m. Eastern time that might call into question the reliability of the value of a portfolio security held by the Fund. As a result, differences may arise between the value of the Fund’s portfolio securities as determined at the foreign market close and the latest indications of value at 4 p.m. Eastern time. In order to minimize the potential for these differences, the VC monitors price movements following the close of trading in foreign stock markets through a series of country specific market proxies (such as baskets of American Depositary Receipts, futures contracts and exchange traded funds). These price movements are measured against established trigger thresholds for each specific market proxy to assist in determining if an event has occurred that may call into question the reliability of the values of the foreign securities held by the Fund. If such an event occurs, the securities may be valued using fair value procedures, which may include the use of independent pricing services. At December 31, 2018, a market event occurred resulting in a portion of the securities held by the Fund being valued using fair value procedures.
When the last day of the reporting period is anon-business day, certain foreign markets may be open on those days that the Fund’s NAV is not calculated, which could result in differences between the value of the Fund’s portfolio securities on the last business day and the last calendar day of the reporting period. Any significant security valuation changes due to an open foreign market are adjusted and reflected by the Fund for financial reporting purposes.
b. Foreign Currency Translation
Portfolio securities and other assets and liabilities denominated in foreign currencies are translated into U.S. dollars based on the exchange rate of such currencies against U.S. dollars on the date of valuation. The Fund may enter into foreign currency exchange contracts to facilitate transactions denominated in a foreign currency. Purchases and sales of securities, income and expense items denominated in foreign currencies are translated into U.S. dollars at the exchange rate in effect on the transaction date. Portfolio securities and assets and liabilities denominated in foreign currencies contain risks that those currencies will decline in value relative to the U.S. dollar. Occasionally, events may impact the availability or reliability of foreign exchange rates used to convert the U.S. dollar
equivalent value. If such an event occurs, the foreign exchange rate will be valued at fair value using procedures established and approved by the Board.
The Fund does not separately report the effect of changes in foreign exchange rates from changes in market prices on securities held. Such changes are included in net realized and unrealized gain or loss from investments in the Statement of Operations.
Realized foreign exchange gains or losses arise from sales of foreign currencies, currency gains or losses realized between the trade and settlement dates on securities transactions and the difference between the recorded amounts of dividends, interest, and foreign withholding taxes and the U.S. dollar equivalent of the amounts actually received or paid. Net unrealized foreign exchange gains and losses arise from changes in foreign exchange rates on foreign denominated assets and liabilities other than investments in securities held at the end of the reporting period.
c. Derivative Financial Instruments
The Fund invested in derivative financial instruments in order to manage risk or gain exposure to various other investments or markets. Derivatives are financial contracts based on an underlying or notional amount, require no initial investment or an initial net investment that is smaller than would normally be required to have a similar response to changes in market factors, and require or permit net settlement. Derivatives contain various risks including the potential inability of the counterparty to fulfill their obligations under the terms of the contract, the potential for an illiquid secondary market, and/or the potential for market movements which expose the Fund to gains or losses in excess of the amounts shown in the Statement of Assets and Liabilities. Realized gain and loss and unrealized appreciation and depreciation on these contracts for the period are included in the Statement of Operations.
Derivative counterparty credit risk is managed through a formal evaluation of the creditworthiness of all potential counter-parties. The Fund attempts to reduce its exposure to counterparty credit risk on OTC derivatives, whenever possible, by entering into International Swaps and Derivatives Association (ISDA) master agreements with certain counterparties. These agreements contain various provisions, including but not limited to collateral requirements, events of default, or early termination. Termination events applicable to
franklintempleton.com |
Annual Report |
27 |
FRANKLIN MUTUAL INTERNATIONAL FUND
NOTES TO FINANCIAL STATEMENTS
1. Organization and Significant Accounting Policies (continued)
c. Derivative Financial Instruments (continued)
the counterparty include certain deteriorations in the credit quality of the counterparty. Termination events applicable to the Fund include failure of the Fund to maintain certain net asset levels and/or limit the decline in net assets over various periods of time. In the event of default or early termination, the ISDA master agreement gives thenon-defaulting party the right to net andclose-out all transactions traded, whether or not arising under the ISDA agreement, to one net amount payable by one counterparty to the other. However, absent an event of default or early termination, OTC derivative assets and liabilities are presented gross and not offset in the Statement of Assets and Liabilities. Early termination by the counterparty may result in an immediate payment by the Fund of any net liability owed to that counterparty under the ISDA agreement.
Collateral requirements differ by type of derivative. Collateral or initial margin requirements are set by the broker or exchange clearing house for exchange traded and centrally cleared derivatives. Initial margin deposited is held at the exchange and can be in the form of cash and/or securities. For OTC derivatives traded under an ISDA master agreement, posting of collateral is required by either the Fund or the applicable counterparty if the total net exposure of all OTC derivatives with the applicable counterparty exceeds the minimum transfer amount, which typically ranges from $100,000 to $250,000, and can vary depending on the counterparty and the type of the agreement. Generally, collateral is determined at the close of Fund business each day and any additional collateral required due to changes in derivative values may be delivered by the Fund or the counterparty the next business day, or within a few business days. Collateral pledged and/or received by the Fund for OTC derivatives, if any, is held in segregated accounts with the Fund’s custodian/counterparty broker and can be in the form of cash and/or securities. Unrestricted cash may be invested according to the Fund’s investment objectives. To the extent that the amounts due to the Fund from its counterparties are not subject to collateralization or are not fully collateralized, the Fund bears the risk of loss from counterpartynon-performance.
The Fund entered into exchange traded futures contracts primarily to manage exposure to certain foreign currencies. A futures contract is an agreement between the Fund and a counterparty to buy or sell an asset at a specified price on a future date. Required initial margins are pledged by the Fund, and the daily change in fair value is accounted for as a variation margin payable or receivable in the Statement of Assets and Liabilities.
The Fund entered into OTC forward exchange contracts primarily to manage exposure to certain foreign currencies. A forward exchange contract is an agreement between the Fund and a counterparty to buy or sell a foreign currency at a specific exchange rate on a future date.
See Note 9 regarding other derivative information.
d. Securities Sold Short
The Fund is engaged in selling securities short, which obligates the Fund to replace a borrowed security with the same security at current fair value. The Fund incurs a loss if the price of the security increases between the date of the short sale and the date on which the Fund replaces the borrowed security. The Fund realizes a gain if the price of the security declines between those dates. Gains are limited to the price at which the Fund sold the security short, while losses are potentially unlimited in size.
The Fund is required to establish a margin account with the broker lending the security sold short. While the short sale is outstanding, the broker retains the proceeds of the short sale to the extent necessary to meet margin requirements until the short position is closed out. A deposit must also be maintained with the Fund’s custodian/counterparty broker consisting of cash and/or securities having a value equal to a specified percentage of the value of the securities sold short. The Fund is obligated to pay fees for borrowing the securities sold short and is required to pay the counterparty any dividends and/or interest due on securities sold short. Such dividends and/or interest and any security borrowing fees are recorded as an expense to the Fund. At December 31, 2018, the Fund had no securities sold short.
e. Securities Lending
The Fund participates in an agency based securities lending program to earn additional income. The Fund receives cash collateral against the loaned securities in an amount equal to at least 102% of the fair value of the loaned securities. Collateral is maintained over the life of the loan in an amount not less than 100% of the fair value of loaned securities, as determined at the close of Fund business each day; any additional collateral required due to changes in security values is delivered to the Fund on the next business day. The collateral is deposited into a
28 |
Annual Report |
franklintempleton.com |
FRANKLIN MUTUAL INTERNATIONAL FUND
NOTES TO FINANCIAL STATEMENTS
joint cash account with other funds and is used to invest in a money market fund managed by Franklin Advisers, Inc., an affiliate of the Fund, and/or a joint repurchase agreement. The Fund may receive income from the investment of cash collateral, in addition to lending fees and rebates paid by the borrower. Income from securities loaned, net of fees paid to the securities lending agent and/or third-party vendor, is reported separately in the Statement of Operations. The Fund bears the market risk with respect to the collateral investment, securities loaned, and the risk that the agent may default on its obligations to the Fund. If the borrower defaults on its obligation to return the securities loaned, the Fund has the right to repurchase the securities in the open market using the collateral received. The securities lending agent has agreed to indemnify the Fund in the event of default by a third party borrower. At December 31, 2018, the Fund had no securities on loan.
f. Income and Deferred Taxes
It is the Fund’s policy to qualify as a regulated investment company under the Internal Revenue Code. The Fund intends to distribute to shareholders substantially all of its taxable income and net realized gains to relieve it from federal income and excise taxes. As a result, no provision for U.S. federal income taxes is required.
The Fund may be subject to foreign taxation related to income received, capital gains on the sale of securities and certain foreign currency transactions in the foreign jurisdictions in which it invests. Foreign taxes, if any, are recorded based on the tax regulations and rates that exist in the foreign markets in which the Fund invests. When a capital gain tax is determined to apply, the Fund records an estimated deferred tax liability in an amount that would be payable if the securities were disposed of on the valuation date.
As a result of several court cases, in certain countries across the European Union, the Fund filed additional tax reclaims for previously withheld taxes on dividends earned in those countries (EU reclaims). These additional filings are subject to various administrative proceedings by the local jurisdictions’ tax authorities within the European Union, as well as a number of related judicial proceedings. Income recognized, if any, for EU reclaims is reflected as other income in the Statement of Operations and any related receivable, if any, is reflected as European Union tax reclaims in the Statement of Assets and Liabilities. When uncertainty exists as to the ultimate resolution of these proceedings, the likelihood of receipt
of these EU reclaims, and the potential timing of payment, no amounts are reflected in the financial statements. For U.S. income tax purposes, EU reclaims received by the Fund, if any, reduce the amounts of foreign taxes Fund shareholders can use as tax credits in their individual income tax returns.
The Fund may recognize an income tax liability related to its uncertain tax positions under U.S. GAAP when the uncertain tax position has a less than 50% probability that it will be sustained upon examination by the tax authorities based on its technical merits. As of December 31, 2018, the Fund has determined that no tax liability is required in its financial statements related to uncertain tax positions for any open tax years (or expected to be taken in future tax years). Open tax years are those that remain subject to examination and are based on the statute of limitations in each jurisdiction in which the Fund invests.
g. Security Transactions, Investment Income, Expenses and Distributions
Security transactions are accounted for on trade date. Realized gains and losses on security transactions are determined on a specific identification basis. Interest income and estimated expenses are accrued daily. Amortization of premium and accretion of discount on debt securities are included in interest income. Dividend income is recorded on theex-dividend date except for certain dividends from securities where the dividend rate is not available. In such cases, the dividend is recorded as soon as the information is received by the Fund. Distributions to shareholders are recorded on theex-dividend date. Distributable earnings are determined according to income tax regulations (tax basis) and may differ from earnings recorded in accordance with U.S. GAAP. These differences may be permanent or temporary. Permanent differences are reclassified among capital accounts to reflect their tax character. These reclassifications have no impact on net assets or the results of operations. Temporary differences are not reclassified, as they may reverse in subsequent periods.*
Common expenses incurred by the Trust are allocated among the Funds based on the ratio of net assets of each Fund to the combined net assets of the Trust or based on the ratio of number of shareholders of each Fund to the combined number of shareholders of the Trust. Fund specific expenses are charged directly to the Fund that incurred the expense.
franklintempleton.com |
Annual Report |
29 |
FRANKLIN MUTUAL INTERNATIONAL FUND
NOTES TO FINANCIAL STATEMENTS
1. Organization and Significant Accounting Policies(continued)
g. Security Transactions, Investment Income, Expenses and Distributions(continued)
Realized and unrealized gains and losses and net investment income, excluding class specific expenses, are allocated daily to each class of shares based upon the relative proportion of net assets of each class. Differences in per share distributions by class are generally due to differences in class specific expenses.
h. Accounting Estimates
The preparation of financial statements in accordance with U.S. GAAP requires management to make estimates and assumptions that affect the reported amounts of assets and liabilities at the date of the financial statements and the amounts of income and expenses during the reporting period. Actual results could differ from those estimates.
i. Guarantees and Indemnifications
Under the Trust’s organizational documents, its officers and trustees are indemnified by the Trust against certain liabilities arising out of the performance of their duties to the Trust. Additionally, in the normal course of business, the Trust, on behalf of the Fund, enters into contracts with service providers that contain general indemnification clauses. The Trust’s maximum exposure under these arrangements is unknown as this would involve future claims that may be made against the Trust that have not yet occurred. Currently, the Trust expects the risk of loss to be remote.
*Effective during the current reporting period, it is no longer required to present certain line items in the Statements of Changes in Net Assets. The below prior period amounts affected by this change are shown as they were in the prior year Statements of Changes in Net Assets.
For the year ended December 31, 2017, distributions to shareholders were as follows:
Distributions from net investment income : | ||||
Class Z | $ | (1,857,997 | ) | |
Class A | (1,574,566 | ) | ||
Class C | (348,684 | ) | ||
Class R | (35,346 | ) | ||
Class R6 | (569,536 | ) |
For the year ended December 31, 2017, distributions in excess of net investment income included in net assets was $(2,125,110).
2. Shares of Beneficial Interest
At December 31, 2018, there were an unlimited number of shares authorized (without par value). Transactions in the Fund’s shares were as follows:
Year Ended December 31, | ||||||||||||||||
| 2018 | 2017 | |||||||||||||||
| Shares | Amount | Shares | Amount | |||||||||||||
| Class Z Shares: | ||||||||||||||||
Shares sold | 2,069,714 | $ | 29,602,759 | 3,534,237 | $ | 54,797,744 | ||||||||||
Shares issued in reinvestment of distributions | 104,086 | 1,342,966 | 114,066 | 1,815,700 | ||||||||||||
Shares redeemed | (3,501,255 | ) | (51,335,452 | ) | (1,098,953 | ) | (17,291,118 | ) | ||||||||
Net increase (decrease) | (1,327,455 | ) | $ | (20,389,727 | ) | 2,549,350 | $ | 39,322,326 | ||||||||
30 |
Annual Report |
franklintempleton.com |
FRANKLIN MUTUAL INTERNATIONAL FUND
NOTES TO FINANCIAL STATEMENTS
Year Ended December 31, | ||||||||||||||||
| 2018 | 2017 | |||||||||||||||
| Shares | Amount | Shares | Amount | |||||||||||||
| Class A Shares: | ||||||||||||||||
Shares solda | 1,021,682 | $ | 15,233,084 | 1,959,536 | $ | 30,501,176 | ||||||||||
Shares issued in reinvestment of distributions | 97,868 | 1,258,830 | 98,350 | 1,558,023 | ||||||||||||
Shares redeemed | (2,182,962 | ) | (32,698,928 | ) | (2,635,900 | ) | (40,022,981 | ) | ||||||||
Net increase (decrease) | (1,063,412 | ) | $ | (16,207,014 | ) | (578,014 | ) | $ | (7,963,782 | ) | ||||||
| Class C Shares: | ||||||||||||||||
Shares sold | 222,976 | $ | 3,422,701 | 572,952 | $ | 8,653,851 | ||||||||||
Shares issued in reinvestment of distributions | 11,409 | 150,533 | 22,302 | 348,313 | ||||||||||||
Shares redeemeda | (1,010,609 | ) | (15,058,426 | ) | (577,334 | ) | (8,776,064 | ) | ||||||||
Net increase (decrease) | (776,224 | ) | $ | (11,485,192 | ) | 17,920 | $ | 226,100 | ||||||||
| Class R Shares: | ||||||||||||||||
Shares sold | 50,432 | $ | 776,090 | 113,248 | $ | 1,751,799 | ||||||||||
Shares issued in reinvestment of distributions | 2,782 | 35,634 | 2,245 | 35,346 | ||||||||||||
Shares redeemed | (39,495 | ) | (605,673 | ) | (46,246 | ) | (727,130 | ) | ||||||||
Net increase (decrease) | 13,719 | $ | 206,051 | 69,247 | $ | 1,060,015 | ||||||||||
| Class R6 Shares: | ||||||||||||||||
Shares sold | 360,960 | $ | 5,502,994 | 685,257 | $ | 10,863,178 | ||||||||||
Shares issued in reinvestment of distributions | 44,003 | 566,278 | 35,752 | 569,536 | ||||||||||||
Shares redeemed | (443,682 | ) | (6,794,236 | ) | (277,679 | ) | (4,337,610 | ) | ||||||||
Net increase (decrease) | (38,719 | ) | $ | (724,964 | ) | 443,330 | $ | 7,095,104 | ||||||||
| aMay | include a portion of Class C shares that were automatically converted to Class A. |
3. Transactions with Affiliates
Franklin Resources, Inc. is the holding company for various subsidiaries that together are referred to as Franklin Templeton. Certain officers and trustees of the Fund are also officers and/or directors of the following subsidiaries:
| Subsidiary | Affiliation | |
Franklin Mutual Advisers, LLC (Franklin Mutual) | Investment manager | |
Franklin Templeton Services, LLC (FT Services) | Administrative manager | |
Franklin Templeton Distributors, Inc. (Distributors) | Principal underwriter | |
Franklin Templeton Investor Services, LLC (Investor Services) | Transfer agent | |
a. Management Fees
The Fund pays an investment management fee to Franklin Mutual of 0.875% per year of the average daily net assets of the Fund.
b. Administrative Fees
Under an agreement with Franklin Mutual, FT Services provides administrative services to the Fund. The fee is paid by Franklin Mutual based on the Fund’s average daily net assets, and is not an additional expense of the Fund.
franklintempleton.com |
Annual Report |
31 |
FRANKLIN MUTUAL INTERNATIONAL FUND
NOTES TO FINANCIAL STATEMENTS
3. Transactions with Affiliates (continued)
c. Distribution Fees
The Board has adopted distribution plans for each share class, with the exception of Class Z and Class R6 shares, pursuant to Rule12b-1 under the 1940 Act. Under the Fund’s Class A reimbursement distribution plan, the Fund reimburses Distributors for costs incurred in connection with the servicing, sale and distribution of the Fund’s shares up to the maximum annual plan rate. Under the Class A reimbursement distribution plan, costs exceeding the maximum for the current plan year cannot be reimbursed in subsequent periods. In addition, under the Fund’s Class C and R compensation distribution plans, the Fund pays Distributors for costs incurred in connection with the servicing, sale and distribution of the Fund’s shares up to the maximum annual plan rate for each class. The plan year, for purposes of monitoring compliance with the maximum annual plan rates, is February 1 through January 31.
The maximum annual plan rates, based on the average daily net assets, for each class, are as follows:
Class A | 0.35 | % | ||
Class C | 1.00 | % | ||
Class R | 0.50 | % |
The Board has set the current rate at 0.25% per year for Class A shares until further notice and approval by the Board.
d. Sales Charges/Underwriting Agreements
Front-end sales charges and contingent deferred sales charges (CDSC) do not represent expenses of the Fund. These charges are deducted from the proceeds of sales of Fund shares prior to investment or from redemption proceeds prior to remittance, as applicable. Distributors has advised the Fund of the following commission transactions related to the sales and redemptions of the Fund’s shares for the year:
Sales charges retained net of commissions paid to unaffiliated brokers/dealers | $ | 15,376 | ||
CDSC retained | $ | 1,741 | ||
Effective September 10, 2018, the Board approved changes to certainfront-end sales charges and dealer commissions on Class A shares. Further details are disclosed in the Fund’s Prospectus.
e. Transfer Agent Fees
Each class of shares pays transfer agent fees to Investor Services for its performance of shareholder servicing obligations. The fees are based on an annualized asset based fee of 0.02% plus a transaction based fee. In addition, each class reimburses Investor Services for out of pocket expenses incurred and, except for Class R6, reimburses shareholder servicing fees paid to third parties. These fees are allocated daily based upon their relative proportion of such classes’ aggregate net assets. Class R6 pays Investor Services transfer agent fees specific to that class.
For the year ended December 31, 2018, the Fund paid transfer agent fees of $344,342, of which $165,784 was retained by Investor Services.
32 |
Annual Report |
franklintempleton.com |
FRANKLIN MUTUAL INTERNATIONAL FUND
NOTES TO FINANCIAL STATEMENTS
f. Investments in Affiliated Management Investment Companies
The Fund invests in one or more affiliated management investment companies for purposes other than exercising a controlling influence over the management or policies. Management fees paid by the Fund are waived on assets invested in the affiliated management investment companies, as noted in the Statement of Operations, in an amount not to exceed the management and administrative fees paid directly or indirectly by each affiliate. During the year ended December 31, 2018, the Fund held investments in affiliated management investment companies as follows:
| Number of Shares Held at Beginning of Year | Gross Additions | Gross Reductions | Number of Held at End | Value Year | Income from securities loaned | Realized Gain (Loss) | Net Change in Unrealized Appreciation (Depreciation) | |||||||||||||||||||||||||
| Non-Controlled Affiliates | ||||||||||||||||||||||||||||||||
Institutional Fiduciary Trust Money Market Portfolio, 1.99% | — | 1,357,000 | (1,357,000 | ) | — | $ | — | $679 | $ | — | $ | — | ||||||||||||||||||||
|
| |||||||||||||||||||||||||||||||
g. Waiver and Expense Reimbursements
Franklin Mutual and Investor Services have contractually agreed in advance to waive or limit their respective fees and to assume as their own expense certain expenses otherwise payable by the Fund so that the expenses (excluding distribution fees, acquired fund fees and expenses and certainnon-routine expenses or costs, including those relating to litigation, indemnification, reorganizations, and liquidations) for each class of the Fund do not exceed 0.97% and Class R6 does not exceed 0.83% based on the average net assets of each class until April 30, 2019. Total expenses waived or paid are not subject to recapture subsequent to the Fund’s fiscal year end.
Prior to May 1, 2018, the expenses (excluding certain fees and expenses as previously disclosed) for Class R6 were limited to 0.81% based on the average net assets of the class.
Prior to February 1, 2018, the expenses (excluding certain fees and expenses as previously disclosed) for each class of the Fund were limited to 1.17% and expenses for Class R6 were limited to 1.01% based on the average net assets of each class.
h. Other Affiliated Transactions
At December 31, 2018, one or more of the funds in Franklin Fund Allocator Series owned 9.4% of the Fund’s outstanding shares.
4. Expense Offset Arrangement
The Fund has entered into an arrangement with its custodian whereby credits realized as a result of uninvested cash balances are used to reduce a portion of the Fund’s custodian expenses. During the year ended December 31, 2018, the custodian fees were reduced as noted in the Statement of Operations.
5. Independent Trustees’ Retirement Plan
On January 1, 1993, the Trust adopted an Independent Trustees’ Retirement Plan (Plan). The Plan is an unfunded defined benefit plan that provides benefit payments to Trustees whose length of service and retirement age meets the eligibility requirements of the Plan. Benefits under the Plan are based on years of service and fees paid to each trustee at the time of retirement. Effective in December 1996, the Plan was closed to new participants.
During the year ended December 31, 2018, the Fund’s projected benefit obligation and benefit payments under the Plan were as follows:
aProjected benefit obligation at December 31, 2018 | $ | 2,899 |
franklintempleton.com |
Annual Report |
33 |
FRANKLIN MUTUAL INTERNATIONAL FUND
NOTES TO FINANCIAL STATEMENTS
5. Independent Trustees’ Retirement Plan(continued)
bIncrease in projected benefit obligation | $ | 2,801 | ||
Benefit payments made to retired trustees | $ | (217 | ) |
aThe projected benefit obligation is included in trustees’ fees and expenses in the Statement of Assets and Liabilities.
bThe increase in projected benefit obligation is included in trustees’ fees and expenses in the Statement of Operations.
6. Income Taxes
During the year ended December 31, 2018 the Fund utilized $13,950,672 of capital loss carryforwards.
For tax purposes, the Fund may elect to defer any portion of a post-October capital loss or late-year ordinary loss to the first day of the following fiscal year. At December 31, 2018, the Fund deferred post-October capital losses of $1,395,980 and late-year ordinary losses of $217,602.
The tax character of distributions paid during the years ended December 31, 2018 and 2017, was as follows:
| 2018 | 2017 | |||||||
Distributions paid from: | ||||||||
Ordinary income | $ | 2,390,052 | $ | 4,386,129 | ||||
Long term capital gain | 1,002,381 | — | ||||||
| $ | 3,392,433 | $ | 4,386,129 | |||||
At December 31, 2018, the cost of investments, net unrealized appreciation (depreciation) and undistributed long term capital gains for income tax purposes were as follows:
Cost of investments | $ | 168,992,098 | ||
Unrealized appreciation | $ | 5,793,363 | ||
Unrealized depreciation | (32,792,185 | ) | ||
Net unrealized appreciation (depreciation) | $ | (26,998,822 | ) | |
Distributable earnings: | ||||
Undistributed long term capital gains | $ | 278,184 | ||
Differences between income and/or capital gains as determined on a book basis and a tax basis are primarily due to differing treatments of foreign currency transactions and passive foreign investment company shares.
The Fund utilized a tax accounting practice to treat a portion of the proceeds from capital shares redeemed as a distribution from realized capital gains.
7. Investment Transactions
Purchases and sales of investments (excluding short term securities) for the year ended December 31, 2018, aggregated $52,576,950 and $92,892,733, respectively.
34 |
Annual Report |
franklintempleton.com |
FRANKLIN MUTUAL INTERNATIONAL FUND
NOTES TO FINANCIAL STATEMENTS
8. Concentration of Risk
Investing in foreign securities may include certain risks and considerations not typically associated with investing in U.S. securities, such as fluctuating currency values and changing local and regional economic, political and social conditions, which may result in greater market volatility. Current political and financial uncertainty surrounding the European Union may increase market volatility and the economic risk of investing in securities in Europe. In addition, certain foreign securities may not be as liquid as U.S. securities.
9. Other Derivative Information
At December 31, 2018, the Fund’s investments in derivative contracts are reflected in the Statement of Assets and Liabilities as follows:
| Asset Derivatives | Liability Derivatives | |||||||||||||||
|
| |||||||||||||||
| Derivative Contracts Not Accounted for as Hedging Instruments | Statement of Assets and Liabilities Location | Fair Value | Statement of Assets and Liabilities Location | Fair Value | ||||||||||||
Foreign exchange contracts | Variation margin on futures contracts | $ | 14,132 | a | Variation margin on futures contracts | $ — | ||||||||||
Unrealized appreciation on OTC forward exchange contracts | 1,266,076 | Unrealized depreciation on OTC forward exchange contracts | 375,879 | |||||||||||||
|
|
|
| |||||||||||||
Totals | $ | 1,280,208 | $375,879 | |||||||||||||
|
|
|
| |||||||||||||
aThis amount reflects the cumulative appreciation (depreciation) of futures contracts as reported in the Statement of Investments. Only the variation margin receivable/ payable at year end is separately reported within the Statement of Assets and Liabilities. Prior variation margin movements were recorded to cash upon receipt or payment.
For the year ended December 31, 2018, the effect of derivative contracts in the Fund’s Statement of Operations was as follows:
| Derivative Contracts Not Accounted for as Hedging Instruments | Statement of Operations Location | Net Realized Gain (Loss) for the Year | Statement of Operations Location | Net Change in Unrealized Appreciation (Depreciation) for the Year | ||||||||
Net realized gain (loss) from: | Net change in unrealized appreciation (depreciation) on: | |||||||||||
Foreign exchange contracts | Forward exchange contracts | $2,367,152 | Forward exchange contracts | $3,845,145 | ||||||||
Futures contracts | 1,559,890 | Futures contracts | 396,088 | |||||||||
|
|
|
| |||||||||
Totals | $3,927,042 | $4,241,233 | ||||||||||
|
|
|
| |||||||||
For the year ended December 31, 2018, the average month end notional amount of futures contracts represented $25,919,681. The average month end contract value of forward exchange contracts was $122,720,122.
At December 31, 2018, the Fund’s OTC derivative assets and liabilities are as follows:
Gross Amounts of in the Statement of Assets and Liabilities | ||||||||
|
| |||||||
| Assetsa | Liabilitiesa | |||||||
| ||||||||
| Derivatives | ||||||||
Forward exchange contracts | $1,266,076 | $375,879 | ||||||
|
| |||||||
aAbsent an event of default or early termination, OTC derivative assets and liabilities are presented gross and not offset in the Statement of Assets and Liabilities.
franklintempleton.com |
Annual Report |
35 |
FRANKLIN MUTUAL INTERNATIONAL FUND
NOTES TO FINANCIAL STATEMENTS
9. Other Derivative Information (continued)
At December 31, 2018, the Fund’s OTC derivative assets, which may be offset against the Fund’s OTC derivative liabilities and collateral received from the counterparty, are as follows:
Amounts Not Offset in the Statement of Assets and Liabilities | ||||||||||||||||||||
Gross Amounts of | Financial Instruments Available for Offset | Financial Instruments Collateral Receiveda,b | Cash Collateral Received | Net Amount (Not less than zero) | ||||||||||||||||
| Counterparty | ||||||||||||||||||||
BOFA | $ 106,863 | $ — | $(106,863 | ) | $ — | $ — | ||||||||||||||
BONY | 183,714 | (84,192 | ) | (99,522 | ) | — | — | |||||||||||||
HSBK | 43,129 | (5,770 | ) | (26,251 | ) | — | 11,108 | |||||||||||||
SSBT | 751,777 | — | (751,777 | ) | — | — | ||||||||||||||
UBSW | 180,593 | (180,593 | ) | — | — | — | ||||||||||||||
Total | $1,266,076 | $(270,555 | ) | $(984,413 | ) | $ — | $11,108 | |||||||||||||
At December 31, 2018, the Fund’s OTC derivative liabilities, which may be offset against the Fund’s OTC derivative assets and collateral pledged to the counterparty, are as follows:
Amounts Not Offset in the Statement of Assets and Liabilities | ||||||||||||||||||||
Gross Amounts of | Financial Instruments Available for Offset | Financial Instruments Collateral Pledged | Cash Collateral Pledged | Net Amount (Not less than zero) | ||||||||||||||||
| Counterparty | ||||||||||||||||||||
BOFA | $ — | $ — | $ — | $ — | $ — | |||||||||||||||
BONY | 84,192 | (84,192 | ) | — | — | — | ||||||||||||||
HSBK | 5,770 | (5,770 | ) | — | — | — | ||||||||||||||
SSBT | — | — | — | — | — | |||||||||||||||
UBSW | 285,917 | (180,593 | ) | — | — | 105,324 | ||||||||||||||
Total | $375,879 | $(270,555 | ) | $ — | $ — | $105,324 | ||||||||||||||
aAt December 31, 2018, the Fund received U.K. Treasury Bonds and U.S. Treasury Bills, Bonds and Notes as collateral for derivatives.
bIn some instances, the collateral amounts disclosed in the table above were adjusted due to the requirement to limit the collateral amounts to avoid the effect of overcollateralization. Actual collateral received and/or pledged may be more than the amounts disclosed herein.
See Note 1(c) regarding derivative financial instruments.
See Abbreviations on page 38.
10. Credit Facility
The Fund, together with other U.S. registered and foreign investment funds (collectively, Borrowers), managed by Franklin Templeton, are borrowers in a joint syndicated senior unsecured credit facility totaling $2 billion (Global Credit Facility) which matured on February 8, 2019. This Global Credit Facility provides a source of funds to the Borrowers for temporary and emergency purposes, including the ability to meet future unanticipated or unusually large redemption requests. Effective February 8, 2019, the Borrowers renewed the Global Credit Facility for a one year term, maturing February 7, 2020, for a total of $2 billion.
36 |
Annual Report |
franklintempleton.com |
FRANKLIN MUTUAL INTERNATIONAL FUND
NOTES TO FINANCIAL STATEMENTS
Under the terms of the Global Credit Facility, the Fund shall, in addition to interest charged on any borrowings made by the Fund and other costs incurred by the Fund, pay its share of fees and expenses incurred in connection with the implementation and maintenance of the Global Credit Facility, based upon its relative share of the aggregate net assets of all of the Borrowers, including an annual commitment fee of 0.15% based upon the unused portion of the Global Credit Facility. These fees are reflected in other expenses in the Statement of Operations. During the year ended December 31, 2018, the Fund did not use the Global Credit Facility.
11. Fair Value Measurements
The Fund follows a fair value hierarchy that distinguishes between market data obtained from independent sources (observable inputs) and the Fund’s own market assumptions (unobservable inputs). These inputs are used in determining the value of the Fund’s financial instruments and are summarized in the following fair value hierarchy:
| • | Level 1 – quoted prices in active markets for identical financial instruments |
| • | Level 2 – other significant observable inputs (including quoted prices for similar financial instruments, interest rates, prepayment speed, credit risk, etc.) |
| • | Level 3 – significant unobservable inputs (including the Fund’s own assumptions in determining the fair value of financial instruments) |
The input levels are not necessarily an indication of the risk or liquidity associated with financial instruments at that level.
A summary of inputs used as of December 31, 2018, in valuing the Fund’s assets and liabilities carried at fair value, is as follows:
| Level 1 | Level 2 | Level 3 | Total | |||||||||||||
| Assets: | ||||||||||||||||
Investments in Securities:a | ||||||||||||||||
Equity Investments:b | ||||||||||||||||
Automobiles | $ | 2,963,216 | $ | 2,169,647 | $ | — | $ | 5,132,863 | ||||||||
Banks | 11,887,810 | 4,530,802 | — | 16,418,612 | ||||||||||||
Capital Markets | 805,227 | 4,145,374 | — | 4,950,601 | ||||||||||||
Chemicals | — | 1,962,158 | — | 1,962,158 | ||||||||||||
Construction Materials | — | 2,360,421 | — | 2,360,421 | ||||||||||||
Consumer Finance | 1,359,769 | 2,046,577 | — | 3,406,346 | ||||||||||||
Oil, Gas & Consumable Fuels | 11,619,116 | 1,701,826 | — | 13,320,942 | ||||||||||||
Pharmaceuticals | 4,065,296 | 4,896,957 | — | 8,962,253 | ||||||||||||
Specialty Retail | — | 3,891,297 | — | 3,891,297 | ||||||||||||
All Other Equity Investments | 69,003,115 | — | — | 69,003,115 | ||||||||||||
Short Term Investments | 8,979,621 | 2,700,000 | — | 11,679,621 | ||||||||||||
Total Investments in Securities | $ | 110,683,170 | $ | 30,405,059 | $ | — | $ | 141,088,229 | ||||||||
Other Financial Instruments: | ||||||||||||||||
Futures Contracts | $ | 14,132 | $ | — | $ | — | $ | 14,132 | ||||||||
Forward Exchange Contracts | — | 1,266,076 | — | 1,266,076 | ||||||||||||
Total Other Financial Instruments | $ | 14,132 | $ | 1,266,076 | $ | — | $ | 1,280,208 | ||||||||
| Liabilities: | ||||||||||||||||
Other Financial Instruments: | ||||||||||||||||
Forward Exchange Contracts | $ | — | $ | 375,879 | $ | — | $ | 375,879 | ||||||||
aFor detailed categories, see the accompanying Statement of Investments.
bIncludes common and preferred stocks.
franklintempleton.com |
Annual Report |
37 |
FRANKLIN MUTUAL INTERNATIONAL FUND
NOTES TO FINANCIAL STATEMENTS
12. New Accounting Pronouncements
In August 2018, the Financial Accounting Standards Board issued Accounting Standards Update (ASU)No. 2018-14, Compensation—Retirement Benefits—Defined Benefit Plans—General (Subtopic715-20): Disclosure Framework—Changes to the Disclosure Requirements for Defined Benefit Plans. The amendments in the ASU modify the disclosure requirements for employers that sponsor defined benefit pension or other postretirement plans. The ASU is effective for annual reporting periods ending after December 15, 2020. Management is currently evaluating the impact, if any, of applying this provision.
13. Subsequent Events
The Fund has evaluated subsequent events through the issuance of the financial statements and determined that no events have occurred that require disclosure other than those already disclosed in the financial statements.
Abbreviations
| Counterparty | Currency | Selected Portfolio | ||||||||
| BOFA | Bank of America Corp. | EUR | Euro | ADR | American Depositary Receipt | |||||
| BONY | The Bank of New York Mellon Corp. | GBP | British Pound | FHLB | Federal Home Loan Bank | |||||
| HSBK | HSBC Bank PLC | USD | United States Dollar | |||||||
| SSBT | State Street Bank and Trust Co., N.A. | |||||||||
| UBSW | UBS AG | |||||||||
38 |
Annual Report |
franklintempleton.com |
FRANKLIN MUTUAL INTERNATIONAL FUND
Report of Independent Registered Public Accounting Firm
To the Board of Trustees of Franklin Mutual Series Funds and Shareholders of Franklin Mutual International Fund:
Opinion on the Financial Statements
We have audited the accompanying statement of assets and liabilities of Franklin Mutual International Fund (the “Fund”) (one of the funds constituting Franklin Mutual Series Funds), including the schedule of investments, as of December 31, 2018, and the related statement of operations for the year then ended, the statements of changes in net assets for each of the two years in the period then ended, the financial highlights for each of the five years in the period then ended and the related notes (collectively referred to as the “financial statements”). In our opinion, the financial statements present fairly, in all material respects, the financial position of Franklin Mutual International Fund (one of the funds constituting Franklin Mutual Series Funds) at December 31, 2018, the results of its operations for the year then ended, the changes in its net assets for each of the two years in the period then ended and its financial highlights for each of the five years in the period then ended, in conformity with U.S. generally accepted accounting principles.
Basis for Opinion
These financial statements are the responsibility of the Fund’s management. Our responsibility is to express an opinion on the Fund’s financial statements based on our audits. We are a public accounting firm registered with the Public Company Accounting Oversight Board (United States) (“PCAOB”) and are required to be independent with respect to the Fund in accordance with the U.S. federal securities laws and the applicable rules and regulations of the Securities and Exchange Commission and the PCAOB.
We conducted our audits in accordance with the standards of the PCAOB. Those standards require that we plan and perform the audit to obtain reasonable assurance about whether the financial statements are free of material misstatement, whether due to error or fraud. The Fund is not required to have, nor were we engaged to perform, an audit of the Fund’s internal control over financial reporting. As part of our audits, we are required to obtain an understanding of internal control over financial reporting, but not for the purpose of expressing an opinion on the effectiveness of the Fund’s internal control over financial reporting. Accordingly, we express no such opinion.
Our audits included performing procedures to assess the risks of material misstatement of the financial statements, whether due to error or fraud, and performing procedures that respond to those risks. Such procedures included examining, on a test basis, evidence regarding the amounts and disclosures in the financial statements. Our procedures included confirmation of securities owned as of December 31, 2018, by correspondence with the custodian and brokers. Our audits also included evaluating the accounting principles used and significant estimates made by management, as well as evaluating the overall presentation of the financial statements. We believe that our audits provide a reasonable basis for our opinion.
We have served as the auditor of one or more Franklin investment companies since 1987.
Boston, Massachusetts
February 20, 2019
franklintempleton.com | Annual Report | 39 | ||||
FRANKLIN MUTUAL INTERNATIONAL FUND
Under Section 852(b)(3)(C) of the Internal Revenue Code, the Fund hereby reports the maximum amount allowable but no less than $1,220,154 as a long term capital gain dividend for the fiscal year ended December 31, 2018.
Under Section 854(b)(1)(B) of the Internal Revenue Code, the Fund hereby reports the maximum amount allowable but no less than $4,887,764 as qualified dividends for purposes of the maximum rate under Section 1(h)(11) of the Internal Revenue Code for the fiscal year ended December 31, 2018. Distributions, including qualified dividend income, paid during calendar year 2018 will be reported to shareholders on Form1099-DIV bymid-February 2019. Shareholders are advised to check with their tax advisors for information on the treatment of these amounts on their individual income tax returns.
At December 31, 2018, more than 50% of the Fund’s total assets were invested in securities of foreign issuers. In most instances, foreign taxes were withheld from income paid to the Fund on these investments. As shown in the table below, the Fund hereby reports to shareholders the foreign source income and foreign taxes paid, pursuant to Section 853 of the Internal Revenue Code. This written statement will allow shareholders of record on December 20, 2018, to treat their proportionate share of foreign taxes paid by the Fund as having been paid directly by them. The shareholder shall consider these amounts as foreign taxes paid in the tax year in which they receive the Fund distribution.
The following table provides a detailed analysis of foreign tax paid, foreign source income and foreign source qualified dividends as reported by the Fund, to Class Z, Class A, Class C, Class R and Class R6 shareholders of record.
| Class | Foreign Tax Paid Per Share | Foreign Source Income Per Share | Foreign Source Qualified Dividends Per Share | |||||||||
Class Z | $0.0555 | $0.3726 | $0.2986 | |||||||||
Class A | $0.0555 | $0.3314 | $0.2653 | |||||||||
Class C | $0.0555 | $0.1490 | $0.1193 | |||||||||
Class R | $0.0555 | $0.3000 | $0.2403 | |||||||||
Class R6 | $0.0555 | $0.4013 | $0.3214 | |||||||||
Foreign Tax Paid Per Share (Column 1) is the amount per share available to you, as a tax credit (assuming you held your shares in the Fund for a minimum of 16 days during the31-day period beginning 15 days before theex-dividend date of the Fund’s distribution to which the foreign taxes relate), or, as a tax deduction.
Foreign Source Income Per Share (Column 2) is the amount per share of income dividends attributable to foreign securities held by the Fund, plus any foreign taxes withheld on these dividends. The amounts reported include foreign source qualified dividends that have not been adjusted for the rate differential applicable to such dividend income.1
Foreign Source Qualified Dividends Per Share (Column 3) is the amount per share of foreign source qualified dividends, plus any foreign taxes withheld on these dividends. These amounts represent the portion of the Foreign Source Income reported to you in column 2 that were derived from qualified foreign securities held by the Fund.1
Bymid-February 2019, shareholders will receive Form1099-DIV which will include their share of taxes paid and foreign source income distributed during the calendar year 2018. The Foreign Source Income reported on Form1099-DIV has not been adjusted for the rate differential on foreign source qualified dividend income. Shareholders are advised to check with their tax advisors for information on the treatment of these amounts on their 2018 individual income tax returns.
1Qualified dividends are taxed at reduced long term capital gains tax rates. In determining the amount of foreign tax credit that may be applied against the U.S. tax liability of individuals receiving foreign source qualified dividends, adjustments may be required to the foreign tax credit limitation calculation to reflect the rate differential applicable to such dividend income. The rules however permit certain individuals to elect not to apply the rate differential adjustments for capital gains and/or dividends for any taxable year. Please consult your tax advisor and the instructions to Form 1116 for more information.
40 |
Annual Report |
franklintempleton.com |
FRANKLIN MUTUAL SERIES FUNDS
The name, year of birth and address of the officers and board members, as well as their affiliations, positions held with the Trust, principal occupations during at least the past five years and number of U.S. registered portfolios overseen in the Franklin Templeton Investments fund complex, are shown below. Generally, each board member serves until that person’s successor is elected and qualified.
Independent Board Members
| Name, Year of Birth and Address | Position | Length of Time Served | Number of Portfolios in Fund Complex Overseen by Board Member* | Other Directorships Held During at Least the Past 5 Years | ||||
Edward I. Altman, Ph.D. (1941) c/o Franklin Mutual Advisers, LLC 101 John F. Kennedy Parkway Short Hills, NJ 07078-2716 | Trustee | Since 1987 | 14 | None | ||||
Principal Occupation During at Least the Past 5 Years: Max L. Heine Professor of Finance, Emeritus and Director of The Credit and Debt Markets Research Program, Salomon Center, Stern School of Business, New York University; editor and author of numerous financial publications; financial consultant; an adviser to numerous financial and publishing organizations; andformerly, Vice Director, Salomon Center, Stern School of Business, New York University. | ||||||||
Ann Torre Bates (1958) c/o Franklin Mutual Advisers, LLC 101 John F. Kennedy Parkway Short Hills, NJ 07078-2716 | Trustee | Since 1995 | 38 | Ares Capital Corporation (specialty finance company) (2010-present), United Natural Foods, Inc. (distributor of natural, organic and specialty foods) (2013-present), Allied Capital Corporation (financial services) (2003-2010), SLM Corporation (Sallie Mae) (1997-2014) and Navient Corporation (loan management, servicing and asset recovery) (2014-2016). | ||||
Principal Occupation During at Least the Past 5 Years: Director of various companies; andformerly, Executive Vice President and Chief Financial Officer, NHP Incorporated (manager of multifamily housing) (1995-1997); and Vice President and Treasurer, US Airways, Inc. (until 1995). | ||||||||
Burton J. Greenwald (1929) c/o Franklin Mutual Advisers, LLC | Trustee and Vice Chairman | Trustee since 2002 and Vice Chairman since 2015 | 14 | Franklin Templeton Emerging Markets Debt Opportunities Fund PLC (1999-present) and Fiduciary International Ireland Limited (1999-2015). | ||||
Principal Occupation During at Least the Past 5 Years: Managing Director, B.J. Greenwald Associates (management consultants to the financial services industry); andformerly, Chairman, Fiduciary Trust International Funds; Executive Vice President, L.F. Rothschild Fund Management, Inc.; President and Director, Merit Mutual Funds; President, Underwriting Division and Director, National Securities & Research Corporation; Governor, Investment Company Institute; and Chairman, ICI Public Information Committee. | ||||||||
| Jan Hopkins Trachtman (1947) c/o Franklin Mutual Advisers, LLC 101 John F. Kennedy Parkway Short Hills, NJ 07078-2716 | Trustee | Since 2009 | 14 | FinTech Acquisition Corp. III (special purpose fintech acquisition company) (2018-present) | ||||
Principal Occupation During at Least the Past 5 Years: President and Founder, The Jan Hopkins Group (communications consulting firm); serves on Advisory Board of Knight Bagehot Fellowship; andformerly, President, Economic Club of New York (2007-2015); Anchor/Correspondent, CNN Financial News (until 2003); Managing Director and Head of Client Communications, Citigroup Private Bank (until 2005);Off-Air reporter, ABC News’ World News Tonight; and Editor, CBS Network News. | ||||||||
| Keith Mitchell (1954) c/o Franklin Mutual Advisers, LLC 101 John F. Kennedy Parkway Short Hills, NJ 07078-2716 | Trustee | Since 2009 | 14 | None | ||||
Principal Occupation During at Least the Past 5 Years: Director of various boards of asset management firms; andformerly, Managing Member, Mitchell, Hartley & Bechtel Advisers, LLC (formerly, Mitchell Advisers, LLC) (advisory firm) (2003-2015) and Managing Director, Putman Lovell NBF. | ||||||||
franklintempleton.com |
Annual Report |
41 |
FRANKLIN MUTUAL SERIES FUNDS
Independent Board Members(continued)
| ||||||||
| Name, Year of Birth and Address | Position | Length of Time Served | Number of Portfolios in by Board Member* | Other Directorships Held During at Least the Past 5 Years | ||||
| David W. Niemiec (1949) c/o Franklin Mutual Advisers, LLC 101 John F. Kennedy Parkway Short Hills, NJ 07078-2716 | Trustee | Since 2015 | 38 | Hess Midstream Partners LP (oil and gas midstream infrastructure) (2017-present). | ||||
Principal Occupation During at Least the Past 5 Years: Advisor, Saratoga Partners (private equity fund); andformerly, Managing Director, Saratoga Partners (1998-2001) and SBC Warburg Dillon Read (investment banking) (1997-1998); Vice Chairman, Dillon, Read & Co. Inc. (investment banking) (1991-1997); and Chief Financial Officer, Dillon, Read & Co. Inc. (1982-1997). | ||||||||
| Charles Rubens II (1930) c/o Franklin Mutual Advisers, LLC 101 John F. Kennedy Parkway Short Hills, NJ 07078-2716 | Trustee | Since 1998 | 14 | None | ||||
Principal Occupation During at Least the Past 5 Years: Private investor and president ofnon-profit organizations; andformerly, an executive of Time, Inc.; and Trustee of Colorado College. | ||||||||
| Robert E. Wade (1946) c/o Franklin Mutual Advisers, LLC 101 John F. Kennedy Parkway Short Hills, NJ 07078-2716 | Trustee and Chairman of the Board | Trustee since 1993 and Chairman of the Board since 2005 | 38 | El Oro Ltd (investments) (2003-present). | ||||
Principal Occupation During at Least the Past 5 Years: Attorney at law engaged in private practice as a sole practitioner (1972-2008) and member of various boards. | ||||||||
| Gregory H. Williams (1943) c/o Franklin Mutual Advisers, LLC 101 John F. Kennedy Parkway Short Hills, NJ 07078-2716 | Trustee | Since 2015 | 14 | None | ||||
Principal Occupation During at Least the Past 5 Years: Private investor; Consultant; andformerly, President, University of Cincinnati (2009-2012); President, The City College of New York (2001-2009); Dean, College of Law, Ohio State University (1993-2001); and Associate Vice President, Academic Affairs and Professor of Law, University of Iowa (1977-1993). | ||||||||
Interested Board Members and Officers | ||||||||
| Name, Year of Birth and Address | Position | Length of Time Served | Number of Portfolios in Fund Complex Overseen by Board Member* | Other Directorships Held During at Least the Past 5 Years | ||||
| **Gregory E. Johnson (1961) One Franklin Parkway San Mateo, CA 94403-1906 | Trustee | Since 2007 | 150 | None | ||||
Principal Occupation During at Least the Past 5 Years: Chairman of the Board, Member – Office of the Chairman, Director and Chief Executive Officer, Franklin Resources, Inc.; officer and/or director or trustee, as the case may be, of some of the other subsidiaries of Franklin Resources, Inc. and of 42 of the investment companies in Franklin Templeton Investments; Vice Chairman, Investment Company Institute; andformerly, President, Franklin Resources, Inc. (1994-2015). | ||||||||
| **Peter A. Langerman (1955) c/o Franklin Mutual Advisers, LLC 101 John F. Kennedy Parkway Short Hills, NJ 07078-2716 | Trustee, President, and Chief Executive Officer – Investment Management | Trustee since 2007, President, and Chief Executive Officer – Investment Management since 2005 | 7 | American International Group, Inc. (AIG) Credit Facility Trust (2010-2011). | ||||
Principal Occupation During at Least the Past 5 Years: Chairman of the Board, Chief Executive Officer and President, Franklin Mutual Advisers, LLC; President and Chief Investment Officer, Franklin Advisory Services, LLC; and officer and/or director, as the case may be, of three of the investment companies in Franklin Templeton Investments. | ||||||||
42 |
Annual Report |
franklintempleton.com |
FRANKLIN MUTUAL SERIES FUNDS
Interested Board Members and Officers(continued)
| ||||||||
| Name, Year of Birth and Address | Position | Length of Time Served | Number of Portfolios in Fund Complex Overseen by Board Member* | Other Directorships Held During at Least the Past 5 Years | ||||
| Alison E. Baur (1964) One Franklin Parkway San Mateo, CA 94403-1906 | Vice President | Since 2012 | Not Applicable | Not Applicable | ||||
Principal Occupation During at Least the Past 5 Years: Deputy General Counsel, Franklin Templeton Investments; and officer of some of the other subsidiaries of Franklin Resources, Inc. and of 44 of the investment companies in Franklin Templeton Investments. | ||||||||
| Aliya S. Gordon (1973) One Franklin Parkway San Mateo, CA 94403-1906 | Vice President | Since 2009 | Not Applicable | Not Applicable | ||||
Principal Occupation During at Least the Past 5 Years: Senior Associate General Counsel, Franklin Templeton Investments; and officer of 44 of the investment companies in Franklin Templeton Investments. | ||||||||
| Steven J. Gray (1955) One Franklin Parkway San Mateo, CA 94403-1906 | Vice President and Secretary | Vice President since 2009 and Secretary since 2005 | Not Applicable | Not Applicable | ||||
Principal Occupation During at Least the Past 5 Years: Senior Associate General Counsel, Franklin Templeton Investments; Vice President, Franklin Templeton Distributors, Inc. and FASA, LLC; and officer of 44 of the investment companies in Franklin Templeton Investments. | ||||||||
| Matthew T. Hinkle (1971) One Franklin Parkway San Mateo, CA 94403-1906 | Chief Executive Officer – Finance and Administration | Since 2017 | Not Applicable | Not Applicable | ||||
Principal Occupation During at Least the Past 5 Years: Senior Vice President, Franklin Templeton Services, LLC; officer of 44 of the investment companies in Franklin Templeton Investments; andformerly, Vice President, Global Tax (2012-April 2017) and Treasurer/Assistant Treasurer, Franklin Templeton Investments (2009-2017). | ||||||||
| Robert G. Kubilis (1973) 300 S.E. 2nd Street Fort Lauderdale, FL 33301-1923 | Chief Financial Officer, Chief Accounting Officer and Treasurer | Since 2012 | Not Applicable | Not Applicable | ||||
Principal Occupation During at Least the Past 5 Years: Treasurer, U.S. Fund Administration & Reporting, Franklin Templeton Investments; and officer of 16 of the investment companies in Franklin Templeton Investments. | ||||||||
| Robert Lim (1948) One Franklin Parkway San Mateo, CA 94403-1906 | Vice President – AML Compliance | Since 2016 | Not Applicable | Not Applicable | ||||
Principal Occupation During at Least the Past 5 Years: Vice President, Franklin Templeton Companies, LLC; Chief Compliance Officer, Franklin Templeton Distributors, Inc. and Franklin Templeton Investor Services, LLC; and officer of 44 of the investment companies in Franklin Templeton Investments. | ||||||||
| Kimberly H. Novotny (1972) 300 S.E. 2nd Street Fort Lauderdale, FL 33301-1923 | Vice President | Since 2013 | Not Applicable | Not Applicable | ||||
Principal Occupation During at Least the Past 5 Years: Associate General Counsel, Franklin Templeton Investments; Vice President and Corporate Secretary, Fiduciary Trust International of the South; Vice President, Templeton Investment Counsel, LLC; Assistant Secretary, Franklin Resources, Inc.; and officer of 44 of the investment companies in Franklin Templeton Investments. | ||||||||
franklintempleton.com |
Annual Report |
43 |
FRANKLIN MUTUAL SERIES FUNDS
Interested Board Members and Officers(continued)
| ||||||||
| Name, Year of Birth and Address | Position | Length of Time Served | Number of Portfolios in Fund Complex Overseen by Board Member* | Other Directorships Held During at Least the Past 5 Years | ||||
| Robert C. Rosselot (1960) 300 S.E. 2nd Street Fort Lauderdale, FL 33301-1923 | Chief Compliance Officer | Since 2013 | Not Applicable | Not Applicable | ||||
Principal Occupation During at Least the Past 5 Years: Director, Global Compliance, Franklin Templeton Investments; Vice President, Franklin Templeton Companies, LLC; officer of 44 of the investment companies in Franklin Templeton Investments; andformerly, Senior Associate General Counsel, Franklin Templeton Investments (2007-2013); and Secretary and Vice President, Templeton Group of Funds (2004-2013). | ||||||||
| Navid J. Tofigh (1972) One Franklin Parkway San Mateo, CA 94403-1906 | Vice President | Since 2015 | Not Applicable | Not Applicable | ||||
Principal Occupation During at Least the Past 5 Years: Associate General Counsel, Franklin Templeton Investments; and officer of 44 of the investment companies in Franklin Templeton Investments. | ||||||||
| Craig S. Tyle (1960) One Franklin Parkway San Mateo, CA 94403-1906 | Vice President | Since 2005 | Not Applicable | Not Applicable | ||||
Principal Occupation During at Least the Past 5 Years: General Counsel and Executive Vice President, Franklin Resources, Inc.; and officer of some of the other subsidiaries of Franklin Resources, Inc. and of 44 of the investment companies in Franklin Templeton Investments. | ||||||||
| Lori A. Weber (1964) 300 S.E. 2nd Street Fort Lauderdale, FL 33301-1923 | Vice President | Since 2011 | Not Applicable | Not Applicable | ||||
Principal Occupation During at Least the Past 5 Years: Senior Associate General Counsel, Franklin Templeton Investments; Assistant Secretary, Franklin Resources, Inc.; Vice President and Secretary, Templeton Investment Counsel, LLC; and officer of 44 of the investment companies in Franklin Templeton Investments. | ||||||||
44 |
Annual Report |
franklintempleton.com |
FRANKLIN MUTUAL SERIES FUNDS
*We base the number of portfolios on each separate series of the U.S. registered investment companies within the Franklin Templeton Investments fund complex. These portfolios have a common investment manager or affiliated investment managers.
**Gregory E. Johnson is considered to be an interested person of the Fund under the federal securities laws due to his position as an officer and director of Franklin Resources, Inc. (Resources), which is the parent company of the Fund’s investment manager and distributor. Peter A. Langerman is considered to be an interested person of the Fund under the federal securities laws due to his position as an officer of Franklin Mutual Advisers, LLC, which is the Fund’s investment manager.
Note 1: Officer information is current as of the date of this report. It is possible that after this date, information about officers may change.
The Sarbanes-Oxley Act of 2002 and Rules adopted by the U.S. Securities and Exchange Commission require the Fund to disclose whether the Fund’s Audit Committee includes at least one member who is an audit committee financial expert within the meaning of such Act and Rules. The Fund’s Board has determined that there is at least one such financial expert on the Audit Committee and has designated each of Edward I. Altman, Ph.D., Ann Torre Bates and David W. Niemiec as an audit committee financial expert. The Board believes that Messrs. Altman and Niemiec and Ms. Bates qualify as such an expert in view of their extensive business background and experience. Mr. Altman has served as a member of the Fund Audit Committee since 1987. He currently serves as a Max L. Hine Professor of Finance, Emeritus and Director of The Credit and Debt Markets Research Program, Salomon Center, Stern School of Business, New York University. Ms. Bates has served as a member of the Fund Audit Committee since 1995. She currently serves as a director of Ares Capital Corporation (2010-present) and United Natural Foods, Inc. (2013-present) and was formerly a director of Navient Corporation from 2014 to 2016, SLM Corporation from 1997 to 2014 and Allied Capital Corporation from 2003 to 2010, Executive Vice President and Chief Financial Officer of NHP Incorporated from 1995 to 1997 and Vice President and Treasurer of US Airways, Inc. until 1995. Mr. Niemiec has served as a member of the Fund Audit Committee since 2015, currently serves as an Advisor to Saratoga Partners and was formerly its Managing Director from 1998 to 2001 and serves as a director of Hess Midstream Partners LP (2017-present). Mr. Niemiec was formerly a director of Emeritus Corporation from 1999 to 2010 and OSI Pharmaceuticals, Inc. from 2006 to 2010, Managing Director of SBC Warburg Dillon Read from 1997 to 1998, and was Vice Chairman from 1991 to 1997 and Chief Financial Officer from 1982 to 1997 of Dillon, Read & Co. Inc. As a result of such background and experience, the Board believes that Messrs. Altman and Niemiec and Ms. Bates have each acquired an understanding of generally accepted accounting principles and financial statements, the general application of such principles in connection with the accounting estimates, accruals and reserves, and analyzing and evaluating financial statements that present a breadth and level of complexity of accounting issues generally comparable to those of the Fund, as well as an understanding of internal controls and procedures for financial reporting and an understanding of audit committee functions. Messrs. Altman and Niemiec and Ms. Bates are independent Board members as that term is defined under the applicable U.S. Securities and Exchange Commission Rules and Releases.
The Statement of Additional Information (SAI) includes additional information about the board members and is available, without charge, upon request. Shareholders may call (800) DIALBEN/342-5236 to request the SAI.
franklintempleton.com |
Annual Report |
45 |
FRANKLIN MUTUAL SERIES FUNDS
FRANKLIN MUTUAL INTERNATIONAL FUND
Proxy Voting Policies and Procedures
The Fund��s investment manager has established Proxy Voting Policies and Procedures (Policies) that the Fund uses to determine how to vote proxies relating to portfolio securities. Shareholders may view the Fund’s complete Policies online at franklintempleton.com. Alternatively, shareholders may request copies of the Policies free of charge by calling the Proxy Group collect at (954)527-7678 or by sending a written request to: Franklin Templeton Companies, LLC, 300 S.E. 2nd Street, Fort Lauderdale, FL 33301, Attention: Proxy Group. Copies of the Fund’s proxy voting records are also made available online at franklintempleton.com and posted on the U.S. Securities and Exchange Commission’s website at sec.gov and reflect the most recent12-month period ended June 30.
Quarterly Statement of Investments
The Trust, on behalf of the Fund, files a complete statement of investments with the U.S. Securities and Exchange Commission for the first and third quarters for each fiscal year on FormN-Q. Shareholders may view the filed FormN-Q by visiting the Commission’s website at sec.gov. The filed form may also be viewed and copied at the Commission’s Public Reference Room in Washington, DC. Information regarding the operations of the Public Reference Room may be obtained by calling(800) SEC-0330.
Householding of Reports and Prospectuses
You will receive the Fund’s financial reports every six months as well as an annual updated summary prospectus (prospectus available upon request). To reduce Fund expenses, we try to identify related shareholders in a household and send only one copy of the financial reports and summary prospectus. This process, called “householding,” will continue indefinitely unless you instruct us otherwise. If you prefer not to have these documents householded, please call us at (800)632-2301. At any time you may view current prospectuses/summary prospectuses and financial reports on our website. If you choose, you may receive these documents through electronic delivery.
46 |
Annual Report |
franklintempleton.com |
This page intentionally left blank.
This page intentionally left blank.
 | Annual Report and Shareholder Letter Franklin Mutual International Fund
Investment Manager Franklin Mutual Advisers, LLC
Distributor Franklin Templeton Distributors, Inc. (800) DIAL BEN®/342-5236 franklintempleton.com
Shareholder Services (800)632-2301 - (Class A, C, R & R6) (800)448-FUND - (Class Z) | |||
Authorized for distribution only when accompanied or preceded by a summary prospectus and/or prospectus. Investors should carefully consider a fund’s investment goals, risks, charges and expenses before investing. A prospectus contains this and other information; please read it carefully before investing.
To help ensure we provide you with quality service, all calls to and from our service areas are monitored and/or recorded.
| ||||
| © 2019 Franklin Templeton Investments. All rights reserved. | 373 A 02/19 | |||
| Item 2. | Code of Ethics. |
(a) The Registrant has adopted a code of ethics that applies to its principal executive officers and principal financial and accounting officer.
(c) N/A
(d) N/A
(f) Pursuant to Item 12(a)(1), the Registrant is attaching as an exhibit a copy of its code of ethics that applies to its principal executive officers and principal financial and accounting officer.
| Item 3. | Audit Committee Financial Expert. |
(a) (1) The registrant has an audit committee financial expert serving on its audit committee.
(2) The audit committee financial expert is Ann Torre Bates, and she is “independent” as defined under the relevant Securities and Exchange Commission Rules and Releases.
| Item 4. | Principal Accountant Fees and Services. |
(a) Audit Fees
The aggregate fees paid to the principal accountant for professional services rendered by the principal accountant for the audit of the registrant’s annual financial statements or for services that are normally provided by the principal accountant in connection with statutory and regulatory filings or engagements were $457,217 for the fiscal year ended December 31, 2018 and $557,692 for the fiscal year ended December 31, 2017.
(b) Audit-Related Fees
There were no fees paid to the principal accountant for assurance and related services rendered by the principal accountant to the registrant that are reasonably related to the performance of the audit of the registrant’s financial statements and are not reported under paragraph (a) of Item 4.
There were no fees paid to the principal accountant for assurance and related services rendered by the principal accountant to the registrant’s investment adviser and any entity controlling, controlled by or under common control with the investment adviser that provides ongoing services to the registrant that are reasonably related to the performance of the audit of their financial statements.
(c) Tax Fees
The aggregate fees paid to the principal accountant for professional services rendered by the principal accountant to the registrant for tax compliance, tax advice and tax planning were $20,026 the fiscal year ended December 31, 2018 and $4,544 for the fiscal year ended December 31, 2017. The services for which these fees were paid included identifying passive foreign investment company to manage exposure to tax liabilities and India tax compliance services.
The aggregate fees paid to the principal accountant for professional services rendered by the principal accountant to the registrant’s investment adviser and any entity controlling, controlled by or under common control with the investment adviser that provides ongoing services to the registrant for tax compliance, tax advice and tax planning were $70,000 for the fiscal year ended December 31, 2018 and $70,000 for the fiscal year ended December 31, 2017. The services for which these fees were paid included technical tax consultation for withholding tax report to foreign governments, application of local country tax laws and tax advice.
(d) All Other Fees
The aggregate fees paid to the principal accountant for products and services rendered by the principal accountant to the registrant not reported in paragraphs (a)-(c) of Item 4 were $25,000 for the fiscal year ended December 31, 2018 and $0 for the fiscal year ended December 31, 2017. The services for which these fees were paid included additional procedures performed as a result of a material weakness identified during the 2017 audit.
There were no fees paid to the principal accountant for products and services rendered by the principal accountant to the registrant’s investment adviser and any entity controlling, controlled by or under common control with the investment adviser that provides ongoing services to the registrant other than services reported in paragraphs (a)-(c) of Item 4.
(e) (1) The registrant’s audit committee is directly responsible for approving the services to be provided by the auditors, including:
(i)pre-approval of all audit and audit related services;
(ii)pre-approval of allnon-audit related services to be provided to the Fund by the auditors;
(iii)pre-approval of allnon-audit related services to be provided to the registrant by the auditors to the registrant’s investment adviser or to any entity that controls, is controlled by or is under common control with the registrant’s investment adviser and that provides ongoing services to the registrant where thenon-audit services relate directly to the operations or financial reporting of the registrant; and
(iv) establishment by the audit committee, if deemed necessary or appropriate, as an alternative to committeepre-approval of services to be provided by the auditors, as required by paragraphs (ii) and (iii) above, of policies and procedures to permit such services to bepre-approved by other means, such as through establishment of guidelines or by action of a designated member or members of the committee; provided the policies and procedures are detailed as to the particular service and the committee is informed of each service and such policies and procedures do not include delegation of audit committee responsibilities, as contemplated under the Securities Exchange Act of 1934, to management; subject, in the case of (ii) through (iv), to any waivers, exceptions or exemptions that may be available under applicable law or rules.
(e) (2) None of the services provided to the registrant described in paragraphs (b)-(d) of Item 4 were approved by the audit committee pursuant to paragraph (c)(7)(i)(C) of Rule2-01 of regulationS-X.
(f) No disclosures are required by this Item 4(f).
(g) The aggregatenon-audit fees paid to the principal accountant for services rendered by the principal accountant to the registrant and the registrant’s investment adviser and any entity controlling, controlled by or under common control with the investment adviser that provides ongoing services to the registrant were $115,026 for the fiscal year ended December 31, 2018 and $74,544 for the fiscal year ended December 31, 2017.
(h) The registrant’s audit committee of the board has considered whether the provision ofnon-audit services that were rendered to the registrant’s investment adviser (not including anysub-adviser whose role is primarily portfolio management and is subcontracted with or overseen by another investment adviser), and any entity controlling, controlled by, or under common control with the investment adviser that provides ongoing services to the registrant that were notpre-approved pursuant to paragraph (c)(7)(ii) of Rule2-01 of RegulationS-X is compatible with maintaining the principal accountant’s independence.
| Item 5. | Audit Committee of Listed Registrants. N/A |
| Item 6. | Schedule of Investments. N/A |
| Item 7. | Disclosure of Proxy Voting Policies and Procedures forClosed-End Management Investment Companies. N/A |
| Item 8. | Portfolio Managers ofClosed-End Management Investment Companies. N/A |
| Item 9. | Purchases of Equity Securities byClosed-End Management Investment Company and Affiliated Purchasers. N/A |
| Item 10. | Submission of Matters to a Vote of Security Holders. |
There have been no changes to the procedures by which shareholders may recommend nominees to the Registrant’s board of trustees that would require disclosure herein.
| Item 11. | Controls and Procedures. |
(a) Evaluation of Disclosure Controls and Procedures. The Registrant maintains disclosure controls and procedures that are designed to provide reasonable assurance that information required to be disclosed in the Registrant’s filings under the Securities Exchange Act of 1934,
as amended, and the Investment Company Act of 1940 is recorded, processed, summarized and reported within the periods specified in the rules and forms of the Securities and Exchange Commission. Such information is accumulated and communicated to the Registrant’s management, including its principal executive officer and principal financial officer, as appropriate, to allow timely decisions regarding required disclosure. The Registrant’s management, including the principal executive officer and the principal financial officer, recognizes that any set of controls and procedures, no matter how well designed and operated, can provide only reasonable assurance of achieving the desired control objectives.
Within 90 days prior to the filing date of this Shareholder Report on FormN-CSR, the Registrant had carried out an evaluation, under the supervision and with the participation of the Registrant’s management, including the Registrant’s principal executive officer and the Registrant’s principal financial officer, of the effectiveness of the design and operation of the Registrant’s disclosure controls and procedures. Based on such evaluation, the Registrant’s principal executive officer and principal financial officer concluded that the Registrant’s disclosure controls and procedures were not effective related to internal control over financial reporting specific to the monitoring of market events following the close of trading in foreign stock markets that assist in determining the reliability of the values of the foreign securities held by the Funds and which may require the use of fair valuation factors to account for changes in the values of those securities subsequent to the local close of the foreign market but prior to the net asset calculation of the Funds. As a result, a material weakness exists at period end for the Franklin Mutual Beacon Fund, Franklin Mutual European Fund, Franklin Mutual Financial Services Fund, Franklin Mutual Global Discovery Fund, Franklin Mutual International Fund, Franklin Mutual Quest Fund and Franklin Mutual Shares Fund. There are no misstatements to current and previously issued financial statements. However, this material weakness could result in misstatements of security values and unrealized gains or losses and associated disclosures that would result in a material misstatement of the interim or annual financial statements that would not be prevented or detected.
Effective November 1, 2018, the Registrant’s controls were enhanced through the implementation of a daily secondary review of market events following the close of trading on foreign stock markets to ensure the appropriate application of market level fair value. Registrant’s management believes this will facilitate the remediation of the control deficiency we have identified and strengthen the internal control over financial reporting. This material weakness will not be considered remediated until the applicable controls operate for a sufficient period of time and management has concluded, through testing, that these controls are operating effectively.
(b) Changes in Internal Controls. As described above, there have been changes in the Registrant’s internal control over financial reporting that occurred during the period covered by this report that have materially affected, or is reasonably likely to materially affect, the internal control over financial reporting.
| Item 12. | Disclosure of Securities Lending Activities forClosed-End Management Investment Company. |
| Item 13. | Exhibits. |
(a)(1) Code of Ethics
(a)(2) Certifications pursuant to Section 302 of the Sarbanes-Oxley Act of 2002 of Matthew T. Hinkle, Chief Executive Officer – Finance and Administration, and Robert G. Kubilis, Chief Financial Officer and Chief Accounting Officer
(b) Certifications pursuant to Section 906 of the Sarbanes-Oxley Act of 2002 of Matthew T. Hinkle, Chief Executive Officer – Finance and Administration, and Robert G. Kubilis, Chief Financial Officer and Chief Accounting Officer
SIGNATURES
Pursuant to the requirements of the Securities Exchange Act of 1934 and the Investment Company Act of 1940, the registrant has duly caused this report to be signed on its behalf by the undersigned, thereunto duly authorized.
FRANKLIN MUTUAL SERIES FUNDS
| By | /s/MATTHEW T. HINKLE | |
| Matthew T. Hinkle | ||
| Chief Executive Officer – | ||
| Finance and Administration |
Date February 26, 2019
Pursuant to the requirements of the Securities Exchange Act of 1934 and the Investment Company Act of 1940, this report has been signed below by the following persons on behalf of the registrant and in the capacities and on the dates indicated.
| By | /s/MATTHEW T. HINKLE | |
| Matthew T. Hinkle | ||
| Chief Executive Officer – | ||
| Finance and Administration |
Date February 26, 2019
| By | /s/ROBERT G. KUBILIS | |
| Robert G. Kubilis | ||
| Chief Financial Officer and | ||
| Chief Accounting Officer |
Date February 26, 2019