UNITED STATES
SECURITIES AND EXCHANGE COMMISSION
Washington, DC 20549
FORMN-CSR
CERTIFIED SHAREHOLDER REPORT OF REGISTERED
MANAGEMENT INVESTMENT COMPANIES
Investment Company Act file number811-05387
Franklin Mutual Series Funds
(Exact name of registrant as specified in charter)
101 John F. Kennedy Parkway, Short Hills, NJ 07078-2705
(Address of principal executive offices) (Zip code)
Craig S. Tyle, One Franklin Parkway, San Mateo, CA 94403-1906
(Name and address of agent for service)
Registrant’s telephone number, including area code: (210)912-2100
Date of fiscal year end: 12/31
Date of reporting period: 12/31/19
| Item 1. | Reports to Stockholders. |
Sign up for electronic delivery at franklintempleton.com/edelivery
Internet Delivery of Fund Reports Unless You Request Paper Copies: Effective January 1, 2021, as permitted by the SEC, paper copies of the Fund’s shareholder reports will no longer be sent by mail, unless you specifically request them from the Fund or your financial intermediary. Instead, the reports will be made available on a website, and you will be notified by mail each time a report is posted and provided with a website link to access the report.
If you already elected to receive shareholder reports electronically, you will not be affected by this change and you need not take any action. If you have not signed up for electronic delivery, we would encourage you to join fellow shareholders who have. You may elect to receive shareholder reports and other communications electronically from the Fund by calling (800)632-2301 or by contacting your financial intermediary.
You may elect to continue to receive paper copies of all your future shareholder reports free of charge by contacting your financial intermediary or, if you invest directly with a Fund, calling (800)632-2301 to let the Fund know of your request. Your election to receive reports in paper will apply to all funds held in your account.
FRANKLIN TEMPLETON
Successful investing begins with ambition. And achievement only comes when you reach for it. That’s why we continually strive to deliver better outcomes for investors. No matter what your goals are, our deep, global investment expertise allows us to offer solutions that can help.
During our more than 70 years of experience, we’ve managed through all kinds of markets—up, down and those in between. We’re always preparing for what may come next. It’s because of this, combined with our strength as one of the world’s largest asset managers that we’ve earned the trust of millions of investors around the world.
Dear Franklin Mutual Beacon Fund Shareholder:
As we enter 2020, the factors that lifted stocks to record highs in 2019—accommodative central bank monetary policies and progress on a proposed trade deal between the U.S. and China—continue to be sources of optimism for growth. The near-term threat of recession has eased, with the U.S. economy showing resilience as low unemployment and moderately rising wages have encouraged consumer spending, which has supported the expansion. In contrast, business investment and exports were weak in 2019, but there are nascent signs of increasing industrial activity.
Tariffs, trade battles and geopolitical conflict may continue to dominate headlines in 2020 and account for a disproportionate source of market volatility. The U.S. and China agreed in principle to aphase-one trade agreement in late 2019. However, are-escalation of the tariff dispute between the world’s two largest economies is not out of the question, as negotiations on aphase-two trade agreement are scheduled to start after the anticipatedphase-one signing ceremony in January. There was clarity on Brexit as British voters delivered a resounding election victory to Prime Minister Boris Johnson and his Conservative Party, which should pave the way for a conclusive exit agreement. The terms of U.K. departure, however, must still be finalized. Late in the period, tensions in the Middle East were on the rise, following the death of an American contractor in Iraq in late December and a retaliatory U.S. military strike two days later.
During the period, we took advantage of market turbulence to seek out a larger number of stocks whose risk/reward profiles turned more favorable. Subsequently, we used the market appreciation to exit from or trim select positions that reached or exceeded our estimates of intrinsic value. Market volatility continues to present occasional opportunities in
individual stocks, and in certain sectors, notably those considered to be economically sensitive. We continue to focus on situations in which company-specific actions are more important than economic improvement in driving shareholder value.
Valuation is an essential factor in our analysis, and we always ask ourselves if current and potential investments represent an attractive balance of risk and reward. Amid theall-time highs reached by the Standard & Poor’s® 500 Index (S&P 500®) during the period, we maintained our focus on individual securities and the prospects for each business in the context of its valuation and the backdrop of potential political and economic risks.
We continue to adhere to abottom-up stock selection process that is disciplined, driven by rigorous fundamental analysis, and that attempts to limit downside risk. In our view, actively investing in underappreciated and misunderstood companies with identifiable catalysts for unlocking shareholder value can offer meaningful upside potential and a degree of downside protection in periods of financial market turbulence.
We recognize the important role of financial advisors in today’s markets and encourage investors to continue to seek their advice. Amid changing markets and economic conditions, we are confident investors with a well-diversified portfolio and a patient, long-term outlook will be well positioned for the years ahead.
On the following pages, the Fund’s portfolio management team reviews investment decisions that pertain to performance during the past 12 months considering the
| Not FDIC Insured | May Lose Value | No Bank Guarantee |
| franklintempleton.com | Not part of the annual report | 1 | ||
economic environment and other factors. Please remember all securities markets fluctuate, as do mutual fund share prices.
We thank you for investing with Franklin Templeton, welcome your questions and comments, and look forward to continuing to serve your investment needs in the years ahead.
Sincerely,

Peter A. Langerman
Chairman, President and Chief Executive Officer
Franklin Mutual Advisers, LLC
This letter reflects our analysis and opinions as of December 31, 2019, unless otherwise indicated. The information is not a complete analysis of every aspect of any market, country, industry, security or fund. Statements of fact are from sources considered reliable.
| 3 | ||||||
| 8 | ||||||
| 11 | ||||||
| 12 | ||||||
| 23 | ||||||
| 28 | ||||||
| 41 | ||||||
| 42 | ||||||
| 43 | ||||||
| 48 | ||||||
Visitfranklintempleton.comfor fund updates, to access your account, or to find helpful financial planning tools. |
| |||||
2 | Not part of the annual report | franklintempleton.com | ||
This annual report for Franklin Mutual Beacon Fund covers the fiscal year ended December 31, 2019.
Your Fund’s Goal and Main Investments
The Fund seeks capital appreciation, which may occasionally be short term, with income as a secondary goal. Under normal market conditions, the Fund invests primarily in equity securities of U.S. and foreign companies that we believe are available at market prices less than their intrinsic value. The equity securities in which the Fund invests are primarily common stock, with a current focus onmid- andlarge-cap companies. To a lesser extent, the Fund also invests in merger arbitrage securities and the debt and equity of distressed companies. The Fund may invest a substantial portion, potentially up to 100% of its assets, in foreign securities, which may include sovereign debt and participations in foreign government debt. The Geographic Composition bar chart on this page lists the leading countries where the Fund invests.
Performance Overview
The Fund’s Class Z shares posted a +24.96% cumulative total return for the 12 months ended December 31, 2019. In comparison, the Fund’s benchmark, the MSCI World Index (USD), which tracks stock performance in global developed markets, posted a +28.40% total return.1 You can find more of the Fund’s performance data in the Performance Summary beginning on page 8.
Performance data represent past performance, which does not guarantee future results. Investment return and principal value will fluctuate, and you may have a gain or loss when you sell your shares. Current performance may differ from figures shown. For most recentmonth-end performance, go tofranklintempleton.comor call(800)342-5236.
Economic and Market Overview
Global developed and emerging market stocks, as measured by the MSCI All Country World Index (USD), posted a +27.30% total return during the 12 months ended December 31, 2019.1 Although global economic growth
Geographic Composition*
Based on Total Net Assets as of 12/31/19
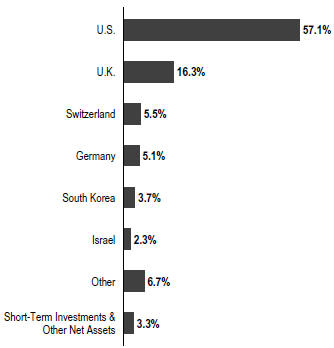
*Figures are stated as a percentage of total and may not equal 100% or may be negative due to rounding, use of any derivatives, unsettled trades or other factors. The Fund held 39.6% of total net assets in foreign securities.
slowed from 2018, interest-rate cuts from many central banks and the easing of trade tensions nearperiod-end contributed to the generally positive environment for equities worldwide. Reflecting investor optimism and slowing but resilient economic growth, stocks advanced in every major region of the globe.
In the U.S., solid economic growth also supported equities, as healthy consumer spending and a strong labor market kept the economy afloat. The unemployment rate fell during the year, reaching 3.5% in September, November and December 2019, the lowest recorded unemployment rate in 50 years.2 Wages also grew, albeit at a moderate pace, and inflation remained persistently low. In addition, deficit spending by the U.S. government boosted current growth at the expense of long-term debt. Despite the strength in the
1. Source: Morningstar.
The index is unmanaged and includes reinvestment of any income or distributions. It does not reflect any fees, expenses or sales charges. One cannot invest directly in an index, and an index is not representative of the Fund’s portfolio.
2. Source: U.S. Bureau of Labor Statistics.
The dollar value, number of shares or principal amount, and names of all portfolio holdings are listed in the Fund’s Statement of Investments (SOI).
The SOI begins on page 17.
| franklintempleton.com | Annual Report | 3 | ||
FRANKLIN MUTUAL BEACON FUND
consumer sector, some parts of the economy struggled, particularly heavy industry. Annual industrial production contracted late in the reporting period, manufacturing output stalled and capital spending declined.
The U.S. Federal Reserve (Fed) provided a substantial boost to equity markets early in the reporting period as it shifted to a more accommodative monetary policy. In January 2019, the Fed signaled the end of its tightening cycle and cut the federal funds rate three times thereafter, lowering it to a range of 1.50%–1.75%. Stocks responded positively to the interest-rate cuts and gained further in December 2019 after the Fed indicated it would likely leave interest rates unchanged in 2020.
Growth slowed overall in the eurozone, particularly in Germany and Italy. Germany, which is heavily reliant on exports, was adversely affected by the trade conflict between the U.S. and China and the resulting slowdown in global trade. In Italy, political uncertainty and budget concerns caused the country’s annual gross domestic product (GDP) growth to stall in 2019’s first quarter before modestly improving in the second and third quarters. Despite sluggish economic conditions, European developed market equities, as measured by the MSCI EuropeIndex-NR (Local Currency), posted a +23.75% total return for the12-month period, as easing trade tensions buoyed investor optimism and an electoral victory by the Conservative Party in the U.K. alleviated uncertainty surrounding Brexit.3 Although the European Central Bank left its headline refinancing rate unchanged, it lowered the deposit rate and restarted its bond-buying stimulus program, further supporting stocks.
Economic growth in Asia was relatively solid overall, despite slowdowns in several large emerging market countries, such as China and India. Japan’s economy grew amid the Bank of Japan’s sizable stimulus program. The trade war between the U.S. and China provided the backdrop for Asian stocks, which rose and fell in sync with investor sentiment regarding a trade deal. A phase one trade agreement between the two countries reached in December 2019 propelled Asian developed and emerging market stocks, which ultimately ended with a +19.23% total return over the12-month period, as measured by the MSCI All Country Asia Index (USD).4
Emerging market stocks overall experienced several sharp selloffs and subsequent rebounds throughout the reporting period before ending with gains. In aggregate, economic growth slowed somewhat from 2018 but remained solid,
although there was some variation among individual countries. Many central banks in emerging markets cut interest rates throughout the reporting period, which, along with resilient GDP growth, provided a supportive environment for equities. Russian stocks posted the highest returns among emerging markets as the threat of further sanctions receded and a solid fiscal environment reassured investors. Overall, global emerging markets, as measured by the MSCI Emerging Markets Index (USD), posted a +18.90% total return for the12-month period.1
Investment Strategy
At Franklin Mutual Series, we are committed to our distinctive value approach to investing, which we believe can generate above-average risk-adjusted returns over time for our shareholders. Our major investment strategy is investing in undervalued stocks. When selecting undervalued equities, we are attracted to what we believe are fundamentally strong companies with healthy balance sheets, high-quality assets, substantial free cash flow and shareholder-oriented management teams and whose stocks are trading at discounts to our assessment of the companies’ intrinsic or business value. We also look for asset-rich companies whose shares may be trading at depressed levels due to concerns over short-term earnings disappointments, litigation, management strategy or other perceived negatives. This strict value approach is not only intended to improve the likelihood of capital appreciation, but also reduces the risk of substantial declines, in our opinion. While the vast majority of our undervalued equity investments are made in publicly traded companies globally, we may invest occasionally in privately held companies as well.
To a lesser extent, we complement this more traditional investment strategy with two others. One is distressed investing, a highly specialized field that has proven quite profitable during certain periods over the years. Distressed investing is complex and can take many forms. The most common distressed investment the Fund undertakes is the purchase of financially troubled or bankrupt companies’ debt at a substantial discount to face value. After the financially distressed company is reorganized, often in bankruptcy court, the old debt is typically replaced with new securities issued by the financially stronger company.
The other piece of our investment strategy is participating in arbitrage situations, another highly specialized field. When companies announce proposed mergers or takeovers,
3. Source: Morningstar. Net Returns (NR) include income net of tax withholding when dividend are paid.
4. Source: MSCI.
4 | Annual Report | franklintempleton.com | ||
FRANKLIN MUTUAL BEACON FUND
commonly referred to as deals, the target company may trade at a discount to the bid it ultimately accepts. One form of arbitrage involves purchasing the target company’s stock when it is trading below the value we believe it would receive in a deal. In keeping with our commitment to a relatively conservative investment approach, we typically focus our arbitrage efforts on announced deals, and avoid rumored deals or other situations we consider relatively risky. In addition, it is our practice to hedge the Fund’s currency exposure when we deem it advantageous for our shareholders.
What is meant by “hedge”? |
To hedge an investment is to take a position intended to offset potential losses that may be incurred by a companion financial instrument. Hedging an investment may also offset potential gains.
|
Manager’s Discussion
The end of a decade is a natural time for reflection about the years that have just passed and to look ahead to what the next 10 might have in store. Across Wall Street, we see many prognostications, and while we are not in the forecasting business, we do allow ourselves to think about investment opportunities over such an extended time period. But experience has taught us that while trying to predict the exact course of markets and/or economic and political events that will drive them may be fun, it is not all that useful.
As 2010 began, the global economy was still recovering from the Global Financial Crisis. The U.S. government owned significant portions of the banking and automotive sectors. The Fed had already started quantitative easing (QE), with QE 2 and QE 3 still to come. In Europe, concerns about Greece’s finances were emerging, and in China the effects of 2009’s massive stimulus programs were starting to take hold.
Over the subsequent years we saw ongoing, global QE, culminating in trillions of dollars of debt yielding negative interest rates. The European Union (EU) was in continuous upheaval, with Greece threatening to leave, but eventually staying in the eurozone; the U.K. pursuing and achieving Brexit; and ongoing strain between core members Germany, France, Italy and Spain. In the U.S., average annual economic growth was restrained and finished the decade
Top 10 Sectors/Industries
Based on Equity Securities as of 12/31/19
% of Total Net Assets | ||
Pharmaceuticals | 12.9% | |
Banks | 9.3% | |
Software | 8.1% | |
Technology Hardware, Storage & Peripherals | 6.6% | |
Media | 5.6% | |
Health Care Equipment & Supplies | 3.9% | |
Electrical Equipment | 3.7% | |
Tobacco | 3.7% | |
Textiles, Apparel & Luxury Goods | 3.5% | |
Entertainment | 3.4% | |
below 2%, trailing the minimum 3% expectation of prior decades. Strong corporate profits and lower corporate tax rates were bright spots.
Equity markets delivered a very good decade—one of the best in history—with the MSCI World Index (USD) and the S&P 500 posting average annual total returns of +10.08% and +13.56%, respectively.5 During the decade, Franklin Mutual Beacon Fund, Class Z posted an average annual total return of +9.81%, a solid absolute return that nonetheless lagged the MSCI World Index (USD), its benchmark. The Fund’s value strategy, which seeks to identify mispriced securities and limit downside risk, was out of favor in an environment that generally encouraged investors to assume more risk. Conversely, the Fund’s Class Z shares posted an average annual total return of +5.36% in the prior decade, compared with +0.23% for the MSCI World Index (USD).1 Our active investment approach focusing on individual opportunities was more conducive to the prior decade’s greater volatility.
In our view, going forward we expect more political and monetary uncertainty and economic growth in unexpected places. Corporate profits will have good years and bad years. Some industries will be massively disrupted, while others will find a way to adjust and prosper, even within the context of artificial intelligence and machine learning. Recent events, such as the coronavirus outbreak, have caused, and may continue to cause, uncertainty and volatility in the Chinese economy, potentially leading to vulnerability in 2020 global growth expectations. As for investment positioning, we
5. Source: Morningstar.
The indexes are unmanaged and include reinvestment of any income or distributions. They do not reflect any fees, expenses or sales charges. One cannot invest directly in an index, and an index is not representative of the Fund’s portfolio.
See www.franklintempletondatasources.com for additional data provider information.
| franklintempleton.com | Annual Report | 5 | ||
FRANKLIN MUTUAL BEACON FUND
intend to avoid forecasts that would lead us to make the Fund’s success dependent on a specific set of outcomes. Rather, we will seek to continue with our time-tested value process and complement it with new tools that enhance our security evaluation and selection process. To that end, we have integrated risk and quantitative portfolio analysis tools that provide us with fresh insights about performance, and help us identify companies and securities that we believe satisfy our investors’ goals of risk-adjusted returns that are not wholly dependent on any one economic or political scenario.
Fund Performance
Turning to Fund performance, top positive contributors included Charter Communications, JPMorgan Chase and Novartis. JPMorgan Chase and Novartis are listed among the Fund’s largest positions in the Top 10 Equity Holdings table on this page.
Shares of U.S.-based cable operator Charter Communications surged after the company reported operating and financial results that were broadly ahead of consensus estimates. Capital expenditures were lower than expected and drove free cash flow, which was used during the period to buy back $3.1 billion of the company’s stock. The market was anticipating share repurchases totaling $2.25 billion. Revenue accelerated 5.1% compared with consensus forecasts of 4.5%. The increased revenue, however, did not reflect the impact of a broad-based increase in per subscriber fees implemented during the period, which could drive revenue growth and margin expansion in 2020. According to the company’s management, there has not been a meaningful decrease in customers as a result of the higher per subscriber fees.
The stock price of U.S.-based banking company JPMorgan Chase trended up during the year but rose sharply after it reported third-quarter earnings that beat consensus estimates. The results were broad based, with stronger-than-expected revenues from the company’s consumer and investment banking divisions. A reduction in net interest income, which declines when interest rates fall, was less than expected, mitigated by revenue from JPMorgan Chase’s diversified banking operation.
The market responded positively to Novartis’ announcement of the official process and dates for itstax-free spinoff of Alcon, its eye care device and consumer products business. In addition, the Switzerland-based drug maker made good progress on its pipeline and delivered solid operational results. The company’s share price pulled back later in the period due to concerns about pharmaceutical drug pricing
Top 10 Equity Holdings
12/31/19
Company Sector/Industry, Country | % of Total Net Assets | |
Novartis AG | 4.0% | |
Pharmaceuticals, Switzerland | ||
Medtronic PLC | 3.9% | |
Health Care Equipment & Supplies, U.S. | ||
GlaxoSmithKline PLC | 3.8% | |
Pharmaceuticals, U.K. | ||
Sensata Technologies Holding PLC | 3.7% | |
Electrical Equipment, U.S. | ||
Samsung Electronics Co. Ltd. | 3.7% | |
Technology Hardware, Storage & Peripherals, South Korea | ||
British American Tobacco PLC | 3.7% | |
Tobacco, U.K. | ||
The Walt Disney Co. | 3.4% | |
Entertainment, U.S. | ||
Wells Fargo & Co. | 3.4% | |
Banks, U.S. | ||
The Hartford Financial Services Group Inc. | 3.2% | |
Insurance, U.S. | ||
JPMorgan Chase & Co. | 3.2% | |
Banks, U.S. | ||
and fallout from a subsidiary’s data manipulation regarding gene therapy Zolgensma. Zolgensma remains on the market, although the U.S. Food and Drug Administration was critical of the delay in informing them of the issue. We believe Novartis’ innovative product pipeline remains underappreciated and that the company’s management has room to further improve operating margins.
During the period under review, Fund investments that detracted from performance included Indiabulls Housing Finance, Baidu and Dufry (not held atperiod-end).
Shares of Indiabulls Housing Finance, an India-based consumer finance company, declined beginning in June following an unsubstantiated allegation of fraudulent loans, which the company vigorously disputed. After declining dramatically, the company’s stock price recovered modestly in late 2019 after India’s Ministry of Corporate Affairs filed an affidavit in the Delhi High Court stating that the five loans, which were the subject of the false claim were repaid or are standard accounts.
Shares of China-based internet search firm Baidu slid after the company posted a 2019 first-quarter loss, attributable to a weaker Chinese economy and increased governmental regulation that hindered advertising sales growth. Earnings
6 | Annual Report | franklintempleton.com | ||
FRANKLIN MUTUAL BEACON FUND
improved in subsequent quarters, but the overhang from the U.S.-China trade dispute hampered the stock price.
Management continues to invest heavily in its video-streaming platform and other initiatives, such as artificial intelligence. We believe these investments may help Baidu further diversify its business into new growth markets.
The share price of Dufry, a Switzerland-based operator of global duty-free and duty-paid stores in airports and other transportation-related facilities, fell earlier in 2019 due to foreign exchange and economic pressures, particularly related to its business in Latin America. Dufry’s stock rallied in November 2019 after the company beat third-quarter consensus estimates for revenue and free cash flow.
During the period, the Fund held currency forwards and futures seeking to hedge most of the currency risk of the portfolio’snon-U.S. dollar investments. The hedges had a modestly positive overall impact on the Fund’s performance.
What is a currency forward? |
A currency forward is a direct agreement between the Fund and a counterparty to buy or sell a foreign currency in exchange for another currency at a specific exchange rate on a future date.
|
What is a future? |
A future is an agreement between the Fund and a counterparty made through a U.S. or foreign futures exchange to buy or sell an underlying instrument or asset at a specific price on a future date.
|
As fellow shareholders, we found recent relative performance disappointing, but it is not uncommon for our strategy to lag the equity markets at times. We remain committed to our disciplined, value investment approach as we seek to generate attractive, long-term, risk-adjusted returns for shareholders.
Thank you for your participation in Franklin Mutual Beacon Fund. We look forward to continuing to serve your investment needs.
 | Christian Correa, CFA Co-Portfolio Manager | |
 | Mandana Hormozi Co-Portfolio Manager | |
 | Aman Gupta, CFA Co-Portfolio Manager | |


The foregoing information reflects our analysis, opinions and portfolio holdings as of December 31, 2019, the end of the reporting period. The way we implement our main investment strategies and the resulting portfolio holdings may change depending on factors such as market and economic conditions. These opinions may not be relied upon as investment advice or an offer for a particular security. The information is not a complete analysis of every aspect of any market, country, industry, security or the Fund. Statements of fact are from sources considered reliable, but the investment manager makes no representation or warranty as to their completeness or accuracy. Although historical performance is no guarantee of future results, these insights may help you understand our investment management philosophy.
CFA® is a trademark owned by CFA Institute.
| franklintempleton.com | Annual Report | 7 | ||
FRANKLIN MUTUAL BEACON FUND
Performance Summary as of December 31, 2019
The performance table and graphs do not reflect any taxes that a shareholder would pay on Fund dividends, capital gain distributions, if any, or any realized gains on the sale of Fund shares. Total return reflects reinvestment of the Fund’s dividends and capital gain distributions, if any, and any unrealized gains or losses. Your dividend income will vary depending on dividends or interest paid by securities in the Fund’s portfolio, adjusted for operating expenses of each class. Capital gain distributions are net profits realized from the sale of portfolio securities.
Performance as of 12/31/191
Cumulative total return excludes sales charges. Average annual total return includes maximum sales charges. Sales charges will vary depending on the size of the investment and the class of share purchased. The maximum is 5.50% and the minimum is 0%.Class A:5.50% maximum initial sales charge. For other share classes, visitfranklintempleton.com.
| Share Class | Cumulative Total Return2 | Average Annual Total Return3 | ||||||
Z | ||||||||
1-Year | +24.96% | +24.96% | ||||||
5-Year | +46.00% | +7.86% | ||||||
10-Year | +154.88% | +9.81% | ||||||
A4 | ||||||||
1-Year | +24.69% | +17.86% | ||||||
5-Year | +44.23% | +6.39% | ||||||
10-Year | +147.92% | +8.89% | ||||||
Performance data represent past performance, which does not guarantee future results. Investment return and principal value will fluctuate, and you may have a gain or loss when you sell your shares. Current performance may differ from figures shown. For most recentmonth-end performance, go tofranklintempleton.comor call(800)342-5236.
See page 10 for Performance Summary footnotes.
8 | Annual Report | franklintempleton.com | ||
FRANKLIN MUTUAL BEACON FUND
PERFORMANCE SUMMARY
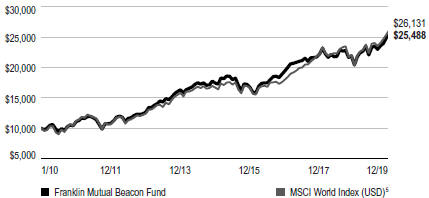
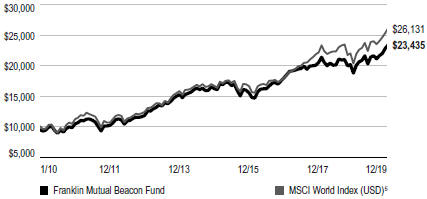
Total Return Index Comparison for a Hypothetical $10,000 Investment1
Total return represents the change in value of an investment over the periods shown. It includes any applicable maximum sales charge, Fund expenses, account fees and reinvested distributions. The unmanaged index includes reinvestment of any income or distributions. It differs from the Fund in composition and does not pay management fees or expenses. One cannot invest directly in an index.
Class Z(1/1/10–12/31/19)
Class A(1/1/10–12/31/19)
See page 10 for Performance Summary footnotes.
| franklintempleton.com | Annual Report | 9 | ||
FRANKLIN MUTUAL BEACON FUND
PERFORMANCE SUMMARY
Distributions(1/1/19–12/31/19)
| Share Class | Net Investment Income | Short-Term Capital Gain | Long-Term Capital Gain | Total | ||||||||||||
Z | $0.3613 | $0.1106 | $0.2819 | $0.7538 | ||||||||||||
A | $0.3228 | $0.1106 | $0.2819 | $0.7153 | ||||||||||||
C | $0.1809 | $0.1106 | $0.2819 | $0.5734 | ||||||||||||
R | $0.2850 | $0.1106 | $0.2819 | $0.6775 | ||||||||||||
R6 | $0.3714 | $0.1106 | $0.2819 | $0.7639 | ||||||||||||
Total Annual Operating Expenses6
| Share Class | With Fee Waiver | Without Fee Waiver | ||||||
| Z | 0.81% | 0.81% | ||||||
| A | 1.06% | 1.06% | ||||||
Each class of shares is available to certain eligible investors and has different annual fees and expenses, as described in the prospectus.
All investments involve risks, including possible loss of principal. Value securities may not increase in price as anticipated or may decline further in value. Special risks are associated with foreign investing, including currency fluctuations, economic instability and political developments. Because the Fund may invest its assets in companies in a specific region, including Europe, it is subject to greater risks of adverse developments in that region and/or the surrounding regions than a fund that is more broadly diversified geographically. Current political and financial uncertainty surrounding the European Union may increase market volatility and the economic risk of investing in companies in Europe. Smaller-company stocks have exhibited greater price volatility than larger-company stocks, particularly over the short term. The Fund’s investments in companies engaged in mergers, reorganizations or liquidations also involve special risks as pending deals may not be completed on time or on favorable terms. The Fund may invest in lower-rated bonds, which entail higher credit risk. The Fund’s prospectus also includes a description of the main investment risks.
1. The Fund has a fee waiver associated with any investment it makes in a Franklin Templeton money fund and/or other Franklin Templeton fund, contractually guaranteed through 4/30/20. Fund investment results reflect the fee waiver; without this waiver, the results would have been lower.
2. Cumulative total return represents the change in value of an investment over the periods indicated.
3. Average annual total return represents the average annual change in value of an investment over the periods indicated. Return for less than one year, if any, has not been annualized.
4. Prior to 9/10/18, these shares were offered at a higher initial sales charge of 5.75%, thus actual returns (with sales charges) would have differed. Average annual total returns (with sales charges) have been restated to reflect the current maximum initial sales charge of 5.50%.
5. Source: Morningstar. The MSCI World Index (USD) is a free float-adjusted, market capitalization-weighted index designed to measure equity market performance in global developed markets.
6. Figures are as stated in the Fund’s current prospectus and may differ from the expense ratios disclosed in the Your Fund’s Expenses and Financial Highlights sections in this report. In periods of market volatility, assets may decline significantly, causing total annual Fund operating expenses to become higher than the figures shown.
See www.franklintempletondatasources.com for additional data provider information.
10 | Annual Report | franklintempleton.com | ||
FRANKLIN MUTUAL BEACON FUND
As a Fund shareholder, you can incur two types of costs: (1) transaction costs, including sales charges (loads) on Fund purchases and redemptions; and (2) ongoing Fund costs, including management fees, distribution and service(12b-1) fees, and other Fund expenses. All mutual funds have ongoing costs, sometimes referred to as operating expenses. The table below shows ongoing costs of investing in the Fund and can help you understand these costs and compare them with those of other mutual funds. The table assumes a $1,000 investment held for the six months indicated.
Actual Fund Expenses
The table below provides information about actual account values and actual expenses in the columns under the heading “Actual.” In these columns the Fund’s actual return, which includes the effect of Fund expenses, is used to calculate the “Ending Account Value” for each class of shares. You can estimate the expenses you paid during the period by following these steps (of course, your account value and expenses will differ from those in this illustration): Divide your account value by $1,000 (if your account had an $8,600 value, then $8,600÷ $1,000 = 8.6). Then multiply the result by the number in the row for your class of shares under the headings “Actual” and “Expenses Paid During Period” (if Actual Expenses Paid During Period were $7.50, then 8.6 x $7.50 = $64.50). In this illustration, the actual expenses paid this period are $64.50.
Hypothetical Example for Comparison with Other Funds
Under the heading “Hypothetical” in the table, information is provided about hypothetical account values and hypothetical expenses based on the Fund’s actual expense ratio and an assumed rate of return of 5% per year before expenses, which is not the Fund’s actual return. This information may not be used to estimate the actual ending account balance or expenses you paid for the period, but it can help you compare ongoing costs of investing in the Fund with those of other funds. To do so, compare this 5% hypothetical example for the class of shares you hold with the 5% hypothetical examples that appear in the shareholder reports of other funds.
Please note that expenses shown in the table are meant to highlight ongoing costs and do not reflect any transactional costs. Therefore, information under the heading “Hypothetical” is useful in comparing ongoing costs only, and will not help you compare total costs of owning different funds. In addition, if transactional costs were included, your total costs would have been higher.
| Actual | Hypothetical | |||||||||||||||||
| (actual return after expenses) | (5% annual return before expenses) | |||||||||||||||||
| Expenses | Expenses | Net | ||||||||||||||||
| Beginning | Ending | Paid During | Ending | Paid During | Annualized | |||||||||||||
| Share | Account | Account | Period | Account | Period | Expense | ||||||||||||
| Class | Value 7/1/19 | Value 12/31/19 | 7/1/19–12/31/191, 2 | Value 12/31/19 | 7/1/19–12/31/191, 2 | Ratio2 | ||||||||||||
|
|
|
| |||||||||||||||
| Z | $1,000 | $1,095.90 | $4.23 | $1,021.17 | $ 4.08 | 0.80% | ||||||||||||
| A | $1,000 | $1,095.10 | $5.54 | $1,019.91 | $ 5.35 | 1.05% | ||||||||||||
| C | $1,000 | $1,090.50 | $9.48 | $1,016.13 | $ 9.15 | 1.80% | ||||||||||||
| R | $1,000 | $1,093.20 | $6.86 | $1,018.65 | $ 6.61 | 1.30% | ||||||||||||
| R6 | $1,000 | $1,096.50 | $3.91 | $1,021.48 | $ 3.77 | 0.74% | ||||||||||||
1. Expenses are equal to the annualized expense ratio for thesix-month period as indicated above—in the far right column—multiplied by the simple average account value over the period indicated, and then multiplied by 184/365 to reflect theone-half year period.
2. Reflects expenses after fee waivers and expense reimbursements. Does not include acquired fund fees and expenses.
| franklintempleton.com | Annual Report | 11 | ||
FRANKLIN MUTUAL SERIES FUNDS
Franklin Mutual Beacon Fund
| Year Ended December 31, | ||||||||||||||||||||
| 2019 | 2018 | 2017 | 2016 | 2015 | ||||||||||||||||
Class Z | ||||||||||||||||||||
Per share operating performance (for a share outstanding throughout the year) | ||||||||||||||||||||
Net asset value, beginning of year | $13.76 | $16.61 | $15.30 | $14.30 | $16.59 | |||||||||||||||
Income from investment operationsa: | ||||||||||||||||||||
Net investment incomeb | 0.33 | 0.29 | 0.29 | 0.37 | c | 0.29 | ||||||||||||||
Net realized and unrealized gains (losses) | 3.06 | (1.68 | ) | 1.90 | 1.93 | (0.99 | ) | |||||||||||||
Total from investment operations | 3.39 | (1.39 | ) | 2.19 | 2.30 | (0.70 | ) | |||||||||||||
Less distributions from: | ||||||||||||||||||||
Net investment income | (0.36 | ) | (0.31 | ) | (0.31 | ) | (0.37 | ) | (0.37 | ) | ||||||||||
Net realized gains | (0.39 | ) | (1.15 | ) | (0.57 | ) | (0.93 | ) | (1.22 | ) | ||||||||||
Total distributions | (0.75 | ) | (1.46 | ) | (0.88 | ) | (1.30 | ) | (1.59 | ) | ||||||||||
Net asset value, end of year | $16.40 | $13.76 | $16.61 | $15.30 | $14.30 | |||||||||||||||
Total return | 24.96% | (8.24)% | 14.39% | 16.11% | (4.14)% | |||||||||||||||
Ratios to average net assets | ||||||||||||||||||||
Expensesd,e | 0.81% | f | 0.80% | f | 0.78% | 0.80% | 0.84% | f | ||||||||||||
Expenses incurred in connection with securities sold short | 0.02% | 0.01% | —% | 0.01% | 0.04% | |||||||||||||||
Net investment income | 2.11% | 1.77% | 1.78% | 2.48% | c | 1.73% | ||||||||||||||
Supplemental data | ||||||||||||||||||||
Net assets, end of year (000’s) | $2,600,744 | $2,271,217 | $2,700,327 | $2,564,120 | $2,420,165 | |||||||||||||||
Portfolio turnover rate | 30.72% | 47.20% | 24.80% | 30.94% | 35.80% | |||||||||||||||
aThe amount shown for a share outstanding throughout the period may not correlate with the Statement of Operations for the period due to the timing of sales and repurchases of the Fund’s shares in relation to income earned and/or fluctuating fair value of the investments of the Fund.
bBased on average daily shares outstanding.
cNet investment income per share includes approximately $0.10 per share related to income received in the form of special dividends in connection with certain Fund holdings. Excluding this amount, the ratio of net investment income to average net assets would have been 1.81%.
dIncludes dividend and/or interest expense on securities sold short and security borrowing fees, if any. See below for the ratios of such expenses to average net assets for the periods presented. See Note 1(d).
eBenefit of expense reduction rounds to less than 0.01%.
fBenefit of waiver and payments by affiliates rounds to less than 0.01%.
12 | Annual Report | The accompanying notes are an integral part of these financial statements. | franklintempleton.com | ||
FRANKLIN MUTUAL SERIES FUNDS
FINANCIAL HIGHLIGHTS
Franklin Mutual Beacon Fund(continued)
| Year Ended December 31, | ||||||||||||||||||||
| 2019 | 2018 | 2017 | 2016 | 2015 | ||||||||||||||||
Class A | ||||||||||||||||||||
Per share operating performance (for a share outstanding throughout the year) | ||||||||||||||||||||
Net asset value, beginning of year | $13.63 | $16.47 | $15.18 | $14.20 | $16.47 | |||||||||||||||
Income from investment operationsa: | ||||||||||||||||||||
Net investment incomeb | 0.29 | 0.25 | 0.25 | 0.33 | c | 0.24 | ||||||||||||||
Net realized and unrealized gains (losses) | 3.03 | (1.67 | ) | 1.87 | 1.91 | (0.97 | ) | |||||||||||||
Total from investment operations | 3.32 | (1.42 | ) | 2.12 | 2.24 | (0.73 | ) | |||||||||||||
Less distributions from: | ||||||||||||||||||||
Net investment income | (0.32 | ) | (0.27 | ) | (0.26 | ) | (0.33 | ) | (0.32 | ) | ||||||||||
Net realized gains | (0.39 | ) | (1.15 | ) | (0.57 | ) | (0.93 | ) | (1.22 | ) | ||||||||||
Total distributions | (0.71 | ) | (1.42 | ) | (0.83 | ) | (1.26 | ) | (1.54 | ) | ||||||||||
Net asset value, end of year | $16.24 | $13.63 | $16.47 | $15.18 | $14.20 | |||||||||||||||
Total returnd | 24.69% | (8.49)% | 14.09% | 15.80% | (4.33)% | |||||||||||||||
Ratios to average net assets | ||||||||||||||||||||
Expensese,f | 1.06% | g | 1.05% | g | 1.03% | 1.05% | 1.12% | g | ||||||||||||
Expenses incurred in connection with securities sold short | 0.02% | 0.01% | —% | �� | 0.01% | 0.04% | ||||||||||||||
Net investment income | 1.86% | 1.52% | 1.53% | 2.23% | c | 1.45% | ||||||||||||||
Supplemental data | ||||||||||||||||||||
Net assets, end of year (000’s) | $1,028,482 | $890,294 | $983,048 | $992,306 | $1,019,568 | |||||||||||||||
Portfolio turnover rate | 30.72% | 47.20% | 24.80% | 30.94% | 35.80% | |||||||||||||||
aThe amount shown for a share outstanding throughout the period may not correlate with the Statement of Operations for the period due to the timing of sales and repurchases of the Fund’s shares in relation to income earned and/or fluctuating fair value of the investments of the Fund.
bBased on average daily shares outstanding.
cNet investment income per share includes approximately $0.10 per share related to income received in the form of special dividends in connection with certain Fund holdings. Excluding this amount, the ratio of net investment income to average net assets would have been 1.56%.
dTotal return does not reflect sales commissions or contingent deferred sales charges, if applicable.
eIncludes dividend and/or interest expense on securities sold short and security borrowing fees, if any. See below for the ratios of such expenses to average net assets for the periods presented. See Note 1(d).
fBenefit of expense reduction rounds to less than 0.01%.
gBenefit of waiver and payments by affiliates rounds to less than 0.01%.
| franklintempleton.com | The accompanying notes are an integral part of these financial statements. | Annual Report | 13 | ||||
FRANKLIN MUTUAL SERIES FUNDS
FINANCIAL HIGHLIGHTS
Franklin Mutual Beacon Fund(continued)
| Year Ended December 31, | ||||||||||||||||||||
| 2019 | 2018 | 2017 | 2016 | 2015 | ||||||||||||||||
Class C | ||||||||||||||||||||
Per share operating performance (for a share outstanding throughout the year) | ||||||||||||||||||||
Net asset value, beginning of year | $13.65 | $16.34 | $15.06 | $14.10 | $16.36 | |||||||||||||||
Income from investment operationsa: | ||||||||||||||||||||
Net investment incomeb | 0.17 | 0.13 | 0.12 | 0.22 | c | 0.12 | ||||||||||||||
Net realized and unrealized gains (losses) | 3.04 | (1.65 | ) | 1.86 | 1.88 | (0.96 | ) | |||||||||||||
Total from investment operations | 3.21 | (1.52 | ) | 1.98 | 2.10 | (0.84 | ) | |||||||||||||
Less distributions from: | ||||||||||||||||||||
Net investment income | (0.18 | ) | (0.02 | ) | (0.13 | ) | (0.21 | ) | (0.20 | ) | ||||||||||
Net realized gains | (0.39 | ) | (1.15 | ) | (0.57 | ) | (0.93 | ) | (1.22 | ) | ||||||||||
Total distributions | (0.57 | ) | (1.17 | ) | (0.70 | ) | (1.14 | ) | (1.42 | ) | ||||||||||
Net asset value, end of year | $16.29 | $13.65 | $16.34 | $15.06 | $14.10 | |||||||||||||||
Total returnd | 23.74% | (9.19)% | 13.25% | 14.94% | (5.06)% | |||||||||||||||
Ratios to average net assets | ||||||||||||||||||||
Expensese,f | 1.81% | g | 1.80% | g | 1.78% | 1.80% | 1.84% | g | ||||||||||||
Expenses incurred in connection with securities sold short | 0.02% | 0.01% | —% | 0.01% | 0.04% | |||||||||||||||
Net investment income | 1.11% | 0.77% | 0.78% | 1.48% | c | 0.73% | ||||||||||||||
Supplemental data | ||||||||||||||||||||
Net assets, end of year (000’s) | $52,620 | $59,828 | $260,113 | $275,138 | $285,333 | |||||||||||||||
Portfolio turnover rate | 30.72% | 47.20% | 24.80% | 30.94% | 35.80% | |||||||||||||||
aThe amount shown for a share outstanding throughout the period may not correlate with the Statement of Operations for the period due to the timing of sales and repurchases of the Fund’s shares in relation to income earned and/or fluctuating fair value of the investments of the Fund.
bBased on average daily shares outstanding.
cNet investment income per share includes approximately $0.10 per share related to income received in the form of special dividends in connection with certain Fund holdings. Excluding this amount, the ratio of net investment income to average net assets would have been 0.81%.
dTotal return does not reflect sales commissions or contingent deferred sales charges, if applicable.
eIncludes dividend and/or interest expense on securities sold short and security borrowing fees, if any. See below for the ratios of such expenses to average net assets for the periods presented. See Note 1(d).
fBenefit of expense reduction rounds to less than 0.01%.
gBenefit of waiver and payments by affiliates rounds to less than 0.01%.
14 | Annual Report | The accompanying notes are an integral part of these financial statements. | franklintempleton.com | ||
FRANKLIN MUTUAL SERIES FUNDS
FINANCIAL HIGHLIGHTS
Franklin Mutual Beacon Fund(continued)
| Year Ended December 31, | ||||||||||||||||||||
| 2019 | 2018 | 2017 | 2016 | 2015 | ||||||||||||||||
Class R | ||||||||||||||||||||
Per share operating performance (for a share outstanding throughout the year) | ||||||||||||||||||||
Net asset value, beginning of year | $13.46 | $16.28 | $15.01 | $14.05 | $16.33 | |||||||||||||||
Income from investment operationsa: | ||||||||||||||||||||
Net investment incomeb | 0.24 | 0.20 | 0.21 | 0.30 | c | 0.20 | ||||||||||||||
Net realized and unrealized gains (losses) | 3.01 | (1.64 | ) | 1.84 | 1.89 | (0.97 | ) | |||||||||||||
Total from investment operations | 3.25 | (1.44 | ) | 2.05 | 2.19 | (0.77 | ) | |||||||||||||
Less distributions from: | ||||||||||||||||||||
Net investment income | (0.29 | ) | (0.23 | ) | (0.21 | ) | (0.30 | ) | (0.29 | ) | ||||||||||
Net realized gains | (0.39 | ) | (1.15 | ) | (0.57 | ) | (0.93 | ) | (1.22 | ) | ||||||||||
Total distributions | (0.68 | ) | (1.38 | ) | (0.78 | ) | (1.23 | ) | (1.51 | ) | ||||||||||
Net asset value, end of year | $16.03 | $13.46 | $16.28 | $15.01 | $14.05 | |||||||||||||||
Total return | 24.33% | (8.65)% | 13.76% | 15.58% | (4.61)% | |||||||||||||||
Ratios to average net assets | ||||||||||||||||||||
Expensesd,e | 1.31% | f | 1.30% | f | 1.28% | 1.30% | 1.34% | f | ||||||||||||
Expenses incurred in connection with securities sold short | 0.02% | 0.01% | —% | 0.01% | 0.04% | |||||||||||||||
Net investment income | 1.61% | 1.27% | 1.28% | 1.98% | c | 1.23% | ||||||||||||||
Supplemental data | ||||||||||||||||||||
Net assets, end of year (000’s) | $1,769 | $1,662 | $1,601 | $2,035 | $2,343 | |||||||||||||||
Portfolio turnover rate | 30.72% | 47.20% | 24.80% | 30.94% | 35.80% | |||||||||||||||
aThe amount shown for a share outstanding throughout the period may not correlate with the Statement of Operations for the period due to the timing of sales and repurchases of the Fund’s shares in relation to income earned and/or fluctuating fair value of the investments of the Fund.
bBased on average daily shares outstanding.
cNet investment income per share includes approximately $0.10 per share related to income received in the form of special dividends in connection with certain Fund holdings. Excluding this amount, the ratio of net investment income to average net assets would have been 1.31%.
dIncludes dividend and/or interest expense on securities sold short and security borrowing fees, if any. See below for the ratios of such expenses to average net assets for the periods presented. See Note 1(d).
eBenefit of expense reduction rounds to less than 0.01%.
fBenefit of waiver and payments by affiliates rounds to less than 0.01%.
| franklintempleton.com | The accompanying notes are an integral part of these financial statements. | Annual Report | 15 | ||||
FRANKLIN MUTUAL SERIES FUNDS
FINANCIAL HIGHLIGHTS
Franklin Mutual Beacon Fund(continued)
| Year Ended December 31, | ||||||||||||||||||||
| 2019 | 2018 | 2017 | 2016 | 2015 | ||||||||||||||||
Class R6 | ||||||||||||||||||||
Per share operating performance (for a share outstanding throughout the year) | ||||||||||||||||||||
Net asset value, beginning of year | $13.75 | $16.60 | $15.30 | $14.30 | $16.58 | |||||||||||||||
Income from investment operationsa: | ||||||||||||||||||||
Net investment incomeb | 0.34 | 0.30 | 0.37 | 0.38 | c | 0.30 | ||||||||||||||
Net realized and unrealized gains (losses) | 3.07 | (1.68 | ) | 1.82 | 1.93 | (0.98 | ) | |||||||||||||
Total from investment operations | 3.41 | (1.38 | ) | 2.19 | 2.31 | (0.68 | ) | |||||||||||||
Less distributions from: | ||||||||||||||||||||
Net investment income | (0.37 | ) | (0.32 | ) | (0.32 | ) | (0.38 | ) | (0.38 | ) | ||||||||||
Net realized gains | (0.39 | ) | (1.15 | ) | (0.57 | ) | (0.93 | ) | (1.22 | ) | ||||||||||
Total distributions | (0.76 | ) | (1.47 | ) | (0.89 | ) | (1.31 | ) | (1.60 | ) | ||||||||||
Net asset value, end of year | $16.40 | $13.75 | $16.60 | $15.30 | $14.30 | |||||||||||||||
Total return | 25.13% | (8.18)% | 14.42% | 16.20% | (3.98)% | |||||||||||||||
Ratios to average net assets | ||||||||||||||||||||
Expenses before waiver and payments by affiliatesd | 0.76% | 0.75% | 0.72% | 0.71% | 0.74% | |||||||||||||||
Expenses net of waiver and payments by affiliatesd,e | 0.74% | 0.73% | 0.71% | 0.71% | 0.74% | f | ||||||||||||||
Expenses incurred in connection with securities sold short | 0.02% | 0.01% | —% | 0.01% | 0.04% | |||||||||||||||
Net investment income | 2.18% | 1.84% | 1.85% | 2.57% | c | 1.83% | ||||||||||||||
Supplemental data | ||||||||||||||||||||
Net assets, end of year (000’s) | $90,220 | $79,358 | $106,845 | $604 | $48,844 | |||||||||||||||
Portfolio turnover rate | 30.72% | 47.20% | 24.80% | 30.94% | 35.80% | |||||||||||||||
aThe amount shown for a share outstanding throughout the period may not correlate with the Statement of Operations for the period due to the timing of sales and repurchases of the Fund’s shares in relation to income earned and/or fluctuating fair value of the investments of the Fund.
bBased on average daily shares outstanding.
cNet investment income per share includes approximately $0.10 per share related to income received in the form of special dividends in connection with certain Fund holdings. Excluding this amount, the ratio of net investment income to average net assets would have been 1.90%.
dIncludes dividend and/or interest expense on securities sold short and security borrowing fees, if any. See below for the ratios of such expenses to average net assets for the periods presented. See Note 1(d).
eBenefit of expense reduction rounds to less than 0.01%.
fBenefit of waiver and payments by affiliates rounds to less than 0.01%.
16 | Annual Report | The accompanying notes are an integral part of these financial statements. | franklintempleton.com | ||
FRANKLIN MUTUAL SERIES FUNDS
Statement of Investments, December 31, 2019
Franklin Mutual Beacon Fund
| Country | Shares/ Rights/ Warrants | Value | ||||||||||
Common Stocks and Other Equity Interests 89.1% | ||||||||||||
Aerospace & Defense 2.5% | ||||||||||||
BAE Systems PLC | United Kingdom | 12,866,872 | $ | 96,250,552 | ||||||||
|
| |||||||||||
Auto Components 0.0%† | ||||||||||||
a,b,cInternational Automotive Components Group Brazil LLC | Brazil | 2,846,329 | 103,322 | |||||||||
|
| |||||||||||
Banks 9.3% | ||||||||||||
JPMorgan Chase & Co. | United States | 866,030 | 120,724,582 | |||||||||
Standard Chartered PLC | United Kingdom | 10,733,493 | 101,274,603 | |||||||||
Wells Fargo & Co. | United States | 2,408,650 | 129,585,370 | |||||||||
|
| |||||||||||
| 351,584,555 | ||||||||||||
|
| |||||||||||
Chemicals 2.2% | ||||||||||||
BASF SE | Germany | 1,114,194 | 84,154,692 | |||||||||
|
| |||||||||||
Communications Equipment 2.7% | ||||||||||||
Cisco Systems Inc. | United States | 2,098,742 | 100,655,666 | |||||||||
|
| |||||||||||
Consumer Finance 2.7% | ||||||||||||
Capital One Financial Corp. | United States | 1,003,098 | 103,228,815 | |||||||||
|
| |||||||||||
Diversified Financial Services 1.7% | ||||||||||||
aM&G PLC | United Kingdom | 19,901,470 | 62,522,366 | |||||||||
|
| |||||||||||
Diversified Telecommunication Services 1.8% | ||||||||||||
Koninklijke KPN NV | Netherlands | 22,591,444 | 66,656,845 | |||||||||
|
| |||||||||||
Electrical Equipment 3.7% | ||||||||||||
aSensata Technologies Holding PLC | United States | 2,626,802 | 141,505,824 | |||||||||
|
| |||||||||||
Entertainment 3.4% | ||||||||||||
The Walt Disney Co. | United States | 897,700 | 129,834,351 | |||||||||
|
| |||||||||||
Equity Real Estate Investment Trusts (REITs) 2.7% | ||||||||||||
Brixmor Property Group Inc. | United States | 4,722,700 | 102,057,547 | |||||||||
|
| |||||||||||
Food Products 2.7% | ||||||||||||
The Kraft Heinz Co. | United States | 3,192,437 | 102,573,001 | |||||||||
|
| |||||||||||
Health Care Equipment & Supplies 3.9% | ||||||||||||
Medtronic PLC | United States | 1,281,090 | 145,339,660 | |||||||||
|
| |||||||||||
Hotels, Restaurants & Leisure 1.7% | ||||||||||||
Sands China Ltd. | Macau | 11,770,400 | 62,913,024 | |||||||||
|
| |||||||||||
Insurance 3.2% | ||||||||||||
The Hartford Financial Services Group Inc. | United States | 2,017,900 | 122,627,783 | |||||||||
|
| |||||||||||
Interactive Media & Services 1.7% | ||||||||||||
aBaidu Inc., ADR | China | 504,347 | 63,749,461 | |||||||||
|
| |||||||||||
IT Services 3.1% | ||||||||||||
Cognizant Technology Solutions Corp., A | United States | 1,870,330 | 115,997,867 | |||||||||
|
| |||||||||||
Media 5.6% | ||||||||||||
aCharter Communications Inc., A | United States | 204,487 | 99,192,554 | |||||||||
aDiscovery Inc., C | United States | 3,439,423 | 104,868,007 | |||||||||
aiHeartMedia Inc., A | United States | 416,304 | 7,035,538 | |||||||||
a,biHeartMedia Inc., B | United States | 7,025 | 100,914 | |||||||||
| franklintempleton.com | Annual Report | 17 | ||
FRANKLIN MUTUAL SERIES FUNDS
STATEMENT OF INVESTMENTS
Franklin Mutual Beacon Fund(continued)
| Country | Shares/ Rights/ Warrants | Value | ||||||||||
Common Stocks and Other Equity Interests(continued) | ||||||||||||
Media(continued) | ||||||||||||
aiHeartMedia Inc., wts., A, 5/01/39 | United States | 418 | $ | 7,064 | ||||||||
|
| |||||||||||
| 211,204,077 | ||||||||||||
|
| |||||||||||
Oil, Gas & Consumable Fuels 2.4% | ||||||||||||
Caltex Australia Ltd. | Australia | 742,312 | 17,682,627 | |||||||||
Royal Dutch Shell PLC, A | United Kingdom | 2,503,893 | 73,471,080 | |||||||||
|
| |||||||||||
| 91,153,707 | ||||||||||||
|
| |||||||||||
Pharmaceuticals 12.9% | ||||||||||||
Allergan PLC | United States | 298,700 | 57,102,479 | |||||||||
aBristol-Myers Squibb Co., rts., 2/01/49 | United States | 574,700 | 1,729,847 | |||||||||
Eli Lilly & Co. | United States | 588,112 | 77,295,560 | |||||||||
GlaxoSmithKline PLC | United Kingdom | 6,044,376 | 142,417,377 | |||||||||
Merck & Co. Inc. | United States | 640,129 | 58,219,733 | |||||||||
Novartis AG, ADR | Switzerland | 1,574,971 | 149,134,004 | |||||||||
|
| |||||||||||
| 485,899,000 | ||||||||||||
|
| |||||||||||
Software 8.1% | ||||||||||||
aCheck Point Software Technologies Ltd. | Israel | 791,712 | 87,848,364 | |||||||||
NortonLifeLock Inc. | United States | 4,522,056 | 115,402,869 | |||||||||
Oracle Corp. | United States | 1,911,500 | 101,271,270 | |||||||||
|
| |||||||||||
| 304,522,503 | ||||||||||||
|
| |||||||||||
Technology Hardware, Storage & Peripherals 2.9% | ||||||||||||
Western Digital Corp. | United States | 1,717,900 | 109,035,113 | |||||||||
|
| |||||||||||
Textiles, Apparel & Luxury Goods 3.5% | ||||||||||||
Cie Financiere Richemont SA | Switzerland | 734,796 | 57,757,023 | |||||||||
Tapestry Inc. | United States | 2,714,300 | 73,204,671 | |||||||||
|
| |||||||||||
| 130,961,694 | ||||||||||||
|
| |||||||||||
Thrifts & Mortgage Finance 1.0% | ||||||||||||
Indiabulls Housing Finance Ltd. | India | 8,676,627 | 38,084,501 | |||||||||
|
| |||||||||||
Tobacco 3.7% | ||||||||||||
British American Tobacco PLC | United Kingdom | 3,250,051 | 139,100,887 | |||||||||
|
| |||||||||||
Total Common Stocks and Other Equity Interests | 3,361,716,813 | |||||||||||
|
| |||||||||||
Preferred Stocks 6.6% | ||||||||||||
Automobiles 2.9% | ||||||||||||
dPorsche Automobil Holding SE, 3.316%, pfd | Germany | 1,451,423 | 108,469,817 | |||||||||
|
| |||||||||||
Technology Hardware, Storage & Peripherals 3.7% | ||||||||||||
dSamsung Electronics Co. Ltd., 3.119%, pfd | South Korea | 3,571,169 | 140,253,006 | |||||||||
|
| |||||||||||
Total Preferred Stocks (Cost $140,382,977) | 248,722,823 | |||||||||||
|
| |||||||||||
18 | Annual Report | franklintempleton.com | ||
FRANKLIN MUTUAL SERIES FUNDS
STATEMENT OF INVESTMENTS
Franklin Mutual Beacon Fund(continued)
| Country | Principal Amount | Value | ||||||||||
Corporate Notes and Senior Floating Rate Interests 1.6% |
| |||||||||||
Frontier Communications Corp., | ||||||||||||
senior note, 10.50%, 9/15/22 | United States | $ | 16,691,000 | $ | 8,183,797 | |||||||
senior note, 11.00%, 9/15/25 | United States | 23,907,000 | 11,654,662 | |||||||||
e,fVeritas U.S. Inc, | ||||||||||||
Term Loan B1, 6.299%,(1-month USD LIBOR + 4.50%), 1/27/23 | United States | 14,399,189 | 13,919,221 | |||||||||
Term Loan B1, 6.445%,(3-month USD LIBOR + 4.50%), 1/27/23 | United States | 2,766,189 | 2,673,984 | |||||||||
gVeritas U.S. Inc./Veritas Bermuda Ltd., | ||||||||||||
senior note, 144A, 7.50%, 2/01/23 | United States | 2,766,000 | 2,767,148 | |||||||||
senior note, 144A, 10.50%, 2/01/24 | United States | 22,708,000 | 21,071,094 | |||||||||
|
| |||||||||||
Total Corporate Notes and Senior Floating Rate Interests |
| 60,269,906 | ||||||||||
|
| |||||||||||
| Shares | ||||||||||||
Companies in Liquidation 0.0%† | ||||||||||||
a,b,hClear Channel Communications Inc., Contingent Distribution | United States | 18,873,000 | — | |||||||||
a,b,hiHeartCommunications Inc., Contingent Distribution | United States | 20,894,418 | — | |||||||||
a,b,hTribune Media, Litigation Trust, Contingent Distribution | United States | 499,183 | — | |||||||||
a,b,hVistra Energy Corp., Litigation Trust, Contingent Distribution | United States | 46,282,735 | 25,456 | |||||||||
a,b,hWalter Energy Inc., Litigation Trust, Contingent Distribution | United States | 5,229,000 | — | |||||||||
|
| |||||||||||
Total Companies in Liquidation (Cost $1,456,075) | 25,456 | |||||||||||
|
| |||||||||||
Total Investments before Short Term Investments | 3,670,734,998 | |||||||||||
|
| |||||||||||
| Principal Amount | ||||||||||||
Short Term Investments 2.7% | ||||||||||||
U.S. Government and Agency Securities 2.7% | ||||||||||||
iU.S. Treasury Bill, | ||||||||||||
1/02/20 - 5/21/20 | United States | $ | 59,500,000 | 59,281,925 | ||||||||
j3/05/20 - 5/28/20 | United States | 45,000,000 | 44,857,793 | |||||||||
|
| |||||||||||
Total U.S. Government and Agency Securities (Cost $104,097,270) | 104,139,718 | |||||||||||
|
| |||||||||||
Total Investments (Cost $2,892,885,768) 100.0% | 3,774,874,716 | |||||||||||
Securities Sold Short (0.6)% | (22,902,996 | ) | ||||||||||
Other Assets, less Liabilities 0.6% | 21,862,442 | |||||||||||
|
| |||||||||||
Net Assets 100.0% | $ | 3,773,834,162 | ||||||||||
|
| |||||||||||
| Shares | ||||||||||||
kSecurities Sold Short (Proceeds $19,775,446) (0.6)% | ||||||||||||
Common Stocks (0.6)% | ||||||||||||
Biotechnology (0.6)% | ||||||||||||
AbbVie Inc | United States | 258,674 | (22,902,996 | ) | ||||||||
|
| |||||||||||
| franklintempleton.com | Annual Report | 19 | ||
FRANKLIN MUTUAL SERIES FUNDS
STATEMENT OF INVESTMENTS
Franklin Mutual Beacon Fund(continued)
†Rounds to less than 0.1% of net assets.
aNon-income producing.
bFair valued using significant unobservable inputs. See Note 13 regarding fair value measurements.
cSee Note 10 regarding restricted securities.
dVariable rate security. The rate shown represents the yield at period end.
eThe coupon rate shown represents the rate at period end.
fSee Note 1(f) regarding senior floating rate interests.
gSecurity was purchased pursuant to Rule 144A under the Securities Act of 1933 and may be sold in transactions exempt from registration only to qualified institutional buyers or in a public offering registered under the Securities Act of 1933. At December 31, 2019, the aggregate value of these securities was $23,838,242, representing 0.6% of net assets.
hContingent distributions represent the right to receive additional distributions, if any, during the reorganization of the underlying company. Shares represent total underlying principal of debt securities.
iThe security was issued on a discount basis with no stated coupon rate.
jA portion or all of the security has been segregated as collateral for securities sold short and/or open forward exchange contracts. At December 31, 2019, the aggregate value of these securities pledged amounted to $20,897,213, representing 0.6% of net assets.
kSee Note 1(d) regarding securities sold short.
At December 31, 2019, the Fund had the following futures contracts outstanding. See Note 1(c).
Futures Contracts
| Description | Type | Number of Contracts | Notional Amount* | Expiration Date | Value/ Unrealized Appreciation (Depreciation) | |||||||||||||||
Currency Contracts | ||||||||||||||||||||
EUR/USD | Short | 825 | $116,345,625 | 3/16/20 | $(1,119,204 | ) | ||||||||||||||
GBP/USD | Short | 1,141 | 94,788,575 | 3/16/20 | (728,971 | ) | ||||||||||||||
|
| |||||||||||||||||||
Total Futures Contracts | $(1,848,175 | ) | ||||||||||||||||||
|
| |||||||||||||||||||
*As of period end.
20 | Annual Report | franklintempleton.com | ||
FRANKLIN MUTUAL SERIES FUNDS
STATEMENT OF INVESTMENTS
Franklin Mutual Beacon Fund(continued)
At December 31, 2019, the Fund had the following forward exchange contracts outstanding. See Note 1(c).
Forward Exchange Contracts
| Currency | Counterpartya | Type | Quantity | Contract Amount | Settlement Date | Unrealized Appreciation | Unrealized Depreciation | |||||||||||||||||||||
OTC Forward Exchange Contracts |
| |||||||||||||||||||||||||||
Euro | BOFA | Buy | 2,249,565 | $ | 2,511,868 | 1/15/20 | $ 13,335 | $ | — | |||||||||||||||||||
Euro | BOFA | Sell | 10,940,338 | 12,175,532 | 1/15/20 | — | (105,320 | ) | ||||||||||||||||||||
Euro | HSBK | Buy | 1,622,992 | 1,823,529 | 1/15/20 | — | (1,673 | ) | ||||||||||||||||||||
Euro | HSBK | Sell | 882,000 | 996,660 | 1/15/20 | 6,589 | — | |||||||||||||||||||||
Euro | HSBK | Sell | 7,403,383 | 8,264,778 | 1/15/20 | — | (45,738 | ) | ||||||||||||||||||||
Euro | SSBT | Sell | 2,152,974 | 2,406,946 | 1/15/20 | — | (9,830 | ) | ||||||||||||||||||||
Euro | UBSW | Sell | 6,679,233 | 7,565,830 | 1/15/20 | 68,193 | — | |||||||||||||||||||||
Euro | UBSW | Sell | 14,603,974 | 16,295,411 | 1/15/20 | — | (97,978 | ) | ||||||||||||||||||||
British Pound | BOFA | Sell | 1,326,025 | 1,662,636 | 1/16/20 | — | (94,452 | ) | ||||||||||||||||||||
British Pound | HSBK | Sell | 23,938,359 | 30,260,694 | 1/16/20 | — | (1,459,537 | ) | ||||||||||||||||||||
South Korean Won | HSBK | Buy | 19,581,884,700 | 16,906,440 | 1/17/20 | 38,784 | — | |||||||||||||||||||||
South Korean Won | HSBK | Sell | 39,913,553,071 | 33,423,564 | 1/17/20 | — | (1,115,713 | ) | ||||||||||||||||||||
South Korean Won | UBSW | Buy | 4,971,463,348 | 4,219,899 | 1/17/20 | 82,167 | — | |||||||||||||||||||||
South Korean Won | UBSW | Sell | 52,909,145,306 | 44,710,929 | 1/17/20 | — | (1,074,110 | ) | ||||||||||||||||||||
Australian Dollar | HSBK | Sell | 278,978 | 196,322 | 2/14/20 | 357 | — | |||||||||||||||||||||
Australian Dollar | HSBK | Sell | 4,311,978 | 2,971,392 | 2/14/20 | — | (57,511 | ) | ||||||||||||||||||||
Australian Dollar | UBSW | Sell | 19,761,990 | 13,646,784 | 2/14/20 | — | (234,822 | ) | ||||||||||||||||||||
British Pound | BOFA | Sell | 9,776,019 | 12,101,929 | 2/14/20 | — | (862,424 | ) | ||||||||||||||||||||
British Pound | HSBK | Sell | 16,417,853 | 20,023,676 | 2/14/20 | — | (1,748,666 | ) | ||||||||||||||||||||
British Pound | SSBT | Sell | 19,266,872 | 23,551,783 | 2/14/20 | — | (1,998,755 | ) | ||||||||||||||||||||
British Pound | UBSW | Sell | 1,778,621 | 2,215,187 | 2/14/20 | — | (143,511 | ) | ||||||||||||||||||||
Euro | BOFA | Sell | 2,052,641 | 2,294,872 | 2/18/20 | — | (14,149 | ) | ||||||||||||||||||||
Euro | HSBK | Sell | 2,539,067 | 2,842,683 | 2/18/20 | — | (13,519 | ) | ||||||||||||||||||||
Euro | SSBT | Sell | 3,351,281 | 3,730,091 | 2/18/20 | — | (39,771 | ) | ||||||||||||||||||||
Euro | UBSW | Sell | 3,670,729 | 4,112,595 | 2/18/20 | — | (16,615 | ) | ||||||||||||||||||||
Euro | HSBK | Sell | 1,081,059 | 1,204,124 | 4/07/20 | — | (15,749 | ) | ||||||||||||||||||||
Euro | SSBT | Sell | 31,433,239 | 35,201,606 | 4/07/20 | — | (267,843 | ) | ||||||||||||||||||||
Euro | UBSW | Sell | 25,060,819 | 28,068,794 | 4/07/20 | — | (209,980 | ) | ||||||||||||||||||||
British Pound | BOFA | Sell | 7,692,076 | 9,949,301 | 4/24/20 | — | (270,489 | ) | ||||||||||||||||||||
British Pound | HSBK | Sell | 5,014,534 | 6,486,522 | 4/24/20 | — | (175,849 | ) | ||||||||||||||||||||
South Korean Won | HSBK | Sell | 49,720,899,763 | 42,843,794 | 5/15/20 | — | (348,786 | ) | ||||||||||||||||||||
South Korean Won | UBSW | Sell | 43,248,030,258 | 37,378,475 | 5/15/20 | — | (191,120 | ) | ||||||||||||||||||||
Euro | SSBT | Sell | 10,049,351 | 11,266,428 | 5/21/20 | — | (104,419 | ) | ||||||||||||||||||||
Euro | UBSW | Sell | 10,049,351 | 11,267,283 | 5/21/20 | — | (103,564 | ) | ||||||||||||||||||||
British Pound | BOFA | Sell | 1,645,098 | 2,209,533 | 5/22/20 | 22,237 | — | |||||||||||||||||||||
British Pound | BOFA | Sell | 22,191,307 | 29,123,611 | 5/22/20 | — | (381,591 | ) | ||||||||||||||||||||
British Pound | HSBK | Sell | 1,990,889 | 2,673,426 | 5/22/20 | 26,372 | — | |||||||||||||||||||||
British Pound | HSBK | Sell | 51,311,772 | 66,910,969 | 5/22/20 | — | (1,312,339 | ) | ||||||||||||||||||||
| franklintempleton.com | Annual Report | 21 | ||
FRANKLIN MUTUAL SERIES FUNDS
STATEMENT OF INVESTMENTS
Franklin Mutual Beacon Fund(continued)
Forward Exchange Contracts(continued)
| Currency | Counterpartya | Type | Quantity | Contract Amount | Settlement Date | Unrealized Appreciation | Unrealized Depreciation | |||||||||||||||||||||
OTC Forward Exchange Contracts(continued) |
| |||||||||||||||||||||||||||
British Pound | UBSW | Sell | 1,645,098 | $ | 2,210,999 | 5/22/20 | $ 23,703 | $ | — | |||||||||||||||||||
|
| |||||||||||||||||||||||||||
Total Forward Exchange Contracts |
| $281,737 | $ | (12,515,823 | ) | |||||||||||||||||||||||
|
| |||||||||||||||||||||||||||
Net unrealized appreciation (depreciation) |
| $ | (12,234,086 | ) | ||||||||||||||||||||||||
|
| |||||||||||||||||||||||||||
aMay be comprised of multiple contracts with the same counterparty, currency and settlement date.
See Note 11 regarding other derivative information.
See Abbreviations on page 40.
22 | Annual Report | The accompanying notes are an integral part of these financial statements. | franklintempleton.com | ||
FINANCIAL STATEMENTS
Statement of Assets and Liabilities
December 31, 2019
Franklin Mutual Beacon Fund
Assets: | ||||
Investments in securities: | ||||
Cost - Unaffiliated issuers | $ | 2,892,885,768 | ||
Value - Unaffiliated issuers | $ | 3,774,874,716 | ||
Cash | 320,471 | |||
Receivables: | ||||
Capital shares sold | 1,261,930 | |||
Dividends and interest | 9,654,523 | |||
European Union tax reclaims | 3,389,044 | |||
Deposits with brokers for: | ||||
Securities sold short | 23,355,775 | |||
Futures contracts | 4,421,280 | |||
Unrealized appreciation on OTC forward exchange contracts | 281,737 | |||
Other assets | 1,452,845 | |||
Total assets | 3,819,012,321 | |||
Liabilities: | ||||
Payables: | ||||
Investment securities purchased | 961,436 | |||
Capital shares redeemed | 3,853,593 | |||
Management fees | 2,136,795 | |||
Distribution fees | 260,489 | |||
Transfer agent fees | 526,696 | |||
Trustees’ fees and expenses | 302,524 | |||
Variation margin on futures contracts | 1,325,530 | |||
Securities sold short, at value (proceeds $19,775,446) | 22,902,996 | |||
Unrealized depreciation on OTC forward exchange contracts | 12,515,823 | |||
Accrued expenses and other liabilities | 392,277 | |||
Total liabilities | 45,178,159 | |||
Net assets, at value | $ | 3,773,834,162 | ||
Net assets consist of: | ||||
Paid-in capital | $ | 2,878,837,071 | ||
Total distributable earnings (losses) | 894,997,091 | |||
Net assets, at value | $ | 3,773,834,162 | ||
| franklintempleton.com | The accompanying notes are an integral part of these financial statements. | Annual Report | 23 | ||||
FRANKLIN MUTUAL SERIES FUNDS
FINANCIAL STATEMENTS
Statement of Assets and Liabilities(continued)
December 31, 2019
Franklin Mutual Beacon Fund
Class Z: | ||||
Net assets, at value | $ | 2,600,743,834 | ||
|
| |||
Shares outstanding | 158,538,329 | |||
|
| |||
Net asset value and maximum offering price per share | $16.40 | |||
|
| |||
Class A: | ||||
Net assets, at value | $ | 1,028,481,778 | ||
|
| |||
Shares outstanding | 63,328,967 | |||
|
| |||
Net asset value per sharea | $16.24 | |||
|
| |||
Maximum offering price per share (net asset value per share ÷ 94.50%) | $17.19 | |||
|
| |||
Class C: | ||||
Net assets, at value | $ | 52,619,909 | ||
|
| |||
Shares outstanding | 3,230,426 | |||
|
| |||
Net asset value and maximum offering price per sharea | $16.29 | |||
|
| |||
Class R: | ||||
Net assets, at value | $ | 1,768,705 | ||
|
| |||
Shares outstanding | 110,330 | |||
|
| |||
Net asset value and maximum offering price per share | $16.03 | |||
|
| |||
Class R6: | ||||
Net assets, at value | $ | 90,219,936 | ||
|
| |||
Shares outstanding | 5,501,592 | |||
|
| |||
Net asset value and maximum offering price per share | $16.40 | |||
|
|
aRedemption price is equal to net asset value less contingent deferred sales charges, if applicable.
24 | Annual Report | The accompanying notes are an integral part of these financial statements. | franklintempleton.com | ||
FRANKLIN MUTUAL SERIES FUNDS
FINANCIAL STATEMENTS
Statement of Operations
for the year ended December 31, 2019
Franklin Mutual Beacon Fund
Investment income: | ||||
Dividends: (net of foreign taxes)* | ||||
Unaffiliated issuers | $ | 88,645,922 | ||
Interest: | ||||
Unaffiliated issuers | 15,386,504 | |||
Income from securities loaned: | ||||
Unaffiliated issuers (net of fees and rebates) | 322,938 | |||
Non-controlled affiliates (Note 3f) | 21,748 | |||
|
| |||
Total investment income | 104,377,112 | |||
|
| |||
Expenses: | ||||
Management fees (Note 3a) | 24,166,236 | |||
Distribution fees: (Note 3c) | ||||
Class A | 2,416,817 | |||
Class C | 571,965 | |||
Class R | 8,412 | |||
Transfer agent fees: (Note 3e) | ||||
Class Z | 2,122,730 | |||
Class A | 831,616 | |||
Class C | 49,203 | |||
Class R | 1,448 | |||
Class R6 | 37,267 | |||
Custodian fees (Note 4) | 276,260 | |||
Reports to shareholders | 180,506 | |||
Registration and filing fees | 144,453 | |||
Professional feesa | (119,971 | ) | ||
Trustees’ fees and expenses | 215,588 | |||
Dividends on securities sold short | 695,220 | |||
Other | 86,781 | |||
|
| |||
Total expenses | 31,684,531 | |||
Expense reductions (Note 4) | (18,205 | ) | ||
Expenses waived/paid by affiliates (Note 3f and 3g) | (23,721 | ) | ||
|
| |||
Net expenses | 31,642,605 | |||
|
| |||
Net investment income | 72,734,507 | |||
|
| |||
Realized and unrealized gains (losses): | ||||
Net realized gain (loss) from: | ||||
Investments: | ||||
Unaffiliated issuers | 25,638,802 | |||
Foreign currency transactions | 135,604 | |||
Forward exchange contracts | 22,896,380 | |||
Futures contracts | 6,145,223 | |||
Securities sold short | (3,686,145 | ) | ||
|
| |||
Net realized gain (loss) | 51,129,864 | |||
|
| |||
Net change in unrealized appreciation (depreciation) on: | ||||
Investments: | ||||
Unaffiliated issuers | 695,558,896 | |||
Translation of other assets and liabilities | (15,549 | ) | ||
Forward exchange contracts | (14,968,234 | ) | ||
Futures contracts | (2,058,651 | ) | ||
Securities sold short | (13,251,876 | ) | ||
Change in deferred taxes on unrealized appreciation | 1,170,447 | |||
|
| |||
| franklintempleton.com | The accompanying notes are an integral part of these financial statements. | Annual Report | 25 | ||||
FRANKLIN MUTUAL SERIES FUNDS
FINANCIAL STATEMENTS
Statement of Operations(continued)
for the year ended December 31, 2019
Franklin Mutual Beacon Fund
Net change in unrealized appreciation (depreciation) | 666,435,033 | |||
|
| |||
Net realized and unrealized gain (loss) | 717,564,897 | |||
|
| |||
Net increase (decrease) in net assets resulting from operations | $ | 790,299,404 | ||
|
| |||
*Foreign taxes withheld on dividends | $ | 3,724,597 | ||
aIncludes unaffiliated reimbursement of legal fees incurred in connection with certain Fund holdings.
26 | Annual Report | The accompanying notes are an integral part of these financial statements. | franklintempleton.com | ||
FRANKLIN MUTUAL SERIES FUNDS
FINANCIAL STATEMENTS
Statements of Changes in Net Assets
Franklin Mutual Beacon Fund
| Year Ended December 31, | ||||||||
| 2019 | 2018 | |||||||
| ||||||||
Increase (decrease) in net assets: | ||||||||
Operations: | ||||||||
Net investment income | $ | 72,734,507 | $ | 63,233,210 | ||||
Net realized gain (loss) | 51,129,864 | 325,997,036 | ||||||
Net change in unrealized appreciation (depreciation) | 666,435,033 | (694,921,118 | ) | |||||
|
| |||||||
Net increase (decrease) in net assets resulting from operations | 790,299,404 | (305,690,872 | ) | |||||
|
| |||||||
Distributions to shareholders: | ||||||||
Class Z | (117,204,577 | ) | (221,433,179 | ) | ||||
Class A | (44,297,307 | ) | (83,941,345 | ) | ||||
Class C | (1,880,966 | ) | (5,683,570 | ) | ||||
Class R | (73,857 | ) | (157,769 | ) | ||||
Class R6 | (4,118,811 | ) | (7,782,384 | ) | ||||
|
| |||||||
Total distributions to shareholders | (167,575,518 | ) | (318,998,247 | ) | ||||
|
| |||||||
Capital share transactions: (Note 2) | ||||||||
Class Z | (100,073,026 | ) | 540,717 | |||||
Class A | (29,105,095 | ) | 72,748,807 | |||||
Class C | (17,741,717 | ) | (185,991,052 | ) | ||||
Class R | (184,983 | ) | 390,017 | |||||
Class R6 | (4,143,408 | ) | (12,575,413 | ) | ||||
|
| |||||||
Total capital share transactions | (151,248,229 | ) | (124,886,924 | ) | ||||
|
| |||||||
Net increase (decrease) in net assets | 471,475,657 | (749,576,043 | ) | |||||
Net assets: | ||||||||
Beginning of year | 3,302,358,505 | 4,051,934,548 | ||||||
|
| |||||||
End of year | $ | 3,773,834,162 | $ | 3,302,358,505 | ||||
|
| |||||||
| franklintempleton.com | The accompanying notes are an integral part of these financial statements. | Annual Report | 27 | ||||
FRANKLIN MUTUAL SERIES FUNDS
Franklin Mutual Beacon Fund
1. Organization and Significant Accounting Policies
Franklin Mutual Series Funds (Trust) is registered under the Investment Company Act of 1940 (1940 Act) as anopen-end management investment company, consisting of seven separate funds and applies the specialized accounting and reporting guidance in U.S. Generally Accepted Accounting Principles (U.S. GAAP). Franklin Mutual Beacon Fund (Fund) is included in this report. The Fund offers five classes of shares: Class Z, Class A, Class C, Class R and Class R6. Class C shares automatically convert to Class A shares after they have been held for 10 years. Each class of shares may differ by its initial sales load, contingent deferred sales charges, voting rights on matters affecting a single class, its exchange privilege and fees due to differing arrangements for distribution and transfer agent fees.
The following summarizes the Fund’s significant accounting policies.
a. Financial Instrument Valuation
The Fund’s investments in financial instruments are carried at fair value daily. Fair value is the price that would be received to sell an asset or paid to transfer a liability in an orderly transaction between market participants on the measurement date. The Fund calculates the net asset value (NAV) per share each business day as of 4 p.m. Eastern time or the regularly scheduled close of the New York Stock Exchange (NYSE), whichever is earlier. Under compliance policies and procedures approved by the Trust’s Board of Trustees (the Board), the Fund’s administrator has responsibility for oversight of valuation, including leading the cross-functional Valuation Committee (VC). The Fund may utilize independent pricing services, quotations from securities and financial instrument dealers, and other market sources to determine fair value.
Equity securities and derivative financial instruments listed on an exchange or on the NASDAQ National Market System are valued at the last quoted sale price or the official closing price of the day, respectively. Foreign equity securities are valued as of the close of trading on the foreign stock exchange on which the security is primarily traded, or as of 4 p.m. Eastern time. The value is then converted into its U.S. dollar equivalent at the foreign exchange rate in effect at 4 p.m. Eastern time on the day that the value of the security is determined.Over-the-counter (OTC) securities are valued within the range of the most recent quoted bid and ask prices. Securities that trade in multiple markets or on multiple
exchanges are valued according to the broadest and most representative market. Certain equity securities are valued based upon fundamental characteristics or relationships to similar securities.
Debt securities generally trade in the OTC market rather than on a securities exchange. The Fund’s pricing services use multiple valuation techniques to determine fair value. In instances where sufficient market activity exists, the pricing services may utilize a market-based approach through which quotes from market makers are used to determine fair value. In instances where sufficient market activity may not exist or is limited, the pricing services also utilize proprietary valuation models which may consider market characteristics such as benchmark yield curves, credit spreads, estimated default rates, anticipated market interest rate volatility, coupon rates, anticipated timing of principal repayments, underlying collateral, and other unique security features in order to estimate the relevant cash flows, which are then discounted to calculate the fair value.
Investments inopen-end mutual funds are valued at the closing NAV.
Certain derivative financial instruments trade in the OTC market. The Fund’s pricing services use various techniques including industry standard option pricing models and proprietary discounted cash flow models to determine the fair value of those instruments. The Fund’s net benefit or obligation under the derivative contract, as measured by the fair value of the contract, is included in net assets.
The Fund has procedures to determine the fair value of financial instruments for which market prices are not reliable or readily available. Under these procedures, the Fund primarily employs a market-based approach which may use related or comparable assets or liabilities, recent transactions, market multiples, book values, and other relevant information for the investment to determine the fair value of the investment. An income-based valuation approach may also be used in which the anticipated future cash flows of the investment are discounted to calculate fair value. Discounts may also be applied due to the nature or duration of any restrictions on the disposition of the investments. Due to the inherent uncertainty of valuations of such investments, the fair values may differ significantly from the values that would have been used had an active market existed.
28 | Annual Report | franklintempleton.com | ||
FRANKLIN MUTUAL SERIES FUNDS
NOTES TO FINANCIAL STATEMENTS
Franklin Mutual Beacon Fund(continued)
Trading in securities on foreign securities stock exchanges and OTC markets may be completed before 4 p.m. Eastern time. In addition, trading in certain foreign markets may not take place on every Fund’s business day. Occasionally, events occur between the time at which trading in a foreign security is completed and 4 p.m. Eastern time that might call into question the reliability of the value of a portfolio security held by the Fund. As a result, differences may arise between the value of the Fund’s portfolio securities as determined at the foreign market close and the latest indications of value at 4 p.m. Eastern time. In order to minimize the potential for these differences, the VC monitors price movements following the close of trading in foreign stock markets through a series of country specific market proxies (such as baskets of American Depositary Receipts, futures contracts and exchange traded funds). These price movements are measured against established trigger thresholds for each specific market proxy to assist in determining if an event has occurred that may call into question the reliability of the values of the foreign securities held by the Fund. If such an event occurs, the securities may be valued using fair value procedures, which may include the use of independent pricing services.
When the last day of the reporting period is anon-business day, certain foreign markets may be open on those days that the Fund’s NAV is not calculated, which could result in differences between the value of the Fund’s portfolio securities on the last business day and the last calendar day of the reporting period. Any significant security valuation changes due to an open foreign market are adjusted and reflected by the Fund for financial reporting purposes.
b. Foreign Currency Translation
Portfolio securities and other assets and liabilities denominated in foreign currencies are translated into U.S. dollars based on the exchange rate of such currencies against U.S. dollars on the date of valuation. The Fund may enter into foreign currency exchange contracts to facilitate transactions denominated in a foreign currency. Purchases and sales of securities, income and expense items denominated in foreign currencies are translated into U.S. dollars at the exchange rate in effect on the transaction date. Portfolio securities and assets and liabilities denominated in foreign currencies contain risks that those currencies will decline in value relative to the U.S. dollar. Occasionally, events may impact the availability or reliability of foreign exchange rates used to convert the U.S. dollar equivalent
value. If such an event occurs, the foreign exchange rate will be valued at fair value using procedures established and approved by the Board.
The Fund does not separately report the effect of changes in foreign exchange rates from changes in market prices on securities held. Such changes are included in net realized and unrealized gain or loss from investments in the Statement of Operations.
Realized foreign exchange gains or losses arise from sales of foreign currencies, currency gains or losses realized between the trade and settlement dates on securities transactions and the difference between the recorded amounts of dividends, interest, and foreign withholding taxes and the U.S. dollar equivalent of the amounts actually received or paid. Net unrealized foreign exchange gains and losses arise from changes in foreign exchange rates on foreign denominated assets and liabilities other than investments in securities held at the end of the reporting period.
c. Derivative Financial Instruments
The Fund invested in derivative financial instruments in order to manage risk or gain exposure to various other investments or markets. Derivatives are financial contracts based on an underlying or notional amount, require no initial investment or an initial net investment that is smaller than would normally be required to have a similar response to changes in market factors, and require or permit net settlement. Derivatives contain various risks including the potential inability of the counterparty to fulfill their obligations under the terms of the contract, the potential for an illiquid secondary market, and/or the potential for market movements which expose the Fund to gains or losses in excess of the amounts shown in the Statement of Assets and Liabilities. Realized gain and loss and unrealized appreciation and depreciation on these contracts for the period are included in the Statement of Operations.
Derivative counterparty credit risk is managed through a formal evaluation of the creditworthiness of all potential counterparties. The Fund attempts to reduce its exposure to counterparty credit risk on OTC derivatives, whenever possible, by entering into International Swaps and Derivatives Association (ISDA) master agreements with certain counterparties. These agreements contain various provisions, including but not limited to collateral requirements, events of default, or early termination. Termination events applicable to the counterparty include certain deteriorations in the credit
| franklintempleton.com | Annual Report | 29 | ||
FRANKLIN MUTUAL SERIES FUNDS
NOTES TO FINANCIAL STATEMENTS
Franklin Mutual Beacon Fund(continued)
1. Organization and Significant Accounting
Policies(continued)
c. Derivative Financial Instruments(continued)
quality of the counterparty. Termination events applicable to the Fund include failure of the Fund to maintain certain net asset levels and/or limit the decline in net assets over various periods of time. In the event of default or early termination, the ISDA master agreement gives thenon-defaulting party the right to net andclose-out all transactions traded, whether or not arising under the ISDA agreement, to one net amount payable by one counterparty to the other. However, absent an event of default or early termination, OTC derivative assets and liabilities are presented gross and not offset in the Statement of Assets and Liabilities. Early termination by the counterparty may result in an immediate payment by the Fund of any net liability owed to that counterparty under the ISDA agreement. At December 31, 2019, the Fund had OTC derivatives in a net liability position of $12,234,086 and the aggregate value of collateral pledged for such contracts was $9,300,101.
Collateral requirements differ by type of derivative. Collateral or initial margin requirements are set by the broker or exchange clearing house for exchange traded and centrally cleared derivatives. Initial margin deposited is held at the exchange and can be in the form of cash and/or securities. For OTC derivatives traded under an ISDA master agreement, posting of collateral is required by either the Fund or the applicable counterparty if the total net exposure of all OTC derivatives with the applicable counterparty exceeds the minimum transfer amount, which typically ranges from $100,000 to $250,000, and can vary depending on the counterparty and the type of the agreement. Generally, collateral is determined at the close of Fund business each day and any additional collateral required due to changes in derivative values may be delivered by the Fund or the counterparty the next business day, or within a few business days. Collateral pledged and/or received by the Fund for OTC derivatives, if any, is held in segregated accounts with the Fund’s custodian/counterparty broker and can be in the form of cash and/or securities. Unrestricted cash may be invested according to the Fund’s investment objectives. To the extent that the amounts due to the Fund from its counterparties are not subject to collateralization or are not fully collateralized, the Fund bears the risk of loss from counterpartynon-performance.
The Fund entered into exchange traded futures contracts primarily to manage exposure to certain foreign currencies. A futures contract is an agreement between the Fund and a counterparty to buy or sell an asset at a specified price on a future date. Required initial margins are pledged by the Fund, and the daily change in fair value is accounted for as a variation margin payable or receivable in the Statement of Assets and Liabilities.
The Fund entered into OTC forward exchange contracts primarily to manage exposure to certain foreign currencies. A forward exchange contract is an agreement between the Fund and a counterparty to buy or sell a foreign currency at a specific exchange rate on a future date.
See Note 11 regarding other derivative information.
d. Securities Sold Short
The Fund is engaged in selling securities short, which obligates the Fund to replace a borrowed security with the same security at current fair value. The Fund incurs a loss if the price of the security increases between the date of the short sale and the date on which the Fund replaces the borrowed security. The Fund realizes a gain if the price of the security declines between those dates. Gains are limited to the price at which the Fund sold the security short, while losses are potentially unlimited in size.
The Fund is required to establish a margin account with the broker lending the security sold short. While the short sale is outstanding, the broker retains the proceeds of the short sale to the extent necessary to meet margin requirements until the short position is closed out. A deposit must also be maintained with the Fund’s custodian/counterparty broker consisting of cash and/or securities having a value equal to a specified percentage of the value of the securities sold short. The Fund is obligated to pay fees for borrowing the securities sold short and is required to pay the counterparty any dividends and/or interest due on securities sold short. Such dividends and/or interest and any security borrowing fees are recorded as an expense to the Fund.
e. Securities Lending
The Fund participates in an agency based securities lending program to earn additional income. The Fund receives cash collateral against the loaned securities in an amount equal to at least 102% of the fair value of the loaned securities. Collateral is maintained over the life of the loan in an amount
30 | Annual Report | franklintempleton.com | ||
FRANKLIN MUTUAL SERIES FUNDS
NOTES TO FINANCIAL STATEMENTS
Franklin Mutual Beacon Fund(continued)
not less than 100% of the fair value of loaned securities, as determined at the close of Fund business each day; any additional collateral required due to changes in security values is delivered to the Fund on the next business day. The collateral is deposited into a joint cash account with other funds and is used to invest in a money market fund managed by Franklin Advisers, Inc., an affiliate of the Fund, and/or a joint repurchase agreement. The Fund may receive income from the investment of cash collateral, in addition to lending fees and rebates paid by the borrower. Income from securities loaned, net of fees paid to the securities lending agent and/or third-party vendor, is reported separately in the Statement of Operations. The Fund bears the market risk with respect to the collateral investment, securities loaned, and the risk that the agent may default on its obligations to the Fund. If the borrower defaults on its obligation to return the securities loaned, the Fund has the right to repurchase the securities in the open market using the collateral received. The securities lending agent has agreed to indemnify the Fund in the event of default by a third party borrower. At December 31, 2019, the Fund had no securities on loan.
f. Senior Floating Rate Interests
The Fund invests in senior secured corporate loans that pay interest at rates which are periodically reset by reference to a base lending rate plus a spread. These base lending rates are generally the prime rate offered by a designated U.S. bank or the London InterBank Offered Rate (LIBOR). Senior secured corporate loans often require prepayment of principal from excess cash flows or at the discretion of the borrower. As a result, actual maturity may be substantially less than the stated maturity. Senior secured corporate loans in which the Fund invests are generally readily marketable, but may be subject to certain restrictions on resale. On July 27, 2017, the United Kingdom’s Financial Conduct Authority announced its intention to cease sustaining LIBOR after 2021. There remains uncertainty regarding the future utilization of LIBOR and the nature of any replacement rate. As such, the potential effect of a transition away from LIBOR on the Fund or the Fund’s investments that use or may use a floating rate based on LIBOR cannot yet be determined.
g. Income and Deferred Taxes
It is the Fund’s policy to qualify as a regulated investment company under the Internal Revenue Code. The Fund intends to distribute to shareholders substantially all of its
taxable income and net realized gains to relieve it from federal income and excise taxes. As a result, no provision for U.S. federal income taxes is required.
The Fund may be subject to foreign taxation related to income received, capital gains on the sale of securities and certain foreign currency transactions in the foreign jurisdictions in which it invests. Foreign taxes, if any, are recorded based on the tax regulations and rates that exist in the foreign markets in which the Fund invests. When a capital gain tax is determined to apply, the Fund records an estimated deferred tax liability in an amount that would be payable if the securities were disposed of on the valuation date.
As a result of several court cases, in certain countries across the European Union, the Fund filed additional tax reclaims for previously withheld taxes on dividends earned in those countries (EU reclaims). These additional filings are subject to various administrative proceedings by the local jurisdictions’ tax authorities within the European Union, as well as a number of related judicial proceedings. Income recognized, if any, for EU reclaims is reflected as other income in the Statement of Operations and any related receivable, if any, is reflected as European Union tax reclaims in the Statement of Assets and Liabilities. When uncertainty exists as to the ultimate resolution of these proceedings, the likelihood of receipt of these EU reclaims, and the potential timing of payment, no amounts are reflected in the financial statements. For U.S. income tax purposes, EU reclaims received by the Fund, if any, reduce the amounts of foreign taxes Fund shareholders can use as tax credits in their individual income tax returns.
The Fund may recognize an income tax liability related to its uncertain tax positions under U.S. GAAP when the uncertain tax position has a less than 50% probability that it will be sustained upon examination by the tax authorities based on its technical merits. As of December 31, 2019, the Fund has determined that no tax liability is required in its financial statements related to uncertain tax positions for any open tax years (or expected to be taken in future tax years). Open tax years are those that remain subject to examination and are based on the statute of limitations in each jurisdiction in which the Fund invests.
| franklintempleton.com | Annual Report | 31 | ||
FRANKLIN MUTUAL SERIES FUNDS
NOTES TO FINANCIAL STATEMENTS
Franklin Mutual Beacon Fund(continued)
1. Organization and Significant Accounting
Policies(continued)
h. Security Transactions, Investment Income, Expenses and Distributions
Security transactions are accounted for on trade date. Realized gains and losses on security transactions are determined on a specific identification basis. Interest income and estimated expenses are accrued daily. Amortization of premium and accretion of discount on debt securities are included in interest income. Dividend income and dividends declared on securities sold short are recorded on theex-dividend date except for certain dividends from securities where the dividend rate is not available. In such cases, the dividend is recorded as soon as the information is received by the Fund. Distributions to shareholders are recorded on theex-dividend date. Distributable earnings are determined according to income tax regulations (tax basis) and may differ from earnings recorded in accordance with U.S. GAAP. These differences may be permanent or temporary. Permanent differences are reclassified among capital accounts to reflect their tax character. These reclassifications have no impact on net assets or the results of operations. Temporary differences are not reclassified, as they may reverse in subsequent periods.
Common expenses incurred by the Trust are allocated among the Funds based on the ratio of net assets of each Fund to the combined net assets of the Trust or based on the ratio of number of shareholders of each Fund to the combined number of shareholders of the Trust. Fund specific expenses are charged directly to the Fund that incurred the expense.
Realized and unrealized gains and losses and net investment income, excluding class specific expenses, are allocated daily to each class of shares based upon the relative proportion of net assets of each class. Differences in per share distributions by class are generally due to differences in class specific expenses.
i. Accounting Estimates
The preparation of financial statements in accordance with U.S. GAAP requires management to make estimates and assumptions that affect the reported amounts of assets and liabilities at the date of the financial statements and the amounts of income and expenses during the reporting period. Actual results could differ from those estimates.
j. Guarantees and Indemnifications
Under the Trust’s organizational documents, its officers and trustees are indemnified by the Trust against certain liabilities arising out of the performance of their duties to the Trust. Additionally, in the normal course of business, the Trust, on behalf of the Fund, enters into contracts with service providers that contain general indemnification clauses. The Trust’s maximum exposure under these arrangements is unknown as this would involve future claims that may be made against the Trust that have not yet occurred. Currently, the Trust expects the risk of loss to be remote.
2. Shares of Beneficial Interest
At December 31, 2019, there were an unlimited number of shares authorized (without par value). Transactions in the Fund’s shares were as follows:
| Year Ended December 31, | ||||||||||||||||
| 2019 | 2018 | |||||||||||||||
| Shares | Amount | Shares | Amount | |||||||||||||
Class Z Shares: | ||||||||||||||||
Shares sold | 6,417,333 | $ | 99,580,274 | 8,257,116 | $ | 133,575,147 | ||||||||||
Shares issued in reinvestment of distributions | 6,936,116 | 109,259,281 | 15,183,241 | 206,770,472 | ||||||||||||
Shares redeemed | (19,916,799 | ) | (308,912,581 | ) | (20,924,183 | ) | (339,804,902 | ) | ||||||||
Net increase (decrease) | (6,563,350 | ) | $ | (100,073,026 | ) | 2,516,174 | $ | 540,717 | ||||||||
32 | Annual Report | franklintempleton.com | ||
FRANKLIN MUTUAL SERIES FUNDS
NOTES TO FINANCIAL STATEMENTS
Franklin Mutual Beacon Fund(continued)
| Year Ended December 31, | ||||||||||||||||
2019 |
2018 | |||||||||||||||
Shares |
Amount |
Shares |
Amount | |||||||||||||
Class A Shares: | ||||||||||||||||
Shares solda | 5,986,582 | $ | 92,355,623 | 13,762,741 | $ | 220,038,461 | ||||||||||
Shares issued in reinvestment of distributions | 2,768,759 | 43,071,568 | 6,066,419 | 81,741,950 | ||||||||||||
Shares redeemed | (10,754,960 | ) | (164,532,286 | ) | (14,199,056 | ) | (229,031,604 | ) | ||||||||
Net increase (decrease) | (1,999,619 | ) | $ | (29,105,095 | ) | 5,630,104 | $ | 72,748,807 | ||||||||
Class C Shares: | ||||||||||||||||
Shares sold | 389,809 | $ | 5,961,650 | 777,745 | $ | 12,227,859 | ||||||||||
Shares issued in reinvestment of distributions | 118,043 | 1,813,172 | 398,415 | 5,563,069 | ||||||||||||
Shares redeemeda | (1,659,137 | ) | (25,516,539 | ) | (12,713,218 | ) | (203,781,980 | ) | ||||||||
Net increase (decrease) | (1,151,285 | ) | $ | (17,741,717 | ) | (11,537,058 | ) | $ | (185,991,052 | ) | ||||||
Class R Shares: | ||||||||||||||||
Shares sold | 11,975 | $ | 176,283 | 27,604 | $ | 454,716 | ||||||||||
Shares issued in reinvestment of distributions | 4,826 | 73,857 | 11,829 | 157,768 | ||||||||||||
Shares redeemed | (29,881 | ) | (435,123 | ) | (14,360 | ) | (222,467 | ) | ||||||||
Net increase (decrease) | (13,080 | ) | $ | (184,983 | ) | 25,073 | $ | 390,017 | ||||||||
Class R6 Shares: | ||||||||||||||||
Shares sold | 1,239,238 | $ | 19,145,578 | 1,125,287 | $ | 18,530,681 | ||||||||||
Shares issued in reinvestment of distributions | 260,098 | 4,098,079 | 570,780 | 7,773,465 | ||||||||||||
Shares redeemed | (1,768,710 | ) | (27,387,065 | ) | (2,360,255 | ) | (38,879,559 | ) | ||||||||
Net increase (decrease) | (269,374 | ) | $ | (4,143,408 | ) | (664,188 | ) | $ | (12,575,413 | ) | ||||||
aMay include a portion of Class C shares that were automatically converted to Class A.
3. Transactions with Affiliates
Franklin Resources, Inc. is the holding company for various subsidiaries that together are referred to as Franklin Templeton. Certain officers and trustees of the Fund are also officers and/or directors of the following subsidiaries:
| Subsidiary | Affiliation | |
Franklin Mutual Advisers, LLC (Franklin Mutual) | Investment manager | |
Franklin Templeton Services, LLC (FT Services) | Administrative manager | |
Franklin Templeton Distributors, Inc. (Distributors) | Principal underwriter | |
Franklin Templeton Investor Services, LLC (Investor Services) | Transfer agent |
| franklintempleton.com | Annual Report | 33 | ||
FRANKLIN MUTUAL SERIES FUNDS
NOTES TO FINANCIAL STATEMENTS
Franklin Mutual Beacon Fund(continued)
3. Transactions with Affiliates(continued)
a. Management Fees
The Fund pays an investment management fee to Franklin Mutual based on the average daily net assets of the Fund as follows:
| Annualized Fee Rate | Net Assets | |
| 0.675% | Up to and including $5 billion | |
| 0.645% | Over $5 billion, up to and including $7 billion | |
| 0.625% | Over $7 billion, up to and including $10 billion | |
| 0.615% | In excess of $10 billion |
b. Administrative Fees
Under an agreement with Franklin Mutual, FT Services provides administrative services to the Fund. The fee is paid by Franklin Mutual based on the Fund’s average daily net assets, and is not an additional expense of the Fund.
c. Distribution Fees
The Board has adopted distribution plans for each share class, with the exception of Class Z and Class R6 shares, pursuant to Rule12b-1 under the 1940 Act. Under the Fund’s Class A reimbursement distribution plan, the Fund reimburses Distributors for costs incurred in connection with the servicing, sale and distribution of the Fund’s shares up to the maximum annual plan rate. Under the Class A reimbursement distribution plan, costs exceeding the maximum for the current plan year cannot be reimbursed in subsequent periods. In addition, under the Fund’s Class C and R compensation distribution plans, the Fund pays Distributors for costs incurred in connection with the servicing, sale and distribution of the Fund’s shares up to the maximum annual plan rate for each class. The plan year, for purposes of monitoring compliance with the maximum annual plan rates, is February 1 through January 31.
The maximum annual plan rates, based on the average daily net assets, for each class, are as follows:
Class A | 0.35 | % | ||
Class C | 1.00 | % | ||
Class R | 0.50 | % | ||
The Board has set the current rate at 0.25% per year for Class A shares until further notice and approval by the Board.
d. Sales Charges/Underwriting Agreements
Front-end sales charges and contingent deferred sales charges (CDSC) do not represent expenses of the Fund. These charges are deducted from the proceeds of sales of Fund shares prior to investment or from redemption proceeds prior to remittance, as applicable. Distributors has advised the Fund of the following commission transactions related to the sales and redemptions of the Fund’s shares for the year:
Sales charges retained net of commissions paid to unaffiliated brokers/dealers | $ | 68,377 | ||
CDSC retained | $ | 8,404 |
34 | Annual Report | franklintempleton.com | ||
FRANKLIN MUTUAL SERIES FUNDS
NOTES TO FINANCIAL STATEMENTS
Franklin Mutual Beacon Fund(continued)
e. Transfer Agent Fees
Each class of shares pays transfer agent fees to Investor Services for its performance of shareholder servicing obligations. The fees are based on an annualized asset based fee of 0.02% plus a transaction based fee. In addition, each class reimburses Investor Services for out of pocket expenses incurred and, except for Class R6, reimburses shareholder servicing fees paid to third parties. These fees are allocated daily based upon their relative proportion of such classes’ aggregate net assets. Class R6 pays Investor Services transfer agent fees specific to that class.
For the year ended December 31, 2019, the Fund paid transfer agent fees of $3,042,264, of which $1,522,842 was retained by Investor Services.
f. Investments in Affiliated Management Investment Companies
The Fund invests in one or more affiliated management investment companies for purposes other than exercising a controlling influence over the management or policies. Management fees paid by the Fund are waived on assets invested in the affiliated management investment companies, as noted in the Statement of Operations, in an amount not to exceed the management and administrative fees paid directly or indirectly by each affiliate. During the year ended December 31, 2019, the Fund held investments in affiliated management investment companies as follows:
Value at Beginning of Year | Purchases | Sales | Realized Gain (Loss) | Net Change in Unrealized Appreciation (Depreciation) | Value at End of Year | Number of Shares Held at End of Year | Income from securities loaned | |||||||||||||||||||||||||
Non-Controlled Affiliates | ||||||||||||||||||||||||||||||||
Institutional Fiduciary Trust Money Market Portfolio, 1.26% | $ | — | $51,845,000 | $(51,845,000 | ) | $ — | $ — | $— | a | — | $21,748 | |||||||||||||||||||||
|
|
|
| |||||||||||||||||||||||||||||
aAs of December 31, 2019, no longer held by the Fund.
g. Waiver and Expense Reimbursements
Investor Services has contractually agreed in advance to waive or limit its fees so that the Class R6 transfer agent fees do not exceed 0.02% based on the average net assets of the class until April 30, 2020.
h. Interfund Transactions
The Fund engaged in purchases and sales of investments with funds or other accounts that have common investment managers (or affiliated investment managers), directors, trustees or officers. During the year ended December 31, 2019, these purchase and sale transactions aggregated $10,152,941 and $5,196,414, respectively.
4. Expense Offset Arrangement
The Fund has entered into an arrangement with its custodian whereby credits realized as a result of uninvested cash balances are used to reduce a portion of the Fund’s custodian expenses. During the year ended December 31, 2019, the custodian fees were reduced as noted in the Statement of Operations.
5. Independent Trustees’ Retirement Plan
On January 1, 1993, the Trust adopted an Independent Trustees’ Retirement Plan (Plan). The Plan is an unfunded defined benefit plan that provides benefit payments to Trustees whose length of service and retirement age meets the eligibility requirements of the Plan. Benefits under the Plan are based on years of service and fees paid to each trustee at the time of retirement. Effective in December 1996, the Plan was closed to new participants.
| franklintempleton.com | Annual Report | 35 | ||
FRANKLIN MUTUAL SERIES FUNDS
NOTES TO FINANCIAL STATEMENTS
Franklin Mutual Beacon Fund(continued)
5. Independent Trustees’ Retirement Plan(continued)
During the year ended December 31, 2019, the Fund’s projected benefit obligation and benefit payments under the Plan were as follows:
aProjected benefit obligation at December 31, 2019 | $ | 302,524 | ||
bIncrease in projected benefit obligation | $ | 29,884 | ||
Benefit payments made to retired trustees | $ | (4,543 | ) |
aThe projected benefit obligation is included in trustees’ fees and expenses in the Statement of Assets and Liabilities.
bThe increase in projected benefit obligation is included in trustees’ fees and expenses in the Statement of Operations.
6. Income Taxes
The tax character of distributions paid during the years ended December 31, 2019 and 2018, was as follows:
| 2019 | 2018 | |||||||
|
| |||||||
Distributions paid from: | ||||||||
Ordinary income | $ | 104,017,656 | $ | 65,063,571 | ||||
Long term capital gain | 63,557,862 | 253,934,676 | ||||||
|
| |||||||
| $ | 167,575,518 | $ | 318,998,247 | |||||
|
| |||||||
At December 31, 2019, the cost of investments, net unrealized appreciation (depreciation), undistributed ordinary income and undistributed long term capital gains for income tax purposes were as follows:
Cost of investments | $ | 2,869,289,065 | ||
|
| |||
Unrealized appreciation | $ | 978,284,742 | ||
Unrealized depreciation | (109,679,492 | ) | ||
|
| |||
Net unrealized appreciation (depreciation) | $ | 868,605,250 | ||
|
| |||
Distributable earnings: | ||||
Undistributed ordinary income | $ | 11,206,405 | ||
Undistributed long term capital gains | 12,030,908 | |||
|
| |||
Total distributable earnings | $ | 23,237,313 | ||
|
| |||
Differences between income and/or capital gains as determined on a book basis and a tax basis are primarily due to differing treatment of foreign currency transactions.
The Fund utilized a tax accounting practice to treat a portion of the proceeds from capital shares redeemed as a distribution from realized capital gains.
7. Investment Transactions
Purchases and sales of investments (excluding short term securities and securities sold short) for the year ended December 31, 2019, aggregated $1,048,561,695 and $1,223,172,180, respectively.
36 | Annual Report | franklintempleton.com | ||
FRANKLIN MUTUAL SERIES FUNDS
NOTES TO FINANCIAL STATEMENTS
Franklin Mutual Beacon Fund(continued)
8. Credit Risk and Defaulted Securities
The Fund may purchase thepre-default or defaulted debt of distressed companies. Distressed companies are financially troubled and could be or are already involved in financial restructuring or bankruptcy. Risks associated with purchasing these securities include the possibility that the bankruptcy or other restructuring process takes longer than expected, or that distributions in restructuring are less than anticipated, either or both of which may result in unfavorable consequences to the Fund. If it becomes probable that the income on debt securities, including those of distressed companies, will not be collected, the Fund discontinues accruing income and recognizes an adjustment for uncollectible interest.
At December 31, 2019, the Fund did not hold any distressed company securities for which interest recognition has been discontinued.
9. Concentration of Risk
Investing in foreign securities may include certain risks and considerations not typically associated with investing in U.S. securities, such as fluctuating currency values and changing local, regional and global economic, political and social conditions, which may result in greater market volatility. Current political and financial uncertainty surrounding the European Union may increase market volatility and the economic risk of investing in securities in Europe. In addition, certain foreign securities may not be as liquid as U.S. securities.
10. Restricted Securities
The Fund invests in securities that are restricted under the Securities Act of 1933 (1933 Act). Restricted securities are often purchased in private placement transactions, and cannot be sold without prior registration unless the sale is pursuant to an exemption under the 1933 Act. Disposal of these securities may require greater effort and expense, and prompt sale at an acceptable price may be difficult. The Fund may have registration rights for restricted securities. The issuer generally incurs all registration costs.
At December 31, 2019, investments in restricted securities, excluding securities exempt from registration under the 1933 Act, were as follows:
| Shares | Issuer | Acquisition Date | Cost | Value | ||||||||||
| 2,846,329 | International Automotive Components Group Brazil LLC, (Value is 0.0%†of Net Assets) | 4/13/06 -12/26/08 | $ | 1,890,264 | $ | 103,322 | ||||||||
|
| |||||||||||||
†Rounds to less than 0.1% of net assets.
| franklintempleton.com | Annual Report | 37 | ||
FRANKLIN MUTUAL SERIES FUNDS
NOTES TO FINANCIAL STATEMENTS
Franklin Mutual Beacon Fund(continued)
11. Other Derivative Information
At December 31, 2019, investments in derivative contracts are reflected in the Statement of Assets and Liabilities as follows:
Asset Derivatives | Liability Derivatives | |||||||||||
Derivative Contracts Not Accounted for as Hedging Instruments | Statement of Assets and Liabilities Location | Fair Value | Statement of Assets and Liabilities Location | Fair Value | ||||||||
| ||||||||||||
Foreign exchange contracts | Variation margin on futures contracts | $ | — | Variation margin on futures contracts | $ | 1,848,175 | a | |||||
Unrealized appreciation on OTC forward exchange contracts | 281,737 | Unrealized depreciation on OTC forward exchange contracts | 12,515,823 | |||||||||
|
|
|
| |||||||||
Totals | $ | 281,737 | $ | 14,363,998 | ||||||||
|
|
|
| |||||||||
| aThis amount reflects the cumulative appreciation (depreciation) of futures contracts as reported in the Statement of Investments. Only the variation margin receivable/ payable at year end is separately reported within the Statement of Assets and Liabilities. Prior variation margin movements were recorded to cash upon receipt or payment. |
| |||||||||||
| For the year ended December 31, 2019, the effect of derivative contracts in the Statement of Operations was as follows: | ||||||||||||
Derivative Contracts Not Accounted for as Hedging Instruments | Statement of Operations Location | Net Realized Gain (Loss) for the Year | Statement of Operations Location | Net Change in Unrealized Appreciation (Depreciation) for the Year | ||||||||
| ||||||||||||
| Net realized gain (loss) from: | Net change in unrealized appreciation (depreciation) on: | |||||||||||
Foreign exchange contracts | Forward exchange contracts | $ | 22,896,380 | Forward exchange contracts | $ | (14,968,234 | ) | |||||
| Futures contracts | 6,145,223 | Futures contracts | (2,058,651 | ) | ||||||||
|
|
|
| |||||||||
Totals | $ | 29,041,603 | $ | (17,026,885 | ) | |||||||
|
|
|
| |||||||||
For the year ended December 31, 2019, the average month end notional amount of futures contracts represented $215,135,753. The average month end contract value of forward exchange contracts was $447,054,197.
See Note 1(c) regarding derivative financial instruments.
12. Credit Facility
The Fund, together with other U.S. registered and foreign investment funds (collectively, Borrowers), managed by Franklin Templeton, are borrowers in a joint syndicated senior unsecured credit facility totaling $2 billion (Global Credit Facility) which matured on February 7, 2020. This Global Credit Facility provides a source of funds to the Borrowers for temporary and emergency purposes, including the ability to meet future unanticipated or unusually large redemption requests. Effective February 7, 2020, the Borrowers renewed the Global Credit Facility for a one year term, maturing February 5, 2021, for a total of $2 billion.
Under the terms of the Global Credit Facility, the Fund shall, in addition to interest charged on any borrowings made by the Fund and other costs incurred by the Fund, pay its share of fees and expenses incurred in connection with the implementation and maintenance of the Global Credit Facility, based upon its relative share of the aggregate net assets of all of the Borrowers, including an annual commitment fee of 0.15% based upon the unused portion of the Global Credit Facility. These fees are reflected in other expenses in the Statement of Operations. During the year ended December 31, 2019, the Fund did not use the Global Credit Facility.
38 | Annual Report | franklintempleton.com | ||
FRANKLIN MUTUAL SERIES FUNDS
NOTES TO FINANCIAL STATEMENTS
Franklin Mutual Beacon Fund(continued)
13. Fair Value Measurements
The Fund follows a fair value hierarchy that distinguishes between market data obtained from independent sources (observable inputs) and the Fund’s own market assumptions (unobservable inputs). These inputs are used in determining the value of the Fund’s financial instruments and are summarized in the following fair value hierarchy:
| • | Level 1 – quoted prices in active markets for identical financial instruments |
| • | Level 2 – other significant observable inputs (including quoted prices for similar financial instruments, interest rates, prepayment speed, credit risk, etc.) |
| • | Level 3 – significant unobservable inputs (including the Fund’s own assumptions in determining the fair value of financial instruments) |
The input levels are not necessarily an indication of the risk or liquidity associated with financial instruments at that level.
A summary of inputs used as of December 31, 2019, in valuing the Fund’s assets and liabilities carried at fair value, is as follows:
| Level 1 | Level 2 | Level 3 | Total | |||||||||||||
Assets: | ||||||||||||||||
Investments in Securities:a | ||||||||||||||||
Equity Investments:b | ||||||||||||||||
Auto Components | $ | — | $ | — | $ | 103,322 | $ | 103,322 | ||||||||
Media | 211,103,163 | — | 100,914 | 211,204,077 | ||||||||||||
All Other Equity Investments | 3,399,132,237 | — | — | 3,399,132,237 | ||||||||||||
Corporate Notes and Senior Floating Rate Interests | — | 60,269,906 | — | 60,269,906 | ||||||||||||
Companies in Liquidation | — | — | 25,456c | 25,456 | ||||||||||||
Short Term Investments | 104,139,718 | — | — | 104,139,718 | ||||||||||||
Total Investments in Securities | $ | 3,714,375,118 | $ | 60,269,906 | $ | 229,692 | $ | 3,774,874,716 | ||||||||
Other Financial Instruments: | ||||||||||||||||
Forward Exchange Contracts | $ | — | $ | 281,737 | $ | — | $ | 281,737 | ||||||||
Liabilities: | ||||||||||||||||
Other Financial Instruments: | ||||||||||||||||
Securities Sold Shorta | $ | 22,902,996 | $ | — | $ | — | $ | 22,902,996 | ||||||||
Futures Contracts | 1,848,175 | — | — | 1,848,175 | ||||||||||||
Forward Exchange Contracts | — | 12,515,823 | — | 12,515,823 | ||||||||||||
Total Other Financial Instruments | $ | 24,751,171 | $ | 12,515,823 | $ | — | $ | 37,266,994 | ||||||||
aFor detailed categories, see the accompanying Statement of Investments.
bIncludes common and preferred stocks as well as other equity interests.
cIncludes securities determined to have no value at December 31, 2019.
A reconciliation of assets in which Level 3 inputs are used in determining fair value is presented when there are significant Level 3 financial instruments at the beginning and/or end of the year.
| franklintempleton.com | Annual Report | 39 | ||
FRANKLIN MUTUAL SERIES FUNDS
NOTES TO FINANCIAL STATEMENTS
Franklin Mutual Beacon Fund(continued)
14. Subsequent Events
The Fund has evaluated subsequent events through the issuance of the financial statements and determined that no events have occurred that require disclosure other than those already disclosed in the financial statements.
Abbreviations
| Counterparty | Currency | Selected Portfolio | ||||||||
BOFA | Bank of America Corp. | EUR | Euro | ADR | American Depositary Receipt | |||||
HSBK | HSBC Bank PLC | GBP | British Pound | LIBOR | London InterBank Offered Rate | |||||
SSBT | State Street Bank and Trust Co., N.A. | USD | United States Dollar | |||||||
UBSW | UBS AG | |||||||||
40 | Annual Report | franklintempleton.com | ||
FRANKLIN MUTUAL SERIES FUNDS
Report of Independent Registered Public Accounting Firm
To the Board of Trustees of Franklin Mutual Series Funds and Shareholders of Franklin Mutual Beacon Fund:
Opinion on the Financial Statements
We have audited the accompanying statement of assets and liabilities of Franklin Mutual Beacon Fund (the “Fund”) (one of the funds constituting Franklin Mutual Series Funds), including the schedule of investments, as of December 31, 2019, and the related statement of operations for the year then ended, the statements of changes in net assets for each of the two years in the period then ended, the financial highlights for each of the five years in the period then ended and the related notes (collectively referred to as the “financial statements”). In our opinion, the financial statements present fairly, in all material respects, the financial position of Franklin Mutual Beacon Fund (one of the funds constituting Franklin Mutual Series Funds) at December 31, 2019, the results of its operations for the year then ended, the changes in its net assets for each of the two years in the period then ended and its financial highlights for each of the five years in the period then ended, in conformity with U.S. generally accepted accounting principles.
Basis for Opinion
These financial statements are the responsibility of the Fund’s management. Our responsibility is to express an opinion on the Fund’s financial statements based on our audits. We are a public accounting firm registered with the Public Company Accounting Oversight Board (United States) (“PCAOB”) and are required to be independent with respect to the Fund in accordance with the U.S. federal securities laws and the applicable rules and regulations of the Securities and Exchange Commission and the PCAOB.
We conducted our audits in accordance with the standards of the PCAOB. Those standards require that we plan and perform the audit to obtain reasonable assurance about whether the financial statements are free of material misstatement, whether due to error or fraud. The Fund is not required to have, nor were we engaged to perform, an audit of the Fund’s internal control over financial reporting. As part of our audits, we are required to obtain an understanding of internal control over financial reporting, but not for the purpose of expressing an opinion on the effectiveness of the Fund’s internal control over financial reporting. Accordingly, we express no such opinion.
Our audits included performing procedures to assess the risks of material misstatement of the financial statements, whether due to error or fraud, and performing procedures that respond to those risks. Such procedures included examining, on a test basis, evidence regarding the amounts and disclosures in the financial statements. Our procedures included confirmation of securities owned as of December 31, 2019, by correspondence with the custodian and brokers or by other appropriate auditing procedures where replies from others were not received. Our audits also included evaluating the accounting principles used and significant estimates made by management, as well as evaluating the overall presentation of the financial statements. We believe that our audits provide a reasonable basis for our opinion.

We have served as the auditor of one or more Franklin investment companies since 1987.
Boston, Massachusetts
February 21, 2020
| franklintempleton.com | Annual Report | 41 | ||
FRANKLIN MUTUAL SERIES FUNDS
Franklin Mutual Beacon Fund
Under Section 852(b)(3)(C) of the Internal Revenue Code, the Fund hereby reports the maximum amount allowable but no less than $68,396,529 as a long term capital gain dividend for the fiscal year ended December 31, 2019.
Under Section 871(k)(2)(C) of the Internal Revenue Code, the Fund hereby reports the maximum amount allowable but no less than $24,935,470 as a short term capital gain dividend for purposes of the tax imposed under Section 871(a)(1)(A) of the Internal Revenue Code for the fiscal year ended December 31, 2019.
Under Section 854(b)(1)(A) of the Internal Revenue Code, the Fund hereby reports 30.22% of the ordinary income dividends as income qualifying for the dividends received deduction for the fiscal year ended December 31, 2019.
Under Section 854(b)(1)(B) of the Internal Revenue Code, the Fund hereby reports the maximum amount allowable but no less than $67,686,024 as qualified dividends for purposes of the maximum rate under Section 1(h)(11) of the Internal Revenue Code for the fiscal year ended December 31, 2019. Distributions, including qualified dividend income, paid during calendar year 2019 will be reported to shareholders on Form1099-DIV bymid-February 2020. Shareholders are advised to check with their tax advisors for information on the treatment of these amounts on their individual income tax returns.
Under Section 871(k)(1)(C) of the Internal Revenue Code, the Fund hereby reports the maximum amount allowable but no less than $8,721,730 as interest related dividends for purposes of the tax imposed under Section 871(a)(1)(A) of the Internal Revenue Code for the fiscal year ended December 31, 2019.
42 | Annual Report | franklintempleton.com | ||
FRANKLIN MUTUAL SERIES FUNDS
The name, year of birth and address of the officers and board members, as well as their affiliations, positions held with the Trust, principal occupations during at least the past five years and number of U.S. registered portfolios overseen in the Franklin Templeton fund complex, are shown below. Generally, each board member serves until that person’s successor is elected and qualified.
Independent Board Members
Name, Year of Birth and Address | Position | Length of Time Served | Number of Portfolios in Fund Complex Overseen by Board Member* | Other Directorships Held During at Least the Past 5 Years | ||||
| Edward I. Altman, Ph.D. (1941) | Trustee | Since 1987 | 12 | None | ||||
c/o Franklin Mutual Advisers, LLC | ||||||||
101 John F. Kennedy Parkway | ||||||||
Short Hills, NJ 07078-2716 | ||||||||
| Principal Occupation During at Least the Past 5 Years: | ||||||||
Max L. Heine Professor of Finance, Emeritus and Director of The Credit and Debt Markets Research Program, Salomon Center, Stern School of Business, New York University; editor and author of numerous financial publications; financial consultant; an adviser to numerous financial and publishing organizations; andformerly, Vice Director, Salomon Center, Stern School of Business, New York University.
| ||||||||
Ann Torre Bates (1958) c/o Franklin Mutual Advisers, LLC 101 John F. Kennedy Parkway Short Hills, NJ 07078-2716 | Trustee and Chairperson | Trustee since 1995 and Chairperson since January 2020 | 33 | Ares Capital Corporation (specialty finance company) (2010-present), United Natural Foods, Inc. (distributor of natural, organic and specialty foods) (2013-present), Allied Capital Corporation (financial services) (2003-2010), SLM Corporation (Sallie Mae) (1997-2014) and Navient Corporation (loan management, servicing and asset recovery) (2014-2016). | ||||
| Principal Occupation During at Least the Past 5 Years: | ||||||||
Director of various companies; andformerly, Executive Vice President and Chief Financial Officer, NHP Incorporated (manager of multifamily housing) (1995-1997); and Vice President and Treasurer, US Airways, Inc. (until 1995).
| ||||||||
Burton J. Greenwald (1929) c/o Franklin Mutual Advisers, LLC 101 John F. Kennedy Parkway Short Hills, NJ 07078-2716 | Trustee | Since 2002 | 12 | Franklin Templeton Emerging Markets Debt Opportunities Fund PLC (1999-present) and Fiduciary International Ireland Limited (1999-2015). | ||||
| Principal Occupation During at Least the Past 5 Years: | ||||||||
Managing Director, B.J. Greenwald Associates (management consultants to the financial services industry); andformerly, Chairman, Fiduciary Trust International Funds; Executive Vice President, L.F. Rothschild Fund Management, Inc.; President and Director, Merit Mutual Funds; President, Underwriting Division and Director, National Securities & Research Corporation; Governor, Investment Company Institute; and Chairman, ICI Public Information Committee.
| ||||||||
Jan Hopkins Trachtman(1947) c/o Franklin Mutual Advisers, LLC 101 John F. Kennedy Parkway Short Hills, NJ 07078-2716 | Trustee | Since 2009 | 12 | FinTech Acquisition Corp. III (special purpose fintech acquisition company) (2018-present) | ||||
| Principal Occupation During at Least the Past 5 Years: | ||||||||
President and Founder, The Jan Hopkins Group (communications consulting firm); serves on Alumni Advisory Board of Knight Bagehot Fellowship; andformerly, President, Economic Club of New York (2007-2015); Anchor/Correspondent, CNN Financial News (until 2003); Managing Director and Head of Client Communications, Citigroup Private Bank (until 2005);Off-Air reporter, ABC News’ World News Tonight; and Editor, CBS Network News.
| ||||||||
| franklintempleton.com | Annual Report | 43 | ||
FRANKLIN MUTUAL SERIES FUNDS
Independent Board Members(continued)
Name, Year of Birth and Address | Position | Length of Time Served | Number of Portfolios in Fund Complex Overseen by Board Member* | Other Directorships Held During at Least the Past 5 Years | ||||
| Keith Mitchell (1954) | Trustee | Since 2009 | 12 | None | ||||
c/o Franklin Mutual Advisers, LLC | ||||||||
101 John F. Kennedy Parkway | ||||||||
Short Hills, NJ 07078-2716 | ||||||||
| Principal Occupation During at Least the Past 5 Years: | ||||||||
Director of various boards of asset management firms; andformerly, Managing Member, Mitchell, Hartley & Bechtel Advisers, LLC (formerly, Mitchell Advisers, LLC) (advisory firm) (2003-2015) and Managing Director, Putman Lovell NBF.
| ||||||||
David W. Niemiec (1949) c/o Franklin Mutual Advisers, LLC 101 John F. Kennedy Parkway Short Hills, NJ 07078-2716 | Trustee | Since 2015 | 33 | Hess Midstream LP (oil and gas midstream infrastructure) (2017-present). | ||||
| Principal Occupation During at Least the Past 5 Years: | ||||||||
Advisor, Saratoga Partners (private equity fund); andformerly, Managing Director, Saratoga Partners (1998-2001) and SBC Warburg Dillon Read (investment banking) (1997-1998); Vice Chairman, Dillon, Read & Co. Inc. (investment banking) (1991-1997); and Chief Financial Officer, Dillon, Read & Co. Inc. (1982-1997).
| ||||||||
| Charles Rubens II (1930) | Trustee | Since 1998 | 12 | None | ||||
c/o Franklin Mutual Advisers, LLC | ||||||||
101 John F. Kennedy Parkway | ||||||||
Short Hills, NJ 07078-2716 | ||||||||
| Principal Occupation During at Least the Past 5 Years: | ||||||||
Private investor and president ofnon-profit organizations; andformerly, an executive of Time, Inc.; and Trustee of Colorado College.
| ||||||||
| Robert E. Wade (1946) | Trustee | Since 1991 | 33 | El Oro Ltd (investments) (2003-2019). | ||||
c/o Franklin Mutual Advisers, LLC | ||||||||
101 John F. Kennedy Parkway | ||||||||
Short Hills, NJ 07078-2716 | ||||||||
| Principal Occupation During at Least the Past 5 Years: | ||||||||
Attorney at law engaged in private practice as a sole practitioner (1972-2008) and member of various boards.
| ||||||||
| Gregory H. Williams (1943) | Trustee | Since 2015 | 12 | None | ||||
c/o Franklin Mutual Advisers, LLC | ||||||||
101 John F. Kennedy Parkway | ||||||||
Short Hills, NJ 07078-2716 | ||||||||
| Principal Occupation During at Least the Past 5 Years: | ||||||||
Private investor; Consultant; andformerly, President, University of Cincinnati (2009-2012); President, The City College of New York (2001-2009); Dean, College of Law, Ohio State University (1993-2001); and Associate Vice President, Academic Affairs and Professor of Law, University of Iowa (1977-1993).
| ||||||||
| Interested Board Members and Officers | ||||||||
Name,Year of Birth and Address | Position | Length of Time Served | Number of Portfolios in Fund Complex Overseen by Board Member* | Other Directorships Held During at Least the Past 5 Years | ||||
| **Gregory E. Johnson (1961) | Trustee | Since 2007 | 144 | None | ||||
One Franklin Parkway | ||||||||
San Mateo, CA 94403-1906 | ||||||||
| Principal Occupation During at Least the Past 5 Years: | ||||||||
Chairman of the Board, Member – Office of the Chairman, Director and Chief Executive Officer, Franklin Resources, Inc.; officer and/or director or trustee, as the case may be, of some of the other subsidiaries of Franklin Resources, Inc. and of 39 of the investment companies in Franklin Templeton; Vice Chairman, Investment Company Institute; andformerly, President, Franklin Resources, Inc. (1994-2015).
| ||||||||
44 | Annual Report | franklintempleton.com | ||
FRANKLIN MUTUAL SERIES FUNDS
Interested Board Members and Officers(continued)
Name, Year of Birth and Address | Position | Length of Time Served | Number of Portfolios in Fund Complex Overseen by Board Member* | Other Directorships Held During at Least the Past 5 Years | ||||
**Peter A. Langerman (1955) c/o Franklin Mutual Advisers, LLC 101 John F. Kennedy Parkway Short Hills, NJ 07078-2716 | Trustee, President, and Chief Executive Officer – Investment Management | Trustee since 2007, President, and Chief Executive Officer – Investment Management since 2005 | 7 | None | ||||
| Principal Occupation During at Least the Past 5 Years: | ||||||||
Chairman of the Board, Chief Executive Officer and President, Franklin Mutual Advisers, LLC; and officer and/or director, as the case may be, of three of the investment companies in Franklin Templeton.
| ||||||||
Alison E. Baur (1964) One Franklin Parkway San Mateo, CA 94403-1906 | Vice President | Since 2012 | Not Applicable | Not Applicable | ||||
| Principal Occupation During at Least the Past 5 Years: | ||||||||
Deputy General Counsel, Franklin Templeton; and officer of some of the other subsidiaries of Franklin Resources, Inc. and of 41 of the investment companies in Franklin Templeton.
| ||||||||
Breda M. Beckerle (1958) 280 Park Avenue New York, NY 10017 | Interim Chief Compliance Officer | Since January 2020 | Not Applicable | Not Applicable | ||||
| Principal Occupation During at Least the Past 5 Years: | ||||||||
Chief Compliance Officer, Fiduciary Investment Management International, Inc., Franklin Advisers, Inc., Franklin Advisory Services, LLC, Franklin Mutual Advisers, LLC, Franklin Templeton Institutional, LLC; and officer of 41 of the investment companies in Franklin Templeton.
| ||||||||
Steven J. Gray (1955) One Franklin Parkway San Mateo, CA 94403-1906 | Vice President and Secretary | Vice President since 2009 and Secretary since 2005 | Not Applicable | Not Applicable | ||||
| Principal Occupation During at Least the Past 5 Years: | ||||||||
Senior Associate General Counsel, Franklin Templeton; Vice President, Franklin Templeton Distributors, Inc. and FASA, LLC; and officer of 41 of the investment companies in Franklin Templeton.
| ||||||||
Matthew T. Hinkle (1971) One Franklin Parkway San Mateo, CA 94403-1906 | Chief Executive Officer – Finance and Administration | Since 2017 | Not Applicable | Not Applicable | ||||
| Principal Occupation During at Least the Past 5 Years: | ||||||||
Senior Vice President, Franklin Templeton Services, LLC; officer of 41 of the investment companies in Franklin Templeton; andformerly, Vice President, Global Tax (2012-April 2017) and Treasurer/Assistant Treasurer, Franklin Templeton (2009-2017).
| ||||||||
Robert G. Kubilis (1973) 300 S.E. 2nd Street Fort Lauderdale, FL 33301-1923 | Chief Financial Officer, Chief Accounting Officer and Treasurer | Since 2012 | Not Applicable | Not Applicable | ||||
| Principal Occupation During at Least the Past 5 Years: | ||||||||
Treasurer, U.S. Fund Administration & Reporting; and officer of 15 of the investment companies in Franklin Templeton.
| ||||||||
| franklintempleton.com | Annual Report | 45 | ||
FRANKLIN MUTUAL SERIES FUNDS
Interested Board Members and Officers(continued)
Name, Year of Birth and Address | Position | Length of Time Served | Number of Portfolios in Fund Complex Overseen by Board Member* | Other Directorships Held During at Least the Past 5 Years | ||||
Robert Lim (1948) One Franklin Parkway San Mateo, CA 94403-1906 | Vice President – AML Compliance | Since 2016 | Not Applicable | Not Applicable | ||||
| Principal Occupation During at Least the Past 5 Years: | ||||||||
Vice President, Franklin Templeton Companies, LLC; Chief Compliance Officer, Franklin Templeton Distributors, Inc. and Franklin Templeton Investor Services, LLC; and officer of 44 of the investment companies in Franklin Templeton Investments.
| ||||||||
Navid J. Tofigh (1972) One Franklin Parkway San Mateo, CA 94403-1906 | Vice President | Since 2015 | Not Applicable | Not Applicable | ||||
| Principal Occupation During at Least the Past 5 Years: | ||||||||
Associate General Counsel; and officer of 41 of the investment companies in Franklin Templeton.
| ||||||||
Craig S. Tyle (1960) One Franklin Parkway San Mateo, CA 94403-1906 | Vice President | Since 2005 | Not Applicable | Not Applicable | ||||
| Principal Occupation During at Least the Past 5 Years: | ||||||||
General Counsel and Executive Vice President, Franklin Resources, Inc.; and officer of some of the other subsidiaries of Franklin Resources, Inc. and of 41 of the investment companies in Franklin Templeton.
| ||||||||
Lori A. Weber (1964) 300 S.E. 2nd Street Fort Lauderdale, FL 33301-1923 | Vice President | Since 2011 | Not Applicable | Not Applicable | ||||
| Principal Occupation During at Least the Past 5 Years: | ||||||||
Senior Associate General Counsel, Franklin Templeton; Assistant Secretary, Franklin Resources, Inc.; Vice President and Secretary, Templeton Investment Counsel, LLC; and officer of 41 of the investment companies in Franklin Templeton.
| ||||||||
46 | Annual Report | franklintempleton.com | ||
FRANKLIN MUTUAL SERIES FUNDS
*We base the number of portfolios on each separate series of the U.S. registered investment companies within the Franklin Templeton fund complex. These portfolios have a common investment manager or affiliated investment managers.
**Gregory E. Johnson is considered to be an interested person of the Fund under the federal securities laws due to his position as an officer and director of Franklin Resources, Inc. (Resources), which is the parent company of the Fund’s investment manager and distributor. Peter A. Langerman is considered to be an interested person of the Fund under the federal securities laws due to his position as an officer of Franklin Mutual Advisers, LLC, which is the Fund’s investment manager.
Note 1: Officer information is current as of the date of this report. It is possible that after this date, information about officers may change.
The Sarbanes-Oxley Act of 2002 and Rules adopted by the U.S. Securities and Exchange Commission require the Fund to disclose whether the Fund’s Audit Committee includes at least one member who is an audit committee financial expert within the meaning of such Act and Rules. The Fund’s Board has determined that there is at least one such financial expert on the Audit Committee and has designated each of Edward I. Altman, Ph.D., Ann Torre Bates and David W. Niemiec as an audit committee financial expert. The Board believes that Messrs. Altman and Niemiec and Ms. Bates qualify as such an expert in view of their extensive business background and experience. Mr. Altman has served as a member of the Fund Audit Committee since 1987. He currently serves as a Max L. Hine Professor of Finance, Emeritus and Director of The Credit and Debt Markets Research Program, Salomon Center, Stern School of Business, New York University. Ms. Bates has served as a member of the Fund Audit Committee since 1995. She currently serves as a director of Ares Capital Corporation (2010-present) and United Natural Foods, Inc. (2013-present) and was formerly a director of Navient Corporation from 2014 to 2016, SLM Corporation from 1997 to 2014 and Allied Capital Corporation from 2003 to 2010, Executive Vice President and Chief Financial Officer of NHP Incorporated from 1995 to 1997 and Vice President and Treasurer of US Airways, Inc. until 1995. Mr. Niemiec has served as a member of the Fund Audit Committee since 2015, currently serves as an Advisor to Saratoga Partners and was formerly its Managing Director from 1998 to 2001 and serves as a director of Hess Midstream LP (2017-present). Mr. Niemiec was formerly a director of Emeritus Corporation from 1999 to 2010 and OSI Pharmaceuticals, Inc. from 2006 to 2010, Managing Director of SBC Warburg Dillon Read from 1997 to 1998, and was Vice Chairman from 1991 to 1997 and Chief Financial Officer from 1982 to 1997 of Dillon, Read & Co. Inc. As a result of such background and experience, the Board believes that Messrs. Altman and Niemiec and Ms. Bates have each acquired an understanding of generally accepted accounting principles and financial statements, the general application of such principles in connection with the accounting estimates, accruals and reserves, and analyzing and evaluating financial statements that present a breadth and level of complexity of accounting issues generally comparable to those of the Fund, as well as an understanding of internal controls and procedures for financial reporting and an understanding of audit committee functions. Messrs. Altman and Niemiec and Ms. Bates are independent Board members as that term is defined under the applicable U.S. Securities and Exchange Commission Rules and Releases.
The Statement of Additional Information (SAI) includes additional information about the board members and is available, without charge, upon request. Shareholders may call (800) DIALBEN/342-5236 to request the SAI.
| franklintempleton.com | Annual Report | 47 | ||
FRANKLIN MUTUAL SERIES FUNDS
FRANKLIN MUTUAL BEACON FUND
Proxy Voting Policies and Procedures
The Fund’s investment manager has established Proxy Voting Policies and Procedures (Policies) that the Fund uses to determine how to vote proxies relating to portfolio securities. Shareholders may view the Fund’s complete Policies online at franklintempleton.com. Alternatively, shareholders may request copies of the Policies free of charge by calling the Proxy Group collect at (954)527-7678 or by sending a written request to: Franklin Templeton Companies, LLC, 300 S.E. 2nd Street, Fort Lauderdale, FL 33301, Attention: Proxy Group. Copies of the Fund’s proxy voting records are also made available online at franklintempleton.com and posted on the U.S. Securities and Exchange Commission’s website at sec.gov and reflect the most recent12-month period ended June 30.
Quarterly Statement of Investments
The Trust, on behalf of the Fund, files a complete statement of investments with the U.S. Securities and Exchange Commission for the first and third quarters for each fiscal year as an exhibit to its report on FormN-PORT. Shareholders may view the filed FormN-PORT by visiting the Commission’s website at sec.gov. The filed form may also be viewed and copied at the Commission’s Public Reference Room in Washington, DC. Information regarding the operations of the Public Reference Room may be obtained by calling(800) SEC-0330.
Householding of Reports and Prospectuses
You will receive the Fund’s financial reports every six months as well as an annual updated summary prospectus (prospectus available upon request). To reduce Fund expenses, we try to identify related shareholders in a household and send only one copy of the financial reports and summary prospectus. This process, called “householding,” will continue indefinitely unless you instruct us otherwise. If you prefer not to have these documents householded, please call us at (800)632-2301. At any time you may view current prospectuses/summary prospectuses and financial reports on our website. If you choose, you may receive these documents through electronic delivery.
48 | Annual Report | franklintempleton.com | ||
Authorized for distribution only when accompanied or preceded by a summary prospectus and/or prospectus. Investors should carefully consider a fund’s investment goals, risks, charges and expenses before investing. A prospectus contains this and other information; please read it carefully before investing.
To help ensure we provide you with quality service, all calls to and from our service areas are monitored and/or recorded.
 | Annual Report and Shareholder Letter Franklin Mutual Beacon Fund | |||||
| Investment Manager | Distributor | Shareholder Services | ||||
| Franklin Mutual Advisers, LLC | Franklin Templeton Distributors, Inc. | (800) 632-2301 - (Class A, C, R & | ||||
| (800) DIAL BEN®/342-5236 | R6) | |||||
| franklintempleton.com | (800)448-FUND - (Class Z) | |||||
| © 2020 Franklin Templeton Investments. All rights reserved. | 476 A 02/20 |
Sign up for electronic delivery at franklintempleton.com/edelivery
Internet Delivery of Fund Reports Unless You Request Paper Copies:Effective January 1, 2021, as permitted by the SEC, paper copies of the Fund’s shareholder reports will no longer be sent by mail, unless you specifically request them from the Fund or your financial intermediary. Instead, the reports will be made available on a website, and you will be notified by mail each time a report is posted and provided with a website link to access the report.
If you already elected to receive shareholder reports electronically, you will not be affected by this change and you need not take any action. If you have not signed up for electronic delivery, we would encourage you to join fellow shareholders who have. You may elect to receive shareholder reports and other communications electronically from the Fund by calling (800)632-2301 or by contacting your financial intermediary.
You may elect to continue to receive paper copies of all your future shareholder reports free of charge by contacting your financial intermediary or, if you invest directly with a Fund, calling (800)632-2301 to let the Fund know of your request. Your election to receive reports in paper will apply to all funds held in your account.
FRANKLIN TEMPLETON
Successful investing begins with ambition. And achievement only comes when you reach for it. That’s why we continually strive to deliver better outcomes for investors. No matter what your goals are, our deep, global investment expertise allows us to offer solutions that can help.
During our more than 70 years of experience, we’ve managed through all kinds of markets—up, down and those in between. We’re always preparing for what may come next. It’s because of this, combined with our strength as one of the world’s largest asset managers that we’ve earned the trust of millions of investors around the world.
Dear Franklin Mutual Global Discovery Fund Shareholder:
As we enter 2020, the factors that lifted stocks to record highs in 2019—accommodative central bank monetary policies and progress on a proposed trade deal between the U.S. and China—continue to be sources of optimism for growth. The near-term threat of recession has eased, with the U.S. economy showing resilience as low unemployment and moderately rising wages have encouraged consumer spending, which has supported the expansion. In contrast, business investment and exports were weak in 2019, but there are nascent signs of increasing industrial activity.
Tariffs, trade battles and geopolitical conflict may continue to dominate headlines in 2020 and account for a disproportionate source of market volatility. The U.S. and China agreed in principle to aphase-one trade agreement in late 2019. However, are-escalation of the tariff dispute between the world’s two largest economies is not out of the question, as negotiations on aphase-two trade agreement are scheduled to start after the anticipatedphase-one signing ceremony in January. There was clarity on Brexit as British voters delivered a resounding election victory to Prime Minister Boris Johnson and his Conservative Party, which should pave the way for a conclusive exit agreement. The terms of U.K. departure, however, must still be finalized. Late in the period, tensions in the Middle East were on the rise, following the death of an American contractor in Iraq in late December and a retaliatory U.S. military strike two days later.
During the period, we took advantage of market turbulence to seek out a larger number of stocks whose risk/reward profiles turned more favorable. Subsequently, we used the market appreciation to exit from or trim select positions that reached or exceeded our estimates of intrinsic value. Market volatility continues to present occasional opportunities in
individual stocks, and in certain sectors, notably those considered to be economically sensitive. We continue to focus on situations in which company-specific actions are more important than economic improvement in driving shareholder value.
Valuation is an essential factor in our analysis, and we always ask ourselves if current and potential investments represent an attractive balance of risk and reward. Amid theall-time highs reached by the Standard & Poor’s® 500 Index (S&P 500®) during the period, we maintained our focus on individual securities and the prospects for each business in the context of its valuation and the backdrop of potential political and economic risks.
We continue to adhere to abottom-up stock selection process that is disciplined, driven by rigorous fundamental analysis, and that attempts to limit downside risk. In our view, actively investing in underappreciated and misunderstood companies with identifiable catalysts for unlocking shareholder value can offer meaningful upside potential and a degree of downside protection in periods of financial market turbulence.
We recognize the important role of financial advisors in today’s markets and encourage investors to continue to seek their advice. Amid changing markets and economic conditions, we are confident investors with a well-diversified portfolio and a patient, long-term outlook will be well positioned for the years ahead.
On the following pages, the Fund’s portfolio management team reviews investment decisions that pertain to performance during the past 12 months considering the
| Not FDIC Insured | May Lose Value | No Bank Guarantee |
| franklintempleton.com | Not part of the annual report | 1 | ||
economic environment and other factors. Please remember all securities markets fluctuate, as do mutual fund share prices.
We thank you for investing with Franklin Templeton, welcome your questions and comments, and look forward to continuing to serve your investment needs in the years ahead.
Sincerely,

Peter A. Langerman
Chairman, President and Chief Executive Officer
Franklin Mutual Advisers, LLC
This letter reflects our analysis and opinions as of December 31, 2019, unless otherwise indicated. The information is not a complete analysis of every aspect of any market, country, industry, security or fund. Statements of fact are from sources considered reliable.
Contents
| 3 | ||||||
| 9 | ||||||
| 12 | ||||||
| 13 | ||||||
| 24 | ||||||
| 29 | ||||||
| 42 | ||||||
| 43 | ||||||
| 44 | ||||||
| 49 | ||||||
| Visitfranklintempleton.comfor fund updates, to access your account, or to find helpful financial planning tools. | ||||||
2 | Not part of the annual report | franklintempleton.com | ||
Franklin Mutual Global Discovery Fund
This annual report for Franklin Mutual Global Discovery Fund covers the fiscal year ended December 31, 2019. The reorganization of Franklin Mutual International Fund into Franklin Mutual Global Discovery Fund, as approved by shareholders, was completed on February 21, 2020. Shares of Franklin Mutual International Fund share classes A, C, R, R6 and Z were exchanged for shares in Franklin Mutual Global Discovery Fund share classes A, C, R, R6 and Z, respectively. We welcome the former shareholders of Franklin Mutual International Fund that now own shares of Franklin Mutual Global Discovery Fund.
Your Fund’s Goal and Main Investments
The Fund seeks capital appreciation. Under normal market conditions, the Fund invests primarily in equity securities of U.S. and foreign companies that we believe are available at market prices less than their intrinsic value. The equity securities in which the Fund invests are primarily common stock, with a current focus onmid- and large cap companies. To a lesser extent, the Fund also invests in merger arbitrage securities and the debt and equity of distressed companies. The Fund may invest a substantial portion, potentially up to 100% of its assets, in foreign securities, which may include sovereign debt and participations in foreign government debt. The Geographic Composition bar chart on this page lists the leading countries where the Fund invests.
Performance Overview
The Fund’s Class Z shares posted a +24.70% cumulative total return for the 12 months ended December 31, 2019. For comparison, the Fund’s benchmark, the MSCI World Index (USD), which tracks stock performance in global developed markets, posted a +28.40% total return.1 You can find more of the Fund’s performance data in the Performance Summary beginning on page 9.
Performance data represent past performance, which does not guarantee future results. Investment return and principal value will fluctuate, and you may have a gain or loss when you sell your shares. Current performance may differ from figures shown. For most recentmonth-end performance, go tofranklintempleton.comor call(800)342-5236.
Geographic Composition*
Based on Total Net Assets as of 12/31/19
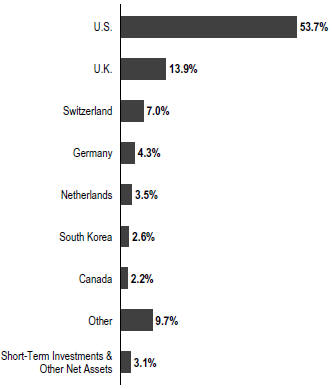
*Figures are stated as a percentage of total and may not equal 100% or may be negative due to rounding, use of any derivatives, unsettled trades or other factors.
Economic and Market Overview
Global developed and emerging market stocks, as measured by the MSCI All Country World Index (USD), posted a +27.30% total return during the 12 months ended December 31, 2019.1 Although global economic growth slowed from 2018, interest-rate cuts from many central banks and the easing of trade tensions nearperiod-end contributed to the generally positive environment for equities worldwide. Reflecting investor optimism and slowing but resilient economic growth, stocks advanced in every major region of the globe.
In the U.S., solid economic growth also supported equities, as healthy consumer spending and a strong labor market kept the economy afloat. The unemployment rate fell during
1. Source: Morningstar.
The index is unmanaged and includes reinvestment of any income or distributions. It does not reflect any fees, expenses or sales charges. One cannot invest directly in an index, and an index is not representative of the Fund’s portfolio.
The dollar value, number of shares or principal amount, and names of all portfolio holdings are listed in the Fund’s Statement of Investments (SOI).
The SOI begins on page 18.
| franklintempleton.com | Annual Report | 3 | ||
FRANKLIN MUTUAL GLOBAL DISCOVERY FUND
the year, reaching 3.5% in September, November and December 2019, the lowest recorded unemployment rate in 50 years.2 Wages also grew, albeit at a moderate pace, and inflation remained persistently low. In addition, deficit spending by the U.S. government boosted current growth at the expense of long-term debt. Despite the strength in the consumer sector, some parts of the economy struggled, particularly heavy industry. Annual industrial production contracted late in the reporting period, manufacturing output stalled and capital spending declined.
The U.S. Federal Reserve (Fed) provided a substantial boost to equity markets early in the reporting period as it shifted to a more accommodative monetary policy. In January 2019, the Fed signaled the end of its tightening cycle and cut the federal funds rate three times thereafter, lowering it to a range of 1.50%–1.75%. Stocks responded positively to the interest-rate cuts and gained further in December 2019 after the Fed indicated it would likely leave interest rates unchanged in 2020.
Growth slowed overall in the eurozone, particularly in Germany and Italy. Germany, which is heavily reliant on exports, was adversely affected by the trade conflict between the U.S. and China and the resulting slowdown in global trade. In Italy, political uncertainty and budget concerns caused the country’s annual gross domestic product (GDP) growth to stall in 2019’s first quarter before modestly improving in the second and third quarters. Despite sluggish economic conditions, European developed market equities, as measured by the MSCI EuropeIndex-NR (Local Currency), posted a +23.75% total return for the12-month period, as easing trade tensions buoyed investor optimism and an electoral victory by the Conservative Party in the U.K. alleviated uncertainty surrounding Brexit.3 Although the European Central Bank left its headline refinancing rate unchanged, it lowered the deposit rate and restarted its bond-buying stimulus program, further supporting stocks.
Economic growth in Asia was relatively solid overall, despite slowdowns in several large emerging market countries, such as China and India. Japan’s economy grew amid the Bank of Japan’s sizable stimulus program. The trade war between the U.S. and China provided the backdrop for Asian stocks, which rose and fell in sync with investor sentiment regarding a trade deal. A phase one trade agreement between the two countries reached in December 2019 propelled Asian developed and emerging market stocks, which ultimately
ended with a +19.23% total return over the12-month period, as measured by the MSCI All Country Asia Index (USD).4
Emerging market stocks overall experienced several sharp selloffs and subsequent rebounds throughout the reporting period before ending with gains. In aggregate, economic growth slowed somewhat from 2018 but remained solid, although there was some variation among individual countries. Many central banks in emerging markets cut interest rates throughout the reporting period, which, along with resilient GDP growth, provided a supportive environment for equities. Russian stocks posted the highest returns among emerging markets as the threat of further sanctions receded and a solid fiscal environment reassured investors. Overall, global emerging markets, as measured by the MSCI Emerging Markets Index (USD), posted a +18.90% total return for the12-month period.1
Investment Strategy
At Franklin Mutual Series, we are committed to our distinctive value approach to investing, which we believe can generate above-average risk-adjusted returns over time for our shareholders. Our major investment strategy is investing in undervalued stocks. When selecting undervalued equities, we are attracted to what we believe are fundamentally strong companies with healthy balance sheets, high-quality assets, substantial free cash flow and shareholder-oriented management teams and whose stocks are trading at discounts to our assessment of the companies’ intrinsic or business value. We also look for asset-rich companies whose shares may be trading at depressed levels due to concerns over short-term earnings disappointments, litigation, management strategy or other perceived negatives. This strict value approach is not only intended to improve the likelihood of capital appreciation, but also reduces the risk of substantial declines, in our opinion. While the vast majority of our undervalued equity investments are made in publicly traded companies globally, we may invest occasionally in privately held companies as well.
To a lesser extent, we complement this more traditional investment strategy with two others. One is distressed investing, a highly specialized field that has proven quite profitable during certain periods over the years. Distressed investing is complex and can take many forms. The most common distressed investment the Fund undertakes is the purchase of financially troubled or bankrupt companies’ debt at a substantial discount to face value. After the financially
2. Source: U.S. Bureau of Labor Statistics.
3. Source: Morningstar. Net Returns (NR) include income net of tax withholding when dividend are paid.
4. Source: MSCI.
4 | Annual Report | franklintempleton.com | ||
FRANKLIN MUTUAL GLOBAL DISCOVERY FUND
distressed company is reorganized, often in bankruptcy court, the old debt is typically replaced with new securities issued by the financially stronger company.
The other piece of our investment strategy is participating in arbitrage situations, another highly specialized field. When companies announce proposed mergers or takeovers, commonly referred to as deals, the target company may trade at a discount to the bid it ultimately accepts. One form of arbitrage involves purchasing the target company’s stock when it is trading below the value we believe it would receive in a deal. In keeping with our commitment to a relatively conservative investment approach, we typically focus our arbitrage efforts on announced deals, and avoid rumored deals or other situations we consider relatively risky. In addition, it is our practice to hedge the Fund’s currency exposure when we deem it advantageous for our shareholders.
What is meant by “hedge”? |
To hedge an investment is to take a position intended to offset potential losses that may be incurred by a companion financial instrument. Hedging an investment may also offset potential gains.
|
Manager’s Discussion
The end of a decade is a natural time for reflection about the years that have just passed and to look ahead to what the next 10 might have in store. Across Wall Street, we see many prognostications, and while we are not in the forecasting business, we do allow ourselves to think about investment opportunities over such an extended time period. But experience has taught us that while trying to predict the exact course of markets and/or economic and political events that will drive them may be fun, it is not all that useful.
As 2010 began, the global economy was still recovering from the Global Financial Crisis. The U.S. government owned significant portions of the banking and automotive sectors. The Fed had already started quantitative easing (QE), with QE 2 and QE 3 still to come. In Europe, concerns about Greece’s finances were emerging, and in China the effects of 2009’s massive stimulus programs were starting to take hold.
Over the subsequent years we saw ongoing, global QE, culminating in trillions of dollars of debt yielding negative
Top 10 Sectors/Industries
Based on Equity Securities as of 12/31/19
% of Total Net Assets | ||
Banks | 11.4% | |
Oil, Gas & Consumable Fuels | 10.7% | |
Pharmaceuticals | 10.2% | |
Insurance | 9.5% | |
Technology Hardware, Storage & Peripherals | 5.1% | |
Software | 4.3% | |
Automobiles | 3.8% | |
Tobacco | 3.1% | |
Health Care Equipment & Supplies | 3.0% | |
Media | 2.9% | |
interest rates. The European Union (EU) was in continuous upheaval, with Greece threatening to leave, but eventually staying in the eurozone; the U.K. pursuing and achieving Brexit; and ongoing strain between core members Germany, France, Italy and Spain. In the U.S., average annual economic growth was restrained and finished the decade below 2%, trailing the minimum 3% expectation of prior decades. Strong corporate profits and lower corporate tax rates were bright spots.
Equity markets delivered a very good decade—one of the best in history—with the MSCI World Index (USD) and the S&P 500 posting average annual total returns of +10.08% and +13.56%, respectively.5 During the decade, Franklin Mutual Global Discovery Fund, Class Z posted an average annual total return of +8.07%, a solid absolute return that nonetheless lagged the MSCI World Index (USD), its benchmark. The Fund’s value strategy, which seeks to identify mispriced securities and limit downside risk, was out of favor in an environment that generally encouraged investors to assume more risk. Conversely, the Fund’s Class Z shares posted an average annual total return of +8.72% in the prior decade, compared with +0.23% for the MSCI World Index (USD).1 Our active investment approach focusing on individual opportunities was more conducive to the prior decade’s greater volatility.
In our view, going forward we expect more political and monetary uncertainty and economic growth in unexpected places. Corporate profits will have good years and bad years. Some industries will be massively disrupted, while others will find a way to adjust and prosper, even within the
5. Source: Morningstar.
The indexes are unmanaged and include reinvestment of any income or distributions. They do not reflect any fees, expenses or sales charges. One cannot invest directly in an index, and an index is not representative of the Fund’s portfolio.
| franklintempleton.com | Annual Report | 5 | ||
FRANKLIN MUTUAL GLOBAL DISCOVERY FUND
context of artificial intelligence and machine learning. Recent events, such as the coronavirus outbreak, have caused, and may continue to cause, uncertainty and volatility in the Chinese economy, potentially leading to vulnerability in 2020 global growth expectations. As for investment positioning, we intend to avoid forecasts that would lead us to make the Fund’s success dependent on a specific set of outcomes. Rather, we will seek to continue with our time-tested value process and complement it with new tools that enhance our security evaluation and selection process. To that end, we have integrated risk and quantitative portfolio analysis tools that provide us with fresh insights about performance, and help us identify companies and securities that we believe satisfy our investors’ goals of risk-adjusted returns that are not wholly dependent on any one economic or political scenario.
Fund Performance
Turning to Fund performance, top positive contributors included U.S.-based companies Charter Communications, Citigroup and Walt Disney. Citigroup and Walt Disney are listed among the Fund’s largest positions in the Top 10 Equity Holdings table on this page.
Shares of cable operator Charter Communications surged after the company reported operating and financial results that were broadly ahead of consensus estimates. Capital expenditures were lower than expected and drove free cash flow, which was used during the period to buy back $3.1 billion of the company’s stock. The market was anticipating share repurchases totaling $2.25 billion. Revenue accelerated 5.1% compared with consensus forecasts of 4.5%. The increased revenue, however, did not reflect the impact of a broad-based increase in per subscriber fees implemented during the period, which could drive revenue growth and margin expansion in 2020. According to the company’s management, there has not been a meaningful decrease in customers as a result of the higher per subscriber fees.
Investors bid up shares of bank and financial services provider Citigroup following the release of third-quarter earnings that beat consensus expectations. Highlights included increases in deposits of 6% quarter-over-quarter and 11% year-over-year; growth in revenues and purchase volumes in the North America-branded credit cards division by 11% and 7% year-over-year, respectively; and strong results in the bank’s Asian operations across the board.
Top 10 Equity Holdings
12/31/19
Company Sector/Industry, Country | % of Total Net Assets | |
Novartis AG Pharmaceuticals, Switzerland | 3.1% | |
GlaxoSmithKline PLC Pharmaceuticals, U.K. | 3.1% | |
Medtronic PLC Health Care Equipment & Supplies, U.S. | 3.0% | |
Samsung Electronics Co. Ltd. Technology Hardware, Storage & Peripherals,South Korea | 2.6% | |
The Walt Disney Co. Entertainment, U.S. | 2.5% | |
Volkswagen AG Automobiles, Germany | 2.5% | |
British American Tobacco PLC Tobacco, U.K. | 2.2% | |
Kinder Morgan Inc. Oil, Gas & Consumable Fuels, U.S. | 2.2% | |
The Hartford Financial Services Group Inc. Insurance, U.S. | 2.2% | |
Citigroup Inc. Banks, U.S. | 2.1% | |
Management also repurchased 76 million, or 3.3%, of outstanding shares of the company during the period.
Shares of family entertainment and media enterprise Walt Disney surged in late 2019. The rally was kicked off by an earnings report characterized byacross-the-board outperformance of Disney legacy assets and a better-than-expected outlook for fiscal-year 2020 earnings. The company’s stock continued to rise following the successful launch of Disney+, its subscription videoon-demand streaming service, which reported more than 10 million subscribers on the first day of service, exceeding forecasts. The box office performance of Frozen II, which set a record for Thanksgiving-weekend receipts, also helped boost the stock’s performance.
During the period under review, Fund investments that detracted from performance included U.S.-based companies Occidental Petroleum (not held atperiod-end), Walgreens Boots Alliance and Clear Channel Outdoor Holdings.6
6. Clear Channel Outdoor Holdings is listed as Clear Channel Communications in the SOI. Clear Channel Communications is the prior name of iHeartMedia, the former parent company of Clear Channel Outdoor Holdings.
See www.franklintempletondatasources.com for additional data provider information.
6 | Annual Report | franklintempleton.com | ||
FRANKLIN MUTUAL GLOBAL DISCOVERY FUND
The stock of Occidental Petroleum, a petroleum and chemical products company, traded lower in 2019 as investors struggled to accept its acquisition of Anadarko Petroleum, during a period in which energy stocks were under pressure from falling crude oil prices. The acquired Permian Basin assets complement Occidental’s existing portfolio, and we believe the considerable free cash flow generated from Anadarko’s Gulf of Mexico operations combined with the disposal ofnon-core assets, could help reduce debt and support the dividend. However, the company’s profile was riskier than it waspre-acquisition, and we exited the position.
Shares of drug store services provider Walgreens Boots Alliance began to sell off early in 2019, when the chief financial officer cited negative industry trends in drug prices and pharmacy benefit manager (PBM) reimbursement rates. Shares also fell in reaction to the company’s limited success in offsetting those challenges by increasing its volume of drug sales or renegotiating with PBMs. These pressures, and weakness in both its U.S. and U.K. stores, resulted in a cut to full-year guidance in April. However, Walgreens is reducing costs throughout the enterprise, and is attempting to reduce exposure to lower margin categories within the front of its stores, which we believe can help boost growth and profitability over the longer term. The company’s share price rallied in early November based on news that global investment firm KKR had approached the company about taking it private via a leveraged buyout that would likely be the largest in history. However, the stock retreated later when deal terms failed to materialize.
Shares of outdoor advertising company Clear Channel Outdoor Holdings weakened after the company sold 100 million shares of stock in July, shortly after emerging from bankruptcy and separating from mass media company iHeart Communications. Clear Channel Outdoor announced it is using the stock proceeds to repurchase the debt of Clear Channel Worldwide Holdings, a subsidiary. Following the equity issuance, which was dilutive and at a depressed price, Clear Channel Outdoor reported mixed earnings. The strength of domestic operations was overshadowed by significantly lower international results, driven primarily by a 51%-owned China joint venture. We believe the company’s assets represent compelling value relative to domestic and international peers.
During the period, the Fund held currency forwards and futures seeking to hedge most of the currency risk of the portfolio’snon-U.S. dollar investments. The hedges had a modestly positive overall impact on the Fund’s performance.
What is a currency forward? |
A currency forward is a direct agreement between the Fund and a counterparty to buy or sell a foreign currency in exchange for another currency at a specific exchange rate on a future date. |
What is a future? |
A future is an agreement between the Fund and a counterparty made through a U.S. or foreign futures exchange to buy or sell an underlying instrument or asset at a specific price on a future date. |
As fellow shareholders, we found recent relative performance disappointing, but it is not uncommon for our strategy to lag the equity markets at times. We remain committed to our disciplined, value investment approach as we seek to generate attractive, long-term, risk-adjusted returns for shareholders.
Thank you for your participation in Franklin Mutual Global Discovery Fund. We look forward to continuing to serve your investment needs.
 | Peter A. Langerman Co-Portfolio Manager | |
 | Timothy Rankin, CFA Co-Portfolio Manager | |
 | Christian Correa, CFA Co-Portfolio Manager | |


CFA® is a trademark owned by CFA Institute.
| franklintempleton.com | Annual Report | 7 | ||
FRANKLIN MUTUAL GLOBAL DISCOVERY FUND
The foregoing information reflects our analysis, opinions and portfolio holdings as of December 31, 2019, the end of the reporting period. The way we implement our main investment strategies and the resulting portfolio holdings may change depending on factors such as market and economic conditions. These opinions may not be relied upon as investment advice or an offer for a particular security. The information is not a complete analysis of every aspect of any market, country, industry, security or the Fund. Statements of fact are from sources considered reliable, but the investment manager makes no representation or warranty as to their completeness or accuracy. Although historical performance is no guarantee of future results, these insights may help you understand our investment management philosophy.
8 | Annual Report | franklintempleton.com | ||
FRANKLIN MUTUAL GLOBAL DISCOVERY FUND
Performance Summary as of December 31, 20191
The performance table and graphs do not reflect any taxes that a shareholder would pay on Fund dividends, capital gain distributions, if any, or any realized gains on the sale of Fund shares. Total return reflects reinvestment of the Fund’s dividends and capital gain distributions, if any, and any unrealized gains or losses. Your dividend income will vary depending on dividends or interest paid by securities in the Fund’s portfolio, adjusted for operating expenses of each class. Capital gain distributions are net profits realized from the sale of portfolio securities.
Performance as of 12/31/191
Cumulative total return excludes sales charges. Average annual total return includes maximum sales charges. Sales charges will vary depending on the size of the investment and the class of share purchased. The maximum is 5.50% and the minimum is 0%.Class A:5.50% maximum initial sales charge. For other share classes, visitfranklintempleton.com.
| Share Class | Cumulative Total Return2 | Average Annual Total Return3 | ||||||||||
| Z | ||||||||||||
1-Year | +24.70% | +24.70% | ||||||||||
5-Year | +33.28% | +5.91% | ||||||||||
10-Year | +117.24% | +8.07% | ||||||||||
| A4 | ||||||||||||
1-Year | +24.37% | +17.54% | ||||||||||
5-Year | +31.56% | +4.45% | ||||||||||
10-Year | +111.35% | +7.16% | ||||||||||
Performance data represent past performance, which does not guarantee future results. Investment return and principal value will fluctuate, and you may have a gain or loss when you sell your shares. Current performance may differ from figures shown. For most recentmonth-end performance, go tofranklintempleton.comor call(800)342-5236.
See page 11 for Performance Summary footnotes.
| franklintempleton.com | Annual Report | 9 | ||
FRANKLIN MUTUAL GLOBAL DISCOVERY FUND
PERFORMANCE SUMMARY
Total Return Index Comparison for a Hypothetical $10,000 Investment1
Total return represents the change in value of an investment over the periods shown. It includes any applicable maximum sales charge, Fund expenses, account fees and reinvested distributions. The unmanaged index includes reinvestment of any income or distributions. It differs from the Fund in composition and does not pay management fees or expenses. One cannot invest directly in an index.
Class Z(1/1/10–12/31/19)
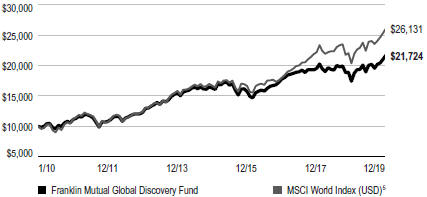
Class A(1/1/10–12/31/19)
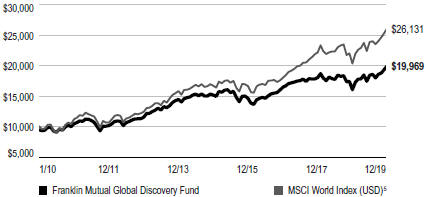
See page 11 for Performance Summary footnotes.
10 | Annual Report | franklintempleton.com | ||
FRANKLIN MUTUAL GLOBAL DISCOVERY FUND
PERFORMANCE SUMMARY
Distributions(1/1/19–12/31/19)
| Share Class | Net Investment Income |
| Short-Term Capital Gain | Long-Term Capital Gain | Total | |||||||||||||||||||||||
Z | $0.6965 | $0.1084 | $1.4426 | $2.2475 | ||||||||||||||||||||||||
A | $0.6178 | $0.1084 | $1.4426 | $2.1688 | ||||||||||||||||||||||||
C | $0.3366 | $0.1084 | $1.4426 | $1.8876 | ||||||||||||||||||||||||
R | $0.5279 | $0.1084 | $1.4426 | $2.0789 | ||||||||||||||||||||||||
R6 | $0.7313 | $0.1084 | $1.4426 | $2.2823 | ||||||||||||||||||||||||
Total Annual Operating Expenses6
| Share Class | With Fee Waiver | Without Fee Waiver | ||||||||||
| Z | 0.98% | 0.98% | ||||||||||
| A | 1.23% | 1.23% | ||||||||||
Each class of shares is available to certain eligible investors and has different annual fees and expenses, as described in the prospectus.
All investments involve risks, including possible loss of principal. Value securities may not increase in price as anticipated or may decline further in value. Special risks are associated with foreign investing, including currency fluctuations, economic instability and political developments. To the extent that the Fund focuses on particular countries, regions, industries, sectors or types of investment from time to time, the Fund may be subject to greater risks of adverse developments in such areas of focus than a fund that invests in a wider variety of countries, regions, industries, sectors or investments. Financial services companies are subject to extensive government regulation that may affect their profitability in many ways, including by limiting the amount and types of loans and other commitments they can make, and the interest rates and fees they can charge. Because the Fund may invest its assets in companies in a specific region, including Europe, it is subject to greater risks of adverse developments in that region and/or the surrounding regions than a fund that is more broadly diversified geographically. Current political and financial uncertainty surrounding the European Union may increase market volatility and the economic risk of investing in companies in Europe. Smaller-company stocks have exhibited greater price volatility than larger-company stocks, particularly over the short term. The Fund’s investments in companies engaged in mergers, reorganizations or liquidations also involve special risks as pending deals may not be completed on time or on favorable terms. The Fund may invest in lower-rated bonds, which entail higher credit risk. The Fund’s prospectus also includes a description of the main investment risks.
1. The Fund has a fee waiver associated with any investment it makes in a Franklin Templeton money fund and/or other Franklin Templeton fund, contractually guaranteed through 4/30/20. Fund investment results reflect the fee waiver; without this waiver, the results would have been lower.
2. Cumulative total return represents the change in value of an investment over the periods indicated.
3. Average annual total return represents the average annual change in value of an investment over the periods indicated. Return for less than one year, if any, has not been annualized.
4. Prior to 9/10/18, these shares were offered at a higher initial sales charge of 5.75%, thus actual returns (with sales charges) would have differed. Average annual total returns (with sales charges) have been restated to reflect the current maximum initial sales charge of 5.50%.
5. Source: Morningstar. The MSCI World Index (USD) is a free float-adjusted, market capitalization-weighted index designed to measure equity market performance in global developed markets.
6. Figures are as stated in the Fund’s current prospectus and may differ from the expense ratios disclosed in the Your Fund’s Expenses and Financial Highlights sections in this report. In periods of market volatility, assets may decline significantly, causing total annual Fund operating expenses to become higher than the figures shown.
See www.franklintempletondatasources.com for additional data provider information.
| franklintempleton.com | Annual Report | 11 | ||
FRANKLIN MUTUAL GLOBAL DISCOVERY FUND
As a Fund shareholder, you can incur two types of costs: (1) transaction costs, including sales charges (loads) on Fund purchases and redemptions; and (2) ongoing Fund costs, including management fees, distribution and service(12b-1) fees, and other Fund expenses. All mutual funds have ongoing costs, sometimes referred to as operating expenses. The table below shows ongoing costs of investing in the Fund and can help you understand these costs and compare them with those of other mutual funds. The table assumes a $1,000 investment held for the six months indicated.
Actual Fund Expenses
The table below provides information about actual account values and actual expenses in the columns under the heading “Actual.” In these columns the Fund’s actual return, which includes the effect of Fund expenses, is used to calculate the “Ending Account Value” for each class of shares. You can estimate the expenses you paid during the period by following these steps (of course, your account value and expenses will differ from those in this illustration): Divide your account value by $1,000 (if your account had an $8,600 value, then $8,600÷ $1,000 = 8.6). Then multiply the result by the number in the row for your class of shares under the headings “Actual” and “Expenses Paid During Period” (if Actual Expenses Paid During Period were $7.50, then 8.6 x $7.50 = $64.50). In this illustration, the actual expenses paid this period are $64.50.
Hypothetical Example for Comparison with Other Funds
Under the heading “Hypothetical” in the table, information is provided about hypothetical account values and hypothetical expenses based on the Fund’s actual expense ratio and an assumed rate of return of 5% per year before expenses, which is not the Fund’s actual return. This information may not be used to estimate the actual ending account balance or expenses you paid for the period, but it can help you compare ongoing costs of investing in the Fund with those of other funds. To do so, compare this 5% hypothetical example for the class of shares you hold with the 5% hypothetical examples that appear in the shareholder reports of other funds.
Please note that expenses shown in the table are meant to highlight ongoing costs and do not reflect any transactional costs. Therefore, information under the heading “Hypothetical” is useful in comparing ongoing costs only, and will not help you compare total costs of owning different funds. In addition, if transactional costs were included, your total costs would have been higher.
| Actual (actual return after expenses) | Hypothetical (5% annual return before expenses) | |||||||||||
Share Class | Beginning Account Value 7/1/19 | Ending Account Value 12/31/19 | Expenses Paid During Period 7/1/19–12/31/191, 2 | Ending Account | Expenses Paid During Period 7/1/19–12/31/191, 2 | Net Annualized Expense Ratio2 | ||||||
|
|
|
| |||||||||
| Z | $1,000 | $1,084.30 | $ 5.20 | $1,020.21 | $ 5.04 | 0.99% | ||||||
| A | $1,000 | $1,083.20 | $ 6.51 | $1,018.95 | $ 6.31 | 1.24% | ||||||
| C | $1,000 | $1,079.00 | $10.43 | $1,015.17 | $10.11 | 1.99% | ||||||
| R | $1,000 | $1,081.80 | $ 7.82 | $1,017.69 | $ 7.58 | 1.49% | ||||||
| R6 | $1,000 | $1,084.80 | $ 4.68 | $1,020.72 | $ 4.53 | 0.89% | ||||||
1. Expenses are equal to the annualized expense ratio for thesix-month period as indicated above—in the far right column—multiplied by the simple average account value over the period indicated, and then multiplied by 184/365 to reflect theone-half year period.
2. Reflects expenses after fee waivers and expense reimbursements. Does not include acquired fund fees and expenses.
12 | Annual Report | franklintempleton.com | ||
FRANKLIN MUTUAL SERIES FUNDS
Franklin Mutual Global Discovery Fund
| Year Ended December 31, | ||||||||||||||||||||
| 2019 | 2018 | 2017 | 2016 | 2015 | ||||||||||||||||
Class Z | ||||||||||||||||||||
Per share operating performance (for a share outstanding throughout the year) | ||||||||||||||||||||
Net asset value, beginning of year | $26.86 | $32.42 | $31.12 | $29.35 | $33.32 | |||||||||||||||
Income from investment operationsa: | ||||||||||||||||||||
Net investment incomeb | 0.67 | 0.58 | 0.76 | c | 0.67 | d | 0.53 | |||||||||||||
Net realized and unrealized gains (losses) | 5.91 | (4.13 | ) | 2.29 | 3.08 | (1.71 | ) | |||||||||||||
Total from investment operations | 6.58 | (3.55 | ) | 3.05 | 3.75 | (1.18 | ) | |||||||||||||
Less distributions from: | ||||||||||||||||||||
Net investment income | (0.70 | ) | (0.64 | ) | (0.79 | ) | (0.69 | ) | (0.55 | ) | ||||||||||
Net realized gains | (1.55 | ) | (1.37 | ) | (0.96 | ) | (1.29 | ) | (2.24 | ) | ||||||||||
Total distributions | (2.25 | ) | (2.01 | ) | (1.75 | ) | (1.98 | ) | (2.79 | ) | ||||||||||
Net asset value, end of year | $31.19 | $26.86 | $32.42 | $31.12 | $29.35 | |||||||||||||||
Total return | 24.70% | (10.78)% | 9.84% | 12.86% | (3.36)% | |||||||||||||||
Ratios to average net assets | ||||||||||||||||||||
Expensese,f | 1.00% | g | 0.97% | g | 0.96% | 0.99% | g | 0.99% | g | |||||||||||
Expenses incurred in connection with securities sold short | 0.02% | —% | h | —% | 0.01% | 0.02% | ||||||||||||||
Net investment income | 2.20% | 1.82% | 2.30% | c | 2.27% | d | 1.56% | |||||||||||||
Supplemental data | ||||||||||||||||||||
Net assets, end of year (000’s) | $5,176,787 | $5,114,274 | $7,175,981 | $8,354,865 | $9,132,752 | |||||||||||||||
Portfolio turnover rate | 14.08% | 14.70% | 17.50% | 17.01% | 21.79% | |||||||||||||||
aThe amount shown for a share outstanding throughout the period may not correlate with the Statement of Operations for the period due to the timing of sales and repurchases of the Fund’s shares in relation to income earned and/or fluctuating fair value of the investments of the Fund.
bBased on average daily shares outstanding.
cNet investment income per share includes approximately $0.20 per share related to income received in the form of special dividends in connection with certain Fund holdings. Excluding this amount, the ratio of net investment income to average net assets would have been 1.68%.
dNet investment income per share includes approximately $0.10 per share related to income received in the form of special dividends in connection with certain Fund holdings. Excluding this amount, the ratio of net investment income to average net assets would have been 1.94%.
eIncludes dividend and/or interest expense on securities sold short and security borrowing fees, if any. See below for the ratios of such expenses to average net assets for the periods presented. See Note 1(d).
fBenefit of expense reduction rounds to less than 0.01%.
gBenefit of waiver and payments by affiliates rounds to less than 0.01%.
hRounds to less than 0.01%.
| franklintempleton.com | The accompanying notes are an integral part of these financial statements. | Annual Report | 13 | ||||
FRANKLIN MUTUAL SERIES FUNDS
FINANCIAL HIGHLIGHTS
Franklin Mutual Global Discovery Fund(continued)
| Year Ended December 31, | ||||||||||||||||||||
| 2019 | 2018 | 2017 | 2016 | 2015 | ||||||||||||||||
Class A | ||||||||||||||||||||
Per share operating performance (for a share outstanding throughout the year) | ||||||||||||||||||||
Net asset value, beginning of year | $26.32 | $31.80 | $30.57 | $28.86 | $32.81 | |||||||||||||||
Income from investment operationsa: | ||||||||||||||||||||
Net investment incomeb | 0.58 | 0.49 | 0.66 | c | 0.59 | d | 0.42 | |||||||||||||
Net realized and unrealized gains (losses) | 5.78 | (4.04 | ) | 2.25 | 3.01 | (1.67 | ) | |||||||||||||
Total from investment operations | 6.36 | (3.55 | ) | 2.91 | 3.60 | (1.25 | ) | |||||||||||||
Less distributions from: | ||||||||||||||||||||
Net investment income | (0.62 | ) | (0.56 | ) | (0.72 | ) | (0.60 | ) | (0.46 | ) | ||||||||||
Net realized gains | (1.55 | ) | (1.37 | ) | (0.96 | ) | (1.29 | ) | (2.24 | ) | ||||||||||
Total distributions | (2.17 | ) | (1.93 | ) | (1.68 | ) | (1.89 | ) | (2.70 | ) | ||||||||||
Net asset value, end of year | $30.51 | $26.32 | $31.80 | $30.57 | $28.86 | |||||||||||||||
Total returne | 24.37% | (10.99)% | 9.57% | 12.56% | (3.63)% | |||||||||||||||
Ratios to average net assets | ||||||||||||||||||||
Expensesf,g | 1.25% | h | 1.22% | h | 1.21% | 1.24% | h | 1.27% | h | |||||||||||
Expenses incurred in connection with securities sold short | 0.02% | —% | i | —% | 0.01% | 0.02% | ||||||||||||||
Net investment income | 1.95% | 1.57% | 2.05% | c | 2.02% | d | 1.28% | |||||||||||||
Supplemental data | ||||||||||||||||||||
Net assets, end of year (000’s) | $7,683,644 | $7,461,444 | $9,589,033 | $10,498,722 | $11,274,721 | |||||||||||||||
Portfolio turnover rate | 14.08% | 14.70% | 17.50% | 17.01% | 21.79% | |||||||||||||||
aThe amount shown for a share outstanding throughout the period may not correlate with the Statement of Operations for the period due to the timing of sales and repurchases of the Fund’s shares in relation to income earned and/or fluctuating fair value of the investments of the Fund.
bBased on average daily shares outstanding.
cNet investment income per share includes approximately $0.20 per share related to income received in the form of special dividends in connection with certain Fund holdings. Excluding this amount, the ratio of net investment income to average net assets would have been 1.43%.
dNet investment income per share includes approximately $0.10 per share related to income received in the form of special dividends in connection with certain Fund holdings. Excluding this amount, the ratio of net investment income to average net assets would have been 1.69%.
eTotal return does not reflect sales commissions or contingent deferred sales charges, if applicable.
fIncludes dividend and/or interest expense on securities sold short and security borrowing fees, if any. See below for the ratios of such expenses to average net assets for the periods presented. See Note 1(d).
gBenefit of expense reduction rounds to less than 0.01%.
hBenefit of waiver and payments by affiliates rounds to less than 0.01%.
iRounds to less than 0.01%.
14 | Annual Report | The accompanying notes are an integral part of these financial statements. | franklintempleton.com | ||
FRANKLIN MUTUAL SERIES FUNDS
FINANCIAL HIGHLIGHTS
Franklin Mutual Global Discovery Fund(continued)
| Year Ended December 31, | ||||||||||||||||||||
| 2019 | 2018 | 2017 | 2016 | 2015 | ||||||||||||||||
Class C | ||||||||||||||||||||
Per share operating performance (for a share outstanding throughout the year) | ||||||||||||||||||||
Net asset value, beginning of year | $26.25 | $31.44 | $30.22 | $28.55 | $32.49 | |||||||||||||||
Income from investment operationsa: | ||||||||||||||||||||
Net investment incomeb | 0.36 | 0.26 | 0.41 | c | 0.36 | d | 0.18 | |||||||||||||
Net realized and unrealized gains (losses) | 5.74 | (3.98 | ) | 2.23 | 2.97 | (1.64 | ) | |||||||||||||
Total from investment operations | 6.10 | (3.72 | ) | 2.64 | 3.33 | (1.46 | ) | |||||||||||||
Less distributions from: | ||||||||||||||||||||
Net investment income | (0.34 | ) | (0.10 | ) | (0.46 | ) | (0.37 | ) | (0.24 | ) | ||||||||||
Net realized gains | (1.55 | ) | (1.37 | ) | (0.96 | ) | (1.29 | ) | (2.24 | ) | ||||||||||
Total distributions | (1.89 | ) | (1.47 | ) | (1.42 | ) | (1.66 | ) | (2.48 | ) | ||||||||||
Net asset value, end of year | $30.46 | $26.25 | $31.44 | $30.22 | $28.55 | |||||||||||||||
Total returne | 23.43% | (11.70)% | 8.78% | 11.70% | (4.33)% | |||||||||||||||
Ratios to average net assets | ||||||||||||||||||||
Expensesf,g | 2.00% | h | 1.97% | h | 1.96% | 1.99% | h | 1.99% | h | |||||||||||
Expenses incurred in connection with securities sold short | 0.02% | —% | i | —% | 0.01% | 0.02% | ||||||||||||||
Net investment income | 1.20% | 0.82% | 1.30% | c | 1.27% | d | 0.56% | |||||||||||||
Supplemental data | ||||||||||||||||||||
Net assets, end of year (000’s) | $872,717 | $1,054,412 | $2,438,507 | $2,758,563 | $2,983,216 | |||||||||||||||
Portfolio turnover rate | 14.08% | 14.70% | 17.50% | 17.01% | 21.79% | |||||||||||||||
aThe amount shown for a share outstanding throughout the period may not correlate with the Statement of Operations for the period due to the timing of sales and repurchases of the Fund’s shares in relation to income earned and/or fluctuating fair value of the investments of the Fund.
bBased on average daily shares outstanding.
cNet investment income per share includes approximately $0.20 per share related to income received in the form of special dividends in connection with certain Fund holdings. Excluding this amount, the ratio of net investment income to average net assets would have been 0.68%.
dNet investment income per share includes approximately $0.10 per share related to income received in the form of special dividends in connection with certain Fund holdings. Excluding this amount, the ratio of net investment income to average net assets would have been 0.94%.
eTotal return does not reflect sales commissions or contingent deferred sales charges, if applicable.
fIncludes dividend and/or interest expense on securities sold short and security borrowing fees, if any. See below for the ratios of such expenses to average net assets for the periods presented. See Note 1(d).
gBenefit of expense reduction rounds to less than 0.01%.
hBenefit of waiver and payments by affiliates rounds to less than 0.01%.
iRounds to less than 0.01%.
| franklintempleton.com | The accompanying notes are an integral part of these financial statements. | Annual Report | 15 | ||||
FRANKLIN MUTUAL SERIES FUNDS
FINANCIAL HIGHLIGHTS
Franklin Mutual Global Discovery Fund(continued)
| Year Ended December 31, | ||||||||||||||||||||
| 2019 | 2018 | 2017 | 2016 | 2015 | ||||||||||||||||
Class R | ||||||||||||||||||||
Per share operating performance (for a share outstanding throughout the year) | ||||||||||||||||||||
Net asset value, beginning of year | $25.97 | $31.37 | $30.17 | $28.51 | $32.43 | |||||||||||||||
Income from investment operationsa: | ||||||||||||||||||||
Net investment incomeb | 0.50 | 0.41 | 0.57 | c | 0.50 | d | 0.35 | |||||||||||||
Net realized and unrealized gains (losses) | 5.69 | (3.97 | ) | 2.22 | 2.98 | (1.64 | ) | |||||||||||||
Total from investment operations | 6.19 | (3.56 | ) | 2.79 | 3.48 | (1.29 | ) | |||||||||||||
Less distributions from: | ||||||||||||||||||||
Net investment income | (0.53 | ) | (0.47 | ) | (0.63 | ) | (0.53 | ) | (0.39 | ) | ||||||||||
Net realized gains | (1.55 | ) | (1.37 | ) | (0.96 | ) | (1.29 | ) | (2.24 | ) | ||||||||||
Total distributions | (2.08 | ) | (1.84 | ) | (1.59 | ) | (1.82 | ) | (2.63 | ) | ||||||||||
Net asset value, end of year | $30.08 | $25.97 | $31.37 | $30.17 | $28.51 | |||||||||||||||
Total return | 24.09% | (11.24)% | 9.31% | 12.28% | (3.82)% | |||||||||||||||
Ratios to average net assets | ||||||||||||||||||||
Expensese,f | 1.50% | g | 1.47% | g | 1.46% | 1.49% | g | 1.49% | g | |||||||||||
Expenses incurred in connection with securities sold short | 0.02% | —% | h | —% | 0.01% | 0.02% | ||||||||||||||
Net investment income | 1.70% | 1.32% | 1.80% | c | 1.77% | d | 1.06% | |||||||||||||
Supplemental data | ||||||||||||||||||||
Net assets, end of year (000’s) | $251,089 | $274,086 | $398,692 | $444,813 | $468,425 | |||||||||||||||
Portfolio turnover rate | 14.08% | 14.70% | 17.50% | 17.01% | 21.79% | |||||||||||||||
aThe amount shown for a share outstanding throughout the period may not correlate with the Statement of Operations for the period due to the timing of sales and repurchases of the Fund’s shares in relation to income earned and/or fluctuating fair value of the investments of the Fund.
bBased on average daily shares outstanding.
cNet investment income per share includes approximately $0.20 per share related to income received in the form of special dividends in connection with certain Fund holdings. Excluding this amount, the ratio of net investment income to average net assets would have been 1.18%.
dNet investment income per share includes approximately $0.10 per share related to income received in the form of special dividends in connection with certain Fund holdings. Excluding this amount, the ratio of net investment income to average net assets would have been 1.44%.
eIncludes dividend and/or interest expense on securities sold short and security borrowing fees, if any. See below for the ratios of such expenses to average net assets for the periods presented. See Note 1(d).
fBenefit of expense reduction rounds to less than 0.01%.
gBenefit of waiver and payments by affiliates rounds to less than 0.01%.
hRounds to less than 0.01%.
16 | Annual Report | The accompanying notes are an integral part of these financial statements. | franklintempleton.com | ||
FRANKLIN MUTUAL SERIES FUNDS
FINANCIAL HIGHLIGHTS
Franklin Mutual Global Discovery Fund(continued)
| Year Ended December 31, | ||||||||||||||||||||
| 2019 | 2018 | 2017 | 2016 | 2015 | ||||||||||||||||
Class R6 | ||||||||||||||||||||
Per share operating performance (for a share outstanding throughout the year) | ||||||||||||||||||||
Net asset value, beginning of year | $26.85 | $32.41 | $31.13 | $29.35 | $33.33 | |||||||||||||||
Income from investment operationsa: | ||||||||||||||||||||
Net investment incomeb | 0.70 | 0.62 | 0.75 | c | 0.61 | d | 0.55 | |||||||||||||
Net realized and unrealized gains (losses) | 5.90 | (4.13 | ) | 2.34 | 3.19 | (1.69 | ) | |||||||||||||
Total from investment operations | 6.60 | (3.51 | ) | 3.09 | 3.80 | (1.14 | ) | |||||||||||||
Less distributions from: | ||||||||||||||||||||
Net investment income | (0.73 | ) | (0.68 | ) | (0.85 | ) | (0.73 | ) | (0.60 | ) | ||||||||||
Net realized gains | (1.55 | ) | (1.37 | ) | (0.96 | ) | (1.29 | ) | (2.24 | ) | ||||||||||
Total distributions | (2.28 | ) | (2.05 | ) | (1.81 | ) | (2.02 | ) | (2.84 | ) | ||||||||||
Net asset value, end of year | $31.17 | $26.85 | $32.41 | $31.13 | $29.35 | |||||||||||||||
Total return | 24.80% | (10.67)% | 9.98% | 13.02% | (3.23)% | |||||||||||||||
Ratios to average net assets | ||||||||||||||||||||
Expenses before waiver and payments by affiliatese | 0.90% | 0.88% | 0.84% | 0.85% | 0.84% | |||||||||||||||
Expenses net of waiver and payments by affiliatese,f | 0.89% | 0.87% | 0.84% | 0.85% | g | 0.84% | g | |||||||||||||
Expenses incurred in connection with securities sold short | 0.02% | —% | h | —% | 0.01% | 0.02% | ||||||||||||||
Net investment income | 2.31% | 1.92% | 2.42% | c | 2.41% | d | 1.71% | |||||||||||||
Supplemental data | ||||||||||||||||||||
Net assets, end of year (000’s) | $1,295,457 | $1,418,812 | $2,221,338 | $528,617 | $229,765 | |||||||||||||||
Portfolio turnover rate | 14.08% | 14.70% | 17.50% | 17.01% | 21.79% | |||||||||||||||
aThe amount shown for a share outstanding throughout the period may not correlate with the Statement of Operations for the period due to the timing of sales and repurchases of the Fund’s shares in relation to income earned and/or fluctuating fair value of the investments of the Fund.
bBased on average daily shares outstanding.
cNet investment income per share includes approximately $0.20 per share related to income received in the form of special dividends in connection with certain Fund holdings. Excluding this amount, the ratio of net investment income to average net assets would have been 1.80%.
dNet investment income per share includes approximately $0.10 per share related to income received in the form of special dividends in connection with certain Fund holdings. Excluding this amount, the ratio of net investment income to average net assets would have been 2.08%.
eIncludes dividend and/or interest expense on securities sold short and security borrowing fees, if any. See below for the ratios of such expenses to average net assets for the periods presented. See Note 1(d).
fBenefit of expense reduction rounds to less than 0.01%.
gBenefit of waiver and payments by affiliates rounds to less than 0.01%.
hRounds to less than 0.01%.
| franklintempleton.com | The accompanying notes are an integral part of these financial statements. | Annual Report | 17 | ||||
FRANKLIN MUTUAL SERIES FUNDS
Statement of Investments, December 31, 2019
Franklin Mutual Global Discovery Fund
| Country | Shares/ Rights/ Units/ Warrants | Value | ||||||||||
Common Stocks and Other Equity Interests 94.0% | ||||||||||||
Aerospace & Defense 1.1% | ||||||||||||
BAE Systems PLC | United Kingdom | 21,584,405 | $ | 161,462,001 | ||||||||
|
| |||||||||||
Auto Components 0.0%† | ||||||||||||
a,b,cInternational Automotive Components Group Brazil LLC | Brazil | 3,819,425 | 138,645 | |||||||||
|
| |||||||||||
Automobiles 1.3% | ||||||||||||
General Motors Co. | United States | 5,350,852 | 195,841,183 | |||||||||
|
| |||||||||||
Banks 11.4% | ||||||||||||
CIT Group Inc. | United States | 2,644,958 | 120,689,434 | |||||||||
Citigroup Inc. | United States | 3,933,740 | 314,266,489 | |||||||||
Citizens Financial Group Inc. | United States | 6,918,710 | 280,968,813 | |||||||||
First Horizon National Corp. | United States | 7,743,203 | 128,227,442 | |||||||||
ING Groep NV | Netherlands | 12,428,617 | 148,970,120 | |||||||||
JPMorgan Chase & Co. | United States | 1,676,856 | 233,753,726 | |||||||||
Standard Chartered PLC | United Kingdom | 21,632,144 | 204,107,535 | |||||||||
Wells Fargo & Co. | United States | 5,713,404 | 307,381,135 | |||||||||
|
| |||||||||||
| 1,738,364,694 | ||||||||||||
|
| |||||||||||
Building Products 1.6% | ||||||||||||
Johnson Controls International PLC | United States | 6,119,300 | 249,116,703 | |||||||||
|
| |||||||||||
Capital Markets 2.0% | ||||||||||||
Credit Suisse Group AG | Switzerland | 12,875,441 | 174,373,641 | |||||||||
Deutsche Bank AG | Germany | 6,644,039 | 51,538,274 | |||||||||
Guotai Junan Securities Co. Ltd. | China | 41,520,689 | 73,532,270 | |||||||||
|
| |||||||||||
| 299,444,185 | ||||||||||||
|
| |||||||||||
Chemicals 1.5% | ||||||||||||
BASF SE | Germany | 2,946,786 | 222,569,739 | |||||||||
|
| |||||||||||
Communications Equipment 0.9% | ||||||||||||
Cisco Systems Inc. | United States | 2,838,530 | 136,135,899 | |||||||||
|
| |||||||||||
Construction Materials 1.3% | ||||||||||||
LafargeHolcim Ltd., B | Switzerland | 3,691,245 | 204,846,646 | |||||||||
|
| |||||||||||
Consumer Finance 1.5% | ||||||||||||
Capital One Financial Corp. | United States | 2,190,465 | 225,420,753 | |||||||||
|
| |||||||||||
Containers & Packaging 1.1% | ||||||||||||
International Paper Co. | United States | 3,679,148 | 169,424,765 | |||||||||
|
| |||||||||||
Diversified Financial Services 1.9% | ||||||||||||
aM&G PLC | United Kingdom | 24,508,843 | 76,996,867 | |||||||||
Voya Financial Inc. | United States | 3,426,353 | 208,939,006 | |||||||||
|
| |||||||||||
| 285,935,873 | ||||||||||||
|
| |||||||||||
Diversified Telecommunication Services 0.6% | ||||||||||||
Koninklijke KPN NV | Netherlands | 33,853,948 | 99,887,257 | |||||||||
|
| |||||||||||
Electric Utilities 1.5% | ||||||||||||
Enel SpA | Italy | 29,478,178 | 233,788,319 | |||||||||
|
| |||||||||||
18 | Annual Report | franklintempleton.com | ||
FRANKLIN MUTUAL SERIES FUNDS
STATEMENT OF INVESTMENTS
Franklin Mutual Global Discovery Beacon Fund(continued)
| Country | Shares/ Rights/ Units/ Warrants | Value | ||||||||||
Common Stocks and Other Equity Interests(continued) | ||||||||||||
Energy Equipment & Services 1.2% | ||||||||||||
Schlumberger Ltd. | United States | 4,741,000 | $ | 190,588,200 | ||||||||
|
| |||||||||||
Entertainment 2.5% | ||||||||||||
The Walt Disney Co. | United States | 2,621,361 | 379,127,441 | |||||||||
|
| |||||||||||
Food & Staples Retailing 1.1% | ||||||||||||
Walgreens Boots Alliance Inc. | United States | 2,833,972 | 167,090,989 | |||||||||
|
| |||||||||||
Food Products 1.4% | ||||||||||||
The Kraft Heinz Co. | United States | 6,492,200 | 208,594,386 | |||||||||
|
| |||||||||||
Health Care Equipment & Supplies 3.0% | ||||||||||||
Medtronic PLC | United States | 3,987,784 | 452,414,095 | |||||||||
|
| |||||||||||
Health Care Providers & Services 1.9% | ||||||||||||
CVS Health Corp. | United States | 3,993,966 | 296,711,734 | |||||||||
|
| |||||||||||
Hotels, Restaurants & Leisure 2.6% | ||||||||||||
Accor SA | France | 5,757,306 | 269,560,163 | |||||||||
Sands China Ltd. | Macau | 25,499,100 | 136,293,202 | |||||||||
|
| |||||||||||
| 405,853,365 | ||||||||||||
|
| |||||||||||
Independent Power & Renewable Electricity Producers 0.1% | ||||||||||||
Vistra Energy Corp. | United States | 865,902 | 19,907,087 | |||||||||
|
| |||||||||||
Industrial Conglomerates 1.2% | ||||||||||||
General Electric Co. | United States | 16,950,050 | 189,162,558 | |||||||||
|
| |||||||||||
Insurance 9.5% | ||||||||||||
aAlleghany Corp. | United States | 76,761 | 61,375,793 | |||||||||
American International Group Inc. | United States | 5,102,618 | 261,917,382 | |||||||||
China Pacific Insurance Group Co. Ltd., H | China | 44,491,587 | 175,287,363 | |||||||||
Chubb Ltd. | United States | 1,032,198 | 160,671,941 | |||||||||
Everest Re Group Ltd. | United States | 282,300 | 78,151,932 | |||||||||
The Hartford Financial Services Group Inc. | United States | 5,478,587 | 332,933,732 | |||||||||
NN Group NV | Netherlands | 7,550,480 | 286,370,371 | |||||||||
RSA Insurance Group PLC | United Kingdom | 13,308,282 | 99,693,526 | |||||||||
|
| |||||||||||
| 1,456,402,040 | ||||||||||||
|
| |||||||||||
IT Services 1.4% | ||||||||||||
Cognizant Technology Solutions Corp., A | United States | 3,420,390 | 212,132,588 | |||||||||
|
| |||||||||||
Machinery 0.9% | ||||||||||||
CNH Industrial NV | United Kingdom | 5,804,196 | 63,724,242 | |||||||||
CNH Industrial NV, special voting | United Kingdom | 7,338,645 | 80,570,951 | |||||||||
|
| |||||||||||
| 144,295,193 | ||||||||||||
|
| |||||||||||
Media 2.9% | ||||||||||||
aCharter Communications Inc., A | United States | 521,865 | 253,146,274 | |||||||||
aDISH Network Corp., A. | United States | 4,143,726 | 146,977,961 | |||||||||
aiHeartMedia Inc., A | United States | 2,634,302 | 44,519,704 | |||||||||
a,biHeartMedia Inc., B | United States | 44,430 | 638,237 | |||||||||
| franklintempleton.com | Annual Report | 19 | ||||
FRANKLIN MUTUAL SERIES FUNDS
STATEMENT OF INVESTMENTS
Franklin Mutual Global Discovery Fund(continued)
| Country | Shares/ Rights/ Units/ Warrants | Value | ||||||||||
Common Stocks and Other Equity Interests(continued) | ||||||||||||
Media(continued) | ||||||||||||
a iHeartMedia Inc., wts., A, 5/01/39 | United States | 292 | $ | 4,935 | ||||||||
|
| |||||||||||
| 445,287,111 | ||||||||||||
|
| |||||||||||
Oil, Gas & Consumable Fuels 10.7% | ||||||||||||
BP PLC | United Kingdom | 42,385,302 | 264,743,094 | |||||||||
Caltex Australia Ltd. | Australia | 3,375,504 | 80,407,940 | |||||||||
Canadian Natural Resources Ltd. | Canada | 7,822,700 | 253,005,852 | |||||||||
Crescent Point Energy Corp. | Canada | 19,234,400 | 85,759,415 | |||||||||
JXTG Holdings Inc. | Japan | 22,697,867 | 103,991,424 | |||||||||
Kinder Morgan Inc. | United States | 15,908,858 | 336,790,524 | |||||||||
Plains All American Pipeline LP | United States | 5,573,200 | 102,491,148 | |||||||||
Royal Dutch Shell PLC, A (EUR Traded) | United Kingdom | 2,415,625 | 70,881,055 | |||||||||
Royal Dutch Shell PLC, A (GBP Traded) | United Kingdom | 6,164,658 | 182,482,859 | |||||||||
The Williams Cos. Inc. | United States | 6,364,035 | 150,954,910 | |||||||||
|
| |||||||||||
| 1,631,508,221 | ||||||||||||
|
| |||||||||||
Pharmaceuticals 10.2% | ||||||||||||
Allergan PLC | United States | 739,800 | 141,427,566 | |||||||||
a Bristol-Myers Squibb Co., rts., 2/01/49 | United States | 2,290,100 | 6,893,201 | |||||||||
Eli Lilly & Co. | United States | 1,984,017 | 260,759,354 | |||||||||
GlaxoSmithKline PLC | United Kingdom | 19,924,824 | 469,468,010 | |||||||||
Merck & Co. Inc. | United States | 2,179,073 | 198,186,689 | |||||||||
Novartis AG, ADR | Switzerland | 5,028,476 | 476,146,393 | |||||||||
|
| |||||||||||
| 1,552,881,213 | ||||||||||||
|
| |||||||||||
Semiconductors & Semiconductor Equipment 1.1% | ||||||||||||
a Renesas Electronics Corp. | Japan | 23,512,917 | 162,269,959 | |||||||||
|
| |||||||||||
Software 4.3% | ||||||||||||
a Avaya Holdings Corp. | United States | 537 | 7,250 | |||||||||
a Avaya Holdings Corp., wts., 12/15/22 | United States | 401,411 | 481,693 | |||||||||
a Check Point Software Technologies Ltd. | Israel | 2,433,172 | 269,984,765 | |||||||||
NortonLifeLock Inc. | United States | 9,568,159 | 244,179,418 | |||||||||
Oracle Corp. | United States | 2,836,800 | 150,293,664 | |||||||||
|
| |||||||||||
| 664,946,790 | ||||||||||||
|
| |||||||||||
Specialty Retail 0.7% | ||||||||||||
Dufry AG | Switzerland | 1,124,346 | 111,568,959 | |||||||||
|
| |||||||||||
Technology Hardware, Storage & Peripherals 5.1% | ||||||||||||
Hewlett Packard Enterprise Co. | United States | 10,039,360 | 159,224,250 | |||||||||
Samsung Electronics Co. Ltd. | South Korea | 8,138,650 | 392,855,189 | |||||||||
Western Digital Corp. | United States | 3,527,471 | 223,888,584 | |||||||||
|
| |||||||||||
| 775,968,023 | ||||||||||||
|
| |||||||||||
Textiles, Apparel & Luxury Goods 0.7% | ||||||||||||
Cie Financiere Richemont SA | Switzerland | 1,357,307 | 106,688,131 | |||||||||
|
| |||||||||||
20 | Annual Report | franklintempleton.com | ||
FRANKLIN MUTUAL SERIES FUNDS
STATEMENT OF INVESTMENTS
Franklin Mutual Global Discovery Fund(continued)
| Country | Shares/ Rights/ Units/ Warrants | Value | ||||||||||
Common Stocks and Other Equity Interests(continued) | ||||||||||||
Tobacco 3.1% | ||||||||||||
Altria Group Inc. | United States | 2,606,727 | $ | 130,101,745 | ||||||||
British American Tobacco PLC | United Kingdom | 5,783,513 | 247,532,050 | |||||||||
British American Tobacco PLC, ADR | United Kingdom | 2,178,905 | 92,516,306 | |||||||||
|
| |||||||||||
| 470,150,101 | ||||||||||||
|
| |||||||||||
Wireless Telecommunication Services 0.7% | ||||||||||||
Vodafone Group PLC | United Kingdom | 53,001,778 | 103,022,884 | |||||||||
|
| |||||||||||
Total Common Stocks and Other Equity Interests | 14,368,947,730 | |||||||||||
|
| |||||||||||
Preferred Stocks (Cost $391,187,079) 2.5% | ||||||||||||
Automobiles 2.5% | ||||||||||||
d Volkswagen AG, 2.758%, pfd | Germany | 1,896,164 | 374,766,100 | |||||||||
|
| |||||||||||
Principal | ||||||||||||
Corporate Notes 0.8% | ||||||||||||
Frontier Communications Corp., | ||||||||||||
senior note, 10.50%, 9/15/22 | United States | $ | 117,895,000 | 57,805,333 | ||||||||
senior note, 11.00%, 9/15/25 | United States | 133,179,000 | 64,924,763 | |||||||||
|
| |||||||||||
Total Corporate Notes (Cost $233,271,255) | 122,730,096 | |||||||||||
|
| |||||||||||
Shares | ||||||||||||
Companies in Liquidation 0.0%† | ||||||||||||
a,b,e Clear Channel Communications Inc., Contingent Distribution | United States | 95,618,000 | — | |||||||||
a,b,e iHeartCommunications Inc., Contingent Distribution | United States | 155,900,649 | — | |||||||||
a,b,e Tribune Media, Litigation Trust, Contingent Distribution | United States | 1,292,117 | — | |||||||||
a,b,e Vistra Energy Corp., Litigation Trust, Contingent Distribution | United States | 142,325,613 | 78,279 | |||||||||
a,b,e Walter Energy Inc., Litigation Trust, Contingent Distribution | United States | 30,996,000 | — | |||||||||
|
| |||||||||||
Total Companies in Liquidation (Cost $4,500,343) | 78,279 | |||||||||||
|
| |||||||||||
Total Investments before Short Term Investments | 14,866,522,205 | |||||||||||
|
| |||||||||||
| franklintempleton.com | Annual Report | 21 | ||||
FRANKLIN MUTUAL SERIES FUNDS
STATEMENT OF INVESTMENTS
Franklin Mutual Global Discovery Fund(continued)
| Country | Principal Amount | Value | ||||||||||
Short Term Investments 2.7% | ||||||||||||
U.S. Government and Agency Securities 2.7% | ||||||||||||
f FHLB, 1/02/20 | United States | $ | 58,500,000 | $ | 58,500,000 | |||||||
f U.S. Treasury Bill, | ||||||||||||
g 3/19/20 - 5/28/20 | United States | 147,000,000 | 146,317,914 | |||||||||
1/02/20 - 6/25/20 | United States | 207,000,000 | 206,471,907 | |||||||||
|
| |||||||||||
Total U.S. Government and Agency Securities | 411,289,821 | |||||||||||
|
| |||||||||||
Total Investments (Cost $12,023,327,438) 100.0% | 15,277,812,026 | |||||||||||
Securities Sold Short (0.4)% | (56,724,656 | ) | ||||||||||
Other Assets, less Liabilities 0.4% | 58,606,826 | |||||||||||
|
| |||||||||||
Net Assets 100.0% | $ | 15,279,694,196 | ||||||||||
|
| |||||||||||
Shares | ||||||||||||
h Securities Sold Short (Proceeds $46,496,765) (0.4)% | ||||||||||||
Common Stocks (0.4)% | ||||||||||||
Biotechnology (0.4)% | ||||||||||||
AbbVie Inc. | United States | 640,667 | (56,724,656 | ) | ||||||||
|
| |||||||||||
†Rounds to less than 0.1% of net assets.
aNon-income producing.
bFair valued using significant unobservable inputs. See Note 15 regarding fair value measurements.
cSee Note 10 regarding restricted securities.
dVariable rate security. The rate shown represents the yield at period end.
eContingent distributions represent the right to receive additional distributions, if any, during the reorganization of the underlying company. Shares represent total underlying principal of debt securities.
fThe security was issued on a discount basis with no stated coupon rate.
gA portion or all of the security has been segregated as collateral for securities sold short and/or open forward exchange contracts. At December 31, 2019, the aggregate value of these securities pledged amounted to $57,795,263, representing 0.4% of net assets.
hSee Note 1(d) regarding securities sold short.
At December 31, 2019, the Fund had the following futures contracts outstanding. See Note 1(c).
Futures Contracts
| Description | Type | Number of Contracts | Notional Amount* | Expiration Date | Value/ Unrealized Appreciation (Depreciation) | |||||||||||||||
Currency Contracts | ||||||||||||||||||||
EUR/USD | Short | 6,716 | $ | 947,123,900 | 3/16/20 | $ | (9,102,815 | ) | ||||||||||||
GBP/USD | Short | 4,516 | 375,166,700 | 3/16/20 | (2,868,036 | ) | ||||||||||||||
|
| |||||||||||||||||||
Total Futures Contracts. | $ | (11,970,851 | ) | |||||||||||||||||
|
| |||||||||||||||||||
*As of period end.
22 | Annual Report | franklintempleton.com | ||
FRANKLIN MUTUAL SERIES FUNDS
STATEMENT OF INVESTMENTS
Franklin Mutual Global Discovery Fund(continued)
At December 31, 2019, the Fund had the following forward exchange contracts outstanding. See Note 1(c).
Forward Exchange Contracts
| Currency | Counterpartya | Type | Quantity | Contract Amount | Settlement Date | Unrealized Appreciation | Unrealized Depreciation | |||||||||||||||||||||
| ||||||||||||||||||||||||||||
OTC Forward Exchange Contracts |
| |||||||||||||||||||||||||||
Swiss Franc | HSBK | Sell | 1,010,168 | $ | 1,025,059 | 1/13/20 | $ | — | $ | (19,869 | ) | |||||||||||||||||
Swiss Franc | UBSW | Sell | 165,864,071 | 167,756,603 | 1/13/20 | — | (3,814,826 | ) | ||||||||||||||||||||
Euro | BOFA | Sell | 17,251,299 | 19,222,412 | 1/15/20 | — | (142,681 | ) | ||||||||||||||||||||
Euro | HSBK | Buy | 3,136,303 | 3,523,824 | 1/15/20 | — | (3,232 | ) | ||||||||||||||||||||
Euro | HSBK | Sell | 11,417,652 | 12,759,398 | 1/15/20 | — | (57,254 | ) | ||||||||||||||||||||
Euro | SSBT | Sell | 10,565,078 | 11,805,502 | 1/15/20 | — | (54,108 | ) | ||||||||||||||||||||
Euro | SSBT | Sell | 18,607,519 | 21,252,764 | 1/15/20 | 365,275 | — | |||||||||||||||||||||
Euro | UBSW | Sell | 18,607,519 | 21,252,857 | 1/15/20 | 365,368 | — | |||||||||||||||||||||
Euro | UBSW | Sell | 34,750,608 | 38,763,320 | 1/15/20 | — | (245,263 | ) | ||||||||||||||||||||
British Pound | BOFA | Buy | 4,452,866 | 5,468,134 | 1/16/20 | 432,268 | — | |||||||||||||||||||||
British Pound | HSBK | Buy | 1,589,771 | 1,982,508 | 1/16/20 | 124,066 | — | |||||||||||||||||||||
British Pound | HSBK | Sell | 107,887,669 | 136,390,754 | 1/16/20 | — | (6,568,997 | ) | ||||||||||||||||||||
South Korean Won | HSBK | Sell | 76,419,913,382 | 64,149,562 | 1/17/20 | — | (1,980,570 | ) | ||||||||||||||||||||
South Korean Won | UBSW | Buy | 16,464,488,950 | 13,975,460 | 1/17/20 | 272,120 | — | |||||||||||||||||||||
South Korean Won | UBSW | Sell | 169,693,662,365 | 143,511,124 | 1/17/20 | — | (3,333,641 | ) | ||||||||||||||||||||
Australian Dollar | HSBK | Sell | 9,283,731 | 6,395,826 | 2/14/20 | — | (125,434 | ) | ||||||||||||||||||||
Australian Dollar | UBSW | Sell | 103,664,903 | 71,604,164 | 2/14/20 | — | (1,214,174 | ) | ||||||||||||||||||||
British Pound | HSBK | Sell | 28,194,389 | 34,552,233 | 2/14/20 | — | (2,837,426 | ) | ||||||||||||||||||||
British Pound | SSBT | Sell | 25,703,449 | 31,309,114 | 2/14/20 | — | (2,777,215 | ) | ||||||||||||||||||||
British Pound | UBSW | Sell | 11,693,465 | 14,536,127 | 2/14/20 | — | (971,026 | ) | ||||||||||||||||||||
Euro | BOFA | Sell | 19,421,265 | 21,737,707 | 2/18/20 | — | (109,309 | ) | ||||||||||||||||||||
Euro | HSBK | Sell | 5,989,529 | 6,685,932 | 2/18/20 | — | (51,701 | ) | ||||||||||||||||||||
Euro | SSBT | Sell | 332,017,537 | 369,245,304 | 2/18/20 | — | (4,241,835 | ) | ||||||||||||||||||||
Euro | HSBK | Sell | 18,360,647 | 20,449,666 | 4/07/20 | — | (268,595 | ) | ||||||||||||||||||||
Euro | SSBT | Sell | 137,228,226 | 153,700,142 | 4/07/20 | — | (1,148,986 | ) | ||||||||||||||||||||
Euro | UBSW | Sell | 147,048,966 | 164,652,586 | 4/07/20 | — | (1,278,322 | ) | ||||||||||||||||||||
British Pound | BOFA | Sell | 20,981,128 | 27,137,747 | 4/24/20 | — | (738,038 | ) | ||||||||||||||||||||
British Pound | HSBK | Sell | 51,057,024 | 66,149,335 | 4/24/20 | — | (1,685,653 | ) | ||||||||||||||||||||
South Korean Won | HSBK | Sell | 134,167,316,764 | 115,638,972 | 5/15/20 | — | (912,273 | ) | ||||||||||||||||||||
South Korean Won | UBSW | Sell | 88,415,822,339 | 76,412,517 | 5/15/20 | — | (394,372 | ) | ||||||||||||||||||||
Euro | BOFA | Sell | 5,065,752 | 5,685,043 | 5/21/20 | — | (46,858 | ) | ||||||||||||||||||||
Euro | SSBT | Sell | 101,841,644 | 114,185,085 | 5/21/20 | — | (1,048,794 | ) | ||||||||||||||||||||
Euro | UBSW | Sell | 101,375,199 | 113,675,980 | 5/21/20 | — | (1,030,117 | ) | ||||||||||||||||||||
British Pound | BOFA | Sell | 4,246,361 | 5,703,292 | 5/22/20 | 57,398 | — | |||||||||||||||||||||
British Pound | BOFA | Sell | 28,418,163 | 37,227,870 | 5/22/20 | — | (556,462 | ) | ||||||||||||||||||||
British Pound | HSBK | Sell | 2,522,355 | 3,387,094 | 5/22/20 | 33,411 | — | |||||||||||||||||||||
British Pound | HSBK | Sell | 21,537,635 | 28,346,058 | 5/22/20 | — | (290,036 | ) | ||||||||||||||||||||
British Pound | UBSW | Sell | 4,246,361 | 5,707,075 | 5/22/20 | 61,182 | — | |||||||||||||||||||||
|
| |||||||||||||||||||||||||||
Total Forward Exchange Contracts |
| $ | 1,711,088 | $ (37,947,067 | ) | |||||||||||||||||||||||
|
| |||||||||||||||||||||||||||
Net unrealized appreciation (depreciation) |
|
|
$ (36,235,979 |
) | ||||||||||||||||||||||||
|
| |||||||||||||||||||||||||||
aMay be comprised of multiple contracts with the same counterparty, currency and settlement date.
See Note 11 regarding other derivative information.
See Abbreviations on page 41.
| franklintempleton.com | The accompanying notes are an integral part of these financial statements. | Annual Report | 23 | ||
FINANCIAL STATEMENTS
Statement of Assets and Liabilities
December 31, 2019
Franklin Mutual Global Discovery Fund
Assets: | ||||
Investments in securities: | ||||
Cost - Unaffiliated issuers | $ | 12,023,327,438 | ||
|
| |||
Value - Unaffiliated issuers | $ | 15,277,812,026 | ||
Cash | 281,389 | |||
Receivables: | ||||
Investment securities sold | 19,224,518 | |||
Capital shares sold | 5,247,674 | |||
Dividends and interest | 47,475,384 | |||
European Union tax reclaims | 8,492,372 | |||
Deposits with brokers for: | ||||
Securities sold short | 57,847,053 | |||
Futures contracts | 24,111,600 | |||
Unrealized appreciation on OTC forward exchange contracts | 1,711,088 | |||
Other assets | 2,874,819 | |||
|
| |||
Total assets | 15,445,077,923 | |||
|
| |||
Liabilities: | ||||
Payables: | ||||
Investment securities purchased | 21,391,186 | |||
Capital shares redeemed | 23,529,183 | |||
Management fees | 10,709,661 | |||
Distribution fees | 2,464,068 | |||
Transfer agent fees | 3,154,695 | |||
Trustees’ fees and expenses | 1,158,979 | |||
Variation margin on futures contracts | 6,346,273 | |||
Securities sold short, at value (proceeds $46,496,765) | 56,724,656 | |||
Unrealized depreciation on OTC forward exchange contracts | 37,947,067 | |||
Accrued expenses and other liabilities | 1,957,959 | |||
|
| |||
Total liabilities | 165,383,727 | |||
|
| |||
Net assets, at value | $ | 15,279,694,196 | ||
|
| |||
Net assets consist of: | ||||
Paid-in capital | $ | 11,962,720,902 | ||
Total distributable earnings (losses) | 3,316,973,294 | |||
|
| |||
Net assets, at value | $ | 15,279,694,196 | ||
|
| |||
24 | Annual Report | The accompanying notes are an integral part of these financial statements. | franklintempleton.com | ||
FRANKLIN MUTUAL SERIES FUNDS
FINANCIAL STATEMENTS
Statement of Assets and Liabilities(continued)
December 31, 2019
Franklin Mutual Global Discovery Fund
Class Z: | ||||
Net assets, at value | $ | 5,176,787,053 | ||
|
| |||
Shares outstanding | 165,985,776 | |||
|
| |||
Net asset value and maximum offering price per share | $31.19 | |||
|
| |||
Class A: | ||||
Net assets, at value | $ | 7,683,643,814 | ||
|
| |||
Shares outstanding | 251,848,370 | |||
|
| |||
Net asset value per sharea | $30.51 | |||
|
| |||
Maximum offering price per share (net asset value per share ÷ 94.50%) | $32.29 | |||
|
| |||
Class C: | ||||
Net assets, at value | $ | 872,716,964 | ||
|
| |||
Shares outstanding | 28,646,905 | |||
|
| |||
Net asset value and maximum offering price per sharea | $30.46 | |||
|
| |||
Class R: | ||||
Net assets, at value | $ | 251,089,192 | ||
|
| |||
Shares outstanding | 8,348,468 | |||
|
| |||
Net asset value and maximum offering price per share | $30.08 | |||
|
| |||
Class R6: | ||||
Net assets, at value | $ | 1,295,457,173 | ||
|
| |||
Shares outstanding | 41,555,139 | |||
|
| |||
Net asset value and maximum offering price per share | $31.17 | |||
|
| |||
aRedemption price is equal to net asset value less contingent deferred sales charges, if applicable.
| franklintempleton.com | The accompanying notes are an integral part of these financial statements. | Annual Report | 25 | ||
FRANKLIN MUTUAL SERIES FUNDS
FINANCIAL STATEMENTS
Statement of Operations
for the year ended December 31, 2019
Franklin Mutual Global Discovery Fund
Investment income: | ||||
Dividends: (net of foreign taxes)* | ||||
Unaffiliated issuers | $ | 446,808,092 | ||
Interest: | ||||
Unaffiliated issuers | 49,202,150 | |||
Income from securities loaned: | ||||
Unaffiliated issuers (net of fees and rebates) | 1,208,403 | |||
Non-controlled affiliates (Note 3f) | 82,368 | |||
Other income (Note 1f) | 1,746,322 | |||
|
| |||
Total investment income | 499,047,335 | |||
|
| |||
Expenses: | ||||
Management fees (Note 3a) | 129,605,427 | |||
Distribution fees: (Note 3c) | ||||
Class A | 19,297,436 | |||
Class C | 9,848,755 | |||
Class R | 1,353,457 | |||
Transfer agent fees: (Note 3e) | ||||
Class Z | 6,566,421 | |||
Class A | 9,680,160 | |||
Class C | 1,235,239 | |||
Class R | 340,336 | |||
Class R6 | 385,223 | |||
Custodian fees (Note 4) | 1,049,619 | |||
Reports to shareholders | 1,332,538 | |||
Registration and filing fees | 244,301 | |||
Professional feesa | (748,750 | ) | ||
Trustees’ fees and expenses | 972,477 | |||
Dividends on securities sold short | 2,706,278 | |||
Other | 498,843 | |||
|
| |||
Total expenses | 184,367,760 | |||
Expense reductions (Note 4) | (125,757 | ) | ||
Expenses waived/paid by affiliates (Note 3f and 3g) | (123,621 | ) | ||
|
| |||
Net expenses | 184,118,382 | |||
|
| |||
Net investment income | 314,928,953 | |||
|
| |||
Realized and unrealized gains (losses): | ||||
Net realized gain (loss) from: | ||||
Investments: | ||||
Unaffiliated issuers | 520,594,188 | |||
Non-controlled affiliates (Note 3f and 12) | (23,807,201 | ) | ||
Foreign currency transactions | 321,342 | |||
Forward exchange contracts | 138,441,749 | |||
Futures contracts | 58,028,854 | |||
Securities sold short | (16,081,292 | ) | ||
|
| |||
Net realized gain (loss) | 677,497,640 | |||
|
| |||
Net change in unrealized appreciation (depreciation) on: | ||||
Investments: | ||||
Unaffiliated issuers | 2,526,183,500 | |||
Non-controlled affiliates (Note 3f and 12) | 24,864,834 | |||
Translation of other assets and liabilities denominated in foreign currencies | 109,714 | |||
Forward exchange contracts | (68,504,004 | ) | ||
26 | Annual Report | The accompanying notes are an integral part of these financial statements. | franklintempleton.com | ||
FRANKLIN MUTUAL SERIES FUNDS
FINANCIAL STATEMENTS
Statement of Operations(continued)
for the year ended December 31, 2019
Franklin Mutual Global Discovery Fund
Futures contracts | (12,957,028 | ) | ||
Securities sold short | (44,940,557 | ) | ||
|
| |||
Net change in unrealized appreciation (depreciation) | 2,424,756,459 | |||
|
| |||
Net realized and unrealized gain (loss) | 3,102,254,099 | |||
|
| |||
Net increase (decrease) in net assets resulting from operations | $ | 3,417,183,052 | ||
|
| |||
*Foreign taxes withheld on dividends | $ | 22,378,684 | ||
aIncludes unaffiliated reimbursement of legal fees incurred in connection with certain Fund holdings.
| franklintempleton.com | The accompanying notes are an integral part of these financial statements. | Annual Report | 27 | ||
FRANKLIN MUTUAL SERIES FUNDS
FINANCIAL STATEMENTS
Statements of Changes in Net Assets
Franklin Mutual Global Discovery Fund
| Year Ended December 31, | ||||||||
| 2019 | 2018 | |||||||
Increase (decrease) in net assets: | ||||||||
Operations: | ||||||||
Net investment income | $ | 314,928,953 | $ | 315,277,410 | ||||
Net realized gain (loss) | 677,497,640 | 1,263,045,185 | ||||||
Net change in unrealized appreciation (depreciation) | 2,424,756,459 | (3,569,979,292 | ) | |||||
|
| |||||||
Net increase (decrease) in net assets resulting from operations | 3,417,183,052 | (1,991,656,697 | ) | |||||
|
| |||||||
Distributions to shareholders: | ||||||||
Class Z | (361,251,360 | ) | (374,006,499 | ) | ||||
Class A | (528,196,610 | ) | (521,977,539 | ) | ||||
Class C | (53,529,898 | ) | (57,992,699 | ) | ||||
Class R | (17,206,023 | ) | (18,330,147 | ) | ||||
Class R6 | (92,112,429 | ) | (102,685,299 | ) | ||||
|
| |||||||
Total distributions to shareholders | (1,052,296,320 | ) | (1,074,992,183 | ) | ||||
|
| |||||||
Capital share transactions: (Note 2) | ||||||||
Class Z | (733,602,714 | ) | (1,016,045,824 | ) | ||||
Class A | (931,107,368 | ) | (656,381,733 | ) | ||||
Class C | (339,610,836 | ) | (1,164,168,030 | ) | ||||
Class R | (64,450,784 | ) | (70,948,671 | ) | ||||
Class R6 | (339,450,065 | ) | (526,328,702 | ) | ||||
|
| |||||||
Total capital share transactions | (2,408,221,767 | ) | (3,433,872,960 | ) | ||||
|
| |||||||
Net increase (decrease) in net assets | (43,335,035 | ) | (6,500,521,840 | ) | ||||
Net assets: | ||||||||
Beginning of year | 15,323,029,231 | 21,823,551,071 | ||||||
|
| |||||||
End of year | $ | 15,279,694,196 | $ | 15,323,029,231 | ||||
|
| |||||||
28 | Annual Report | The accompanying notes are an integral part of these financial statements. | franklintempleton.com | ||
FRANKLIN MUTUAL SERIES FUNDS
Franklin Mutual Global Discovery Fund
1. Organization and Significant Accounting Policies
Franklin Mutual Series Funds (Trust) is registered under the Investment Company Act of 1940 (1940 Act) as anopen-end management investment company, consisting of seven separate funds and applies the specialized accounting and reporting guidance in U.S. Generally Accepted Accounting Principles (U.S. GAAP). Franklin Mutual Global Discovery Fund (Fund) is included in this report. The Fund offers five classes of shares: Class Z, Class A, Class C, Class R and Class R6. Class C shares automatically convert to Class A shares after they have been held for 10 years. Each class of shares may differ by its initial sales load, contingent deferred sales charges, voting rights on matters affecting a single class, its exchange privilege and fees due to differing arrangements for distribution and transfer agent fees.
The following summarizes the Fund’s significant accounting policies.
a. Financial Instrument Valuation
The Fund’s investments in financial instruments are carried at fair value daily. Fair value is the price that would be received to sell an asset or paid to transfer a liability in an orderly transaction between market participants on the measurement date. The Fund calculates the net asset value (NAV) per share each business day as of 4 p.m. Eastern time or the regularly scheduled close of the New York Stock Exchange (NYSE), whichever is earlier. Under compliance policies and procedures approved by the Trust’s Board of Trustees (the Board), the Fund’s administrator has responsibility for oversight of valuation, including leading the cross-functional Valuation Committee (VC). The Fund may utilize independent pricing services, quotations from securities and financial instrument dealers, and other market sources to determine fair value.
Equity securities and derivative financial instruments listed on an exchange or on the NASDAQ National Market System are valued at the last quoted sale price or the official closing price of the day, respectively. Foreign equity securities are valued as of the close of trading on the foreign stock exchange on which the security is primarily traded, or as of 4 p.m. Eastern time. The value is then converted into its U.S. dollar equivalent at the foreign exchange rate in effect at 4 p.m. Eastern time on the day that the value of the security is determined.Over-the-counter (OTC) securities are valued within the range of the most recent quoted bid and ask prices. Securities that trade in multiple markets or on multiple
exchanges are valued according to the broadest and most representative market. Certain equity securities are valued based upon fundamental characteristics or relationships to similar securities.
Debt securities generally trade in the OTC market rather than on a securities exchange. The Fund’s pricing services use multiple valuation techniques to determine fair value. In instances where sufficient market activity exists, the pricing services may utilize a market-based approach through which quotes from market makers are used to determine fair value. In instances where sufficient market activity may not exist or is limited, the pricing services also utilize proprietary valuation models which may consider market characteristics such as benchmark yield curves, credit spreads, estimated default rates, anticipated market interest rate volatility, coupon rates, anticipated timing of principal repayments, underlying collateral, and other unique security features in order to estimate the relevant cash flows, which are then discounted to calculate the fair value.
Investments inopen-end mutual funds are valued at the closing NAV.
Certain derivative financial instruments trade in the OTC market. The Fund’s pricing services use various techniques including industry standard option pricing models and proprietary discounted cash flow models to determine the fair value of those instruments. The Fund’s net benefit or obligation under the derivative contract, as measured by the fair value of the contract, is included in net assets.
The Fund has procedures to determine the fair value of financial instruments for which market prices are not reliable or readily available. Under these procedures, the Fund primarily employs a market-based approach which may use related or comparable assets or liabilities, recent transactions, market multiples, book values, and other relevant information for the investment to determine the fair value of the investment. An income-based valuation approach may also be used in which the anticipated future cash flows of the investment are discounted to calculate fair value. Discounts may also be applied due to the nature or duration of any restrictions on the disposition of the investments. Due to the inherent uncertainty of valuations of such investments, the fair values may differ significantly from the values that would have been used had an active market existed.
| franklintempleton.com | Annual Report | 29 | ||
FRANKLIN MUTUAL SERIES FUNDS
NOTES TO FINANCIAL STATEMENTS
Franklin Mutual Global Discovery Fund(continued)
1. Organization and Significant Accounting Policies(continued)
a. Financial Instrument Valuation(continued)
Trading in securities on foreign securities stock exchanges and OTC markets may be completed before 4 p.m. Eastern time. In addition, trading in certain foreign markets may not take place on every Fund’s business day. Occasionally, events occur between the time at which trading in a foreign security is completed and 4 p.m. Eastern time that might call into question the reliability of the value of a portfolio security held by the Fund. As a result, differences may arise between the value of the Fund’s portfolio securities as determined at the foreign market close and the latest indications of value at 4 p.m. Eastern time. In order to minimize the potential for these differences, the VC monitors price movements following the close of trading in foreign stock markets through a series of country specific market proxies (such as baskets of American Depositary Receipts, futures contracts and exchange traded funds). These price movements are measured against established trigger thresholds for each specific market proxy to assist in determining if an event has occurred that may call into question the reliability of the values of the foreign securities held by the Fund. If such an event occurs, the securities may be valued using fair value procedures, which may include the use of independent pricing services.
When the last day of the reporting period is anon-business day, certain foreign markets may be open on those days that the Fund’s NAV is not calculated, which could result in differences between the value of the Fund’s portfolio securities on the last business day and the last calendar day of the reporting period. Any significant security valuation changes due to an open foreign market are adjusted and reflected by the Fund for financial reporting purposes.
b. Foreign Currency Translation
Portfolio securities and other assets and liabilities denominated in foreign currencies are translated into U.S. dollars based on the exchange rate of such currencies against U.S. dollars on the date of valuation. The Fund may enter into foreign currency exchange contracts to facilitate transactions denominated in a foreign currency. Purchases and sales of securities, income and expense items denominated in foreign currencies are translated into U.S. dollars at the exchange rate in effect on the transaction date. Portfolio securities and assets and liabilities denominated in
foreign currencies contain risks that those currencies will decline in value relative to the U.S. dollar. Occasionally, events may impact the availability or reliability of foreign exchange rates used to convert the U.S. dollar equivalent value. If such an event occurs, the foreign exchange rate will be valued at fair value using procedures established and approved by the Board.
The Fund does not separately report the effect of changes in foreign exchange rates from changes in market prices on securities held. Such changes are included in net realized and unrealized gain or loss from investments in the Statement of Operations.
Realized foreign exchange gains or losses arise from sales of foreign currencies, currency gains or losses realized between the trade and settlement dates on securities transactions and the difference between the recorded amounts of dividends, interest, and foreign withholding taxes and the U.S. dollar equivalent of the amounts actually received or paid. Net unrealized foreign exchange gains and losses arise from changes in foreign exchange rates on foreign denominated assets and liabilities other than investments in securities held at the end of the reporting period.
c. Derivative Financial Instruments
The Fund invested in derivative financial instruments in order to manage risk or gain exposure to various other investments or markets. Derivatives are financial contracts based on an underlying or notional amount, require no initial investment or an initial net investment that is smaller than would normally be required to have a similar response to changes in market factors, and require or permit net settlement. Derivatives contain various risks including the potential inability of the counterparty to fulfill their obligations under the terms of the contract, the potential for an illiquid secondary market, and/or the potential for market movements which expose the Fund to gains or losses in excess of the amounts shown in the Statement of Assets and Liabilities. Realized gain and loss and unrealized appreciation and depreciation on these contracts for the period are included in the Statement of Operations.
Derivative counterparty credit risk is managed through a formal evaluation of the creditworthiness of all potential counterparties. The Fund attempts to reduce its exposure to counterparty credit risk on OTC derivatives, whenever possible, by entering into International Swaps and Derivatives Association (ISDA) master agreements with certain
30 | Annual Report | franklintempleton.com | ||
FRANKLIN MUTUAL SERIES FUNDS
NOTES TO FINANCIAL STATEMENTS
Franklin Mutual Global Discovery Fund(continued)
counterparties. These agreements contain various provisions, including but not limited to collateral requirements, events of default, or early termination. Termination events applicable to the counterparty include certain deteriorations in the credit quality of the counterparty. Termination events applicable to the Fund include failure of the Fund to maintain certain net asset levels and/or limit the decline in net assets over various periods of time. In the event of default or early termination, the ISDA master agreement gives thenon-defaulting party the right to net andclose-out all transactions traded, whether or not arising under the ISDA agreement, to one net amount payable by one counterparty to the other. However, absent an event of default or early termination, OTC derivative assets and liabilities are presented gross and not offset in the Statement of Assets and Liabilities. Early termination by the counterparty may result in an immediate payment by the Fund of any net liability owed to that counterparty under the ISDA agreement. At December 31, 2019, the Fund had OTC derivatives in a net liability position of $36,235,979 and the aggregate value of collateral pledged for such contracts was $30,030,901.
Collateral requirements differ by type of derivative. Collateral or initial margin requirements are set by the broker or exchange clearing house for exchange traded and centrally cleared derivatives. Initial margin deposited is held at the exchange and can be in the form of cash and/or securities. For OTC derivatives traded under an ISDA master agreement, posting of collateral is required by either the Fund or the applicable counterparty if the total net exposure of all OTC derivatives with the applicable counterparty exceeds the minimum transfer amount, which typically ranges from $100,000 to $250,000, and can vary depending on the counterparty and the type of the agreement. Generally, collateral is determined at the close of Fund business each day and any additional collateral required due to changes in derivative values may be delivered by the Fund or the counterparty the next business day, or within a few business days. Collateral pledged and/or received by the Fund for OTC derivatives, if any, is held in segregated accounts with the Fund’s custodian/counterparty broker and can be in the form of cash and/or securities. Unrestricted cash may be invested according to the Fund’s investment objectives. To the extent that the amounts due to the Fund from its counterparties are not subject to collateralization or are not fully collateralized, the Fund bears the risk of loss from counterpartynon-performance.
The Fund entered into exchange traded futures contracts primarily to manage exposure to certain foreign currencies. A futures contract is an agreement between the Fund and a counterparty to buy or sell an asset at a specified price on a future date. Required initial margins are pledged by the Fund, and the daily change in fair value is accounted for as a variation margin payable or receivable in the Statement of Assets and Liabilities.
The Fund entered into OTC forward exchange contracts primarily to manage exposure to certain foreign currencies. A forward exchange contract is an agreement between the Fund and a counterparty to buy or sell a foreign currency at a specific exchange rate on a future date.
See Note 11 regarding other derivative information.
d. Securities Sold Short
The Fund is engaged in selling securities short, which obligates the Fund to replace a borrowed security with the same security at current fair value. The Fund incurs a loss if the price of the security increases between the date of the short sale and the date on which the Fund replaces the borrowed security. The Fund realizes a gain if the price of the security declines between those dates. Gains are limited to the price at which the Fund sold the security short, while losses are potentially unlimited in size.
The Fund is required to establish a margin account with the broker lending the security sold short. While the short sale is outstanding, the broker retains the proceeds of the short sale to the extent necessary to meet margin requirements until the short position is closed out. A deposit must also be maintained with the Fund’s custodian/counterparty broker consisting of cash and/or securities having a value equal to a specified percentage of the value of the securities sold short. The Fund is obligated to pay fees for borrowing the securities sold short and is required to pay the counterparty any dividends and/or interest due on securities sold short. Such dividends and/or interest and any security borrowing fees are recorded as an expense to the Fund.
e. Securities Lending
The Fund participates in an agency based securities lending program to earn additional income. The Fund receives cash collateral against the loaned securities in an amount equal to at least 102% of the fair value of the loaned securities. Collateral is maintained over the life of the loan in an amount
| franklintempleton.com | Annual Report | 31 | ||
FRANKLIN MUTUAL SERIES FUNDS
NOTES TO FINANCIAL STATEMENTS
Franklin Mutual Global Discovery Fund(continued)
1. Organization and Significant Accounting Policies(continued)
e. Securities Lending(continued)
not less than 100% of the fair value of loaned securities, as determined at the close of Fund business each day; any additional collateral required due to changes in security values is delivered to the Fund on the next business day. The collateral is deposited into a joint cash account with other funds and is used to invest in a money market fund managed by Franklin Advisers, Inc., an affiliate of the Fund, and/or a joint repurchase agreement. The Fund may receive income from the investment of cash collateral, in addition to lending fees and rebates paid by the borrower. Income from securities loaned, net of fees paid to the securities lending agent and/or third-party vendor, is reported separately in the Statement of Operations. The Fund bears the market risk with respect to the collateral investment, securities loaned, and the risk that the agent may default on its obligations to the Fund. If the borrower defaults on its obligation to return the securities loaned, the Fund has the right to repurchase the securities in the open market using the collateral received. The securities lending agent has agreed to indemnify the Fund in the event of default by a third party borrower. At December 31, 2019, the Fund had no securities on loan.
f. Income and Deferred Taxes
It is the Fund’s policy to qualify as a regulated investment company under the Internal Revenue Code. The Fund intends to distribute to shareholders substantially all of its taxable income and net realized gains to relieve it from federal income and excise taxes. As a result, no provision for U.S. federal income taxes is required.
The Fund may be subject to foreign taxation related to income received, capital gains on the sale of securities and certain foreign currency transactions in the foreign jurisdictions in which it invests. Foreign taxes, if any, are recorded based on the tax regulations and rates that exist in the foreign markets in which the Fund invests. When a capital gain tax is determined to apply, the Fund records an estimated deferred tax liability in an amount that would be payable if the securities were disposed of on the valuation date.
As a result of several court cases, in certain countries across the European Union, the Fund filed additional tax reclaims for previously withheld taxes on dividends earned in those
countries (EU reclaims). These additional filings are subject to various administrative proceedings by the local jurisdictions’ tax authorities within the European Union, as well as a number of related judicial proceedings. Income recognized, if any, for EU reclaims is reflected as other income in the Statement of Operations and any related receivable, if any, is reflected as European Union tax reclaims in the Statement of Assets and Liabilities. When uncertainty exists as to the ultimate resolution of these proceedings, the likelihood of receipt of these EU reclaims, and the potential timing of payment, no amounts are reflected in the financial statements. For U.S. income tax purposes, EU reclaims received by the Fund, if any, reduce the amounts of foreign taxes Fund shareholders can use as tax credits in their individual income tax returns.
The Fund may recognize an income tax liability related to its uncertain tax positions under U.S. GAAP when the uncertain tax position has a less than 50% probability that it will be sustained upon examination by the tax authorities based on its technical merits. As of December 31, 2019, the Fund has determined that no tax liability is required in its financial statements related to uncertain tax positions for any open tax years (or expected to be taken in future tax years). Open tax years are those that remain subject to examination and are based on the statute of limitations in each jurisdiction in which the Fund invests.
g. Security Transactions, Investment Income, Expenses and Distributions
Security transactions are accounted for on trade date. Realized gains and losses on security transactions are determined on a specific identification basis. Interest income and estimated expenses are accrued daily. Amortization of premium and accretion of discount on debt securities are included in interest income. Dividend income and dividends declared on securities sold short are recorded on theex-dividend date except for certain dividends from securities where the dividend rate is not available. In such cases, the dividend is recorded as soon as the information is received by the Fund. Distributions to shareholders are recorded on theex-dividend date. Distributable earnings are determined according to income tax regulations (tax basis) and may differ from earnings recorded in accordance with U.S. GAAP. These differences may be permanent or temporary. Permanent differences are reclassified among capital accounts to reflect
32 | Annual Report | franklintempleton.com | ||
FRANKLIN MUTUAL SERIES FUNDS
NOTES TO FINANCIAL STATEMENTS
Franklin Mutual Global Discovery Fund(continued)
their tax character. These reclassifications have no impact on net assets or the results of operations. Temporary differences are not reclassified, as they may reverse in subsequent periods.
Common expenses incurred by the Trust are allocated among the Funds based on the ratio of net assets of each Fund to the combined net assets of the Trust or based on the ratio of number of shareholders of each Fund to the combined number of shareholders of the Trust. Fund specific expenses are charged directly to the Fund that incurred the expense.
Realized and unrealized gains and losses and net investment income, excluding class specific expenses, are allocated daily to each class of shares based upon the relative proportion of net assets of each class. Differences in per share distributions by class are generally due to differences in class specific expenses.
h. Accounting Estimates
The preparation of financial statements in accordance with U.S. GAAP requires management to make estimates and assumptions that affect the reported amounts of assets and
liabilities at the date of the financial statements and the amounts of income and expenses during the reporting period. Actual results could differ from those estimates.
i. Guarantees and Indemnifications
Under the Trust’s organizational documents, its officers and trustees are indemnified by the Trust against certain liabilities arising out of the performance of their duties to the Trust. Additionally, in the normal course of business, the Trust, on behalf of the Fund, enters into contracts with service providers that contain general indemnification clauses. The Trust’s maximum exposure under these arrangements is unknown as this would involve future claims that may be made against the Trust that have not yet occurred. Currently, the Trust expects the risk of loss to be remote.
2. Shares of Beneficial Interest
At December 31, 2019, there were an unlimited number of shares authorized (without par value). Transactions in the Fund’s shares were as follows:
| Year Ended December 31, | ||||||||||||||||
| 2019 | 2018 | |||||||||||||||
| Shares | Amount | Shares | Amount | |||||||||||||
Class Z Shares: | ||||||||||||||||
Shares sold | 12,263,198 | $ | 369,164,159 | 23,075,260 | $ | 743,381,791 | ||||||||||
Shares issued in reinvestment of distributions | 10,621,505 | 326,481,046 | 12,874,929 | 339,549,151 | ||||||||||||
Shares redeemed | (47,272,140 | ) | (1,429,247,919 | ) | (66,928,248 | ) | (2,098,976,766 | ) | ||||||||
Net increase (decrease) | (24,387,437 | ) | $ | (733,602,714 | ) | (30,978,059 | ) | $ | (1,016,045,824 | ) | ||||||
Class A Shares: | ||||||||||||||||
Shares solda | 17,462,220 | $ | 518,262,717 | 39,540,409 | $ | 1,238,132,295 | ||||||||||
Shares issued in reinvestment of distributions | 17,190,278 | 516,611,982 | 19,765,773 | 510,690,925 | ||||||||||||
Shares redeemed | (66,274,047 | ) | (1,965,982,067 | ) | (77,371,791 | ) | (2,405,204,953 | ) | ||||||||
Net increase (decrease) | (31,621,549 | ) | $ | (931,107,368 | ) | (18,065,609 | ) | $ | (656,381,733 | ) | ||||||
| franklintempleton.com | Annual Report | 33 | ||
FRANKLIN MUTUAL SERIES FUNDS
NOTES TO FINANCIAL STATEMENTS
Franklin Mutual Global Discovery Fund(continued)
2. Shares of Beneficial Interest(continued)
| Year Ended December 31, | ||||||||||||||||
| 2019 | 2018 | |||||||||||||||
| Shares | Amount | Shares | Amount | |||||||||||||
Class C Shares: | ||||||||||||||||
Shares sold | 1,771,751 | $ | 52,145,801 | 3,686,938 | $ | 114,177,734 | ||||||||||
Shares issued in reinvestment of distributions | 1,728,177 | 51,590,928 | 2,158,214 | 55,791,403 | ||||||||||||
Shares redeemeda | (15,014,827 | ) | (443,347,565 | ) | (43,253,998 | ) | (1,334,137,167 | ) | ||||||||
Net increase (decrease) | (11,514,899 | ) | $ | (339,610,836 | ) | (37,408,846 | ) | $ | (1,164,168,030 | ) | ||||||
Class R Shares: | ||||||||||||||||
Shares sold | 673,375 | $ | 19,591,339 | 952,638 | $ | 29,475,566 | ||||||||||
Shares issued in reinvestment of distributions | 571,874 | 16,917,190 | 699,971 | 17,846,355 | ||||||||||||
Shares redeemed | (3,452,518 | ) | (100,959,313 | ) | (3,807,349 | ) | (118,270,592 | ) | ||||||||
Net increase (decrease) | (2,207,269 | ) | $ | (64,450,784 | ) | (2,154,740 | ) | $ | (70,948,671 | ) | ||||||
Class R6 Shares: | ||||||||||||||||
Shares sold | 5,767,180 | $ | 173,953,547 | 12,000,653 | $ | 384,806,245 | ||||||||||
Shares issued in reinvestment of distributions | 2,704,420 | 83,110,071 | 3,572,465 | 94,139,840 | ||||||||||||
Shares redeemed | (19,752,108 | ) | (596,513,683 | ) | (31,266,192 | ) | (1,005,274,787 | ) | ||||||||
Net increase (decrease) | (11,280,508 | ) | $ | (339,450,065 | ) | (15,693,074 | ) | $ | (526,328,702 | ) | ||||||
aMay include a portion of Class C shares that were automatically converted to Class A.
3. Transactions with Affiliates
Franklin Resources, Inc. is the holding company for various subsidiaries that together are referred to as Franklin Templeton. Certain officers and trustees of the Fund are also officers and/or directors of the following subsidiaries:
| Subsidiary | Affiliation | |
Franklin Mutual Advisers, LLC (Franklin Mutual) | Investment manager | |
Franklin Templeton Services, LLC (FT Services) | Administrative manager | |
Franklin Templeton Distributors, Inc. (Distributors) | Principal underwriter | |
Franklin Templeton Investor Services, LLC (Investor Services) | Transfer agent | |
34 | Annual Report | franklintempleton.com | ||
FRANKLIN MUTUAL SERIES FUNDS
NOTES TO FINANCIAL STATEMENTS
Franklin Mutual Global Discovery Fund(continued)
a. Management Fees
The Fund pays an investment management fee to Franklin Mutual based on the average daily net assets of the Fund as follows:
| Annualized Fee Rate | Net Assets | |
0.875% | Up to and including $4 billion | |
0.845% | Over $4 billion, up to and including $7 billion | |
0.825% | Over $7 billion, up to and including $10 billion | |
0.805% | Over $10 billion, up to and including $13 billion | |
0.785% | Over $13 billion, up to and including $16 billion | |
0.765% | Over $16 billion, up to and including $19 billion | |
0.745% | Over $19 billion, up to and including $22 billion | |
0.725% | Over $22 billion, up to and including $25 billion | |
0.705% | Over $25 billion, up to and including $28 billion | |
0.685% | In excess of $28 billion | |
For the year ended December 31, 2019, the gross effective investment management fee rate was 0.831% of the Fund’s average daily net assets.
b. Administrative Fees
Under an agreement with Franklin Mutual, FT Services provides administrative services to the Fund. The fee is paid by Franklin Mutual based on the Fund’s average daily net assets, and is not an additional expense of the Fund.
c. Distribution Fees
The Board has adopted distribution plans for each share class, with the exception of Class Z and Class R6 shares, pursuant to Rule12b-1 under the 1940 Act. Under the Fund’s Class A reimbursement distribution plan, the Fund reimburses Distributors for costs incurred in connection with the servicing, sale and distribution of the Fund’s shares up to the maximum annual plan rate. Under the Class A reimbursement distribution plan, costs exceeding the maximum for the current plan year cannot be reimbursed in subsequent periods. In addition, under the Fund’s Class C and R compensation distribution plans, the Fund pays Distributors for costs incurred in connection with the servicing, sale and distribution of the Fund’s shares up to the maximum annual plan rate for each class. The plan year, for purposes of monitoring compliance with the maximum annual plan rates, is February 1 through January 31.
The maximum annual plan rates, based on the average daily net assets, for each class, are as follows:
Class A | 0.35 | % | ||
Class C | 1.00 | % | ||
Class R | 0.50 | % | ||
The Board has set the current rate at 0.25% per year for Class A shares until further notice and approval by the Board.
| franklintempleton.com | Annual Report | 35 | ||
FRANKLIN MUTUAL SERIES FUNDS
NOTES TO FINANCIAL STATEMENTS
Franklin Mutual Global Discovery Fund(continued)
3. Transactions with Affiliates(continued)
d. Sales Charges/Underwriting Agreements
Front-end sales charges and contingent deferred sales charges (CDSC) do not represent expenses of the Fund. These charges are deducted from the proceeds of sales of Fund shares prior to investment or from redemption proceeds prior to remittance, as applicable. Distributors has advised the Fund of the following commission transactions related to the sales and redemptions of the Fund’s shares for the year:
Sales charges retained net of commissions paid to unaffiliated brokers/dealers | $ | 554,224 | ||
CDSC retained | $ | 48,615 |
e. Transfer Agent Fees
Each class of shares pays transfer agent fees to Investor Services for its performance of shareholder servicing obligations. The fees are based on an annualized asset based fee of 0.02% plus a transaction based fee. In addition, each class reimburses Investor Services for out of pocket expenses incurred and, except for Class R6 reimburses shareholder servicing fees paid to third parties. These fees are allocated daily based upon their relative proportion of such classes’ aggregate net assets. Class R6 pays Investor Services transfer agent fees specific to that class.
For the year ended December 31, 2019, the Fund paid transfer agent fees of $18,207,379, of which $7,566,749 was retained by Investor Services.
f. Investments in Affiliated Management Investment Companies
The Fund invests in one or more affiliated management investment companies for purposes other than exercising a controlling influence over the management or policies. Management fees paid by the Fund are waived on assets invested in the affiliated management investment companies, as noted in the Statement of Operations, in an amount not to exceed the management and administrative fees paid directly or indirectly by each affiliate. During the year ended December 31, 2019, the Fund held investments in affiliated management investment companies as follows:
| Value at Beginning of Year | Purchases | Sales | Realized Gain (Loss) | Net Change in Unrealized Appreciation (Depreciation) | Value at End of Year | Number of Shares Held at End of Year | Income from securities loaned | |||||||||||||||||||||||||
Non-Controlled Affiliates |
| |||||||||||||||||||||||||||||||
Institutional Fiduciary Trust Money Market Portfolio, 1.26% | $ | — | $ | 200,368,000 | $ | (200,368,000 | ) | $ — | $ — | $— | a | — | $82,368 | |||||||||||||||||||
|
| |||||||||||||||||||||||||||||||
aAs of December 31, 2019, no longer held by the Fund.
g. Waiver and Expense Reimbursements
Investor Services has contractually agreed in advance to waive or limit its fees so that the Class R6 transfer agent fees do not exceed 0.02% based on the average net assets of the class until April 30, 2020.
h. Interfund Transactions
The Fund engaged in purchases and sales of investments with funds or other accounts that have common investment managers (or affiliated investment managers), directors, trustees or officers. During the year ended December 31, 2019, these purchase and sale transactions aggregated $0 and $36,197,808, respectively.
36 | Annual Report | franklintempleton.com | ||
FRANKLIN MUTUAL SERIES FUNDS
NOTES TO FINANCIAL STATEMENTS
Franklin Mutual Global Discovery Fund(continued)
4. Expense Offset Arrangement
The Fund has entered into an arrangement with its custodian whereby credits realized as a result of uninvested cash balances are used to reduce a portion of the Fund’s custodian expenses. During the year ended December 31, 2019, the custodian fees were reduced as noted in the Statement of Operations.
5. Independent Trustees’ Retirement Plan
On January 1, 1993, the Trust adopted an Independent Trustees’ Retirement Plan (Plan). The Plan is an unfunded defined benefit plan that provides benefit payments to Trustees whose length of service and retirement age meets the eligibility requirements of the Plan. Benefits under the Plan are based on years of service and fees paid to each trustee at the time of retirement. Effective in December 1996, the Plan was closed to new participants.
During the year ended December 31, 2019, the Fund’s projected benefit obligation and benefit payments under the Plan were as follows:
aProjected benefit obligation at December 31, 2019 | $ | 1,158,979 | ||
bIncrease in projected benefit obligation | $ | 124,089 | ||
Benefit payments made to retired trustees | $ | (20,192 | ) |
aThe projected benefit obligation is included in trustees’ fees and expenses in the Statement of Assets and Liabilities.
bThe increase in projected benefit obligation is included in trustees’ fees and expenses in the Statement of Operations.
6. Income Taxes
The tax character of distributions paid during the years ended December 31, 2019 and 2018, was as follows:
| 2019 | 2018 | |||||||
Distributions paid from: | ||||||||
Ordinary income | $ | 355,756,491 | $ | 484,685,209 | ||||
Long term capital gain | 696,539,829 | 590,306,974 | ||||||
| $ | 1,052,296,320 | $ | 1,074,992,183 | |||||
At December 31, 2019, the cost of investments, net unrealized appreciation (depreciation), undistributed ordinary income and undistributed long term capital gains for income tax purposes were as follows:
Cost of investments | $ | 11,941,686,015 | ||
Unrealized appreciation | $ | 4,091,134,419 | ||
Unrealized depreciation | (859,912,150 | ) | ||
Net unrealized appreciation (depreciation) | $ | 3,231,222,269 | ||
Distributable earnings: | ||||
Undistributed ordinary income | $ | 32,026,024 | ||
Undistributed long term capital gains | 46,033,838 | |||
Total distributable earnings | $ | 78,059,862 | ||
Differences between income and/or capital gains as determined on a book basis and a tax basis are primarily due to differing treatment of foreign currency transactions.
| franklintempleton.com | Annual Report | 37 | ||
FRANKLIN MUTUAL SERIES FUNDS
NOTES TO FINANCIAL STATEMENTS
Franklin Mutual Global Discovery Fund(continued)
6. Income Taxes(continued)
The Fund utilized a tax accounting practice to treat a portion of the proceeds from capital shares redeemed as a distribution from realized capital gains.
7. Investment Transactions
Purchases and sales of investments (excluding short term securities and securities sold short) for the year ended December 31, 2019, aggregated $2,102,139,834 and $5,211,927,979, respectively.
8. Credit Risk and Defaulted Securities
The Fund may purchase thepre-default or defaulted debt of distressed companies. Distressed companies are financially troubled and could be or are already involved in financial restructuring or bankruptcy. Risks associated with purchasing these securities include the possibility that the bankruptcy or other restructuring process takes longer than expected, or that distributions in restructuring are less than anticipated, either or both of which may result in unfavorable consequences to the Fund. If it becomes probable that the income on debt securities, including those of distressed companies, will not be collected, the Fund discontinues accruing income and recognizes an adjustment for uncollectible interest.
At December 31, 2019, the Fund did not hold any distressed company securities for which interest recognition has been discontinued.
9. Concentration of Risk
Investing in foreign securities may include certain risks and considerations not typically associated with investing in U.S. securities, such as fluctuating currency values and changing local, regional and global economic, political and social conditions, which may result in greater market volatility. Current political and financial uncertainty surrounding the European Union may increase market volatility and the economic risk of investing in securities in Europe. In addition, certain foreign securities may not be as liquid as U.S. securities.
10. Restricted Securities
The Fund invests in securities that are restricted under the Securities Act of 1933 (1933 Act). Restricted securities are often purchased in private placement transactions, and cannot be sold without prior registration unless the sale is pursuant to an exemption under the 1933 Act. Disposal of these securities may require greater effort and expense, and prompt sale at an acceptable price may be difficult. The Fund may have registration rights for restricted securities. The issuer generally incurs all registration costs.
At December 31, 2019, investments in restricted securities, excluding securities exempt from registration under the 1933 Act, were as follows:
| Shares | Issuer | Acquisition Date | Cost | Value | ||||||||||
| 3,819,425 | International Automotive Components Group Brazil LLC, (Value is 0.0%†of Net Assets) | 4/13/06 - 12/26/08 | $ | 2,536,498 | $ | 138,645 | ||||||||
†Rounds to less than 0.1% of net assets.
38 | Annual Report | franklintempleton.com | ||
FRANKLIN MUTUAL SERIES FUNDS
NOTES TO FINANCIAL STATEMENTS
Franklin Mutual Global Discovery Fund(continued)
11. Other Derivative Information
At December 31, 2019, investments in derivative contracts are reflected in the Statement of Assets and Liabilities as follows:
Asset Derivatives | Liability Derivatives | |||||||||||
Derivative Contracts Not Accounted for as Hedging Instruments | Statement of Assets and Liabilities Location | Fair Value | Statement of Assets and Liabilities Location | Fair Value | ||||||||
| ||||||||||||
Foreign exchange contracts | Variation margin on futures contracts | $ | — | Variation margin on futures contracts | $ | 11,970,851 | a | |||||
Unrealized appreciation on OTC forward exchange contracts | 1,711,088 | Unrealized depreciation on OTC forward exchange contracts | 37,947,067 | |||||||||
|
|
|
| |||||||||
Totals | $ | 1,711,088 | $ | 49,917,918 | ||||||||
|
|
|
| |||||||||
aThis amount reflects the cumulative appreciation (depreciation) of futures contracts as reported in the Statement of Investments. Only the variation margin receivable/ payable at year end is separately reported within the Statement of Assets and Liabilities. Prior variation margin movements were recorded to cash upon receipt or payment.
For the year ended December 31, 2019, the effect of derivative contracts in the Statement of Operations was as follows:
Derivative Contracts Not Accounted for as Hedging Instruments | Statement of Operations Location | Net Realized Gain (Loss) for the Year | Statement of Operations Location | Net Change in Unrealized Appreciation (Depreciation) for the Year | ||||||||
| Net realized gain (loss) from: | Net change in unrealized appreciation (depreciation) on: | |||||||||||
Foreign exchange contracts | Forward exchange contracts | $138,441,749 | Forward exchange contracts | $(68,504,004 | ) | |||||||
| Futures contracts | 58,028,854 | Futures contracts | (12,957,028 | ) | ||||||||
|
|
|
|
| ||||||||
Totals | $196,470,603 | $(81,461,032 | ) | |||||||||
|
|
|
|
| ||||||||
For the year ended December 31, 2019, the average month end notional amount of futures contracts represented $1,408,222,955. The average month end contract value of forward exchange contracts was $2,158,919,843.
See Note 1(c) regarding derivative financial instruments.
12. Holdings of 5% Voting Securities of Portfolio Companies
The 1940 Act defines “affiliated companies” to include investments in portfolio companies in which a fund owns 5% or more of the outstanding voting securities. During the year ended December 31, 2019, investments in “affiliated companies” were as follows:
| Name of Issuer | Value at Beginning of Year | Purchases | Sales | Realized Gain (Loss) | Net Change in Unrealized Appreciation (Depreciation) | Value at End of Year | Number of of Year | Dividend Income | ||||||||||||||||||||||||
Non-Controlled Affiliates | ||||||||||||||||||||||||||||||||
International Automotive Components Group North America LLC (Value is —% of Net Assets) | $4,230,537 | $— | $(5,288,170 | ) | $(23,807,201 | ) | $24,864,834 | $— | a | — | $— | |||||||||||||||||||||
|
|
|
| |||||||||||||||||||||||||||||
aAs of December 31, 2019, no longer held by the Fund.
| franklintempleton.com | Annual Report | 39 | ||
FRANKLIN MUTUAL SERIES FUNDS
NOTES TO FINANCIAL STATEMENTS
Franklin Mutual Global Discovery Fund(continued)
13. Upcoming Acquisitions/Reorganization
On July 16, 2019, the Board approved a proposal to reorganize Franklin Mutual International Fund (Acquired Fund) with and into the Fund (Surviving Fund). On December 6, 2019, shareholders of the Acquired Fund approved the proposal. Upon completion of the reorganization on or about February 21, 2020, assets in the Acquired Fund will be transferred into the Surviving Fund.
14. Credit Facility
The Fund, together with other U.S. registered and foreign investment funds (collectively, Borrowers), managed by Franklin Templeton, are borrowers in a joint syndicated senior unsecured credit facility totaling $2 billion (Global Credit Facility) which matured on February 7, 2020. This Global Credit Facility provides a source of funds to the Borrowers for temporary and emergency purposes, including the ability to meet future unanticipated or unusually large redemption requests. Effective February 7, 2020, the Borrowers renewed the Global Credit Facility for a one year term, maturing February 5, 2021, for a total of $2 billion.
Under the terms of the Global Credit Facility, the Fund shall, in addition to interest charged on any borrowings made by the Fund and other costs incurred by the Fund, pay its share of fees and expenses incurred in connection with the implementation and maintenance of the Global Credit Facility, based upon its relative share of the aggregate net assets of all of the Borrowers, including an annual commitment fee of 0.15% based upon the unused portion of the Global Credit Facility. These fees are reflected in other expenses in the Statement of Operations. During the year ended December 31, 2019, the Fund did not use the Global Credit Facility.
15. Fair Value Measurements
The Fund follows a fair value hierarchy that distinguishes between market data obtained from independent sources (observable inputs) and the Fund’s own market assumptions (unobservable inputs). These inputs are used in determining the value of the Fund’s financial instruments and are summarized in the following fair value hierarchy:
| • | Level 1 – quoted prices in active markets for identical financial instruments |
| • | Level 2 – other significant observable inputs (including quoted prices for similar financial instruments, interest rates, prepayment speed, credit risk, etc.) |
| • | Level 3 – significant unobservable inputs (including the Fund’s own assumptions in determining the fair value of financial instruments) |
The input levels are not necessarily an indication of the risk or liquidity associated with financial instruments at that level.
40 | Annual Report | franklintempleton.com | ||
FRANKLIN MUTUAL SERIES FUNDS
NOTES TO FINANCIAL STATEMENTS
Franklin Mutual Global Discovery Fund(continued)
A summary of inputs used as of December 31, 2019, in valuing the Fund’s assets and liabilities carried at fair value, is as follows:
| Level 1 | Level 2 | Level 3 | Total | |||||||||||||
| ||||||||||||||||
Assets: | ||||||||||||||||
Investments in Securities:a | ||||||||||||||||
Equity Investments:b | ||||||||||||||||
Auto Components | $ | — | $ | — | $ | 138,645 | $ | 138,645 | ||||||||
Machinery | 63,724,242 | 80,570,951 | — | 144,295,193 | ||||||||||||
Media | 444,648,874 | — | 638,237 | 445,287,111 | ||||||||||||
All Other Equity Investments | 14,153,992,881 | — | — | 14,153,992,881 | ||||||||||||
Corporate Notes | — | 122,730,096 | — | 122,730,096 | ||||||||||||
Companies in Liquidation | — | — | 78,279c | 78,279 | ||||||||||||
Short Term Investments | 352,789,821 | 58,500,000 | — | 411,289,821 | ||||||||||||
|
| |||||||||||||||
Total Investments in Securities | $ | 15,015,155,818 | $ | 261,801,047 | $ | 855,161 | $ | 15,277,812,026 | ||||||||
|
| |||||||||||||||
Other Financial Instruments: | ||||||||||||||||
Forward Exchange Contracts | $ | — | $ | 1,711,088 | $ | — | $ | 1,711,088 | ||||||||
|
| |||||||||||||||
Liabilities: | ||||||||||||||||
Other Financial Instruments: | ||||||||||||||||
Securities Sold Shorta | $ | 56,724,656 | $ | — | $ | — | $ | 56,724,656 | ||||||||
Futures Contracts | 11,970,851 | — | — | 11,970,851 | ||||||||||||
Forward Exchange Contracts | — | 37,947,067 | — | 37,947,067 | ||||||||||||
|
| |||||||||||||||
Total Other Financial Instruments | $ | 68,695,507 | $ | 37,947,067 | $ | — | $ | 106,642,574 | ||||||||
|
| |||||||||||||||
aFor detailed categories, see the accompanying Statement of Investments.
bIncludes common and preferred stocks as well as other equity interests.
cIncludes securities determined to have no value at December 31, 2019.
A reconciliation of assets in which Level 3 inputs are used in determining fair value is presented when there are significant Level 3 financial instruments at the beginning and/or end of the year.
16. Subsequent Events
The Fund has evaluated subsequent events through the issuance of the financial statements and determined that no events have occurred that require disclosure other than those already disclosed in the financial statements.
Abbreviations
| Counterparty | Currency | Selected Portfolio | ||||||||||
BOFA | Bank of America Corp. | EUR | Euro | ADR | American Depositary Receipt | |||||||
HSBK | HSBC Bank PLC | GBP | British Pound | FHLB | Federal Home Loan Bank | |||||||
SSBT | State Street Bank and Trust Co., N.A. | USD | United States Dollar | |||||||||
UBSW | UBS AG | |||||||||||
| franklintempleton.com | Annual Report | 41 | ||
FRANKLIN MUTUAL SERIES FUNDS
Report of Independent Registered Public Accounting Firm
To the Board of Trustees of Franklin Mutual Series Funds and Shareholders of Franklin Mutual Global Discovery Fund:
Opinion on the Financial Statements
We have audited the accompanying statement of assets and liabilities of Franklin Mutual Global Discovery Fund (the “Fund”) (one of the funds constituting Franklin Mutual Series Funds), including the schedule of investments, as of December 31, 2019, and the related statement of operations for the year then ended, the statements of changes in net assets for each of the two years in the period then ended, the financial highlights for each of the five years in the period then ended and the related notes (collectively referred to as the “financial statements”). In our opinion, the financial statements present fairly, in all material respects, the financial position of Franklin Mutual Global Discovery Fund (one of the funds constituting Franklin Mutual Series Funds) at December 31, 2019, the results of its operations for the year then ended, the changes in its net assets for each of the two years in the period then ended and its financial highlights for each of the five years in the period then ended, in conformity with U.S. generally accepted accounting principles.
Basis for Opinion
These financial statements are the responsibility of the Fund’s management. Our responsibility is to express an opinion on the Fund’s financial statements based on our audits. We are a public accounting firm registered with the Public Company Accounting Oversight Board (United States) (“PCAOB”) and are required to be independent with respect to the Fund in accordance with the U.S. federal securities laws and the applicable rules and regulations of the Securities and Exchange Commission and the PCAOB.
We conducted our audits in accordance with the standards of the PCAOB. Those standards require that we plan and perform the audit to obtain reasonable assurance about whether the financial statements are free of material misstatement, whether due to error or fraud. The Fund is not required to have, nor were we engaged to perform, an audit of the Fund’s internal control over financial reporting. As part of our audits, we are required to obtain an understanding of internal control over financial reporting, but not for the purpose of expressing an opinion on the effectiveness of the Fund’s internal control over financial reporting. Accordingly, we express no such opinion.
Our audits included performing procedures to assess the risks of material misstatement of the financial statements, whether due to error or fraud, and performing procedures that respond to those risks. Such procedures included examining, on a test basis, evidence regarding the amounts and disclosures in the financial statements. Our procedures included confirmation of securities owned as of December 31, 2019, by correspondence with the custodian and brokers or by other appropriate auditing procedures where replies from others were not received. Our audits also included evaluating the accounting principles used and significant estimates made by management, as well as evaluating the overall presentation of the financial statements. We believe that our audits provide a reasonable basis for our opinion.

We have served as the auditor of one or more Franklin investment companies since 1987.
Boston, Massachusetts
February 21, 2020
42 | Annual Report | franklintempleton.com | ||
FRANKLIN MUTUAL SERIES FUNDS
Franklin Mutual Global Discovery Fund
Under Section 852(b)(3)(C) of the Internal Revenue Code, the Fund hereby reports the maximum amount allowable but no less than $778,210,889 as a long term capital gain dividend for the fiscal year ended December 31, 2019.
Under Section 871(k)(2)(C) of the Internal Revenue Code, the Fund hereby reports the maximum amount allowable but no less than $51,805,373 as a short term capital gain dividend for purposes of the tax imposed under Section 871(a)(1)(A) of the Internal Revenue Code for the fiscal year ended December 31, 2019.
Under Section 854(b)(1)(A) of the Internal Revenue Code, the Fund hereby reports 49.26% of the ordinary income dividends as income qualifying for the dividends received deduction for the fiscal year ended December 31, 2019.
Under Section 854(b)(1)(B) of the Internal Revenue Code, the Fund hereby reports the maximum amount allowable but no less than $402,701,435 as qualified dividends for purposes of the maximum rate under Section 1(h)(11) of the Internal Revenue Code for the fiscal year ended December 31, 2019. Distributions, including qualified dividend income, paid during calendar year 2019 will be reported to shareholders on Form1099-DIV bymid-February 2020. Shareholders are advised to check with their tax advisors for information on the treatment of these amounts on their individual income tax returns.
Under Section 871(k)(1)(C) of the Internal Revenue Code, the Fund hereby reports the maximum amount allowable but no less than $29,006,943 as interest related dividends for purposes of the tax imposed under Section 871(a)(1)(A) of the Internal Revenue Code for the fiscal year ended December 31, 2019.
| franklintempleton.com | Annual Report | 43 | ||
FRANKLIN MUTUAL SERIES FUNDS
The name, year of birth and address of the officers and board members, as well as their affiliations, positions held with the Trust, principal occupations during at least the past five years and number of U.S. registered portfolios overseen in the Franklin Templeton fund complex, are shown below. Generally, each board member serves until that person’s successor is elected and qualified.
Independent Board Members
Name, Year of Birth and Address | Position | Length of Time Served | Number of Portfolios in by Board Member* | Other Directorships Held During at Least the Past 5 Years | ||||
Edward I. Altman, Ph.D. (1941) 101 John F. Kennedy Parkway Short Hills, NJ 07078-2716 |
Trustee |
Since 1987 |
12 |
None | ||||
| Principal Occupation During at Least the Past 5 Years: | ||||||||
| Max L. Heine Professor of Finance, Emeritus and Director of The Credit and Debt Markets Research Program, Salomon Center, Stern School of Business, New York University; editor and author of numerous financial publications; financial consultant; an adviser to numerous financial and publishing organizations; and formerly, Vice Director, Salomon Center, Stern School of Business, New York University. | ||||||||
Ann Torre Bates (1958) 101 John F. Kennedy Parkway Short Hills, NJ 07078-2716 | Trustee and Chairperson | Trustee since 1995 and Chairperson since January 2020 | 33 | Ares Capital Corporation (specialty finance company) (2010-present), United Natural Foods, Inc. (distributor of natural, organic and specialty foods) (2013-present), Allied Capital Corporation (financial services) (2003-2010), SLM Corporation (Sallie Mae) (1997-2014) and Navient Corporation (loan management, servicing and asset recovery) (2014-2016). | ||||
| Principal Occupation During at Least the Past 5 Years: | ||||||||
| Director of various companies; andformerly, Executive Vice President and Chief Financial Officer, NHP Incorporated (manager of multifamily housing) (1995-1997); and Vice President and Treasurer, US Airways, Inc. (until 1995). | ||||||||
Burton J. Greenwald (1929) 101 John F. Kennedy Parkway Short Hills, NJ 07078-2716 | Trustee | Since 2002 | 12 | Franklin Templeton Emerging Markets Debt Opportunities Fund PLC (1999-present) and Fiduciary International Ireland Limited (1999-2015). | ||||
| Principal Occupation During at Least the Past 5 Years: | ||||||||
| Managing Director, B.J. Greenwald Associates (management consultants to the financial services industry); and formerly, Chairman, Fiduciary Trust International Funds; Executive Vice President, L.F. Rothschild Fund Management, Inc.; President and Director, Merit Mutual Funds; President, Underwriting Division and Director, National Securities & Research Corporation; Governor, Investment Company Institute; and Chairman, ICI Public Information Committee. | ||||||||
Jan Hopkins Trachtman (1947) 101 John F. Kennedy Parkway Short Hills, NJ 07078-2716 | Trustee | Since 2009 | 12 | FinTech Acquisition Corp. III (special purpose fintech acquisition company) (2018-present) | ||||
| Principal Occupation During at Least the Past 5 Years: | ||||||||
| President and Founder, The Jan Hopkins Group (communications consulting firm); serves on Alumni Advisory Board of Knight Bagehot Fellowship; andformerly, President, Economic Club of New York (2007-2015); Anchor/Correspondent, CNN Financial News (until 2003); Managing Director and Head of Client Communications, Citigroup Private Bank (until 2005);Off-Air reporter, ABC News’ World News Tonight; and Editor, CBS Network News. | ||||||||
44 | Annual Report | franklintempleton.com | ||
FRANKLIN MUTUAL SERIES FUNDS
Independent Board Members(continued)
Name, Year of Birth and Address | Position | Length of Time Served | Number of Portfolios in Fund Complex Overseen by Board Member* | Other Directorships Held During at Least the Past 5 Years | ||||
Keith Mitchell (1954) 101 John F. Kennedy Parkway Short Hills, NJ 07078-2716 | Trustee | Since 2009 | 12 | None | ||||
| Principal Occupation During at Least the Past 5 Years: | ||||||||
| Director of various boards of asset management firms; andformerly, Managing Member, Mitchell, Hartley & Bechtel Advisers, LLC (formerly, Mitchell Advisers, LLC) (advisory firm) (2003-2015) and Managing Director, Putman Lovell NBF. | ||||||||
David W. Niemiec (1949) c/o Franklin Mutual Advisers, LLC 101 John F. Kennedy Parkway Short Hills, NJ 07078-2716 | Trustee | Since 2015 | 33 | Hess Midstream LP (oil and gas midstream infrastructure) (2017-present). | ||||
| Principal Occupation During at Least the Past 5 Years: | ||||||||
| Advisor, Saratoga Partners (private equity fund); andformerly, Managing Director, Saratoga Partners (1998-2001) and SBC Warburg Dillon Read (investment banking) (1997-1998); Vice Chairman, Dillon, Read & Co. Inc. (investment banking) (1991-1997); and Chief Financial Officer, Dillon, Read & Co. Inc. (1982-1997). | ||||||||
Charles Rubens II (1930) c/o Franklin Mutual Advisers, LLC 101 John F. Kennedy Parkway Short Hills, NJ 07078-2716 | Trustee | Since 1998 | 12 | None | ||||
| Principal Occupation During at Least the Past 5 Years: | ||||||||
| Private investor and president ofnon-profit organizations; andformerly, an executive of Time, Inc.; and Trustee of Colorado College. | ||||||||
Robert E. Wade (1946) c/o Franklin Mutual Advisers, LLC 101 John F. Kennedy Parkway Short Hills, NJ 07078-2716 | Trustee | Since 1991 | 33 | El Oro Ltd (investments) (2003-2019). | ||||
| Principal Occupation During at Least the Past 5 Years: | ||||||||
| Attorney at law engaged in private practice as a sole practitioner (1972-2008) and member of various boards. | ||||||||
Gregory H. Williams (1943) c/o Franklin Mutual Advisers, LLC 101 John F. Kennedy Parkway Short Hills, NJ 07078-2716 | Trustee | Since 2015 | 12 | None | ||||
| Principal Occupation During at Least the Past 5 Years: | ||||||||
| Private investor; Consultant; andformerly, President, University of Cincinnati (2009-2012); President, The City College of New York (2001-2009); Dean, College of Law, Ohio State University (1993-2001); and Associate Vice President, Academic Affairs and Professor of Law, University of Iowa (1977-1993). | ||||||||
| Interested Board Members and Officers | ||||||||
Name, Year of Birth and Address | Position | Length of Time Served | Number of Portfolios in by Board Member* | Other Directorships Held During at Least the Past 5 Years | ||||
**Gregory E. Johnson (1961) One Franklin Parkway San Mateo, CA 94403-1906 | Trustee | Since 2007 | 144 | None | ||||
| Principal Occupation During at Least the Past 5 Years: | ||||||||
| Chairman of the Board, Member – Office of the Chairman, Director and Chief Executive Officer, Franklin Resources, Inc.; officer and/or director or trustee, as the case may be, of some of the other subsidiaries of Franklin Resources, Inc. and of 39 of the investment companies in Franklin Templeton; Vice Chairman, Investment Company Institute; andformerly, President, Franklin Resources, Inc. (1994-2015). | ||||||||
| franklintempleton.com | Annual Report | 45 | ||
FRANKLIN MUTUAL SERIES FUNDS
Interested Board Members and Officers(continued)
Name, Year of Birth and Address | Position | Length of Time Served | Number of Portfolios in Fund Complex Overseen by Board Member* | Other Directorships Held During at Least the Past 5 Years | ||||
**Peter A. Langerman (1955) c/o Franklin Mutual Advisers, LLC 101 John F. Kennedy Parkway Short Hills, NJ 07078-2716 | Trustee, President, and Chief Executive Officer – Investment Management | Trustee since 2007, President, and Chief Executive Officer – Investment Management since 2005 | 7 | None | ||||
| Principal Occupation During at Least the Past 5 Years: | ||||||||
| Chairman of the Board, Chief Executive Officer and President, Franklin Mutual Advisers, LLC; and officer and/or director, as the case may be, of three of the investment companies in Franklin Templeton. | ||||||||
Alison E. Baur (1964) One Franklin Parkway San Mateo, CA 94403-1906 | Vice President | Since 2012 | Not Applicable | Not Applicable | ||||
| Principal Occupation During at Least the Past 5 Years: | ||||||||
| Deputy General Counsel, Franklin Templeton; and officer of some of the other subsidiaries of Franklin Resources, Inc. and of 41 of the investment companies in Franklin Templeton. | ||||||||
Breda M. Beckerle (1958) 280 Park Avenue New York, NY 10017 | Interim Chief Compliance Officer | Since January 2020 | Not Applicable | Not Applicable | ||||
| Principal Occupation During at Least the Past 5 Years: | ||||||||
| Chief Compliance Officer, Fiduciary Investment Management International, Inc., Franklin Advisers, Inc., Franklin Advisory Services, LLC, Franklin Mutual Advisers, LLC, Franklin Templeton Institutional, LLC; and officer of 41 of the investment companies in Franklin Templeton. | ||||||||
Steven J. Gray (1955) One Franklin Parkway San Mateo, CA 94403-1906 | Vice President and Secretary | Vice President since 2009 and Secretary since 2005 | Not Applicable | Not Applicable | ||||
| Principal Occupation During at Least the Past 5 Years: | ||||||||
| Senior Associate General Counsel, Franklin Templeton; Vice President, Franklin Templeton Distributors, Inc. and FASA, LLC; and officer of 41 of the investment companies in Franklin Templeton. | ||||||||
Matthew T. Hinkle (1971) One Franklin Parkway San Mateo, CA 94403-1906 | Chief Executive Officer – Finance and Administration | Since 2017 | Not Applicable | Not Applicable | ||||
| Principal Occupation During at Least the Past 5 Years: | ||||||||
| Senior Vice President, Franklin Templeton Services, LLC; officer of 41 of the investment companies in Franklin Templeton; and formerly, Vice President, Global Tax (2012-April 2017) and Treasurer/Assistant Treasurer, Franklin Templeton (2009-2017). | ||||||||
Robert G. Kubilis (1973) 300 S.E. 2nd Street Fort Lauderdale, FL 33301-1923 | Chief Financial Officer, Chief Accounting Officer and Treasurer | Since 2012 | Not Applicable | Not Applicable | ||||
| Principal Occupation During at Least the Past 5 Years: | ||||||||
| Treasurer, U.S. Fund Administration & Reporting; and officer of 15 of the investment companies in Franklin Templeton. | ||||||||
46 | Annual Report | franklintempleton.com | ||
FRANKLIN MUTUAL SERIES FUNDS
Interested Board Members and Officers(continued)
Name, Year of Birth and Address | Position | Length of Time Served | Number of Portfolios in Fund Complex Overseen by Board Member* | Other Directorships Held During at Least the Past 5 Years | ||||
Robert Lim (1948) One Franklin Parkway San Mateo, CA 94403-1906 | Vice President – AML Compliance | Since 2016 | Not Applicable | Not Applicable | ||||
| Principal Occupation During at Least the Past 5 Years: | ||||||||
| Vice President, Franklin Templeton Companies, LLC; Chief Compliance Officer, Franklin Templeton Distributors, Inc. and Franklin Templeton Investor Services, LLC; and officer of 44 of the investment companies in Franklin Templeton Investments. | ||||||||
Navid J. Tofigh (1972) One Franklin Parkway San Mateo, CA 94403-1906 | Vice President | Since 2015 | Not Applicable | Not Applicable | ||||
| Principal Occupation During at Least the Past 5 Years: | ||||||||
| Associate General Counsel; and officer of 41 of the investment companies in Franklin Templeton. | ||||||||
Craig S. Tyle (1960) One Franklin Parkway San Mateo, CA 94403-1906 | Vice President | Since 2005 | Not Applicable | Not Applicable | ||||
| Principal Occupation During at Least the Past 5 Years: | ||||||||
| General Counsel and Executive Vice President, Franklin Resources, Inc.; and officer of some of the other subsidiaries of Franklin Resources, Inc. and of 41 of the investment companies in Franklin Templeton. | ||||||||
Lori A. Weber (1964) 300 S.E. 2nd Street Fort Lauderdale, FL 33301-1923 | Vice President | Since 2011 | Not Applicable | Not Applicable | ||||
| Principal Occupation During at Least the Past 5 Years: | ||||||||
| Senior Associate General Counsel, Franklin Templeton; Assistant Secretary, Franklin Resources, Inc.; Vice President and Secretary, Templeton Investment Counsel, LLC; and officer of 41 of the investment companies in Franklin Templeton. | ||||||||
| franklintempleton.com | Annual Report | 47 | ||
FRANKLIN MUTUAL SERIES FUNDS
*We base the number of portfolios on each separate series of the U.S. registered investment companies within the Franklin Templeton fund complex. These portfolios have a common investment manager or affiliated investment managers.
**Gregory E. Johnson is considered to be an interested person of the Fund under the federal securities laws due to his position as an officer and director of Franklin Resources, Inc. (Resources), which is the parent company of the Fund’s investment manager and distributor. Peter A. Langerman is considered to be an interested person of the Fund under the federal securities laws due to his position as an officer of Franklin Mutual Advisers, LLC, which is the Fund’s investment manager.
Note 1: Officer information is current as of the date of this report. It is possible that after this date, information about officers may change.
The Sarbanes-Oxley Act of 2002 and Rules adopted by the U.S. Securities and Exchange Commission require the Fund to disclose whether the Fund’s Audit Committee includes at least one member who is an audit committee financial expert within the meaning of such Act and Rules. The Fund’s Board has determined that there is at least one such financial expert on the Audit Committee and has designated each of Edward I. Altman, Ph.D., Ann Torre Bates and David W. Niemiec as an audit committee financial expert. The Board believes that Messrs. Altman and Niemiec and Ms. Bates qualify as such an expert in view of their extensive business background and experience. Mr. Altman has served as a member of the Fund Audit Committee since 1987. He currently serves as a Max L. Hine Professor of Finance, Emeritus and Director of The Credit and Debt Markets Research Program, Salomon Center, Stern School of Business, New York University. Ms. Bates has served as a member of the Fund Audit Committee since 1995. She currently serves as a director of Ares Capital Corporation (2010-present) and United Natural Foods, Inc. (2013-present) and was formerly a director of Navient Corporation from 2014 to 2016, SLM Corporation from 1997 to 2014 and Allied Capital Corporation from 2003 to 2010, Executive Vice President and Chief Financial Officer of NHP Incorporated from 1995 to 1997 and Vice President and Treasurer of US Airways, Inc. until 1995. Mr. Niemiec has served as a member of the Fund Audit Committee since 2015, currently serves as an Advisor to Saratoga Partners and was formerly its Managing Director from 1998 to 2001 and serves as a director of Hess Midstream LP (2017-present). Mr. Niemiec was formerly a director of Emeritus Corporation from 1999 to 2010 and OSI Pharmaceuticals, Inc. from 2006 to 2010, Managing Director of SBC Warburg Dillon Read from 1997 to 1998, and was Vice Chairman from 1991 to 1997 and Chief Financial Officer from 1982 to 1997 of Dillon, Read & Co. Inc. As a result of such background and experience, the Board believes that Messrs. Altman and Niemiec and Ms. Bates have each acquired an understanding of generally accepted accounting principles and financial statements, the general application of such principles in connection with the accounting estimates, accruals and reserves, and analyzing and evaluating financial statements that present a breadth and level of complexity of accounting issues generally comparable to those of the Fund, as well as an understanding of internal controls and procedures for financial reporting and an understanding of audit committee functions. Messrs. Altman and Niemiec and Ms. Bates are independent Board members as that term is defined under the applicable U.S. Securities and Exchange Commission Rules and Releases.
The Statement of Additional Information (SAI) includes additional information about the board members and is available, without charge, upon request. Shareholders may call (800) DIALBEN/342-5236 to request the SAI.
48 | Annual Report | franklintempleton.com | ||
FRANKLIN MUTUAL SERIES FUNDS
FRANKLIN MUTUAL GLOBAL DISCOVERY FUND
Proxy Voting Policies and Procedures
The Fund’s investment manager has established Proxy Voting Policies and Procedures (Policies) that the Fund uses to determine how to vote proxies relating to portfolio securities. Shareholders may view the Fund’s complete Policies online at franklintempleton.com. Alternatively, shareholders may request copies of the Policies free of charge by calling the Proxy Group collect at (954)527-7678 or by sending a written request to: Franklin Templeton Companies, LLC, 300 S.E. 2nd Street, Fort Lauderdale, FL 33301, Attention: Proxy Group. Copies of the Fund’s proxy voting records are also made available online at franklintempleton.com and posted on the U.S. Securities and Exchange Commission’s website at sec.gov and reflect the most recent12-month period ended June 30.
Quarterly Statement of Investments
The Trust, on behalf of the Fund, files a complete statement of investments with the U.S. Securities and Exchange Commission for the first and third quarters for each fiscal year as an exhibit to its report on FormN-PORT. Shareholders may view the filed FormN-PORT by visiting the Commission’s website at sec.gov. The filed form may also be viewed and copied at the Commission’s Public Reference Room in Washington, DC. Information regarding the operations of the Public Reference Room may be obtained by calling(800) SEC-0330.
Householding of Reports and Prospectuses
You will receive the Fund’s financial reports every six months as well as an annual updated summary prospectus (prospectus available upon request). To reduce Fund expenses, we try to identify related shareholders in a household and send only one copy of the financial reports and summary prospectus. This process, called “householding,” will continue indefinitely unless you instruct us otherwise. If you prefer not to have these documents householded, please call us at (800)632-2301. At any time you may view current prospectuses/summary prospectuses and financial reports on our website. If you choose, you may receive these documents through electronic delivery.
| franklintempleton.com | Annual Report | 49 | ||
This page intentionally left blank.
This page intentionally left blank.
This page intentionally left blank.
Authorized for distribution only when accompanied or preceded by a summary prospectus and/or prospectus. Investors should carefully consider a fund’s investment goals, risks, charges and expenses before investing. A prospectus contains this and other information; please read it carefully before investing.
To help ensure we provide you with quality service, all calls to and from our service areas are monitored and/or recorded.
| | Annual Report and Shareholder Letter Franklin Mutual Global Discovery Fund | |||||
| Investment Manager | Distributor | Shareholder Services | ||||
| Franklin Mutual Advisers, LLC | Franklin Templeton Distributors, Inc. | (800) 632-2301 - (Class A, C, R & | ||||
| (800) DIAL BEN®/342-5236 | R6) | |||||
| franklintempleton.com | (800)448-FUND - (Class Z) | |||||
| © 2020 Franklin Templeton Investments. All rights reserved. | 477 A 02/20 |
Sign up for electronic delivery at franklintempleton.com/edelivery
Internet Delivery of Fund Reports Unless You Request Paper Copies: Effective January 1, 2021, as permitted by the SEC, paper copies of the Fund’s shareholder reports will no longer be sent by mail, unless you specifically request them from the Fund or your financial intermediary. Instead, the reports will be made available on a website, and you will be notified by mail each time a report is posted and provided with a website link to access the report.
If you already elected to receive shareholder reports electronically, you will not be affected by this change and you need not take any action. If you have not signed up for electronic delivery, we would encourage you to join fellow shareholders who have. You may elect to receive shareholder reports and other communications electronically from the Fund by calling (800)632-2301 or by contacting your financial intermediary.
You may elect to continue to receive paper copies of all your future shareholder reports free of charge by contacting your financial intermediary or, if you invest directly with a Fund, calling (800)632-2301 to let the Fund know of your request. Your election to receive reports in paper will apply to all funds held in your account.
FRANKLIN TEMPLETON
Successful investing begins with ambition. And achievement only comes when you reach for it. That’s why we continually strive to deliver better outcomes for investors. No matter what your goals are, our deep, global investment expertise allows us to offer solutions that can help.
During our more than 70 years of experience, we’ve managed through all kinds of markets—up, down and those in between. We’re always preparing for what may come next. It’s because of this, combined with our strength as one of the world’s largest asset managers that we’ve earned the trust of millions of investors around the world.
Dear Franklin Mutual European Fund Shareholder:
As we enter 2020, the factors that lifted stocks to record highs in 2019—accommodative central bank monetary policies and progress on a proposed trade deal between the U.S. and China—continue to be sources of optimism for growth. The near-term threat of recession has eased, with the U.S. economy showing resilience as low unemployment and moderately rising wages have encouraged consumer spending, which has supported the expansion. In contrast, business investment and exports were weak in 2019, but there are nascent signs of increasing industrial activity.
Tariffs, trade battles and geopolitical conflict may continue to dominate headlines in 2020 and account for a disproportionate source of market volatility. The U.S. and China agreed in principle to aphase-one trade agreement in late 2019. However, are-escalation of the tariff dispute between the world’s two largest economies is not out of the question, as negotiations on aphase-two trade agreement are scheduled to start after the anticipatedphase-one signing ceremony in January. There was clarity on Brexit as British voters delivered a resounding election victory to Prime Minister Boris Johnson and his Conservative Party, which should pave the way for a conclusive exit agreement. The terms of U.K. departure, however, must still be finalized. Late in the period, tensions in the Middle East were on the rise, following the death of an American contractor in Iraq in late December and a retaliatory U.S. military strike two days later.
During the period, we took advantage of market turbulence to seek out a larger number of stocks whose risk/reward profiles turned more favorable. Subsequently, we used the market appreciation to exit from or trim select positions that reached or exceeded our estimates of intrinsic value. Market volatility continues to present occasional opportunities in
individual stocks, and in certain sectors, notably those considered to be economically sensitive. We continue to focus on situations in which company-specific actions are more important than economic improvement in driving shareholder value.
Valuation is an essential factor in our analysis, and we always ask ourselves if current and potential investments represent an attractive balance of risk and reward. Amid theall-time highs reached by the Standard & Poor’s® 500 Index (S&P 500®) during the period, we maintained our focus on individual securities and the prospects for each business in the context of its valuation and the backdrop of potential political and economic risks.
We continue to adhere to abottom-up stock selection process that is disciplined, driven by rigorous fundamental analysis, and that attempts to limit downside risk. In our view, actively investing in underappreciated and misunderstood companies with identifiable catalysts for unlocking shareholder value can offer meaningful upside potential and a degree of downside protection in periods of financial market turbulence.
We recognize the important role of financial advisors in today’s markets and encourage investors to continue to seek their advice. Amid changing markets and economic conditions, we are confident investors with a well-diversified portfolio and a patient, long-term outlook will be well positioned for the years ahead.
On the following pages, the Fund’s portfolio management team reviews investment decisions that pertain to performance during the past 12 months considering the
Not FDIC Insured | May Lose Value | No Bank Guarantee |
| franklintempleton.com | Not part of the annual report | 1 | ||
economic environment and other factors. Please remember all securities markets fluctuate, as do mutual fund share prices.
We thank you for investing with Franklin Templeton, welcome your questions and comments, and look forward to continuing to serve your investment needs in the years ahead.
Sincereiy,
Peter A. Langerman
Chairman, President and Chief Executive Officer
Franklin Mutual Advisers, LLC
This letter reflects our analysis and opinions as of December 31, 2019, unless otherwise indicated. The information is not a complete analysis of every aspect of any market, country, industry, security or fund. Statements of fact are from sources considered reliable.
Contents
| ||
| Annual Report | ||
| 3 | ||
| 7 | ||
| 10 | ||
| 11 | ||
| 20 | ||
| 24 | ||
| Report of Independent Registered Public Accounting Firm | 37 | |
| 38 | ||
| 39 | ||
| 44 | ||
| Visitfranklintempleton.comfor fund updates, to access your account, or to find helpful financial planning tools. | ||
2 | Not part of the annual report | franklintempleton.com | ||
This annual report for Franklin Mutual European Fund covers the fiscal year ended December 31, 2019.
Your Fund’s Goal and Main Investments
The Fund seeks capital appreciation, which may occasionally be short term, with income as a secondary goal, by investing at least 80% of its total assets in securities of European companies that we believe are available at market prices less than their intrinsic value. The Fund invests primarily in equity securities, mainly common stocks, with a focus onmid- and large cap companies. To a lesser extent, the Fund also invests in merger arbitrage securities and the debt and equity of distressed companies. The Geographic Composition bar chart on this page lists the leading European countries where the Fund invests.
Performance Overview
The Fund’s Class Z shares posted a +22.28% cumulative total return for the 12 months ended December 31, 2019. For comparison, the Fund’s primary benchmark, the MSCI EuropeIndex-NR (Local Currency), which tracks equity performance in Europe’s developed markets, posted a +23.75% total return.1 Also for comparison, the Fund’s secondary benchmark, the MSCI EuropeIndex-NR (USD), posted a +23.77% total return.1 You can find more of the Fund’s performance data in the Performance Summary beginning on page 7.
Performance data represent past performance, which does not guarantee future results. Investment return and principal value will fluctuate, and you may have a gain or loss when you sell your shares. Current performance may differ from figures shown. For most recentmonth-end performance, go tofranklintempleton.comor call(800)342-5236.
Economic and Market Overview
Global developed and emerging market stocks, as measured by the MSCI All Country World Index (USD), posted a +27.30% total return during the 12 months ended December 31, 2019.1 Although global economic growth slowed from 2018, interest-rate cuts from many central banks and the easing of trade tensions nearperiod-end
Geographic Composition*
Based on Total Net Assets as of 12/31/19
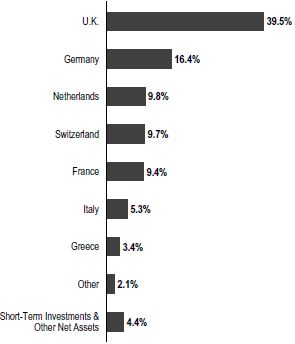
*Figures are stated as a percentage of total and may not equal 100% or may be negative due to rounding, use of any derivatives, unsettled trades or other factors.
contributed to the generally positive environment for equities worldwide. Reflecting investor optimism and slowing but resilient economic growth, stocks advanced in every major region of the globe.
Growth slowed overall in the eurozone, particularly in Germany and Italy. Germany, which is heavily reliant on exports, was adversely affected by the trade conflict between the U.S. and China and the resulting slowdown in global trade. In Italy, political uncertainty and budget concerns caused the country’s annual gross domestic product (GDP) growth to stall in 2019’s first quarter before modestly improving in the second and third quarters. Despite sluggish economic conditions, European developed market equities, as measured by the MSCI EuropeIndex-NR (Local
1. Source: Morningstar.
The index is unmanaged and includes reinvestment of any income or distributions. It does not reflect any fees, expenses or sales charges. One cannot invest directly in an index, and an index is not representative of the Fund’s portfolio. Net Returns (NR) include income net of tax withholding when dividends are paid.
The dollar value, number of shares or principal amount, and names of all portfolio holdings are listed in the Fund’s Statement of Investments (SOI).
The SOI begins on page 16.
| franklintempleton.com | Annual Report | 3 | ||
FRANKLIN MUTUAL EUROPEAN FUND
Currency), posted a +23.75% total return for the12-month period, as easing trade tensions buoyed investor optimism and an electoral victory by the Conservative Party in the U.K. alleviated uncertainty surrounding Brexit.1 Although the European Central Bank left its headline refinancing rate unchanged, it lowered the deposit rate and restarted its bond-buying stimulus program, further supporting stocks.
Investment Strategy
We follow a distinctive value investment approach that combines investments in what we believe are undervalued common stocks with, to a lesser extent, distressed debt investing and merger arbitrage. Our style aims to provide our shareholders with superior risk-adjusted results over time. We employ rigorous, fundamental analysis to find compelling situations. In our opinion, successful investing is as much about assessing risk and containing losses as it is about achieving profits. In choosing investments, we look at the market price of an individual company’s securities relative to our evaluation of its intrinsic value based on factors including book value, cash flow generation, long-term earnings potential and earnings multiples. We may invest in bankrupt or distressed companies if we believe the market overreacted to adverse developments or failed to appreciate positive changes, including restructuring. In addition, it is our practice to hedge the Fund’s currency exposure when we deem it advantageous for our shareholders.
What is meant by “hedge”?
To hedge an investment is to take a position intended to offset potential losses that may be incurred by a companion financial instrument. Hedging an investment may also offset potential gains. |
Manager’s Discussion
The end of a decade is a natural time for reflection about the years that have just passed and to look ahead to what the next 10 might have in store. Across Wall Street, we see many prognostications, and while we are not in the forecasting business, we do allow ourselves to think about investment opportunities over such an extended time period. But experience has taught us that while trying to predict the exact course of markets and/or economic and political events that will drive them may be fun, it is not all that useful.
As 2010 began, the global economy was still recovering from the Global Financial Crisis. The U.S. government owned significant portions of the banking and automotive sectors. The Fed had already started quantitative easing (QE), with QE 2 and QE 3 still to come. In Europe, concerns about
Top 10 Sectors/Industries
Based on Equity Securities as of 12/31/19
| % of Total Net Assets | ||
Insurance | 11.2% | |
Banks | 10.7% | |
Oil, Gas & Consumable Fuels | 8.7% | |
Pharmaceuticals | 6.8% | |
Diversified Telecommunication Services | 6.0% | |
Construction Materials | 5.9% | |
Trading Companies & Distributors | 5.1% | |
Machinery | 5.1% | |
Auto Components | 4.8% | |
Automobiles | 3.1% | |
Greece’s finances were emerging, and in China the effects of 2009’s massive stimulus programs were starting to take hold.
Over the subsequent years we saw ongoing, global QE, culminating in trillions of dollars of debt yielding negative interest rates. The European Union (EU) was in continuous upheaval, with Greece threatening to leave, but eventually staying in the eurozone; the U.K. pursuing and achieving Brexit; and ongoing strain between core members Germany, France, Italy and Spain. In the U.S., average annual economic growth was restrained and finished the decade below 2%, trailing the minimum 3% expectation of prior decades. Strong corporate profits and lower corporate tax rates were bright spots.
Equity markets delivered a very good decade—one of the best in history—with the MSCI EuropeIndex-NR (Local Currency) posting an average annual total return of +7.20%.1 During the decade, Franklin Mutual European Fund, Class Z posted an average annual total return of +5.89%, a solid absolute return that nonetheless lagged its benchmark above. The Fund’s value strategy, which seeks to identify mispriced securities and limit downside risk, was out of favor in an environment that generally encouraged investors to assume more risk. Conversely, in the prior decade, the Fund’s Class Z shares posted an average annual total return of +9.04%, compared with-0.45% for the MSCI EuropeIndex-NR (Local Currency).1 Our active investment approach focusing on individual opportunities was more conducive to the prior decade’s greater volatility.
In our view, going forward we expect more political and monetary uncertainty and economic growth in unexpected places. Corporate profits will have good years and bad years. Some industries will be massively disrupted, while
4 | Annual Report | franklintempleton.com | ||
FRANKLIN MUTUAL EUROPEAN FUND
others will find a way to adjust and prosper, even within the context of artificial intelligence and machine learning. Recent events, such as the coronavirus outbreak, have caused, and may continue to cause, uncertainty and volatility in the Chinese economy, potentially leading to vulnerability in 2020 global growth expectations. As for investment positioning, we intend to avoid forecasts that would lead us to make the Fund’s success dependent on a specific set of outcomes. Rather, we will seek to continue with our time-tested value process and complement it with new tools that enhance our security evaluation and selection process. To that end, we have integrated risk and quantitative portfolio analysis tools that provide us with fresh insights about performance, and help us identify companies and securities that we believe satisfy our investors’ goals of risk-adjusted returns that are not wholly dependent on any one economic or political scenario.
Fund Performance
Turning to Fund performance, top positive contributors included LafargeHolcim, BE Semiconductor and Enel. LafargeHolcim is listed among the Fund’s largest positions in the Top 10 Equity Holdings table on this page.
Investors bid up shares of Switzerland-based LafargeHolcim, the world’s largest cement maker, as the company’s management made progress implementing the long-term strategic plan it presented in 2018, including growing sales, divestments in Asia and deleveraging. LafargeHolcim intends to grow by acquiring smaller cement companies in markets that it considers attractive, primarily Europe and North America, according to the plan. Also, some of the headwinds, notably rising energy costs and poor weather conditions, which hampered performance in 2018, abated in 2019.
The share price of Netherlands-based BE Semiconductor, a producer of integrated semiconductor assembly equipment, improved as a competitive dividend yield and an announcement of a stock buyback program earlier in the period attracted investors. The stock had sold off following the company’s warning about slowing growth and order cancellations, which our analysis indicated were transitory concerns. We closed the position byperiod-end as it approached our estimate of intrinsic value.
Shares of Italy-based utility Enel rose after the company’s management reported solid first-half financial results. The company expects organic growth to accelerate over the
Top 10 Equity Holdings
12/31/19
Company Sector/Industry, Country | % of Total Net Assets | |
LafargeHolcim Ltd. Construction Materials, Switzerland | 3.9% | |
GlaxoSmithKline PLC Pharmaceuticals, U.K. | 3.8% | |
Rexel SA Trading Companies & Distributors, France | 3.6% | |
Hellenic Telecommunications Organization SA Diversified Telecommunication Services, Greece | 3.4% | |
Standard Chartered PLC Banks, U.K. | 3.3% | |
Volkswagen AG Automobiles, Germany | 3.1% | |
Royal Dutch Shell PLC Oil,Gas & Consumable Fuels, U.K. | 3.1% | |
Novartis AG Pharmaceuticals, Switzerland | 3.0% | |
Direct Line Insurance Group PLC Insurance, U.K. | 3.0% | |
Cie Generale des Etablissements Michelin SCA Auto Components, France | 3.0% | |
medium term as its investments in renewable energy sources begin to pay off. Enel also expects to benefit from operational efficiencies and reduced costs after refinancing its debt at lower interest rates.
During the period under review, Fund investments that detracted from performance included Vossloh, Allied Irish Bank Group2 and Saras.
Shares of Vossloh, a Germany-based railroad infrastructure manufacturer that supplies global rail markets, declined in April after the company announced its performance program aimed at improving profitability. The program called for a 5% workforce reduction and divestment from unprofitable businesses.
The stock of Ireland-based Allied Irish Bank Group declined after the company reported weaker-than-anticipated earnings and higher expenses. The bank has a strong capital ratio and has been reducing the number ofnon-performing loans on its balance sheet, both of which are positive for the stock, in our view.
2. Listed as AIB Group in the SOI.
See www.franklintempletondatasources.com for additional data provider information.
| franklintempleton.com | Annual Report | 5 | ||
FRANKLIN MUTUAL EUROPEAN FUND
Shares of Saras, an Italy-based, diversified energy provider, after reaching aone-year low in June 2019, were lifted through October by stronger refinery margins and earnings. However, the company’s stock sold off late in 2019 on reports of weakening margins in its oil refining segment.
During the period, the Fund held currency forwards and futures seeking to hedge most of the currency risk of the portfolio’snon-U.S. dollar investments. The hedges had a modestly positive overall impact on the Fund’s performance.
What is a currency forward? |
A currency forward is a direct agreement between the Fund and a counterparty to buy or sell a foreign currency in exchange for another currency at a specific exchange rate on a future date. |
What is a future? |
A future is an agreement between the Fund and a counterparty made through a U.S. or foreign futures exchange to buy or sell an underlying instrument or asset at a specific price on a future date. |
As fellow shareholders, we found recent relative performance disappointing, but it is not uncommon for our strategy to diverge from European equity market returns at times. We remain committed to our disciplined, value investment approach as we seek to generate attractive, long-term, risk-adjusted returns for shareholders.
Thank you for your participation in Franklin Mutual European Fund. We look forward to continuing to serve your investment needs.
 |
Katrina Dudley, CFA Co-Portfolio Manager | |
 |
Mandana Hormozi Co-Portfolio Manager | |
|
Todd Ostrow Co-Portfolio Manager
| |


The foregoing information reflects our analysis, opinions and portfolio holdings as of December 31, 2019, the end of the reporting period. The way we implement our main investment strategies and the resulting portfolio holdings may change depending on factors such as market and economic conditions. These opinions may not be relied upon as investment advice or an offer for a particular security. The information is not a complete analysis of every aspect of any market, country, industry, security or the Fund. Statements of fact are from sources considered reliable, but the investment manager makes no representation or warranty as to their completeness or accuracy. Although historical performance is no guarantee of future results, these insights may help you understand our investment management philosophy.
CFA® is a trademark owned by CFA Institute.
6 | Annual Report | franklintempleton.com | ||
FRANKLIN MUTUAL EUROPEAN FUND
Performance Summary as of December 31, 2019
The performance table and graphs do not reflect any taxes that a shareholder would pay on Fund dividends, capital gain distributions, if any, or any realized gains on the sale of Fund shares. Total return reflects reinvestment of the Fund’s dividends and capital gain distributions, if any, and any unrealized gains or losses. Your dividend income will vary depending on dividends or interest paid by securities in the Fund’s portfolio, adjusted for operating expenses of each class. Capital gain distributions are net profits realized from the sale of portfolio securities.
Performance as of 12/31/19
Cumulative total return excludes sales charges. Average annual total return includes maximum sales charges. Sales charges will vary depending on the size of the investment and the class of share purchased. The maximum is 5.50% and the minimum is 0%.Class A:5.50% maximum initial sales charge. For other share classes, visitfranklintempleton.com.
| Share Class | Cumulative Total Return1 | Average Annual Total Return2 | ||||||||||
| Z | ||||||||||||
1-Year | +22.28% | +22.28% | ||||||||||
5-Year | +23.94% | +4.39% | ||||||||||
10-Year | +77.27% | +5.89% | ||||||||||
| A3 | ||||||||||||
1-Year | +21.98% | +15.28% | ||||||||||
5-Year | +22.40% | +2.96% | ||||||||||
10-Year | +72.42% | +5.00% | ||||||||||
Performance data represent past performance, which does not guarantee future results. Investment return and principal value will fluctuate, and you may have a gain or loss when you sell your shares. Current performance may differ from figures shown. For most recentmonth-end performance, go tofranklintempleton.comor call(800)342-5236.
See page 9 for Performance Summary footnotes.
| franklintempleton.com | Annual Report | 7 | ||
FRANKLIN MUTUAL EUROPEAN FUND
PERFORMANCE SUMMARY
Total Return Index Comparison for a Hypothetical $10,000 Investment
Total return represents the change in value of an investment over the periods shown. It includes any applicable maximum sales charge, Fund expenses, account fees and reinvested distributions. The unmanaged indexes include reinvestment of any income or distributions. They differ from the Fund in composition and do not pay management fees or expenses. One cannot invest directly in an index.
Class Z(1/1/10–12/31/19)
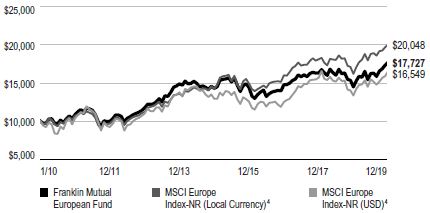
Class A(1/1/10–12/31/19)
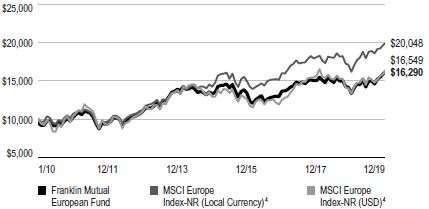
See page 9 for Performance Summary footnotes.
8 | Annual Report | franklintempleton.com | ||
FRANKLIN MUTUAL EUROPEAN FUND
PERFORMANCE SUMMARY
Distributions(1/1/19–12/31/19)
| Share Class | Net Investment Income | |||||
Z | $0.5770 | |||||
A | $0.5186 | |||||
C | $0.3306 | |||||
R | $0.4797 | |||||
R6 | $0.5973 | |||||
Total Annual Operating Expenses5
| Share Class | ||||||
Z | 1.04 | % | ||||
A | 1.29 | % | ||||
Each class of shares is available to certain eligible investors and has different annual fees and expenses, as described in the prospectus.
All investments involve risks, including possible loss of principal. Value securities may not increase in price as anticipated or may decline further in value. Special risks are associated with foreign investing, including currency fluctuations, economic instability and political developments. Because the Fund may invest its assets in companies in a specific region, including Europe, it is subject to greater risks of adverse developments in that region and/or the surrounding regions than a fund that is more broadly diversified geographically. Current political and financial uncertainty surrounding the European Union may increase market volatility and the economic risk of investing in companies in Europe. The Fund’s investments in smaller-company stocks carry an increased risk of price fluctuation, especially over the short term. The Fund’s investments in companies engaged in mergers, reorganizations or liquidations also involve special risks as pending deals may not be completed on time or on favorable terms. The Fund’s prospectus also includes a description of the main investment risks.
1. Cumulative total return represents the change in value of an investment over the periods indicated.
2. Average annual total return represents the average annual change in value of an investment over the periods indicated. Return for less than one year, if any, has not been annualized.
3. Prior to 9/10/18, these shares were offered at a higher initial sales charge of 5.75%, thus actual returns (with sales charges) would have differed. Average annual total returns (with sales charges) have been restated to reflect the current maximum initial sales charge of 5.50%.
4. Source: Morningstar. The MSCI EuropeIndex-NR (Local Currency and USD) is a market capitalization-weighted index designed to measure equity market performance of developed markets in Europe. The NR or Net Dividends Index reflects the deduction of withholding taxes on reinvested dividends.
5. Figures are as stated in the Fund’s current prospectus and may differ from the expense ratios disclosed in the Your Fund’s Expenses and Financial Highlights sections in this report. In periods of market volatility, assets may decline significantly, causing total annual Fund operating expenses to become higher than the figures shown.
See www.franklintempletondatasources.com for additional data provider information.
| franklintempleton.com | Annual Report | 9 | ||
FRANKLIN MUTUAL EUROPEAN FUND
As a Fund shareholder, you can incur two types of costs: (1) transaction costs, including sales charges (loads) on Fund purchases and redemptions; and (2) ongoing Fund costs, including management fees, distribution and service(12b-1) fees, and other Fund expenses. All mutual funds have ongoing costs, sometimes referred to as operating expenses. The table below shows ongoing costs of investing in the Fund and can help you understand these costs and compare them with those of other mutual funds. The table assumes a $1,000 investment held for the six months indicated.
Actual Fund Expenses
The table below provides information about actual account values and actual expenses in the columns under the heading “Actual.” In these columns the Fund’s actual return, which includes the effect of Fund expenses, is used to calculate the “Ending Account Value” for each class of shares. You can estimate the expenses you paid during the period by following these steps (of course, your account value and expenses will differ from those in this illustration): Divide your account value by $1,000 (if your account had an $8,600 value, then $8,600÷ $1,000 = 8.6). Then multiply the result by the number in the row for your class of shares under the headings “Actual” and “Expenses Paid During Period” (if Actual Expenses Paid During Period were $7.50, then 8.6 x $7.50 = $64.50). In this illustration, the actual expenses paid this period are $64.50.
Hypothetical Example for Comparison with Other Funds
Under the heading “Hypothetical” in the table, information is provided about hypothetical account values and hypothetical expenses based on the Fund’s actual expense ratio and an assumed rate of return of 5% per year before expenses, which is not the Fund’s actual return. This information may not be used to estimate the actual ending account balance or expenses you paid for the period, but it can help you compare ongoing costs of investing in the Fund with those of other funds. To do so, compare this 5% hypothetical example for the class of shares you hold with the 5% hypothetical examples that appear in the shareholder reports of other funds.
Please note that expenses shown in the table are meant to highlight ongoing costs and do not reflect any transactional costs. Therefore, information under the heading “Hypothetical” is useful in comparing ongoing costs only, and will not help you compare total costs of owning different funds. In addition, if transactional costs were included, your total costs would have been higher.
| Actual (actual return after expenses) | Hypothetical (5% annual return before expenses) | |||||||||||
Share Class | Beginning Account Value 7/1/19 | Ending Account Value 12/31/19 | Expenses 7/1/19–12/31/191, 2 | Ending Account Value 12/31/19 | Expenses 7/1/19–12/31/191, 2 | Net Annualized Expense Ratio2 | ||||||
|
|
|
| |||||||||
| Z | $1,000 | $1,091.70 | $ 5.38 | $1,020.06 | $ 5.19 | 1.02% | ||||||
| A | $1,000 | $1,090.50 | $ 6.69 | $1,018.80 | $ 6.46 | 1.27% | ||||||
| C | $1,000 | $1,086.40 | $10.62 | $1,015.02 | $10.26 | 2.02% | ||||||
| R | $1,000 | $1,089.80 | $ 8.01 | $1,017.54 | $ 7.73 | 1.52% | ||||||
| R6 | $1,000 | $1,092.20 | $ 4.90 | $1,020.52 | $ 4.74 | 0.93% | ||||||
1. Expenses are equal to the annualized expense ratio for thesix-month period as indicated above—in the far right column—multiplied by the simple average account value over the period indicated, and then multiplied by 184/365 to reflect theone-half year period.
2. Reflects expenses after fee waivers and expense reimbursements, for Class R6.
10 | Annual Report | franklintempleton.com | ||
FRANKLIN MUTUAL SERIES FUNDS
Franklin Mutual European Fund
Year Ended December 31, | ||||||||||||||||||||
| 2019 | 2018 | 2017 | 2016 | 2015 | ||||||||||||||||
Class Z | ||||||||||||||||||||
Per share operating performance (for a share outstanding throughout the year) | ||||||||||||||||||||
Net asset value, beginning of year | $17.89 | $20.93 | $19.20 | $19.48 | $20.86 | |||||||||||||||
Income from investment operationsa: | ||||||||||||||||||||
Net investment incomeb | 0.54 | 0.49 | 0.35 | 0.63 | c | 0.42 | ||||||||||||||
Net realized and unrealized gains (losses) | 3.46 | (2.80 | ) | 1.65 | (0.17 | ) | (0.27 | ) | ||||||||||||
Total from investment operations | 4.00 | (2.31 | ) | 2.00 | 0.46 | 0.15 | ||||||||||||||
Less distributions from: | ||||||||||||||||||||
Net investment income | (0.58 | ) | (0.73 | ) | (0.27 | ) | (0.47 | ) | (0.46 | ) | ||||||||||
Net realized gains | — | — | — | (0.27 | ) | (1.07 | ) | |||||||||||||
Total distributions | (0.58 | ) | (0.73 | ) | (0.27 | ) | (0.74 | ) | (1.53 | ) | ||||||||||
Net asset value, end of year | $21.31 | $17.89 | $20.93 | $19.20 | $19.48 | |||||||||||||||
Total return | 22.28% | (11.12)% | 10.45% | 2.40% | 0.82% | |||||||||||||||
Ratios to average net assets | ||||||||||||||||||||
Expensesd | 1.04% | e | 1.04% | e,f | 1.04% | e | 1.06% | e,f | 1.05% | |||||||||||
Expenses incurred in connection with securities sold short | —% | —% | g | —% | —% | —% | g | |||||||||||||
Net investment income | 2.77% | 2.38% | 1.75% | 3.42% | c | 1.93% | ||||||||||||||
Supplemental data | ||||||||||||||||||||
Net assets, end of year (000’s) | $789,012 | $958,149 | $1,328,622 | $1,175,972 | $1,355,780 | |||||||||||||||
Portfolio turnover rate | 12.16% | 35.42% | 17.33% | 16.43% | 32.59% | |||||||||||||||
aThe amount shown for a share outstanding throughout the period may not correlate with the Statement of Operations for the period due to the timing of sales and repurchases of the Fund’s shares in relation to income earned and/or fluctuating fair value of the investments of the Fund.
bBased on average daily shares outstanding.
cNet investment income per share includes approximately $0.17 per share related to a nonrecurring distribution. The amount, although initially recorded as dividend income, is subject to recharacterization once the issuer provides information regarding the actual composition of the distribution. Excluding this amount, the ratio of net investment income to average net assets would have been 2.50%.
dIncludes dividend and/or interest expense on securities sold short and security borrowing fees, if any. See below for the ratios of such expenses to average net assets for the periods presented. See Note 1(d).
eBenefit of expense reduction rounds to less than 0.01%.
fBenefit of waiver and payments by affiliates rounds to less than 0.01%.
gRounds to less than 0.01%.
| franklintempleton.com | The accompanying notes are an integral part of these financial statements. | Annual Report | 11 | ||
FRANKLIN MUTUAL SERIES FUNDS
FINANCIAL HIGHLIGHTS
Franklin Mutual European Fund (continued)
| Year Ended December 31, | ||||||||||||||||||||
| 2019 | 2018 | 2017 | 2016 | 2015 | ||||||||||||||||
Class A | ||||||||||||||||||||
Per share operating performance (for a share outstanding throughout the year) | ||||||||||||||||||||
Net asset value, beginning of year | $17.37 | $20.33 | $18.66 | $18.95 | $20.33 | |||||||||||||||
Income from investment operationsa: | ||||||||||||||||||||
Net investment incomeb | 0.49 | 0.41 | 0.31 | 0.57 | c | 0.35 | ||||||||||||||
Net realized and unrealized gains (losses) | 3.33 | (2.69 | ) | 1.58 | (0.18 | ) | (0.26 | ) | ||||||||||||
Total from investment operations | 3.82 | (2.28 | ) | 1.89 | 0.39 | 0.09 | ||||||||||||||
Less distributions from: | ||||||||||||||||||||
Net investment income | (0.52 | ) | (0.68 | ) | (0.22 | ) | (0.41 | ) | (0.40 | ) | ||||||||||
Net realized gains | — | — | — | (0.27 | ) | (1.07 | ) | |||||||||||||
Total distributions | (0.52 | ) | (0.68 | ) | (0.22 | ) | (0.68 | ) | (1.47 | ) | ||||||||||
Net asset value, end of year | $20.67 | $17.37 | $20.33 | $18.66 | $18.95 | |||||||||||||||
Total returnd | 21.98% | (11.29)% | 10.14% | 2.12% | 0.57% | |||||||||||||||
Ratios to average net assets | ||||||||||||||||||||
Expensese | 1.29% | f | 1.29% | f,g | 1.29% | f | 1.31% | f,g | 1.33% | |||||||||||
Expenses incurred in connection with securities sold short | —% | —% | h | —% | —% | —% | h | |||||||||||||
Net investment income | 2.52% | 2.13% | 1.50% | 3.17% | c | 1.65% | ||||||||||||||
Supplemental data | ||||||||||||||||||||
Net assets, end of year (000’s) | $512,218 | $564,038 | $714,915 | $769,297 | $1,033,307 | |||||||||||||||
Portfolio turnover rate | 12.16% | 35.42% | 17.33% | 16.43% | 32.59% | |||||||||||||||
aThe amount shown for a share outstanding throughout the period may not correlate with the Statement of Operations for the period due to the timing of sales and repurchases of the Fund’s shares in relation to income earned and/or fluctuating fair value of the investments of the Fund.
bBased on average daily shares outstanding.
cNet investment income per share includes approximately $0.17 per share related to a nonrecurring distribution. The amount, although initially recorded as dividend income, is subject to recharacterization once the issuer provides information regarding the actual composition of the distribution. Excluding this amount, the ratio of net investment income to average net assets would have been 2.25%.
dTotal return does not reflect sales commissions or contingent deferred sales charges, if applicable.
eIncludes dividend and/or interest expense on securities sold short and security borrowing fees, if any. See below for the ratios of such expenses to average net assets for the periods presented. See Note 1(d).
fBenefit of expense reduction rounds to less than 0.01%.
gBenefit of waiver and payments by affiliates rounds to less than 0.01%.
hRounds to less than 0.01%.
12 | Annual Report | The accompanying notes are an integral part of these financial statements. | franklintempleton.com | ||
FRANKLIN MUTUAL SERIES FUNDS
FINANCIAL HIGHLIGHTS
Franklin Mutual European Fund (continued)
| Year Ended December 31, | ||||||||||||||||||||
| 2019 | 2018 | 2017 | 2016 | 2015 | ||||||||||||||||
Class C | ||||||||||||||||||||
Per share operating performance (for a share outstanding throughout the year) | ||||||||||||||||||||
Net asset value, beginning of year | $17.56 | $20.38 | $18.70 | $18.97 | $20.37 | |||||||||||||||
Income from investment operationsa: | ||||||||||||||||||||
Net investment incomeb | 0.35 | 0.29 | 0.15 | 0.44 | c | 0.19 | ||||||||||||||
Net realized and unrealized gains (losses) | 3.35 | (2.72 | ) | 1.60 | (0.19 | ) | (0.25 | ) | ||||||||||||
Total from investment operations | 3.70 | (2.43 | ) | 1.75 | 0.25 | (0.06 | ) | |||||||||||||
Less distributions from: | ||||||||||||||||||||
Net investment income | (0.33 | ) | (0.39 | ) | (0.07 | ) | (0.25 | ) | (0.27 | ) | ||||||||||
Net realized gains | — | — | — | (0.27 | ) | (1.07 | ) | |||||||||||||
Total distributions | (0.33 | ) | (0.39 | ) | (0.07 | ) | (0.52 | ) | (1.34 | ) | ||||||||||
Net asset value, end of year | $20.93 | $17.56 | $20.38 | $18.70 | $18.97 | |||||||||||||||
Total returnd | 21.01% | (11.96)% | 9.37% | 1.32% | (0.16)% | |||||||||||||||
Ratios to average net assets | ||||||||||||||||||||
Expensese | 2.04% | f | 2.04% | f,g | 2.04% | f | 2.06% | f,g | 2.05% | |||||||||||
Expenses incurred in connection with securities sold short | —% | —% | h | —% | —% | —% | h | |||||||||||||
Net investment income | 1.77% | 1.38% | 0.75% | 2.42% | c | 0.93% | ||||||||||||||
Supplemental data | ||||||||||||||||||||
Net assets, end of year (000’s) | $61,743 | $78,149 | $179,123 | $209,196 | $291,752 | |||||||||||||||
Portfolio turnover rate | 12.16% | 35.42% | 17.33% | 16.43% | 32.59% | |||||||||||||||
aThe amount shown for a share outstanding throughout the period may not correlate with the Statement of Operations for the period due to the timing of sales and repurchases of the Fund’s shares in relation to income earned and/or fluctuating fair value of the investments of the Fund.
bBased on average daily shares outstanding.
cNet investment income per share includes approximately $0.17 per share related to a nonrecurring distribution. The amount, although initially recorded as dividend income, is subject to recharacterization once the issuer provides information regarding the actual composition of the distribution. Excluding this amount, the ratio of net investment income to average net assets would have been 1.50%.
dTotal return does not reflect sales commissions or contingent deferred sales charges, if applicable.
eIncludes dividend and/or interest expense on securities sold short and security borrowing fees, if any. See below for the ratios of such expenses to average net assets for the periods presented. See Note 1(d).
fBenefit of expense reduction rounds to less than 0.01%.
gBenefit of waiver and payments by affiliates rounds to less than 0.01%.
hRounds to less than 0.01%.
| franklintempleton.com | The accompanying notes are an integral part of these financial statements. | Annual Report | 13 | ||
FRANKLIN MUTUAL SERIES FUNDS
FINANCIAL HIGHLIGHTS
Franklin Mutual European Fund (continued)
| Year Ended December 31, | ||||||||||||||||||||
| 2019 | 2018 | 2017 | 2016 | 2015 | ||||||||||||||||
Class R | ||||||||||||||||||||
Per share operating performance (for a share outstanding throughout the year) | ||||||||||||||||||||
Net asset value, beginning of year | $17.05 | $19.97 | $18.35 | $18.62 | $20.04 | |||||||||||||||
Income from investment operationsa: | ||||||||||||||||||||
Net investment incomeb | 0.43 | 0.35 | 0.22 | 0.52 | c | 0.27 | ||||||||||||||
Net realized and unrealized gains (losses) | 3.27 | (2.64 | ) | 1.60 | (0.18 | ) | (0.23 | ) | ||||||||||||
Total from investment operations | 3.70 | (2.29 | ) | 1.82 | 0.34 | 0.04 | ||||||||||||||
Less distributions from: | ||||||||||||||||||||
Net investment income | (0.48 | ) | (0.63 | ) | (0.20 | ) | (0.34 | ) | (0.39 | ) | ||||||||||
Net realized gains | — | — | — | (0.27 | ) | (1.07 | ) | |||||||||||||
Total distributions | (0.48 | ) | (0.63 | ) | (0.20 | ) | (0.61 | ) | (1.46 | ) | ||||||||||
Net asset value, end of year | $20.27 | $17.05 | $19.97 | $18.35 | $18.62 | |||||||||||||||
Total return | 21.70% | (11.54)% | 9.92% | 1.86% | 0.37% | |||||||||||||||
Ratios to average net assets | ||||||||||||||||||||
Expensesd | 1.54% | e | 1.54% | e,f | 1.54% | e | 1.56% | e,f | 1.55% | |||||||||||
Expenses incurred in connection with securities sold short | —% | —% | g | —% | —% | —% | g | |||||||||||||
Net investment income | 2.27% | 1.88% | 1.25% | 2.92% | c | 1.43% | ||||||||||||||
Supplemental data | ||||||||||||||||||||
Net assets, end of year (000’s) | $733 | $731 | $821 | $626 | $997 | |||||||||||||||
Portfolio turnover rate | 12.16% | 35.42% | 17.33% | 16.43% | 32.59% | |||||||||||||||
aThe amount shown for a share outstanding throughout the period may not correlate with the Statement of Operations for the period due to the timing of sales and repurchases of the Fund’s shares in relation to income earned and/or fluctuating fair value of the investments of the Fund.
bBased on average daily shares outstanding.
cNet investment income per share includes approximately $0.17 per share related to a nonrecurring distribution. The amount, although initially recorded as dividend income, is subject to recharacterization once the issuer provides information regarding the actual composition of the distribution. Excluding this amount, the ratio of net investment income to average net assets would have been 2.00%.
dIncludes dividend and/or interest expense on securities sold short and security borrowing fees, if any. See below for the ratios of such expenses to average net assets for the periods presented. See Note 1(d).
eBenefit of expense reduction rounds to less than 0.01%.
fBenefit of waiver and payments by affiliates rounds to less than 0.01%.
gRounds to less than 0.01%.
14 | Annual Report | The accompanying notes are an integral part of these financial statements. | franklintempleton.com | ||
FRANKLIN MUTUAL SERIES FUNDS
FINANCIAL HIGHLIGHTS
Franklin Mutual European Fund (continued)
| Year Ended December 31, | ||||||||||||||||||||
| 2019 | 2018 | 2017 | 2016 | 2015 | ||||||||||||||||
Class R6 | ||||||||||||||||||||
Per share operating performance (for a share outstanding throughout the year) | ||||||||||||||||||||
Net asset value, beginning of year | $17.87 | $20.91 | $19.19 | $19.47 | $20.85 | |||||||||||||||
Income from investment operationsa: | ||||||||||||||||||||
Net investment incomeb | 0.69 | 0.56 | 0.41 | 0.66 | c | 0.46 | ||||||||||||||
Net realized and unrealized gains (losses) | 3.33 | (2.85 | ) | 1.62 | (0.17 | ) | (0.28 | ) | ||||||||||||
Total from investment operations | 4.02 | (2.29 | ) | 2.03 | 0.49 | 0.18 | ||||||||||||||
Less distributions from: | ||||||||||||||||||||
Net investment income | (0.60 | ) | (0.75 | ) | (0.31 | ) | (0.50 | ) | (0.49 | ) | ||||||||||
Net realized gains | — | — | — | (0.27 | ) | (1.07 | ) | |||||||||||||
Total distributions | (0.60 | ) | (0.75 | ) | (0.31 | ) | (0.77 | ) | (1.56 | ) | ||||||||||
Net asset value, end of year | $21.29 | $17.87 | $20.91 | $19.19 | $19.47 | |||||||||||||||
Total return | 22.35% | (10.94)% | 10.63% | 2.53% | 0.98% | |||||||||||||||
Ratios to average net assets | ||||||||||||||||||||
Expenses before waiver and payments by affiliatesd | 0.94% | 0.92% | 0.88% | 0.89% | 0.89% | |||||||||||||||
Expenses net of waiver and payments by affiliatesd | 0.93% | e | 0.91% | e | 0.88% | e | 0.89% | e,f | 0.89% | |||||||||||
Expenses incurred in connection with securities sold short | —% | —% | g | —% | —% | —% | g | |||||||||||||
Net investment income | 2.88% | 2.51% | 1.91% | 3.59% | c | 2.09% | ||||||||||||||
Supplemental data | ||||||||||||||||||||
Net assets, end of year (000’s) | $44,561 | $149,796 | $294,660 | $311,784 | $373,904 | |||||||||||||||
Portfolio turnover rate | 12.16% | 35.42% | 17.33% | 16.43% | 32.59% | |||||||||||||||
aThe amount shown for a share outstanding throughout the period may not correlate with the Statement of Operations for the period due to the timing of sales and repurchases of the Fund’s shares in relation to income earned and/or fluctuating fair value of the investments of the Fund.
bBased on average daily shares outstanding.
cNet investment income per share includes approximately $0.17 per share related to a nonrecurring distribution. The amount, although initially recorded as dividend income, is subject to recharacterization once the issuer provides information regarding the actual composition of the distribution. Excluding this amount, the ratio of net investment income to average net assets would have been 2.67%.
dIncludes dividend and/or interest expense on securities sold short and security borrowing fees, if any. See below for the ratios of such expenses to average net assets for the periods presented. See Note 1(d).
eBenefit of expense reduction rounds to less than 0.01%.
fBenefit of waiver and payments by affiliates rounds to less than 0.01%.
gRounds to less than 0.01%.
| franklintempleton.com | The accompanying notes are an integral part of these financial statements. | Annual Report | 15 | ||
FRANKLIN MUTUAL SERIES FUNDS
Statement of Investments, December 31, 2019
Franklin Mutual European Fund
| Country | Shares | Value | ||||||||||
Common Stocks 90.7% | ||||||||||||
Aerospace & Defense 2.4% | ||||||||||||
BAE Systems PLC | United Kingdom | 4,553,139 | $ | 34,059,727 | ||||||||
|
| |||||||||||
Auto Components 3.0% | ||||||||||||
Cie Generale des Etablissements Michelin SCA | France | 342,111 | 41,857,348 | |||||||||
|
| |||||||||||
Banks 10.7% | ||||||||||||
AIB Group PLC | Ireland | 3,552,062 | 12,372,627 | |||||||||
Barclays PLC | United Kingdom | 9,589,788 | 22,816,426 | |||||||||
ING Groep NV | Netherlands | 3,059,161 | 36,667,280 | |||||||||
Standard Chartered PLC | United Kingdom | 4,960,260 | 46,801,946 | |||||||||
UniCredit SpA | Italy | 2,221,742 | 32,440,275 | |||||||||
|
| |||||||||||
|
151,098,554 |
| ||||||||||
|
| |||||||||||
Capital Markets 1.2% | ||||||||||||
Deutsche Bank AG | Germany | 2,148,475 | 16,665,870 | |||||||||
|
| |||||||||||
Chemicals 2.7% | ||||||||||||
BASF SE | Germany | 497,440 | 37,571,473 | |||||||||
|
| |||||||||||
Commercial Services & Supplies 1.7% | ||||||||||||
G4S PLC | United Kingdom | 8,137,683 | 23,495,940 | |||||||||
|
| |||||||||||
Construction Materials 5.9% | ||||||||||||
HeidelbergCement AG | Germany | 389,156 | 28,349,778 | |||||||||
LafargeHolcim Ltd., B | Switzerland | 978,029 | 54,275,986 | |||||||||
|
| |||||||||||
|
82,625,764 |
| ||||||||||
|
| |||||||||||
Diversified Financial Services 0.5% | ||||||||||||
aM&G PLC | United Kingdom | 2,288,985 | 7,191,065 | |||||||||
|
| |||||||||||
Diversified Telecommunication Services 6.0% | ||||||||||||
Hellenic Telecommunications Organization SA | Greece | 3,014,871 | 48,213,447 | |||||||||
Koninklijke KPN NV | Netherlands | 12,263,002 | 36,182,416 | |||||||||
|
| |||||||||||
|
84,395,863 |
| ||||||||||
|
| |||||||||||
Electric Utilities 0.8% | ||||||||||||
Enel SpA | Italy | 1,374,926 | 10,904,393 | |||||||||
|
| |||||||||||
Energy Equipment & Services 1.0% | ||||||||||||
Tenaris SA, ADR | Italy | 635,416 | 14,385,818 | |||||||||
|
| |||||||||||
Health Care Providers & Services 1.5% | ||||||||||||
Fresenius SE and Co. KGaA | Germany | 368,256 | 20,723,371 | |||||||||
|
| |||||||||||
Hotels, Restaurants & Leisure 2.8% | ||||||||||||
Accor SA | France | 834,577 | 39,075,344 | |||||||||
|
| |||||||||||
Household Durables 1.2% | ||||||||||||
Husqvarna AB, B | Sweden | 2,085,623 | 16,705,114 | |||||||||
|
| |||||||||||
Household Products 0.8% | ||||||||||||
Reckitt Benckiser Group PLC | United Kingdom | 145,144 | 11,782,142 | |||||||||
|
| |||||||||||
Insurance 11.2% | ||||||||||||
ASR Nederland NV | Netherlands | 852,316 | 31,886,482 | |||||||||
Direct Line Insurance Group PLC | United Kingdom | 10,211,469 | 42,264,312 | |||||||||
Lancashire Holdings Ltd | United Kingdom | 1,165,903 | 11,843,862 | |||||||||
NN Group NV | Netherlands | 855,360 | 32,441,614 | |||||||||
16 | Annual Report | franklintempleton.com | ||
FRANKLIN MUTUAL SERIES FUNDS
STATEMENT OF INVESTMENTS
Franklin Mutual European Fund (continued)
| Country | Shares | Value | ||||||||||
Common Stocks(continued) | ||||||||||||
Insurance(continued) | ||||||||||||
RSA Insurance Group PLC | United Kingdom | 5,306,413 | $ | 39,750,813 | ||||||||
|
| |||||||||||
| 158,187,083 | ||||||||||||
|
| |||||||||||
Machinery 5.1% | ||||||||||||
CNH Industrial NV | United Kingdom | 2,270,191 | 24,924,417 | |||||||||
CNH Industrial NV, special voting | United Kingdom | 833,461 | 9,150,565 | |||||||||
Vossloh AG | Germany | 500,980 | 20,787,489 | |||||||||
Weir Group PLC | United Kingdom | 848,675 | 16,967,196 | |||||||||
|
| |||||||||||
| 71,829,667 | ||||||||||||
|
| |||||||||||
Oil, Gas & Consumable Fuels 8.7% | ||||||||||||
BP PLC | United Kingdom | 5,184,495 | 32,382,906 | |||||||||
aCairn Energy PLC | United Kingdom | 11,140,689 | 30,248,335 | |||||||||
Royal Dutch Shell PLC, A (EUR Traded) | United Kingdom | 370,119 | 10,860,305 | |||||||||
Royal Dutch Shell PLC, A (GBP Traded) | United Kingdom | 1,095,418 | 32,425,969 | |||||||||
Saras SpA | Italy | 10,256,302 | 16,493,768 | |||||||||
|
| |||||||||||
| 122,411,283 | ||||||||||||
|
| |||||||||||
Pharmaceuticals 6.8% | ||||||||||||
GlaxoSmithKline PLC | United Kingdom | 2,282,483 | 53,779,785 | |||||||||
Novartis AG | Switzerland | 447,966 | 42,544,386 | |||||||||
|
| |||||||||||
| 96,324,171 | ||||||||||||
|
| |||||||||||
Road & Rail 0.0% | ||||||||||||
a,b,c,dEuro Wagon LP | Jersey Islands | 16,127,149 | — | |||||||||
|
| |||||||||||
Software 2.5% | ||||||||||||
Avast PLC. | United Kingdom | 5,837,250 | 35,006,628 | |||||||||
|
| |||||||||||
Specialty Retail 2.9% | ||||||||||||
Dufry AG | Switzerland | 255,528 | 25,356,067 | |||||||||
Hornbach Holding AG & Co. KGaA | Germany | 213,786 | 15,463,895 | |||||||||
|
| |||||||||||
| 40,819,962 | ||||||||||||
|
| |||||||||||
Textiles, Apparel & Luxury Goods 1.0% | ||||||||||||
Cie Financiere Richemont SA | Switzerland | 173,203 | 13,614,241 | |||||||||
|
| |||||||||||
Tobacco 2.7% | ||||||||||||
British American Tobacco PLC | United Kingdom | 881,269 | 37,717,962 | |||||||||
|
| |||||||||||
Trading Companies & Distributors 5.1% | ||||||||||||
Kloeckner & Co. SE | Germany | 3,031,653 | 21,351,041 | |||||||||
Rexel SA | France | 3,855,030 | 51,208,581 | |||||||||
|
| |||||||||||
| 72,559,622 | ||||||||||||
|
| |||||||||||
Wireless Telecommunication Services 2.5% | ||||||||||||
Vodafone Group PLC | United Kingdom | 18,316,426 | 35,602,788 | |||||||||
|
| |||||||||||
Total Common Stocks (Cost $1,257,538,969) | 1,276,611,193 | |||||||||||
|
| |||||||||||
Preferred Stocks 4.9% | ||||||||||||
Auto Components 1.8% | ||||||||||||
eSchaeffler AG, 5.713%, pfd | Germany | 2,355,532 | 25,433,435 | |||||||||
|
| |||||||||||
| franklintempleton.com | Annual Report | 17 | ||
FRANKLIN MUTUAL SERIES FUNDS
STATEMENT OF INVESTMENTS
Franklin Mutual European Fund (continued)
| Country | Shares | Value | ||||||||||
Preferred Stocks(continued) | ||||||||||||
Automobiles 3.1% | ||||||||||||
eVolkswagen AG, 2.758%, pfd | Germany | 221,849 | $ | 43,847,201 | ||||||||
|
| |||||||||||
Total Preferred Stocks (Cost $62,346,594) | 69,280,636 | |||||||||||
|
| |||||||||||
Total Investments before Short Term Investments | 1,345,891,829 | |||||||||||
|
| |||||||||||
| Principal Amount | ||||||||||||
Short Term Investments 4.2% | ||||||||||||
U.S. Government and Agency Securities 4.2% | ||||||||||||
fFHLB, 1/02/20 | United States | $ | 28,300,000 | 28,300,000 | ||||||||
fU.S. Treasury Bill, | ||||||||||||
1/14/20 - 2/20/20 | United States | 15,000,000 | 14,983,420 | |||||||||
g1/02/20 - 5/28/20 | United States | 16,100,000 | 16,048,946 | |||||||||
|
| |||||||||||
Total U.S. Government and Agency Securities | 59,332,366 | |||||||||||
|
| |||||||||||
Total Investments (Cost $1,379,211,750) 99.8% | 1,405,224,195 | |||||||||||
Other Assets, less Liabilities 0.2% | 3,043,173 | |||||||||||
|
| |||||||||||
Net Assets 100.0% | $ | 1,408,267,368 | ||||||||||
|
| |||||||||||
aNon-income producing.
bSee Note 11 regarding holdings of 5% voting securities.
cFair valued using significant unobservable inputs. See Note 13 regarding fair value measurements.
dSee Note 9 regarding restricted securities.
eVariable rate security. The rate shown represents the yield at period end.
fThe security was issued on a discount basis with no stated coupon rate.
gA portion or all of the security has been segregated as collateral for open forward exchange contracts. At December 31, 2019, the aggregate value of these securities pledged amounted to $12,467,874, representing 0.9% of net assets.
At December 31, 2019, the Fund had the following futures contracts outstanding. See Note 1(c).
Futures Contracts
| Description | Type | Number of Contracts | Notional Amount* | Expiration Date | Value/ Unrealized Appreciation (Depreciation) | |||||||||||||||
Currency Contracts | ||||||||||||||||||||
EUR/USD | Short | 2,580 | $363,844,500 | 3/16/20 | $(3,496,695 | ) | ||||||||||||||
GBP/USD | Short | 1,900 | 157,842,500 | 3/16/20 | (1,188,506 | ) | ||||||||||||||
|
| |||||||||||||||||||
Total Futures Contracts | $(4,685,201 | ) | ||||||||||||||||||
|
| |||||||||||||||||||
*As of period end.
18 | Annual Report | franklintempleton.com | ||
FRANKLIN MUTUAL SERIES FUNDS
STATEMENT OF INVESTMENTS
Franklin Mutual European Fund (continued)
At December 31, 2019, the Fund had the following forward exchange contracts outstanding. See Note 1(c).
Forward Exchange Contracts
| Currency | Counterpartya | Type | Quantity | Contract Amount | Settlement Date | Unrealized Appreciation | Unrealized Depreciation | |||||||||||||||||||||
OTC Forward Exchange Contracts |
| |||||||||||||||||||||||||||
Swiss Franc | HSBK | Sell | 293,124 | $ | 297,176 | 1/13/20 | $ | — | $ | (6,034 | ) | |||||||||||||||||
Swiss Franc | SSBT | Sell | 4,489,599 | 4,558,130 | 1/13/20 | — | (85,953 | ) | ||||||||||||||||||||
Swiss Franc | UBSW | Sell | 48,091,670 | 48,633,356 | 1/13/20 | — | (1,113,141 | ) | ||||||||||||||||||||
Euro | BOFA | Buy | 6,331,857 | 7,057,786 | 1/15/20 | 49,910 | — | |||||||||||||||||||||
Euro | BOFA | Sell | 7,322,894 | 8,149,657 | 1/15/20 | — | (70,508 | ) | ||||||||||||||||||||
Euro | BOFA | Sell | 10,106,099 | 11,427,774 | 1/15/20 | 83,380 | — | |||||||||||||||||||||
Euro | HSBK | Buy | 2,461,274 | 2,765,389 | 1/15/20 | — | (2,536 | ) | ||||||||||||||||||||
Euro | HSBK | Buy | 9,955,315 | 11,062,400 | 1/15/20 | 112,734 | — | |||||||||||||||||||||
Euro | HSBK | Sell | 1,150,000 | 1,299,500 | 1/15/20 | 8,591 | — | |||||||||||||||||||||
Euro | HSBK | Sell | 5,999,414 | 6,706,468 | 1/15/20 | — | (28,052 | ) | ||||||||||||||||||||
Euro | SSBT | Buy | 14,546,655 | 16,212,922 | 1/15/20 | 116,128 | — | |||||||||||||||||||||
Euro | SSBT | Sell | 5,890,446 | 6,582,451 | 1/15/20 | — | (29,748 | ) | ||||||||||||||||||||
Euro | SSBT | Sell | 69,496,440 | 79,376,054 | 1/15/20 | 1,364,251 | — | |||||||||||||||||||||
Euro | UBSW | Sell | 11,971,400 | 13,365,150 | 1/15/20 | — | (73,098 | ) | ||||||||||||||||||||
Euro | UBSW | Sell | 73,851,016 | 84,353,944 | 1/15/20 | 1,454,001 | — | |||||||||||||||||||||
British Pound | HSBK | Sell | 14,381,140 | 18,183,586 | 1/16/20 | — | (872,570 | ) | ||||||||||||||||||||
British Pound | HSBK | Sell | 51,220,912 | 62,504,309 | 2/14/20 | — | (5,421,706 | ) | ||||||||||||||||||||
British Pound | SSBT | Sell | 48,750,912 | 59,382,998 | 2/14/20 | — | (5,267,454 | ) | ||||||||||||||||||||
British Pound | UBSW | Sell | 2,000,000 | 2,509,400 | 2/14/20 | — | (142,877 | ) | ||||||||||||||||||||
Euro | BOFA | Sell | 2,641,107 | 2,945,901 | 2/18/20 | — | (25,085 | ) | ||||||||||||||||||||
Euro | HSBK | Sell | 4,106,116 | 4,591,076 | 2/18/20 | — | (27,900 | ) | ||||||||||||||||||||
Euro | SSBT | Sell | 2,658,139 | 2,965,659 | 2/18/20 | — | (24,486 | ) | ||||||||||||||||||||
Euro | UBSW | Sell | 2,930,017 | 3,287,447 | 2/18/20 | — | (8,535 | ) | ||||||||||||||||||||
Swedish Krona | SSBT | Sell | 155,812,671 | 16,651,011 | 2/18/20 | — | (24,165 | ) | ||||||||||||||||||||
Euro | SSBT | Sell | 40,266,052 | 45,099,307 | 4/07/20 | — | (337,140 | ) | ||||||||||||||||||||
Euro | UBSW | Sell | 40,266,052 | 45,099,066 | 4/07/20 | — | (337,382 | ) | ||||||||||||||||||||
British Pound | BOFA | Sell | 5,134,163 | 6,648,541 | 4/24/20 | — | (172,771 | ) | ||||||||||||||||||||
British Pound | HSBK | Sell | 44,393,484 | 57,685,826 | 4/24/20 | — | (1,295,903 | ) | ||||||||||||||||||||
Euro | SSBT | Sell | 38,230,845 | 42,860,983 | 5/21/20 | — | (397,241 | ) | ||||||||||||||||||||
Euro | UBSW | Sell | 38,230,845 | 42,864,233 | 5/21/20 | — | (393,991 | ) | ||||||||||||||||||||
British Pound | BOFA | Sell | 2,725,656 | 3,660,831 | 5/22/20 | 36,843 | — | |||||||||||||||||||||
British Pound | BOFA | Sell | 21,115,377 | 27,618,891 | 5/22/20 | — | (455,775 | ) | ||||||||||||||||||||
British Pound | HSBK | Sell | 374,483 | 502,868 | 5/22/20 | 4,960 | — | |||||||||||||||||||||
British Pound | HSBK | Sell | 23,356,317 | 30,361,690 | 5/22/20 | — | (692,494 | ) | ||||||||||||||||||||
British Pound | UBSW | Sell | 2,725,656 | 3,663,260 | 5/22/20 | 39,271 | — | |||||||||||||||||||||
|
| |||||||||||||||||||||||||||
Total Forward Exchange Contracts |
| $ | 3,270,069 |
$ |
(17,306,545 |
) | ||||||||||||||||||||||
|
| |||||||||||||||||||||||||||
Net unrealized appreciation (depreciation) |
|
$ |
(14,036,476 |
) | ||||||||||||||||||||||||
|
| |||||||||||||||||||||||||||
aMay be comprised of multiple contracts with the same counterparty, currency and settlement date.
See Note 10 regarding other derivative information.
See Abbreviations on page 36.
| franklintempleton.com | The accompanying notes are an integral part of these financial statements. | Annual Report | 19 | ||
FRANKLIN MUTUAL SERIES FUNDS
Statement of Assets and Liabilities
December 31, 2019
Franklin Mutual European Fund
Assets: | ||
Investments in securities: | ||
Cost - Unaffiliated issuers | $1,372,929,241 | |
Cost - Controlled affiliates (Note 11) | 6,282,509 | |
| ||
Value - Unaffiliated issuers | $1,405,224,195 | |
Value - Controlled affiliates (Note 11) | — | |
Cash | 101,337 | |
Foreign currency, at value (cost $1,040,224) | 1,050,036 | |
Receivables: | ||
Investment securities sold | 209,439 | |
Capital shares sold | 868,056 | |
Dividends | 7,095,261 | |
European Union tax reclaims | 3,344,659 | |
Deposits with brokers for: | ||
Futures contracts | 9,653,520 | |
Unrealized appreciation on OTC forward exchange contracts | 3,270,069 | |
Other assets | 550,982 | |
| ||
Total assets | 1,431,367,554 | |
| ||
Liabilities: | ||
Payables: | ||
Capital shares redeemed | 1,184,195 | |
Management fees | 1,038,006 | |
Distribution fees | 161,600 | |
Transfer agent fees | 358,087 | |
Trustees’ fees and expenses | 135,246 | |
Variation margin on futures contracts | 2,591,761 | |
Unrealized depreciation on OTC forward exchange contracts | 17,306,545 | |
Accrued expenses and other liabilities | 324,746 | |
| ||
Total liabilities | 23,100,186 | |
| ||
Net assets, at value | $1,408,267,368 | |
| ||
Net assets consist of: | ||
Paid-in capital | $1,382,777,787 | |
Total distributable earnings (losses) | 25,489,581 | |
| ||
Net assets, at value | $1,408,267,368 | |
| ||
20 | Annual Report | The accompanying notes are an integral part of these financial statements. | franklintempleton.com | ||
FRANKLIN MUTUAL SERIES FUNDS
FINANCIAL STATEMENTS
Statement of Assets and Liabilities(continued)
December 31, 2019
Franklin Mutual European Fund
Class Z: | ||
Net assets, at value | $789,011,534 | |
| ||
Shares outstanding | 37,033,279 | |
| ||
Net asset value and maximum offering price per share | $21.31 | |
| ||
Class A: | ||
Net assets, at value | $512,217,940 | |
| ||
Shares outstanding | 24,781,732 | |
| ||
Net asset value per sharea | $20.67 | |
| ||
Maximum offering price per share (net asset value per share ÷ 94.50%) | $21.87 | |
| ||
Class C: | ||
Net assets, at value | $ 61,742,943 | |
| ||
Shares outstanding | 2,949,273 | |
| ||
Net asset value and maximum offering price per sharea | $20.93 | |
| ||
Class R: | ||
Net assets, at value | $ 733,489 | |
| ||
Shares outstanding | 36,193 | |
| ||
Net asset value and maximum offering price per share | $20.27 | |
| ||
Class R6: | ||
Net assets, at value | $ 44,561,462 | |
| ||
Shares outstanding | 2,093,536 | |
| ||
Net asset value and maximum offering price per share | $21.29 | |
|
aRedemption price is equal to net asset value less contingent deferred sales charges, if applicable.
| franklintempleton.com | The accompanying notes are an integral part of these financial statements. | Annual Report | 21 | ||
FRANKLIN MUTUAL SERIES FUNDS
FINANCIAL STATEMENTS
Statement of Operations
for the year ended December 31, 2019
Franklin Mutual European Fund
Investment income: | ||||
Dividends: (net of foreign taxes)* | ||||
Unaffiliated issuers | $ | 58,413,551 | ||
Interest: | ||||
Unaffiliated issuers | 2,094,156 | |||
|
| |||
Total investment income | 60,507,707 | |||
|
| |||
Expenses: | ||||
Management fees (Note 3a) | 13,707,046 | |||
Distribution fees: (Note 3c) | ||||
Class A | 1,408,316 | |||
Class C | 713,161 | |||
Class R | 3,551 | |||
Transfer agent fees: (Note 3e) | ||||
Class Z | 1,112,329 | |||
Class A | 755,446 | |||
Class C | 95,637 | |||
Class R | 952 | |||
Class R6 | 34,485 | |||
Custodian fees (Note 4) | 213,868 | |||
Reports to shareholders | 113,844 | |||
Registration and filing fees | 110,950 | |||
Professional fees | 171,983 | |||
Trustees’ fees and expenses | 102,639 | |||
Other | 56,917 | |||
|
| |||
Total expenses | 18,601,124 | |||
Expense reductions (Note 4) | (33,318 | ) | ||
Expenses waived/paid by affiliates (Note 3f) | (10,369 | ) | ||
|
| |||
Net expenses | 18,557,437 | |||
|
| |||
Net investment income | 41,950,270 | |||
|
| |||
Realized and unrealized gains (losses): | ||||
Net realized gain (loss) from: | ||||
Investments: | ||||
Unaffiliated issuers | (17,256,708 | ) | ||
Foreign currency transactions | (592,668 | ) | ||
Forward exchange contracts | 51,052,918 | |||
Futures contracts | 21,548,807 | |||
Securities sold short | 709,734 | |||
|
| |||
Net realized gain (loss) | 55,462,083 | |||
|
| |||
Net change in unrealized appreciation (depreciation) on: | ||||
Investments: | ||||
Unaffiliated issuers | 256,539,918 | |||
Translation of other assets and liabilities | (151,482 | ) | ||
Forward exchange contracts | (25,369,973 | ) | ||
Futures contracts | (5,063,994 | ) | ||
Securities sold short | (1,515,523 | ) | ||
|
| |||
Net change in unrealized appreciation (depreciation) | 224,438,946 | |||
|
| |||
Net realized and unrealized gain (loss) | 279,901,029 | |||
|
| |||
Net increase (decrease) in net assets resulting from operations | $ | 321,851,299 | ||
|
| |||
*Foreign taxes withheld on dividends | $ | 5,081,832 | ||
22 | Annual Report | The accompanying notes are an integral part of these financial statements. | franklintempleton.com | ||
FRANKLIN MUTUAL SERIES FUNDS
FINANCIAL STATEMENTS
Statements of Changes in Net Assets
Franklin Mutual European Fund
| Year Ended December 31, | ||||||||
| 2019 | 2018 | |||||||
| ||||||||
Increase (decrease) in net assets: | ||||||||
Operations: | ||||||||
Net investment income | $ | 41,950,270 | $ | 51,748,479 | ||||
Net realized gain (loss) | 55,462,083 | 168,364,634 | ||||||
Net change in unrealized appreciation (depreciation) | 224,438,946 | (457,535,035 | ) | |||||
|
| |||||||
Net increase (decrease) in net assets resulting from operations | 321,851,299 | (237,421,922 | ) | |||||
|
| |||||||
Distributions to shareholders: | ||||||||
Class Z | (20,967,947 | ) | (39,537,213 | ) | ||||
Class A | (12,671,231 | ) | (21,635,584 | ) | ||||
Class C | (972,882 | ) | (2,285,511 | ) | ||||
Class R | (16,815 | ) | (26,901 | ) | ||||
Class R6 | (1,222,857 | ) | (6,073,341 | ) | ||||
|
| |||||||
Total distributions to shareholders | (35,851,732 | ) | (69,558,550 | ) | ||||
|
| |||||||
Capital share transactions: (Note 2) | ||||||||
Class Z | (321,483,450 | ) | (197,936,001 | ) | ||||
Class A | (150,432,479 | ) | (56,127,793 | ) | ||||
Class C | (29,238,553 | ) | (84,206,336 | ) | ||||
Class R | (117,087 | ) | 38,579 | |||||
Class R6 | (127,323,705 | ) | (122,065,613 | ) | ||||
|
| |||||||
Total capital share transactions | (628,595,274 | ) | (460,297,164 | ) | ||||
|
| |||||||
Net increase (decrease) in net assets | (342,595,707 | ) | (767,277,636 | ) | ||||
Net assets: | ||||||||
Beginning of year | 1,750,863,075 | 2,518,140,711 | ||||||
|
| |||||||
End of year | $ | 1,408,267,368 | $ | 1,750,863,075 | ||||
|
| |||||||
| franklintempleton.com | The accompanying notes are an integral part of these financial statements. | Annual Report | 23 | ||
FRANKLIN MUTUAL SERIES FUNDS
Franklin Mutual European Fund
1. Organization and Significant Accounting Policies
Franklin Mutual Series Funds (Trust) is registered under the Investment Company Act of 1940 (1940 Act) as anopen-end management investment company, consisting of seven separate funds and applies the specialized accounting and reporting guidance in U.S. Generally Accepted Accounting Principles (U.S. GAAP). Franklin Mutual European Fund (Fund) is included in this report. The Fund offers five classes of shares: Class Z, Class A, Class C, Class R and Class R6. Class C shares automatically convert to Class A shares after they have been held for 10 years. Each class of shares may differ by its initial sales load, contingent deferred sales charges, voting rights on matters affecting a single class, its exchange privilege and fees due to differing arrangements for distribution and transfer agent fees.
The following summarizes the Fund’s significant accounting policies.
a. Financial Instrument Valuation
The Fund’s investments in financial instruments are carried at fair value daily. Fair value is the price that would be received to sell an asset or paid to transfer a liability in an orderly transaction between market participants on the measurement date. The Fund calculates the net asset value (NAV) per share each business day as of 4 p.m. Eastern time or the regularly scheduled close of the New York Stock Exchange (NYSE), whichever is earlier. Under compliance policies and procedures approved by the Trust’s Board of Trustees (the Board), the Fund’s administrator has responsibility for oversight of valuation, including leading the cross-functional Valuation Committee (VC). The Fund may utilize independent pricing services, quotations from securities and financial instrument dealers, and other market sources to determine fair value.
Equity securities and derivative financial instruments listed on an exchange or on the NASDAQ National Market System are valued at the last quoted sale price or the official closing price of the day, respectively. Foreign equity securities are valued as of the close of trading on the foreign stock exchange on which the security is primarily traded, or as of 4 p.m. Eastern time. The value is then converted into its U.S. dollar equivalent at the foreign exchange rate in effect at 4 p.m. Eastern time on the day that the value of the security is determined.Over-the-counter (OTC) securities are valued within the range of the most recent quoted bid and ask prices. Securities that trade in multiple markets or on multiple
exchanges are valued according to the broadest and most representative market. Certain equity securities are valued based upon fundamental characteristics or relationships to similar securities.
Debt securities generally trade in the OTC market rather than on a securities exchange. The Fund’s pricing services use multiple valuation techniques to determine fair value. In instances where sufficient market activity exists, the pricing services may utilize a market-based approach through which quotes from market makers are used to determine fair value. In instances where sufficient market activity may not exist or is limited, the pricing services also utilize proprietary valuation models which may consider market characteristics such as benchmark yield curves, credit spreads, estimated default rates, anticipated market interest rate volatility, coupon rates, anticipated timing of principal repayments, underlying collateral, and other unique security features in order to estimate the relevant cash flows, which are then discounted to calculate the fair value.
Certain derivative financial instruments trade in the OTC market. The Fund’s pricing services use various techniques including industry standard option pricing models and proprietary discounted cash flow models to determine the fair value of those instruments. The Fund’s net benefit or obligation under the derivative contract, as measured by the fair value of the contract, is included in net assets.
The Fund has procedures to determine the fair value of financial instruments for which market prices are not reliable or readily available. Under these procedures, the Fund primarily employs a market-based approach which may use related or comparable assets or liabilities, recent transactions, market multiples, book values, and other relevant information for the investment to determine the fair value of the investment. An income-based valuation approach may also be used in which the anticipated future cash flows of the investment are discounted to calculate fair value. Discounts may also be applied due to the nature or duration of any restrictions on the disposition of the investments. Due to the inherent uncertainty of valuations of such investments, the fair values may differ significantly from the values that would have been used had an active market existed.
Trading in securities on foreign securities stock exchanges and OTC markets may be completed before 4 p.m. Eastern time. In addition, trading in certain foreign markets may not take place on every Fund’s business day. Occasionally,
24 | Annual Report | franklintempleton.com | ||
FRANKLIN MUTUAL SERIES FUNDS
NOTES TO FINANCIAL STATEMENTS
Franklin Mutual European Fund(continued)
events occur between the time at which trading in a foreign security is completed and 4 p.m. Eastern time that might call into question the reliability of the value of a portfolio security held by the Fund. As a result, differences may arise between the value of the Fund’s portfolio securities as determined at the foreign market close and the latest indications of value at 4 p.m. Eastern time. In order to minimize the potential for these differences, the VC monitors price movements following the close of trading in foreign stock markets through a series of country specific market proxies (such as baskets of American Depositary Receipts, futures contracts and exchange traded funds). These price movements are measured against established trigger thresholds for each specific market proxy to assist in determining if an event has occurred that may call into question the reliability of the values of the foreign securities held by the Fund. If such an event occurs, the securities may be valued using fair value procedures, which may include the use of independent pricing services.
When the last day of the reporting period is anon-business day, certain foreign markets may be open on those days that the Fund’s NAV is not calculated, which could result in differences between the value of the Fund’s portfolio securities on the last business day and the last calendar day of the reporting period. Any significant security valuation changes due to an open foreign market are adjusted and reflected by the Fund for financial reporting purposes.
b. Foreign Currency Translation
Portfolio securities and other assets and liabilities denominated in foreign currencies are translated into U.S. dollars based on the exchange rate of such currencies against U.S. dollars on the date of valuation. The Fund may enter into foreign currency exchange contracts to facilitate transactions denominated in a foreign currency. Purchases and sales of securities, income and expense items denominated in foreign currencies are translated into U.S. dollars at the exchange rate in effect on the transaction date. Portfolio securities and assets and liabilities denominated in foreign currencies contain risks that those currencies will decline in value relative to the U.S. dollar. Occasionally, events may impact the availability or reliability of foreign exchange rates used to convert the U.S. dollar equivalent value. If such an event occurs, the foreign exchange rate will be valued at fair value using procedures established and approved by the Board.
The Fund does not separately report the effect of changes in foreign exchange rates from changes in market prices on securities held. Such changes are included in net realized and unrealized gain or loss from investments in the Statement of Operations.
Realized foreign exchange gains or losses arise from sales of foreign currencies, currency gains or losses realized between the trade and settlement dates on securities transactions and the difference between the recorded amounts of dividends, interest, and foreign withholding taxes and the U.S. dollar equivalent of the amounts actually received or paid. Net unrealized foreign exchange gains and losses arise from changes in foreign exchange rates on foreign denominated assets and liabilities other than investments in securities held at the end of the reporting period.
c. Derivative Financial Instruments
The Fund invested in derivative financial instruments in order to manage risk or gain exposure to various other investments or markets. Derivatives are financial contracts based on an underlying or notional amount, require no initial investment or an initial net investment that is smaller than would normally be required to have a similar response to changes in market factors, and require or permit net settlement. Derivatives contain various risks including the potential inability of the counterparty to fulfill their obligations under the terms of the contract, the potential for an illiquid secondary market, and/or the potential for market movements which expose the Fund to gains or losses in excess of the amounts shown in the Statement of Assets and Liabilities. Realized gain and loss and unrealized appreciation and depreciation on these contracts for the period are included in the Statement of Operations.
Derivative counterparty credit risk is managed through a formal evaluation of the creditworthiness of all potential counterparties. The Fund attempts to reduce its exposure to counterparty credit risk on OTC derivatives, whenever possible, by entering into International Swaps and Derivatives Association (ISDA) master agreements with certain counterparties. These agreements contain various provisions, including but not limited to collateral requirements, events of default, or early termination. Termination events applicable to the counterparty include certain deteriorations in the credit quality of the counterparty. Termination events applicable to the Fund include failure of the Fund to maintain certain net asset levels and/or limit the decline in net assets over various
| franklintempleton.com | Annual Report | 25 | ||
FRANKLIN MUTUAL SERIES FUNDS
NOTES TO FINANCIAL STATEMENTS
Franklin Mutual European Fund(continued)
1. Organization and Significant Accounting Policies (continued)
c. Derivative Financial Instruments(continued)
periods of time. In the event of default or early termination, the ISDA master agreement gives thenon-defaulting party the right to net andclose-out all transactions traded, whether or not arising under the ISDA agreement, to one net amount payable by one counterparty to the other. However, absent an event of default or early termination, OTC derivative assets and liabilities are presented gross and not offset in the Statement of Assets and Liabilities. Early termination by the counterparty may result in an immediate payment by the Fund of any net liability owed to that counterparty under the ISDA agreement.
Collateral requirements differ by type of derivative. Collateral or initial margin requirements are set by the broker or exchange clearing house for exchange traded and centrally cleared derivatives. Initial margin deposited is held at the exchange and can be in the form of cash and/or securities. For OTC derivatives traded under an ISDA master agreement, posting of collateral is required by either the Fund or the applicable counterparty if the total net exposure of all OTC derivatives with the applicable counterparty exceeds the minimum transfer amount, which typically ranges from $100,000 to $250,000, and can vary depending on the counterparty and the type of the agreement. Generally, collateral is determined at the close of Fund business each day and any additional collateral required due to changes in derivative values may be delivered by the Fund or the counterparty the next business day, or within a few business days. Collateral pledged and/or received by the Fund for OTC derivatives, if any, is held in segregated accounts with the Fund’s custodian/counterparty broker and can be in the form of cash and/or securities. Unrestricted cash may be invested according to the Fund’s investment objectives. To the extent that the amounts due to the Fund from its counterparties are not subject to collateralization or are not fully collateralized, the Fund bears the risk of loss from counterpartynon-performance.
The Fund entered into exchange traded futures contracts primarily to manage exposure to certain foreign currencies. A futures contract is an agreement between the Fund and a counterparty to buy or sell an asset at a specified price on a future date. Required initial margins are pledged by the Fund,
and the daily change in fair value is accounted for as a variation margin payable or receivable in the Statement of Assets and Liabilities.
The Fund entered into OTC forward exchange contracts primarily to manage exposure to certain foreign currencies. A forward exchange contract is an agreement between the Fund and a counterparty to buy or sell a foreign currency at a specific exchange rate on a future date.
See Note 10 regarding other derivative information.
d. Securities Sold Short
The Fund is engaged in selling securities short, which obligates the Fund to replace a borrowed security with the same security at current fair value. The Fund incurs a loss if the price of the security increases between the date of the short sale and the date on which the Fund replaces the borrowed security. The Fund realizes a gain if the price of the security declines between those dates. Gains are limited to the price at which the Fund sold the security short, while losses are potentially unlimited in size.
The Fund is required to establish a margin account with the broker lending the security sold short. While the short sale is outstanding, the broker retains the proceeds of the short sale to the extent necessary to meet margin requirements until the short position is closed out. A deposit must also be maintained with the Fund’s custodian/counterparty broker consisting of cash and/or securities having a value equal to a specified percentage of the value of the securities sold short. The Fund is obligated to pay fees for borrowing the securities sold short and is required to pay the counterparty any dividends and/or interest due on securities sold short. Such dividends and/or interest and any security borrowing fees are recorded as an expense to the Fund. At December 31, 2019, the Fund had no securities sold short.
e. Securities Lending
The Fund participates in an agency based securities lending program to earn additional income. The Fund receives cash collateral against the loaned securities in an amount equal to at least 102% of the fair value of the loaned securities. Collateral is maintained over the life of the loan in an amount not less than 100% of the fair value of loaned securities, as determined at the close of Fund business each day; any additional collateral required due to changes in security values is delivered to the Fund on the next business day. The
26 | Annual Report | franklintempleton.com | ||
FRANKLIN MUTUAL SERIES FUNDS
NOTES TO FINANCIAL STATEMENTS
Franklin Mutual European Fund(continued)
collateral is deposited into a joint cash account with other funds and is used to invest in a money market fund managed by Franklin Advisers, Inc., an affiliate of the Fund, and/or a joint repurchase agreement. The Fund may receive income from the investment of cash collateral, in addition to lending fees and rebates paid by the borrower. Income from securities loaned, net of fees paid to the securities lending agent and/or third-party vendor, is reported separately in the Statement of Operations. The Fund bears the market risk with respect to the collateral investment, securities loaned, and the risk that the agent may default on its obligations to the Fund. If the borrower defaults on its obligation to return the securities loaned, the Fund has the right to repurchase the securities in the open market using the collateral received. The securities lending agent has agreed to indemnify the Fund in the event of default by a third party borrower. At December 31, 2019, the Fund had no securities on loan.
f. Income and Deferred Taxes
It is the Fund’s policy to qualify as a regulated investment company under the Internal Revenue Code. The Fund intends to distribute to shareholders substantially all of its taxable income and net realized gains to relieve it from federal income and excise taxes. As a result, no provision for U.S. federal income taxes is required.
The Fund may be subject to foreign taxation related to income received, capital gains on the sale of securities and certain foreign currency transactions in the foreign jurisdictions in which it invests. Foreign taxes, if any, are recorded based on the tax regulations and rates that exist in the foreign markets in which the Fund invests. When a capital gain tax is determined to apply, the Fund records an estimated deferred tax liability in an amount that would be payable if the securities were disposed of on the valuation date.
As a result of several court cases, in certain countries across the European Union, the Fund filed additional tax reclaims for previously withheld taxes on dividends earned in those countries (EU reclaims). These additional filings are subject to various administrative proceedings by the local jurisdictions’ tax authorities within the European Union, as well as a number of related judicial proceedings. Income recognized, if any, for EU reclaims is reflected as other income in the Statement of Operations and any related receivable, if any, is reflected as European Union tax reclaims in the Statement of Assets and Liabilities. When uncertainty
exists as to the ultimate resolution of these proceedings, the likelihood of receipt of these EU reclaims, and the potential timing of payment, no amounts are reflected in the financial statements. For U.S. income tax purposes, EU reclaims received by the Fund, if any, reduce the amounts of foreign taxes Fund shareholders can use as tax credits in their individual income tax returns.
The Fund may recognize an income tax liability related to its uncertain tax positions under U.S. GAAP when the uncertain tax position has a less than 50% probability that it will be sustained upon examination by the tax authorities based on its technical merits. As of December 31, 2019, the Fund has determined that no tax liability is required in its financial statements related to uncertain tax positions for any open tax years (or expected to be taken in future tax years). Open tax years are those that remain subject to examination and are based on the statute of limitations in each jurisdiction in which the Fund invests.
g. Security Transactions, Investment Income, Expenses and Distributions
Security transactions are accounted for on trade date. Realized gains and losses on security transactions are determined on a specific identification basis. Interest income and estimated expenses are accrued daily. Amortization of premium and accretion of discount on debt securities are included in interest income. Dividend income and dividends declared on securities sold short are recorded on theex-dividend date except for certain dividends from securities where the dividend rate is not available. In such cases, the dividend is recorded as soon as the information is received by the Fund. Distributions to shareholders are recorded on theex-dividend date. Distributable earnings are determined according to income tax regulations (tax basis) and may differ from earnings recorded in accordance with U.S. GAAP. These differences may be permanent or temporary. Permanent differences are reclassified among capital accounts to reflect their tax character. These reclassifications have no impact on net assets or the results of operations. Temporary differences are not reclassified, as they may reverse in subsequent periods.
Common expenses incurred by the Trust are allocated among the Funds based on the ratio of net assets of each Fund to the combined net assets of the Trust or based on the ratio of
| franklintempleton.com | Annual Report | 27 | ||
FRANKLIN MUTUAL SERIES FUNDS
NOTES TO FINANCIAL STATEMENTS
Franklin Mutual European Fund(continued)
1. Organization and Significant Accounting Policies (continued)
g. Security Transactions, Investment Income, Expenses and Distributions(continued)
number of shareholders of each Fund to the combined number of shareholders of the Trust. Fund specific expenses are charged directly to the Fund that incurred the expense.
Realized and unrealized gains and losses and net investment income, excluding class specific expenses, are allocated daily to each class of shares based upon the relative proportion of net assets of each class. Differences in per share distributions by class are generally due to differences in class specific expenses.
h. Accounting Estimates
The preparation of financial statements in accordance with U.S. GAAP requires management to make estimates and assumptions that affect the reported amounts of assets and
liabilities at the date of the financial statements and the amounts of income and expenses during the reporting period. Actual results could differ from those estimates.
i. Guarantees and Indemnifications
Under the Trust’s organizational documents, its officers and trustees are indemnified by the Trust against certain liabilities arising out of the performance of their duties to the Trust. Additionally, in the normal course of business, the Trust, on behalf of the Fund, enters into contracts with service providers that contain general indemnification clauses. The Trust’s maximum exposure under these arrangements is unknown as this would involve future claims that may be made against the Trust that have not yet occurred. Currently, the Trust expects the risk of loss to be remote.
2. Shares of Beneficial Interest
At December 31, 2019, there were an unlimited number of shares authorized (without par value). Transactions in the Fund’s shares were as follows:
| Year Ended December 31, | ||||||||||||||||
| 2019 | 2018 | |||||||||||||||
| Shares | Amount | Shares | Amount | |||||||||||||
Class Z Shares: | ||||||||||||||||
Shares sold | 4,771,932 | $ | 94,210,649 | 15,870,789 | $ | 328,884,286 | ||||||||||
Shares issued in reinvestment of distributions | 916,245 | 19,535,245 | 2,023,721 | 37,225,839 | ||||||||||||
Shares redeemed | (22,203,969 | ) | (435,229,344 | ) | (27,834,376 | ) | (564,046,126 | ) | ||||||||
Net increase (decrease) | (16,515,792 | ) | $ | (321,483,450 | ) | (9,939,866 | ) | $ | (197,936,001 | ) | ||||||
Class A Shares: | ||||||||||||||||
Shares solda | 3,580,834 | $ | 69,916,200 | 6,861,993 | $ | 134,662,400 | ||||||||||
Shares issued in reinvestment of distributions | 473,589 | 9,797,244 | 870,701 | 15,538,916 | ||||||||||||
Shares redeemed | (11,746,709 | ) | (230,145,923 | ) | (10,421,209 | ) | (206,329,109 | ) | ||||||||
Net increase (decrease) | (7,692,286 | ) | $ | (150,432,479 | ) | (2,688,515 | ) | $ | (56,127,793 | ) | ||||||
Class C Shares: | ||||||||||||||||
Shares sold | 149,698 | $ | 2,911,176 | 486,940 | $ | 9,826,395 | ||||||||||
Shares issued in reinvestment of distributions | 44,429 | 929,543 | 117,682 | 2,203,229 | ||||||||||||
Shares redeemeda | (1,694,293 | ) | (33,079,272 | ) | (4,944,916 | ) | (96,235,960 | ) | ||||||||
Net increase (decrease) | (1,500,166 | ) | $ | (29,238,553 | ) | (4,340,294 | ) | $ | (84,206,336 | ) | ||||||
28 | Annual Report | franklintempleton.com | ||
FRANKLIN MUTUAL SERIES FUNDS
NOTES TO FINANCIAL STATEMENTS
Franklin Mutual European Fund(continued)
| Year Ended December 31, | ||||||||||||||||
| 2019 | 2018 | |||||||||||||||
| Shares | Amount | Shares | Amount | |||||||||||||
Class R Shares: | ||||||||||||||||
Shares sold | 6,114 | $ | 118,329 | 8,109 | $ | 162,976 | ||||||||||
Shares issued in reinvestment of distributions | 829 | 16,815 | 1,528 | 26,901 | ||||||||||||
Shares redeemed | (13,638 | ) | (252,231 | ) | (7,860 | ) | (151,298 | ) | ||||||||
Net increase (decrease) | (6,695 | ) | $ | (117,087 | ) | 1,777 | $ | 38,579 | ||||||||
Class R6 Shares: | ||||||||||||||||
Shares sold | 354,277 | $ | 7,045,227 | 1,059,999 | $ | 21,160,059 | ||||||||||
Shares issued in reinvestment of distributions | 13,656 | 290,912 | 261,913 | 4,800,226 | ||||||||||||
Shares redeemed | (6,655,454 | ) | (134,659,844 | ) | (7,032,513 | ) | (148,025,898 | ) | ||||||||
Net increase (decrease) | (6,287,521 | ) | $ | (127,323,705 | ) | (5,710,601 | ) | $ | (122,065,613 | ) | ||||||
aMay include a portion of Class C shares that were automatically converted to Class A.
3. Transactions with Affiliates
Franklin Resources, Inc. is the holding company for various subsidiaries that together are referred to as Franklin Templeton. Certain officers and trustees of the Fund are also officers and/or directors of the following subsidiaries:
| Subsidiary | Affiliation | |||
Franklin Mutual Advisers, LLC (Franklin Mutual) | Investment manager | |||
Franklin Templeton Services, LLC (FT Services) | Administrative manager | |||
Franklin Templeton Distributors, Inc. (Distributors) | Principal underwriter | |||
Franklin Templeton Investor Services, LLC (Investor Services) | Transfer agent | |||
a. Management Fees
The Fund pays an investment management fee to Franklin Mutual based on the average daily net assets of the Fund as follows:
| Annualized Fee Rate | Net Assets | |||
0.875% | Up to and including $1 billion | |||
0.845% | Over $1 billion, up to and including $2 billion | |||
0.825% | Over $2 billion, up to and including $5 billion | |||
0.805% | In excess of $5 billion | |||
For the year ended December 31, 2019, the gross effective investment management fee rate was 0.864% of the Fund’s average daily net assets.
b. Administrative Fees
Under an agreement with Franklin Mutual, FT Services provides administrative services to the Fund. The fee is paid by Franklin Mutual based on the Fund’s average daily net assets, and is not an additional expense of the Fund.
| franklintempleton.com | Annual Report | 29 | ||
FRANKLIN MUTUAL SERIES FUNDS
NOTES TO FINANCIAL STATEMENTS
Franklin Mutual European Fund(continued)
3. Transactions with Affiliates(continued)
c. Distribution Fees
The Board has adopted distribution plans for each share class, with the exception of Class Z and Class R6 shares, pursuant to Rule12b-1 under the 1940 Act. Under the Fund’s Class A reimbursement distribution plan, the Fund reimburses Distributors for costs incurred in connection with the servicing, sale and distribution of the Fund’s shares up to the maximum annual plan rate. Under the Class A reimbursement distribution plan, costs exceeding the maximum for the current plan year cannot be reimbursed in subsequent periods. In addition, under the Fund’s Class C and R compensation distribution plans, the Fund pays Distributors for costs incurred in connection with the servicing, sale and distribution of the Fund’s shares up to the maximum annual plan rate for each class. The plan year, for purposes of monitoring compliance with the maximum annual plan rates, is February 1 through January 31.
The maximum annual plan rates, based on the average daily net assets, for each class, are as follows:
Class A | 0.35 | % | ||
Class C | 1.00 | % | ||
Class R | 0.50 | % |
The Board has set the current rate at 0.25% per year for Class A shares until further notice and approval by the Board.
d. Sales Charges/Underwriting Agreements
Front-end sales charges and contingent deferred sales charges (CDSC) do not represent expenses of the Fund. These charges are deducted from the proceeds of sales of Fund shares prior to investment or from redemption proceeds prior to remittance, as applicable. Distributors has advised the Fund of the following commission transactions related to the sales and redemptions of the Fund’s shares for the year:
Sales charges retained net of commissions paid to unaffiliated brokers/dealers | $ | 14,005 | ||
CDSC retained | $ | 8,990 |
e. Transfer Agent Fees
Each class of shares pays transfer agent fees to Investor Services for its performance of shareholder servicing obligations. The fees are based on an annualized asset based fee of 0.02% plus a transaction based fee. In addition, each class reimburses Investor Services for out of pocket expenses incurred and, except for Class R6, reimburses shareholder servicing fees paid to third parties. These fees are allocated daily based upon their relative proportion of such classes’ aggregate net assets. Class R6 pays Investor Services transfer agent fees specific to that class.
For the year ended December 31, 2019, the Fund paid transfer agent fees of $1,998,849, of which $703,150 was retained by Investor Services.
f. Waiver and Expense Reimbursements
Investor Services has contractually agreed in advance to waive or limit its fees so that the Class R6 transfer agent fees do not exceed 0.02% based on the average net assets of the class until April 30, 2020.
30 | Annual Report | franklintempleton.com | ||
FRANKLIN MUTUAL SERIES FUNDS
NOTES TO FINANCIAL STATEMENTS
Franklin Mutual European Fund(continued)
g. Interfund Transactions
The Fund engaged in purchases and sales of investments with funds or other accounts that have common investment managers (or affiliated investment managers), directors, trustees or officers. During the year ended December 31, 2019, these purchase and sale transactions aggregated $0 and $12,456,798, respectively.
4. Expense Offset Arrangement
The Fund has entered into an arrangement with its custodian whereby credits realized as a result of uninvested cash balances are used to reduce a portion of the Fund’s custodian expenses. During the year ended December 31, 2019, the custodian fees were reduced as noted in the Statement of Operations.
5. Independent Trustees’ Retirement Plan
On January 1, 1993, the Trust adopted an Independent Trustees’ Retirement Plan (Plan). The Plan is an unfunded defined benefit plan that provides benefit payments to Trustees whose length of service and retirement age meets the eligibility requirements of the Plan. Benefits under the Plan are based on years of service and fees paid to each trustee at the time of retirement. Effective in December 1996, the Plan was closed to new participants.
During the year ended December 31, 2019, the Fund’s projected benefit obligation and benefit payments under the Plan were as follows:
aProjected benefit obligation at December 31, 2019 | $ | 135,246 | ||
bIncrease in projected benefit obligation |
$ |
11,562 |
| |
Benefit payments made to retired trustees |
$ |
(2,102 |
) |
aThe projected benefit obligation is included in trustees’ fees and expenses in the Statement of Assets and Liabilities.
bThe increase in projected benefit obligation is included in trustees’ fees and expenses in the Statement of Operations.
6. Income Taxes
For tax purposes, capital losses may be carried over to offset future capital gains.
At December 31, 2019, the capital loss carryforwards were as follows:
Capital loss carryforwards not subject to expiration: | ||||
Short term | $ | 11,726,704 |
During the year ended December 31, 2019, the Fund utilized $27,402,502 of capital loss carryforwards.
The tax character of distributions paid during the years ended December 31, 2019 and 2018, was as follows:
| 2019 | 2018 | |||||||
|
| |||||||
Distributions paid from ordinary income | $ | 35,851,732 | $ | 69,558,550 | ||||
|
| |||||||
| franklintempleton.com | Annual Report | 31 | ||
FRANKLIN MUTUAL SERIES FUNDS
NOTES TO FINANCIAL STATEMENTS
Franklin Mutual European Fund(continued)
6. Income Taxes(continued)
At December 31, 2019, the cost of investments, net unrealized appreciation (depreciation) and undistributed ordinary income for income tax purposes were as follows:
Cost of investments | $ | 1,358,701,931 | ||
|
|
| ||
Unrealized appreciation | $ | 185,031,521 | ||
Unrealized depreciation |
|
(171,256,344 |
) | |
|
|
| ||
Net unrealized appreciation (depreciation) | $ | 13,775,177 | ||
|
|
| ||
Distributable earnings: | ||||
Undistributed ordinary income | $ | 6,295,750 | ||
|
|
| ||
Differences between income and/or capital gains as determined on a book basis and a tax basis are primarily due to differing treatment of foreign currency transactions.
7. Investment Transactions
Purchases and sales of investments (excluding short term securities and securities sold short) for the year ended December 31, 2019, aggregated $178,687,099 and $746,768,210, respectively.
8. Concentration of Risk
Investing in foreign securities may include certain risks and considerations not typically associated with investing in U.S. securities, such as fluctuating currency values and changing local, regional and global economic, political and social conditions, which may result in greater market volatility. Current political and financial uncertainty surrounding the European Union may increase market volatility and the economic risk of investing in securities in Europe. In addition, certain foreign securities may not be as liquid as U.S. securities.
9. Restricted Securities
The Fund invests in securities that are restricted under the Securities Act of 1933 (1933 Act). Restricted securities are often purchased in private placement transactions, and cannot be sold without prior registration unless the sale is pursuant to an exemption under the 1933 Act. Disposal of these securities may require greater effort and expense, and prompt sale at an acceptable price may be difficult. The Fund may have registration rights for restricted securities. The issuer generally incurs all registration costs.
At December 31, 2019, investments in restricted securities, excluding securities exempt from registration under the 1933 Act, were as follows:
| Acquisition | ||||||||||||
| Shares | Issuer | Date | Cost | Value | ||||||||
| ||||||||||||
| 16,127,149 | Euro Wagon LP (Value is —% of Net Assets) | 12/08/05 - 1/02/08 | $6,282,509 | $ | — | |||||||
|
| |||||||||||
32 | Annual Report | franklintempleton.com | ||
FRANKLIN MUTUAL SERIES FUNDS
NOTES TO FINANCIAL STATEMENTS
Franklin Mutual European Fund(continued)
10. Other Derivative Information
At December 31, 2019, investments in derivative contracts are reflected in the Statement of Assets and Liabilities as follows:
Asset Derivatives | Liability Derivatives | |||||||||||
| Derivative Contracts Not Accounted for as Hedging Instruments | Statement of Assets and Liabilities Location | Fair Value | Statement of Location | Fair Value | ||||||||
| ||||||||||||
Foreign exchange contracts | Variation margin on futures contracts | $ | — | Variation margin on futures contracts | $ | 4,685,201 | a | |||||
Unrealized appreciation on OTC forward exchange contracts | 3,270,069 | Unrealized depreciation on OTC forward exchange contracts | 17,306,545 | |||||||||
Totals | $ | 3,270,069 | $ | 21,991,746 | ||||||||
aThis amount reflects the cumulative appreciation (depreciation) of futures contracts as reported in the Statement of Investments. Only the variation margin receivable/ payable at year end is separately reported within the Statement of Assets and Liabilities. Prior variation margin movements were recorded to cash upon receipt or payment.
For the year ended December 31, 2019, the effect of derivative contracts in the Statement of Operations was as follows:
Derivative Contracts Hedging Instruments | Statement of Operations Location | Net Realized Gain (Loss) for the Year | Statement of Operations Location | Net Change in Unrealized Appreciation (Depreciation) for the Year | ||||
Net realized gain (loss) from: | Net change in unrealized appreciation (depreciation) on: | |||||||
Foreign exchange contracts | Forward exchange contracts | $51,052,918 | Forward exchange contracts | $(25,369,973) | ||||
Futures contracts | 21,548,807 | Futures contracts | (5,063,994) | |||||
Totals | $72,601,725 | $(30,433,967) | ||||||
For the year ended December 31, 2019, the average month end notional amount of futures contracts represented $541,926,607. The average month end contract value of forward exchange contracts was $874,813,396.
At December 31, 2019, OTC derivative assets and liabilities are as follows:
| Gross Amounts of Assets and Liabilities Presented in the Statement of Assets and Liabilities | ||||||||
| Assetsa | Liabilitiesa | |||||||
Derivatives | ||||||||
Forward exchange contracts | $3,270,069 | $17,306,545 | ||||||
aAbsent an event of default or early termination, OTC derivative assets and liabilities are presented gross and not offset in the Statement of Assets and Liabilities.
| franklintempleton.com | Annual Report | 33 | ||
FRANKLIN MUTUAL SERIES FUNDS
NOTES TO FINANCIAL STATEMENTS
Franklin Mutual European Fund(continued)
10. Other Derivative Information(continued)
At December 31, 2019, OTC derivative assets, which may be offset against OTC derivative liabilities and collateral received from the counterparty, are as follows:
| Amounts Not Offset in the Statement of Assets and Liabilities | ||||||||||||||||||||
Gross Amounts of Assets Presented in the Statement of Assets and Liabilities | Financial Instruments Available for Offset | Financial Instruments Collateral Received | Cash Collateral Received | Net Amount (Not less than zero) | ||||||||||||||||
Counterparty | ||||||||||||||||||||
BOFA | $ 170,133 | $ (170,133 | ) | $ — | $ — | $ — | ||||||||||||||
HSBK | 126,285 | (126,285 | ) | — | — | — | ||||||||||||||
SSBT | 1,480,379 | (1,480,379 | ) | — | — | — | ||||||||||||||
UBSW | 1,493,272 | (1,493,272 | ) | — | — | — | ||||||||||||||
Total | $3,270,069 | $(3,270,069 | ) | $ — | $ — | $ — | ||||||||||||||
At December 31, 2019, OTC derivative liabilities, which may be offset against OTC derivative assets and collateral pledged to the counterparty, are as follows:
| Amounts Not Offset in the Statement of Assets and Liabilities | ||||||||||||||||||||
Gross Amounts of Liabilities Presented in the Statement of Assets and Liabilities | Financial Instruments Available for Offset | Financial Instruments Collateral Pledgeda,b | Cash Collateral Pledged | Net Amount (Not less than zero) | ||||||||||||||||
Counterparty | ||||||||||||||||||||
BOFA | $ 724,139 | $ (170,133 | ) | $ (190,864 | ) | $ — | $ 363,142 | |||||||||||||
HSBK | 8,347,195 | (126,285 | ) | (8,220,910 | ) | — | — | |||||||||||||
SSBT | 6,166,187 | (1,480,379 | ) | (3,853,480 | ) | — | 832,328 | |||||||||||||
UBSW | 2,069,024 | (1,493,272 | ) | — | — | 575,752 | ||||||||||||||
Total | $17,306,545 | $(3,270,069 | ) | $(12,265,254 | ) | $ — | $1,771,222 | |||||||||||||
aIn some instances, the collateral amounts disclosed in the table above were adjusted due to the requirement to limit collateral amounts to avoid the effect of overcollateralization. Actual collateral received and/or pledged may be more than the amounts disclosed herein.
bSee the accompanying Statement of Investments for securities pledged as collateral for derivatives.
See Note 1(c) regarding derivative financial instruments.
See Abbreviations on page 36.
34 | Annual Report | franklintempleton.com | ||
FRANKLIN MUTUAL SERIES FUNDS
NOTES TO FINANCIAL STATEMENTS
Franklin Mutual European Fund(continued)
11. Holdings of 5% Voting Securities of Portfolio Companies
The 1940 Act defines “affiliated companies” to include investments in portfolio companies in which a fund owns 5% or more of the outstanding voting securities. During the year ended December 31, 2019, investments in “affiliated companies” were as follows:
| Name of Issuer | Value at of Year | Purchases | Sales | Realized Gain (Loss) | Net Change in Unrealized (Depreciation) | Value at End of Year | Number of at End of Year | Dividend Income | ||||||||||||||||||||||||
Controlled Affiliatesa | ||||||||||||||||||||||||||||||||
Euro Wagon LP (Value is —% of Net Assets) | $ — | $ — | $ — | $ — | $ — | $ — | 16,127,149 | $ — | ||||||||||||||||||||||||
aIssuer in which the Fund owns 25% or more of the outstanding voting securities.
12. Credit Facility
The Fund, together with other U.S. registered and foreign investment funds (collectively, Borrowers), managed by Franklin Templeton, are borrowers in a joint syndicated senior unsecured credit facility totaling $2 billion (Global Credit Facility) which matured on February 7, 2020. This Global Credit Facility provides a source of funds to the Borrowers for temporary and emergency purposes, including the ability to meet future unanticipated or unusually large redemption requests. Effective February 7, 2020, the Borrowers renewed the Global Credit Facility for a one year term, maturing February 5, 2021, for a total of $2 billion.
Under the terms of the Global Credit Facility, the Fund shall, in addition to interest charged on any borrowings made by the Fund and other costs incurred by the Fund, pay its share of fees and expenses incurred in connection with the implementation and maintenance of the Global Credit Facility, based upon its relative share of the aggregate net assets of all of the Borrowers, including an annual commitment fee of 0.15% based upon the unused portion of the Global Credit Facility. These fees are reflected in other expenses in the Statement of Operations. During the year ended December 31, 2019, the Fund did not use the Global Credit Facility.
13. Fair Value Measurements
The Fund follows a fair value hierarchy that distinguishes between market data obtained from independent sources (observable inputs) and the Fund’s own market assumptions (unobservable inputs). These inputs are used in determining the value of the Fund’s financial instruments and are summarized in the following fair value hierarchy:
| • | Level 1 – quoted prices in active markets for identical financial instruments |
| • | Level 2 – other significant observable inputs (including quoted prices for similar financial instruments, interest rates, prepayment speed, credit risk, etc.) |
| • | Level 3 – significant unobservable inputs (including the Fund’s own assumptions in determining the fair value of financial instruments) |
The input levels are not necessarily an indication of the risk or liquidity associated with financial instruments at that level.
| franklintempleton.com | Annual Report | 35 | ||
FRANKLIN MUTUAL SERIES FUNDS
NOTES TO FINANCIAL STATEMENTS
Franklin Mutual European Fund(continued)
13. Fair Value Measurements(continued)
A summary of inputs used as of December 31, 2019, in valuing the Fund’s assets and liabilities carried at fair value, is as follows:
| Level 1 | Level 2 | Level 3 | Total | |||||||||||||
Assets: | ||||||||||||||||
Investments in Securities:a | ||||||||||||||||
Equity Investments:b | ||||||||||||||||
Machinery | $ | 62,679,102 | $ | 9,150,565 | $ | — | $ | 71,829,667 | ||||||||
All Other Equity Investments | 1,274,062,162 | — | — | c | 1,274,062,162 | |||||||||||
Short Term Investments | 31,032,366 | 28,300,000 | — | 59,332,366 | ||||||||||||
Total Investments in Securities | $ | 1,367,773,630 | $ | 37,450,565 | $ | — | $ | 1,405,224,195 | ||||||||
Other Financial Instruments: | ||||||||||||||||
Forward Exchange Contracts | $ | — | $ | 3,270,069 | $ | — | $ | 3,270,069 | ||||||||
Liabilities: | ||||||||||||||||
Other Financial Instruments: | ||||||||||||||||
Futures Contracts | $ | 4,685,201 | $ | — | $ | — | $ | 4,685,201 | ||||||||
Forward Exchange Contracts | — | 17,306,545 | — | 17,306,545 | ||||||||||||
Total Other Financial Instruments | $ | 4,685,201 | $ | 17,306,545 | $ | — | $ | 21,991,746 | ||||||||
aFor detailed categories, see the accompanying Statement of Investments.
bIncludes common and preferred stocks.
cIncludes securities determined to have no value at December 31, 2019.
A reconciliation of assets in which Level 3 inputs are used in determining fair value is presented when there are significant Level 3 financial instruments at the beginning and/or end of the year.
14. Subsequent Events
The Fund has evaluated subsequent events through the issuance of the financial statements and determined that no events have occurred that require disclosure other than those already disclosed in the financial statements.
| Abbreviations | ||||||||||
| Counterparty | Currency | Selected Portfolio | ||||||||
BOFA | Bank of America Corp. | EUR | Euro | ADR | American Depositary Receipt | |||||
HSBK | HSBC Bank PLC | GBP | British Pound | FHLB | Federal Home Loan Bank | |||||
SSBT | State Street Bank and Trust Co., N.A. | USD | United States Dollar | |||||||
UBSW | UBS AG | |||||||||
36 | Annual Report | franklintempleton.com | ||
FRANKLIN MUTUAL SERIES FUNDS
Report of Independent Registered Public Accounting Firm
To the Board of Trustees of Franklin Mutual Series Funds and Shareholders of Franklin Mutual European Fund:
Opinion on the Financial Statements
We have audited the accompanying statement of assets and liabilities of Franklin Mutual European Fund (the “Fund”) (one of the funds constituting Franklin Mutual Series Funds), including the schedule of investments, as of December 31, 2019, and the related statement of operations for the year then ended, the statements of changes in net assets for each of the two years in the period then ended, the financial highlights for each of the five years in the period then ended and the related notes (collectively referred to as the “financial statements”). In our opinion, the financial statements present fairly, in all material respects, the financial position of Franklin Mutual European Fund (one of the funds constituting Franklin Mutual Series Funds) at December 31, 2019, the results of its operations for the year then ended, the changes in its net assets for each of the two years in the period then ended and its financial highlights for each of the five years in the period then ended, in conformity with U.S. generally accepted accounting principles.
Basis for Opinion
These financial statements are the responsibility of the Fund’s management. Our responsibility is to express an opinion on the Fund’s financial statements based on our audits. We are a public accounting firm registered with the Public Company Accounting Oversight Board (United States) ("PCAOB") and are required to be independent with respect to the Fund in accordance with the U.S. federal securities laws and the applicable rules and regulations of the Securities and Exchange Commission and the PCAOB.
We conducted our audits in accordance with the standards of the PCAOB. Those standards require that we plan and perform the audit to obtain reasonable assurance about whether the financial statements are free of material misstatement, whether due to error or fraud. The Fund is not required to have, nor were we engaged to perform, an audit of the Fund’s internal control over financial reporting. As part of our audits, we are required to obtain an understanding of internal control over financial reporting, but not for the purpose of expressing an opinion on the effectiveness of the Fund’s internal control over financial reporting. Accordingly, we express no such opinion.
Our audits included performing procedures to assess the risks of material misstatement of the financial statements, whether due to error or fraud, and performing procedures that respond to those risks. Such procedures included examining, on a test basis, evidence regarding the amounts and disclosures in the financial statements. Our procedures included confirmation of securities owned as of December 31, 2019, by correspondence with the custodian and brokers. Our audits also included evaluating the accounting principles used and significant estimates made by management, as well as evaluating the overall presentation of the financial statements. We believe that our audits provide a reasonable basis for our opinion.
We have served as the auditor of one or more Franklin investment companies since 1987.
Boston, Massachusetts
February 21, 2020
| franklintempleton.com | Annual Report | 37 | ||
FRANKLIN MUTUAL SERIES FUNDS
Franklin Mutual European Fund
Under Section 854(b)(1)(B) of the Internal Revenue Code, the Fund hereby reports the maximum amount allowable but no less than $56,246,676 as qualified dividends for purposes of the maximum rate under Section 1(h)(11) of the Internal Revenue Code for the fiscal year ended December 31, 2019. Distributions, including qualified dividend income, paid during calendar year 2019 will be reported to shareholders on Form1099-DIV bymid-February 2020. Shareholders are advised to check with their tax advisors for information on the treatment of these amounts on their individual income tax returns.
At December 31, 2019, more than 50% of the Fund’s total assets were invested in securities of foreign issuers. In most instances, foreign taxes were withheld from income paid to the Fund on these investments. As shown in the table below, the Fund hereby reports to shareholders the foreign source income and foreign taxes paid, pursuant to Section 853 of the Internal Revenue Code. This written statement will allow shareholders of record on December 19, 2019, to treat their proportionate share of foreign taxes paid by the Fund as having been paid directly by them. The shareholder shall consider these amounts as foreign taxes paid in the tax year in which they receive the Fund distribution.
The following table provides a detailed analysis of foreign tax paid, foreign source income and foreign source qualified dividends as reported by the Fund to shareholders of record.
| Class | Foreign Tax Paid Per Share | Foreign Source Income Per Share | Foreign Source Qualified Dividends Per Share | |||||||||||
Class Z | $0.0721 | $0.7313 | $0.6398 | |||||||||||
Class A | $0.0721 | $0.6749 | $0.5905 | |||||||||||
Class C | $0.0721 | $0.4937 | $0.4320 | |||||||||||
Class R | $0.0721 | $0.6368 | $0.5571 | |||||||||||
Class R6 | $0.0721 | $0.7495 | $0.6557 | |||||||||||
Foreign Tax Paid Per Share is the amount per share available to you, as a tax credit (assuming you held your shares in the Fund for a minimum of 16 days during the31-day period beginning 15 days before theex-dividend date of the Fund’s distribution to which the foreign taxes relate), or, as a tax deduction.
Foreign Source Income Per Share is the amount per share of income dividends attributable to foreign securities held by the Fund, plus any foreign taxes withheld on these dividends. The amounts reported include foreign source qualified dividends that have not been adjusted for the rate differential applicable to such dividend income.1
Foreign Source Qualified Dividends Per Share is the amount per share of foreign source qualified dividends plus any foreign taxes withheld on these dividends. These amounts represent the portion of the Foreign Source Income Per Share that were derived from qualified foreign securities held by the Fund.1
At the beginning of each calendar year, shareholders will receive Form1099-DIV which will include their share of taxes paid and foreign source income distributed during the prior calendar year. The Foreign Source Income reported on Form1099-DIV has not been adjusted for the rate differential on foreign source qualified dividend income. Shareholders are advised to check with their tax advisors for information on the treatment of these amounts on their individual income tax returns.
1Qualified dividends are taxed at reduced long term capital gains tax rates. In determining the amount of foreign tax credit that may be applied against the U.S. tax liability of individuals receiving foreign source qualified dividends, adjustments may be required to the foreign tax credit limitation calculation to reflect the rate differential applicable to such dividend income. The rules however permit certain individuals to elect not to apply the rate differential adjustments for capital gains and/or dividends for any taxable year. Please consult your tax advisor and the instructions to Form 1116 for more information.
38 | Annual Report | franklintempleton.com | ||
FRANKLIN MUTUAL SERIES FUNDS
The name, year of birth and address of the officers and board members, as well as their affiliations, positions held with the Trust, principal occupations during at least the past five years and number of U.S. registered portfolios overseen in the Franklin Templeton fund complex, are shown below. Generally, each board member serves until that person’s successor is elected and qualified.
Independent Board Members
Name, Year of Birth and Address | Position | Length of Time Served | Number of Portfolios in Fund Complex Overseen by Board Member* | Other Directorships Held During at Least the Past 5 Years | ||||
| Edward I. Altman, Ph.D. (1941) | Trustee | Since 1987 | 12 | None | ||||
c/o Franklin Mutual Advisers, LLC 101 John F. Kennedy Parkway Short Hills, NJ 07078-2716
| ||||||||
Principal Occupation During at Least the Past 5 Years: Max L. Heine Professor of Finance, Emeritus and Director of The Credit and Debt Markets Research Program, Salomon Center, Stern School of Business, New York University; editor and author of numerous financial publications; financial consultant; an adviser to numerous financial and publishing organizations; andformerly, Vice Director, Salomon Center, Stern School of Business, New York University.
| ||||||||
Ann Torre Bates (1958) c/o Franklin Mutual Advisers, LLC 101 John F. Kennedy Parkway Short Hills, NJ 07078-2716 | Trustee and Chairperson | Trustee since 1995 and Chairperson since January 2020 | 33 | Ares Capital Corporation (specialty finance company) (2010-present), United Natural Foods, Inc. (distributor of natural, organic and specialty foods) (2013-present), Allied Capital Corporation (financial services) (2003-2010), SLM Corporation (Sallie Mae) (1997-2014) and Navient Corporation (loan management, servicing and asset recovery) (2014-2016). | ||||
Principal Occupation During at Least the Past 5 Years: Director of various companies; andformerly, Executive Vice President and Chief Financial Officer, NHP Incorporated (manager of multifamily housing) (1995-1997); and Vice President and Treasurer, US Airways, Inc. (until 1995). | ||||||||
Burton J. Greenwald (1929) c/o Franklin Mutual Advisers, LLC 101 John F. Kennedy Parkway Short Hills, NJ 07078-2716 | Trustee | Since 2002 | 12 | Franklin Templeton Emerging Markets Debt Opportunities Fund PLC (1999-present) and Fiduciary International Ireland Limited (1999-2015). | ||||
Principal Occupation During at Least the Past 5 Years: Managing Director, B.J. Greenwald Associates (management consultants to the financial services industry); andformerly, Chairman, Fiduciary Trust International Funds; Executive Vice President, L.F. Rothschild Fund Management, Inc.; President and Director, Merit Mutual Funds; President, Underwriting Division and Director, National Securities & Research Corporation; Governor, Investment Company Institute; and Chairman, ICI Public Information Committee.
| ||||||||
Jan Hopkins Trachtman(1947) c/o Franklin Mutual Advisers, LLC 101 John F. Kennedy Parkway Short Hills, NJ 07078-2716 | Trustee | Since 2009 | 12 | FinTech Acquisition Corp. III (special purpose fintech acquisition company) (2018-present) | ||||
Principal Occupation During at Least the Past 5 Years: President and Founder, The Jan Hopkins Group (communications consulting firm); serves on Alumni Advisory Board of Knight Bagehot Fellowship; andformerly, President, Economic Club of New York (2007-2015); Anchor/Correspondent, CNN Financial News (until 2003); Managing Director and Head of Client Communications, Citigroup Private Bank (until 2005);Off-Air reporter, ABC News’ World News Tonight; and Editor, CBS Network News. | ||||||||
| franklintempleton.com | Annual Report | 39 | ||
FRANKLIN MUTUAL SERIES FUNDS
Independent Board Members(continued)
Name, Year of Birth and Address | Position | Length of Time Served | Number of Portfolios in Fund Complex Overseen by Board Member* | Other Directorships Held During at Least the Past 5 Years | ||||
Keith Mitchell (1954) c/o Franklin Mutual Advisers, LLC 101 John F. Kennedy Parkway Short Hills, NJ 07078-2716 | Trustee | Since 2009 | 12 | None | ||||
| Principal Occupation During at Least the Past 5 Years: | ||||||||
Director of various boards of asset management firms; andformerly, Managing Member, Mitchell, Hartley & Bechtel Advisers, LLC (formerly, Mitchell Advisers, LLC) (advisory firm) (2003-2015) and Managing Director, Putman Lovell NBF.
| ||||||||
David W. Niemiec (1949) c/o Franklin Mutual Advisers, LLC 101 John F. Kennedy Parkway Short Hills, NJ 07078-2716 | Trustee | Since 2015 | 33 | Hess Midstream LP (oil and gas midstream infrastructure) (2017-present). | ||||
| Principal Occupation During at Least the Past 5 Years: | ||||||||
Advisor, Saratoga Partners (private equity fund); andformerly, Managing Director, Saratoga Partners (1998-2001) and SBC Warburg Dillon Read (investment banking) (1997-1998); Vice Chairman, Dillon, Read & Co. Inc. (investment banking) (1991-1997); and Chief Financial Officer, Dillon, Read & Co. Inc. (1982-1997).
| ||||||||
Charles Rubens II (1930) c/o Franklin Mutual Advisers, LLC 101 John F. Kennedy Parkway Short Hills, NJ 07078-2716 | Trustee | Since 1998 | 12 | None | ||||
| Principal Occupation During at Least the Past 5 Years: | ||||||||
Private investor and president ofnon-profit organizations; andformerly, an executive of Time, Inc.; and Trustee of Colorado College.
| ||||||||
Robert E. Wade (1946) c/o Franklin Mutual Advisers, LLC 101 John F. Kennedy Parkway Short Hills, NJ 07078-2716 | Trustee | Since 1991 | 33 | El Oro Ltd (investments) (2003-2019). | ||||
| Principal Occupation During at Least the Past 5 Years: | ||||||||
Attorney at law engaged in private practice as a sole practitioner (1972-2008) and member of various boards.
| ||||||||
Gregory H. Williams (1943) c/o Franklin Mutual Advisers, LLC 101 John F. Kennedy Parkway Short Hills, NJ 07078-2716 | Trustee | Since 2015 | 12 | None | ||||
| Principal Occupation During at Least the Past 5 Years: | ||||||||
Private investor; Consultant; andformerly, President, University of Cincinnati (2009-2012); President, The City College of New York (2001-2009); Dean, College of Law, Ohio State University (1993-2001); and Associate Vice President, Academic Affairs and Professor of Law, University of Iowa (1977-1993).
| ||||||||
Interested Board Members and Officers
Name, Year of Birth and Address | Position | Length of Time Served | Number of Portfolios in Fund Complex Overseen by Board Member* | Other Directorships Held During at Least the Past 5 Years | ||||
**Gregory E. Johnson (1961) One Franklin Parkway San Mateo, CA 94403-1906 | Trustee | Since 2007 | 144 | None | ||||
Principal Occupation During at Least the Past 5 Years: Chairman of the Board, Member – Office of the Chairman, Director and Chief Executive Officer, Franklin Resources, Inc.; officer and/or director or trustee, as the case may be, of some of the other subsidiaries of Franklin Resources, Inc. and of 39 of the investment companies in Franklin Templeton; Vice Chairman, Investment Company Institute; andformerly,President, Franklin Resources, Inc. (1994-2015). | ||||||||
40 | Annual Report | franklintempleton.com | ||
FRANKLIN MUTUAL SERIES FUNDS
Interested Board Members and Officers (continued)
Name, Year of Birth and Address | Position | Length of Time Served | Number of Portfolios in Fund Complex Overseen by Board Member* | Other Directorships Held During at Least the Past 5 Years | ||||
**Peter A. Langerman (1955) c/o Franklin Mutual Advisers, LLC 101 John F. Kennedy Parkway Short Hills, NJ 07078-2716 | Trustee, President, and Chief Executive Officer – Investment Management | Trustee since 2007, President, and Chief Executive Officer – Investment Management since 2005 | 7 | None | ||||
Principal Occupation During at Least the Past 5 Years: Chairman of the Board, Chief Executive Officer and President, Franklin Mutual Advisers, LLC; and officer and/or director, as the case may be, of three of the investment companies in Franklin Templeton. | ||||||||
Alison E. Baur (1964) One Franklin Parkway San Mateo, CA 94403-1906 | Vice President | Since 2012 | Not Applicable | Not Applicable | ||||
Principal Occupation During at Least the Past 5 Years: Deputy General Counsel, Franklin Templeton; and officer of some of the other subsidiaries of Franklin Resources, Inc. and of 41 of the investment companies in Franklin Templeton. | ||||||||
Breda M. Beckerle (1958) 280 Park Avenue New York, NY 10017 | Interim Chief Compliance Officer | Since January 2020 | Not Applicable | Not Applicable | ||||
Principal Occupation During at Least the Past 5 Years: Chief Compliance Officer, Fiduciary Investment Management International, Inc., Franklin Advisers, Inc., Franklin Advisory Services, LLC, Franklin Mutual Advisers, LLC, Franklin Templeton Institutional, LLC; and officer of 41 of the investment companies in Franklin Templeton. | ||||||||
Steven J. Gray (1955) One Franklin Parkway San Mateo, CA 94403-1906 | Vice President and Secretary | Vice President since 2009 and Secretary since 2005 | Not Applicable | Not Applicable | ||||
Principal Occupation During at Least the Past 5 Years: Senior Associate General Counsel, Franklin Templeton; Vice President, Franklin Templeton Distributors, Inc. and FASA, LLC; and officer of 41 of the investment companies in Franklin Templeton. | ||||||||
Matthew T. Hinkle (1971) One Franklin Parkway San Mateo, CA 94403-1906 | Chief Executive Officer – Finance and Administration | Since 2017 | Not Applicable | Not Applicable | ||||
Principal Occupation During at Least the Past 5 Years: Senior Vice President, Franklin Templeton Services, LLC; officer of 41 of the investment companies in Franklin Templeton; andformerly, Vice President, Global Tax (2012-April 2017) and Treasurer/Assistant Treasurer, Franklin Templeton (2009-2017). | ||||||||
Robert G. Kubilis (1973) 300 S.E. 2nd Street Fort Lauderdale, FL 33301-1923 | Chief Financial Officer, Chief Accounting Officer and Treasurer | Since 2012 | Not Applicable | Not Applicable | ||||
Principal Occupation During at Least the Past 5 Years: Treasurer, U.S. Fund Administration & Reporting; and officer of 15 of the investment companies in Franklin Templeton. | ||||||||
| franklintempleton.com | Annual Report | 41 | ||
FRANKLIN MUTUAL SERIES FUNDS
Interested Board Members and Officers(continued)
Name, Year of Birth and Address | Position | Length of Time Served | Number of Portfolios in Fund Complex Overseen by Board Member* | Other Directorships Held During at Least the Past 5 Years | ||||
Robert Lim (1948) One Franklin Parkway San Mateo, CA 94403-1906 | Vice President – AML Compliance | Since 2016 | Not Applicable | Not Applicable | ||||
Principal Occupation During at Least the Past 5 Years: Vice President, Franklin Templeton Companies, LLC; Chief Compliance Officer, Franklin Templeton Distributors, Inc. and Franklin Templeton Investor Services, LLC; and officer of 44 of the investment companies in Franklin Templeton Investments. | ||||||||
Navid J. Tofigh (1972) One Franklin Parkway San Mateo, CA 94403-1906 | Vice President | Since 2015 | Not Applicable | Not Applicable | ||||
Principal Occupation During at Least the Past 5 Years: Associate General Counsel; and officer of 41 of the investment companies in Franklin Templeton. | ||||||||
Craig S. Tyle (1960) One Franklin Parkway San Mateo, CA 94403-1906 | Vice President | Since 2005 | Not Applicable | Not Applicable | ||||
Principal Occupation During at Least the Past 5 Years: General Counsel and Executive Vice President, Franklin Resources, Inc.; and officer of some of the other subsidiaries of Franklin Resources, Inc. and of 41 of the investment companies in Franklin Templeton. | ||||||||
Lori A. Weber (1964) 300 S.E. 2nd Street Fort Lauderdale, FL 33301-1923 | Vice President | Since 2011 | Not Applicable | Not Applicable | ||||
Principal Occupation During at Least the Past 5 Years: Senior Associate General Counsel, Franklin Templeton; Assistant Secretary, Franklin Resources, Inc.; Vice President and Secretary, Templeton Investment Counsel, LLC; and officer of 41 of the investment companies in Franklin Templeton. | ||||||||
42 | Annual Report | franklintempleton.com | ||
FRANKLIN MUTUAL SERIES FUNDS
*We base the number of portfolios on each separate series of the U.S. registered investment companies within the Franklin Templeton Investments fund complex. These portfolios have a common investment manager or affiliated investment managers.
**Gregory E. Johnson is considered to be an interested person of the Fund under the federal securities laws due to his position as an officer and director of Franklin Resources, Inc. (Resources), which is the parent company of the Fund’s investment manager and distributor. Peter A. Langerman is considered to be an interested person of the Fund under the federal securities laws due to his position as an officer of Franklin Mutual Advisers, LLC, which is the Fund’s investment manager.
Note 1: Officer information is current as of the date of this report. It is possible that after this date, information about officers may change.
The Sarbanes-Oxley Act of 2002 and Rules adopted by the U.S. Securities and Exchange Commission require the Fund to disclose whether the Fund’s Audit Committee includes at least one member who is an audit committee financial expert within the meaning of such Act and Rules. The Fund’s Board has determined that there is at least one such financial expert on the Audit Committee and has designated each of Edward I. Altman, Ph.D., Ann Torre Bates and David W. Niemiec as an audit committee financial expert. The Board believes that Messrs. Altman and Niemiec and Ms. Bates qualify as such an expert in view of their extensive business background and experience. Mr. Altman has served as a member of the Fund Audit Committee since 1987. He currently serves as a Max L. Hine Professor of Finance, Emeritus and Director of The Credit and Debt Markets Research Program, Salomon Center, Stern School of Business, New York University. Ms. Bates has served as a member of the Fund Audit Committee since 1995. She currently serves as a director of Ares Capital Corporation (2010-present) and United Natural Foods, Inc. (2013-present) and was formerly a director of Navient Corporation from 2014 to 2016, SLM Corporation from 1997 to 2014 and Allied Capital Corporation from 2003 to 2010, Executive Vice President and Chief Financial Officer of NHP Incorporated from 1995 to 1997 and Vice President and Treasurer of US Airways, Inc. until 1995. Mr. Niemiec has served as a member of the Fund Audit Committee since 2015, currently serves as an Advisor to Saratoga Partners and was formerly its Managing Director from 1998 to 2001 and serves as a director of Hess Midstream LP (2017-present). Mr. Niemiec was formerly a director of Emeritus Corporation from 1999 to 2010 and OSI Pharmaceuticals, Inc. from 2006 to 2010, Managing Director of SBC Warburg Dillon Read from 1997 to 1998, and was Vice Chairman from 1991 to 1997 and Chief Financial Officer from 1982 to 1997 of Dillon, Read & Co. Inc. As a result of such background and experience, the Board believes that Messrs. Altman and Niemiec and Ms. Bates have each acquired an understanding of generally accepted accounting principles and financial statements, the general application of such principles in connection with the accounting estimates, accruals and reserves, and analyzing and evaluating financial statements that present a breadth and level of complexity of accounting issues generally comparable to those of the Fund, as well as an understanding of internal controls and procedures for financial reporting and an understanding of audit committee functions. Messrs. Altman and Niemiec and Ms. Bates are independent Board members as that term is defined under the applicable U.S. Securities and Exchange Commission Rules and Releases.
The Statement of Additional Information (SAI) includes additional information about the board members and is available, without charge, upon request. Shareholders may call (800) DIALBEN/342-5236 to request the SAI.
| franklintempleton.com | Annual Report | 43 | ||
FRANKLIN MUTUAL SERIES FUNDS
FRANKLIN MUTUAL EUROPEAN FUND
Proxy Voting Policies and Procedures
The Fund’s investment manager has established Proxy Voting Policies and Procedures (Policies) that the Fund uses to determine how to vote proxies relating to portfolio securities. Shareholders may view the Fund’s complete Policies online at franklintempleton.com. Alternatively, shareholders may request copies of the Policies free of charge by calling the Proxy Group collect at (954)527-7678 or by sending a written request to: Franklin Templeton Companies, LLC, 300 S.E. 2nd Street, Fort Lauderdale, FL 33301, Attention: Proxy Group. Copies of the Fund’s proxy voting records are also made available online at franklintempleton.com and posted on the U.S. Securities and Exchange Commission’s website at sec.gov and reflect the most recent12-month period ended June 30.
Quarterly Statement of Investments
The Trust, on behalf of the Fund, files a complete statement of investments with the U.S. Securities and Exchange Commission for the first and third quarters for each fiscal year as an exhibit to its report on FormN-PORT. Shareholders may view the filed FormN-PORT by visiting the Commission’s website at sec.gov. The filed form may also be viewed and copied at the Commission’s Public Reference Room in Washington, DC. Information regarding the operations of the Public Reference Room may be obtained by calling(800) SEC-0330.
Householding of Reports and Prospectuses
You will receive the Fund’s financial reports every six months as well as an annual updated summary prospectus (prospectus available upon request). To reduce Fund expenses, we try to identify related shareholders in a household and send only one copy of the financial reports and summary prospectus. This process, called “householding,” will continue indefinitely unless you instruct us otherwise. If you prefer not to have these documents householded, please call us at (800)632-2301. At any time you may view current prospectuses/summary prospectuses and financial reports on our website. If you choose, you may receive these documents through electronic delivery.
44 | Annual Report | franklintempleton.com | ||
Authorized for distribution only when accompanied or preceded by a summary prospectus and/or prospectus. Investors should carefully consider a fund’s investment goals, risks, charges and expenses before investing. A prospectus contains this and other information; please read it carefully before investing.
To help ensure we provide you with quality service, all calls to and from our service areas are monitored and/or recorded.
| | Annual Report and Shareholder Letter Franklin Mutual European Fund | |||||
| Investment Manager | Distributor | Shareholder Services | ||||
| Franklin Mutual Advisers, LLC | Franklin Templeton Distributors, Inc. | (800)632-2301 - (Class A, C, R & | ||||
| (800) DIAL BEN®/342-5236 | R6) | |||||
| franklintempleton.com | (800)448-FUND - (Class Z) | |||||
| © 2020 Franklin Templeton Investments. All rights reserved. | 478 A 02/20 |
Sign up for electronic delivery at franklintempleton.com/edelivery
Internet Delivery of Fund Reports Unless You Request Paper Copies: Effective January 1, 2021, as permitted by the SEC, paper copies of the Fund’s shareholder reports will no longer be sent by mail, unless you specifically request them from the Fund or your financial intermediary. Instead, the reports will be made available on a website, and you will be notified by mail each time a report is posted and provided with a website link to access the report.
If you already elected to receive shareholder reports electronically, you will not be affected by this change and you need not take any action. If you have not signed up for electronic delivery, we would encourage you to join fellow shareholders who have. You may elect to receive shareholder reports and other communications electronically from the Fund by calling (800)632-2301 or by contacting your financial intermediary.
You may elect to continue to receive paper copies of all your future shareholder reports free of charge by contacting your financial intermediary or, if you invest directly with a Fund, calling (800)632-2301 to let the Fund know of your request. Your election to receive reports in paper will apply to all funds held in your account.
FRANKLIN TEMPLETON
Successful investing begins with ambition. And achievement only comes when you reach for it. That’s why we continually strive to deliver better outcomes for investors. No matter what your goals are, our deep, global investment expertise allows us to offer solutions that can help.
During our more than 70 years of experience, we’ve managed through all kinds of markets—up, down and those in between. We’re always preparing for what may come next. It’s because of this, combined with our strength as one of the world’s largest asset managers that we’ve earned the trust of millions of investors around the world.
Dear Franklin Mutual Quest Fund Shareholder:
As we enter 2020, the factors that lifted stocks to record highs in 2019—accommodative central bank monetary policies and progress on a proposed trade deal between the U.S. and China—continue to be sources of optimism for growth. The near-term threat of recession has eased, with the U.S. economy showing resilience as low unemployment and moderately rising wages have encouraged consumer spending, which has supported the expansion. In contrast, business investment and exports were weak in 2019, but there are nascent signs of increasing industrial activity.
Tariffs, trade battles and geopolitical conflict may continue to dominate headlines in 2020 and account for a disproportionate source of market volatility. The U.S. and China agreed in principle to aphase-one trade agreement in late 2019. However, are-escalation of the tariff dispute between the world’s two largest economies is not out of the question, as negotiations on aphase-two trade agreement are scheduled to start after the anticipatedphase-one signing ceremony in January. There was clarity on Brexit as British voters delivered a resounding election victory to Prime Minister Boris Johnson and his Conservative Party, which should pave the way for a conclusive exit agreement. The terms of U.K. departure, however, must still be finalized. Late in the period, tensions in the Middle East were on the rise, following the death of an American contractor in Iraq in late December and a retaliatory U.S. military strike two days later.
During the period, we took advantage of market turbulence to seek out a larger number of stocks whose risk/reward profiles turned more favorable. Subsequently, we used the market appreciation to exit from or trim select positions that reached or exceeded our estimates of intrinsic value. Market volatility continues to present occasional opportunities in
individual stocks, and in certain sectors, notably those considered to be economically sensitive. We continue to focus on situations in which company-specific actions are more important than economic improvement in driving shareholder value.
Valuation is an essential factor in our analysis, and we always ask ourselves if current and potential investments represent an attractive balance of risk and reward. Amid theall-time highs reached by the Standard & Poor’s® 500 Index (S&P 500®) during the period, we maintained our focus on individual securities and the prospects for each business in the context of its valuation and the backdrop of potential political and economic risks.
We continue to adhere to abottom-up stock selection process that is disciplined, driven by rigorous fundamental analysis, and that attempts to limit downside risk. In our view, actively investing in underappreciated and misunderstood companies with identifiable catalysts for unlocking shareholder value can offer meaningful upside potential and a degree of downside protection in periods of financial market turbulence.
We recognize the important role of financial advisors in today’s markets and encourage investors to continue to seek their advice. Amid changing markets and economic conditions, we are confident investors with a well-diversified portfolio and a patient, long-term outlook will be well positioned for the years ahead.
On the following pages, the Fund’s portfolio management team reviews investment decisions that pertain to performance during the past 12 months considering the
| Not FDIC Insured | May Lose Value | No Bank Guarantee |
| franklintempleton.com | Not part of the annual report | 1 | ||
economic environment and other factors. Please remember all securities markets fluctuate, as do mutual fund share prices.
We thank you for investing with Franklin Templeton, welcome your questions and comments, and look forward to continuing to serve your investment needs in the years ahead.
Sincerely,
Peter A. Langerman
Chairman, President and Chief Executive Officer
Franklin Mutual Advisers, LLC
This letter reflects our analysis and opinions as of December 31, 2019, unless otherwise indicated. The information is not a complete analysis of every aspect of any market, country, industry, security or fund. Statements of fact are from sources considered reliable.
| Contents |
| |||||
|
| |||||
| 3 | ||||||
| 9 | ||||||
| 12 | ||||||
| 13 | ||||||
| 25 | ||||||
| 30 | ||||||
| Report of Independent Registered Public Accounting Firm | 45 | |||||
| 46 | ||||||
| 47 | ||||||
| 52 | ||||||
| ||||||
Visitfranklintempleton.comfor fund updates, to access your account, or to find helpful financial planning tools. |
| |||||
2 | Not part of the annual report | franklintempleton.com | ||
This annual report for Franklin Mutual Quest Fund covers the fiscal year ended December 31, 2019.
Your Fund’s Goal and Main Investments
The Fund seeks capital appreciation, which may occasionally be short term, with income as a secondary goal. Under normal market conditions, the Fund invests substantially to primarily in equity securities of U.S. and foreign companies that we believe are available at market prices less than their intrinsic value. The equity securities in which the Fund invests are primarily common stock, with a current focus onmid- andlarge-cap companies. To a lesser extent, the Fund also invests in merger arbitrage securities and the debt and equity of distressed companies. The Fund may invest a substantial portion, potentially up to 100% of its assets, in foreign securities, which may include sovereign debt and participations in foreign government debt. The Geographic Composition bar chart on this page lists the leading countries where the Fund invests.
Performance Overview
The Fund’s Class Z shares posted a +12.40% cumulative total return for the 12 months ended December 31, 2019. In comparison, the Fund’s benchmark, the MSCI World Index (USD), which tracks stock performance in global developed markets, posted a total return of +28.40%.1 Also for comparison, the Fund’s secondary benchmark, the Bloomberg Barclays U.S. Corporate High Yield Index, which measures the U.S. corporate market ofnon-investment grade, fixed-rate corporate bonds, defined as the middle or lower ratings of Moody’s, Fitch and Standard & Poor’s, posted a +14.32% total return.1 You can find more of the Fund’s performance data in the Performance Summary beginning on page 9.
Geographic Composition*
Based on Total Net Assets as of 12/31/19
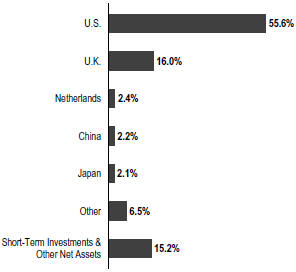
*Figures are stated as a percentage of total and may not equal 100% or may be negative due to rounding, use of any derivatives, unsettled trades or other factors.
Performance data represent past performance, which does not guarantee future results. Investment return and principal value will fluctuate, and you may have a gain or loss when you sell your shares. Current performance may differ from figures shown. For most recentmonth-end performance, go tofranklintempleton.comor call(800)342-5236.
Economic and Market Overview
Global developed and emerging market stocks, as measured by the MSCI All Country World Index (USD), posted a +27.30% total return during the 12 months ended December 31, 2019.1 Although global economic growth slowed from 2018, interest-rate cuts from many central banks and the easing of trade tensions nearperiod-end contributed to the generally positive environment for equities worldwide. Reflecting investor optimism and slowing but resilient economic growth, stocks advanced in every major region of the globe.
1. Source: Morningstar.
The indexes are unmanaged and include reinvestment of any income or distributions. They do not reflect any fees, expenses or sales charges. One cannot invest directly in an index, and an index is not representative of the Fund’s portfolio.
The dollar value, number of shares or principal amount, and names of all portfolio holdings are listed in the Fund’s Statement of Investments (SOI).
The SOI begins on page 18.
| franklintempleton.com | Annual Report | 3 | ||
FRANKLIN MUTUAL QUEST FUND
In the U.S., solid economic growth also supported equities, as healthy consumer spending and a strong labor market kept the economy afloat. The unemployment rate fell during the year, reaching 3.5% in September, November and December 2019, the lowest recorded unemployment rate in 50 years.2 Wages also grew, albeit at a moderate pace, and inflation remained persistently low. In addition, deficit spending by the U.S. government boosted current growth at the expense of long-term debt. Despite the strength in the consumer sector, some parts of the economy struggled, particularly heavy industry. Annual industrial production contracted late in the reporting period, manufacturing output stalled and capital spending declined.
The U.S. Federal Reserve (Fed) provided a substantial boost to equity markets early in the reporting period as it shifted to a more accommodative monetary policy. In January 2019, the Fed signaled the end of its tightening cycle and cut the federal funds rate three times thereafter, lowering it to a range of 1.50%–1.75%. Stocks responded positively to the interest-rate cuts and gained further in December 2019 after the Fed indicated it would likely leave interest rates unchanged in 2020.
Growth slowed overall in the eurozone, particularly in Germany and Italy. Germany, which is heavily reliant on exports, was adversely affected by the trade conflict between the U.S. and China and the resulting slowdown in global trade. In Italy, political uncertainty and budget concerns caused the country’s annual gross domestic product (GDP) growth to stall in 2019’s first quarter before modestly improving in the second and third quarters. Despite sluggish economic conditions, European developed market equities, as measured by the MSCI EuropeIndex-NR (Local Currency), posted a +23.75% total return for the12-month period, as easing trade tensions buoyed investor optimism and an electoral victory by the Conservative Party in the U.K. alleviated uncertainty surrounding Brexit.3 Although the European Central Bank left its headline refinancing rate unchanged, it lowered the deposit rate and restarted its bond-buying stimulus program, further supporting stocks.
Economic growth in Asia was relatively solid overall, despite slowdowns in several large emerging market countries, such as China and India. Japan’s economy grew amid the Bank of Japan’s sizable stimulus program. The trade war between the U.S. and China provided the backdrop for Asian stocks, which rose and fell in sync with investor sentiment regarding
a trade deal. A phase one trade agreement between the two countries reached in December 2019 propelled Asian developed and emerging market stocks, which ultimately ended with a +19.23% total return over the12-month period, as measured by the MSCI All Country Asia Index (USD).4
Emerging market stocks overall experienced several sharp selloffs and subsequent rebounds throughout the reporting period before ending with gains. In aggregate, economic growth slowed somewhat from 2018 but remained solid, although there was some variation among individual countries. Many central banks in emerging markets cut interest rates throughout the reporting period, which, along with resilient GDP growth, provided a supportive environment for equities. Russian stocks posted the highest returns among emerging markets as the threat of further sanctions receded and a solid fiscal environment reassured investors. Overall, global emerging markets, as measured by the MSCI Emerging Markets Index (USD), posted a +18.90% total return for the12-month period.1
Investment Strategy
At Franklin Mutual Series, we are committed to our distinctive value approach to investing, which we believe can generate above-average risk-adjusted returns over time for our shareholders. Our major investment strategy is investing in undervalued stocks. When selecting undervalued equities, we are attracted to what we believe are fundamentally strong companies with healthy balance sheets, high-quality assets, substantial free cash flow and shareholder-oriented management teams and whose stocks are trading at discounts to our assessment of the companies’ intrinsic or business value. We also look for asset-rich companies whose shares may be trading at depressed levels due to concerns over short-term earnings disappointments, litigation, management strategy or other perceived negatives. This strict value approach is not only intended to improve the likelihood of capital appreciation, but also reduces the risk of substantial declines, in our opinion. While the vast majority of our undervalued equity investments are made in publicly traded companies globally, we may invest occasionally in privately held companies as well.
To a lesser extent, we complement this more traditional investment strategy with two others. One is distressed investing, a highly specialized field that has proven quite profitable during certain periods over the years. Distressed investing is complex and can take many forms. The most
2. Source: U.S. Bureau of Labor Statistics.
3. Source: Morningstar. Net Returns (NR) include income net of withholding when dividends are paid.
4. Source: MSCI.
4 | Annual Report | franklintempleton.com | ||
FRANKLIN MUTUAL QUEST FUND
common distressed investment the Fund undertakes is the purchase of financially troubled or bankrupt companies’ debt at a substantial discount to face value. After the financially distressed company is reorganized, often in bankruptcy court, the old debt is typically replaced with new securities issued by the financially stronger company.
The other piece of our investment strategy is participating in arbitrage situations, another highly specialized field. When companies announce proposed mergers or takeovers, commonly referred to as deals, the target company may trade at a discount to the bid it ultimately accepts. One form of arbitrage involves purchasing the target company’s stock when it is trading below the value we believe it would receive in a deal. In keeping with our commitment to a relatively conservative investment approach, we typically focus our arbitrage efforts on announced deals, and avoid rumored deals or other situations we consider relatively risky. The current percentages of the Fund’s assets devoted to these investment strategies are listed in the Asset Allocation bar chart on this page. In addition, it is our practice to hedge the Fund’s currency exposure when we deem it advantageous for our shareholders.
What is meant by “hedge”?
To hedge an investment is to take a position intended to offset potential losses that may be incurred by a companion financial instrument. Hedging an investment may also offset potential gains.
|
Manager’s Discussion
The end of a decade is a natural time for reflection about the years that have just passed and to look ahead to what the next 10 might have in store. Across Wall Street, we see many prognostications, and while we are not in the forecasting business, we do allow ourselves to think about investment opportunities over such an extended time period. But experience has taught us that while trying to predict the exact course of markets and/or economic and political events that will drive them may be fun, it is not all that useful.
As 2010 began, the global economy was still recovering from the Global Financial Crisis. The U.S. government owned significant portions of the banking and automotive sectors. The Fed had already started quantitative easing (QE), with QE 2 and QE 3 still to come. In Europe, concerns about
Asset Allocation*
Based on Total Net Assets as of 12/31/19
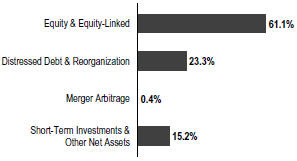
*Figures are stated as a percentage of total and may not equal 100% or may be negative due to rounding, use of any derivatives, unsettled trades or other factors.
Greece’s finances were emerging, and in China the effects of 2009’s massive stimulus programs were starting to take hold.
Over the subsequent years we saw ongoing, global QE, culminating in trillions of dollars of debt yielding negative interest rates. The European Union (EU) was in continuous upheaval, with Greece threatening to leave, but eventually staying in the eurozone; the U.K. pursuing and achieving Brexit; and ongoing strain between core members Germany, France, Italy and Spain. In the U.S., average annual economic growth was restrained and finished the decade below 2%, trailing the minimum 3% expectation of prior decades. Strong corporate profits and lower corporate tax rates were bright spots.
Equity markets delivered a very good decade—one of the best in history—with the MSCI World Index (USD) and the S&P 500 posting average annual total returns of +10.08% and +13.56%, respectively.1 During the decade, Franklin Mutual Quest Fund, Class Z posted an average annual total return of +6.91%, a solid absolute return that nonetheless lagged the MSCI World Index (USD), its benchmark. The Fund’s value strategy, which seeks to identify mispriced securities and limit downside risk, was out of favor in an environment that generally encouraged investors to assume more risk. Conversely, the Fund’s Class Z shares posted an average annual total return of +7.92% in the prior decade, compared with +0.23% for the MSCI World Index (USD).5 Our active investment approach focusing on individual opportunities was more conducive to the prior decade’s greater volatility.
5. Source: Morningstar.
The index is unmanaged and includes reinvestment of any income or distributions. It does not reflect any fees, expenses or sales charges. One cannot invest directly in an index, and an index is not representative of the Fund’s portfolio.
See www.franklintempletondatasources.com for additional data provider information.
| franklintempleton.com | Annual Report | 5 | ||
FRANKLIN MUTUAL QUEST FUND
In our view, going forward we expect more political and monetary uncertainty and economic growth in unexpected places. Corporate profits will have good years and bad years. Some industries will be massively disrupted, while others will find a way to adjust and prosper, even within the context of artificial intelligence and machine learning. Recent events, such as the coronavirus outbreak, have caused, and may continue to cause, uncertainty and volatility in the Chinese economy, potentially leading to vulnerability in 2020 global growth expectations. As for investment positioning, we intend to avoid forecasts that would lead us to make the Fund’s success dependent on a specific set of outcomes. Rather, we will seek to continue with our time-tested value process and complement it with new tools that enhance our security evaluation and selection process. To that end, we have integrated risk and quantitative portfolio analysis tools that provide us with fresh insights about performance, and help us identify companies and securities that we believe satisfy our investors’ goals of risk-adjusted returns that are not wholly dependent on any one economic or political scenario.
Fund Performance
Turning to Fund performance, top positive contributors included British American Tobacco, Charter Communications and Voya Financial. British American Tobacco and Voya Financial are listed among the Fund’s largest positions in the Top 10 Equity Holdings table on page 7.
Shares of U.K.-based British American Tobacco rebounded in November, lifted by management’s guidance that revenue and profit would be in the upper half of its target range. Sentiment also improved following decisions by U.S. regulators that reversed previous stances on nicotine. The U.S. Department of Health and Human Services dropped a proposal to cut the level of nicotine in cigarettes, and the U.S. Food and Drug Administration removed nicotine from its regulatory agenda.
Shares of U.S.-based cable operator Charter Communications surged after the company reported operating and financial results that were broadly ahead of consensus estimates. Capital expenditures were lower than expected and drove free cash flow, which was used during the period to buy back $3.1 billion of the company’s stock. The market was anticipating share repurchases totaling $2.25 billion. Revenue accelerated 5.1% compared with consensus forecasts of 4.5%. The increased revenue, however, did not reflect the impact of a broad-based increase in per subscriber fees implemented during the period, which could drive revenue growth and margin expansion in 2020. According to the company’s management, there has not
Top 10 Sectors/Industries
Based on Equity Securities as of 12/31/19
% of Total Net Assets | ||||
Insurance | 9.6% | |||
Oil, Gas & Consumable Fuels | 8.6% | |||
Tobacco | 7.8% | |||
Media | 7.8% | |||
Pharmaceuticals | 6.3% | |||
Communications Equipment | 3.5% | |||
Diversified Financial Services | 3.3% | |||
Software | 3.2% | |||
Interactive Media & Services | 2.4% | |||
Aerospace & Defense | 2.3% | |||
been a meaningful decrease in customers as a result of the higher per subscriber fees.
Shares of U.S.-based investment and insurance company Voya Financial rallied in September after reporting earnings that beat consensus expectations, and the company expanded its stock buyback program. Voya’s shares also surged in December after the company announced that it was selling its individual life and othernon-retirement annuities businesses to Resolution Life Group Holdings (not a Fund holding) for $1.7 billion. Voya’s management said it expects to use $600 million to $800 million of the proceeds to pay down debt and between $900 million and $1.1 billion for stock repurchases in 2020.
During the period under review, Fund investments that detracted from performance included Baidu, Envision Healthcare and Occidental Petroleum.
Shares of China-based internet search firm Baidu slid after the company posted a 2019 first-quarter loss, attributable to a weaker Chinese economy and increased governmental regulation that hindered advertising sales growth. Earnings improved in subsequent quarters, but the overhang from the U.S.-China trade dispute hampered the stock price. Management continues to invest heavily in its video-streaming platform and other initiatives, such as artificial intelligence. We believe these investments may help Baidu further diversify its business into new growth markets.
Our bond holdings of Envision Healthcare, a U.S.-based physician and ambulatory services company, declined in value following a rating agency downgrade of its senior secured and senior unsecured debt to B and CCC+, respectively. The move by Standard & Poor’s (S&P) follows aone-notch downgrade across the company’s ratings by Moody’s in September that dropped the unsecured rating to
6 | Annual Report | franklintempleton.com | ||
FRANKLIN MUTUAL QUEST FUND
Caa2. S&P cited lower-than-expected cash flow as reason for the downgrade. Global investment firm KKR acquired Envision Healthcare in 2018 through a leveraged buyout. We maintain a position in Envision as it continues to offer an attractive yield.
The stock of Occidental Petroleum, a U.S.-based petroleum and chemical products company, traded lower in 2019 as investors struggled to accept its acquisition of Anadarko Petroleum, during a period in which energy stocks were under pressure from falling crude oil prices. We think the Anadarko deal should be highly beneficial to the company’s per share metrics, although the acquisition will make the company more dependent on oil prices, while significantly weakening its balance sheet. The acquired Permian Basin assets complement Occidental’s existing portfolio, and the considerable free cash flow generated from Anadarko’s Gulf of Mexico operations can help reduce debt and support its dividend. Occidental’s management is strengthening the company’s financial position by disposing ofnon-core assets, which is key to restoring investor confidence, in our view.
During the period, the Fund held currency forwards and futures seeking to hedge most of the currency risk of the portfolio’snon-U.S. dollar investments. The hedges had a modestly positive overall impact on the Fund’s performance.
What is a currency forward?
A currency forward is a direct agreement between the Fund and a counterparty to buy or sell a foreign currency in exchange for another currency at a specific exchange rate on a future date.
|
What is a future?
A future is an agreement between the Fund and a counterparty made through a U.S. or foreign futures exchange to buy or sell an underlying instrument or asset at a specific price on a future date.
|
As fellow shareholders, we found recent relative performance disappointing, but it is not uncommon for our strategy to lag the equity markets at times. We remain committed to our disciplined, value investment approach as we seek to generate attractive, long-term, risk-adjusted returns for shareholders.
Top 10 Equity Holdings
12/31/19
Company Sector/Industry, Country | % of Total Net Assets | |||
British American Tobacco PLC Tobacco, U.K. | 4.3% | |||
Sorenson Communications LLC Communications Equipment, U.S. | 3.5% | |||
Eli Lilly & Co. Pharmaceuticals, U.S. | 2.4% | |||
Baidu Inc. Interactive Media & Services, China | 2.4% | |||
Voya Financial Inc. Diversified Financial Services, U.S. | 2.3% | |||
Discovery Inc. Media, U.S. | 2.3% | |||
Everest Re Group Ltd. Insurance, U.S. | 2.3% | |||
JXTG Holdings Inc. Oil, Gas & Consumable Fuels, Japan | 2.1% | |||
Liberty Global PLC Media, U.K. | 2.1% | |||
Imperial Brands PLC Tobacco, U.K. | 2.0% | |||
Thank you for your participation in Franklin Mutual Quest Fund. We look forward to continuing to serve your investment needs.
 |
Shawn M. Tumulty Co-Portfolio Manager | |
 |
Keith Luh, CFA Co-Portfolio Manager | |


| CFA®is a trademark owned by CFA Institute. |
| franklintempleton.com | Annual Report | 7 | ||
FRANKLIN MUTUAL QUEST FUND
The foregoing information reflects our analysis, opinions and portfolio holdings as of December 31, 2019, the end of the reporting period. The way we implement our main investment strategies and the resulting portfolio holdings may change depending on factors such as market and economic conditions. These opinions may not be relied upon as investment advice or an offer for a particular security. The information is not a complete analysis of every aspect of any market, country, industry, security or the Fund. Statements of fact are from sources considered reliable, but the investment manager makes no representation or warranty as to their completeness or accuracy. Although historical performance is no guarantee of future results, these insights may help you understand our investment management philosophy.
8 | Annual Report | franklintempleton.com | ||
FRANKLIN MUTUAL QUEST FUND
Performance Summary as of December 31, 2019
The performance table and graphs do not reflect any taxes that a shareholder would pay on Fund dividends, capital gain distributions, if any, or any realized gains on the sale of Fund shares. Total return reflects reinvestment of the Fund’s dividends and capital gain distributions, if any, and any unrealized gains or losses. Your dividend income will vary depending on dividends or interest paid by securities in the Fund’s portfolio, adjusted for operating expenses of each class. Capital gain distributions are net profits realized from the sale of portfolio securities.
Performance as of 12/31/19
Cumulative total return excludes sales charges. Average annual total return includes maximum sales charges. Sales charges will vary depending on the size of the investment and the class of share purchased. The maximum is 5.50% and the minimum is 0%.Class A:5.50% maximum initial sales charge. For other share classes, visitfranklintempleton.com.
| Share Class | Cumulative Total Return1 | Average Annual Total Return2 | ||||
Z | ||||||
1-Year | +12.40% | +12.40% | ||||
5-Year | +22.93% | +4.21% | ||||
10-Year | +94.98% | +6.91% | ||||
A3 | ||||||
1-Year | +12.14% | +5.99% | ||||
5-Year | +21.40% | +2.79% | ||||
10-Year | +89.74% | +6.01% | ||||
Performance data represent past performance, which does not guarantee future results. Investment return and principal value will fluctuate, and you may have a gain or loss when you sell your shares. Current performance may differ from figures shown. For most recentmonth-end performance, go tofranklintempleton.comor call(800)342-5236.
See page 11 for Performance Summary footnotes.
| franklintempleton.com | Annual Report | 9 | ||
FRANKLIN MUTUAL QUEST FUND
PERFORMANCE SUMMARY
Total Return Index Comparison for a Hypothetical $10,000 Investment
Total return represents the change in value of an investment over the periods shown. It includes any applicable maximum sales charge, Fund expenses, account fees and reinvested distributions. The unmanaged indexes include reinvestment of any income or distributions. They differ from the Fund in composition and do not pay management fees or expenses. One cannot invest directly in an index.
Class Z(1/1/10–12/31/19)
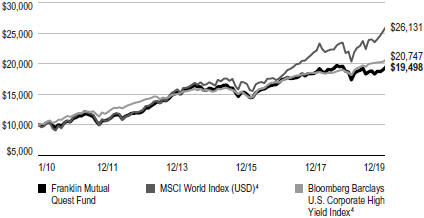
Class A(1/1/10–12/31/19)
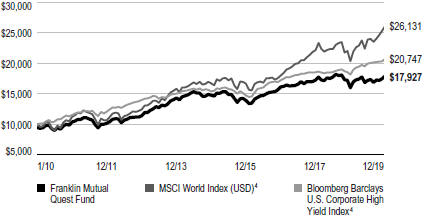
See page 11 for Performance Summary footnotes.
10 | Annual Report | franklintempleton.com | ||
FRANKLIN MUTUAL QUEST FUND
PERFORMANCE SUMMARY
Distributions(1/1/19–12/31/19)
| Share Class | Net Investment Income | |||
Z | $0.4954 | |||
A | $0.4582 | |||
C | $0.3334 | |||
R | $0.4192 | |||
R6 | $0.5048 | |||
Total Annual Operating Expenses5
| Share Class | ||||
| Z | 0.78 | % | ||
| A | 1.03 | % | ||
Each class of shares is available to certain eligible investors and has different annual fees and expenses, as described in the prospectus.
All investments involve risks, including possible loss of principal. Value securities may not increase in price as anticipated or may decline further in value. Special risks are associated with foreign investing, including currency fluctuations, economic instability and political developments. Because the Fund may invest its assets in companies in a specific region, including Europe, it is subject to greater risks of adverse developments in that region and/or the surrounding regions than a fund that is more broadly diversified geographically. Current political and financial uncertainty surrounding the European Union may increase market volatility and the economic risk of investing in companies in Europe. Smaller-company stocks have exhibited greater price volatility than larger-company stocks, particularly over the short term. The Fund’s investments in companies engaged in mergers, reorganizations or liquidations also involve special risks as pending deals may not be completed on time or on favorable terms. The Fund may invest in lower-rated bonds, which entail higher credit risk. The Fund’s prospectus also includes a description of the main investment risks.
1. Cumulative total return represents the change in value of an investment over the periods indicated.
2. Average annual total return represents the average annual change in value of an investment over the periods indicated. Return for less than one year, if any, has not been annualized.
3. Prior to 9/10/18, these shares were offered at a higher initial sales charge of 5.75%, thus actual returns (with sales charges) would have differed. Average annual total returns (with sales charges) have been restated to reflect the current maximum initial sales charge of 5.50%..
4. Source: Morningstar. The MSCI World Index (USD) is a free float-adjusted, market capitalization-weighted index designed to measure equity market performance in global developed markets. The Bloomberg Barclays U.S. Corporate High Yield Index measures the U.S. corporate market ofnon-investment grade, fixed-rate corporate bonds, defined as the middle or lower ratings of Moody’s, Fitch and Standard & Poor’s (Ba1/BB+/BB+).
5. Figures are as stated in the Fund’s current prospectus and may differ from the expense ratios disclosed in the Your Fund’s Expenses and Financial Highlights sections in this report. In periods of market volatility, assets may decline significantly, causing total annual Fund operating expenses to become higher than the figures shown.
See www.franklintempletondatasources.com for additional data provider information.
| franklintempleton.com | Annual Report | 11 | ||
FRANKLIN MUTUAL QUEST FUND
As a Fund shareholder, you can incur two types of costs: (1) transaction costs, including sales charges (loads) on Fund purchases and redemptions; and (2) ongoing Fund costs, including management fees, distribution and service(12b-1) fees, and other Fund expenses. All mutual funds have ongoing costs, sometimes referred to as operating expenses. The table below shows ongoing costs of investing in the Fund and can help you understand these costs and compare them with those of other mutual funds. The table assumes a $1,000 investment held for the six months indicated.
Actual Fund Expenses
The table below provides information about actual account values and actual expenses in the columns under the heading “Actual.” In these columns the Fund’s actual return, which includes the effect of Fund expenses, is used to calculate the “Ending Account Value” for each class of shares. You can estimate the expenses you paid during the period by following these steps (of course, your account value and expenses will differ from those in this illustration): Divide your account value by $1,000 (if your account had an $8,600 value, then $8,600÷ $1,000 = 8.6). Then multiply the result by the number in the row for your class of shares under the headings “Actual” and “Expenses Paid During Period” (if Actual Expenses Paid During Period were $7.50, then 8.6 x $7.50 = $64.50). In this illustration, the actual expenses paid this period are $64.50.
Hypothetical Example for Comparison with Other Funds
Under the heading “Hypothetical” in the table, information is provided about hypothetical account values and hypothetical expenses based on the Fund’s actual expense ratio and an assumed rate of return of 5% per year before expenses, which is not the Fund’s actual return. This information may not be used to estimate the actual ending account balance or expenses you paid for the period, but it can help you compare ongoing costs of investing in the Fund with those of other funds. To do so, compare this 5% hypothetical example for the class of shares you hold with the 5% hypothetical examples that appear in the shareholder reports of other funds.
Please note that expenses shown in the table are meant to highlight ongoing costs and do not reflect any transactional costs. Therefore, information under the heading “Hypothetical” is useful in comparing ongoing costs only, and will not help you compare total costs of owning different funds. In addition, if transactional costs were included, your total costs would have been higher.
Actual (actual return after expenses) | Hypothetical (5% annual return before expenses) | |||||||||||||||||
|
| |||||||||||||||||
Share Class | Beginning Account Value 7/1/19 | Ending Account Value 12/31/19 | Expenses Paid During Period 7/1/19–12/31/191,2 | Ending Account Value 12/31/19 | Expenses Paid During 7/1/19–12/31/191,2 | Net Annualized Expense Ratio2 | ||||||||||||
|
|
|
| |||||||||||||||
| Z | $1,000 | $1,044.20 | $4.02 | $1,021.27 | $3.97 | 0.78% | ||||||||||||
| A | $1,000 | $1,042.90 | $5.30 | $1,020.01 | $5.24 | 1.03% | ||||||||||||
| C | $1,000 | $1,039.40 | $9.15 | $1,016.23 | $9.05 | 1.78% | ||||||||||||
| R | $1,000 | $1,041.50 | $6.59 | $1,018.75 | $6.51 | 1.28% | ||||||||||||
| R6 | $1,000 | $1,044.10 | $3.71 | $1,021.58 | $3.67 | 0.72% | ||||||||||||
1. Expenses are equal to the annualized expense ratio for thesix-month period as indicated above—in the far right column—multiplied by the simple average account value over the period indicated, and then multiplied by 184/365 to reflect theone-half year period.
2. Reflects expenses after fee waivers and expense reimbursements, for Class R6.
12 | Annual Report | franklintempleton.com | ||
FRANKLIN MUTUAL SERIES FUNDS
Franklin Mutual Quest Fund
| Year Ended December 31, | ||||||||||||||||||||
| 2019 | 2018 | 2017 | 2016 | 2015 | ||||||||||||||||
Class Z | ||||||||||||||||||||
Per share operating performance (for a share outstanding throughout the year) | ||||||||||||||||||||
Net asset value, beginning of year | $12.95 | $15.83 | $15.52 | $14.47 | $16.21 | |||||||||||||||
Income from investment operationsa: | ||||||||||||||||||||
Net investment incomeb | 0.45 | 0.48 | 0.58 | 0.87c | 0.54 | |||||||||||||||
Net realized and unrealized gains (losses) | 1.16 | (1.58) | 0.49 | 1.47 | (1.45) | |||||||||||||||
Total from investment operations | 1.61 | (1.10) | 1.07 | 2.34 | (0.91) | |||||||||||||||
Less distributions from: | ||||||||||||||||||||
Net investment income | (0.50) | (0.58) | (0.63) | (1.01) | (0.68) | |||||||||||||||
Net realized gains | — | (1.20) | (0.13) | (0.28) | (0.15) | |||||||||||||||
Total distributions | (0.50) | (1.78) | (0.76) | (1.29) | (0.83) | |||||||||||||||
Net asset value, end of year | $14.06 | $12.95 | $15.83 | $15.52 | $14.47 | |||||||||||||||
Total return | 12.40% | (6.85)% | 6.92% | 16.26% | (5.55)% | |||||||||||||||
Ratios to average net assets | ||||||||||||||||||||
Expensesd,e | 0.78% | 0.78% | 0.79% | 0.79%f | 0.82%f | |||||||||||||||
Expenses incurred in connection with securities sold short | 0.02% | —%g | —% | 0.01% | 0.03% | |||||||||||||||
Net investment income | 3.22% | 2.96% | 3.65% | 5.74%c | 3.35% | |||||||||||||||
Supplemental data | ||||||||||||||||||||
Net assets, end of year (000’s) | $3,042,387 | $3,054,792 | $3,667,351 | $3,683,095 | $3,577,696 | |||||||||||||||
Portfolio turnover rate | 60.96% | 115.52% | 32.90% | 44.04% | 30.51% | |||||||||||||||
aThe amount shown for a share outstanding throughout the period may not correlate with the Statement of Operations for the period due to the timing of sales and repurchases of the Fund’s shares in relation to income earned and/or fluctuating fair value of the investments of the Fund.
bBased on average daily shares outstanding.
cNet investment income per share includes approximately $0.05 per share related to income received in the form of special dividends in connection with certain Fund holdings. Excluding this amount, the ratio of net investment income to average net assets would have been 5.42%.
dIncludes dividend and/or interest expense on securities sold short and security borrowing fees, if any. See below for the ratios of such expenses to average net assets for the periods presented. See Note 1(e).
eBenefit of expense reduction rounds to less than 0.01%.
fBenefit of waiver and payments by affiliates rounds to less than 0.01%.
gRounds to less than 0.01%.
| franklintempleton.com | The accompanying notes are an integral part of these financial statements. | Annual Report | 13 | ||
FRANKLIN MUTUAL SERIES FUNDS
FINANCIAL HIGHLIGHTS
Franklin Mutual Quest Fund(continued)
| Year Ended December 31, | ||||||||||||||||||||
| 2019 | 2018 | 2017 | 2016 | 2015 | ||||||||||||||||
Class A | ||||||||||||||||||||
Per share operating performance (for a share outstanding throughout the year) | ||||||||||||||||||||
Net asset value, beginning of year | $12.75 | $15.60 | $15.32 | $14.29 | $16.02 | |||||||||||||||
Income from investment operationsa: | ||||||||||||||||||||
Net investment incomeb | 0.41 | 0.43 | 0.53 | 0.83c | 0.49 | |||||||||||||||
Net realized and unrealized gains (losses) | 1.14 | (1.54) | 0.46 | 1.45 | (1.43 | ) | ||||||||||||||
Total from investment operations | 1.55 | (1.11) | 0.99 | 2.28 | (0.94 | ) | ||||||||||||||
Less distributions from: | ||||||||||||||||||||
Net investment income | (0.46 | ) | (0.54 | ) | (0.58 | ) | (0.97 | ) | (0.64 | ) | ||||||||||
Net realized gains | — | (1.20 | ) | (0.13 | ) | (0.28 | ) | (0.15 | ) | |||||||||||
Total distributions | (0.46) | (1.74) | (0.71) | (1.25) | (0.79 | ) | ||||||||||||||
Net asset value, end of year | $13.84 | $12.75 | $15.60 | $15.32 | $14.29 | |||||||||||||||
Total returnd | 12.14% | (7.00)% | 6.54% | 16.04% | (5.85)% | |||||||||||||||
Ratios to average net assets | ||||||||||||||||||||
Expensese,f | 1.03% | 1.03% | 1.04% | 1.04% | g | 1.10% | g | |||||||||||||
Expenses incurred in connection with securities sold short | 0.02% | —% | h | —% | 0.01% | 0.03% | ||||||||||||||
Net investment income | 2.97% | 2.71% | 3.40% | 5.49%c | 3.07% | |||||||||||||||
Supplemental data | ||||||||||||||||||||
Net assets, end of year (000’s) | $1,035,699 | $1,067,382 | $1,153,870 | $1,216,085 | $1,203,508 | |||||||||||||||
Portfolio turnover rate | 60.96% | 115.52% | 32.90% | 44.04% | 30.51% | |||||||||||||||
aThe amount shown for a share outstanding throughout the period may not correlate with the Statement of Operations for the period due to the timing of sales and repurchases of the Fund’s shares in relation to income earned and/or fluctuating fair value of the investments of the Fund.
bBased on average daily shares outstanding.
cNet investment income per share includes approximately $0.05 per share related to income received in the form of special dividends in connection with certain Fund holdings. Excluding this amount, the ratio of net investment income to average net assets would have been 5.17%.
dTotal return does not reflect sales commissions or contingent deferred sales charges, if applicable.
eIncludes dividend and/or interest expense on securities sold short and security borrowing fees, if any. See below for the ratios of such expenses to average net assets for the periods presented. See Note 1(e).
fBenefit of expense reduction rounds to less than 0.01%.
gBenefit of waiver and payments by affiliates rounds to less than 0.01%.
hRounds to less than 0.01%.
14 | Annual Report | The accompanying notes are an integral part of these financial statements. | franklintempleton.com | ||
FRANKLIN MUTUAL SERIES FUNDS
FINANCIAL HIGHLIGHTS
Franklin Mutual Quest Fund(continued)
| Year Ended December 31, | ||||||||||||||||||||
| 2019 | 2018 | 2017 | 2016 | 2015 | ||||||||||||||||
Class C | ||||||||||||||||||||
Per share operating performance (for a share outstanding throughout the year) | ||||||||||||||||||||
Net asset value, beginning of year | $12.64 | $15.35 | $15.06 | $14.08 | $15.78 | |||||||||||||||
Income from investment operationsa: | ||||||||||||||||||||
Net investment incomeb | 0.30 | 0.29 | 0.41 | 0.70c | 0.36 | |||||||||||||||
Net realized and unrealized gains (losses) | 1.12 | (1.49) | 0.47 | 1.41 | (1.39 | ) | ||||||||||||||
Total from investment operations | 1.42 | (1.20) | 0.88 | 2.11 | (1.03 | ) | ||||||||||||||
Less distributions from: | ||||||||||||||||||||
Net investment income | (0.33) | (0.31) | (0.46) | (0.85) | (0.52 | ) | ||||||||||||||
Net realized gains | — | (1.20) | (0.13) | (0.28) | (0.15 | ) | ||||||||||||||
Total distributions | (0.33) | (1.51) | (0.59) | (1.13) | (0.67 | ) | ||||||||||||||
Net asset value, end of year | $13.73 | $12.64 | $15.35 | $15.06 | $14.08 | |||||||||||||||
Total returnd | 11.26% | (7.77)% | 5.89% | 15.10% | (6.49)% | |||||||||||||||
Ratios to average net assets | ||||||||||||||||||||
Expensese,f | 1.78% | 1.78% | 1.79% | 1.79% | g | 1.82% | g | |||||||||||||
Expenses incurred in connection with securities sold short | 0.02% | —% | h | —% | 0.01% | 0.03% | ||||||||||||||
Net investment income | 2.22% | 1.96% | 2.65% | 4.74%c | 2.35% | |||||||||||||||
Supplemental data | ||||||||||||||||||||
Net assets, end of year (000’s) | $112,751 | $141,619 | $309,160 | $343,624 | $337,974 | |||||||||||||||
Portfolio turnover rate | 60.96% | 115.52% | 32.90% | 44.04% | 30.51% | |||||||||||||||
aThe amount shown for a share outstanding throughout the period may not correlate with the Statement of Operations for the period due to the timing of sales and repurchases of the Fund’s shares in relation to income earned and/or fluctuating fair value of the investments of the Fund.
bBased on average daily shares outstanding.
cNet investment income per share includes approximately $0.05 per share related to income received in the form of special dividends in connection with certain Fund holdings. Excluding this amount, the ratio of net investment income to average net assets would have been 4.42%.
dTotal return does not reflect sales commissions or contingent deferred sales charges, if applicable.
eIncludes dividend and/or interest expense on securities sold short and security borrowing fees, if any. See below for the ratios of such expenses to average net assets for the periods presented. See Note 1(e).
fBenefit of expense reduction rounds to less than 0.01%.
gBenefit of waiver and payments by affiliates rounds to less than 0.01%.
hRounds to less than 0.01%.
| franklintempleton.com | The accompanying notes are an integral part of these financial statements. | Annual Report | 15 | ||
FRANKLIN MUTUAL SERIES FUNDS
FINANCIAL HIGHLIGHTS
Franklin Mutual Quest Fund(continued)
| Year Ended December 31, | ||||||||||||||||||||
| 2019 | 2018 | 2017 | 2016 | 2015 | ||||||||||||||||
Class R | ||||||||||||||||||||
Per share operating performance (for a share outstanding throughout the year) | ||||||||||||||||||||
Net asset value, beginning of year | $12.54 | $15.40 | $15.14 | $14.14 | $15.87 | |||||||||||||||
Income from investment operationsa: | ||||||||||||||||||||
Net investment incomeb | 0.37 | 0.39 | 0.50 | 0.78 | c | 0.44 | ||||||||||||||
Net realized and unrealized gains (losses) | 1.12 | (1.53 | ) | 0.46 | 1.43 | (1.40 | ) | |||||||||||||
Total from investment operations | 1.49 | (1.14 | ) | 0.96 | 2.21 | (0.96 | ) | |||||||||||||
Less distributions from: | ||||||||||||||||||||
Net investment income | (0.42 | ) | (0.52 | ) | (0.57 | ) | (0.93 | ) | (0.62 | ) | ||||||||||
Net realized gains | — | (1.20 | ) | (0.13 | ) | (0.28 | ) | (0.15 | ) | |||||||||||
Total distributions | (0.42 | ) | (1.72 | ) | (0.70 | ) | (1.21 | ) | (0.77 | ) | ||||||||||
Net asset value, end of year | $13.61 | $12.54 | $15.40 | $15.14 | $14.14 | |||||||||||||||
Total return | 11.88% | (7.31)% | 6.38% | 15.69% | (6.03)% | |||||||||||||||
Ratios to average net assets | ||||||||||||||||||||
Expensesd,e | 1.28% | 1.28% | 1.29% | 1.29% | f | 1.32% | f | |||||||||||||
Expenses incurred in connection with securities sold short | 0.02% | —% | g | —% | 0.01% | 0.03% | ||||||||||||||
Net investment income | 2.72% | 2.46% | 3.15% | 5.24% | c | 2.85% | ||||||||||||||
Supplemental data | ||||||||||||||||||||
Net assets, end of year (000’s) | $3,415 | $2,929 | $1,774 | $880 | $898 | |||||||||||||||
Portfolio turnover rate | 60.96% | 115.52% | 32.90% | 44.04% | 30.51% | |||||||||||||||
aThe amount shown for a share outstanding throughout the period may not correlate with the Statement of Operations for the period due to the timing of sales and repurchases of the Fund’s shares in relation to income earned and/or fluctuating fair value of the investments of the Fund.
bBased on average daily shares outstanding.
cNet investment income per share includes approximately $0.05 per share related to income received in the form of special dividends in connection with certain Fund holdings. Excluding this amount, the ratio of net investment income to average net assets would have been 4.92%.
dIncludes dividend and/or interest expense on securities sold short and security borrowing fees, if any. See below for the ratios of such expenses to average net assets for the periods presented. See Note 1(e).
eBenefit of expense reduction rounds to less than 0.01%.
fBenefit of waiver and payments by affiliates rounds to less than 0.01%.
gRounds to less than 0.01%.
16 | Annual Report | The accompanying notes are an integral part of these financial statements. | franklintempleton.com | ||
FRANKLIN MUTUAL SERIES FUNDS
FINANCIAL HIGHLIGHTS
Franklin Mutual Quest Fund(continued)
| Year Ended December 31, | ||||||||||||||||||||
| 2019 | 2018 | 2017 | 2016 | 2015 | ||||||||||||||||
Class R6 | ||||||||||||||||||||
Per share operating performance (for a share outstanding throughout the year) | ||||||||||||||||||||
Net asset value, beginning of year | $12.94 | $15.81 | $15.51 | $14.45 | $16.19 | |||||||||||||||
Income from investment operationsa: | ||||||||||||||||||||
Net investment incomeb | 0.46 | 0.49 | 0.64 | 0.88 | c | 0.55 | ||||||||||||||
Net realized and unrealized gains (losses) | 1.15 | (1.57 | ) | 0.43 | 1.48 | (1.44 | ) | |||||||||||||
Total from investment operations | 1.61 | (1.08 | ) | 1.07 | 2.36 | (0.89 | ) | |||||||||||||
Less distributions from: | ||||||||||||||||||||
Net investment income | (0.50 | ) | (0.59 | ) | (0.64 | ) | (1.02 | ) | (0.70 | ) | ||||||||||
Net realized gains | — | (1.20 | ) | (0.13 | ) | (0.28 | ) | (0.15 | ) | |||||||||||
Total distributions | (0.50 | ) | (1.79 | ) | (0.77 | ) | (1.30 | ) | (0.85 | ) | ||||||||||
Net asset value, end of year | $14.05 | $12.94 | $15.81 | $15.51 | $14.45 | |||||||||||||||
Total return | 12.40% | (6.73 | )% | 6.94% | 16.44% | (5.54)% | ||||||||||||||
Ratios to average net assets | ||||||||||||||||||||
Expenses before waiver and payments by affiliatesd | 0.74% | 0.74% | 0.72% | 0.71% | 0.74% | |||||||||||||||
Expenses net of waiver and payments by affiliatesd,e | 0.72% | 0.72% | 0.72% | 0.71% | f | 0.74% | f | |||||||||||||
Expenses incurred in connection with securities sold short | 0.02% | —% | g | —% | 0.01% | 0.03% | ||||||||||||||
Net investment income | 3.28% | 3.02% | 3.72% | 5.82% | c | 3.43% | ||||||||||||||
Supplemental data | ||||||||||||||||||||
Net assets, end of year (000’s) | $107,723 | $116,012 | $123,863 | $52,277 | $41,408 | |||||||||||||||
Portfolio turnover rate | 60.96% | 115.52% | 32.90% | 44.04% | 30.51% | |||||||||||||||
aThe amount shown for a share outstanding throughout the period may not correlate with the Statement of Operations for the period due to the timing of sales and repurchases of the Fund’s shares in relation to income earned and/or fluctuating fair value of the investments of the Fund.
bBased on average daily shares outstanding.
cNet investment income per share includes approximately $0.05 per share related to income received in the form of special dividends in connection with certain Fund holdings. Excluding this amount, the ratio of net investment income to average net assets would have been 5.50%.
dIncludes dividend and/or interest expense on securities sold short and security borrowing fees, if any. See below for the ratios of such expenses to average net assets for the periods presented. See Note 1(e).
eBenefit of expense reduction rounds to less than 0.01%.
fBenefit of waiver and payments by affiliates rounds to less than 0.01%.
gRounds to less than 0.01%.
| franklintempleton.com | The accompanying notes are an integral part of these financial statements. | Annual Report | 17 | ||
FRANKLIN MUTUAL SERIES FUNDS
Statement of Investments, December 31, 2019
Franklin Mutual Quest Fund
| Country | Shares/ Rights/ Units/ Warrants | Value | ||||||||||
Common Stocks and Other Equity Interests 67.0% | ||||||||||||
Aerospace & Defense 2.3% | ||||||||||||
BAE Systems PLC | United Kingdom | 7,240,981 | $ | 54,166,111 | ||||||||
Huntington Ingalls Industries Inc. | United States | 186,900 | 46,889,472 | |||||||||
|
| |||||||||||
| 101,055,583 | ||||||||||||
|
| |||||||||||
Auto Components 0.0%† | ||||||||||||
a,b,cInternational Automotive Components Group Brazil LLC | Brazil | 2,548,299 | 92,503 | |||||||||
|
| |||||||||||
Banks 0.5% | ||||||||||||
BNP Paribas SA | France | 180,324 | 10,683,512 | |||||||||
Wells Fargo & Co. | United States | 189,200 | 10,178,960 | |||||||||
|
| |||||||||||
| 20,862,472 | ||||||||||||
|
| |||||||||||
Chemicals 0.4% | ||||||||||||
dAdvanced Emissions Solutions Inc. | United States | 1,724,209 | 18,104,195 | |||||||||
|
| |||||||||||
Commercial Services & Supplies 0.7% | ||||||||||||
aAdvanced Disposal Services Inc. | United States | 865,200 | 28,439,124 | |||||||||
|
| |||||||||||
Communications Equipment 3.5% | ||||||||||||
a,b,c,dSorenson Communications LLC, Membership Interests | United States | 224,279 | 152,057,986 | |||||||||
|
| |||||||||||
Diversified Consumer Services 0.0% | ||||||||||||
a,bAffinion Group Holdings Inc., wts., 4/10/24 | United States | 48,381 | — | |||||||||
|
| |||||||||||
Diversified Financial Services 3.3% | ||||||||||||
aM&G PLC | United Kingdom | 13,937,492 | 43,785,960 | |||||||||
Voya Financial Inc. | United States | 1,638,886 | 99,939,268 | |||||||||
|
| |||||||||||
| 143,725,228 | ||||||||||||
|
| |||||||||||
Diversified Telecommunication Services 1.0% | ||||||||||||
AT&T Inc. | United States | 720,975 | 28,175,703 | |||||||||
aIntelsat SA | United States | 1,002,495 | 7,047,540 | |||||||||
aZayo Group Holdings Inc. | United States | 199,800 | 6,923,070 | |||||||||
|
| |||||||||||
| 42,146,313 | ||||||||||||
|
| |||||||||||
Energy Equipment & Services 0.1% | ||||||||||||
Baker Hughes Co., A | United States | 162,400 | 4,162,312 | |||||||||
|
| |||||||||||
Food Products 1.2% | ||||||||||||
Bunge Ltd. | United States | 627,878 | 36,134,379 | |||||||||
Conagra Brands Inc. | United States | 509,612 | 17,449,115 | |||||||||
|
| |||||||||||
| 53,583,494 | ||||||||||||
|
| |||||||||||
Health Care Equipment & Supplies 1.2% | ||||||||||||
Envista Holdings Corp. | United States | 721,049 | 21,371,893 | |||||||||
Medtronic PLC | United States | 250,543 | 28,424,103 | |||||||||
|
| |||||||||||
| 49,795,996 | ||||||||||||
|
| |||||||||||
Independent Power & Renewable Electricity Producers 1.3% | ||||||||||||
Vistra Energy Corp. | United States | 2,401,437 | 55,209,037 | |||||||||
|
| |||||||||||
18 | Annual Report | franklintempleton.com | ||
FRANKLIN MUTUAL SERIES FUNDS
STATEMENT OF INVESTMENTS
Franklin Mutual Quest Fund(continued)
| Country | Shares/ Rights/ Units/ Warrants | Value | ||||||||||
Common Stocks and Other Equity Interests(continued) | ||||||||||||
Insurance 9.6% | ||||||||||||
ASR Nederland NV | Netherlands | 1,510,686 | $ | 56,517,139 | ||||||||
aBrighthouse Financial Inc. | United States | 1,987,579 | 77,972,724 | |||||||||
Everest Re Group Ltd. | United States | 353,566 | 97,881,211 | |||||||||
The Hartford Financial Services Group Inc. | United States | 1,044,190 | 63,455,426 | |||||||||
Lancashire Holdings Ltd. | United Kingdom | 45,105 | 458,201 | |||||||||
NN Group NV | Netherlands | 1,223,210 | 46,393,223 | |||||||||
RSA Insurance Group PLC | United Kingdom | 9,614,692 | 72,024,514 | |||||||||
|
| |||||||||||
| 414,702,438 | ||||||||||||
|
| |||||||||||
Interactive Media & Services 2.4% | ||||||||||||
aBaidu Inc., ADR | China | 805,393 | 101,801,675 | |||||||||
|
| |||||||||||
IT Services 1.6% | ||||||||||||
Cognizant Technology Solutions Corp., A | United States | 1,124,900 | 69,766,298 | |||||||||
|
| |||||||||||
Machinery 1.6% | ||||||||||||
aNavistar International Corp. | United States | 2,355,409 | 68,165,537 | |||||||||
|
| |||||||||||
Media 7.8% | ||||||||||||
aCharter Communications Inc., A | United States | 93,270 | 45,243,412 | |||||||||
aClear Channel Outdoor Holdings Inc. | United States | 16,963,460 | 48,515,496 | |||||||||
aDiscovery Inc., C | United States | 3,223,884 | 98,296,223 | |||||||||
Gannett Co. Inc. | United States | 2,768,935 | 17,665,805 | |||||||||
aiHeartMedia Inc., A | United States | 1,623,513 | 27,437,370 | |||||||||
a,biHeartMedia Inc., B | United States | 23,770 | 341,456 | |||||||||
aiHeartMedia Inc., wts., A, 5/01/39 | United States | 1,872 | 31,635 | |||||||||
a,dLee Enterprises Inc./IA | United States | 3,245,968 | 4,609,275 | |||||||||
a,b,c,dLee Enterprises Inc., wts., 12/31/22 | United States | 1,110,000 | 130,691 | |||||||||
aLiberty Global PLC, C. | United Kingdom | 4,194,789 | 91,425,426 | |||||||||
|
| |||||||||||
| 333,696,789 | ||||||||||||
|
| |||||||||||
Oil, Gas & Consumable Fuels 8.6% | ||||||||||||
BP PLC | United Kingdom | 9,261,430 | 57,847,875 | |||||||||
Caltex Australia Ltd. | Australia | 582,961 | 13,886,724 | |||||||||
Canadian Natural Resources Ltd. | Canada | 182,800 | 5,912,213 | |||||||||
JXTG Holdings Inc. | Japan | 20,035,237 | 91,792,450 | |||||||||
Kinder Morgan Inc. | United States | 415,470 | 8,795,500 | |||||||||
Marathon Oil Corp. | United States | 3,163,559 | 42,961,131 | |||||||||
Occidental Petroleum Corp. | United States | 1,229,030 | 50,648,326 | |||||||||
Plains All American Pipeline LP | United States | 199,100 | 3,661,449 | |||||||||
Royal Dutch Shell PLC, A | United Kingdom | 1,467,136 | 43,049,789 | |||||||||
The Williams Cos. Inc. | United States | 2,208,222 | 52,379,026 | |||||||||
|
| |||||||||||
| 370,934,483 | ||||||||||||
|
| |||||||||||
Pharmaceuticals 6.4% | ||||||||||||
Allergan PLC | United States | 202,983 | 38,804,260 | |||||||||
aBristol-Myers Squibb Co., rts., 2/01/49 | United States | 295,300 | 888,853 | |||||||||
Eli Lilly & Co. | United States | 796,911 | 104,738,013 | |||||||||
Novartis AG, ADR | Switzerland | 529,806 | 50,167,330 | |||||||||
| franklintempleton.com | Annual Report | 19 | ||
FRANKLIN MUTUAL SERIES FUNDS
STATEMENT OF INVESTMENTS
Franklin Mutual Quest Fund(continued)
| Country | Shares/ Rights/ Units/ Warrants | Value | ||||||||||
Common Stocks and Other Equity Interests(continued) | ||||||||||||
Pharmaceuticals(continued) | ||||||||||||
Perrigo Co. PLC. | United States | 1,564,842 | $ | 80,839,738 | ||||||||
|
| |||||||||||
| 275,438,194 | ||||||||||||
|
| |||||||||||
Software 3.2% | ||||||||||||
aAvaya Holdings Corp. | United States | 168 | 2,268 | |||||||||
aAvaya Holdings Corp., wts., 12/15/22 | United States | 338,090 | 405,708 | |||||||||
aCheck Point Software Technologies Ltd. | Israel | 517,511 | 57,423,021 | |||||||||
NortonLifeLock Inc. | United States | 1,505,152 | 38,411,479 | |||||||||
Oracle Corp. | United States | 769,800 | 40,784,004 | |||||||||
|
| |||||||||||
| 137,026,480 | ||||||||||||
|
| |||||||||||
Specialty Retail 1.2% | ||||||||||||
Dufry AG | Switzerland | 30,278 | 3,004,489 | |||||||||
Tiffany & Co. | United States | 153,164 | 20,470,369 | |||||||||
a,b,dTRU Kids Parent LLC | United States | 7,104 | 26,506,829 | |||||||||
a,b,dWayne Services Legacy Inc. | United States | 7,104 | — | |||||||||
|
| |||||||||||
| 49,981,687 | ||||||||||||
|
| |||||||||||
Tobacco 7.8% | ||||||||||||
Altria Group Inc. | United States | 1,356,100 | 67,682,951 | |||||||||
British American Tobacco PLC | United Kingdom | 4,311,835 | 184,544,818 | |||||||||
Imperial Brands PLC | United Kingdom | 3,434,804 | 85,025,036 | |||||||||
|
| |||||||||||
| 337,252,805 | ||||||||||||
|
| |||||||||||
Wireless Telecommunication Services 1.3% | ||||||||||||
Vodafone Group PLC | United Kingdom | 28,081,388 | 54,583,557 | |||||||||
|
| |||||||||||
Total Common Stocks and Other Equity Interests | 2,882,584,186 | |||||||||||
|
| |||||||||||
Convertible Preferred Stocks (Cost $26,071,880) 0.7% | ||||||||||||
Multi-Utilities 0.7% | ||||||||||||
Sempra Energy, 6.00%, cvt. pfd., A | United States | 245,650 | 29,482,913 | |||||||||
|
| |||||||||||
Preferred Stocks 1.4% | ||||||||||||
Auto Components 0.3% | ||||||||||||
eSchaeffler AG, 5.713%, pfd | Germany | 1,365,000 | 14,738,343 | |||||||||
|
| |||||||||||
Technology Hardware, Storage & Peripherals 1.1% | ||||||||||||
eSamsung Electronics Co. Ltd., 3.119%, pfd | South Korea | 1,162,517 | 45,656,339 | |||||||||
|
| |||||||||||
Total Preferred Stocks (Cost $32,648,785) | 60,394,682 | |||||||||||
|
| |||||||||||
20 | Annual Report | franklintempleton.com | ||
FRANKLIN MUTUAL SERIES FUNDS
STATEMENT OF INVESTMENTS
Franklin Mutual Quest Fund(continued)
| Country | Principal Amount* | Value | ||||||||||
Corporate Bonds, Notes and Senior Floating Rate Interests 16.5% | ||||||||||||
f,gAffinion Group Inc., Term Loan, 7.549%,(1-month USD LIBOR + 5.75%), 4/05/24 | United States | $ | 18,650,677 | $ | 16,055,118 | |||||||
hBanff Merger Sub Inc., senior note, 144A, 9.75%, 9/01/26 | United States | 50,000,000 | 50,751,250 | |||||||||
Envision Healthcare Corp., | ||||||||||||
hsenior note, 144A, 8.75%, 10/15/26 | United States | 140,000,000 | 87,198,650 | |||||||||
f,gTerm Loan B, 5.549%,(1-month USD LIBOR + 3.75%), 10/11/25 | United States | 40,639,624 | 34,871,073 | |||||||||
Frontier Communications Corp., | ||||||||||||
h second lien, 144A, 8.50%, 4/01/26 | United States | 25,000,000 | 25,358,750 | |||||||||
senior note, 8.875%, 9/15/20 | United States | 21,382,000 | 11,653,190 | |||||||||
senior note, 10.50%, 9/15/22 | United States | 77,063,000 | 37,784,914 | |||||||||
senior note, 11.00%, 9/15/25 | United States | 41,812,000 | 20,383,350 | |||||||||
hsenior secured note, first lien, 144A, 8.00%, 4/01/27 | United States | 20,000,000 | 20,937,000 | |||||||||
hiHeartCommunications Inc., first lien, 144A, 4.75%, 1/15/28 | United States | 25,000,000 | 25,604,250 | |||||||||
hIntelsat Connect Finance SA, senior note, 144A, 9.50%, 2/15/23 | Luxembourg | 47,845,000 | 33,596,759 | |||||||||
Intelsat Jackson Holdings SA, | ||||||||||||
senior bond, 5.50%, 8/01/23 | Luxembourg | 39,750,000 | 34,320,945 | |||||||||
f,gTermB-3 Loan, 5.682%,(3-month USD LIBOR + 3.75%), 11/27/23 | Luxembourg | 8,000,000 | 8,026,000 | |||||||||
dLee Enterprises Inc., | ||||||||||||
g Second Lien Term Loan, 12.00%, 12/15/22 | United States | 34,317,486 | 34,210,244 | |||||||||
hsenior secured note, first lien, 144A, 9.50%, 3/15/22 | United States | 97,050,000 | 90,529,405 | |||||||||
hNavistar International Corp., senior note, 144A, 6.625%, 11/01/25 | United States | 18,270,000 | 18,650,655 | |||||||||
d,f,gSorenson Communications LLC, Initial Term Loans, 8.445%,(3-month USD LIBOR + 6.50%), 3/14/24 | United States | 12,535,714 | 12,473,036 | |||||||||
f,gVeritas U.S. Inc, | ||||||||||||
Term Loan B1, 6.299%,(1-month USD LIBOR + 4.50%), 1/27/23 | United States | 19,230,693 | 18,589,676 | |||||||||
Term Loan B1, 6.445%,(3-month USD LIBOR + 4.50%), 1/27/23 | United States | 3,694,357 | 3,571,213 | |||||||||
hVeritas U.S. Inc./Veritas Bermuda Ltd., | ||||||||||||
senior note, 144A, 7.50%, 2/01/23 | United States | 3,682,000 | 3,683,528 | |||||||||
senior note, 144A, 10.50%, 2/01/24 | United States | 30,222,000 | 28,043,447 | |||||||||
f,gWindstream Services LLC, | ||||||||||||
iRevolving Commitment, 7.75%, (Prime + 3.00%), 4/24/20 | United States | 74,847,868 | 70,169,876 | |||||||||
Term Loan B6, 9.75%, (Prime + 5.00%), 3/30/21 | United States | 12,922,000 | 12,398,194 | |||||||||
hZayo Group LLC/Zayo Capital Inc., senior note, 144A, 5.75%, 1/15/27 | United States | 9,923,000 | 10,112,505 | |||||||||
|
| |||||||||||
Total Corporate Bonds, Notes and Senior Floating Rate Interests | 708,973,028 | |||||||||||
|
| |||||||||||
| Shares | ||||||||||||
Companies in Liquidation 0.0%† | ||||||||||||
a,b,jClear Channel Communications Inc., Contingent Distribution | United States | 72,867,000 | — | |||||||||
a,b,jiHeartCommunications Inc., Contingent Distribution | United States | 61,658,229 | — | |||||||||
a,b,jTribune Media, Litigation Trust, Contingent Distribution | United States | 1,524,556 | — | |||||||||
a,b,jVistra Energy Corp., Litigation Trust, Contingent Distribution | United States | 104,175,133 | 57,296 | |||||||||
a,b,jWalter Energy Inc., Litigation Trust, Contingent Distribution | United States | 7,443,000 | — | |||||||||
|
| |||||||||||
Total Companies in Liquidation (Cost $3,234,626) |
|
57,296 |
| |||||||||
|
| |||||||||||
| franklintempleton.com | Annual Report | 21 | ||
FRANKLIN MUTUAL SERIES FUNDS
STATEMENT OF INVESTMENTS
Franklin Mutual Quest Fund(continued)
| | Number of Contracts |
| | Notional Amount | # | Value | ||||||
Options Purchased 0.0%† | ||||||||||||
Calls - Exchange-Traded | ||||||||||||
Tiffany & Co., January Strike Price $130.00, Expires 1/17/20 | 500 | 50,000 | $ | 187,500 | ||||||||
|
| |||||||||||
Puts - Exchange-Traded | ||||||||||||
Tiffany & Co., February Strike Price $100.00, Expires 2/21/20 | 500 | 50,000 | — | |||||||||
|
| |||||||||||
Total Options Purchased (Cost $230,039) | 187,500 | |||||||||||
|
| |||||||||||
Total Investments before Short Term Investments | 3,681,679,605 | |||||||||||
|
| |||||||||||
| Country | Principal Amount* | |||||||||||
Short Term Investments 14.3% | ||||||||||||
U.S. Government and Agency Securities 14.3% | ||||||||||||
kFHLB, 1/02/20 | United States | $ | 54,100,000 | 54,100,000 | ||||||||
kU.S. Treasury Bill, | ||||||||||||
1/16/20 | United States | 50,000,000 | 49,972,923 | |||||||||
1/21/20 | United States | 50,000,000 | 49,961,341 | |||||||||
1/23/20 | United States | 50,000,000 | 49,957,271 | |||||||||
l2/06/20 - 2/20/20 | United States | 58,000,000 | 57,900,974 | |||||||||
l3/05/20 | United States | 50,000,000 | 49,868,969 | |||||||||
3/19/20 | United States | 50,000,000 | 49,842,079 | |||||||||
5/21/20 | United States | 80,000,000 | 79,526,722 | |||||||||
1/02/20 - 5/28/20 | United States | 125,000,000 | 124,781,971 | |||||||||
6/25/20 | United States | 50,000,000 | 49,627,882 | |||||||||
|
| |||||||||||
Total U.S. Government and Agency Securities | 615,540,132 | |||||||||||
|
| |||||||||||
Total Investments (Cost $4,255,055,927) 99.9% | 4,297,219,737 | |||||||||||
Options Written (0.0)%† | (1,454,500 | ) | ||||||||||
Securities Sold Short (0.8)% | (33,371,164 | ) | ||||||||||
Other Assets, less Liabilities 0.9% | 39,580,323 | |||||||||||
|
| |||||||||||
Net Assets 100.0% | $ | 4,301,974,396 | ||||||||||
|
| |||||||||||
| Number of Contracts | Notional Amount# | |||||||||||
mOptions Written (0.0)%† | ||||||||||||
Puts - Exchange-Traded | ||||||||||||
Allergan PLC, January Strike Price $150.00, Expires 1/17/20 | 500 | 50,000 | (4,500 | ) | ||||||||
Intelsat SA, January Strike Price $10.00, Expires 1/17/20 | 5,000 | 500,000 | (1,450,000 | ) | ||||||||
NortonLifeLock Inc., January Strike Price $20.00, Expires 1/17/20 | 354 | 35,400 | — | |||||||||
|
| |||||||||||
Total Options Written (Premiums received $1,488,625) | $ | (1,454,500 | ) | |||||||||
|
| |||||||||||
22 | Annual Report | franklintempleton.com | ||
FRANKLIN MUTUAL SERIES FUNDS
STATEMENT OF INVESTMENTS
Franklin Mutual Quest Fund(continued)
| Country | Shares | Value | ||||||||||
nSecurities Sold Short (0.8)% | ||||||||||||
Common Stocks (0.8)% | ||||||||||||
Biotechnology (0.4)% | ||||||||||||
AbbVie Inc. | United States | 185,248 | $ | (16,401,858 | ) | |||||||
|
| |||||||||||
Equity Real Estate Investment Trusts (REITs) (0.2)% | ||||||||||||
Seritage Growth Properties, A | United States | 176,850 | (7,088,148 | ) | ||||||||
|
| |||||||||||
Internet & Direct Marketing Retail (0.1)% | ||||||||||||
Alibaba Group Holding Ltd., ADR. | China | 32,000 | (6,787,200 | ) | ||||||||
|
| |||||||||||
Pharmaceuticals (0.1)% | ||||||||||||
Bristol-Myers Squibb Co. | United States | 48,200 | (3,093,958 | ) | ||||||||
|
| |||||||||||
Total Securities Sold Short (Proceeds $27,549,135) | $ | (33,371,164 | ) | |||||||||
|
| |||||||||||
†Rounds to less than 0.1% of net assets.
*The principal amount is stated in U.S. dollars unless otherwise indicated.
#Notional amount is the number of units specified in the contract, and can include currency units, bushels, shares, pounds, barrels or other units. Currency units are stated in U.S. dollars unless otherwise indicated.
aNon-income producing.
bFair valued using significant unobservable inputs. See Note 14 regarding fair value measurements.
cSee Note 10 regarding restricted securities.
dSee Note 12 regarding holdings of 5% voting securities.
eVariable rate security. The rate shown represents the yield at period end.
fThe coupon rate shown represents the rate at period end.
gSee Note 1(f) regarding senior floating rate interests.
hSecurity was purchased pursuant to Rule 144A under the Securities Act of 1933 and may be sold in transactions exempt from registration only to qualified institutional buyers or in a public offering registered under the Securities Act of 1933. At December 31, 2019, the aggregate value of these securities was $394,466,199, representing 9.2% of net assets.
iA portion or all of the security purchased on a delayed delivery basis. See Note 1(c).
jContingent distributions represent the right to receive additional distributions, if any, during the reorganization of the underlying company. Shares represent total underlying principal of debt securities.
kThe security was issued on a discount basis with no stated coupon rate.
lA portion or all of the security has been segregated as collateral for securities sold short, open forward exchange contracts and/or open written options contracts. At December 31, 2019, the aggregate value of these securities pledged amounted to $29,369,870, representing 0.7% of net assets.
mSee Note 1(d) regarding written options.
nSee Note 1(e) regarding securities sold short.
At December 31, 2019, the Fund had the following futures contracts outstanding. See Note 1(d).
Futures Contracts
| Description | Type | Number of Contracts | Notional Amount* | Expiration Date | Value/ Unrealized Appreciation (Depreciation) | |||||||||||||||
Currency Contracts | ||||||||||||||||||||
EUR/USD | Short | 456 | $ | 64,307,400 | 3/16/20 | $ | (619,019 | ) | ||||||||||||
GBP/USD | Short | 815 | 67,706,125 | 3/16/20 | (470,278 | ) | ||||||||||||||
|
| |||||||||||||||||||
Total Futures Contracts | $ | (1,089,297 | ) | |||||||||||||||||
|
| |||||||||||||||||||
*As of period end.
| franklintempleton.com | Annual Report | 23 | ||
FRANKLIN MUTUAL SERIES FUNDS
STATEMENT OF INVESTMENTS
Franklin Mutual Quest Fund(continued)
At December 31, 2019, the Fund had the following forward exchange contracts outstanding. See Note 1(d).
Forward Exchange Contracts
| Currency | Counterpartya | Type | Quantity | Contract Amount | Settlement Date | Unrealized Appreciation | Unrealized Depreciation | |||||||||||||||||||||
| ||||||||||||||||||||||||||||
OTC Forward Exchange Contracts |
| |||||||||||||||||||||||||||
Euro | BOFA | Buy | 801,934 | $ | 902,376 | 1/15/20 | $ | — | $ | (2,182 | ) | |||||||||||||||||
Euro | BOFA | Buy | 3,246,460 | 3,618,304 | 1/15/20 | 25,943 | — | |||||||||||||||||||||
Euro | BOFA | Sell | 1,207,142 | 1,343,499 | 1/15/20 | — | (11,554 | ) | ||||||||||||||||||||
Euro | HSBK | Buy | 1,960,830 | 2,204,104 | 1/15/20 | — | (3,013 | ) | ||||||||||||||||||||
Euro | HSBK | Buy | 4,540,126 | 5,044,531 | 1/15/20 | 51,895 | — | |||||||||||||||||||||
Euro | HSBK | Sell | 3,010,000 | 3,380,736 | 1/15/20 | 1,922 | — | |||||||||||||||||||||
Euro | HSBK | Sell | 3,953,824 | 4,425,495 | 1/15/20 | — | (12,789 | ) | ||||||||||||||||||||
Euro | SSBT | Buy | 3,967,769 | 4,409,380 | 1/15/20 | 44,557 | — | |||||||||||||||||||||
Euro | SSBT | Sell | 944,130 | 1,055,268 | 1/15/20 | — | (4,545 | ) | ||||||||||||||||||||
Euro | SSBT | Sell | 23,500,284 | 26,783,828 | 1/15/20 | 404,066 | — | |||||||||||||||||||||
Euro | UBSW | Buy | 1,300,000 | 1,456,221 | 1/15/20 | 3,067 | — | |||||||||||||||||||||
Euro | UBSW | Sell | 8,525,019 | 9,482,275 | 1/15/20 | — | (87,309 | ) | ||||||||||||||||||||
Euro | UBSW | Sell | 20,645,285 | 23,580,461 | 1/15/20 | 405,520 | — | |||||||||||||||||||||
British Pound | BOFA | Buy | 200,000 | 264,626 | 1/16/20 | 390 | — | |||||||||||||||||||||
British Pound | BOFA | Sell | 1,899,342 | 2,401,219 | 1/16/20 | — | (115,561 | ) | ||||||||||||||||||||
British Pound | HSBK | Sell | 7,998,000 | 10,079,853 | 1/16/20 | — | (518,134 | ) | ||||||||||||||||||||
British Pound | SSBT | Sell | 4,100,000 | 5,031,828 | 1/16/20 | — | (400,999 | ) | ||||||||||||||||||||
South Korean Won | HSBK | Buy | 488,257,140 | 421,547 | 1/17/20 | 967 | — | |||||||||||||||||||||
South Korean Won | HSBK | Sell | 6,691,185,784 | 5,605,906 | 1/17/20 | — | (184,324 | ) | ||||||||||||||||||||
South Korean Won | UBSW | Buy | 1,456,517,549 | 1,236,328 | 1/17/20 | 24,073 | — | |||||||||||||||||||||
South Korean Won | UBSW | Sell | 7,038,538,567 | 5,945,409 | 1/17/20 | — | (145,405 | ) | ||||||||||||||||||||
Australian Dollar | HSBK | Sell | 579,063 | 407,498 | 2/14/20 | 741 | — | |||||||||||||||||||||
Australian Dollar | HSBK | Sell | 1,756,404 | 1,225,445 | 2/14/20 | — | (8,322 | ) | ||||||||||||||||||||
Australian Dollar | UBSW | Sell | 16,201,776 | 11,171,682 | 2/14/20 | — | (209,091 | ) | ||||||||||||||||||||
British Pound | BOFA | Sell | 1,213,060 | 1,490,172 | 2/14/20 | — | (118,514 | ) | ||||||||||||||||||||
British Pound | HSBK | Sell | 35,153,784 | 42,820,156 | 2/14/20 | — | (3,798,624 | ) | ||||||||||||||||||||
British Pound | SSBT | Sell | 35,860,914 | 43,697,453 | 2/14/20 | — | (3,859,079 | ) | ||||||||||||||||||||
British Pound | UBSW | Sell | 2,540,286 | 3,158,337 | 2/14/20 | — | (210,433 | ) | ||||||||||||||||||||
Euro | HSBK | Sell | 360,085 | 401,235 | 4/07/20 | — | (5,087 | ) | ||||||||||||||||||||
British Pound | BOFA | Sell | 3,030,008 | 3,911,075 | 4/24/20 | — | (114,632 | ) | ||||||||||||||||||||
British Pound | HSBK | Sell | 82,126,841 | 106,700,323 | 4/24/20 | — | (2,414,408 | ) | ||||||||||||||||||||
South Korean Won | HSBK | Sell | 26,789,185,654 | 23,113,581 | 5/15/20 | — | (158,203 | ) | ||||||||||||||||||||
South Korean Won | UBSW | Sell | 13,913,507,234 | 12,025,494 | 5/15/20 | — | (61,179 | ) | ||||||||||||||||||||
British Pound | BOFA | Sell | 11,372,469 | 14,963,123 | 5/22/20 | — | (157,530 | ) | ||||||||||||||||||||
British Pound | HSBK | Sell | 50,106,954 | 65,195,089 | 5/22/20 | — | (1,426,310 | ) | ||||||||||||||||||||
|
| |||||||||||||||||||||||||||
Total Forward Exchange Contracts |
| $ | 963,141 | $ | (14,027,227 | ) | ||||||||||||||||||||||
|
| |||||||||||||||||||||||||||
Net unrealized appreciation (depreciation) |
| $ | (13,064,086 | ) | ||||||||||||||||||||||||
|
| |||||||||||||||||||||||||||
aMay be comprised of multiple contracts with the same counterparty, currency and settlement date.
See Note 11 regarding other derivative information.
See Abbreviations on page 44.
24 | Annual Report | The accompanying notes are an integral part of these financial statements. | franklintempleton.com | ||
FRANKLIN MUTUAL SERIES FUNDS
Statement of Assets and Liabilities
December 31, 2019
Franklin Mutual Quest Fund
Assets: | ||||
Investments in securities: | ||||
Cost - Unaffiliated issuers | $4,040,212,844 | |||
Cost -Non-controlled affiliates (Note 12) | 214,843,083 | |||
|
| |||
Value - Unaffiliated issuers | $3,958,598,076 | |||
Value -Non-controlled affiliates (Note 12) | 338,621,661 | |||
Cash | 1,918,562 | |||
Foreign currency, at value (cost $11,000,061) | 11,080,152 | |||
Receivables: | ||||
Investment securities sold | 707,926 | |||
Capital shares sold | 2,942,994 | |||
Dividends and interest | 25,798,847 | |||
European Union tax reclaims | 641,529 | |||
Deposits with brokers for: | ||||
Securities sold short | 34,011,788 | |||
Futures contracts | 2,800,620 | |||
Unrealized appreciation on OTC forward exchange contracts | 963,141 | |||
Other assets | 1,017,331 | |||
|
| |||
Total assets | 4,379,102,627 | |||
|
| |||
Liabilities: | ||||
Payables: | ||||
Investment securities purchased | 15,681,574 | |||
Capital shares redeemed | 7,687,950 | |||
Management fees | 2,458,686 | |||
Distribution fees | 325,952 | |||
Transfer agent fees | 489,363 | |||
Trustees’ fees and expenses | 355,665 | |||
Variation margin on futures contracts. | 904,327 | |||
Options written, at value (premiums received $1,488,625) | 1,454,500 | |||
Securities sold short, at value (proceeds $27,549,135) | 33,371,164 | |||
Unrealized depreciation on OTC forward exchange contracts | 14,027,227 | |||
Accrued expenses and other liabilities. | 371,823 | |||
|
| |||
Total liabilities | 77,128,231 | |||
|
| |||
Net assets, at value | $4,301,974,396 | |||
|
| |||
Net assets consist of: | ||||
Paid-in capital | $4,585,790,989 | |||
Total distributable earnings (losses) | (283,816,593 | ) | ||
|
| |||
Net assets, at value | $4,301,974,396 | |||
|
| |||
| franklintempleton.com | The accompanying notes are an integral part of these financial statements. | Annual Report | 25 | ||
FRANKLIN MUTUAL SERIES FUNDS
FINANCIAL STATEMENTS
Statement of Assets and Liabilities(continued)
December 31, 2019
Franklin Mutual Quest Fund
Class Z: | ||||
Net assets, at value | $ | 3,042,386,632 | ||
|
| |||
Shares outstanding | 216,327,127 | |||
|
| |||
Net asset value and maximum offering price per share | $14.06 | |||
|
| |||
Class A: | ||||
Net assets, at value | $ | 1,035,698,582 | ||
|
| |||
Shares outstanding | 74,831,914 | |||
|
| |||
Net asset value per sharea | $13.84 | |||
|
| |||
Maximum offering price per share (net asset value per share ÷ 94.50%) | $14.65 | |||
|
| |||
Class C: | ||||
Net assets, at value | $ | 112,751,137 | ||
|
| |||
Shares outstanding | 8,212,513 | |||
|
| |||
Net asset value and maximum offering price per sharea | $13.73 | |||
|
| |||
Class R: | ||||
Net assets, at value | $ | 3,415,358 | ||
|
| |||
Shares outstanding | 250,970 | |||
|
| |||
Net asset value and maximum offering price per share | $13.61 | |||
|
| |||
Class R6: | ||||
Net assets, at value | $ | 107,722,687 | ||
|
| |||
Shares outstanding | 7,669,500 | |||
|
| |||
Net asset value and maximum offering price per share | $14.05 | |||
|
| |||
aRedemption price is equal to net asset value less contingent deferred sales charges, if applicable.
26 | Annual Report | The accompanying notes are an integral part of these financial statements. | franklintempleton.com | ||
FRANKLIN MUTUAL SERIES FUNDS
FINANCIAL STATEMENTS
Statement of Operations
for the year ended December 31, 2019
Franklin Mutual Quest Fund
Investment income: | ||||
Dividends: (net of foreign taxes)* | ||||
Unaffiliated issuers | $ | 71,115,859 | ||
Non-controlled affiliates (Note 12) | 2,776,405 | |||
Interest: | ||||
Unaffiliated issuers | 86,877,249 | |||
Non-controlled affiliates (Note 12) | 18,774,687 | |||
|
| |||
Total investment income | 179,544,200 | |||
|
| |||
Expenses: | ||||
Management fees (Note 3a) | 30,247,305 | |||
Distribution fees: (Note 3c) | ||||
Class A | 2,724,511 | |||
Class C | 1,307,001 | |||
Class R | 18,225 | |||
Transfer agent fees: (Note 3e) | ||||
Class Z | 2,614,935 | |||
Class A | 908,782 | |||
Class C | 109,007 | |||
Class R | 3,041 | |||
Class R6 | 52,810 | |||
Custodian fees (Note 4) | 153,948 | |||
Reports to shareholders | 237,532 | |||
Registration and filing fees | 158,229 | |||
Professional feesa | (380,032 | ) | ||
Trustees’ fees and expenses | 278,109 | |||
Dividends on securities sold short | 712,090 | |||
Other | 121,359 | |||
|
| |||
Total expenses | 39,266,852 | |||
Expense reductions (Note 4) | (48,450 | ) | ||
Expenses waived/paid by affiliates (Note 3f) | (29,265 | ) | ||
|
| |||
Net expenses | 39,189,137 | |||
|
| |||
Net investment income | 140,355,063 | |||
|
| |||
Realized and unrealized gains (losses): | ||||
Net realized gain (loss) from: | ||||
Investments:# | ||||
Unaffiliated issuers | (239,279,541 | ) | ||
Non-controlled affiliates (Note 12) | 3,315,774 | |||
Written options | 3,551,588 | |||
Foreign currency transactions | (191,291 | ) | ||
Forward exchange contracts | 22,733,552 | |||
Futures contracts | 4,034,394 | |||
Securities sold short | (32,152 | ) | ||
|
| |||
Net realized gain (loss) | (205,867,676 | ) | ||
|
| |||
Net change in unrealized appreciation (depreciation) on: | ||||
Investments: | ||||
Unaffiliated issuers | 631,150,512 | |||
Non-controlled affiliates (Note 12) | (21,819,118 | ) | ||
Translation of other assets and liabilities | 157,456 | |||
Forward exchange contracts | (23,337,473 | ) | ||
Written options | 6,081,893 | |||
| franklintempleton.com | The accompanying notes are an integral part of these financial statements. | Annual Report | 27 | ||
FRANKLIN MUTUAL SERIES FUNDS
FINANCIAL STATEMENTS
Statement of Operations(continued)
for the year ended December 31, 2019
Franklin Mutual Quest Fund
Futures contracts | (1,240,706 | ) | ||
Securities sold short | (7,162,287 | ) | ||
|
| |||
Net change in unrealized appreciation (depreciation) | 583,830,277 | |||
|
| |||
Net realized and unrealized gain (loss) | 377,962,601 | |||
|
| |||
Net increase (decrease) in net assets resulting from operations | $ | 518,317,664 | ||
|
| |||
*Foreign taxes withheld on dividends | $ | 2,317,815 | ||
#Net of foreign taxes | $ | 392,774 |
aIncludes unaffiliated reimbursement of legal fees incurred in connection with certain Fund holdings.
28 | Annual Report | The accompanying notes are an integral part of these financial statements. | franklintempleton.com | ||
FRANKLIN MUTUAL SERIES FUNDS
FINANCIAL STATEMENTS
Statements of Changes in Net Assets
Franklin Mutual Quest Fund
| Year Ended December 31, | ||||||||
| 2019 | 2018 | |||||||
| ||||||||
Increase (decrease) in net assets: | ||||||||
Operations: | ||||||||
Net investment income | $ | 140,355,063 | $ | 143,898,637 | ||||
Net realized gain (loss) | (205,867,676 | ) | 354,503,773 | |||||
Net change in unrealized appreciation (depreciation) | 583,830,277 | (826,097,878 | ) | |||||
|
| |||||||
Net increase (decrease) in net assets resulting from operations | 518,317,664 | (327,695,468 | ) | |||||
|
| |||||||
Distributions to shareholders: | ||||||||
Class Z | (104,723,243 | ) | (375,929,219 | ) | ||||
Class A | (33,694,633 | ) | (130,844,029 | ) | ||||
Class C | (2,725,827 | ) | (15,959,447 | ) | ||||
Class R | (102,662 | ) | (352,629 | ) | ||||
Class R6 | (3,763,980 | ) | (14,194,157 | ) | ||||
|
| |||||||
Total distributions to shareholders | (145,010,345 | ) | (537,279,481 | ) | ||||
|
| |||||||
Capital share transactions: (Note 2) | ||||||||
Class Z | (273,149,893 | ) | (10,462,191 | ) | ||||
Class A | (122,215,243 | ) | 126,783,503 | |||||
Class C | (40,715,515 | ) | (141,318,519 | ) | ||||
Class R | 223,722 | 1,767,885 | ||||||
Class R6 | (18,209,640 | ) | 14,919,716 | |||||
|
| |||||||
Total capital share transactions | (454,066,569 | ) | (8,309,606 | ) | ||||
|
| |||||||
Net increase (decrease) in net assets | (80,759,250 | ) | (873,284,555 | ) | ||||
Net assets: | ||||||||
Beginning of year | 4,382,733,646 | 5,256,018,201 | ||||||
|
| |||||||
End of year | $ | 4,301,974,396 | $ | 4,382,733,646 | ||||
|
| |||||||
| franklintempleton.com | The accompanying notes are an integral part of these financial statements. | Annual Report | 29 | ||
FRANKLIN MUTUAL SERIES FUNDS
Franklin Mutual Quest Fund
1. Organization and Significant Accounting Policies
Franklin Mutual Series Funds (Trust) is registered under the Investment Company Act of 1940 (1940 Act) as anopen-end management investment company, consisting of seven separate funds and applies the specialized accounting and reporting guidance in U.S. Generally Accepted Accounting Principles (U.S. GAAP). Franklin Mutual Quest Fund (Fund) is included in this report. The Fund offers five classes of shares: Class Z, Class A, Class C, Class R and Class R6. Class C shares automatically convert to Class A shares after they have been held for 10 years. Each class of shares may differ by its initial sales load, contingent deferred sales charges, voting rights on matters affecting a single class, its exchange privilege and fees due to differing arrangements for distribution and transfer agent fees.
The following summarizes the Fund’s significant accounting policies.
a. Financial Instrument Valuation
The Fund’s investments in financial instruments are carried at fair value daily. Fair value is the price that would be received to sell an asset or paid to transfer a liability in an orderly transaction between market participants on the measurement date. The Fund calculates the net asset value (NAV) per share each business day as of 4 p.m. Eastern time or the regularly scheduled close of the New York Stock Exchange (NYSE), whichever is earlier. Under compliance policies and procedures approved by the Trust’s Board of Trustees (the Board), the Fund’s administrator has responsibility for oversight of valuation, including leading the cross-functional Valuation Committee (VC). The Fund may utilize independent pricing services, quotations from securities and financial instrument dealers, and other market sources to determine fair value.
Equity securities and derivative financial instruments listed on an exchange or on the NASDAQ National Market System are valued at the last quoted sale price or the official closing price of the day, respectively. Foreign equity securities are valued as of the close of trading on the foreign stock exchange on which the security is primarily traded, or as of 4 p.m. Eastern time. The value is then converted into its U.S. dollar equivalent at the foreign exchange rate in effect at 4 p.m. Eastern time on the day that the value of the security is determined.Over-the-counter (OTC) securities are valued within the range of the most recent quoted bid and ask prices. Securities that trade in multiple markets or on multiple
exchanges are valued according to the broadest and most representative market. Certain equity securities are valued based upon fundamental characteristics or relationships to similar securities.
Debt securities generally trade in the OTC market rather than on a securities exchange. The Fund’s pricing services use multiple valuation techniques to determine fair value. In instances where sufficient market activity exists, the pricing services may utilize a market-based approach through which quotes from market makers are used to determine fair value. In instances where sufficient market activity may not exist or is limited, the pricing services also utilize proprietary valuation models which may consider market characteristics such as benchmark yield curves, credit spreads, estimated default rates, anticipated market interest rate volatility, coupon rates, anticipated timing of principal repayments, underlying collateral, and other unique security features in order to estimate the relevant cash flows, which are then discounted to calculate the fair value.
Certain derivative financial instruments trade in the OTC market. The Fund’s pricing services use various techniques including industry standard option pricing models and proprietary discounted cash flow models to determine the fair value of those instruments. The Fund’s net benefit or obligation under the derivative contract, as measured by the fair value of the contract, is included in net assets.
The Fund has procedures to determine the fair value of financial instruments for which market prices are not reliable or readily available. Under these procedures, the Fund primarily employs a market-based approach which may use related or comparable assets or liabilities, recent transactions, market multiples, book values, and other relevant information for the investment to determine the fair value of the investment. An income-based valuation approach may also be used in which the anticipated future cash flows of the investment are discounted to calculate fair value. Discounts may also be applied due to the nature or duration of any restrictions on the disposition of the investments. Due to the inherent uncertainty of valuations of such investments, the fair values may differ significantly from the values that would have been used had an active market existed.
Trading in securities on foreign securities stock exchanges and OTC markets may be completed before 4 p.m. Eastern time. In addition, trading in certain foreign markets may not take place on every Fund’s business day. Occasionally,
30 | Annual Report | franklintempleton.com | ||
FRANKLIN MUTUAL SERIES FUNDS
NOTES TO FINANCIAL STATEMENTS
Franklin Mutual Quest Fund (continued)
events occur between the time at which trading in a foreign security is completed and 4 p.m. Eastern time that might call into question the reliability of the value of a portfolio security held by the Fund. As a result, differences may arise between the value of the Fund’s portfolio securities as determined at the foreign market close and the latest indications of value at 4 p.m. Eastern time. In order to minimize the potential for these differences, the VC monitors price movements following the close of trading in foreign stock markets through a series of country specific market proxies (such as baskets of American Depositary Receipts, futures contracts and exchange traded funds). These price movements are measured against established trigger thresholds for each specific market proxy to assist in determining if an event has occurred that may call into question the reliability of the values of the foreign securities held by the Fund. If such an event occurs, the securities may be valued using fair value procedures, which may include the use of independent pricing services.
When the last day of the reporting period is anon-business day, certain foreign markets may be open on those days that the Fund’s NAV is not calculated, which could result in differences between the value of the Fund’s portfolio securities on the last business day and the last calendar day of the reporting period. Any significant security valuation changes due to an open foreign market are adjusted and reflected by the Fund for financial reporting purposes.
b. Foreign Currency Translation
Portfolio securities and other assets and liabilities denominated in foreign currencies are translated into U.S. dollars based on the exchange rate of such currencies against U.S. dollars on the date of valuation. The Fund may enter into foreign currency exchange contracts to facilitate transactions denominated in a foreign currency. Purchases and sales of securities, income and expense items denominated in foreign currencies are translated into U.S. dollars at the exchange rate in effect on the transaction date. Portfolio securities and assets and liabilities denominated in foreign currencies contain risks that those currencies will decline in value relative to the U.S. dollar. Occasionally, events may impact the availability or reliability of foreign exchange rates used to convert the U.S. dollar equivalent value. If such an event occurs, the foreign exchange rate will be valued at fair value using procedures established and approved by the Board.
The Fund does not separately report the effect of changes in foreign exchange rates from changes in market prices on securities held. Such changes are included in net realized and unrealized gain or loss from investments in the Statement of Operations.
Realized foreign exchange gains or losses arise from sales of foreign currencies, currency gains or losses realized between the trade and settlement dates on securities transactions and the difference between the recorded amounts of dividends, interest, and foreign withholding taxes and the U.S. dollar equivalent of the amounts actually received or paid. Net unrealized foreign exchange gains and losses arise from changes in foreign exchange rates on foreign denominated assets and liabilities other than investments in securities held at the end of the reporting period.
c. Securities Purchased on a Delayed Delivery Basis
The Fund purchases securities on a delayed delivery basis, with payment and delivery scheduled for a future date. These transactions are subject to market fluctuations and are subject to the risk that the value at delivery may be more or less than the trade date purchase price. Although the Fund will generally purchase these securities with the intention of holding the securities, it may sell the securities before the settlement date. Sufficient assets have been segregated for these securities.
d. Derivative Financial Instruments
The Fund invested in derivative financial instruments in order to manage risk or gain exposure to various other investments or markets. Derivatives are financial contracts based on an underlying or notional amount, require no initial investment or an initial net investment that is smaller than would normally be required to have a similar response to changes in market factors, and require or permit net settlement. Derivatives contain various risks including the potential inability of the counterparty to fulfill their obligations under the terms of the contract, the potential for an illiquid secondary market, and/or the potential for market movements which expose the Fund to gains or losses in excess of the amounts shown in the Statement of Assets and Liabilities. Realized gain and loss and unrealized appreciation and depreciation on these contracts for the period are included in the Statement of Operations.
| franklintempleton.com | Annual Report | 31 | ||
FRANKLIN MUTUAL SERIES FUNDS
NOTES TO FINANCIAL STATEMENTS
Franklin Mutual Quest Fund (continued)
1. Organization and Significant Accounting Policies (continued)
d. Derivative Financial Instruments(continued)
Derivative counterparty credit risk is managed through a formal evaluation of the creditworthiness of all potential counterparties. The Fund attempts to reduce its exposure to counterparty credit risk on OTC derivatives, whenever possible, by entering into International Swaps and Derivatives Association (ISDA) master agreements with certain counterparties. These agreements contain various provisions, including but not limited to collateral requirements, events of default, or early termination. Termination events applicable to the counterparty include certain deteriorations in the credit quality of the counterparty. Termination events applicable to the Fund include failure of the Fund to maintain certain net asset levels and/or limit the decline in net assets over various periods of time. In the event of default or early termination, the ISDA master agreement gives thenon-defaulting party the right to net andclose-out all transactions traded, whether or not arising under the ISDA agreement, to one net amount payable by one counterparty to the other. However, absent an event of default or early termination, OTC derivative assets and liabilities are presented gross and not offset in the Statement of Assets and Liabilities. Early termination by the counterparty may result in an immediate payment by the Fund of any net liability owed to that counterparty under the ISDA agreement. At December 31, 2019, the Fund had OTC derivatives in a net liability position of $13,064,086 and the aggregate value of collateral pledged for such contracts was $9,281,578.
Collateral requirements differ by type of derivative. Collateral or initial margin requirements are set by the broker or exchange clearing house for exchange traded and centrally cleared derivatives. Initial margin deposited is held at the exchange and can be in the form of cash and/or securities. For OTC derivatives traded under an ISDA master agreement, posting of collateral is required by either the Fund or the applicable counterparty if the total net exposure of all OTC derivatives with the applicable counterparty exceeds the minimum transfer amount, which typically ranges from $100,000 to $250,000, and can vary depending on the counterparty and the type of the agreement. Generally, collateral is determined at the close of Fund business each day and any additional collateral required due to changes in derivative values may be delivered by the Fund or the counterparty the next business day, or within a few business days. Collateral pledged and/or received by the Fund for OTC
derivatives, if any, is held in segregated accounts with the Fund’s custodian/counterparty broker and can be in the form of cash and/or securities. Unrestricted cash may be invested according to the Fund’s investment objectives. To the extent that the amounts due to the Fund from its counterparties are not subject to collateralization or are not fully collateralized, the Fund bears the risk of loss from counterpartynon-performance.
The Fund entered into exchange traded futures contracts primarily to manage exposure to certain foreign currencies. A futures contract is an agreement between the Fund and a counterparty to buy or sell an asset at a specified price on a future date. Required initial margins are pledged by the Fund, and the daily change in fair value is accounted for as a variation margin payable or receivable in the Statement of Assets and Liabilities.
The Fund entered into OTC forward exchange contracts primarily to manage exposure to certain foreign currencies. A forward exchange contract is an agreement between the Fund and a counterparty to buy or sell a foreign currency at a specific exchange rate on a future date.
The Fund purchased or wrote exchange traded and/or OTC option contracts primarily to manage exposure to equity price risk. An option is a contract entitling the holder to purchase or sell a specific amount of shares or units of an asset or notional amount of a swap (swaption), at a specified price. When an option is purchased or written, an amount equal to the premium paid or received is recorded as an asset or liability, respectively. Upon exercise of an option, the acquisition cost or sales proceeds of the underlying investment is adjusted by any premium received or paid. Upon expiration of an option, any premium received or paid is recorded as a realized gain or loss. Upon closing an option other than through expiration or exercise, the difference between the premium received or paid and the cost to close the position is recorded as a realized gain or loss.
See Note 11 regarding other derivative information.
e. Securities Sold Short
The Fund is engaged in selling securities short, which obligates the Fund to replace a borrowed security with the same security at current fair value. The Fund incurs a loss if the price of the security increases between the date of the short sale and the date on which the Fund replaces the borrowed security. The Fund realizes a gain if the price of the
32 | Annual Report | franklintempleton.com | ||
FRANKLIN MUTUAL SERIES FUNDS
NOTES TO FINANCIAL STATEMENTS
Franklin Mutual Quest Fund (continued)
security declines between those dates. Gains are limited to the price at which the Fund sold the security short, while losses are potentially unlimited in size.
The Fund is required to establish a margin account with the broker lending the security sold short. While the short sale is outstanding, the broker retains the proceeds of the short sale to the extent necessary to meet margin requirements until the short position is closed out. A deposit must also be maintained with the Fund’s custodian/counterparty broker consisting of cash and/or securities having a value equal to a specified percentage of the value of the securities sold short. The Fund is obligated to pay fees for borrowing the securities sold short and is required to pay the counterparty any dividends and/or interest due on securities sold short. Such dividends and/or interest and any security borrowing fees are recorded as an expense to the Fund.
f. Senior Floating Rate Interests
The Fund invests in senior secured corporate loans that pay interest at rates which are periodically reset by reference to a base lending rate plus a spread. These base lending rates are generally the prime rate offered by a designated U.S. bank or the London InterBank Offered Rate (LIBOR). Senior secured corporate loans often require prepayment of principal from excess cash flows or at the discretion of the borrower. As a result, actual maturity may be substantially less than the stated maturity. Senior secured corporate loans in which the Fund invests are generally readily marketable, but may be subject to certain restrictions on resale. On July 27, 2017, the United Kingdom’s Financial Conduct Authority announced its intention to cease sustaining LIBOR after 2021. There remains uncertainty regarding the future utilization of LIBOR and the nature of any replacement rate. As such, the potential effect of a transition away from LIBOR on the Fund or the Fund’s investments that use or may use a floating rate based on LIBOR cannot yet be determined.
g. Income and Deferred Taxes
It is the Fund’s policy to qualify as a regulated investment company under the Internal Revenue Code. The Fund intends to distribute to shareholders substantially all of its taxable income and net realized gains to relieve it from federal income and excise taxes. As a result, no provision for U.S. federal income taxes is required.
The Fund may be subject to foreign taxation related to income received, capital gains on the sale of securities and certain foreign currency transactions in the foreign jurisdictions in which it invests. Foreign taxes, if any, are recorded based on the tax regulations and rates that exist in the foreign markets in which the Fund invests. When a capital gain tax is determined to apply, the Fund records an estimated deferred tax liability in an amount that would be payable if the securities were disposed of on the valuation date.
As a result of several court cases, in certain countries across the European Union, the Fund filed additional tax reclaims for previously withheld taxes on dividends earned in those countries (EU reclaims). These additional filings are subject to various administrative proceedings by the local jurisdictions’ tax authorities within the European Union, as well as a number of related judicial proceedings. Income recognized, if any, for EU reclaims is reflected as other income in the Statement of Operations and any related receivable, if any, is reflected as European Union tax reclaims in the Statement of Assets and Liabilities. When uncertainty exists as to the ultimate resolution of these proceedings, the likelihood of receipt of these EU reclaims, and the potential timing of payment, no amounts are reflected in the financial statements. For U.S. income tax purposes, EU reclaims received by the Fund, if any, reduce the amounts of foreign taxes Fund shareholders can use as tax credits in their individual income tax returns.
The Fund may recognize an income tax liability related to its uncertain tax positions under U.S. GAAP when the uncertain tax position has a less than 50% probability that it will be sustained upon examination by the tax authorities based on its technical merits. As of December 31, 2019, the Fund has determined that no tax liability is required in its financial statements related to uncertain tax positions for any open tax years (or expected to be taken in future tax years). Open tax years are those that remain subject to examination and are based on the statute of limitations in each jurisdiction in which the Fund invests.
h. Security Transactions, Investment Income, Expenses and Distributions
Security transactions are accounted for on trade date. Realized gains and losses on security transactions are determined on a specific identification basis. Interest income and estimated expenses are accrued daily. Amortization of
| franklintempleton.com | Annual Report | 33 | ||
FRANKLIN MUTUAL SERIES FUNDS
NOTES TO FINANCIAL STATEMENTS
Franklin Mutual Quest Fund (continued)
1. Organization and Significant Accounting Policies(continued)
h. Security Transactions, Investment Income, Expenses and Distributions(continued)
premium and accretion of discount on debt securities are included in interest income. Dividend income and dividends declared on securities sold short are recorded on theex-dividend date except for certain dividends from securities where the dividend rate is not available. In such cases, the dividend is recorded as soon as the information is received by the Fund. Distributions to shareholders are recorded on theex-dividend date. Distributable earnings are determined according to income tax regulations (tax basis) and may differ from earnings recorded in accordance with U.S. GAAP. These differences may be permanent or temporary. Permanent differences are reclassified among capital accounts to reflect their tax character. These reclassifications have no impact on net assets or the results of operations. Temporary differences are not reclassified, as they may reverse in subsequent periods.
Common expenses incurred by the Trust are allocated among the Funds based on the ratio of net assets of each Fund to the combined net assets of the Trust or based on the ratio of number of shareholders of each Fund to the combined number of shareholders of the Trust. Fund specific expenses are charged directly to the Fund that incurred the expense.
Realized and unrealized gains and losses and net investment income, excluding class specific expenses, are allocated daily to each class of shares based upon the relative proportion of net assets of each class. Differences in per share distributions by class are generally due to differences in class specific expenses.
i. Accounting Estimates
The preparation of financial statements in accordance with U.S. GAAP requires management to make estimates and assumptions that affect the reported amounts of assets and liabilities at the date of the financial statements and the amounts of income and expenses during the reporting period. Actual results could differ from those estimates.
j. Guarantees and Indemnifications
Under the Trust’s organizational documents its officers and trustees are indemnified by the Trust against certain liabilities arising out of the performance of their duties to the Trust. Additionally, in the normal course of business, the Trust, on behalf of the Fund, enters into contracts with service providers that contain general indemnification clauses. The Trust’s maximum exposure under these arrangements is unknown as this would involve future claims that may be made against the Trust that have not yet occurred. Currently, the Trust expects the risk of loss to be remote.
2. Shares of Beneficial Interest
At December 31, 2019, there were an unlimited number of shares authorized (without par value). Transactions in the Fund’s shares were as follows:
Year Ended December 31, | ||||||||||||||||
| 2019 | 2018 | |||||||||||||||
| Shares | Amount | Shares | Amount | |||||||||||||
Class Z Shares: | ||||||||||||||||
Shares sold | 15,090,002 | $ | 210,921,808 | 19,486,438 | $ | 309,433,086 | ||||||||||
Shares issued in reinvestment of distributions | 7,039,345 | 99,052,207 | 27,534,405 | 355,938,444 | ||||||||||||
Shares redeemed | (41,662,846 | ) | (583,123,908 | ) | (42,815,519 | ) | (675,833,721 | ) | ||||||||
|
|
| ||||||||||||||
Net increase (decrease) | (19,533,499 | ) | $ | (273,149,893 | ) | 4,205,324 | $ | (10,462,191 | ) | |||||||
|
|
| ||||||||||||||
Class A Shares: | ||||||||||||||||
Shares solda | 8,918,707 | $ | 122,459,568 | 18,112,061 | $ | 282,062,168 | ||||||||||
Shares issued in reinvestment of distributions | 2,357,320 | 32,648,125 | 10,086,321 | 128,317,894 | ||||||||||||
Shares redeemed | (20,150,894 | ) | (277,322,936 | ) | (18,481,020 | ) | (283,596,559 | ) | ||||||||
|
|
| ||||||||||||||
Net increase (decrease) | (8,874,867 | ) | $ | (122,215,243 | ) | 9,717,362 | $ | 126,783,503 | ||||||||
|
|
| ||||||||||||||
34 | Annual Report | franklintempleton.com | ||
FRANKLIN MUTUAL SERIES FUNDS
NOTES TO FINANCIAL STATEMENTS
Franklin Mutual Quest Fund (continued)
| Year Ended December 31, | ||||||||||||||||
| 2019 | 2018 | |||||||||||||||
| Shares | Amount | Shares | Amount | |||||||||||||
Class C Shares: | ||||||||||||||||
Shares sold | 1,166,930 | $ | 15,819,778 | 2,391,188 | $ | 36,406,068 | ||||||||||
Shares issued in reinvestment of distributions | 195,226 | 2,680,611 | 1,234,078 | 15,734,249 | ||||||||||||
Shares redeemeda | (4,357,765 | ) | (59,215,904 | ) | (12,562,392 | ) | (193,458,836 | ) | ||||||||
Net increase (decrease) | (2,995,609 | ) | $ | (40,715,515 | ) | (8,937,126 | ) | $ | (141,318,519 | ) | ||||||
Class R Shares: | ||||||||||||||||
Shares sold | 96,194 | $ | 1,289,422 | 121,081 | $ | 1,898,376 | ||||||||||
Shares issued in reinvestment of distributions | 7,540 | 102,662 | 28,180 | 352,629 | ||||||||||||
Shares redeemed | (86,277 | ) | (1,168,362 | ) | (30,958 | ) | (483,120 | ) | ||||||||
Net increase (decrease) | 17,457 | $ | 223,722 | 118,303 | $ | 1,767,885 | ||||||||||
Class R6 Shares: | ||||||||||||||||
Shares sold | 1,870,657 | $ | 26,089,722 | 2,288,195 | $ | 36,596,048 | ||||||||||
Shares issued in reinvestment of distributions | 264,636 | 3,718,560 | 1,096,020 | 14,150,067 | ||||||||||||
Shares redeemed | (3,434,204 | ) | (48,017,922 | ) | (2,247,945 | ) | (35,826,399 | ) | ||||||||
Net increase (decrease) | (1,298,911 | ) | $ | (18,209,640 | ) | 1,136,270 | $ | 14,919,716 | ||||||||
aMay include a portion of Class C shares that were automatically converted to Class A.
3. Transactions with Affiliates
Franklin Resources, Inc. is the holding company for various subsidiaries that together are referred to as Franklin Templeton. Certain officers and trustees of the Fund are also officers and/or directors of the following subsidiaries:
| Subsidiary | Affiliation | |||
Franklin Mutual Advisers, LLC (Franklin Mutual) | Investment manager | |||
Franklin Templeton Services, LLC (FT Services) | Administrative manager | |||
Franklin Templeton Distributors, Inc. (Distributors) | Principal underwriter | |||
Franklin Templeton Investor Services, LLC (Investor Services) | Transfer agent | |||
a. Management Fees
The Fund pays an investment management fee to Franklin Mutual based on the average daily net assets of the Fund as follows:
| Annualized Fee Rate | Net Assets | |||
0.675% | Up to and including $5 billion | |||
0.645% | Over $5 billion, up to and including $7 billion | |||
0.625% | Over $7 billion, up to and including $10 billion | |||
0.615% | In excess of $10 billion | |||
| franklintempleton.com | Annual Report | 35 | ||
FRANKLIN MUTUAL SERIES FUNDS
NOTES TO FINANCIAL STATEMENTS
Franklin Mutual Quest Fund (continued)
3. Transactions with Affiliates(continued)
b. Administrative Fees
Under an agreement with Franklin Mutual, FT Services provides administrative services to the Fund. The fee is paid by Franklin Mutual based on the Fund’s average daily net assets, and is not an additional expense of the Fund.
c. Distribution Fees
The Board has adopted distribution plans for each share class, with the exception of Class Z and Class R6 shares, pursuant to Rule12b-1 under the 1940 Act. Under the Fund’s Class A reimbursement distribution plan, the Fund reimburses Distributors for costs incurred in connection with the servicing, sale and distribution of the Fund’s shares up to the maximum annual plan rate. Under the Class A reimbursement distribution plan, costs exceeding the maximum for the current plan year cannot be reimbursed in subsequent periods. In addition, under the Fund’s Class C and R compensation distribution plans, the Fund pays Distributors for costs incurred in connection with the servicing, sale and distribution of the Fund’s shares up to the maximum annual plan rate for each class. The plan year, for purposes of monitoring compliance with the maximum annual plan rates, is February 1 through January 31.
The maximum annual plan rates, based on the average daily net assets, for each class, are as follows:
Class A | 0.35 | % | ||
Class C | 1.00 | % | ||
Class R | 0.50 | % | ||
The Board has set the current rate at 0.25% per year for Class A shares until further notice and approval by the Board.
d. Sales Charges/Underwriting Agreements
Front-end sales charges and contingent deferred sales charges (CDSC) do not represent expenses of the Fund. These charges are deducted from the proceeds of sales of Fund shares prior to investment or from redemption proceeds prior to remittance, as applicable. Distributors has advised the Fund of the following commission transactions related to the sales and redemptions of the Fund’s shares for the year:
Sales charges retained net of commissions paid to unaffiliated brokers/dealers | $ | 102,193 | ||
CDSC retained | $ | 12,902 | ||
e. Transfer Agent Fees
Each class of shares pays transfer agent fees to Investor Services for its performance of shareholder servicing obligations. The fees are based on an annualized asset based fee of 0.02% plus a transaction based fee. In addition, each class reimburses Investor Services for out of pocket expenses incurred and, except for Class R6, reimburses shareholder servicing fees paid to third parties. These fees are allocated daily based upon their relative proportion of such classes’ aggregate net assets. Class R6 pays Investor Services transfer agent fees specific to that class.
For the year ended December 31, 2019, the Fund paid transfer agent fees of $3,688,575, of which $1,983,018 was retained by Investor Services.
f. Waiver and Expense Reimbursements
Investor Services has contractually agreed in advance to waive or limit its fees so that the Class R6 transfer agent fees do not exceed 0.02% based on the average net assets of the class until April 30, 2020.
36 | Annual Report | franklintempleton.com | ||
FRANKLIN MUTUAL SERIES FUNDS
NOTES TO FINANCIAL STATEMENTS
Franklin Mutual Quest Fund (continued)
g. Interfund Transactions
The Fund engaged in purchases and sales of investments with funds or other accounts that have common investment managers (or affiliated investment managers), directors, trustees or officers. During the year ended December 31, 2019, these purchase and sale transactions aggregated $99,609,496 and $0, respectively.
4. Expense Offset Arrangement
The Fund has entered into an arrangement with its custodian whereby credits realized as a result of uninvested cash balances are used to reduce a portion of the Fund’s custodian expenses. During the year ended December 31, 2019, the custodian fees were reduced as noted in the Statement of Operations.
5. Independent Trustees’ Retirement Plan
On January 1, 1993, the Trust adopted an Independent Trustees’ Retirement Plan (Plan). The Plan is an unfunded defined benefit plan that provides benefit payments to Trustees whose length of service and retirement age meets the eligibility requirements of the Plan. Benefits under the Plan are based on years of service and fees paid to each trustee at the time of retirement. Effective in December 1996, the Plan was closed to new participants.
During the year ended December 31, 2019, the Fund’s projected benefit obligation and benefit payments under the Plan were as follows:
aProjected benefit obligation at December 31, 2019 | $ | 355,665 | ||
bIncrease in projected benefit obligation | $ | 35,608 | ||
Benefit payments made to retired trustees | $ | (5,782 | ) | |
aThe projected benefit obligation is included in trustees’ fees and expenses in the Statement of Assets and Liabilities.
bThe increase in projected benefit obligation is included in trustees’ fees and expenses in the Statement of Operations.
6. Income Taxes
For tax purposes, capital losses may be carried over to offset future capital gains.
At December 31, 2019, the capital loss carryforwards were as follows:
| Capital loss carryforwards not subject to expiration: | ||||
Long term | $ | 271,513,668 | ||
The tax character of distributions paid during the years ended December 31, 2019 and 2018, was as follows:
| 2019 | 2018 | |||||||||
Distributions paid from: | ||||||||||
Ordinary income | $ | 145,010,345 | $ | 242,783,398 | ||||||
Long term capital gain | — | 294,496,083 | ||||||||
| �� | $ | 145,010,345 | $ | 537,279,481 | ||||||
| franklintempleton.com | Annual Report | 37 | ||
FRANKLIN MUTUAL SERIES FUNDS
NOTES TO FINANCIAL STATEMENTS
Franklin Mutual Quest Fund (continued)
6. Income Taxes(continued)
At December 31, 2019, the cost of investments, net unrealized appreciation (depreciation) and undistributed ordinary income for income tax purposes were as follows:
Cost of investments | $ | 4,263,203,026 | ||||
Unrealized appreciation | $ | 440,494,770 | ||||
Unrealized depreciation | (469,607,353 | ) | ||||
Net unrealized appreciation (depreciation) | $ | (29,112,583 | ) | |||
Distributable earnings: | ||||||
Undistributed ordinary income | $ | 1,845,930 | ||||
Differences between income and/or capital gains as determined on a book basis and a tax basis are primarily due to differing treatments of wash sales and foreign currency transactions.
7. Investment Transactions
Purchases and sales of investments (excluding short term securities and securities sold short) for the year ended December 31, 2019, aggregated $2,222,988,576 and $2,748,779,735, respectively.
8. Credit Risk and Defaulted Securities
The Fund may purchase thepre-default or defaulted debt of distressed companies. Distressed companies are financially troubled and could be or are already involved in financial restructuring or bankruptcy. Risks associated with purchasing these securities include the possibility that the bankruptcy or other restructuring process takes longer than expected, or that distributions in restructuring are less than anticipated, either or both of which may result in unfavorable consequences to the Fund. If it becomes probable that the income on debt securities, including those of distressed companies, will not be collected, the Fund discontinues accruing income and recognizes an adjustment for uncollectible interest.
At December 31, 2019, the Fund did not hold any distressed company securities for which interest recognition has been discontinued.
9. Concentration of Risk
Investing in foreign securities may include certain risks and considerations not typically associated with investing in U.S. securities, such as fluctuating currency values and changing local, regional and global economic, political and social conditions, which may result in greater market volatility. Current political and financial uncertainty surrounding the European Union may increase market volatility and the economic risk of investing in securities in Europe. In addition, certain foreign securities may not be as liquid as U.S. securities.
10. Restricted Securities
The Fund invests in securities that are restricted under the Securities Act of 1933 (1933 Act). Restricted securities are often purchased in private placement transactions, and cannot be sold without prior registration unless the sale is pursuant to an exemption under the 1933 Act. Disposal of these securities may require greater effort and expense, and prompt sale at an acceptable price may be difficult. The Fund may have registration rights for restricted securities. The issuer generally incurs all registration costs.
38 | Annual Report | franklintempleton.com | ||
FRANKLIN MUTUAL SERIES FUNDS
NOTES TO FINANCIAL STATEMENTS
Franklin Mutual Quest Fund (continued)
At December 31, 2019, investments in restricted securities, excluding securities exempt from registration under the 1933 Act, were as follows:
Shares/ Warrants | Issuer | Acquisition Date | Cost | Value | ||||||||||||
| 2,548,299 | International Automotive Components Group Brazil LLC | 4/13/06 - 12/26/08 | $ | 1,692,334 | $ | 92,503 | ||||||||||
| 1,110,000 | aLee Enterprises Inc., wts., 12/31/22 | 3/31/14 | 1,490,026 | 130,691 | ||||||||||||
| 224,279 | bSorenson Communications LLC, Membership Interests | 4/30/14 | — | 152,057,986 | ||||||||||||
| Total Restricted Securities(Value is 3.5% of Net Assets) | $ | 3,182,360 | $ | 152,281,180 | ||||||||||||
aThe Fund also invests in unrestricted securities or other investments in the issuer, valued at $129,348,924 as of December 31, 2019.
bThe Fund also invests in unrestricted securities or other investments in the issuer, valued at $12,473,036 as of December 31, 2019.
11. Other Derivative Information
At December 31, 2019, investments in derivative contracts are reflected in the Statement of Assets and Liabilities as follows:
Asset Derivatives | Liability Derivatives | |||||||||||||||
Derivative Contracts Not Accounted for as Hedging Instruments | Statement of Assets and Liabilities Location | Fair Value | Statement of Assets and Liabilities Location | Fair Value | ||||||||||||
| ||||||||||||||||
Foreign exchange contracts | Variation margin on futures contracts | $ | — | Variation margin on futures contracts | $ | 1,089,297 | a | |||||||||
Unrealized appreciation on OTC forward exchange contracts | 963,141 | Unrealized depreciation on OTC forward exchange contracts | 14,027,227 | |||||||||||||
Equity contracts | Investments in securities, at value | 187,500 | b | Options written, at value | 1,454,500 | |||||||||||
|
|
|
| |||||||||||||
Totals | $ | 1,150,641 | $ | 16,571,024 | ||||||||||||
|
|
|
| |||||||||||||
aThis amount reflects the cumulative appreciation (depreciation) of futures contracts as reported in the Statement of Investments. Only the variation margin receivable/ payable at year end is separately reported within the Statement of Assets and Liabilities. Prior variation margin movements were recorded to cash upon receipt or payment.
bPurchased option contracts are included in investments in securities, at value in the Statement of Assets and Liabilities.
For the year ended December 31, 2019, the effect of derivative contracts in the Statement of Operations was as follows:
Derivative Contracts Not Accounted for as Hedging Instruments | Statement of Operations Location | Net Realized Gain (Loss) for the Year | Statement of Operations Location | Net Change in Unrealized Appreciation (Depreciation) for the Year | ||||||||||||
| ||||||||||||||||
| Net realized gain (loss) from: | Net change in unrealized appreciation (depreciation) on: | |||||||||||||||
Foreign exchange contracts | Forward exchange contracts | $22,733,552 | Forward exchange contracts | $(23,337,473) | ||||||||||||
| Futures contracts | 4,034,394 | Futures contracts | (1,240,706) | |||||||||||||
Equity contracts | Investments | (1,129,832) | a | Investments | 870,984 | a | ||||||||||
| Written options | 3,551,588 | Written options | 6,081,893 | |||||||||||||
|
|
|
| |||||||||||||
Totals | $29,189,702 | $(17,625,302) | ||||||||||||||
|
|
|
| |||||||||||||
aPurchased option contracts are included in net realized gain (loss) from investments and net change in unrealized appreciation (depreciation) on investments in the Statement of Operations.
| franklintempleton.com | Annual Report | 39 | ||
FRANKLIN MUTUAL SERIES FUNDS
NOTES TO FINANCIAL STATEMENTS
Franklin Mutual Quest Fund (continued)
11. Other Derivative Information(continued)
For the year ended December 31, 2019, the average month end notional amount of futures contracts and options represented $144,793,454 and 993,546 shares, respectively. The average month end contract value of forward exchange contracts was $477,776,037.
See Note 1(d) regarding derivative financial instruments.
12. Holdings of 5% Voting Securities of Portfolio Companies
The 1940 Act defines ‘‘affiliated companies” to include investments in portfolio companies in which a fund owns 5% or more of the outstanding voting securities. During the year ended December 31, 2019, investments in “affiliated companies” were as follows:
| Name of Issuer | Value at of Year | Purchases | Sales | Realized Gain (Loss) | Net Change in Unrealized Appreciation (Depreciation) | Value at End of Year | Number of Principal of Year | Investment Income | ||||||||||||||||||||||||
Non-Controlled Affiliates |
| |||||||||||||||||||||||||||||||
| Dividends | ||||||||||||||||||||||||||||||||
Advanced Emissions Solutions Inc. | $ | 18,190,405 | $ | — | $ | — | $ | — | $ | (86,210 | ) | $ | 18,104,195 | 1,724,209 | $ | 1,724,209 | ||||||||||||||||
Gannett Co. Inc. | 37,084,199 | — | (5,996,577 | ) | 119,111 | — | a | — | a | — | a | 1,052,196 | ||||||||||||||||||||
Lee Enterprises Inc./IA | 10,179,206 | — | (5,444,799 | ) | 438,041 | (563,173 | ) | 4,609,275 | 3,245,968 | — | ||||||||||||||||||||||
Lee Enterprises Inc., wts., 12/31/22 | 217,582 | — | — | — | (86,891 | ) | 130,691 | 1,110,000 | — | |||||||||||||||||||||||
Sorenson Communications LLC, Membership Interests | 155,100,344 | — | — | — | (3,042,358 | ) | 152,057,986 | 224,279 | — | |||||||||||||||||||||||
TRU Kids Parent LLC | — | 34,810,099 | b | — | — | (8,303,270 | ) | 26,506,829 | 7,104 | — | ||||||||||||||||||||||
Wayne Services Legacy Inc. | — | 2,484,752 | b | (3,727,125 | )b | 1,242,373 | — | — | 7,104 | — | ||||||||||||||||||||||
| $ | 220,771,736 | $ | 37,294,851 | $ | (15,168,501 | ) | $ | 1,799,525 | $ | (12,081,902 | ) | $ | 201,408,976 | $ | 2,776,405 | |||||||||||||||||
| Interest | ||||||||||||||||||||||||||||||||
Lee Enterprises Inc., Second Lien Term Loan, 12.00%, 12/15/22 | 47,222,199 | 209,317 | b | (12,427,697 | )b | 148,076 | (941,651 | ) | 34,210,244 | 34,317,486 | 2,445,712 | |||||||||||||||||||||
Lee Enterprises Inc., senior secured note, first lien, 144A, 9.50%, 3/15/22 | 99,476,250 | 207,405 | b | — | — | (9,154,250 | ) | 90,529,405 | 97,050,000 | 9,194,140 | ||||||||||||||||||||||
Sorenson Communications LLC, Initial Term Loan, 8.25%, 4/30/20 | 138,475,000 | 44,289 | b | (139,170,854 | ) | 120,026 | 531,539 | — | c | — | 2,758,168 | |||||||||||||||||||||
Sorenson Communications LLC, Initial Term Loans, 8.445%, 3/14/24 | — | 13,022,779 | b | (964,285 | ) | 34,649 | 379,893 | 12,473,036 | 12,535,714 | 796,367 | ||||||||||||||||||||||
Sorenson Communications LLC, secured note, second lien, 144A, PIK, 9.00%, 10/31/20 | 94,738,498 | 222,447 | b | (96,671,937 | ) | 1,144,350 | 566,642 | — | c | — | 2,875,990 | |||||||||||||||||||||
Sorenson Holdings LLC/Finance Corp., senior note, 144A, PIK, 13.85%, 10/31/21 | 20,620,500 | 44,363 | b | (19,614,622 | ) | 69,148 | (1,119,389 | ) | — | c | — | 704,310 | ||||||||||||||||||||
| $ | 400,532,447 | $ | 13,750,600 | $ | (268,849,395 | ) | $ | 1,516,249 | $ | (9,737,216 | ) | $ | 137,212,685 | $ | 18,774,687 | |||||||||||||||||
Total Affiliated Securities (Value is 7.9% of Net Assets) | $ | 621,304,183 | $ | 51,045,451 | $ | (284,017,896 | ) | $ | 3,315,774 | $ | (21,819,118 | ) | $ | 338,621,661 | $ | 21,551,092 | ||||||||||||||||
40 | Annual Report | franklintempleton.com | ||
FRANKLIN MUTUAL SERIES FUNDS
NOTES TO FINANCIAL STATEMENTS
Franklin Mutual Quest Fund (continued)
aAs of December 31, 2019, no longer an affiliate.
bMay include accretion, amortization, partnership adjustments, and/or corporate actions.
cAs of December 31, 2019, no longer held by the Fund.
13. Credit Facility
The Fund, together with other U.S. registered and foreign investment funds (collectively, Borrowers), managed by Franklin Templeton, are borrowers in a joint syndicated senior unsecured credit facility totaling $2 billion (Global Credit Facility) which matured on February 7, 2020. This Global Credit Facility provides a source of funds to the Borrowers for temporary and emergency purposes, including the ability to meet future unanticipated or unusually large redemption requests. Effective February 7, 2020, the Borrowers renewed the Global Credit Facility for a one year term, maturing February 5, 2021, for a total of $2 billion.
Under the terms of the Global Credit Facility, the Fund shall, in addition to interest charged on any borrowings made by the Fund and other costs incurred by the Fund, pay its share of fees and expenses incurred in connection with the implementation and maintenance of the Global Credit Facility, based upon its relative share of the aggregate net assets of all of the Borrowers, including an annual commitment fee of 0.15% based upon the unused portion of the Global Credit Facility. These fees are reflected in other expenses in the Statement of Operations. During the year ended December 31, 2019, the Fund did not use the Global Credit Facility.
14. Fair Value Measurements
The Fund follows a fair value hierarchy that distinguishes between market data obtained from independent sources (observable inputs) and the Fund’s own market assumptions (unobservable inputs). These inputs are used in determining the value of the Fund’s financial instruments and are summarized in the following fair value hierarchy:
| • | Level 1 – quoted prices in active markets for identical financial instruments |
| • | Level 2 – other significant observable inputs (including quoted prices for similar financial instruments, interest rates, prepayment speed, credit risk, etc.) |
| • | Level 3 – significant unobservable inputs (including the Fund’s own assumptions in determining the fair value of financial instruments) |
The input levels are not necessarily an indication of the risk or liquidity associated with financial instruments at that level.
| franklintempleton.com | Annual Report | 41 | ||
FRANKLIN MUTUAL SERIES FUNDS
NOTES TO FINANCIAL STATEMENTS
Franklin Mutual Quest Fund (continued)
14. Fair Value Measurements(continued)
A summary of inputs used as of December 31, 2019, in valuing the Fund’s assets and liabilities carried at fair value, is as follows:
| Level 1 | Level 2 | Level 3 | Total | |||||||||||||
Assets: | ||||||||||||||||
Investments in Securities:a | ||||||||||||||||
Equity Investments:b | ||||||||||||||||
Auto Components | $ | 14,738,343 | $ | — | $ | 92,503 | $ | 14,830,846 | ||||||||
Communications Equipment | — | — | 152,057,986 | 152,057,986 | ||||||||||||
Media | 333,224,642 | — | 472,147 | 333,696,789 | ||||||||||||
Specialty Retail | 23,474,858 | — | 26,506,829c | 49,981,687 | ||||||||||||
All Other Equity Investments | 2,421,894,473 | — | —c | 2,421,894,473 | ||||||||||||
Corporate Bonds, Notes and Senior Floating Rate Interests | — | 708,973,028 | — | 708,973,028 | ||||||||||||
Companies in Liquidation | — | — | 57,296c | 57,296 | ||||||||||||
Options Purchased | 187,500 | — | — | 187,500 | ||||||||||||
Short Term Investments | 561,440,132 | 54,100,000 | — | 615,540,132 | ||||||||||||
Total Investments in Securities | $ | 3,354,959,948 | $ | 763,073,028 | $ | 179,186,761 | $ | 4,297,219,737 | ||||||||
Other Financial Instruments: | ||||||||||||||||
Forward Exchange Contracts | $ | — | $ | 963,141 | $ | — | $ | 963,141 | ||||||||
Liabilities: | ||||||||||||||||
Other Financial Instruments: | ||||||||||||||||
Options Written | $ | 1,454,500 | $ | — | $ | — | $ | 1,454,500 | ||||||||
Securities Sold Shorta | 33,371,164 | — | — | 33,371,164 | ||||||||||||
Futures Contracts | 1,089,297 | — | — | 1,089,297 | ||||||||||||
Forward Exchange Contracts | — | 14,027,227 | — | 14,027,227 | ||||||||||||
Total Other Financial Instruments | $ | 35,914,961 | $ | 14,027,227 | $ | — | $ | 49,942,188 | ||||||||
aFor detailed categories, see the accompanying Statement of Investments.
bIncludes common, preferred and convertible preferred stocks as well as other equity interests.
cIncludes securities determined to have no value at December 31, 2019.
42 | Annual Report | franklintempleton.com | ||
FRANKLIN MUTUAL SERIES FUNDS
NOTES TO FINANCIAL STATEMENTS
Franklin Mutual Quest Fund (continued)
A reconciliation of assets in which Level 3 inputs are used in determining fair value is presented when there are significant Level 3 financial instruments at the beginning and/or end of the year. At December 31, 2019, the reconciliation of assets are as follows:
Balance at Beginning of Year | Purchases | Sales | Transfer Into Level 3a | Transfer Out of | Cost Basis Adjustmentsb | Net Realized Gain (Loss) | Net Unrealized Appreciation (Depreciation) | Balance at End of Year | Net Change in Unrealized Appreciation (Depreciation) on Assets Held at Year End | |||||||||||||||||||||||||||||||||||||||||||
Assets: | ||||||||||||||||||||||||||||||||||||||||||||||||||||
Investments in Securities: | ||||||||||||||||||||||||||||||||||||||||||||||||||||
Equity Investments:c | ||||||||||||||||||||||||||||||||||||||||||||||||||||
Auto Components | $ | 2,483,009 | $ | — | $ | (2,968,774 | ) | $ | — | $— | $ | — | $ | (13,337,171 | ) | $ | 13,915,439 | $ | 92,503 | $ | (15,486 | ) | ||||||||||||||||||||||||||||||
Chemicals | — | d | — | — | — | — | — | — | — | — | — | |||||||||||||||||||||||||||||||||||||||||
Communications Equipment | 155,100,344 | — | — | — | — | — | — | (3,042,358 | ) | 152,057,986 | (3,042,358 | ) | ||||||||||||||||||||||||||||||||||||||||
Diversified Consumer Services | 3,664,436 | — | — | — | — | — | — | (3,664,436 | ) | — | d | (3,664,436 | ) | |||||||||||||||||||||||||||||||||||||||
Media | 217,582 | 519,612 | — | — | — | — | — | (265,047 | ) | 472,147 | (265,047 | ) | ||||||||||||||||||||||||||||||||||||||||
Specialty Retail | — | 37,294,851 | — | — | — | (3,727,125 | ) | 1,242,373 | (8,303,270 | ) | 26,506,829 | d | (8,303,270 | ) | ||||||||||||||||||||||||||||||||||||||
Corporate Notes in Reorganization | 3,563,602 | d | — | (426,271 | ) | — | — | — | (17,289,374 | ) | 14,152,043 | — | — | |||||||||||||||||||||||||||||||||||||||
Companies in Liquidation | — | d | — | — | 57,296 | — | (2,135 | ) | 2,135 | — | 57,296 | d | — | |||||||||||||||||||||||||||||||||||||||
|
| |||||||||||||||||||||||||||||||||||||||||||||||||||
Total Investments in Securities | $ | 165,028,973 | $ | 37,814,463 | $ | (3,395,045 | ) | $ | 57,296 | $— | $ | (3,729,260 | ) | $ | (29,382,037 | ) | $ | 12,792,371 | $ | 179,186,761 | $ | (15,290,597 | ) | |||||||||||||||||||||||||||||
|
| |||||||||||||||||||||||||||||||||||||||||||||||||||
aThe investments were transferred into Level 3 as a result of its value being determined using a significant unobservable input.
bMay include accretion, amortization, partnership adjustments, and/or other cost basis adjustments. May also include amounts related to a corporate action.
cIncludes common stocks as well as other equity interests.
dIncludes securities determined to have no value.
| franklintempleton.com | Annual Report | 43 | ||
FRANKLIN MUTUAL SERIES FUNDS
NOTES TO FINANCIAL STATEMENTS
Franklin Mutual Quest Fund (continued)
14. Fair Value Measurements(continued)
Significant unobservable valuation inputs for material Level 3 financial instruments and impact to fair value as a result of changes in unobservable valuation inputs as of December 31, 2019, are as follows:
| Description | Fair Value at End of Year | Valuation Technique | Unobservable Inputs | Amount | Impact to Fair Value if Input Increasesa | |||||||||||
Assets: | ||||||||||||||||
Investments in Securities: | ||||||||||||||||
Equity Investments: | ||||||||||||||||
Communications Equipment | $ | 152,057,986 | Market transaction | Transaction price weighting | 50% | Increaseb | ||||||||||
| Market comparables | EV / EBITDA multiple | 4.8x | Increasec | |||||||||||||
Specialty Retail | 26,506,829 | Market comparables | Discount for lack of marketability | 20% | Decreased | |||||||||||
| EV / EBITDA multiple | 9.3x | Increased | ||||||||||||||
All Other Investmentse | 621,946 | f | ||||||||||||||
Total | $ | 179,186,761 | ||||||||||||||
aRepresents the directional change in the fair value of the Level 3 financial instruments that would result from a significant and reasonable increase in the corresponding input. A significant and reasonable decrease in the input would have the opposite effect. Significant impacts, if any, to fair value and/or net assets have been indicated.
bRepresents a significant impact to fair value and net assets.
cRepresents a significant impact to net assets but not fair value.
dRepresents a significant impact to fair value but not net assets.
eIncludes fair value of immaterial financial instruments developed using various valuation techniques and unobservable inputs. May also include financial instruments with values derived using private transaction prices ornon-public third party pricing information which is unobservable.
fIncludes securities determined to have no value at December 31, 2019.
Abbreviations List
| EBITDA | Earnings before interest, taxes, depreciation and amortization | |
| EV | Enterprise value | |
15. Subsequent Events
The Fund has evaluated subsequent events through the issuance of the financial statements and determined that no events have occurred that require disclosure other than those already disclosed in the financial statements.
| Abbreviations | ||||||||||
| Counterparty | Currency | Selected Portfolio | ||||||||
| BOFA | Bank of America Corp. | EUR | Euro | ADR | American Depositary Receipt | |||||
| HSBK | HSBC Bank PLC | GBP | British Pound | FHLB | Federal Home Loan Bank | |||||
| SSBT | State Street Bank and Trust Co., N.A. | USD | United States Dollar | LIBOR | London InterBank Offered Rate | |||||
| UBSW | UBS AG | |||||||||
44 | Annual Report | franklintempleton.com | ||
FRANKLIN MUTUAL SERIES FUNDS
Report of Independent Registered Public Accounting Firm
To the Board of Trustees of Franklin Mutual Series Funds and Shareholders of Franklin Mutual Quest Fund:
Opinion on the Financial Statements
We have audited the accompanying statement of assets and liabilities of Franklin Mutual Quest Fund (the “Fund”) (one of the funds constituting Franklin Mutual Series Funds), including the schedule of investments, as of December 31, 2019, and the related statement of operations for the year then ended, the statements of changes in net assets for each of the two years in the period then ended, the financial highlights for each of the five years in the period then ended and the related notes (collectively referred to as the “financial statements”). In our opinion, the financial statements present fairly, in all material respects, the financial position of Franklin Mutual Quest Fund (one of the funds constituting Franklin Mutual Series Funds) at December 31, 2019, the results of its operations for the year then ended, the changes in its net assets for each of the two years in the period then ended and its financial highlights for each of the five years in the period then ended, in conformity with U.S. generally accepted accounting principles.
Basis for Opinion
These financial statements are the responsibility of the Fund’s management. Our responsibility is to express an opinion on the Fund’s financial statements based on our audits. We are a public accounting firm registered with the Public Company Accounting Oversight Board (United States) ("PCAOB") and are required to be independent with respect to the Fund in accordance with the U.S. federal securities laws and the applicable rules and regulations of the Securities and Exchange Commission and the PCAOB.
We conducted our audits in accordance with the standards of the PCAOB. Those standards require that we plan and perform the audit to obtain reasonable assurance about whether the financial statements are free of material misstatement, whether due to error or fraud. The Fund is not required to have, nor were we engaged to perform, an audit of the Fund’s internal control over financial reporting. As part of our audits, we are required to obtain an understanding of internal control over financial reporting, but not for the purpose of expressing an opinion on the effectiveness of the Fund’s internal control over financial reporting. Accordingly, we express no such opinion.
Our audits included performing procedures to assess the risks of material misstatement of the financial statements, whether due to error or fraud, and performing procedures that respond to those risks. Such procedures included examining, on a test basis, evidence regarding the amounts and disclosures in the financial statements. Our procedures included confirmation of securities owned as of December 31, 2019, by correspondence with the custodian and brokers or by other appropriate auditing procedures where replies from others were not received. Our audits also included evaluating the accounting principles used and significant estimates made by management, as well as evaluating the overall presentation of the financial statements. We believe that our audits provide a reasonable basis for our opinion.
We have served as the auditor of one or more Franklin investment companies since 1987.
Boston, Massachusetts
February 21, 2020
| franklintempleton.com | Annual Report | 45 | ||
FRANKLIN MUTUAL SERIES FUNDS
Franklin Mutual Quest Fund
Under Section 854(b)(1)(A) of the Internal Revenue Code, the Fund hereby reports 14.95% of the ordinary income dividends as income qualifying for the dividends received deduction for the fiscal year ended December 31, 2019.
Under Section 854(b)(1)(B) of the Internal Revenue Code, the Fund hereby reports the maximum amount allowable but no less than $64,811,119 as qualified dividends for purposes of the maximum rate under Section 1(h)(11) of the Internal Revenue Code for the fiscal year ended December 31, 2019. Distributions, including qualified dividend income, paid during calendar year 2019 will be reported to shareholders on Form1099-DIV bymid-February 2020. Shareholders are advised to check with their tax advisors for information on the treatment of these amounts on their individual income tax returns.
Under Section 871(k)(1)(C) of the Internal Revenue Code, the Fund hereby reports the maximum amount allowable but no less than $77,328,147 as interest related dividends for purposes of the tax imposed under Section 871(a)(1)(A) of the Internal Revenue Code for the fiscal year ended December 31, 2019.
46 | Annual Report | franklintempleton.com | ||
FRANKLIN MUTUAL SERIES FUNDS
The name, year of birth and address of the officers and board members, as well as their affiliations, positions held with the Trust, principal occupations during at least the past five years and number of U.S. registered portfolios overseen in the Franklin Templeton fund complex, are shown below. Generally, each board member serves until that person’s successor is elected and qualified.
Independent Board Members
Name, Year of Birth and Address | Position | Length of Time Served | Number of Portfolios in Fund Complex Overseen by Board Member* | Other Directorships Held During at Least the Past 5 Years | ||||
Edward I. Altman, Ph.D. (1941) c/o Franklin Mutual Advisers, LLC 101 John F. Kennedy Parkway Short Hills, NJ 07078-2716 | Trustee | Since 1987 | 12 | None | ||||
| Principal Occupation During at Least the Past 5 Years: | ||||||||
Max L. Heine Professor of Finance, Emeritus and Director of The Credit and Debt Markets Research Program, Salomon Center, Stern School of Business, New York University; editor and author of numerous financial publications; financial consultant; an adviser to numerous financial and publishing organizations; andformerly, Vice Director, Salomon Center, Stern School of Business, New York University.
| ||||||||
Ann Torre Bates (1958) c/o Franklin Mutual Advisers, LLC 101 John F. Kennedy Parkway Short Hills, NJ 07078-2716 | Trustee and Chairperson | Trustee since 1995 and Chairperson since January 2020 | 33 | Ares Capital Corporation (specialty finance company) (2010-present), United Natural Foods, Inc. (distributor of natural, organic and specialty foods) (2013-present), Allied Capital Corporation (financial services) (2003-2010), SLM Corporation (Sallie Mae) (1997-2014) and Navient Corporation (loan management, servicing and asset recovery) (2014-2016). | ||||
| Principal Occupation During at Least the Past 5 Years: | ||||||||
| Director of various companies; andformerly, Executive Vice President and Chief Financial Officer, NHP Incorporated (manager of multifamily housing) (1995-1997); and Vice President and Treasurer, US Airways, Inc. (until 1995). | ||||||||
Burton J. Greenwald (1929) c/o Franklin Mutual Advisers, LLC 101 John F. Kennedy Parkway Short Hills, NJ 07078-2716 | Trustee | Since 2002 | 12 | Franklin Templeton Emerging Markets Debt Opportunities Fund PLC (1999-present) and Fiduciary International Ireland Limited (1999-2015). | ||||
| Principal Occupation During at Least the Past 5 Years: | ||||||||
| Managing Director, B.J. Greenwald Associates (management consultants to the financial services industry); andformerly, Chairman, Fiduciary Trust International Funds; Executive Vice President, L.F. Rothschild Fund Management, Inc.; President and Director, Merit Mutual Funds; President, Underwriting Division and Director, National Securities & Research Corporation; Governor, Investment Company Institute; and Chairman, ICI Public Information Committee. | ||||||||
Jan Hopkins Trachtman (1947) c/o Franklin Mutual Advisers, LLC 101 John F. Kennedy Parkway Short Hills, NJ 07078-2716 | Trustee | Since 2009 | 12 | FinTech Acquisition Corp. III (special purpose fintech acquisition company) (2018-present) | ||||
| Principal Occupation During at Least the Past 5 Years: | ||||||||
President and Founder, The Jan Hopkins Group (communications consulting firm); serves on Alumni Advisory Board of Knight Bagehot Fellowship; andformerly, President, Economic Club of New York (2007-2015); Anchor/Correspondent, CNN Financial News (until 2003); Managing Director and Head of Client Communications, Citigroup Private Bank (until 2005);Off-Air reporter, ABC News’ World News Tonight; and Editor, CBS Network News.
| ||||||||
| franklintempleton.com | Annual Report | 47 | ||
FRANKLIN MUTUAL SERIES FUNDS
Independent Board Members(continued)
Name, Year of Birth and Address | Position | Length of Time Served | Number of Portfolios in Fund Complex Overseen by Board Member* | Other Directorships Held During at Least the Past 5 Years | ||||
Keith Mitchell (1954) c/o Franklin Mutual Advisers, LLC 101 John F. Kennedy Parkway Short Hills, NJ 07078-2716 | Trustee | Since 2009 | 12 | None | ||||
| Principal Occupation During at Least the Past 5 Years: | ||||||||
| Director of various boards of asset management firms; andformerly, Managing Member, Mitchell, Hartley & Bechtel Advisers, LLC (formerly, Mitchell Advisers, LLC) (advisory firm) (2003-2015) and Managing Director, Putman Lovell NBF. | ||||||||
David W. Niemiec (1949) c/o Franklin Mutual Advisers, LLC 101 John F. Kennedy Parkway Short Hills, NJ 07078-2716 | Trustee | Since 2015 | 33 | Hess Midstream LP (oil and gas midstream infrastructure) (2017-present). | ||||
| Principal Occupation During at Least the Past 5 Years: | ||||||||
| Advisor, Saratoga Partners (private equity fund); andformerly, Managing Director, Saratoga Partners (1998-2001) and SBC Warburg Dillon Read (investment banking) (1997-1998); Vice Chairman, Dillon, Read & Co. Inc. (investment banking) (1991-1997); and Chief Financial Officer, Dillon, Read & Co. Inc. (1982-1997). | ||||||||
Charles Rubens II (1930) c/o Franklin Mutual Advisers, LLC 101 John F. Kennedy Parkway Short Hills, NJ 07078-2716 | Trustee | Since 1998 | 12 | None | ||||
| Principal Occupation During at Least the Past 5 Years: | ||||||||
| Private investor and president ofnon-profit organizations; andformerly, an executive of Time, Inc.; and Trustee of Colorado College. | ||||||||
Robert E. Wade (1946) c/o Franklin Mutual Advisers, LLC 101 John F. Kennedy Parkway Short Hills, NJ 07078-2716 | Trustee | Since 1991 | 33 | El Oro Ltd (investments) (2003-2019). | ||||
| Principal Occupation During at Least the Past 5 Years: | ||||||||
| Attorney at law engaged in private practice as a sole practitioner (1972-2008) and member of various boards. | ||||||||
Gregory H. Williams (1943) c/o Franklin Mutual Advisers, LLC 101 John F. Kennedy Parkway Short Hills, NJ 07078-2716 | Trustee | Since 2015 | 12 | None | ||||
| Principal Occupation During at Least the Past 5 Years: | ||||||||
| Private investor; Consultant; andformerly, President, University of Cincinnati (2009-2012); President, The City College of New York (2001-2009); Dean, College of Law, Ohio State University (1993-2001); and Associate Vice President, Academic Affairs and Professor of Law, University of Iowa (1977-1993). | ||||||||
| Interested Board Members and Officers | ||||||||
Name, Year of Birth and Address | Position | Length of Time Served | Number of Portfolios in Fund Complex Overseen by Board Member* | Other Directorships Held During at Least the Past 5 Years | ||||
**Gregory E. Johnson (1961) One Franklin Parkway San Mateo, CA 94403-1906 | Trustee | Since 2007 | 144 | None | ||||
| Principal Occupation During at Least the Past 5 Years: | ||||||||
Chairman of the Board, Member – Office of the Chairman, Director and Chief Executive Officer, Franklin Resources, Inc.; officer and/or director or trustee, as the case may be, of some of the other subsidiaries of Franklin Resources, Inc. and of 39 of the investment companies in Franklin Templeton; Vice Chairman, Investment Company Institute; andformerly, President, Franklin Resources, Inc. (1994-2015).
| ||||||||
48 | Annual Report | franklintempleton.com | ||
FRANKLIN MUTUAL SERIES FUNDS
Interested Board Members and Officers(continued)
Name, Year of Birth and Address | Position | Length of Time Served | Number of Portfolios in Fund Complex Overseen by Board Member* | Other Directorships Held During at Least the Past 5 Years | ||||
**Peter A. Langerman (1955) c/o Franklin Mutual Advisers, LLC 101 John F. Kennedy Parkway Short Hills, NJ 07078-2716 | Trustee, President, and Chief Executive Officer – Investment Management | Trustee since 2007, President, and Chief Executive Officer – Investment Management since 2005 | 7 | None | ||||
| Principal Occupation During at Least the Past 5 Years: | ||||||||
| Chairman of the Board, Chief Executive Officer and President, Franklin Mutual Advisers, LLC; and officer and/or director, as the case may be, of three of the investment companies in Franklin Templeton. | ||||||||
Alison E. Baur (1964) One Franklin Parkway San Mateo, CA 94403-1906 | Vice President | Since 2012 | Not Applicable | Not Applicable | ||||
| Principal Occupation During at Least the Past 5 Years: | ||||||||
| Deputy General Counsel, Franklin Templeton; and officer of some of the other subsidiaries of Franklin Resources, Inc. and of 41 of the investment companies in Franklin Templeton. | ||||||||
Breda M. Beckerle (1958) 280 Park Avenue New York, NY 10017 | Interim Chief Compliance Officer | Since January 2020 | Not Applicable | Not Applicable | ||||
| Principal Occupation During at Least the Past 5 Years: | ||||||||
| Chief Compliance Officer, Fiduciary Investment Management International, Inc., Franklin Advisers, Inc., Franklin Advisory Services, LLC, Franklin Mutual Advisers, LLC, Franklin Templeton Institutional, LLC; and officer of 41 of the investment companies in Franklin Templeton. | ||||||||
Steven J. Gray (1955) One Franklin Parkway San Mateo, CA 94403-1906 | Vice President and Secretary | Vice President since 2009 and Secretary since 2005 | Not Applicable | Not Applicable | ||||
| Principal Occupation During at Least the Past 5 Years: | ||||||||
| Senior Associate General Counsel, Franklin Templeton; Vice President, Franklin Templeton Distributors, Inc. and FASA, LLC; and officer of 41 of the investment companies in Franklin Templeton. | ||||||||
Matthew T. Hinkle (1971) One Franklin Parkway San Mateo, CA 94403-1906 | Chief Executive Officer – Finance and Administration | Since 2017 | Not Applicable | Not Applicable | ||||
| Principal Occupation During at Least the Past 5 Years: | ||||||||
| Senior Vice President, Franklin Templeton Services, LLC; officer of 41 of the investment companies in Franklin Templeton; andformerly, Vice President, Global Tax (2012-April 2017) and Treasurer/Assistant Treasurer, Franklin Templeton (2009-2017). | ||||||||
Robert G. Kubilis (1973) 300 S.E. 2nd Street Fort Lauderdale, FL 33301-1923 | Chief Financial Officer, Chief Accounting Officer and Treasurer | Since 2012 | Not Applicable | Not Applicable | ||||
| Principal Occupation During at Least the Past 5 Years: | ||||||||
Treasurer, U.S. Fund Administration & Reporting; and officer of 15 of the investment companies in Franklin Templeton.
| ||||||||
| franklintempleton.com | Annual Report | 49 | ||
FRANKLIN MUTUAL SERIES FUNDS
Interested Board Members and Officers(continued)
Name, Year of Birth and Address | Position | Length of Time Served | Number of Portfolios in Fund Complex Overseen by Board Member* | Other Directorships Held During at Least the Past 5 Years | ||||
Robert Lim (1948) One Franklin Parkway San Mateo, CA 94403-1906 | Vice President – AML Compliance | Since 2016 | Not Applicable | Not Applicable | ||||
| Principal Occupation During at Least the Past 5 Years: | ||||||||
| Vice President, Franklin Templeton Companies, LLC; Chief Compliance Officer, Franklin Templeton Distributors, Inc. and Franklin Templeton Investor Services, LLC; and officer of 44 of the investment companies in Franklin Templeton Investments. | ||||||||
Navid J. Tofigh (1972) One Franklin Parkway San Mateo, CA 94403-1906 | Vice President | Since 2015 | Not Applicable | Not Applicable | ||||
| Principal Occupation During at Least the Past 5 Years: | ||||||||
| Associate General Counsel; and officer of 41 of the investment companies in Franklin Templeton. | ||||||||
Craig S. Tyle (1960) One Franklin Parkway San Mateo, CA 94403-1906 | Vice President | Since 2005 | Not Applicable | Not Applicable | ||||
| Principal Occupation During at Least the Past 5 Years: | ||||||||
| General Counsel and Executive Vice President, Franklin Resources, Inc.; and officer of some of the other subsidiaries of Franklin Resources, Inc. and of 41 of the investment companies in Franklin Templeton. | ||||||||
Lori A. Weber (1964) 300 S.E. 2nd Street Fort Lauderdale, FL 33301-1923 | Vice President | Since 2011 | Not Applicable | Not Applicable | ||||
| Principal Occupation During at Least the Past 5 Years: | ||||||||
Senior Associate General Counsel, Franklin Templeton; Assistant Secretary, Franklin Resources, Inc.; Vice President and Secretary, Templeton Investment Counsel, LLC; and officer of 41 of the investment companies in Franklin Templeton.
| ||||||||
50 | Annual Report | franklintempleton.com | ||
FRANKLIN MUTUAL SERIES FUNDS
*We base the number of portfolios on each separate series of the U.S. registered investment companies within the Franklin Templeton Investments fund complex. These portfolios have a common investment manager or affiliated investment managers.
**Gregory E. Johnson is considered to be an interested person of the Fund under the federal securities laws due to his position as an officer and director of Franklin Resources, Inc. (Resources), which is the parent company of the Fund’s investment manager and distributor. Peter A. Langerman is considered to be an interested person of the Fund under the federal securities laws due to his position as an officer of Franklin Mutual Advisers, LLC, which is the Fund’s investment manager.
Note 1: Officer information is current as of the date of this report. It is possible that after this date, information about officers may change.
The Sarbanes-Oxley Act of 2002 and Rules adopted by the U.S. Securities and Exchange Commission require the Fund to disclose whether the Fund’s Audit Committee includes at least one member who is an audit committee financial expert within the meaning of such Act and Rules. The Fund’s Board has determined that there is at least one such financial expert on the Audit Committee and has designated each of Edward I. Altman, Ph.D., Ann Torre Bates and David W. Niemiec as an audit committee financial expert. The Board believes that Messrs. Altman and Niemiec and Ms. Bates qualify as such an expert in view of their extensive business background and experience. Mr. Altman has served as a member of the Fund Audit Committee since 1987. He currently serves as a Max L. Hine Professor of Finance, Emeritus and Director of The Credit and Debt Markets Research Program, Salomon Center, Stern School of Business, New York University. Ms. Bates has served as a member of the Fund Audit Committee since 1995. She currently serves as a director of Ares Capital Corporation (2010-present) and United Natural Foods, Inc. (2013-present) and was formerly a director of Navient Corporation from 2014 to 2016, SLM Corporation from 1997 to 2014 and Allied Capital Corporation from 2003 to 2010, Executive Vice President and Chief Financial Officer of NHP Incorporated from 1995 to 1997 and Vice President and Treasurer of US Airways, Inc. until 1995. Mr. Niemiec has served as a member of the Fund Audit Committee since 2015, currently serves as an Advisor to Saratoga Partners and was formerly its Managing Director from 1998 to 2001 and serves as a director of Hess Midstream LP (2017-present). Mr. Niemiec was formerly a director of Emeritus Corporation from 1999 to 2010 and OSI Pharmaceuticals, Inc. from 2006 to 2010, Managing Director of SBC Warburg Dillon Read from 1997 to 1998, and was Vice Chairman from 1991 to 1997 and Chief Financial Officer from 1982 to 1997 of Dillon, Read & Co. Inc. As a result of such background and experience, the Board believes that Messrs. Altman and Niemiec and Ms. Bates have each acquired an understanding of generally accepted accounting principles and financial statements, the general application of such principles in connection with the accounting estimates, accruals and reserves, and analyzing and evaluating financial statements that present a breadth and level of complexity of accounting issues generally comparable to those of the Fund, as well as an understanding of internal controls and procedures for financial reporting and an understanding of audit committee functions. Messrs. Altman and Niemiec and Ms. Bates are independent Board members as that term is defined under the applicable U.S. Securities and Exchange Commission Rules and Releases.
The Statement of Additional Information (SAI) includes additional information about the board members and is available, without charge, upon request. Shareholders may call (800) DIALBEN/342-5236 to request the SAI.
| franklintempleton.com | Annual Report | 51 | ||
FRANKLIN MUTUAL SERIES FUNDS
FRANKLIN MUTUAL QUEST FUND
Proxy Voting Policies and Procedures
The Fund’s investment manager has established Proxy Voting Policies and Procedures (Policies) that the Fund uses to determine how to vote proxies relating to portfolio securities. Shareholders may view the Fund’s complete Policies online at franklintempleton.com. Alternatively, shareholders may request copies of the Policies free of charge by calling the Proxy Group collect at (954)527-7678 or by sending a written request to: Franklin Templeton Companies, LLC, 300 S.E. 2nd Street, Fort Lauderdale, FL 33301, Attention: Proxy Group. Copies of the Fund’s proxy voting records are also made available online at franklintempleton.com and posted on the U.S. Securities and Exchange Commission’s website at sec.gov and reflect the most recent12-month period ended June 30.
Quarterly Statement of Investments
The Trust, on behalf of the Fund, files a complete statement of investments with the U.S. Securities and Exchange Commission for the first and third quarters for each fiscal year as an exhibit to its report on FormN-PORT. Shareholders may view the filed FormN-PORT by visiting the Commission’s website at sec.gov. The filed form may also be viewed and copied at the Commission’s Public Reference Room in Washington, DC. Information regarding the operations of the Public Reference Room may be obtained by calling(800) SEC-0330.
Householding of Reports and Prospectuses
You will receive the Fund’s financial reports every six months as well as an annual updated summary prospectus (prospectus available upon request). To reduce Fund expenses, we try to identify related shareholders in a household and send only one copy of the financial reports and summary prospectus. This process, called “householding,” will continue indefinitely unless you instruct us otherwise. If you prefer not to have these documents householded, please call us at (800)632-2301. At any time you may view current prospectuses/summary prospectuses and financial reports on our website. If you choose, you may receive these documents through electronic delivery.
52 | Annual Report | franklintempleton.com | ||
Authorized for distribution only when accompanied or preceded by a summary prospectus and/or prospectus. Investors should carefully consider a fund’s investment goals, risks, charges and expenses before investing. A prospectus contains this and other information; please read it carefully before investing.
To help ensure we provide you with quality service, all calls to and from our service areas are monitored and/or recorded.
 | Annual Report and Shareholder Letter | |||||
| Franklin Mutual Quest Fund | ||||||
Investment Manager | Distributor | Shareholder Services | ||||
| Franklin Mutual Advisers, LLC | Franklin Templeton Distributors, Inc. (800) DIAL BEN®/342-5236 | (800)632-2301 - (Class A, C, R & R6) | ||||
| franklintempleton.com | (800)448-FUND - (Class Z) | |||||
| © 2020 Franklin Templeton Investments. All rights reserved. | 475 A 02/20 |
Sign up for electronic delivery at franklintempleton.com/edelivery
Internet Delivery of Fund Reports Unless You Request Paper Copies: Effective January 1, 2021, as permitted by the SEC, paper copies of the Fund’s shareholder reports will no longer be sent by mail, unless you specifically request them from the Fund or your financial intermediary. Instead, the reports will be made available on a website, and you will be notified by mail each time a report is posted and provided with a website link to access the report.
If you already elected to receive shareholder reports electronically, you will not be affected by this change and you need not take any action. If you have not signed up for electronic delivery, we would encourage you to join fellow shareholders who have. You may elect to receive shareholder reports and other communications electronically from the Fund by calling (800)632-2301 or by contacting your financial intermediary.
You may elect to continue to receive paper copies of all your future shareholder reports free of charge by contacting your financial intermediary or, if you invest directly with a Fund, calling (800)632-2301 to let the Fund know of your request. Your election to receive reports in paper will apply to all funds held in your account.
FRANKLIN TEMPLETON
Successful investing begins with ambition. And achievement only comes when you reach for it. That’s why we continually strive to deliver better outcomes for investors. No matter what your goals are, our deep, global investment expertise allows us to offer solutions that can help.
During our more than 70 years of experience, we’ve managed through all kinds of markets—up, down and those in between. We’re always preparing for what may come next. It’s because of this, combined with our strength as one of the world’s largest asset managers that we’ve earned the trust of millions of investors around the world.
Dear Franklin Mutual Shares Fund Shareholder:
As we enter 2020, the factors that lifted stocks to record highs in 2019—accommodative central bank monetary policies and progress on a proposed trade deal between the U.S. and China—continue to be sources of optimism for growth. The near-term threat of recession has eased, with the U.S. economy showing resilience as low unemployment and moderately rising wages have encouraged consumer spending, which has supported the expansion. In contrast, business investment and exports were weak in 2019, but there are nascent signs of increasing industrial activity.
Tariffs, trade battles and geopolitical conflict may continue to dominate headlines in 2020 and account for a disproportionate source of market volatility. The U.S. and China agreed in principle to aphase-one trade agreement in late 2019. However, are-escalation of the tariff dispute between the world’s two largest economies is not out of the question, as negotiations on aphase-two trade agreement are scheduled to start after the anticipatedphase-one signing ceremony in January. There was clarity on Brexit as British voters delivered a resounding election victory to Prime Minister Boris Johnson and his Conservative Party, which should pave the way for a conclusive exit agreement. The terms of U.K. departure, however, must still be finalized. Late in the period, tensions in the Middle East were on the rise, following the death of an American contractor in Iraq in late December and a retaliatory U.S. military strike two days later.
During the period, we took advantage of market turbulence to seek out a larger number of stocks whose risk/reward profiles turned more favorable. Subsequently, we used the market appreciation to exit from or trim select positions that reached or exceeded our estimates of intrinsic value. Market volatility continues to present occasional opportunities in
individual stocks, and in certain sectors, notably those considered to be economically sensitive. We continue to focus on situations in which company-specific actions are more important than economic improvement in driving shareholder value.
Valuation is an essential factor in our analysis, and we always ask ourselves if current and potential investments represent an attractive balance of risk and reward. Amid theall-time highs reached by the Standard & Poor’s® 500 Index (S&P 500®) during the period, we maintained our focus on individual securities and the prospects for each business in the context of its valuation and the backdrop of potential political and economic risks.
We continue to adhere to abottom-up stock selection process that is disciplined, driven by rigorous fundamental analysis, and that attempts to limit downside risk. In our view, actively investing in underappreciated and misunderstood companies with identifiable catalysts for unlocking shareholder value can offer meaningful upside potential and a degree of downside protection in periods of financial market turbulence.
We recognize the important role of financial advisors in today’s markets and encourage investors to continue to seek their advice. Amid changing markets and economic conditions, we are confident investors with a well-diversified portfolio and a patient, long-term outlook will be well positioned for the years ahead.
On the following pages, the Fund’s portfolio management team reviews investment decisions that pertain to performance during the past 12 months considering the
| Not FDIC Insured | May Lose Value | No Bank Guarantee |
| franklintempleton.com | Not part of the annual report | 1 | ||
economic environment and other factors. Please remember all securities markets fluctuate, as do mutual fund share prices.
We thank you for investing with Franklin Templeton, welcome your questions and comments, and look forward to continuing to serve your investment needs in the years ahead.
Sincerely,
Peter A. Langerman
Chairman, President and Chief Executive Officer
Franklin Mutual Advisers, LLC
This letter reflects our analysis and opinions as of December 31, 2019, unless otherwise indicated. The information is not a complete analysis of every aspect of any market, country, industry, security or fund. Statements of fact are from sources considered reliable.
| 3 | ||||
| 9 | ||||
| 12 | ||||
| 13 | ||||
| 25 | ||||
| 30 | ||||
| Report of Independent Registered Public Accounting Firm | 44 | |||
| 45 | ||||
| 46 | ||||
| 51 | ||||
Visitfranklintempleton.comfor fund updates, to access your account, or to find helpful financial planning tools. | ||||
2 | Not part of the annual report | franklintempleton.com | ||
This annual report for Franklin Mutual Shares Fund covers the fiscal year ended December 31, 2019.
Your Fund’s Goal and Main Investments
The Fund seeks capital appreciation, which may occasionally be short term, with income as a secondary goal. Under normal market conditions, the Fund invests primarily in equity securities, primarily common stock, of U.S. and foreign companies that we believe are available at market prices less than their intrinsic value. To a lesser extent, the Fund also invests in merger arbitrage securities and the debt and equity of distressed companies. The Fund may invest up to 35% of its assets in foreign securities, which may include sovereign debt and participations in foreign government debt. The Geographic Composition bar chart on this page lists the leading countries where the Fund invests.
Performance Overview
The Fund’s Class Z shares posted a cumulative total return of +23.13% for the 12 months ended December 31, 2019. For comparison, the Fund’s benchmark, the Standard & Poor’s 500 Index (S&P 500), which is a broad measure of U.S. stock performance, posted a total return of +31.49%.1 You can find more of the Fund’s performance data in the Performance Summary beginning on page 9.
Performance data represent past performance, which does not guarantee future results. Investment return and principal value will fluctuate, and you may have a gain or loss when you sell your shares. Current performance may differ from figures shown. For most recentmonth-end performance, go tofranklintempleton.comor call(800)342-5236.
Economic and Market Overview
Global developed and emerging market stocks, as measured by the MSCI All Country World Index (USD), posted a +27.30% total return during the 12 months ended December 31, 2019.1 Although global economic growth slowed from 2018, interest-rate cuts from many central banks and the easing of trade tensions nearperiod-end
Geographic Composition*
Based on Total Net Assets as of 12/31/19
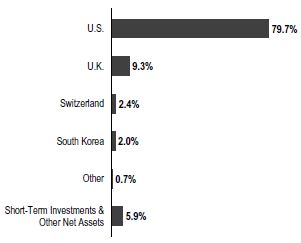
*Figures are stated as a percentage of total and may not equal 100% or may be negative due to rounding, use of any derivatives, unsettled trades or other factors.
contributed to the generally positive environment for equities worldwide. Reflecting investor optimism and slowing but resilient economic growth, stocks advanced in every major region of the globe.
In the U.S., solid economic growth also supported equities, as healthy consumer spending and a strong labor market kept the economy afloat. The unemployment rate fell during the year, reaching 3.5% in September, November and December 2019, the lowest recorded unemployment rate in 50 years.2Wages also grew, albeit at a moderate pace, and inflation remained persistently low. In addition, deficit spending by the U.S. government boosted current growth at the expense of long-term debt. Despite the strength in the consumer sector, some parts of the economy struggled, particularly heavy industry. Annual industrial production contracted late in the reporting period, manufacturing output stalled and capital spending declined.
The U.S. Federal Reserve (Fed) provided a substantial boost to equity markets early in the reporting period as it shifted to a more accommodative monetary policy. In January 2019,
1. Source: Morningstar.
The index is unmanaged and includes reinvestment of any income or distributions. It does not reflect any fees, expenses or sales charges. One cannot invest directly in an index, and an index is not representative of the Fund’s portfolio.
2. Source: U.S. Bureau of Labor Statistics.
The dollar value, number of shares or principal amount, and names of all portfolio holdings are listed in the Fund’s Statement of Investments (SOI).
The SOI begins on page 18.
| franklintempleton.com | Annual Report | 3 | ||
FRANKLIN MUTUAL SHARES FUND
the Fed signaled the end of its tightening cycle and cut the federal funds rate three times thereafter, lowering it to a range of 1.50%–1.75%. Stocks responded positively to the interest-rate cuts and gained further in December 2019 after the Fed indicated it would likely leave interest rates unchanged in 2020.
Growth slowed overall in the eurozone, particularly in Germany and Italy. Germany, which is heavily reliant on exports, was adversely affected by the trade conflict between the U.S. and China and the resulting slowdown in global trade. In Italy, political uncertainty and budget concerns caused the country’s annual gross domestic product (GDP) growth to stall in 2019’s first quarter before modestly improving in the second and third quarters. Despite sluggish economic conditions, European developed market equities, as measured by the MSCI EuropeIndex-NR (Local Currency), posted a +23.75% total return for the12-month period, as easing trade tensions buoyed investor optimism and an electoral victory by the Conservative Party in the U.K. alleviated uncertainty surrounding Brexit.3 Although the European Central Bank left its headline refinancing rate unchanged, it lowered the deposit rate and restarted its bond-buying stimulus program, further supporting stocks.
Economic growth in Asia was relatively solid overall, despite slowdowns in several large emerging market countries, such as China and India. Japan’s economy grew amid the Bank of Japan’s sizable stimulus program. The trade war between the U.S. and China provided the backdrop for Asian stocks, which rose and fell in sync with investor sentiment regarding a trade deal. A phase one trade agreement between the two countries reached in December 2019 propelled Asian developed and emerging market stocks, which ultimately ended with a +19.23% total return over the12-month period, as measured by the MSCI All Country Asia Index (USD).4
Emerging market stocks overall experienced several sharp selloffs and subsequent rebounds throughout the reporting period before ending with gains. In aggregate, economic growth slowed somewhat from 2018 but remained solid, although there was some variation among individual countries. Many central banks in emerging markets cut interest rates throughout the reporting period, which, along with resilient GDP growth, provided a supportive environment for equities. Russian stocks posted the highest returns among emerging markets as the threat of further sanctions receded and a solid fiscal environment reassured investors. Overall, global emerging markets, as measured by
the MSCI Emerging Markets Index (USD), posted a +18.90% total return for the12-month period.1
Investment Strategy
At Franklin Mutual Series, we are committed to our distinctive value approach to investing, which we believe can generate above-average risk-adjusted returns over time for our shareholders. Our major investment strategy is investing in undervalued stocks. When selecting undervalued equities, we are attracted to what we believe are fundamentally strong companies with healthy balance sheets, high-quality assets, substantial free cash flow and shareholder-oriented management teams and whose stocks are trading at discounts to our assessment of the companies’ intrinsic or business value. We also look for asset-rich companies whose shares may be trading at depressed levels due to concerns over short-term earnings disappointments, litigation, management strategy or other perceived negatives. This strict value approach is not only intended to improve the likelihood of capital appreciation, but also reduces the risk of substantial declines, in our opinion. While the vast majority of our undervalued equity investments are made in publicly traded companies globally, we may invest occasionally in privately held companies as well.
To a lesser extent, we complement this more traditional investment strategy with two others. One is distressed investing, a highly specialized field that has proven quite profitable during certain periods over the years. Distressed investing is complex and can take many forms. The most common distressed investment the Fund undertakes is the purchase of financially troubled or bankrupt companies’ debt at a substantial discount to face value. After the financially distressed company is reorganized, often in bankruptcy court, the old debt is typically replaced with new securities issued by the financially stronger company.
The other piece of our investment strategy is participating in arbitrage situations, another highly specialized field. When companies announce proposed mergers or takeovers, commonly referred to as deals, the target company may trade at a discount to the bid it ultimately accepts. One form of arbitrage involves purchasing the target company’s stock when it is trading below the value we believe it would receive in a deal. In keeping with our commitment to a relatively conservative investment approach, we typically focus our arbitrage efforts on announced deals, and avoid rumored deals or other situations we consider relatively risky. In
3. Source: Morningstar. Net Returns (NR) include income net of tax withholding when dividend are paid.
4. Source: MSCI.
4 | Annual Report | franklintempleton.com | ||
FRANKLIN MUTUAL SHARES FUND
addition, it is our practice to hedge the Fund’s currency exposure when we deem it advantageous for our shareholders.
What is meant by “hedge”? |
To hedge an investment is to take a position intended to offset potential losses that may be incurred by a companion financial instrument. Hedging an investment may also offset potential gains. |
Manager’s Discussion
The end of a decade is a natural time for reflection about the years that have just passed and to look ahead to what the next 10 might have in store. Across Wall Street, we see many prognostications, and while we are not in the forecasting business, we do allow ourselves to think about investment opportunities over such an extended time period. But experience has taught us that while trying to predict the exact course of markets and/or economic and political events that will drive them may be fun, it is not all that useful.
As 2010 began, the global economy was still recovering from the Global Financial Crisis. The U.S. government owned significant portions of the banking and automotive sectors. The Fed had already started quantitative easing (QE), with QE 2 and QE 3 still to come. In Europe, concerns about Greece’s finances were emerging, and in China the effects of 2009’s massive stimulus programs were starting to take hold.
Over the subsequent years we saw ongoing, global QE, culminating in trillions of dollars of debt yielding negative interest rates. The European Union (EU) was in continuous upheaval, with Greece threatening to leave, but eventually staying in the eurozone; the U.K. pursuing and achieving Brexit; and ongoing strain between core members Germany, France, Italy and Spain. In the U.S., average annual economic growth was restrained and finished the decade below 2%, trailing the minimum 3% expectation of prior decades. Strong corporate profits and lower corporate tax rates were bright spots.
Equity markets delivered a very good decade—one of the best in history—with the S&P 500 and the MSCI World Index (USD) posting average annual total returns of +13.56% and +10.08%, respectively.5 During the decade, Franklin Mutual
Top 10 Sectors/Industries
Based on Equity Securities as of 12/31/19
% of Total Net Assets | ||
Pharmaceuticals | 9.9% | |
Banks | 9.7% | |
Insurance | 8.2% | |
Oil, Gas & Consumable Fuels | 7.7% | |
Media | 6.1% | |
Technology Hardware, Storage & Peripherals | 4.3% | |
Tobacco | 3.1% | |
Food Products | 3.1% | |
Health Care Equipment & Supplies | 3.0% | |
Software | 3.0% | |
Shares Fund, Class Z posted an average annual total return of +9.01%, a solid absolute return that nonetheless lagged the S&P 500, its benchmark. The Fund’s value strategy, which seeks to identify mispriced securities and limit downside risk, was out of favor in an environment that generally encouraged investors to assume more risk. Conversely, the Fund’s Class Z shares posted an average annual total return of +5.27% in the prior decade, compared with-0.95% for the S&P 500.1 Our active investment approach focusing on individual opportunities was more conducive to the prior decade’s greater volatility.
In our view, going forward we expect more political and monetary uncertainty and economic growth in unexpected places. Corporate profits will have good years and bad years. Some industries will be massively disrupted, while others will find a way to adjust and prosper, even within the context of artificial intelligence and machine learning. Recent events, such as the coronavirus outbreak, have caused, and may continue to cause, uncertainty and volatility in the Chinese economy, potentially leading to vulnerability in 2020 global growth expectations. As for investment positioning, we intend to avoid forecasts that would lead us to make the Fund’s success dependent on a specific set of outcomes. Rather, we will seek to continue with our time-tested value process and complement it with new tools that enhance our security evaluation and selection process. To that end, we have integrated risk and quantitative portfolio analysis tools that provide us with fresh insights about performance, and help us identify companies and securities that we believe
5. Source: Morningstar.
The indexes are unmanaged and include reinvestment of any income or distributions. They do not reflect any fees, expenses or sales charges. One cannot invest directly in an index, and an index is not representative of the Fund’s portfolio.
See www.franklintempletondatasources.com for additional data provider information.
| franklintempleton.com | Annual Report | 5 | ||
FRANKLIN MUTUAL SHARES FUND
satisfy our investors’ goals of risk-adjusted returns that are not wholly dependent on any one economic or political scenario.
Fund Performance
Turning to Fund performance, top positive contributors included U.S.-based companies Charter Communications, Citigroup and Walt Disney. These companies are listed among the Fund’s largest positions in the Top 10 Equity Holdings table on this page.
Shares of cable operator Charter Communications surged after the company reported operating and financial results that were broadly ahead of consensus estimates. Capital expenditures were lower than expected and drove free cash flow, which was used during the period to buy back $3.1 billion of the company’s stock. The market was anticipating share repurchases totaling $2.25 billion. Revenue accelerated 5.1% compared with consensus forecasts of 4.5%. The increased revenue, however, did not reflect the impact of a broad-based increase in per subscriber fees implemented during the period, which could drive revenue growth and margin expansion in 2020. According to the company’s management, there has not been a meaningful decrease in customers as a result of the higher per subscriber fees.
Investors bid up shares of bank and financial services provider Citigroup following the release of third-quarter earnings that beat consensus expectations. Highlights included increases in deposits of 6% quarter-over-quarter and 11% year-over-year; growth in revenues and purchase volumes in the North America-branded credit cards division by 11% and 7% year-over-year, respectively; and strong results in the bank’s Asian operations across the board. Management also repurchased 76 million, or 3.3%, of outstanding shares of the company during the period.
Shares of family entertainment and media enterprise Walt Disney surged in late 2019. The rally was kicked off by an earnings report characterized byacross-the-board outperformance of Disney legacy assets and a better-than-expected outlook for fiscal-year 2020 earnings. The company’s stock continued to rise following the successful launch of Disney+, its subscription videoon-demand streaming service, which reported more than 10 million subscribers on the first day of service, exceeding forecasts. The box office performance of Frozen II, which set a record for Thanksgiving-weekend receipts, also helped boost the stock’s performance.
Top 10 Equity Holdings
12/31/19
Company Sector/Industry, Country | % of Total Net Assets | |
Medtronic PLC Health Care Equipment & Supplies, U.S. | 3.0% | |
Novartis AG Pharmaceuticals, Switzerland | 2.4% | |
The Walt Disney Co. Entertainment, U.S. | 2.3% | |
Charter Communications Inc. Media, U.S. | 2.3% | |
GlaxoSmithKline PLC Pharmaceuticals, U.K. | 2.3% | |
Alleghany Corp. Insurance, U.S. | 2.2% | |
JPMorgan Chase & Co. Banks, U.S. | 2.2% | |
American International Group Inc. Insurance, U.S. | 2.2% | |
Citigroup Inc. Banks, U.S. | 2.1% | |
Wells Fargo & Co. Banks, U.S. | 2.1% | |
During the period under review, Fund investments that detracted from performance included U.S.-based companies Fluor (not held atperiod-end), Occidental Petroleum and Walgreens Boots Alliance.
The share price of Fluor, a global engineering and construction company, fell significantly during the period. The company withdrew 2019 guidance after reporting significant project charges and materially lower-than-expected earnings and revenues. Following these disappointing results, the company announced the return of the former chief executive officer (CEO) as executive chairman, promoted the general counsel to CEO, rehired the former chief financial officer and initiated a strategic review that recommends simplifying the company’s business model by divesting ofnon-core businesses.
The stock of Occidental Petroleum, a petroleum and chemical products company, traded lower in 2019 as investors struggled to accept its acquisition of Anadarko Petroleum, during a period in which energy stocks were under pressure from falling crude oil prices. We think the Anadarko deal should be highly beneficial to the company’s per share metrics, although the acquisition will make the company more dependent on oil prices, while significantly weakening its balance sheet. The acquired Permian Basin
6 | Annual Report | franklintempleton.com | ||
FRANKLIN MUTUAL SHARES FUND
assets complement Occidental’s existing portfolio, and the considerable free cash flow generated from Anadarko’s Gulf of Mexico operations can help reduce debt and support its dividend. Occidental’s management is strengthening the company’s financial position by disposing ofnon-core assets, which is key to restoring investor confidence, in our view.
Shares of drug store services provider Walgreens Boots Alliance began to sell off early in 2019, when the chief financial officer cited negative industry trends in drug prices and pharmacy benefit manager (PBM) reimbursement rates. Shares also fell in reaction to the company’s limited success in offsetting those challenges by increasing its volume of drug sales or renegotiating with PBMs. These pressures, and weakness in both its U.S. and U.K. stores, resulted in a cut to full-year guidance in April. However, Walgreens is reducing costs throughout the enterprise, and is attempting to reduce exposure to lower margin categories within the front of its stores, which we believe can help boost growth and profitability over the longer term. The company’s share price rallied in early November based on news that global investment firm KKR had approached the company about taking it private via a leveraged buyout that would likely be the largest in history. However, the stock retreated later when deal terms failed to materialize.
During the period, the Fund held currency forwards and futures seeking to hedge most of the currency risk of the portfolio’snon-U.S. dollar investments. The hedges had a modestly positive overall impact on the Fund’s performance.
What is a currency forward? |
A currency forward is a direct agreement between the Fund and a counterparty to buy or sell a foreign currency in exchange for another currency at a specific exchange rate on a future date. |
What is a future?
A future is an agreement between the Fund and a counterparty made through a U.S. or foreign futures exchange to buy or sell an underlying instrument or asset at a specific price on a future date.
As fellow shareholders, we found recent relative performance disappointing, but it is not uncommon for our strategy to lag the equity markets at times. We remain committed to our disciplined, value investment approach as we seek to generate attractive, long-term, risk-adjusted returns for shareholders.
Thank you for your participation in Franklin Mutual Shares Fund. We look forward to continuing to serve your investment needs.
| franklintempleton.com | Annual Report | 7 | ||
FRANKLIN MUTUAL SHARES FUND
| |
Peter A. Langerman Co-Portfolio Manager |
 |
F. David Segal, CFA Co-Portfolio Manager |

 |
Debbie A. Turner, CFA Co-Portfolio Manager |

The foregoing information reflects our analysis, opinions and portfolio holdings as of December 31, 2019, the end of the reporting period. The way we implement our main investment strategies and the resulting portfolio holdings may change depending on factors such as market and economic conditions. These opinions may not be relied upon as investment advice or an offer for a particular security. The information is not a complete analysis of every aspect of any market, country, industry, security or the Fund. Statements of fact are from sources considered reliable, but the investment manager makes no representation or warranty as to their completeness or accuracy. Although historical performance is no guarantee of future results, these insights may help you understand our investment management philosophy.
CFA® is a trademark owned by CFA Institute.
8 | Annual Report | franklintempleton.com | ||
FRANKLIN MUTUAL SHARES FUND
Performance Summary as of December 31, 2019
The performance table and graphs do not reflect any taxes that a shareholder would pay on Fund dividends, capital gain distributions, if any, or any realized gains on the sale of Fund shares. Total return reflects reinvestment of the Fund’s dividends and capital gain distributions, if any, and any unrealized gains or losses. Your dividend income will vary depending on dividends or interest paid by securities in the Fund’s portfolio, adjusted for operating expenses of each class. Capital gain distributions are net profits realized from the sale of portfolio securities.
Performance as of 12/31/191
Cumulative total return excludes sales charges. Average annual total return includes maximum sales charges. Sales charges will vary depending on the size of the investment and the class of share purchased. The maximum is 5.50% and the minimum is 0%.Class A:5.50% maximum initial sales charge. For other share classes, visitfranklintempleton.com.
| Share Class | Cumulative Total Return2 | Average Annual Total Return3 | ||
Z | ||||
1-Year | +23.13% | +23.13% | ||
5-Year | +35.59% | +6.28% | ||
10-Year | +136.87% | +9.01% | ||
A4 | ||||
1-Year | +22.86% | +16.09% | ||
5-Year | +33.88% | +4.82% | ||
10-Year | +130.40% | +8.09% | ||
Performance data represent past performance, which does not guarantee future results. Investment return and principal value will fluctuate, and you may have a gain or loss when you sell your shares. Current performance may differ from figures shown. For most recentmonth-end performance, go tofranklintempleton.comor call(800)342-5236.
See page 11 for Performance Summary footnotes.
| franklintempleton.com | Annual Report | 9 | ||
FRANKLIN MUTUAL SHARES FUND
PERFORMANCE SUMMARY
Total Return Index Comparison for a Hypothetical $10,000 Investment1
Total return represents the change in value of an investment over the periods shown. It includes any applicable maximum sales charge, Fund expenses, account fees and reinvested distributions. The unmanaged index includes reinvestment of any income or distributions. It differs from the Fund in composition and does not pay management fees or expenses. One cannot invest directly in an index.
Class Z(1/1/10–12/31/19)
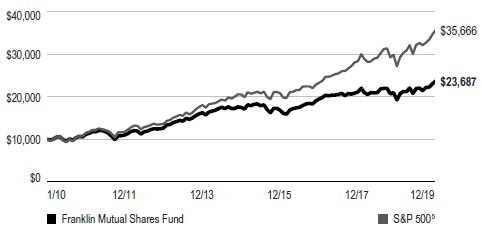
Class A(1/1/10–12/31/19)
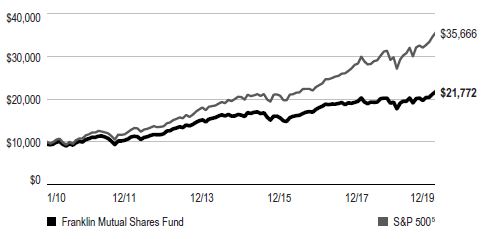
See page 11 for Performance Summary footnotes.
10 | Annual Report | franklintempleton.com | ||
FRANKLIN MUTUAL SHARES FUND
PERFORMANCE SUMMARY
Distributions(1/1/19–12/31/19)
| Share Class | Net Investment Income | Short-Term Capital Gain | Long-Term Capital Gain | Total | ||||||||||||
Z | $0.7149 | $0.0648 | $1.4468 | $2.2265 | ||||||||||||
A | $0.6430 | $0.0648 | $1.4468 | $2.1546 | ||||||||||||
C | $0.4236 | $0.0648 | $1.4468 | $1.9352 | ||||||||||||
R | $0.5479 | $0.0648 | $1.4468 | $2.0595 | ||||||||||||
R6 | $0.7317 | $0.0648 | $1.4468 | $2.2433 | ||||||||||||
Total Annual Operating Expenses6
| Share Class | With Fee Waiver | Without Fee Waiver | ||||||
| Z | 0.77% | 0.77% | ||||||
| A | 1.02% | 1.02% | ||||||
Each class of shares is available to certain eligible investors and has different annual fees and expenses, as described in the prospectus.
All investments involve risks, including possible loss of principal. Value securities may not increase in price as anticipated or may decline further in value. Special risks are associated with foreign investing, including currency fluctuations, economic instability and political developments. The Fund’s investments in companies engaged in mergers, reorganizations or liquidations also involve special risks as pending deals may not be completed on time or on favorable terms. The Fund may invest in lower rated bonds, which entail higher credit risk. The Fund’s prospectus also includes a description of the main investment risks.
1. The Fund has a fee waiver associated with any investment it makes in a Franklin Templeton money fund and/or other Franklin Templeton fund, contractually guaranteed through 4/30/20. Fund investment results reflect the fee waiver; without this waiver, the results would have been lower.
2. Cumulative total return represents the change in value of an investment over the periods indicated.
3. Average annual total return represents the average annual change in value of an investment over the periods indicated. Return for less than one year, if any, has not been annualized.
4. Prior to 9/10/18, these shares were offered at a higher initial sales charge of 5.75%, thus actual returns (with sales charges) would have differed. Average annual total returns (with sales charges) have been restated to reflect the current maximum initial sales charge of 5.50%.
5. Source: Morningstar. The S&P 500 is a market capitalization-weighted index of 500 stocks designed to measure total U.S. equity market performance.
6. Figures are as stated in the Fund’s current prospectus and may differ from the expense ratios disclosed in the Your Fund’s Expenses and Financial Highlights sections in this report. In periods of market volatility, assets may decline significantly, causing total annual Fund operating expenses to become higher than the figures shown. See www.franklintempletondatasources.com for additional data provider information.
| franklintempleton.com | Annual Report | 11 | ||
FRANKLIN MUTUAL SHARES FUND
As a Fund shareholder, you can incur two types of costs: (1) transaction costs, including sales charges (loads) on Fund purchases and redemptions; and (2) ongoing Fund costs, including management fees, distribution and service(12b-1) fees, and other Fund expenses. All mutual funds have ongoing costs, sometimes referred to as operating expenses. The table below shows ongoing costs of investing in the Fund and can help you understand these costs and compare them with those of other mutual funds. The table assumes a $1,000 investment held for the six months indicated.
Actual Fund Expenses
The table below provides information about actual account values and actual expenses in the columns under the heading “Actual.” In these columns the Fund’s actual return, which includes the effect of Fund expenses, is used to calculate the “Ending Account Value” for each class of shares. You can estimate the expenses you paid during the period by following these steps (of course, your account value and expenses will differ from those in this illustration): Divide your account value by $1,000 (if your account had an $8,600 value, then $8,600 ÷ $1,000 = 8.6). Then multiply the result by the number in the row for your class of shares under the headings “Actual” and “Expenses Paid During Period”(if Actual Expenses Paid During Period were $7.50, then 8.6 x $7.50 = $64.50). In this illustration, the actual expenses paid this period are $64.50.
Hypothetical Example for Comparison with Other Funds
Under the heading “Hypothetical” in the table, information is provided about hypothetical account values and hypothetical expenses based on the Fund’s actual expense ratio and an assumed rate of return of 5% per year before expenses, which is not the Fund’s actual return. This information may not be used to estimate the actual ending account balance or expenses you paid for the period, but it can help you compare ongoing costs of investing in the Fund with those of other funds. To do so, compare this 5% hypothetical example for the class of shares you hold with the 5% hypothetical examples that appear in the shareholder reports of other funds.
Please note that expenses shown in the table are meant to highlight ongoing costs and do not reflect any transactional costs. Therefore, information under the heading “Hypothetical” is useful in comparing ongoing costs only, and will not help you compare total costs of owning different funds. In addition, if transactional costs were included, your total costs would have been higher.
| Actual | Hypothetical | |||||||||||||||||
| (actual return after expenses) | (5% annual return before expenses) | |||||||||||||||||
| Expenses | Expenses | Net | ||||||||||||||||
| Beginning | Ending | Paid During | Ending | Paid During | Annualized | |||||||||||||
| Share | Account | Account | Period | Account | Period | Expense | ||||||||||||
| Class | Value 7/1/19 | Value 12/31/19 | 7/1/19–12/31/191, 2 | Value 12/31/19 | 7/1/19–12/31/191, 2 | Ratio2 | ||||||||||||
|
|
|
| |||||||||||||||
| Z | $1,000 | $1,082.20 | $4.09 | $1,021.27 | $3.97 | 0.78% | ||||||||||||
| A | $1,000 | $1,081.30 | $5.40 | $1,020.01 | $5.24 | 1.03% | ||||||||||||
| C | $1,000 | $1,076.80 | $9.32 | $1,016.23 | $9.05 | 1.78% | ||||||||||||
| R | $1,000 | $1,079.60 | $6.71 | $1,018.75 | $6.51 | 1.28% | ||||||||||||
| R6 | $1,000 | $1,082.90 | $3.68 | $1,021.68 | $3.57 | 0.70% | ||||||||||||
1. Expenses are equal to the annualized expense ratio for thesix-month period as indicated above—in the far right column—multiplied by the simple average account value over the period indicated, and then multiplied by 184/365 to reflect theone-half year period.
2. Reflects expenses after fee waivers and expense reimbursements. Does not include acquired fund fees and expenses.
12 | Annual Report | franklintempleton.com | ||
FRANKLIN MUTUAL SERIES FUNDS
Franklin Mutual Shares Fund
| Year Ended December 31, | ||||||||||||||||||||
| 2019 | 2018 | 2017 | 2016 | 2015 | ||||||||||||||||
Class Z | ||||||||||||||||||||
Per share operating performance (for a share outstanding throughout the year) | ||||||||||||||||||||
Net asset value, beginning of year | $24.25 | $28.63 | $28.22 | $26.00 | $29.52 | |||||||||||||||
Income from investment operationsa: | ||||||||||||||||||||
Net investment incomeb | 0.63 | 0.51 | 0.65 | c | 0.63 | d | 0.54 | |||||||||||||
Net realized and unrealized gains (losses) | 4.90 | (3.11 | ) | 1.73 | 3.48 | (1.71 | ) | |||||||||||||
Total from investment operations | 5.53 | (2.60 | ) | 2.38 | 4.11 | (1.17 | ) | |||||||||||||
Less distributions from: | ||||||||||||||||||||
Net investment income | (0.71 | ) | (0.53 | ) | (0.68 | ) | (0.64 | ) | (0.59 | ) | ||||||||||
Net realized gains | (1.51 | ) | (1.25 | ) | (1.29 | ) | (1.25 | ) | (1.76 | ) | ||||||||||
Total distributions | (2.22 | ) | (1.78 | ) | (1.97 | ) | (1.89 | ) | (2.35 | ) | ||||||||||
Net asset value, end of year | $27.56 | $24.25 | $28.63 | $28.22 | $26.00 | |||||||||||||||
Total return | 23.13% | (8.95)% | 8.49% | 15.88% | (3.81)% | |||||||||||||||
Ratios to average net assets | ||||||||||||||||||||
Expensese,f | 0.78% | g | 0.76% | g | 0.78% | 0.80% | g | 0.81% | g | |||||||||||
Expenses incurred in connection with securities sold short | 0.02% | —% | h | —% | 0.01% | 0.02% | ||||||||||||||
Net investment income | 2.32% | 1.77% | 2.23% | c | 2.33% | d | 1.82% | |||||||||||||
Supplemental data | ||||||||||||||||||||
Net assets, end of year (000’s) | $5,472,276 | $5,189,476 | $6,229,996 | $7,681,881 | $6,770,056 | |||||||||||||||
Portfolio turnover rate | 21.71% | 20.72% | 18.15% | 20.56% | 19.99% | |||||||||||||||
aThe amount shown for a share outstanding throughout the period may not correlate with the Statement of Operations for the period due to the timing of sales and repurchases of the Fund’s shares in relation to income earned and/or fluctuating fair value of the investments of the Fund.
bBased on average daily shares outstanding.
cNet investment income per share includes approximately $0.16 per share related to income received in the form of special dividends in connection with certain Fund holdings. Excluding this amount, the ratio of net investment income to average net assets would have been 1.69%.
dNet investment income per share includes approximately $0.10 per share related to income received in the form of special dividends in connection with certain Fund holdings. Excluding this amount, the ratio of net investment income to average net assets would have been 1.96%.
eIncludes dividend and/or interest expense on securities sold short and security borrowing fees, if any. See below for the ratios of such expenses to average net assets for the periods presented. See Note 1(e).
fBenefit of expense reduction rounds to less than 0.01%.
gBenefit of waiver and payments by affiliates rounds to less than 0.01%.
hRounds to less than 0.01%.
| franklintempleton.com | The accompanying notes are an integral part of these financial statements. | Annual Report | 13 | ||
FRANKLIN MUTUAL SERIES FUNDS
FINANCIAL HIGHLIGHTS
Franklin Mutual Shares Fund(continued)
| Year Ended December 31, | ||||||||||||||||||||
| 2019 | 2018 | 2017 | 2016 | 2015 | ||||||||||||||||
Class A | ||||||||||||||||||||
Per share operating performance (for a share outstanding throughout the year) | ||||||||||||||||||||
Net asset value, beginning of year | $24.00 | $28.35 | $27.97 | $25.78 | $29.29 | |||||||||||||||
Income from investment operationsa: | ||||||||||||||||||||
Net investment incomeb | 0.56 | 0.43 | 0.58 | c | 0.56 | d | 0.45 | |||||||||||||
Net realized and unrealized gains (losses) | 4.85 | (3.07 | ) | 1.70 | 3.45 | (1.69 | ) | |||||||||||||
Total from investment operations | 5.41 | (2.64 | ) | 2.28 | 4.01 | (1.24 | ) | |||||||||||||
Less distributions from: | ||||||||||||||||||||
Net investment income | (0.64 | ) | (0.46 | ) | (0.61 | ) | (0.57 | ) | (0.51 | ) | ||||||||||
Net realized gains | (1.51 | ) | (1.25 | ) | (1.29 | ) | (1.25 | ) | (1.76 | ) | ||||||||||
Total distributions | (2.15 | ) | (1.71 | ) | (1.90 | ) | (1.82 | ) | (2.27 | ) | ||||||||||
Net asset value, end of year | $27.26 | $24.00 | $28.35 | $27.97 | $25.78 | |||||||||||||||
Total returne | 22.86% | (9.18)% | 8.21% | 15.61% | (4.10)% | |||||||||||||||
Ratios to average net assets | ||||||||||||||||||||
Expensesf,g | 1.03% | h | 1.01% | h | 1.03% | 1.05% | h | 1.09% | h | |||||||||||
Expenses incurred in connection with securities sold short | 0.02% | —% | i | —% | 0.01% | 0.02% | ||||||||||||||
Net investment income | 2.07% | 1.52% | 1.98% | c | 2.08% | d | 1.54% | |||||||||||||
Supplemental data | ||||||||||||||||||||
Net assets, end of year (000’s) | $4,042,626 | $3,852,134 | $4,386,829 | $4,737,576 | $4,819,868 | |||||||||||||||
Portfolio turnover rate | 21.71% | 20.72% | 18.15% | 20.56% | 19.99% | |||||||||||||||
aThe amount shown for a share outstanding throughout the period may not correlate with the Statement of Operations for the period due to the timing of sales and repurchases of the Fund’s shares in relation to income earned and/or fluctuating fair value of the investments of the Fund.
bBased on average daily shares outstanding.
cNet investment income per share includes approximately $0.16 per share related to income received in the form of special dividends in connection with certain Fund holdings. Excluding this amount, the ratio of net investment income to average net assets would have been 1.44%.
dNet investment income per share includes approximately $0.10 per share related to income received in the form of special dividends in connection with certain Fund holdings. Excluding this amount, the ratio of net investment income to average net assets would have been 1.71%.
eTotal return does not reflect sales commissions or contingent deferred sales charges, if applicable.
fIncludes dividend and/or interest expense on securities sold short and security borrowing fees, if any. See below for the ratios of such expenses to average net assets for the periods presented. See Note 1(e).
gBenefit of expense reduction rounds to less than 0.01%.
hBenefit of waiver and payments by affiliates rounds to less than 0.01%.
iRounds to less than 0.01%.
14 | Annual Report | The accompanying notes are an integral part of these financial statements. | franklintempleton.com | ||
FRANKLIN MUTUAL SERIES FUNDS
FINANCIAL HIGHLIGHTS
Franklin Mutual Shares Fund(continued)
| Year Ended December 31, | ||||||||||||||||||||
| 2019 | 2018 | 2017 | 2016 | 2015 | ||||||||||||||||
Class C | ||||||||||||||||||||
Per share operating performance (for a share outstanding throughout the year) | ||||||||||||||||||||
Net asset value, beginning of year | $23.97 | $28.04 | $27.68 | $25.54 | $29.02 | |||||||||||||||
Income from investment operationsa: | ||||||||||||||||||||
Net investment incomeb | 0.36 | 0.21 | 0.35 | c | 0.35 | d | 0.24 | |||||||||||||
Net realized and unrealized gains (losses) | 4.82 | (3.00 | ) | 1.67 | 3.40 | (1.67 | ) | |||||||||||||
Total from investment operations | 5.18 | (2.79 | ) | 2.02 | 3.75 | (1.43 | ) | |||||||||||||
Less distributions from: | ||||||||||||||||||||
Net investment income | (0.42 | ) | (0.03 | ) | (0.37 | ) | (0.36 | ) | (0.29 | ) | ||||||||||
Net realized gains | (1.51 | ) | (1.25 | ) | (1.29 | ) | (1.25 | ) | (1.76 | ) | ||||||||||
Total distributions | (1.93 | ) | (1.28 | ) | (1.66 | ) | (1.61 | ) | (2.05 | ) | ||||||||||
Net asset value, end of year | $27.22 | $23.97 | $28.04 | $27.68 | $25.54 | |||||||||||||||
Total returne | 21.93% | (9.87)% | 7.37% | 14.77% | (4.79)% | |||||||||||||||
Ratios to average net assets | ||||||||||||||||||||
Expensesf,g | 1.78% | h | 1.76% | h | 1.78% | 1.80% | h | 1.81% | h | |||||||||||
Expenses incurred in connection with securities sold short | 0.02% | —% | i | —% | 0.01% | 0.02% | ||||||||||||||
Net investment income | 1.32% | 0.77% | 1.23% | c | 1.33% | d | 0.82% | |||||||||||||
Supplemental data | ||||||||||||||||||||
Net assets, end of year (000’s) | $302,296 | $309,756 | $995,665 | $1,114,760 | $1,101,302 | |||||||||||||||
Portfolio turnover rate | 21.71% | 20.72% | 18.15% | 20.56% | 19.99% | |||||||||||||||
aThe amount shown for a share outstanding throughout the period may not correlate with the Statement of Operations for the period due to the timing of sales and repurchases of the Fund’s shares in relation to income earned and/or fluctuating fair value of the investments of the Fund.
bBased on average daily shares outstanding.
cNet investment income per share includes approximately $0.16 per share related to income received in the form of special dividends in connection with certain Fund holdings. Excluding this amount, the ratio of net investment income to average net assets would have been 0.69%.
dNet investment income per share includes approximately $0.10 per share related to income received in the form of special dividends in connection with certain Fund holdings. Excluding this amount, the ratio of net investment income to average net assets would have been 0.96%.
eTotal return does not reflect sales commissions or contingent deferred sales charges, if applicable.
fIncludes dividend and/or interest expense on securities sold short and security borrowing fees, if any. See below for the ratios of such expenses to average net assets for the periods presented. See Note 1(e).
gBenefit of expense reduction rounds to less than 0.01%.
hBenefit of waiver and payments by affiliates rounds to less than 0.01%.
iRounds to less than 0.01%.
| franklintempleton.com | The accompanying notes are an integral part of these financial statements. | Annual Report | 15 | ||
FRANKLIN MUTUAL SERIES FUNDS
FINANCIAL HIGHLIGHTS
Franklin Mutual Shares Fund(continued)
| Year Ended December 31, | ||||||||||||||||||||
| 2019 | 2018 | 2017 | 2016 | 2015 | ||||||||||||||||
Class R | ||||||||||||||||||||
Per share operating performance (for a share outstanding throughout the year) | ||||||||||||||||||||
Net asset value, beginning of year | $23.91 | $28.21 | $27.83 | $25.66 | $29.14 | |||||||||||||||
Income from investment operationsa: | ||||||||||||||||||||
Net investment incomeb | 0.49 | 0.36 | 0.50 | c | 0.49 | d | 0.38 | |||||||||||||
Net realized and unrealized gains (losses) | 4.83 | (3.05 | ) | 1.70 | 3.42 | (1.67 | ) | |||||||||||||
Total from investment operations | 5.32 | (2.69 | ) | 2.20 | 3.91 | (1.29 | ) | |||||||||||||
Less distributions from: | ||||||||||||||||||||
Net investment income | (0.55 | ) | (0.36 | ) | (0.53 | ) | (0.49 | ) | (0.43 | ) | ||||||||||
Net realized gains | (1.51 | ) | (1.25 | ) | (1.29 | ) | (1.25 | ) | (1.76 | ) | ||||||||||
Total distributions | (2.06 | ) | (1.61 | ) | (1.82 | ) | (1.74 | ) | (2.19 | ) | ||||||||||
Net asset value, end of year | $27.17 | $23.91 | $28.21 | $27.83 | $25.66 | |||||||||||||||
Total return | 22.55% | (9.41)% | 7.96% | 15.31% | (4.32)% | |||||||||||||||
Ratios to average net assets | ||||||||||||||||||||
Expensese,f | 1.28% | g | 1.26% | g | 1.28% | 1.30% | g | 1.31% | g | |||||||||||
Expenses incurred in connection with securities sold short | 0.02% | —% | h | —% | 0.01% | 0.02% | ||||||||||||||
Net investment income | 1.82% | 1.27% | 1.73% | c | 1.83% | d | 1.32% | |||||||||||||
Supplemental data | ||||||||||||||||||||
Net assets, end of year (000’s) | $66,038 | $74,345 | $107,660 | $123,013 | $134,050 | |||||||||||||||
Portfolio turnover rate | 21.71% | 20.72% | 18.15% | 20.56% | 19.99% | |||||||||||||||
aThe amount shown for a share outstanding throughout the period may not correlate with the Statement of Operations for the period due to the timing of sales and repurchases of the Fund’s shares in relation to income earned and/or fluctuating fair value of the investments of the Fund.
bBased on average daily shares outstanding.
cNet investment income per share includes approximately $0.16 per share related to income received in the form of special dividends in connection with certain Fund holdings. Excluding this amount, the ratio of net investment income to average net assets would have been 1.19%.
dNet investment income per share includes approximately $0.10 per share related to income received in the form of special dividends in connection with certain Fund holdings. Excluding this amount, the ratio of net investment income to average net assets would have been 1.46%.
eIncludes dividend and/or interest expense on securities sold short and security borrowing fees, if any. See below for the ratios of such expenses to average net assets for the periods presented. See Note 1(e).
fBenefit of expense reduction rounds to less than 0.01%.
gBenefit of waiver and payments by affiliates rounds to less than 0.01%.
hRounds to less than 0.01%.
16 | Annual Report | The accompanying notes are an integral part of these financial statements. | franklintempleton.com | ||
FRANKLIN MUTUAL SERIES FUNDS
FINANCIAL HIGHLIGHTS
Franklin Mutual Shares Fund(continued)
| Year Ended December 31, | ||||||||||||||||||||
| 2019 | 2018 | 2017 | 2016 | 2015 | ||||||||||||||||
Class R6 | ||||||||||||||||||||
Per share operating performance (for a share outstanding throughout the year) | ||||||||||||||||||||
Net asset value, beginning of year | $24.23 | $28.61 | $28.21 | $25.98 | $29.51 | |||||||||||||||
Income from investment operationsa: | ||||||||||||||||||||
Net investment incomeb | 0.64 | 0.53 | 0.70 | c | 0.66 | d | 0.57 | |||||||||||||
Net realized and unrealized gains (losses) | 4.92 | (3.11 | ) | 1.71 | 3.49 | (1.71 | ) | |||||||||||||
Total from investment operations | 5.56 | (2.58 | ) | 2.41 | 4.15 | (1.14 | ) | |||||||||||||
Less distributions from: | ||||||||||||||||||||
Net investment income | (0.73 | ) | (0.55 | ) | (0.72 | ) | (0.67 | ) | (0.63 | ) | ||||||||||
Net realized gains | (1.51 | ) | (1.25 | ) | (1.29 | ) | (1.25 | ) | (1.76 | ) | ||||||||||
Total distributions | (2.24 | ) | (1.80 | ) | (2.01 | ) | (1.92 | ) | (2.39 | ) | ||||||||||
Net asset value, end of year | $27.55 | $24.23 | $28.61 | $28.21 | $25.98 | |||||||||||||||
Total return | 23.26% | (8.88)% | 8.61% | 16.05% | (3.71)% | |||||||||||||||
Ratios to average net assets | ||||||||||||||||||||
Expensese,f | 0.70% | g | 0.69% | g | 0.67% | 0.68% | g | 0.69% | g | |||||||||||
Expenses incurred in connection with securities sold short | 0.02% | —% | h | —% | 0.01% | 0.02% | ||||||||||||||
Net investment income | 2.40% | 1.84% | 2.34% | c | 2.45% | d | 1.94% | |||||||||||||
Supplemental data | ||||||||||||||||||||
Net assets, end of year (000’s) | $1,680,600 | $3,160,186 | $3,741,430 | $1,896,497 | $1,923,466 | |||||||||||||||
Portfolio turnover rate | 21.71% | 20.72% | 18.15% | 20.56% | 19.99% | |||||||||||||||
aThe amount shown for a share outstanding throughout the period may not correlate with the Statement of Operations for the period due to the timing of sales and repurchases of the Fund’s shares in relation to income earned and/or fluctuating fair value of the investments of the Fund.
bBased on average daily shares outstanding.
cNet investment income per share includes approximately $0.16 per share related to income received in the form of special dividends in connection with certain Fund holdings. Excluding this amount, the ratio of net investment income to average net assets would have been 1.80%.
dNet investment income per share includes approximately $0.10 per share related to income received in the form of special dividends in connection with certain Fund holdings. Excluding this amount, the ratio of net investment income to average net assets would have been 2.08%.
eIncludes dividend and/or interest expense on securities sold short and security borrowing fees, if any. See below for the ratios of such expenses to average net assets for the periods presented. See Note 1(e).
fBenefit of expense reduction rounds to less than 0.01%.
gBenefit of waiver and payments by affiliates rounds to less than 0.01%.
hRounds to less than 0.01%.
| franklintempleton.com | The accompanying notes are an integral part of these financial statements. | Annual Report | 17 | ||
FRANKLIN MUTUAL SERIES FUNDS
Statement of Investments, December 31, 2019
Franklin Mutual Shares Fund
| Country | Shares/ Rights/ Units/ Warrants | Value | ||||||||||
| ||||||||||||
Common Stocks and Other Equity Interests 91.1% | ||||||||||||
Aerospace & Defense 2.3% | ||||||||||||
BAE Systems PLC | United Kingdom | 15,590,083 | $ | 116,621,514 | ||||||||
Huntington Ingalls Industries Inc. | United States | 609,698 | 152,961,034 | |||||||||
|
| |||||||||||
| 269,582,548 | ||||||||||||
|
| |||||||||||
Auto Components 0.0%† | ||||||||||||
a,b,c,dInternational Automotive Components Group Brazil LLC | Brazil | 7,234,813 | 262,624 | |||||||||
|
| |||||||||||
Automobiles 1.2% | ||||||||||||
General Motors Co. | United States | 3,805,294 | 139,273,760 | |||||||||
|
| |||||||||||
Banks 9.7% | ||||||||||||
Cadence Bancorp | United States | 1,604,557 | 29,090,619 | |||||||||
CIT Group Inc. | United States | 2,228,261 | 101,675,550 | |||||||||
Citigroup Inc. | United States | 3,077,706 | 245,877,932 | |||||||||
Citizens Financial Group Inc. | United States | 4,361,671 | 177,127,459 | |||||||||
Columbia Banking System Inc. | United States | 75,396 | 3,067,486 | |||||||||
JPMorgan Chase & Co. | United States | 1,827,190 | 254,710,286 | |||||||||
Synovus Financial Corp. | United States | 1,882,029 | 73,775,537 | |||||||||
Wells Fargo & Co. | United States | 4,450,830 | 239,454,654 | |||||||||
|
| |||||||||||
| 1,124,779,523 | ||||||||||||
|
| |||||||||||
Building Products 1.2% | ||||||||||||
Johnson Controls International PLC | United States | 3,293,400 | 134,074,314 | |||||||||
|
| |||||||||||
Communications Equipment 0.8% | ||||||||||||
Cisco Systems Inc. | United States | 2,020,910 | 96,922,844 | |||||||||
|
| |||||||||||
Consumer Finance 1.5% | ||||||||||||
Capital One Financial Corp. | United States | 1,731,205 | 178,158,307 | |||||||||
|
| |||||||||||
Containers & Packaging 1.6% | ||||||||||||
International Paper Co. | United States | 3,220,137 | 148,287,309 | |||||||||
WestRock Co. | United States | 968,212 | 41,545,977 | |||||||||
|
| |||||||||||
| 189,833,286 | ||||||||||||
|
| |||||||||||
Diversified Financial Services 1.6% | ||||||||||||
Voya Financial Inc. | United States | 2,937,130 | 179,106,187 | |||||||||
|
| |||||||||||
Diversified Telecommunication Services 0.7% | ||||||||||||
Koninklijke KPN NV | Netherlands | 26,172,465 | 77,222,773 | |||||||||
|
| |||||||||||
Electrical Equipment 1.8% | ||||||||||||
aSensata Technologies Holding PLC | United States | 3,755,370 | 202,301,782 | |||||||||
|
| |||||||||||
Electronic Equipment, Instruments & Components 1.0% | ||||||||||||
Corning Inc. | United States | 4,042,414 | 117,674,671 | |||||||||
|
| |||||||||||
Energy Equipment & Services 1.7% | ||||||||||||
Baker Hughes Co., A | United States | 2,405,627 | 61,656,220 | |||||||||
Schlumberger Ltd. | United States | 3,224,000 | 129,604,800 | |||||||||
|
| |||||||||||
| 191,261,020 | ||||||||||||
|
| |||||||||||
Entertainment 2.3% | ||||||||||||
The Walt Disney Co. | United States | 1,853,574 | 268,082,408 | |||||||||
|
| |||||||||||
18 | Annual Report | franklintempleton.com | ||
FRANKLIN MUTUAL SERIES FUNDS
STATEMENT OF INVESTMENTS
Franklin Mutual Shares Fund(continued)
| Country | Shares/ Rights/ Units/ Warrants | Value | ||||||||||
| ||||||||||||
Common Stocks and Other Equity Interests(continued) | ||||||||||||
Equity Real Estate Investment Trusts (REITs) 1.7% | ||||||||||||
Alexander’s Inc. | United States | 231,286 | $ | 76,405,330 | ||||||||
Vornado Realty Trust | United States | 1,752,422 | 116,536,063 | |||||||||
|
| |||||||||||
| 192,941,393 | ||||||||||||
|
| |||||||||||
Food & Staples Retailing 2.7% | ||||||||||||
The Kroger Co. | United States | 6,370,986 | 184,694,884 | |||||||||
Walgreens Boots Alliance Inc. | United States | 2,104,829 | 124,100,718 | |||||||||
|
| |||||||||||
| 308,795,602 | ||||||||||||
|
| |||||||||||
Food Products 3.1% | ||||||||||||
Archer-Daniels-Midland Co. | United States | 2,402,500 | 111,355,875 | |||||||||
Conagra Brands Inc. | United States | 1,481,783 | 50,736,250 | |||||||||
The Kraft Heinz Co. | United States | 6,008,600 | 193,056,318 | |||||||||
|
| |||||||||||
| 355,148,443 | ||||||||||||
|
| |||||||||||
Health Care Equipment & Supplies 3.0% | ||||||||||||
Medtronic PLC | United States | 3,107,601 | 352,557,333 | |||||||||
|
| |||||||||||
Health Care Providers & Services 1.7% | ||||||||||||
CVS Health Corp. | United States | 2,595,215 | 192,798,522 | |||||||||
|
| |||||||||||
Household Durables 3.0% | ||||||||||||
Lennar Corp., A | United States | 2,046,900 | 114,196,551 | |||||||||
Newell Brands Inc. | United States | 8,492,195 | 163,219,988 | |||||||||
Toll Brothers Inc. | United States | 1,715,500 | 67,779,405 | |||||||||
|
| |||||||||||
| 345,195,944 | ||||||||||||
|
| |||||||||||
Household Products 0.7% | ||||||||||||
Energizer Holdings Inc. | United States | 1,538,433 | 77,260,105 | |||||||||
|
| |||||||||||
Independent Power & Renewable Electricity Producers 0.1% | ||||||||||||
Vistra Energy Corp. | United States | 658,165 | 15,131,213 | |||||||||
|
| |||||||||||
Industrial Conglomerates 1.1% | ||||||||||||
General Electric Co. | United States | 11,699,600 | 130,567,536 | |||||||||
|
| |||||||||||
Insurance 8.2% | ||||||||||||
aAlleghany Corp. | United States | 325,189 | 260,011,369 | |||||||||
American International Group Inc. | United States | 4,874,739 | 250,220,353 | |||||||||
Chubb Ltd. | United States | 195,858 | 30,487,256 | |||||||||
Everest Re Group Ltd. | United States | 444,994 | 123,192,139 | |||||||||
The Hartford Financial Services Group Inc. | United States | 3,214,299 | 195,332,950 | |||||||||
MetLife Inc. | United States | 1,833,830 | 93,470,315 | |||||||||
|
| |||||||||||
| 952,714,382 | ||||||||||||
|
| |||||||||||
IT Services 1.5% | ||||||||||||
Cognizant Technology Solutions Corp., A | United States | 2,857,050 | 177,194,241 | |||||||||
|
| |||||||||||
Machinery 0.9% | ||||||||||||
CNH Industrial NV | United Kingdom | 3,744,919 | 41,115,449 | |||||||||
CNH Industrial NV, special voting | United Kingdom | 5,296,616 | 58,151,524 | |||||||||
|
| |||||||||||
| 99,266,973 | ||||||||||||
|
| |||||||||||
| franklintempleton.com | Annual Report | 19 | ||
FRANKLIN MUTUAL SERIES FUNDS
STATEMENT OF INVESTMENTS
Franklin Mutual Shares Fund(continued)
| Country | Shares/ Rights/ Units/ Warrants | Value | ||||||||||
| ||||||||||||
Common Stocks and Other Equity Interests(continued) | ||||||||||||
Media 6.1% | ||||||||||||
aCharter Communications Inc., A | United States | 543,329 | $ | 263,558,031 | ||||||||
Comcast Corp., A. | United States | 4,398,700 | 197,809,539 | |||||||||
aDiscovery Inc., C | United States | 4,106,800 | 125,216,332 | |||||||||
aDISH Network Corp., A | United States | 2,477,837 | 87,888,878 | |||||||||
aiHeartMedia Inc., A | United States | 1,795,072 | 30,336,717 | |||||||||
a,ciHeartMedia Inc., B | United States | 35,201 | 505,662 | |||||||||
aiHeartMedia Inc., wts., A, 5/01/39 | United States | 1,786 | 30,182 | |||||||||
|
| |||||||||||
| 705,345,341 | ||||||||||||
|
| |||||||||||
Oil, Gas & Consumable Fuels 7.7% | ||||||||||||
BP PLC | United Kingdom | 26,357,264 | 164,630,268 | |||||||||
Kinder Morgan Inc. | United States | 9,925,540 | 210,123,682 | |||||||||
Marathon Oil Corp. | United States | 9,432,085 | 128,087,714 | |||||||||
Occidental Petroleum Corp. | United States | 1,825,516 | 75,229,514 | |||||||||
Plains All American Pipeline LP | United States | 3,323,700 | 61,122,843 | |||||||||
Royal Dutch Shell PLC, A (EUR Traded) | United Kingdom | 1,219,903 | 35,795,296 | |||||||||
Royal Dutch Shell PLC, A (GBP Traded) | United Kingdom | 2,719,064 | 80,488,256 | |||||||||
The Williams Cos. Inc. | United States | 5,465,884 | 129,650,769 | |||||||||
|
| |||||||||||
| 885,128,342 | ||||||||||||
|
| |||||||||||
Pharmaceuticals 9.9% | ||||||||||||
Allergan PLC | United States | 703,000 | 134,392,510 | |||||||||
aBristol-Myers Squibb Co., rts., 2/01/49 | United States | 1,368,343 | 4,118,712 | |||||||||
Eli Lilly & Co. | United States | 1,790,643 | 235,344,210 | |||||||||
GlaxoSmithKline PLC | United Kingdom | 11,072,484 | 260,889,483 | |||||||||
Merck & Co. Inc. | United States | 1,660,972 | 151,065,403 | |||||||||
Novartis AG, ADR | Switzerland | 2,881,641 | 272,862,586 | |||||||||
Perrigo Co. PLC | United States | 1,643,800 | 84,918,708 | |||||||||
|
| |||||||||||
| 1,143,591,612 | ||||||||||||
|
| |||||||||||
Software 3.0% | ||||||||||||
aAvaya Holdings Corp. | United States | 364 | 4,914 | |||||||||
aAvaya Holdings Corp., wts., 12/15/22 | United States | 276,741 | 332,089 | |||||||||
NortonLifeLock Inc. | United States | 8,128,551 | 207,440,622 | |||||||||
Oracle Corp. | United States | 2,686,800 | 142,346,664 | |||||||||
|
| |||||||||||
| 350,124,289 | ||||||||||||
|
| |||||||||||
Specialty Retail 0.2% | ||||||||||||
a,b,cTRU Kids Parent LLC | United States | 7,469 | 27,867,828 | |||||||||
a,b,cWayne Services Legacy Inc. | United States | 7,469 | — | |||||||||
|
| |||||||||||
| 27,867,828 | ||||||||||||
|
| |||||||||||
Technology Hardware, Storage & Peripherals 4.3% | ||||||||||||
Hewlett Packard Enterprise Co. | United States | 7,532,314 | 119,462,500 | |||||||||
Samsung Electronics Co. Ltd. | South Korea | 4,751,619 | 229,362,140 | |||||||||
Western Digital Corp. | United States | 2,337,857 | 148,383,784 | |||||||||
|
| |||||||||||
| 497,208,424 | ||||||||||||
|
| |||||||||||
20 | Annual Report | franklintempleton.com | ||
FRANKLIN MUTUAL SERIES FUNDS
STATEMENT OF INVESTMENTS
Franklin Mutual Shares Fund(continued)
| Country | Shares/ Rights/ Units/ Warrants | Value | ||||||||||
Common Stocks and Other Equity Interests(continued) | ||||||||||||
Textiles, Apparel & Luxury Goods 1.2% | ||||||||||||
PVH Corp. | United States | 1,285,900 | $ | 135,212,385 | ||||||||
|
| |||||||||||
Tobacco 3.1% | ||||||||||||
Altria Group Inc. | United States | 2,023,360 | 100,985,898 | |||||||||
British American Tobacco PLC | United Kingdom | 3,767,740 | 161,257,769 | |||||||||
British American Tobacco PLC, ADR | United Kingdom | 1,424,588 | 60,488,007 | |||||||||
Imperial Brands PLC | United Kingdom | 1,507,727 | 37,322,229 | |||||||||
|
| |||||||||||
| 360,053,903 | ||||||||||||
|
| |||||||||||
Wireless Telecommunication Services 0.5% | ||||||||||||
Vodafone Group PLC | United Kingdom | 30,709,264 | 59,691,525 | |||||||||
|
| |||||||||||
Total Common Stocks and Other Equity Interests | 10,532,331,383 | |||||||||||
|
| |||||||||||
| Principal Amount | ||||||||||||
Corporate Notes and Senior Floating Rate Interests 3.5% | ||||||||||||
eBanff Merger Sub Inc., senior note, 144A, 9.75%, 9/01/26 | United States | $ | 59,688,000 | 60,584,812 | ||||||||
Frontier Communications Corp., | ||||||||||||
senior note, 10.50%, 9/15/22 | United States | 72,365,000 | 35,481,428 | |||||||||
senior note, 11.00%, 9/15/25 | United States | 81,506,000 | 39,734,175 | |||||||||
esenior secured note, first lien, 144A, 8.00%, 4/01/27 | United States | 19,878,000 | 20,809,284 | |||||||||
f,gVeritas U.S. Inc, | ||||||||||||
Term Loan B1, 6.299%,(1-month USD LIBOR + 4.50%), 1/27/23 | United States | 48,688,224 | 47,065,300 | |||||||||
Term Loan B1, 6.445%,(3-month USD LIBOR + 4.50%), 1/27/23 | United States | 9,353,364 | 9,041,589 | |||||||||
eVeritas U.S. Inc./Veritas Bermuda Ltd., | ||||||||||||
senior note, 144A, 7.50%, 2/01/23 | United States | 9,656,000 | 9,660,007 | |||||||||
senior note, 144A, 10.50%, 2/01/24 | United States | 76,705,000 | 71,175,720 | |||||||||
f,gWindstream Services LLC, | ||||||||||||
hRevolving Commitment, 7.75%, (Prime + 3.00%), 4/24/20 | United States | 91,322,291 | 85,614,648 | |||||||||
Term Loan B6, 9.75%, (Prime + 5.00%), 3/30/21 | United States | 23,496,000 | 22,543,566 | |||||||||
|
| |||||||||||
Total Corporate Notes and Senior Floating Rate Interests | 401,710,529 | |||||||||||
|
| |||||||||||
Corporate Notes in Reorganization (Cost $30,683,169) 0.0%† | ||||||||||||
e,iMcDermott Technology Americas Inc., senior note, 144A, 10.625%, 5/01/24 | United States | 32,043,000 | 2,813,696 | |||||||||
|
| |||||||||||
| Shares | ||||||||||||
Companies in Liquidation 0.0%† | ||||||||||||
a,c,jClear Channel Communications Inc., Contingent Distribution | United States | 74,295,000 | — | |||||||||
a,c,jiHeartCommunications Inc., Contingent Distribution | United States | 125,033,338 | — | |||||||||
a,c,jTribune Media, Litigation Trust, Contingent Distribution | United States | 1,000,497 | — | |||||||||
a,c,jVistra Energy Corp., Litigation Trust, Contingent Distribution | United States | 194,177,556 | 106,797 | |||||||||
| franklintempleton.com | Annual Report | 21 | ||
FRANKLIN MUTUAL SERIES FUNDS
STATEMENT OF INVESTMENTS
Franklin Mutual Shares Fund(continued)
| Country | Shares | Value | ||||||||||
Companies in Liquidation(continued) | ||||||||||||
a,c,jWalter Energy Inc., Litigation Trust, Contingent Distribution | United States | 20,046,000 | $ | — | ||||||||
|
| |||||||||||
Total Companies in Liquidation (Cost $6,071,371) | 106,797 | |||||||||||
|
| |||||||||||
Total Investments before Short Term Investments | 10,936,962,405 | |||||||||||
|
| |||||||||||
Principal Amount | ||||||||||||
Short Term Investments 5.6% | ||||||||||||
U.S. Government and Agency Securities 5.6% | ||||||||||||
kFHLB, 1/02/20 | United States | $ | 16,300,000 | 16,300,000 | ||||||||
kU.S. Treasury Bill, | ||||||||||||
l2/06/20 - 3/19/20 | United States | 83,000,000 | 82,794,435 | |||||||||
1/02/20 - 5/28/20 | United States | 550,000,000 | 548,666,202 | |||||||||
|
| |||||||||||
Total U.S. Government and Agency Securities | 647,760,637 | |||||||||||
|
| |||||||||||
Total Investments (Cost $8,609,984,765) 100.2% | 11,584,723,042 | |||||||||||
Securities Sold Short (0.5)% | (53,876,501 | ) | ||||||||||
Other Assets, less Liabilities 0.3% | 32,989,498 | |||||||||||
|
| |||||||||||
Net Assets 100.0% | $ | 11,563,836,039 | ||||||||||
|
| |||||||||||
| Shares | ||||||||||||
m Securities Sold Short (Proceeds $46,531,474) (0.5)% | ||||||||||||
Common Stocks (0.5)% | ||||||||||||
Biotechnology (0.5)% | ||||||||||||
AbbVie Inc. | United States | 608,499 | (53,876,501 | ) | ||||||||
|
| |||||||||||
†Rounds to less than 0.1% of net assets.
aNon-income producing.
bSee Note 11 regarding holdings of 5% voting securities.
cFair valued using significant unobservable inputs. See Note 13 regarding fair value measurements.
dSee Note 9 regarding restricted securities.
eSecurity was purchased pursuant to Rule 144A under the Securities Act of 1933 and may be sold in transactions exempt from registration only to qualified institutional buyers or in a public offering registered under the Securities Act of 1933. At December 31, 2019, the aggregate value of these securities was $165,043,519, representing 1.4% of net assets.
fThe coupon rate shown represents the rate at period end.
gSee Note 1(g) regarding senior floating rate interests.
hA portion or all of the security purchased on a delayed delivery basis. See Note 1(c).
iSee Note 8 regarding credit risk and defaulted securities.
jContingent distributions represent the right to receive additional distributions, if any, during the reorganization of the underlying company. Shares represent total underlying principal of debt securities.
kThe security was issued on a discount basis with no stated coupon rate.
lA portion or all of the security has been segregated as collateral for securities sold short and/or open forward exchange contracts. At December 31, 2019, the aggregate value of these securities pledged amounted to $ 32,911,646, representing 0.3% of net assets.
mSee Note 1(e) regarding securities sold short.
22 | Annual Report | franklintempleton.com | ||
FRANKLIN MUTUAL SERIES FUNDS
STATEMENT OF INVESTMENTS
Franklin Mutual Shares Fund(continued)
At December 31, 2019, the Fund had the following futures contracts outstanding. See Note 1(d).
Futures Contracts
| Description | Type | Number of Contracts | Notional Amount* | Expiration Date | Value/ Unrealized Appreciation (Depreciation) | |||||||||||||
Currency Contracts | ||||||||||||||||||
EUR/USD | Short | 728 | $102,666,200 | 3/16/20 | $ | (986,062 | ) | |||||||||||
GBP/USD | Short | 1,814 | 150,698,050 | 3/16/20 | (1,171,780 | ) | ||||||||||||
|
| |||||||||||||||||
Total Futures Contracts. | $ | (2,157,842 | ) | |||||||||||||||
|
| |||||||||||||||||
*As of period end.
At December 31, 2019, the Fund had the following forward exchange contracts outstanding. See Note 1(d).
Forward Exchange Contracts
| Currency | Counterpartya | Type | Quantity | Contract Amount | Settlement Date | Unrealized Appreciation | Unrealized Depreciation | |||||||||||||||||||||
OTC Forward Exchange Contracts |
| |||||||||||||||||||||||||||
Euro | BOFA | Buy | 10,161,789 | $ | 11,340,783 | 1/15/20 | $ | 66,124 | $ | — | ||||||||||||||||||
Euro | BOFA | Sell | 1,218,207 | 1,354,210 | 1/15/20 | — | (13,263 | ) | ||||||||||||||||||||
Euro | HSBK | Buy | 1,110,000 | 1,247,152 | 1/15/20 | — | (1,144 | ) | ||||||||||||||||||||
Euro | HSBK | Buy | 2,961,420 | 3,298,217 | 1/15/20 | 26,065 | — | |||||||||||||||||||||
Euro | HSBK | Sell | 1,218,207 | 1,355,146 | 1/15/20 | — | (12,328 | ) | ||||||||||||||||||||
Euro | SSBT | �� | Sell | 18,399,108 | 21,014,725 | 1/15/20 | 361,184 | — | ||||||||||||||||||||
Euro | UBSW | Sell | 18,399,108 | 21,014,817 | 1/15/20 | 361,276 | — | |||||||||||||||||||||
British Pound | BOFA | Buy | 418,966 | 548,451 | 1/16/20 | 6,712 | — | |||||||||||||||||||||
British Pound | BOFA | Sell | 7,030,724 | 8,843,987 | 1/16/20 | — | (472,283 | ) | ||||||||||||||||||||
British Pound | HSBK | Sell | 19,661,567 | 24,815,811 | 1/16/20 | — | (1,237,331 | ) | ||||||||||||||||||||
South Korean Won | HSBK | Sell | 72,308,874,616 | 60,555,797 | 1/17/20 | — | (2,016,839 | ) | ||||||||||||||||||||
South Korean Won | UBSW | Buy | 2,494,512,800 | 2,159,377 | 1/17/20 | — | (746 | ) | ||||||||||||||||||||
South Korean Won | UBSW | Buy | 9,612,263,500 | 8,159,124 | 1/17/20 | 158,869 | — | |||||||||||||||||||||
South Korean Won | UBSW | Sell | 44,474,572,809 | 37,585,034 | 1/17/20 | — | (901,131 | ) | ||||||||||||||||||||
British Pound | HSBK | Sell | 8,780,856 | 11,016,979 | 2/14/20 | — | (627,650 | ) | ||||||||||||||||||||
British Pound | SSBT | Sell | 4,975,490 | 6,060,595 | 2/14/20 | — | (537,593 | ) | ||||||||||||||||||||
Euro | SSBT | Sell | 15,316,719 | 17,033,110 | 2/18/20 | — | (196,695 | ) | ||||||||||||||||||||
Euro | SSBT | Sell | 4,202,801 | 4,707,276 | 4/07/20 | — | (35,189 | ) | ||||||||||||||||||||
Euro | UBSW | Sell | 4,202,802 | 4,707,251 | 4/07/20 | — | (35,215 | ) | ||||||||||||||||||||
British Pound | BOFA | Sell | 5,860,227 | 7,577,918 | 4/24/20 | — | (208,052 | ) | ||||||||||||||||||||
British Pound | HSBK | Sell | 11,856,261 | 15,358,325 | 4/24/20 | — | (394,050 | ) | ||||||||||||||||||||
South Korean Won | HSBK | Sell | 100,408,792,211 | 86,620,257 | 5/15/20 | — | (604,932 | ) | ||||||||||||||||||||
South Korean Won | UBSW | Sell | 58,942,998,018 | 50,943,023 | 5/15/20 | — | (260,800 | ) | ||||||||||||||||||||
Euro | SSBT | Sell | 12,813,030 | 14,364,816 | 5/21/20 | — | (133,135 | ) | ||||||||||||||||||||
Euro | UBSW | Sell | 12,813,030 | 14,365,905 | 5/21/20 | — | (132,046 | ) | ||||||||||||||||||||
British Pound | BOFA | Sell | 6,752,067 | 8,822,422 | 5/22/20 | — | (155,018 | ) | ||||||||||||||||||||
| franklintempleton.com | Annual Report | 23 | ||
FRANKLIN MUTUAL SERIES FUNDS
STATEMENT OF INVESTMENTS
Franklin Mutual Shares Fund(continued)
Forward Exchange Contracts(continued)
| Currency | Counterpartya | Type | Quantity | Contract Amount | Settlement Date | Unrealized Appreciation | Unrealized Depreciation | |||||||||||||||||||||
OTC Forward Exchange Contracts(continued) |
| |||||||||||||||||||||||||||
British Pound | HSBK | Sell | 62,688,202 | $ | 81,305,529 | 5/22/20 | $ | — | $ | (2,043,695 | ) | |||||||||||||||||
Total Forward Exchange Contracts | $ | 980,230 | $ | (10,019,135 | ) | |||||||||||||||||||||||
Net unrealized appreciation (depreciation) | $ | (9,038,905 | ) | |||||||||||||||||||||||||
aMay be comprised of multiple contracts with the same counterparty, currency and settlement date.
See Note 10 regarding other derivative information.
See Abbreviations on page 43.
24 | Annual Report | The accompanying notes are an integral part of these financial statements. | franklintempleton.com | ||
FINANCIAL STATEMENTS
Statement of Assets and Liabilities
December 31, 2019
Franklin Mutual Shares Fund
Assets: | ||||
Investments in securities: | ||||
Cost - Unaffiliated issuers | $ | 8,568,582,657 | ||
Cost -Non-controlled affiliates (Note 3f and 11) | 41,402,108 | |||
|
| |||
Value - Unaffiliated issuers | $ | 11,556,592,590 | ||
Value -Non-controlled affiliates (Note 3f and 11) | 28,130,452 | |||
Cash | 1,113,363 | |||
Foreign currency, at value (cost $1,411,958) | 1,437,774 | |||
Receivables: | ||||
Investment securities sold | 17,702,299 | |||
Capital shares sold | 2,350,436 | |||
Dividends and interest | 38,443,445 | |||
European Union tax reclaims | 7,226,216 | |||
Deposits with brokers for: | ||||
Securities sold short | 54,941,618 | |||
Futures contracts. | 6,001,320 | |||
Unrealized appreciation on OTC forward exchange contracts | 980,230 | |||
Other assets | 3,404,432 | |||
|
| |||
Total assets | 11,718,324,175 | |||
|
| |||
Liabilities: | ||||
Payables: | ||||
Investment securities purchased | 63,315,638 | |||
Capital shares redeemed | 14,589,686 | |||
Management fees | 6,380,412 | |||
Distribution fees | 1,132,078 | |||
Transfer agent fees | 1,466,901 | |||
Trustees’ fees and expenses | 1,035,874 | |||
Variation margin on futures contracts | 1,921,345 | |||
Securities sold short, at value (proceeds $46,531,474) | 53,876,501 | |||
Unrealized depreciation on OTC forward exchange contracts | 10,019,135 | |||
Accrued expenses and other liabilities | 750,566 | |||
|
| |||
Total liabilities | 154,488,136 | |||
|
| |||
Net assets, at value | $ | 11,563,836,039 | ||
|
| |||
Net assets consist of: | ||||
Paid-in capital | $ | 8,421,411,264 | ||
Total distributable earnings (losses) | 3,142,424,775 | |||
|
| |||
Net assets, at value | $ | 11,563,836,039 | ||
|
| |||
| franklintempleton.com | The accompanying notes are an integral part of these financial statements. | Annual Report | 25 | ||
FRANKLIN MUTUAL SERIES FUNDS
FINANCIAL STATEMENTS
Statement of Assets and Liabilities(continued)
December 31, 2019
Franklin Mutual Shares Fund
Class Z: | ||||
Net assets, at value | $5,472,276,431 | |||
|
| |||
Shares outstanding | 198,525,310 | |||
|
| |||
Net asset value and maximum offering price per share | $27.56 | |||
|
| |||
Class A: | ||||
Net assets, at value | $4,042,625,849 | |||
|
| |||
Shares outstanding | 148,318,618 | |||
|
| |||
Net asset value per sharea | $27.26 | |||
|
| |||
Maximum offering price per share (net asset value per share ÷ 94.50%) | $28.85 | |||
|
| |||
Class C: | ||||
Net assets, at value | $ 302,296,402 | |||
|
| |||
Shares outstanding | 11,105,781 | |||
|
| |||
Net asset value and maximum offering price per sharea | $27.22 | |||
|
| |||
Class R: | ||||
Net assets, at value | $ 66,037,699 | |||
|
| |||
Shares outstanding | 2,430,462 | |||
|
| |||
Net asset value and maximum offering price per share | $27.17 | |||
|
| |||
Class R6: | ||||
Net assets, at value | $1,680,599,658 | |||
|
| |||
Shares outstanding | 61,009,188 | |||
|
| |||
Net asset value and maximum offering price per share | $27.55 | |||
|
|
aRedemption price is equal to net asset value less contingent deferred sales charges, if applicable.
26 | Annual Report | The accompanying notes are an integral part of these financial statements. | franklintempleton.com | ||
FRANKLIN MUTUAL SERIES FUNDS
FINANCIAL STATEMENTS
Statement of Operations
for the year ended December 31, 2019
Franklin Mutual Shares Fund
Investment income: | ||||
Dividends: (net of foreign taxes)* | ||||
Unaffiliated issuers | $ | 309,359,245 | ||
Non-controlled affiliates (Note 3f and 11) | 4,162,293 | |||
Interest: | ||||
Unaffiliated issuers | 82,188,646 | |||
Income from securities loaned: | ||||
Unaffiliated issuers (net of fees and rebates) | 1,068,265 | |||
Non-controlled affiliates (Note 3f) | 72,310 | |||
Other income (Note 1h) | 793,071 | |||
|
| |||
Total investment income. | 397,643,830 | |||
|
| |||
Expenses: | ||||
Management fees (Note 3a) | 83,782,616 | |||
Distribution fees: (Note 3c) | ||||
Class A | 10,168,543 | |||
Class C | 3,090,467 | |||
Class R | 379,992 | |||
Transfer agent fees: (Note 3e) | ||||
Class Z | 5,200,484 | |||
Class A | 3,951,134 | |||
Class C | 300,191 | |||
Class R | 74,246 | |||
Class R6 | 656,681 | |||
Custodian fees (Note 4) | 507,645 | |||
Reports to shareholders | 631,778 | |||
Registration and filing fees | 203,710 | |||
Professional feesa | (893,326 | ) | ||
Trustees’ fees and expenses | 795,433 | |||
Dividends on securities sold short | 2,140,623 | |||
Other. | 295,205 | |||
|
| |||
Total expenses | 111,285,422 | |||
Expense reductions (Note 4) | (52,940 | ) | ||
Expenses waived/paid by affiliates (Note 3f and 3g) | (62,512 | ) | ||
|
| |||
Net expenses | 111,169,970 | |||
|
| |||
Net investment income | 286,473,860 | |||
|
| |||
Realized and unrealized gains (losses): | ||||
Net realized gain (loss) from: | ||||
Investments: | ||||
Unaffiliated issuers | 599,564,227 | |||
Non-controlled affiliates (Note 3f and 11) | (20,456,067 | ) | ||
Foreign currency transactions | 1,247,570 | |||
Forward exchange contracts | 31,064,320 | |||
Futures contracts | 5,392,979 | |||
Securities sold short | (27,564,705 | ) | ||
|
| |||
Net realized gain (loss) | 589,248,324 | |||
|
| |||
Net change in unrealized appreciation (depreciation) on: | ||||
Investments: | ||||
Unaffiliated issuers | 1,754,817,383 | |||
Non-controlled affiliates (Note 3f and 11) | 35,369,848 | |||
Translation of other assets and liabilities denominated in foreign currencies | (90,460 | ) | ||
| franklintempleton.com | The accompanying notes are an integral part of these financial statements. | Annual Report | 27 | ||
FRANKLIN MUTUAL SERIES FUNDS
FINANCIAL STATEMENTS
Statement of Operations(continued)
for the year ended December 31, 2019
Franklin Mutual Shares Fund
Forward exchange contracts | (16,802,196 | ) | ||
Futures contracts | (2,622,855 | ) | ||
Securities sold short | (32,850,352 | ) | ||
|
| |||
Net change in unrealized appreciation (depreciation) | 1,737,821,368 | |||
|
| |||
Net realized and unrealized gain (loss) | 2,327,069,692 | |||
|
| |||
Net increase (decrease) in net assets resulting from operations | $ | 2,613,543,552 | ||
|
| |||
*Foreign taxes withheld on dividends | $ | 5,327,021 |
aIncludes unaffiliated reimbursement of legal fees incurred in connection with certain Fund holdings.
28 | Annual Report | The accompanying notes are an integral part of these financial statements. | franklintempleton.com | ||
FRANKLIN MUTUAL SERIES FUNDS
FINANCIAL STATEMENTS
Statements of Changes in Net Assets
Franklin Mutual Shares Fund
| Year Ended December 31, | ||||||||
| 2019 | 2018 | |||||||
| ||||||||
Increase (decrease) in net assets: | ||||||||
Operations: | ||||||||
Net investment income | $ | 286,473,860 | $ | 244,198,602 | ||||
Net realized gain (loss) | 589,248,324 | 1,079,036,473 | ||||||
Net change in unrealized appreciation (depreciation) | 1,737,821,368 | (2,582,054,169 | ) | |||||
|
| |||||||
Net increase (decrease) in net assets resulting from operations | 2,613,543,552 | (1,258,819,094 | ) | |||||
|
| |||||||
Distributions to shareholders: | ||||||||
Class Z | (424,957,060 | ) | (359,738,797 | ) | ||||
Class A | (310,738,396 | ) | (258,843,422 | ) | ||||
Class C | (20,683,973 | ) | (16,133,984 | ) | ||||
Class R | (5,167,516 | ) | (4,696,240 | ) | ||||
Class R6 | (180,523,371 | ) | (218,275,931 | ) | ||||
|
| |||||||
Total distributions to shareholders | (942,070,316 | ) | (857,688,374 | ) | ||||
|
| |||||||
Capital share transactions: (Note 2) | ||||||||
Class Z | (407,966,163 | ) | (162,098,601 | ) | ||||
Class A | (326,358,495 | ) | 114,605,103 | |||||
Class C | (49,007,989 | ) | (631,170,380 | ) | ||||
Class R | (18,388,105 | ) | (21,048,937 | ) | ||||
Class R6 | (1,891,813,271 | ) | (59,462,529 | ) | ||||
|
| |||||||
Total capital share transactions | (2,693,534,023 | ) | (759,175,344 | ) | ||||
|
| |||||||
Net increase (decrease) in net assets | (1,022,060,787 | ) | (2,875,682,812 | ) | ||||
Net assets: | ||||||||
Beginning of year | 12,585,896,826 | 15,461,579,638 | ||||||
|
| |||||||
End of year | $ | 11,563,836,039 | $ | 12,585,896,826 | ||||
|
| |||||||
| franklintempleton.com | The accompanying notes are an integral part of these financial statements. | Annual Report | 29 | ||
FRANKLIN MUTUAL SERIES FUNDS
Franklin Mutual Shares Fund
1. Organization and Significant Accounting Policies
Franklin Mutual Series Funds (Trust) is registered under the Investment Company Act of 1940 (1940 Act) as anopen-end management investment company, consisting of seven separate funds and applies the specialized accounting and reporting guidance in U.S. Generally Accepted Accounting Principles (U.S. GAAP). Franklin Mutual Shares Fund (Fund) is included in this report. The Fund offers five classes of shares: Class Z, Class A, Class C, Class R and Class R6. Class C shares automatically convert to Class A shares after they have been held for 10 years. Each class of shares may differ by its initial sales load, contingent deferred sales charges, voting rights on matters affecting a single class, its exchange privilege and fees due to differing arrangements for distribution and transfer agent fees.
The following summarizes the Fund’s significant accounting policies.
a. Financial Instrument Valuation
The Fund’s investments in financial instruments are carried at fair value daily. Fair value is the price that would be received to sell an asset or paid to transfer a liability in an orderly transaction between market participants on the measurement date. The Fund calculates the net asset value (NAV) per share each business day as of 4 p.m. Eastern time or the regularly scheduled close of the New York Stock Exchange (NYSE), whichever is earlier. Under compliance policies and procedures approved by the Trust’s Board of Trustees (the Board), the Fund’s administrator has responsibility for oversight of valuation, including leading the cross-functional Valuation Committee (VC). The Fund may utilize independent pricing services, quotations from securities and financial instrument dealers, and other market sources to determine fair value.
Equity securities and derivative financial instruments listed on an exchange or on the NASDAQ National Market System are valued at the last quoted sale price or the official closing price of the day, respectively. Foreign equity securities are valued as of the close of trading on the foreign stock exchange on which the security is primarily traded, or as of 4 p.m. Eastern time. The value is then converted into its U.S. dollar equivalent at the foreign exchange rate in effect at 4 p.m. Eastern time on the day that the value of the security is determined.Over-the-counter (OTC) securities are valued within the range of the most recent quoted bid and ask prices. Securities that trade in multiple markets or on multiple
exchanges are valued according to the broadest and most representative market. Certain equity securities are valued based upon fundamental characteristics or relationships to similar securities.
Debt securities generally trade in the OTC market rather than on a securities exchange. The Fund’s pricing services use multiple valuation techniques to determine fair value. In instances where sufficient market activity exists, the pricing services may utilize a market-based approach through which quotes from market makers are used to determine fair value. In instances where sufficient market activity may not exist or is limited, the pricing services also utilize proprietary valuation models which may consider market characteristics such as benchmark yield curves, credit spreads, estimated default rates, anticipated market interest rate volatility, coupon rates, anticipated timing of principal repayments, underlying collateral, and other unique security features in order to estimate the relevant cash flows, which are then discounted to calculate the fair value.
Investments inopen-end mutual funds are valued at the closing NAV.
Certain derivative financial instruments trade in the OTC market. The Fund’s pricing services use various techniques including industry standard option pricing models and proprietary discounted cash flow models to determine the fair value of those instruments. The Fund’s net benefit or obligation under the derivative contract, as measured by the fair value of the contract, is included in net assets.
The Fund has procedures to determine the fair value of financial instruments for which market prices are not reliable or readily available. Under these procedures, the Fund primarily employs a market-based approach which may use related or comparable assets or liabilities, recent transactions, market multiples, book values, and other relevant information for the investment to determine the fair value of the investment. An income-based valuation approach may also be used in which the anticipated future cash flows of the investment are discounted to calculate fair value. Discounts may also be applied due to the nature or duration of any restrictions on the disposition of the investments. Due to the inherent uncertainty of valuations of such investments, the fair values may differ significantly from the values that would have been used had an active market existed.
30 | Annual Report | franklintempleton.com | ||
FRANKLIN MUTUAL SERIES FUNDS
NOTES TO FINANCIAL STATEMENTS
Franklin Mutual Shares Fund(continued)
Trading in securities on foreign securities stock exchanges and OTC markets may be completed before 4 p.m. Eastern time. In addition, trading in certain foreign markets may not take place on every Fund’s business day. Occasionally, events occur between the time at which trading in a foreign security is completed and 4 p.m. Eastern time that might call into question the reliability of the value of a portfolio security held by the Fund. As a result, differences may arise between the value of the Fund’s portfolio securities as determined at the foreign market close and the latest indications of value at 4 p.m. Eastern time. In order to minimize the potential for these differences, the VC monitors price movements following the close of trading in foreign stock markets through a series of country specific market proxies (such as baskets of American Depositary Receipts, futures contracts and exchange traded funds). These price movements are measured against established trigger thresholds for each specific market proxy to assist in determining if an event has occurred that may call into question the reliability of the values of the foreign securities held by the Fund. If such an event occurs, the securities may be valued using fair value procedures, which may include the use of independent pricing services.
When the last day of the reporting period is anon-business day, certain foreign markets may be open on those days that the Fund’s NAV is not calculated, which could result in differences between the value of the Fund’s portfolio securities on the last business day and the last calendar day of the reporting period. Any significant security valuation changes due to an open foreign market are adjusted and reflected by the Fund for financial reporting purposes.
b. Foreign Currency Translation
Portfolio securities and other assets and liabilities denominated in foreign currencies are translated into U.S. dollars based on the exchange rate of such currencies against U.S. dollars on the date of valuation. The Fund may enter into foreign currency exchange contracts to facilitate transactions denominated in a foreign currency. Purchases and sales of securities, income and expense items denominated in foreign currencies are translated into U.S. dollars at the exchange rate in effect on the transaction date. Portfolio securities and assets and liabilities denominated in foreign currencies contain risks that those currencies will decline in value relative to the U.S. dollar. Occasionally, events may impact the availability or reliability of foreign exchange rates used to convert the U.S. dollar equivalent
value. If such an event occurs, the foreign exchange rate will be valued at fair value using procedures established and approved by the Board.
The Fund does not separately report the effect of changes in foreign exchange rates from changes in market prices on securities held. Such changes are included in net realized and unrealized gain or loss from investments in the Statement of Operations.
Realized foreign exchange gains or losses arise from sales of foreign currencies, currency gains or losses realized between the trade and settlement dates on securities transactions and the difference between the recorded amounts of dividends, interest, and foreign withholding taxes and the U.S. dollar equivalent of the amounts actually received or paid. Net unrealized foreign exchange gains and losses arise from changes in foreign exchange rates on foreign denominated assets and liabilities other than investments in securities held at the end of the reporting period.
c. Securities Purchased on a Delayed Delivery Basis
The Fund purchases securities on a delayed delivery basis, with payment and delivery scheduled for a future date. These transactions are subject to market fluctuations and are subject to the risk that the value at delivery may be more or less than the trade date purchase price. Although the Fund will generally purchase these securities with the intention of holding the securities, it may sell the securities before the settlement date. Sufficient assets have been segregated for these securities.
d. Derivative Financial Instruments
The Fund invested in derivative financial instruments in order to manage risk or gain exposure to various other investments or markets. Derivatives are financial contracts based on an underlying or notional amount, require no initial investment or an initial net investment that is smaller than would normally be required to have a similar response to changes in market factors, and require or permit net settlement. Derivatives contain various risks including the potential inability of the counterparty to fulfill their obligations under the terms of the contract, the potential for an illiquid secondary market, and/or the potential for market movements which expose the Fund to gains or losses in excess of the amounts shown in the Statement of Assets and Liabilities. Realized gain and loss
| franklintempleton.com | Annual Report | 31 | ||
FRANKLIN MUTUAL SERIES FUNDS
NOTES TO FINANCIAL STATEMENTS
Franklin Mutual Shares Fund (continued)
1. Organization and Significant Accounting Policies(continued)
d. Derivative Financial Instruments(continued)
and unrealized appreciation and depreciation on these contracts for the period are included in the Statement of Operations.
Derivative counterparty credit risk is managed through a formal evaluation of the creditworthiness of all potential counterparties. The Fund attempts to reduce its exposure to counterparty credit risk on OTC derivatives, whenever possible, by entering into International Swaps and Derivatives Association (ISDA) master agreements with certain counterparties. These agreements contain various provisions, including but not limited to collateral requirements, events of default, or early termination. Termination events applicable to the counterparty include certain deteriorations in the credit quality of the counterparty. Termination events applicable to the Fund include failure of the Fund to maintain certain net asset levels and/or limit the decline in net assets over various periods of time. In the event of default or early termination, the ISDA master agreement gives thenon-defaulting party the right to net andclose-out all transactions traded, whether or not arising under the ISDA agreement, to one net amount payable by one counterparty to the other. However, absent an event of default or early termination, OTC derivative assets and liabilities are presented gross and not offset in the Statement of Assets and Liabilities. Early termination by the counterparty may result in an immediate payment by the Fund of any net liability owed to that counterparty under the ISDA agreement. At December 31, 2019, the Fund had OTC derivatives in a net liability position of $9,038,905 and the aggregate value of collateral pledged for such contracts was $6,335,838.
Collateral requirements differ by type of derivative. Collateral or initial margin requirements are set by the broker or exchange clearing house for exchange traded and centrally cleared derivatives. Initial margin deposited is held at the exchange and can be in the form of cash and/or securities. For OTC derivatives traded under an ISDA master agreement, posting of collateral is required by either the Fund or the applicable counterparty if the total net exposure of all OTC derivatives with the applicable counterparty exceeds the minimum transfer amount, which typically ranges from $100,000 to $250,000, and can vary depending on the counterparty and the type of the agreement. Generally, collateral is determined at the close of Fund business each
day and any additional collateral required due to changes in derivative values may be delivered by the Fund or the counterparty the next business day, or within a few business days. Collateral pledged and/or received by the Fund for OTC derivatives, if any, is held in segregated accounts with the Fund’s custodian/counterparty broker and can be in the form of cash and/or securities. Unrestricted cash may be invested according to the Fund’s investment objectives. To the extent that the amounts due to the Fund from its counterparties are not subject to collateralization or are not fully collateralized, the Fund bears the risk of loss from counterpartynon-performance.
The Fund entered into exchange traded futures contracts primarily to manage exposure to certain foreign currencies. A futures contract is an agreement between the Fund and a counterparty to buy or sell an asset at a specified price on a future date. Required initial margins are pledged by the Fund, and the daily change in fair value is accounted for as a variation margin payable or receivable in the Statement of Assets and Liabilities.
The Fund entered into OTC forward exchange contracts primarily to manage exposure to certain foreign currencies. A forward exchange contract is an agreement between the Fund and a counterparty to buy or sell a foreign currency at a specific exchange rate on a future date.
See Note 10 regarding other derivative information.
e. Securities Sold Short
The Fund is engaged in selling securities short, which obligates the Fund to replace a borrowed security with the same security at current fair value. The Fund incurs a loss if the price of the security increases between the date of the short sale and the date on which the Fund replaces the borrowed security. The Fund realizes a gain if the price of the security declines between those dates. Gains are limited to the price at which the Fund sold the security short, while losses are potentially unlimited in size.
The Fund is required to establish a margin account with the broker lending the security sold short. While the short sale is outstanding, the broker retains the proceeds of the short sale to the extent necessary to meet margin requirements until the short position is closed out. A deposit must also be maintained with the Fund’s custodian/counterparty broker consisting of cash and/or securities having a value equal to a specified percentage of the value of the securities sold short.
32 | Annual Report | franklintempleton.com | ||
FRANKLIN MUTUAL SERIES FUNDS
NOTES TO FINANCIAL STATEMENTS
Franklin Mutual Shares Fund(continued)
The Fund is obligated to pay fees for borrowing the securities sold short and is required to pay the counterparty any dividends and/or interest due on securities sold short. Such dividends and/or interest and any security borrowing fees are recorded as an expense to the Fund.
f. Securities Lending
The Fund participates in an agency based securities lending program to earn additional income. The Fund receives cash collateral against the loaned securities in an amount equal to at least 102% of the fair value of the loaned securities. Collateral is maintained over the life of the loan in an amount not less than 100% of the fair value of loaned securities, as determined at the close of Fund business each day; any additional collateral required due to changes in security values is delivered to the Fund on the next business day. The collateral is deposited into a joint cash account with other funds and is used to invest in a money market fund managed by Franklin Advisers, Inc., an affiliate of the Fund, and/or a joint repurchase agreement. The Fund may receive income from the investment of cash collateral, in addition to lending fees and rebates paid by the borrower. Income from securities loaned, net of fees paid to the securities lending agent and/or third-party vendor, is reported separately in the Statement of Operations. The Fund bears the market risk with respect to the collateral investment, securities loaned, and the risk that the agent may default on its obligations to the Fund. If the borrower defaults on its obligation to return the securities loaned, the Fund has the right to repurchase the securities in the open market using the collateral received. The securities lending agent has agreed to indemnify the Fund in the event of default by a third party borrower. At December 31, 2019, the Fund had no securities on loan.
g. Senior Floating Rate Interests
The Fund invests in senior secured corporate loans that pay interest at rates which are periodically reset by reference to a base lending rate plus a spread. These base lending rates are generally the prime rate offered by a designated U.S. bank or the London InterBank Offered Rate (LIBOR). Senior secured corporate loans often require prepayment of principal from excess cash flows or at the discretion of the borrower. As a result, actual maturity may be substantially less than the stated maturity. Senior secured corporate loans in which the Fund invests are generally readily marketable, but may be subject to certain restrictions on resale. On July 27, 2017, the United Kingdom’s Financial Conduct
Authority announced its intention to cease sustaining LIBOR after 2021. There remains uncertainty regarding the future utilization of LIBOR and the nature of any replacement rate. As such, the potential effect of a transition away from LIBOR on the Fund or the Fund’s investments that use or may use a floating rate based on LIBOR cannot yet be determined.
h. Income and Deferred Taxes
It is the Fund’s policy to qualify as a regulated investment company under the Internal Revenue Code. The Fund intends to distribute to shareholders substantially all of its taxable income and net realized gains to relieve it from federal income and excise taxes. As a result, no provision for U.S. federal income taxes is required.
The Fund may be subject to foreign taxation related to income received, capital gains on the sale of securities and certain foreign currency transactions in the foreign jurisdictions in which it invests. Foreign taxes, if any, are recorded based on the tax regulations and rates that exist in the foreign markets in which the Fund invests. When a capital gain tax is determined to apply, the Fund records an estimated deferred tax liability in an amount that would be payable if the securities were disposed of on the valuation date.
As a result of several court cases, in certain countries across the European Union, the Fund filed additional tax reclaims for previously withheld taxes on dividends earned in those countries (EU reclaims). These additional filings are subject to various administrative proceedings by the local jurisdictions’ tax authorities within the European Union, as well as a number of related judicial proceedings. Income recognized, if any, for EU reclaims is reflected as other income in the Statement of Operations and any related receivable, if any, is reflected as European Union tax reclaims in the Statement of Assets and Liabilities. When uncertainty exists as to the ultimate resolution of these proceedings, the likelihood of receipt of these EU reclaims, and the potential timing of payment, no amounts are reflected in the financial statements. For U.S. income tax purposes, EU reclaims received by the Fund, if any, reduce the amounts of foreign taxes Fund shareholders can use as tax credits in their individual income tax returns.
The Fund may recognize an income tax liability related to its uncertain tax positions under U.S. GAAP when the uncertain tax position has a less than 50% probability that it will be sustained upon examination by the tax authorities based on
| franklintempleton.com | Annual Report | 33 | ||
FRANKLIN MUTUAL SERIES FUNDS
NOTES TO FINANCIAL STATEMENTS
Franklin Mutual Shares Fund (continued)
1. Organization and Significant Accounting Policies(continued)
h. Income and Deferred Taxes(continued)
its technical merits. As of December 31, 2019, the Fund has determined that no tax liability is required in its financial statements related to uncertain tax positions for any open tax years (or expected to be taken in future tax years). Open tax years are those that remain subject to examination and are based on the statute of limitations in each jurisdiction in which the Fund invests.
i. Security Transactions, Investment Income, Expenses and Distributions
Security transactions are accounted for on trade date. Realized gains and losses on security transactions are determined on a specific identification basis. Interest income and estimated expenses are accrued daily. Amortization of premium and accretion of discount on debt securities are included in interest income. Dividend income and dividends declared on securities sold short are recorded on theex-dividend date except for certain dividends from securities where the dividend rate is not available. In such cases, the dividend is recorded as soon as the information is received by the Fund. Distributions to shareholders are recorded on theex-dividend date. Distributable earnings are determined according to income tax regulations (tax basis) and may differ from earnings recorded in accordance with U.S. GAAP. These differences may be permanent or temporary. Permanent differences are reclassified among capital accounts to reflect their tax character. These reclassifications have no impact on net assets or the results of operations. Temporary differences are not reclassified, as they may reverse in subsequent periods.
Common expenses incurred by the Trust are allocated among the Funds based on the ratio of net assets of each Fund to the combined net assets of the Trust or based on the ratio of number of shareholders of each Fund to the combined number of shareholders of the Trust. Fund specific expenses are charged directly to the Fund that incurred the expense.
Realized and unrealized gains and losses and net investment income, excluding class specific expenses, are allocated daily to each class of shares based upon the relative proportion of net assets of each class. Differences in per share distributions by class are generally due to differences in class specific expenses.
j. Accounting Estimates
The preparation of financial statements in accordance with U.S. GAAP requires management to make estimates and assumptions that affect the reported amounts of assets and liabilities at the date of the financial statements and the amounts of income and expenses during the reporting period. Actual results could differ from those estimates.
k. Guarantees and Indemnifications
Under the Trust’s organizational documents, its officers and trustees are indemnified by the Trust against certain liabilities arising out of the performance of their duties to the Trust. Additionally, in the normal course of business, the Trust, on behalf of the Fund, enters into contracts with service providers that contain general indemnification clauses. The Trust’s maximum exposure under these arrangements is unknown as this would involve future claims that may be made against the Trust that have not yet occurred. Currently, the Trust expects the risk of loss to be remote.
34 | Annual Report | franklintempleton.com | ||
FRANKLIN MUTUAL SERIES FUNDS
NOTES TO FINANCIAL STATEMENTS
Franklin Mutual Shares Fund(continued)
2. Shares of Beneficial Interest
At December 31, 2019, there were an unlimited number of shares authorized (without par value). Transactions in the Fund’s shares were as follows:
| Year Ended December 31, | ||||||||||||||||
| 2019 | 2018 | |||||||||||||||
| Shares | Amount | Shares | Amount | |||||||||||||
Class Z Shares: | ||||||||||||||||
Shares sold | 5,703,921 | $ | 154,451,161 | 10,029,587 | $ | 284,766,342 | ||||||||||
Shares issued in reinvestment of distributions | 13,821,998 | 375,962,807 | 13,492,550 | 320,309,753 | ||||||||||||
Shares redeemed | (35,007,575 | ) | (938,380,131 | ) | (27,123,733 | ) | (767,174,696 | ) | ||||||||
Net increase (decrease) | (15,481,656 | ) | $ | (407,966,163 | ) | (3,601,596 | ) | $ | (162,098,601 | ) | ||||||
Class A Shares: | ||||||||||||||||
Shares solda | 9,660,276 | $ | 258,457,935 | 25,412,499 | $ | 710,808,675 | ||||||||||
Shares issued in reinvestment of distributions | 10,821,922 | 290,798,586 | 10,148,432 | 238,431,075 | ||||||||||||
Shares redeemed | (32,673,689 | ) | (875,615,016 | ) | (29,787,083 | ) | (834,634,647 | ) | ||||||||
Net increase (decrease) | (12,191,491 | ) | $ | (326,358,495 | ) | 5,773,848 | $ | 114,605,103 | ||||||||
Class C Shares: | ||||||||||||||||
Shares sold | 1,854,760 | $ | 49,227,044 | 2,074,273 | $ | 57,275,560 | ||||||||||
Shares issued in reinvestment of distributions | 765,482 | 20,460,413 | 675,227 | 15,942,868 | ||||||||||||
Shares redeemeda | (4,437,754 | ) | (118,695,446 | ) | (25,329,240 | ) | (704,388,808 | ) | ||||||||
Net increase (decrease) | (1,817,512 | ) | $ | (49,007,989 | ) | (22,579,740 | ) | $ | (631,170,380 | ) | ||||||
Class R Shares: | ||||||||||||||||
Shares sold | 246,671 | $ | 6,553,429 | 347,792 | $ | 9,776,448 | ||||||||||
Shares issued in reinvestment of distributions | 193,343 | 5,163,831 | 199,115 | 4,662,921 | ||||||||||||
Shares redeemed | (1,118,911 | ) | (30,105,365 | ) | (1,253,910 | ) | (35,488,306 | ) | ||||||||
Net increase (decrease) | (678,897 | ) | $ | (18,388,105 | ) | (707,003 | ) | $ | (21,048,937 | ) | ||||||
Class R6 Shares: | ||||||||||||||||
Shares sold | 7,406,299 | $ | 199,310,809 | 14,420,824 | $ | 412,295,163 | ||||||||||
Shares issued in reinvestment of distributions | 6,673,123 | 180,428,324 | 9,195,249 | 218,103,352 | ||||||||||||
Shares redeemed | (83,508,648 | ) | (2,271,552,404 | ) | (23,959,670 | ) | (689,861,044 | ) | ||||||||
Net increase (decrease) | (69,429,226 | ) | $ | (1,891,813,271 | ) | (343,597 | ) | $ | (59,462,529 | ) | ||||||
aMay include a portion of Class C shares that were automatically converted to Class A.
3. Transactions with Affiliates
Franklin Resources, Inc. is the holding company for various subsidiaries that together are referred to as Franklin Templeton. Certain officers and trustees of the Fund are also officers and/or directors of the following subsidiaries:
| Subsidiary | Affiliation | |
Franklin Mutual Advisers, LLC (Franklin Mutual) | Investment manager | |
Franklin Templeton Services, LLC (FT Services) | Administrative manager | |
Franklin Templeton Distributors, Inc. (Distributors) | Principal underwriter | |
Franklin Templeton Investor Services, LLC (Investor Services) | Transfer agent | |
| franklintempleton.com | Annual Report | 35 | ||
FRANKLIN MUTUAL SERIES FUNDS
NOTES TO FINANCIAL STATEMENTS
Franklin Mutual Shares Fund (continued)
3. Transactions with Affiliates(continued)
a. Management Fees
The Fund pays an investment management fee to Franklin Mutual based on the average daily net assets of the Fund as follows:
| Annualized Fee Rate | Net Assets | |
0.675% | Up to and including $5 billion | |
0.645% | Over $5 billion, up to and including $10 billion | |
0.625% | Over $10 billion, up to and including $15 billion | |
0.595% | Over $15 billion, up to and including $20 billion | |
0.585% | Over $20 billion, up to and including $25 billion | |
0.565% | Over $25 billion, up to and including $30 billion | |
0.555% | Over $30 billion, up to and including $35 billion | |
0.545% | In excess of $35 billion | |
For the year ended December 31, 2019, the gross effective investment management fee rate was 0.652% of the Fund’s average daily net assets.
b. Administrative Fees
Under an agreement with Franklin Mutual, FT Services provides administrative services to the Fund. The fee is paid by Franklin Mutual based on the Fund’s average daily net assets, and is not an additional expense of the Fund.
c. Distribution Fees
The Board has adopted distribution plans for each share class, with the exception of Class Z and Class R6 shares, pursuant to Rule12b-1 under the 1940 Act. Under the Fund’s Class A reimbursement distribution plan, the Fund reimburses Distributors for costs incurred in connection with the servicing, sale and distribution of the Fund’s shares up to the maximum annual plan rate. Under the Class A reimbursement distribution plan, costs exceeding the maximum for the current plan year cannot be reimbursed in subsequent periods. In addition, under the Fund’s Class C and R compensation distribution plans, the Fund pays Distributors for costs incurred in connection with the servicing, sale and distribution of the Fund’s shares up to the maximum annual plan rate for each class. The plan year, for purposes of monitoring compliance with the maximum annual plan rates, is February 1 through January 31.
The maximum annual plan rates, based on the average daily net assets, for each class, are as follows:
Class A | 0.35 | % | ||
Class C | 1.00 | % | ||
Class R | 0.50 | % |
The Board has set the current rate at 0.25% per year for Class A shares until further notice and approval by the Board.
36 | Annual Report | franklintempleton.com | ||
FRANKLIN MUTUAL SERIES FUNDS
NOTES TO FINANCIAL STATEMENTS
Franklin Mutual Shares Fund(continued)
d. Sales Charges/Underwriting Agreements
Front-end sales charges and contingent deferred sales charges (CDSC) do not represent expenses of the Fund. These charges are deducted from the proceeds of sales of Fund shares prior to investment or from redemption proceeds prior to remittance, as applicable. Distributors has advised the Fund of the following commission transactions related to the sales and redemptions of the Fund’s shares for the year:
Sales charges retained net of commissions paid to unaffiliated brokers/dealers | $ | 218,747 | ||
CDSC retained | $ | 6,949 |
e. Transfer Agent Fees
Each class of shares pays transfer agent fees to Investor Services for its performance of shareholder servicing obligations. The fees are based on an annualized asset based fee of 0.02% plus a transaction based fee. In addition, each class reimburses Investor Services for out of pocket expenses incurred and, except for Class R6, reimburses shareholder servicing fees paid to third parties. These fees are allocated daily based upon their relative proportion of such classes’ aggregate net assets. Class R6 pays Investor Services transfer agent fees specific to that class.
For the year ended December 31, 2019, the Fund paid transfer agent fees of $10,182,736, of which $5,367,848 was retained by Investor Services.
f. Investments in Affiliated Management Investment Companies
The Fund invests in one or more affiliated management investment companies for purposes other than exercising a controlling influence over the management or policies. Management fees paid by the Fund are waived on assets invested in the affiliated management investment companies, as noted in the Statement of Operations, in an amount not to exceed the management and administrative fees paid directly or indirectly by each affiliate. During the year ended December 31, 2019, the Fund held investments in affiliated management investment companies as follows:
Value at Beginning of Year | Purchases | Sales | Realized Gain (Loss) | Net Change in Unrealized Appreciation (Depreciation) | Value at End of Year | Number of Shares Held at End of Year | Income from securities loaned | |||||||||||||||||||||||||
Non-Controlled Affiliates | ||||||||||||||||||||||||||||||||
Institutional Fiduciary Trust Money Market Portfolio, 1.26% | $ — | $ | 176,535,000 | $ | (176,535,000 | ) | $ — | $ — | $— | a | — | $72,310 | ||||||||||||||||||||
aAs of December 31, 2019, no longer held by the Fund.
g. Waiver and Expense Reimbursements
Investor Services has contractually agreed in advance to waive or limit its fees so that the Class R6 transfer agent fees do not exceed 0.02% based on the average net assets of the class until April 30, 2020.
h. Other Affiliated Transactions
At December 31, 2019, one or more of the funds in Franklin Fund Allocator Series owned 13.0% of the Fund’s outstanding shares.
| franklintempleton.com | Annual Report | 37 | ||
FRANKLIN MUTUAL SERIES FUNDS
NOTES TO FINANCIAL STATEMENTS
Franklin Mutual Shares Fund (continued)
3. Transactions with Affiliates (continued)
i. Interfund Transactions
The Fund engaged in purchases and sales of investments with funds or other accounts that have common investment managers (or affiliated investment managers), directors, trustees or officers. During the year ended December 31, 2019, these purchase and sale transactions aggregated $0 and $39,927,317, respectively.
4. Expense Offset Arrangement
The Fund has entered into an arrangement with its custodian whereby credits realized as a result of uninvested cash balances are used to reduce a portion of the Fund’s custodian expenses. During the year ended December 31, 2019, the custodian fees were reduced as noted in the Statement of Operations.
5. Independent Trustees’ Retirement Plan
On January 1, 1993, the Trust adopted an Independent Trustees’ Retirement Plan (Plan). The Plan is an unfunded defined benefit plan that provides benefit payments to Trustees whose length of service and retirement age meets the eligibility requirements of the Plan. Benefits under the Plan are based on years of service and fees paid to each trustee at the time of retirement. Effective in December 1996, the Plan was closed to new participants.
During the year ended December 31, 2019, the Fund’s projected benefit obligation and benefit payments under the Plan were as follows:
aProjected benefit obligation at December 31, 2019 | $ | 1,035,874 | ||
bIncrease in projected benefit obligation | $ | 96,893 | ||
Benefit payments made to retired trustees | $ | (16,724 | ) |
aThe projected benefit obligation is included in trustees’ fees and expenses in the Statement of Assets and Liabilities.
bThe increase in projected benefit obligation is included in trustees’ fees and expenses in the Statement of Operations.
6. Income Taxes
The tax character of distributions paid during the years ended December 31, 2019 and 2018, was as follows:
| 2019 | 2018 | |||||||
Distributions paid from: | ||||||||
Ordinary income | $ | 304,453,606 | $ | 273,584,591 | ||||
Long term capital gain | 637,616,710 | 584,103,783 | ||||||
| $ | 942,070,316 | $ | 857,688,374 | |||||
38 | Annual Report | franklintempleton.com | ||
FRANKLIN MUTUAL SERIES FUNDS
NOTES TO FINANCIAL STATEMENTS
Franklin Mutual Shares Fund(continued)
At December 31, 2019, the cost of investments, net unrealized appreciation (depreciation), undistributed ordinary income and undistributed long term capital gains for income tax purposes were as follows:
Cost of investments | $ | 8,555,810,833 | ||
|
|
| ||
Unrealized appreciation | $ | 3,304,897,841 | ||
Unrealized depreciation | (341,052,602 | ) | ||
|
|
| ||
Net unrealized appreciation (depreciation) | $ | 2,963,845,239 | ||
|
|
| ||
Distributable earnings: | ||||
Undistributed ordinary income | $ | 45,344,212 | ||
Undistributed long term capital gains | 126,870,225 | |||
|
|
| ||
Total distributable earnings | $ | 172,214,437 | ||
|
|
| ||
Differences between income and/or capital gains as determined on a book basis and a tax basis are primarily due to differing treatments of foreign currency transactions, pass-through entity income and defaulted securities.
The Fund utilized a tax accounting practice to treat a portion of the proceeds from capital shares redeemed as a distribution from realized capital gains.
7. Investment Transactions
Purchases and sales of investments (excluding short term securities and securities sold short) for the year ended December 31, 2019, aggregated $2,568,929,331 and $5,148,623,495, respectively.
8. Credit Risk and Defaulted Securities
The Fund may purchase thepre-default or defaulted debt of distressed companies. Distressed companies are financially troubled and could be or are already involved in financial restructuring or bankruptcy. Risks associated with purchasing these securities include the possibility that the bankruptcy or other restructuring process takes longer than expected, or that distributions in restructuring are less than anticipated, either or both of which may result in unfavorable consequences to the Fund. If it becomes probable that the income on debt securities, including those of distressed companies, will not be collected, the Fund discontinues accruing income and recognizes an adjustment for uncollectible interest.
At December 31, 2019, the aggregate long value of distressed company securities for which interest recognition has been discontinued represents less than 0.1% of the Fund’s net assets. For information as to specific securities, see the accompanying Statement of Investments.
9. Restricted Securities
The Fund invests in securities that are restricted under the Securities Act of 1933 (1933 Act). Restricted securities are often purchased in private placement transactions, and cannot be sold without prior registration unless the sale is pursuant to an exemption under the 1933 Act. Disposal of these securities may require greater effort and expense, and prompt sale at an acceptable price may be difficult. The Fund may have registration rights for restricted securities. The issuer generally incurs all registration costs.
| franklintempleton.com | Annual Report | 39 | ||
FRANKLIN MUTUAL SERIES FUNDS
NOTES TO FINANCIAL STATEMENTS
Franklin Mutual Shares Fund (continued)
9. Restricted Securities(continued)
At December 31, 2019, investments in restricted securities, excluding securities exempt from registration under the 1933 Act, were as follows:
| Shares | Issuer | Acquisition Date | Cost | Value | ||||||||||
| 7,234,813 | International Automotive Components Group Brazil LLC, (Value is 0.0%†of Net Assets) | 4/13/06 - 12/26/08 | $ | 4,804,678 | $ | 262,624 | ||||||||
†Rounds to less than 0.1% of net assets.
10. Other Derivative Information
At December 31, 2019, investments in derivative contracts are reflected in the Statement of Assets and Liabilities as follows:
Asset Derivatives | Liability Derivatives | |||||||||||
Derivative Contracts Not Accounted for as Hedging Instruments | Statement of Assets and Liabilities Location | Fair Value | Statement of Assets and Liabilities Location | Fair Value | ||||||||
| ||||||||||||
Foreign exchange contracts | Variation margin on futures contracts | $ | — | Variation margin on futures contracts | $ | 2,157,842 | a | |||||
Unrealized appreciation on OTC forward exchange contracts | 980,230 | Unrealized depreciation on OTC forward exchange contracts | 10,019,135 | |||||||||
|
|
|
| |||||||||
Totals | $ | 980,230 | $ | 12,176,977 | ||||||||
|
|
|
| |||||||||
aThis amount reflects the cumulative appreciation (depreciation) of futures contracts as reported in the Statement of Investments. Only the variation margin receivable/ payable at year end is separately reported within the Statement of Assets and Liabilities. Prior variation margin movements were recorded to cash upon receipt or payment.
For the year ended December 31, 2019, the effect of derivative contracts in the Statement of Operations was as follows:
Derivative Contracts Not Accounted for as Hedging Instruments | Statement of Operations Location | Net Realized Gain (Loss) for the Year | Statement of Operations Location | Net Change in Unrealized Appreciation (Depreciation) for the Year | ||||||||
| ||||||||||||
Net realized gain (loss) from: | Net change in unrealized appreciation (depreciation) on: | |||||||||||
Foreign exchange contracts | Forward exchange contracts | $31,064,320 | Forward exchange contracts | $(16,802,196) | ||||||||
Futures contracts | 5,392,979 | Futures contracts | (2,622,855) | |||||||||
|
|
|
| |||||||||
Totals | $36,457,299 | $(19,425,051) | ||||||||||
|
|
|
| |||||||||
For the year ended December 31, 2019, the average month end notional amount of futures contracts represented $290,533,947. The average month end contract value of forward exchange contracts was $574,888,214.
See Note 1(d) regarding derivative financial instruments.
40 | Annual Report | franklintempleton.com | ||
FRANKLIN MUTUAL SERIES FUNDS
NOTES TO FINANCIAL STATEMENTS
Franklin Mutual Shares Fund(continued)
11. Holdings of 5% Voting Securities of Portfolio Companies
The 1940 Act defines “affiliated companies” to include investments in portfolio companies in which a fund owns 5% or more of the outstanding voting securities. During the year ended December 31, 2019, investments in “affiliated companies” were as follows:
| Name of Issuer | Value at Beginning of Year | Purchases | Sales | Realized Gain (Loss) | Net Change in Unrealized Appreciation (Depreciation) | Value at End of Year | Number of Shares/Units Held at End of Year | Dividend Income | ||||||||||||||||||||||||
Non-Controlled Affiliates | ||||||||||||||||||||||||||||||||
Alexander’s Inc. | $ | 99,550,939 | $ | — | $ | (23,452,339 | ) | $ | 20,501,406 | $ — | a | $ | — | a | — | a$ | 4,162,293 | |||||||||||||||
International Automotive Components Group Brazil LLC | 306,590 | — | — | — | (43,966 | ) | 262,624 | 7,234,813 | — | |||||||||||||||||||||||
International Automotive Components Group North America LLC | 7,519,120 | — | (9,398,900 | ) | (42,263,636 | ) | 44,143,416 | — | b | — | — | |||||||||||||||||||||
TRU Kids Parent LLC | — | 36,597,430 | c | — | — | (8,729,602 | ) | 27,867,828 | 7,469 | — | ||||||||||||||||||||||
Wayne Services Legacy Inc. | — | 2,612,332 | c | (3,918,495 | )c | 1,306,163 | — | — | 7,469 | — | ||||||||||||||||||||||
Total Affiliated Securities (Value is 0.2% of Net Assets) | $ | 107,376,649 | $ | 39,209,762 | $ | (36,769,734 | ) | $ | (20,456,067 | ) | $35,369,848 | $ | 28,130,452 | $ | 4,162,293 | |||||||||||||||||
aAs of December 31, 2019, no longer an affiliate.
bAs of December 31, 2019, no longer held by the Fund.
cMay include accretion, amortization, partnership adjustments, and/or corporate actions.
12. Credit Facility
The Fund, together with other U.S. registered and foreign investment funds (collectively, Borrowers), managed by Franklin Templeton, are borrowers in a joint syndicated senior unsecured credit facility totaling $2 billion (Global Credit Facility) which matured on February 7, 2020. This Global Credit Facility provides a source of funds to the Borrowers for temporary and emergency purposes, including the ability to meet future unanticipated or unusually large redemption requests. Effective February 7, 2020, the Borrowers renewed the Global Credit Facility for a one year term, maturing February 5, 2021, for a total of $2 billion.
Under the terms of the Global Credit Facility, the Fund shall, in addition to interest charged on any borrowings made by the Fund and other costs incurred by the Fund, pay its share of fees and expenses incurred in connection with the implementation and maintenance of the Global Credit Facility, based upon its relative share of the aggregate net assets of all of the Borrowers, including an annual commitment fee of 0.15% based upon the unused portion of the Global Credit Facility. These fees are reflected in other expenses in the Statement of Operations. During the year ended December 31, 2019, the Fund did not use the Global Credit Facility.
13. Fair Value Measurements
The Fund follows a fair value hierarchy that distinguishes between market data obtained from independent sources (observable inputs) and the Fund’s own market assumptions (unobservable inputs). These inputs are used in determining the value of the Fund’s financial instruments and are summarized in the following fair value hierarchy:
| • | Level 1 – quoted prices in active markets for identical financial instruments |
| franklintempleton.com | Annual Report | 41 | ||
FRANKLIN MUTUAL SERIES FUNDS
NOTES TO FINANCIAL STATEMENTS
Franklin Mutual Shares Fund (continued)
13. Fair Value Measurements(continued)
| • | Level 2 – other significant observable inputs (including quoted prices for similar financial instruments, interest rates, prepayment speed, credit risk, etc.) |
| • | Level 3 – significant unobservable inputs (including the Fund’s own assumptions in determining the fair value of financial instruments) |
The input levels are not necessarily an indication of the risk or liquidity associated with financial instruments at that level.
A summary of inputs used as of December 31, 2019, in valuing the Fund’s assets and liabilities carried at fair value, is as follows:
| Level 1 | Level 2 | Level 3 | Total | |||||||||||||
Assets: | ||||||||||||||||
Investments in Securities:a | ||||||||||||||||
Equity Investments:b | ||||||||||||||||
Auto Components | $ | — | $ | — | $ | 262,624 | $ | 262,624 | ||||||||
Machinery | 41,115,449 | 58,151,524 | — | 99,266,973 | ||||||||||||
Media | 704,839,679 | — | 505,662 | 705,345,341 | ||||||||||||
Specialty Retail | — | — | 27,867,828 | c | 27,867,828 | |||||||||||
All Other Equity Investments | 9,699,588,617 | — | — | 9,699,588,617 | ||||||||||||
Corporate Notes and Senior Floating Rate Interests | — | 401,710,529 | — | 401,710,529 | ||||||||||||
Corporate Notes in Reorganization | — | 2,813,696 | — | 2,813,696 | ||||||||||||
Companies in Liquidation | — | — | 106,797 | c | 106,797 | |||||||||||
Short Term Investments | 631,460,637 | 16,300,000 | — | 647,760,637 | ||||||||||||
|
| |||||||||||||||
Total Investments in Securities | $ | 11,077,004,382 | �� | $ | 478,975,749 | $ | 28,742,911 | $ | 11,584,723,042 | |||||||
|
| |||||||||||||||
Other Financial Instruments: | ||||||||||||||||
Forward Exchange Contracts | $ | — | $ | 980,230 | $ | — | $ | 980,230 | ||||||||
|
| |||||||||||||||
Liabilities: | ||||||||||||||||
Other Financial Instruments: | ||||||||||||||||
Securities Sold Shorta | $ | 53,876,501 | $ | — | $ | — | $ | 53,876,501 | ||||||||
Futures Contracts | 2,157,842 | — | — | 2,157,842 | ||||||||||||
Forward Exchange Contracts | — | 10,019,135 | — | 10,019,135 | ||||||||||||
|
| |||||||||||||||
Total Other Financial Instruments | $ | 56,034,343 | $ | 10,019,135 | $ | — | $ | 66,053,478 | ||||||||
|
| |||||||||||||||
aFor detailed categories, see the accompanying Statement of Investments.
bIncludes common stocks as well as other equity interests.
cIncludes securities determined to have no value at December 31, 2019.
A reconciliation of assets in which Level 3 inputs are used in determining fair value is presented when there are significant Level 3 financial instruments at the beginning and/or end of the year.
14. Subsequent Events
The Fund has evaluated subsequent events through the issuance of the financial statements and determined that no events have occurred that require disclosure other than those already disclosed in the financial statements.
42 | Annual Report | franklintempleton.com | ||
FRANKLIN MUTUAL SERIES FUNDS
NOTES TO FINANCIAL STATEMENTS
Franklin Mutual Shares Fund(continued)
Abbreviations
| Counterparty | Currency | Selected Portfolio | ||||||||
BOFA | Bank of America Corp. | EUR | Euro | ADR | American Depositary Receipt | |||||
HSBK | HSBC Bank PLC | GBP | British Pound | FHLB | Federal Home Loan Bank | |||||
SSBT | State Street Bank and Trust Co., N.A. | USD | United States Dollar | LIBOR | London InterBank Offered Rate | |||||
UBSW | UBS AG | |||||||||
| franklintempleton.com | Annual Report | 43 | ||
FRANKLIN MUTUAL SERIES FUNDS
Report of Independent Registered Public Accounting Firm
To the Board of Trustees of Franklin Mutual Series Funds and Shareholders of Franklin Mutual Shares Fund:
Opinion on the Financial Statements
We have audited the accompanying statement of assets and liabilities of Franklin Mutual Shares Fund (the “Fund”) (one of the funds constituting Franklin Mutual Series Funds), including the schedule of investments, as of December 31, 2019, and the related statement of operations for the year then ended, the statements of changes in net assets for each of the two years in the period then ended, the financial highlights for each of the five years in the period then ended and the related notes (collectively referred to as the “financial statements”). In our opinion, the financial statements present fairly, in all material respects, the financial position of Franklin Mutual Shares Fund (one of the funds constituting Franklin Mutual Series Funds) at December 31, 2019, the results of its operations for the year then ended, the changes in its net assets for each of the two years in the period then ended and its financial highlights for each of the five years in the period then ended, in conformity with U.S. generally accepted accounting principles.
Basis for Opinion
These financial statements are the responsibility of the Fund’s management. Our responsibility is to express an opinion on the Fund’s financial statements based on our audits. We are a public accounting firm registered with the Public Company Accounting Oversight Board (United States) (“PCAOB”) and are required to be independent with respect to the Fund in accordance with the U.S. federal securities laws and the applicable rules and regulations of the Securities and Exchange Commission and the PCAOB.
We conducted our audits in accordance with the standards of the PCAOB. Those standards require that we plan and perform the audit to obtain reasonable assurance about whether the financial statements are free of material misstatement, whether due to error or fraud. The Fund is not required to have, nor were we engaged to perform, an audit of the Fund’s internal control over financial reporting. As part of our audits, we are required to obtain an understanding of internal control over financial reporting, but not for the purpose of expressing an opinion on the effectiveness of the Fund’s internal control over financial reporting. Accordingly, we express no such opinion.
Our audits included performing procedures to assess the risks of material misstatement of the financial statements, whether due to error or fraud, and performing procedures that respond to those risks. Such procedures included examining, on a test basis, evidence regarding the amounts and disclosures in the financial statements. Our procedures included confirmation of securities owned as of December 31, 2019, by correspondence with the custodian or by other appropriate auditing procedures where replies from others were not received. Our audits also included evaluating the accounting principles used and significant estimates made by management, as well as evaluating the overall presentation of the financial statements. We believe that our audits provide a reasonable basis for our opinion.
We have served as the auditor of one or more Franklin investment companies since 1987.
Boston, Massachusetts
February 21, 2020
44 | Annual Report | franklintempleton.com | ||
FRANKLIN MUTUAL SERIES FUNDS
Franklin Mutual Shares Fund
Under Section 852(b)(3)(C) of the Internal Revenue Code, the Fund hereby reports the maximum amount allowable but no less than $757,400,294 as a long term capital gain dividend for the fiscal year ended December 31, 2019.
Under Section 871(k)(2)(C) of the Internal Revenue Code, the Fund hereby reports the maximum amount allowable but no less than $26,825,217 as a short term capital gain dividend for purposes of the tax imposed under Section 871(a)(1)(A) of the Internal Revenue Code for the fiscal year ended December 31, 2019.
Under Section 854(b)(1)(A) of the Internal Revenue Code, the Fund hereby reports 62.80% of the ordinary income dividends as income qualifying for the dividends received deduction for the fiscal year ended December 31, 2019.
Under Section 854(b)(1)(B) of the Internal Revenue Code, the Fund hereby reports the maximum amount allowable but no less than $280,960,099 as qualified dividends for purposes of the maximum rate under Section 1(h)(11) of the Internal Revenue Code for the fiscal year ended December 31, 2019. Distributions, including qualified dividend income, paid during calendar year 2019 will be reported to shareholders on Form1099-DIV bymid-February 2020. Shareholders are advised to check with their tax advisors for information on the treatment of these amounts on their individual income tax returns.
Under Section 871(k)(1)(C) of the Internal Revenue Code, the Fund hereby reports the maximum amount allowable but no less than $57,644,174 as interest related dividends for purposes of the tax imposed under Section 871(a)(1)(A) of the Internal Revenue Code for the fiscal year ended December 31, 2019.
| franklintempleton.com | Annual Report | 45 | ||
FRANKLIN MUTUAL SERIES FUNDS
The name, year of birth and address of the officers and board members, as well as their affiliations, positions held with the Trust, principal occupations during at least the past five years and number of U.S. registered portfolios overseen in the Franklin Templeton fund complex, are shown below. Generally, each board member serves until that person’s successor is elected and qualified.
Independent Board Members
Name, Year of Birth and Address | Position | Length of Time Served | Number of Portfolios in Fund Complex Overseen by Board Member* | Other Directorships Held During at Least the Past 5 Years | ||||
| Edward I. Altman, Ph.D. (1941) | Trustee | Since 1987 | 12 | None | ||||
c/o Franklin Mutual Advisers, LLC | ||||||||
101 John F. Kennedy Parkway | ||||||||
Short Hills, NJ 07078-2716 | ||||||||
| Principal Occupation During at Least the Past 5 Years: | ||||||||
Max L. Heine Professor of Finance, Emeritus and Director of The Credit and Debt Markets Research Program, Salomon Center, Stern School of Business, New York University; editor and author of numerous financial publications; financial consultant; an adviser to numerous financial and publishing organizations; andformerly, Vice Director, Salomon Center, Stern School of Business, New York University.
| ||||||||
Ann Torre Bates (1958) c/o Franklin Mutual Advisers, LLC 101 John F. Kennedy Parkway Short Hills, NJ 07078-2716 | Trustee and Chairperson | Trustee since 1995 and Chairperson since January 2020 | 33 | Ares Capital Corporation (specialty finance company) (2010-present), United Natural Foods, Inc. (distributor of natural, organic and specialty foods) (2013-present), Allied Capital Corporation (financial services) (2003-2010), SLM Corporation (Sallie Mae) (1997-2014) and Navient Corporation (loan management, servicing and asset recovery) (2014-2016). | ||||
| Principal Occupation During at Least the Past 5 Years: | ||||||||
Director of various companies; andformerly, Executive Vice President and Chief Financial Officer, NHP Incorporated (manager of multifamily housing) (1995-1997); and Vice President and Treasurer, US Airways, Inc. (until 1995).
| ||||||||
Burton J. Greenwald (1929) c/o Franklin Mutual Advisers, LLC 101 John F. Kennedy Parkway Short Hills, NJ 07078-2716 | Trustee | Since 2002 | 12 | Franklin Templeton Emerging Markets Debt Opportunities Fund PLC (1999-present) and Fiduciary International Ireland Limited (1999-2015). | ||||
| Principal Occupation During at Least the Past 5 Years: | ||||||||
Managing Director, B.J. Greenwald Associates (management consultants to the financial services industry); andformerly, Chairman, Fiduciary Trust International Funds; Executive Vice President, L.F. Rothschild Fund Management, Inc.; President and Director, Merit Mutual Funds; President, Underwriting Division and Director, National Securities & Research Corporation; Governor, Investment Company Institute; and Chairman, ICI Public Information Committee.
| ||||||||
Jan Hopkins Trachtman(1947) c/o Franklin Mutual Advisers, LLC 101 John F. Kennedy Parkway Short Hills, NJ 07078-2716 | Trustee | Since 2009 | 12 | FinTech Acquisition Corp. III (special purpose fintech acquisition company) (2018-present) | ||||
| Principal Occupation During at Least the Past 5 Years: | ||||||||
President and Founder, The Jan Hopkins Group (communications consulting firm); serves on Alumni Advisory Board of Knight Bagehot Fellowship; andformerly, President, Economic Club of New York (2007-2015); Anchor/Correspondent, CNN Financial News (until 2003); Managing Director and Head of Client Communications, Citigroup Private Bank (until 2005);Off-Air reporter, ABC News’ World News Tonight; and Editor, CBS Network News.
| ||||||||
46 | Annual Report | franklintempleton.com | ||
FRANKLIN MUTUAL SERIES FUNDS
-
Independent Board Members(continued)
Name, Year of Birth and Address | Position | Length of Time Served | Number of Portfolios in Fund Complex Overseen by Board Member* | Other Directorships Held During at Least the Past 5 Years | ||||
| Keith Mitchell (1954) | Trustee | Since 2009 | 12 | None | ||||
c/o Franklin Mutual Advisers, LLC | ||||||||
101 John F. Kennedy Parkway | ||||||||
Short Hills, NJ 07078-2716 | ||||||||
| Principal Occupation During at Least the Past 5 Years: | ||||||||
Director of various boards of asset management firms; andformerly, Managing Member, Mitchell, Hartley & Bechtel Advisers, LLC (formerly, Mitchell Advisers, LLC) (advisory firm) (2003-2015) and Managing Director, Putman Lovell NBF.
| ||||||||
David W. Niemiec (1949) c/o Franklin Mutual Advisers, LLC 101 John F. Kennedy Parkway Short Hills, NJ 07078-2716 | Trustee | Since 2015 | 33 | Hess Midstream LP (oil and gas midstream infrastructure) (2017-present). | ||||
| Principal Occupation During at Least the Past 5 Years: | ||||||||
Advisor, Saratoga Partners (private equity fund); andformerly, Managing Director, Saratoga Partners (1998-2001) and SBC Warburg Dillon Read (investment banking) (1997-1998); Vice Chairman, Dillon, Read & Co. Inc. (investment banking) (1991-1997); and Chief Financial Officer, Dillon, Read & Co. Inc. (1982-1997).
| ||||||||
| Charles Rubens II (1930) | Trustee | Since 1998 | 12 | None | ||||
c/o Franklin Mutual Advisers, LLC | ||||||||
101 John F. Kennedy Parkway | ||||||||
Short Hills, NJ 07078-2716 | ||||||||
| Principal Occupation During at Least the Past 5 Years: | ||||||||
Private investor and president ofnon-profit organizations; andformerly, an executive of Time, Inc.; and Trustee of Colorado College.
| ||||||||
| Robert E. Wade (1946) | Trustee | Since 1991 | 33 | El Oro Ltd (investments) (2003-2019). | ||||
c/o Franklin Mutual Advisers, LLC | ||||||||
101 John F. Kennedy Parkway | ||||||||
Short Hills, NJ 07078-2716 | ||||||||
| Principal Occupation During at Least the Past 5 Years: | ||||||||
Attorney at law engaged in private practice as a sole practitioner (1972-2008) and member of various boards.
| ||||||||
| Gregory H. Williams (1943) | Trustee | Since 2015 | 12 | None | ||||
c/o Franklin Mutual Advisers, LLC | ||||||||
101 John F. Kennedy Parkway | ||||||||
Short Hills, NJ 07078-2716 | ||||||||
| Principal Occupation During at Least the Past 5 Years: | ||||||||
Private investor; Consultant; andformerly, President, University of Cincinnati (2009-2012); President, The City College of New York (2001-2009); Dean, College of Law, Ohio State University (1993-2001); and Associate Vice President, Academic Affairs and Professor of Law, University of Iowa (1977-1993).
| ||||||||
| Interested Board Members and Officers | ||||||||
Name, Year of Birth and Address | Position | Length of Time Served | Number of Portfolios in Fund Complex Overseen by Board Member* | Other Directorships Held During at Least the Past 5 Years | ||||
| **Gregory E. Johnson (1961) | Trustee | Since 2007 | 144 | None | ||||
One Franklin Parkway | ||||||||
San Mateo, CA 94403-1906 | ||||||||
| Principal Occupation During at Least the Past 5 Years: | ||||||||
Chairman of the Board, Member – Office of the Chairman, Director and Chief Executive Officer, Franklin Resources, Inc.; officer and/or director or trustee, as the case may be, of some of the other subsidiaries of Franklin Resources, Inc. and of 39 of the investment companies in Franklin Templeton; Vice Chairman, Investment Company Institute; andformerly, President, Franklin Resources, Inc. (1994-2015).
| ||||||||
| franklintempleton.com | Annual Report | 47 | ||
FRANKLIN MUTUAL SERIES FUNDS
Interested Board Members and Officers (continued)
Name, Year of Birth and Address | Position | Length of Time Served | Number of Portfolios in Fund Complex Overseen by Board Member* | Other Directorships Held During at Least the Past 5 Years | ||||
**Peter A. Langerman (1955) c/o Franklin Mutual Advisers, LLC 101 John F. Kennedy Parkway Short Hills, NJ 07078-2716 | Trustee, President, and Chief Executive Officer – Investment Management | Trustee since 2007, President, and Chief Executive Officer – Investment Management since 2005 | 7 | None | ||||
| Principal Occupation During at Least the Past 5 Years: | ||||||||
Chairman of the Board, Chief Executive Officer and President, Franklin Mutual Advisers, LLC; and officer and/or director, as the case may be, of three of the investment companies in Franklin Templeton.
| ||||||||
Alison E. Baur (1964) One Franklin Parkway San Mateo, CA 94403-1906 | Vice President | Since 2012 | Not Applicable | Not Applicable | ||||
| Principal Occupation During at Least the Past 5 Years: | ||||||||
Deputy General Counsel, Franklin Templeton; and officer of some of the other subsidiaries of Franklin Resources, Inc. and of 41 of the investment companies in Franklin Templeton.
| ||||||||
Breda M. Beckerle (1958) 280 Park Avenue New York, NY 10017 | Interim Chief Compliance Officer | Since January 2020 | Not Applicable | Not Applicable | ||||
| Principal Occupation During at Least the Past 5 Years: | ||||||||
Chief Compliance Officer, Fiduciary Investment Management International, Inc., Franklin Advisers, Inc., Franklin Advisory Services, LLC, Franklin Mutual Advisers, LLC, Franklin Templeton Institutional, LLC; and officer of 41 of the investment companies in Franklin Templeton.
| ||||||||
Steven J. Gray (1955) One Franklin Parkway San Mateo, CA 94403-1906 | Vice President and Secretary | Vice President since 2009 and Secretary since 2005 | Not Applicable | Not Applicable | ||||
| Principal Occupation During at Least the Past 5 Years: | ||||||||
Senior Associate General Counsel, Franklin Templeton; Vice President, Franklin Templeton Distributors, Inc. and FASA, LLC; and officer of 41 of the investment companies in Franklin Templeton.
| ||||||||
Matthew T. Hinkle (1971) One Franklin Parkway San Mateo, CA 94403-1906 | Chief Executive Officer – Finance and Administration | Since 2017 | Not Applicable | Not Applicable | ||||
| Principal Occupation During at Least the Past 5 Years: | ||||||||
Senior Vice President, Franklin Templeton Services, LLC; officer of 41 of the investment companies in Franklin Templeton; andformerly,Vice President, Global Tax (2012-April 2017) and Treasurer/Assistant Treasurer, Franklin Templeton (2009-2017).
| ||||||||
Robert G. Kubilis (1973) 300 S.E. 2nd Street Fort Lauderdale, FL 33301-1923 | Chief Financial Officer, Chief Accounting Officer and Treasurer | Since 2012 | Not Applicable | Not Applicable | ||||
| Principal Occupation During at Least the Past 5 Years: | ||||||||
Treasurer, U.S. Fund Administration & Reporting; and officer of 15 of the investment companies in Franklin Templeton.
| ||||||||
48 | Annual Report | franklintempleton.com | ||
FRANKLIN MUTUAL SERIES FUNDS
-
Interested Board Members and Officers(continued)
Name, Year of Birth and Address | Position | Length of Time Served | Number of Portfolios in Fund Complex Overseen by Board Member* | Other Directorships Held During at Least the Past 5 Years | ||||
Robert Lim (1948) One Franklin Parkway San Mateo, CA 94403-1906 | Vice President – AML Compliance | Since 2016 | Not Applicable | Not Applicable | ||||
| Principal Occupation During at Least the Past 5 Years: | ||||||||
Vice President, Franklin Templeton Companies, LLC; Chief Compliance Officer, Franklin Templeton Distributors, Inc. and Franklin Templeton Investor Services, LLC; and officer of 44 of the investment companies in Franklin Templeton Investments.
| ||||||||
Navid J. Tofigh (1972) One Franklin Parkway San Mateo, CA 94403-1906 | Vice President | Since 2015 | Not Applicable | Not Applicable | ||||
| Principal Occupation During at Least the Past 5 Years: | ||||||||
Associate General Counsel; and officer of 41 of the investment companies in Franklin Templeton.
| ||||||||
Craig S. Tyle (1960) One Franklin Parkway San Mateo, CA 94403-1906 | Vice President | Since 2005 | Not Applicable | Not Applicable | ||||
| Principal Occupation During at Least the Past 5 Years: | ||||||||
General Counsel and Executive Vice President, Franklin Resources, Inc.; and officer of some of the other subsidiaries of Franklin Resources, Inc. and of 41 of the investment companies in Franklin Templeton.
| ||||||||
Lori A. Weber (1964) 300 S.E. 2nd Street Fort Lauderdale, FL 33301-1923 | Vice President | Since 2011 | Not Applicable | Not Applicable | ||||
| Principal Occupation During at Least the Past 5 Years: | ||||||||
Senior Associate General Counsel, Franklin Templeton; Assistant Secretary, Franklin Resources, Inc.; Vice President and Secretary, Templeton Investment Counsel, LLC; and officer of 41 of the investment companies in Franklin Templeton.
| ||||||||
| franklintempleton.com | Annual Report | 49 | ||
FRANKLIN MUTUAL SERIES FUNDS
*We base the number of portfolios on each separate series of the U.S. registered investment companies within the Franklin Templeton Investments fund complex. These portfolios have a common investment manager or affiliated investment managers.
**Gregory E. Johnson is considered to be an interested person of the Fund under the federal securities laws due to his position as an officer and director of Franklin Resources, Inc. (Resources), which is the parent company of the Fund’s investment manager and distributor. Peter A. Langerman is considered to be an interested person of the Fund under the federal securities laws due to his position as an officer of Franklin Mutual Advisers, LLC, which is the Fund’s investment manager.
Note 1: Officer information is current as of the date of this report. It is possible that after this date, information about officers may change.
The Sarbanes-Oxley Act of 2002 and Rules adopted by the U.S. Securities and Exchange Commission require the Fund to disclose whether the Fund’s Audit Committee includes at least one member who is an audit committee financial expert within the meaning of such Act and Rules. The Fund’s Board has determined that there is at least one such financial expert on the Audit Committee and has designated each of Edward I. Altman, Ph.D., Ann Torre Bates and David W. Niemiec as an audit committee financial expert. The Board believes that Messrs. Altman and Niemiec and Ms. Bates qualify as such an expert in view of their extensive business background and experience. Mr. Altman has served as a member of the Fund Audit Committee since 1987. He currently serves as a Max L. Hine Professor of Finance, Emeritus and Director of The Credit and Debt Markets Research Program, Salomon Center, Stern School of Business, New York University. Ms. Bates has served as a member of the Fund Audit Committee since 1995. She currently serves as a director of Ares Capital Corporation (2010-present) and United Natural Foods, Inc. (2013-present) and was formerly a director of Navient Corporation from 2014 to 2016, SLM Corporation from 1997 to 2014 and Allied Capital Corporation from 2003 to 2010, Executive Vice President and Chief Financial Officer of NHP Incorporated from 1995 to 1997 and Vice President and Treasurer of US Airways, Inc. until 1995. Mr. Niemiec has served as a member of the Fund Audit Committee since 2015, currently serves as an Advisor to Saratoga Partners and was formerly its Managing Director from 1998 to 2001 and serves as a director of Hess Midstream LP (2017-present). Mr. Niemiec was formerly a director of Emeritus Corporation from 1999 to 2010 and OSI Pharmaceuticals, Inc. from 2006 to 2010, Managing Director of SBC Warburg Dillon Read from 1997 to 1998, and was Vice Chairman from 1991 to 1997 and Chief Financial Officer from 1982 to 1997 of Dillon, Read & Co. Inc. As a result of such background and experience, the Board believes that Messrs. Altman and Niemiec and Ms. Bates have each acquired an understanding of generally accepted accounting principles and financial statements, the general application of such principles in connection with the accounting estimates, accruals and reserves, and analyzing and evaluating financial statements that present a breadth and level of complexity of accounting issues generally comparable to those of the Fund, as well as an understanding of internal controls and procedures for financial reporting and an understanding of audit committee functions. Messrs. Altman and Niemiec and Ms. Bates are independent Board members as that term is defined under the applicable U.S. Securities and Exchange Commission Rules and Releases.
The Statement of Additional Information (SAI) includes additional information about the board members and is available, without charge, upon request. Shareholders may call (800) DIALBEN/342-5236 to request the SAI.
50 | Annual Report | franklintempleton.com | ||
FRANKLIN MUTUAL SERIES FUNDS
FRANKLIN MUTUAL SHARES FUND
Proxy Voting Policies and Procedures
The Fund’s investment manager has established Proxy Voting Policies and Procedures (Policies) that the Fund uses to determine how to vote proxies relating to portfolio securities. Shareholders may view the Fund’s complete Policies online at franklintempleton.com. Alternatively, shareholders may request copies of the Policies free of charge by calling the Proxy Group collect at (954)527-7678 or by sending a written request to: Franklin Templeton Companies, LLC, 300 S.E. 2nd Street, Fort Lauderdale, FL 33301, Attention: Proxy Group. Copies of the Fund’s proxy voting records are also made available online at franklintempleton.com and posted on the U.S. Securities and Exchange Commission’s website at sec.gov and reflect the most recent12-month period ended June 30.
Quarterly Statement of Investments
The Trust, on behalf of the Fund, files a complete statement of investments with the U.S. Securities and Exchange Commission for the first and third quarters for each fiscal year as an exhibit to its report on FormN-PORT. Shareholders may view the filed FormN-PORT by visiting the Commission’s website at sec.gov. The filed form may also be viewed and copied at the Commission’s Public Reference Room in Washington, DC. Information regarding the operations of the Public Reference Room may be obtained by calling(800) SEC-0330.
Householding of Reports and Prospectuses
You will receive the Fund’s financial reports every six months as well as an annual updated summary prospectus (prospectus available upon request). To reduce Fund expenses, we try to identify related shareholders in a household and send only one copy of the financial reports and summary prospectus. This process, called “house-holding,” will continue indefinitely unless you instruct us otherwise. If you prefer not to have these documents householded, please call us at (800)632-2301. At any time you may view current prospectuses/summary prospectuses and financial reports on our website. If you choose, you may receive these documents through electronic delivery.
| franklintempleton.com | Annual Report | 51 | ||
This page intentionally left blank.
Authorized for distribution only when accompanied or preceded by a summary prospectus and/or prospectus. Investors should carefully consider a fund’s investment goals, risks, charges and expenses before investing. A prospectus contains this and other information; please read it carefully before investing.
To help ensure we provide you with quality service, all calls to and from our service areas are monitored and/or recorded.
| Annual Report and Shareholder Letter Franklin Mutual Shares Fund | |||||
| Investment Manager | Distributor | Shareholder Services | ||||
| Franklin Mutual Advisers, LLC | Franklin Templeton Distributors, Inc. (800) DIAL BEN®/342-5236 | (800)632-2301 - (Class A, C, R & R6) | ||||
| franklintempleton.com | (800)448-FUND - (Class Z) | |||||
| © 2020 Franklin Templeton Investments. All rights reserved. | 474 A 02/20 |
Sign up for electronic delivery at franklintempleton.com/edelivery
Internet Delivery of Fund Reports Unless You Request Paper Copies: Effective January 1, 2021, as permitted by the SEC, paper copies of the Fund’s shareholder reports will no longer be sent by mail, unless you specifically request them from the Fund or your financial intermediary. Instead, the reports will be made available on a website, and you will be notified by mail each time a report is posted and provided with a website link to access the report.
If you already elected to receive shareholder reports electronically, you will not be affected by this change and you need not take any action. If you have not signed up for electronic delivery, we would encourage you to join fellow shareholders who have. You may elect to receive shareholder reports and other communications electronically from the Fund by calling (800)632-2301 or by contacting your financial intermediary.
You may elect to continue to receive paper copies of all your future shareholder reports free of charge by contacting your financial intermediary or, if you invest directly with a Fund, calling (800)632-2301 to let the Fund know of your request. Your election to receive reports in paper will apply to all funds held in your account.
FRANKLIN TEMPLETON
Successful investing begins with ambition. And achievement only comes when you reach for it. That’s why we continually strive to deliver better outcomes for investors. No matter what your goals are, our deep, global investment expertise allows us to offer solutions that can help.
During our more than 70 years of experience, we’ve managed through all kinds of markets—up, down and those in between. We’re always preparing for what may come next. It’s because of this, combined with our strength as one of the world’s largest asset managers that we’ve earned the trust of millions of investors around the world.
Dear Franklin Mutual Financial Services Fund Shareholder:
As we enter 2020, the factors that lifted stocks to record highs in 2019—accommodative central bank monetary policies and progress on a proposed trade deal between the U.S. and China—continue to be sources of optimism for growth. The near-term threat of recession has eased, with the U.S. economy showing resilience as low unemployment and moderately rising wages have encouraged consumer spending, which has supported the expansion. In contrast, business investment and exports were weak in 2019, but there are nascent signs of increasing industrial activity.
Tariffs, trade battles and geopolitical conflict may continue to dominate headlines in 2020 and account for a disproportionate source of market volatility. The U.S. and China agreed in principle to aphase-one trade agreement in late 2019. However, are-escalation of the tariff dispute between the world’s two largest economies is not out of the question, as negotiations on aphase-two trade agreement are scheduled to start after the anticipatedphase-one signing ceremony in January. There was clarity on Brexit as British voters delivered a resounding election victory to Prime Minister Boris Johnson and his Conservative Party, which should pave the way for a conclusive exit agreement. The terms of U.K. departure, however, must still be finalized. Late in the period, tensions in the Middle East were on the rise, following the death of an American contractor in Iraq in late December and a retaliatory U.S. military strike two days later.
During the period, we took advantage of market turbulence to seek out a larger number of stocks whose risk/reward profiles turned more favorable. Subsequently, we used the market appreciation to exit from or trim select positions that reached or exceeded our estimates of intrinsic value. Market volatility continues to present occasional opportunities in
individual stocks, and in certain sectors, notably those considered to be economically sensitive. We continue to focus on situations in which company-specific actions are more important than economic improvement in driving shareholder value.
Valuation is an essential factor in our analysis, and we always ask ourselves if current and potential investments represent an attractive balance of risk and reward. Amid theall-time highs reached by the Standard & Poor’s® 500 Index (S&P 500®) during the period, we maintained our focus on individual securities and the prospects for each business in the context of its valuation and the backdrop of potential political and economic risks.
We continue to adhere to abottom-up stock selection process that is disciplined, driven by rigorous fundamental analysis, and that attempts to limit downside risk. In our view, actively investing in underappreciated and misunderstood companies with identifiable catalysts for unlocking shareholder value can offer meaningful upside potential and a degree of downside protection in periods of financial market turbulence.
We recognize the important role of financial advisors in today’s markets and encourage investors to continue to seek their advice. Amid changing markets and economic conditions, we are confident investors with a well-diversified portfolio and a patient, long-term outlook will be well positioned for the years ahead.
On the following pages, the Fund’s portfolio management team reviews investment decisions that pertain to performance during the past 12 months considering the
| Not FDIC Insured | May Lose Value | No Bank Guarantee | ||
| franklintempleton.com | Not part of the annual report | 1 | ||
economic environment and other factors. Please remember all securities markets fluctuate, as do mutual fund share prices.
We thank you for investing with Franklin Templeton, welcome your questions and comments, and look forward to continuing to serve your investment needs in the years ahead.
Sincerely,

Peter A. Langerman
Chairman, President and Chief Executive Officer
Franklin Mutual Advisers, LLC
This letter reflects our analysis and opinions as of December 31, 2019, unless otherwise indicated. The information is not a complete analysis of every aspect of any market, country, industry, security or fund. Statements of fact are from sources considered reliable.
Contents
| Visitfranklintempleton.comfor fund updates, to access your account, or to find helpful financial planning tools. |
2 | Not part of the annual report | franklintempleton.com | ||
Franklin Mutual Financial Services Fund
This annual report for Franklin Mutual Financial Services Fund covers the fiscal year ended December 31, 2019.
Your Fund’s Goal and Main Investments
The Fund seeks capital appreciation, which may occasionally be short term, with income as a secondary goal. Under normal market conditions, the Fund invests at least 80% of its net assets in securities of financial services companies that we believe are available at market prices less than their intrinsic value. The Fund invests primarily in equity securities, mainly common stocks with a current focus onmid- and large cap companies. To a lesser extent, the Fund also invests in merger arbitrage securities and the debt and equity of distressed companies. The Fund may invest in foreign securities without limit. The Geographic Composition bar chart on this page lists the leading countries where the Fund invests.
Performance Overview
The Fund’s Class Z shares posted a cumulative total return of +19.32% for the 12 months ended December 31, 2019. For comparison, the Fund’s primary benchmark, the MSCI World Financials Index (USD), which captures large and midcap representation across developed markets countries, posted a +26.41% total return, while its secondary benchmark, the Standard & Poor’s 500 (S&P 500®) Financials Index, which tracks financials stocks in the S&P 500 Index, posted a +32.13% total return.1 You can find more of the Fund’s performance data in the Performance Summary beginning on page 8.
Performance data represent past performance, which does not guarantee future results. Investment return and principal value will fluctuate, and you may have a gain or loss when you sell your shares. Current performance may differ from figures shown. For most recentmonth-end performance, go tofranklintempleton.comor call(800)342-5236.
Economic and Market Overview
Global developed and emerging market stocks, as measured by the MSCI All Country World Index (USD), posted a +27.30% total return during the 12 months ended
Geographic Composition*
Based on Total Net Assets as of 12/31/19
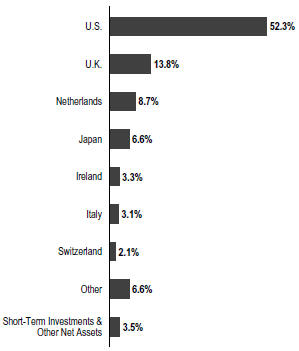
*Figures are stated as a percentage of total and may not equal 100% or may be negative due to rounding, use of any derivatives, unsettled trades or other factors.
December 31, 2019.1 Although global economic growth slowed from 2018, interest-rate cuts from many central banks and the easing of trade tensions nearperiod-end contributed to the generally positive environment for equities worldwide. Reflecting investor optimism and slowing but resilient economic growth, stocks advanced in every major region of the globe.
In the U.S., solid economic growth also supported equities, as healthy consumer spending and a strong labor market kept the economy afloat. The unemployment rate fell during the year, reaching 3.5% in September, November and December 2019, the lowest recorded unemployment rate in
1. Source: Morningstar.
The indexes are unmanaged and include reinvestment of any income or distributions. They do not reflect any fees, expenses or sales charges. One cannot invest directly in an index, and an index is not representative of the Fund’s portfolio.
The dollar value, number of shares or principal amount, and names of all portfolio holdings are listed in the Fund’s Statement of Investments (SOI).
The SOI begins on page 16.
| franklintempleton.com | Annual Report | 3 | ||
FRANKLIN MUTUAL FINANCIAL SERVICES FUND
50 years.2 Wages also grew, albeit at a moderate pace, and inflation remained persistently low. In addition, deficit spending by the U.S. government boosted current growth at the expense of long-term debt. Despite the strength in the consumer sector, some parts of the economy struggled, particularly heavy industry. Annual industrial production contracted late in the reporting period, manufacturing output stalled and capital spending declined.
The U.S. Federal Reserve (Fed) provided a substantial boost to equity markets early in the reporting period as it shifted to a more accommodative monetary policy. In January 2019, the Fed signaled the end of its tightening cycle and cut the federal funds rate three times thereafter, lowering it to a range of 1.50%–1.75%. Stocks responded positively to the interest-rate cuts and gained further in December 2019 after the Fed indicated it would likely leave interest rates unchanged in 2020.
Growth slowed overall in the eurozone, particularly in Germany and Italy. Germany, which is heavily reliant on exports, was adversely affected by the trade conflict between the U.S. and China and the resulting slowdown in global trade. In Italy, political uncertainty and budget concerns caused the country’s annual gross domestic product (GDP) growth to stall in 2019’s first quarter before modestly improving in the second and third quarters. Despite sluggish economic conditions, European developed market equities, as measured by the MSCI EuropeIndex-NR (Local Currency), posted a +23.75% total return for the12-month period, as easing trade tensions buoyed investor optimism and an electoral victory by the Conservative Party in the U.K. alleviated uncertainty surrounding Brexit.3 Although the European Central Bank left its headline refinancing rate unchanged, it lowered the deposit rate and restarted its bond-buying stimulus program, further supporting stocks.
Economic growth in Asia was relatively solid overall, despite slowdowns in several large emerging market countries, such as China and India. Japan’s economy grew amid the Bank of Japan’s sizable stimulus program. The trade war between the U.S. and China provided the backdrop for Asian stocks, which rose and fell in sync with investor sentiment regarding a trade deal. A phase one trade agreement between the two countries reached in December 2019 propelled Asian developed and emerging market stocks, which ultimately ended with a +19.23% total return over the12-month period, as measured by the MSCI All Country Asia Index (USD).4
Emerging market stocks overall experienced several sharp selloffs and subsequent rebounds throughout the reporting period before ending with gains. In aggregate, economic growth slowed somewhat from 2018 but remained solid, although there was some variation among individual countries. Many central banks in emerging markets cut interest rates throughout the reporting period, which, along with resilient GDP growth, provided a supportive environment for equities. Russian stocks posted the highest returns among emerging markets as the threat of further sanctions receded and a solid fiscal environment reassured investors. Overall, global emerging markets, as measured by the MSCI Emerging Markets Index (USD), posted a +18.90% total return for the12-month period.1
Investment Strategy
We strive to provide investors with superior risk-adjusted returns over time through our distinctive, value investment style, which includes investments in undervalued common stocks, and to a significantly lesser extent, distressed debt and merger arbitrage. Rigorous fundamental analysis drives our investment process. We attempt to determine each investment’s intrinsic value as well as the price at which we would be willing to commit shareholder funds. While valuation remains our key consideration, we utilize numerous fundamental factors such as return on equity, financial leverage and long-term earnings power. We also consider factors such as management quality and competitive position. As always, our approach to investing is as much about assessing risk and containing losses as it is about achieving profits. In addition, it is our practice to hedge the Fund’s currency exposure when we deem it advantageous for our shareholders.
What is return on equity? |
Return on equity is a measure of profitability, expressed as a percentage, calculated by dividing a company’s net income by total shareholder equity for a given period. Return on equity tells common shareholders how effectually their money is being employed. Comparing percentages for current and prior periods also reveals trends, and comparison with industry composites reveals how well a company is holding its own against its competitors.
|
2. Source: U.S. Bureau of Labor Statistics.
3. Source: Morningstar. Net Returns (NR) include income net of tax withholding when dividends are paid.
4. Source: MSCI.
4 | Annual Report | franklintempleton.com | ||
FRANKLIN MUTUAL FINANCIAL SERVICES FUND
What is meant by “hedge”? |
To hedge an investment is to take a position intended to offset potential losses that may be incurred by a companion financial instrument. Hedging an investment may also offset potential gains.
|
Manager’s Discussion
The end of a decade is a natural time for reflection about the years that have just passed and to look ahead to what the next 10 might have in store. Across Wall Street, we see many prognostications, and while we are not in the forecasting business, we do allow ourselves to think about investment opportunities over such an extended time period. But experience has taught us that while trying to predict the exact course of markets and/or economic and political events that will drive them may be fun, it is not all that useful.
As 2010 began, the global economy was still recovering from the Global Financial Crisis. The U.S. government owned significant portions of the banking and automotive sectors. The Fed had already started quantitative easing (QE), with QE 2 and QE 3 still to come. In Europe, concerns about Greece’s finances were emerging, and in China the effects of 2009’s massive stimulus programs were starting to take hold.
Over the subsequent years we saw ongoing, global QE, culminating in trillions of dollars of debt yielding negative interest rates. The European Union (EU) was in continuous upheaval, with Greece threatening to leave, but eventually staying in the eurozone; the U.K. pursuing and achieving Brexit; and ongoing strain between core members Germany, France, Italy and Spain. In the U.S., average annual economic growth was restrained and finished the decade below 2%, trailing the minimum 3% expectation of prior decades. Strong corporate profits and lower corporate tax rates were bright spots.
Equity markets delivered a very good decade—one of the best in history—with the MSCI World Financials Index (USD) posting an average annual total return of +7.85%.1 During the decade, Franklin Mutual Financial Services Fund, Class Z posted an average annual total return of +8.94%, surpassing its benchmark above. In the prior decade, the Fund’s value strategy, which seeks to identify mispriced securities and limit downside risk, posted an average annual total return of +6.71%, compared with +0.15% for its benchmark.1
In our view, going forward we expect more political and monetary uncertainty and economic growth in unexpected
Portfolio Composition*
Based on Total Net Assets as of 12/31/19
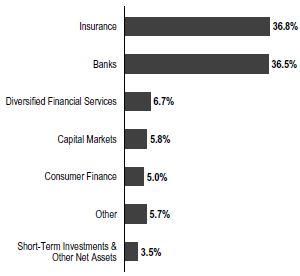
*Figures are stated as a percentage of total and may not equal 100% or may be negative due to rounding, use of any derivatives, unsettled trades or other factors.
places. Corporate profits will have good years and bad years. Some industries will be massively disrupted, while others will find a way to adjust and prosper, even within the context of artificial intelligence and machine learning. Recent events, such as the coronavirus outbreak, have caused, and may continue to cause, uncertainty and volatility in the Chinese economy, potentially leading to vulnerability in 2020 global growth expectations. As for investment positioning, we intend to avoid forecasts that would lead us to make the Fund’s success dependent on a specific set of outcomes. Rather, we will seek to continue with our time-tested value process and complement it with new tools that enhance our security evaluation and selection process. To that end, we have integrated risk and quantitative portfolio analysis tools that provide us with fresh insights about performance, and help us identify companies and securities that we believe satisfy our investors’ goals of risk-adjusted returns that are not wholly dependent on any one economic or political scenario.
Fund Performance
Turning to Fund performance, top positive contributors included U.S.-based companies Voya Financial, Hartford Financial Services Group and JPMorgan Chase. Voya Financial and Harford Financial Services Group are listed among the Fund’s largest positions in the Top 10 Equity Holdings table on page 6.
Shares of U.S.-based investment and insurance company Voya Financial rallied in September after reporting earnings
| franklintempleton.com | Annual Report | 5 | ||
FRANKLIN MUTUAL FINANCIAL SERVICES FUND
that beat consensus expectations, and the company expanded its stock buyback program. Voya’s shares also surged in December after the company announced that it was selling its individual life and othernon-retirement annuities businesses to Resolution Life Group Holdings (not a Fund holding) for $1.7 billion. Voya’s management said it expects to use $600 million to $800 million of the proceeds to pay down debt and between $900 million and $1.1 billion for stock repurchases in 2020.
Shares of insurer and investment products firm Hartford Financial Services Group performed well after the company posted a solid set of quarterly results driven by strong group benefits results, improved market conditions in the property casualty markets and good cost controls. Going forward, we believe Hartford Financial can deliver higher returns through its franchise property/casualty, group benefits and asset management businesses.
The stock price of banking company JPMorgan Chase trended up during the year but rose sharply after it reported third-quarter earnings that beat consensus estimates. The results were broad based, with stronger-than-expected revenues from the company’s consumer and investment banking divisions. A reduction in net interest income, which declines when interest rates fall, was less than expected, mitigated by revenue from JPMorgan Chase’s diversified banking operation.
During the period under review, Fund investments that detracted from performance included Indiabulls Housing Finance, Yes Bank (not held atperiod-end) and Allied Irish Bank Group5.
Shares of Indiabulls Housing Finance, an India-based consumer finance company, declined beginning in June following an unsubstantiated allegation of fraudulent loans, which the company vigorously disputed. After declining dramatically, the company’s stock price recovered modestly in late 2019 after India’s Ministry of Corporate Affairs filed an affidavit in the Delhi High Court stating that the five loans which were the subject of the false claim were repaid or are standard accounts.
Shares of India-based Yes Bank slid after rating agencies downgraded the bonds of two financial services companies that the bank had exposure to. Additional price deterioration was attributable to an equity issuance that was very dilutive, and we liquidated our position ahead of this event. Yes Bank also posted a significant decline in profits, due to a material
Top 10 Equity Holdings
12/31/19
Company Sector/Industry, Country | % of Total Net Assets | |
Voya Financial Inc. Diversified Financial Services, U.S. | 5.1% | |
Everest Re Group Ltd. Insurance, U.S. | 4.9% | |
The Hartford Financial Services Group Inc. Insurance, U.S. | 4.8% | |
American International Group Inc. Insurance, U.S. | 4.4% | |
Citizens Financial Group Inc. Banks, U.S. | 4.0% | |
Alleghany Corp. Insurance, U.S. | 3.7% | |
Wells Fargo & Co. Banks, U.S. | 3.6% | |
Capital One Financial Corp. Consumer Finance, U.S. | 3.6% | |
ING Groep NV Banks, Netherlands | 3.1% | |
Shinsei Bank Ltd. Banks, Japan | 3.0% | |
rise in provisions for loan losses. The company’s new chief executive officer has initiated a strategic initiative to focus more on retail and digital banking in an effort to turn the bank around after recent weakness.
The stock of Ireland-based Allied Irish Bank Group declined after the company reported weaker-than-anticipated earnings and higher expenses. The bank has a strong capital ratio and has been reducing the number ofnon-performing loans on its balance sheet, both of which are positive for the stock, in our view.
During the period, the Fund held currency forwards and futures seeking to hedge most of the currency risk of the portfolio’snon-U.S. dollar investments. The hedges had a modestly positive overall impact on the Fund’s performance.
5. Listed as AIB Group in the SOI.
See www.franklintempletondatasources.com for additional provider information.
6 | Annual Report | franklintempleton.com | ||
FRANKLIN MUTUAL FINANCIAL SERVICES FUND
What is a currency forward?
A currency forward is a direct agreement between the Fund and a counterparty to buy or sell a foreign currency in exchange for another currency at a specific exchange rate on a future date.
|
What is a future?
A future is an agreement between the Fund and a counterparty made through a U.S. or foreign futures exchange to buy or sell an underlying instrument or asset at a specific price on a future date. |
As fellow shareholders, we found recent relative performance disappointing, but it is not uncommon for our strategy to lag the equity markets at times. We remain committed to our disciplined, value investment approach as we seek to generate attractive, long-term, risk-adjusted returns for shareholders.
Thank you for your participation in Franklin Mutual Financial Services Fund. We look forward to continuing to serve your investment needs.
 |  | |
Andrew Sleeman, CFA | ||
| Co-Portfolio Manager |
 |  | |
Andrew B. Dinnhaupt, CFA | ||
| Co-Portfolio Manager |
 |  | |
Luis Hernandez | ||
| Co-Portfolio Manager |
CFA® is a trademark owned by CFA Institute.
The foregoing information reflects our analysis, opinions and portfolio holdings as of December 31, 2019, the end of the reporting period. The way we implement our main investment strategies and the resulting portfolio holdings may change depending on factors such as market and economic conditions. These opinions may not be relied upon as investment advice or an offer for a particular security. The information is not a complete analysis of every aspect of any market, country, industry, security or the Fund. Statements of fact are from sources considered reliable, but the investment manager makes no representation or warranty as to their completeness or accuracy. Although historical performance is no guarantee of future results, these insights may help you understand our investment management philosophy.
| franklintempleton.com | Annual Report | 7 | ||
FRANKLIN MUTUAL FINANCIAL SERVICES FUND
Performance Summary as of December 31, 2019
The performance table and graphs do not reflect any taxes that a shareholder would pay on Fund dividends, capital gain distributions, if any, or any realized gains on the sale of Fund shares. Total return reflects reinvestment of the Fund’s dividends and capital gain distributions, if any, and any unrealized gains or losses. Your dividend income will vary depending on dividends or interest paid by securities in the Fund’s portfolio, adjusted for operating expenses of each class. Capital gain distributions are net profits realized from the sale of portfolio securities.
Performance as of 12/31/19
Cumulative total return excludes sales charges. Average annual total return includes maximum sales charges. Sales charges will vary depending on the size of the investment and the class of share purchased. The maximum is 5.50% and the minimum is 0%.Class A:5.50% maximum initial sales charge. For other share classes, visitfranklintempleton.com.
| Share Class | Cumulative Total Return1 | Average Annual Total Return2 | ||||
Z | ||||||
1-Year | +19.32% | +19.32% | ||||
5-Year | +37.30% | +6.54% | ||||
10-Year | +135.43% | +8.94% | ||||
A3 | ||||||
1-Year | +19.06% | +12.49% | ||||
5-Year | +35.54% | +5.08% | ||||
10-Year | +128.80% | +8.02% | ||||
Performance data represent past performance, which does not guarantee future results. Investment return and principal value will fluctuate, and you may have a gain or loss when you sell your shares. Current performance may differ from figures shown. For most recentmonth-end performance, go tofranklintempleton.comor call(800)342-5236.
See page 10 for Performance Summary footnotes.
8 | Annual Report | franklintempleton.com | ||
FRANKLIN MUTUAL FINANCIAL SERVICES FUND
PERFORMANCE SUMMARY
Total Return Index Comparison for a Hypothetical $10,000 Investment
Total return represents the change in value of an investment over the periods shown. It includes any applicable maximum sales charge, Fund expenses, account fees and reinvested distributions. The unmanaged indexes include reinvestment of any income or distributions. They differ from the Fund in composition and do not pay management fees or expenses. One cannot invest directly in an index.
Class Z(1/1/10–12/31/19)
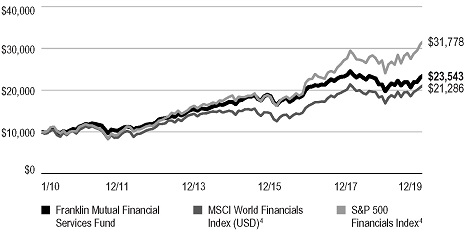
Class A(1/1/10–12/31/19)
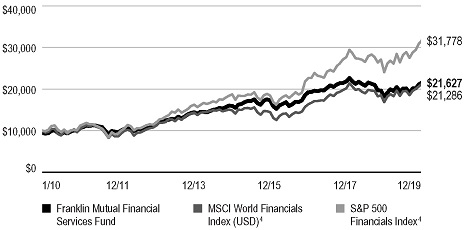
See page 10 for Performance Summary footnotes.
| franklintempleton.com | Annual Report | 9 | ||
FRANKLIN MUTUAL FINANCIAL SERVICES FUND
PERFORMANCE SUMMARY
Distributions(1/1/19–12/31/19)
| Share Class | Net Investment Income | |
Z | $0.4382 | |
A | $0.3778 | |
C | $0.1743 | |
R6 | $0.4680 | |
Total Annual Operating Expenses5
| Share Class | ||
| Z | 1.09% | |
| A | 1.34% |
Each class of shares is available to certain eligible investors and has different annual fees and expenses, as described in the prospectus.
All investments involve risks, including possible loss of principal. Value securities may not increase in price as anticipated or may decline further in value. Special risks are associated with foreign investing, including currency fluctuations, economic instability and political developments. Investing in a single-sector fund involves special risks, including greater sensitivity to economic, political or regulatory developments impacting the sector. Because the Fund may invest its assets in companies in a specific region, including Europe, it is subject to greater risks of adverse developments in that region and/or the surrounding regions than a fund that is more broadly diversified geographically. Current political and financial uncertainty surrounding the European Union may increase market volatility and the economic risk of investing in companies in Europe. Smaller-company stocks have exhibited greater price volatility than larger-company stocks, particularly over the short term. The Fund’s investments in companies engaged in mergers, reorganizations or liquidations also involve special risks as pending deals may not be completed on time or on favorable terms. The Fund may invest in lower-rated bonds, which entail higher credit risk. The Fund’s prospectus also includes a description of the main investment risks.
1. Cumulative total return represents the change in value of an investment over the periods indicated.
2. Average annual total return represents the average annual change in value of an investment over the periods indicated. Return for less than one year, if any, has not been annualized.
3. Prior to 9/10/18, these shares were offered at a higher initial sales charge of 5.75%, thus actual returns (with sales charges) would have differed. Average annual total returns (with sales charges) have been restated to reflect the current maximum initial sales charge of 5.50%.
4. Source: Morningstar. The MSCI World Financials Index (USD) captures large and midcap representation across developed markets countries. The S&P 500 Financials Index is market capitalization-weighted and consists of all financial stocks in the S&P 500. The S&P 500 is a market capitalization-weighted index of 500 stocks designed to measure total U.S. equity market performance.
5. Figures are as stated in the Fund’s current prospectus and may differ from the expense ratios disclosed in the Your Fund’s Expenses and Financial Highlights sections in this report. In periods of market volatility, assets may decline significantly, causing total annual Fund operating expenses to become higher than the figures shown.
See www.franklintempletondatasources.com for additional data provider information.
10 | Annual Report | franklintempleton.com | ||
FRANKLIN MUTUAL FINANCIAL SERVICES FUND
As a Fund shareholder, you can incur two types of costs: (1) transaction costs, including sales charges (loads) on Fund purchases and redemptions; and (2) ongoing Fund costs, including management fees, distribution and service(12b-1) fees, and other Fund expenses. All mutual funds have ongoing costs, sometimes referred to as operating expenses. The table below shows ongoing costs of investing in the Fund and can help you understand these costs and compare them with those of other mutual funds. The table assumes a $1,000 investment held for the six months indicated.
Actual Fund Expenses
The table below provides information about actual account values and actual expenses in the columns under the heading “Actual.” In these columns the Fund’s actual return, which includes the effect of Fund expenses, is used to calculate the “Ending Account Value” for each class of shares. You can estimate the expenses you paid during the period by following these steps (of course, your account value and expenses will differ from those in this illustration): Divide your account value by $1,000 (if your account had an $8,600 value, then $8,600÷ $1,000 = 8.6). Then multiply the result by the number in the row for your class of shares under the headings “Actual” and “Expenses Paid During Period” (if Actual Expenses Paid During Period were $7.50, then 8.6 x $7.50 = $64.50). In this illustration, the actual expenses paid this period are $64.50.
Hypothetical Example for Comparison with Other Funds
Under the heading “Hypothetical” in the table, information is provided about hypothetical account values and hypothetical expenses based on the Fund’s actual expense ratio and an assumed rate of return of 5% per year before expenses, which is not the Fund’s actual return. This information may not be used to estimate the actual ending account balance or expenses you paid for the period, but it can help you compare ongoing costs of investing in the Fund with those of other funds. To do so, compare this 5% hypothetical example for the class of shares you hold with the 5% hypothetical examples that appear in the shareholder reports of other funds.
Please note that expenses shown in the table are meant to highlight ongoing costs and do not reflect any transactional costs. Therefore, information under the heading “Hypothetical” is useful in comparing ongoing costs only, and will not help you compare total costs of owning different funds. In addition, if transactional costs were included, your total costs would have been higher.
| Actual | Hypothetical | |||||||||||||||
| (actual return after expenses) | (5% annual return before expenses) | |||||||||||||||
| Share Class | Beginning Account Value 7/1/19 | Ending Account Value 12/31/19 | Expenses Paid During Period | Ending Account Value 12/31/19 | Expenses Paid During Period 7/1/19–12/31/191, 2 | Net Annualized Expense Ratio2 | ||||||||||
|
|
|
| |||||||||||||
| Z | $1,000 | $1,075.50 | $ 5.65 | $1,019.76 | $ 5.50 | 1.08% | ||||||||||
| A | $1,000 | $1,074.40 | $ 6.95 | $1,018.50 | $ 6.77 | 1.33% | ||||||||||
| C | $1,000 | $1,070.10 | $10.85 | $1,014.72 | $10.56 | 2.08% | ||||||||||
| R6 | $1,000 | $1,076.30 | $ 5.02 | $1,020.37 | $ 4.89 | 0.96% | ||||||||||
1. Expenses are equal to the annualized expense ratio for thesix-month period as indicated above—in the far right column—multiplied by the simple average account value over the period indicated, and then multiplied by 184/365 to reflect theone-half year period.
2. Reflects expenses after fee waivers and expense reimbursements, for Class R6.
| franklintempleton.com | Annual Report | 11 | ||
FRANKLIN MUTUAL SERIES FUNDS
Franklin Mutual Financial Services Fund
| Year Ended December 31, | ||||||||||||||||||||
| 2019 | 2018 | 2017 | 2016 | 2015 | ||||||||||||||||
Class Z | ||||||||||||||||||||
Per share operating performance | ||||||||||||||||||||
(for a share outstanding throughout the year) | ||||||||||||||||||||
Net asset value, beginning of year | $19.46 | $24.14 | $21.65 | $19.63 | $18.40 | |||||||||||||||
Income from investment operationsa: | ||||||||||||||||||||
Net investment incomeb | 0.38 | 0.38 | c | 0.22 | 0.31 | d | 0.30 | e | ||||||||||||
Net realized and unrealized gains (losses) | 3.38 | (4.37 | ) | 2.76 | 2.00 | 1.23 | ||||||||||||||
Total from investment operations | 3.76 | (3.99 | ) | 2.98 | 2.31 | 1.53 | ||||||||||||||
Less distributions from: | ||||||||||||||||||||
Net investment income | (0.44 | ) | (0.17 | ) | (0.49 | ) | (0.29 | ) | (0.30 | ) | ||||||||||
Net realized gains | — | (0.52 | ) | — | — | — | ||||||||||||||
Total distributions | (0.44 | ) | (0.69 | ) | (0.49 | ) | (0.29 | ) | (0.30 | ) | ||||||||||
Net asset value, end of year | $22.78 | $19.46 | $24.14 | $21.65 | $19.63 | |||||||||||||||
Total return | 19.32% | (16.49)% | 13.77% | 11.79% | 8.34% | |||||||||||||||
Ratios to average net assets | ||||||||||||||||||||
Expensesf | 1.10% | 1.09% | g | 1.09% | 1.13% | g | 1.13% | |||||||||||||
Net investment income | 1.80% | 1.61% | c | 0.95% | 1.64% | d | 1.53% | e | ||||||||||||
Supplemental data | ||||||||||||||||||||
Net assets, end of year (000’s) | $139,189 | $142,212 | $210,825 | $162,687 | $178,157 | |||||||||||||||
Portfolio turnover rate | 17.06% | 33.11% | 67.89% | 34.58% | 25.43% | |||||||||||||||
aThe amount shown for a share outstanding throughout the period may not correlate with the Statement of Operations for the period due to the timing of sales and repurchases of the Fund’s shares in relation to income earned and/or fluctuating fair value of the investments of the Fund.
bBased on average daily shares outstanding.
cNet investment income per share includes approximately $0.08 per share related to income received in the form of special dividends in connection with certain Fund holdings. Excluding this amount, the ratio of net investment income to average net assets would have been 1.29%.
dNet investment income per share includes approximately $0.05 per share related to income received in the form of special dividends in connection with certain Fund holdings. Excluding this amount, the ratio of net investment income to average net assets would have been 1.38%.
eNet investment income per share includes approximately $0.14 per share related to income received in the form of special dividends in connection with certain Fund holdings. Excluding this amount, the ratio of net investment income to average net assets would have been 0.81%.
fBenefit of expense reduction rounds to less than 0.01%.
gBenefit of waiver and payments by affiliates rounds to less than 0.01%.
12 | Annual Report | The accompanying notes are an integral part of these financial statements. | franklintempleton.com | ||
FRANKLIN MUTUAL SERIES FUNDS
FINANCIAL HIGHLIGHTS
Franklin Mutual Financial Services Fund(continued)
| Year Ended December 31, | ||||||||||||||||||||
| 2019 | 2018 | 2017 | 2016 | 2015 | ||||||||||||||||
Class A | ||||||||||||||||||||
Per share operating performance | ||||||||||||||||||||
(for a share outstanding throughout the year) | ||||||||||||||||||||
Net asset value, beginning of year | $19.52 | $24.21 | $21.70 | $19.69 | $18.46 | |||||||||||||||
Income from investment operationsa: | ||||||||||||||||||||
Net investment incomeb | 0.33 | 0.31 | c | 0.16 | 0.26 | d | 0.25 | e | ||||||||||||
Net realized and unrealized gains (losses) | 3.38 | (4.36 | ) | 2.78 | 1.99 | 1.23 | ||||||||||||||
Total from investment operations | 3.71 | (4.05 | ) | 2.94 | 2.25 | 1.48 | ||||||||||||||
Less distributions from: | ||||||||||||||||||||
Net investment income | (0.38 | ) | (0.12 | ) | (0.43 | ) | (0.24 | ) | (0.25 | ) | ||||||||||
Net realized gains | — | (0.52 | ) | — | — | — | ||||||||||||||
Total distributions | (0.38 | ) | (0.64 | ) | (0.43 | ) | (0.24 | ) | (0.25 | ) | ||||||||||
Net asset value, end of year | $22.85 | $19.52 | $24.21 | $21.70 | $19.69 | |||||||||||||||
Total returnf | 19.06% | (16.72)% | 13.55% | 11.46% | 8.05% | |||||||||||||||
Ratios to average net assets | ||||||||||||||||||||
Expensesg | 1.35% | 1.34% | h | 1.34% | 1.38% | h | 1.41% | |||||||||||||
Net investment income | 1.55% | 1.36% | c | 0.70% | 1.39% | d | 1.25% | e | ||||||||||||
Supplemental data | ||||||||||||||||||||
Net assets, end of year (000’s) | $278,968 | $298,878 | $368,850 | $346,008 | $360,278 | |||||||||||||||
Portfolio turnover rate | 17.06% | 33.11% | 67.89% | 34.58% | 25.43% | |||||||||||||||
aThe amount shown for a share outstanding throughout the period may not correlate with the Statement of Operations for the period due to the timing of sales and repurchases of the Fund’s shares in relation to income earned and/or fluctuating fair value of the investments of the Fund.
bBased on average daily shares outstanding.
cNet investment income per share includes approximately $0.08 per share related to income received in the form of special dividends in connection with certain Fund holdings. Excluding this amount, the ratio of net investment income to average net assets would have been 1.04%.
dNet investment income per share includes approximately $0.05 per share related to income received in the form of special dividends in connection with certain Fund holdings. Excluding this amount, the ratio of net investment income to average net assets would have been 1.13%.
eNet investment income per share includes approximately $0.14 per share related to income received in the form of special dividends in connection with certain Fund holdings. Excluding this amount, the ratio of net investment income to average net assets would have been 0.53%.
fTotal return does not reflect sales commissions or contingent deferred sales charges, if applicable.
gBenefit of expense reduction rounds to less than 0.01%.
hBenefit of waiver and payments by affiliates rounds to less than 0.01%.
| franklintempleton.com | The accompanying notes are an integral part of these financial statements. | Annual Report | 13 | ||
FRANKLIN MUTUAL SERIES FUNDS
FINANCIAL HIGHLIGHTS
Franklin Mutual Financial Services Fund(continued)
| Year Ended December 31, | ||||||||||||||||||||
| 2019 | 2018 | 2017 | 2016 | 2015 | ||||||||||||||||
Class C | ||||||||||||||||||||
Per share operating performance | ||||||||||||||||||||
(for a share outstanding throughout the year) | ||||||||||||||||||||
Net asset value, beginning of year | $19.32 | $24.08 | $21.60 | $19.61 | $18.41 | |||||||||||||||
Income from investment operationsa: | ||||||||||||||||||||
Net investment income (loss)b | 0.18 | 0.15 | c | (0.01 | ) | 0.12 | d | 0.10 | e | |||||||||||
Net realized and unrealized gains (losses) | 3.32 | (4.33 | ) | 2.74 | 1.96 | 1.24 | ||||||||||||||
Total from investment operations | 3.50 | (4.18 | ) | 2.73 | 2.08 | 1.34 | ||||||||||||||
Less distributions from: | ||||||||||||||||||||
Net investment income | (0.17 | ) | (0.06 | ) | (0.25 | ) | (0.09 | ) | (0.14 | ) | ||||||||||
Net realized gains | — | (0.52 | ) | — | — | — | ||||||||||||||
Total distributions | (0.17 | ) | (0.58 | ) | (0.25 | ) | (0.09 | ) | (0.14 | ) | ||||||||||
Net asset value, end of year | $22.65 | $19.32 | $24.08 | $21.60 | $19.61 | |||||||||||||||
Total returnf | 18.15% | (17.35)% | 12.66% | 10.64% | 7.30% | |||||||||||||||
Ratios to average net assets | ||||||||||||||||||||
Expensesg | 2.10% | 2.09% | h | 2.09% | 2.13% | h | 2.13% | |||||||||||||
Net investment income (loss) | 0.80% | 0.61% | c | (0.05)% | 0.64% | d | 0.53% | e | ||||||||||||
Supplemental data | ||||||||||||||||||||
Net assets, end of year (000’s) | $46,132 | $58,610 | $134,117 | $128,766 | $132,975 | |||||||||||||||
Portfolio turnover rate | 17.06% | 33.11% | 67.89% | 34.58% | 25.43% | |||||||||||||||
aThe amount shown for a share outstanding throughout the period may not correlate with the Statement of Operations for the period due to the timing of sales and repurchases of the Fund’s shares in relation to income earned and/or fluctuating fair value of the investments of the Fund.
bBased on average daily shares outstanding.
cNet investment income per share includes approximately $0.08 per share related to income received in the form of special dividends in connection with certain Fund holdings. Excluding this amount, the ratio of net investment income to average net assets would have been 0.29%.
dNet investment income per share includes approximately $0.05 per share related to income received in the form of special dividends in connection with certain Fund holdings. Excluding this amount, the ratio of net investment income to average net assets would have been 0.38%.
eNet investment income per share includes approximately $0.14 per share related to income received in the form of special dividends in connection with certain Fund holdings. Excluding this amount, the ratio of net investment income to average net assets would have been (0.19)%.
fTotal return does not reflect sales commissions or contingent deferred sales charges, if applicable.
gBenefit of expense reduction rounds to less than 0.01%.
hBenefit of waiver and payments by affiliates rounds to less than 0.01%.
14 | Annual Report | The accompanying notes are an integral part of these financial statements. | franklintempleton.com | ||
FRANKLIN MUTUAL SERIES FUNDS
FINANCIAL HIGHLIGHTS
Franklin Mutual Financial Services Fund(continued)
| Year Ended December 31, | ||||||||||||||||||||
| 2019 | 2018 | 2017 | 2016 | 2015 | ||||||||||||||||
Class R6 | ||||||||||||||||||||
Per share operating performance | ||||||||||||||||||||
(for a share outstanding throughout the year) | ||||||||||||||||||||
Net asset value, beginning of year | $19.58 | $24.30 | $21.79 | $19.76 | $18.52 | |||||||||||||||
Income from investment operationsa: | ||||||||||||||||||||
Net investment incomeb | 0.42 | 0.41 | c | 0.25 | 0.32 | d | 0.07 | e | ||||||||||||
Net realized and unrealized gains (losses) | 3.40 | (4.41 | ) | 2.78 | 2.03 | 1.49 | ||||||||||||||
Total from investment operations | 3.82 | (4.00 | ) | 3.03 | 2.35 | 1.56 | ||||||||||||||
Less distributions from: | ||||||||||||||||||||
Net investment income | (0.47 | ) | (0.20 | ) | (0.52 | ) | (0.32 | ) | (0.32 | ) | ||||||||||
Net realized gains | — | (0.52 | ) | — | — | — | ||||||||||||||
Total distributions | (0.47 | ) | (0.72 | ) | (0.52 | ) | (0.32 | ) | (0.32 | ) | ||||||||||
Net asset value, end of year | $22.93 | $19.58 | $24.30 | $21.79 | $19.76 | |||||||||||||||
Total return | 19.51% | (16.41)% | 13.92% | 11.93% | 8.55% | |||||||||||||||
Ratios to average net assets | ||||||||||||||||||||
Expenses before waiver and payments by affiliates | 1.05% | 1.06% | 0.97% | 0.99% | 1.16% | |||||||||||||||
Expenses net of waiver and payments by affiliatesf | 0.97% | 0.97% | 0.95% | 0.96% | 0.96% | |||||||||||||||
Net investment income | 1.93% | 1.73% | c | 1.09% | 1.81% | d | 1.70% | e | ||||||||||||
Supplemental data | ||||||||||||||||||||
Net assets, end of year (000’s) | $2,931 | $3,371 | $4,523 | $2,601 | $1,421 | |||||||||||||||
Portfolio turnover rate | 17.06% | 33.11% | 67.89% | 34.58% | 25.43% | |||||||||||||||
aThe amount shown for a share outstanding throughout the period may not correlate with the Statement of Operations for the period due to the timing of sales and repurchases of the Fund’s shares in relation to income earned and/or fluctuating fair value of the investments of the Fund.
bBased on average daily shares outstanding.
cNet investment income per share includes approximately $0.08 per share related to income received in the form of special dividends in connection with certain Fund holdings. Excluding this amount, the ratio of net investment income to average net assets would have been 1.41%.
dNet investment income per share includes approximately $0.05 per share related to income received in the form of special dividends in connection with certain Fund holdings. Excluding this amount, the ratio of net investment income to average net assets would have been 1.55%.
eNet investment income per share includes approximately $0.14 per share related to income received in the form of special dividends in connection with certain Fund holdings. Excluding this amount, the ratio of net investment income to average net assets would have been 0.98%.
fBenefit of expense reduction rounds to less than 0.01%.
| franklintempleton.com | The accompanying notes are an integral part of these financial statements. | Annual Report | 15 | ||
FRANKLIN MUTUAL SERIES FUNDS
Statement of Investments, December 31, 2019
Franklin Mutual Financial Services Fund
| Country | Shares | Value | ||||||||||
| ||||||||||||
Common Stocks 96.5% | ||||||||||||
Banks 36.5% | ||||||||||||
aAB&T Financial Corp. | United States | 226,100 | $ | 109,658 | ||||||||
AIB Group PLC | Ireland | 2,267,537 | 7,898,339 | |||||||||
Barclays PLC | United Kingdom | 4,160,905 | 9,899,800 | |||||||||
b,cBAWAG Group AG, 144A | Austria | 115,000 | 5,236,050 | |||||||||
CIT Group Inc. | United States | 88,130 | 4,021,372 | |||||||||
Citigroup Inc. | United States | 147,810 | 11,808,541 | |||||||||
Citizens Financial Group Inc. | United States | 455,400 | 18,493,794 | |||||||||
bCredito Valtellinese SpA | Italy | 117,345,631 | 9,369,725 | |||||||||
First Horizon National Corp. | United States | 553,729 | 9,169,752 | |||||||||
ING Groep NV. | Netherlands | 1,200,685 | 14,391,480 | |||||||||
JPMorgan Chase & Co. | United States | 67,580 | 9,420,652 | |||||||||
Shinsei Bank Ltd | Japan | 925,211 | 14,260,211 | |||||||||
Southern National Bancorp of Virginia Inc. | United States | 649,760 | 10,623,576 | |||||||||
Standard Chartered PLC | United Kingdom | 1,267,928 | 11,963,384 | |||||||||
Synovus Financial Corp. | United States | 300,311 | 11,772,191 | |||||||||
UniCredit SpA | Italy | 362,001 | 5,285,678 | |||||||||
Wells Fargo & Co. | United States | 313,670 | 16,875,446 | |||||||||
|
| |||||||||||
| 170,599,649 | ||||||||||||
|
| |||||||||||
Capital Markets 5.8% | ||||||||||||
Credit Suisse Group AG | Switzerland | 712,449 | 9,648,782 | |||||||||
Deutsche Bank AG | Germany | 991,436 | 7,690,638 | |||||||||
Guotai Junan Securities Co. Ltd. | China | 1,396,063 | 2,472,398 | |||||||||
bTiberius Acquisition Corp. | United States | 683,955 | 7,133,651 | |||||||||
|
| |||||||||||
| 26,945,469 | ||||||||||||
|
| |||||||||||
Consumer Finance 5.0% | ||||||||||||
Capital One Financial Corp. | United States | 163,510 | 16,826,814 | |||||||||
Sun Hung Kai & Co. Ltd. | Hong Kong | 14,145,704 | 6,734,926 | |||||||||
|
| |||||||||||
| 23,561,740 | ||||||||||||
|
| |||||||||||
Diversified Financial Services 6.7% | ||||||||||||
bM&G PLC | United Kingdom | 2,364,966 | 7,429,766 | |||||||||
Voya Financial Inc. | United States | 388,650 | 23,699,877 | |||||||||
|
| |||||||||||
| 31,129,643 | ||||||||||||
|
| |||||||||||
Equity Real Estate Investment Trusts (REITs) 1.7% | ||||||||||||
Brixmor Property Group Inc. | United States | 361,000 | 7,801,210 | |||||||||
|
| |||||||||||
Household Durables 1.6% | ||||||||||||
Cairn Homes PLC | Ireland | 5,428,109 | 7,694,414 | |||||||||
|
| |||||||||||
Insurance 36.8% | ||||||||||||
bAlleghany Corp | United States | 21,947 | 17,548,163 | |||||||||
American International Group Inc. | United States | 398,758 | 20,468,248 | |||||||||
ASR Nederland NV | Netherlands | 340,115 | 12,724,237 | |||||||||
bBrighthouse Financial Inc. | United States | 86,800 | 3,405,164 | |||||||||
China Pacific Insurance Group Co. Ltd., H | China | 1,238,600 | 4,879,820 | |||||||||
Chubb Ltd. | United States | 14,450 | 2,249,287 | |||||||||
Direct Line Insurance Group PLC. | United Kingdom | 3,006,354 | 12,443,017 | |||||||||
Everest Re Group Ltd. | United States | 83,500 | 23,116,140 | |||||||||
16 | Annual Report | franklintempleton.com | ||
FRANKLIN MUTUAL SERIES FUNDS
STATEMENT OF INVESTMENTS
Franklin Mutual Financial Services Fund(continued)
Country
| Shares
| Value
| ||||||||||
| ||||||||||||
Common Stocks (continued) | ||||||||||||
Insurance(continued) | ||||||||||||
The Hartford Financial Services Group Inc. | United States | 366,272 | $ | 22,258,349 | ||||||||
Lancashire Holdings Ltd. | United Kingdom | 461,707 | 4,690,265 | |||||||||
MetLife Inc. | United States | 143,270 | 7,302,472 | |||||||||
NN Group NV | Netherlands | 352,791 | 13,380,459 | |||||||||
RSA Insurance Group PLC | United Kingdom | 1,866,729 | 13,983,833 | |||||||||
Sabre Insurance Group PLC | United Kingdom | 881,672 | 3,596,610 | |||||||||
T&D Holdings Inc. | Japan | 768,169 | 9,860,555 | |||||||||
|
| |||||||||||
| 171,906,619 | ||||||||||||
|
| |||||||||||
Real Estate Management & Development 1.6% | ||||||||||||
bDolphin Capital Investors Ltd. | Greece | 3,979,650 | 226,646 | |||||||||
Kenedix Inc. | Japan | 1,350,600 | 7,071,465 | |||||||||
|
| |||||||||||
| 7,298,111 | ||||||||||||
|
| |||||||||||
Thrifts & Mortgage Finance 0.8% | ||||||||||||
Indiabulls Housing Finance Ltd. | India | 907,348 | 3,982,642 | |||||||||
|
| |||||||||||
Total Common Stocks (Cost $435,713,823) | 450,919,497 | |||||||||||
|
| |||||||||||
| Principal Amount | ||||||||||||
Short Term Investments 3.7% | ||||||||||||
U.S. Government and Agency Securities 3.7% | ||||||||||||
dFHLB, 1/02/20 | United States | $ | 8,500,000 | 8,500,000 | ||||||||
dU.S. Treasury Bill, | ||||||||||||
1/02/20 - 3/19/20 | United States | 5,700,000 | 5,693,529 | |||||||||
e 3/26/20 | United States | 3,000,000 | 2,989,481 | |||||||||
|
| |||||||||||
Total U.S. Government and Agency Securities | 17,183,010 | |||||||||||
|
| |||||||||||
Total Investments (Cost $452,891,207) 100.2% | 468,102,507 | |||||||||||
Other Assets, less Liabilities (0.2)% | (882,688 | ) | ||||||||||
|
| |||||||||||
Net Assets 100.0% | $ | 467,219,819 | ||||||||||
|
| |||||||||||
aSee Note 10 regarding holdings of 5% voting securities.
bNon-income producing.
cSecurity was purchased pursuant to Rule 144A under the Securities Act of 1933 and may be sold in transactions exempt from registration only to qualified institutional buyers or in a public offering registered under the Securities Act of 1933. At December 31, 2019, the value of this security was $5,236,050, representing 1.1% of net assets.
dThe security was issued on a discount basis with no stated coupon rate.
eA portion or all of the security has been segregated as collateral for open forward exchange contracts. At December 31, 2019, the value of this security pledged amounted to $2,238,126, representing 0.5% of net assets.
| franklintempleton.com | Annual Report | 17 | ||
FRANKLIN MUTUAL SERIES FUNDS
STATEMENT OF INVESTMENTS
Franklin Mutual Financial Services Fund(continued)
At December 31, 2019, the Fund had the following futures contracts outstanding. See Note 1(c).
Futures Contracts
| Description | Type | Number of Contracts | Notional Amount* | Expiration Date | Value/ Unrealized Appreciation (Depreciation) | |||||||||||||||
| ||||||||||||||||||||
Currency Contracts | ||||||||||||||||||||
EUR/USD | Short | 154 | $ | 21,717,850 | 3/16/20 | $(209,054 | ) | |||||||||||||
GBP/USD | Short | 134 | 11,132,050 | 3/16/20 | (81,712 | ) | ||||||||||||||
|
| |||||||||||||||||||
Total Futures Contracts | $(290,766 | ) | ||||||||||||||||||
|
| |||||||||||||||||||
*As of period end.
At December 31, 2019, the Fund had the following forward exchange contracts outstanding. See Note 1(c).
Forward Exchange Contracts
| Currency | Counterpartya | Type | Quantity | Contract Amount | Settlement Date | Unrealized Appreciation | Unrealized Depreciation | |||||||||||||||||||||
OTC Forward Exchange Contracts |
| |||||||||||||||||||||||||||
Swiss Franc | HSBK | Sell | 55,928 | $ | 56,752 | 1/13/20 | $ | — | $ | (1,100 | ) | |||||||||||||||||
Swiss Franc | UBSW | Sell | 9,177,586 | 9,282,301 | 1/13/20 | — | (211,084 | ) | ||||||||||||||||||||
Euro | BOFA | Sell | 2,020,390 | 2,247,368 | 1/15/20 | — | (20,579 | ) | ||||||||||||||||||||
Euro | HSBK | Sell | 1,273,672 | 1,421,370 | 1/15/20 | — | (8,365 | ) | ||||||||||||||||||||
Euro | SSBT | Sell | 1,069,676 | 1,195,678 | 1/15/20 | — | (5,064 | ) | ||||||||||||||||||||
Euro | SSBT | Sell | 13,244,866 | 15,127,757 | 1/15/20 | 260,004 | — | |||||||||||||||||||||
Euro | UBSW | Sell | 1,705,323 | 1,903,718 | 1/15/20 | — | (10,558 | ) | ||||||||||||||||||||
Euro | UBSW | Sell | 13,355,376 | 15,254,142 | 1/15/20 | 262,339 | — | |||||||||||||||||||||
British Pound | HSBK | Buy | 825,467 | 1,068,801 | 1/16/20 | 25,010 | — | |||||||||||||||||||||
British Pound | HSBK | Sell | 825,467 | 1,043,725 | 1/16/20 | — | (50,085 | ) | ||||||||||||||||||||
British Pound | BOFA | Buy | 398,298 | 527,972 | 2/14/20 | 226 | — | |||||||||||||||||||||
British Pound | HSBK | Sell | 13,616,046 | 16,650,938 | 2/14/20 | — | (1,405,823 | ) | ||||||||||||||||||||
British Pound | SSBT | Sell | 13,341,046 | 16,267,728 | 2/14/20 | — | (1,424,345 | ) | ||||||||||||||||||||
British Pound | UBSW | Sell | 500,000 | 627,335 | 2/14/20 | — | (35,734 | ) | ||||||||||||||||||||
Euro | BOFA | Sell | 177,447 | 197,925 | 2/18/20 | — | (1,685 | ) | ||||||||||||||||||||
Euro | HSBK | Sell | 786,853 | 881,417 | 2/18/20 | — | (3,715 | ) | ||||||||||||||||||||
Euro | SSBT | Sell | 178,591 | 199,252 | 2/18/20 | — | (1,645 | ) | ||||||||||||||||||||
Japanese Yen | HSBK | Buy | 29,922,796 | 276,048 | 2/18/20 | 59 | — | |||||||||||||||||||||
Japanese Yen | SSBT | Sell | 3,419,738,376 | 31,484,955 | 2/18/20 | — | (70,107 | ) | ||||||||||||||||||||
Euro | HSBK | Sell | 604,415 | 674,697 | 4/07/20 | — | (7,329 | ) | ||||||||||||||||||||
Euro | SSBT | Sell | 1,928,286 | 2,159,744 | 4/07/20 | — | (16,145 | ) | ||||||||||||||||||||
Euro | UBSW | Sell | 2,674,217 | 2,991,684 | 4/07/20 | — | (25,918 | ) | ||||||||||||||||||||
British Pound | BOFA | Sell | 55,773 | 72,221 | 4/24/20 | — | (1,879 | ) | ||||||||||||||||||||
British Pound | HSBK | Sell | 2,899,252 | 3,756,679 | 4/24/20 | — | (95,303 | ) | ||||||||||||||||||||
Euro | BOFA | Sell | 2,625,897 | 2,939,758 | 5/21/20 | — | (31,446 | ) | ||||||||||||||||||||
Euro | HSBK | Sell | 864,630 | 965,644 | 5/21/20 | — | (12,685 | ) | ||||||||||||||||||||
Euro | SSBT | Sell | 6,567,050 | 7,362,346 | 5/21/20 | — | (68,276 | ) | ||||||||||||||||||||
Euro | UBSW | Sell | 5,102,096 | 5,724,967 | 5/21/20 | — | (48,058 | ) | ||||||||||||||||||||
British Pound | BOFA | Sell | 335,350 | 450,410 | 5/22/20 | 4,533 | — | |||||||||||||||||||||
British Pound | BOFA | Sell | 3,461,831 | 4,567,646 | 5/22/20 | — | (35,147 | ) | ||||||||||||||||||||
18 | Annual Report | franklintempleton.com | ||
FRANKLIN MUTUAL SERIES FUNDS
STATEMENT OF INVESTMENTS
Franklin Mutual Financial Services Fund(continued)
Forward Exchange Contracts (continued)
| Currency | Counterparty | a | Type | Quantity | | Contract Amount |
| | Settlement Date |
| | Unrealized Appreciation |
| | Unrealized Depreciation |
| ||||||||||||
| ||||||||||||||||||||||||||||
OTC Forward Exchange Contracts(continued) |
| |||||||||||||||||||||||||||
British Pound | HSBK | Sell | 570,589 | $751,035 | 5/22/20 | $ — | $ | (7,610 | ) | |||||||||||||||||||
British Pound | HSBK | Sell | 577,578 | 775,589 | 5/22/20 | 7,651 | — | |||||||||||||||||||||
British Pound | UBSW | Sell | 335,350 | 450,708 | 5/22/20 | 4,832 | — | |||||||||||||||||||||
|
| |||||||||||||||||||||||||||
Total Forward Exchange Contracts |
| $564,654 | $ | (3,599,685 | ) | |||||||||||||||||||||||
|
| |||||||||||||||||||||||||||
Net unrealized appreciation (depreciation) |
| $ | (3,035,031 | ) | ||||||||||||||||||||||||
|
| |||||||||||||||||||||||||||
aMay be comprised of multiple contracts with the same counterparty, currency and settlement date.
See Note 9 regarding other derivative information.
See Abbreviations on page 34.
| franklintempleton.com | The accompanying notes are an integral part of these financial statements. | Annual Report | 19 | ||
FINANCIAL STATEMENTS
Statement of Assets and Liabilities
December 31, 2019
Franklin Mutual Financial Services Fund
Assets: | ||||
Investments in securities: | ||||
Cost - Unaffiliated issuers | $450,664,452 | |||
Cost -Non-controlled affiliates (Note 10) | 2,226,755 | |||
|
| |||
Value - Unaffiliated issuers | $467,992,849 | |||
Value -Non-controlled affiliates (Note 10) | 109,658 | |||
Cash | 83,393 | |||
Foreign currency, at value (cost $454,389) | 456,006 | |||
Receivables: | ||||
Investment securities sold | 329,062 | |||
Capital shares sold | 390,109 | |||
Dividends | 759,850 | |||
European Union tax reclaims | 829,335 | |||
Deposits with brokers for: | ||||
Futures contracts | 618,360 | |||
Unrealized appreciation on OTC forward exchange contracts | 564,654 | |||
Other assets | 382,330 | |||
|
| |||
Total assets | 472,515,606 | |||
|
| |||
Liabilities: | ||||
Payables: | ||||
Capital shares redeemed | 750,602 | |||
Management fees | 346,656 | |||
Distribution fees | 98,419 | |||
Transfer agent fees | 107,534 | |||
Trustees’ fees and expenses | 36,034 | |||
Variation margin on futures contracts | 173,876 | |||
Unrealized depreciation on OTC forward exchange contracts | 3,599,685 | |||
Accrued expenses and other liabilities | 182,981 | |||
|
| |||
Total liabilities | 5,295,787 | |||
|
| |||
Net assets, at value | $467,219,819 | |||
|
| |||
Net assets consist of: | ||||
Paid-in capital | $466,772,042 | |||
Total distributable earnings (losses) | 447,777 | |||
|
| |||
Net assets, at value | $467,219,819 | |||
|
| |||
20 | Annual Report | The accompanying notes are an integral part of these financial statements. | franklintempleton.com | ||
FRANKLIN MUTUAL SERIES FUNDS
FINANCIAL STATEMENTS
Statement of Assets and Liabilities(continued)
December 31, 2019
Franklin Mutual Financial Services Fund
Class Z: | ||||
Net assets, at value | $139,188,813 | |||
|
| |||
Shares outstanding | 6,110,235 | |||
|
| |||
Net asset value and maximum offering price per share | $22.78 | |||
|
| |||
Class A: | ||||
Net assets, at value | $278,968,292 | |||
|
| |||
Shares outstanding | 12,208,646 | |||
|
| |||
Net asset value per sharea | $22.85 | |||
|
| |||
Maximum offering price per share (net asset value per share ÷ 94.50%) | $24.18 | |||
|
| |||
Class C: | ||||
Net assets, at value | $ 46,131,729 | |||
|
| |||
Shares outstanding | 2,036,686 | |||
|
| |||
Net asset value and maximum offering price per sharea | $22.65 | |||
|
| |||
Class R6: | ||||
Net assets, at value | $ 2,930,985 | |||
|
| |||
Shares outstanding | 127,828 | |||
|
| |||
Net asset value and maximum offering price per share | $22.93 | |||
|
|
aRedemption price is equal to net asset value less contingent deferred sales charges, if applicable.
| franklintempleton.com | The accompanying notes are an integral part of these financial statements. | Annual Report | 21 | ||
FRANKLIN MUTUAL SERIES FUNDS
FINANCIAL STATEMENTS
Statement of Operations
for the year ended December 31, 2019
Franklin Mutual Financial Services Fund
Investment income: | ||||
Dividends: (net of foreign taxes)* | ||||
Unaffiliated issuers | $ | 13,361,139 | ||
Non-controlled affiliates (Note 10) | 861 | |||
Interest: | ||||
Unaffiliated issuers | 715,675 | |||
|
| |||
Total investment income | 14,077,675 | |||
|
| |||
Expenses: | ||||
Management fees (Note 3a) | 4,249,976 | |||
Distribution fees: (Note 3c) | ||||
Class A | 720,633 | |||
Class C | 527,404 | |||
Transfer agent fees: (Note 3e) | ||||
Class Z | 211,538 | |||
Class A | 432,976 | |||
Class C | 79,221 | |||
Class R6 | 3,696 | |||
Custodian fees (Note 4) | 39,797 | |||
Reports to shareholders | 71,432 | |||
Registration and filing fees | 77,376 | |||
Professional fees | 109,782 | |||
Trustees’ fees and expenses | 30,389 | |||
Other | 30,023 | |||
|
| |||
Total expenses | 6,584,243 | |||
Expense reductions (Note 4) | (3,419 | ) | ||
Expenses waived/paid by affiliates (Note 3f) | (2,859 | ) | ||
|
| |||
Net expenses | 6,577,965 | |||
|
| |||
Net investment income | 7,499,710 | |||
|
| |||
Realized and unrealized gains (losses): | ||||
Net realized gain (loss) from: | ||||
Investments: | ||||
Unaffiliated issuers | (4,980,619 | ) | ||
Foreign currency transactions | 10,602 | |||
Forward exchange contracts | 8,270,852 | |||
Futures contracts | 1,158,767 | |||
|
| |||
Net realized gain (loss) | 4,459,602 | |||
|
| |||
Net change in unrealized appreciation (depreciation) on: | ||||
Investments: | ||||
Unaffiliated issuers. | 78,037,482 | |||
Non-controlled affiliates (Note 10) | (16,958 | ) | ||
Translation of other assets and liabilities | (110,676 | ) | ||
Forward exchange contracts | (4,607,388 | ) | ||
Futures contracts | (317,435 | ) | ||
|
| |||
Net change in unrealized appreciation (depreciation) | 72,985,025 | |||
|
| |||
Net realized and unrealized gain (loss) | 77,444,627 | |||
|
| |||
Net increase (decrease) in net assets resulting from operations | $ | 84,944,337 | ||
|
| |||
| ||||
*Foreign taxes withheld on dividends | $ | 465,414 | ||
22 | Annual Report | The accompanying notes are an integral part of these financial statements. | franklintempleton.com | ||
FRANKLIN MUTUAL SERIES FUNDS
FINANCIAL STATEMENTS
Statements of Changes in Net Assets
Franklin Mutual Financial Services Fund
| Year Ended December 31, | ||||||||
| 2019 | 2018 | |||||||
Increase (decrease) in net assets: | ||||||||
Operations: | ||||||||
Net investment income | $ | 7,499,710 | $ | 8,665,785 | ||||
Net realized gain (loss) | 4,459,602 | 9,412,447 | ||||||
Net change in unrealized appreciation (depreciation) | 72,985,025 | (127,980,059 | ) | |||||
|
| |||||||
Net increase (decrease) in net assets resulting from operations | 84,944,337 | (109,901,827 | ) | |||||
|
| |||||||
Distributions to shareholders: | ||||||||
Class Z | (2,651,907 | ) | (4,996,108 | ) | ||||
Class A | (4,583,542 | ) | (9,609,536 | ) | ||||
Class C | (357,699 | ) | (1,856,107 | ) | ||||
Class R6 | (62,332 | ) | (115,264 | ) | ||||
|
| |||||||
Total distributions to shareholders | (7,655,480 | ) | (16,577,015 | ) | ||||
|
| |||||||
Capital share transactions: (Note 2) | ||||||||
Class Z | (25,248,222 | ) | (32,948,539 | ) | ||||
Class A | (65,850,270 | ) | 734,715 | |||||
Class C | (21,041,157 | ) | (56,197,465 | ) | ||||
Class R6 | (1,001,103 | ) | (354,486 | ) | ||||
|
| |||||||
Total capital share transactions | (113,140,752 | ) | (88,765,775 | ) | ||||
|
| |||||||
Net increase (decrease) in net assets | (35,851,895 | ) | (215,244,617 | ) | ||||
Net assets: | ||||||||
Beginning of year | 503,071,714 | 718,316,331 | ||||||
|
| |||||||
End of year | $ | 467,219,819 | $ | 503,071,714 | ||||
|
| |||||||
| franklintempleton.com | The accompanying notes are an integral part of these financial statements. | Annual Report | 23 | ||
FRANKLIN MUTUAL SERIES FUNDS
Franklin Mutual Financial Services Fund
1. Organization and Significant Accounting Policies
Franklin Mutual Series Funds (Trust) is registered under the Investment Company Act of 1940 (1940 Act) as anopen-end management investment company, consisting of seven separate funds and applies the specialized accounting and reporting guidance in U.S. Generally Accepted Accounting Principles (U.S. GAAP). Franklin Mutual Financial Services Fund (Fund) is included in this report. The Fund offers four classes of shares: Class Z, Class A, Class C and Class R6. Class C shares automatically convert to Class A shares after they have been held for 10 years. Each class of shares may differ by its initial sales load, contingent deferred sales charges, voting rights on matters affecting a single class, its exchange privilege and fees due to differing arrangements for distribution and transfer agent fees.
The following summarizes the Fund’s significant accounting policies.
a. Financial Instrument Valuation
The Fund’s investments in financial instruments are carried at fair value daily. Fair value is the price that would be received to sell an asset or paid to transfer a liability in an orderly transaction between market participants on the measurement date. The Fund calculates the net asset value (NAV) per share each business day as of 4 p.m. Eastern time or the regularly scheduled close of the New York Stock Exchange (NYSE), whichever is earlier. Under compliance policies and procedures approved by the Trust’s Board of Trustees (the Board), the Fund’s administrator has responsibility for oversight of valuation, including leading the cross-functional Valuation Committee (VC). The Fund may utilize independent pricing services, quotations from securities and financial instrument dealers, and other market sources to determine fair value.
Equity securities and derivative financial instruments listed on an exchange or on the NASDAQ National Market System are valued at the last quoted sale price or the official closing price of the day, respectively. Foreign equity securities are valued as of the close of trading on the foreign stock exchange on which the security is primarily traded, or as of 4 p.m. Eastern time. The value is then converted into its U.S. dollar equivalent at the foreign exchange rate in effect at 4 p.m. Eastern time on the day that the value of the security is determined.Over-the-counter (OTC) securities are valued within the range of the most recent quoted bid and ask prices. Securities that trade in multiple markets or on multiple
exchanges are valued according to the broadest and most representative market. Certain equity securities are valued based upon fundamental characteristics or relationships to similar securities.
Debt securities generally trade in the OTC market rather than on a securities exchange. The Fund’s pricing services use multiple valuation techniques to determine fair value. In instances where sufficient market activity exists, the pricing services may utilize a market-based approach through which quotes from market makers are used to determine fair value. In instances where sufficient market activity may not exist or is limited, the pricing services also utilize proprietary valuation models which may consider market characteristics such as benchmark yield curves, credit spreads, estimated default rates, anticipated market interest rate volatility, coupon rates, anticipated timing of principal repayments, underlying collateral, and other unique security features in order to estimate the relevant cash flows, which are then discounted to calculate the fair value.
Certain derivative financial instruments trade in the OTC market. The Fund’s pricing services use various techniques including industry standard option pricing models and proprietary discounted cash flow models to determine the fair value of those instruments. The Fund’s net benefit or obligation under the derivative contract, as measured by the fair value of the contract, is included in net assets.
The Fund has procedures to determine the fair value of financial instruments for which market prices are not reliable or readily available. Under these procedures, the Fund primarily employs a market-based approach which may use related or comparable assets or liabilities, recent transactions, market multiples, book values, and other relevant information for the investment to determine the fair value of the investment. An income-based valuation approach may also be used in which the anticipated future cash flows of the investment are discounted to calculate fair value. Discounts may also be applied due to the nature or duration of any restrictions on the disposition of the investments. Due to the inherent uncertainty of valuations of such investments, the fair values may differ significantly from the values that would have been used had an active market existed.
Trading in securities on foreign securities stock exchanges and OTC markets may be completed before 4 p.m. Eastern time. In addition, trading in certain foreign markets may not take place on every Fund’s business day. Occasionally,
24 | Annual Report | franklintempleton.com | ||
FRANKLIN MUTUAL SERIES FUNDS
NOTES TO FINANCIAL STATEMENTS
Franklin Mutual Financial Services Fund(continued)
events occur between the time at which trading in a foreign security is completed and 4 p.m. Eastern time that might call into question the reliability of the value of a portfolio security held by the Fund. As a result, differences may arise between the value of the Fund’s portfolio securities as determined at the foreign market close and the latest indications of value at 4 p.m. Eastern time. In order to minimize the potential for these differences, the VC monitors price movements following the close of trading in foreign stock markets through a series of country specific market proxies (such as baskets of American Depositary Receipts, futures contracts and exchange traded funds). These price movements are measured against established trigger thresholds for each specific market proxy to assist in determining if an event has occurred that may call into question the reliability of the values of the foreign securities held by the Fund. If such an event occurs, the securities may be valued using fair value procedures, which may include the use of independent pricing services.
When the last day of the reporting period is anon-business day, certain foreign markets may be open on those days that the Fund’s NAV is not calculated, which could result in differences between the value of the Fund’s portfolio securities on the last business day and the last calendar day of the reporting period. Any significant security valuation changes due to an open foreign market are adjusted and reflected by the Fund for financial reporting purposes.
b. Foreign Currency Translation
Portfolio securities and other assets and liabilities denominated in foreign currencies are translated into U.S. dollars based on the exchange rate of such currencies against U.S. dollars on the date of valuation. The Fund may enter into foreign currency exchange contracts to facilitate transactions denominated in a foreign currency. Purchases and sales of securities, income and expense items denominated in foreign currencies are translated into U.S. dollars at the exchange rate in effect on the transaction date. Portfolio securities and assets and liabilities denominated in foreign currencies contain risks that those currencies will decline in value relative to the U.S. dollar. Occasionally, events may impact the availability or reliability of foreign exchange rates used to convert the U.S. dollar equivalent value. If such an event occurs, the foreign exchange rate will be valued at fair value using procedures established and approved by the Board.
The Fund does not separately report the effect of changes in foreign exchange rates from changes in market prices on securities held. Such changes are included in net realized and unrealized gain or loss from investments in the Statement of Operations.
Realized foreign exchange gains or losses arise from sales of foreign currencies, currency gains or losses realized between the trade and settlement dates on securities transactions and the difference between the recorded amounts of dividends, interest, and foreign withholding taxes and the U.S. dollar equivalent of the amounts actually received or paid. Net unrealized foreign exchange gains and losses arise from changes in foreign exchange rates on foreign denominated assets and liabilities other than investments in securities held at the end of the reporting period.
c. Derivative Financial Instruments
The Fund invested in derivative financial instruments in order to manage risk or gain exposure to various other investments or markets. Derivatives are financial contracts based on an underlying or notional amount, require no initial investment or an initial net investment that is smaller than would normally be required to have a similar response to changes in market factors, and require or permit net settlement. Derivatives contain various risks including the potential inability of the counterparty to fulfill their obligations under the terms of the contract, the potential for an illiquid secondary market, and/or the potential for market movements which expose the Fund to gains or losses in excess of the amounts shown in the Statement of Assets and Liabilities. Realized gain and loss and unrealized appreciation and depreciation on these contracts for the period are included in the Statement of Operations.
Derivative counterparty credit risk is managed through a formal evaluation of the creditworthiness of all potential counterparties. The Fund attempts to reduce its exposure to counterparty credit risk on OTC derivatives, whenever possible, by entering into International Swaps and Derivatives Association (ISDA) master agreements with certain counterparties. These agreements contain various provisions, including but not limited to collateral requirements, events of default, or early termination. Termination events applicable to the counterparty include certain deteriorations in the credit quality of the counterparty. Termination events applicable to the Fund include failure of the Fund to maintain certain net asset levels and/or limit the decline in net assets over various
| franklintempleton.com | Annual Report | 25 | ||
FRANKLIN MUTUAL SERIES FUNDS
NOTES TO FINANCIAL STATEMENTS
Franklin Mutual Financial Services Fund(continued)
1. Organization and Significant Accounting Policies(continued)
c. Derivative Financial Instruments(continued)
periods of time. In the event of default or early termination, the ISDA master agreement gives thenon-defaulting party the right to net andclose-out all transactions traded, whether or not arising under the ISDA agreement, to one net amount payable by one counterparty to the other. However, absent an event of default or early termination, OTC derivative assets and liabilities are presented gross and not offset in the Statement of Assets and Liabilities. Early termination by the counterparty may result in an immediate payment by the Fund of any net liability owed to that counterparty under the ISDA agreement. At December 31, 2019, the Fund had OTC derivatives in a net liability position of $3,035,031 and the aggregate value of collateral pledged for such contracts was $2,238,126.
Collateral requirements differ by type of derivative. Collateral or initial margin requirements are set by the broker or exchange clearing house for exchange traded and centrally cleared derivatives. Initial margin deposited is held at the exchange and can be in the form of cash and/or securities. For OTC derivatives traded under an ISDA master agreement, posting of collateral is required by either the Fund or the applicable counterparty if the total net exposure of all OTC derivatives with the applicable counterparty exceeds the minimum transfer amount, which typically ranges from $100,000 to $250,000, and can vary depending on the counterparty and the type of the agreement. Generally, collateral is determined at the close of Fund business each day and any additional collateral required due to changes in derivative values may be delivered by the Fund or the counterparty the next business day, or within a few business days. Collateral pledged and/or received by the Fund for OTC derivatives, if any, is held in segregated accounts with the Fund’s custodian/counterparty broker and can be in the form of cash and/or securities. Unrestricted cash may be invested according to the Fund’s investment objectives. To the extent that the amounts due to the Fund from its counterparties are not subject to collateralization or are not fully collateralized, the Fund bears the risk of loss from counterpartynon-performance.
At December 31, 2019, the Fund received $105,817 in U.S. Treasury Bills, Bonds and Notes as collateral for derivatives.
The Fund entered into exchange traded futures contracts primarily to manage exposure to certain foreign currencies. A futures contract is an agreement between the Fund and a counterparty to buy or sell an asset at a specified price on a future date. Required initial margins are pledged by the Fund, and the daily change in fair value is accounted for as a variation margin payable or receivable in the Statement of Assets and Liabilities.
The Fund entered into OTC forward exchange contracts primarily to manage exposure to certain foreign currencies. A forward exchange contract is an agreement between the Fund and a counterparty to buy or sell a foreign currency at a specific exchange rate on a future date.
See Note 9 regarding other derivative information.
d. Securities Lending
The Fund participates in an agency based securities lending program to earn additional income. The Fund receives cash collateral against the loaned securities in an amount equal to at least 102% of the fair value of the loaned securities. Collateral is maintained over the life of the loan in an amount not less than 100% of the fair value of loaned securities, as determined at the close of Fund business each day; any additional collateral required due to changes in security values is delivered to the Fund on the next business day. The collateral is deposited into a joint cash account with other funds and is used to invest in a money market fund managed by Franklin Advisers, Inc., an affiliate of the Fund, and/or a joint repurchase agreement. The Fund may receive income from the investment of cash collateral, in addition to lending fees and rebates paid by the borrower. Income from securities loaned, net of fees paid to the securities lending agent and/or third-party vendor, is reported separately in the Statement of Operations. The Fund bears the market risk with respect to the collateral investment, securities loaned, and the risk that the agent may default on its obligations to the Fund. If the borrower defaults on its obligation to return the securities loaned, the Fund has the right to repurchase the securities in the open market using the collateral received. The securities lending agent has agreed to indemnify the Fund in the event of default by a third party borrower. At December 31, 2019, the Fund had no securities on loan.
26 | Annual Report | franklintempleton.com | ||
FRANKLIN MUTUAL SERIES FUNDS
NOTES TO FINANCIAL STATEMENTS
Franklin Mutual Financial Services Fund(continued)
e. Income and Deferred Taxes
It is the Fund’s policy to qualify as a regulated investment company under the Internal Revenue Code. The Fund intends to distribute to shareholders substantially all of its taxable income and net realized gains to relieve it from federal income and excise taxes. As a result, no provision for U.S. federal income taxes is required.
The Fund may be subject to foreign taxation related to income received, capital gains on the sale of securities and certain foreign currency transactions in the foreign jurisdictions in which it invests. Foreign taxes, if any, are recorded based on the tax regulations and rates that exist in the foreign markets in which the Fund invests. When a capital gain tax is determined to apply, the Fund records an estimated deferred tax liability in an amount that would be payable if the securities were disposed of on the valuation date.
As a result of several court cases, in certain countries across the European Union, the Fund filed additional tax reclaims for previously withheld taxes on dividends earned in those countries (EU reclaims). These additional filings are subject to various administrative proceedings by the local jurisdictions’ tax authorities within the European Union, as well as a number of related judicial proceedings. Income recognized, if any, for EU reclaims is reflected as other income in the Statement of Operations and any related receivable, if any, is reflected as European Union tax reclaims in the Statement of Assets and Liabilities. When uncertainty exists as to the ultimate resolution of these proceedings, the likelihood of receipt of these EU reclaims, and the potential timing of payment, no amounts are reflected in the financial statements. For U.S. income tax purposes, EU reclaims received by the Fund, if any, reduce the amounts of foreign taxes Fund shareholders can use as tax credits in their individual income tax returns.
The Fund may recognize an income tax liability related to its uncertain tax positions under U.S. GAAP when the uncertain tax position has a less than 50% probability that it will be sustained upon examination by the tax authorities based on its technical merits. As of December 31, 2019, the Fund has determined that no tax liability is required in its financial statements related to uncertain tax positions for any open tax years (or expected to be taken in future tax years). Open tax years are those that remain subject to examination and are based on the statute of limitations in each jurisdiction in which the Fund invests.
f. Security Transactions, Investment Income, Expenses and Distributions
Security transactions are accounted for on trade date. Realized gains and losses on security transactions are determined on a specific identification basis. Interest income and estimated expenses are accrued daily. Amortization of premium and accretion of discount on debt securities are included in interest income. Dividend income is recorded on theex-dividend date except for certain dividends from securities where the dividend rate is not available. In such cases, the dividend is recorded as soon as the information is received by the Fund. Distributions to shareholders are recorded on theex-dividend date. Distributable earnings are determined according to income tax regulations (tax basis) and may differ from earnings recorded in accordance with U.S. GAAP. These differences may be permanent or temporary. Permanent differences are reclassified among capital accounts to reflect their tax character. These reclassifications have no impact on net assets or the results of operations. Temporary differences are not reclassified, as they may reverse in subsequent periods.
Common expenses incurred by the Trust are allocated among the Funds based on the ratio of net assets of each Fund to the combined net assets of the Trust or based on the ratio of number of shareholders of each Fund to the combined number of shareholders of the Trust. Fund specific expenses are charged directly to the Fund that incurred the expense.
Realized and unrealized gains and losses and net investment income, excluding class specific expenses, are allocated daily to each class of shares based upon the relative proportion of net assets of each class. Differences in per share distributions by class are generally due to differences in class specific expenses.
g. Accounting Estimates
The preparation of financial statements in accordance with U.S. GAAP requires management to make estimates and assumptions that affect the reported amounts of assets and liabilities at the date of the financial statements and the amounts of income and expenses during the reporting period. Actual results could differ from those estimates.
h. Guarantees and Indemnifications
Under the Trust’s organizational documents, its officers and trustees are indemnified by the Trust against certain liabilities arising out of the performance of their duties to the Trust.
| franklintempleton.com | Annual Report | 27 | ||
FRANKLIN MUTUAL SERIES FUNDS
NOTES TO FINANCIAL STATEMENTS
Franklin Mutual Financial Services Fund(continued)
1. Organization and Significant Accounting Policies(continued)
h. Guarantees and Indemnifications(continued)
Additionally, in the normal course of business, the Trust, on behalf of the Fund, enters into contracts with service
providers that contain general indemnification clauses. The Trust’s maximum exposure under these arrangements is unknown as this would involve future claims that may be made against the Trust that have not yet occurred. Currently, the Trust expects the risk of loss to be remote.
2. Shares of Beneficial Interest
At December 31, 2019, there were an unlimited number of shares authorized (without par value). Transactions in the Fund’s shares were as follows:
Year Ended December 31,
| ||||||||||||||||||||
2019
| 2018
| |||||||||||||||||||
Shares
| Amount
| Shares
| Amount
| |||||||||||||||||
Class Z Shares: | ||||||||||||||||||||
Shares sold | 812,603 | $ | 17,390,341 | 1,795,911 | $ | 42,587,212 | ||||||||||||||
Shares issued in reinvestment of distributions | 105,805 | 2,403,432 | 232,915 | 4,484,624 | ||||||||||||||||
Shares redeemed | (2,116,626 | ) | (45,041,995 | ) | (3,453,297 | ) | (80,020,375 | ) | ||||||||||||
Net increase (decrease) | (1,198,218 | ) | $ | (25,248,222 | ) | (1,424,471 | ) | $ | (32,948,539 | ) | ||||||||||
Class A Shares: | ||||||||||||||||||||
Shares solda | 938,834 | $ | 20,168,898 | 3,840,652 | $ | 88,515,496 | ||||||||||||||
Shares issued in reinvestment of distributions | 195,362 | 4,450,004 | 483,446 | 9,333,950 | ||||||||||||||||
Shares redeemed | (4,240,433 | ) | (90,469,172 | ) | (4,247,680 | ) | (97,114,731 | ) | ||||||||||||
Net increase (decrease) | (3,106,237 | ) | $ | (65,850,270 | ) | 76,418 | $ | 734,715 | ||||||||||||
Class C Shares: | ||||||||||||||||||||
Shares sold | 185,573 | $ | 3,904,208 | 619,361 | $ | 14,593,999 | ||||||||||||||
Shares issued in reinvestment of distributions | 15,462 | 346,913 | 92,903 | 1,798,559 | ||||||||||||||||
Shares redeemeda | (1,197,724 | ) | (25,292,278 | ) | (3,248,605 | ) | (72,590,023 | ) | ||||||||||||
Net increase (decrease) | (996,689 | ) | $ | (21,041,157 | ) | (2,536,341 | ) | $ | (56,197,465 | ) | ||||||||||
Class R6 Shares: | ||||||||||||||||||||
Shares sold | 82,219 | $ | 1,781,383 | 79,359 | $ | 1,851,756 | ||||||||||||||
Shares issued in reinvestment of distributions | 2,727 | 62,332 | 5,949 | 115,264 | ||||||||||||||||
Shares redeemed | (129,250 | ) | (2,844,818 | ) | (99,309 | ) | (2,321,506 | ) | ||||||||||||
Net increase (decrease) | (44,304 | ) | $ | (1,001,103 | ) | (14,001 | ) | $ | (354,486 | ) | ||||||||||
aMay include a portion of Class C shares that were automatically converted to Class A.
28 | Annual Report | franklintempleton.com | ||
FRANKLIN MUTUAL SERIES FUNDS
NOTES TO FINANCIAL STATEMENTS
Franklin Mutual Financial Services Fund(continued)
3. Transactions with Affiliates
Franklin Resources, Inc. is the holding company for various subsidiaries that together are referred to as Franklin Templeton. Certain officers and trustees of the Fund are also officers and/or directors of the following subsidiaries:
| Subsidiary | Affiliation | |||
Franklin Mutual Advisers, LLC (Franklin Mutual) | Investment manager | |||
Franklin Templeton Services, LLC (FT Services) | Administrative manager | |||
Franklin Templeton Distributors, Inc. (Distributors) | Principal underwriter | |||
Franklin Templeton Investor Services, LLC (Investor Services) | Transfer agent | |||
a. Management Fees
The Fund pays an investment management fee to Franklin Mutual based on the average daily net assets of the Fund as follows:
| Annualized Fee Rate | Net Assets | |||
0.875% | Up to and including $1 billion | |||
0.845% | Over $1 billion, up to and including $2 billion | |||
0.825% | Over $2 billion, up to and including $5 billion | |||
0.805% | In excess of $5 billion | |||
b. Administrative Fees
Under an agreement with Franklin Mutual, FT Services provides administrative services to the Fund. The fee is paid by Franklin Mutual based on the Fund’s average daily net assets, and is not an additional expense of the Fund.
c. Distribution Fees
The Board has adopted distribution plans for each share class, with the exception of Class Z and Class R6 shares, pursuant to Rule12b-1 under the 1940 Act. Under the Fund’s Class A reimbursement distribution plan, the Fund reimburses Distributors for costs incurred in connection with the servicing, sale and distribution of the Fund’s shares up to the maximum annual plan rate. Under the Class A reimbursement distribution plan, costs exceeding the maximum for the current plan year cannot be reimbursed in subsequent periods. In addition, under the Fund’s Class C compensation distribution plan, the Fund pays Distributors for costs incurred in connection with the servicing, sale and distribution of the Fund’s shares up to the maximum annual plan rate. The plan year, for purposes of monitoring compliance with the maximum annual plan rates, is February 1 through January 31.
The maximum annual plan rates, based on the average daily net assets, for each class, are as follows:
Class A | 0.35 | % | ||
Class C | 1.00 | % |
The Board has set the current rate at 0.25% per year for Class A shares until further notice and approval by the Board.
| franklintempleton.com | Annual Report | 29 | ||
FRANKLIN MUTUAL SERIES FUNDS
NOTES TO FINANCIAL STATEMENTS
Franklin Mutual Financial Services Fund(continued)
3. Transactions with Affiliates(continued)
d. Sales Charges/Underwriting Agreements
Front-end sales charges and contingent deferred sales charges (CDSC) do not represent expenses of the Fund. These charges are deducted from the proceeds of sales of Fund shares prior to investment or from redemption proceeds prior to remittance, as applicable. Distributors has advised the Fund of the following commission transactions related to the sales and redemptions of the Fund’s shares for the year:
Sales charges retained net of commissions paid to unaffiliated brokers/dealers. | $ | 15,249 | ||
CDSC retained | $ | 5,567 |
e. Transfer Agent Fees
Each class of shares pays transfer agent fees to Investor Services for its performance of shareholder servicing obligations. The fees are based on an annualized asset based fee of 0.02% plus a transaction based fee. In addition, each class reimburses Investor Services for out of pocket expenses incurred and, except for Class R6, reimburses shareholder servicing fees paid to third parties. These fees are allocated daily based upon their relative proportion of such classes’ aggregate net assets. Class R6 pays Investor Services transfer agent fees specific to that class.
For the year ended December 31, 2019, the Fund paid transfer agent fees of $727,431, of which $350,262 was retained by Investor Services.
f. Waiver and Expense Reimbursements
Investor Services has contractually agreed in advance to waive or limit its fees so that the Class R6 transfer agent fees do not exceed 0.02% based on the average net assets of the class until April 30, 2020. Prior to May 1, 2019, the Class R6 transfer agent fees were limited to 0.03%.
g. Interfund Transactions
The Fund engaged in purchases and sales of investments with funds or other accounts that have common investment managers (or affiliated investment managers), directors, trustees or officers. During the year ended December 31, 2019, these purchase and sale transactions aggregated $2,646,846 and $2,231,546, respectively.
4. Expense Offset Arrangement
The Fund has entered into an arrangement with its custodian whereby credits realized as a result of uninvested cash balances are used to reduce a portion of the Fund’s custodian expenses. During the year ended December 31, 2019, the custodian fees were reduced as noted in the Statement of Operations.
5. Independent Trustees’ Retirement Plan
On January 1, 1993, the Trust adopted an Independent Trustees’ Retirement Plan (Plan). The Plan is an unfunded defined benefit plan that provides benefit payments to Trustees whose length of service and retirement age meets the eligibility requirements of the Plan. Benefits under the Plan are based on years of service and fees paid to each trustee at the time of retirement. Effective in December 1996, the Plan was closed to new participants.
30 | Annual Report | franklintempleton.com | ||
FRANKLIN MUTUAL SERIES FUNDS
NOTES TO FINANCIAL STATEMENTS
Franklin Mutual Financial Services Fund(continued)
During the year ended December 31, 2019, the Fund’s projected benefit obligation and benefit payments under the Plan were as follows:
aProjected benefit obligation at December 31, 2019 | $ | 36,034 | ||
bIncrease in projected benefit obligation | $ | 3,753 | ||
Benefit payments made to retired trustees | $ | (632 | ) |
aThe projected benefit obligation is included in trustees’ fees and expenses in the Statement of Assets and Liabilities.
bThe increase in projected benefit obligation is included in trustees’ fees and expenses in the Statement of Operations.
6. Income Taxes
For tax purposes, capital losses may be carried over to offset future capital gains.
At December 31, 2019, the capital loss carryforwards were as follows:
Capital loss carryforwards not subject to expiration: | ||||
Short term | $ | 5,515,313 | ||
Long term | 5,361,458 | |||
|
| |||
Total capital loss carryforwards | $ | 10,876,771 | ||
|
| |||
The tax character of distributions paid during the years ended December 31, 2019 and 2018, was as follows:
| 2019 | 2018 | |||||||
Distributions paid from: | ||||||||
Ordinary income | $ | 7,655,480 | $ | 3,323,724 | ||||
Long term capital gain | — | 13,253,291 | ||||||
| $ | 7,655,480 | $ | 16,577,015 | |||||
At December 31, 2019, the cost of investments, net unrealized appreciation (depreciation) and undistributed ordinary income for income tax purposes were as follows:
Cost of investments | $454,251,359 | |
| ||
Unrealized appreciation | $ 66,323,839 | |
Unrealized depreciation | (55,797,777) | |
| ||
Net unrealized appreciation (depreciation) | $ 10,526,062 | |
| ||
Distributable earnings: | ||
Undistributed ordinary income | $ 62,965 | |
| ||
Differences between income and/or capital gains as determined on a book basis and a tax basis are primarily due to differing treatments of foreign currency transactions and corporate actions.
7. Investment Transactions
Purchases and sales of investments (excluding short term securities) for the year ended December 31, 2019, aggregated $76,742,800 and $156,785,193, respectively.
| franklintempleton.com | Annual Report | 31 | ||
FRANKLIN MUTUAL SERIES FUNDS
NOTES TO FINANCIAL STATEMENTS
Franklin Mutual Financial Services Fund(continued)
8. Concentration of Risk
Investing in foreign securities may include certain risks and considerations not typically associated with investing in U.S. securities, such as fluctuating currency values and changing local, regional and global economic, political and social conditions, which may result in greater market volatility. Current political and financial uncertainty surrounding the European Union may increase market volatility and the economic risk of investing in securities in Europe. In addition, certain foreign securities may not be as liquid as U.S. securities.
9. Other Derivative Information
At December 31, 2019, investments in derivative contracts are reflected in the Statement of Assets and Liabilities as follows:
Asset Derivatives | Liability Derivatives | |||||||||||||||||||
Derivative Contracts Not Accounted for as Hedging Instruments | Statement of Assets and Liabilities Location | Fair Value | Statement of Assets and Liabilities Location | Fair Value | ||||||||||||||||
| ||||||||||||||||||||
Foreign exchange contracts | Variation margin on futures contracts | $ | — | Variation margin on futures contracts | $ | 290,766 | a | |||||||||||||
Unrealized appreciation on OTC forward exchange contracts | 564,654 | Unrealized depreciation on OTC forward exchange contracts | 3,599,685 | |||||||||||||||||
|
|
|
| |||||||||||||||||
Totals | $ | 564,654 | $ | 3,890,451 | ||||||||||||||||
|
|
|
| |||||||||||||||||
aThis amount reflects the cumulative appreciation (depreciation) of futures contracts as reported in the Statement of Investments. Only the variation margin receivable/ payable at year end is separately reported within the Statement of Assets and Liabilities. Prior variation margin movements were recorded to cash upon receipt or payment.
For the year ended December 31, 2019, the effect of derivative contracts in the Statement of Operations was as follows:
Derivative Contracts Not Accounted for as Hedging Instruments | Statement of Operations Location | Net Realized Gain (Loss) for | Statement of Operations Location | Net Change in Unrealized Appreciation (Depreciation) for the Year | ||||||||
| ||||||||||||
| Net realized gain (loss) from: | Net change in unrealized appreciation (depreciation) on: | |||||||||||
Foreign exchange contracts | Forward exchange contracts | $ | 8,270,852 | Forward exchange contracts | $(4,607,388) | |||||||
| Futures contracts | 1,158,767 | Futures contracts | (317,435) | |||||||||
|
|
| ||||||||||
Totals | $ | 9,429,619 | $(4,924,823) | |||||||||
|
|
| ||||||||||
For the year ended December 31, 2019, the average month end notional amount of futures contracts represented $32,923,963. The average month end contract value of forward exchange contracts was $172,353,439.
See Note 1(c) regarding derivative financial instruments.
32 | Annual Report | franklintempleton.com | ||
FRANKLIN MUTUAL SERIES FUNDS
NOTES TO FINANCIAL STATEMENTS
Franklin Mutual Financial Services Fund(continued)
10. Holdings of 5% Voting Securities of Portfolio Companies
The 1940 Act defines "affiliated companies" to include investments in portfolio companies in which a fund owns 5% or more of the outstanding voting securities. During the year ended December 31, 2019, investments in “affiliated companies” were as follows:
| Name of Issuer | Value at Beginning of Year | Purchases | Sales | Realized Gain (Loss) | Net Change in Unrealized Appreciation (Depreciation) | Value at End of Year | Number of Shares Held at End of Year | Dividend Income | ||||||||||||||||||||||||
| ||||||||||||||||||||||||||||||||
Non-Controlled Affiliates | ||||||||||||||||||||||||||||||||
AB&T Financial Corp. (Value is —%†of Net Assets) | $126,616 | $ — | $ — | $ — | $(16,958 | ) | $109,658 | 226,100 | $861 | |||||||||||||||||||||||
|
|
|
| |||||||||||||||||||||||||||||
†Rounds to less than 0.1% of net assets.
11. Credit Facility
The Fund, together with other U.S. registered and foreign investment funds (collectively, Borrowers), managed by Franklin Templeton, are borrowers in a joint syndicated senior unsecured credit facility totaling $2 billion (Global Credit Facility) which matured on February 7, 2020. This Global Credit Facility provides a source of funds to the Borrowers for temporary and emergency purposes, including the ability to meet future unanticipated or unusually large redemption requests. Effective February 7, 2020, the Borrowers renewed the Global Credit Facility for a one year term, maturing February 5, 2021, for a total of $2 billion.
Under the terms of the Global Credit Facility, the Fund shall, in addition to interest charged on any borrowings made by the Fund and other costs incurred by the Fund, pay its share of fees and expenses incurred in connection with the implementation and maintenance of the Global Credit Facility, based upon its relative share of the aggregate net assets of all of the Borrowers, including an annual commitment fee of 0.15% based upon the unused portion of the Global Credit Facility. These fees are reflected in other expenses in the Statement of Operations. During the year ended December 31, 2019, the Fund did not use the Global Credit Facility.
12. Fair Value Measurements
The Fund follows a fair value hierarchy that distinguishes between market data obtained from independent sources (observable inputs) and the Fund’s own market assumptions (unobservable inputs). These inputs are used in determining the value of the Fund’s financial instruments and are summarized in the following fair value hierarchy:
| • | Level 1 – quoted prices in active markets for identical financial instruments |
| • | Level 2 – other significant observable inputs (including quoted prices for similar financial instruments, interest rates, prepayment speed, credit risk, etc.) |
| • | Level 3 – significant unobservable inputs (including the Fund’s own assumptions in determining the fair value of financial instruments) |
The input levels are not necessarily an indication of the risk or liquidity associated with financial instruments at that level.
| franklintempleton.com | Annual Report | 33 | ||
FRANKLIN MUTUAL SERIES FUNDS
NOTES TO FINANCIAL STATEMENTS
Franklin Mutual Financial Services Fund(continued)
12. Fair Value Measurements(continued)
A summary of inputs used as of December 31, 2019, in valuing the Fund’s assets and liabilities carried at fair value, is as follows:
| Level 1 | Level 2 | Level 3 | Total | |||||||||||||
Assets: | ||||||||||||||||
Investments in Securities:a | ||||||||||||||||
Equity Investments | $ | 450,919,497 | $ | — | $ | — | $ | 450,919,497 | ||||||||
Short Term Investments | 8,683,010 | 8,500,000 | — | 17,183,010 | ||||||||||||
Total Investments in Securities | $ | 459,602,507 | $ | 8,500,000 | $ | — | $ | 468,102,507 | ||||||||
Other Financial Instruments: | ||||||||||||||||
Forward Exchange Contracts | $ | — | $ | 564,654 | $ | — | $ | 564,654 | ||||||||
Liabilities: | ||||||||||||||||
Other Financial Instruments: | ||||||||||||||||
Futures Contracts | $ | 290,766 | $ | — | $ | — | $ | 290,766 | ||||||||
Forward Exchange Contracts | — | 3,599,685 | — | 3,599,685 | ||||||||||||
Total Other Financial Instruments | $ | 290,766 | $ | 3,599,685 | $ | — | $ | 3,890,451 | ||||||||
aFor detailed categories, see the accompanying Statement of Investments.
13. Subsequent Events
The Fund has evaluated subsequent events through the issuance of the financial statements and determined that no events have occurred that require disclosure other than those already disclosed in the financial statements.
Abbreviations
| Counterparty | Currency | Selected Portfolio | ||||||||||
| BOFA | Bank of America Corp. | EUR | Euro | FHLB | Federal Home Loan Bank | |||||||
| HSBK | HSBC Bank PLC | GBP | British Pound | |||||||||
| SSBT | State Street Bank and Trust Co., N.A. | USD | United States Dollar | |||||||||
| UBSW | UBS AG | |||||||||||
34 | Annual Report | franklintempleton.com | ||
FRANKLIN MUTUAL SERIES FUNDS
Report of Independent Registered Public Accounting Firm
To the Board of Trustees of Franklin Mutual Series Funds and Shareholders of Franklin Mutual Financial Services Fund:
Opinion on the Financial Statements
We have audited the accompanying statement of assets and liabilities of Franklin Mutual Financial Services Fund (the “Fund”) (one of the funds constituting Franklin Mutual Series Funds), including the schedule of investments, as of December 31, 2019, and the related statement of operations for the year then ended, the statements of changes in net assets for each of the two years in the period then ended, the financial highlights for each of the five years in the period then ended and the related notes (collectively referred to as the “financial statements”). In our opinion, the financial statements present fairly, in all material respects, the financial position of Franklin Mutual Financial Services Fund (one of the funds constituting Franklin Mutual Series Funds) at December 31, 2019, the results of its operations for the year then ended, the changes in its net assets for each of the two years in the period then ended and its financial highlights for each of the five years in the period then ended, in conformity with U.S. generally accepted accounting principles.
Basis for Opinion
These financial statements are the responsibility of the Fund’s management. Our responsibility is to express an opinion on the Fund’s financial statements based on our audits. We are a public accounting firm registered with the Public Company Accounting Oversight Board (United States) (“PCAOB”) and are required to be independent with respect to the Fund in accordance with the U.S. federal securities laws and the applicable rules and regulations of the Securities and Exchange Commission and the PCAOB.
We conducted our audits in accordance with the standards of the PCAOB. Those standards require that we plan and perform the audit to obtain reasonable assurance about whether the financial statements are free of material misstatement, whether due to error or fraud. The Fund is not required to have, nor were we engaged to perform, an audit of the Fund’s internal control over financial reporting. As part of our audits, we are required to obtain an understanding of internal control over financial reporting, but not for the purpose of expressing an opinion on the effectiveness of the Fund’s internal control over financial reporting. Accordingly, we express no such opinion.
Our audits included performing procedures to assess the risks of material misstatement of the financial statements, whether due to error or fraud, and performing procedures that respond to those risks. Such procedures included examining, on a test basis, evidence regarding the amounts and disclosures in the financial statements. Our procedures included confirmation of securities owned as of December 31, 2019, by correspondence with the custodian and brokers. Our audits also included evaluating the accounting principles used and significant estimates made by management, as well as evaluating the overall presentation of the financial statements. We believe that our audits provide a reasonable basis for our opinion.

We have served as the auditor of one or more Franklin investment companies since 1987.
Boston, Massachusetts
February 21, 2020
| franklintempleton.com | Annual Report | 35 | ||
FRANKLIN MUTUAL SERIES FUNDS
Franklin Mutual Financial Services Fund
Under Section 854(b)(1)(A) of the Internal Revenue Code, the Fund hereby reports 62.47% of the ordinary income dividends as income qualifying for the dividends received deduction for the fiscal year ended December 31, 2019.
Under Section 854(b)(1)(B) of the Internal Revenue Code, the Fund hereby reports the maximum amount allowable but no less than $11,872,327 as qualified dividends for purposes of the maximum rate under Section 1(h)(11) of the Internal Revenue Code for the fiscal year ended December 31, 2019. Distributions, including qualified dividend income, paid during calendar year 2019 will be reported to shareholders on Form1099-DIV bymid-February 2020. Shareholders are advised to check with their tax advisors for information on the treatment of these amounts on their individual income tax returns.
36 | Annual Report | franklintempleton.com | ||
FRANKLIN MUTUAL SERIES FUNDS
The name, year of birth and address of the officers and board members, as well as their affiliations, positions held with the Trust, principal occupations during at least the past five years and number of U.S. registered portfolios overseen in the Franklin Templeton fund complex, are shown below. Generally, each board member serves until that person’s successor is elected and qualified.
Independent Board Members
Name, Year of Birth and Address | Position | Length of Time Served | Number of Portfolios in Fund Complex Overseen by Board Member* | Other Directorships Held During at Least the Past 5 Years | ||||
Edward I. Altman, Ph.D. (1941) c/o Franklin Mutual Advisers, LLC 101 John F. Kennedy Parkway Short Hills, NJ 07078-2716 | Trustee | Since 1987 | 12 | None | ||||
| Principal Occupation During at Least the Past 5 Years: | ||||||||
| Max L. Heine Professor of Finance, Emeritus and Director of The Credit and Debt Markets Research Program, Salomon Center, Stern School of Business, New York University; editor and author of numerous financial publications; financial consultant; an adviser to numerous financial and publishing organizations; andformerly, Vice Director, Salomon Center, Stern School of Business, New York University. | ||||||||
Ann Torre Bates (1958) c/o Franklin Mutual Advisers, LLC 101 John F. Kennedy Parkway Short Hills, NJ 07078-2716 | Trustee and Chairperson | Trustee since 1995 and Chairperson since January 2020 | 33 | Ares Capital Corporation (specialty finance company) (2010-present), United Natural Foods, Inc. (distributor of natural, organic and specialty foods) (2013-present), Allied Capital Corporation (financial services) (2003-2010), SLM Corporation (Sallie Mae) (1997-2014) and Navient Corporation (loan management, servicing and asset recovery) (2014-2016). | ||||
| Principal Occupation During at Least the Past 5 Years: | ||||||||
| Director of various companies; andformerly, Executive Vice President and Chief Financial Officer, NHP Incorporated (manager of multifamily housing) (1995-1997); and Vice President and Treasurer, US Airways, Inc. (until 1995). | ||||||||
Burton J. Greenwald (1929) c/o Franklin Mutual Advisers, LLC 101 John F. Kennedy Parkway Short Hills, NJ 07078-2716 | Trustee | Since 2002 | 12 | Franklin Templeton Emerging Markets Debt Opportunities Fund PLC (1999-present) and Fiduciary International Ireland Limited (1999-2015). | ||||
| Principal Occupation During at Least the Past 5 Years: | ||||||||
| Managing Director, B.J. Greenwald Associates (management consultants to the financial services industry); andformerly, Chairman, Fiduciary Trust International Funds; Executive Vice President, L.F. Rothschild Fund Management, Inc.; President and Director, Merit Mutual Funds; President, Underwriting Division and Director, National Securities & Research Corporation; Governor, Investment Company Institute; and Chairman, ICI Public Information Committee. | ||||||||
Jan Hopkins Trachtman (1947) c/o Franklin Mutual Advisers, LLC 101 John F. Kennedy Parkway Short Hills, NJ 07078-2716 | Trustee | Since 2009 | 12 | FinTech Acquisition Corp. III (special purpose fintech acquisition company) (2018-present) | ||||
| Principal Occupation During at Least the Past 5 Years: | ||||||||
| President and Founder, The Jan Hopkins Group (communications consulting firm); serves on Alumni Advisory Board of Knight Bagehot Fellowship; andformerly, President, Economic Club of New York (2007-2015); Anchor/Correspondent, CNN Financial News (until 2003); Managing Director and Head of Client Communications, Citigroup Private Bank (until 2005); Off-Air reporter, ABC News’ World News Tonight; and Editor, CBS Network News. | ||||||||
| franklintempleton.com | Annual Report | 37 | ||
FRANKLIN MUTUAL SERIES FUNDS
Independent Board Members(continued)
Name, Year of Birth and Address | Position | Length of Time Served | Number of Portfolios in Fund Complex Overseen by Board Member* | Other Directorships Held During at Least the Past 5 Years | ||||
Keith Mitchell (1954) c/o Franklin Mutual Advisers, LLC 101 John F. Kennedy Parkway Short Hills, NJ 07078-2716 | Trustee | Since 2009 | 12 | None | ||||
| Principal Occupation During at Least the Past 5 Years: | ||||||||
| Director of various boards of asset management firms; andformerly, Managing Member, Mitchell, Hartley & Bechtel Advisers, LLC (formerly, Mitchell Advisers, LLC) (advisory firm) (2003-2015) and Managing Director, Putman Lovell NBF. | ||||||||
David W. Niemiec (1949) c/o Franklin Mutual Advisers, LLC 101 John F. Kennedy Parkway Short Hills, NJ 07078-2716 | Trustee | Since 2015 | 33 | Hess Midstream LP (oil and gas midstream infrastructure) (2017-present). | ||||
| Principal Occupation During at Least the Past 5 Years: | ||||||||
| Advisor, Saratoga Partners (private equity fund); andformerly, Managing Director, Saratoga Partners (1998-2001) and SBC Warburg Dillon Read (investment banking) (1997-1998); Vice Chairman, Dillon, Read & Co. Inc. (investment banking) (1991-1997); and Chief Financial Officer, Dillon, Read & Co. Inc. (1982-1997). | ||||||||
Charles Rubens II (1930) c/o Franklin Mutual Advisers, LLC 101 John F. Kennedy Parkway Short Hills, NJ 07078-2716 | Trustee | Since 1998 | 12 | None | ||||
| Principal Occupation During at Least the Past 5 Years: | ||||||||
| Private investor and president of non-profit organizations; andformerly, an executive of Time, Inc.; and Trustee of Colorado College. | ||||||||
Robert E. Wade (1946) c/o Franklin Mutual Advisers, LLC 101 John F. Kennedy Parkway Short Hills, NJ 07078-2716 | Trustee | Since 1991 | 33 | El Oro Ltd (investments) (2003-2019). | ||||
| Principal Occupation During at Least the Past 5 Years: | ||||||||
| Attorney at law engaged in private practice as a sole practitioner (1972-2008) and member of various boards. | ||||||||
Gregory H. Williams (1943) c/o Franklin Mutual Advisers, LLC 101 John F. Kennedy Parkway Short Hills, NJ 07078-2716 | Trustee | Since 2015 | 12 | None | ||||
| Principal Occupation During at Least the Past 5 Years: | ||||||||
| Private investor; Consultant; andformerly, President, University of Cincinnati (2009-2012); President, The City College of New York (2001-2009); Dean, College of Law, Ohio State University (1993-2001); and Associate Vice President, Academic Affairs and Professor of Law, University of Iowa (1977-1993). | ||||||||
| Interested Board Members and Officers | ||||||||
Name, Year of Birth and Address | Position | Length of Time Served | Number of Portfolios in Fund Complex Overseen by Board Member* | Other Directorships Held During at Least the Past 5 Years | ||||
**Gregory E. Johnson (1961) One Franklin Parkway San Mateo, CA 94403-1906 | Trustee | Since 2007 | 144 | None | ||||
| Principal Occupation During at Least the Past 5 Years: | ||||||||
| Chairman of the Board, Member – Office of the Chairman, Director and Chief Executive Officer, Franklin Resources, Inc.; officer and/or director or trustee, as the case may be, of some of the other subsidiaries of Franklin Resources, Inc. and of 39 of the investment companies in Franklin Templeton; Vice Chairman, Investment Company Institute; andformerly, President, Franklin Resources, Inc. (1994-2015). | ||||||||
38 | Annual Report | franklintempleton.com | ||
FRANKLIN MUTUAL SERIES FUNDS
Interested Board Members and Officers(continued)
Name, Year of Birth and Address | Position | Length of Time Served | Number of Portfolios in Fund Complex Overseen by Board Member* | Other Directorships Held During at Least the Past 5 Years | ||||
**Peter A. Langerman (1955) c/o Franklin Mutual Advisers, LLC 101 John F. Kennedy Parkway Short Hills, NJ 07078-2716 | Trustee, President, and Chief Executive Officer – Investment Management | Trustee since 2007, President, and Chief Executive Officer – Investment Management since 2005 | 7 | None | ||||
| Principal Occupation During at Least the Past 5 Years: | ||||||||
| Chairman of the Board, Chief Executive Officer and President, Franklin Mutual Advisers, LLC; and officer and/or director, as the case may be, of three of the investment companies in Franklin Templeton. | ||||||||
Alison E. Baur (1964) One Franklin Parkway San Mateo, CA 94403-1906 | Vice President | Since 2012 | Not Applicable | Not Applicable | ||||
| Principal Occupation During at Least the Past 5 Years: | ||||||||
| Deputy General Counsel, Franklin Templeton; and officer of some of the other subsidiaries of Franklin Resources, Inc. and of 41 of the investment companies in Franklin Templeton. | ||||||||
Breda M. Beckerle (1958) 280 Park Avenue New York, NY 10017 | Interim Chief Compliance Officer | Since January 2020 | Not Applicable | Not Applicable | ||||
| Principal Occupation During at Least the Past 5 Years: | ||||||||
| Chief Compliance Officer, Fiduciary Investment Management International, Inc., Franklin Advisers, Inc., Franklin Advisory Services, LLC, Franklin Mutual Advisers, LLC, Franklin Templeton Institutional, LLC; and officer of 41 of the investment companies in Franklin Templeton. | ||||||||
Steven J. Gray (1955) One Franklin Parkway San Mateo, CA 94403-1906 | Vice President and Secretary | Vice President since 2009 and Secretary since 2005 | Not Applicable | Not Applicable | ||||
| Principal Occupation During at Least the Past 5 Years: | ||||||||
| Senior Associate General Counsel, Franklin Templeton; Vice President, Franklin Templeton Distributors, Inc. and FASA, LLC; and officer of 41 of the investment companies in Franklin Templeton. | ||||||||
Matthew T. Hinkle (1971) One Franklin Parkway San Mateo, CA 94403-1906 | Chief Executive Officer – Finance and Administration | Since 2017 | Not Applicable | Not Applicable | ||||
| Principal Occupation During at Least the Past 5 Years: | ||||||||
| Senior Vice President, Franklin Templeton Services, LLC; officer of 41 of the investment companies in Franklin Templeton; andformerly, Vice President, Global Tax (2012-April 2017) and Treasurer/Assistant Treasurer, Franklin Templeton (2009-2017). | ||||||||
Robert G. Kubilis (1973) 300 S.E. 2nd Street Fort Lauderdale, FL 33301-1923 | Chief Financial Officer, Chief Accounting Officer and Treasurer | Since 2012 | Not Applicable | Not Applicable | ||||
| Principal Occupation During at Least the Past 5 Years: | ||||||||
Treasurer, U.S. Fund Administration & Reporting; and officer of 15 of the investment companies in Franklin Templeton. | ||||||||
| franklintempleton.com | Annual Report | 39 | ||
FRANKLIN MUTUAL SERIES FUNDS
Interested Board Members and Officers(continued)
Name, Year of Birth and Address | Position | Length of Time Served | Number of Portfolios in Fund Complex Overseen by Board Member* | Other Directorships Held During at Least the Past 5 Years | ||||
Robert Lim (1948) One Franklin Parkway San Mateo, CA 94403-1906 | Vice President – AML Compliance | Since 2016 | Not Applicable | Not Applicable | ||||
| Principal Occupation During at Least the Past 5 Years: | ||||||||
| Vice President, Franklin Templeton Companies, LLC; Chief Compliance Officer, Franklin Templeton Distributors, Inc. and Franklin Templeton Investor Services, LLC; and officer of 44 of the investment companies in Franklin Templeton Investments. | ||||||||
Navid J. Tofigh (1972) One Franklin Parkway San Mateo, CA 94403-1906 | Vice President | Since 2015 | Not Applicable | Not Applicable | ||||
| Principal Occupation During at Least the Past 5 Years: | ||||||||
| Associate General Counsel; and officer of 41 of the investment companies in Franklin Templeton. | ||||||||
Craig S. Tyle (1960) One Franklin Parkway San Mateo, CA 94403-1906 | Vice President | Since 2005 | Not Applicable | Not Applicable | ||||
| Principal Occupation During at Least the Past 5 Years: | ||||||||
| General Counsel and Executive Vice President, Franklin Resources, Inc.; and officer of some of the other subsidiaries of Franklin Resources, Inc. and of 41 of the investment companies in Franklin Templeton. | ||||||||
Lori A. Weber (1964) 300 S.E. 2nd Street Fort Lauderdale, FL 33301-1923 | Vice President | Since 2011 | Not Applicable | Not Applicable | ||||
| Principal Occupation During at Least the Past 5 Years: | ||||||||
| Senior Associate General Counsel, Franklin Templeton; Assistant Secretary, Franklin Resources, Inc.; Vice President and Secretary, Templeton Investment Counsel, LLC; and officer of 41 of the investment companies in Franklin Templeton. | ||||||||
40 | Annual Report | franklintempleton.com | ||
FRANKLIN MUTUAL SERIES FUNDS
*We base the number of portfolios on each separate series of the U.S. registered investment companies within the Franklin Templeton Investments fund complex. These portfolios have a common investment manager or affiliated investment managers.
**Gregory E. Johnson is considered to be an interested person of the Fund under the federal securities laws due to his position as an officer and director of Franklin Resources, Inc. (Resources), which is the parent company of the Fund’s investment manager and distributor. Peter A. Langerman is considered to be an interested person of the Fund under the federal securities laws due to his position as an officer of Franklin Mutual Advisers, LLC, which is the Fund’s investment manager.
Note 1: Officer information is current as of the date of this report. It is possible that after this date, information about officers may change.
The Sarbanes-Oxley Act of 2002 and Rules adopted by the U.S. Securities and Exchange Commission require the Fund to disclose whether the Fund’s Audit Committee includes at least one member who is an audit committee financial expert within the meaning of such Act and Rules. The Fund’s Board has determined that there is at least one such financial expert on the Audit Committee and has designated each of Edward I. Altman, Ph.D., Ann Torre Bates and David W. Niemiec as an audit committee financial expert. The Board believes that Messrs. Altman and Niemiec and Ms. Bates qualify as such an expert in view of their extensive business background and experience. Mr. Altman has served as a member of the Fund Audit Committee since 1987. He currently serves as a Max L. Hine Professor of Finance, Emeritus and Director of The Credit and Debt Markets Research Program, Salomon Center, Stern School of Business, New York University. Ms. Bates has served as a member of the Fund Audit Committee since 1995. She currently serves as a director of Ares Capital Corporation (2010-present) and United Natural Foods, Inc. (2013-present) and was formerly a director of Navient Corporation from 2014 to 2016, SLM Corporation from 1997 to 2014 and Allied Capital Corporation from 2003 to 2010, Executive Vice President and Chief Financial Officer of NHP Incorporated from 1995 to 1997 and Vice President and Treasurer of US Airways, Inc. until 1995. Mr. Niemiec has served as a member of the Fund Audit Committee since 2015, currently serves as an Advisor to Saratoga Partners and was formerly its Managing Director from 1998 to 2001 and serves as a director of Hess Midstream LP (2017-present). Mr. Niemiec was formerly a director of Emeritus Corporation from 1999 to 2010 and OSI Pharmaceuticals, Inc. from 2006 to 2010, Managing Director of SBC Warburg Dillon Read from 1997 to 1998, and was Vice Chairman from 1991 to 1997 and Chief Financial Officer from 1982 to 1997 of Dillon, Read & Co. Inc. As a result of such background and experience, the Board believes that Messrs. Altman and Niemiec and Ms. Bates have each acquired an understanding of generally accepted accounting principles and financial statements, the general application of such principles in connection with the accounting estimates, accruals and reserves, and analyzing and evaluating financial statements that present a breadth and level of complexity of accounting issues generally comparable to those of the Fund, as well as an understanding of internal controls and procedures for financial reporting and an understanding of audit committee functions. Messrs. Altman and Niemiec and Ms. Bates are independent Board members as that term is defined under the applicable U.S. Securities and Exchange Commission Rules and Releases.
The Statement of Additional Information (SAI) includes additional information about the board members and is available, without charge, upon request. Shareholders may call (800) DIALBEN/342-5236 to request the SAI.
| franklintempleton.com | Annual Report | 41 | ||
FRANKLIN MUTUAL SERIES FUNDS
FRANKLIN MUTUAL FINANCIAL SERVICES FUND
Proxy Voting Policies and Procedures
The Fund’s investment manager has established Proxy Voting Policies and Procedures (Policies) that the Fund uses to determine how to vote proxies relating to portfolio securities. Shareholders may view the Fund’s complete Policies online at franklintempleton.com. Alternatively, shareholders may request copies of the Policies free of charge by calling the Proxy Group collect at (954)527-7678 or by sending a written request to: Franklin Templeton Companies, LLC, 300 S.E. 2nd Street, Fort Lauderdale, FL 33301, Attention: Proxy Group. Copies of the Fund’s proxy voting records are also made available online at franklintempleton.com and posted on the U.S. Securities and Exchange Commission’s website at sec.gov and reflect the most recent12-month period ended June 30.
Quarterly Statement of Investments
The Trust, on behalf of the Fund, files a complete statement of investments with the U.S. Securities and Exchange Commission for the first and third quarters for each fiscal year as an exhibit to its report on FormN-PORT. Shareholders may view the filed FormN-PORT by visiting the Commission’s website at sec.gov. The filed form may also be viewed and copied at the Commission’s Public Reference Room in Washington, DC. Information regarding the operations of the Public Reference Room may be obtained by calling(800) SEC-0330.
Householding of Reports and Prospectuses
You will receive the Fund’s financial reports every six months as well as an annual updated summary prospectus (prospectus available upon request). To reduce Fund expenses, we try to identify related shareholders in a household and send only one copy of the financial reports and summary prospectus. This process, called “householding,” will continue indefinitely unless you instruct us otherwise. If you prefer not to have these documents householded, please call us at (800)632-2301. At any time you may view current prospectuses/summary prospectuses and financial reports on our website. If you choose, you may receive these documents through electronic delivery.
42 | Annual Report | franklintempleton.com | ||
This page intentionally left blank.
This page intentionally left blank.
Authorized for distribution only when accompanied or preceded by a summary prospectus and/or prospectus. Investors should carefully consider a fund’s investment goals, risks, charges and expenses before investing. A prospectus contains this and other information; please read it carefully before investing.
To help ensure we provide you with quality service, all calls to and from our service areas are monitored and/or recorded.
 | Annual Report and Shareholder Letter | |||||||
| Franklin Mutual Financial Services Fund | ||||||||
Investment Manager Franklin Mutual Advisers, LLC |
Distributor Franklin Templeton Distributors, Inc. (800) DIAL BEN®/342-5236 franklintempleton.com |
Shareholder Services (800)632-2301 - (Class A, C & R6) (800)448-FUND - (Class Z) | ||||||
© 2020 Franklin Templeton Investments. All rights reserved. | 479 A 02/20 |
Sign up for electronic delivery at franklintempleton.com/edelivery
Internet Delivery of Fund Reports Unless You Request Paper Copies: Effective January 1, 2021, as permitted by the SEC, paper copies of the Fund’s shareholder reports will no longer be sent by mail, unless you specifically request them from the Fund or your financial intermediary. Instead, the reports will be made available on a website, and you will be notified by mail each time a report is posted and provided with a website link to access the report.
If you already elected to receive shareholder reports electronically, you will not be affected by this change and you need not take any action. If you have not signed up for electronic delivery, we would encourage you to join fellow shareholders who have. You may elect to receive shareholder reports and other communications electronically from the Fund by calling (800) 632-2301 or by contacting your financial intermediary.
You may elect to continue to receive paper copies of all your future shareholder reports free of charge by contacting your financial intermediary or, if you invest directly with a Fund, calling (800) 632-2301 to let the Fund know of your request. Your election to receive reports in paper will apply to all funds held in your account.
FRANKLIN TEMPLETON
Successful investing begins with ambition. And achievement only comes when you reach for it. That’s why we continually strive to deliver better outcomes for investors. No matter what your goals are, our deep, global investment expertise allows us to offer solutions that can help.
During our more than 70 years of experience, we’ve managed through all kinds of markets—up, down and those in between. We’re always preparing for what may come next. It’s because of this, combined with our strength as one of the world’s largest asset managers that we’ve earned the trust of millions of investors around the world.
Dear Franklin Mutual International Fund Shareholder:
As we enter 2020, the factors that lifted stocks to record highs in 2019—accommodative central bank monetary policies and progress on a proposed trade deal between the U.S. and China—continue to be sources of optimism for growth. The near-term threat of recession has eased, with the U.S. economy showing resilience as low unemployment and moderately rising wages have encouraged consumer spending, which has supported the expansion. In contrast, business investment and exports were weak in 2019, but there are nascent signs of increasing industrial activity.
Tariffs, trade battles and geopolitical conflict may continue to dominate headlines in 2020 and account for a disproportionate source of market volatility. The U.S. and China agreed in principle to a phase-one trade agreement in late 2019. However, a re-escalation of the tariff dispute between the world’s two largest economies is not out of the question, as negotiations on a phase-two trade agreement are scheduled to start after the anticipated phase-one signing ceremony in January. There was clarity on Brexit as British voters delivered a resounding election victory to Prime Minister Boris Johnson and his Conservative Party, which should pave the way for a conclusive exit agreement. The terms of U.K. departure, however, must still be finalized. Late in the period, tensions in the Middle East were on the rise, following the death of an American contractor in Iraq in late December and a retaliatory U.S. military strike two days later.
During the period, we took advantage of market turbulence to seek out a larger number of stocks whose risk/reward profiles turned more favorable. Subsequently, we used the market appreciation to exit from or trim select positions that reached or exceeded our estimates of intrinsic value. Market volatility continues to present occasional opportunities in
individual stocks, and in certain sectors, notably those considered to be economically sensitive. We continue to focus on situations in which company-specific actions are more important than economic improvement in driving shareholder value.
Valuation is an essential factor in our analysis, and we always ask ourselves if current and potential investments represent an attractive balance of risk and reward. Amid the all-time highs reached by the Standard & Poor’s® 500 Index (S&P 500®) during the period, we maintained our focus on individual securities and the prospects for each business in the context of its valuation and the backdrop of potential political and economic risks.
We continue to adhere to a bottom-up stock selection process that is disciplined, driven by rigorous fundamental analysis, and that attempts to limit downside risk. In our view, actively investing in underappreciated and misunderstood companies with identifiable catalysts for unlocking shareholder value can offer meaningful upside potential and a degree of downside protection in periods of financial market turbulence.
We recognize the important role of financial advisors in today’s markets and encourage investors to continue to seek their advice. Amid changing markets and economic conditions, we are confident investors with a well-diversified portfolio and a patient, long-term outlook will be well positioned for the years ahead.
On the following pages, the Fund’s portfolio management team reviews investment decisions that pertain to performance during the past 12 months considering the
| Not FDIC Insured | May Lose Value | No Bank Guarantee |
| franklintempleton.com | Not part of the annual report | 1 | ||
economic environment and other factors. Please remember all securities markets fluctuate, as do mutual fund share prices.
The reorganization of Franklin Mutual International Fund into Franklin Mutual Global Discovery Fund, as approved by shareholders, was completed on February 21, 2020. Shares of Franklin Mutual International Fund share classes A, C, R, R6 and Z were exchanged for shares in Franklin Mutual Global Discovery Fund share classes A, C, R, R6 and Z, respectively.
We thank you for investing with Franklin Templeton, welcome your questions and comments, and look forward to continuing to serve your investment needs in the years ahead. We appreciate your trust and participation in Franklin Mutual International Fund. It has been our privilege to serve you.
Sincerely,

Peter A. Langerman
Chairman, President and Chief Executive Officer
Franklin Mutual Advisers, LLC
This letter reflects our analysis and opinions as of December 31, 2019, unless otherwise indicated. The information is not a complete analysis of every aspect of any market, country, industry, security or fund. Statements of fact are from sources considered reliable.
| ||
| 3 | ||
| 8 | ||
| 11 | ||
| 12 | ||
| 21 | ||
| 25 | ||
| 36 | ||
| 37 | ||
| 38 | ||
| 43 | ||
| ||
| Visitfranklintempleton.comfor fund updates, to access your account, or to find helpful financial planning tools. | ||
2 | Not part of the annual report | franklintempleton.com | ||
Franklin Mutual International Fund
This annual report for Franklin Mutual International Fund covers the fiscal year ended December 31, 2019. The reorganization of Franklin Mutual International Fund into Franklin Mutual Global Discovery Fund, as approved by shareholders, was completed on February 21, 2020. Shares of Franklin Mutual International Fund share classes A, C, R, R6 and Z were exchanged for shares in Franklin Mutual Global Discovery Fund share classes A, C, R, R6 and Z, respectively.
Your Fund’s Goal and Main Investments
The Fund seeks capital appreciation, which may occasionally be short term, with income as a secondary goal. Under normal market conditions, the Fund invests at least 80% of its net assets in securities of non-U.S. issuers, primarily Asian and European companies. We focus the Fund’s investments on securities believed to be available at market prices less than their intrinsic value. The Fund invests primarily in equity securities, mainly common stocks, with a current focus on mid- and large-cap companies. To a lesser extent, the Fund also invests in merger arbitrage securities and the debt and equity of distressed companies. The Geographic Composition bar chart on page 4 lists the leading countries where the Fund invests.
Performance Overview
The Fund’s Class Z shares posted a +14.78% cumulative total return for the 12 months ended December 31, 2019. In comparison, the Fund’s benchmark, the MSCI All Country World Index (ACWI) ex USA Index-NR (Local Currency), which is a free float-adjusted, market capitalization-weighted index designed to measure equity market performance in global developed and emerging markets, posted a +20.75% total return.1 Also for comparison, the Fund’s secondary benchmark, the MSCI ACWI ex USA Index-NR (USD) posted a +21.51% total return.1 You can find more of the Fund’s performance data in the Performance Summary beginning on page 8.
Performance data represent past performance, which does not guarantee future results. Investment return and principal value will fluctuate, and you may have a gain or loss when you sell your shares. Current performance may differ from figures shown. For most recent month-end performance, go tofranklintempleton.com or call(800) 342-5236.
Economic and Market Overview
Global developed and emerging market stocks, as measured by the MSCI All Country World Index (USD), posted a +27.30% total return during the 12 months ended December 31, 2019.1 Although global economic growth slowed from 2018, interest-rate cuts from many central banks and the easing of trade tensions near period-end contributed to the generally positive environment for equities worldwide. Reflecting investor optimism and slowing but resilient economic growth, stocks advanced in every major region of the globe.
In the U.S., solid economic growth also supported equities, as healthy consumer spending and a strong labor market kept the economy afloat. The unemployment rate fell during the year, reaching 3.5% in September, November and December 2019, the lowest recorded unemployment rate in 50 years.2 Wages also grew, albeit at a moderate pace, and inflation remained persistently low. In addition, deficit spending by the U.S. government boosted current growth at the expense of long-term debt. Despite the strength in the consumer sector, some parts of the economy struggled, particularly heavy industry. Annual industrial production contracted late in the reporting period, manufacturing output stalled and capital spending declined.
The U.S. Federal Reserve (Fed) provided a substantial boost to equity markets early in the reporting period as it shifted to a more accommodative monetary policy. In January 2019, the Fed signaled the end of its tightening cycle and cut the federal funds rate three times thereafter, lowering it to a range of 1.50%–1.75%. Stocks responded positively to the interest-rate cuts and gained further in December 2019 after the Fed indicated it would likely leave interest rates unchanged in 2020.
1. Source: Morningstar.
The index is unmanaged and includes reinvestment of any income or distributions. It does not reflect any fees, expenses or sales charges. One cannot invest directly in an index, and an index is not representative of the Fund’s portfolio. Net Returns (NR) include income net of tax withholding when dividends are paid.
2. Source: U.S. Bureau of Labor Statistics.
The dollar value, number of shares or principal amount, and names of all portfolio holdings are listed in the Fund’s Statement of Investments (SOI). The SOI begins on page 17.
| franklintempleton.com | Annual Report | 3 | ||
FRANKLIN MUTUAL INTERNATIONAL FUND
Growth slowed overall in the eurozone, particularly in Germany and Italy. Germany, which is heavily reliant on exports, was adversely affected by the trade conflict between the U.S. and China and the resulting slowdown in global trade. In Italy, political uncertainty and budget concerns caused the country’s annual gross domestic product (GDP) growth to stall in 2019’s first quarter before modestly improving in the second and third quarters. Despite sluggish economic conditions, European developed market equities, as measured by the MSCI Europe Index-NR (Local Currency), posted a +23.75% total return for the 12-month period, as easing trade tensions buoyed investor optimism and an electoral victory by the Conservative Party in the U.K. alleviated uncertainty surrounding Brexit.1 Although the European Central Bank left its headline refinancing rate unchanged, it lowered the deposit rate and restarted its bond-buying stimulus program, further supporting stocks.
Economic growth in Asia was relatively solid overall, despite slowdowns in several large emerging market countries, such as China and India. Japan’s economy grew amid the Bank of Japan’s sizable stimulus program. The trade war between the U.S. and China provided the backdrop for Asian stocks, which rose and fell in sync with investor sentiment regarding a trade deal. A phase one trade agreement between the two countries reached in December 2019 propelled Asian developed and emerging market stocks, which ultimately ended with a +19.23% total return over the 12-month period, as measured by the MSCI All Country Asia Index (USD).3
Emerging market stocks overall experienced several sharp selloffs and subsequent rebounds throughout the reporting period before ending with gains. In aggregate, economic growth slowed somewhat from 2018 but remained solid, although there was some variation among individual countries. Many central banks in emerging markets cut interest rates throughout the reporting period, which, along with resilient GDP growth, provided a supportive environment for equities. Russian stocks posted the highest returns among emerging markets as the threat of further sanctions receded and a solid fiscal environment reassured investors. Overall, global emerging markets, as measured by the MSCI Emerging Markets Index (USD), posted a +18.90% total return for the 12-month period.1
Investment Strategy
At Franklin Mutual Series, we are committed to our distinctive value approach to investing, which we believe can generate
Geographic Composition*
Based on Total Net Assets as of 12/31/19
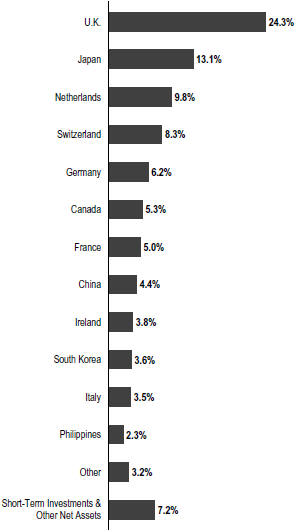
*Figures are stated as a percentage of total and may not equal 100% or may be negative due to rounding, use of any derivatives, unsettled trades or other factors.
above-average risk-adjusted returns over time for our shareholders. Our major investment strategy is investing in undervalued stocks in Asia and Europe. We have the ability to invest in emerging markets, although this is unlikely to be a significant focus of our strategy. When selecting undervalued equities, we are attracted to what we believe are fundamentally strong companies with healthy balance sheets, high-quality assets, substantial free cash flow and shareholder-oriented management teams and whose stocks are trading at discounts to our assessment of the
3. Source: MSCI.
See www.franklintempletondatasources.com for additional data provider information.
4 | Annual Report | franklintempleton.com | ||
FRANKLIN MUTUAL INTERNATIONAL FUND
companies’ intrinsic or business value. We also look for asset-rich companies whose shares may be trading at depressed levels due to concerns over short-term earnings disappointments, litigation, management strategy or other perceived negatives. This strict value approach is not only intended to improve the likelihood of capital appreciation, but also reduces the risk of substantial declines, in our opinion. While the vast majority of our undervalued equity investments are made in publicly traded companies internationally, we may invest occasionally in privately held companies as well.
To a significantly lesser extent, we complement this more traditional investment strategy with two others. One is distressed investing, a highly specialized field that has proven quite profitable during certain periods over the years. Distressed investing is complex and can take many forms. The most common distressed investment the Fund undertakes is the purchase of financially troubled or bankrupt companies’ debt at a substantial discount to face value. After the financially distressed company is reorganized, the old debt is typically replaced with new securities issued by the financially stronger company.
The other piece of our investment strategy is participating in arbitrage situations, another highly specialized field. When companies announce proposed mergers or takeovers, commonly referred to as deals, the target company may trade at a discount to the bid it ultimately accepts. One form of arbitrage involves purchasing the target company’s stock when it is trading below the value we believe it would receive in a deal. In keeping with our commitment to a relatively conservative investment approach, we typically focus our arbitrage efforts on announced deals, and avoid rumored deals or other situations we consider relatively risky. In addition, it is our practice to hedge the Fund’s currency exposure when we deem it advantageous for our shareholders.
What is meant by“hedge”?
To hedge an investment is to take a position intended to offset potential losses that may be incurred by a companion financial instrument. Hedging an investment may also offset potential gains.
|
Manager’s Discussion
The end of a decade is a natural time for reflection about the years that have just passed and to look ahead to what the next 10 might have in store. Across Wall Street, we see many prognostications, and while we are not in the forecasting business, we do allow ourselves to think about
Top 10 Sectors/Industries
Based on Equity Securities as of 12/31/19
| % of Total Net Assets | ||||
Insurance | 16.5% | |||
Oil, Gas & Consumable Fuels | 16.1% | |||
Banks | 11.3% | |||
Pharmaceuticals | 6.2% | |||
Hotels, Restaurants & Leisure | 3.7% | |||
Capital Markets | 3.7% | |||
Technology Hardware, Storage & Peripherals | 3.6% | |||
Tobacco | 3.4% | |||
Semiconductors & Semiconductor Equipment | 3.2% | |||
Chemicals | 2.6% | |||
investment opportunities over such an extended time period. But experience has taught us that while trying to predict the exact course of markets and/or economic and political events that will drive them may be fun, it is not all that useful.
As 2010 began, the global economy was still recovering from the Global Financial Crisis. The U.S. government owned significant portions of the banking and automotive sectors. The Fed had already started quantitative easing (QE), with QE 2 and QE 3 still to come. In Europe, concerns about Greece’s finances were emerging, and in China the effects of 2009’s massive stimulus programs were starting to take hold.
Over the subsequent years we saw ongoing, global QE, culminating in trillions of dollars of debt yielding negative interest rates. The European Union (EU) was in continuous upheaval, with Greece threatening to leave, but eventually staying in the eurozone; the U.K. pursuing and achieving Brexit; and ongoing strain between core members Germany, France, Italy and Spain. In the U.S., average annual economic growth was restrained and finished the decade below 2%, trailing the minimum 3% expectation of prior decades. Strong corporate profits and lower corporate tax rates were bright spots.
Equity markets delivered a very good decade—one of the best in history—with the MSCI ACWI ex-USA Index-NR (Local Currency) posting an average annual total return of +6.89%.1 During the decade, Franklin Mutual International Fund, Class Z posted an average annual total return of +4.59%, a solid absolute return that nonetheless lagged its benchmark above. The Fund’s value strategy, which seeks to identify mispriced securities and limit downside risk, was out of favor in an environment that generally encouraged investors to assume more risk. However, the Fund launched
| franklintempleton.com | Annual Report | 5 | ||
FRANKLIN MUTUAL INTERNATIONAL FUND
on May 1, 2009, and through the end of 2009, its Class Z shares posted a cumulative total return of +28.27%, compared with +27.41% for the MSCI ACWI ex-USA Index-NR (Local Currency).1
In our view, going forward we expect more political and monetary uncertainty and economic growth in unexpected places. Corporate profits will have good years and bad years. Some industries will be massively disrupted, while others will find a way to adjust and prosper, even within the context of artificial intelligence and machine learning. Recent events, such as the coronavirus outbreak, have caused, and may continue to cause, uncertainty and volatility in the Chinese economy, potentially leading to vulnerability in 2020 global growth expectations. As for investment positioning, we intend to avoid forecasts that would lead us to make the Fund’s success dependent on a specific set of outcomes. Rather, we will seek to continue with our time-tested value process and complement it with new tools that enhance our security evaluation and selection process. To that end, we have integrated risk and quantitative portfolio analysis tools that provide us with fresh insights about performance, and help us identify companies and securities that we believe satisfy our investors’ goals of risk-adjusted returns that are not wholly dependent on any one economic or political scenario.
Fund Performance
Turning to Fund performance, top positive contributors included Samsung Electronics, Renesas Electronics and Novartis. These companies are listed among the Fund’s largest positions in the Top 10 Equity Holdings table on this page.
The stock price of electronics and computer peripherals manufacturer Samsung Electronics rose based on improved investor sentiment that the market for semiconductor chips was approaching a bottom, and that prices may begin rising in 2020. A glut in the market for dynamic random access memory (DRAM) chips has weighed on the company, the world’s largest manufacturer of DRAMs.
Similarly, shares of Japanese semiconductor company Renesas Electronics rallied as the broader semiconductor industry bounced back, beginning in mid-summer 2019. The stock had been under pressure due to weakness in the company’s end-markets, such as automobiles.
The market responded positively to Novartis’ announcement of the official process and dates for its tax-free spinoff of Alcon, its eye care device and consumer products business. In addition, the Switzerland-based drug maker made good
Top 10 Equity Holdings
12/31/19
Company Sector/Industry, Country | % of Total Net Assets | |||
Samsung Electronics Co. Ltd. Technology Hardware, Storage & Peripherals, | 3.6% | |||
British American Tobacco PLC Tobacco, U.K. | 3.4% | |||
NN Group NV Insurance, Netherlands | 3.3% | |||
GlaxoSmithKline PLC Pharmaceuticals, U.K. | 3.3% | |||
RSA Insurance Group PLC Insurance, U.K. | 3.2% | |||
JXTG Holdings Inc. Oil, Gas & Consumable Fuels, Japan | 3.2% | |||
Renesas Electronics Corp. Semiconductors & Semiconductor Equipment, Japan | 3.2% | |||
BP PLC Oil, Gas & Consumable Fuels, U.K. | 3.1% | |||
ING Groep NV Banks, Netherlands | 3.0% | |||
Novartis AG Pharmaceuticals, Switzerland | 3.0% | |||
progress on its pipeline and delivered solid operational results. The company’s share price pulled back later in the period due to concerns about pharmaceutical drug pricing and fallout from a subsidiary’s data manipulation regarding gene therapy Zolgensma. Zolgensma remains on the market, although the U.S. Food and Drug Administration was critical of the delay in informing them of the issue. We believe Novartis’ innovative product pipeline remains underappreciated and that the company’s management has room to further improve operating margins.
During the period under review, Fund investments that detracted from performance included Indiabulls Housing Finance (not held at period-end), Yes Bank (not held at period-end) and Baidu.
Shares of Indiabulls Housing Finance, an India-based consumer finance company, declined beginning in June following an unsubstantiated allegation of fraudulent loans, which the company vigorously disputed. After declining dramatically, the company’s stock price recovered modestly in late 2019 after India’s Ministry of Corporate Affairs filed an affidavit in the Delhi High Court stating that the five loans which were the subject of the false claim were repaid or are standard accounts.
6 | Annual Report | franklintempleton.com | ||
FRANKLIN MUTUAL INTERNATIONAL FUND
Shares of India-based Yes Bank slid after rating agencies downgraded the bonds of two financial services companies that the bank had exposure to. Additional price deterioration was attributable to an equity issuance that was very dilutive, and we liquidated our position ahead of this event. Yes Bank also posted a significant decline in profits, due to a material rise in provisions for loan losses. The company’s new chief executive officer has initiated a strategic initiative to focus more on retail and digital banking in an effort to turn the bank around after recent weakness.
Shares of China-based internet search firm Baidu slid after the company posted a 2019 first-quarter loss, attributable to a weaker Chinese economy and increased governmental regulation that hindered advertising sales growth. Earnings improved in subsequent quarters, but the overhang from the U.S.-China trade dispute hampered the stock price. Management continues to invest heavily in its video-streaming platform and other initiatives, such as artificial intelligence. We believe these investments may help Baidu further diversify its business into new growth markets.
During the period, the Fund held currency forwards and futures seeking to hedge most of the currency risk of the portfolio’s non-U.S. dollar investments. The hedges had a modestly positive overall impact on the Fund’s performance.
What is a currency forward?
A currency forward is a direct agreement between the Fund and a counterparty to buy or sell a foreign currency in exchange for another currency at a specific exchange rate on a future date.
|
What is a future?
A future is an agreement between the Fund and a counterparty made through a U.S. or foreign futures exchange to buy or sell an underlying instrument or asset at a specific price on a future date.
|
As fellow shareholders, we found recent relative performance disappointing, but it is not uncommon for our strategy to lag the equity markets at times. We remain committed to our disciplined, value investment approach as we seek to generate attractive, long-term, risk-adjusted returns for shareholders.
Thank you for your participation in Franklin Mutual International Fund. It has been our privilege to serve your investment needs.
 |
Andrew Sleeman, CFA Co-Portfolio Manager |
 |
Timothy Rankin, CFA Co-Portfolio Manager |

The foregoing information reflects our analysis, opinions and portfolio holdings as of December 31, 2019, the end of the reporting period. The way we implement our main investment strategies and the resulting portfolio holdings may change depending on factors such as market and economic conditions. These opinions may not be relied upon as investment advice or an offer for a particular security. The information is not a complete analysis of every aspect of any market, country, industry, security or the Fund. Statements of fact are from sources considered reliable, but the investment manager makes no representation or warranty as to their completeness or accuracy. Although historical performance is no guarantee of future results, these insights may help you understand our investment management philosophy.
CFA® is a trademark owned by CFA Institute.
| franklintempleton.com | Annual Report | 7 | ||
FRANKLIN MUTUAL INTERNATIONAL FUND
Performance Summary as of December 31, 2019
The performance table and graphs do not reflect any taxes that a shareholder would pay on Fund dividends, capital gain distributions, if any, or any realized gains on the sale of Fund shares. Total return reflects reinvestment of the Fund’s dividends and capital gain distributions, if any, and any unrealized gains or losses. Your dividend income will vary depending on dividends or interest paid by securities in the Fund’s portfolio, adjusted for operating expenses of each class. Capital gain distributions are net profits realized from the sale of portfolio securities.
Performance as of 12/31/191
Cumulative total return excludes sales charges. Average annual total return includes maximum sales charges. Sales charges will vary depending on the size of the investment and the class of share purchased. The maximum is 5.50% and the minimum is 0%.Class A:5.50% maximum initial sales charge. For other share classes, visitfranklintempleton.com.
| Share Class | Cumulative Total Return2 | Average Annual Total Return3 | ||||||
Z | ||||||||
1-Year | +14.78% | +14.78% | ||||||
5-Year | +11.68% | +2.23% | ||||||
10-Year | +56.68% | +4.59% | ||||||
A4 | ||||||||
1-Year | +14.49% | +8.22% | ||||||
5-Year | +10.20% | +0.81% | ||||||
10-Year | +52.34% | +3.71% | ||||||
Performance data represent past performance, which does not guarantee future results. Investment return and principal value will fluctuate, and you may have a gain or loss when you sell your shares. Current performance may differ from figures shown. For most recent month-end performance, go tofranklintempleton.comor call(800) 342-5236.
See page 10 for Performance Summary footnotes.
8 | Annual Report | franklintempleton.com | ||
FRANKLIN MUTUAL INTERNATIONAL FUND
PERFORMANCE SUMMARY
Total Return Index Comparison for a Hypothetical $10,000 Investment1
Total return represents the change in value of an investment over the periods shown. It includes any applicable maximum sales charge, Fund expenses, account fees and reinvested distributions. The unmanaged indexes include reinvestment of any income or distributions. They differ from the Fund in composition and do not pay management fees or expenses. One cannot invest directly in an index.
Class Z(5/1/09–12/31/19)
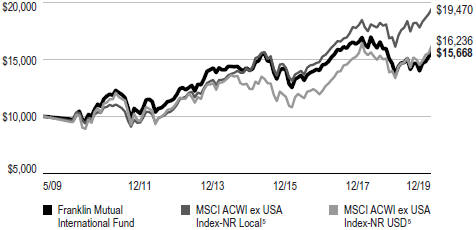
Class A(5/1/09–12/31/19)
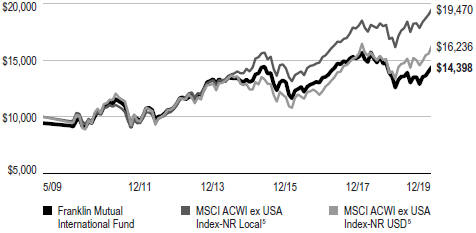
See page 10 for Performance Summary footnotes.
| franklintempleton.com | Annual Report | 9 | ||
FRANKLIN MUTUAL INTERNATIONAL FUND
PERFORMANCE SUMMARY
Distributions(1/1/19–12/31/19)
| Share Class | Net Investment Income | Long-Term Capital Gain | Total | |||||||||
Z | $0.4345 | $0.0346 | $0.4691 | |||||||||
A | $0.3997 | $0.0346 | $0.4343 | |||||||||
C | $0.2770 | $0.0346 | $0.3116 | |||||||||
R | $0.3561 | $0.0346 | $0.3907 | |||||||||
R6 | $0.4577 | $0.0346 | $0.4923 | |||||||||
Total Annual Operating Expenses6
|
| |||||||||||
| Share Class | With Fee Waiver | Without Fee Waiver | ||||||||||
Z | 0.97% | 1.21% | ||||||||||
A | 1.22% | 1.46% | ||||||||||
Each class of shares is available to certain eligible investors and has different annual fees and expenses, as described in the prospectus.
All investments involve risks, including possible loss of principal. Value securities may not increase in price as anticipated or may decline further in value. Special risks are associated with foreign investing, including currency fluctuations, economic instability and political developments; investments in emerging markets involve heightened risks related to the same factors. Because the Fund may invest its assets in companies in a specific region, including Europe, it is subject to greater risks of adverse developments in that region and/or the surrounding regions than a fund that is more broadly diversified geographically. Current political and financial uncertainty surrounding the European Union may increase market volatility and the economic risk of investing in companies in Europe. Smaller and midsize company stocks have exhibited greater price volatility than larger-company stocks, particularly over the short term. The Fund’s investments in companies engaged in mergers, reorganizations or liquidations also involve special risks as pending deals may not be completed on time or on favorable terms. The Fund may invest in lower-rated bonds, which entail higher credit risk. The Fund’s prospectus also includes a description of the main investment risks.
1. The Fund has an expense reduction contractually guaranteed through 4/30/20. Fund investment results reflect the expense reduction; without this reduction, the results would have been lower.
2. Cumulative total return represents the change in value of an investment over the periods indicated.
3. Average annual total return represents the average annual change in value of an investment over the periods indicated. Return for less than one year, if any, has not been annualized.
4. Prior to 9/10/18, these shares were offered at a higher initial sales charge of 5.75%, thus actual returns (with sales charges) would have differed. Average annual total returns (with sales charges) have been restated to reflect the current maximum initial sales charge of 5.50%.
5. Source: Morningstar. the MSCI ACWI ex USA Index-NR (Local Currency and USD) is a free float-adjusted, market capitalization-weighted index designed to measure equity market performance in global developed and emerging markets. The NR or Net Dividends Index reflects the deduction of withholding taxes on reinvested dividends.
6. Figures are as stated in the Fund’s current prospectus and may differ from the expense ratios disclosed in the Your Fund’s Expenses and Financial Highlights sections in this report. In periods of market volatility, assets may decline significantly, causing total annual Fund operating expenses to become higher than the figures shown.
See www.franklintempletondatasources.com for additional data provider information.
10 | Annual Report | franklintempleton.com | ||
FRANKLIN MUTUAL INTERNATIONAL FUND
As a Fund shareholder, you can incur two types of costs: (1) transaction costs, including sales charges (loads) on Fund purchases and redemptions; and (2) ongoing Fund costs, including management fees, distribution and service (12b-1) fees, and other Fund expenses. All mutual funds have ongoing costs, sometimes referred to as operating expenses. The table below shows ongoing costs of investing in the Fund and can help you understand these costs and compare them with those of other mutual funds. The table assumes a $1,000 investment held for the six months indicated.
Actual Fund Expenses
The table below provides information about actual account values and actual expenses in the columns under the heading “Actual.” In these columns the Fund’s actual return, which includes the effect of Fund expenses, is used to calculate the “Ending Account Value” for each class of shares. You can estimate the expenses you paid during the period by following these steps (of course, your account value and expenses will differ from those in this illustration): Divide your account value by $1,000 (if your account had an $8,600 value, then $8,600 ÷ $1,000 = 8.6). Then multiply the result by the number in the row for your class of shares under the headings “Actual” and “Expenses Paid During Period” (if Actual Expenses Paid During Period were $7.50, then 8.6 x $7.50 = $64.50). In this illustration, the actual expenses paid this period are $64.50.
Hypothetical Example for Comparison with Other Funds
Under the heading “Hypothetical” in the table, information is provided about hypothetical account values and hypothetical expenses based on the Fund’s actual expense ratio and an assumed rate of return of 5% per year before expenses, which is not the Fund’s actual return. This information may not be used to estimate the actual ending account balance or expenses you paid for the period, but it can help you compare ongoing costs of investing in the Fund with those of other funds. To do so, compare this 5% hypothetical example for the class of shares you hold with the 5% hypothetical examples that appear in the shareholder reports of other funds.
Please note that expenses shown in the table are meant to highlight ongoing costs and do not reflect any transactional costs. Therefore, information under the heading “Hypothetical” is useful in comparing ongoing costs only, and will not help you compare total costs of owning different funds. In addition, if transactional costs were included, your total costs would have been higher.
| Actual (actual return after expenses) | Hypothetical (5% annual return before expenses) | |||||||||||
Share Class | Beginning Account Value 7/1/19 | Ending Account Value 12/31/19 | Expenses Paid During Period 7/1/19–12/31/191, 2 | Ending Account Value 12/31/19 | Expenses Paid During Period 7/1/19–12/31/191, 2 | Net Annualized Expense Ratio2 | ||||||
|
|
|
| |||||||||
| Z | $1,000 | $1,069.40 | $ 5.06 | $1,020.32 | $4.94 | 0.97% | ||||||
| A | $1,000 | $1,068.00 | $ 6.36 | $1,019.06 | $6.21 | 1.22% | ||||||
| C | $1,000 | $1,063.30 | $10.19 | $1,015.32 | $9.96 | 1.96% | ||||||
| R | $1,000 | $1,066.00 | $ 7.65 | $1,017.80 | $7.48 | 1.47% | ||||||
| R6 | $1,000 | $1,069.60 | $ 4.23 | $1,021.12 | $4.13 | 0.81% | ||||||
1. Expenses are equal to the annualized expense ratio for the six-month period as indicated above—in the far right column—multiplied by the simple average account value over the period indicated, and then multiplied by 184/365 to reflect the one-half year period.
2. Reflects expenses after fee waivers and expense reimbursements.
| franklintempleton.com | Annual Report | 11 | ||
FRANKLIN MUTUAL SERIES FUNDS
Franklin Mutual International Fund
| Year Ended December 31, | ||||||||||||||||||||
| 2019 | 2018 | 2017 | 2016 | 2015 | ||||||||||||||||
Class Z | ||||||||||||||||||||
Per share operating performance (for a share outstanding throughout the year) | ||||||||||||||||||||
Net asset value, beginning of year | $12.82 | $15.96 | $14.32 | $14.17 | $14.59 | |||||||||||||||
Income from investment operationsa: | ||||||||||||||||||||
Net investment incomeb | 0.37 | 0.31 | 0.21 | 0.27 | c | 0.18 | d | |||||||||||||
Net realized and unrealized gains (losses) | 1.51 | (3.11 | ) | 1.78 | 0.20 | (0.17 | ) | |||||||||||||
Total from investment operations | 1.88 | (2.80 | ) | 1.99 | 0.47 | 0.01 | ||||||||||||||
Less distributions from: | ||||||||||||||||||||
Net investment income | (0.43 | ) | (0.25 | ) | (0.35 | ) | (0.27 | ) | (0.16 | ) | ||||||||||
Net realized gains | (0.03 | ) | (0.09 | ) | — | (0.05 | ) | (0.27 | ) | |||||||||||
Total distributions | (0.46 | ) | (0.34 | ) | (0.35 | ) | (0.32 | ) | (0.43 | ) | ||||||||||
Net asset value, end of year | $14.24 | $12.82 | $15.96 | $14.32 | $14.17 | |||||||||||||||
Total return | 14.78% | (17.52)% | 13.99% | 3.34% | 0.15% | |||||||||||||||
Ratios to average net assets | ||||||||||||||||||||
Expenses before waiver and payments by affiliates | 1.31% | 1.21% | 1.17% | 1.22% | 1.24% | |||||||||||||||
Expenses net of waiver and payments by affiliatese | 0.97% | 0.99% | 1.16% | 1.17% | 1.15% | |||||||||||||||
Net investment income | 2.70% | 2.00% | 1.41% | 2.07% | c | 1.26% | d | |||||||||||||
Supplemental data | ||||||||||||||||||||
Net assets, end of year (000’s) | $37,986 | $52,271 | $86,274 | $40,875 | $49,963 | |||||||||||||||
Portfolio turnover rate | 10.66% | 28.75% | 38.77% | 24.87% | 28.64% | |||||||||||||||
aThe amount shown for a share outstanding throughout the period may not correlate with the Statement of Operations for the period due to the timing of sales and repurchases of the Fund’s shares in relation to income earned and/or fluctuating fair value of the investments of the Fund.
bBased on average daily shares outstanding.
cNet investment income per share includes approximately $0.06 per share related to income received in the form of special dividends in connection with certain Fund holdings. Excluding this amount, the ratio of net investment income to average net assets would have been 1.63%.
dNet investment income per share includes approximately $0.08 per share related to income received in the form of special dividends in connection with certain Fund holdings. Excluding this amount, the ratio of net investment income to average net assets would have been 0.71%.
eBenefit of expense reduction rounds to less than 0.01%.
12 | Annual Report | The accompanying notes are an integral part of these financial statements. | franklintempleton.com | ||
FRANKLIN MUTUAL SERIES FUNDS
FINANCIAL HIGHLIGHTS
Franklin Mutual International Fund(continued)
| Year Ended December 31, | ||||||||||||||||||||
| 2019 | 2018 | 2017 | 2016 | 2015 | ||||||||||||||||
Class A | ||||||||||||||||||||
Per share operating performance (for a share outstanding throughout the year) | ||||||||||||||||||||
Net asset value, beginning of year | $12.77 | $15.90 | $14.25 | $14.10 | $14.54 | |||||||||||||||
Income from investment operationsa: | ||||||||||||||||||||
Net investment incomeb | 0.33 | 0.27 | 0.18 | 0.24 | c | 0.15 | d | |||||||||||||
Net realized and unrealized gains (losses) | 1.51 | (3.10 | ) | 1.78 | 0.19 | (0.19 | ) | |||||||||||||
Total from investment operations | 1.84 | (2.83 | ) | 1.96 | 0.43 | (0.04 | ) | |||||||||||||
Less distributions from: | ||||||||||||||||||||
Net investment income | (0.40 | ) | (0.21 | ) | (0.31 | ) | (0.23 | ) | (0.13 | ) | ||||||||||
Net realized gains | (0.03 | ) | (0.09 | ) | — | (0.05 | ) | (0.27 | ) | |||||||||||
Total distributions | (0.43 | ) | (0.30 | ) | (0.31 | ) | (0.28 | ) | (0.40 | ) | ||||||||||
Net asset value, end of year | $14.18 | $12.77 | $15.90 | $14.25 | $14.10 | |||||||||||||||
Total returne | 14.49% | (17.73)% | 13.67% | 3.14% | (0.20)% | |||||||||||||||
Ratios to average net assets | ||||||||||||||||||||
Expenses before waiver and payments by affiliates | 1.56% | 1.46% | 1.42% | 1.47% | 1.52% | |||||||||||||||
Expenses net of waiver and payments by affiliatesf | 1.22% | 1.24% | 1.41% | 1.42% | 1.43% | |||||||||||||||
Net investment income | 2.45% | 1.75% | 1.16% | 1.82% | c | 0.98% | d | |||||||||||||
Supplemental data | ||||||||||||||||||||
Net assets, end of year (000’s) | $44,178 | $53,082 | $82,965 | $82,626 | $110,591 | |||||||||||||||
Portfolio turnover rate | 10.66% | 28.75% | 38.77% | 24.87% | 28.64% | |||||||||||||||
aThe amount shown for a share outstanding throughout the period may not correlate with the Statement of Operations for the period due to the timing of sales and repurchases of the Fund’s shares in relation to income earned and/or fluctuating fair value of the investments of the Fund.
bBased on average daily shares outstanding.
cNet investment income per share includes approximately $0.06 per share related to income received in the form of special dividends in connection with certain Fund holdings. Excluding this amount, the ratio of net investment income to average net assets would have been 1.38%.
dNet investment income per share includes approximately $0.08 per share related to income received in the form of special dividends in connection with certain Fund holdings. Excluding this amount, the ratio of net investment income to average net assets would have been 0.43%.
eTotal return does not reflect sales commissions or contingent deferred sales charges, if applicable.
fBenefit of expense reduction rounds to less than 0.01%.
| franklintempleton.com | The accompanying notes are an integral part of these financial statements. | Annual Report | 13 | ||
FRANKLIN MUTUAL SERIES FUNDS
FINANCIAL HIGHLIGHTS
Franklin Mutual International Fund(continued)
| Year Ended December 31, | ||||||||||||||||||
| 2019 | 2018 | 2017 | 2016 | 2015 | ||||||||||||||
Class C | ||||||||||||||||||
Per share operating performance (for a share outstanding throughout the year) | ||||||||||||||||||
Net asset value, beginning of year | $12.68 | $15.69 | $14.08 | $13.92 | $14.38 | |||||||||||||
Income from investment operationsa: | ||||||||||||||||||
Net investment incomeb | 0.22 | 0.16 | 0.08 | 0.15 | c | 0.04d | ||||||||||||
Net realized and unrealized gains (losses) | 1.51 | (3.04 | ) | 1.72 | 0.18 | (0.18) | ||||||||||||
Total from investment operations | 1.73 | (2.88 | ) | 1.80 | 0.33 | (0.14) | ||||||||||||
Less distributions from: | ||||||||||||||||||
Net investment income | (0.28 | ) | (0.04 | ) | (0.19 | ) | (0.12 | ) | (0.05) | |||||||||
Net realized gains | (0.03 | ) | (0.09 | ) | — | (0.05 | ) | (0.27) | ||||||||||
Total distributions | (0.31 | ) | (0.13 | ) | (0.19 | ) | (0.17 | ) | (0.32) | |||||||||
Net asset value, end of year | $14.10 | $12.68 | $15.69 | $14.08 | $13.92 | |||||||||||||
Total returne | 13.62% | (18.39)% | 12.79% | 2.44% | (0.93)% | |||||||||||||
Ratios to average net assets | ||||||||||||||||||
Expenses before waiver and payments by affiliates | 2.30% | 2.21% | 2.17% | 2.22% | 2.24% | |||||||||||||
Expenses net of waiver and payments by affiliatesf | 1.96% | 1.99% | 2.16% | 2.17% | 2.15% | |||||||||||||
Net investment income | 1.71% | 1.00% | 0.41% | 1.07% | c | 0.26%d | ||||||||||||
Supplemental data | ||||||||||||||||||
Net assets, end of year (000’s) | $11,074 | $13,685 | $29,109 | $25,860 | $34,611 | |||||||||||||
Portfolio turnover rate | 10.66% | 28.75% | 38.77% | 24.87% | 28.64% | |||||||||||||
aThe amount shown for a share outstanding throughout the period may not correlate with the Statement of Operations for the period due to the timing of sales and repurchases of the Fund’s shares in relation to income earned and/or fluctuating fair value of the investments of the Fund.
bBased on average daily shares outstanding.
cNet investment income per share includes approximately $0.06 per share related to income received in the form of special dividends in connection with certain Fund holdings. Excluding this amount, the ratio of net investment income to average net assets would have been 0.63%.
dNet investment income per share includes approximately $0.08 per share related to income received in the form of special dividends in connection with certain Fund holdings. Excluding this amount, the ratio of net investment income to average net assets would have been (0.29)%.
eTotal return does not reflect sales commissions or contingent deferred sales charges, if applicable.
fBenefit of expense reduction rounds to less than 0.01%.
14 | Annual Report | The accompanying notes are an integral part of these financial statements. | franklintempleton.com | ||
FRANKLIN MUTUAL SERIES FUNDS
FINANCIAL HIGHLIGHTS
Franklin Mutual International Fund(continued)
| Year Ended December 31, | ||||||||||||||||||
| 2019 | 2018 | 2017 | 2016 | 2015 | ||||||||||||||
Class R | ||||||||||||||||||
Per share operating performance (for a share outstanding throughout the year) | ||||||||||||||||||
Net asset value, beginning of year | $12.69 | $15.80 | $14.19 | $14.05 | $14.51 | |||||||||||||
Income from investment operationsa: | ||||||||||||||||||
Net investment incomeb | 0.30 | 0.23 | 0.10 | 0.20 | c | 0.04d | ||||||||||||
Net realized and unrealized gains (losses) | 1.49 | (3.07 | ) | 1.80 | 0.20 | (0.10) | ||||||||||||
Total from investment operations | 1.79 | (2.84 | ) | 1.90 | 0.40 | (0.06) | ||||||||||||
Less distributions from: | ||||||||||||||||||
Net investment income | (0.36 | ) | (0.18 | ) | (0.29 | ) | (0.21 | ) | (0.13) | |||||||||
Net realized gains | (0.03 | ) | (0.09 | ) | — | (0.05 | ) | (0.27) | ||||||||||
Total distributions | (0.39 | ) | (0.27 | ) | (0.29 | ) | (0.26 | ) | (0.40) | |||||||||
Net asset value, end of year | $14.09 | $12.69 | $15.80 | $14.19 | $14.05 | |||||||||||||
Total return | 14.16% | (17.96)% | 13.43% | 2.90% | (0.38)% | |||||||||||||
Ratios to average net assets | ||||||||||||||||||
Expenses before waiver and payments by affiliates | 1.81% | 1.71% | 1.64% | 1.72% | 1.74% | |||||||||||||
Expenses net of waiver and payments by affiliatese | 1.47% | 1.49% | 1.63% | 1.67% | 1.65% | |||||||||||||
Net investment income | 2.20% | 1.50% | 0.94% | 1.57% | c | 0.76%d | ||||||||||||
Supplemental data | ||||||||||||||||||
Net assets, end of year (000’s) | $1,452 | $1,673 | $1,867 | $694 | $662 | |||||||||||||
Portfolio turnover rate | 10.66% | 28.75% | 38.77% | 24.87% | 28.64% | |||||||||||||
aThe amount shown for a share outstanding throughout the period may not correlate with the Statement of Operations for the period due to the timing of sales and repurchases of the Fund’s shares in relation to income earned and/or fluctuating fair value of the investments of the Fund.
bBased on average daily shares outstanding.
cNet investment income per share includes approximately $0.06 per share related to income received in the form of special dividends in connection with certain Fund holdings. Excluding this amount, the ratio of net investment income to average net assets would have been 1.13%.
dNet investment income per share includes approximately $0.08 per share related to income received in the form of special dividends in connection with certain Fund holdings. Excluding this amount, the ratio of net investment income to average net assets would have been 0.21%.
eBenefit of expense reduction rounds to less than 0.01%.
| franklintempleton.com | The accompanying notes are an integral part of these financial statements. | Annual Report | 15 | ||
FRANKLIN MUTUAL SERIES FUNDS
FINANCIAL HIGHLIGHTS
Franklin Mutual International Fund(continued)
| Year Ended December 31, | ||||||||||||||||||
| 2019 | 2018 | 2017 | 2016 | 2015 | ||||||||||||||
Class R6 | ||||||||||||||||||
Per share operating performance (for a share outstanding throughout the year) | ||||||||||||||||||
Net asset value, beginning of year | $12.82 | $15.97 | $14.32 | $14.17 | $14.59 | |||||||||||||
Income from investment operationsa: | ||||||||||||||||||
Net investment incomeb | 0.45 | 0.33 | 0.24 | 0.33 | c | 0.22d | ||||||||||||
Net realized and unrealized gains (losses) | 1.45 | (3.11 | ) | 1.78 | 0.17 | (0.20) | ||||||||||||
Total from investment operations | 1.90 | (2.78 | ) | 2.02 | 0.50 | 0.02 | ||||||||||||
Less distributions from: | ||||||||||||||||||
Net investment income | (0.46 | ) | (0.28 | ) | (0.37 | ) | (0.30 | ) | (0.17) | |||||||||
Net realized gains | (0.03 | ) | (0.09 | ) | — | (0.05 | ) | (0.27) | ||||||||||
Total distributions | (0.49 | ) | (0.37 | ) | (0.37 | ) | (0.35 | ) | (0.44) | |||||||||
Net asset value, end of year | $14.23 | $12.82 | $15.97 | $14.32 | $14.17 | |||||||||||||
Total return | 14.89% | (17.40)% | 14.11% | 3.58% | 0.23% | |||||||||||||
Ratios to average net assets | ||||||||||||||||||
Expenses before waiver and payments by affiliates | 1.22% | 1.11% | 1.03% | 1.06% | 1.06% | |||||||||||||
Expenses net of waiver and payments by affiliatese | 0.81% | 0.85% | 1.01% | 1.00% | 1.02% | |||||||||||||
Net investment income | 2.86% | 2.14% | 1.56% | 2.24% | c | 1.39%d | ||||||||||||
Supplemental data | ||||||||||||||||||
Net assets, end of year (000’s) | $5,314 | $20,128 | $25,697 | $16,687 | $23,793 | |||||||||||||
Portfolio turnover rate | 10.66% | 28.75% | 38.77% | 24.87% | 28.64% | |||||||||||||
aThe amount shown for a share outstanding throughout the period may not correlate with the Statement of Operations for the period due to the timing of sales and repurchases of the Fund’s shares in relation to income earned and/or fluctuating fair value of the investments of the Fund.
bBased on average daily shares outstanding.
cNet investment income per share includes approximately $0.06 per share related to income received in the form of special dividends in connection with certain Fund holdings. Excluding this amount, the ratio of net investment income to average net assets would have been 1.80%.
dNet investment income per share includes approximately $0.08 per share related to income received in the form of special dividends in connection with certain Fund holdings. Excluding this amount, the ratio of net investment income to average net assets would have been 0.84%.
eBenefit of expense reduction rounds to less than 0.01%.
16 | Annual Report | The accompanying notes are an integral part of these financial statements. | franklintempleton.com | ||
FRANKLIN MUTUAL SERIES FUNDS
Statement of Investments, December 31, 2019
Franklin Mutual International Fund
| Country | Shares | Value | ||||||||||
Common Stocks 91.2% | ||||||||||||
Aerospace & Defense 1.7% | ||||||||||||
BAE Systems PLC | United Kingdom | 229,000 | $ | 1,713,033 | ||||||||
|
| |||||||||||
Auto Components 1.6% | ||||||||||||
Cie Generale des Etablissements Michelin SCA | France | 12,904 | 1,578,807 | |||||||||
|
| |||||||||||
Banks 11.3% | ||||||||||||
AIB Group PLC | Ireland | 516,975 | 1,800,740 | |||||||||
aCredito Valtellinese SpA | Italy | 25,464,429 | 2,033,264 | |||||||||
ING Groep NV | Netherlands | 252,834 | 3,030,483 | |||||||||
Shinsei Bank Ltd. | Japan | 162,827 | 2,509,641 | |||||||||
Standard Chartered PLC | United Kingdom | 198,100 | 1,869,149 | |||||||||
|
| |||||||||||
| 11,243,277 | ||||||||||||
|
| |||||||||||
Capital Markets 3.7% | ||||||||||||
Credit Suisse Group AG | Switzerland | 129,527 | 1,754,200 | |||||||||
Deutsche Bank AG | Germany | 254,188 | 1,971,754 | |||||||||
|
| |||||||||||
| 3,725,954 | ||||||||||||
|
| |||||||||||
Chemicals 2.6% | ||||||||||||
BASF SE | Germany | 34,111 | 2,576,392 | |||||||||
|
| |||||||||||
Construction Materials 1.9% | ||||||||||||
LafargeHolcim Ltd., B | Switzerland | 34,929 | 1,938,394 | |||||||||
|
| |||||||||||
Consumer Finance 0.8% | ||||||||||||
Sun Hung Kai & Co. Ltd. | Hong Kong | 1,735,748 | 826,409 | |||||||||
|
| |||||||||||
Diversified Financial Services 2.3% | ||||||||||||
Metro Pacific Investments Corp. | Philippines | 33,698,700 | 2,313,960 | |||||||||
|
| |||||||||||
Diversified Telecommunication Services 1.6% | ||||||||||||
Koninklijke KPN NV | Netherlands | 555,623 | 1,639,385 | |||||||||
|
| |||||||||||
Hotels, Restaurants & Leisure 3.7% | ||||||||||||
Accor SA | France | 44,182 | 2,068,625 | |||||||||
Sands China Ltd. | Macau | 312,200 | 1,668,715 | |||||||||
|
| |||||||||||
| 3,737,340 | ||||||||||||
|
| |||||||||||
Household Durables 2.0% | ||||||||||||
Cairn Homes PLC | Ireland | 1,397,177 | 1,980,516 | |||||||||
|
| |||||||||||
Insurance 16.5% | ||||||||||||
ASR Nederland NV | Netherlands | 51,344 | 1,920,860 | |||||||||
China Pacific Insurance Group Co. Ltd., H | China | 608,045 | 2,395,567 | |||||||||
Direct Line Insurance Group PLC | United Kingdom | 668,514 | 2,766,917 | |||||||||
NN Group NV | Netherlands | 86,936 | 3,297,260 | |||||||||
RSA Insurance Group PLC | United Kingdom | 425,931 | 3,190,687 | |||||||||
T&D Holdings Inc. | Japan | 225,033 | 2,888,622 | |||||||||
|
| |||||||||||
| 16,459,913 | ||||||||||||
|
| |||||||||||
Interactive Media & Services 2.0% | ||||||||||||
aBaidu Inc., ADR | China | 16,131 | 2,038,958 | |||||||||
|
| |||||||||||
| franklintempleton.com | Annual Report | 17 | ||
FRANKLIN MUTUAL SERIES FUNDS
STATEMENT OF INVESTMENTS
Franklin Mutual International Fund(continued)
| Country | Shares | Value | ||||||||||
Common Stocks(continued) | ||||||||||||
Oil, Gas & Consumable Fuels 16.1% | ||||||||||||
BP PLC | United Kingdom | 495,900 | $ | 3,097,444 | ||||||||
Caltex Australia Ltd. | Australia | 30,065 | 716,179 | |||||||||
Canadian Natural Resources Ltd. | Canada | 84,900 | 2,745,880 | |||||||||
Crescent Point Energy Corp. | Canada | 585,600 | 2,610,984 | |||||||||
JXTG Holdings Inc. | Japan | 693,300 | 3,176,389 | |||||||||
Royal Dutch Shell PLC, B | United Kingdom | 79,534 | 2,359,063 | |||||||||
Saras SpA | Italy | 877,091 | 1,410,502 | |||||||||
|
| |||||||||||
| 16,116,441 | ||||||||||||
|
| |||||||||||
Pharmaceuticals 6.2% | ||||||||||||
GlaxoSmithKline PLC | United Kingdom | 138,343 | 3,259,633 | |||||||||
Novartis AG | Switzerland | 31,288 | 2,971,495 | |||||||||
|
| |||||||||||
| 6,231,128 | ||||||||||||
|
| |||||||||||
Real Estate Management & Development 1.3% | ||||||||||||
Kenedix Inc. | Japan | 243,134 | 1,273,000 | |||||||||
|
| |||||||||||
Semiconductors & Semiconductor Equipment 3.2% | ||||||||||||
aRenesas Electronics Corp. | Japan | 459,862 | 3,173,651 | |||||||||
|
| |||||||||||
Specialty Retail 1.7% | ||||||||||||
Dufry AG | Switzerland | 17,401 | 1,726,703 | |||||||||
|
| |||||||||||
Technology Hardware, Storage & Peripherals 3.6% | ||||||||||||
Samsung Electronics Co. Ltd. | South Korea | 74,519 | 3,597,056 | |||||||||
|
| |||||||||||
Tobacco 3.4% | ||||||||||||
British American Tobacco PLC | United Kingdom | 78,471 | 3,358,527 | |||||||||
|
| |||||||||||
Trading Companies & Distributors 1.4% | ||||||||||||
Rexel SA | France | 101,939 | 1,354,114 | |||||||||
|
| |||||||||||
Wireless Telecommunication Services 2.6% | ||||||||||||
Vodafone Group PLC | United Kingdom | 1,324,860 | 2,575,214 | |||||||||
|
| |||||||||||
Total Common Stocks (Cost $97,237,877) | 91,178,172 | |||||||||||
|
| |||||||||||
Preferred Stocks (Cost $1,084,080) 1.6% | ||||||||||||
Automobiles 1.6% | ||||||||||||
bVolkswagen AG, 2.758%, pfd. | Germany | 8,416 | 1,663,375 | |||||||||
|
| |||||||||||
Total Investments before Short Term Investments | 92,841,547 | |||||||||||
|
| |||||||||||
18 | Annual Report | franklintempleton.com | ||
FRANKLIN MUTUAL SERIES FUNDS
STATEMENT OF INVESTMENTS
Franklin Mutual International Fund(continued)
| Country | Principal Amount | Value | ||||||||||
Short Term Investments 6.5% | ||||||||||||
U.S. Government and Agency Securities 6.5% | ||||||||||||
cFHLB, 1/02/20 | United States | $ | 5,600,000 | $ | 5,600,000 | |||||||
cU.S. Treasury Bill, 1/02/20 - 1/23/20 | United States | 900,000 | 899,573 | |||||||||
|
| |||||||||||
Total U.S. Government and Agency Securities | 6,499,573 | |||||||||||
|
| |||||||||||
Total Investments (Cost $104,821,056) 99.3% | 99,341,120 | |||||||||||
Other Assets, less Liabilities 0.7% | 663,526 | |||||||||||
|
| |||||||||||
Net Assets 100.0% | $ | 100,004,646 | ||||||||||
|
| |||||||||||
aNon-income producing.
bVariable rate security. The rate shown represents the yield at period end.
cThe security was issued on a discount basis with no stated coupon rate.
At December 31, 2019, the Fund had the following futures contracts outstanding. See Note 1(c).
Futures Contracts
| Description | Type | Number of Contracts | Notional Amount* | Expiration Date | Value/ Unrealized Appreciation (Depreciation) | |||||||||||||||
Currency Contracts | ||||||||||||||||||||
EUR/USD | Short | 118 | $16,640,950 | 3/16/20 | $(160,042 | ) | ||||||||||||||
GBP/USD | Short | 66 | 5,482,950 | 3/16/20 | (38,019 | ) | ||||||||||||||
|
| |||||||||||||||||||
Total Futures Contracts | $(198,061 | ) | ||||||||||||||||||
|
| |||||||||||||||||||
*As of period end.
| franklintempleton.com | Annual Report | 19 | ||
FRANKLIN MUTUAL SERIES FUNDS
STATEMENT OF INVESTMENTS
Franklin Mutual International Fund(continued)
At December 31, 2019, the Fund had the following forward exchange contracts outstanding. See Note 1(c).
Forward Exchange Contracts
| Currency | Counterpartya | Type | Quantity | Contract Amount | Settlement Date | Unrealized Appreciation | Unrealized Depreciation | |||||||||||||||||||||
OTC Forward Exchange Contracts | ||||||||||||||||||||||||||||
Swiss Franc | UBSW | Sell | 1,678,781 | $ | 1,708,648 | 1/13/20 | $ | — | $ | (27,900 | ) | |||||||||||||||||
Euro | BOFA | Buy | 594,410 | 657,404 | 1/15/20 | 9,841 | — | |||||||||||||||||||||
Euro | BOFA | Buy | 702,856 | 794,907 | 1/15/20 | — | (5,930 | ) | ||||||||||||||||||||
Euro | HSBK | Buy | 1,199,036 | 1,353,687 | 1/15/20 | — | (7,733 | ) | ||||||||||||||||||||
Euro | HSBK | Buy | 1,353,471 | 1,504,874 | 1/15/20 | 14,436 | — | |||||||||||||||||||||
Euro | SSBT | Buy | 159,177 | 178,778 | 1/15/20 | — | (97 | ) | ||||||||||||||||||||
Euro | SSBT | Buy | 1,550,000 | 1,722,864 | 1/15/20 | 17,057 | — | |||||||||||||||||||||
Euro | SSBT | Sell | 7,929,191 | 9,056,405 | 1/15/20 | 155,654 | — | |||||||||||||||||||||
Euro | UBSW | Sell | 8,185,413 | 9,349,322 | 1/15/20 | 160,954 | — | |||||||||||||||||||||
Australian Dollar | UBSW | Sell | 1,015,897 | 701,395 | 1/16/20 | — | (11,704 | ) | ||||||||||||||||||||
British Pound | BOFA | Buy | 91,879 | 121,694 | 1/16/20 | 52 | — | |||||||||||||||||||||
British Pound | HSBK | Buy | 146,913 | 196,638 | 1/16/20 | — | (1,966 | ) | ||||||||||||||||||||
British Pound | HSBK | Sell | 12,856,251 | 16,876,642 | 1/16/20 | — | (158,915 | ) | ||||||||||||||||||||
Japanese Yen | HSBK | Buy | 11,877,336 | 109,377 | 1/16/20 | 14 | — | |||||||||||||||||||||
Japanese Yen | SSBT | Buy | 12,349,401 | 113,002 | 1/16/20 | 737 | — | |||||||||||||||||||||
Japanese Yen | SSBT | Sell | 1,094,420,313 | 10,057,808 | 1/16/20 | — | (21,894 | ) | ||||||||||||||||||||
Philippine Peso | BONY | Buy | 15,838,389 | 311,902 | 1/16/20 | 468 | — | |||||||||||||||||||||
Philippine Peso | BONY | Sell | 130,413,969 | 2,563,919 | 1/16/20 | — | (8,147 | ) | ||||||||||||||||||||
South Korean Won | HSBK | Sell | 1,595,420,211 | 1,349,868 | 1/17/20 | — | (30,732 | ) | ||||||||||||||||||||
South Korean Won | UBSW | Buy | 512,453,000 | 430,816 | 1/17/20 | 12,636 | — | |||||||||||||||||||||
South Korean Won | UBSW | Sell | 3,057,755,543 | 2,581,910 | 1/17/20 | — | (64,126 | ) | ||||||||||||||||||||
|
|
| ||||||||||||||||||||||||||
Total Forward Exchange Contracts | $ | 371,849 | $ | (339,144 | ) | |||||||||||||||||||||||
|
|
| ||||||||||||||||||||||||||
Net unrealized appreciation (depreciation) |
| $ | 32,705 | |||||||||||||||||||||||||
|
|
| ||||||||||||||||||||||||||
aMay be comprised of multiple contracts with the same counterparty, currency and settlement date.
See Note 9 regarding other derivative information.
See Abbreviations on page 35.
20 | Annual Report | The accompanying notes are an integral part of these financial statements. | franklintempleton.com | ||
FRANKLIN MUTUAL SERIES FUNDS
Statement of Assets and Liabilities
December 31, 2019
Franklin Mutual International Fund
Assets: | ||||
Investments in securities: | ||||
Cost - Unaffiliated issuers | $104,821,056 | |||
|
| |||
Value - Unaffiliated issuers | $ 99,341,120 | |||
Cash | 31,062 | |||
Receivables: | ||||
Investment securities sold | 156,488 | |||
Capital shares sold | 38,745 | |||
Dividends | 424,598 | |||
European Union tax reclaims | 47,531 | |||
Affiliates | 2,577 | |||
Deposits with brokers for: | ||||
Futures contracts | 375,840 | |||
Unrealized appreciation on OTC forward exchange contracts | 371,849 | |||
Other assets | 19 | |||
|
| |||
Total assets | 100,789,829 | |||
|
| |||
Liabilities: | ||||
Payables: | ||||
Capital shares redeemed | 189,561 | |||
Management fees | 36,051 | |||
Distribution fees | 19,391 | |||
Trustees’ fees and expenses | 3,627 | |||
Variation margin on futures contracts | 99,076 | |||
Unrealized depreciation on OTC forward exchange contracts | 339,144 | |||
Accrued expenses and other liabilities | 98,333 | |||
|
| |||
Total liabilities | 785,183 | |||
|
| |||
Net assets, at value | $100,004,646 | |||
|
| |||
Net assets consist of: | ||||
Paid-in capital | $114,685,487 | |||
Total distributable earnings (losses) | (14,680,841 | ) | ||
|
| |||
Net assets, at value | $100,004,646 | |||
|
| |||
| franklintempleton.com | The accompanying notes are an integral part of these financial statements. | Annual Report | 21 | ||
FRANKLIN MUTUAL SERIES FUNDS
FINANCIAL STATEMENTS
Statement of Assets and Liabilities(continued)
December 31, 2019
Franklin Mutual International Fund
Class Z: | ||||
Net assets, at value | $37,986,457 | |||
|
| |||
Shares outstanding | 2,667,971 | |||
|
| |||
Net asset value and maximum offering price per share | $14.24 | |||
|
| |||
Class A: | ||||
Net assets, at value | $44,178,026 | |||
|
| |||
Shares outstanding | 3,115,136 | |||
|
| |||
Net asset value per sharea | $14.18 | |||
|
| |||
Maximum offering price per share (net asset value per share ÷ 94.50%) | $15.01 | |||
|
| |||
Class C: | ||||
Net assets, at value | $11,074,186 | |||
|
| |||
Shares outstanding | 785,669 | |||
|
| |||
Net asset value and maximum offering price per sharea | $14.10 | |||
|
| |||
Class R: | ||||
Net assets, at value | $ 1,452,392 | |||
|
| |||
Shares outstanding | 103,059 | |||
|
| |||
Net asset value and maximum offering price per share | $14.09 | |||
|
| |||
Class R6: | ||||
Net assets, at value | $ 5,313,585 | |||
|
| |||
Shares outstanding | 373,334 | |||
|
| |||
Net asset value and maximum offering price per share | $14.23 | |||
|
| |||
aRedemption price is equal to net asset value less contingent deferred sales charges, if applicable.
22 | Annual Report | The accompanying notes are an integral part of these financial statements. | franklintempleton.com | ||
FRANKLIN MUTUAL SERIES FUNDS
FINANCIAL STATEMENTS
Statement of Operations
for the year ended December 31, 2019
Franklin Mutual International Fund
Investment income: | ||||
Dividends: (net of foreign taxes)* | ||||
Unaffiliated issuers | $ | 4,527,752 | ||
Interest: | ||||
Unaffiliated issuers | 166,386 | |||
|
| |||
Total investment income | 4,694,138 | |||
|
| |||
Expenses: | ||||
Management fees (Note 3a) | 1,119,858 | |||
Distribution fees: (Note 3c) | ||||
Class A | 121,988 | |||
Class C | 124,319 | |||
Class R | 8,240 | |||
Transfer agent fees: (Note 3e) | ||||
Class Z | 102,497 | |||
Class A | 99,817 | |||
Class C | 25,583 | |||
Class R | 3,372 | |||
Class R6 | 16,506 | |||
Custodian fees (Note 4) | 25,180 | |||
Reports to shareholders | 35,516 | |||
Registration and filing fees | 83,776 | |||
Professional fees | 100,446 | |||
Trustees’ fees and expenses | 8,385 | |||
Other | 53,390 | |||
|
| |||
Total expenses | 1,928,873 | |||
Expense reductions (Note 4) | (3,009 | ) | ||
Expenses waived/paid by affiliates (Note 3f) | (453,083 | ) | ||
|
| |||
Net expenses | 1,472,781 | |||
|
| |||
Net investment income | 3,221,357 | |||
|
| |||
Realized and unrealized gains (losses): | ||||
Net realized gain (loss) from: | ||||
Investments: | ||||
Unaffiliated issuers | (8,916,433 | ) | ||
Foreign currency transactions | 13,698 | |||
Forward exchange contracts | 1,922,383 | |||
Futures contracts | 1,001,804 | |||
|
| |||
Net realized gain (loss) | (5,978,548 | ) | ||
|
| |||
Net change in unrealized appreciation (depreciation) on: | ||||
Investments: | ||||
Unaffiliated issuers | 20,585,867 | |||
Translation of other assets and liabilities denominated in foreign currencies | 555 | |||
Forward exchange contracts | (857,492 | ) | ||
Futures contracts | (212,193 | ) | ||
|
| |||
Net change in unrealized appreciation (depreciation) | 19,516,737 | |||
|
| |||
Net realized and unrealized gain (loss) | 13,538,189 | |||
|
| |||
Net increase (decrease) in net assets resulting from operations | $ | 16,759,546 | ||
|
| |||
*Foreign taxes withheld on dividends | $ | 355,011 | ||
| franklintempleton.com | The accompanying notes are an integral part of these financial statements. | Annual Report | 23 | ||||
FRANKLIN MUTUAL SERIES FUNDS
FINANCIAL STATEMENTS
Statements of Changes in Net Assets
Franklin Mutual International Fund
| Year Ended December 31, | ||||||||
| 2019 | 2018 | |||||||
Increase (decrease) in net assets: | ||||||||
Operations: | ||||||||
Net investment income | $ | 3,221,357 | $ | 3,528,615 | ||||
Net realized gain (loss) | (5,978,548 | ) | 9,920,269 | |||||
Net change in unrealized appreciation (depreciation) | 19,516,737 | (46,528,018 | ) | |||||
|
| |||||||
Net increase (decrease) in net assets resulting from operations | 16,759,546 | (33,079,134 | ) | |||||
|
| |||||||
Distributions to shareholders: | ||||||||
Class Z | (1,312,058 | ) | (1,369,385 | ) | ||||
Class A | (1,347,125 | ) | (1,270,437 | ) | ||||
Class C | (245,479 | ) | (150,699 | ) | ||||
Class R | (39,723 | ) | (35,634 | ) | ||||
Class R6 | (180,611 | ) | (566,278 | ) | ||||
|
| |||||||
Total distributions to shareholders | (3,124,996 | ) | (3,392,433 | ) | ||||
|
| |||||||
Capital share transactions: (Note 2) | ||||||||
Class Z | (19,496,686 | ) | (20,389,727 | ) | ||||
Class A | (14,221,831 | ) | (16,207,014 | ) | ||||
Class C | (3,971,113 | ) | (11,485,192 | ) | ||||
Class R | (386,368 | ) | 206,051 | |||||
Class R6 | (16,392,849 | ) | (724,964 | ) | ||||
|
| |||||||
Total capital share transactions | (54,468,847 | ) | (48,600,846 | ) | ||||
|
| |||||||
Net increase (decrease) in net assets | (40,834,297 | ) | (85,072,413 | ) | ||||
Net assets: | ||||||||
Beginning of year | 140,838,943 | 225,911,356 | ||||||
|
| |||||||
End of year | $ | 100,004,646 | $ | 140,838,943 | ||||
|
| |||||||
24 | Annual Report | The accompanying notes are an integral part of these financial statements. | franklintempleton.com | ||
FRANKLIN MUTUAL SERIES FUNDS
Franklin Mutual International Fund
1. Organization and Significant Accounting Policies
Franklin Mutual Series Funds (Trust) is registered under the Investment Company Act of 1940 (1940 Act) as an open-end management investment company, consisting of seven separate funds and applies the specialized accounting and reporting guidance in U.S. Generally Accepted Accounting Principles (U.S. GAAP). Franklin Mutual International Fund (Fund) is included in this report. The Fund offers five classes of shares: Class Z, Class A, Class C, Class R and Class R6. Class C shares automatically convert to Class A shares after they have been held for 10 years. Each class of shares may differ by its initial sales load, contingent deferred sales charges, voting rights on matters affecting a single class, its exchange privilege and fees due to differing arrangements for distribution and transfer agent fees.
The following summarizes the Fund’s significant accounting policies.
a. Financial Instrument Valuation
The Fund’s investments in financial instruments are carried at fair value daily. Fair value is the price that would be received to sell an asset or paid to transfer a liability in an orderly transaction between market participants on the measurement date. The Fund calculates the net asset value (NAV) per share each business day as of 4 p.m. Eastern time or the regularly scheduled close of the New York Stock Exchange (NYSE), whichever is earlier. Under compliance policies and procedures approved by the Trust’s Board of Trustees (the Board), the Fund’s administrator has responsibility for oversight of valuation, including leading the cross-functional Valuation Committee (VC). The Fund may utilize independent pricing services, quotations from securities and financial instrument dealers, and other market sources to determine fair value.
Equity securities and derivative financial instruments listed on an exchange or on the NASDAQ National Market System are valued at the last quoted sale price or the official closing price of the day, respectively. Foreign equity securities are valued as of the close of trading on the foreign stock exchange on which the security is primarily traded, or as of 4 p.m. Eastern time. The value is then converted into its U.S. dollar equivalent at the foreign exchange rate in effect at 4 p.m. Eastern time on the day that the value of the security is determined. Over-the-counter (OTC) securities are valued within the range of the most recent quoted bid and ask prices. Securities that trade in multiple markets or on multiple
exchanges are valued according to the broadest and most representative market. Certain equity securities are valued based upon fundamental characteristics or relationships to similar securities.
Debt securities generally trade in the OTC market rather than on a securities exchange. The Fund’s pricing services use multiple valuation techniques to determine fair value. In instances where sufficient market activity exists, the pricing services may utilize a market-based approach through which quotes from market makers are used to determine fair value. In instances where sufficient market activity may not exist or is limited, the pricing services also utilize proprietary valuation models which may consider market characteristics such as benchmark yield curves, credit spreads, estimated default rates, anticipated market interest rate volatility, coupon rates, anticipated timing of principal repayments, underlying collateral, and other unique security features in order to estimate the relevant cash flows, which are then discounted to calculate the fair value.
Certain derivative financial instruments trade in the OTC market. The Fund’s pricing services use various techniques including industry standard option pricing models and proprietary discounted cash flow models to determine the fair value of those instruments. The Fund’s net benefit or obligation under the derivative contract, as measured by the fair value of the contract, is included in net assets.
The Fund has procedures to determine the fair value of financial instruments for which market prices are not reliable or readily available. Under these procedures, the Fund primarily employs a market-based approach which may use related or comparable assets or liabilities, recent transactions, market multiples, book values, and other relevant information for the investment to determine the fair value of the investment. An income-based valuation approach may also be used in which the anticipated future cash flows of the investment are discounted to calculate fair value. Discounts may also be applied due to the nature or duration of any restrictions on the disposition of the investments. Due to the inherent uncertainty of valuations of such investments, the fair values may differ significantly from the values that would have been used had an active market existed.
Trading in securities on foreign securities stock exchanges and OTC markets may be completed before 4 p.m. Eastern time. In addition, trading in certain foreign markets may not take place on every Fund’s business day. Occasionally,
| franklintempleton.com | Annual Report | 25 | ||
FRANKLIN MUTUAL SERIES FUNDS
NOTES TO FINANCIAL STATEMENTS
Franklin Mutual International Fund(continued)
1. Organization and Significant Accounting Policies(continued)
a. Financial Instrument Valuation(continued)
events occur between the time at which trading in a foreign security is completed and 4 p.m. Eastern time that might call into question the reliability of the value of a portfolio security held by the Fund. As a result, differences may arise between the value of the Fund’s portfolio securities as determined at the foreign market close and the latest indications of value at 4 p.m. Eastern time. In order to minimize the potential for these differences, the VC monitors price movements following the close of trading in foreign stock markets through a series of country specific market proxies (such as baskets of American Depositary Receipts, futures contracts and exchange traded funds). These price movements are measured against established trigger thresholds for each specific market proxy to assist in determining if an event has occurred that may call into question the reliability of the values of the foreign securities held by the Fund. If such an event occurs, the securities may be valued using fair value procedures, which may include the use of independent pricing services.
When the last day of the reporting period is a non-business day, certain foreign markets may be open on those days that the Fund’s NAV is not calculated, which could result in differences between the value of the Fund’s portfolio securities on the last business day and the last calendar day of the reporting period. Any significant security valuation changes due to an open foreign market are adjusted and reflected by the Fund for financial reporting purposes.
b. Foreign Currency Translation
Portfolio securities and other assets and liabilities denominated in foreign currencies are translated into U.S. dollars based on the exchange rate of such currencies against U.S. dollars on the date of valuation. The Fund may enter into foreign currency exchange contracts to facilitate transactions denominated in a foreign currency. Purchases and sales of securities, income and expense items denominated in foreign currencies are translated into U.S. dollars at the exchange rate in effect on the transaction date. Portfolio securities and assets and liabilities denominated in foreign currencies contain risks that those currencies will decline in value relative to the U.S. dollar. Occasionally, events may impact the availability or reliability of foreign exchange rates used to convert the U.S. dollar equivalent
value. If such an event occurs, the foreign exchange rate will be valued at fair value using procedures established and approved by the Board.
The Fund does not separately report the effect of changes in foreign exchange rates from changes in market prices on securities held. Such changes are included in net realized and unrealized gain or loss from investments in the Statement of Operations.
Realized foreign exchange gains or losses arise from sales of foreign currencies, currency gains or losses realized between the trade and settlement dates on securities transactions and the difference between the recorded amounts of dividends, interest, and foreign withholding taxes and the U.S. dollar equivalent of the amounts actually received or paid. Net unrealized foreign exchange gains and losses arise from changes in foreign exchange rates on foreign denominated assets and liabilities other than investments in securities held at the end of the reporting period.
c. Derivative Financial Instruments
The Fund invested in derivative financial instruments in order to manage risk or gain exposure to various other investments or markets. Derivatives are financial contracts based on an underlying or notional amount, require no initial investment or an initial net investment that is smaller than would normally be required to have a similar response to changes in market factors, and require or permit net settlement. Derivatives contain various risks including the potential inability of the counterparty to fulfill their obligations under the terms of the contract, the potential for an illiquid secondary market, and/or the potential for market movements which expose the Fund to gains or losses in excess of the amounts shown in the Statement of Assets and Liabilities. Realized gain and loss and unrealized appreciation and depreciation on these contracts for the period are included in the Statement of Operations.
Derivative counterparty credit risk is managed through a formal evaluation of the creditworthiness of all potential counterparties. The Fund attempts to reduce its exposure to counterparty credit risk on OTC derivatives, whenever possible, by entering into International Swaps and Derivatives Association (ISDA) master agreements with certain counterparties. These agreements contain various provisions, including but not limited to collateral requirements, events of default, or early termination. Termination events applicable to the counterparty include certain deteriorations in the credit
26 | Annual Report | franklintempleton.com | ||
FRANKLIN MUTUAL SERIES FUNDS
NOTES TO FINANCIAL STATEMENTS
Franklin Mutual International Fund(continued)
quality of the counterparty. Termination events applicable to the Fund include failure of the Fund to maintain certain net asset levels and/or limit the decline in net assets over various periods of time. In the event of default or early termination, the ISDA master agreement gives the non-defaulting party the right to net and close-out all transactions traded, whether or not arising under the ISDA agreement, to one net amount payable by one counterparty to the other. However, absent an event of default or early termination, OTC derivative assets and liabilities are presented gross and not offset in the Statement of Assets and Liabilities. Early termination by the counterparty may result in an immediate payment by the Fund of any net liability owed to that counterparty under the ISDA agreement. At December 31, 2019, the Fund had OTC derivatives in a net liability position of $192,575.
Collateral requirements differ by type of derivative. Collateral or initial margin requirements are set by the broker or exchange clearing house for exchange traded and centrally cleared derivatives. Initial margin deposited is held at the exchange and can be in the form of cash and/or securities. For OTC derivatives traded under an ISDA master agreement, posting of collateral is required by either the Fund or the applicable counterparty if the total net exposure of all OTC derivatives with the applicable counterparty exceeds the minimum transfer amount, which typically ranges from $100,000 to $250,000, and can vary depending on the counterparty and the type of the agreement. Generally, collateral is determined at the close of Fund business each day and any additional collateral required due to changes in derivative values may be delivered by the Fund or the counterparty the next business day, or within a few business days. Collateral pledged and/or received by the Fund for OTC derivatives, if any, is held in segregated accounts with the Fund’s custodian/counterparty broker and can be in the form of cash and/or securities. Unrestricted cash may be invested according to the Fund’s investment objectives. To the extent that the amounts due to the Fund from its counterparties are not subject to collateralization or are not fully collateralized, the Fund bears the risk of loss from counterparty non-performance.
At December 31, 2019, the Fund received $486,227 in U.S. Treasury Bills, Bonds and Notes as collateral for derivatives.
The Fund entered into exchange traded futures contracts primarily to manage exposure to certain foreign currencies. A futures contract is an agreement between the Fund and a counterparty to buy or sell an asset at a specified price on a
future date. Required initial margins are pledged by the Fund, and the daily change in fair value is accounted for as a variation margin payable or receivable in the Statement of Assets and Liabilities.
The Fund entered into OTC forward exchange contracts primarily to manage exposure to certain foreign currencies. A forward exchange contract is an agreement between the Fund and a counterparty to buy or sell a foreign currency at a specific exchange rate on a future date.
See Note 9 regarding other derivative information.
d. Securities Lending
The Fund participates in an agency based securities lending program to earn additional income. The Fund receives cash collateral against the loaned securities in an amount equal to at least 102% of the fair value of the loaned securities. Collateral is maintained over the life of the loan in an amount not less than 100% of the fair value of loaned securities, as determined at the close of Fund business each day; any additional collateral required due to changes in security values is delivered to the Fund on the next business day. The collateral is deposited into a joint cash account with other funds and is used to invest in a money market fund managed by Franklin Advisers, Inc., an affiliate of the Fund, and/or a joint repurchase agreement. The Fund may receive income from the investment of cash collateral, in addition to lending fees and rebates paid by the borrower. Income from securities loaned, net of fees paid to the securities lending agent and/or third-party vendor, is reported separately in the Statement of Operations. The Fund bears the market risk with respect to the collateral investment, securities loaned, and the risk that the agent may default on its obligations to the Fund. If the borrower defaults on its obligation to return the securities loaned, the Fund has the right to repurchase the securities in the open market using the collateral received. The securities lending agent has agreed to indemnify the Fund in the event of default by a third party borrower. At December 31, 2019, the Fund had no securities on loan.
e. Income and Deferred Taxes
It is the Fund’s policy to qualify as a regulated investment company under the Internal Revenue Code. The Fund intends to distribute to shareholders substantially all of its taxable income and net realized gains to relieve it from federal income and excise taxes. As a result, no provision for U.S. federal income taxes is required.
| franklintempleton.com | Annual Report | 27 | ||
FRANKLIN MUTUAL SERIES FUNDS
NOTES TO FINANCIAL STATEMENTS
Franklin Mutual International Fund(continued)
1. Organization and Significant Accounting Policies(continued)
e. Income and Deferred Taxes(continued)
The Fund may be subject to foreign taxation related to income received, capital gains on the sale of securities and certain foreign currency transactions in the foreign jurisdictions in which it invests. Foreign taxes, if any, are recorded based on the tax regulations and rates that exist in the foreign markets in which the Fund invests. When a capital gain tax is determined to apply, the Fund records an estimated deferred tax liability in an amount that would be payable if the securities were disposed of on the valuation date.
As a result of several court cases, in certain countries across the European Union, the Fund filed additional tax reclaims for previously withheld taxes on dividends earned in those countries (EU reclaims). These additional filings are subject to various administrative proceedings by the local jurisdictions’ tax authorities within the European Union, as well as a number of related judicial proceedings. Income recognized, if any, for EU reclaims is reflected as other income in the Statement of Operations and any related receivable, if any, is reflected as European Union tax reclaims in the Statement of Assets and Liabilities. When uncertainty exists as to the ultimate resolution of these proceedings, the likelihood of receipt of these EU reclaims, and the potential timing of payment, no amounts are reflected in the financial statements. For U.S. income tax purposes, EU reclaims received by the Fund, if any, reduce the amounts of foreign taxes Fund shareholders can use as tax credits in their individual income tax returns.
The Fund may recognize an income tax liability related to its uncertain tax positions under U.S. GAAP when the uncertain tax position has a less than 50% probability that it will be sustained upon examination by the tax authorities based on its technical merits. As of December 31, 2019, the Fund has determined that no tax liability is required in its financial statements related to uncertain tax positions for any open tax years (or expected to be taken in future tax years). Open tax years are those that remain subject to examination and are based on the statute of limitations in each jurisdiction in which the Fund invests.
f. Security Transactions, Investment Income, Expenses and Distributions
Security transactions are accounted for on trade date. Realized gains and losses on security transactions are determined on a specific identification basis. Interest income and estimated expenses are accrued daily. Amortization of premium and accretion of discount on debt securities are included in interest income. Dividend income is recorded on the ex-dividend date except for certain dividends from securities where the dividend rate is not available. In such cases, the dividend is recorded as soon as the information is received by the Fund. Distributions to shareholders are recorded on the ex-dividend date. Distributable earnings are determined according to income tax regulations (tax basis) and may differ from earnings recorded in accordance with U.S. GAAP. These differences may be permanent or temporary. Permanent differences are reclassified among capital accounts to reflect their tax character. These reclassifications have no impact on net assets or the results of operations. Temporary differences are not reclassified, as they may reverse in subsequent periods.
Common expenses incurred by the Trust are allocated among the Funds based on the ratio of net assets of each Fund to the combined net assets of the Trust or based on the ratio of number of shareholders of each Fund to the combined number of shareholders of the Trust. Fund specific expenses are charged directly to the Fund that incurred the expense.
Realized and unrealized gains and losses and net investment income, excluding class specific expenses, are allocated daily to each class of shares based upon the relative proportion of net assets of each class. Differences in per share distributions by class are generally due to differences in class specific expenses.
g. Accounting Estimates
The preparation of financial statements in accordance with U.S. GAAP requires management to make estimates and assumptions that affect the reported amounts of assets and liabilities at the date of the financial statements and the amounts of income and expenses during the reporting period. Actual results could differ from those estimates.
h. Guarantees and Indemnifications
Under the Trust’s organizational documents, its officers and trustees are indemnified by the Trust against certain liabilities arising out of the performance of their duties to the Trust.
28 | Annual Report | franklintempleton.com | ||
FRANKLIN MUTUAL SERIES FUNDS
NOTES TO FINANCIAL STATEMENTS
Franklin Mutual International Fund(continued)
Additionally, in the normal course of business, the Trust, on behalf of the Fund, enters into contracts with service providers that contain general indemnification clauses. The Trust’s maximum exposure under these arrangements is
unknown as this would involve future claims that may be made against the Trust that have not yet occurred. Currently, the Trust expects the risk of loss to be remote.
2. Shares of Beneficial Interest
At December 31, 2019, there were an unlimited number of shares authorized (without par value). Transactions in the Fund’s shares were as follows:
| Year Ended December 31, | ||||||||||||||
| 2019 | 2018 | |||||||||||||
| Shares | Amount | Shares | Amount | |||||||||||
Class Z Shares: | ||||||||||||||
Shares sold | 594,641 | $ | 8,171,934 | 2,069,714 | $29,602,759 | |||||||||
Shares issued in reinvestment of distributions | 89,276 | 1,257,074 | 104,086 | 1,342,966 | ||||||||||
Shares redeemed | (2,093,240 | ) | (28,925,694 | ) | (3,501,255 | ) | (51,335,452) | |||||||
|
| |||||||||||||
Net increase (decrease) | (1,409,323 | ) | $ | (19,496,686 | ) | (1,327,455 | ) | $(20,389,727) | ||||||
|
| |||||||||||||
Class A Shares: | ||||||||||||||
Shares solda | 311,163 | $ | 4,237,738 | 1,021,682 | $15,233,084 | |||||||||
Shares issued in reinvestment of distributions | 95,181 | 1,335,417 | 97,868 | 1,258,830 | ||||||||||
Shares redeemed | (1,447,114 | ) | (19,794,986 | ) | (2,182,962 | ) | (32,698,928) | |||||||
|
| |||||||||||||
Net increase (decrease) | (1,040,770 | ) | $ | (14,221,831 | ) | (1,063,412 | ) | $(16,207,014) | ||||||
|
| |||||||||||||
Class C Shares: | ||||||||||||||
Shares sold | 63,396 | $ | 859,057 | 222,976 | $3,422,701 | |||||||||
Shares issued in reinvestment of distributions | 17,649 | 244,848 | 11,409 | 150,533 | ||||||||||
Shares redeemeda | (374,326 | ) | (5,075,018 | ) | (1,010,609 | ) | (15,058,426) | |||||||
|
| |||||||||||||
Net increase (decrease) | (293,281 | ) | $ | (3,971,113 | ) | (776,224 | ) | $(11,485,192) | ||||||
|
| |||||||||||||
Class R Shares: | ||||||||||||||
Shares sold | 23,758 | $ | 321,122 | 50,432 | $776,090 | |||||||||
Shares issued in reinvestment of distributions | 2,853 | 39,723 | 2,782 | 35,634 | ||||||||||
Shares redeemed | (55,438 | ) | (747,213 | ) | (39,495 | ) | (605,673) | |||||||
|
| |||||||||||||
Net increase (decrease) | (28,827 | ) | $ | (386,368 | ) | 13,719 | $206,051 | |||||||
|
| |||||||||||||
Class R6 Shares: | ||||||||||||||
Shares sold | 170,009 | $ | 2,342,662 | 360,960 | $5,502,994 | |||||||||
Shares issued in reinvestment of distributions | 12,811 | 180,611 | 44,003 | 566,278 | ||||||||||
Shares redeemed | (1,379,626 | ) | (18,916,122 | ) | (443,682 | ) | (6,794,236) | |||||||
|
| |||||||||||||
Net increase (decrease) | (1,196,806 | ) | $ | (16,392,849 | ) | (38,719 | ) | $(724,964) | ||||||
|
| |||||||||||||
aMay include a portion of Class C shares that were automatically converted to Class A.
| franklintempleton.com | Annual Report | 29 | ||
FRANKLIN MUTUAL SERIES FUNDS
NOTES TO FINANCIAL STATEMENTS
Franklin Mutual International Fund(continued)
3. Transactions with Affiliates
Franklin Resources, Inc. is the holding company for various subsidiaries that together are referred to as Franklin Templeton. Certain officers and trustees of the Fund are also officers and/or directors of the following subsidiaries:
| Subsidiary | Affiliation | |
Franklin Mutual Advisers, LLC (Franklin Mutual) | Investment manager | |
Franklin Templeton Services, LLC (FT Services) | Administrative manager | |
Franklin Templeton Distributors, Inc. (Distributors) | Principal underwriter | |
Franklin Templeton Investor Services, LLC (Investor Services) | Transfer agent | |
a. Management Fees
The Fund pays an investment management fee to Franklin Mutual of 0.875% per year of the average daily net assets of the Fund.
b. Administrative Fees
Under an agreement with Franklin Mutual, FT Services provides administrative services to the Fund. The fee is paid by Franklin Mutual based on the Fund’s average daily net assets, and is not an additional expense of the Fund.
c. Distribution Fees
The Board has adopted distribution plans for each share class, with the exception of Class Z and Class R6 shares, pursuant to Rule 12b-1 under the 1940 Act. Under the Fund’s Class A reimbursement distribution plan, the Fund reimburses Distributors for costs incurred in connection with the servicing, sale and distribution of the Fund’s shares up to the maximum annual plan rate. Under the Class A reimbursement distribution plan, costs exceeding the maximum for the current plan year cannot be reimbursed in subsequent periods. In addition, under the Fund’s Class C and R compensation distribution plans, the Fund pays Distributors for costs incurred in connection with the servicing, sale and distribution of the Fund’s shares up to the maximum annual plan rate for each class. The plan year, for purposes of monitoring compliance with the maximum annual plan rates, is February 1 through January 31.
The maximum annual plan rates, based on the average daily net assets, for each class, are as follows:
Class A | 0.35 | % | ||
Class C | 1.00 | % | ||
Class R | 0.50 | % |
The Board has set the current rate at 0.25% per year for Class A shares until further notice and approval by the Board.
d. Sales Charges/Underwriting Agreements
Front-end sales charges and contingent deferred sales charges (CDSC) do not represent expenses of the Fund. These charges are deducted from the proceeds of sales of Fund shares prior to investment or from redemption proceeds prior to remittance, as applicable. Distributors has advised the Fund of the following commission transactions related to the sales and redemptions of the Fund’s shares for the year:
Sales charges retained net of commissions paid to unaffiliated brokers/dealers | $ | 3,307 | ||
CDSC retained | $ | (1,150 | ) |
30 | Annual Report | franklintempleton.com | ||
FRANKLIN MUTUAL SERIES FUNDS
NOTES TO FINANCIAL STATEMENTS
Franklin Mutual International Fund(continued)
e. Transfer Agent Fees
Each class of shares pays transfer agent fees to Investor Services for its performance of shareholder servicing obligations. The fees are based on an annualized asset based fee of 0.02% plus a transaction based fee. In addition, each class reimburses Investor Services for out of pocket expenses incurred and, except for Class R6, reimburses shareholder servicing fees paid to third parties. These fees are allocated daily based upon their relative proportion of such classes’ aggregate net assets. Class R6 pays Investor Services transfer agent fees specific to that class.
For the year ended December 31, 2019, the Fund paid transfer agent fees of $247,775, of which $136,007 was retained by Investor Services.
f. Waiver and Expense Reimbursements
Franklin Mutual and Investor Services have contractually agreed in advance to waive or limit their respective fees and to assume as their own expense certain expenses otherwise payable by the Fund so that the expenses (excluding distribution fees, acquired fund fees and expenses and certain non-routine expenses or costs, including those relating to litigation, indemnification, reorganizations, and liquidations) for each class of the Fund do not exceed 0.97%, and Class R6 does not exceed 0.81%, based on the average net assets of each class until April 30, 2020. Total expenses waived or paid are not subject to recapture subsequent to the Fund’s fiscal year end.
Prior to May 1, 2019, the expenses (excluding certain fees and expenses as previously disclosed) for Class R6 were limited to 0.83% based on the average net assets of the class.
4. Expense Offset Arrangement
The Fund has entered into an arrangement with its custodian whereby credits realized as a result of uninvested cash balances are used to reduce a portion of the Fund’s custodian expenses. During the year ended December 31, 2019, the custodian fees were reduced as noted in the Statement of Operations.
5. Independent Trustees’ Retirement Plan
On January 1, 1993, the Trust adopted an Independent Trustees’ Retirement Plan (Plan). The Plan is an unfunded defined benefit plan that provides benefit payments to Trustees whose length of service and retirement age meets the eligibility requirements of the Plan. Benefits under the Plan are based on years of service and fees paid to each trustee at the time of retirement. Effective in December 1996, the Plan was closed to new participants.
During the year ended December 31, 2019, the Fund’s projected benefit obligation and benefit payments under the Plan were as follows:
aProjected benefit obligation at December 31, 2019 | $ | 3,627 | ||
bIncrease in projected benefit obligation | $ | 899 | ||
Benefit payments made to retired trustees | $ | (171 | ) |
aThe projected benefit obligation is included in trustees’ fees and expenses in the Statement of Assets and Liabilities.
bThe increase in projected benefit obligation is included in trustees’ fees and expenses in the Statement of Operations.
| franklintempleton.com | Annual Report | 31 | ||
FRANKLIN MUTUAL SERIES FUNDS
NOTES TO FINANCIAL STATEMENTS
Franklin Mutual International Fund(continued)
6. Income Taxes
For tax purposes, capital losses may be carried over to offset future capital gains.
At December 31, 2019, the capital loss carryforwards were as follows:
Capital loss carryforwards not subject to expiration: | ||||
Short term | $ | 380,285 | ||
Long term | 8,303,435 | |||
|
| |||
Total capital loss carryforwards | $ | 8,683,720 | ||
|
| |||
For tax purposes, the Fund may elect to defer any portion of a post-October capital loss or late-year ordinary loss to the first day of the following fiscal year. At December 31, 2019, the Fund deferred late-year ordinary losses of $40,094.
The tax character of distributions paid during the years ended December 31, 2019 and 2018, was as follows:
| 2019 | 2018 | |||||||
Distributions paid from: | ||||||||
Ordinary income | $ | 2,846,811 | $ | 2,390,052 | ||||
Long term capital gain | 278,185 | 1,002,381 | ||||||
|
| |||||||
| $ | 3,124,996 | $ | 3,392,433 | |||||
|
| |||||||
At December 31, 2019, the cost of investments and net unrealized appreciation (depreciation) for income tax purposes were as follows:
Cost of investments | $ | 105,179,827 | ||
|
| |||
Unrealized appreciation | $ | 9,082,492 | ||
Unrealized depreciation | (15,086,101) | |||
|
| |||
Net unrealized appreciation (depreciation) | $ | (6,003,609) | ||
|
| |||
Differences between income and/or capital gains as determined on a book basis and a tax basis are primarily due to differing treatments of foreign currency transactions and passive foreign investment company shares.
7. Investment Transactions
Purchases and sales of investments (excluding short term securities) for the year ended December 31, 2019, aggregated $12,569,736 and $60,806,629, respectively.
8. Concentration of Risk
Investing in foreign securities may include certain risks and considerations not typically associated with investing in U.S. securities, such as fluctuating currency values and changing local, regional and global economic, political and social conditions, which may result in greater market volatility. Current political and financial uncertainty surrounding the European Union may increase market volatility and the economic risk of investing in securities in Europe. In addition, certain foreign securities may not be as liquid as U.S. securities.
32 | Annual Report | franklintempleton.com | ||
FRANKLIN MUTUAL SERIES FUNDS
NOTES TO FINANCIAL STATEMENTS
Franklin Mutual International Fund(continued)
9. Other Derivative Information
At December 31, 2019, investments in derivative contracts are reflected in the Statement of Assets and Liabilities as follows:
Asset Derivatives | Liability Derivatives | |||||||||
Derivative Contracts Not Accounted for as Hedging Instruments | Statement of Assets and Liabilities Location | Fair Value | Statement of Assets and Liabilities Location | Fair Value | ||||||
Foreign exchange contracts | Variation margin on futures contracts | $ — | Variation margin on futures contracts | $198,061 | a | |||||
Unrealized appreciation on OTC forward exchange contracts | 371,849 | Unrealized depreciation on OTC forward exchange contracts | 339,144 | |||||||
|
|
| ||||||||
Totals | $371,849 | $537,205 | ||||||||
|
|
| ||||||||
aThis amount reflects the cumulative appreciation (depreciation) of futures contracts as reported in the Statement of Investments. Only the variation margin receivable/ payable at year end is separately reported within the Statement of Assets and Liabilities. Prior variation margin movements were recorded to cash upon receipt or payment.
For the year ended December 31, 2019, the effect of derivative contracts in the Statement of Operations was as follows:
Derivative Contracts Not Accounted for as Hedging Instruments | Statement of Operations Location | Net Realized Gain (Loss) for the Year | Statement of Operations Location | Net Change in Unrealized Appreciation (Depreciation) for the Year | ||||||
Net realized gain (loss) from: | Net change in unrealized appreciation (depreciation) on: | |||||||||
Foreign exchange contracts | Forward exchange contracts | $1,922,383 | Forward exchange contracts | $ (857,492) | ||||||
Futures contracts | 1,001,804 | Futures contracts | (212,193) | |||||||
|
|
| ||||||||
Totals | $2,924,187 | $(1,069,685) | ||||||||
|
|
| ||||||||
For the year ended December 31, 2019, the average month end notional amount of futures contracts represented $23,331,352. The average month end contract value of forward exchange contracts was $71,605,661.
See Note 1(c) regarding derivative financial instruments.
10. Upcoming Acquisitions/Reorganization
On July 16, 2019, the Board approved a proposal to reorganize the Fund with and into Franklin Mutual Global Discovery Fund (Surviving Fund). On December 6, 2019, shareholders of the Fund approved the proposal. Upon completion of the reorganization on or about February 21, 2020, assets in the Fund will be transferred into the Surviving Fund.
11. Credit Facility
The Fund, together with other U.S. registered and foreign investment funds (collectively, Borrowers), managed by Franklin Templeton, are borrowers in a joint syndicated senior unsecured credit facility totaling $2 billion (Global Credit Facility) which matured on February 7, 2020. This Global Credit Facility provides a source of funds to the Borrowers for temporary and emergency purposes, including the ability to meet future unanticipated or unusually large redemption requests. Effective February 7, 2020, the Borrowers renewed the Global Credit Facility for a one year term, maturing February 5, 2021, for a total of $2 billion.
| franklintempleton.com | Annual Report | 33 | ||
FRANKLIN MUTUAL SERIES FUNDS
NOTES TO FINANCIAL STATEMENTS
Franklin Mutual International Fund(continued)
11. Credit Facility(continued)
Under the terms of the Global Credit Facility, the Fund shall, in addition to interest charged on any borrowings made by the Fund and other costs incurred by the Fund, pay its share of fees and expenses incurred in connection with the implementation and maintenance of the Global Credit Facility, based upon its relative share of the aggregate net assets of all of the Borrowers, including an annual commitment fee of 0.15% based upon the unused portion of the Global Credit Facility. These fees are reflected in other expenses in the Statement of Operations. During the year ended December 31, 2019, the Fund did not use the Global Credit Facility.
12. Fair Value Measurements
The Fund follows a fair value hierarchy that distinguishes between market data obtained from independent sources (observable inputs) and the Fund’s own market assumptions (unobservable inputs). These inputs are used in determining the value of the Fund’s financial instruments and are summarized in the following fair value hierarchy:
| • | Level 1 – quoted prices in active markets for identical financial instruments |
| • | Level 2 – other significant observable inputs (including quoted prices for similar financial instruments, interest rates, prepayment speed, credit risk, etc.) |
| • | Level 3 – significant unobservable inputs (including the Fund’s own assumptions in determining the fair value of financial instruments) |
The input levels are not necessarily an indication of the risk or liquidity associated with financial instruments at that level.
A summary of inputs used as of December 31, 2019, in valuing the Fund’s assets and liabilities carried at fair value, is as follows:
| Level 1 | Level 2 | Level 3 | Total | |||||||||||||
Assets: | ||||||||||||||||
Investments in Securities:a | ||||||||||||||||
Equity Investmentsb | $ | 92,841,547 | $ | — | $ | — | $ | 92,841,547 | ||||||||
Short Term Investments | 899,573 | 5,600,000 | — | 6,499,573 | ||||||||||||
Total Investments in Securities | $ | 93,741,120 | $ | 5,600,000 | $ | — | $ | 99,341,120 | ||||||||
Other Financial Instruments: | ||||||||||||||||
Forward Exchange Contracts | $ | — | $ | 371,849 | $ | — | $ | 371,849 | ||||||||
Liabilities: | ||||||||||||||||
Other Financial Instruments: | ||||||||||||||||
Futures Contracts | $ | 198,061 | $ | — | $ | — | $ | 198,061 | ||||||||
Forward Exchange Contracts | — | 339,144 | — | 339,144 | ||||||||||||
Total Other Financial Instruments | $ | 198,061 | $ | 339,144 | $ | — | $ | 537,205 | ||||||||
aFor detailed categories, see the accompanying Statement of Investments.
bIncludes common and preferred stocks.
13. Subsequent Events
The Fund has evaluated subsequent events through the issuance of the financial statements and determined that no events have occurred that require disclosure other than those already disclosed in the financial statements.
34 | Annual Report | franklintempleton.com | ||
FRANKLIN MUTUAL SERIES FUNDS
NOTES TO FINANCIAL STATEMENTS
Franklin Mutual International Fund(continued)
Abbreviations
| Counterparty | Currency | Selected Portfolio | ||||||||
| BOFA | Bank of America Corp. | EUR | Euro | ADR | American Depositary Receipt | |||||
| BONY | The Bank of New York Mellon Corp. | GBP | British Pound | FHLB | Federal Home Loan Bank | |||||
| HSBK | HSBC Bank PLC | USD | United States Dollar | |||||||
| SSBT | State Street Bank and Trust Co., N.A. | |||||||||
| UBSW | UBS AG | |||||||||
| franklintempleton.com | Annual Report | 35 | ||
FRANKLIN MUTUAL SERIES FUNDS
Report of Independent Registered Public Accounting Firm
To the Board of Trustees of Franklin Mutual Series Funds and Shareholders of Franklin Mutual International Fund:
Opinion on the Financial Statements
We have audited the accompanying statement of assets and liabilities of Franklin Mutual International Fund (the “Fund”) (one of the funds constituting Franklin Mutual Series Funds), including the schedule of investments, as of December 31, 2019, and the related statement of operations for the year then ended, the statements of changes in net assets for each of the two years in the period then ended, the financial highlights for each of the five years in the period then ended and the related notes (collectively referred to as the “financial statements”). In our opinion, the financial statements present fairly, in all material respects, the financial position of Franklin Mutual International Fund (one of the funds constituting Franklin Mutual Series Funds) at December 31, 2019, the results of its operations for the year then ended, the changes in its net assets for each of the two years in the period then ended and its financial highlights for each of the five years in the period then ended, in conformity with U.S. generally accepted accounting principles.
Basis for Opinion
These financial statements are the responsibility of the Fund’s management. Our responsibility is to express an opinion on the Fund’s financial statements based on our audits. We are a public accounting firm registered with the Public Company Accounting Oversight Board (United States) (‘‘PCAOB’’) and are required to be independent with respect to the Fund in accordance with the U.S. federal securities laws and the applicable rules and regulations of the Securities and Exchange Commission and the PCAOB.
We conducted our audits in accordance with the standards of the PCAOB. Those standards require that we plan and perform the audit to obtain reasonable assurance about whether the financial statements are free of material misstatement, whether due to error or fraud. The Fund is not required to have, nor were we engaged to perform, an audit of the Fund’s internal control over financial reporting. As part of our audits, we are required to obtain an understanding of internal control over financial reporting, but not for the purpose of expressing an opinion on the effectiveness of the Fund’s internal control over financial reporting. Accordingly, we express no such opinion.
Our audits included performing procedures to assess the risks of material misstatement of the financial statements, whether due to error or fraud, and performing procedures that respond to those risks. Such procedures included examining, on a test basis, evidence regarding the amounts and disclosures in the financial statements. Our procedures included confirmation of securities owned as of December 31, 2019, by correspondence with the custodian and brokers. Our audits also included evaluating the accounting principles used and significant estimates made by management, as well as evaluating the overall presentation of the financial statements. We believe that our audits provide a reasonable basis for our opinion.

We have served as the auditor of one or more Franklin investment companies since 1987.
Boston, Massachusetts
February 21, 2020
36 | Annual Report | franklintempleton.com | ||
FRANKLIN MUTUAL SERIES FUNDS
Franklin Mutual International Fund
Under Section 852(b)(3)(C) of the Internal Revenue Code, the Fund hereby reports the maximum amount allowable but no less than $278,185 as a long term capital gain dividend for the fiscal year ended December 31, 2019.
Under Section 854(b)(1)(B) of the Internal Revenue Code, the Fund hereby reports the maximum amount allowable but no less than $3,992,580 as qualified dividends for purposes of the maximum rate under Section 1(h)(11) of the Internal Revenue Code for the fiscal year ended December 31, 2019. Distributions, including qualified dividend income, paid during calendar year 2019 will be reported to shareholders on Form 1099-DIV by mid-February 2020. Shareholders are advised to check with their tax advisors for information on the treatment of these amounts on their individual income tax returns.
At December 31, 2019, more than 50% of the Fund’s total assets were invested in securities of foreign issuers. In most instances, foreign taxes were withheld from income paid to the Fund on these investments. As shown in the table below, the Fund hereby reports to shareholders the foreign source income and foreign taxes paid, pursuant to Section 853 of the Internal Revenue Code. This written statement will allow shareholders of record on December 19, 2019, to treat their proportionate share of foreign taxes paid by the Fund as having been paid directly by them. The shareholder shall consider these amounts as foreign taxes paid in the tax year in which they receive the Fund distribution.
The following table provides a detailed analysis of foreign tax paid, foreign source income and foreign source qualified dividends as reported by the Fund, to Class Z, Class A, Class C, Class R and Class R6 shareholders of record.
| Class | Foreign Tax Paid Per Share | Foreign Source Income Per Share | Foreign Source Qualified Dividends Per Share | |||||||||
Class Z | $0.0593 | $0.5288 | $0.4324 | |||||||||
Class A | $0.0593 | $0.4955 | $0.4052 | |||||||||
Class C | $0.0593 | $0.3794 | $0.3102 | |||||||||
Class R | $0.0593 | $0.4538 | $0.3709 | |||||||||
Class R6 | $0.0593 | $0.5504 | $0.4499 | |||||||||
Foreign Tax Paid Per Share is the amount per share available to you, as a tax credit (assuming you held your shares in the Fund for a minimum of 16 days during the 31-day period beginning 15 days before the ex-dividend date of the Fund’s distribution to which the foreign taxes relate), or, as a tax deduction.
Foreign Source Income Per Share is the amount per share of income dividends attributable to foreign securities held by the Fund, plus any foreign taxes withheld on these dividends. The amounts reported include foreign source qualified dividends that have not been adjusted for the rate differential applicable to such dividend income.1
Foreign Source Qualified Dividends Per Share is the amount per share of foreign source qualified dividends plus any foreign taxes withheld on these dividends. These amounts represent the portion of the Foreign Source Income Per Share that were derived from qualified foreign securities held by the Fund.1
At the beginning of each calendar year, shareholders will receive Form 1099-DIV which will include their share of taxes paid and foreign source income distributed during the prior calendar year. The Foreign Source Income reported on Form 1099-DIV has not been adjusted for the rate differential on foreign source qualified dividend income. Shareholders are advised to check with their tax advisors for information on the treatment of these amounts on their individual income tax returns.
1Qualified dividends are taxed at reduced long term capital gains tax rates. In determining the amount of foreign tax credit that may be applied against the U.S. tax liability of individuals receiving foreign source qualified dividends, adjustments may be required to the foreign tax credit limitation calculation to reflect the rate differential applicable to such dividend income. The rules however permit certain individuals to elect not to apply the rate differential adjustments for capital gains and/or dividends for any taxable year. Please consult your tax advisor and the instructions to Form 1116 for more information.
| franklintempleton.com | Annual Report | 37 | ||
FRANKLIN MUTUAL SERIES FUNDS
The name, year of birth and address of the officers and board members, as well as their affiliations, positions held with the Trust, principal occupations during at least the past five years and number of U.S. registered portfolios overseen in the Franklin Templeton fund complex, are shown below. Generally, each board member serves until that person’s successor is elected and qualified.
Independent Board Members
Name, Year of Birth and Address | Position | Length of Time Served | Number of Portfolios in Fund Complex Overseen by Board Member* | Other Directorships Held During at Least the Past 5 Years | ||||
Edward I. Altman, Ph.D. (1941) c/o Franklin Mutual Advisers, LLC 101 John F. Kennedy Parkway Short Hills, NJ 07078-2716 | Trustee | Since 1987 | 12 | None | ||||
| Principal Occupation During at Least the Past 5 Years: | ||||||||
| Max L. Heine Professor of Finance, Emeritus and Director of The Credit and Debt Markets Research Program, Salomon Center, Stern School of Business, New York University; editor and author of numerous financial publications; financial consultant; an adviser to numerous financial and publishing organizations; andformerly, Vice Director, Salomon Center, Stern School of Business, New York University. | ||||||||
Ann Torre Bates (1958) c/o Franklin Mutual Advisers, LLC 101 John F. Kennedy Parkway Short Hills, NJ 07078-2716 | Trustee and Chairperson | Trustee since 1995 and Chairperson since January 2020 | 33 | Ares Capital Corporation (specialty finance company) (2010-present), United Natural Foods, Inc. (distributor of natural, organic and specialty foods) (2013-present), Allied Capital Corporation (financial services) (2003-2010), SLM Corporation (Sallie Mae) (1997-2014) and Navient Corporation (loan management, servicing and asset recovery) (2014-2016). | ||||
| Principal Occupation During at Least the Past 5 Years: | ||||||||
| Director of various companies; andformerly, Executive Vice President and Chief Financial Officer, NHP Incorporated (manager of multifamily housing) (1995-1997); and Vice President and Treasurer, US Airways, Inc. (until 1995). | ||||||||
Burton J. Greenwald (1929) c/o Franklin Mutual Advisers, LLC 101 John F. Kennedy Parkway Short Hills, NJ 07078-2716 | Trustee | Since 2002 | 12 | Franklin Templeton Emerging Markets Debt Opportunities Fund PLC (1999-present) and Fiduciary International Ireland Limited (1999-2015). | ||||
| Principal Occupation During at Least the Past 5 Years: | ||||||||
| Managing Director, B.J. Greenwald Associates (management consultants to the financial services industry); andformerly, Chairman, Fiduciary Trust International Funds; Executive Vice President, L.F. Rothschild Fund Management, Inc.; President and Director, Merit Mutual Funds; President, Underwriting Division and Director, National Securities & Research Corporation; Governor, Investment Company Institute; and Chairman, ICI Public Information Committee. | ||||||||
Jan Hopkins Trachtman(1947) c/o Franklin Mutual Advisers, LLC 101 John F. Kennedy Parkway Short Hills, NJ 07078-2716 | Trustee | Since 2009 | 12 | FinTech Acquisition Corp. III (special purpose fintech acquisition company) (2018-present) | ||||
| Principal Occupation During at Least the Past 5 Years: | ||||||||
| President and Founder, The Jan Hopkins Group (communications consulting firm); serves on Alumni Advisory Board of Knight Bagehot Fellowship; andformerly, President, Economic Club of New York (2007-2015); Anchor/Correspondent, CNN Financial News (until 2003); Managing Director and Head of Client Communications, Citigroup Private Bank (until 2005); Off-Air reporter, ABC News’ World News Tonight; and Editor, CBS Network News. | ||||||||
38 | Annual Report | franklintempleton.com | ||
FRANKLIN MUTUAL SERIES FUNDS
Independent Board Members(continued)
Name, Year of Birth and Address | Position | Length of Time Served | Number of Portfolios in Fund Complex Overseen by Board Member* | Other Directorships Held During at Least the Past 5 Years | ||||||
Keith Mitchell (1954) c/o Franklin Mutual Advisers, LLC 101 John F. Kennedy Parkway Short Hills, NJ 07078-2716 | Trustee | Since 2009 | 12 | None | ||||||
| Principal Occupation During at Least the Past 5 Years: | ||||||||||
| Director of various boards of asset management firms; andformerly, Managing Member, Mitchell, Hartley & Bechtel Advisers, LLC (formerly, Mitchell Advisers, LLC) (advisory firm) (2003-2015) and Managing Director, Putman Lovell NBF. | ||||||||||
David W. Niemiec (1949) c/o Franklin Mutual Advisers, LLC 101 John F. Kennedy Parkway Short Hills, NJ 07078-2716 | Trustee | Since 2015 | 33 | Hess Midstream LP (oil and gas midstream infrastructure) (2017-present). | ||||||
| Principal Occupation During at Least the Past 5 Years: | ||||||||||
| Advisor, Saratoga Partners (private equity fund); andformerly, Managing Director, Saratoga Partners (1998-2001) and SBC Warburg Dillon Read (investment banking) (1997-1998); Vice Chairman, Dillon, Read & Co. Inc. (investment banking) (1991-1997); and Chief Financial Officer, Dillon, Read & Co. Inc. (1982-1997). | ||||||||||
Charles Rubens II (1930) c/o Franklin Mutual Advisers, LLC 101 John F. Kennedy Parkway Short Hills, NJ 07078-2716 | Trustee | Since 1998 | 12 | None | ||||||
| Principal Occupation During at Least the Past 5 Years: | ||||||||||
| Private investor and president of non-profit organizations; andformerly, an executive of Time, Inc.; and Trustee of Colorado College. | ||||||||||
Robert E. Wade (1946) c/o Franklin Mutual Advisers, LLC 101 John F. Kennedy Parkway Short Hills, NJ 07078-2716 | Trustee | Since 1991 | 33 | El Oro Ltd (investments) (2003-2019). | ||||||
| Principal Occupation During at Least the Past 5 Years: | ||||||||||
| Attorney at law engaged in private practice as a sole practitioner (1972-2008) and member of various boards. | ||||||||||
Gregory H. Williams (1943) c/o Franklin Mutual Advisers, LLC 101 John F. Kennedy Parkway Short Hills, NJ 07078-2716 | Trustee | Since 2015 | 12 | None | ||||||
| Principal Occupation During at Least the Past 5 Years: | ||||||||||
| Private investor; Consultant; andformerly, President, University of Cincinnati (2009-2012); President, The City College of New York (2001-2009); Dean, College of Law, Ohio State University (1993-2001); and Associate Vice President, Academic Affairs and Professor of Law, University of Iowa (1977-1993). | ||||||||||
| Interested Board Members and Officers | ||||||||||
Name, Year of Birth and Address | Position | Length of Time Served | Number of Portfolios in Fund Complex Overseen by Board Member* | Other Directorships Held During at Least the Past 5 Years | ||||||
**Gregory E. Johnson (1961) One Franklin Parkway San Mateo, CA 94403-1906 | Trustee | Since 2007 | 144 | None | ||||||
| Principal Occupation During at Least the Past 5 Years: | ||||||||||
| Chairman of the Board, Member – Office of the Chairman, Director and Chief Executive Officer, Franklin Resources, Inc.; officer and/or director or trustee, as the case may be, of some of the other subsidiaries of Franklin Resources, Inc. and of 39 of the investment companies in Franklin Templeton; Vice Chairman, Investment Company Institute; andformerly, President, Franklin Resources, Inc. (1994-2015). | ||||||||||
| franklintempleton.com | Annual Report | 39 | ||
FRANKLIN MUTUAL SERIES FUNDS
Interested Board Members and Officers(continued)
Name, Year of Birth and Address | Position | Length of Time Served | Number of Portfolios in Fund Complex Overseen by Board Member* | Other Directorships Held During at Least the Past 5 Years | ||||
**Peter A. Langerman (1955) c/o Franklin Mutual Advisers, LLC 101 John F. Kennedy Parkway Short Hills, NJ 07078-2716 | Trustee, President, and Chief Executive Officer – Investment Management | Trustee since 2007, President, and Chief Executive Officer – Investment Management since 2005 | 7 | None | ||||
| Principal Occupation During at Least the Past 5 Years: | ||||||||
| Chairman of the Board, Chief Executive Officer and President, Franklin Mutual Advisers, LLC; and officer and/or director, as the case may be, of three of the investment companies in Franklin Templeton. | ||||||||
Alison E. Baur (1964) One Franklin Parkway San Mateo, CA 94403-1906 | Vice President | Since 2012 | Not Applicable | Not Applicable | ||||
| Principal Occupation During at Least the Past 5 Years: | ||||||||
| Deputy General Counsel, Franklin Templeton; and officer of some of the other subsidiaries of Franklin Resources, Inc. and of 41 of the investment companies in Franklin Templeton. | ||||||||
Breda M. Beckerle (1958) 280 Park Avenue New York, NY 10017 | Interim Chief Compliance Officer | Since January 2020 | Not Applicable | Not Applicable | ||||
| Principal Occupation During at Least the Past 5 Years: | ||||||||
| Chief Compliance Officer, Fiduciary Investment Management International, Inc., Franklin Advisers, Inc., Franklin Advisory Services, LLC, Franklin Mutual Advisers, LLC, Franklin Templeton Institutional, LLC; and officer of 41 of the investment companies in Franklin Templeton. | ||||||||
Steven J. Gray (1955) One Franklin Parkway San Mateo, CA 94403-1906 | Vice President and Secretary | Vice President since 2009 and Secretary since 2005 | Not Applicable | Not Applicable | ||||
| Principal Occupation During at Least the Past 5 Years: | ||||||||
| Senior Associate General Counsel, Franklin Templeton; Vice President, Franklin Templeton Distributors, Inc. and FASA, LLC; and officer of 41 of the investment companies in Franklin Templeton. | ||||||||
Matthew T. Hinkle (1971) One Franklin Parkway San Mateo, CA 94403-1906 | Chief Executive Officer – Finance and Administration | Since 2017 | Not Applicable | Not Applicable | ||||
| Principal Occupation During at Least the Past 5 Years: | ||||||||
| Senior Vice President, Franklin Templeton Services, LLC; officer of 41 of the investment companies in Franklin Templeton; andformerly,Vice President, Global Tax (2012-April 2017) and Treasurer/Assistant Treasurer, Franklin Templeton (2009-2017). | ||||||||
Robert G. Kubilis (1973) 300 S.E. 2nd Street Fort Lauderdale, FL 33301-1923 | Chief Financial Officer, Chief Accounting Officer and Treasurer | Since 2012 | Not Applicable | Not Applicable | ||||
| Principal Occupation During at Least the Past 5 Years: | ||||||||
| Treasurer, U.S. Fund Administration & Reporting; and officer of 15 of the investment companies in Franklin Templeton. | ||||||||
40 | Annual Report | franklintempleton.com | ||
FRANKLIN MUTUAL SERIES FUNDS
Interested Board Members and Officers(continued)
Name, Year of Birth and Address | Position | Length of Time Served | Number of Portfolios in Fund Complex Overseen by Board Member* | Other Directorships Held During at Least the Past 5 Years | ||||
Robert Lim (1948) One Franklin Parkway San Mateo, CA 94403-1906 | Vice President – AML Compliance | Since 2016 | Not Applicable | Not Applicable | ||||
| Principal Occupation During at Least the Past 5 Years: | ||||||||
| Vice President, Franklin Templeton Companies, LLC; Chief Compliance Officer, Franklin Templeton Distributors, Inc. and Franklin Templeton Investor Services, LLC; and officer of 44 of the investment companies in Franklin Templeton Investments. | ||||||||
Navid J. Tofigh (1972) One Franklin Parkway San Mateo, CA 94403-1906 | Vice President | Since 2015 | Not Applicable | Not Applicable | ||||
| Principal Occupation During at Least the Past 5 Years: | ||||||||
| Associate General Counsel; and officer of 41 of the investment companies in Franklin Templeton. | ||||||||
Craig S. Tyle (1960) One Franklin Parkway San Mateo, CA 94403-1906 | Vice President | Since 2005 | Not Applicable | Not Applicable | ||||
| Principal Occupation During at Least the Past 5 Years: | ||||||||
| General Counsel and Executive Vice President, Franklin Resources, Inc.; and officer of some of the other subsidiaries of Franklin Resources, Inc. and of 41 of the investment companies in Franklin Templeton. | ||||||||
Lori A. Weber (1964) 300 S.E. 2nd Street Fort Lauderdale, FL 33301-1923 | Vice President | Since 2011 | Not Applicable | Not Applicable | ||||
| Principal Occupation During at Least the Past 5 Years: | ||||||||
| Senior Associate General Counsel, Franklin Templeton; Assistant Secretary, Franklin Resources, Inc.; Vice President and Secretary, Templeton Investment Counsel, LLC; and officer of 41 of the investment companies in Franklin Templeton. | ||||||||
| franklintempleton.com | Annual Report | 41 | ||
FRANKLIN MUTUAL SERIES FUNDS
*We base the number of portfolios on each separate series of the U.S. registered investment companies within the Franklin Templeton Investments fund complex. These portfolios have a common investment manager or affiliated investment managers.
**Gregory E. Johnson is considered to be an interested person of the Fund under the federal securities laws due to his position as an officer and director of Franklin Resources, Inc. (Resources), which is the parent company of the Fund’s investment manager and distributor. Peter A. Langerman is considered to be an interested person of the Fund under the federal securities laws due to his position as an officer of Franklin Mutual Advisers, LLC, which is the Fund’s investment manager.
Note 1: Officer information is current as of the date of this report. It is possible that after this date, information about officers may change.
The Sarbanes-Oxley Act of 2002 and Rules adopted by the U.S. Securities and Exchange Commission require the Fund to disclose whether the Fund’s Audit Committee includes at least one member who is an audit committee financial expert within the meaning of such Act and Rules. The Fund’s Board has determined that there is at least one such financial expert on the Audit Committee and has designated each of Edward I. Altman, Ph.D., Ann Torre Bates and David W. Niemiec as an audit committee financial expert. The Board believes that Messrs. Altman and Niemiec and Ms. Bates qualify as such an expert in view of their extensive business background and experience. Mr. Altman has served as a member of the Fund Audit Committee since 1987. He currently serves as a Max L. Hine Professor of Finance, Emeritus and Director of The Credit and Debt Markets Research Program, Salomon Center, Stern School of Business, New York University. Ms. Bates has served as a member of the Fund Audit Committee since 1995. She currently serves as a director of Ares Capital Corporation (2010-present) and United Natural Foods, Inc. (2013-present) and was formerly a director of Navient Corporation from 2014 to 2016, SLM Corporation from 1997 to 2014 and Allied Capital Corporation from 2003 to 2010, Executive Vice President and Chief Financial Officer of NHP Incorporated from 1995 to 1997 and Vice President and Treasurer of US Airways, Inc. until 1995. Mr. Niemiec has served as a member of the Fund Audit Committee since 2015, currently serves as an Advisor to Saratoga Partners and was formerly its Managing Director from 1998 to 2001 and serves as a director of Hess Midstream LP (2017-present). Mr. Niemiec was formerly a director of Emeritus Corporation from 1999 to 2010 and OSI Pharmaceuticals, Inc. from 2006 to 2010, Managing Director of SBC Warburg Dillon Read from 1997 to 1998, and was Vice Chairman from 1991 to 1997 and Chief Financial Officer from 1982 to 1997 of Dillon, Read & Co. Inc. As a result of such background and experience, the Board believes that Messrs. Altman and Niemiec and Ms. Bates have each acquired an understanding of generally accepted accounting principles and financial statements, the general application of such principles in connection with the accounting estimates, accruals and reserves, and analyzing and evaluating financial statements that present a breadth and level of complexity of accounting issues generally comparable to those of the Fund, as well as an understanding of internal controls and procedures for financial reporting and an understanding of audit committee functions. Messrs. Altman and Niemiec and Ms. Bates are independent Board members as that term is defined under the applicable U.S. Securities and Exchange Commission Rules and Releases.
The Statement of Additional Information (SAI) includes additional information about the board members and is available, without charge, upon request. Shareholders may call (800) DIAL BEN/342-5236 to request the SAI.
42 | Annual Report | franklintempleton.com | ||
FRANKLIN MUTUAL SERIES FUNDS
FRANKLIN MUTUAL INTERNATIONAL FUND
Proxy Voting Policies and Procedures
The Fund’s investment manager has established Proxy Voting Policies and Procedures (Policies) that the Fund uses to determine how to vote proxies relating to portfolio securities. Shareholders may view the Fund’s complete Policies online at franklintempleton.com. Alternatively, shareholders may request copies of the Policies free of charge by calling the Proxy Group collect at (954) 527-7678 or by sending a written request to: Franklin Templeton Companies, LLC, 300 S.E. 2nd Street, Fort Lauderdale, FL 33301, Attention: Proxy Group. Copies of the Fund’s proxy voting records are also made available online at franklintempleton.com and posted on the U.S. Securities and Exchange Commission’s website at sec.gov and reflect the most recent 12-month period ended June 30.
Quarterly Statement of Investments
The Trust, on behalf of the Fund, files a complete statement of investments with the U.S. Securities and Exchange Commission for the first and third quarters for each fiscal year as an exhibit to its report on Form N-PORT. Shareholders may view the filed Form N-PORT by visiting the Commission’s website at sec.gov. The filed form may also be viewed and copied at the Commission’s Public Reference Room in Washington, DC. Information regarding the operations of the Public Reference Room may be obtained by calling (800) SEC-0330.
Householding of Reports and Prospectuses
You will receive the Fund’s financial reports every six months as well as an annual updated summary prospectus (prospectus available upon request). To reduce Fund expenses, we try to identify related shareholders in a household and send only one copy of the financial reports and summary prospectus. This process, called “householding,” will continue indefinitely unless you instruct us otherwise. If you prefer not to have these documents householded, please call us at (800) 632-2301. At any time you may view current prospectuses/summary prospectuses and financial reports on our website. If you choose, you may receive these documents through electronic delivery.
| franklintempleton.com | Annual Report | 43 | ||||
This page intentionally left blank.
Authorized for distribution only when accompanied or preceded by a summary prospectus and/or prospectus. Investors should carefully consider a fund’s investment goals, risks, charges and expenses before investing. A prospectus contains this and other information; please read it carefully before investing.
To help ensure we provide you with quality service, all calls to and from our service areas are monitored and/or recorded.
 | Annual Report and Shareholder Letter Franklin Mutual International Fund | |||||
| Investment Manager | Distributor | Shareholder Services | ||||
| Franklin Mutual Advisers, LLC | Franklin Templeton Distributors, Inc. (800) DIAL BEN® / 342-5236 franklintempleton.com | (800) 632-2301 - (Class A, C, R & R6) (800) 448-FUND - (Class Z) | ||||
| © 2020 Franklin Templeton Investments. All rights reserved. | 373 A 02/20 |
| Item 2. | Code of Ethics. |
(a) The Registrant has adopted a code of ethics that applies to its principal executive officers and principal financial and accounting officer.
(c) N/A
(d) N/A
(f) Pursuant to Item 13(a)(1), the Registrant is attaching as an exhibit a copy of its code of ethics that applies to its principal executive officers and principal financial and accounting officer.
| Item 3. | Audit Committee Financial Expert. |
(a)(1) The Registrant has an audit committee financial expert serving on its audit committee.
(2) The audit committee financial experts are Edward I. Altman, Ann Torre Bates and David W. Niemiec and they are “independent” as defined under the relevant Securities and Exchange Commission Rules and Releases.
| Item 4. | Principal Accountant Fees and Services. |
(a) Audit Fees
The aggregate fees paid to the principal accountant for professional services rendered by the principal accountant for the audit of the registrant’s annual financial statements or for services that are normally provided by the principal accountant in connection with statutory and regulatory filings or engagements were $466,362 for the fiscal year ended December 31, 2019 and $457,217 for the fiscal year ended December 31, 2018.
(b) Audit-Related Fees
There were no fees paid to the principal accountant for assurance and related services rendered by the principal accountant to the registrant that are reasonably related to the performance of the audit of the registrant’s financial statements and are not reported under paragraph (a) of Item 4.
There were no fees paid to the principal accountant for assurance and related services rendered by the principal accountant to the registrant’s investment adviser and any entity controlling, controlled by or under common control with the investment adviser that provides ongoing services to the registrant that are reasonably related to the performance of the audit of their financial statements.
(c) Tax Fees
The aggregate fees paid to the principal accountant for professional services rendered by the principal accountant to the registrant for tax compliance, tax advice and tax planning were $22,310 the fiscal year ended December 31, 2019 and $20,026 for the fiscal year ended December 31, 2018. The services for which these fees were paid included identifying passive foreign investment companies to manage exposure to tax liabilities and India tax compliance services.
The aggregate fees paid to the principal accountant for professional services rendered by the principal accountant to the registrant’s investment adviser and any entity controlling, controlled by or under common control with the investment adviser that provides ongoing services to the registrant for tax compliance, tax advice and tax planning were $70,000 for the fiscal year ended December 31, 2019 and $70,000 for the fiscal year ended December 31, 2018. The services for which these fees were paid included technical tax consultation for withholding tax report to foreign governments, application of local country tax laws and tax advice.
(d) All Other Fees
The aggregate fees paid to the principal accountant for products and services rendered by the principal accountant to the registrant not reported in paragraphs (a)-(c) of Item 4 were $0 for the fiscal year ended December 31, 2019 and $25,000 for the fiscal year ended December 31, 2018. The services for which these fees were paid included additional procedures performed as a result of a material weakness identified during the 2017 audit.
There were no fees paid to the principal accountant for products and services rendered by the principal accountant to the registrant’s investment adviser and any entity controlling, controlled by or under
common control with the investment adviser that provides ongoing services to the registrant other than the services reported in paragraphs (a)-(c) of Item 4.
(e) (1) The registrant’s audit committee is directly responsible for approving the services to be provided by the auditors, including:
(i) pre-approval of all audit and audit related services;
(ii) pre-approval of allnon-audit related services to be provided to the Fund by the auditors;
(iii) pre-approval of allnon-audit related services to be provided to the registrant by the auditors to the registrant’s investment adviser or to any entity that controls, is controlled by or is under common control with the registrant’s investment adviser and that provides ongoing services to the registrant where thenon-audit services relate directly to the operations or financial reporting of the registrant; and
(iv) establishment by the audit committee, if deemed necessary or appropriate, as an alternative to committeepre-approval of services to be provided by the auditors, as required by paragraphs (ii) and (iii) above, of policies and procedures to permit such services to bepre-approved by other means, such as through establishment of guidelines or by action of a designated member or members of the committee; provided the policies and procedures are detailed as to the particular service and the committee is informed of each service and such policies and procedures do not include delegation of audit committee responsibilities, as contemplated under the Securities Exchange Act of 1934, to management; subject, in the case of (ii) through (iv), to any waivers, exceptions or exemptions that may be available under applicable law or rules.
(e) (2) None of the services provided to the registrant described in paragraphs (b)-(d) of Item 4 were approved by the audit committee pursuant to paragraph (c)(7)(i)(C) of Rule2-01 of regulationS-X.
(f) No disclosures are required by this Item 4(f).
(g) The aggregatenon-audit fees paid to the principal accountant for services rendered by the principal accountant to the registrant and the registrant’s investment adviser and any entity controlling, controlled by or under common control with the investment adviser that provides ongoing services to the registrant were $92,310 for the fiscal year ended December 31, 2019 and $115,026 for the fiscal year ended December 31, 2018.
(h) The registrant’s audit committee of the board has considered whether the provision ofnon-audit services that were rendered to the registrant’s investment adviser (not including anysub-adviser whose role is primarily portfolio management and is subcontracted with or overseen by another investment adviser), and any entity controlling, controlled by, or under common control with the investment adviser that provides ongoing services to the registrant that were notpre-approved pursuant to paragraph (c)(7)(ii) of Rule2-01 of RegulationS-X is compatible with maintaining the principal accountant’s independence.
| Item 5. | Audit Committee of Listed Registrants. N/A |
| Item 6. | Schedule of Investments. N/A |
| Item 7. | Disclosure of Proxy Voting Policies and Procedures forClosed-End Management Investment Companies. N/A |
| Item 8. | Portfolio Managers ofClosed-End Management Investment Companies. N/A |
| Item 9. | Purchases of Equity Securities byClosed-End Management Investment Company and Affiliated Purchasers. N/A |
| Item 10. | Submission of Matters to a Vote of Security Holders. |
There have been no changes to the procedures by which shareholders may recommend nominees to the Registrant’s Board of Trustees that would require disclosure herein.
| Item 11. | Controls and Procedures. |
(a)Evaluation of Disclosure Controls and Procedures The Registrant maintains disclosure controls and procedures that are designed to provide reasonable assurance that information required to be disclosed in the Registrant’s filings under the Securities Exchange Act of 1934, as amended, and the Investment Company Act of 1940 is recorded, processed, summarized and reported within the periods specified in the rules and forms of the Securities and Exchange Commission. Such information is accumulated and communicated to the Registrant’s management, including its principal executive officer and principal financial officer, as appropriate, to allow timely decisions regarding required disclosure. The Registrant’s management, including the principal executive officer and the principal financial officer, recognizes that any set of controls and procedures, no matter how well designed and operated, can provide only reasonable assurance of achieving the desired control objectives.
Within 90 days prior to the filing date of this Shareholder Report onForm N-CSR, the Registrant had carried out an evaluation, under the supervision and with the participation of the Registrant’s management, including the Registrant’s principal executive officer and the Registrant’s principal financial officer, of the effectiveness of the design and operation of the Registrant’s disclosure controls and procedures. Based on such evaluation, the Registrant’s principal executive officer and principal financial officer concluded that the Registrant’s disclosure controls and procedures are effective.
(b) Changes in Internal Controls. There have been no changes in the Registrant’s internal control over financial reporting that occurred during the period covered by this report that has materially affected, or is reasonably likely to materially affect the internal control over financial reporting.
| Item 12. | Disclosure of Securities Lending Activities forClosed-End Management Investment Company. N/A |
| Item 13. | Exhibits. |
(a)(1) Code of Ethics
(a)(2) Certifications pursuant to Section 302 of the Sarbanes-Oxley Act of 2002 of Matthew T. Hinkle, Chief Executive Officer - Finance and Administration, and Robert G. Kubilis, Chief Financial Officer and Chief Accounting Officer
(b)Certifications pursuant to Section 906 of the Sarbanes-Oxley Act of 2002 of Matthew T. Hinkle, Chief Executive Officer - Finance and Administration, and Robert G. Kubilis, Chief Financial Officer and Chief Accounting Officer
SIGNATURES
Pursuant to the requirements of the Securities Exchange Act of 1934 and the Investment Company Act of 1940, the registrant has duly caused this report to be signed on its behalf by the undersigned, thereunto duly authorized.
| FRANKLIN MUTUAL SERIES FUNDS | ||
| By | S\MATTHEW T. HINKLE | |
| Matthew T. Hinkle | ||
| Chief Executive Officer – Finance and Administration | ||
| Date | February 28, 2020 | |
Pursuant to the requirements of the Securities Exchange Act of 1934 and the Investment Company Act of 1940, this report has been signed below by the following persons on behalf of the registrant and in the capacities and on the dates indicated.
| By | S\MATTHEW T. HINKLE | |
| Matthew T. Hinkle | ||
| Chief Executive Officer – Finance and Administration | ||
| Date | February 28, 2020 | |
| By | S\ROBERT G. KUBILIS | |
| Robert G. Kubilis | ||
| Chief Financial Officer and Chief Accounting Officer | ||
| Date | February 28, 2020 | |