Exhibit 99.03
Link to searchable text of slide shown above
Link to searchable text of slide shown above
Link to searchable text of slide shown above
Link to searchable text of slide shown above
Link to searchable text of slide shown above
Link to searchable text of slide shown above
Link to searchable text of slide shown above

Link to searchable text of slide shown above

Link to searchable text of slide shown above
Link to searchable text of slide shown above
Link to searchable text of slide shown above
Link to searchable text of slide shown above
Link to searchable text of slide shown above
Link to searchable text of slide shown above

Link to searchable text of slide shown above
Link to searchable text of slide shown above
Link to searchable text of slide shown above
Link to searchable text of slide shown above
Link to searchable text of slide shown above
Link to searchable text of slide shown above
Link to searchable text of slide shown above
Link to searchable text of slide shown above
Link to searchable text of slide shown above

Link to searchable text of slide shown above
Link to searchable text of slide shown above

Link to searchable text of slide shown above

Link to searchable text of slide shown above

Link to searchable text of slide shown above
Link to searchable text of slide shown above
Link to searchable text of slide shown above

Link to searchable text of slide shown above
Link to searchable text of slide shown above

Link to searchable text of slide shown above

Link to searchable text of slide shown above
Link to searchable text of slide shown above
Link to searchable text of slide shown above

Link to searchable text of slide shown above
Link to searchable text of slide shown above

Link to searchable text of slide shown above
Link to searchable text of slide shown above

Link to searchable text of slide shown above
Link to searchable text of slide shown above
Link to searchable text of slide shown above

Link to searchable text of slide shown above

Link to searchable text of slide shown above
Searchable text section of graphics shown above
[GRAPHIC]
| www.alliancecapital.com |
[LOGO] | |
| January 25, 2006 |
Fourth-Quarter 2005 Review
Lewis A. Sanders | | Gerald M. Lieberman |
Chairman & Chief Executive Officer | | President & Chief Operating Officer |
Any forecasts or opinions in this material may not be realized. Information should not be construed as investment advice.
In light of Regulation FD, management will be limited in responding to inquiries from investors or analysts in a non-public forum.
Forward-Looking Statements
Certain statements in this presentation are “forward-looking statements” within the meaning of the Private Securities Litigation Reform Act of 1995. Such forward-looking statements are subject to risks, uncertainties, and other factors that could cause actual results to differ materially from future results expressed or implied by such forward-looking statements. The most significant of these factors include, but are not limited to, the following: the performance of financial markets, the investment performance we achieve for our clients, general economic conditions, future acquisitions, competitive conditions and government regulations, including changes in tax rates. We caution readers to carefully consider such forward-looking statements in light of these factors. Further, such forward-looking statements speak only as of the date on which such statements are made; we have no obligation to update any forward-looking statements to reflect events or circumstances after the date of such statements. For further information regarding these forward-looking statements and the factors that could cause actual results to differ, see “Risk Factors” in Item I of Form 10-K for the year ended December 31, 2004. Any or all of the forward-looking statements that we make in Form 10-K, this presentation, or any other public statements we issue may turn out to be wrong. Please remember that factors other than those listed in “Risk Factors” could also adversely affect our business, operating results, or financial condition.
The forward-looking statements we make in this presentation include descriptions of certain 2006 initiatives. Some or all of these initiatives may not be achieved due to management’s subsequent determination that other activities are a better use of company resources and/or unanticipated changes in global regulatory and investment environments.
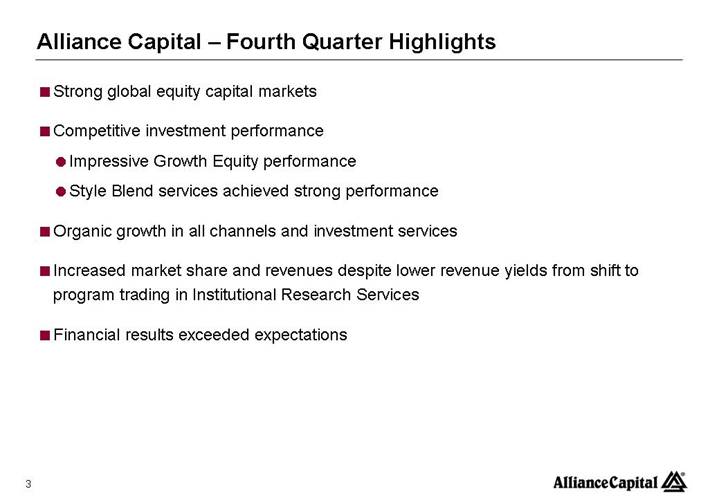
Alliance Capital - Fourth Quarter Highlights
• Strong global equity capital markets
• Competitive investment performance
• Impressive Growth Equity performance
• Style Blend services achieved strong performance
• Organic growth in all channels and investment services
• Increased market share and revenues despite lower revenue yields from shift to program trading in Institutional Research Services
• Financial results exceeded expectations
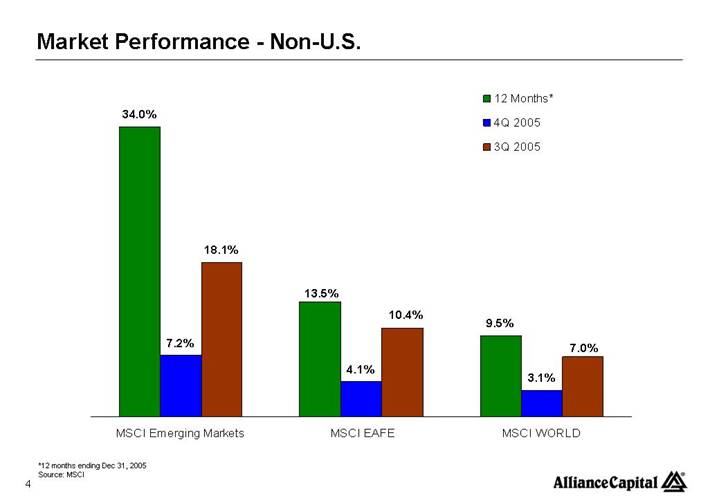
Market Performance - Non-U.S.
[CHART]
*12 months ending Dec 31, 2005
Source: MSCI
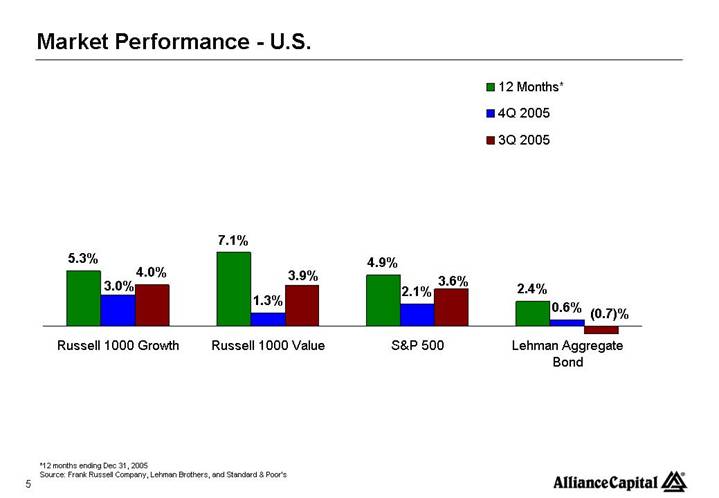
Market Performance - U.S.
[CHART]
*12 months ending Dec 31, 2005
Source: Frank Russell Company, Lehman Brothers, and Standard & Poor’s
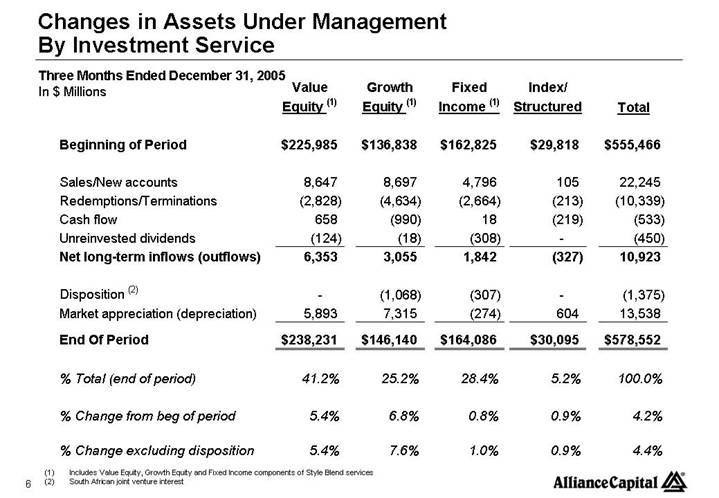
Changes in Assets Under Management
By Investment Service
Three Months Ended December 31, 2005
In $ Millions
| | Value | | Growth | | Fixed | | Index/ | | | |
| | Equity (1) | | Equity (1) | | Income (1) | | Structured | | Total | |
| | | | | | | | | | | |
Beginning of Period | | $ | 225,985 | | $ | 136,838 | | $ | 162,825 | | $ | 29,818 | | $ | 555,466 | |
| | | | | | | | | | | |
Sales/New accounts | | 8,647 | | 8,697 | | 4,796 | | 105 | | 22,245 | |
Redemptions/Terminations | | (2,828 | ) | (4,634 | ) | (2,664 | ) | (213 | ) | (10,339 | ) |
Cash flow | | 658 | | (990 | ) | 18 | | (219 | ) | (533 | ) |
Unreinvested dividends | | (124 | ) | (18 | ) | (308 | ) | - | | (450 | ) |
Net long-term inflows (outflows) | | 6,353 | | 3,055 | | 1,842 | | (327 | ) | 10,923 | |
| | | | | | | | | | | |
Disposition (2) | | - | | (1,068 | ) | (307 | ) | - | | (1,375 | ) |
Market appreciation (depreciation) | | 5,893 | | 7,315 | | (274 | ) | 604 | | 13,538 | |
| | | | | | | | | | | |
End Of Period | | $ | 238,231 | | $ | 146,140 | | $ | 164,086 | | $ | 30,095 | | $ | 578,552 | |
| | | | | | | | | | | |
% Total (end of period) | | 41.2 | % | 25.2 | % | 28.4 | % | 5.2 | % | 100.0 | % |
| | | | | | | | | | | |
% Change from beg of period | | 5.4 | % | 6.8 | % | 0.8 | % | 0.9 | % | 4.2 | % |
| | | | | | | | | | | |
% Change excluding disposition | | 5.4 | % | 7.6 | % | 1.0 | % | 0.9 | % | 4.4 | % |
(1) Includes Value Equity, Growth Equity and Fixed Income components of Style Blend services
(2) South African joint venture interest
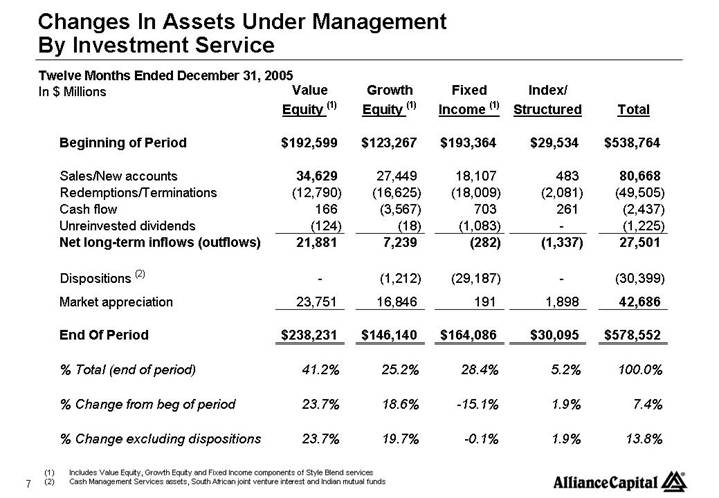
Changes In Assets Under Management
Twelve Months Ended December 31, 2005
In $ Millions
| | Value | | Growth | | Fixed | | Index/ | | | |
| | Equity (1) | | Equity (1) | | Income (1) | | Structured | | Total | |
| | | | | | | | | | | |
Beginning of Period | | $ | 192,599 | | $ | 123,267 | | $ | 193,364 | | $ | 29,534 | | $ | 538,764 | |
| | | | | | | | | | | |
Sales/New accounts | | 34,629 | | 27,449 | | 18,107 | | 483 | | 80,668 | |
Redemptions/Terminations | | (12,790 | ) | (16,625 | ) | (18,009 | ) | (2,081 | ) | (49,505 | ) |
Cash flow | | 166 | | (3,567 | ) | 703 | | 261 | | (2,437 | ) |
Unreinvested dividends | | (124 | ) | (18 | ) | (1,083 | ) | - | | (1,225 | ) |
Net long-term inflows (outflows) | | 21,881 | | 7,239 | | (282 | ) | (1,337 | ) | 27,501 | |
| | | | | | | | | | | |
Dispositions (2) | | - | | (1,212 | ) | (29,187 | ) | - | | (30,399 | ) |
Market appreciation | | 23,751 | | 16,846 | | 191 | | 1,898 | | 42,686 | |
| | | | | | | | | | | |
End Of Period | | $ | 238,231 | | $ | 146,140 | | $ | 164,086 | | $ | 30,095 | | $ | 578,552 | |
| | | | | | | | | | | |
% Total (end of period) | | 41.2 | % | 25.2 | % | 28.4 | % | 5.2 | % | 100.0 | % |
| | | | | | | | | | | |
% Change from beg of period | | 23.7 | % | 18.6 | % | -15.1 | % | 1.9 | % | 7.4 | % |
| | | | | | | | | | | |
% Change excluding dispositions | | 23.7 | % | 19.7 | % | -0.1 | % | 1.9 | % | 13.8 | % |
(1) Includes Value Equity, Growth Equity and Fixed Income components of Style Blend services
(2) Cash Management Services assets, South African joint venture interest and Indian mutual funds
Institutional Investment—
Fourth Quarter Highlights
• Continuing strong net inflows into Global and International services
• Flows well-diversified geographically (North America, EMEA, Asia Pacific)
• Continuing strong flows into Style Blend
2006 Initiatives
• Build-up of infrastructure in Asia-Pacific
• Continued expansion in continental Europe
| | Ended December 31, 2005 | |
(In $ Billions) | | 3 months | | 12 months | |
| | | | | |
Beginning AUM | | $ | 342 | | $ | 311 | |
| | | | | |
Net Flows | | 9 | | 20 | |
| | | | | |
Disposition (1) | | (1 | ) | (1 | ) |
| | | | | |
Transfers (2) | | 1 | | 1 | |
| | | | | |
Market Appreciation | | 8 | | 28 | |
| | | | | |
Ending AUM | | $ | 359 | | $ | 359 | |
| | | | | |
% Total | | 62.0 | % | 62.0 | % |
% Change | | 4.8 | % | 15.2 | % |
(1) South African joint venture interest
(2) Approximately $570 million from Private Client
Retail—
Fourth Quarter Highlights
• Non-U.S. net inflows consistently strong
• Improving U.S. fund sales reduced net outflows
• Separately Managed Account business strengthened
• Wealth Strategies reached $3 billion in assets
2006 Initiatives
• Rebuild and enhance Retail presence in Japan
• Upgrade and enlarge U.S. sales force
| | Ended December 31, 2005 | |
(In $ Billions) | | 3 months | | 12 months | |
| | | | | |
Beginning AUM | | $ | 140 | | $ | 164 | |
| | | | | |
Net Flows | | 1 | | 1 | |
| | | | | |
Dispositions (1) | | - | | (29 | ) |
| | | | | |
Market Appreciation | | 4 | | 9 | |
| | | | | |
Ending AUM | | $ | 145 | | $ | 145 | |
| | | | | |
% Total | | 25.1 | % | 25.1 | % |
% Change | | 3.4 | % | -11.3 | % |
% Change ex. Dispositions | | 3.4 | % | 7.6 | % |
(1) Cash Management Services assets and Indian mutual funds
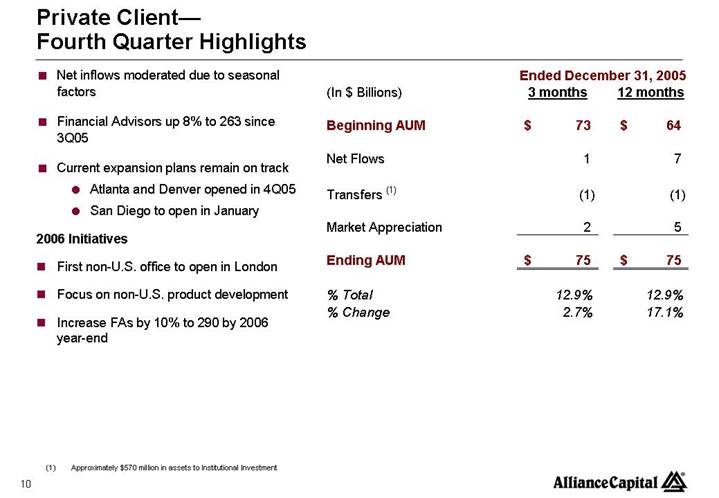
Private Client—
Fourth Quarter Highlights
• Net inflows moderated due to seasonal Factors
• Financial Advisors up 8% to 263 since 3Q05
• Current expansion plans remain on track
• Atlanta and Denver opened in 4Q05
• San Diego to open in January
2006 Initiatives
• First non-U.S. office to open in London
• Focus on non-U.S. product development
• Increase FAs by 10% to 290 by 2006 year-end
| | Ended December 31, 2005 | |
(In $ Billions) | | 3 months | | 12 months | |
| | | | | |
Beginning AUM | | $ | 73 | | $ | 64 | |
| | | | | |
Net Flows | | 1 | | 7 | |
| | | | | |
Transfers (1) | | (1 | ) | (1 | ) |
| | | | | |
Market Appreciation | | 2 | | 5 | |
| | | | | |
Ending AUM | | $ | 75 | | $ | 75 | |
| | | | | |
% Total | | 12.9 | % | 12.9 | % |
% Change | | 2.7 | % | 17.1 | % |
(1) Approximately $570 million in assets to Institutional Investment
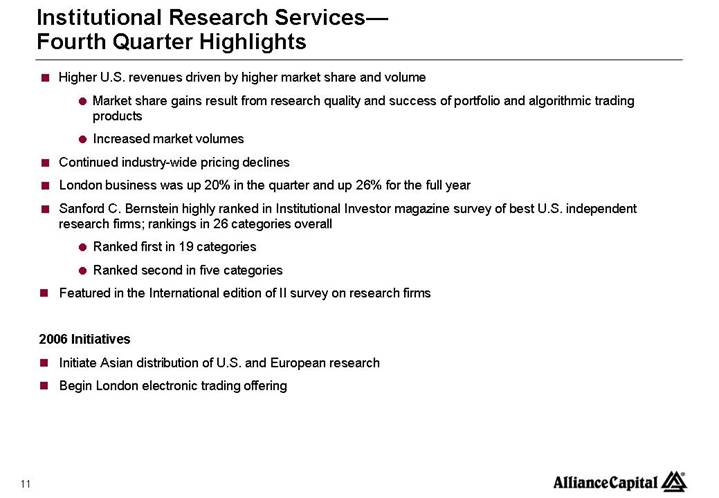
Institutional Research Services—
Fourth Quarter Highlights
• Higher U.S. revenues driven by higher market share and volume
• Market share gains result from research quality and success of portfolio and algorithmic trading products
• Increased market volumes
• Continued industry-wide pricing declines
• London business was up 20% in the quarter and up 26% for the full year
• Sanford C. Bernstein highly ranked in Institutional Investor magazine survey of best U.S. independent research firms; rankings in 26 categories overall
• Ranked first in 19 categories
• Ranked second in five categories
• Featured in the International edition of II survey on research firms
2006 Initiatives
• Initiate Asian distribution of U.S. and European research
• Begin London electronic trading offering
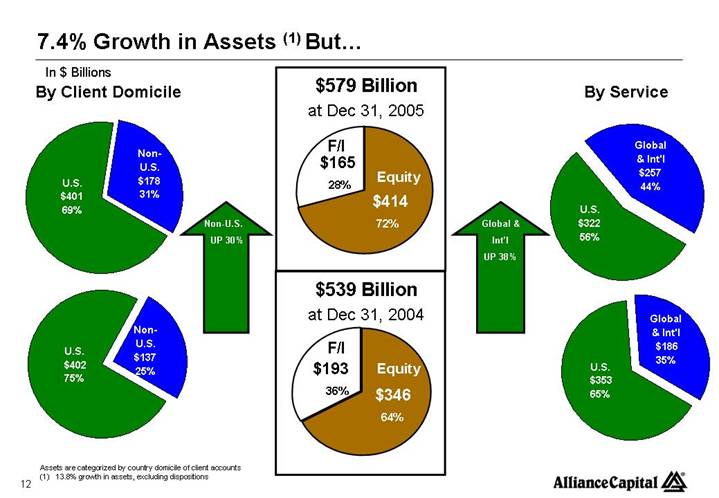
7.4% Growth in Assets (1) But…
In $ Billions
By Client Domicile | | $579 Billion
at Dec 31, 2005 | | By Service |
| | | | |
[CHART] | | [CHART] | | [CHART] |
| Non-U.S. UP 30% | | Global & Int’l UP 38% | |
| | $539 Billion
at Dec 31, 2004 | | |
| | | | |
[CHART] | | [CHART] | | [CHART] |
Assets are categorized by country domicile of client accounts
(1) 13.8% growth in assets, excluding dispositions
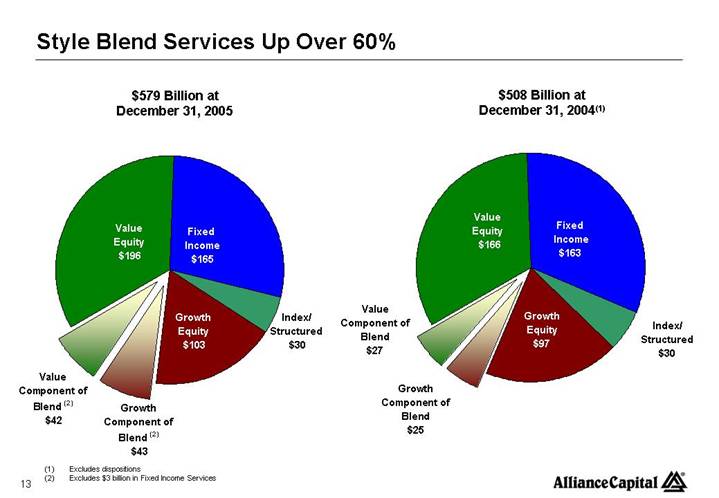
Style Blend Services Up Over 60%
$579 Billion at
December 31, 2005 | | $508 Billion at
December 31, 2004(1) |
| | |
[CHART] | | [CHART] |
(1) Excludes dispositions
(2) Excludes $3 billion in Fixed Income Services
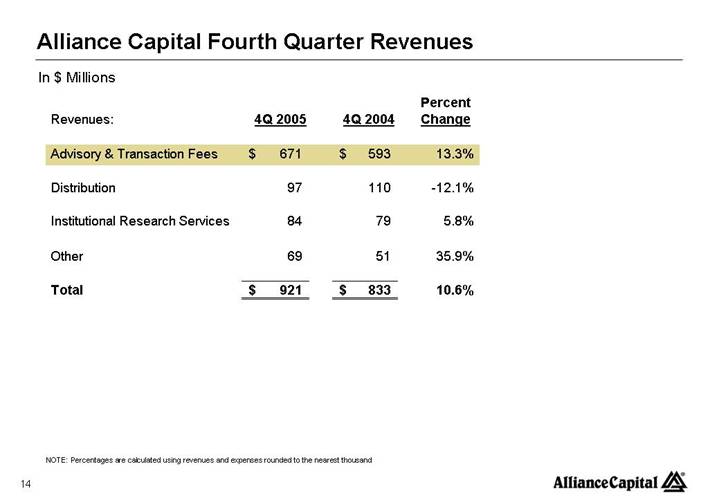
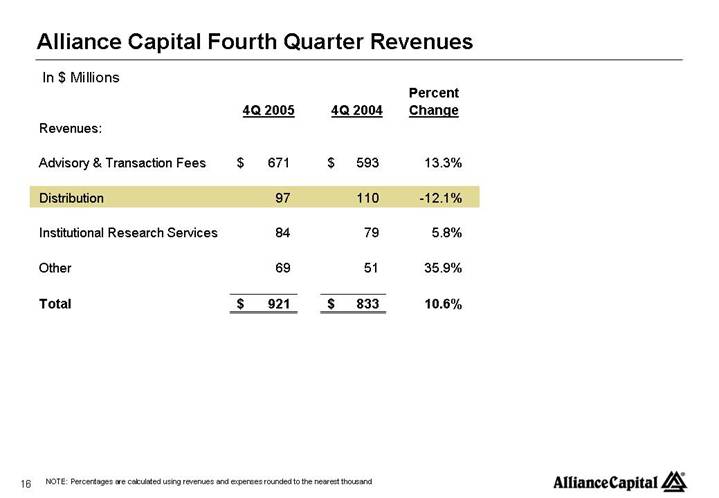
Alliance Capital Fourth Quarter Revenues
In $ Millions
| | | | | | Percent | |
| | 4Q 2005 | | 4Q 2004 | | Change | |
| | | | | | | |
Revenues: | | | | | | | |
| | | | | | | |
Advisory & Transaction Fees | | $ | 671 | | $ | 593 | | 13.3 | % |
| | | | | | | |
Distribution | | 97 | | 110 | | -12.1 | % |
| | | | | | | |
Institutional Research Services | | 84 | | 79 | | 5.8 | % |
| | | | | | | |
Other | | 69 | | 51 | | 35.9 | % |
| | | | | | | |
Total | | $ | 921 | | $ | 833 | | 10.6 | % |
NOTE: Percentages are calculated using revenues and expenses rounded to the nearest thousand
Alliance Capital Fourth Quarter Advisory &
Transaction Fees
In $ Millions
| | | | | | Percent | | |
| | 4Q 2005 | | 4Q 2004 | | Change | | |
| | | | | | | | |
By Fee Type: | | | | | | | | |
| | | | | | | | |
Base Fees | | $ | 576 | | $ | 489 | | 17.8 | % | • Higher average AUM |
| | | | | | | | |
Transaction Charges | | 3 | | 26 | | -86.5 | % | • New Private Client fee structure |
| | | | | | | | |
Performance Fees | | 92 | | 78 | | 18.8 | % | • Higher Value Equity and hedge products |
| | | | | | | | partially offset by lower Fixed |
| | | | | | | | Income |
Total | | $ | 671 | | $ | 593 | | 13.3 | % | |
| | | | | | | | |
By Channel: | | | | | | | | |
| | | | | | | | |
Institutional | | $ | 266 | | $ | 204 | | 30.7 | % | • Higher average AUM |
| | | | | | | | |
Private Client | | 225 | | 205 | | 9.8 | % | • Higher billable AUM |
| | | | | | | | |
Retail | | 180 | | 184 | | -2.0 | % | • Disposition of CMS, partly offset by |
| | | | | | | | higher average AUM |
Total | | $ | 671 | | $ | 593 | | 13.3 | % | |
NOTE: Percentages are calculated using revenues and expenses rounded to the nearest thousand
Alliance Capital Fourth Quarter Revenues
In $ Millions
| | | | | | Percent | |
| | 4Q 2005 | | 4Q 2004 | | Change | |
| | | | | | | |
Revenues: | | | | | | | |
| | | | | | | |
Advisory & Transaction Fees | | $ | 671 | | $ | 593 | | 13.3 | % |
| | | | | | | |
Distribution | | 97 | | 110 | | -12.1 | % |
| | | | | | | |
Institutional Research Services | | 84 | | 79 | | 5.8 | % |
| | | | | | | |
Other | | 69 | | 51 | | 35.9 | % |
| | | | | | | |
Total | | $ | 921 | | $ | 833 | | 10.6 | % |
NOTE: Percentages are calculated using revenues and expenses rounded to the nearest thousand
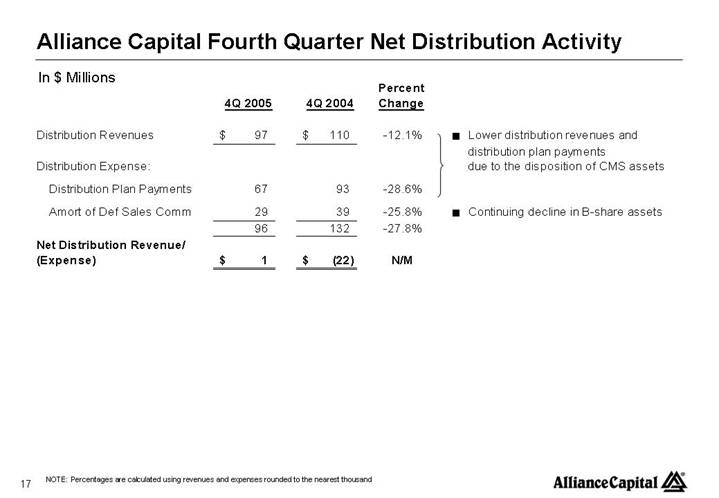
Alliance Capital Fourth Quarter Net Distribution Activity
In $ Millions
| | | | | | Percent | | | | |
| | 4Q 2005 | | 4Q 2004 | | Change | | | | |
| | | | | | | | | | |
Distribution Revenues | | $ | 97 | | $ | 110 | | -12.1 | % | 
| • Lower distribution revenues and | |
| | | | | | | | distribution plan payments | |
Distribution Expense: | | | | | | | | Due to the disposition of CMS assets | |
Distribution Plan Payments | | 67 | | 93 | | -28.6 | % | | |
Amort of Def Sales Comm | | 29 | | 39 | | -25.8 | % | | • Continuing decline in B-share assets | |
| | 96 | | 132 | | -27.8 | % | | | |
Net Distribution Revenue/(Expense) | | $ | 1 | | $ | (22 | ) | N/M | | | | |
NOTE: Percentages are calculated using revenues and expenses rounded to the nearest thousand
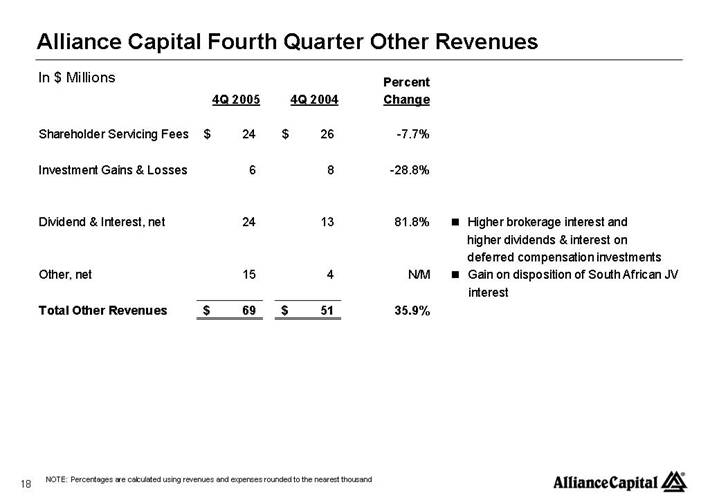
Alliance Capital Fourth Quarter Other Revenues
In $ Millions
| | | | | | Percent | | | | |
| | 4Q 2005 | | 4Q 2004 | | Change | | | | |
| | | | | | | | | | |
Shareholder Servicing Fees | | $ | 24 | | $ | 26 | | -7.7 | % | | | |
| | | | | | | | | | |
Investment Gains & Losses | | 6 | | 8 | | -28.8 | % | | | |
| | | | | | | | | | |
Dividend & Interest, net | | 24 | | 13 | | 81.8 | % | | • Higher brokerage interest and | |
| | | | | | | | | higher dividends & interest on | |
| | | | | | | | | deferred compensation investments | |
Other, net | | 15 | | 4 | | N/M | | | • Gain on disposition of South African JV | |
| | | | | | | | | Interest | |
Total Other Revenues | | $ | 69 | | $ | 51 | | 35.9 | % | | | |
NOTE: Percentages are calculated using revenues and expenses rounded to the nearest thousand
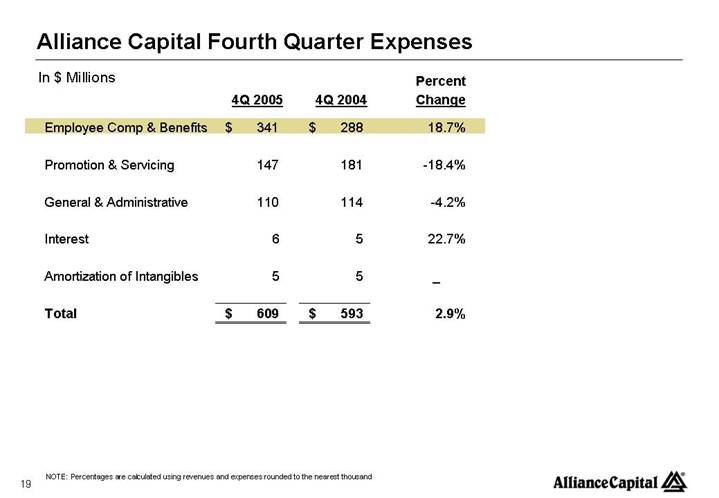
Alliance Capital Fourth Quarter Expenses
In $ Millions
| | | | | | Percent | |
| | 4Q 2005 | | 4Q 2004 | | Change | |
| | | | | | | |
Employee Comp & Benefits | | $ | 341 | | $ | 288 | | 18.7 | % |
| | | | | | | |
Promotion & Servicing | | 147 | | 181 | | -18.4 | % |
| | | | | | | |
General & Administrative | | 110 | | 114 | | -4.2 | % |
| | | | | | | |
Interest | | 6 | | 5 | | 22.7 | % |
| | | | | | | |
Amortization of Intangibles | | 5 | | 5 | | — | |
| | | | | | | |
Total | | $ | 609 | | $ | 593 | | 2.9 | % |
NOTE: Percentages are calculated using revenues and expenses rounded to the nearest thousand
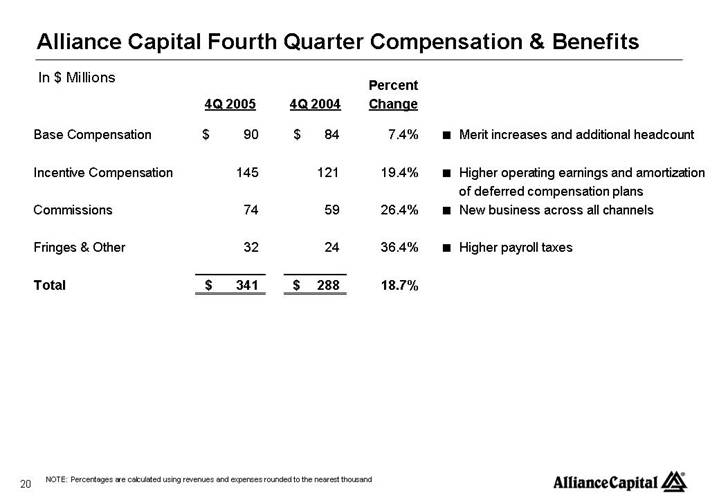
Alliance Capital Fourth Quarter Compensation & Benefits
In $ Millions
| | | | | | Percent | | | |
| | 4Q 2005 | | 4Q 2004 | | Change | | | |
| | | | | | | | | |
Base Compensation | | $ | 90 | | $ | 84 | | 7.4 | % | • | Merit increases and additional headcount |
| | | | | | | | | |
Incentive Compensation | | 145 | | 121 | | 19.4 | % | • | Higher operating earnings and amortization |
| | | | | | | | | of deferred compensation plans |
| | | | | | | | | |
Commissions | | 74 | | 59 | | 26.4 | % | • | New business across all channels |
| | | | | | | | | |
Fringes & Other | | 32 | | 24 | | 36.4 | % | • | Higher payroll taxes |
| | | | | | | | | |
Total | | $ | 341 | | $ | 288 | | 18.7 | % | | |
NOTE: Percentages are calculated using revenues and expenses rounded to the nearest thousand
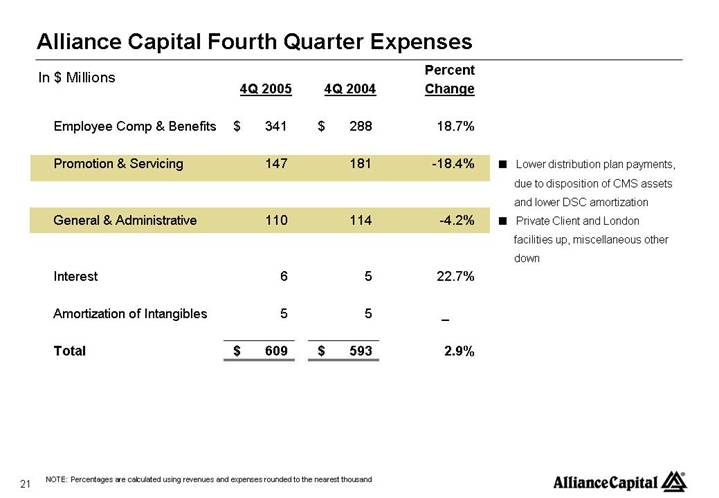
Alliance Capital Fourth Quarter Expenses
In $ Millions
| | | | | | Percent | | | |
| | 4Q 2005 | | 4Q 2004 | | Change | | | |
| | | | | | | | | |
Employee Comp & Benefits | | $ | 341 | | $ | 288 | | 18.7 | % | | |
| | | | | | | | | |
Promotion & Servicing | | 147 | | 181 | | -18.4 | % | • | Lower distribution plan payments, |
| | | | | | | | | due to disposition of CMS assets |
| | | | | | | | | and lower DSC amortization |
| | | | | | | | | |
General & Administrative | | 110 | | 114 | | -4.2 | % | • | Private Client and London |
| | | | | | | | | facilities up, miscellaneous other |
| | | | | | | | | down |
| | | | | | | | | |
Interest | | 6 | | 5 | | 22.7 | % | | |
| | | | | | | | | |
Amortization of Intangibles | | 5 | | 5 | | — | | | |
| | | | | | | | | |
Total | | $ | 609 | | $ | 593 | | 2.9 | % | | |
NOTE: Percentages are calculated using revenues and expenses rounded to the nearest thousand
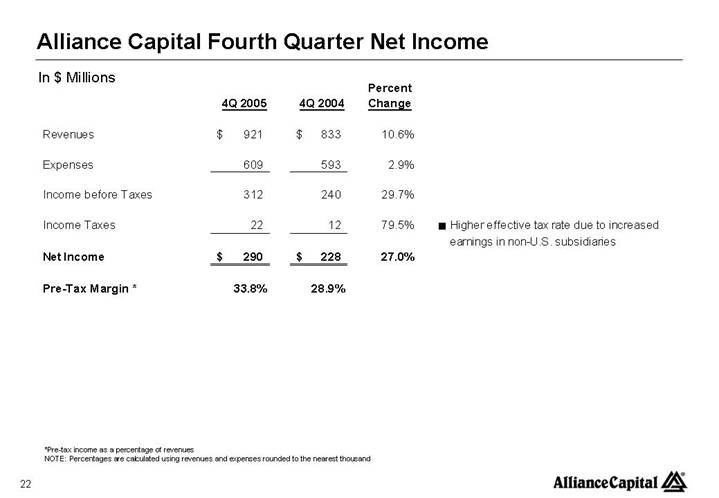
Alliance Capital Fourth Quarter Net Income
In $ Millions
| | | | | | Percent | | | |
| | 4Q 2005 | | 4Q 2004 | | Change | | | |
| | | | | | | | | |
Revenues | | $ | 921 | | $ | 833 | | 10.6 | % | | |
| | | | | | | | | |
Expenses | | 609 | | 593 | | 2.9 | % | | |
| | | | | | | | | |
Income before Taxes | | 312 | | 240 | | 29.7 | % | | |
| | | | | | | | | |
Income Taxes | | 22 | | 12 | | 79.5 | % | • | Higher effective tax rate due to increased |
| | | | | | | | | earnings in non-U.S. subsidiaries |
| | | | | | | | | |
Net Income | | $ | 290 | | $ | 228 | | 27.0 | % | | |
| | | | | | | | | |
Pre-Tax Margin * | | 33.8 | % | 28.9 | % | | | | |
| | | | | | | | | | | | |
*Pre-tax income as a percentage of revenues
NOTE: Percentages are calculated using revenues and expenses rounded to the nearest thousand
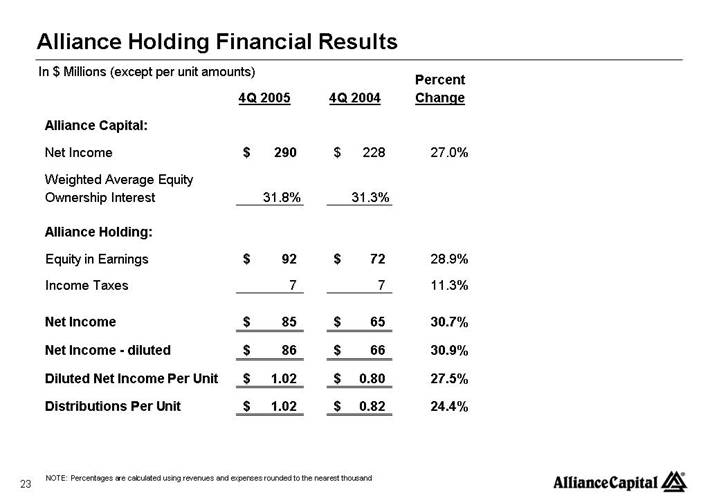
Alliance Holding Financial Results
In $ Millions (except per unit amounts)
| | | | | | Percent | |
| | 4Q 2005 | | 4Q 2004 | | Change | |
Alliance Capital: | | | | | | | |
| | | | | | | |
Net Income | | $ | 290 | | $ | 228 | | 27.0 | % |
| | | | | | | |
Weighted Average Equity Ownership Interest | | 31.8 | % | 31.3 | % | | |
| | | | | | | |
Alliance Holding: | | | | | | | |
| | | | | | | |
Equity in Earnings | | $ | 92 | | $ | 72 | | 28.9 | % |
| | | | | | | |
Income Taxes | | 7 | | 7 | | 11.3 | % |
| | | | | | | |
Net Income | | $ | 85 | | $ | 65 | | 30.7 | % |
| | | | | | | | | |
Net Income - diluted | | $ | 86 | | $ | 66 | | 30.9 | % |
| | | | | | | | | |
Diluted Net Income Per Unit | | $ | 1.02 | | $ | 0.80 | | 27.5 | % |
| | | | | | | | | |
Distributions Per Unit | | $ | 1.02 | | $ | 0.82 | | 24.4 | % |
NOTE: Percentages are calculated using revenues and expenses rounded to the nearest thousand
[LOGO]
24
|
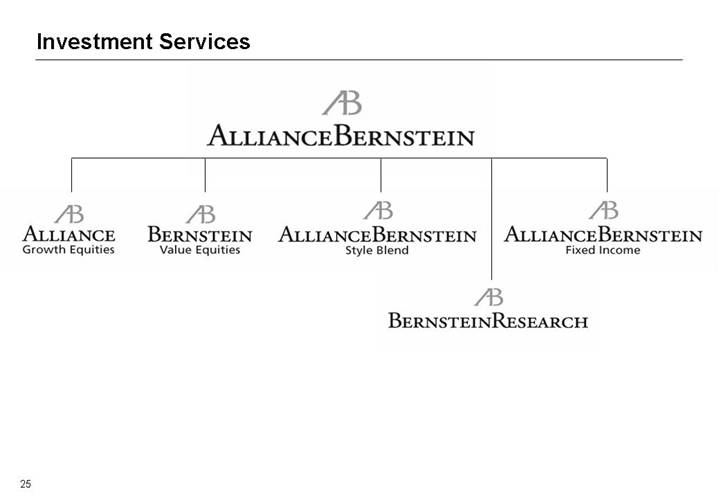
| | | | | [LOGO] | | | | | |
| | | | | | | | | | |
| | | | | | | | | | | |
| | | | | | | | | | | |
| | | | | | | | | | | |
[LOGO] | | [LOGO] | | [LOGO] | | | [LOGO] |
Growth Equities | | Value Equities | | Style Blend | | | Fixed Income |
| | | | | | | |
| | | | | | | |
| | | | | | | |
| | | | | [LOGO] | |
25
| | [LOGO] | | |
| | | | | | | |
| | | | | | | |
| | | | | | | |
| | | | | | | |
[LOGO] | | [LOGO] | | [LOGO] |
Institutional Investments | | Investments | | Global Wealth Management |
| | | | |
| | | | |
| | [LOGO] | | |
26
APPENDIX
Market Environment
| | | | | | Annualized | | Cumulative | |
| | 4Q 05 | | One Year | | Three Years | | Three Years | |
| | | | | | | | | |
MSCI Emerging Markets | | 7.2 | | 34.0 | | 37.9 | | 162.1 | |
| | | | | | | | | |
MSCI EAFE | | 4.1 | | 13.5 | | 23.7 | | 89.2 | |
| | | | | | | | | |
MSCI World | | 3.1 | | 9.5 | | 18.7 | | 67.2 | |
| | | | | | | | | |
Russell 1000 Growth | | 3.0 | | 5.3 | | 13.2 | | 45.2 | |
| | | | | | | | | |
Russell 1000 Value | | 1.3 | | 7.1 | | 17.5 | | 62.2 | |
| | | | | | | | | |
S&P 500 | | 2.1 | | 4.9 | | 14.4 | | 49.7 | |
| | | | | | | | | |
Lehman Aggregate Bond | | 0.6 | | 2.4 | | 3.6 | | 11.3 | |
Returns in % through December 31, 2005
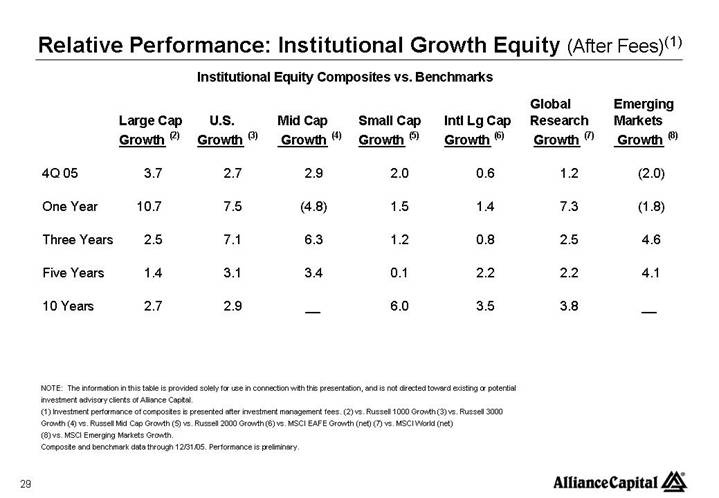
Relative Performance: Institutional Growth Equity (After Fees)(1)
Institutional Equity Composites vs. Benchmarks
| | | | | | | | | | | | Global | | Emerging | |
| | Large Cap | | U.S. | | Mid Cap | | Small Cap | | Intl Lg Cap | | Research | | Markets | |
| | Growth (2) | | Growth (3) | | Growth (4) | | Growth (5) | | Growth (6) | | Growth (7) | | Growth (8) | |
| | | | | | | | | | | | | | | |
4Q 05 | | 3.7 | | 2.7 | | 2.9 | | 2.0 | | 0.6 | | 1.2 | | (2.0 | ) |
| | | | | | | | | | | | | | | |
One Year | | 10.7 | | 7.5 | | (4.8 | ) | 1.5 | | 1.4 | | 7.3 | | (1.8 | ) |
| | | | | | | | | | | | | | | |
Three Years | | 2.5 | | 7.1 | | 6.3 | | 1.2 | | 0.8 | | 2.5 | | 4.6 | |
| | | | | | | | | | | | | | | |
Five Years | | 1.4 | | 3.1 | | 3.4 | | 0.1 | | 2.2 | | 2.2 | | 4.1 | |
| | | | | | | | | | | | | | | |
10 Years | | 2.7 | | 2.9 | | — | | 6.0 | | 3.5 | | 3.8 | | — | |
NOTE: The information in this table is provided solely for use in connection with this presentation, and is not directed toward existing or potential investment advisory clients of Alliance Capital.
(1) Investment performance of composites is presented after investment management fees.
(2) vs. Russell 1000 Growth
(3) vs. Russell 3000 Growth
(4) vs. Russell Mid Cap Growth
(5) vs. Russell 2000 Growth
(6) vs. MSCI EAFE Growth (net)
(7) vs. MSCI World (net)
(8) vs. MSCI Emerging Markets Growth. Composite and benchmark data through 12/31/05. Performance is preliminary.
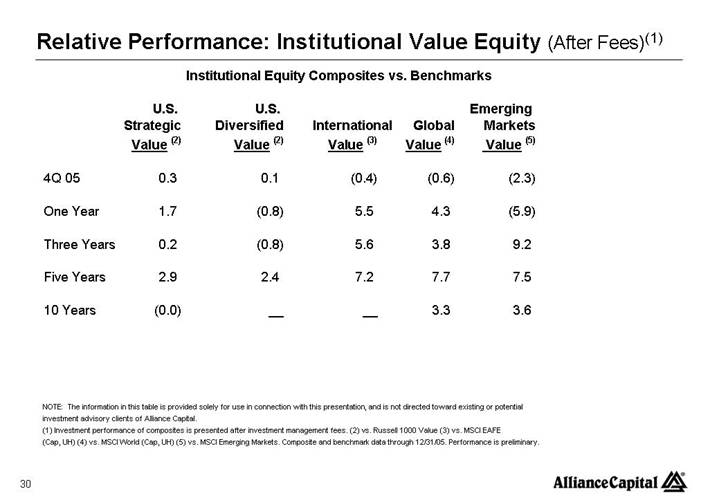
Relative Performance: Institutional Value Equity (After Fees)(1)
Institutional Equity Composites vs. Benchmarks
| | U.S. | | U.S. | | | | | | Emerging | |
| | Strategic | | Diversified | | International | | Global | | Markets | |
| | Value (2) | | Value (2) | | Value (3) | | Value (4) | | Value (5) | |
| | | | | | | | | | | |
4Q 05 | | 0.3 | | 0.1 | | (0.4 | ) | (0.6 | ) | (2.3 | ) |
| | | | | | | | | | | |
One Year | | 1.7 | | (0.8 | ) | 5.5 | | 4.3 | | (5.9 | ) |
| | | | | | | | | | | |
Three Years | | 0.2 | | (0.8 | ) | 5.6 | | 3.8 | | 9.2 | |
| | | | | | | | | | | |
Five Years | | 2.9 | | 2.4 | | 7.2 | | 7.7 | | 7.5 | |
| | | | | | | | | | | |
10 Years | | (0.0 | ) | — | | — | | 3.3 | | 3.6 | |
NOTE: The information in this table is provided solely for use in connection with this presentation, and is not directed toward existing or potential investment advisory clients of Alliance Capital.
(1) Investment performance of composites is presented after investment management fees.
(2) vs. Russell 1000 Value
(3) vs. MSCI EAFE (Cap, UH)
(4) vs. MSCI World (Cap, UH
(5) vs. MSCI Emerging Markets. Composite and benchmark data through 12/31/05. Performance is preliminary.
Relative Performance: Style Blend Services (After Fees)(1)
Blend Equity Composites vs. Benchmarks
| | | | | | International | | Emerging Markets | |
| | U.S. Style | | Global Style | | Style | | Style | |
| | Blend (2) | | Blend (5) | | Blend (3) | | Blend (4) | |
| | | | | | | | | |
4Q 05 | | 1.7 | | 0.5 | | 0.4 | | (1.5 | ) |
| | | | | | | | | |
One Year | | 6.0 | | 6.5 | | 2.2 | | (4.3 | ) |
| | | | | | | | | |
Three Years | | 2.1 | | — | | (0.4 | ) | 5.5 | |
| | | | | | | | | |
Since Inception | | 1.3 | | 3.5 | | 2.2 | | 5.7 | |
NOTE: The information in this table is provided solely for use in connection with this presentation, and is not directed toward existing or potential investment advisory clients of Alliance Capital.
(1) Investment performance of mutual funds is presented after investment management fees.
(2) U.S. Style Blend (12/31/01) vs. S&P 500
(3) Int’l Style Blend (12/31/01) vs. MSCI EAFE
(4) EM Style Blend (12/31/01) vs.MSCI EM
(5) Global Style Blend (6/30/03) vs. MSCI World for Global products. Composite and benchmark data through 12/31/05. Performance is preliminary.
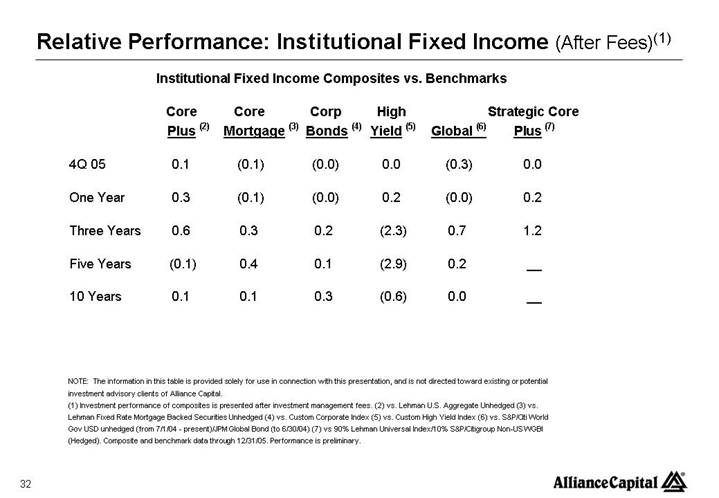
Relative Performance: Institutional Fixed Income (After Fees)(1)
Institutional Fixed Income Composites vs. Benchmarks
| | Core | | Core | | Corp | | High | | | | Strategic Core | |
| | Plus (2) | | Mortgage (3) | | Bonds (4) | | Yield (5) | | Global (6) | | Plus (7) | |
| | | | | | | | | | | | | |
4Q 05 | | 0.1 | | (0.1 | ) | (0.0 | ) | 0.0 | | (0.3 | ) | 0.0 | |
| | | | | | | | | | | | | |
One Year | | 0.3 | | (0.1 | ) | (0.0 | ) | 0.2 | | (0.0 | ) | 0.2 | |
| | | | | | | | | | | | | |
Three Years | | 0.6 | | 0.3 | | 0.2 | | (2.3 | ) | 0.7 | | 1.2 | |
| | | | | | | | | | | | | |
Five Years | | (0.1 | ) | 0.4 | | 0.1 | | (2.9 | ) | 0.2 | | — | |
| | | | | | | | | | | | | |
10 Years | | 0.1 | | 0.1 | | 0.3 | | (0.6 | ) | 0.0 | | — | |
NOTE: The information in this table is provided solely for use in connection with this presentation, and is not directed toward existing or potential investment advisory clients of Alliance Capital.
(1) Investment performance of composites is presented after investment management fees.
(2) vs. Lehman U.S. Aggregate Unhedged
(3) vs. Lehman Fixed Rate Mortgage Backed Securities Unhedged
(4) vs. Custom Corporate Index
(5) vs. Custom High Yield Index
(6) vs. S&P/Citi World Gov USD unhedged (from 7/1/04 - present)/JPM Global Bond (to 6/30/04)
(7) vs 90% Lehman Universal Index/10% S&P/Citigroup Non-US WGBI (Hedged). Composite and benchmark data through 12/31/05. Performance is preliminary.
Absolute Performance:Private Client (After Fees)(1)
| | | | Annualized | |
| | 4Q 05 | | 1 Year | | 3 Year | | 5 Year | |
| | | | | | | | | |
All Balanced Accounts (2) | | 2.5 | % | 8.1 | % | 13.1 | % | 6.5 | % |
| | | | | | | | | |
Global Balanced Benchmark (3) | | 1.9 | % | 5.7 | % | 11.7 | % | 3.5 | % |
| | | | | | | | | |
S&P 500 | | 2.1 | % | 4.9 | % | 14.4 | % | 0.6 | % |
NOTE: The information in this table is provided solely for use in connection with this presentation, and is not directed towards existing or potential investment advisory clients of Alliance Capital.
(1) Investment performance of composites is presented after investment management fees.
(2) All Balanced Accounts include those accounts with any combination of equity and fixed income in any percentage mix.
(3) Custom benchmark: 42% S&P 500, 15% MSCI EAFE, 3% MSCI Emerging Markets, 40% Lipper Intermediate Municipal Debt Fund Average.
Relative Performance: Retail Growth Equity (After Fees)(1)
Retail Mutual Funds vs. Lipper Averages
| | | | | | | | Global | | | |
| | Large Cap | | | | Mid Cap | | Research | | Regent | |
| | Growth (2) | | Growth (3) | | Growth (4) | | Growth (5) | | Equity (6) | |
| | | | | | | | | | | |
4Q 05 | | 3.1 | | 2.0 | | 3.2 | | (0.1 | ) | 2.4 | |
| | | | | | | | | | | |
One Year | | 8.0 | | 2.8 | | (3.1 | ) | 5.6 | | 5.1 | |
| | | | | | | | | | | |
Three Years | | 1.9 | | 2.0 | | 9.5 | | 3.0 | | 7.0 | |
| | | | | | | | | | | |
Five Years | | (0.9 | ) | 1.4 | | 3.6 | | — | | 3.3 | |
| | | | | | | | | | | |
10 Years | | 0.4 | | (1.1 | ) | (0.7 | ) | — | | 3.9 | |
NOTE: The information in this table is provided solely for use in connection with this presentation, and is not directed toward existing or potential investment advisory clients of Alliance Capital.
(1) Investment performance of mutual funds is presented after investment management fees
(2) vs. Large Cap Growth average. Formerly named Premier Growth
(3) vs. Multi Cap Growth average
(4) vs. Mid Cap Growth average
(5) vs. Global Large Cap Growth Equity average; formerly named Global Growth Trends
(6) vs. S&P 500; represents Regent separately managed account service. Net performance is inclusive of the investment management fee only; it does not include the total management fee typically associated with a managed account that may range from 2.0 - 3.0% which includes transaction costs, custodial services and investment advisory fees.
Source: Alliance Capital, Lipper, and S&P
Mutual fund performance and Lipper data through 12/31/05.
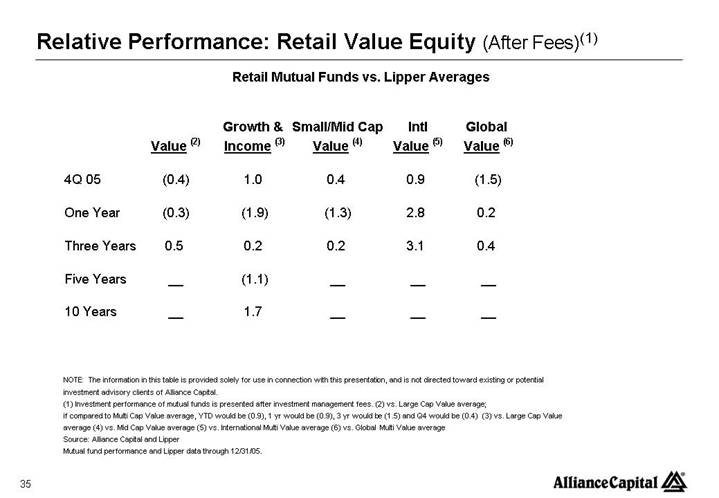
Relative Performance: Retail Value Equity (After Fees)(1)
Retail Mutual Funds vs. Lipper Averages
| | | | Growth & | | Small/Mid Cap | | Intl | | Global | |
| | Value (2) | | Income (3) | | Value (4) | | Value (5) | | Value (6) | |
| | | | | | | | | | | |
4Q 05 | | (0.4 | ) | 1.0 | | 0.4 | | 0.9 | | (1.5 | ) |
| | | | | | | | | | | |
One Year | | (0.3 | ) | (1.9 | ) | (1.3 | ) | 2.8 | | 0.2 | |
| | | | | | | | | | | |
Three Years | | 0.5 | | 0.2 | | 0.2 | | 3.1 | | 0.4 | |
| | | | | | | | | | | |
Five Years | | — | | (1.1 | ) | — | | — | | — | |
| | | | | | | | | | | |
10 Years | | — | | 1.7 | | — | | — | | — | |
NOTE: The information in this table is provided solely for use in connection with this presentation, and is not directed toward existing or potential investment advisory clients of Alliance Capital.
(1) Investment performance of mutual funds is presented after investment management fees.
(2) vs. Large Cap Value average; if compared to Multi Cap Value average, YTD would be (0.9), 1 yr would be (0.9), 3 yr would be (1.5) and Q4 would be (0.4)
(3) vs. Large Cap Value average
(4) vs. Mid Cap Value average
(5) vs. International Multi Value average (6) vs. Global Multi Value average Source: Alliance Capital and Lipper Mutual fund performance and Lipper data through 12/31/05.
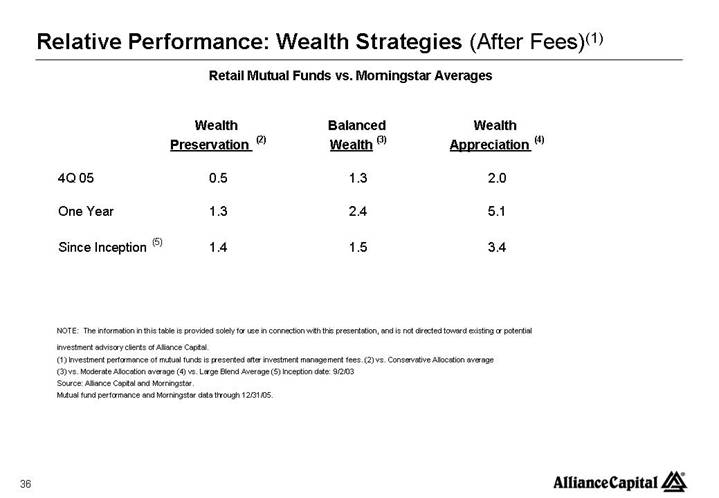
Relative Performance: Wealth Strategies (After Fees)(1)
Retail Mutual Funds vs. Morningstar Averages
| | Wealth | | Balanced | | Wealth | |
| | Preservation (2) | | Wealth (3) | | Appreciation (4) | |
| | | | | | | |
4Q 05 | | 0.5 | | 1.3 | | 2.0 | |
| | | | | | | |
One Year | | 1.3 | | 2.4 | | 5.1 | |
| | | | | | | |
Since Inception (5) | | 1.4 | | 1.5 | | 3.4 | |
NOTE: The information in this table is provided solely for use in connection with this presentation, and is not directed toward existing or potential investment advisory clients of Alliance Capital.
(1) Investment performance of mutual funds is presented after investment management fees.
(2) vs. Conservative Allocation average
(3) vs. Moderate Allocation average
(4) vs. Large Blend Average (5) Inception date: 9/2/03 Source: Alliance Capital and Morningstar.
Mutual fund performance and Morningstar data through 12/31/05.
Relative Performance: Retail Fixed Income (After Fees)(1)
Retail Fixed Income Funds vs. Lipper Averages
| | | | | | | | | | | | ACMGI- | |
| | | | Americas | | Emerging | | | | Short | | American | |
| | Corporate | | Gov’t | | Market | | High | | Duration | | Income- | |
| | Bond (2) | | Income (3) | | Debt (4) | | Yield (5) | | Plus (6) | | Offshore (7) | |
| | | | | | | | | | | | | |
4Q 05 | | 0.3 | | 2.3 | | 0.0 | | (0.3 | ) | (0.1 | ) | 0.8 | |
| | | | | | | | | | | | | |
One Year | | (0.3 | ) | 11.9 | | (1.6 | ) | (0.5 | ) | (0.2 | ) | 4.9 | |
| | | | | | | | | | | | | |
Three Years | | 3.1 | | 4.0 | | 1.3 | | (0.9 | ) | (0.0 | ) | 8.3 | |
| | | | | | | | | | | | | |
Five Years | | (0.1 | ) | 1.7 | | 0.5 | | (1.6 | ) | 0.4 | | 8.0 | |
| | | | | | | | | | | | | |
10 Years | | 0.4 | | 5.5 | | 0.2 | | — | | 0.2 | | 7.3 | |
NOTE: The information in this table is provided solely for use in connection with this presentation, and is not directed toward existing or potential investment advisory clients of Alliance Capital.
(1) Investment performance of mutual funds is presented after investment management fees.
(2) vs. Corporate Debt Funds BBB-Rated average
(3) vs. Global Income Funds average
(4) vs. Emerging Markets Debt average
(5) vs. High Current Yield average
(6) vs. Short Investment Grade Debt average
(7) vs. Global Bond U.S. Dollar average. Source: Alliance Capital and Lipper. Composite and benchmark data through 12/31/05. Performance is preliminary.
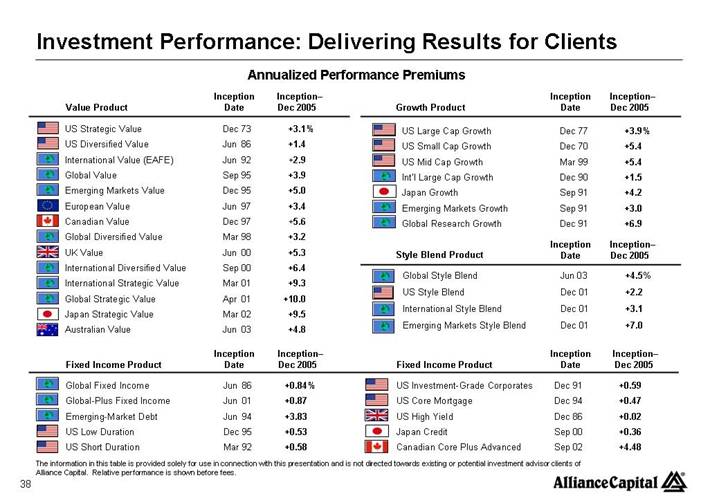
Investment Performance: Delivering Results for Clients
Annualized Performance Premiums
| | Inception | | Inception- | |
Value Product | | Date | | Dec 2005 | |
[GRAPHIC] | | US Strategic Value | | Dec 73 | | +3.1 | % |
[GRAPHIC] | | US Diversified Value | | Jun 86 | | +1.4 | |
[GRAPHIC] | | International Value (EAFE) | | Jun 92 | | +2.9 | |
[GRAPHIC] | | Global Value | | Sep 95 | | +3.9 | |
[GRAPHIC] | | Emerging Markets Value | | Dec 95 | | +5.0 | |
[GRAPHIC] | | European Value | | Jun 97 | | +3.4 | |
[GRAPHIC] | | Canadian Value | | Dec 97 | | +5.6 | |
[GRAPHIC] | | Global Diversified Value | | Mar 98 | | +3.2 | |
[GRAPHIC] | | UK Value | | Jun 00 | | +5.3 | |
[GRAPHIC] | | International Diversified Value | | Sep 00 | | +6.4 | |
[GRAPHIC] | | International Strategic Value | | Mar 01 | | +9.3 | |
[GRAPHIC] | | Global Strategic Value | | Apr 01 | | +10.0 | |
[GRAPHIC] | | Japan Strategic Value | | Mar 02 | | +9.5 | |
[GRAPHIC] | | Australian Value | | Jun 03 | | +4.8 | |
| | | | | | | |
| | Inception | | Inception- | |
Growth Product | | Date | | Dec 2005 | |
[GRAPHIC] | | US Large Cap Growth | | Dec 77 | | +3.9 | % |
[GRAPHIC] | | US Small Cap Growth | | Dec 70 | | +5.4 | |
[GRAPHIC] | | US Mid Cap Growth | | Mar 99 | | +5.4 | |
[GRAPHIC] | | Int’l Large Cap Growth | | Dec 90 | | +1.5 | |
[GRAPHIC] | | Japan Growth | | Sep 91 | | +4.2 | |
[GRAPHIC] | | Emerging Markets Growth | | Sep 91 | | +3.0 | |
[GRAPHIC] | | Global Research Growth | | Dec 91 | | +6.9 | |
| | | | | | | |
| | Inception | | Inception- | |
Style Blend Product | | Date | | Dec 2005 | |
[GRAPHIC] | | Global Style Blend | | Jun 03 | | +4.5 | % |
[GRAPHIC] | | US Style Blend | | Dec 01 | | +2.2 | |
[GRAPHIC] | | International Style Blend | | Dec 01 | | +3.1 | |
[GRAPHIC] | | Emerging Markets Style Blend | | Dec 01 | | +7.0 | |
| | | | | | | |
| | | | Inception | | Inception- | |
Fixed Income Product | | Date | | Dec 2005 | |
[GRAPHIC] | | Global Fixed Income | | Jun 86 | | +0.84 | % |
[GRAPHIC] | | Global-Plus Fixed Income | | Jun 01 | | +0.87 | |
[GRAPHIC] | | Emerging-Market Debt | | Jun 94 | | +3.83 | |
[GRAPHIC] | | US Low Duration | | Dec 95 | | +0.53 | |
[GRAPHIC] | | US Short Duration | | Mar 92 | | +0.58 | |
[GRAPHIC] | | US Investment-Grade Corporates | | Dec 91 | | +0.59 | |
[GRAPHIC] | | US Core Mortgage | | Dec 94 | | +0.47 | |
[GRAPHIC] | | US High Yield | | Dec 86 | | +0.02 | |
[GRAPHIC] | | Japan Credit | | Sep 00 | | +0.36 | |
[GRAPHIC] | | Canadian Core Plus Advanced | | Sep 02 | | +4.48 | |
The information in this table is provided solely for use in connection with this presentation and is not directed towards existing or potential investment advisor clients of Alliance Capital. Relative performance is shown before fees.
Changes in Assets Under Management by Channel
Three Months Ended December 31, 2005
In $ Millions
| | Institutional | | | | Private | | | |
| | Investment | | Retail | | Client | | Total | |
| | | | | | | | | |
Beginning of Period | | $ | 342,180 | | $ | 140,410 | | $ | 72,876 | | $ | 555,466 | |
| | | | | | | | | |
Sales/New accounts | | 11,600 | | 8,169 | | 2,476 | | 22,245 | |
Redemptions/Terminations | | (3,020 | ) | (6,562 | ) | (757 | ) | (10,339 | ) |
Cash flow | | 482 | | (275 | ) | (740 | ) | (533 | ) |
Unreinvested dividends | | — | | (306 | ) | (144 | ) | (450 | ) |
Net long-term inflows | | 9,062 | | 1,026 | | 835 | | 10,923 | |
| | | | | | | | | |
Disposition (1) | | (1,375 | ) | — | | — | | (1,375 | ) |
| | | | | | | | | |
Transfers | | 570 | | — | | (570 | ) | — | |
| | | | | | | | | |
Market appreciation | | 8,108 | | 3,698 | | 1,732 | | 13,538 | |
| | | | | | | | | |
End of Period | | $ | 358,545 | | $ | 145,134 | | $ | 74,873 | | $ | 578,552 | |
| | | | | | | | | |
% Total (end of period) | | 62.0 | % | 25.1 | % | 12.9 | % | 100.0 | % |
| | | | | | | | | |
% Change from beg of period | | 4.8 | % | 3.4 | % | 2.7 | % | 4.2 | % |
| | | | | | | | | |
% Change excluding disposition | | 5.2 | % | 3.4 | % | 2.7 | % | 4.4 | % |
(1) South African joint venture interest
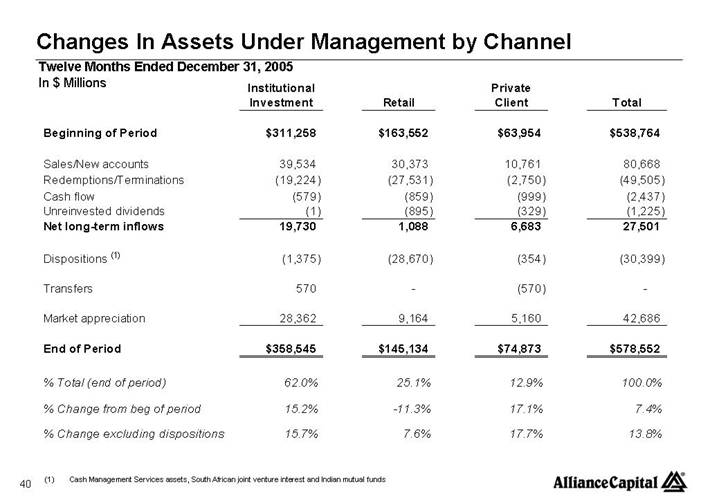
Changes In Assets Under Management by Channel
Twelve Months Ended December 31, 2005
In $ Millions
| | Institutional | | | | Private | | | |
| | Investment | | Retail | | Client | | Total | |
| | | | | | | | | |
Beginning of Period | | $ | 311,258 | | $ | 163,552 | | $ | 63,954 | | $ | 538,764 | |
| | | | | | | | | |
Sales/New accounts | | 39,534 | | 30,373 | | 10,761 | | 80,668 | |
Redemptions/Terminations | | (19,224 | ) | (27,531 | ) | (2,750 | ) | (49,505 | ) |
Cash flow | | (579 | ) | (859 | ) | (999 | ) | (2,437 | ) |
Unreinvested dividends | | (1 | ) | (895 | ) | (329 | ) | (1,225 | ) |
Net long-term inflows | | 19,730 | | 1,088 | | 6,683 | | 27,501 | |
| | | | | | | | | |
Dispositions (1) | | (1,375 | ) | (28,670 | ) | (354 | ) | (30,399 | ) |
| | | | | | | | | |
Transfers | | 570 | | — | | (570 | ) | — | |
| | | | | | | | | |
Market appreciation | | 28,362 | | 9,164 | | 5,160 | | 42,686 | |
| | | | | | | | | |
End of Period | | $ | 358,545 | | $ | 145,134 | | $ | 74,873 | | $ | 578,552 | |
| | | | | | | | | |
% Total (end of period) | | 62.0 | % | 25.1 | % | 12.9 | % | 100.0 | % |
% Change from beg of period | | 15.2 | % | -11.3 | % | 17.1 | % | 7.4 | % |
% Change excluding dispositions | | 15.7 | % | 7.6 | % | 17.7 | % | 13.8 | % |
(1) Cash Management Services assets, South African joint venture interest and Indian mutual funds
Alliance Capital
Consolidated Balance Sheet
In $ Thousands
| | 12/31/05 | | 12/31/04 | |
Assets | | | | | |
Cash and investments | | $ | 999,213 | | $ | 1,253,690 | |
Cash and securities, segregated | | 1,720,809 | | 1,489,041 | |
Receivables, net | | 2,936,245 | | 2,194,226 | |
Goodwill, net | | 2,876,657 | | 2,876,657 | |
Intangible assets, net | | 305,325 | | 326,025 | |
Deferred sales commissions, net | | 196,637 | | 254,456 | |
Other (incl. furniture & equipment) | | 455,594 | | 385,235 | |
Total Assets | | $ | 9,490,480 | | $ | 8,779,330 | |
| | | | | |
Liabilities and Partners’ Capital | | | | | |
Liabilites: | | | | | |
Payables | | $ | 4,127,377 | | $ | 3,576,395 | |
Accounts payable and accrued expenses | | 286,449 | | 275,264 | |
Accrued compensation and benefits | | 357,321 | | 326,219 | |
Debt | | 407,291 | | 407,517 | |
Minority Interest | | 9,368 | | 10,237 | |
Total Liabilities | | 5,187,806 | | 4,595,632 | |
| | | | | |
Partners’ Capital | | 4,302,674 | | 4,183,698 | |
Total Liabilities and Partners’ Capital | | $ | 9,490,480 | | $ | 8,779,330 | |
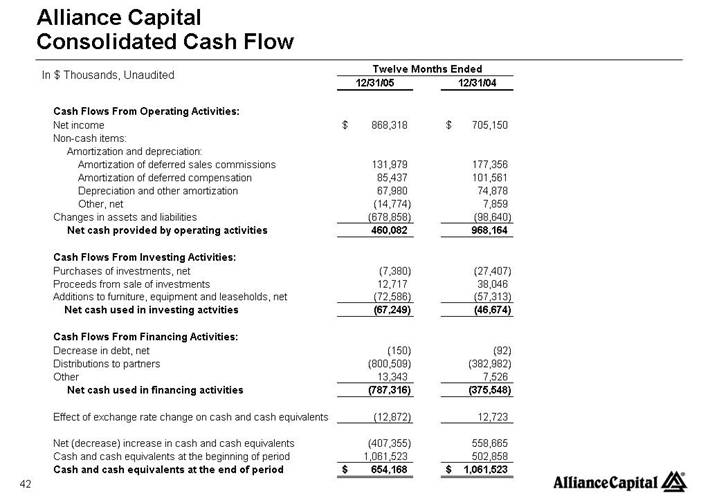
Alliance Capital
In $ Thousands, Unaudited
| | Twelve Months Ended | |
| | 12/31/05 | | 12/31/04 | |
| | | | | |
Cash Flows From Operating Activities: | | | | | |
Net income | | $ | 868,318 | | $ | 705,150 | |
Non-cash items: | | | | | |
Amortization and depreciation: | | | | | |
Amortization of deferred sales commissions | | 131,979 | | 177,356 | |
Amortization of deferred compensation | | 85,437 | | 101,561 | |
Depreciation and other amortization | | 67,980 | | 74,878 | |
Other, net | | (14,774 | ) | 7,859 | |
Changes in assets and liabilities | | (678,858 | ) | (98,640 | ) |
Net cash provided by operating activities | | 460,082 | | 968,164 | |
| | | | | |
Cash Flows From Investing Activities: | | | | | |
Purchases of investments, net | | (7,380 | ) | (27,407 | ) |
Proceeds from sale of investments | | 12,717 | | 38,046 | |
Additions to furniture, equipment and leaseholds, net | | (72,586 | ) | (57,313 | ) |
Net cash used in investing actvities | | (67,249 | ) | (46,674 | ) |
| | | | | |
Cash Flows From Financing Activities: | | | | | |
Decrease in debt, net | | (150 | ) | (92 | ) |
Distributions to partners | | (800,509 | ) | (382,982 | ) |
Other | | 13,343 | | 7,526 | |
Net cash used in financing activities | | (787,316 | ) | (375,548 | ) |
| | | | | |
Effect of exchange rate change on cash and cash equivalents | | (12,872 | ) | 12,723 | |
| | | | | |
Net (decrease) increase in cash and cash equivalents | | (407,355 | ) | 558,665 | |
Cash and cash equivalents at the beginning of period | | 1,061,523 | | 502,858 | |
Cash and cash equivalents at the end of period | | $ | 654,168 | | $ | 1,061,523 | |
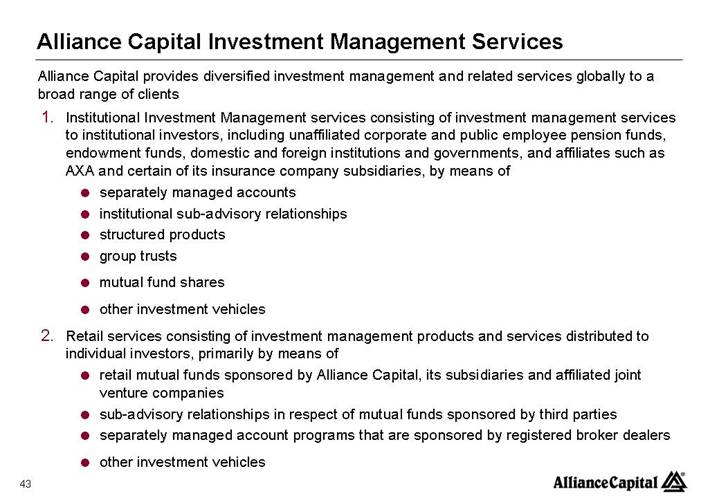
Alliance Capital Investment Management Services
Alliance Capital provides diversified investment management and related services globally to a broad range of clients
1. Institutional Investment Management services consisting of investment management services to institutional investors, including unaffiliated corporate and public employee pension funds, endowment funds, domestic and foreign institutions and governments, and affiliates such as AXA and certain of its insurance company subsidiaries, by means of
• separately managed accounts
• institutional sub-advisory relationships
• structured products
• group trusts
• mutual fund shares
• other investment vehicles
2. Retail services consisting of investment management products and services distributed to individual investors, primarily by means of
• retail mutual funds sponsored by Alliance Capital, its subsidiaries and affiliated joint venture companies
• sub-advisory relationships in respect of mutual funds sponsored by third parties
• separately managed account programs that are sponsored by registered broker dealers
• other investment vehicles
Alliance Capital Investment Management Services
3. Private Client services consisting of investment management services provided to private clients, including high-net-worth individuals, trusts and estates, charitable foundations, partnerships, private and family corporations and other entities by means of
• separately managed accounts
• hedge funds
• mutual funds
• other investment vehicles
4. Institutional Research Services consisting of services to institutional investors by means of
• in-depth research
• portfolio strategy
• trading
• brokerage-related services
[LOGO]