UNITED STATES
SECURITIES AND EXCHANGE COMMISSION
WASHINGTON, D.C. 20549
FORM N-CSR
CERTIFIED SHAREHOLDER REPORT OF REGISTERED
MANAGEMENT INVESTMENT COMPANIES
Investment Company Act file number: 811-05398
AB VARIABLE PRODUCTS SERIES FUND, INC.
(Exact name of registrant as specified in charter)
66 Hudson Boulevard East
New York, New York 10005
(Address of principal executive offices) (Zip code)
Stephen M. Woetzel
AllianceBernstein L.P.
66 Hudson Boulevard East
New York, New York 10005
(Name and address of agent for service)
Registrant’s telephone number, including area code: (800) 221-5672
Date of fiscal year end: December 31, 2024
Date of reporting period: December 31, 2024
ITEM 1. REPORTS TO STOCKHOLDERS.
Please scan QR code for
Portfolio Information
AB VPS Dynamic Asset Allocation Portfolio
Annual Shareholder Report
This annual shareholder report contains important information about the AB VPS Dynamic Asset Allocation Portfolio (the “Portfolio”) for the period of January 1, 2024 to December 31, 2024. You can find additional information about the Portfolio at https://www.abfunds.com/link/AB/64VD-A-A. You can also request this information by contacting us at (800) 227 4618.
What were the Portfolio costs for the last year?
(Based on a hypothetical $10,000 investment)
| Class Name | Cost of a $10,000 investment | Costs paid as a percentage of a $10,000 investment |
|---|
| Class A | $90 | 0.85% |
|---|
How did the Portfolio perform last year? What affected the Portfolio’s performance?
During the 12-month period, the Portfolio underperformed the Morgan Stanley Capital International (“MSCI”) World Index (net) (the "benchmark"), largely due to its balanced construction of approximately 60% in equity and 40% in fixed-income. Through the course of the year, the Portfolio's Senior Investment Management Team (the “Team”) maintained an overweight in equity assets due to an expectation that inflation would cool and US growth would remain strong, creating a market-friendly environment of both central bank rate cuts and solid corporate earnings growth. The Team also tilted the Portfolio towards US stocks relative to international stocks due to the greater resilience of the US economy and very strong profitability and growth prospects for US technology companies.
In Late July and early August, market volatility rose due to concerns about US growth, fears that Japanese investors would unwind their US holdings in favor of domestic assets, and increased uncertainty around the US election outcome, leading the Team to moderate the size of the equity overweight. In the fourth quarter, the Team increased its equity overweight again as improved economic data supported continued expansion and sentiment improved due to the potential of a more supportive business environment following the election. While US equity holdings benefited, fixed-income investments and international assets suffered declines. The Team ended the period with an overweight to risk assets including developed-market equities.
The Portfolio continued to hold US treasury exposure to hedge equity risk as well as equity put options to guard against unexpected market shocks.
Top contributors to performance:
Top detractors from performance:
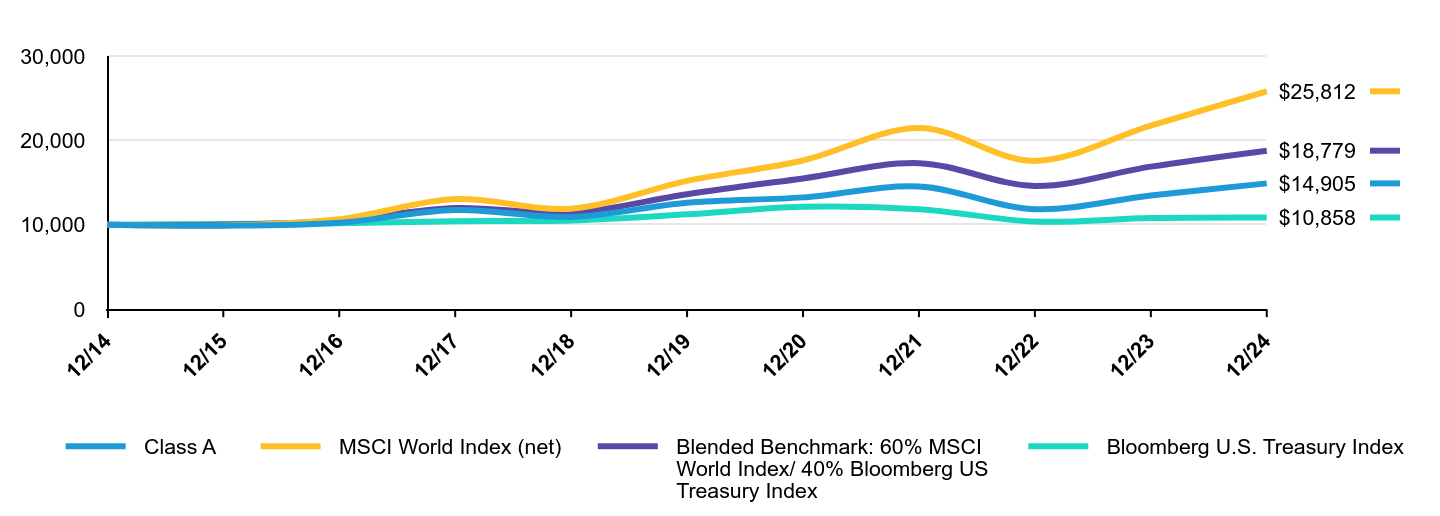
The following graph shows the performance of hypothetical $10,000 investments in the Portfolio, a broad-based securities market index and an additional index that corresponds to the Portfolio's investment strategies, over the most recently completed 10 fiscal years of the Portfolio, or since inception, if shorter. The Portfolio's performance reflects applicable sales charges and assumes the reinvestment of dividends.
| Class A | MSCI World Index (net) | Blended Benchmark: 60% MSCI World Index/ 40% Bloomberg US Treasury Index | Bloomberg U.S. Treasury Index |
|---|
| 12/14 | $10,000 | $10,000 | $10,000 | $10,000 |
|---|
| 12/15 | $9,891 | $9,913 | $10,008 | $10,084 |
|---|
| 12/16 | $10,246 | $10,657 | $10,516 | $10,189 |
|---|
| 12/17 | $11,749 | $13,045 | $11,987 | $10,424 |
|---|
| 12/18 | $10,919 | $11,908 | $11,420 | $10,514 |
|---|
| 12/19 | $12,612 | $15,203 | $13,617 | $11,235 |
|---|
| 12/20 | $13,246 | $17,621 | $15,492 | $12,134 |
|---|
| 12/21 | $14,527 | $21,465 | $17,304 | $11,852 |
|---|
| 12/22 | $11,847 | $17,571 | $14,607 | $10,375 |
|---|
| 12/23 | $13,470 | $21,751 | $16,893 | $10,795 |
|---|
| 12/24 | $14,905 | $25,812 | $18,779 | $10,858 |
|---|
Average Annual Total Returns
| AATR | 1 Year | 5 Years | 10 Years |
|---|
| Class A | 10.65% | 3.40% | 4.07% |
|---|
| MSCI World Index (net) | 18.67% | 11.17% | 9.95% |
|---|
| Blended Benchmark: 60% MSCI World Index/ 40% Bloomberg US Treasury Index | 11.16% | 6.64% | 6.50% |
|---|
| Bloomberg U.S. Treasury Index | 0.58% | -0.68% | 0.83% |
|---|
The Portfolio’s past performance is not a good predictor of the Portfolio’s future performance.
The graph and table do not reflect the deduction of taxes that a shareholder would pay on Portfolio distributions or the redemption or sale of Portfolio shares.
Visit https://www.abfunds.com/link/AB/64VD-A-A for the most recent performance information.
| Net Assets | $251,418,002 |
|---|
| # of Portfolio Holdings | 1,501 |
|---|
| Portfolio Turnover Rate | 11% |
|---|
| Total Advisory Fees Paid | $1,713,037 |
|---|
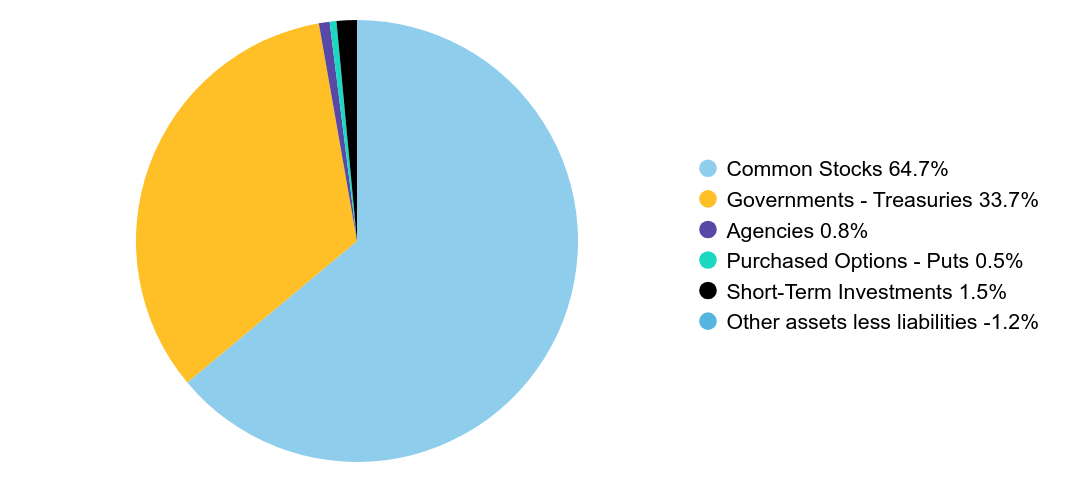
Graphical Representation of Holdings
| Company | U.S. $ Value | % of Net Assets |
|---|
| Apple, Inc. | $8,870,377 | 3.5% |
| NVIDIA Corp. | $7,674,673 | 3.1% |
| Microsoft Corp. | $6,934,518 | 2.8% |
| Amazon.com, Inc. | $4,828,116 | 1.9% |
| U.S. Treasury Notes, 2.00%, due 11/15/26 | $4,613,618 | 1.8% |
| U.S. Treasury Notes, 2.38%, due 05/15/27 | $4,181,498 | 1.7% |
| U.S. Treasury Notes, 2.25%, due 11/15/27 | $3,392,159 | 1.4% |
| Meta Platforms, Inc. - Class A | $2,981,417 | 1.2% |
| Tesla, Inc. | $2,705,324 | 1.1% |
| U.S. Treasury Notes, 1.63%, due 05/15/31 | $2,598,631 | 1.0% |
| Total | $48,780,331 | 19.5% |
| Value | Value |
|---|
| Common Stocks | 64.7% |
| Governments - Treasuries | 33.7% |
| Agencies | 0.8% |
| Purchased Options - Puts | 0.5% |
| Short-Term Investments | 1.5% |
| Other assets less liabilities | -1.2% |
Availability of Additional Information
You can find additional information on the Portfolio’s website at https://www.abfunds.com/link/AB/64VD-A-A, including the Portfolio's:
• Prospectus
• Financial information
• Portfolio holdings
• Proxy voting information
You can also request this information by contacting us at (800) 227 4618.
Shareholders who have consented to receive a single annual or semi-annual shareholder report at a shared address may revoke this consent by contacting us at (800) 227 4618.
Information Regarding the Review and Approval of the Portfolio’s Advisory Agreement
Information regarding the Portfolio’s Board of Directors’/Trustees’ review of the advisory agreement is available on the Portfolio’s website https://www.abfunds.com/link/AB/64VD-A-A. You can request this information, free of charge, by contacting us at (800) 227 4618 or by scanning the QR code below.
The [A/B] logo and AllianceBernstein® are registered trademarks used by permission of the owner, AllianceBernstein L.P.
Please scan QR code for
Portfolio Information
Please scan QR code for
Portfolio Information
AB VPS Dynamic Asset Allocation Portfolio
Annual Shareholder Report
This annual shareholder report contains important information about the AB VPS Dynamic Asset Allocation Portfolio (the “Portfolio”) for the period of January 1, 2024 to December 31, 2024. You can find additional information about the Portfolio at https://www.abfunds.com/link/AB/64VD-B-A. You can also request this information by contacting us at (800) 227 4618.
What were the Portfolio costs for the last year?
(Based on a hypothetical $10,000 investment)
| Class Name | Cost of a $10,000 investment | Costs paid as a percentage of a $10,000 investment |
|---|
| Class B | $116 | 1.10% |
|---|
How did the Portfolio perform last year? What affected the Portfolio’s performance?
During the 12-month period, the Portfolio underperformed the Morgan Stanley Capital International (“MSCI”) World Index (net) (the "benchmark"), largely due to its balanced construction of approximately 60% in equity and 40% in fixed-income. Through the course of the year, the Portfolio's Senior Investment Management Team (the “Team”) maintained an overweight in equity assets due to an expectation that inflation would cool and US growth would remain strong, creating a market-friendly environment of both central bank rate cuts and solid corporate earnings growth. The Team also tilted the Portfolio towards US stocks relative to international stocks due to the greater resilience of the US economy and very strong profitability and growth prospects for US technology companies.
In Late July and early August, market volatility rose due to concerns about US growth, fears that Japanese investors would unwind their US holdings in favor of domestic assets, and increased uncertainty around the US election outcome, leading the Team to moderate the size of the equity overweight. In the fourth quarter, the Team increased its equity overweight again as improved economic data supported continued expansion and sentiment improved due to the potential of a more supportive business environment following the election. While US equity holdings benefited, fixed-income investments and international assets suffered declines. The Team ended the period with an overweight to risk assets including developed-market equities.
The Portfolio continued to hold US treasury exposure to hedge equity risk as well as equity put options to guard against unexpected market shocks.
Top contributors to performance:
Top detractors from performance:
The following graph shows the performance of hypothetical $10,000 investments in the Portfolio, a broad-based securities market index and an additional index that corresponds to the Portfolio's investment strategies, over the most recently completed 10 fiscal years of the Portfolio, or since inception, if shorter. The Portfolio's performance reflects applicable sales charges and assumes the reinvestment of dividends.
| Class B | MSCI World Index (net) | Blended Benchmark: 60% MSCI World Index/ 40% Bloomberg US Treasury Index | Bloomberg U.S. Treasury Index |
|---|
| 12/14 | $10,000 | $10,000 | $10,000 | $10,000 |
|---|
| 12/15 | $9,870 | $9,913 | $10,008 | $10,084 |
|---|
| 12/16 | $10,202 | $10,657 | $10,516 | $10,189 |
|---|
| 12/17 | $11,663 | $13,045 | $11,987 | $10,424 |
|---|
| 12/18 | $10,807 | $11,908 | $11,420 | $10,514 |
|---|
| 12/19 | $12,453 | $15,203 | $13,617 | $11,235 |
|---|
| 12/20 | $13,059 | $17,621 | $15,492 | $12,134 |
|---|
| 12/21 | $14,270 | $21,465 | $17,304 | $11,852 |
|---|
| 12/22 | $11,605 | $17,571 | $14,607 | $10,375 |
|---|
| 12/23 | $13,169 | $21,751 | $16,893 | $10,795 |
|---|
| 12/24 | $14,542 | $25,812 | $18,779 | $10,858 |
|---|
Average Annual Total Returns
| AATR | 1 Year | 5 Years | 10 Years |
|---|
| Class B | 10.43% | 3.15% | 3.82% |
|---|
| MSCI World Index (net) | 18.67% | 11.17% | 9.95% |
|---|
| Blended Benchmark: 60% MSCI World Index/ 40% Bloomberg US Treasury Index | 11.16% | 6.64% | 6.50% |
|---|
| Bloomberg U.S. Treasury Index | 0.58% | -0.68% | 0.83% |
|---|
The Portfolio’s past performance is not a good predictor of the Portfolio’s future performance.
The graph and table do not reflect the deduction of taxes that a shareholder would pay on Portfolio distributions or the redemption or sale of Portfolio shares.
Visit https://www.abfunds.com/link/AB/64VD-B-A for the most recent performance information.
| Net Assets | $251,418,002 |
|---|
| # of Portfolio Holdings | 1,501 |
|---|
| Portfolio Turnover Rate | 11% |
|---|
| Total Advisory Fees Paid | $1,713,037 |
|---|
Graphical Representation of Holdings
| Company | U.S. $ Value | % of Net Assets |
|---|
| Apple, Inc. | $8,870,377 | 3.5% |
| NVIDIA Corp. | $7,674,673 | 3.1% |
| Microsoft Corp. | $6,934,518 | 2.8% |
| Amazon.com, Inc. | $4,828,116 | 1.9% |
| U.S. Treasury Notes, 2.00%, due 11/15/26 | $4,613,618 | 1.8% |
| U.S. Treasury Notes, 2.38%, due 05/15/27 | $4,181,498 | 1.7% |
| U.S. Treasury Notes, 2.25%, due 11/15/27 | $3,392,159 | 1.4% |
| Meta Platforms, Inc. - Class A | $2,981,417 | 1.2% |
| Tesla, Inc. | $2,705,324 | 1.1% |
| U.S. Treasury Notes, 1.63%, due 05/15/31 | $2,598,631 | 1.0% |
| Total | $48,780,331 | 19.5% |
| Value | Value |
|---|
| Common Stocks | 64.7% |
| Governments - Treasuries | 33.7% |
| Agencies | 0.8% |
| Purchased Options - Puts | 0.5% |
| Short-Term Investments | 1.5% |
| Other assets less liabilities | -1.2% |
Availability of Additional Information
You can find additional information on the Portfolio’s website at https://www.abfunds.com/link/AB/64VD-B-A, including the Portfolio's:
• Prospectus
• Financial information
• Portfolio holdings
• Proxy voting information
You can also request this information by contacting us at (800) 227 4618.
Shareholders who have consented to receive a single annual or semi-annual shareholder report at a shared address may revoke this consent by contacting us at (800) 227 4618.
Information Regarding the Review and Approval of the Portfolio’s Advisory Agreement
Information regarding the Portfolio’s Board of Directors’/Trustees’ review of the advisory agreement is available on the Portfolio’s website https://www.abfunds.com/link/AB/64VD-B-A. You can request this information, free of charge, by contacting us at (800) 227 4618 or by scanning the QR code below.
The [A/B] logo and AllianceBernstein® are registered trademarks used by permission of the owner, AllianceBernstein L.P.
Please scan QR code for
Portfolio Information
Please scan QR code for
Portfolio Information
AB VPS Global Risk Allocation - Moderate Portfolio
Annual Shareholder Report
This annual shareholder report contains important information about the AB VPS Global Risk Allocation - Moderate Portfolio (the “Portfolio”) for the period of January 1, 2024 to December 31, 2024. You can find additional information about the Portfolio at https://www.abfunds.com/link/AB/64V2-B-A. You can also request this information by contacting us at (800) 227 4618.
What were the Portfolio costs for the last year?
(Based on a hypothetical $10,000 investment)
| Class Name | Cost of a $10,000 investment | Costs paid as a percentage of a $10,000 investment |
|---|
| Class B | $79 | 0.74% |
|---|
How did the Portfolio perform last year? What affected the Portfolio’s performance?
For the 12-month period, Class B of the Portfolio underperformed the Morgan Stanley Capital International (“MSCI”) World Index (the "benchmark") (net, hedged to USD) and the blended benchmark. The Portfolio allocated most of its risk to global equity, with the balance allocated to global government bonds and cash. Over the period, the Portfolio’s overweight in equity and underweight in fixed income versus the blended benchmark contributed to the relative performance. The Portfolio's equity downside protection via equity index options detracted from performance.
During the 12-month period, the Portfolio used derivatives in the form of futures, currency forwards, purchased options and written options for hedging and investment purposes. Currency forwards and written options contributed, while futures and purchased options detracted from performance.
Top contributors to performance:
Top detractors from performance:
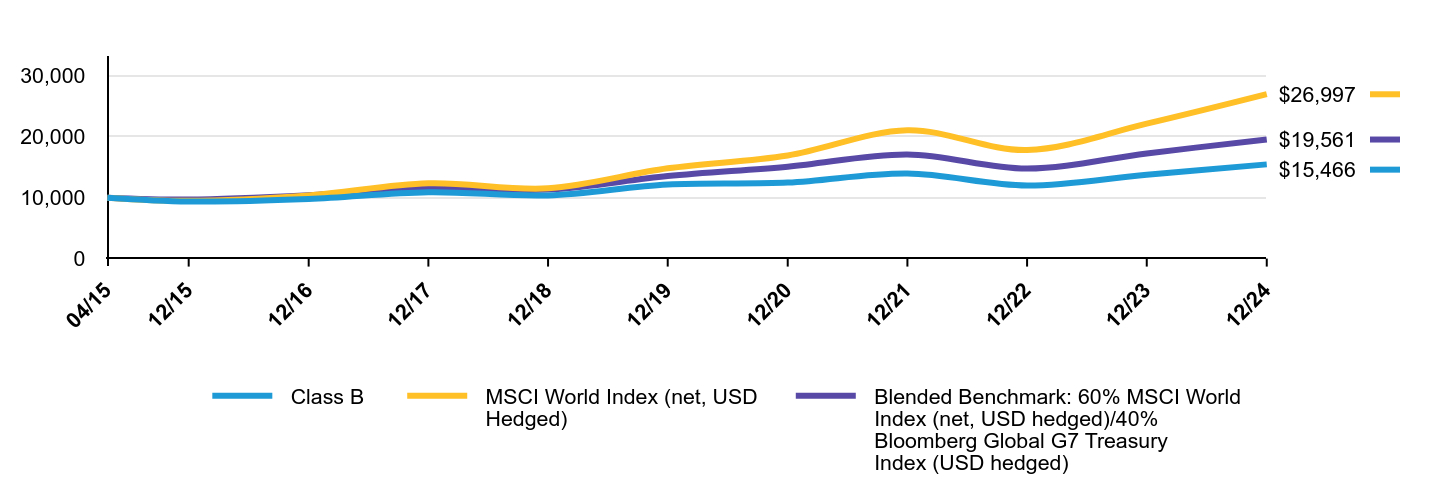
The following graph shows the performance of hypothetical $10,000 investments in the Portfolio, a broad-based securities market index and an additional index that corresponds to the Portfolio's investment strategies, over the most recently completed 10 fiscal years of the Portfolio, or since inception, if shorter. The Portfolio's performance reflects applicable sales charges and assumes the reinvestment of dividends.
| Class B | MSCI World Index (net, USD Hedged) | Blended Benchmark: 60% MSCI World Index (net, USD hedged)/40% Bloomberg Global G7 Treasury Index (USD hedged) |
|---|
| 04/15 | $10,000 | $10,000 | $10,000 |
|---|
| 12/15 | $9,380 | $9,479 | $9,691 |
|---|
| 12/16 | $9,778 | $10,369 | $10,402 |
|---|
| 12/17 | $10,903 | $12,353 | $11,655 |
|---|
| 12/18 | $10,375 | $11,539 | $11,328 |
|---|
| 12/19 | $12,172 | $14,819 | $13,546 |
|---|
| 12/20 | $12,471 | $16,933 | $15,091 |
|---|
| 12/21 | $13,964 | $21,062 | $17,104 |
|---|
| 12/22 | $12,000 | $17,822 | $14,784 |
|---|
| 12/23 | $13,775 | $22,153 | $17,261 |
|---|
| 12/24 | $15,466 | $26,997 | $19,561 |
|---|
Average Annual Total Returns
| AATR | 1 Year | 5 Years | Since Inception 04/28/15 |
|---|
| Class B | 12.28% | 4.91% | 4.61% |
|---|
| MSCI World Index (net, USD Hedged) | 21.87% | 12.75% | 10.80% |
|---|
| Blended Benchmark: 60% MSCI World Index (net, USD hedged)/40% Bloomberg Global G7 Treasury Index (USD hedged) | 13.33% | 7.63% | 7.17% |
|---|
The Portfolio’s past performance is not a good predictor of the Portfolio’s future performance.
The graph and table do not reflect the deduction of taxes that a shareholder would pay on Portfolio distributions or the redemption or sale of Portfolio shares.
Visit https://www.abfunds.com/link/AB/64V2-B-A for the most recent performance information.
| Net Assets | $715,718,987 |
|---|
| # of Portfolio Holdings | 1,234 |
|---|
| Portfolio Turnover Rate | 8% |
|---|
| Total Advisory Fees Paid | $3,270,604 |
|---|
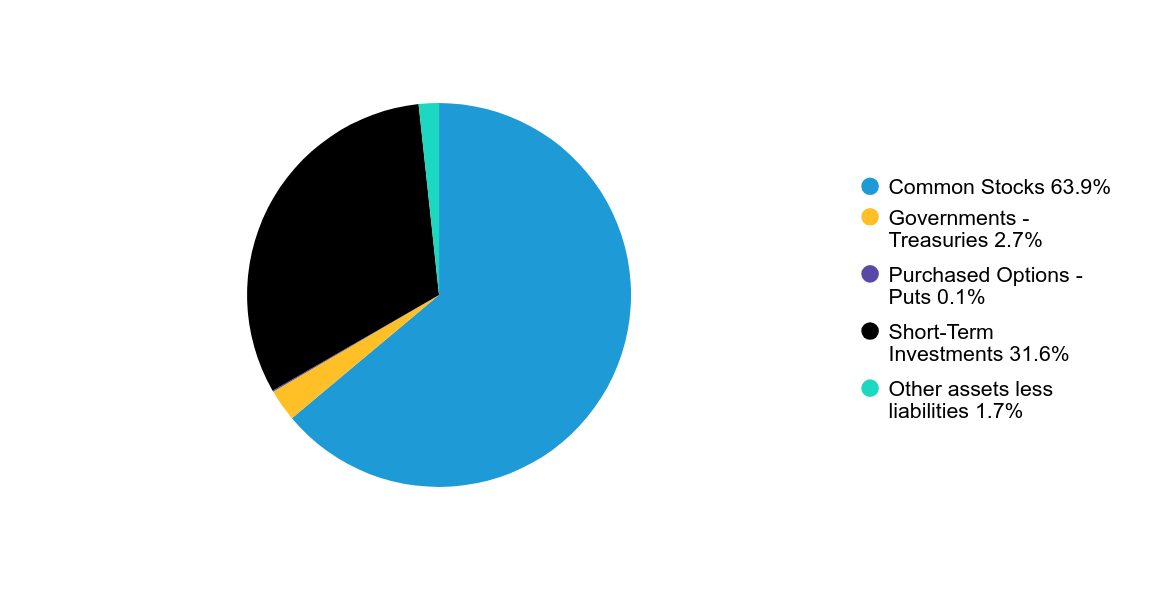
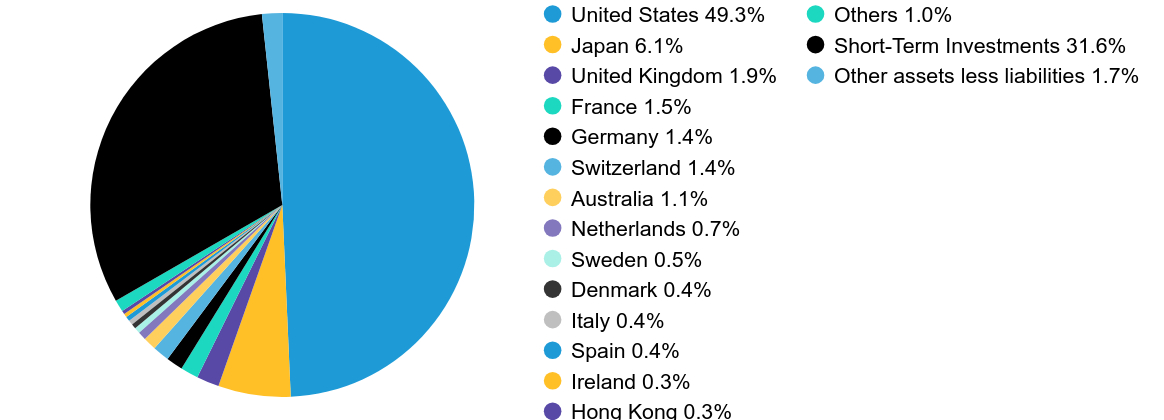
Graphical Representation of Holdings
| Value | Value |
|---|
| Common Stocks | 63.9% |
| Governments - Treasuries | 2.7% |
| Purchased Options - Puts | 0.1% |
| Short-Term Investments | 31.6% |
| Other assets less liabilities | 1.7% |
| Value | Value |
|---|
| United States | 49.3% |
| Japan | 6.1% |
| United Kingdom | 1.9% |
| France | 1.5% |
| Germany | 1.4% |
| Switzerland | 1.4% |
| Australia | 1.1% |
| Netherlands | 0.7% |
| Sweden | 0.5% |
| Denmark | 0.4% |
| Italy | 0.4% |
| Spain | 0.4% |
| Ireland | 0.3% |
| Hong Kong | 0.3% |
| Others | 1.0% |
| Short-Term Investments | 31.6% |
| Other assets less liabilities | 1.7% |
Availability of Additional Information
You can find additional information on the Portfolio’s website at https://www.abfunds.com/link/AB/64V2-B-A, including the Portfolio's:
• Prospectus
• Financial information
• Portfolio holdings
• Proxy voting information
You can also request this information by contacting us at (800) 227 4618.
Shareholders who have consented to receive a single annual or semi-annual shareholder report at a shared address may revoke this consent by contacting us at (800) 227 4618.
Information Regarding the Review and Approval of the Portfolio’s Advisory Agreement
Information regarding the Portfolio’s Board of Directors’/Trustees’ review of the advisory agreement is available on the Portfolio’s website https://www.abfunds.com/link/AB/64V2-B-A. You can request this information, free of charge, by contacting us at (800) 227 4618 or by scanning the QR code below.
The [A/B] logo and AllianceBernstein® are registered trademarks used by permission of the owner, AllianceBernstein L.P.
Please scan QR code for
Portfolio Information
Please scan QR code for
Portfolio Information
AB VPS Balanced Hedged Allocation Portfolio
Annual Shareholder Report
This annual shareholder report contains important information about the AB VPS Balanced Hedged Allocation Portfolio (the “Portfolio”) for the period of January 1, 2024 to December 31, 2024. You can find additional information about the Portfolio at https://www.abfunds.com/link/AB/64VW-A-A. You can also request this information by contacting us at (800) 227 4618.
What were the Portfolio costs for the last year?
(Based on a hypothetical $10,000 investment)
| Class Name | Cost of a $10,000 investment | Costs paid as a percentage of a $10,000 investment |
|---|
| Class A | $69 | 0.66% |
|---|
How did the Portfolio perform last year? What affected the Portfolio’s performance?
During the 12-month period ended December 31, 2024, all share classes of the Portfolio underperformed the Morgan Stanley Capital International All Country World Index (“MSCI ACWI”) (the "benchmark") (net). The Portfolio's more diversified approach, which balances exposures to equities, bonds and risk management techniques, is expected to underperform the all-equity primary benchmark during normal and rising markets. During the period, equities and fixed-income assets contributed to absolute performance, while risk management techniques detracted.
The Portfolio used derivatives in the form of futures and purchased options for hedging and investment purposes. Futures detracted from performance, while purchased options contributed.
Top contributors to performance:
Top detractors from performance:
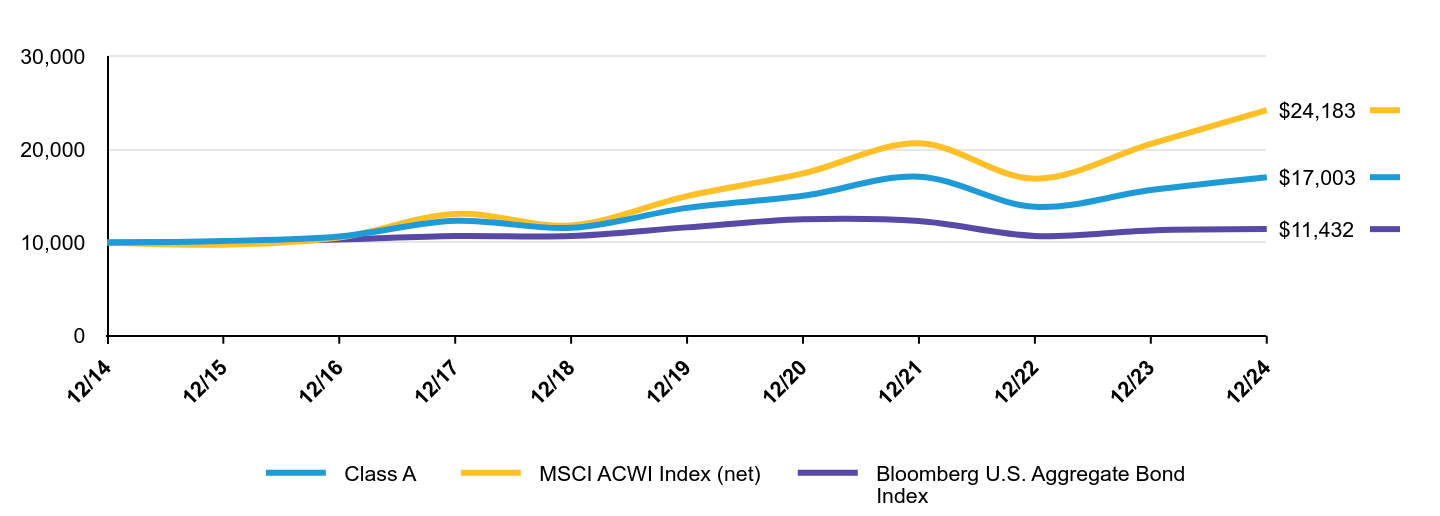
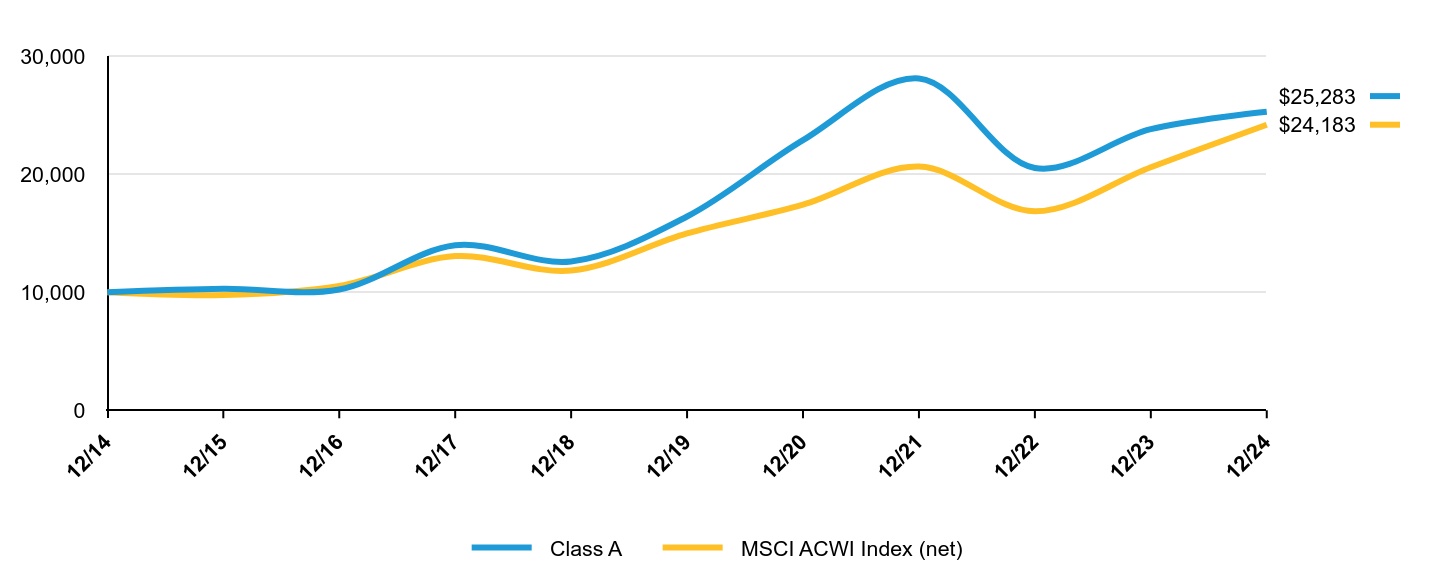
The following graph shows the performance of hypothetical $10,000 investments in the Portfolio, a broad-based securities market index and an additional index that corresponds to the Portfolio's investment strategies, over the most recently completed 10 fiscal years of the Portfolio, or since inception, if shorter. The Portfolio's performance reflects applicable sales charges and assumes the reinvestment of dividends.
| Class A | MSCI ACWI Index (net) | Bloomberg U.S. Aggregate Bond Index |
|---|
| 12/14 | $10,000 | $10,000 | $10,000 |
|---|
| 12/15 | $10,165 | $9,764 | $10,055 |
|---|
| 12/16 | $10,642 | $10,531 | $10,321 |
|---|
| 12/17 | $12,328 | $13,056 | $10,687 |
|---|
| 12/18 | $11,567 | $11,827 | $10,688 |
|---|
| 12/19 | $13,711 | $14,973 | $11,620 |
|---|
| 12/20 | $15,001 | $17,406 | $12,492 |
|---|
| 12/21 | $17,060 | $20,633 | $12,299 |
|---|
| 12/22 | $13,821 | $16,844 | $10,699 |
|---|
| 12/23 | $15,623 | $20,584 | $11,291 |
|---|
| 12/24 | $17,003 | $24,183 | $11,432 |
|---|
Average Annual Total Returns
| AATR | 1 Year | 5 Years | 10 Years |
|---|
| Class A | 8.84% | 4.40% | 5.45% |
|---|
| MSCI ACWI Index (net) | 17.49% | 10.06% | 9.23% |
|---|
| Bloomberg U.S. Aggregate Bond Index | 1.25% | -0.33% | 1.35% |
|---|
The Portfolio’s past performance is not a good predictor of the Portfolio’s future performance.
The graph and table do not reflect the deduction of taxes that a shareholder would pay on Portfolio distributions or the redemption or sale of Portfolio shares.
Visit https://www.abfunds.com/link/AB/64VW-A-A for the most recent performance information.
| Net Assets | $156,346,511 |
|---|
| # of Portfolio Holdings | 25 |
|---|
| Portfolio Turnover Rate | 6% |
|---|
| Total Advisory Fees Paid | $734,983 |
|---|
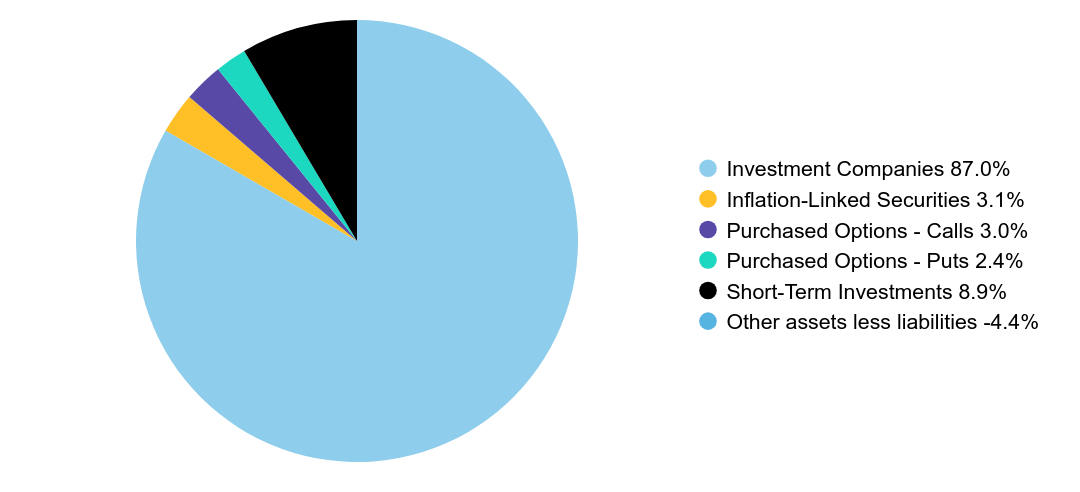
Graphical Representation of Holdings
| Company | U.S. $ Value | % of Net Assets |
|---|
| iShares Core S&P 500 ETF | $47,035,532 | 30.1% |
| iShares Core U.S. Aggregate Bond ETF | $24,273,450 | 15.5% |
| Vanguard Total Bond Market ETF | $24,226,479 | 15.5% |
| iShares Core MSCI EAFE ETF | $18,321,996 | 11.7% |
| iShares Core MSCI Emerging Markets ETF | $9,712,920 | 6.2% |
| Vanguard Mid-Cap ETF | $4,873,198 | 3.1% |
| U.S. Treasury Inflation Index, 0.13%, due 01/15/32 | $4,812,559 | 3.1% |
| Vanguard Real Estate ETF | $3,999,692 | 2.6% |
| Vanguard Small-Cap ETF | $3,520,102 | 2.3% |
| Purchased Options - Calls, S&P 500 Index, USD 5500.00, due 12/18/26 | $1,242,240 | 0.8% |
| Total | $142,018,168 | 90.9% |
| |
|---|
| Investment Companies | 87.0% |
| Inflation-Linked Securities | 3.1% |
| Purchased Options - Calls | 3.0% |
| Purchased Options - Puts | 2.4% |
| Short-Term Investments | 8.9% |
| Other assets less liabilities | -4.4% |
Availability of Additional Information
You can find additional information on the Portfolio’s website at https://www.abfunds.com/link/AB/64VW-A-A, including the Portfolio's:
• Prospectus
• Financial information
• Portfolio holdings
• Proxy voting information
You can also request this information by contacting us at (800) 227 4618.
Shareholders who have consented to receive a single annual or semi-annual shareholder report at a shared address may revoke this consent by contacting us at (800) 227 4618.
Information Regarding the Review and Approval of the Portfolio’s Advisory Agreement
Information regarding the Portfolio’s Board of Directors’/Trustees’ review of the advisory agreement is available on the Portfolio’s website https://www.abfunds.com/link/AB/64VW-A-A. You can request this information, free of charge, by contacting us at (800) 227 4618 or by scanning the QR code below.
The [A/B] logo and AllianceBernstein® are registered trademarks used by permission of the owner, AllianceBernstein L.P.
Please scan QR code for
Portfolio Information
Please scan QR code for
Portfolio Information
AB VPS Balanced Hedged Allocation Portfolio
Annual Shareholder Report
This annual shareholder report contains important information about the AB VPS Balanced Hedged Allocation Portfolio (the “Portfolio”) for the period of January 1, 2024 to December 31, 2024. You can find additional information about the Portfolio at https://www.abfunds.com/link/AB/64VW-B-A. You can also request this information by contacting us at (800) 227 4618.
What were the Portfolio costs for the last year?
(Based on a hypothetical $10,000 investment)
| Class Name | Cost of a $10,000 investment | Costs paid as a percentage of a $10,000 investment |
|---|
| Class B | $95 | 0.91% |
|---|
How did the Portfolio perform last year? What affected the Portfolio’s performance?
During the 12-month period ended December 31, 2024, all share classes of the Portfolio underperformed the Morgan Stanley Capital International All Country World Index (“MSCI ACWI”) (the "benchmark") (net). The Portfolio's more diversified approach, which balances exposures to equities, bonds and risk management techniques, is expected to underperform the all-equity primary benchmark during normal and rising markets. During the period, equities and fixed-income assets contributed to absolute performance, while risk management techniques detracted.
The Portfolio used derivatives in the form of futures and purchased options for hedging and investment purposes. Futures detracted from performance, while purchased options contributed.
Top contributors to performance:
Top detractors from performance:
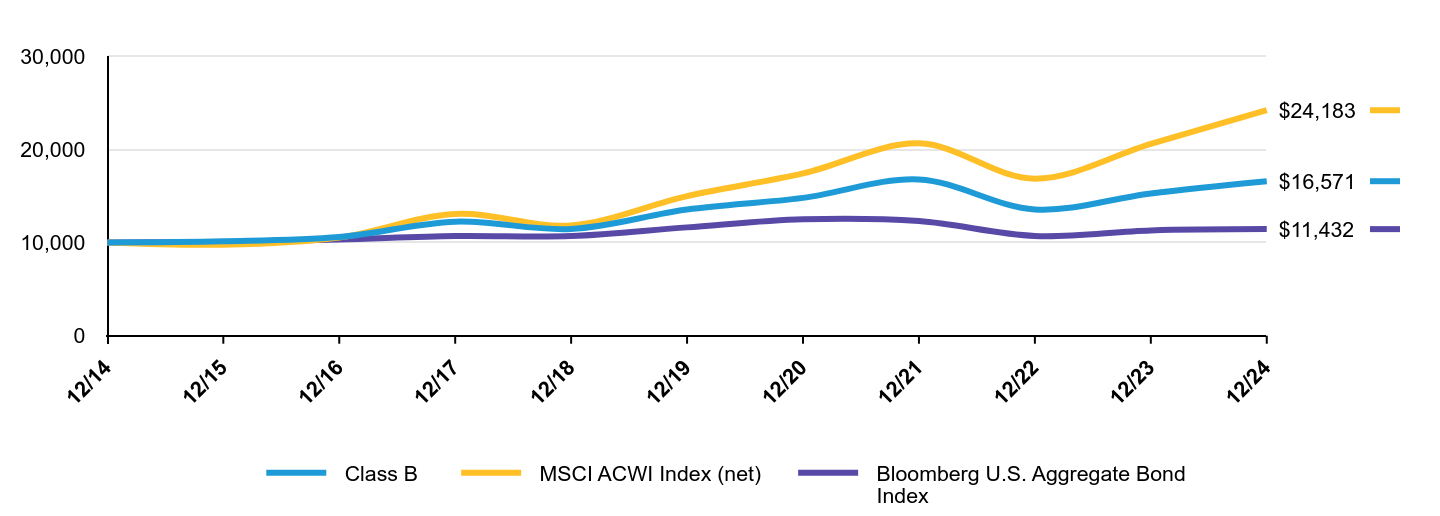
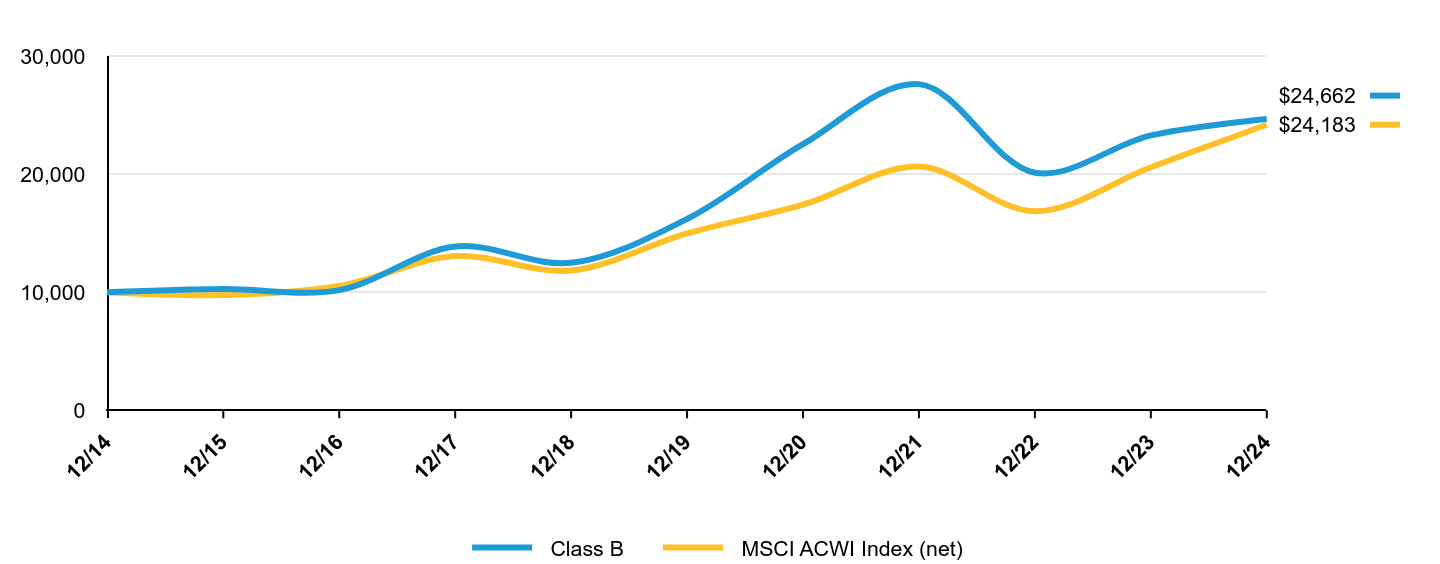
The following graph shows the performance of hypothetical $10,000 investments in the Portfolio, a broad-based securities market index and an additional index that corresponds to the Portfolio's investment strategies, over the most recently completed 10 fiscal years of the Portfolio, or since inception, if shorter. The Portfolio's performance reflects applicable sales charges and assumes the reinvestment of dividends.
| Class B | MSCI ACWI Index (net) | Bloomberg U.S. Aggregate Bond Index |
|---|
| 12/14 | $10,000 | $10,000 | $10,000 |
|---|
| 12/15 | $10,129 | $9,764 | $10,055 |
|---|
| 12/16 | $10,579 | $10,531 | $10,321 |
|---|
| 12/17 | $12,232 | $13,056 | $10,687 |
|---|
| 12/18 | $11,448 | $11,827 | $10,688 |
|---|
| 12/19 | $13,532 | $14,973 | $11,620 |
|---|
| 12/20 | $14,784 | $17,406 | $12,492 |
|---|
| 12/21 | $16,760 | $20,633 | $12,299 |
|---|
| 12/22 | $13,547 | $16,844 | $10,699 |
|---|
| 12/23 | $15,262 | $20,584 | $11,291 |
|---|
| 12/24 | $16,571 | $24,183 | $11,432 |
|---|
Average Annual Total Returns
| AATR | 1 Year | 5 Years | 10 Years |
|---|
| Class B | 8.58% | 4.14% | 5.18% |
|---|
| MSCI ACWI Index (net) | 17.49% | 10.06% | 9.23% |
|---|
| Bloomberg U.S. Aggregate Bond Index | 1.25% | -0.33% | 1.35% |
|---|
The Portfolio’s past performance is not a good predictor of the Portfolio’s future performance.
The graph and table do not reflect the deduction of taxes that a shareholder would pay on Portfolio distributions or the redemption or sale of Portfolio shares.
Visit https://www.abfunds.com/link/AB/64VW-B-A for the most recent performance information.
| Net Assets | $156,346,511 |
|---|
| # of Portfolio Holdings | 25 |
|---|
| Portfolio Turnover Rate | 6% |
|---|
| Total Advisory Fees Paid | $734,983 |
|---|
Graphical Representation of Holdings
| Company | U.S. $ Value | % of Net Assets |
|---|
| iShares Core S&P 500 ETF | $47,035,532 | 30.1% |
| iShares Core U.S. Aggregate Bond ETF | $24,273,450 | 15.5% |
| Vanguard Total Bond Market ETF | $24,226,479 | 15.5% |
| iShares Core MSCI EAFE ETF | $18,321,996 | 11.7% |
| iShares Core MSCI Emerging Markets ETF | $9,712,920 | 6.2% |
| Vanguard Mid-Cap ETF | $4,873,198 | 3.1% |
| U.S. Treasury Inflation Index, 0.13%, due 01/15/32 | $4,812,559 | 3.1% |
| Vanguard Real Estate ETF | $3,999,692 | 2.6% |
| Vanguard Small-Cap ETF | $3,520,102 | 2.3% |
| Purchased Options - Calls, S&P 500 Index, USD 5500.00, due 12/18/26 | $1,242,240 | 0.8% |
| Total | $142,018,168 | 90.9% |
| |
|---|
| Investment Companies | 87.0% |
| Inflation-Linked Securities | 3.1% |
| Purchased Options - Calls | 3.0% |
| Purchased Options - Puts | 2.4% |
| Short-Term Investments | 8.9% |
| Other assets less liabilities | -4.4% |
Availability of Additional Information
You can find additional information on the Portfolio’s website at https://www.abfunds.com/link/AB/64VW-B-A, including the Portfolio's:
• Prospectus
• Financial information
• Portfolio holdings
• Proxy voting information
You can also request this information by contacting us at (800) 227 4618.
Shareholders who have consented to receive a single annual or semi-annual shareholder report at a shared address may revoke this consent by contacting us at (800) 227 4618.
Information Regarding the Review and Approval of the Portfolio’s Advisory Agreement
Information regarding the Portfolio’s Board of Directors’/Trustees’ review of the advisory agreement is available on the Portfolio’s website https://www.abfunds.com/link/AB/64VW-B-A. You can request this information, free of charge, by contacting us at (800) 227 4618 or by scanning the QR code below.
The [A/B] logo and AllianceBernstein® are registered trademarks used by permission of the owner, AllianceBernstein L.P.
Please scan QR code for
Portfolio Information
Please scan QR code for
Portfolio Information
AB VPS Relative Value Portfolio
Annual Shareholder Report
This annual shareholder report contains important information about the AB VPS Relative Value Portfolio (the “Portfolio”) for the period of January 1, 2024 to December 31, 2024. You can find additional information about the Portfolio at https://www.abfunds.com/link/AB/64VH-A-A. You can also request this information by contacting us at (800) 227 4618.
What were the Portfolio costs for the last year?
(Based on a hypothetical $10,000 investment)
| Class Name | Cost of a $10,000 investment | Costs paid as a percentage of a $10,000 investment |
|---|
| Class A | $64 | 0.60% |
|---|
How did the Portfolio perform last year? What affected the Portfolio’s performance?
During the 12-month period ended December 31, 2024, all share classes of the Portfolio underperformed the Russell 1000 Value Index (the “benchmark”). Overall sector allocation drove the underperformance. Gains from underweights to materials and real estate were offset by losses from an overweight to health care and an underweight to utilities. Security selection was positive and added to gains, led by selection within consumer staples and technology. Selection within industrials and energy detracted from results.
Top contributors to performance:
Top detractors from performance:
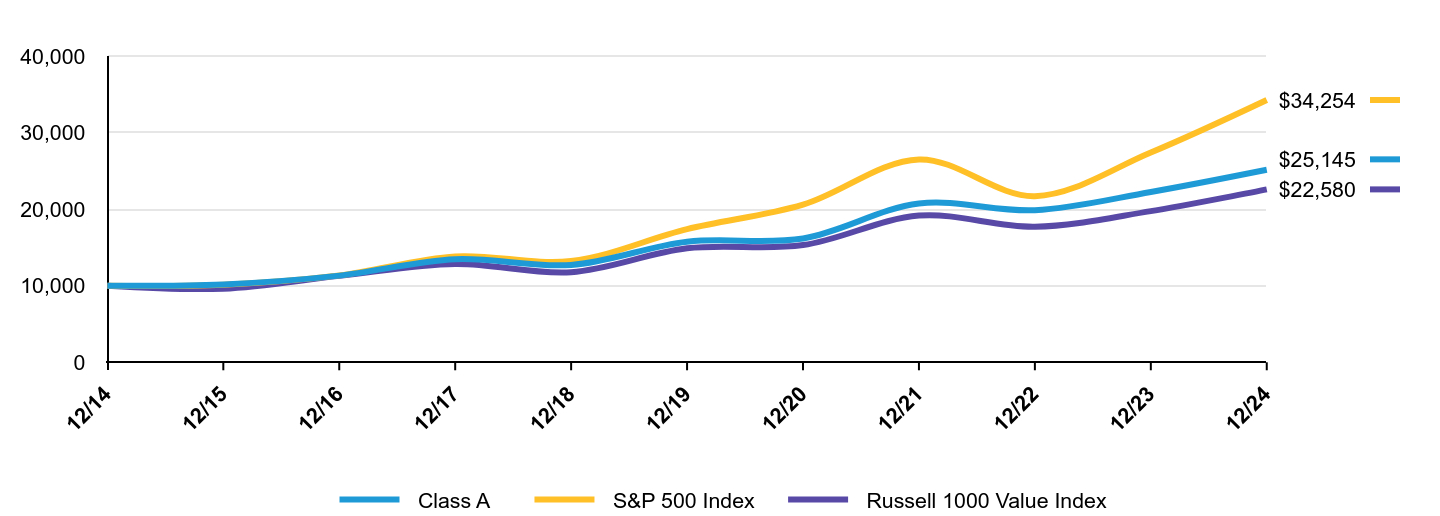
The following graph shows the performance of hypothetical $10,000 investments in the Portfolio, a broad-based securities market index and an additional index that corresponds to the Portfolio's investment strategies, over the most recently completed 10 fiscal years of the Portfolio, or since inception, if shorter. The Portfolio's performance reflects applicable sales charges and assumes the reinvestment of dividends.
| Class A | S&P 500 Index | Russell 1000 Value Index |
|---|
| 12/14 | $10,000 | $10,000 | $10,000 |
|---|
| 12/15 | $10,170 | $10,138 | $9,617 |
|---|
| 12/16 | $11,319 | $11,351 | $11,285 |
|---|
| 12/17 | $13,462 | $13,829 | $12,827 |
|---|
| 12/18 | $12,707 | $13,223 | $11,767 |
|---|
| 12/19 | $15,745 | $17,386 | $14,890 |
|---|
| 12/20 | $16,174 | $20,585 | $15,306 |
|---|
| 12/21 | $20,728 | $26,494 | $19,157 |
|---|
| 12/22 | $19,859 | $21,696 | $17,713 |
|---|
| 12/23 | $22,247 | $27,399 | $19,743 |
|---|
| 12/24 | $25,145 | $34,254 | $22,580 |
|---|
Average Annual Total Returns
| AATR | 1 Year | 5 Years | 10 Years |
|---|
| Class A | 13.02% | 9.81% | 9.66% |
|---|
| S&P 500 Index | 25.02% | 14.53% | 13.10% |
|---|
| Russell 1000 Value Index | 14.37% | 8.68% | 8.49% |
|---|
The addition of the S&P 500 Index broad-based benchmark provides a comparison of the Portfolio's performance against the broader market as regulatorily required.
The Portfolio’s past performance is not a good predictor of the Portfolio’s future performance.
The graph and table do not reflect the deduction of taxes that a shareholder would pay on Portfolio distributions or the redemption or sale of Portfolio shares.
Visit https://www.abfunds.com/link/AB/64VH-A-A for the most recent performance information.
| Net Assets | $922,434,257 |
|---|
| # of Portfolio Holdings | 73 |
|---|
| Portfolio Turnover Rate | 58% |
|---|
| Total Advisory Fees Paid | $4,958,987 |
|---|
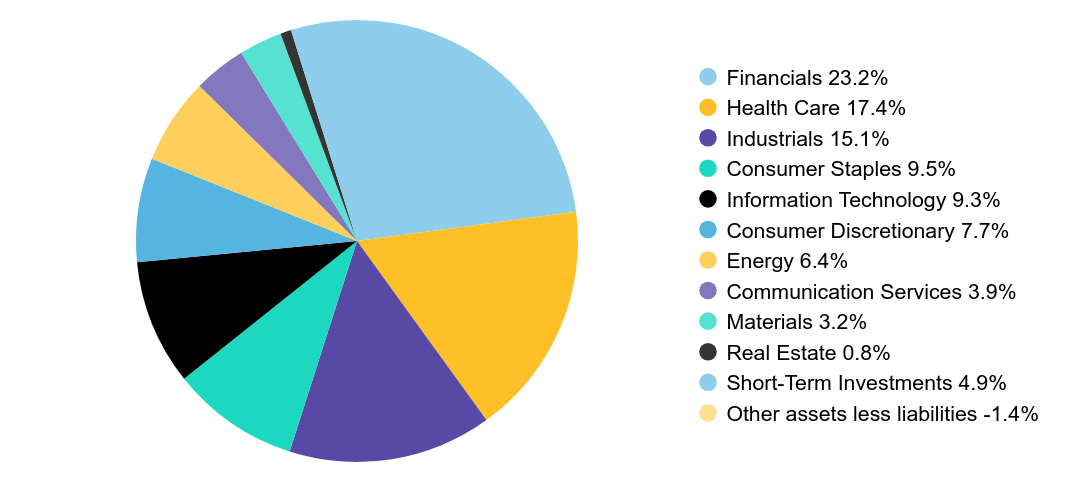
Graphical Representation of Holdings
| Company | U.S. $ Value | % of Net Assets |
|---|
| JPMorgan Chase & Co. | $37,720,766 | 4.1% |
| Berkshire Hathaway, Inc. - Class B | $36,686,217 | 4.0% |
| Walmart, Inc. | $36,142,710 | 3.9% |
| Philip Morris International, Inc. | $32,846,644 | 3.6% |
| Fiserv, Inc. | $28,005,525 | 3.0% |
| Accenture PLC - Class A | $26,236,850 | 2.8% |
| Regeneron Pharmaceuticals, Inc. | $24,294,727 | 2.6% |
| Citigroup, Inc. | $23,972,229 | 2.6% |
| Electronic Arts, Inc. | $23,306,468 | 2.5% |
| Johnson & Johnson | $23,258,222 | 2.5% |
| Total | $292,470,358 | 31.6% |
| Value | Value |
|---|
| Financials | 23.2% |
| Health Care | 17.4% |
| Industrials | 15.1% |
| Consumer Staples | 9.5% |
| Information Technology | 9.3% |
| Consumer Discretionary | 7.7% |
| Energy | 6.4% |
| Communication Services | 3.9% |
| Materials | 3.2% |
| Real Estate | 0.8% |
| Short-Term Investments | 4.9% |
| Other assets less liabilities | -1.4% |
Availability of Additional Information
You can find additional information on the Portfolio’s website at https://www.abfunds.com/link/AB/64VH-A-A, including the Portfolio's:
• Prospectus
• Financial information
• Portfolio holdings
• Proxy voting information
You can also request this information by contacting us at (800) 227 4618.
Shareholders who have consented to receive a single annual or semi-annual shareholder report at a shared address may revoke this consent by contacting us at (800) 227 4618.
Information Regarding the Review and Approval of the Portfolio’s Advisory Agreement
Information regarding the Portfolio’s Board of Directors’/Trustees’ review of the advisory agreement is available on the Portfolio’s website https://www.abfunds.com/link/AB/64VH-A-A. You can request this information, free of charge, by contacting us at (800) 227 4618 or by scanning the QR code below.
The [A/B] logo and AllianceBernstein® are registered trademarks used by permission of the owner, AllianceBernstein L.P.
Please scan QR code for
Portfolio Information
Please scan QR code for
Portfolio Information
AB VPS Relative Value Portfolio
Annual Shareholder Report
This annual shareholder report contains important information about the AB VPS Relative Value Portfolio (the “Portfolio”) for the period of January 1, 2024 to December 31, 2024. You can find additional information about the Portfolio at https://www.abfunds.com/link/AB/64VH-B-A. You can also request this information by contacting us at (800) 227 4618.
What were the Portfolio costs for the last year?
(Based on a hypothetical $10,000 investment)
| Class Name | Cost of a $10,000 investment | Costs paid as a percentage of a $10,000 investment |
|---|
| Class B | $90 | 0.85% |
|---|
How did the Portfolio perform last year? What affected the Portfolio’s performance?
During the 12-month period ended December 31, 2024, all share classes of the Portfolio underperformed the Russell 1000 Value Index (the “benchmark”). Overall sector allocation drove the underperformance. Gains from underweights to materials and real estate were offset by losses from an overweight to health care and an underweight to utilities. Security selection was positive and added to gains, led by selection within consumer staples and technology. Selection within industrials and energy detracted from results.
Top contributors to performance:
Top detractors from performance:
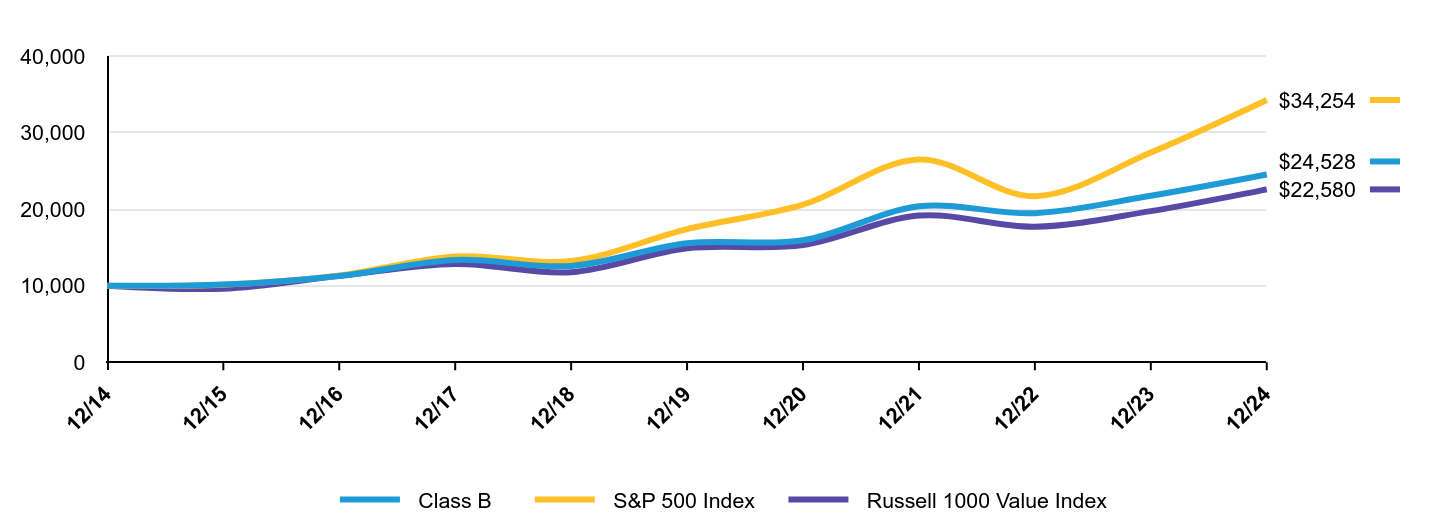
The following graph shows the performance of hypothetical $10,000 investments in the Portfolio, a broad-based securities market index and an additional index that corresponds to the Portfolio's investment strategies, over the most recently completed 10 fiscal years of the Portfolio, or since inception, if shorter. The Portfolio's performance reflects applicable sales charges and assumes the reinvestment of dividends.
| Class B | S&P 500 Index | Russell 1000 Value Index |
|---|
| 12/14 | $10,000 | $10,000 | $10,000 |
|---|
| 12/15 | $10,143 | $10,138 | $9,617 |
|---|
| 12/16 | $11,265 | $11,351 | $11,285 |
|---|
| 12/17 | $13,360 | $13,829 | $12,827 |
|---|
| 12/18 | $12,580 | $13,223 | $11,767 |
|---|
| 12/19 | $15,550 | $17,386 | $14,890 |
|---|
| 12/20 | $15,934 | $20,585 | $15,306 |
|---|
| 12/21 | $20,370 | $26,494 | $19,157 |
|---|
| 12/22 | $19,470 | $21,696 | $17,713 |
|---|
| 12/23 | $21,752 | $27,399 | $19,743 |
|---|
| 12/24 | $24,528 | $34,254 | $22,580 |
|---|
Average Annual Total Returns
| AATR | 1 Year | 5 Years | 10 Years |
|---|
| Class B | 12.76% | 9.54% | 9.39% |
|---|
| S&P 500 Index | 25.02% | 14.53% | 13.10% |
|---|
| Russell 1000 Value Index | 14.37% | 8.68% | 8.49% |
|---|
The addition of the S&P 500 Index broad-based benchmark provides a comparison of the Portfolio's performance against the broader market as regulatorily required.
The Portfolio’s past performance is not a good predictor of the Portfolio’s future performance.
The graph and table do not reflect the deduction of taxes that a shareholder would pay on Portfolio distributions or the redemption or sale of Portfolio shares.
Visit https://www.abfunds.com/link/AB/64VH-B-A for the most recent performance information.
| Net Assets | $922,434,257 |
|---|
| # of Portfolio Holdings | 73 |
|---|
| Portfolio Turnover Rate | 58% |
|---|
| Total Advisory Fees Paid | $4,958,987 |
|---|
Graphical Representation of Holdings
| Company | U.S. $ Value | % of Net Assets |
|---|
| JPMorgan Chase & Co. | $37,720,766 | 4.1% |
| Berkshire Hathaway, Inc. - Class B | $36,686,217 | 4.0% |
| Walmart, Inc. | $36,142,710 | 3.9% |
| Philip Morris International, Inc. | $32,846,644 | 3.6% |
| Fiserv, Inc. | $28,005,525 | 3.0% |
| Accenture PLC - Class A | $26,236,850 | 2.8% |
| Regeneron Pharmaceuticals, Inc. | $24,294,727 | 2.6% |
| Citigroup, Inc. | $23,972,229 | 2.6% |
| Electronic Arts, Inc. | $23,306,468 | 2.5% |
| Johnson & Johnson | $23,258,222 | 2.5% |
| Total | $292,470,358 | 31.6% |
| Value | Value |
|---|
| Financials | 23.2% |
| Health Care | 17.4% |
| Industrials | 15.1% |
| Consumer Staples | 9.5% |
| Information Technology | 9.3% |
| Consumer Discretionary | 7.7% |
| Energy | 6.4% |
| Communication Services | 3.9% |
| Materials | 3.2% |
| Real Estate | 0.8% |
| Short-Term Investments | 4.9% |
| Other assets less liabilities | -1.4% |
Availability of Additional Information
You can find additional information on the Portfolio’s website at https://www.abfunds.com/link/AB/64VH-B-A, including the Portfolio's:
• Prospectus
• Financial information
• Portfolio holdings
• Proxy voting information
You can also request this information by contacting us at (800) 227 4618.
Shareholders who have consented to receive a single annual or semi-annual shareholder report at a shared address may revoke this consent by contacting us at (800) 227 4618.
Information Regarding the Review and Approval of the Portfolio’s Advisory Agreement
Information regarding the Portfolio’s Board of Directors’/Trustees’ review of the advisory agreement is available on the Portfolio’s website https://www.abfunds.com/link/AB/64VH-B-A. You can request this information, free of charge, by contacting us at (800) 227 4618 or by scanning the QR code below.
The [A/B] logo and AllianceBernstein® are registered trademarks used by permission of the owner, AllianceBernstein L.P.
Please scan QR code for
Portfolio Information
Please scan QR code for
Portfolio Information
AB VPS International Value Portfolio
Annual Shareholder Report
This annual shareholder report contains important information about the AB VPS International Value Portfolio (the “Portfolio”) for the period of January 1, 2024 to December 31, 2024. You can find additional information about the Portfolio at https://www.abfunds.com/link/AB/64VF-A-A. You can also request this information by contacting us at (800) 227 4618.
What were the Portfolio costs for the last year?
(Based on a hypothetical $10,000 investment)
| Class Name | Cost of a $10,000 investment | Costs paid as a percentage of a $10,000 investment |
|---|
| Class A | $92 | 0.90% |
|---|
How did the Portfolio perform last year? What affected the Portfolio’s performance?
During the 12-month period ended December 31, 2024, all share classes of the Portfolio outperformed the Morgan Stanley Capital International Europe, Australasia and the Far East (“MSCI EAFE”) Index (net) (the "benchmark"). Overall security selection contributed to returns, while sector allocation detracted. Security selection within industrials and materials contributed the most, offsetting losses from selection within consumer discretionary and utilities. In terms of sector allocation, an underweight to financials and an overweight to energy detracted and offset some of the gains from an overweight to communication services and an underweight to health care. Overall country selection (a result of bottom-up security analysis combined with fundamental research) detracted, as losses from overweights to Portugal and South Korea offset gains from an overweight to Taiwan and an underweight to Denmark.
The Portfolio used derivatives for hedging purchases, which detracted from performance over the 12-month period.
Top contributors to performance:
During the 12-month period, security selection within industrials and materials, an overweight to communication services and an underweight to health care contributed the most. Country selection including an overweight to Taiwan and an underweight to Denmark also added to gains.
Top detractors from performance:
During the 12-month period, leading detractors to performance included an underweight to financials and an overweight to energy, as well as selection within consumer discretionary and utilities. Overweights to Portugal and South Korea also detracted from returns.
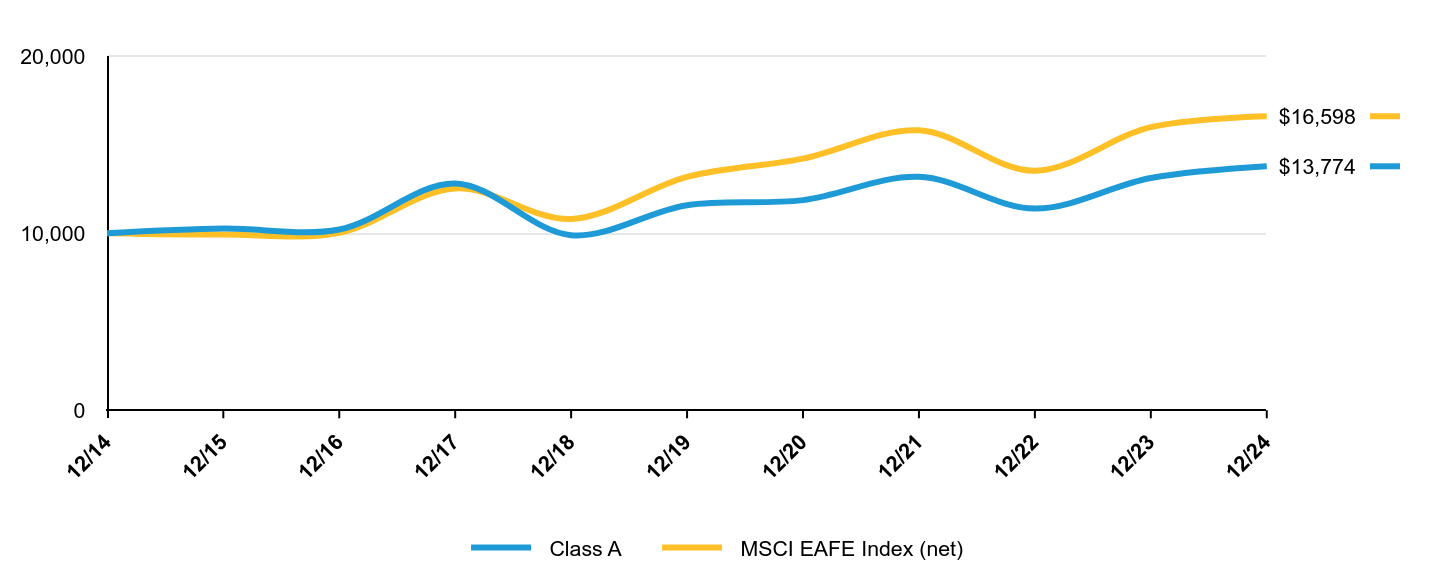
The following graph shows the performance of hypothetical $10,000 investments in the Portfolio and a broad-based securities market index over the most recently completed 10 fiscal years of the Portfolio, or since inception, if shorter. The Portfolio's performance reflects applicable sales charges and assumes the reinvestment of dividends.
| Class A | MSCI EAFE Index (net) |
|---|
| 12/14 | $10,000 | $10,000 |
|---|
| 12/15 | $10,259 | $9,919 |
|---|
| 12/16 | $10,208 | $10,018 |
|---|
| 12/17 | $12,802 | $12,526 |
|---|
| 12/18 | $9,885 | $10,798 |
|---|
| 12/19 | $11,579 | $13,176 |
|---|
| 12/20 | $11,864 | $14,205 |
|---|
| 12/21 | $13,179 | $15,805 |
|---|
| 12/22 | $11,386 | $13,521 |
|---|
| 12/23 | $13,110 | $15,987 |
|---|
| 12/24 | $13,774 | $16,598 |
|---|
Average Annual Total Returns
| AATR | 1 Year | 5 Years | 10 Years |
|---|
| Class A | 5.07% | 3.53% | 3.25% |
|---|
| MSCI EAFE Index (net) | 3.82% | 4.73% | 5.20% |
|---|
The Portfolio’s past performance is not a good predictor of the Portfolio’s future performance.
The graph and table do not reflect the deduction of taxes that a shareholder would pay on Portfolio distributions or the redemption or sale of Portfolio shares.
Visit https://www.abfunds.com/link/AB/64VF-A-A for the most recent performance information.
| Net Assets | $254,126,665 |
|---|
| # of Portfolio Holdings | 61 |
|---|
| Portfolio Turnover Rate | 51% |
|---|
| Total Advisory Fees Paid | $2,028,548 |
|---|
Graphical Representation of Holdings
| Company | U.S. $ Value | % of Net Assets |
|---|
| Roche Holding AG | $8,919,731 | 3.5% |
| Shell PLC | $8,543,790 | 3.4% |
| NatWest Group PLC | $7,371,505 | 2.9% |
| Sony Group Corp. | $7,056,090 | 2.8% |
| Airbus SE | $6,370,805 | 2.5% |
| Deutsche Telekom AG | $6,291,167 | 2.5% |
| Resona Holdings, Inc. | $6,270,193 | 2.5% |
| Koninklijke Ahold Delhaize NV | $6,198,114 | 2.4% |
| Erste Group Bank AG | $6,048,360 | 2.4% |
| Haleon PLC | $5,788,100 | 2.3% |
| Total | $68,857,855 | 27.2% |
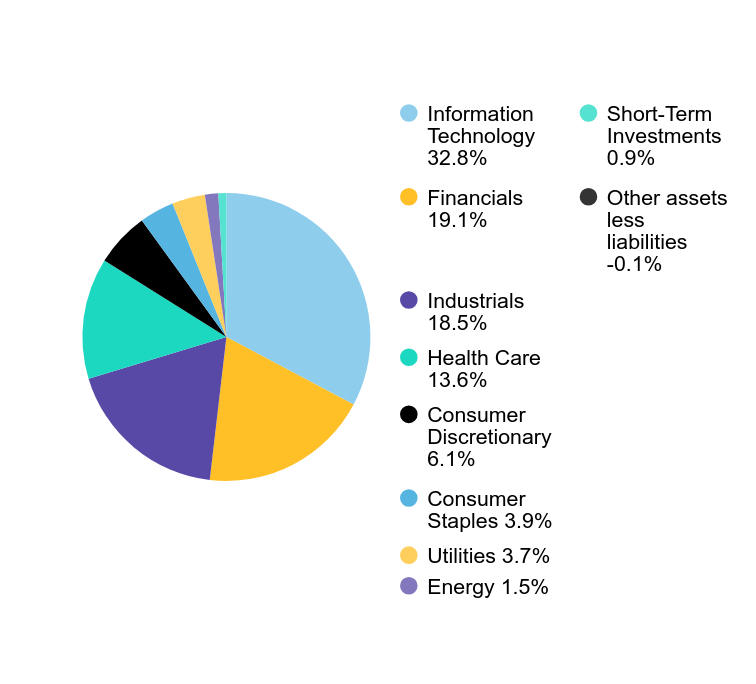
| Value | Value |
|---|
| Industrials | 18.9% |
| Financials | 15.1% |
| Consumer Discretionary | 11.8% |
| Health Care | 11.4% |
| Consumer Staples | 9.8% |
| Materials | 8.5% |
| Energy | 8.2% |
| Information Technology | 6.6% |
| Communication Services | 5.4% |
| Utilities | 3.3% |
| Short-Term Investments | 1.1% |
| Other assets less liabilities | -0.1% |
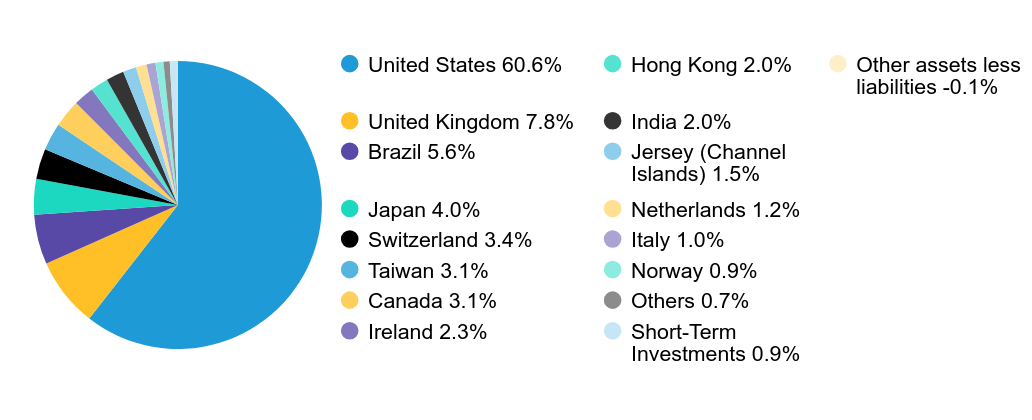
| Value | Value |
|---|
| Japan | 20.4% |
| United Kingdom | 16.6% |
| United States | 10.2% |
| France | 9.0% |
| Netherlands | 7.7% |
| Germany | 7.2% |
| Switzerland | 5.6% |
| Spain | 3.3% |
| Italy | 3.2% |
| Hong Kong | 2.7% |
| Austria | 2.4% |
| Taiwan | 2.0% |
| Canada | 1.9% |
| Portugal | 1.6% |
| Others | 5.2% |
| Short-Term Investments | 1.1% |
| Other assets less liabilities | -0.1% |
Availability of Additional Information
You can find additional information on the Portfolio’s website at https://www.abfunds.com/link/AB/64VF-A-A, including the Portfolio's:
• Prospectus
• Financial information
• Portfolio holdings
• Proxy voting information
You can also request this information by contacting us at (800) 227 4618.
Shareholders who have consented to receive a single annual or semi-annual shareholder report at a shared address may revoke this consent by contacting us at (800) 227 4618.
Information Regarding the Review and Approval of the Portfolio’s Advisory Agreement
Information regarding the Portfolio’s Board of Directors’/Trustees’ review of the advisory agreement is available on the Portfolio’s website https://www.abfunds.com/link/AB/64VF-A-A. You can request this information, free of charge, by contacting us at (800) 227 4618 or by scanning the QR code below.
The [A/B] logo and AllianceBernstein® are registered trademarks used by permission of the owner, AllianceBernstein L.P.
Please scan QR code for
Portfolio Information
Please scan QR code for
Portfolio Information
AB VPS International Value Portfolio
Annual Shareholder Report
This annual shareholder report contains important information about the AB VPS International Value Portfolio (the “Portfolio”) for the period of January 1, 2024 to December 31, 2024. You can find additional information about the Portfolio at https://www.abfunds.com/link/AB/64VF-B-A. You can also request this information by contacting us at (800) 227 4618.
What were the Portfolio costs for the last year?
(Based on a hypothetical $10,000 investment)
| Class Name | Cost of a $10,000 investment | Costs paid as a percentage of a $10,000 investment |
|---|
| Class B | $117 | 1.14% |
|---|
How did the Portfolio perform last year? What affected the Portfolio’s performance?
During the 12-month period ended December 31, 2024, all share classes of the Portfolio outperformed the Morgan Stanley Capital International Europe, Australasia and the Far East (“MSCI EAFE”) Index (net) (the "benchmark"). Overall security selection contributed to returns, while sector allocation detracted. Security selection within industrials and materials contributed the most, offsetting losses from selection within consumer discretionary and utilities. In terms of sector allocation, an underweight to financials and an overweight to energy detracted and offset some of the gains from an overweight to communication services and an underweight to health care. Overall country selection (a result of bottom-up security analysis combined with fundamental research) detracted, as losses from overweights to Portugal and South Korea offset gains from an overweight to Taiwan and an underweight to Denmark.
The Portfolio used derivatives for hedging purchases, which detracted from performance over the 12-month period.
Top contributors to performance:
During the 12-month period, security selection within industrials and materials, an overweight to communication services and an underweight to health care contributed the most. Country selection including an overweight to Taiwan and an underweight to Denmark also added to gains.
Top detractors from performance:
During the 12-month period, leading detractors to performance included an underweight to financials and an overweight to energy, as well as selection within consumer discretionary and utilities. Overweights to Portugal and South Korea also detracted from returns.
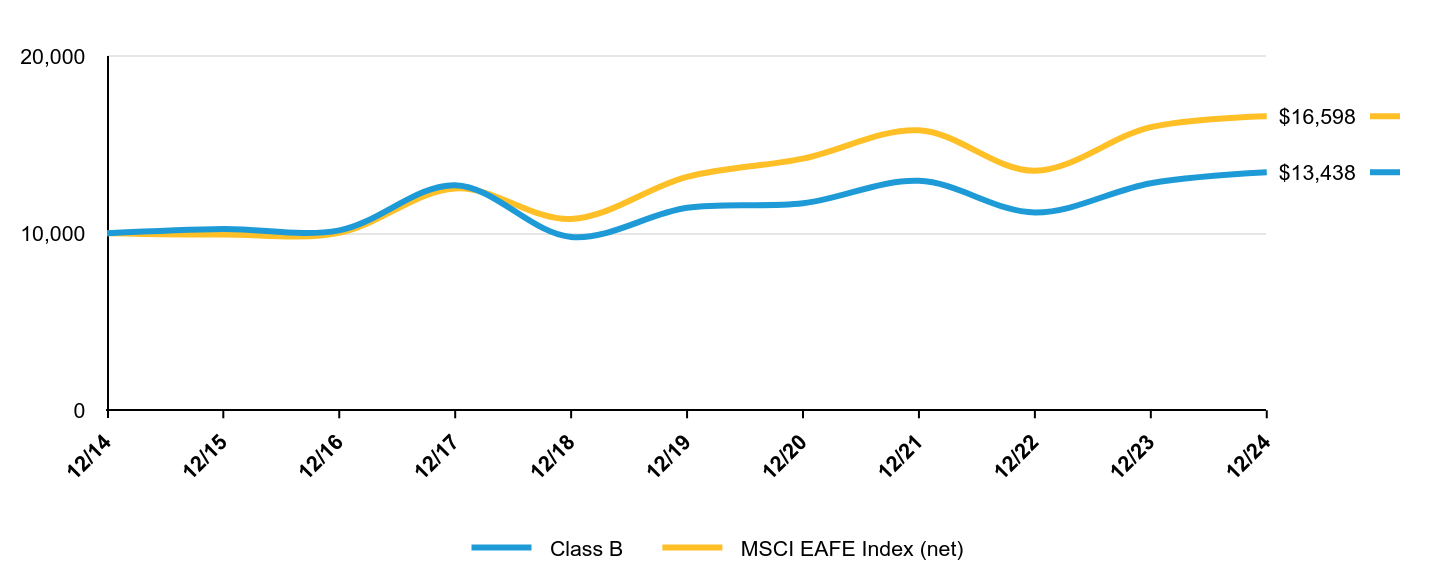
The following graph shows the performance of hypothetical $10,000 investments in the Portfolio and a broad-based securities market index over the most recently completed 10 fiscal years of the Portfolio, or since inception, if shorter. The Portfolio's performance reflects applicable sales charges and assumes the reinvestment of dividends.
| Class B | MSCI EAFE Index (net) |
|---|
| 12/14 | $10,000 | $10,000 |
|---|
| 12/15 | $10,240 | $9,919 |
|---|
| 12/16 | $10,158 | $10,018 |
|---|
| 12/17 | $12,708 | $12,526 |
|---|
| 12/18 | $9,788 | $10,798 |
|---|
| 12/19 | $11,431 | $13,176 |
|---|
| 12/20 | $11,684 | $14,205 |
|---|
| 12/21 | $12,952 | $15,805 |
|---|
| 12/22 | $11,165 | $13,521 |
|---|
| 12/23 | $12,821 | $15,987 |
|---|
| 12/24 | $13,438 | $16,598 |
|---|
Average Annual Total Returns
| AATR | 1 Year | 5 Years | 10 Years |
|---|
| Class B | 4.81% | 3.29% | 3.00% |
|---|
| MSCI EAFE Index (net) | 3.82% | 4.73% | 5.20% |
|---|
The Portfolio’s past performance is not a good predictor of the Portfolio’s future performance.
The graph and table do not reflect the deduction of taxes that a shareholder would pay on Portfolio distributions or the redemption or sale of Portfolio shares.
Visit https://www.abfunds.com/link/AB/64VF-B-A for the most recent performance information.
| Net Assets | $254,126,665 |
|---|
| # of Portfolio Holdings | 61 |
|---|
| Portfolio Turnover Rate | 51% |
|---|
| Total Advisory Fees Paid | $2,028,548 |
|---|
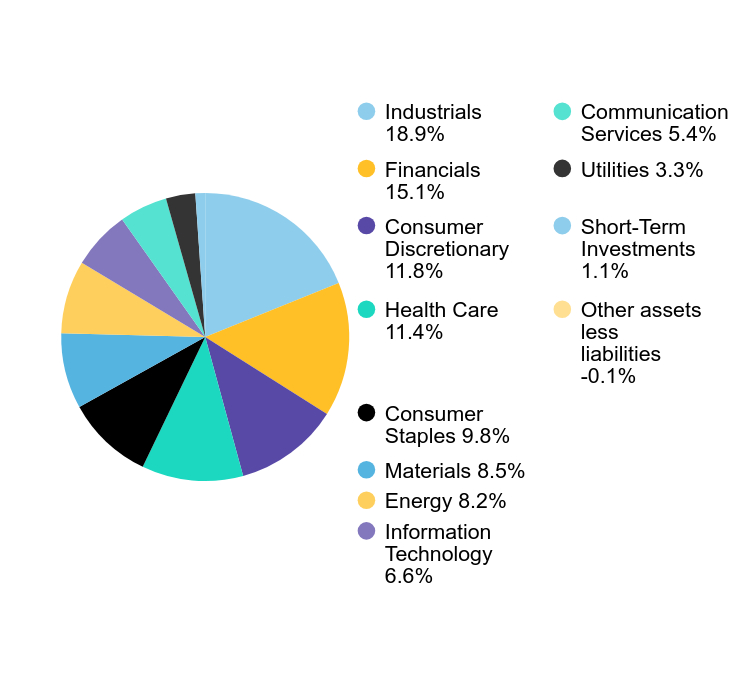
Graphical Representation of Holdings
| Company | U.S. $ Value | % of Net Assets |
|---|
| Roche Holding AG | $8,919,731 | 3.5% |
| Shell PLC | $8,543,790 | 3.4% |
| NatWest Group PLC | $7,371,505 | 2.9% |
| Sony Group Corp. | $7,056,090 | 2.8% |
| Airbus SE | $6,370,805 | 2.5% |
| Deutsche Telekom AG | $6,291,167 | 2.5% |
| Resona Holdings, Inc. | $6,270,193 | 2.5% |
| Koninklijke Ahold Delhaize NV | $6,198,114 | 2.4% |
| Erste Group Bank AG | $6,048,360 | 2.4% |
| Haleon PLC | $5,788,100 | 2.3% |
| Total | $68,857,855 | 27.2% |
| Value | Value |
|---|
| Industrials | 18.9% |
| Financials | 15.1% |
| Consumer Discretionary | 11.8% |
| Health Care | 11.4% |
| Consumer Staples | 9.8% |
| Materials | 8.5% |
| Energy | 8.2% |
| Information Technology | 6.6% |
| Communication Services | 5.4% |
| Utilities | 3.3% |
| Short-Term Investments | 1.1% |
| Other assets less liabilities | -0.1% |
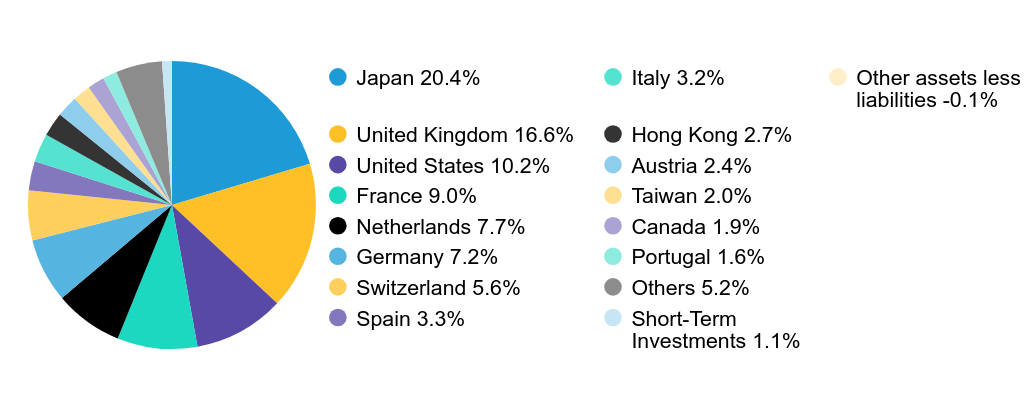
| Value | Value |
|---|
| Japan | 20.4% |
| United Kingdom | 16.6% |
| United States | 10.2% |
| France | 9.0% |
| Netherlands | 7.7% |
| Germany | 7.2% |
| Switzerland | 5.6% |
| Spain | 3.3% |
| Italy | 3.2% |
| Hong Kong | 2.7% |
| Austria | 2.4% |
| Taiwan | 2.0% |
| Canada | 1.9% |
| Portugal | 1.6% |
| Others | 5.2% |
| Short-Term Investments | 1.1% |
| Other assets less liabilities | -0.1% |
Availability of Additional Information
You can find additional information on the Portfolio’s website at https://www.abfunds.com/link/AB/64VF-B-A, including the Portfolio's:
• Prospectus
• Financial information
• Portfolio holdings
• Proxy voting information
You can also request this information by contacting us at (800) 227 4618.
Shareholders who have consented to receive a single annual or semi-annual shareholder report at a shared address may revoke this consent by contacting us at (800) 227 4618.
Information Regarding the Review and Approval of the Portfolio’s Advisory Agreement
Information regarding the Portfolio’s Board of Directors’/Trustees’ review of the advisory agreement is available on the Portfolio’s website https://www.abfunds.com/link/AB/64VF-B-A. You can request this information, free of charge, by contacting us at (800) 227 4618 or by scanning the QR code below.
The [A/B] logo and AllianceBernstein® are registered trademarks used by permission of the owner, AllianceBernstein L.P.
Please scan QR code for
Portfolio Information
Please scan QR code for
Portfolio Information
AB VPS Large Cap Growth Portfolio
Annual Shareholder Report
This annual shareholder report contains important information about the AB VPS Large Cap Growth Portfolio (the “Portfolio”) for the period of January 1, 2024 to December 31, 2024. You can find additional information about the Portfolio at https://www.abfunds.com/link/AB/64VL-A-A. You can also request this information by contacting us at (800) 227 4618.
What were the Portfolio costs for the last year?
(Based on a hypothetical $10,000 investment)
| Class Name | Cost of a $10,000 investment | Costs paid as a percentage of a $10,000 investment |
|---|
| Class A | $73 | 0.65% |
|---|
How did the Portfolio perform last year? What affected the Portfolio’s performance?
During the 12-month period ended December 31, 2024, all share classes of the Portfolio underperformed the Russell 1000 Growth Index (the “benchmark”). Overall sector allocation drove the underperformance led by an overweight to health care and an underweight to technology. Underweights to real estate and consumer discretionary contributed, offsetting some losses. Security selection also detracted. Contributions from selection within technology and communication services were offset by selection within consumer discretionary and health care, which detracted.
Top contributors to performance:
Top detractors from performance:
During the 12-month period, an overweight to the health care sector and an underweight to the technology sector, and security selection within the consumer-discretionary and health care sectors were the leading detractors from performance.
The following graph shows the performance of hypothetical $10,000 investments in the Portfolio, a broad-based securities market index and an additional index that corresponds to the Portfolio's investment strategies, over the most recently completed 10 fiscal years of the Portfolio, or since inception, if shorter. The Portfolio's performance reflects applicable sales charges and assumes the reinvestment of dividends.
| Class A | S&P 500 Index | Russell 1000 Growth Index |
|---|
| 12/14 | $10,000 | $10,000 | $10,000 |
|---|
| 12/15 | $11,111 | $10,138 | $10,567 |
|---|
| 12/16 | $11,403 | $11,351 | $11,314 |
|---|
| 12/17 | $15,051 | $13,829 | $14,733 |
|---|
| 12/18 | $15,439 | $13,223 | $14,510 |
|---|
| 12/19 | $20,796 | $17,386 | $19,790 |
|---|
| 12/20 | $28,175 | $20,585 | $27,408 |
|---|
| 12/21 | $36,338 | $26,494 | $34,971 |
|---|
| 12/22 | $25,978 | $21,696 | $24,782 |
|---|
| 12/23 | $35,104 | $27,399 | $35,358 |
|---|
| 12/24 | $43,969 | $34,254 | $47,152 |
|---|
Average Annual Total Returns
| AATR | 1 Year | 5 Years | 10 Years |
|---|
| Class A | 25.26% | 16.16% | 15.96% |
|---|
| S&P 500 Index | 25.02% | 14.53% | 13.10% |
|---|
| Russell 1000 Growth Index | 33.36% | 18.96% | 16.78% |
|---|
The addition of the S&P 500 Index broad-based benchmark provides a comparison of the Fund's performance against the broader market as regulatorily required.
The Portfolio’s past performance is not a good predictor of the Portfolio’s future performance.
The graph and table do not reflect the deduction of taxes that a shareholder would pay on Portfolio distributions or the redemption or sale of Portfolio shares.
Visit https://www.abfunds.com/link/AB/64VL-A-A for the most recent performance information.
| Net Assets | $951,493,333 |
|---|
| # of Portfolio Holdings | 55 |
|---|
| Portfolio Turnover Rate | 27% |
|---|
| Total Advisory Fees Paid | $5,235,485 |
|---|
Graphical Representation of Holdings
| Company | U.S. $ Value | % of Net Assets |
|---|
| NVIDIA Corp. | $90,508,640 | 9.5% |
| Microsoft Corp. | $78,498,053 | 8.2% |
| Amazon.com, Inc. | $63,558,380 | 6.7% |
| Alphabet, Inc. - Class C | $53,131,618 | 5.6% |
| Meta Platforms, Inc. - Class A | $51,157,765 | 5.4% |
| Visa, Inc. - Class A | $43,874,569 | 4.6% |
| Netflix, Inc. | $39,148,557 | 4.1% |
| Broadcom, Inc. | $33,402,812 | 3.5% |
| Costco Wholesale Corp. | $30,983,670 | 3.3% |
| Home Depot, Inc. (The) | $25,406,493 | 2.7% |
| Total | $509,670,557 | 53.6% |
| Value | Value |
|---|
| Information Technology | 35.7% |
| Communication Services | 15.5% |
| Consumer Discretionary | 15.0% |
| Health Care | 11.5% |
| Industrials | 7.5% |
| Financials | 5.8% |
| Consumer Staples | 5.6% |
| Materials | 1.3% |
| Short-Term Investments | 2.7% |
| Other assets less liabilities | -0.6% |
Availability of Additional Information
You can find additional information on the Portfolio’s website at https://www.abfunds.com/link/AB/64VL-A-A, including the Portfolio's:
• Prospectus
• Financial information
• Portfolio holdings
• Proxy voting information
You can also request this information by contacting us at (800) 227 4618.
Shareholders who have consented to receive a single annual or semi-annual shareholder report at a shared address may revoke this consent by contacting us at (800) 227 4618.
Information Regarding the Review and Approval of the Portfolio’s Advisory Agreement
Information regarding the Portfolio’s Board of Directors’/Trustees’ review of the advisory agreement is available on the Portfolio’s website https://www.abfunds.com/link/AB/64VL-A-A. You can request this information, free of charge, by contacting us at (800) 227 4618 or by scanning the QR code below.
The [A/B] logo and AllianceBernstein® are registered trademarks used by permission of the owner, AllianceBernstein L.P.
Please scan QR code for
Portfolio Information
Please scan QR code for
Portfolio Information
AB VPS Large Cap Growth Portfolio
Annual Shareholder Report
This annual shareholder report contains important information about the AB VPS Large Cap Growth Portfolio (the “Portfolio”) for the period of January 1, 2024 to December 31, 2024. You can find additional information about the Portfolio at https://www.abfunds.com/link/AB/64VL-B-A. You can also request this information by contacting us at (800) 227 4618.
What were the Portfolio costs for the last year?
(Based on a hypothetical $10,000 investment)
| Class Name | Cost of a $10,000 investment | Costs paid as a percentage of a $10,000 investment |
|---|
| Class B | $101 | 0.90% |
|---|
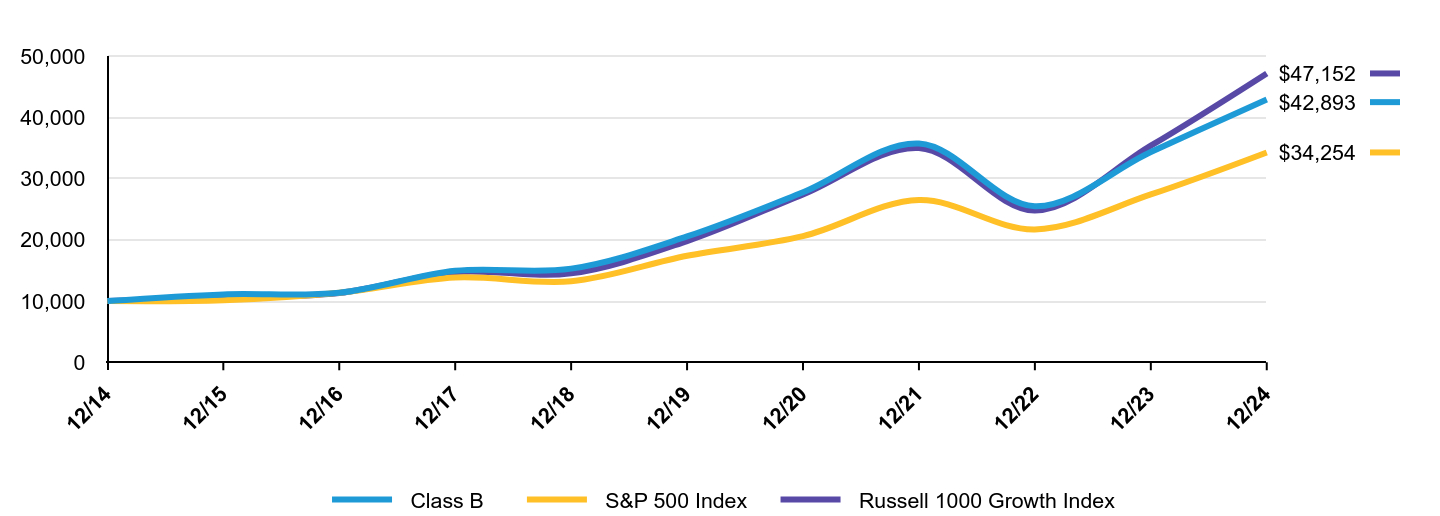
How did the Portfolio perform last year? What affected the Portfolio’s performance?
During the 12-month period ended December 31, 2024, all share classes of the Portfolio underperformed the Russell 1000 Growth Index (the “benchmark”). Overall sector allocation drove the underperformance led by an overweight to health care and an underweight to technology. Underweights to real estate and consumer discretionary contributed, offsetting some losses. Security selection also detracted. Contributions from selection within technology and communication services were offset by selection within consumer discretionary and health care, which detracted.
Top contributors to performance:
Top detractors from performance:
During the 12-month period, an overweight to the health care sector and an underweight to the technology sector, and security selection within the consumer-discretionary and health care sectors were the leading detractors from performance.
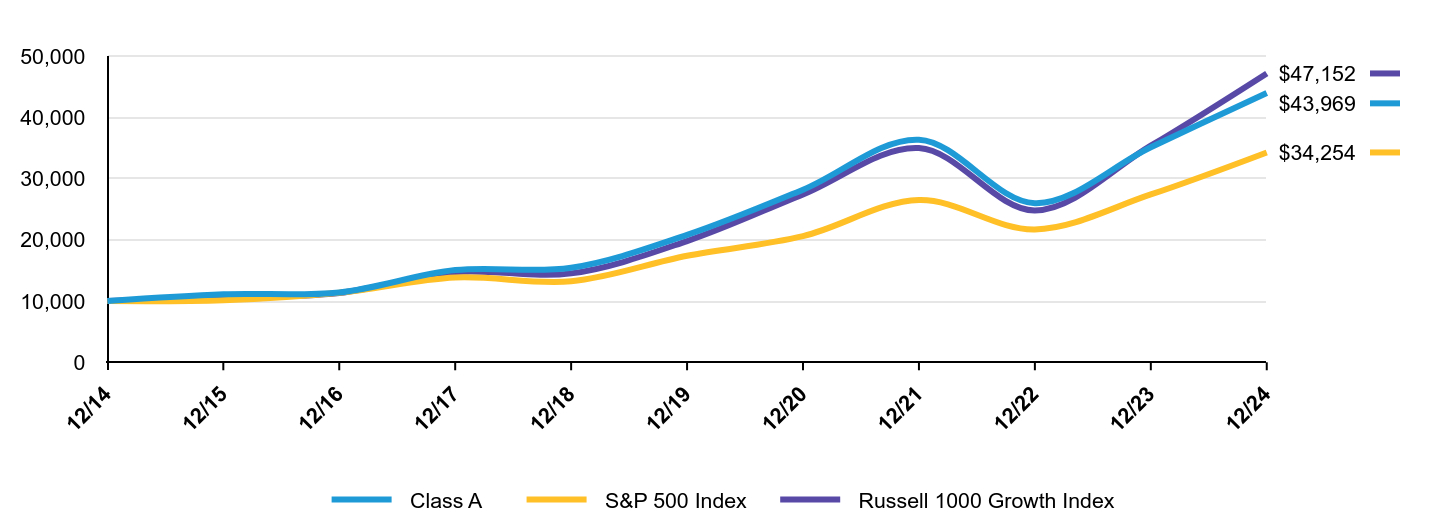
The following graph shows the performance of hypothetical $10,000 investments in the Portfolio, a broad-based securities market index and an additional index that corresponds to the Portfolio's investment strategies, over the most recently completed 10 fiscal years of the Portfolio, or since inception, if shorter. The Portfolio's performance reflects applicable sales charges and assumes the reinvestment of dividends.
| Class B | S&P 500 Index | Russell 1000 Growth Index |
|---|
| 12/14 | $10,000 | $10,000 | $10,000 |
|---|
| 12/15 | $11,085 | $10,138 | $10,567 |
|---|
| 12/16 | $11,346 | $11,351 | $11,314 |
|---|
| 12/17 | $14,940 | $13,829 | $14,733 |
|---|
| 12/18 | $15,287 | $13,223 | $14,510 |
|---|
| 12/19 | $20,540 | $17,386 | $19,790 |
|---|
| 12/20 | $27,760 | $20,585 | $27,408 |
|---|
| 12/21 | $35,713 | $26,494 | $34,971 |
|---|
| 12/22 | $25,468 | $21,696 | $24,782 |
|---|
| 12/23 | $34,327 | $27,399 | $35,358 |
|---|
| 12/24 | $42,893 | $34,254 | $47,152 |
|---|
Average Annual Total Returns
| AATR | 1 Year | 5 Years | 10 Years |
|---|
| Class B | 24.95% | 15.87% | 15.67% |
|---|
| S&P 500 Index | 25.02% | 14.53% | 13.10% |
|---|
| Russell 1000 Growth Index | 33.36% | 18.96% | 16.78% |
|---|
The addition of the S&P 500 Index broad-based benchmark provides a comparison of the Fund's performance against the broader market as regulatorily required.
The Portfolio’s past performance is not a good predictor of the Portfolio’s future performance.
The graph and table do not reflect the deduction of taxes that a shareholder would pay on Portfolio distributions or the redemption or sale of Portfolio shares.
Visit https://www.abfunds.com/link/AB/64VL-B-A for the most recent performance information.
| Net Assets | $951,493,333 |
|---|
| # of Portfolio Holdings | 55 |
|---|
| Portfolio Turnover Rate | 27% |
|---|
| Total Advisory Fees Paid | $5,235,485 |
|---|
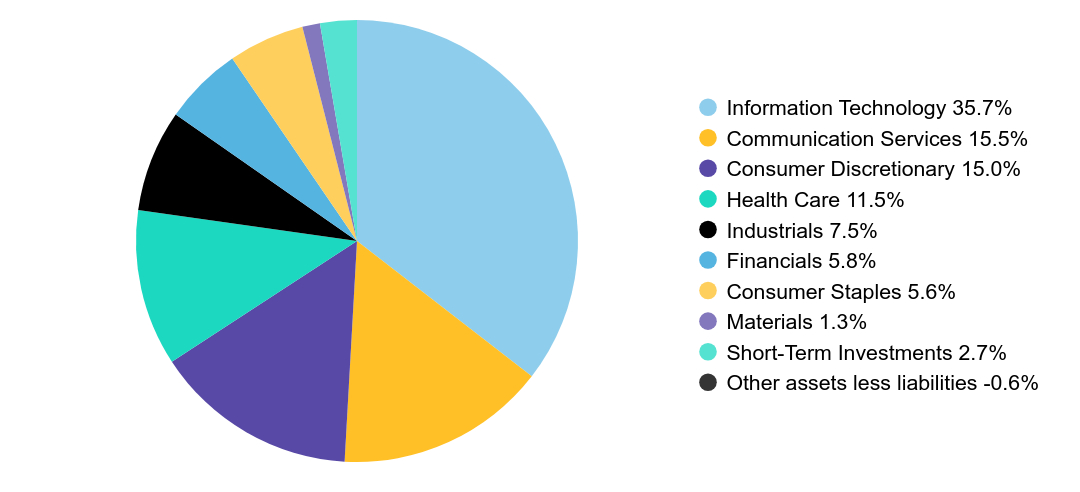
Graphical Representation of Holdings
| Company | U.S. $ Value | % of Net Assets |
|---|
| NVIDIA Corp. | $90,508,640 | 9.5% |
| Microsoft Corp. | $78,498,053 | 8.2% |
| Amazon.com, Inc. | $63,558,380 | 6.7% |
| Alphabet, Inc. - Class C | $53,131,618 | 5.6% |
| Meta Platforms, Inc. - Class A | $51,157,765 | 5.4% |
| Visa, Inc. - Class A | $43,874,569 | 4.6% |
| Netflix, Inc. | $39,148,557 | 4.1% |
| Broadcom, Inc. | $33,402,812 | 3.5% |
| Costco Wholesale Corp. | $30,983,670 | 3.3% |
| Home Depot, Inc. (The) | $25,406,493 | 2.7% |
| Total | $509,670,557 | 53.6% |
| Value | Value |
|---|
| Information Technology | 35.7% |
| Communication Services | 15.5% |
| Consumer Discretionary | 15.0% |
| Health Care | 11.5% |
| Industrials | 7.5% |
| Financials | 5.8% |
| Consumer Staples | 5.6% |
| Materials | 1.3% |
| Short-Term Investments | 2.7% |
| Other assets less liabilities | -0.6% |
Availability of Additional Information
You can find additional information on the Portfolio’s website at https://www.abfunds.com/link/AB/64VL-B-A, including the Portfolio's:
• Prospectus
• Financial information
• Portfolio holdings
• Proxy voting information
You can also request this information by contacting us at (800) 227 4618.
Shareholders who have consented to receive a single annual or semi-annual shareholder report at a shared address may revoke this consent by contacting us at (800) 227 4618.
Information Regarding the Review and Approval of the Portfolio’s Advisory Agreement
Information regarding the Portfolio’s Board of Directors’/Trustees’ review of the advisory agreement is available on the Portfolio’s website https://www.abfunds.com/link/AB/64VL-B-A. You can request this information, free of charge, by contacting us at (800) 227 4618 or by scanning the QR code below.
The [A/B] logo and AllianceBernstein® are registered trademarks used by permission of the owner, AllianceBernstein L.P.
Please scan QR code for
Portfolio Information
Please scan QR code for
Portfolio Information
AB VPS Small Cap Growth Portfolio
Annual Shareholder Report
This annual shareholder report contains important information about the AB VPS Small Cap Growth Portfolio (the “Portfolio”) for the period of January 1, 2024 to December 31, 2024. You can find additional information about the Portfolio at https://www.abfunds.com/link/AB/64VS-A-A. You can also request this information by contacting us at (800) 227 4618.
What were the Portfolio costs for the last year?
(Based on a hypothetical $10,000 investment)
| Class Name | Cost of a $10,000 investment | Costs paid as a percentage of a $10,000 investment |
|---|
| Class A | $98 | 0.90% |
|---|
How did the Portfolio perform last year? What affected the Portfolio’s performance?
During the 12-month period ended December 31, 2024, all share classes of the Portfolio outperformed the Russell 2000 Growth Index (the “benchmark”). Overall security selection and sector allocation were positive. Security selection within industrials and consumer discretionary contributed the most, while selection within technology and real estate detracted. Gains from an underweight to materials and an overweight to technology offset losses from overweights to consumer discretionary and financials.
Top contributors to performance:
Top detractors from performance:
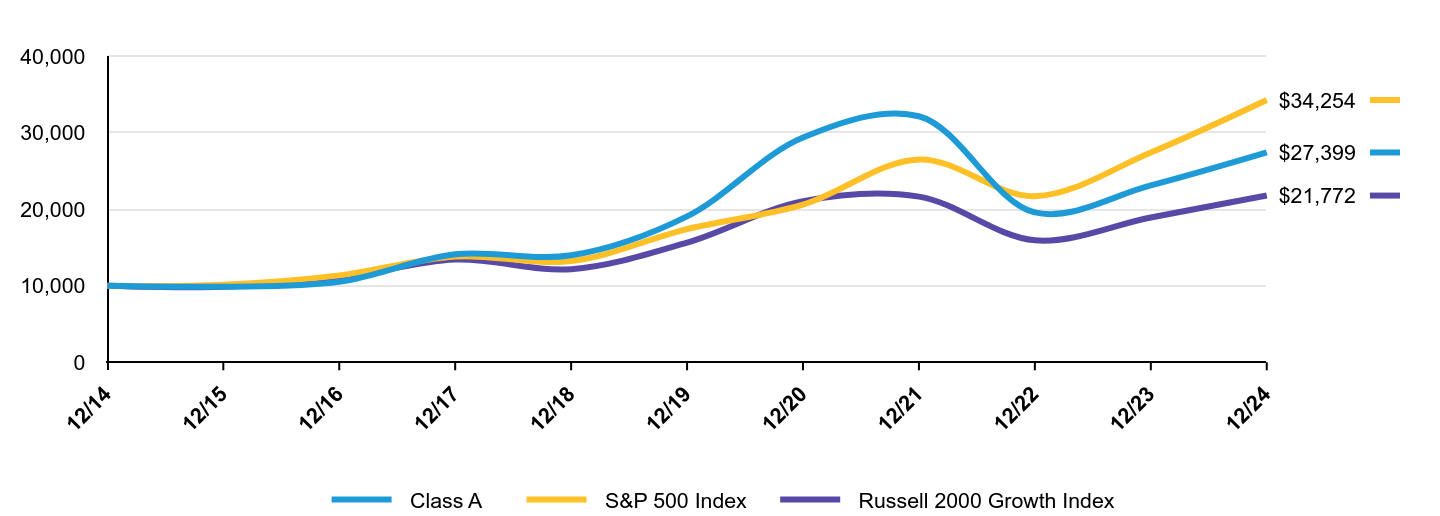
The following graph shows the performance of hypothetical $10,000 investments in the Portfolio, a broad-based securities market index and an additional index that corresponds to the Portfolio's investment strategies, over the most recently completed 10 fiscal years of the Portfolio, or since inception, if shorter. The Portfolio's performance reflects applicable sales charges and assumes the reinvestment of dividends.
| Class A | S&P 500 Index | Russell 2000 Growth Index |
|---|
| 12/14 | $10,000 | $10,000 | $10,000 |
|---|
| 12/15 | $9,875 | $10,138 | $9,862 |
|---|
| 12/16 | $10,513 | $11,351 | $10,978 |
|---|
| 12/17 | $14,101 | $13,829 | $13,411 |
|---|
| 12/18 | $13,975 | $13,223 | $12,163 |
|---|
| 12/19 | $19,062 | $17,386 | $15,628 |
|---|
| 12/20 | $29,352 | $20,585 | $21,040 |
|---|
| 12/21 | $32,128 | $26,494 | $21,636 |
|---|
| 12/22 | $19,568 | $21,696 | $15,933 |
|---|
| 12/23 | $23,094 | $27,399 | $18,906 |
|---|
| 12/24 | $27,399 | $34,254 | $21,772 |
|---|
Average Annual Total Returns
| AATR | 1 Year | 5 Years | 10 Years |
|---|
| Class A | 18.64% | 7.53% | 10.60% |
|---|
| S&P 500 Index | 25.02% | 14.53% | 13.10% |
|---|
| Russell 2000 Growth Index | 15.15% | 6.86% | 8.09% |
|---|
The addition of the S&P 500 Index broad-based benchmark provides a comparison of the Portfolio's performance against the broader market as regulatorily required.
The Portfolio’s past performance is not a good predictor of the Portfolio’s future performance.
The graph and table do not reflect the deduction of taxes that a shareholder would pay on Portfolio distributions or the redemption or sale of Portfolio shares.
Visit https://www.abfunds.com/link/AB/64VS-A-A for the most recent performance information.
| Net Assets | $64,894,798 |
|---|
| # of Portfolio Holdings | 103 |
|---|
| Portfolio Turnover Rate | 92% |
|---|
| Total Advisory Fees Paid | $228,180 |
|---|
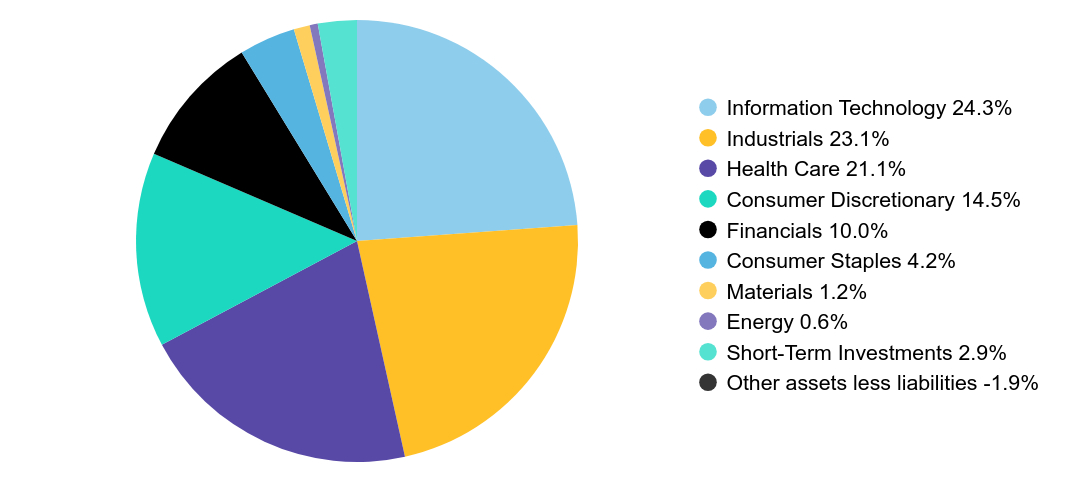
Graphical Representation of Holdings
| Company | U.S. $ Value | % of Net Assets |
|---|
| Boot Barn Holdings, Inc. | $1,207,880 | 1.9% |
| ACV Auctions, Inc. - Class A | $1,196,186 | 1.8% |
| Semtech Corp. | $1,134,267 | 1.7% |
| Clearwater Analytics Holdings, Inc. - Class A | $1,129,861 | 1.7% |
| CSW Industrials, Inc. | $1,074,629 | 1.7% |
| Construction Partners, Inc. - Class A | $1,063,908 | 1.6% |
| SPS Commerce, Inc. | $1,053,711 | 1.6% |
| Intapp, Inc. | $1,038,771 | 1.6% |
| Piper Sandler Cos. | $1,034,527 | 1.6% |
| Modine Manufacturing Co. | $1,025,517 | 1.6% |
| Total | $10,959,257 | 16.8% |
| Value | Value |
|---|
| Information Technology | 24.3% |
| Industrials | 23.1% |
| Health Care | 21.1% |
| Consumer Discretionary | 14.5% |
| Financials | 10.0% |
| Consumer Staples | 4.2% |
| Materials | 1.2% |
| Energy | 0.6% |
| Short-Term Investments | 2.9% |
| Other assets less liabilities | -1.9% |
Availability of Additional Information
You can find additional information on the Portfolio’s website at https://www.abfunds.com/link/AB/64VS-A-A, including the Portfolio's:
• Prospectus
• Financial information
• Portfolio holdings
• Proxy voting information
You can also request this information by contacting us at (800) 227 4618.
Shareholders who have consented to receive a single annual or semi-annual shareholder report at a shared address may revoke this consent by contacting us at (800) 227 4618.
Information Regarding the Review and Approval of the Portfolio’s Advisory Agreement
Information regarding the Portfolio’s Board of Directors’/Trustees’ review of the advisory agreement is available on the Portfolio’s website https://www.abfunds.com/link/AB/64VS-A-A. You can request this information, free of charge, by contacting us at (800) 227 4618 or by scanning the QR code below.
The [A/B] logo and AllianceBernstein® are registered trademarks used by permission of the owner, AllianceBernstein L.P.
Please scan QR code for
Portfolio Information
Please scan QR code for
Portfolio Information
AB VPS Small Cap Growth Portfolio
Annual Shareholder Report
This annual shareholder report contains important information about the AB VPS Small Cap Growth Portfolio (the “Portfolio”) for the period of January 1, 2024 to December 31, 2024. You can find additional information about the Portfolio at https://www.abfunds.com/link/AB/64VS-B-A. You can also request this information by contacting us at (800) 227 4618.
What were the Portfolio costs for the last year?
(Based on a hypothetical $10,000 investment)
| Class Name | Cost of a $10,000 investment | Costs paid as a percentage of a $10,000 investment |
|---|
| Class B | $126 | 1.15% |
|---|
How did the Portfolio perform last year? What affected the Portfolio’s performance?
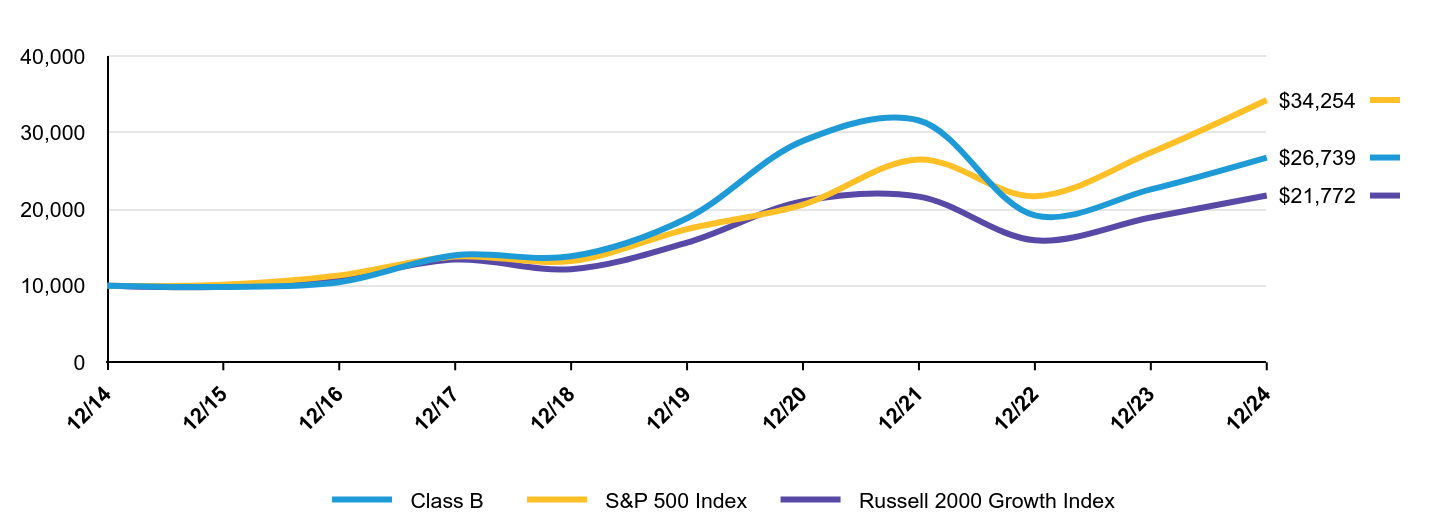
During the 12-month period ended December 31, 2024, all share classes of the Portfolio outperformed the Russell 2000 Growth Index (the “benchmark”). Overall security selection and sector allocation were positive. Security selection within industrials and consumer discretionary contributed the most, while selection within technology and real estate detracted. Gains from an underweight to materials and an overweight to technology offset losses from overweights to consumer discretionary and financials.
Top contributors to performance:
Top detractors from performance:
The following graph shows the performance of hypothetical $10,000 investments in the Portfolio, a broad-based securities market index and an additional index that corresponds to the Portfolio's investment strategies, over the most recently completed 10 fiscal years of the Portfolio, or since inception, if shorter. The Portfolio's performance reflects applicable sales charges and assumes the reinvestment of dividends.
| Class B | S&P 500 Index | Russell 2000 Growth Index |
|---|
| 12/14 | $10,000 | $10,000 | $10,000 |
|---|
| 12/15 | $9,847 | $10,138 | $9,862 |
|---|
| 12/16 | $10,459 | $11,351 | $10,978 |
|---|
| 12/17 | $13,991 | $13,829 | $13,411 |
|---|
| 12/18 | $13,837 | $13,223 | $12,163 |
|---|
| 12/19 | $18,819 | $17,386 | $15,628 |
|---|
| 12/20 | $28,913 | $20,585 | $21,040 |
|---|
| 12/21 | $31,573 | $26,494 | $21,636 |
|---|
| 12/22 | $19,176 | $21,696 | $15,933 |
|---|
| 12/23 | $22,576 | $27,399 | $18,906 |
|---|
| 12/24 | $26,739 | $34,254 | $21,772 |
|---|
Average Annual Total Returns
| AATR | 1 Year | 5 Years | 10 Years |
|---|
| Class B | 18.44% | 7.28% | 10.34% |
|---|
| S&P 500 Index | 25.02% | 14.53% | 13.10% |
|---|
| Russell 2000 Growth Index | 15.15% | 6.86% | 8.09% |
|---|
The addition of the S&P 500 Index broad-based benchmark provides a comparison of the Portfolio's performance against the broader market as regulatorily required.
The Portfolio’s past performance is not a good predictor of the Portfolio’s future performance.
The graph and table do not reflect the deduction of taxes that a shareholder would pay on Portfolio distributions or the redemption or sale of Portfolio shares.
Visit https://www.abfunds.com/link/AB/64VS-B-A for the most recent performance information.
| Net Assets | $64,894,798 |
|---|
| # of Portfolio Holdings | 103 |
|---|
| Portfolio Turnover Rate | 92% |
|---|
| Total Advisory Fees Paid | $228,180 |
|---|
Graphical Representation of Holdings
| Company | U.S. $ Value | % of Net Assets |
|---|
| Boot Barn Holdings, Inc. | $1,207,880 | 1.9% |
| ACV Auctions, Inc. - Class A | $1,196,186 | 1.8% |
| Semtech Corp. | $1,134,267 | 1.7% |
| Clearwater Analytics Holdings, Inc. - Class A | $1,129,861 | 1.7% |
| CSW Industrials, Inc. | $1,074,629 | 1.7% |
| Construction Partners, Inc. - Class A | $1,063,908 | 1.6% |
| SPS Commerce, Inc. | $1,053,711 | 1.6% |
| Intapp, Inc. | $1,038,771 | 1.6% |
| Piper Sandler Cos. | $1,034,527 | 1.6% |
| Modine Manufacturing Co. | $1,025,517 | 1.6% |
| Total | $10,959,257 | 16.8% |
| Value | Value |
|---|
| Information Technology | 24.3% |
| Industrials | 23.1% |
| Health Care | 21.1% |
| Consumer Discretionary | 14.5% |
| Financials | 10.0% |
| Consumer Staples | 4.2% |
| Materials | 1.2% |
| Energy | 0.6% |
| Short-Term Investments | 2.9% |
| Other assets less liabilities | -1.9% |
Availability of Additional Information
You can find additional information on the Portfolio’s website at https://www.abfunds.com/link/AB/64VS-B-A, including the Portfolio's:
• Prospectus
• Financial information
• Portfolio holdings
• Proxy voting information
You can also request this information by contacting us at (800) 227 4618.
Shareholders who have consented to receive a single annual or semi-annual shareholder report at a shared address may revoke this consent by contacting us at (800) 227 4618.
Information Regarding the Review and Approval of the Portfolio’s Advisory Agreement
Information regarding the Portfolio’s Board of Directors’/Trustees’ review of the advisory agreement is available on the Portfolio’s website https://www.abfunds.com/link/AB/64VS-B-A. You can request this information, free of charge, by contacting us at (800) 227 4618 or by scanning the QR code below.
The [A/B] logo and AllianceBernstein® are registered trademarks used by permission of the owner, AllianceBernstein L.P.
Please scan QR code for
Portfolio Information
Please scan QR code for
Portfolio Information
AB VPS Discovery Value Portfolio
Annual Shareholder Report
This annual shareholder report contains important information about the AB VPS Discovery Value Portfolio (the “Portfolio”) for the period of January 1, 2024 to December 31, 2024. You can find additional information about the Portfolio at https://www.abfunds.com/link/AB/64VQ-A-A. You can also request this information by contacting us at (800) 227 4618.
What were the Portfolio costs for the last year?
(Based on a hypothetical $10,000 investment)
| Class Name | Cost of a $10,000 investment | Costs paid as a percentage of a $10,000 investment |
|---|
| Class A | $85 | 0.81% |
|---|
How did the Portfolio perform last year? What affected the Portfolio’s performance?
During the 12-month period ended December 31, 2024, all share classes of the Portfolio underperformed the Russell 2500 Value Index (the "benchmark"). Overall security selection detracted from performance, while sector allocation contributed. Gains from security selection within financials and communication services were offset by losses from selection within health care and consumer staples. Sector allocation was positive. An underweight to materials and overweight to technology added to gains, offsetting losses from an overweight to consumer discretionary and an underweight to utilities.
Top contributors to performance:
Top detractors from performance:
The following graph shows the performance of hypothetical $10,000 investments in the Portfolio, a broad-based securities market index and an additional index that corresponds to the Portfolio's investment strategies, over the most recently completed 10 fiscal years of the Portfolio, or since inception, if shorter. The Portfolio's performance reflects applicable sales charges and assumes the reinvestment of dividends.
| Class A | S&P 500 Index | Russell 2500 Value Index |
|---|
| 12/14 | $10,000 | $10,000 | $10,000 |
|---|
| 12/15 | $9,451 | $10,138 | $9,451 |
|---|
| 12/16 | $11,823 | $11,351 | $11,833 |
|---|
| 12/17 | $13,377 | $13,829 | $13,059 |
|---|
| 12/18 | $11,367 | $13,223 | $11,445 |
|---|
| 12/19 | $13,651 | $17,386 | $14,142 |
|---|
| 12/20 | $14,111 | $20,585 | $14,832 |
|---|
| 12/21 | $19,183 | $26,494 | $18,953 |
|---|
| 12/22 | $16,185 | $21,696 | $16,473 |
|---|
| 12/23 | $18,966 | $27,399 | $19,105 |
|---|
| 12/24 | $20,866 | $34,254 | $21,204 |
|---|
Average Annual Total Returns
| AATR | 1 Year | 5 Years | 10 Years |
|---|
| Class A | 10.02% | 8.86% | 7.63% |
|---|
| S&P 500 Index | 25.02% | 14.53% | 13.10% |
|---|
| Russell 2500 Value Index | 10.98% | 8.44% | 7.81% |
|---|
The addition of the S&P 500 Index broad-based benchmark provides a comparison of the Portfolio's performance against the broader market as regulatorily required.
The Portfolio’s past performance is not a good predictor of the Portfolio’s future performance.
The graph and table do not reflect the deduction of taxes that a shareholder would pay on Portfolio distributions or the redemption or sale of Portfolio shares.
Visit https://www.abfunds.com/link/AB/64VQ-A-A for the most recent performance information.
| Net Assets | $697,028,669 |
|---|
| # of Portfolio Holdings | 92 |
|---|
| Portfolio Turnover Rate | 53% |
|---|
| Total Advisory Fees Paid | $5,311,202 |
|---|
Graphical Representation of Holdings
| Company | U.S. $ Value | % of Net Assets |
|---|
| Tapestry, Inc. | $13,519,456 | 1.9% |
| F5, Inc. | $12,613,735 | 1.8% |
| Bath & Body Works, Inc. | $12,002,106 | 1.7% |
| CH Robinson Worldwide, Inc. | $11,861,343 | 1.7% |
| Pentair PLC | $10,765,461 | 1.5% |
| Jones Lang LaSalle, Inc. | $10,595,934 | 1.5% |
| BJ's Wholesale Club Holdings, Inc. | $10,588,868 | 1.5% |
| Cameco Corp. (New York) | $10,305,751 | 1.5% |
| Encompass Health Corp. | $10,303,490 | 1.5% |
| NCR Atleos Corp. | $10,273,283 | 1.5% |
| Total | $112,829,427 | 16.1% |
| Value | Value |
|---|
| Industrials | 20.9% |
| Financials | 20.4% |
| Consumer Discretionary | 15.4% |
| Information Technology | 12.0% |
| Real Estate | 8.1% |
| Health Care | 6.6% |
| Energy | 5.4% |
| Materials | 3.1% |
| Utilities | 2.8% |
| Consumer Staples | 2.7% |
| Communication Services | 2.0% |
| Short-Term Investments | 8.4% |
| Other assets less liabilities | -7.8% |
Availability of Additional Information
You can find additional information on the Portfolio’s website at https://www.abfunds.com/link/AB/64VQ-A-A, including the Portfolio's:
• Prospectus
• Financial information
• Portfolio holdings
• Proxy voting information
You can also request this information by contacting us at (800) 227 4618.
Shareholders who have consented to receive a single annual or semi-annual shareholder report at a shared address may revoke this consent by contacting us at (800) 227 4618.
Information Regarding the Review and Approval of the Portfolio’s Advisory Agreement
Information regarding the Portfolio’s Board of Directors’/Trustees’ review of the advisory agreement is available on the Portfolio’s website https://www.abfunds.com/link/AB/64VQ-A-A. You can request this information, free of charge, by contacting us at (800) 227 4618 or by scanning the QR code below.
The [A/B] logo and AllianceBernstein® are registered trademarks used by permission of the owner, AllianceBernstein L.P.
Please scan QR code for
Portfolio Information
Please scan QR code for
Portfolio Information
AB VPS Discovery Value Portfolio
Annual Shareholder Report
This annual shareholder report contains important information about the AB VPS Discovery Value Portfolio (the “Portfolio”) for the period of January 1, 2024 to December 31, 2024. You can find additional information about the Portfolio at https://www.abfunds.com/link/AB/64VQ-B-A. You can also request this information by contacting us at (800) 227 4618.
What were the Portfolio costs for the last year?
(Based on a hypothetical $10,000 investment)
| Class Name | Cost of a $10,000 investment | Costs paid as a percentage of a $10,000 investment |
|---|
| Class B | $111 | 1.06% |
|---|
How did the Portfolio perform last year? What affected the Portfolio’s performance?
During the 12-month period ended December 31, 2024, all share classes of the Portfolio underperformed the Russell 2500 Value Index (the "benchmark"). Overall security selection detracted from performance, while sector allocation contributed. Gains from security selection within financials and communication services were offset by losses from selection within health care and consumer staples. Sector allocation was positive. An underweight to materials and overweight to technology added to gains, offsetting losses from an overweight to consumer discretionary and an underweight to utilities.
Top contributors to performance:
Top detractors from performance:
The following graph shows the performance of hypothetical $10,000 investments in the Portfolio, a broad-based securities market index and an additional index that corresponds to the Portfolio's investment strategies, over the most recently completed 10 fiscal years of the Portfolio, or since inception, if shorter. The Portfolio's performance reflects applicable sales charges and assumes the reinvestment of dividends.
| Class B | S&P 500 Index | Russell 2500 Value Index |
|---|
| 12/14 | $10,000 | $10,000 | $10,000 |
|---|
| 12/15 | $9,431 | $10,138 | $9,451 |
|---|
| 12/16 | $11,769 | $11,351 | $11,833 |
|---|
| 12/17 | $13,281 | $13,829 | $13,059 |
|---|
| 12/18 | $11,250 | $13,223 | $11,445 |
|---|
| 12/19 | $13,489 | $17,386 | $14,142 |
|---|
| 12/20 | $13,900 | $20,585 | $14,832 |
|---|
| 12/21 | $18,850 | $26,494 | $18,953 |
|---|
| 12/22 | $15,868 | $21,696 | $16,473 |
|---|
| 12/23 | $18,544 | $27,399 | $19,105 |
|---|
| 12/24 | $20,346 | $34,254 | $21,204 |
|---|
Average Annual Total Returns
| AATR | 1 Year | 5 Years | 10 Years |
|---|
| Class B | 9.72% | 8.57% | 7.36% |
|---|
| S&P 500 Index | 25.02% | 14.53% | 13.10% |
|---|
| Russell 2500 Value Index | 10.98% | 8.44% | 7.81% |
|---|
The addition of the S&P 500 Index broad-based benchmark provides a comparison of the Portfolio's performance against the broader market as regulatorily required.
The Portfolio’s past performance is not a good predictor of the Portfolio’s future performance.
The graph and table do not reflect the deduction of taxes that a shareholder would pay on Portfolio distributions or the redemption or sale of Portfolio shares.
Visit https://www.abfunds.com/link/AB/64VQ-B-A for the most recent performance information.
| Net Assets | $697,028,669 |
|---|
| # of Portfolio Holdings | 92 |
|---|
| Portfolio Turnover Rate | 53% |
|---|
| Total Advisory Fees Paid | $5,311,202 |
|---|
Graphical Representation of Holdings
| Company | U.S. $ Value | % of Net Assets |
|---|
| Tapestry, Inc. | $13,519,456 | 1.9% |
| F5, Inc. | $12,613,735 | 1.8% |
| Bath & Body Works, Inc. | $12,002,106 | 1.7% |
| CH Robinson Worldwide, Inc. | $11,861,343 | 1.7% |
| Pentair PLC | $10,765,461 | 1.5% |
| Jones Lang LaSalle, Inc. | $10,595,934 | 1.5% |
| BJ's Wholesale Club Holdings, Inc. | $10,588,868 | 1.5% |
| Cameco Corp. (New York) | $10,305,751 | 1.5% |
| Encompass Health Corp. | $10,303,490 | 1.5% |
| NCR Atleos Corp. | $10,273,283 | 1.5% |
| Total | $112,829,427 | 16.1% |
| Value | Value |
|---|
| Industrials | 20.9% |
| Financials | 20.4% |
| Consumer Discretionary | 15.4% |
| Information Technology | 12.0% |
| Real Estate | 8.1% |
| Health Care | 6.6% |
| Energy | 5.4% |
| Materials | 3.1% |
| Utilities | 2.8% |
| Consumer Staples | 2.7% |
| Communication Services | 2.0% |
| Short-Term Investments | 8.4% |
| Other assets less liabilities | -7.8% |
Availability of Additional Information
You can find additional information on the Portfolio’s website at https://www.abfunds.com/link/AB/64VQ-B-A, including the Portfolio's:
• Prospectus
• Financial information
• Portfolio holdings
• Proxy voting information
You can also request this information by contacting us at (800) 227 4618.
Shareholders who have consented to receive a single annual or semi-annual shareholder report at a shared address may revoke this consent by contacting us at (800) 227 4618.
Information Regarding the Review and Approval of the Portfolio’s Advisory Agreement
Information regarding the Portfolio’s Board of Directors’/Trustees’ review of the advisory agreement is available on the Portfolio’s website https://www.abfunds.com/link/AB/64VQ-B-A. You can request this information, free of charge, by contacting us at (800) 227 4618 or by scanning the QR code below.
The [A/B] logo and AllianceBernstein® are registered trademarks used by permission of the owner, AllianceBernstein L.P.
Please scan QR code for
Portfolio Information
Please scan QR code for
Portfolio Information
AB VPS Sustainable Global Thematic Portfolio
Annual Shareholder Report
This annual shareholder report contains important information about the AB VPS Sustainable Global Thematic Portfolio (the “Portfolio”) for the period of January 1, 2024 to December 31, 2024. You can find additional information about the Portfolio at https://www.abfunds.com/link/AB/64VA-A-A. You can also request this information by contacting us at (800) 227 4618.
What were the Portfolio costs for the last year?
(Based on a hypothetical $10,000 investment)
| Class Name | Cost of a $10,000 investment | Costs paid as a percentage of a $10,000 investment |
|---|
| Class A | $94 | 0.91% |
|---|
How did the Portfolio perform last year? What affected the Portfolio’s performance?
During the 12-month period ended December 31, 2024, all share classes of the Portfolio underperformed the Morgan Stanley Capital
International All Country World Index (“MSCI ACWI”)(net)(the “benchmark”). Overall security selection drove the underperformance, while sector allocation contributed. Security selection within technology and financials detracted the most, while selection within consumer staples and utilities was positive. In terms of sector allocation, an overweight to technology and an underweight to materials contributed and helped offset losses from an underweight to communication services and an overweight to health care. Overall country selection (a result of bottom-up security analysis combined with fundamental research) detracted, as losses from overweights to Brazil and Indonesia offset gains from underweights to France and South Korea.
The Portfolio used derivatives in the form of currency forwards for hedging purposes, which had no material impact on absolute returns for the annual period.
Top contributors to performance:
During the 12-month period, an overweight to technology and an underweight to materials contributed, as did security selection within consumer staples and utilities. In terms of country selection, underweights to France and South Korea also added to gains.
Top detractors from performance:
During the 12-month period, leading detractors to performance included security selection within technology and financials, an underweight to communication services and an overweight to health care. Country selection, including overweights to Brazil and Indonesia, also detracted from gains.
The following graph shows the performance of hypothetical $10,000 investments in the Portfolio and a broad-based securities market index over the most recently completed 10 fiscal years of the Portfolio, or since inception, if shorter. The Portfolio's performance reflects applicable sales charges and assumes the reinvestment of dividends.
| Class A | MSCI ACWI Index (net) |
|---|
| 12/14 | $10,000 | $10,000 |
|---|
| 12/15 | $10,289 | $9,764 |
|---|
| 12/16 | $10,225 | $10,531 |
|---|
| 12/17 | $13,974 | $13,056 |
|---|
| 12/18 | $12,605 | $11,827 |
|---|
| 12/19 | $16,406 | $14,973 |
|---|
| 12/20 | $22,872 | $17,406 |
|---|
| 12/21 | $28,103 | $20,633 |
|---|
| 12/22 | $20,520 | $16,844 |
|---|
| 12/23 | $23,805 | $20,584 |
|---|
| 12/24 | $25,283 | $24,183 |
|---|
Average Annual Total Returns
| AATR | 1 Year | 5 Years | 10 Years |
|---|
| Class A | 6.21% | 9.03% | 9.72% |
|---|
| MSCI ACWI Index (net) | 17.49% | 10.06% | 9.23% |
|---|
The Portfolio’s past performance is not a good predictor of the Portfolio’s future performance.
The graph and table do not reflect the deduction of taxes that a shareholder would pay on Portfolio distributions or the redemption or sale of Portfolio shares.
Visit https://www.abfunds.com/link/AB/64VA-A-A for the most recent performance information.
| Net Assets | $160,869,684 |
|---|
| # of Portfolio Holdings | 54 |
|---|
| Portfolio Turnover Rate | 47% |
|---|
| Total Advisory Fees Paid | $1,176,639 |
|---|
Graphical Representation of Holdings
| Company | U.S. $ Value | % of Net Assets |
|---|
| Microsoft Corp. | $6,112,593 | 3.8% |
| NVIDIA Corp. | $5,201,992 | 3.2% |
| Taiwan Semiconductor Manufacturing Co., Ltd. | $4,940,003 | 3.1% |
| Flex Ltd. | $4,626,686 | 2.9% |
| Visa, Inc. - Class A | $4,374,941 | 2.7% |
| London Stock Exchange Group PLC | $4,225,046 | 2.6% |
| Fiserv, Inc. | $4,155,236 | 2.6% |
| Veralto Corp. | $4,057,093 | 2.5% |
| NextEra Energy, Inc. | $3,855,273 | 2.4% |
| MercadoLibre, Inc. | $3,849,796 | 2.4% |
| Total | $45,398,659 | 28.2% |
| Value | Value |
|---|
| Information Technology | 32.8% |
| Financials | 19.1% |
| Industrials | 18.5% |
| Health Care | 13.6% |
| Consumer Discretionary | 6.1% |
| Consumer Staples | 3.9% |
| Utilities | 3.7% |
| Energy | 1.5% |
| Short-Term Investments | 0.9% |
| Other assets less liabilities | -0.1% |
| Value | Value |
|---|
| United States | 60.6% |
| United Kingdom | 7.8% |
| Brazil | 5.6% |
| Japan | 4.0% |
| Switzerland | 3.4% |
| Taiwan | 3.1% |
| Canada | 3.1% |
| Ireland | 2.3% |
| Hong Kong | 2.0% |
| India | 2.0% |
| Jersey (Channel Islands) | 1.5% |
| Netherlands | 1.2% |
| Italy | 1.0% |
| Norway | 0.9% |
| Others | 0.7% |
| Short-Term Investments | 0.9% |
| Other assets less liabilities | -0.1% |
Availability of Additional Information
You can find additional information on the Portfolio’s website at https://www.abfunds.com/link/AB/64VA-A-A, including the Portfolio's:
• Prospectus
• Financial information
• Portfolio holdings
• Proxy voting information
You can also request this information by contacting us at (800) 227 4618.
Shareholders who have consented to receive a single annual or semi-annual shareholder report at a shared address may revoke this consent by contacting us at (800) 227 4618.
Information Regarding the Review and Approval of the Portfolio’s Advisory Agreement
Information regarding the Portfolio’s Board of Directors’/Trustees’ review of the advisory agreement is available on the Portfolio’s website https://www.abfunds.com/link/AB/64VA-A-A. You can request this information, free of charge, by contacting us at (800) 227 4618 or by scanning the QR code below.
The [A/B] logo and AllianceBernstein® are registered trademarks used by permission of the owner, AllianceBernstein L.P.
Please scan QR code for
Portfolio Information
Please scan QR code for
Portfolio Information
AB VPS Sustainable Global Thematic Portfolio
Annual Shareholder Report
This annual shareholder report contains important information about the AB VPS Sustainable Global Thematic Portfolio (the “Portfolio”) for the period of January 1, 2024 to December 31, 2024. You can find additional information about the Portfolio at https://www.abfunds.com/link/AB/64VA-B-A. You can also request this information by contacting us at (800) 227 4618.
What were the Portfolio costs for the last year?
(Based on a hypothetical $10,000 investment)
| Class Name | Cost of a $10,000 investment | Costs paid as a percentage of a $10,000 investment |
|---|
| Class B | $119 | 1.16% |
|---|
How did the Portfolio perform last year? What affected the Portfolio’s performance?
During the 12-month period ended December 31, 2024, all share classes of the Portfolio underperformed the Morgan Stanley Capital
International All Country World Index (“MSCI ACWI”)(net)(the “benchmark”). Overall security selection drove the underperformance, while sector allocation contributed. Security selection within technology and financials detracted the most, while selection within consumer staples and utilities was positive. In terms of sector allocation, an overweight to technology and an underweight to materials contributed and helped offset losses from an underweight to communication services and an overweight to health care. Overall country selection (a result of bottom-up security analysis combined with fundamental research) detracted, as losses from overweights to Brazil and Indonesia offset gains from underweights to France and South Korea.
The Portfolio used derivatives in the form of currency forwards for hedging purposes, which had no material impact on absolute returns for the annual period.
Top contributors to performance:
During the 12-month period, an overweight to technology and an underweight to materials contributed, as did security selection within consumer staples and utilities. In terms of country selection, underweights to France and South Korea also added to gains.
Top detractors from performance:
During the 12-month period, leading detractors to performance included security selection within technology and financials, an underweight to communication services and an overweight to health care. Country selection, including overweights to Brazil and Indonesia, also detracted from gains.
The following graph shows the performance of hypothetical $10,000 investments in the Portfolio and a broad-based securities market index over the most recently completed 10 fiscal years of the Portfolio, or since inception, if shorter. The Portfolio's performance reflects applicable sales charges and assumes the reinvestment of dividends.
| Class B | MSCI ACWI Index (net) |
|---|
| 12/14 | $10,000 | $10,000 |
|---|
| 12/15 | $10,265 | $9,764 |
|---|
| 12/16 | $10,175 | $10,531 |
|---|
| 12/17 | $13,868 | $13,056 |
|---|
| 12/18 | $12,484 | $11,827 |
|---|
| 12/19 | $16,201 | $14,973 |
|---|
| 12/20 | $22,533 | $17,406 |
|---|
| 12/21 | $27,619 | $20,633 |
|---|
| 12/22 | $20,116 | $16,844 |
|---|
| 12/23 | $23,274 | $20,584 |
|---|
| 12/24 | $24,662 | $24,183 |
|---|
Average Annual Total Returns
| AATR | 1 Year | 5 Years | 10 Years |
|---|
| Class B | 5.96% | 8.77% | 9.45% |
|---|
| MSCI ACWI Index (net) | 17.49% | 10.06% | 9.23% |
|---|
The Portfolio’s past performance is not a good predictor of the Portfolio’s future performance.
The graph and table do not reflect the deduction of taxes that a shareholder would pay on Portfolio distributions or the redemption or sale of Portfolio shares.
Visit https://www.abfunds.com/link/AB/64VA-B-A for the most recent performance information.
| Net Assets | $160,869,684 |
|---|
| # of Portfolio Holdings | 54 |
|---|
| Portfolio Turnover Rate | 47% |
|---|
| Total Advisory Fees Paid | $1,176,639 |
|---|
Graphical Representation of Holdings
| Company | U.S. $ Value | % of Net Assets |
|---|
| Microsoft Corp. | $6,112,593 | 3.8% |
| NVIDIA Corp. | $5,201,992 | 3.2% |
| Taiwan Semiconductor Manufacturing Co., Ltd. | $4,940,003 | 3.1% |
| Flex Ltd. | $4,626,686 | 2.9% |
| Visa, Inc. - Class A | $4,374,941 | 2.7% |
| London Stock Exchange Group PLC | $4,225,046 | 2.6% |
| Fiserv, Inc. | $4,155,236 | 2.6% |
| Veralto Corp. | $4,057,093 | 2.5% |
| NextEra Energy, Inc. | $3,855,273 | 2.4% |
| MercadoLibre, Inc. | $3,849,796 | 2.4% |
| Total | $45,398,659 | 28.2% |
| Value | Value |
|---|
| Information Technology | 32.8% |
| Financials | 19.1% |
| Industrials | 18.5% |
| Health Care | 13.6% |
| Consumer Discretionary | 6.1% |
| Consumer Staples | 3.9% |
| Utilities | 3.7% |
| Energy | 1.5% |
| Short-Term Investments | 0.9% |
| Other assets less liabilities | -0.1% |
| Value | Value |
|---|
| United States | 60.6% |
| United Kingdom | 7.8% |
| Brazil | 5.6% |
| Japan | 4.0% |
| Switzerland | 3.4% |
| Taiwan | 3.1% |
| Canada | 3.1% |
| Ireland | 2.3% |
| Hong Kong | 2.0% |
| India | 2.0% |
| Jersey (Channel Islands) | 1.5% |
| Netherlands | 1.2% |
| Italy | 1.0% |
| Norway | 0.9% |
| Others | 0.7% |
| Short-Term Investments | 0.9% |
| Other assets less liabilities | -0.1% |
Availability of Additional Information
You can find additional information on the Portfolio’s website at https://www.abfunds.com/link/AB/64VA-B-A, including the Portfolio's:
• Prospectus
• Financial information
• Portfolio holdings
• Proxy voting information
You can also request this information by contacting us at (800) 227 4618.
Shareholders who have consented to receive a single annual or semi-annual shareholder report at a shared address may revoke this consent by contacting us at (800) 227 4618.
Information Regarding the Review and Approval of the Portfolio’s Advisory Agreement
Information regarding the Portfolio’s Board of Directors’/Trustees’ review of the advisory agreement is available on the Portfolio’s website https://www.abfunds.com/link/AB/64VA-B-A. You can request this information, free of charge, by contacting us at (800) 227 4618 or by scanning the QR code below.
The [A/B] logo and AllianceBernstein® are registered trademarks used by permission of the owner, AllianceBernstein L.P.
Please scan QR code for
Portfolio Information
ITEM 2. CODE OF ETHICS.
(a) The registrant has adopted a code of ethics that applies to its principal executive officer, principal financial officer and principal accounting officer. A copy of the registrant’s code of ethics is filed herewith as Exhibit 19(a)(1).
(b) During the period covered by this report, no material amendments were made to the provisions of the code of ethics adopted in 2(a) above.
(c) During the period covered by this report, no implicit or explicit waivers to the provisions of the code of ethics adopted in 2(a) above were granted.
ITEM 3. AUDIT COMMITTEE FINANCIAL EXPERT.
The registrant’s Board of Directors has determined that independent directors Garry L. Moody, Marshall C. Turner, Jr., Jorge A. Bermudez and Carol C. McMullen qualify as audit committee financial experts.
ITEM 4. PRINCIPAL ACCOUNTANT FEES AND SERVICES.
(a) - (c) The following table sets forth the aggregate fees billed by the independent registered public accounting firm Ernst & Young LLP, for the Fund’s last two fiscal years, for professional services rendered for: (i) the audit of the Fund’s annual financial statements included in the Fund’s annual report to stockholders; (ii) assurance and related services that are reasonably related to the performance of the audit of the Fund’s financial statements and are not reported under (i), which include advice and education related to accounting and auditing issues, quarterly press release review (for those Funds that issue quarterly press releases), and preferred stock maintenance testing (for those Funds that issue preferred stock); and (iii) tax compliance, tax advice and tax return preparation.
| | | | | | | | | | | | | | | | |
| | | | | | Audit Fees | | | Audit-Related
Fees | | | Tax Fees | |
AB Balanced Hedged Allocation Portfolio | | | 2023 | | | | 60,807 | | | | — | | | | 29,670 | |
| | | 2024 | | | | 45,000 | | | | — | | | | 9,274 | |
AB Sustainable Global Thematic Portfolio | | | 2023 | | | | 44,022 | | | | — | | | | 19,327 | |
| | | 2024 | | | | 44,022 | | | | — | | | | 4,222 | |
AB Relative Value Portfolio | | | 2023 | | | | 32,974 | | | | — | | | | 19,617 | |
| | | 2024 | | | | 32,974 | | | | — | | | | 3,780 | |
AB International Value Portfolio | | | 2023 | | | | 44,022 | | | | — | | | | 46,938 | |
| | | 2024 | | | | 44,022 | | | | — | | | | 12,660 | |
AB Large Cap Growth Portfolio | | | 2023 | | | | 32,974 | | | | — | | | | 17,220 | |
| | | 2024 | | | | 32,974 | | | | — | | | | 1,770 | |
AB Small Cap Growth Portfolio | | | 2023 | | | | 32,974 | | | | — | | | | 18,663 | |
| | | 2024 | | | | 32,974 | | | | — | | | | 1,893 | |
AB Discovery Value Portfolio | | | 2023 | | | | 37,394 | | | | — | | | | 19,663 | |
| | | 2024 | | | | 37,394 | | | | — | | | | 6,602 | |
AB Dynamic Asset Allocation Portfolio | | | 2023 | | | | 89,404 | | | | — | | | | 59,547 | |
| | | 2024 | | | | 55,000 | | | | — | | | | 24,499 | |
AB Global Risk Allocation-Moderate Portfolio | | | 2023 | | | | 58,830 | | | | — | | | | 34,712 | |
| | | 2024 | | | | 58,830 | | | | — | | | | 20,686 | |
(d) Not applicable.
(e) (1) Beginning with audit and non-audit service contracts entered into on or after May 6, 2003, the Fund’s Audit Committee policies and procedures require the pre-approval of all audit and non-audit services provided to the Fund by the Fund’s independent registered public accounting firm. The Fund’s Audit Committee policies and procedures also require pre-approval of all audit and non-audit services provided to the Adviser and Service Affiliates to the extent that these services are directly related to the operations or financial reporting of the Fund.
(e) (2) No percentage of services addressed by (b) and (c) of this Item 4 were approved pursuant to the waiver provision of paragraph (c)(7)(i)(C) of Rule 2-01 of Regulation S-X. No amounts are reported for Item 4 (d).
(f) Not applicable.
(g) The following table sets forth the aggregate non-audit services provided to the Fund, the Fund’s Adviser and entities that control, are controlled by or under common control with the Adviser that provide ongoing services to the Fund: (“Service Affiliates”):
| | | | | | | | | | | | |
| | | | | All Fees for
Non-Audit Services
Provided to the
Portfolio, the Adviser
and Service Affiliates | | | Total Amount of
Foregoing Column
Pre-approved by the Audit
Committee
(Portion Comprised of
Audit Related Fees)
(Portion Comprised of
Tax Fees) | |
AB Balanced Hedged Allocation Portfolio | | | 2023 | | | $ | 1,917,111 | | | $ | 29,670 | |
| | | | | | | | | | | — | |
| | | | | | | | | | $ | (29,670 | ) |
| | | 2024 | | | $ | 1,765,978 | | | $ | 9,274 | |
| | | | | | | | | | | — | |
| | | | | | | | | | | (9,274 | ) |
AB Sustainable Global Thematic Portfolio | | | 2023 | | | $ | 1,906,768 | | | $ | 19,327 | |
| | | | | | | | | | | — | |
| | | | | | | | | | $ | (19,327 | ) |
| | | 2024 | | | $ | 1,760,926 | | | $ | 4,222 | |
| | | | | | | | | | | — | |
| | | | | | | | | | | (4,222 | ) |
AB Relative Value Portfolio | | | 2023 | | | $ | 1,907,058 | | | $ | 19,617 | |
| | | | | | | | | | | — | |
| | | | | | | | | | $ | (19,617 | ) |
| | | 2024 | | | $ | 1,760,484 | | | $ | 3,780 | |
| | | | | | | | | | | — | |
| | | | | | | | | | $ | (3,780 | ) |
AB International Value Portfolio | | | 2023 | | | $ | 1,934,379 | | | $ | 46,938 | |
| | | | | | | | | | | — | |
| | | | | | | | | | $ | (46,938 | ) |
| | | 2024 | | | $ | 1,769,364 | | | $ | 12,660 | |
| | | | | | | | | | | — | |
| | | | | | | | | | | (12,660 | ) |
AB Large Cap Growth Portfolio | | | 2023 | | | $ | 1,904,661 | | | $ | 17,220 | |
| | | | | | | | | | | — | |
| | | | | | | | | | $ | (17,220 | ) |
| | | 2024 | | | $ | 1,758,474 | | | $ | 1,770 | |
| | | | | | | | | | | — | |
| | | | | | | | | | | (1,770 | ) |
AB Small Cap Growth Portfolio | | | 2023 | | | $ | 1,906,104 | | | $ | 18,663 | |
| | | | | | | | | | | — | |
| | | | | | | | | | $ | (18,663 | ) |
| | | 2024 | | | $ | 1,758,597 | | | $ | 1,893 | |
| | | | | | | | | | | — | |
| | | | | | | | | | | (1,893 | ) |
AB Discovery Value Portfolio | | | 2023 | | | $ | 1,907,104 | | | $ | 19,663 | |
| | | | | | | | | | | — | |
| | | | | | | | | | $ | (19,663 | ) |
| | | 2024 | | | $ | 1,763,306 | | | $ | 6,602 | |
| | | | | | | | | | | — | |
| | | | | | | | | | | (6,602 | ) |
AB Dynamic Asset Allocation Portfolio | | | 2023 | | | $ | 1,946,988 | | | $ | 59,547 | |
| | | | | | | | | | | — | |
| | | | | | | | | | $ | (59,547 | ) |
| | | 2024 | | | $ | 1,781,203 | | | $ | 24,499 | |
| | | | | | | | | | | — | |
| | | | | | | | | | | (24,499 | ) |
AB Global Risk Allocation-Moderate Portfolio | | | 2023 | | | $ | 1,922,153 | | | $ | 34,712 | |
| | | | | | | | | | | — | |
| | | | | | | | | | $ | (34,712 | ) |
| | | 2024 | | | $ | 1,777,390 | | | $ | 20,686 | |
| | | | | | | | | | | — | |
| | | | | | | | | | | (20,686 | ) |
(h) The Audit Committee of the Fund has considered whether the provision of any non-audit services not pre-approved by the Audit Committee provided by the Fund’s independent registered public accounting firm to the Adviser and Service Affiliates is compatible with maintaining the auditor’s independence.
(i) Not applicable.
(j) Not applicable.
ITEM 5. AUDIT COMMITTEE OF LISTED REGISTRANTS.
Not applicable to the registrant.
ITEM 6. INVESTMENTS.
Please see Schedule of Investments contained in the Report to Shareholders included under Item 1 of this Form N-CSR.
ITEM 7. FINANCIAL STATEMENTS AND FINANCIAL HIGHLIGHTS FOR OPEN-END MANAGEMENT INVESTMENT COMPANIES.
Not applicable to the registrant.
DEC 12.31.24

ANNUAL FINANCIAL STATEMENTS AND ADDITIONAL INFORMATION
AB VARIABLE PRODUCTS
SERIES FUND, INC.
| + | | AB BALANCED HEDGED ALLOCATION PORTFOLIO |
Investment Products Offered
| | • | | Are Not Bank Guaranteed |
AllianceBernstein Investments, Inc. (ABI) is the distributor of the AB family of mutual funds. ABI is a member of FINRA and is an affiliate of AllianceBernstein L.P., the Adviser of the funds.
You may obtain a description of the Fund’s proxy voting policies and procedures, and information regarding how the Fund voted proxies relating to portfolio securities during the most recent 12-month period ended June 30, without charge. Simply visit AB’s website at www.abfunds.com or go to the Securities and Exchange Commission’s (the “Commission”) website at www.sec.gov, or call AB at (800) 227 4618.
The Fund files its complete schedule of portfolio holdings with the Commission for the first and third quarters of each fiscal year as an exhibit to its reports on Form N-PORT. The Fund’s Form N-PORT reports are available on the Commission’s website at www.sec.gov.
The [A/B] logo and AllianceBernstein® are registered trademarks used by permission of the owner, AllianceBernstein L.P.
| | |
| BALANCED HEDGED ALLOCATION PORTFOLIO |
| PORTFOLIO OF INVESTMENTS | | |
| |
| December 31, 2024 | | AB Variable Products Series Fund |
| | | | | | | | | | | | |
| Company | | | | |
Shares | | | U.S. $ Value | |
| | | | | | | | | | | | |
INVESTMENT COMPANIES–87.0% | | | | | | | | | |
FUNDS AND INVESTMENT TRUSTS–87.0%(a) | | | | | | | | | | | | |
iShares Core MSCI EAFE ETF | | | | | | | 260,700 | | | $ | 18,321,996 | |
iShares Core MSCI Emerging Markets ETF | | | | | | | 186,000 | | | | 9,712,920 | |
iShares Core S&P 500 ETF | | | | | | | 79,900 | | | | 47,035,532 | |
iShares Core U.S. Aggregate Bond ETF(b) | | | | | | | 250,500 | | | | 24,273,450 | |
Vanguard Mid-Cap ETF(b) | | | | | | | 18,450 | | | | 4,873,198 | |
Vanguard Real Estate ETF(b) | | | | | | | 44,900 | | | | 3,999,692 | |
Vanguard Small-Cap ETF(b) | | | | | | | 14,650 | | | | 3,520,102 | |
Vanguard Total Bond Market ETF(b) | | | | | | | 336,900 | | | | 24,226,479 | |
| | | | | | | | | | | | |
Total Investment Companies
(cost $123,782,313) | | | | | | | 135,963,369 | |
| | | | | | | | | | | | |
| | | Principal
Amount
(000) | | | | |
INFLATION-LINKED SECURITIES–3.1% | | | | | | | | | | | | |
UNITED STATES–3.1% | | | | | | | | | | | | |
U.S. Treasury Inflation Index
0.125%, 01/15/2032 (TIPS)(c)
(cost $5,573,156) | | | U.S.$ | | | | 5,550 | | | | 4,812,559 | |
| | | | | | | | | | | | |
| | | Notional
Amount | | | | |
PURCHASED OPTIONS–CALLS–3.0% | | | | | | | | | | | | |
OPTIONS ON EQUITY INDICES–3.0% | | | | | | | | | | | | |
S&P 500 Index
Expiration: Dec 2026; Contracts: 18;
Exercise Price:
USD 6,100.00;
Counterparty: Morgan Stanley & Co.,
Inc.(d) | | | USD | | | | 10,980,000 | | | | 1,164,600 | |
| | | | | | | | | | | | |
S&P 500 Index
Expiration: Dec 2026; Contracts: 14;
Exercise Price: USD 6,000.00;
Counterparty: Morgan Stanley & Co., Inc.(d) | | | USD | | | | 8,400,000 | | | | 990,430 | |
S&P 500 Index
Expiration: Dec 2026; Contracts: 12;
Exercise Price: USD 5,500.00;
Counterparty: Morgan Stanley & Co., Inc.(d) | | | USD | | | | 6,600,000 | | | | 1,242,240 | |
S&P 500 Index
Expiration: Dec 2026; Contracts: 6;
Exercise Price: USD 5,600.00;
Counterparty: Morgan Stanley & Co., Inc.(d) | | | USD | | | | 3,360,000 | | | | 580,230 | |
S&P 500 Index
Expiration: Dec 2026; Contracts: 6;
Exercise Price: USD 5,300.00;
Counterparty: Morgan Stanley & Co., Inc.(d) | | | USD | | | | 3,180,000 | | | | 700,050 | |
| | | | | | | | | | | | |
Total Purchased
Options–Calls
(premiums paid $4,307,464) | | | | | | | 4,677,550 | |
| | | | | | | | | | | | |
PURCHASED OPTIONS–
PUTS–2.4% | | | | | | | | | | | | |
OPTIONS ON EQUITY INDICES–2.4% | | | | | | | | | | | | |
S&P 500 Index
Expiration: Dec 2026; Contracts: 33;
Exercise Price:
USD 5,600.00;
Counterparty: Morgan Stanley & Co.,
Inc.(d) | | | USD | | | | 18,480,000 | | | | 1,010,295 | |
1
| | |
| BALANCED HEDGED ALLOCATION PORTFOLIO |
| PORTFOLIO OF INVESTMENTS | | |
| |
| (continued) | | AB Variable Products Series Fund |
| | | | | | | | | | | | |
| Company | | | | |
Notional
Amount | | | U.S. $ Value | |
| | | | | | | | | | | | |
S&P 500 Index
Expiration: Dec 2026; Contracts: 24;
Exercise Price: USD 5,500.00;
Counterparty: Morgan Stanley & Co., Inc.(d) | | | USD | | | | 13,200,000 | | | $ | 680,160 | |
S&P 500 Index
Expiration: Dec 2026; Contracts: 18;
Exercise Price: USD 6,100.00;
Counterparty: Morgan Stanley & Co., Inc.(d) | | | USD | | | | 10,980,000 | | | | 798,120 | |
S&P 500 Index
Expiration: Dec 2026; Contracts: 14;
Exercise Price: USD 6,000.00;
Counterparty: Morgan Stanley & Co., Inc.(d) | | | USD | | | | 8,400,000 | | | | 577,570 | |
S&P 500 Index
Expiration: Dec 2026; Contracts: 12;
Exercise Price: USD 5,700.00;
Counterparty: Morgan Stanley & Co., Inc.(d) | | | USD | | | | 6,840,000 | | | | 396,480 | |
S&P 500 Index
Expiration: Dec 2026; Contracts: 12;
Exercise Price: USD 5,300.00;
Counterparty: Morgan Stanley & Co., Inc.(d) | | | USD | | | | 6,360,000 | | | | 289,920 | |
| | | | | | | | | | | | |
Total Purchased Options–Puts
(premiums paid $4,258,079) | | | | | | | | | | | 3,752,545 | |
| | | | | | | | | | | | |
| Company | | | | | Shares | | | U.S. $ Value | |
| | | | | | | | | | | | |
COMMON STOCKS–0.0% | | | | | | | | | | | | |
ENERGY–0.0% | | | | | | | | | | | | |
OIL, GAS & CONSUMABLE
FUELS–0.0% | | | | | | | | | | | | |
Gazprom PJSC(d)(e)(f)(g) | | | | | | | 31,460 | | | | –0 | – |
LUKOIL PJSC(e)(f)(g) | | | | | | | 790 | | | | –0 | – |
| | | | | | | | | | | | |
| | | | | | | –0 | – |
| | | | | | | | | | | | |
MATERIALS–0.0% | |
METALS & MINING–0.0% | |
MMC Norilsk Nickel PJSC (ADR)(d)(e)(f) | | | | | | | 2,540 | | | | –0 | – |
| | | | | | | | | | | | |
Total Common Stocks
(cost $272,696) | | | | | | | –0 | – |
| | | | | | | | | | | | |
SHORT-TERM INVESTMENTS–4.8% | | | | | | | | | | | | |
INVESTMENT COMPANIES–4.8% | | | | | | | | | | | | |
AB Fixed Income Shares, Inc.–Government Money Market Portfolio–Class AB, 4.43%(a)(h)(i)
(cost $7,544,584) | | | | | | | 7,544,584 | | | | 7,544,584 | |
| | | | | | | | | | | | |
TOTAL INVESTMENTS BEFORE SECURITY LENDING COLLATERAL FOR SECURITIES
LOANED–100.3%
(cost $145,738,292) | | | | | | | | | | | 156,750,607 | |
| | | | | | | | | | | | |
INVESTMENTS OF CASH COLLATERAL FOR SECURITIES
LOANED–4.1% | | | | | | | | | | | | |
INVESTMENT COMPANIES–4.1% | | | | | | | | | | | | |
AB Fixed Income Shares, Inc.–Government Money Market Portfolio–Class AB, 4.43%(a)(h)(i)
(cost $6,437,125) | | | | | | | 6,437,125 | | | | 6,437,125 | |
| | | | | | | | | | | | |
TOTAL
INVESTMENTS–104.4%
(cost $152,175,417) | | | | | | | | | | | 163,187,732 | |
Other assets less
liabilities–(4.4)% | | | | | | | | | | | (6,841,221 | ) |
| | | | | | | | | | | | |
NET ASSETS–100.0% | | | | | | | | | | $ | 156,346,511 | |
| | | | | | | | | | | | |
2
| | |
| |
| | | AB Variable Products Series Fund |
FUTURES (see Note D)
| | | | | | | | | | | | | | | | |
| Description | | Number of
Contracts | | | Expiration
Month | | | Current
Notional | | | Value and
Unrealized
Appreciation
(Depreciation) | |
Purchased Contracts | |
E-Mini Russell 2000 Futures | | | 9 | | | | March 2025 | | | $ | 1,012,410 | | | $ | (57,242 | ) |
MSCI EAFE Futures | | | 39 | | | | March 2025 | | | | 4,421,625 | | | | (134,047 | ) |
MSCI Emerging Markets Futures | | | 46 | | | | March 2025 | | | | 2,469,740 | | | | (91,060 | ) |
S&P 500 E-Mini Futures | | | 20 | | | | March 2025 | | | | 5,935,750 | | | | (223,529 | ) |
S&P Mid 400 E-Mini Futures | | | 5 | | | | March 2025 | | | | 1,573,350 | | | | (85,140 | ) |
U.S. Long Bond (CBT) Futures | | | 45 | | | | March 2025 | | | | 5,122,969 | | | | (118,879 | ) |
U.S. T-Note 10 Yr (CBT) Futures | | | 496 | | | | March 2025 | | | | 53,940,000 | | | | (481,871 | ) |
| | | | | | | | | | | | | | | | |
| | | | | | | | | | | | | | $ | (1,191,768 | ) |
| | | | | | | | | | | | | | | | |
| (a) | | To obtain a copy of the fund’s shareholder report, please go to the Securities and Exchange Commission’s website at www.sec.gov. Additionally, shareholder reports for AB funds can be obtained by calling AB at (800) 227-4618. |
| (b) | | Represents entire or partial securities out on loan. See Note E for securities lending information. |
| (c) | | Position, or a portion thereof, has been segregated to collateralize margin requirements for open futures contracts. |
| (d) | | Non-income producing security. |
| (e) | | Security in which significant unobservable inputs (Level 3) were used in determining fair value. |
| (f) | | Fair valued by the Adviser. |
| (g) | | Restricted and illiquid security. |
| | | | | | | | | | | | | | | | |
| Restricted & Illiquid Securities | | Acquisition
Date | | | Cost | | | Market
Value | | | Percentage
of Net Assets | |
Gazprom PJSC | | | 09/28/2021-09/29/2021 | | | $ | 154,651 | | | $ | –0 | – | | | 0.00 | % |
LUKOIL PJSC | | | 06/29/2018-07/09/2021 | | | | 61,154 | | | | –0 | – | | | 0.00 | % |
| (h) | | Affiliated investments. |
| (i) | | The rate shown represents the 7-day yield as of period end. |
Currency Abbreviations:
USD—United States Dollar
Glossary:
ADR—American Depositary Receipt
CBT—Chicago Board of Trade
EAFE—Europe, Australia, and Far East
ETF—Exchange Traded Fund
MSCI—Morgan Stanley Capital International
PJSC—Public Joint Stock Company
TIPS—Treasury Inflation-Protected Securities
See notes to financial statements.
3
| | |
| BALANCED HEDGED ALLOCATION PORTFOLIO |
| STATEMENT OF ASSETS & LIABILITIES | | |
| |
| December 31, 2024 | | AB Variable Products Series Fund |
| | | | |
ASSETS | |
Investments in securities, at value | | | | |
Unaffiliated issuers (cost $138,193,708) | | $ | 149,206,023 | (a) |
Affiliated issuers (cost $13,981,709—including investment of cash collateral for securities loaned of $6,437,125) | | | 13,981,709 | |
Cash | | | 20 | |
Foreign currencies, at value (cost $3,025) | | | 2,982 | |
Affiliated dividends receivable | | | 22,652 | |
Unaffiliated dividends and interest receivable | | | 6,223 | |
Receivable due from Adviser | | | 1,211 | |
Receivable for capital stock sold | | | 406 | |
| | | | |
Total assets | | | 163,221,226 | |
| | | | |
LIABILITIES | |
Payable for collateral received on securities loaned | | | 6,437,125 | |
Payable for variation margin on futures | | | 150,209 | |
Advisory fee payable | | | 59,436 | |
Payable for capital stock redeemed | | | 48,507 | |
Distribution fee payable | | | 29,775 | |
Administrative fee payable | | | 22,291 | |
Transfer Agent fee payable | | | 167 | |
Accrued expenses | | | 127,205 | |
| | | | |
Total liabilities | | | 6,874,715 | |
| | | | |
NET ASSETS | | $ | 156,346,511 | |
| | | | |
COMPOSITION OF NET ASSETS | | | | |
Capital stock, at par | | $ | 17,327 | |
Additional paid-in capital | | | 143,244,739 | |
Distributable earnings | | | 13,084,445 | |
| | | | |
NET ASSETS | | $ | 156,346,511 | |
| | | | |
Net Asset Value Per Share—1 billion shares of capital stock authorized, $.001 par value
| | | | | | | | | | | | |
| Class | | Net Assets | | | Shares
Outstanding | | | Net Asset
Value | |
| | | |
| A | | $ | 15,427,768 | | | | 1,683,143 | | | $ | 9.17 | |
| | | |
| B | | $ | 140,918,743 | | | | 15,643,773 | | | $ | 9.01 | |
| (a) | | Includes securities on loan with a value of $11,706,815 (see Note E). |
See notes to financial statements.
4
| | |
| BALANCED HEDGED ALLOCATION PORTFOLIO |
| STATEMENT OF OPERATIONS | | |
| |
| Year Ended December 31, 2024 | | AB Variable Products Series Fund |
| | | | |
INVESTMENT INCOME | | | | |
Dividends | | | | |
Unaffiliated issuers (net of foreign taxes withheld of $555) | | $ | 3,793,184 | |
Affiliated issuers | | | 274,992 | |
Interest | | | 145,954 | |
Securities lending income | | | 18,172 | |
Other income | | | 110,687 | |
| | | | |
| | | 4,342,989 | |
| | | | |
EXPENSES | | | | |
Advisory fee (see Note B) | | | 747,060 | |
Distribution fee—Class B | | | 375,608 | |
Transfer agency—Class A | | | 498 | |
Transfer agency—Class B | | | 4,736 | |
Administrative | | | 92,747 | |
Audit and tax | | | 65,917 | |
Custody and accounting | | | 61,137 | |
Printing | | | 54,301 | |
Legal | | | 37,305 | |
Directors’ fees | | | 22,839 | |
Miscellaneous | | | 18,679 | |
| | | | |
Total expenses | | | 1,480,827 | |
Less: expenses waived and reimbursed by the Adviser (see Notes B & E) | | | (12,077 | ) |
| | | | |
Net expenses | | | 1,468,750 | |
| | | | |
Net investment income | | | 2,874,239 | |
| | | | |
REALIZED AND UNREALIZED GAIN (LOSS) ON INVESTMENT AND FOREIGN CURRENCY TRANSACTIONS | | | | |
Net realized gain (loss) on: | | | | |
Investment transactions(a) | | | 7,546,941 | |
Futures | | | 1,010,049 | |
Foreign currency transactions | | | (90 | ) |
Net change in unrealized appreciation (depreciation) of: | | | | |
Investments | | | 6,980,468 | |
Futures | | | (4,564,393 | ) |
Foreign currency denominated assets and liabilities | | | (389 | ) |
| | | | |
Net gain on investment and foreign currency transactions | | | 10,972,586 | |
| | | | |
NET INCREASE IN NET ASSETS FROM OPERATIONS | | $ | 13,846,825 | |
| | | | |
| (a) | Net of foreign realized capital gains taxes of $5,943. |
See notes to financial statements.
5
| | |
| |
| BALANCED HEDGED ALLOCATION PORTFOLIO |
| |
| STATEMENT OF CHANGES IN NET ASSETS | | AB Variable Products Series Fund |
| | | | | | | | |
| | | Year Ended
December 31,
2024 | | | Year Ended
December 31,
2023 | |
INCREASE (DECREASE) IN NET ASSETS FROM OPERATIONS | |
Net investment income | | $ | 2,874,239 | | | $ | 2,924,139 | |
Net realized gain (loss) on investment and foreign currency transactions | | | 8,556,900 | | | | (6,050,458 | ) |
Net change in unrealized appreciation (depreciation) of investments and foreign currency denominated assets and liabilities | | | 2,415,686 | | | | 23,831,462 | |
| | | | | | | | |
Net increase in net assets from operations | | | 13,846,825 | | | | 20,705,143 | |
Distributions to Shareholders | |
Class A | | | (633,925 | ) | | | (978,634 | ) |
Class B | | | (5,620,894 | ) | | | (9,515,346 | ) |
CAPITAL STOCK TRANSACTIONS | |
Net decrease | | | (24,086,380 | ) | | | (14,760,704 | ) |
| | | | | | | | |
Total decrease | | | (16,494,374 | ) | | | (4,549,541 | ) |
NET ASSETS | |
Beginning of period | | | 172,840,885 | | | | 177,390,426 | |
| | | | | | | | |
End of period | | $ | 156,346,511 | | | $ | 172,840,885 | |
| | | | | | | | |
See notes to financial statements.
6
| | |
| BALANCED HEDGED ALLOCATION PORTFOLIO |
| NOTES TO FINANCIAL STATEMENTS | | |
| |
| December 31, 2024 | | AB Variable Products Series Fund |
NOTE A: Significant Accounting Policies
The AB Balanced Hedged Allocation Portfolio (the “Portfolio”) (formerly known as AB Balanced Wealth Strategy Portfolio) is a series of AB Variable Products Series Fund, Inc. (the “Fund”). The Portfolio’s investment objective is to maximize total return consistent with the determination of AllianceBernstein L.P. (the “Adviser”) of reasonable risk. The Portfolio is diversified as defined under the Investment Company Act of 1940 (the “1940 Act”). The Fund was incorporated in the State of Maryland as an open-end series investment company. The Fund offers nine separately managed pools of assets which have differing investment objectives and policies. The Portfolio offers Class A and Class B shares. Both classes of shares have identical voting, dividend, liquidating and other rights, except that Class B shares bear a distribution expense and have exclusive voting rights with respect to the Class B distribution plan.
The Portfolio offers and sells its shares only to separate accounts of certain life insurance companies for the purpose of funding variable annuity contracts and variable life insurance policies. Sales are made without a sales charge at the Portfolio’s net asset value per share.
The financial statements have been prepared in conformity with U.S. generally accepted accounting principles (“U.S. GAAP”), which require management to make certain estimates and assumptions that affect the reported amounts of assets and liabilities in the financial statements and amounts of income and expenses during the reporting period. Actual results could differ from those estimates. The Portfolio is an investment company under U.S. GAAP and follows the accounting and reporting guidance applicable to investment companies. The following is a summary of significant accounting policies followed by the Portfolio.
1. Security Valuation
Portfolio securities are valued at market value determined on the basis of market quotations or, if market quotations are not readily available or are unreliable, at “fair value” as determined in accordance with procedures approved by and under the oversight of the Fund’s Board of Directors (the “Board”). Pursuant to these procedures, the Adviser serves as the Portfolio’s valuation designee pursuant to Rule 2a-5 of the 1940 Act. In this capacity, the Adviser is responsible, among other things, for making all fair value determinations relating to the Portfolio’s portfolio investments, subject to the Board’s oversight.
In general, the market values of securities which are readily available and deemed reliable are determined as follows: securities listed on a national securities exchange (other than securities listed on the NASDAQ Stock Market, Inc. (“NASDAQ”)) or on a foreign securities exchange are valued at the last sale price at the close of the exchange or foreign securities exchange. If there has been no sale on such day, the securities are valued at the last traded price from the previous day. Securities listed on more than one exchange are valued by reference to the principal exchange on which the securities are traded; securities listed only on NASDAQ are valued in accordance with the NASDAQ Official Closing Price; listed or over the counter (“OTC”) market put or call options are valued at the mid level between the current bid and ask prices. If either a current bid or current ask price is unavailable, the Adviser will have discretion to determine the best valuation (e.g., last trade price in the case of listed options); open futures are valued using the closing settlement price or, in the absence of such a price, the most recent quoted bid price. If there are no quotations available for the day of valuation, the last available closing settlement price is used; U.S. Government securities and any other debt instruments having 60 days or less remaining until maturity are generally valued at market by an independent pricing vendor, if a market price is available. If a market price is not available, the securities are valued at amortized cost. This methodology is commonly used for short term securities that have an original maturity of 60 days or less, as well as short term securities that had an original term to maturity that exceeded 60 days. In instances when amortized cost is utilized, the Valuation Committee (the “Committee”) must reasonably conclude that the utilization of amortized cost is approximately the same as the fair value of the security. Factors the Committee will consider include, but are not limited to, an impairment of the creditworthiness of the issuer or material changes in interest rates. Fixed-income securities, including mortgage-backed and asset-backed securities, may be valued on the basis of prices provided by a pricing service or at a price obtained from one or more of the major broker-dealers. In cases where broker-dealer quotes are obtained, the Adviser may establish procedures whereby changes in market yields or spreads are used to adjust, on a daily basis, a recently obtained quoted price on a security. Swaps and other derivatives are valued daily, primarily using independent pricing services, independent pricing models using market inputs, as well as third party broker-dealers or counterparties. Open-end mutual funds are valued at the closing net asset value per share, while exchange-traded funds are valued at the closing market price per share.
7
| | |
| BALANCED HEDGED ALLOCATION PORTFOLIO |
| NOTES TO FINANCIAL STATEMENTS | | |
| |
| (continued) | | AB Variable Products Series Fund |
Securities for which market quotations are not readily available (including restricted securities) or are deemed unreliable are valued at fair value as deemed appropriate by the Adviser. Factors considered in making this determination may include, but are not limited to, information obtained by contacting the issuer, analysts, analysis of the issuer’s financial statements or other available documents. In addition, the Portfolio may use fair value pricing for securities primarily traded in non-U.S. markets because most foreign markets close well before the Portfolio values its securities at 4:00 p.m., Eastern Time. The earlier close of these foreign markets gives rise to the possibility that significant events, including broad market moves, may have occurred in the interim and may materially affect the value of those securities. To account for this, the Portfolio generally values many of its foreign equity securities using fair value prices based on third party vendor modeling tools to the extent available.
2. Fair Value Measurements
In accordance with U.S. GAAP regarding fair value measurements, fair value is defined as the price that the Portfolio would receive to sell an asset or pay to transfer a liability in an orderly transaction between market participants at the measurement date. U.S. GAAP establishes a framework for measuring fair value, and a three-level hierarchy for fair value measurements based upon the transparency of inputs to the valuation of an asset or liability (including those valued based on their market values as described in Note A.1 above). Inputs may be observable or unobservable and refer broadly to the assumptions that market participants would use in pricing the asset or liability. Observable inputs reflect the assumptions market participants would use in pricing the asset or liability based on market data obtained from sources independent of the Portfolio. Unobservable inputs reflect the Portfolio’s own assumptions about the assumptions that market participants would use in pricing the asset or liability based on the best information available in the circumstances. Each investment is assigned a level based upon the observability of the inputs which are significant to the overall valuation. The three-tier hierarchy of inputs is summarized below.
| | • | | Level 1—quoted prices in active markets for identical investments |
| | • | | Level 2—other significant observable inputs (including quoted prices for similar investments, interest rates, prepayment speeds, credit risk, etc.) |
| | • | | Level 3—significant unobservable inputs (including the Portfolio’s own assumptions in determining the fair value of investments) |
The fair value of debt instruments, such as bonds, and over-the-counter derivatives is generally based on market price quotations, recently executed market transactions (where observable) or industry recognized modeling techniques and are generally classified as Level 2. Pricing vendor inputs to Level 2 valuations may include quoted prices for similar investments in active markets, interest rate curves, coupon rates, currency rates, yield curves, option adjusted spreads, default rates, credit spreads and other unique security features in order to estimate the relevant cash flows which are then discounted to calculate fair values. If these inputs are unobservable and significant to the fair value, these investments will be classified as Level 3.
Where readily available market prices or relevant bid prices are not available for certain equity investments, such investments may be valued based on similar publicly traded investments, movements in relevant indices since last available prices or based upon underlying company fundamentals and comparable company data (such as multiples to earnings or other multiples to equity). Where an investment is valued using an observable input, such as another publicly traded security, the investment will be classified as Level 2. If management determines that an adjustment is appropriate based on restrictions on resale, illiquidity or uncertainty, and such adjustment is a significant component of the valuation, the investment will be classified as Level 3. An investment will also be classified as Level 3 where management uses company fundamentals and other significant inputs to determine the valuation.
Options are valued using market-based inputs to models, broker or dealer quotations, or alternative pricing sources with reasonable levels of price transparency, where such inputs and models are available. Alternatively, the values may be obtained through unobservable management determined inputs and/or management’s proprietary models. Where models are used, the selection of a particular model to value an option depends upon the contractual terms of, and specific risks inherent in, the option as well as the availability of pricing information in the market. Valuation models require a variety of inputs, including contractual terms, market prices, measures of volatility and correlations of such inputs. Exchange traded options generally will be classified as Level 2. For options that do not trade on an exchange but trade in liquid markets, inputs can generally be verified and model selection does not involve significant management judgment. Options are classified within Level 2 on the fair value hierarchy when all of the significant inputs can be corroborated to market evidence. Otherwise such instruments are classified as Level 3.
8
| | |
| |
| | | AB Variable Products Series Fund |
Other fixed income investments, including non-U.S. government and corporate debt, are generally valued using quoted market prices, if available, which are typically impacted by current interest rates, maturity dates and any perceived credit risk of the issuer. Additionally, in the absence of quoted market prices, these inputs are used by pricing vendors to derive a valuation based upon industry or proprietary models which incorporate issuer specific data with relevant yield/spread comparisons with more widely quoted bonds with similar key characteristics. Those investments for which there are observable inputs are classified as Level 2. Where the inputs are not observable, the investments are classified as Level 3.
The following table summarizes the valuation of the Portfolio’s investments by the above fair value hierarchy levels as of December 31, 2024:
| | | | | | | | | | | | | | | | |
| | | Level 1 | | | Level 2 | | | Level 3 | | | Total | |
Investments in Securities: | | | | | | | | | | | | | | | | |
Assets: | |
Investment Companies | | $ | 135,963,369 | | | $ | –0 | – | | $ | –0 | – | | $ | 135,963,369 | |
Inflation-Linked Securities | | | –0 | – | | | 4,812,559 | | | | –0 | – | | | 4,812,559 | |
Purchased Options—Calls | | | –0 | – | | | 4,677,550 | | | | –0 | – | | | 4,677,550 | |
Purchased Options—Puts | | | –0 | – | | | 3,752,545 | | | | –0 | – | | | 3,752,545 | |
Common Stocks | | | –0 | – | | | –0 | – | | | 0 | (a) | | | –0 | – |
Short-Term Investments | | | 7,544,584 | | | | –0 | – | | | –0 | – | | | 7,544,584 | |
Investments of Cash Collateral for Securities Loaned in Affiliated Money Market Fund | | | 6,437,125 | | | | –0 | – | | | –0 | – | | | 6,437,125 | |
| | | | | | | | | | | | | | | | |
Total Investments in Securities | | | 149,945,078 | | | | 13,242,654 | | | | 0 | (a) | | | 163,187,732 | |
Other Financial Instruments(b): | | | | | | | | | | | | | | | | |
Assets | | | –0 | – | | | –0 | – | | | –0 | – | | | –0 | – |
Liabilities: | |
Futures | | | (1,191,768 | ) | | | –0 | – | | | –0 | – | | | (1,191,768 | )(c) |
| | | | | | | | | | | | | | | | |
Total | | $ | 148,753,310 | | | $ | 13,242,654 | | | $ | 0 | (a) | | $ | 161,995,964 | |
| | | | | | | | | | | | | | | | |
| (a) | | The Portfolio held securities with zero market value at period end. |
| (b) | | Other financial instruments include derivative instruments, such as futures, forwards and swaps. Derivative instruments are valued at the unrealized appreciation (depreciation) on the instrument. Other financial instruments may also include swaps with upfront premiums, written options and written swaptions which are valued at market value. |
| (c) | | Only variation margin receivable (payable) at period end is reported within the statement of assets and liabilities. This amount reflects cumulative unrealized appreciation (depreciation) on futures and centrally cleared swaps as reported in the portfolio of investments. Where applicable, centrally cleared swaps with upfront premiums are presented here at market value. |
3. Currency Translation
Assets and liabilities denominated in foreign currencies and commitments under forward currency exchange contracts are translated into U.S. dollars at the mean of the quoted bid and ask prices of such currencies against the U.S. dollar. Purchases and sales of portfolio securities are translated into U.S. dollars at the rates of exchange prevailing when such securities were acquired or sold. Income and expenses are translated into U.S. dollars at rates of exchange prevailing when accrued.
Net realized gain or loss on foreign currency transactions represents foreign exchange gains and losses from sales and maturities of foreign fixed income investments, holding of foreign currencies, currency gains or losses realized between the trade and settlement dates on foreign investment transactions, and the difference between the amounts of dividends, interest and foreign withholding taxes recorded on the Portfolio’s books and the U.S. dollar equivalent amounts actually received or paid. Net unrealized currency gains and losses from valuing foreign currency denominated assets and liabilities at period end exchange rates are reflected as a component of net unrealized appreciation or depreciation of foreign currency denominated assets and liabilities.
4. Taxes
It is the Portfolio’s policy to meet the requirements of the Internal Revenue Code applicable to regulated investment companies and to distribute all of its investment company taxable income and net realized gains, if any, to shareholders. Therefore, no provisions for federal income or excise taxes are required. The Portfolio may be subject to taxes imposed by countries in which it invests. Such taxes are generally based on income and/or capital gains earned or repatriated. Taxes are accrued and applied to net investment income, net realized gains and net unrealized appreciation/depreciation as such income and/or gains are earned.
9
| | |
| BALANCED HEDGED ALLOCATION PORTFOLIO |
| NOTES TO FINANCIAL STATEMENTS | | |
| |
| (continued) | | AB Variable Products Series Fund |
In accordance with U.S. GAAP requirements regarding accounting for uncertainties in income taxes, management has analyzed the Portfolio’s tax positions taken or expected to be taken on federal and state income tax returns for all open tax years (the current and the prior three tax years) and has concluded that no provision for income tax is required in the Portfolio’s financial statements.
5. Investment Income and Investment Transactions
Dividend income is recorded on the ex-dividend date or as soon as the Portfolio is informed of the dividend. Interest income is accrued daily. Investment transactions are accounted for on the date the securities are purchased or sold. Investment gains or losses are determined on the identified cost basis. Non-cash dividends, if any, are recorded on the ex-dividend date at the fair value of the securities received. The Portfolio amortizes premiums and accretes discounts as adjustments to interest income. The Portfolio accounts for distributions received from real estate investment trust (“REIT”) investments or from regulated investment companies as dividend income, realized gain, or return of capital based on information provided by the REIT or the investment company.
6. Class Allocations
All income earned and expenses incurred by the Portfolio are borne on a pro-rata basis by each outstanding class of shares, based on the proportionate interest in the Portfolio represented by the net assets of such class, except for class specific expenses which are allocated to the respective class. Expenses of the Fund are charged proportionately to each portfolio or based on other appropriate methods. Realized and unrealized gains and losses are allocated among the various share classes based on respective net assets.
7. Dividends and Distributions
Dividends and distributions to shareholders, if any, are recorded on the ex-dividend date. Income dividends and capital gains distributions are determined in accordance with federal tax regulations and may differ from those determined in accordance with U.S. GAAP. To the extent these differences are permanent, such amounts are reclassified within the capital accounts based on their federal tax basis treatment; temporary differences do not require such reclassification.
8. Cash and Short-Term Investments
Cash and short-term investments include cash on hand and short-term investments with maturities of less than one year when purchased.
9. Segment Information
The Portfolio represents a single operating segment. An operating segment is defined in U.S. GAAP as a component of a public entity that engages in business activities from which it may recognize revenues and incur expenses, has operating results that are regularly reviewed by the public entity’s chief operating decision maker (“CODM”) to make decisions about resources to be allocated to the segment and assess its performance, and has discrete financial information available. The Portfolio’s President is the CODM. The CODM monitors the operating results of the Portfolio as a whole and the pre-determined Portfolio’s long term investment strategy, which is executed by the portfolio management group. The qualitative and quantitative information contained within the financial statements is used by the CODM to assess the segments performance versus the Portfolio’s comparative benchmark and to make resource allocation decisions. Segment assets are reflected on the statement of assets and liabilities and segment expenses are listed on the statement of operations.
NOTE B: Advisory Fee and Other Transactions with Affiliates
Under the terms of the investment advisory agreement, the Portfolio pays the Adviser an advisory fee at an annual rate of .45% of the first $2.5 billion, .425% of the next $2.5 billion and .40% in excess of $5 billion, of the Portfolio’s average daily net assets. The fee is accrued daily and paid monthly. The Adviser has agreed to waive its fees and bear certain expenses to the extent necessary to limit total operating expenses on an annual basis (the “Expense Caps”) to .75% and 1.00% of daily average net assets for Class A and Class B shares, respectively. For the year ended December 31, 2024, there was no such reimbursement. This fee waiver and/or expense reimbursement agreement extends through May 1, 2025 and then may be extended by the Adviser for additional one-year terms.
Pursuant to the investment advisory agreement, the Portfolio may reimburse the Adviser for certain legal and accounting services provided to the Portfolio by the Adviser. For the year ended December 31, 2024, the reimbursement for such services amounted to $92,747.
10
| | |
| |
| | | AB Variable Products Series Fund |
The Portfolio compensates AllianceBernstein Investor Services, Inc. (“ABIS”), a wholly-owned subsidiary of the Adviser, under a Transfer Agency Agreement for providing personnel and facilities to perform transfer agency services for the Portfolio. Such compensation retained by ABIS amounted to $1,950 for the year ended December 31, 2024.
The Portfolio may invest in AB Government Money Market Portfolio which has a contractual annual advisory fee rate of .20% of the portfolio’s average daily net assets and bears its own expenses. The Adviser had contractually agreed to waive .10% of the advisory fee of AB Government Money Market Portfolio (resulting in a net advisory fee of .10%) until August 31, 2023. Effective September 1, 2023, the Adviser has contractually agreed to waive .05% of the advisory fee of AB Government Money Market Portfolio (resulting in a net advisory fee of .15%) until August 31, 2024. In connection with the investment by the Portfolio in AB Government Money Market Portfolio, the Adviser has contractually agreed to waive its advisory fee from the Portfolio in an amount equal to the Portfolio’s pro rata share of the effective advisory fee of AB Government Money Market Portfolio, as borne indirectly by the Portfolio as an acquired fund fee and expense. For the year ended December 31, 2024, such waiver amounted to $8,614.
A summary of the Portfolio’s transactions in AB mutual funds for the year ended December 31, 2024 is as follows:
| | | | | | | | | | | | | | | | | | | | |
Portfolio | | Market Value
12/31/23
(000) | | | Purchases
at Cost
(000) | | | Sales
Proceeds
(000) | | | Market Value
12/31/24
(000) | | | Dividend
Income
(000) | |
AB Government Money Market Portfolio | | $ | 10,353 | | | $ | 41,185 | | | $ | 43,993 | | | $ | 7,545 | | | $ | 275 | |
AB Government Money Market Portfolio* | | | 6,202 | | | | 243,734 | | | | 243,499 | | | | 6,437 | | | | –0 | – |
| | | | | | | | | | | | | | | | | | | | |
Total | | | | | | | | | | | | | | $ | 13,982 | | | $ | 275 | |
| | | | | | | | | | | | | | | | | | | | |
| * | | Investments of cash collateral for securities lending transactions (see Note E). |
NOTE C: Distribution Plan
The Portfolio has adopted a Distribution Plan (the “Plan”) for Class B shares pursuant to Rule 12b-1 under the 1940 Act. Under the Plan, the Portfolio pays distribution and servicing fees to AllianceBernstein Investments, Inc. (the “Distributor”), a wholly-owned subsidiary of the Adviser, at an annual rate of up to .50% of the Portfolio’s average daily net assets attributable to Class B shares. The fees are accrued daily and paid monthly. The Board currently limits payments under the Plan to .25% of the Portfolio’s average daily net assets attributable to Class B shares. The Plan provides that the Distributor will use such payments in their entirety for distribution assistance and promotional activities.
The Portfolio is not obligated under the Plan to pay any distribution and servicing fees in excess of the amounts set forth above. The purpose of the payments to the Distributor under the Plan is to compensate the Distributor for its distribution services with respect to the sale of the Portfolio’s Class B shares. Since the Distributor’s compensation is not directly tied to its expenses, the amount of compensation received by it under the Plan during any year may be more or less than its actual expenses. For this reason, the Plan is characterized by the staff of the Securities and Exchange Commission as being of the “compensation” variety.
In the event that the Plan is terminated or not continued, no distribution or servicing fees (other than current amounts accrued but not yet paid) would be owed by the Portfolio to the Distributor.
The Plan also provides that the Adviser may use its own resources to finance the distribution of the Portfolio’s shares.
NOTE D: Investment Transactions
Purchases and sales of investment securities (excluding short-term investments) for the year ended December 31, 2024 were as follows:
| | | | | | | | |
| | | Purchases | | | Sales | |
Investment securities (excluding U.S. government securities) | | $ | 9,296,935 | | | $ | 37,632,387 | |
U.S. government securities | | | –0 | – | | | –0 | – |
11
| | |
| BALANCED HEDGED ALLOCATION PORTFOLIO |
| NOTES TO FINANCIAL STATEMENTS | | |
| |
| (continued) | | AB Variable Products Series Fund |
The cost of investments for federal income tax purposes, gross unrealized appreciation and unrealized depreciation are as follows:
| | | | |
Cost | | $ | 152,175,417 | |
| | | | |
Gross unrealized appreciation | | $ | 18,185,452 | |
Gross unrealized depreciation | | | (7,037,690 | ) |
| | | | |
Net unrealized appreciation | | $ | 11,147,762 | |
| | | | |
1. Derivative Financial Instruments
The Portfolio may use derivatives in an effort to earn income and enhance returns, to replace more traditional direct investments, to obtain exposure to otherwise inaccessible markets (collectively, “investment purposes”), or to hedge or adjust the risk profile of its portfolio.
The principal types of derivatives utilized by the Portfolio, as well as the methods in which they may be used are:
The Portfolio may buy or sell futures for investment purposes or for the purpose of hedging its portfolio against adverse effects of potential movements in the market. The Portfolio bears the market risk that arises from changes in the value of these instruments and the imperfect correlation between movements in the price of the futures and movements in the price of the assets, reference rates or indices which they are designed to track. Among other things, the Portfolio may purchase or sell futures for foreign currencies or options thereon for non-hedging purposes as a means of making direct investment in foreign currencies, as described below under “Currency Transactions”.
At the time the Portfolio enters into futures, the Portfolio deposits with the broker or segregates at its custodian cash or securities as collateral to satisfy initial margin requirements set by the exchange on which the transaction is effected. Pursuant to the contract, with respect to cash collateral, the Portfolio agrees to receive from or pay to the broker an amount of cash equal to the daily fluctuation in the value of the contract; in the case of securities collateral, the Fund agrees to adjust the securities position held in the segregated account accordingly. Such receipts, payments or adjustments are known as variation margin and are recorded by the Portfolio as unrealized gains or losses. Risks may arise from the potential inability of a counterparty to meet the terms of the contract. The credit/counterparty risk for exchange-traded futures is generally less than privately negotiated futures, since the clearinghouse, which is the issuer or counterparty to each exchange-traded future, has robust risk mitigation standards, including the requirement to provide initial and variation margin. When the contract is closed, the Portfolio records a realized gain or loss equal to the difference between the value of the contract at the time it was opened and the time it was closed.
Use of long futures subjects the Portfolio to risk of loss in excess of the amounts shown on the statement of assets and liabilities, up to the notional value of the futures. Use of short futures subjects the Portfolio to unlimited risk of loss. Under some circumstances, futures exchanges may establish daily limits on the amount that the price of futures can vary from the previous day’s settlement price, which could effectively prevent liquidation of unfavorable positions.
During the year ended December 31, 2024, the Portfolio held futures for hedging and non-hedging purposes.
For hedging and investment purposes, the Portfolio may purchase and write (sell) put and call options on U.S. and foreign securities, including government securities, and foreign currencies that are traded on U.S. and foreign securities exchanges and over-the-counter markets. Among other things, the Portfolio may use options transactions for non-hedging purposes as a means of making direct investments in foreign currencies, as described below under “Currency Transactions” and may use options strategies involving the purchase and/or writing of various combinations of call and/or put options, for hedging and investment purposes.
The risk associated with purchasing an option is that the Portfolio pays a premium whether or not the option is exercised. Additionally, the Portfolio bears the risk of loss of the premium and change in market value should the counterparty not perform under the contract. If a put or call purchased option by the Portfolio were permitted to expire without being sold or exercised, its premium would represent a loss to the Portfolio. Put and call purchased options are accounted for in the same manner as portfolio securities. The cost of securities acquired through the
12
| | |
| |
| | | AB Variable Products Series Fund |
exercise of call options is increased by premiums paid. The proceeds from securities sold through the exercise of put options are decreased by the premiums paid.
When the Portfolio writes an option, the premium received by the Portfolio is recorded as a liability and is subsequently adjusted to the current market value of the written option. The Portfolio’s maximum payment for written put options equates to the number of shares multiplied by the strike price. In certain circumstances maximum payout amounts may be partially offset by recovery values of the respective referenced assets and upfront premium received upon entering into the contract. Premiums received from written options which expire unexercised are recorded by the Portfolio on the expiration date as realized gains from written options. The difference between the premium received and the amount paid on effecting a closing purchase transaction, including brokerage commissions, is also treated as a realized gain, or if the premium received is less than the amount paid for the closing purchase transaction, as a realized loss. If a call option is exercised, the premium received is added to the proceeds from the sale of the underlying security or currency in determining whether the Portfolio has realized a gain or loss. If a put option is exercised, the premium received reduces the cost basis of the security or currency purchased by the Portfolio. In writing an option, the Portfolio bears the market risk of an unfavorable change in the price of the security or currency underlying the written option. Exercise of the written option by the Portfolio could result in the Portfolio selling or buying a security or currency at a price different from the current market value.
During the year ended December 31, 2024, the Portfolio held purchased options for hedging and non-hedging purposes.
During the year ended December 31, 2024, the Portfolio had entered into the following derivatives:
| | | | | | | | | | | | |
| | | Asset Derivatives | | | Liability Derivatives | |
Derivative Type | | Statement of Assets and Liabilities
Location | | Fair Value | | | Statement of Assets and Liabilities
Location | | Fair Value | |
Interest rate contracts | | | | | | | | Payable for variation margin on futures | | $ | 600,750 | * |
| | | | |
Equity contracts | | | | | | | | Payable for variation margin on futures | | | 591,018 | * |
| | | | |
Equity contracts | | Investments in securities, at value | | $ | 8,430,095 | | | | | | | |
| | | | | | | | | | | | |
Total | | | | $ | 8,430,095 | | | | | $ | 1,191,768 | |
| | | | | | | | | | | | |
| * | | Only variation margin receivable/payable at period end is reported within the statement of assets and liabilities. This amount reflects cumulative unrealized appreciation (depreciation) on futures and centrally cleared swaps as reported in the portfolio of investments. |
| | | | | | | | | | |
Derivative Type | | Location of Gain or (Loss) on Derivatives
Within Statement of Operations | | Realized Gain or
(Loss) on
Derivatives | | | Change in Unrealized
Appreciation or
(Depreciation) | |
Interest rate contracts | | Net realized gain (loss) on futures; Net change in unrealized appreciation (depreciation) of futures | | $ | (538,792 | ) | | $ | (3,004,439 | ) |
| | | |
Equity contracts | | Net realized gain (loss) on futures; Net change in unrealized appreciation (depreciation) of futures | | | 1,548,841 | | | | (1,559,954 | ) |
| | | |
Equity contracts | | Net realized gain (loss) on investment transactions; Net change in unrealized appreciation (depreciation) of investments | | | 2,907,209 | | | | (244,734 | ) |
| | | | | | | | | | |
Total | | | | $ | 3,917,258 | | | $ | (4,809,127 | ) |
| | | | | | | | | | |
13
| | |
| BALANCED HEDGED ALLOCATION PORTFOLIO |
| NOTES TO FINANCIAL STATEMENTS | | |
| |
| (continued) | | AB Variable Products Series Fund |
The following table represents the average monthly volume of the Portfolio’s derivative transactions during the year ended December 31, 2024:
| | | | |
Futures: | | | | |
Average notional amount of buy contracts | | $ | 73,122,412 | |
Average notional amount of sale contracts | | $ | 2,271,586 | (a) |
Purchased Options: | | | | |
Average notional amount | | $ | 92,024,615 | |
| (a) | | Positions were open for 10 months during the year. |
2. Currency Transactions
The Portfolio may invest in non-U.S. Dollar-denominated securities on a currency hedged or unhedged basis. The Portfolio may seek investment opportunities by taking long or short positions in currencies through the use of currency-related derivatives, including forward currency exchange contracts, futures and options on futures, swaps, and other options. The Portfolio may enter into transactions for investment opportunities when it anticipates that a foreign currency will appreciate or depreciate in value but securities denominated in that currency are not held by the Portfolio and do not present attractive investment opportunities. Such transactions may also be used when the Adviser believes that it may be more efficient than a direct investment in a foreign currency-denominated security. The Portfolio may also conduct currency exchange contracts on a spot basis (i.e., for cash at the spot rate prevailing in the currency exchange market for buying or selling currencies).
NOTE E: Securities Lending
The Portfolio may enter into securities lending transactions. Under the Portfolio’s securities lending program, all loans of securities will be collateralized continually by cash collateral and/or non-cash collateral. Non-cash collateral will include only securities issued or guaranteed by the U.S. government or its agencies or instrumentalities. If the Portfolio cannot sell or repledge any non-cash collateral, such collateral will not be reflected in the portfolio of investments. If a loan is collateralized by cash, the Portfolio will be compensated for the loan from a portion of the net return from the income earned on cash collateral after a rebate is paid to the borrower (in some cases, this rebate may be a “negative rebate” or fee paid by the borrower to the Portfolio in connection with the loan), and payments are made for fees of the securities lending agent and for certain other administrative expenses. If the Portfolio receives non-cash collateral, the Portfolio will receive a fee from the borrower generally equal to a negotiated percentage of the market value of the loaned securities. The Portfolio will have the right to call a loan and obtain the securities loaned at any time on notice to the borrower within the normal and customary settlement time for the securities. While the securities are on loan, the borrower is obligated to pay the Portfolio amounts equal to any dividend income or other distributions from the securities; however, these distributions will not be afforded the same preferential tax treatment as qualified dividends. The Portfolio will not be able to exercise voting rights with respect to any securities during the existence of a loan, but will have the right to regain ownership of loaned securities in order to exercise voting or other ownership rights. Collateral received and securities loaned are marked to market daily to ensure that the securities loaned are secured by collateral. The lending agent currently invests the cash collateral received in AB Government Money Market Portfolio, an eligible money market vehicle, in accordance with the investment restrictions of the Portfolio, and as approved by the Board. The collateral received on securities loaned is recorded as an asset as well as a corresponding liability in the statement of assets and liabilities. The collateral will be adjusted the next business day to maintain the required collateral amount. The amounts of securities lending income from the borrowers and AB Government Money Market Portfolio are reflected in the statement of operations. When the Portfolio earns net securities lending income from AB Government Money Market Portfolio, the income is inclusive of a rebate expense paid to the borrower. In connection with the cash collateral investment by the Portfolio in AB Government Money Market Portfolio, the Adviser has agreed to waive a portion of the Portfolio’s share of the advisory fees of AB Government Money Market Portfolio, as borne indirectly by the Portfolio as an acquired fund fee and expense. When the Portfolio lends securities, its investment performance will continue to reflect changes in the value of the securities loaned. A principal risk of lending portfolio securities is that the borrower may fail to return the loaned securities upon termination of the loan and that the collateral will not be sufficient to replace the loaned securities. The lending agent has agreed to indemnify the Portfolio in the case of default of any securities borrower.
14
| | |
| |
| | | AB Variable Products Series Fund |
A summary of the Portfolio’s transactions surrounding securities lending for the year ended December 31, 2024 is as follows:
| | | | | | | | | | | | | | | | | | | | | | |
| | | | | | | | | | | | | AB Government Money Market
Portfolio | |
Market Value of
Securities on Loan* | | | Cash Collateral* | | | Market Value of
Non-Cash
Collateral* | | | Income from
Borrowers | | | Income Earned | | | Advisory Fee
Waived | |
| $ | 11,706,815 | | | $ | 6,437,125 | | | $ | 5,485,627 | | | $ | 18,172 | | | $ | –0 | – | | $ | 3,463 | |
| * | | As of December 31, 2024. |
NOTE F: Capital Stock
Each class consists of 500,000,000 authorized shares. Transactions in capital shares for each class were as follows:
| | | | | | | | | | | | | | | | | | | | |
| | | SHARES | | | | | | AMOUNT | |
| | | Year Ended
December 31,
2024 | | | Year Ended
December 31,
2023 | | | | | | Year Ended
December 31,
2024 | | | Year Ended
December 31,
2023 | |
Class A | |
Shares sold | | | 83,454 | | | | 15,409 | | | | | | | $ | 745,767 | | | $ | 134,466 | |
Shares issued in reinvestment of dividends and distributions | | | 70,909 | | | | 117,766 | | | | | | | | 633,925 | | | | 978,634 | |
Shares redeemed | | | (276,002 | ) | | | (289,545 | ) | | | | | | | (2,489,227 | ) | | | (2,475,377 | ) |
| | | | | | | | | | | | | | | | | | | | |
Net decrease | | | (121,639 | ) | | | (156,370 | ) | | | | | | $ | (1,109,535 | ) | | $ | (1,362,277 | ) |
| | | | | | | | | | | | | | | | | | | | |
Class B | |
Shares sold | | | 447,965 | | | | 503,184 | | | | | | | $ | 4,013,635 | | | $ | 4,219,796 | |
Shares issued on reinvestment of dividends and distributions | | | 639,464 | | | | 1,163,245 | | | | | | | | 5,620,894 | | | | 9,515,346 | |
Shares redeemed | | | (3,631,685 | ) | | | (3,256,453 | ) | | | | | | | (32,611,374 | ) | | | (27,133,569 | ) |
| | | | | | | | | | | | | | | | | | | | |
Net decrease | | | (2,544,256 | ) | | | (1,590,024 | ) | | | | | | $ | (22,976,845 | ) | | $ | (13,398,427 | ) |
| | | | | | | | | | | | | | | | | | | | |
At December 31, 2024, certain shareholders of the Portfolio owned 70% in aggregate of the Portfolio’s outstanding shares. Significant transactions by such shareholders, if any, may impact the Portfolio’s performance.
NOTE G: Risks Involved in Investing in the Portfolio
Market Risk—The value of the Portfolio’s assets will fluctuate as the market or markets in which the Portfolio invests fluctuate. The value of the Portfolio’s investments may decline, sometimes rapidly and unpredictably, simply because of economic changes or other events, including public health crises (including the occurrence of a contagious disease or illness) and regional and global conflicts, that affect large portions of the market. It includes the risk that a particular style of investing may underperform the market generally.
Allocation Risk—The allocation of investments among the different investment styles, such as growth or value, equity or debt securities, or U.S. or non-U.S. securities may have a more significant effect on the Portfolio’s net asset value, or NAV, when one of these investment strategies is performing more poorly than others.
ETF Risk—ETFs, are investment companies and are subject to market and selection risk. When the Portfolio invests in an ETF, the Portfolio bears its share of the ETF’s expenses and runs the risk that the ETF may not achieve its investment objective.
Foreign (Non-U.S.) Risk—Investments in securities of non-U.S. issuers may involve more risk than those of U.S. issuers. These securities may fluctuate more widely in price and may be more difficult to trade due to adverse market, economic, political, regulatory or other factors.
Emerging Market Risk—Investments in emerging market countries may have more risk because the markets are less developed and less liquid, and because these investments may be subject to increased economic, political, regulatory or other uncertainties.
Currency Risk—Fluctuations in currency exchange rates may negatively affect the value of the Portfolio’s investments or reduce the Portfolio’s returns.
15
| | |
| BALANCED HEDGED ALLOCATION PORTFOLIO |
| NOTES TO FINANCIAL STATEMENTS | | |
| |
| (continued) | | AB Variable Products Series Fund |
Interest Rate Risk—Changes in interest rates will affect the value of investments in fixed-income securities. When interest rates rise, the value of existing investments in fixed-income securities tends to fall and this decrease in value may not be offset by higher income from new investments. Interest-rate risk is generally greater for fixed-income securities with longer maturities or durations. The Portfolio may be subject to a greater risk of rising interest rates than would normally be the case due to the recent end of a period of historically low rates and the effects of potential central bank monetary policy, and government fiscal policy, initiatives and market reactions to those initiatives.
Credit Risk—An issuer or guarantor of a fixed-income security, or the counterparty to a derivatives or other contract, may be unable or unwilling to make timely payments of interest or principal, or to otherwise honor its obligations. The issuer or guarantor may default, causing a loss of the full principal amount of a security and accrued interest. The degree of risk for a particular security may be reflected in its credit rating. There is the possibility that the credit rating of a fixed-income security may be downgraded after purchase, which may adversely affect the value of the security.
Below Investment-Grade Securities Risk—Investments in fixed-income securities with lower ratings (“junk bonds”) tend to have a higher probability that an issuer will default or fail to meet its payment obligations. These securities may be subject to greater price volatility due to such factors as specific corporate developments, interest rate sensitivity and negative perceptions of the junk bond market generally, and may be more difficult to trade than other types of securities.
Capitalization Risk—Investments in small- and mid-capitalization companies may be more volatile than investments in large-capitalization companies. Investments in small- and mid-capitalization companies may have additional risks because these companies have limited product lines, markets or financial resources.
Derivatives Risk—Derivatives may be difficult to price or unwind and leveraged so that small changes may produce disproportionate losses for the Portfolio. A short position in a derivative instrument involves the risk of a theoretically unlimited increase in the value of the underlying asset, reference rate or index, which could cause the Portfolio to suffer a potentially unlimited loss. Derivatives, especially over-the-counter derivatives, are also subject to counterparty risk, which is the risk that the counterparty (the party on the other side of the transaction) on a derivative transaction will be unable or unwilling to honor its contractual obligations to the Portfolio.
Real Assets Risk—The Portfolio’s investments in securities linked to real assets involve significant risks, including financial, operating, and competitive risks. Investments in securities linked to real assets expose the Portfolio to adverse macroeconomic conditions, such as a rise in interest rates or a downturn in the economy in which the asset is located. Changes in inflation rates or in the market’s inflation expectations may adversely affect the market value of inflation-sensitive equities. The Portfolio’s investments in real estate securities have many of the same risks as direct ownership of real estate, including the risk that the value of real estate could decline due to a variety of factors that affect the real estate market generally. Investments in real estate investment trusts, or REITs, may have additional risks. REITs are dependent on the capability of their managers, may have limited diversification, and could be significantly affected by changes in tax laws. Some REITs may utilize leverage, which increases investment risk and may potentially increase the Portfolio’s losses.
Indemnification Risk—In the ordinary course of business, the Portfolio enters into contracts that contain a variety of indemnifications. The Portfolio’s maximum exposure under these arrangements is unknown. However, the Portfolio has not had prior claims or losses pursuant to these indemnification provisions and expects the risk of loss thereunder to be remote. Therefore, the Portfolio has not accrued any liability in connection with these indemnification provisions.
Management Risk—The Portfolio is subject to management risk because it is an actively-managed investment fund. The Adviser will apply its investment techniques and risk analyses in making investment decisions for the Portfolio, but there is no guarantee that its techniques will produce the intended results. Some of these techniques may incorporate, or rely upon, quantitative models, but there is no guarantee that these models will generate accurate forecasts, reduce risk or otherwise perform as expected.
NOTE H: Joint Credit Facility
A number of open-end mutual funds managed by the Adviser, including the Portfolio, participate in a $325 million revolving credit facility (the “Facility”) intended to provide short-term financing related to redemptions and other short term liquidity requirements, subject to certain restrictions. Commitment fees related to the Facility are paid by the participating funds and are included in miscellaneous expenses in the statement of operations. The Portfolio did not utilize the Facility during the year ended December 31, 2024.
16
| | |
| |
| | | AB Variable Products Series Fund |
NOTE I: Distributions to Shareholders
The tax character of distributions paid during the fiscal year ended December 31, 2024 and December 31, 2023 were as follows:
| | | | | | | | |
| | | 2024 | | | 2023 | |
Distributions paid from: | | | | | | | | |
Ordinary income | | $ | 4,625,970 | | | $ | 1,598,559 | |
Net long-term capital gains | | | 1,628,849 | | | | 8,895,421 | |
| | | | | | | | |
Total taxable distributions paid | | $ | 6,254,819 | | | $ | 10,493,980 | |
| | | | | | | | |
As of December 31, 2024, the components of accumulated earnings (deficit) on a tax basis were as follows:
| | | | |
Undistributed ordinary income | | $ | 10,897,149 | |
Accumulated capital and other losses | | | (8,961,977 | )(a) |
Unrealized appreciation (depreciation) | | | 11,149,273 | (b) |
| | | | |
Total accumulated earnings (deficit) | | $ | 13,084,445 | |
| | | | |
| (a) | | As of December 31, 2024, the cumulative deferred loss on straddles was $8,961,977. |
| (b) | | The differences between book-basis and tax-basis unrealized appreciation (depreciation) are attributable primarily to the recognition for tax purposes of unrealized gains/losses on certain derivative instruments. |
For tax purposes, net realized capital losses may be carried over to offset future capital gains, if any. Funds are permitted to carry forward capital losses for an indefinite period, and such losses will retain their character as either short-term or long-term capital losses. As of December 31, 2024, the Portfolio did not have any capital loss carryforwards.
During the current fiscal year, there were no permanent differences that resulted in adjustments to distributable earnings or additional paid-in capital.
NOTE J: Subsequent Events
Management has evaluated subsequent events for possible recognition or disclosure in the financial statements through the date the financial statements are issued. Management has determined that there are no material events that would require disclosure in the Portfolio’s financial statements through this date.
17
| | |
|
| BALANCED HEDGED ALLOCATION PORTFOLIO |
| |
| FINANCIAL HIGHLIGHTS | | AB Variable Products Series Fund |
Selected Data For A Share Of Capital Stock Outstanding Throughout Each Period
| | | | | | | | | | | | | | | | | | | | |
| | | CLASS A | |
| | | Year Ended December 31, | |
| | | 2024 | | | 2023 | | | 2022 | | | 2021 | | | 2020 | |
Net asset value, beginning of period | | | $8.78 | | | | $8.28 | | | | $11.75 | | | | $10.61 | | | | $10.24 | |
| | | | | | | | | | | | | | | | | | | | |
| | | | | | | | | | | | | | | | | | | | |
Income From Investment Operations | | | | | | | | | | | | | | | | | | | | |
Net investment income(a)(b) | | | .18 | | | | .16 | | | | .15 | | | | .16 | | | | .13 | |
Net realized and unrealized gain (loss) on investment and foreign currency transactions | | | .59 | | | | .89 | | | | (2.25 | ) | | | 1.29 | | | | .78 | |
Contributions from Affiliates | | | –0 | – | | | –0 | – | | | .00 | (c) | | | .00 | (c) | | | –0 | – |
| | | | | | | | | | | | | | | | | | | | |
Net increase (decrease) in net asset value from operations | | | .77 | | | | 1.05 | | | | (2.10 | ) | | | 1.45 | | | | .91 | |
| | | | | | | | | | | | | | | | | | | | |
| | | | | | | | | | | | | | | | | | | | |
Less: Dividends and Distributions | | | | | | | | | | | | | | | | | | | | |
Dividends from net investment income | | | (.19 | ) | | | (.10 | ) | | | (.35 | ) | | | (.06 | ) | | | (.24 | ) |
Distributions from net realized gain on investment transactions | | | (.19 | ) | | | (.45 | ) | | | (1.02 | ) | | | (.25 | ) | | | (.30 | ) |
| | | | | | | | | | | | | | | | | | | | |
Total dividends and distributions | | | (.38 | ) | | | (.55 | ) | | | (1.37 | ) | | | (.31 | ) | | | (.54 | ) |
| | | | | | | | | | | | | | | | | | | | |
Net asset value, end of period | | | $9.17 | | | | $8.78 | | | | $8.28 | | | | $11.75 | | | | $10.61 | |
| | | | | | | | | | | | | | | | | | | | |
| | | | | | | | | | | | | | | | | | | | |
Total Return | | | | | | | | | | | | | | | | | | | | |
Total investment return based on net asset value(d)* | | | 8.84 | % | | | 13.04 | % | | | (18.99 | )% | | | 13.73 | % | | | 9.41 | % |
| | | | | | | | | | | | | | | | | | | | |
Ratios/Supplemental Data | | | | | | | | | | | | | | | | | | | | |
Net assets, end of period (000’s omitted) | | | $15,428 | | | | $15,843 | | | | $16,241 | | | | $21,879 | | | | $21,252 | |
Ratio to average net assets of: | | | | | | | | | | | | | | | | | | | | |
Expenses, net of waivers/reimbursements(e)‡ | | | .66 | % | | | .69 | % | | | .63 | % | | | .56 | % | | | .55 | % |
Expenses, before waivers/reimbursements(e)‡ | | | .67 | % | | | .70 | % | | | .71 | % | | | .75 | % | | | .77 | % |
Net investment income(b) | | | 1.97 | % | | | 1.92 | % | | | 1.50 | % | | | 1.43 | % | | | 1.38 | % |
Portfolio turnover rate | | | 6 | % | | | 4 | % | | | 135 | %** | | | 63 | %** | | | 66 | %** |
| | | | | | | | | | | | | | | | | | | | |
‡ Expense ratios exclude the estimated acquired fund fees of the affiliated/unaffiliated underlying | |
portfolios | | | .04 | % | | | .04 | % | | | .09 | % | | | .20 | % | | | .22 | % |
See footnote summary on page 20.
18
| | |
| BALANCED HEDGED ALLOCATION PORTFOLIO |
| FINANCIAL HIGHLIGHTS | | |
| |
| (continued) | | AB Variable Products Series Fund |
Selected Data For A Share Of Capital Stock Outstanding Throughout Each Period
| | | | | | | | | | | | | | | | | | | | |
| | | Class B | |
| | | Year Ended December 31, | |
| | | 2024 | | | 2023 | | | 2022 | | | 2021 | | | 2020 | |
Net asset value, beginning of period | | | $8.63 | | | | $8.15 | | | | $11.58 | | | | $10.47 | | | | $10.10 | |
| | | | | | | | | | | | | | | | | | | | |
| | | | | | | | | | | | | | | | | | | | |
Income From Investment Operations | | | | | | | | | | | | | | | | | | | | |
Net investment income(a)(b) | | | .15 | | | | .14 | | | | .12 | | | | .13 | | | | .11 | |
Net realized and unrealized gain (loss) on investment and foreign currency transactions | | | .58 | | | | .87 | | | | (2.22 | ) | | | 1.26 | | | | .78 | |
Contributions from Affiliates | | | –0 | – | | | –0 | – | | | .00 | (c) | | | .00 | (c) | | | –0 | – |
| | | | | | | | | | | | | | | | | | | | |
Net increase (decrease) in net asset value from operations | | | .73 | | | | 1.01 | | | | (2.10 | ) | | | 1.39 | | | | .89 | |
| | | | | | | | | | | | | | | | | | | | |
| | | | | | | | | | | | | | | | | | | | |
Less: Dividends and Distributions | | | | | | | | | | | | | | | | | | | | |
Dividends from net investment income | | | (.16 | ) | | | (.08 | ) | | | (.31 | ) | | | (.03 | ) | | | (.22 | ) |
Distributions from net realized gain on investment transactions | | | (.19 | ) | | | (.45 | ) | | | (1.02 | ) | | | (.25 | ) | | | (.30 | ) |
| | | | | | | | | | | | | | | | | | | | |
Total dividends and distributions | | | (.35 | ) | | | (.53 | ) | | | (1.33 | ) | | | (.28 | ) | | | (.52 | ) |
| | | | | | | | | | | | | | | | | | | | |
Net asset value, end of period | | | $9.01 | | | | $8.63 | | | | $8.15 | | | | $11.58 | | | | $10.47 | |
| | | | | | | | | | | | | | | | | | | | |
| | | | | | | | | | | | | | | | | | | | |
Total Return | | | | | | | | | | | | | | | | | | | | |
Total investment return based on net asset value(d)* | | | 8.58 | % | | | 12.66 | % | | | (19.17 | )% | | | 13.36 | % | | | 9.25 | % |
| | | | | | | | | | | | | | | | | | | | |
Ratios/Supplemental Data | | | | | | | | | | | | | | | | | | | | |
Net assets, end of period (000’s omitted) | | | $140,919 | | | | $156,998 | | | | $161,149 | | | | $223,893 | | | | $222,427 | |
Ratio to average net assets of: | | | | | | | | | | | | | | | | | | | | |
Expenses, net of waivers/reimbursements(e)‡ | | | .91 | % | | | .94 | % | | | .88 | % | | | .81 | % | | | .80 | % |
Expenses, before waivers/reimbursements(e)‡ | | | .92 | % | | | .95 | % | | | .96 | % | | | 1.00 | % | | | 1.02 | % |
Net investment income(b) | | | 1.71 | % | | | 1.66 | % | | | 1.24 | % | | | 1.20 | % | | | 1.14 | % |
Portfolio turnover rate | | | 6 | % | | | 4 | % | | | 135 | %** | | | 63 | %** | | | 66 | %** |
| | | | | | | | | | | | | | | | | | | | |
‡ Expense ratios exclude the estimated acquired fund fees of the affiliated/unaffiliated underlying | |
portfolios | | | .04 | % | | | .04 | % | | | .09 | % | | | .20 | % | | | .22 | % |
See footnote summary on page 20.
19
| | |
| BALANCED HEDGED ALLOCATION PORTFOLIO |
| FINANCIAL HIGHLIGHTS | | |
| |
| (continued) | | AB Variable Products Series Fund |
| (a) | | Based on average shares outstanding. |
| (b) | | Net of expenses waived/reimbursed by the Adviser. |
| (c) | | Amount is less than $.005. |
| (d) | | Total investment return is calculated assuming an initial investment made at the net asset value at the beginning of the period, reinvestment of all dividends and distributions at net asset value during the period, and redemption on the last day of the period. Total investment return does not reflect (i) insurance company’s separate account related expense charges and (ii) the deductions of taxes that a shareholder would pay on Portfolio distributions or the redemption of Portfolio shares. Total investment return calculated for a period of less than one year is not annualized. |
| (e) | | In connection with the Portfolio’s investments in affiliated underlying portfolios, the Portfolio incurs no direct expenses, but bears proportionate shares of the fees and expenses (i.e., operating, administrative and investment advisory fees) of the affiliated underlying portfolios. The Adviser has contractually agreed to waive its fees from the Portfolio in an amount equal to the Portfolio’s pro rata share of certain acquired fund fees and expenses, and for the years ended December 31, 2024, December 31, 2023, December 31, 2022, December 31, 2021 and December 31, 2020, such waiver amounted to .01%, .01%, .08%, .19% and .20%, respectively. |
| * | | Includes the impact of proceeds received and credited to the Portfolio resulting from class action settlements, which enhanced the Portfolio’s performance for the years ended December 31, 2024 and December 31, 2022 by .10% and .02%, respectively. |
| ** | | The Portfolio accounts for dollar roll transactions as purchases and sales. |
See notes to financial statements.
20
| | |
| | |
| REPORT OF INDEPENDENT REGISTERED |
| |
| PUBLIC ACCOUNTING FIRM | | AB Variable Products Series Fund |
To the Shareholders and the Board of Directors of AB Balanced Hedged Allocation Portfolio
Opinion on the Financial Statements
We have audited the accompanying statement of assets and liabilities of AB Balanced Hedged Allocation Portfolio (the “Portfolio”) (one of the series constituting AB Variable Products Series Fund, Inc. (the “Fund”)), including the portfolio of investments, as of December 31, 2024, and the related statement of operations for the year then ended, the statements of changes in net assets for each of the two years in the period then ended, the financial highlights for each of the five years in the period then ended and the related notes (collectively referred to as the “financial statements”). In our opinion, the financial statements present fairly, in all material respects, the financial position of the Portfolio (one of the series constituting AB Variable Products Series Fund, Inc.) at December 31, 2024, the results of its operations for the year then ended, the changes in its net assets for each of the two years in the period then ended and its financial highlights for each of the five years in the period then ended, in conformity with U.S. generally accepted accounting principles.
Basis for Opinion
These financial statements are the responsibility of the Fund’s management. Our responsibility is to express an opinion on the Portfolio’s financial statements based on our audits. We are a public accounting firm registered with the Public Company Accounting Oversight Board (United States) (“PCAOB”) and are required to be independent with respect to the Fund in accordance with the U.S. federal securities laws and the applicable rules and regulations of the Securities and Exchange Commission and the PCAOB.
We conducted our audits in accordance with the standards of the PCAOB. Those standards require that we plan and perform the audit to obtain reasonable assurance about whether the financial statements are free of material misstatement, whether due to error or fraud. The Fund is not required to have, nor were we engaged to perform, an audit of the Fund’s internal control over financial reporting. As part of our audits, we are required to obtain an understanding of internal control over financial reporting but not for the purpose of expressing an opinion on the effectiveness of the Fund’s internal control over financial reporting. Accordingly, we express no such opinion.
Our audits included performing procedures to assess the risks of material misstatement of the financial statements, whether due to error or fraud, and performing procedures that respond to those risks. Such procedures included examining, on a test basis, evidence regarding the amounts and disclosures in the financial statements. Our procedures included confirmation of securities owned as of December 31, 2024, by correspondence with the custodian, brokers and others; when replies were not received from brokers or others, we performed other auditing procedures. Our audits also included evaluating the accounting principles used and significant estimates made by management, as well as evaluating the overall presentation of the financial statements. We believe that our audits provide a reasonable basis for our opinion.

We have served as the auditor of one or more of the AB investment companies since 1968.
New York, New York
February 14, 2025
21
| | |
| | |
| | |
| |
| 2024 TAX INFORMATION (unaudited) | | AB Variable Products Series Fund |
For Federal income tax purposes, the following information is furnished with respect to the distributions paid by the Portfolio during the taxable year ended December 31, 2024. For corporate shareholders, 17.10% of dividends paid qualify for the dividends received deduction. The Portfolio designates $1,628,849 of dividends paid as long-term capital gain dividends.
22
| | |
| | |
| | |
| |
| BALANCED HEDGED ALLOCATION PORTFOLIO | | AB Variable Products Series Fund |
INFORMATION REGARDING THE REVIEW AND APPROVAL OF THE FUND’S ADVISORY AGREEMENT
The disinterested directors (the “directors”) of AB Variable Products Series Fund, Inc. (the “Company”) unanimously approved the continuance of the Company’s Advisory Agreement with the Adviser in respect of AB Balanced Hedged Allocation Portfolio (the “Fund”) at a meeting held in-person on November 5-7, 2024 (the “Meeting”).
Prior to approval of the continuance of the Advisory Agreement, the directors had requested from the Adviser, and received and evaluated, extensive materials. They reviewed the proposed continuance of the Advisory Agreement with the Adviser and with experienced counsel who are independent of the Adviser, who advised on the relevant legal standards. The directors also reviewed additional materials, including comparative analytical data prepared by the Senior Vice President of the Fund. The directors also discussed the proposed continuance in private sessions with counsel.
The directors considered their knowledge of the nature and quality of the services provided by the Adviser to the Fund gained from their experience as directors or trustees of most of the registered investment companies advised by the Adviser, their overall confidence in the Adviser’s integrity and competence they have gained from that experience, the Adviser’s initiative in identifying and raising potential issues with the directors and its responsiveness, frankness and attention to concerns raised by the directors in the past, including the Adviser’s willingness to consider and implement organizational and operational changes designed to improve investment results and the services provided to the AB Funds. The directors noted that they have four regular meetings each year, at each of which they review extensive materials and information from the Adviser, including information on the investment performance of the Fund and the money market fund advised by the Adviser in which the Fund invests a portion of its assets.
The directors also considered all factors they believed relevant, including the specific matters discussed below. During the course of their deliberations, the directors evaluated, among other things, the reasonableness of the advisory fee. The directors did not identify any particular information that was all-important or controlling, and different directors may have attributed different weights to the various factors. The directors determined that the selection of the Adviser to manage the Fund and the overall arrangements between the Fund and the Adviser, as provided in the Advisory Agreement, including the advisory fee, were fair and reasonable in light of the services performed, expenses incurred and such other matters as the directors considered relevant in the exercise of their business judgment. The material factors and conclusions that formed the basis for the directors’ determinations included the following:
Nature, Extent and Quality of Services Provided
The directors considered the scope and quality of services provided by the Adviser under the Advisory Agreement, including the quality of the investment research capabilities of the Adviser and the other resources it has dedicated to performing services for the Fund. The directors noted that the Adviser from time to time reviews the Fund’s investment strategies and from time to time proposes changes intended to improve the Fund’s relative or absolute performance for the directors’ consideration. They also noted the professional experience and qualifications of the Fund’s portfolio management team and other senior personnel of the Adviser. The directors also considered that the Advisory Agreement provides that the Fund will reimburse the Adviser for the cost to it of providing certain clerical, accounting, administrative and other services to the Fund by employees of the Adviser or its affiliates. Requests for these reimbursements are made on a quarterly basis and subject to approval by the directors. Reimbursements, to the extent requested and paid, result in a higher rate of total compensation from the Fund to the Adviser than the fee rate stated in the Advisory Agreement. The directors noted that the methodology used to determine the reimbursement amounts had been reviewed by an independent consultant at the request of the directors. The quality of administrative and other services, including the Adviser’s role in coordinating the activities of the Fund’s other service providers, also was considered. The directors concluded that, overall, they were satisfied with the nature, extent and quality of services provided to the Fund under the Advisory Agreement.
Costs of Services Provided and Profitability
The directors reviewed a schedule of the revenues and expenses and related notes indicating the profitability of the Fund to the Adviser for calendar years 2022 and 2023 that had been prepared with an expense allocation methodology arrived at in consultation with an independent consultant at the request of the directors. The directors noted the assumptions and methods of allocation used by the Adviser in preparing fund-specific profitability data and understood that there are a number of potentially acceptable allocation methodologies for information of this type. The directors noted that the profitability information reflected all revenues and expenses of the Adviser’s relationship with the Fund, including those relating to its subsidiaries that provide transfer agency, distribution and brokerage services to the Fund. The directors recognized that it is difficult to make comparisons of the profitability of the Advisory Agreement with the profitability of fund advisory contracts
23
| | |
|
| BALANCED HEDGED ALLOCATION PORTFOLIO |
| |
| (continued) | | AB Variable Products Series Fund |
for unaffiliated funds because comparative information is not generally publicly available and is affected by numerous factors. The directors focused on the profitability of the Adviser’s relationship with the Fund before taxes and distribution expenses. The directors noted that the Fund was not profitable to the Adviser in the periods reviewed.
Fall-Out Benefits
The directors considered the other benefits to the Adviser and its affiliates from their relationships with the Fund and the money market fund advised by the Adviser in which the Fund invests, including, but not limited to, benefits relating to soft dollar arrangements (whereby investment advisers receive brokerage and research services from brokers that execute agency transactions for their clients); 12b-1 fees and sales charges received by the Fund’s principal underwriter (which is a wholly owned subsidiary of the Adviser) in respect of the Fund’s Class B shares; brokerage commissions paid by the Fund to brokers affiliated with the Adviser; and transfer agency fees paid by the Fund to a wholly owned subsidiary of the Adviser. The directors recognized that the Fund’s unprofitability to the Adviser would be exacerbated without these benefits. The directors understood that the Adviser also might derive reputational and other benefits from its association with the Fund.
Investment Results
In addition to the information reviewed by the directors in connection with the Meeting, the directors receive detailed performance information for the Fund at each regular Board meeting during the year.
At the Meetings, the directors reviewed performance information prepared by an independent service provider (the “15(c) service provider”), showing the performance of the Class A shares of the Fund against a group of similar funds (“peer group”) and a larger group of similar funds (“peer universe”), each selected by the 15(c) service provider, and information prepared by the Adviser showing performance of the Class A shares against a broad-based securities market index, in each case for the 1-, 3-, 5- and 10-year periods July 31, 2024 and (in the case of comparisons with the broad-based securities market index) for the period from inception. Based on their review, the directors concluded that the Fund’s investment performance was acceptable.
Advisory Fees and Other Expenses
The directors considered the advisory fee rate payable by the Fund to the Adviser and information prepared by the 15(c) service provider concerning advisory fee rates payable by other funds in the same category as the Fund. The directors recognized that it is difficult to make comparisons of advisory fees because there are variations in the services that are included in the fees paid by other funds. The directors compared the Fund’s contractual effective advisory fee rate with a peer group median and noted that it was lower than the median. They also noted that the Adviser’s total rate of compensation, taking into account the impact of the administrative expense reimbursement paid to the Adviser in the latest fiscal year, was equal to the median.
The directors considered the schedule of fees charged by the Adviser for services to any sub-advised funds utilizing investment strategies similar to those of the Fund.
In connection with their review of the Fund’s advisory fee, the directors also considered the total expense ratio of the Class B shares of the Fund in comparison to the medians for a peer group and a peer universe selected by the 15(c) service provider. The Class B expense ratio of the Fund was based on the Fund’s latest fiscal year. The Adviser had agreed to cap the Fund’s expenses, and the directors note that the Fund’s expense ratio was currently close to the level of the Adviser’s cap. The directors noted that it was likely that the expense ratios of some of the other funds in the Fund’s category were lowered by waivers or reimbursements by those funds’ investment advisers, which in some cases might be voluntary or temporary. The directors view expense ratio information as relevant to their evaluation of the Adviser’s services because the Adviser is responsible for coordinating services provided to the Fund by others. The directors noted that the Fund’s expense ratio was above the medians. After reviewing and discussing the Adviser’s explanation for this, the directors concluded that the Fund’s expense ratio was acceptable.
Economies of Scale
The directors noted that the advisory fee schedule for the Fund contains breakpoints that reduce the fee rates on assets above specified levels. The directors took into consideration prior presentations by an independent consultant on economies of scale in the mutual fund industry and for the AB Funds, and presentations from time to time by the Adviser concerning certain of its views on economies of scale. The directors also had requested and received from the Adviser certain updates on economies of scale in advance of the Meeting. The directors believe that economies of scale may be realized (if at all) by the Adviser across a variety of products and services, and not only in respect of a single fund. The directors noted that there is no
24
| | |
| |
| | | AB Variable Products Series Fund |
established methodology for setting breakpoints that give effect to the fund-specific services provided by a fund’s adviser and to the economies of scale that an adviser may realize in its overall mutual fund business or those components of it which directly or indirectly affect a fund’s operations. The directors observed that in the mutual fund industry as a whole, as well as among funds similar to the Fund, there is no uniformity or pattern in the fees and asset levels at which breakpoints (if any) apply. The directors also noted that the advisory agreements for many funds do not have breakpoints at all. Having taken these factors into account, the directors concluded that the Fund’s shareholders would benefit from a sharing of economies of scale in the event the Fund’s net assets exceed a breakpoint in the future.
25
VPS-BHA-0151-1224
DEC 12.31.24

ANNUAL FINANCIAL STATEMENTS AND ADDITIONAL INFORMATION
AB VARIABLE PRODUCTS SERIES FUND, INC.
| + | | AB DYNAMIC ASSET ALLOCATION PORTFOLIO |
Investment Products Offered
| | • | | Are Not Bank Guaranteed |
AllianceBernstein Investments, Inc. (ABI) is the distributor of the AB family of mutual funds. ABI is a member of FINRA and is an affiliate of AllianceBernstein L.P., the Adviser of the funds.
You may obtain a description of the Fund’s proxy voting policies and procedures, and information regarding how the Fund voted proxies relating to portfolio securities during the most recent 12-month period ended June 30, without charge. Simply visit AB’s website at www.abfunds.com or go to the Securities and Exchange Commission’s (the “Commission”) website at www.sec.gov, or call AB at (800) 227 4618.
The Fund files its complete schedule of portfolio holdings with the Commission for the first and third quarters of each fiscal year as an exhibit to its reports on Form N-PORT. The Fund’s Form N-PORT reports are available on the Commission’s website at www.sec.gov.
The [A/B] logo and AllianceBernstein® are registered trademarks used by permission of the owner, AllianceBernstein L.P.
| | |
| DYNAMIC ASSET ALLOCATION PORTFOLIO |
| PORTFOLIO OF INVESTMENTS | | |
| |
| December 31, 2024 | | AB Variable Products Series Fund |
| | | | | | | | | | | | |
| Company | | | | | Shares | | | U.S. $ Value | |
| | | | | | | | | | | | |
COMMON STOCKS–64.7% | | | | | | | | | | | | |
| | | | | | | | | | | | |
INFORMATION TECHNOLOGY–17.0% | | | | | | | | | | | | |
COMMUNICATIONS EQUIPMENT–0.5% | | | | | | | | | | | | |
Arista Networks, Inc.(a) | | | | | | | 2,488 | | | $ | 274,999 | |
Cisco Systems, Inc. | | | | | | | 9,298 | | | | 550,442 | |
F5, Inc.(a) | | | | | | | 136 | | | | 34,200 | |
Juniper Networks, Inc. | | | | | | | 767 | | | | 28,724 | |
Motorola Solutions, Inc. | | | | | | | 389 | | | | 179,807 | |
Nokia Oyj | | | | | | | 12,429 | | | | 54,979 | |
Telefonaktiebolaget LM Ericsson–Class B | | | | | | | 6,474 | | | | 52,429 | |
| | | | | | | | | | | | |
| | | | | | | | | | | 1,175,580 | |
| | | | | | | | | | | | |
ELECTRONIC EQUIPMENT, INSTRUMENTS & COMPONENTS–0.4% | | | | | | | | | | | | |
Amphenol Corp.–Class A | | | | | | | 2,806 | | | | 194,877 | |
CDW Corp./DE | | | | | | | 311 | | | | 54,126 | |
Corning, Inc. | | | | | | | 1,895 | | | | 90,050 | |
Halma PLC | | | | | | | 885 | | | | 29,691 | |
Hexagon AB–Class B | | | | | | | 4,839 | | | | 46,200 | |
Jabil, Inc. | | | | | | | 264 | | | | 37,990 | |
Keyence Corp. | | | | | | | 487 | | | | 197,952 | |
Keysight Technologies, Inc.(a) | | | | | | | 404 | | | | 64,894 | |
Kyocera Corp. | | | | | | | 3,036 | | | | 30,092 | |
Murata Manufacturing Co., Ltd. | | | | | | | 3,951 | | | | 62,682 | |
Omron Corp. | | | | | | | 453 | | | | 15,253 | |
Shimadzu Corp. | | | | | | | 578 | | | | 16,177 | |
TDK Corp. | | | | | | | 4,510 | | | | 58,082 | |
TE Connectivity PLC | | | | | | | 711 | | | | 101,652 | |
Teledyne Technologies, Inc.(a) | | | | | | | 109 | | | | 50,590 | |
Trimble, Inc.(a) | | | | | | | 569 | | | | 40,206 | |
Yaskawa Electric Corp. | | | | | | | 507 | | | | 12,939 | |
Yokogawa Electric Corp. | | | | | | | 534 | | | | 11,358 | |
Zebra Technologies Corp.–Class A(a) | | | | | | | 120 | | | | 46,346 | |
| | | | | | | | | | | | |
| | | | | | | | | | | 1,161,157 | |
| | | | | | | | | | | | |
IT SERVICES–0.9% | | | | | | | | | | | | |
Accenture PLC–Class A | | | | | | | 1,456 | | | | 512,206 | |
Akamai Technologies, Inc.(a) | | | | | | | 353 | | | | 33,764 | |
Bechtle AG | | | | | | | 191 | | | | 6,126 | |
Capgemini SE | | | | | | | 362 | | | | 59,125 | |
CGI, Inc. | | | | | | | 475 | | | | 51,973 | |
Cognizant Technology Solutions Corp.–Class A | | | | | | | 1,155 | | | | 88,819 | |
EPAM Systems, Inc.(a) | | | | | | | 133 | | | | 31,098 | |
Fujitsu Ltd. | | | | | | | 3,910 | | | | 68,685 | |
Gartner, Inc.(a) | | | | | | | 180 | | | | 87,205 | |
GoDaddy, Inc.–Class A(a) | | | | | | | 329 | | | | 64,935 | |
International Business Machines Corp. | | | | | | | 2,146 | | | | 471,755 | |
| | | | | | | | | | | | |
| Company | | | | | Shares | | | U.S. $ Value | |
| | | | | | | | | | | | |
MongoDB, Inc.(a) | | | | | | | 172 | | | $ | 40,043 | |
NEC Corp. | | | | | | | 609 | | | | 52,116 | |
Nomura Research Institute Ltd. | | | | | | | 854 | | | | 25,075 | |
NTT Data Group Corp. | | | | | | | 1,422 | | | | 27,039 | |
Obic Co., Ltd. | | | | | | | 705 | | | | 20,980 | |
Okta, Inc.(a) | | | | | | | 379 | | | | 29,865 | |
Otsuka Corp. | | | | | | | 560 | | | | 12,807 | |
SCSK Corp. | | | | | | | 392 | | | | 8,205 | |
Shopify, Inc.–Class A(a)(b) | | | | | | | 2,825 | | | | 300,669 | |
Snowflake, Inc.–Class A(a) | | | | | | | 703 | | | | 108,550 | |
TIS, Inc. | | | | | | | 494 | | | | 11,668 | |
Twilio, Inc.–Class A(a) | | | | | | | 356 | | | | 38,476 | |
VeriSign, Inc.(a) | | | | | | | 205 | | | | 42,427 | |
Wix.com Ltd.(a) | | | | | | | 123 | | | | 26,390 | |
| | | | | | | | | | | | |
| | | | | | | | | | | 2,220,001 | |
| | | | | | | | | | | | |
SEMICONDUCTORS & SEMICONDUCTOR EQUIPMENT–5.9% | | | | | | | | | | | | |
Advanced Micro Devices, Inc.(a) | | | | | | | 3,771 | | | | 455,499 | |
Advantest Corp. | | | | | | | 1,808 | | | | 102,801 | |
Analog Devices, Inc. | | | | | | | 1,157 | | | | 245,816 | |
Applied Materials, Inc. | | | | | | | 1,921 | | | | 312,412 | |
ASM International NV | | | | | | | 109 | | | | 63,022 | |
ASML Holding NV(b) | | | | | | | 931 | | | | 652,104 | |
BE Semiconductor Industries NV(b) | | | | | | | 180 | | | | 24,672 | |
Broadcom, Inc. | | | | | | | 10,337 | | | | 2,396,530 | |
Disco Corp. | | | | | | | 231 | | | | 61,279 | |
Enphase Energy, Inc.(a) | | | | | | | 316 | | | | 21,703 | |
Entegris, Inc.(b) | | | | | | | 352 | | | | 34,869 | |
First Solar, Inc.(a) | | | | | | | 237 | | | | 41,769 | |
Infineon Technologies AG | | | | | | | 3,044 | | | | 99,361 | |
Intel Corp. | | | | | | | 9,962 | | | | 199,738 | |
KLA Corp. | | | | | | | 312 | | | | 196,597 | |
Kokusai Electric Corp.(b) | | | | | | | 400 | | | | 5,242 | |
Lam Research Corp. | | | | | | | 3,020 | | | | 218,135 | |
Lasertec Corp. | | | | | | | 171 | | | | 16,030 | |
Marvell Technology, Inc. | | | | | | | 2,018 | | | | 222,888 | |
Microchip Technology, Inc. | | | | | | | 1,259 | | | | 72,204 | |
Micron Technology, Inc. | | | | | | | 2,583 | | | | 217,385 | |
Monolithic Power Systems, Inc. | | | | | | | 114 | | | | 67,454 | |
NVIDIA Corp. | | | | | | | 57,150 | | | | 7,674,673 | |
NXP Semiconductors NV | | | | | | | 594 | | | | 123,463 | |
ON Semiconductor Corp.(a) | | | | | | | 998 | | | | 62,924 | |
Qorvo, Inc.(a) | | | | | | | 221 | | | | 15,455 | |
QUALCOMM, Inc. | | | | | | | 2,595 | | | | 398,644 | |
Renesas Electronics Corp.(a) | | | | | | | 3,917 | | | | 49,570 | |
SCREEN Holdings Co., Ltd. | | | | | | | 200 | | | | 11,807 | |
Skyworks Solutions, Inc. | | | | | | | 372 | | | | 32,989 | |
STMicroelectronics NV | | | | | | | 1,593 | | | | 39,900 | |
Teradyne, Inc. | | | | | | | 380 | | | | 47,850 | |
Texas Instruments, Inc. | | | | | | | 2,127 | | | | 398,834 | |
Tokyo Electron Ltd. | | | | | | | 1,090 | | | | 163,848 | |
| | | | | | | | | | | | |
| | | | | | | | | | | 14,747,467 | |
| | | | | | | | | | | | |
1
| | |
| DYNAMIC ASSET ALLOCATION PORTFOLIO |
| PORTFOLIO OF INVESTMENTS | | |
| |
| (continued) | | AB Variable Products Series Fund |
| | | | | | | | | | | | |
| Company | | | | | Shares | | | U.S. $ Value | |
| | | | | | | | | | | | |
SOFTWARE–5.5% | | | | | | | | | | | | |
Adobe, Inc.(a) | | | | | | | 1,026 | | | $ | 456,242 | |
ANSYS, Inc.(a) | | | | | | | 204 | | | | 68,815 | |
AppLovin Corp.–Class A(a) | | | | | | | 485 | | | | 157,058 | |
Aspen Technology, Inc.(a) | | | | | | | 66 | | | | 16,476 | |
Atlassian Corp., Ltd.–Class A(a) | | | | | | | 373 | | | | 90,781 | |
Autodesk, Inc.(a) | | | | | | | 501 | | | | 148,081 | |
Bentley Systems, Inc.–Class B | | | | | | | 372 | | | | 17,372 | |
Cadence Design Systems, Inc.(a) | | | | | | | 638 | | | | 191,693 | |
Check Point Software Technologies Ltd.(a) | | | | | | | 205 | | | | 38,274 | |
Cloudflare, Inc.–Class A(a) | | | | | | | 709 | | | | 76,345 | |
Coinbase Global, Inc.–Class A(a) | | | | | | | 449 | | | | 111,487 | |
Constellation Software, Inc./Canada | | | | | | | 47 | | | | 145,334 | |
Crowdstrike Holdings, Inc.–Class A(a) | | | | | | | 542 | | | | 185,451 | |
CyberArk Software Ltd.(a) | | | | | | | 101 | | | | 33,648 | |
Dassault Systemes SE | | | | | | | 1,560 | | | | 53,982 | |
Datadog, Inc.–Class A(a) | | | | | | | 654 | | | | 93,450 | |
Descartes Systems Group, Inc. (The)(a) | | | | | | | 199 | | | | 22,621 | |
DocuSign, Inc.(a) | | | | | | | 473 | | | | 42,542 | |
Fair Isaac Corp.(a) | | | | | | | 57 | | | | 113,483 | |
Fortinet, Inc.(a) | | | | | | | 1,515 | | | | 143,137 | |
Gen Digital, Inc. | | | | | | | 1,291 | | | | 35,348 | |
HubSpot, Inc.(a) | | | | | | | 114 | | | | 79,432 | |
Intuit, Inc. | | | | | | | 653 | | | | 410,410 | |
Manhattan Associates, Inc.(a) | | | | | | | 143 | | | | 38,644 | |
Microsoft Corp. | | | | | | | 16,452 | | | | 6,934,518 | |
MicroStrategy, Inc.–Class A(a) | | | | | | | 426 | | | | 123,378 | |
Monday.com Ltd.(a) | | | | | | | 87 | | | | 20,483 | |
Nemetschek SE | | | | | | | 135 | | | | 13,114 | |
Nice Ltd.(a) | | | | | | | 146 | | | | 24,794 | |
Nutanix, Inc.–Class A(a) | | | | | | | 587 | | | | 35,913 | |
Open Text Corp. | | | | | | | 619 | | | | 17,518 | |
Oracle Corp. | | | | | | | 3,874 | | | | 645,563 | |
Oracle Corp. Japan | | | | | | | 42 | | | | 4,020 | |
Palantir Technologies, Inc.–Class A(a) | | | | | | | 4,742 | | | | 358,637 | |
Palo Alto Networks, Inc.(a) | | | | | | | 1,518 | | | | 276,215 | |
PTC, Inc.(a) | | | | | | | 280 | | | | 51,484 | |
Roper Technologies, Inc. | | | | | | | 250 | | | | 129,962 | |
Sage Group PLC (The) | | | | | | | 2,342 | | | | 37,211 | |
Salesforce, Inc. | | | | | | | 2,227 | | | | 744,553 | |
Samsara, Inc.–Class A(a) | | | | | | | 509 | | | | 22,238 | |
SAP SE | | | | | | | 2,433 | | | | 598,455 | |
ServiceNow, Inc.(a) | | | | | | | 480 | | | | 508,858 | |
Synopsys, Inc.(a) | | | | | | | 358 | | | | 173,759 | |
Temenos AG (REG) | | | | | | | 131 | | | | 9,257 | |
Trend Micro, Inc./Japan | | | | | | | 289 | | | | 15,581 | |
Tyler Technologies, Inc.(a) | | | | | | | 99 | | | | 57,087 | |
| | | | | | | | | | | | |
| Company | | | | | Shares | | | U.S. $ Value | |
| | | | | | | | | | | | |
WiseTech Global Ltd. | | | | | | | 429 | | | $ | 32,026 | |
Workday, Inc.–Class A(a) | | | | | | | 496 | | | | 127,983 | |
Xero Ltd.(a) | | | | | | | 338 | | | | 35,173 | |
Zoom Communications, Inc.–Class A(a) | | | | | | | 580 | | | | 47,334 | |
Zscaler, Inc.(a) | | | | | | | 213 | | | | 38,427 | |
| | | | | | | | | | | | |
| | | | | | | | | | | 13,853,647 | |
| | | | | | | | | | | | |
TECHNOLOGY HARDWARE, STORAGE & PERIPHERALS–3.8% | | | | | | | | | | | | |
Apple, Inc. | | | | | | | 35,422 | | | | 8,870,377 | |
Brother Industries Ltd. | | | | | | | 585 | | | | 9,896 | |
Canon, Inc. | | | | | | | 2,211 | | | | 71,817 | |
Dell Technologies, Inc.–Class C | | | | | | | 739 | | | | 85,162 | |
FUJIFILM Holdings Corp. | | | | | | | 2,627 | | | | 54,352 | |
Hewlett Packard Enterprise Co. | | | | | | | 3,027 | | | | 64,627 | |
HP, Inc. | | | | | | | 2,246 | | | | 73,287 | |
Logitech International SA (REG) | | | | | | | 354 | | | | 29,221 | |
NetApp, Inc. | | | | | | | 477 | | | | 55,370 | |
Pure Storage, Inc.–Class A(a) | | | | | | | 726 | | | | 44,598 | |
Ricoh Co., Ltd. | | | | | | | 1,272 | | | | 14,446 | |
Seagate Technology Holdings PLC | | | | | | | 491 | | | | 42,378 | |
Seiko Epson Corp. | | | | | | | 692 | | | | 12,486 | |
Super Micro Computer, Inc.(a) | | | | | | | 1,228 | | | | 37,429 | |
Western Digital Corp.(a) | | | | | | | 806 | | | | 48,062 | |
| | | | | | | | | | | | |
| | | | | | | | | | | 9,513,508 | |
| | | | | | | | | | | | |
| | | | | | | | | | | 42,671,360 | |
| | | | | | | | | | | | |
FINANCIALS–10.3% | | | | | | | | | | | | |
BANKS–3.8% | | | | | | | | | | | | |
ABN AMRO Bank NV(b) | | | | | | | 1,068 | | | | 16,481 | |
AIB Group PLC | | | | | | | 4,341 | | | | 24,005 | |
ANZ Group Holdings Ltd. | | | | | | | 6,940 | | | | 122,281 | |
Banco Bilbao Vizcaya Argentaria SA | | | | | | | 13,431 | | | | 131,415 | |
Banco BPM SpA(b) | | | | | | | 3,001 | | | | 24,298 | |
Banco de Sabadell SA | | | | | | | 12,677 | | | | 24,635 | |
Banco Santander SA | | | | | | | 36,104 | | | | 167,026 | |
Bank Hapoalim BM | | | | | | | 2,946 | | | | 35,565 | |
Bank Leumi Le-Israel BM | | | | | | | 3,514 | | | | 41,807 | |
Bank of America Corp. | | | | | | | 16,271 | | | | 715,110 | |
Bank of Ireland Group PLC | | | | | | | 2,340 | | | | 21,339 | |
Bank of Montreal | | | | | | | 1,700 | | | | 165,039 | |
Bank of Nova Scotia (The) | | | | | | | 2,883 | | | | 154,815 | |
Banque Cantonale Vaudoise (REG) | | | | | | | 70 | | | | 6,445 | |
Barclays PLC | | | | | | | 33,870 | | | | 113,302 | |
BNP Paribas SA | | | | | | | 2,372 | | | | 145,633 | |
BOC Hong Kong Holdings Ltd. | | | | | | | 8,531 | | | | 27,241 | |
BPER Banca SPA | | | | | | | 2,319 | | | | 14,790 | |
2
| | |
| |
| | | AB Variable Products Series Fund |
| | | | | | | | | | | | |
| Company | | | | | Shares | | | U.S. $ Value | |
| | | | | | | | | | | | |
CaixaBank SA | | | | | | | 9,316 | | | $ | 50,578 | |
Canadian Imperial Bank of Commerce(b) | | | | | | | 2,198 | | | | 139,041 | |
Chiba Bank Ltd. (The) | | | | | | | 1,314 | | | | 10,128 | |
Citigroup, Inc. | | | | | | | 4,445 | | | | 312,884 | |
Citizens Financial Group, Inc. | | | | | | | 1,045 | | | | 45,729 | |
Commerzbank AG | | | | | | | 2,209 | | | | 36,277 | |
Commonwealth Bank of Australia(b) | | | | | | | 3,899 | | | | 368,928 | |
Concordia Financial Group Ltd.(b) | | | | | | | 2,421 | | | | 13,314 | |
Credit Agricole SA | | | | | | | 2,481 | | | | 34,137 | |
Danske Bank A/S | | | | | | | 1,608 | | | | 45,591 | |
DBS Group Holdings Ltd. | | | | | | | 4,592 | | | | 147,153 | |
DNB Bank ASA | | | | | | | 2,087 | | | | 41,666 | |
Erste Group Bank AG | | | | | | | 785 | | | | 48,588 | |
Fifth Third Bancorp | | | | | | | 1,577 | | | | 66,676 | |
FinecoBank Banca Fineco SpA | | | | | | | 1,424 | | | | 24,853 | |
First Citizens BancShares, Inc./NC–Class A | | | | | | | 24 | | | | 50,712 | |
Hang Seng Bank Ltd.(b) | | | | | | | 1,705 | | | | 20,884 | |
HSBC Holdings PLC | | | | | | | 42,414 | | | | 416,637 | |
Huntington Bancshares, Inc./OH | | | | | | | 3,385 | | | | 55,074 | |
ING Groep NV | | | | | | | 7,699 | | | | 120,655 | |
Intesa Sanpaolo SpA | | | | | | | 34,087 | | | | 136,717 | |
Israel Discount Bank Ltd.–Class A | | | | | | | 2,882 | | | | 19,715 | |
Japan Post Bank Co., Ltd. | | | | | | | 3,418 | | | | 32,306 | |
JPMorgan Chase & Co. | | | | | | | 6,629 | | | | 1,589,038 | |
KBC Group NV | | | | | | | 535 | | | | 41,307 | |
KeyCorp | | | | | | | 2,198 | | | | 37,674 | |
Lloyds Banking Group PLC | | | | | | | 142,945 | | | | 97,621 | |
M&T Bank Corp. | | | | | | | 389 | | | | 73,136 | |
Mediobanca Banca di Credito Finanziario SpA | | | | | | | 1,164 | | | | 16,999 | |
Mitsubishi UFJ Financial Group, Inc. | | | | | | | 25,887 | | | | 302,223 | |
Mizrahi Tefahot Bank Ltd. | | | | | | | 361 | | | | 15,627 | |
Mizuho Financial Group, Inc. | | | | | | | 5,654 | | | | 138,029 | |
National Australia Bank Ltd. | | | | | | | 7,163 | | | | 164,121 | |
National Bank of Canada(b) | | | | | | | 794 | | | | 72,382 | |
NatWest Group PLC | | | | | | | 16,454 | | | | 82,455 | |
Nordea Bank Abp (Helsinki) | | | | | | | 7,354 | | | | 80,238 | |
Oversea-Chinese Banking Corp., Ltd. | | | | | | | 8,327 | | | | 101,698 | |
PNC Financial Services Group, Inc. (The) | | | | | | | 926 | | | | 178,579 | |
Regions Financial Corp. | | | | | | | 2,133 | | | | 50,168 | |
Resona Holdings, Inc. | | | | | | | 4,922 | | | | 35,482 | |
Royal Bank of Canada | | | | | | | 3,297 | | | | 397,535 | |
Shizuoka Financial Group, Inc. | | | | | | | 994 | | | | 8,061 | |
| | | | | | | | | | | | |
| Company | | | | | Shares | | | U.S. $ Value | |
| | | | | | | | | | | | |
Skandinaviska Enskilda Banken AB–Class A | | | | | | | 3,698 | | | $ | 50,678 | |
Societe Generale SA | | | | | | | 1,679 | | | | 47,122 | |
Standard Chartered PLC | | | | | | | 4,898 | | | | 60,300 | |
Sumitomo Mitsui Financial Group, Inc. | | | | | | | 8,699 | | | | 208,778 | |
Sumitomo Mitsui Trust Holdings, Inc. | | | | | | | 1,534 | | | | 35,834 | |
Svenska Handelsbanken AB–Class A | | | | | | | 3,399 | | | | 35,095 | |
Swedbank AB–Class A | | | | | | | 1,979 | | | | 39,077 | |
Toronto-Dominion Bank (The) | | | | | | | 4,072 | | | | 216,794 | |
Truist Financial Corp. | | | | | | | 3,121 | | | | 135,389 | |
UniCredit SpA | | | | | | | 3,433 | | | | 137,486 | |
United Overseas Bank Ltd. | | | | | | | 2,692 | | | | 71,488 | |
US Bancorp | | | | | | | 3,636 | | | | 173,910 | |
Wells Fargo & Co. | | | | | | | 7,930 | | | | 557,003 | |
Westpac Banking Corp. | | | | | | | 8,012 | | | | 159,927 | |
| | | | | | | | | | | | |
| | | | | | | | | | | 9,600,724 | |
| | | | | | | | | | | | |
CAPITAL MARKETS–2.2% | | | | | | | | | | | | |
3i Group PLC | | | | | | | 2,269 | | | | 101,000 | |
Ameriprise Financial, Inc. | | | | | | | 229 | | | | 121,926 | |
Amundi SA | | | | | | | 143 | | | | 9,517 | |
Ares Management Corp.–Class A | | | | | | | 439 | | | | 77,716 | |
ASX Ltd. | | | | | | | 452 | | | | 18,176 | |
Bank of New York Mellon Corp. (The) | | | | | | | 1,720 | | | | 132,148 | |
Blackrock, Inc. | | | | | | | 345 | | | | 353,663 | |
Blackstone, Inc. | | | | | | | 1,678 | | | | 289,321 | |
Brookfield Asset Management Ltd.–Class A (Toronto)(b) | | | | | | | 828 | | | | 44,907 | |
Brookfield Corp. (Toronto)(b) | | | | | | | 3,185 | | | | 183,064 | |
Carlyle Group, Inc. (The)(b) | | | | | | | 540 | | | | 27,265 | |
Cboe Global Markets, Inc. | | | | | | | 244 | | | | 47,678 | |
Charles Schwab Corp. (The) | | | | | | | 3,729 | | | | 275,983 | |
CME Group, Inc. | | | | | | | 839 | | | | 194,841 | |
CVC Capital Partners PLC(a)(b)(c) | | | | | | | 495 | | | | 10,946 | |
Daiwa Securities Group, Inc. | | | | | | | 3,063 | | | | 20,212 | |
Deutsche Bank AG (REG) | | | | | | | 4,416 | | | | 76,206 | |
Deutsche Boerse AG | | | | | | | 439 | | | | 101,126 | |
EQT AB | | | | | | | 868 | | | | 23,995 | |
Euronext NV | | | | | | | 182 | | | | 20,418 | |
FactSet Research Systems, Inc. | | | | | | | 89 | | | | 42,745 | |
Franklin Resources, Inc. | | | | | | | 670 | | | | 13,594 | |
Futu Holdings Ltd. (ADR) | | | | | | | 140 | | | | 11,199 | |
Goldman Sachs Group, Inc. (The) | | | | | | | 736 | | | | 421,448 | |
Hargreaves Lansdown PLC | | | | | | | 829 | | | | 11,376 | |
Hong Kong Exchanges & Clearing Ltd. | | | | | | | 2,801 | | | | 104,838 | |
3
| | |
| DYNAMIC ASSET ALLOCATION PORTFOLIO |
| PORTFOLIO OF INVESTMENTS | | |
| |
| (continued) | | AB Variable Products Series Fund |
| | | | | | | | | | | | |
| Company | | | | | Shares | | | U.S. $ Value | |
| | | | | | | | | | | | |
IGM Financial, Inc.(b) | | | | | | | 193 | | | $ | 6,164 | |
Intercontinental Exchange, Inc. | | | | | | | 1,338 | | | | 199,375 | |
Japan Exchange Group, Inc.(b) | | | | | | | 2,276 | | | | 25,253 | |
Julius Baer Group Ltd. | | | | | | | 480 | | | | 31,138 | |
KKR & Co., Inc. | | | | | | | 1,447 | | | | 214,026 | |
London Stock Exchange Group PLC | | | | | | | 1,114 | | | | 157,246 | |
LPL Financial Holdings, Inc. | | | | | | | 174 | | | | 56,813 | |
Macquarie Group Ltd. | | | | | | | 844 | | | | 115,428 | |
MarketAxess Holdings, Inc. | | | | | | | 88 | | | | 19,892 | |
Moody’s Corp. | | | | | | | 383 | | | | 181,301 | |
Morgan Stanley | | | | | | | 2,827 | | | | 355,410 | |
MSCI, Inc. | | | | | | | 183 | | | | 109,802 | |
Nasdaq, Inc. | | | | | | | 1,005 | | | | 77,697 | |
Nomura Holdings, Inc. | | | | | | | 7,021 | | | | 40,735 | |
Northern Trust Corp. | | | | | | | 470 | | | | 48,175 | |
Onex Corp. | | | | | | | 147 | | | | 11,482 | |
Partners Group Holding AG | | | | | | | 53 | | | | 71,989 | |
Raymond James Financial, Inc. | | | | | | | 456 | | | | 70,830 | |
Robinhood Markets, Inc.–Class A(a) | | | | | | | 1,245 | | | | 46,389 | |
S&P Global, Inc. | | | | | | | 745 | | | | 371,032 | |
SBI Holdings, Inc. | | | | | | | 595 | | | | 14,944 | |
Schroders PLC | | | | | | | 1,878 | | | | 7,591 | |
SEI Investments Co. | | | | | | | 257 | | | | 21,197 | |
Singapore Exchange Ltd. | | | | | | | 1,635 | | | | 15,241 | |
State Street Corp. | | | | | | | 686 | | | | 67,331 | |
T. Rowe Price Group, Inc. | | | | | | | 519 | | | | 58,694 | |
TMX Group Ltd. | | | | | | | 647 | | | | 19,931 | |
Tradeweb Markets, Inc.–Class A | | | | | | | 271 | | | | 35,479 | |
UBS Group AG (REG) | | | | | | | 7,663 | | | | 234,616 | |
| | | | | | | | | | | | |
| | | | | | | | | | | 5,420,509 | |
| | | | | | | | | | | | |
CONSUMER FINANCE–0.3% | | | | | | | | | | | | |
Ally Financial, Inc. | | | | | | | 639 | | | | 23,010 | |
American Express Co. | | | | | | | 1,325 | | | | 393,247 | |
Capital One Financial Corp. | | | | | | | 890 | | | | 158,705 | |
Discover Financial Services | | | | | | | 585 | | | | 101,339 | |
Synchrony Financial | | | | | | | 921 | | | | 59,865 | |
| | | | | | | | | | | | |
| | | | | | | | | | | 736,166 | |
| | | | | | | | | | | | |
FINANCIAL SERVICES–2.0% | | | | | | | | | | | | |
Adyen NV(a)(b) | | | | | | | 51 | | | | 75,790 | |
Apollo Global Management, Inc. | | | | | | | 929 | | | | 153,434 | |
Berkshire Hathaway, Inc.–Class B(a) | | | | | | | 3,087 | | | | 1,399,275 | |
Block, Inc.(a) | | | | | | | 1,294 | | | | 109,977 | |
Corebridge Financial, Inc. | | | | | | | 621 | | | | 18,586 | |
Corpay, Inc.(a) | | | | | | | 154 | | | | 52,117 | |
Edenred SE | | | | | | | 571 | | | | 18,772 | |
Equitable Holdings, Inc. | | | | | | | 735 | | | | 34,670 | |
| | | | | | | | | | | | |
| Company | | | | | Shares | | | U.S. $ Value | |
| | | | | | | | | | | | |
Eurazeo SE | | | | | | | 98 | | | $ | 7,310 | |
EXOR NV | | | | | | | 232 | | | | 21,269 | |
Fidelity National Information Services, Inc. | | | | | | | 1,271 | | | | 102,659 | |
Fiserv, Inc.(a) | | | | | | | 1,341 | | | | 275,468 | |
Global Payments, Inc. | | | | | | | 593 | | | | 66,452 | |
Groupe Bruxelles Lambert NV | | | | | | | 193 | | | | 13,197 | |
Industrivarden AB–Class A | | | | | | | 283 | | | | 8,945 | |
Industrivarden AB–Class C | | | | | | | 374 | | | | 11,813 | |
Infratil Ltd. | | | | | | | 2,139 | | | | 15,077 | |
Investor AB–Class B | | | | | | | 4,034 | | | | 106,848 | |
Jack Henry & Associates, Inc. | | | | | | | 170 | | | | 29,801 | |
L E Lundbergforetagen AB–Class B | | | | | | | 177 | | | | 8,020 | |
M&G PLC | | | | | | | 5,269 | | | | 13,039 | |
Mastercard, Inc.–Class A | | | | | | | 1,922 | | | | 1,012,068 | |
Mitsubishi HC Capital, Inc. | | | | | | | 2,023 | | | | 13,332 | |
Nexi SpA(a)(b) | | | | | | | 1,200 | | | | 6,679 | |
ORIX Corp. | | | | | | | 2,731 | | | | 58,672 | |
PayPal Holdings, Inc.(a) | | | | | | | 2,263 | | | | 193,147 | |
Sofina SA(b) | | | | | | | 36 | | | | 8,126 | |
Toast, Inc.–Class A(a)(b) | | | | | | | 913 | | | | 33,279 | |
Visa, Inc.–Class A | | | | | | | 3,892 | | | | 1,230,028 | |
Wise PLC–Class A(a) | | | | | | | 1,552 | | | | 20,628 | |
| | | | | | | | | | | | |
| | | | | | | | | | | 5,118,478 | |
| | | | | | | | | | | | |
INSURANCE–2.0% | | | | | | | | | | | | |
Admiral Group PLC | | | | | | | 607 | | | | 20,053 | |
Aegon Ltd.(b) | | | | | | | 3,146 | | | | 18,721 | |
Aflac, Inc. | | | | | | | 1,240 | | | | 128,266 | |
Ageas SA/NV | | | | | | | 372 | | | | 18,087 | |
AIA Group Ltd. | | | | | | | 25,437 | | | | 182,710 | |
Allianz SE (REG) | | | | | | | 913 | | | | 280,622 | |
Allstate Corp. (The) | | | | | | | 615 | | | | 118,566 | |
American Financial Group, Inc./OH | | | | | | | 166 | | | | 22,730 | |
American International Group, Inc. | | | | | | | 1,501 | | | | 109,273 | |
Aon PLC–Class A | | | | | | | 456 | | | | 163,777 | |
Arch Capital Group Ltd. | | | | | | | 876 | | | | 80,899 | |
Arthur J Gallagher & Co. | | | | | | | 511 | | | | 145,047 | |
ASR Nederland NV | | | | | | | 369 | | | | 17,550 | |
Assurant, Inc. | | | | | | | 121 | | | | 25,800 | |
Aviva PLC | | | | | | | 6,239 | | | | 36,567 | |
AXA SA | | | | | | | 4,103 | | | | 146,024 | |
Baloise Holding AG (REG) | | | | | | | 101 | | | | 18,302 | |
Brown & Brown, Inc. | | | | | | | 565 | | | | 57,641 | |
Chubb Ltd. | | | | | | | 894 | | | | 247,012 | |
Cincinnati Financial Corp. | | | | | | | 364 | | | | 52,307 | |
Dai-ichi Life Holdings, Inc. | | | | | | | 2,113 | | | | 56,304 | |
Erie Indemnity Co.–Class A | | | | | | | 59 | | | | 24,322 | |
Everest Group Ltd. | | | | | | | 101 | | | | 36,608 | |
Fairfax Financial Holdings Ltd. | | | | | | | 48 | | | | 66,785 | |
Fidelity National Financial, Inc. | | | | | | | 605 | | | | 33,965 | |
Generali(b) | | | | | | | 2,195 | | | | 62,101 | |
4
| | |
| |
| | | AB Variable Products Series Fund |
| | | | | | | | | | | | |
| Company | | | | | Shares | | | U.S. $ Value | |
| | | | | | | | | | | | |
Gjensidige Forsikring ASA | | | | | | | 466 | | | $ | 8,228 | |
Great-West Lifeco, Inc.(b) | | | | | | | 651 | | | | 21,589 | |
Hannover Rueck SE | | | | | | | 141 | | | | 35,309 | |
Hartford Financial Services Group, Inc. (The) | | | | | | | 683 | | | | 74,720 | |
Helvetia Holding AG (REG) | | | | | | | 86 | | | | 14,184 | |
iA Financial Corp., Inc. | | | | | | | 220 | | | | 20,404 | |
Insurance Australia Group Ltd. | | | | | | | 5,524 | | | | 28,892 | |
Intact Financial Corp. | | | | | | | 416 | | | | 75,745 | |
Japan Post Holdings Co., Ltd. | | | | | | | 4,467 | | | | 42,069 | |
Japan Post Insurance Co., Ltd. | | | | | | | 492 | | | | 9,037 | |
Legal & General Group PLC | | | | | | | 13,744 | | | | 39,464 | |
Loews Corp. | | | | | | | 435 | | | | 36,840 | |
Manulife Financial Corp. | | | | | | | 4,099 | | | | 125,926 | |
Markel Group, Inc.(a) | | | | | | | 30 | | | | 51,787 | |
Marsh & McLennan Cos., Inc. | | | | | | | 1,146 | | | | 243,422 | |
Medibank Pvt Ltd. | | | | | | | 6,417 | | | | 15,041 | |
MetLife, Inc. | | | | | | | 1,387 | | | | 113,568 | |
MS&AD Insurance Group Holdings, Inc. | | | | | | | 2,976 | | | | 64,274 | |
Muenchener Rueckversicherungs-Gesellschaft AG in Muenchen (REG) | | | | | | | 312 | | | | 157,423 | |
NN Group NV | | | | | | | 631 | | | | 27,517 | |
Phoenix Group Holdings PLC | | | | | | | 1,634 | | | | 10,412 | |
Poste Italiane SpA | | | | | | | 1,065 | | | | 15,062 | |
Power Corp. of Canada(b) | | | | | | | 1,310 | | | | 40,864 | |
Principal Financial Group, Inc. | | | | | | | 540 | | | | 41,801 | |
Progressive Corp. (The) | | | | | | | 1,364 | | | | 326,828 | |
Prudential Financial, Inc. | | | | | | | 832 | | | | 98,617 | |
Prudential PLC | | | | | | | 6,283 | | | | 49,862 | |
QBE Insurance Group Ltd. | | | | | | | 3,509 | | | | 41,672 | |
Sampo Oyj–Class A(b) | | | | | | | 1,153 | | | | 47,094 | |
Sompo Holdings, Inc. | | | | | | | 2,066 | | | | 53,531 | |
Sun Life Financial, Inc.(b) | | | | | | | 1,346 | | | | 79,920 | |
Suncorp Group Ltd. | | | | | | | 2,965 | | | | 34,835 | |
Swiss Life Holding AG (REG) | | | | | | | 67 | | | | 51,729 | |
Swiss Re AG | | | | | | | 703 | | | | 101,819 | |
T&D Holdings, Inc. | | | | | | | 1,096 | | | | 20,061 | |
Talanx AG | | | | | | | 150 | | | | 12,758 | |
Tokio Marine Holdings, Inc. | | | | | | | 4,412 | | | | 158,338 | |
Travelers Cos., Inc. (The) | | | | | | | 531 | | | | 127,913 | |
Tryg A/S | | | | | | | 790 | | | | 16,665 | |
Unipol Gruppo SpA | | | | | | | 919 | | | | 11,477 | |
W R Berkley Corp. | | | | | | | 710 | | | | 41,549 | |
Willis Towers Watson PLC | | | | | | | 237 | | | | 74,238 | |
Zurich Insurance Group AG | | | | | | | 341 | | | | 202,815 | |
| | | | | | | | | | | | |
| | | | | | | | | | | 5,035,338 | |
| | | | | | | | | | | | |
| | | | | | | | | | | | |
| Company | | | | | Shares | | | U.S. $ Value | |
| | | | | | | | | | | | |
MORTGAGE REAL ESTATE INVESTMENT TRUSTS (REITs)–0.0% | | | | | | | | | | | | |
Annaly Capital Management, Inc. | | | | | | | 1,254 | | | $ | 22,948 | |
| | | | | | | | | | | | |
| | | | | | | | | | | 25,934,163 | |
| | | | | | | | | | | | |
CONSUMER DISCRETIONARY–7.2% | | | | | | | | | | | | |
AUTOMOBILE COMPONENTS–0.1% | | | | | | | | | | | | |
Aisin Corp. | | | | | | | 1,229 | | | | 13,731 | |
Aptiv PLC(a) | | | | | | | 619 | | | | 37,437 | |
Bridgestone Corp. | | | | | | | 1,368 | | | | 45,983 | |
Cie Generale des Etablissements Michelin SCA | | | | | | | 1,557 | | | | 51,234 | |
Continental AG | | | | | | | 256 | | | | 17,250 | |
Denso Corp. | | | | | | | 4,440 | | | | 61,214 | |
Magna International, Inc.(b) | | | | | | | 636 | | | | 26,582 | |
Sumitomo Electric Industries Ltd. | | | | | | | 1,619 | | | | 28,944 | |
| | | | | | | | | | | | |
| | | | | | | | | | | 282,375 | |
| | | | | | | | | | | | |
AUTOMOBILES–1.6% | | | | | | | | | | | | |
Bayerische Motoren Werke AG | | | | | | | 676 | | | | 55,290 | |
Bayerische Motoren Werke AG (Preference Shares) | | | | | | | 130 | | | | 9,739 | |
Dr. Ing. h.c. F. Porsche AG (Preference Shares)(c) | | | | | | | 265 | | | | 16,059 | |
Ferrari NV(b) | | | | | | | 294 | | | | 125,450 | |
Ford Motor Co. | | | | | | | 9,100 | | | | 90,090 | |
General Motors Co. | | | | | | | 2,619 | | | | 139,514 | |
Honda Motor Co., Ltd. | | | | | | | 10,469 | | | | 99,673 | |
Isuzu Motors Ltd.(b) | | | | | | | 1,312 | | | | 17,848 | |
Mercedes-Benz Group AG | | | | | | | 1,745 | | | | 97,287 | |
Nissan Motor Co., Ltd.(b) | | | | | | | 5,179 | | | | 15,707 | |
Porsche Automobil Holding SE (Preference Shares) | | | | | | | 357 | | | | 13,452 | |
Renault SA | | | | | | | 448 | | | | 21,810 | |
Rivian Automotive, Inc.–Class A(a)(b) | | | | | | | 1,748 | | | | 23,248 | |
Stellantis NV (Milan) | | | | | | | 4,580 | | | | 59,579 | |
Subaru Corp. | | | | | | | 1,381 | | | | 24,538 | |
Suzuki Motor Corp. | | | | | | | 3,636 | | | | 40,739 | |
Tesla, Inc.(a) | | | | | | | 6,699 | | | | 2,705,324 | |
Toyota Motor Corp. | | | | | | | 23,870 | | | | 466,067 | |
Volkswagen AG (Preference Shares) | | | | | | | 481 | | | | 44,380 | |
Yamaha Motor Co., Ltd. | | | | | | | 2,185 | | | | 19,251 | |
| | | | | | | | | | | | |
| | | | | | | | | | | 4,085,045 | |
| | | | | | | | | | | | |
BROADLINE RETAIL–2.3% | | | | | | | | | | | | |
Amazon.com, Inc.(a) | | | | | | | 22,007 | | | | 4,828,116 | |
Canadian Tire Corp., Ltd.–Class A(b) | | | | | | | 122 | | | | 12,834 | |
Cie Financiere Richemont SA (REG) | | | | | | | 1,253 | | | | 189,546 | |
5
| | |
| DYNAMIC ASSET ALLOCATION PORTFOLIO |
| PORTFOLIO OF INVESTMENTS | | |
| |
| (continued) | | AB Variable Products Series Fund |
| | | | | | | | | | | | |
| Company | | | | | Shares | | | U.S. $ Value | |
| | | | | | | | | | | | |
Dollarama, Inc. | | | | | | | 655 | | | $ | 63,921 | |
eBay, Inc. | | | | | | | 1,140 | | | | 70,623 | |
Global-e Online Ltd.(a) | | | | | | | 233 | | | | 12,706 | |
MercadoLibre, Inc.(a) | | | | | | | 106 | | | | 180,247 | |
Next PLC | | | | | | | 278 | | | | 32,977 | |
Pan Pacific International Holdings Corp. | | | | | | | 871 | | | | 23,662 | |
Prosus NV(b) | | | | | | | 3,188 | | | | 126,643 | |
Rakuten Group, Inc.(a) | | | | | | | 3,513 | | | | 18,926 | |
Wesfarmers Ltd. | | | | | | | 2,645 | | | | 116,850 | |
| | | | | | | | | | | | |
| | | | | | | | | | | 5,677,051 | |
| | | | | | | | | | | | |
DISTRIBUTORS–0.0% | | | | | | | | | | | | |
D’ieteren Group | | | | | | | 50 | | | | 8,317 | |
Genuine Parts Co. | | | | | | | 325 | | | | 37,947 | |
LKQ Corp. | | | | | | | 613 | | | | 22,528 | |
Pool Corp. | | | | | | | 89 | | | | 30,344 | |
| | | | | | | | | | | | |
| | | | | | | | | | | 99,136 | |
| | | | | | | | | | | | |
DIVERSIFIED CONSUMER SERVICES–0.0% | | | | | | | | | | | | |
Pearson PLC | | | | | | | 1,397 | | | | 22,401 | |
| | | | | | | | | | | | |
HOTELS, RESTAURANTS & LEISURE–1.3% | | | | | | | | | | | | |
Accor SA | | | | | | | 454 | | | | 22,081 | |
Airbnb, Inc.–Class A(a) | | | | | | | 1,025 | | | | 134,695 | |
Amadeus IT Group SA(b) | | | | | | | 1,050 | | | | 74,113 | |
Aristocrat Leisure Ltd. | | | | | | | 1,320 | | | | 55,744 | |
Booking Holdings, Inc. | | | | | | | 78 | | | | 387,537 | |
Carnival Corp.(a) | | | | | | | 2,421 | | | | 60,331 | |
Chipotle Mexican Grill, Inc.(a) | | | | | | | 3,191 | | | | 192,417 | |
Compass Group PLC | | | | | | | 3,955 | | | | 131,596 | |
Darden Restaurants, Inc. | | | | | | | 274 | | | | 51,153 | |
Delivery Hero SE(a) | | | | | | | 435 | | | | 12,220 | |
Domino’s Pizza, Inc. | | | | | | | 80 | | | | 33,581 | |
DoorDash, Inc.–Class A(a) | | | | | | | 717 | | | | 120,277 | |
DraftKings, Inc.–Class A(a) | | | | | | | 1,018 | | | | 37,870 | |
Entain PLC | | | | | | | 1,415 | | | | 12,147 | |
Evolution AB | | | | | | | 395 | | | | 30,461 | |
Expedia Group, Inc.(a) | | | | | | | 291 | | | | 54,222 | |
Flutter Entertainment PLC(a) | | | | | | | 414 | | | | 106,998 | |
Galaxy Entertainment Group Ltd. | | | | | | | 5,343 | | | | 22,492 | |
Genting Singapore Ltd. | | | | | | | 13,869 | | | | 7,780 | |
Hilton Worldwide Holdings, Inc. | | | | | | | 574 | | | | 141,870 | |
Hyatt Hotels Corp.–Class A(b) | | | | | | | 105 | | | | 16,483 | |
InterContinental Hotels Group PLC | | | | | | | 371 | | | | 46,161 | |
La Francaise des Jeux SACA | | | | | | | 237 | | | | 9,127 | |
Las Vegas Sands Corp.(b) | | | | | | | 858 | | | | 44,067 | |
Lottery Corp., Ltd. (The) | | | | | | | 5,186 | | | | 15,818 | |
Marriott International, Inc./MD–Class A | | | | | | | 558 | | | | 155,649 | |
| | | | | | | | | | | | |
| Company | | | | | Shares | | | U.S. $ Value | |
| | | | | | | | | | | | |
McDonald’s Corp. | | | | | | | 1,671 | | | $ | 484,406 | |
McDonald’s Holdings Co. Japan Ltd. | | | | | | | 192 | | | | 7,542 | |
MGM Resorts International(a) | | | | | | | 531 | | | | 18,399 | |
Oriental Land Co., Ltd./Japan | | | | | | | 2,505 | | | | 53,998 | |
Restaurant Brands International, Inc. | | | | | | | 717 | | | | 46,733 | |
Royal Caribbean Cruises Ltd. | | | | | | | 570 | | | | 131,493 | |
Sands China Ltd.(a) | | | | | | | 5,620 | | | | 14,964 | |
Sodexo SA | | | | | | | 206 | | | | 16,975 | |
Starbucks Corp. | | | | | | | 2,640 | | | | 240,900 | |
Whitbread PLC | | | | | | | 418 | | | | 15,387 | |
Wynn Resorts Ltd. | | | | | | | 233 | | | | 20,075 | |
Yum! Brands, Inc. | | | | | | | 655 | | | | 87,875 | |
Zensho Holdings Co., Ltd. | | | | | | | 200 | | | | 11,327 | |
| | | | | | | | | | | | |
| | | | | | | | | | | 3,126,964 | |
| | | | | | | | | | | | |
HOUSEHOLD DURABLES–0.3% | | | | | | | | | | | | |
Barratt Redrow PLC | | | | | | | 3,212 | | | | 17,608 | |
Berkeley Group Holdings PLC | | | | | | | 238 | | | | 11,583 | |
DR Horton, Inc. | | | | | | | 684 | | | | 95,637 | |
Garmin Ltd. | | | | | | | 358 | | | | 73,841 | |
Lennar Corp.–Class A | | | | | | | 557 | | | | 75,958 | |
NVR, Inc.(a) | | | | | | | 7 | | | | 57,252 | |
Panasonic Holdings Corp. | | | | | | | 5,471 | | | | 55,917 | |
Persimmon PLC | | | | | | | 745 | | | | 11,128 | |
PulteGroup, Inc. | | | | | | | 484 | | | | 52,708 | |
SEB SA | | | | | | | 58 | | | | 5,241 | |
Sekisui House Ltd. | | | | | | | 1,389 | | | | 33,119 | |
Sony Group Corp. | | | | | | | 14,570 | | | | 307,071 | |
Taylor Wimpey PLC | | | | | | | 8,248 | | | | 12,553 | |
| | | | | | | | | | | | |
| | | | | | | | | | | 809,616 | |
| | | | | | | | | | | | |
LEISURE PRODUCTS–0.0% | | | | | | | | | | | | |
Bandai Namco Holdings, Inc. | | | | | | | 1,337 | | | | 31,881 | |
Shimano, Inc. | | | | | | | 160 | | | | 21,523 | |
| | | | | | | | | | | | |
| | | | | | | | | | | 53,404 | |
| | | | | | | | | | | | |
SPECIALTY RETAIL–1.1% | | | | | | | | | | | | |
AutoZone, Inc.(a) | | | | | | | 40 | | | | 128,080 | |
Avolta AG | | | | | | | 213 | | | | 8,551 | |
Best Buy Co., Inc. | | | | | | | 475 | | | | 40,755 | |
Burlington Stores, Inc.(a) | | | | | | | 148 | | | | 42,189 | |
CarMax, Inc.(a) | | | | | | | 361 | | | | 29,515 | |
Carvana Co.(a) | | | | | | | 266 | | | | 54,094 | |
Dick’s Sporting Goods, Inc. | | | | | | | 135 | | | | 30,893 | |
Dynatrace, Inc.(a) | | | | | | | 694 | | | | 37,719 | |
Fast Retailing Co., Ltd. | | | | | | | 457 | | | | 154,165 | |
H & M Hennes & Mauritz AB–Class B(b) | | | | | | | 1,320 | | | | 17,792 | |
Home Depot, Inc. (The) | | | | | | | 2,314 | | | | 900,123 | |
Industria de Diseno Textil SA | | | | | | | 2,542 | | | | 130,211 | |
6
| | |
| |
| | | AB Variable Products Series Fund |
| | | | | | | | | | | | |
| Company | | | | | Shares | | | U.S. $ Value | |
| | | | | | | | | | | | |
JD Sports Fashion PLC | | | | | | | 6,039 | | | $ | 7,218 | |
Kingfisher PLC | | | | | | | 4,252 | | | | 13,217 | |
Lowe’s Cos., Inc. | | | | | | | 1,322 | | | | 326,270 | |
Nitori Holdings Co., Ltd. | | | | | | | 213 | | | | 25,239 | |
O’Reilly Automotive, Inc.(a) | | | | | | | 135 | | | | 160,083 | |
Ross Stores, Inc. | | | | | | | 773 | | | | 116,932 | |
TJX Cos., Inc. (The) | | | | | | | 2,628 | | | | 317,489 | |
Tractor Supply Co. | | | | | | | 1,255 | | | | 66,590 | |
Ulta Beauty, Inc.(a) | | | | | | | 110 | | | | 47,842 | |
Williams-Sonoma, Inc. | | | | | | | 294 | | | | 54,443 | |
Zalando SE(a) | | | | | | | 523 | | | | 17,496 | |
ZOZO, Inc. | | | | | | | 271 | | | | 8,346 | |
| | | | | | | | | | | | |
| | | | | | | | | | | 2,735,252 | |
| | | | | | | | | | | | |
TEXTILES, APPAREL & LUXURY GOODS–0.5% | | | | | | | | | | | | |
adidas AG | | | | | | | 378 | | | | 92,974 | |
Asics Corp. | | | | | | | 1,600 | | | | 31,212 | |
Deckers Outdoor Corp.(a) | | | | | | | 355 | | | | 72,097 | |
Gildan Activewear, Inc. | | | | | | | 329 | | | | 15,484 | |
Hermes International SCA | | | | | | | 74 | | | | 177,553 | |
Kering SA | | | | | | | 173 | | | | 42,730 | |
Lululemon Athletica, Inc.(a) | | | | | | | 261 | | | | 99,809 | |
LVMH Moet Hennessy Louis Vuitton SE | | | | | | | 641 | | | | 421,645 | |
Moncler SpA(b) | | | | | | | 544 | | | | 28,718 | |
NIKE, Inc.–Class B | | | | | | | 2,774 | | | | 209,909 | |
Pandora A/S | | | | | | | 191 | | | | 34,945 | |
Puma SE | | | | | | | 246 | | | | 11,311 | |
Swatch Group AG (The) (BR) | | | | | | | 67 | | | | 12,178 | |
| | | | | | | | | | | | |
| | | | | | | | | | | 1,250,565 | |
| | | | | | | | | | | | |
| | | | | | | | | | | 18,141,809 | |
| | | | | | | | | | | | |
INDUSTRIALS–6.9% | | | | | | | | | | | | |
AEROSPACE & DEFENSE–1.2% | | | | | | | | | | | | |
Airbus SE | | | | | | | 1,384 | | | | 221,621 | |
Axon Enterprise, Inc.(a) | | | | | | | 167 | | | | 99,251 | |
BAE Systems PLC | | | | | | | 7,043 | | | | 101,034 | |
Boeing Co. (The)(a) | | | | | | | 1,698 | | | | 300,546 | |
CAE, Inc.(a)(b) | | | | | | | 743 | | | | 18,866 | |
Dassault Aviation SA | | | | | | | 46 | | | | 9,399 | |
Elbit Systems Ltd. | | | | | | | 62 | | | | 16,257 | |
General Dynamics Corp. | | | | | | | 544 | | | | 143,339 | |
General Electric Co. | | | | | | | 2,526 | | | | 421,312 | |
HEICO Corp.(b) | | | | | | | 102 | | | | 24,249 | |
HEICO Corp.–Class A | | | | | | | 176 | | | | 32,750 | |
Howmet Aerospace, Inc. | | | | | | | 904 | | | | 98,871 | |
Huntington Ingalls Industries, Inc. | | | | | | | 91 | | | | 17,196 | |
Kongsberg Gruppen ASA | | | | | | | 205 | | | | 23,064 | |
L3Harris Technologies, Inc. | | | | | | | 442 | | | | 92,944 | |
Leonardo SpA | | | | | | | 943 | | | | 25,370 | |
Lockheed Martin Corp. | | | | | | | 500 | | | | 242,970 | |
Melrose Industries PLC | | | | | | | 3,005 | | | | 20,766 | |
MTU Aero Engines AG | | | | | | | 125 | | | | 41,749 | |
Northrop Grumman Corp. | | | | | | | 324 | | | | 152,050 | |
| | | | | | | | | | | | |
| Company | | | | | Shares | | | U.S. $ Value | |
| | | | | | | | | | | | |
Rheinmetall AG | | | | | | | 102 | | | $ | 65,169 | |
Rolls-Royce Holdings PLC(a) | | | | | | | 19,820 | | | | 140,551 | |
RTX Corp. | | | | | | | 3,099 | | | | 358,616 | |
Saab AB–Class B | | | | | | | 746 | | | | 15,761 | |
Safran SA | | | | | | | 846 | | | | 185,365 | |
Singapore Technologies Engineering Ltd. | | | | | | | 3,908 | | | | 13,335 | |
Textron, Inc. | | | | | | | 437 | | | | 33,426 | |
Thales SA | | | | | | | 216 | | | | 31,017 | |
TransDigm Group, Inc. | | | | | | | 131 | | | | 166,014 | |
| | | | | | | | | | | | |
| | | | | | | | | | | 3,112,858 | |
| | | | | | | | | | | | |
AIR FREIGHT & LOGISTICS–0.2% | | | | | | | | | | | | |
CH Robinson Worldwide, Inc. | | | | | | | 273 | | | | 28,206 | |
Deutsche Post AG | | | | | | | 2,377 | | | | 83,914 | |
DSV A/S | | | | | | | 476 | | | | 101,372 | |
Expeditors International of Washington, Inc. | | | | | | | 329 | | | | 36,443 | |
FedEx Corp. | | | | | | | 541 | | | | 152,200 | |
InPost SA(a) | | | | | | | 524 | | | | 8,946 | |
SG Holdings Co., Ltd. | | | | | | | 752 | | | | 7,188 | |
United Parcel Service, Inc.–Class B | | | | | | | 1,707 | | | | 215,253 | |
| | | | | | | | | | | | |
| | | | | | | | | | | 633,522 | |
| | | | | | | | | | | | |
BUILDING PRODUCTS–0.5% | | | | | | | | | | | | |
A O Smith Corp. | | | | | | | 280 | | | | 19,099 | |
AGC, Inc. | | | | | | | 422 | | | | 12,327 | |
Allegion PLC | | | | | | | 203 | | | | 26,528 | |
Assa Abloy AB–Class B | | | | | | | 2,336 | | | | 68,997 | |
Builders FirstSource, Inc.(a) | | | | | | | 271 | | | | 38,734 | |
Carlisle Cos., Inc. | | | | | | | 108 | | | | 39,835 | |
Carrier Global Corp. | | | | | | | 1,893 | | | | 129,216 | |
Cie de Saint-Gobain SA | | | | | | | 1,057 | | | | 93,927 | |
Daikin Industries Ltd. | | | | | | | 619 | | | | 72,225 | |
Fortune Brands Innovations, Inc. | | | | | | | 290 | | | | 19,816 | |
Geberit AG (REG) | | | | | | | 78 | | | | 44,236 | |
Johnson Controls International PLC | | | | | | | 1,557 | | | | 122,894 | |
Kingspan Group PLC | | | | | | | 360 | | | | 26,171 | |
Lennox International, Inc. | | | | | | | 75 | | | | 45,697 | |
Masco Corp. | | | | | | | 509 | | | | 36,938 | |
Nibe Industrier AB–Class B(b) | | | | | | | 3,531 | | | | 13,799 | |
Otis Worldwide Corp. | | | | | | | 934 | | | | 86,498 | |
Owens Corning | | | | | | | 203 | | | | 34,575 | |
ROCKWOOL A/S–Class B | | | | | | | 22 | | | | 7,828 | |
TOTO Ltd. | | | | | | | 361 | | | | 8,648 | |
Trane Technologies PLC | | | | | | | 526 | | | | 194,278 | |
| | | | | | | | | | | | |
| | | | | | | | | | | 1,142,266 | |
| | | | | | | | | | | | |
COMMERCIAL SERVICES & SUPPLIES–0.4% | | | | | | | | | | | | |
Brambles Ltd. | | | | | | | 3,246 | | | | 38,605 | |
Cintas Corp. | | | | | | | 846 | | | | 154,564 | |
7
| | |
| DYNAMIC ASSET ALLOCATION PORTFOLIO |
| PORTFOLIO OF INVESTMENTS | | |
| |
| (continued) | | AB Variable Products Series Fund |
| | | | | | | | | | | | |
| Company | | | | | Shares | | | U.S. $ Value | |
| | | | | | | | | | | | |
Copart, Inc.(a) | | | | | | | 2,020 | | | $ | 115,928 | |
Dai Nippon Printing Co., Ltd. | | | | | | | 932 | | | | 13,042 | |
Element Fleet Management Corp. | | | | | | | 943 | | | | 19,064 | |
GFL Environmental, Inc.(b) | | | | | | | 533 | | | | 23,761 | |
RB Global, Inc.(b) | | | | | | | 429 | | | | 38,720 | |
Rentokil Initial PLC | | | | | | | 5,884 | | | | 29,370 | |
Republic Services, Inc. | | | | | | | 512 | | | | 103,004 | |
Rollins, Inc. | | | | | | | 677 | | | | 31,379 | |
Secom Co., Ltd. | | | | | | | 940 | | | | 31,922 | |
Securitas AB–Class B(b) | | | | | | | 1,146 | | | | 14,169 | |
TOPPAN Holdings, Inc. | | | | | | | 536 | | | | 14,219 | |
Veralto Corp. | | | | | | | 576 | | | | 58,666 | |
Waste Connections, Inc. | | | | | | | 601 | | | | 103,119 | |
Waste Management, Inc. | | | | | | | 935 | | | | 188,674 | |
| | | | | | | | | | | | |
| | | | | | | | | | | 978,206 | |
| | | | | | | | | | | | |
CONSTRUCTION & ENGINEERING–0.2% | | | | | | | | | | | | |
ACS Actividades de Construccion y Servicios SA(b) | | | | | | | 411 | | | | 20,596 | |
AECOM | | | | | | | 312 | | | | 33,328 | |
Bouygues SA | | | | | | | 442 | | | | 13,088 | |
Eiffage SA | | | | | | | 171 | | | | 14,995 | |
EMCOR Group, Inc. | | | | | | | 109 | | | | 49,475 | |
Ferrovial SE(b) | | | | | | | 1,109 | | | | 46,550 | |
Kajima Corp. | | | | | | | 903 | | | | 16,358 | |
Obayashi Corp. | | | | | | | 1,484 | | | | 19,540 | |
Quanta Services, Inc.(b) | | | | | | | 343 | | | | 108,405 | |
Skanska AB–Class B | | | | | | | 793 | | | | 16,675 | |
Stantec, Inc. | | | | | | | 266 | | | | 20,870 | |
Taisei Corp.(b) | | | | | | | 400 | | | | 16,760 | |
Vinci SA | | | | | | | 1,166 | | | | 120,047 | |
WSP Global, Inc. | | | | | | | 304 | | | | 53,497 | |
| | | | | | | | | | | | |
| | | | | | | | | | | 550,184 | |
| | | | | | | | | | | | |
ELECTRICAL EQUIPMENT–0.7% | | | | | | | | | | | | |
ABB Ltd. (REG) | | | | | | | 3,685 | | | | 198,984 | |
AMETEK, Inc. | | | | | | | 540 | | | | 97,340 | |
Eaton Corp. PLC | | | | | | | 927 | | | | 307,643 | |
Emerson Electric Co. | | | | | | | 1,334 | | | | 165,323 | |
Fuji Electric Co., Ltd. | | | | | | | 330 | | | | 17,642 | |
Fujikura Ltd. | | | | | | | 600 | | | | 24,495 | |
GE Vernova, Inc. | | | | | | | 640 | | | | 210,515 | |
Hubbell, Inc. | | | | | | | 125 | | | | 52,361 | |
Legrand SA | | | | | | | 611 | | | | 59,433 | |
Mitsubishi Electric Corp. | | | | | | | 4,458 | | | | 75,277 | |
NIDEC Corp. | | | | | | | 1,966 | | | | 35,313 | |
Prysmian SpA(b) | | | | | | | 655 | | | | 41,918 | |
Rockwell Automation, Inc. | | | | | | | 264 | | | | 75,448 | |
Schneider Electric SE | | | | | | | 1,274 | | | | 317,170 | |
Siemens Energy AG(a) | | | | | | | 1,490 | | | | 79,077 | |
Vertiv Holdings Co.–Class A | | | | | | | 831 | | | | 94,410 | |
Vestas Wind Systems A/S(a) | | | | | | | 2,354 | | | | 32,290 | |
| | | | | | | | | | | | |
| | | | | | | | | | | 1,884,639 | |
| | | | | | | | | | | | |
| | | | | | | | | | | | |
| Company | | | | | Shares | | | U.S. $ Value | |
| | | | | | | | | | | | |
GROUND TRANSPORTATION–0.6% | | | | | | | | | | | | |
Canadian National Railway Co. | | | | | | | 1,247 | | | $ | 126,630 | |
Canadian Pacific Kansas City Ltd. (Toronto) | | | | | | | 2,174 | | | | 157,411 | |
Central Japan Railway Co. | | | | | | | 1,835 | | | | 34,435 | |
CSX Corp. | | | | | | | 4,518 | | | | 145,796 | |
East Japan Railway Co. | | | | | | | 2,079 | | | | 36,821 | |
Grab Holdings Ltd.–Class A(a) | | | | | | | 4,925 | | | | 23,246 | |
Hankyu Hanshin Holdings, Inc. | | | | | | | 526 | | | | 13,710 | |
JB Hunt Transport Services, Inc. | | | | | | | 190 | | | | 32,425 | |
Knight-Swift Transportation Holdings, Inc. | | | | | | | 377 | | | | 19,996 | |
MTR Corp., Ltd. | | | | | | | 3,764 | | | | 13,075 | |
Norfolk Southern Corp. | | | | | | | 527 | | | | 123,687 | |
Old Dominion Freight Line, Inc. | | | | | | | 449 | | | | 79,204 | |
TFI International, Inc. | | | | | | | 187 | | | | 25,269 | |
Tokyu Corp.(b) | | | | | | | 1,253 | | | | 13,353 | |
U-Haul Holding Co. (Non-Voting) | | | | | | | 226 | | | | 14,475 | |
Uber Technologies, Inc.(a) | | | | | | | 4,405 | | | | 265,710 | |
Union Pacific Corp. | | | | | | | 1,419 | | | | 323,589 | |
West Japan Railway Co. | | | | | | | 996 | | | | 17,641 | |
| | | | | | | | | | | | |
| | | | | | | | | | | 1,466,473 | |
| | | | | | | | | | | | |
INDUSTRIAL CONGLOMERATES–0.5% | | | | | | | | | | | | |
3M Co. | | | | | | | 1,280 | | | | 165,235 | |
CK Hutchison Holdings Ltd. | | | | | | | 6,047 | | | | 32,149 | |
DCC PLC | | | | | | | 230 | | | | 14,738 | |
Hikari Tsushin, Inc. | | | | | | | 86 | | | | 18,666 | |
Hitachi Ltd. | | | | | | | 10,810 | | | | 264,737 | |
Honeywell International, Inc. | | | | | | | 1,514 | | | | 341,997 | |
Investment AB Latour–Class B | | | | | | | 345 | | | | 8,606 | |
Jardine Matheson Holdings Ltd. | | | | | | | 340 | | | | 13,917 | |
Keppel Ltd. | | | | | | | 2,974 | | | | 14,900 | |
Lifco AB–Class B | | | | | | | 543 | | | | 15,738 | |
Sekisui Chemical Co., Ltd. | | | | | | | 883 | | | | 15,119 | |
Siemens AG (REG) | | | | | | | 1,771 | | | | 345,336 | |
Smiths Group PLC | | | | | | | 803 | | | | 17,217 | |
Swire Pacific Ltd.–Class A | | | | | | | 935 | | | | 8,456 | |
| | | | | | | | | | | | |
| | | | | | | | | | | 1,276,811 | |
| | | | | | | | | | | | |
MACHINERY–1.2% | | | | | | | | | | | | |
Alfa Laval AB | | | | | | | 674 | | | | 28,210 | |
Alstom SA(a) | | | | | | | 807 | | | | 18,007 | |
Atlas Copco AB–Class A | | | | | | | 6,260 | | | | 95,538 | |
Atlas Copco AB–Class B | | | | | | | 3,638 | | | | 49,153 | |
Caterpillar, Inc. | | | | | | | 1,130 | | | | 409,919 | |
CNH Industrial NV | | | | | | | 2,045 | | | | 23,170 | |
8
| | |
| |
| | | AB Variable Products Series Fund |
| | | | | | | | | | | | |
| Company | | | | | Shares | | | U.S. $ Value | |
| | | | | | | | | | | | |
Cummins, Inc. | | | | | | | 321 | | | $ | 111,901 | |
Daifuku Co., Ltd. | | | | | | | 706 | | | | 14,505 | |
Daimler Truck Holding AG | | | | | | | 1,151 | | | | 44,086 | |
Deere & Co. | | | | | | | 606 | | | | 256,762 | |
Dover Corp. | | | | | | | 320 | | | | 60,032 | |
Epiroc AB–Class A | | | | | | | 1,536 | | | | 26,769 | |
Epiroc AB–Class B | | | | | | | 909 | | | | 14,181 | |
FANUC Corp. | | | | | | | 2,170 | | | | 56,687 | |
Fortive Corp. | | | | | | | 817 | | | | 61,275 | |
GEA Group AG | | | | | | | 361 | | | | 17,932 | |
Graco, Inc. | | | | | | | 394 | | | | 33,210 | |
Hitachi Construction Machinery Co., Ltd.(b) | | | | | | | 258 | | | | 5,718 | |
Hoshizaki Corp. | | | | | | | 302 | | | | 11,874 | |
IDEX Corp. | | | | | | | 176 | | | | 36,835 | |
Illinois Tool Works, Inc. | | | | | | | 692 | | | | 175,464 | |
Indutrade AB | | | | | | | 637 | | | | 15,961 | |
Ingersoll Rand, Inc. | | | | | | | 940 | | | | 85,032 | |
Knorr-Bremse AG | | | | | | | 169 | | | | 12,266 | |
Komatsu Ltd. | | | | | | | 2,000 | | | | 54,485 | |
Kone Oyj–Class B(b) | | | | | | | 792 | | | | 38,610 | |
Kubota Corp. | | | | | | | 2,151 | | | | 24,919 | |
Makita Corp. | | | | | | | 595 | | | | 18,093 | |
Metso Oyj(b) | | | | | | | 1,449 | | | | 13,490 | |
MINEBEA MITSUMI, Inc. | | | | | | | 833 | | | | 13,343 | |
Mitsubishi Heavy Industries Ltd. | | | | | | | 7,430 | | | | 103,604 | |
Nordson Corp. | | | | | | | 127 | | | | 26,574 | |
PACCAR, Inc. | | | | | | | 1,222 | | | | 127,112 | |
Parker-Hannifin Corp. | | | | | | | 300 | | | | 190,809 | |
Pentair PLC | | | | | | | 386 | | | | 38,847 | |
Rational AG | | | | | | | 12 | | | | 10,278 | |
Sandvik AB | | | | | | | 2,485 | | | | 44,559 | |
Schindler Holding AG | | | | | | | 95 | | | | 26,247 | |
Schindler Holding AG (REG) | | | | | | | 55 | | | | 15,004 | |
SKF AB–Class B | | | | | | | 794 | | | | 14,903 | |
SMC Corp. | | | | | | | 110 | | | | 42,715 | |
Snap-on, Inc. | | | | | | | 123 | | | | 41,756 | |
Spirax Group PLC | | | | | | | 172 | | | | 14,713 | |
Stanley Black & Decker, Inc. | | | | | | | 359 | | | | 28,824 | |
Techtronic Industries Co., Ltd. | | | | | | | 3,244 | | | | 42,645 | |
Toro Co. (The) | | | | | | | 239 | | | | 19,144 | |
Toyota Industries Corp. | | | | | | | 406 | | | | 32,653 | |
Trelleborg AB–Class B | | | | | | | 496 | | | | 16,973 | |
VAT Group AG(c) | | | | | | | 63 | | | | 23,821 | |
Volvo AB–Class A | | | | | | | 467 | | | | 11,414 | |
Volvo AB–Class B | | | | | | | 3,702 | | | | 89,967 | |
Wartsila OYJ Abp | | | | | | | 1,172 | | | | 20,771 | |
Westinghouse Air Brake Technologies Corp. | | | | | | | 408 | | | | 77,353 | |
Xylem, Inc./NY | | | | | | | 564 | | | | 65,435 | |
Yangzijiang Shipbuilding Holdings Ltd. | | | | | | | 6,000 | | | | 13,115 | |
| | | | | | | | | | | | |
| | | | | | | | | | | 2,966,663 | |
| | | | | | | | | | | | |
| | | | | | | | | | | | |
| Company | | | | | Shares | | | U.S. $ Value | |
| | | | | | | | | | | | |
MARINE TRANSPORTATION–0.1% | | | | | | | | | | | | |
AP Moller–Maersk A/S–Class A | | | | | | | 7 | | | $ | 11,262 | |
AP Moller–Maersk A/S–Class B | | | | | | | 11 | | | | 18,301 | |
Kawasaki Kisen Kaisha Ltd. | | | | | | | 900 | | | | 12,804 | |
Kuehne + Nagel International AG (REG) | | | | | | | 113 | | | | 25,927 | |
Mitsui OSK Lines Ltd. | | | | | | | 817 | | | | 28,430 | |
Nippon Yusen KK(b) | | | | | | | 989 | | | | 32,918 | |
SITC International Holdings Co., Ltd. | | | | | | | 3,000 | | | | 7,955 | |
| | | | | | | | | | | | |
| | | | | | | | | | | 137,597 | |
| | | | | | | | | | | | |
PASSENGER AIRLINES–0.0% | | | | | | | | | | | | |
Air Canada(a)(b) | | | | | | | 409 | | | | 6,334 | |
ANA Holdings, Inc. | | | | | | | 395 | | | | 7,169 | |
Delta Air Lines, Inc. | | | | | | | 376 | | | | 22,748 | |
Deutsche Lufthansa AG (REG) | | | | | | | 1,398 | | | | 8,984 | |
Japan Airlines Co., Ltd. | | | | | | | 358 | | | | 5,644 | |
Qantas Airways Ltd.(a) | | | | | | | 1,785 | | | | 9,882 | |
Singapore Airlines Ltd.(b) | | | | | | | 3,936 | | | | 18,556 | |
Southwest Airlines Co.(b) | | | | | | | 349 | | | | 11,733 | |
| | | | | | | | | | | | |
| | | | | | | | | | | 91,050 | |
| | | | | | | | | | | | |
PROFESSIONAL SERVICES–0.7% | | | | | | | | | | | | |
Adecco Group AG (REG) | | | | | | | 392 | | | | 9,683 | |
Automatic Data Processing, Inc. | | | | | | | 950 | | | | 278,094 | |
Booz Allen Hamilton Holding Corp. | | | | | | | 301 | | | | 38,739 | |
Broadridge Financial Solutions, Inc. | | | | | | | 272 | | | | 61,496 | |
Bureau Veritas SA | | | | | | | 740 | | | | 22,481 | |
Computershare Ltd. | | | | | | | 1,236 | | | | 25,964 | |
Dayforce, Inc.(a)(b) | | | | | | | 368 | | | | 26,732 | |
Equifax, Inc. | | | | | | | 289 | | | | 73,652 | |
Experian PLC | | | | | | | 2,143 | | | | 92,106 | |
Intertek Group PLC | | | | | | | 376 | | | | 22,214 | |
Jacobs Solutions, Inc. | | | | | | | 290 | | | | 38,750 | |
Leidos Holdings, Inc. | | | | | | | 298 | | | | 42,930 | |
Paychex, Inc. | | | | | | | 755 | | | | 105,866 | |
Paycom Software, Inc. | | | | | | | 120 | | | | 24,596 | |
Randstad NV(b) | | | | | | | 253 | | | | 10,652 | |
Recruit Holdings Co., Ltd. | | | | | | | 3,286 | | | | 228,403 | |
RELX PLC (London) | | | | | | | 4,341 | | | | 196,686 | |
SGS SA (REG) | | | | | | | 353 | | | | 35,412 | |
SS&C Technologies Holdings, Inc. | | | | | | | 515 | | | | 39,027 | |
Teleperformance SE | | | | | | | 127 | | | | 10,893 | |
Thomson Reuters Corp.(b) | | | | | | | 367 | | | | 58,931 | |
TransUnion | | | | | | | 453 | | | | 41,998 | |
Verisk Analytics, Inc. | | | | | | | 332 | | | | 91,443 | |
Wolters Kluwer NV | | | | | | | 556 | | | | 92,376 | |
| | | | | | | | | | | | |
| | | | | | | | | | | 1,669,124 | |
| | | | | | | | | | | | |
9
| | |
| DYNAMIC ASSET ALLOCATION PORTFOLIO |
| PORTFOLIO OF INVESTMENTS | | |
| |
| (continued) | | AB Variable Products Series Fund |
| | | | | | | | | | | | |
| Company | | | | | Shares | | | U.S. $ Value | |
| | | | | | | | | | | | |
TRADING COMPANIES & DISTRIBUTORS–0.5% | | | | | | | | | | | | |
AddTech AB | | | | | | | 606 | | | $ | 16,512 | |
AerCap Holdings NV(b) | | | | | | | 453 | | | | 43,352 | |
Ashtead Group PLC | | | | | | | 1,019 | | | | 63,044 | |
Beijer Ref AB | | | | | | | 897 | | | | 13,238 | |
Brenntag SE | | | | | | | 303 | | | | 18,222 | |
Bunzl PLC | | | | | | | 783 | | | | 32,240 | |
Fastenal Co. | | | | | | | 1,335 | | | | 96,000 | |
Ferguson Enterprises, Inc. | | | | | | | 468 | | | | 81,231 | |
ITOCHU Corp. | | | | | | | 2,801 | | | | 137,737 | |
Marubeni Corp. | | | | | | | 3,308 | | | | 49,648 | |
Mitsubishi Corp. | | | | | | | 7,833 | | | | 128,161 | |
Mitsui & Co., Ltd. | | | | | | | 5,862 | | | | 121,573 | |
MonotaRO Co., Ltd. | | | | | | | 632 | | | | 10,740 | |
Reece Ltd.(b) | | | | | | | 527 | | | | 7,280 | |
Rexel SA | | | | | | | 521 | | | | 13,270 | |
SGH Ltd.(b) | | | | | | | 474 | | | | 13,484 | |
Sumitomo Corp. | | | | | | | 2,589 | | | | 56,029 | |
Toromont Industries Ltd. | | | | | | | 191 | | | | 15,100 | |
Toyota Tsusho Corp. | | | | | | | 1,476 | | | | 26,102 | |
United Rentals, Inc. | | | | | | | 154 | | | | 108,484 | |
Watsco, Inc.(b) | | | | | | | 81 | | | | 38,385 | |
WW Grainger, Inc. | | | | | | | 102 | | | | 107,513 | |
| | | | | | | | | | | | |
| | | | | | | | | | | 1,197,345 | |
| | | | | | | | | | | | |
TRANSPORTATION INFRASTRUCTURE–0.1% | | | | | | | | | | | | |
Aena SME SA | | | | | | | 175 | | | | 35,717 | |
Aeroports de Paris SA | | | | | | | 81 | | | | 9,379 | |
Auckland International Airport Ltd. | | | | | | | 3,527 | | | | 17,168 | |
Getlink SE | | | | | | | 705 | | | | 11,242 | |
Transurban Group(b) | | | | | | | 7,234 | | | | 59,789 | |
| | | | | | | | | | | | |
| | | | | | | | | | | 133,295 | |
| | | | | | | | | | | | |
| | | | | | | | | | | 17,240,033 | |
| | | | | | | | | | | | |
HEALTH CARE–6.7% | | | | | | | | | | | | |
BIOTECHNOLOGY–1.0% | | | | | | | | | | | | |
AbbVie, Inc. | | | | | | | 4,115 | | | | 731,235 | |
Alnylam Pharmaceuticals, Inc.(a) | | | | | | | 299 | | | | 70,358 | |
Amgen, Inc. | | | | | | | 1,252 | | | | 326,321 | |
Argenx SE(a) | | | | | | | 139 | | | | 85,862 | |
Biogen, Inc.(a) | | | | | | | 339 | | | | 51,840 | |
BioMarin Pharmaceutical, Inc.(a) | | | | | | | 444 | | | | 29,184 | |
CSL Ltd. | | | | | | | 1,128 | | | | 196,780 | |
Exact Sciences Corp.(a)(b) | | | | | | | 431 | | | | 24,218 | |
Genmab A/S(a) | | | | | | | 147 | | | | 30,700 | |
Gilead Sciences, Inc. | | | | | | | 2,901 | | | | 267,965 | |
Grifols SA(a) | | | | | | | 695 | | | | 6,568 | |
Incyte Corp.(a) | | | | | | | 381 | | | | 26,316 | |
Moderna, Inc.(a) | | | | | | | 762 | | | | 31,684 | |
Neurocrine Biosciences, Inc.(a) | | | | | | | 235 | | | | 32,078 | |
Regeneron Pharmaceuticals, Inc.(a) | | | | | | | 253 | | | | 180,219 | |
| | | | | | | | | | | | |
| Company | | | | | Shares | | | U.S. $ Value | |
| | | | | | | | | | | | |
Swedish Orphan Biovitrum AB(a) | | | | | | | 456 | | | $ | 13,082 | |
United Therapeutics Corp.(a) | | | | | | | 99 | | | | 34,931 | |
Vertex Pharmaceuticals, Inc.(a) | | | | | | | 601 | | | | 242,023 | |
Zealand Pharma A/S(a) | | | | | | | 149 | | | | 14,822 | |
| | | | | | | | | | | | |
| | | | | | | | | | | 2,396,186 | |
| | | | | | | | | | | | |
HEALTH CARE EQUIPMENT & SUPPLIES–1.4% | | | | | | | | | | | | |
Abbott Laboratories | | | | | | | 4,054 | | | | 458,548 | |
Alcon AG | | | | | | | 1,165 | | | | 98,777 | |
Align Technology, Inc.(a) | | | | | | | 165 | | | | 34,404 | |
Avantor, Inc.(a) | | | | | | | 1,584 | | | | 33,375 | |
Baxter International, Inc. | | | | | | | 1,189 | | | | 34,671 | |
Becton Dickinson & Co. | | | | | | | 674 | | | | 152,910 | |
BioMerieux | | | | | | | 97 | | | | 10,382 | |
Boston Scientific Corp.(a) | | | | | | | 3,431 | | | | 306,457 | |
Carl Zeiss Meditec AG (BR) | | | | | | | 94 | | | | 4,401 | |
Cochlear Ltd. | | | | | | | 153 | | | | 27,399 | |
Coloplast A/S–Class B | | | | | | | 294 | | | | 32,211 | |
Cooper Cos., Inc. (The)(a) | | | | | | | 464 | | | | 42,656 | |
Demant A/S(a) | | | | | | | 206 | | | | 7,582 | |
Dexcom, Inc.(a) | | | | | | | 934 | | | | 72,637 | |
DiaSorin SpA | | | | | | | 52 | | | | 5,364 | |
Edwards Lifesciences Corp.(a) | | | | | | | 1,404 | | | | 103,938 | |
EssilorLuxottica SA | | | | | | | 693 | | | | 169,043 | |
Fisher & Paykel Healthcare Corp., Ltd. | | | | | | | 1,366 | | | | 29,360 | |
GE Healthcare, Inc. | | | | | | | 1,064 | | | | 83,184 | |
Getinge AB–Class B | | | | | | | 533 | | | | 8,743 | |
Hologic, Inc.(a) | | | | | | | 541 | | | | 39,001 | |
Hoya Corp. | | | | | | | 848 | | | | 105,242 | |
IDEXX Laboratories, Inc.(a) | | | | | | | 192 | | | | 79,381 | |
Insulet Corp.(a) | | | | | | | 163 | | | | 42,554 | |
Intuitive Surgical, Inc.(a) | | | | | | | 828 | | | | 432,183 | |
Koninklijke Philips
NV(a)(b) | | | | | | | 1,862 | | | | 47,167 | |
Medtronic PLC | | | | | | | 2,988 | | | | 238,681 | |
Olympus Corp. | | | | | | | 2,780 | | | | 41,506 | |
ResMed, Inc. | | | | | | | 342 | | | | 78,212 | |
Siemens Healthineers AG | | | | | | | 657 | | | | 34,694 | |
Smith & Nephew PLC | | | | | | | 2,037 | | | | 25,243 | |
Solventum Corp.(a) | | | | | | | 342 | | | | 22,593 | |
Sonova Holding AG (REG) | | | | | | | 118 | | | | 38,587 | |
STERIS PLC | | | | | | | 230 | | | | 47,279 | |
Straumann Holding AG (REG) | | | | | | | 260 | | | | 32,750 | |
Stryker Corp. | | | | | | | 799 | | | | 287,680 | |
Sysmex Corp. | | | | | | | 1,173 | | | | 21,507 | |
Teleflex, Inc. | | | | | | | 110 | | | | 19,578 | |
Terumo Corp. | | | | | | | 3,102 | | | | 59,886 | |
Zimmer Biomet Holdings, Inc. | | | | | | | 475 | | | | 50,174 | |
| | | | | | | | | | | | |
| | | | | | | | | | | 3,459,940 | |
| | | | | | | | | | | | |
10
| | |
| |
| | | AB Variable Products Series Fund |
| | | | | | | | | | | | |
| Company | | | | | Shares | | | U.S. $ Value | |
| | | | | | | | | | | | |
HEALTH CARE PROVIDERS & SERVICES–1.0% | | | | | | | | | | | | |
Amplifon SpA(b) | | | | | | | 290 | | | $ | 7,473 | |
Cardinal Health, Inc. | | | | | | | 564 | | | | 66,704 | |
Cencora, Inc. | | | | | | | 413 | | | | 92,793 | |
Centene Corp.(a) | | | | | | | 1,226 | | | | 74,271 | |
Cigna Group (The) | | | | | | | 651 | | | | 179,767 | |
CVS Health Corp. | | | | | | | 2,931 | | | | 131,573 | |
DaVita, Inc.(a) | | | | | | | 108 | | | | 16,151 | |
Elevance Health, Inc. | | | | | | | 540 | | | | 199,206 | |
Fresenius Medical Care AG | | | | | | | 479 | | | | 21,809 | |
Fresenius SE & Co. KGaA(a) | | | | | | | 985 | | | | 34,190 | |
HCA Healthcare, Inc. | | | | | | | 451 | | | | 135,368 | |
Henry Schein, Inc.(a) | | | | | | | 295 | | | | 20,414 | |
Humana, Inc. | | | | | | | 281 | | | | 71,292 | |
Labcorp Holdings, Inc. | | | | | | | 195 | | | | 44,717 | |
McKesson Corp. | | | | | | | 302 | | | | 172,113 | |
Molina Healthcare, Inc.(a) | | | | | | | 137 | | | | 39,874 | |
Quest Diagnostics, Inc. | | | | | | | 259 | | | | 39,073 | |
Ramsay Health Care Ltd.(b) | | | | | | | 429 | | | | 9,155 | |
Sonic Healthcare Ltd. | | | | | | | 1,063 | | | | 17,730 | |
UnitedHealth Group, Inc. | | | | | | | 2,151 | | | | 1,088,105 | |
Universal Health Services, Inc.–Class B | | | | | | | 139 | | | | 24,939 | |
| | | | | | | | | | | | |
| | | | | | | | | | | 2,486,717 | |
| | | | | | | | | | | | |
HEALTH CARE TECHNOLOGY–0.0% | | | | | | | | | | | | |
M3, Inc.(b) | | | | | | | 1,030 | | | | 8,925 | |
Pro Medicus Ltd. | | | | | | | 134 | | | | 20,699 | |
Veeva Systems, Inc.–Class A(a) | | | | | | | 359 | | | | 75,480 | |
| | | | | | | | | | | | |
| | | | | | | | | | | 105,104 | |
| | | | | | | | | | | | |
LIFE SCIENCES TOOLS & SERVICES–0.6% | | | | | | | | | | | | |
Agilent Technologies, Inc. | | | | | | | 670 | | | | 90,008 | |
Bachem Holding AG | | | | | | | 79 | | | | 5,052 | |
Bio-Rad Laboratories, Inc.–Class A(a) | | | | | | | 45 | | | | 14,783 | |
Bio-Techne Corp. | | | | | | | 370 | | | | 26,651 | |
Charles River Laboratories International, Inc.(a)(b) | | | | | | | 120 | | | | 22,152 | |
Danaher Corp. | | | | | | | 1,514 | | | | 347,539 | |
Eurofins Scientific SE | | | | | | | 315 | | | | 16,066 | |
Illumina, Inc.(a)(b) | | | | | | | 370 | | | | 49,443 | |
IQVIA Holdings, Inc.(a) | | | | | | | 425 | | | | 83,517 | |
Lonza Group AG (REG) | | | | | | | 168 | | | | 99,160 | |
Mettler-Toledo International, Inc.(a) | | | | | | | 50 | | | | 61,184 | |
QIAGEN NV(a) | | | | | | | 517 | | | | 23,174 | |
Revvity, Inc. | | | | | | | 287 | | | | 32,032 | |
Sartorius AG (Preference Shares) | | | | | | | 61 | | | | 13,556 | |
Sartorius Stedim Biotech | | | | | | | 68 | | | | 13,275 | |
Thermo Fisher Scientific, Inc. | | | | | | | 890 | | | | 463,005 | |
| | | | | | | | | | | | |
| Company | | | | | Shares | | | U.S. $ Value | |
| | | | | | | | | | | | |
Waters Corp.(a) | | | | | | | 138 | | | $ | 51,195 | |
West Pharmaceutical Services, Inc. | | | | | | | 169 | | | | 55,358 | |
| | | | | | | | | | | | |
| | | | | | | | | | | 1,467,150 | |
| | | | | | | | | | | | |
PHARMACEUTICALS–2.7% | | | | | | | | | | | | |
Astellas Pharma, Inc. | | | | | | | 4,185 | | | | 40,639 | |
AstraZeneca PLC | | | | | | | 3,612 | | | | 470,931 | |
Bayer AG (REG) | | | | | | | 2,290 | | | | 45,743 | |
Bristol-Myers Squibb Co. | | | | | | | 4,723 | | | | 267,133 | |
Chugai Pharmaceutical Co., Ltd. | | | | | | | 1,583 | | | | 69,780 | |
Daiichi Sankyo Co., Ltd. | | | | | | | 4,058 | | | | 111,040 | |
Eisai Co., Ltd. | | | | | | | 545 | | | | 14,840 | |
Eli Lilly & Co. | | | | | | | 1,882 | | | | 1,452,904 | |
Galderma Group AG(a) | | | | | | | 194 | | | | 21,513 | |
GSK PLC | | | | | | | 9,659 | | | | 162,921 | |
Hikma Pharmaceuticals PLC | | | | | | | 388 | | | | 9,673 | |
Ipsen SA | | | | | | | 88 | | | | 10,087 | |
Johnson & Johnson | | | | | | | 5,564 | | | | 804,666 | |
Kyowa Kirin Co., Ltd. | | | | | | | 605 | | | | 9,098 | |
Merck & Co., Inc. | | | | | | | 5,906 | | | | 587,529 | |
Merck KGaA | | | | | | | 301 | | | | 43,802 | |
Novartis AG (REG) | | | | | | | 4,592 | | | | 447,064 | |
Novo Nordisk A/S–Class B | | | | | | | 7,503 | | | | 647,373 | |
Ono Pharmaceutical Co., Ltd. | | | | | | | 894 | | | | 9,308 | |
Orion Oyj–Class B(b) | | | | | | | 252 | | | | 11,167 | |
Otsuka Holdings Co., Ltd. | | | | | | | 1,078 | | | | 58,643 | |
Pfizer, Inc. | | | | | | | 13,202 | | | | 350,249 | |
Recordati Industria Chimica e Farmaceutica SpA(b) | | | | | | | 244 | | | | 12,791 | |
Roche Holding AG (BR) | | | | | | | 75 | | | | 22,402 | |
Roche Holding AG (Genusschein) | | | | | | | 1,637 | | | | 457,716 | |
Royalty Pharma PLC–Class A | | | | | | | 888 | | | | 22,653 | |
Sandoz Group AG | | | | | | | 954 | | | | 39,107 | |
Sanofi SA | | | | | | | 2,661 | | | | 258,678 | |
Shionogi & Co., Ltd. | | | | | | | 1,756 | | | | 24,628 | |
Takeda Pharmaceutical Co., Ltd. | | | | | | | 3,743 | | | | 99,086 | |
Teva Pharmaceutical Industries Ltd. (Sponsored ADR)(a) | | | | | | | 2,640 | | | | 58,186 | |
UCB SA | | | | | | | 295 | | | | 58,724 | |
Viatris, Inc. | | | | | | | 2,807 | | | | 34,947 | |
Zoetis, Inc. | | | | | | | 1,056 | | | | 172,054 | |
| | | | | | | | | | | | |
| | | | | | | | | | | 6,907,075 | |
| | | | | | | | | | | | |
| | | | | | | | | | | 16,822,172 | |
| | | | | | | | | | | | |
COMMUNICATION SERVICES–5.3% | | | | | | | | | | | | |
DIVERSIFIED TELECOMMUNICATION SERVICES–0.7% | | | | | | | | | | | | |
AT&T, Inc. | | | | | | | 16,705 | | | | 380,373 | |
11
| | |
| DYNAMIC ASSET ALLOCATION PORTFOLIO |
| PORTFOLIO OF INVESTMENTS | | |
| |
| (continued) | | AB Variable Products Series Fund |
| | | | | | | | | | | | |
| Company | | | | | Shares | | | U.S. $ Value | |
| | | | | | | | | | | | |
BCE, Inc.(b) | | | | | | | 170 | | | $ | 3,941 | |
BT Group PLC(b) | | | | | | | 15,081 | | | | 27,183 | |
Cellnex Telecom SA(a)(b) | | | | | | | 1,235 | | | | 39,009 | |
Charter Communications, Inc.–Class A(a) | | | | | | | 216 | | | | 74,038 | |
Comcast Corp.–Class A | | | | | | | 9,000 | | | | 337,770 | |
Deutsche Telekom AG (REG) | | | | | | | 8,132 | | | | 243,660 | |
Elisa Oyj | | | | | | | 331 | | | | 14,332 | |
HKT Trust & HKT Ltd.–Class SS | | | | | | | 8,744 | | | | 10,799 | |
Infrastrutture Wireless Italiane SpA | | | | | | | 783 | | | | 7,954 | |
Koninklijke KPN NV | | | | | | | 9,064 | | | | 33,051 | |
Nippon Telegraph & Telephone Corp. | | | | | | | 69,675 | | | | 69,596 | |
Orange SA | | | | | | | 4,340 | | | | 43,304 | |
Quebecor, Inc.–Class B(b) | | | | | | | 370 | | | | 8,108 | |
Singapore Telecommunications Ltd. | | | | | | | 17,333 | | | | 39,048 | |
Swisscom AG (REG) | | | | | | | 60 | | | | 33,393 | |
Telecom Italia SpA/Milano(a)(b) | | | | | | | 23,220 | | | | 5,934 | |
Telefonica SA(b) | | | | | | | 9,251 | | | | 37,752 | |
Telenor ASA | | | | | | | 1,435 | | | | 16,011 | |
Telia Co. AB | | | | | | | 5,497 | | | | 15,279 | |
Telstra Group Ltd. | | | | | | | 9,423 | | | | 23,353 | |
TELUS Corp. | | | | | | | 1,147 | | | | 15,552 | |
Verizon Communications, Inc. | | | | | | | 9,807 | | | | 392,182 | |
Washington H Soul Pattinson & Co., Ltd.(b) | | | | | | | 557 | | | | 11,774 | |
| | | | | | | | | | | | |
| | | | | | | | | | | 1,883,396 | |
| | | | | | | | | | | | |
ENTERTAINMENT–0.9% | | | | | | | | | | | | |
Bollore SE | | | | | | | 1,661 | | | | 10,214 | |
Capcom Co., Ltd. | | | | | | | 836 | | | | 18,186 | |
CTS Eventim AG & Co. KGaA | | | | | | | 145 | | | | 12,258 | |
Electronic Arts, Inc. | | | | | | | 585 | | | | 85,585 | |
Konami Group Corp. | | | | | | | 230 | | | | 21,521 | |
Liberty Media Corp.-Liberty Formula One–Class C(a) | | | | | | | 492 | | | | 45,589 | |
Live Nation Entertainment, Inc.(a) | | | | | | | 376 | | | | 48,692 | |
Netflix, Inc.(a) | | | | | | | 1,000 | | | | 891,320 | |
Nexon Co., Ltd. | | | | | | | 740 | | | | 11,008 | |
Nintendo Co., Ltd. | | | | | | | 2,460 | | | | 143,275 | |
ROBLOX Corp.–Class A(a) | | | | | | | 1,116 | | | | 64,572 | |
Roku, Inc.(a) | | | | | | | 297 | | | | 22,079 | |
Sea Ltd. (ADR)(a) | | | | | | | 863 | | | | 91,564 | |
Spotify Technology SA(a) | | | | | | | 357 | | | | 159,715 | |
Take-Two Interactive Software, Inc.(a) | | | | | | | 409 | | | | 75,289 | |
Toho Co., Ltd./Tokyo | | | | | | | 296 | | | | 11,567 | |
Universal Music Group NV(b) | | | | | | | 1,919 | | | | 49,086 | |
Walt Disney Co. (The) | | | | | | | 4,225 | | | | 470,454 | |
| | | | | | | | | | | | |
| Company | | | | | Shares | | | U.S. $ Value | |
| | | | | | | | | | | | |
Warner Bros Discovery, Inc.(a) | | | | | | | 5,429 | | | $ | 57,384 | |
| | | | | | | | | | | | |
| | | | | | | | | | | 2,289,358 | |
| | | | | | | | | | | | |
INTERACTIVE MEDIA & SERVICES–3.2% | | | | | | | | | | | | |
Alphabet, Inc.–Class A | | | | | | | 13,650 | | | | 2,583,945 | |
Alphabet, Inc.–Class C | | | | | | | 11,711 | | | | 2,230,243 | |
Auto Trader Group PLC | | | | | | | 2,085 | | | | 20,631 | |
CAR Group Ltd. | | | | | | | 880 | | | | 19,583 | |
LY Corp. | | | | | | | 6,635 | | | | 17,544 | |
Match Group, Inc.(a)(b) | | | | | | | 571 | | | | 18,677 | |
Meta Platforms, Inc.–Class A | | | | | | | 5,092 | | | | 2,981,417 | |
Pinterest, Inc.–Class A(a) | | | | | | | 1,407 | | | | 40,803 | |
REA Group Ltd.(b) | | | | | | | 123 | | | | 17,695 | |
Scout24 SE | | | | | | | 175 | | | | 15,442 | |
SEEK Ltd.(b) | | | | | | | 831 | | | | 11,564 | |
Snap, Inc.–Class A(a)(b) | | | | | | | 2,456 | | | | 26,451 | |
| | | | | | | | | | | | |
| | | | | | | | | | | 7,983,995 | |
| | | | | | | | | | | | |
MEDIA–0.2% | | | | | | | | | | | | |
Dentsu Group, Inc. | | | | | | | 426 | | | | 10,237 | |
Fox Corp.–Class A | | | | | | | 519 | | | | 25,213 | |
Fox Corp.–Class B | | | | | | | 329 | | | | 15,049 | |
Informa PLC | | | | | | | 3,100 | | | | 30,918 | |
Interpublic Group of Cos., Inc. (The) | | | | | | | 875 | | | | 24,518 | |
News Corp.–Class A | | | | | | | 884 | | | | 24,345 | |
Omnicom Group, Inc.(b) | | | | | | | 456 | | | | 39,234 | |
Publicis Groupe SA | | | | | | | 533 | | | | 56,743 | |
Trade Desk, Inc. (The)–Class A(a) | | | | | | | 1,046 | | | | 122,936 | |
WPP PLC | | | | | | | 2,513 | | | | 25,904 | |
| | | | | | | | | | | | |
| | | | | | | | | | | 375,097 | |
| | | | | | | | | | | | |
WIRELESS TELECOMMUNICATION SERVICES–0.3% | | | | | | | | | | | | |
KDDI Corp. | | | | | | | 3,568 | | | | 113,643 | |
Rogers Communications, Inc.–Class B(b) | | | | | | | 835 | | | | 25,669 | |
SoftBank Corp. | | | | | | | 66,670 | | | | 84,160 | |
SoftBank Group Corp. | | | | | | | 2,262 | | | | 129,264 | |
T-Mobile US, Inc. | | | | | | | 1,223 | | | | 269,953 | |
Tele2 AB–Class B | | | | | | | 1,274 | | | | 12,580 | |
Vodafone Group PLC | | | | | | | 51,782 | | | | 44,174 | |
| | | | | | | | | | | | |
| | | | | | | | | | | 679,443 | |
| | | | | | | | | | | | |
| | | | | | | | | | | 13,211,289 | |
| | | | | | | | | | | | |
CONSUMER STAPLES–3.9% | | | | | | | | | | | | |
BEVERAGES–0.7% | | | | | | | | | | | | |
Anheuser-Busch InBev SA/NV | | | | | | | 2,094 | | | | 104,834 | |
Asahi Group Holdings Ltd. | | | | | | | 3,392 | | | | 35,584 | |
Brown-Forman Corp.–Class B | | | | | | | 424 | | | | 16,104 | |
Carlsberg AS–Class B | | | | | | | 223 | | | | 21,417 | |
12
| | |
| |
| | | AB Variable Products Series Fund |
| | | | | | | | | | | | |
| Company | | | | | Shares | | | U.S. $ Value | |
| | | | | | | | | | | | |
Coca-Cola Co. (The) | | | | | | | 9,539 | | | $ | 593,898 | |
Coca-Cola Europacific Partners PLC | | | | | | | 483 | | | | 37,099 | |
Coca-Cola HBC AG–Class DI | | | | | | | 506 | | | | 17,286 | |
Constellation Brands, Inc.–Class A | | | | | | | 381 | | | | 84,201 | |
Davide Campari-Milano NV(b) | | | | | | | 1,435 | | | | 8,981 | |
Diageo PLC | | | | | | | 5,185 | | | | 164,768 | |
Heineken Holding NV | | | | | | | 302 | | | | 18,106 | |
Heineken NV(b) | | | | | | | 671 | | | | 47,822 | |
Keurig Dr Pepper, Inc. | | | | | | | 2,687 | | | | 86,306 | |
Kirin Holdings Co., Ltd. | | | | | | | 1,828 | | | | 23,735 | |
Molson Coors Beverage Co.–Class B(b) | | | | | | | 424 | | | | 24,304 | |
Monster Beverage Corp.(a) | | | | | | | 1,712 | | | | 89,983 | |
PepsiCo, Inc. | | | | | | | 3,196 | | | | 485,984 | |
Pernod Ricard SA | | | | | | | 472 | | | | 53,330 | |
Suntory Beverage & Food Ltd. | | | | | | | 338 | | | | 10,739 | |
Treasury Wine Estates Ltd. | | | | | | | 1,891 | | | | 13,246 | |
| | | | | | | | | | | | |
| | | | | | | | | | | 1,937,727 | |
| | | | | | | | | | | | |
CONSUMER STAPLES DISTRIBUTION & RETAIL–1.2% | | | | | | | | | | | | |
Aeon Co., Ltd. | | | | | | | 1,525 | | | | 35,690 | |
Albertsons Cos., Inc.–Class A | | | | | | | 877 | | | | 17,224 | |
Alimentation Couche-Tard, Inc. | | | | | | | 1,768 | | | | 98,052 | |
Carrefour SA | | | | | | | 1,264 | | | | 17,990 | |
Coles Group Ltd.(b) | | | | | | | 3,124 | | | | 36,468 | |
Costco Wholesale Corp. | | | | | | | 1,032 | | | | 945,591 | |
Dollar General Corp. | | | | | | | 513 | | | | 38,896 | |
Dollar Tree, Inc.(a)(b) | | | | | | | 476 | | | | 35,671 | |
Empire Co., Ltd.–Class A | | | | | | | 309 | | | | 9,435 | |
Endeavour Group Ltd./Australia(b) | | | | | | | 3,547 | | | | 9,202 | |
George Weston Ltd. | | | | | | | 137 | | | | 21,305 | |
J Sainsbury PLC | | | | | | | 4,120 | | | | 14,079 | |
Jeronimo Martins SGPS SA | | | | | | | 660 | | | | 12,613 | |
Kesko Oyj–Class B(b) | | | | | | | 636 | | | | 12,000 | |
Kobe Bussan Co., Ltd. | | | | | | | 396 | | | | 8,657 | |
Koninklijke Ahold Delhaize NV | | | | | | | 2,166 | | | | 70,652 | |
Kroger Co. (The) | | | | | | | 1,602 | | | | 97,962 | |
Loblaw Cos., Ltd.(b) | | | | | | | 354 | | | | 46,587 | |
Marks & Spencer Group PLC | | | | | | | 4,779 | | | | 22,381 | |
MatsukiyoCocokara & Co. | | | | | | | 800 | | | | 11,647 | |
Metro, Inc./CN | | | | | | | 493 | | | | 30,919 | |
Seven & i Holdings Co., Ltd. | | | | | | | 5,136 | | | | 80,520 | |
Sysco Corp. | | | | | | | 1,145 | | | | 87,547 | |
Target Corp. | | | | | | | 1,074 | | | | 145,183 | |
Tesco PLC | | | | | | | 15,970 | | | | 73,452 | |
| | | | | | | | | | | | |
| Company | | | | | Shares | | | U.S. $ Value | |
| | | | | | | | | | | | |
Walgreens Boots Alliance, Inc.(b) | | | | | | | 1,710 | | | $ | 15,954 | |
Walmart, Inc. | | | | | | | 10,300 | | | | 930,605 | |
Woolworths Group Ltd. | | | | | | | 2,847 | | | | 53,668 | |
| | | | | | | | | | | | |
| | | | | | | | | | | 2,979,950 | |
| | | | | | | | | | | | |
FOOD PRODUCTS–0.7% | | | | | | | | | | | | |
Ajinomoto Co., Inc. | | | | | | | 1,058 | | | | 43,072 | |
Archer-Daniels-Midland Co. | | | | | | | 1,114 | | | | 56,279 | |
Associated British Foods PLC | | | | | | | 778 | | | | 19,846 | |
Barry Callebaut AG (REG) | | | | | | | 8 | | | | 10,652 | |
Bunge Global SA | | | | | | | 330 | | | | 25,661 | |
Chocoladefabriken Lindt & Spruengli AG | | | | | | | 2 | | | | 22,186 | |
Chocoladefabriken Lindt & Spruengli AG (REG) | | | | | | | 1 | | | | 109,894 | |
Conagra Brands, Inc. | | | | | | | 1,112 | | | | 30,858 | |
Danone SA | | | | | | | 1,505 | | | | 101,708 | |
General Mills, Inc. | | | | | | | 1,294 | | | | 82,518 | |
Hershey Co. (The) | | | | | | | 344 | | | | 58,256 | |
Hormel Foods Corp. | | | | | | | 703 | | | | 22,053 | |
J M Smucker Co. (The) | | | | | | | 248 | | | | 27,310 | |
JDE Peet’s NV(b) | | | | | | | 284 | | | | 4,879 | |
Kellanova | | | | | | | 643 | | | | 52,064 | |
Kerry Group PLC–Class A | | | | | | | 357 | | | | 34,431 | |
Kikkoman Corp. | | | | | | | 1,585 | | | | 17,600 | |
Kraft Heinz Co. (The) | | | | | | | 2,113 | | | | 64,890 | |
Lamb Weston Holdings, Inc. | | | | | | | 332 | | | | 22,188 | |
Lotus Bakeries NV | | | | | | | 1 | | | | 11,193 | |
McCormick & Co., Inc./MD (Non-Voting) | | | | | | | 588 | | | | 44,829 | |
MEIJI Holdings Co., Ltd. | | | | | | | 540 | | | | 10,986 | |
Mondelez International, Inc.–Class A | | | | | | | 3,112 | | | | 185,880 | |
Mowi ASA | | | | | | | 1,084 | | | | 18,578 | |
Nestle SA (REG) | | | | | | | 6,104 | | | | 500,792 | |
Nissin Foods Holdings Co., Ltd. | | | | | | | 492 | | | | 11,886 | |
Orkla ASA | | | | | | | 1,633 | | | | 14,127 | |
Salmar ASA | | | | | | | 154 | | | | 7,319 | |
Saputo, Inc. | | | | | | | 593 | | | | 10,309 | |
The Campbell’s Company(b) | | | | | | | 451 | | | | 18,888 | |
Tyson Foods, Inc.–Class A | | | | | | | 666 | | | | 38,255 | |
WH Group Ltd. | | | | | | | 19,359 | | | | 14,919 | |
Wilmar International Ltd. | | | | | | | 4,113 | | | | 9,335 | |
Yakult Honsha Co., Ltd. | | | | | | | 584 | | | | 11,062 | |
| | | | | | | | | | | | |
| | | | | | | | | | | 1,714,703 | |
| | | | | | | | | | | | |
HOUSEHOLD PRODUCTS–0.6% | | | | | | | | | | | | |
Church & Dwight Co., Inc. | | | | | | | 571 | | | | 59,790 | |
Clorox Co. (The) | | | | | | | 288 | | | | 46,774 | |
Colgate-Palmolive Co. | | | | | | | 1,809 | | | | 164,456 | |
Essity AB–Class B | | | | | | | 1,421 | | | | 37,979 | |
Henkel AG & Co. KGaA | | | | | | | 242 | | | | 18,650 | |
13
| | |
| DYNAMIC ASSET ALLOCATION PORTFOLIO |
| PORTFOLIO OF INVESTMENTS | | |
| |
| (continued) | | AB Variable Products Series Fund |
| | | | | | | | | | | | |
| Company | | | | | Shares | | | U.S. $ Value | |
| | | | | | | | | | | | |
Henkel AG & Co. KGaA (Preference Shares) | | | | | | | 394 | | | $ | 34,568 | |
Kimberly-Clark Corp. | | | | | | | 785 | | | | 102,866 | |
Procter & Gamble Co. (The) | | | | | | | 5,474 | | | | 917,716 | |
Reckitt Benckiser Group PLC | | | | | | | 1,611 | | | | 97,515 | |
Unicharm Corp. | | | | | | | 2,682 | | | | 22,111 | |
| | | | | | | | | | | | |
| | | | | | | | | | | 1,502,425 | |
| | | | | | | | | | | | |
PERSONAL CARE PRODUCTS–0.3% | | | | | | | | | | | | |
Beiersdorf AG | | | | | | | 231 | | | | 29,671 | |
Estee Lauder Cos., Inc. (The)–Class A | | | | | | | 544 | | | | 40,789 | |
Haleon PLC | | | | | | | 17,936 | | | | 84,571 | |
Kao Corp. | | | | | | | 1,093 | | | | 44,224 | |
Kenvue, Inc. | | | | | | | 4,463 | | | | 95,285 | |
L’Oreal SA | | | | | | | 560 | | | | 198,242 | |
Shiseido Co., Ltd. | | | | | | | 963 | | | | 17,029 | |
Unilever PLC (London) | | | | | | | 5,784 | | | | 328,650 | |
| | | | | | | | | | | | |
| | | | | | | | | | | 838,461 | |
| | | | | | | | | | | | |
TOBACCO–0.4% | | | | | | | | | | | | |
Altria Group, Inc. | | | | | | | 3,975 | | | | 207,853 | |
British American Tobacco PLC | | | | | | | 4,642 | | | | 167,505 | |
Imperial Brands PLC | | | | | | | 1,870 | | | | 59,800 | |
Japan Tobacco, Inc. | | | | | | | 2,790 | | | | 71,571 | |
Philip Morris International, Inc. | | | | | | | 3,622 | | | | 435,908 | |
| | | | | | | | | | | | |
| | | | | | | | | | | 942,637 | |
| | | | | | | | | | | | |
| | | | | | | | | | | 9,915,903 | |
| | | | | | | | | | | | |
ENERGY–2.4% | | | | | | | | | | | | |
ENERGY EQUIPMENT & SERVICES–0.1% | | | | | | | | | | | | |
Baker Hughes Co. | | | | | | | 2,315 | | | | 94,961 | |
Halliburton Co. | | | | | | | 2,058 | | | | 55,957 | |
Schlumberger NV | | | | | | | 3,309 | | | | 126,867 | |
Tenaris SA | | | | | | | 948 | | | | 17,897 | |
| | | | | | | | | | | | |
| | | | | | | | | | | 295,682 | |
| | | | | | | | | | | | |
OIL, GAS & CONSUMABLE FUELS–2.3% | | | | | | | | | | | | |
Aker BP ASA | | | | | | | 736 | | | | 14,469 | |
APA Corp.(b) | | | | | | | 862 | | | | 19,904 | |
ARC Resources Ltd.(b) | | | | | | | 1,381 | | | | 25,046 | |
BP PLC | | | | | | | 37,688 | | | | 186,290 | |
Cameco Corp. (Toronto) | | | | | | | 1,014 | | | | 52,137 | |
Canadian Natural Resources Ltd. | | | | | | | 4,925 | | | | 152,055 | |
Cenovus Energy, Inc.(b) | | | | | | | 3,198 | | | | 48,478 | |
Cheniere Energy, Inc. | | | | | | | 527 | | | | 113,236 | |
Chevron Corp. | | | | | | | 4,048 | | | | 586,312 | |
ConocoPhillips | | | | | | | 3,053 | | | | 302,766 | |
Coterra Energy, Inc. | | | | | | | 1,723 | | | | 44,005 | |
Devon Energy Corp. | | | | | | | 1,457 | | | | 47,688 | |
| | | | | | | | | | | | |
| Company | | | | | Shares | | | U.S. $ Value | |
| | | | | | | | | | | | |
Diamondback Energy, Inc. | | | | | | | 444 | | | $ | 72,741 | |
Enbridge, Inc. | | | | | | | 5,073 | | | | 215,314 | |
ENEOS Holdings, Inc. | | | | | | | 6,337 | | | | 33,245 | |
Eni SpA(b) | | | | | | | 5,358 | | | | 73,289 | |
EOG Resources, Inc. | | | | | | | 1,325 | | | | 162,418 | |
EQT Corp. | | | | | | | 1,317 | | | | 60,727 | |
Equinor ASA | | | | | | | 1,953 | | | | 46,323 | |
Expand Energy Corp.(b) | | | | | | | 476 | | | | 47,386 | |
Exxon Mobil Corp. | | | | | | | 10,351 | | | | 1,113,457 | |
Galp Energia SGPS SA | | | | | | | 1,083 | | | | 17,950 | |
Hess Corp. | | | | | | | 646 | | | | 85,924 | |
HF Sinclair Corp. | | | | | | | 378 | | | | 13,249 | |
Idemitsu Kosan Co., Ltd. | | | | | | | 2,120 | | | | 13,964 | |
Imperial Oil Ltd.(b) | | | | | | | 427 | | | | 26,316 | |
Inpex Corp. | | | | | | | 2,018 | | | | 25,389 | |
Keyera Corp. | | | | | | | 534 | | | | 16,331 | |
Kinder Morgan, Inc. | | | | | | | 4,662 | | | | 127,739 | |
Marathon Petroleum Corp. | | | | | | | 780 | | | | 108,810 | |
MEG Energy Corp.(b) | | | | | | | 620 | | | | 10,179 | |
Neste Oyj(b) | | | | | | | 986 | | | | 12,478 | |
Occidental Petroleum Corp. | | | | | | | 1,477 | | | | 72,979 | |
OMV AG | | | | | | | 343 | | | | 13,302 | |
ONEOK, Inc. | | | | | | | 1,361 | | | | 136,644 | |
Ovintiv, Inc. (New York) | | | | | | | 614 | | | | 24,867 | |
Parkland Corp. | | | | | | | 326 | | | | 7,373 | |
Pembina Pipeline Corp.(b) | | | | | | | 1,352 | | | | 49,953 | |
Phillips 66 | | | | | | | 975 | | | | 111,082 | |
Repsol SA | | | | | | | 2,744 | | | | 33,389 | |
Santos Ltd.(b) | | | | | | | 7,570 | | | | 31,347 | |
Shell PLC | | | | | | | 14,454 | | | | 450,546 | |
Suncor Energy, Inc. | | | | | | | 2,941 | | | | 104,979 | |
Targa Resources Corp. | | | | | | | 485 | | | | 86,573 | |
TC Energy Corp. | | | | | | | 2,418 | | | | 112,687 | |
Texas Pacific Land Corp. | | | | | | | 46 | | | | 50,874 | |
TotalEnergies SE | | | | | | | 5,027 | | | | 280,079 | |
Tourmaline Oil Corp.(b) | | | | | | | 822 | | | | 38,039 | |
Valero Energy Corp. | | | | | | | 747 | | | | 91,575 | |
Williams Cos., Inc. (The) | | | | | | | 2,840 | | | | 153,701 | |
Woodside Energy Group Ltd.(b) | | | | | | | 4,425 | | | | 68,521 | |
| | | | | | | | | | | | |
| | | | | | | | | | | 5,794,125 | |
| | | | | | | | | | | | |
| | | | | | | | | | | 6,089,807 | |
| | | | | | | | | | | | |
MATERIALS–2.1% | | | | | | | | | | | | |
CHEMICALS–1.0% | | | | | | | | | | | | |
Air Liquide SA | | | | | | | 1,347 | | | | 218,968 | |
Air Products and Chemicals, Inc. | | | | | | | 518 | | | | 150,241 | |
Akzo Nobel NV(b) | | | | | | | 398 | | | | 23,889 | |
Albemarle Corp.(b) | | | | | | | 274 | | | | 23,586 | |
Arkema SA | | | | | | | 131 | | | | 9,968 | |
Asahi Kasei Corp. | | | | | | | 2,875 | | | | 19,809 | |
BASF SE | | | | | | | 2,080 | | | | 91,210 | |
Celanese Corp. | | | | | | | 255 | | | | 17,649 | |
CF Industries Holdings, Inc. | | | | | | | 420 | | | | 35,834 | |
Clariant AG (REG) | | | | | | | 503 | | | | 5,614 | |
Corteva, Inc. | | | | | | | 1,613 | | | | 91,877 | |
Covestro AG(a) | | | | | | | 418 | | | | 25,113 | |
14
| | |
| |
| | | AB Variable Products Series Fund |
| | | | | | | | | | | | |
| Company | | | | | Shares | | | U.S. $ Value | |
| | | | | | | | | | | | |
Croda International PLC | | | | | | | 309 | | | $ | 13,070 | |
Dow, Inc. | | | | | | | 1,634 | | | | 65,572 | |
DSM-Firmenich AG | | | | | | | 433 | | | | 43,769 | |
DuPont de Nemours, Inc. | | | | | | | 973 | | | | 74,191 | |
Eastman Chemical Co. | | | | | | | 272 | | | | 24,839 | |
Ecolab, Inc. | | | | | | | 597 | | | | 139,889 | |
EMS-Chemie Holding AG (REG) | | | | | | | 16 | | | | 10,796 | |
Evonik Industries AG | | | | | | | 597 | | | | 10,377 | |
Givaudan SA (REG) | | | | | | | 22 | | | | 96,171 | |
ICL Group Ltd. | | | | | | | 1,804 | | | | 8,910 | |
IMCD NV(b) | | | | | | | 133 | | | | 19,765 | |
International Flavors & Fragrances, Inc. | | | | | | | 596 | | | | 50,392 | |
Linde PLC | | | | | | | 1,112 | | | | 465,561 | |
LyondellBasell Industries NV–Class A | | | | | | | 606 | | | | 45,008 | |
Mitsubishi Chemical Group Corp. | | | | | | | 3,205 | | | | 16,187 | |
Mitsui Chemicals, Inc. | | | | | | | 440 | | | | 9,605 | |
Mosaic Co. (The) | | | | | | | 742 | | | | 18,238 | |
Nippon Paint Holdings Co., Ltd. | | | | | | | 2,222 | | | | 14,346 | |
Nippon Sanso Holdings Corp. | | | | | | | 450 | | | | 12,487 | |
Nitto Denko Corp. | | | | | | | 1,670 | | | | 27,920 | |
Novonesis (Novozymes) B | | | | | | | 821 | | | | 46,523 | |
Nutrien Ltd.(b) | | | | | | | 1,153 | | | | 51,592 | |
Orica Ltd. | | | | | | | 1,153 | | | | 11,820 | |
PPG Industries, Inc. | | | | | | | 544 | | | | 64,981 | |
RPM International, Inc. | | | | | | | 300 | | | | 36,918 | |
Sherwin-Williams Co. (The) | | | | | | | 558 | | | | 189,681 | |
Shin-Etsu Chemical Co., Ltd. | | | | | | | 4,245 | | | | 139,818 | |
Sika AG (REG) | | | | | | | 355 | | | | 84,706 | |
Syensqo SA(b) | | | | | | | 173 | | | | 12,634 | |
Symrise AG | | | | | | | 309 | | | | 32,962 | |
Toray Industries, Inc. | | | | | | | 3,253 | | | | 20,598 | |
Westlake Corp. | | | | | | | 90 | | | | 10,319 | |
Yara International ASA | | | | | | | 386 | | | | 10,218 | |
| | | | | | | | | | | | |
| | | | | | | | | | | 2,593,621 | |
| | | | | | | | | | | | |
CONSTRUCTION MATERIALS–0.2% | | | | | | | | | | | | |
CRH PLC | | | | | | | 1,597 | | | | 147,754 | |
Heidelberg Materials AG | | | | | | | 318 | | | | 39,293 | |
Holcim AG | | | | | | | 1,215 | | | | 116,986 | |
James Hardie Industries PLC(a) | | | | | | | 1,001 | | | | 30,852 | |
Martin Marietta Materials, Inc. | | | | | | | 142 | | | | 73,343 | |
Vulcan Materials Co. | | | | | | | 308 | | | | 79,227 | |
| | | | | | | | | | | | |
| | | | | | | | | | | 487,455 | |
| | | | | | | | | | | | |
CONTAINERS & PACKAGING–0.1% | | | | | | | | | | | | |
Amcor PLC | | | | | | | 3,369 | | | | 31,702 | |
Avery Dennison Corp. | | | | | | | 188 | | | | 35,181 | |
| | | | | | | | | | | | |
| Company | | | | | Shares | | | U.S. $ Value | |
| | | | | | | | | | | | |
Ball Corp. | | | | | | | 708 | | | $ | 39,032 | |
CCL Industries, Inc.–Class B | | | | | | | 349 | | | | 17,954 | |
Crown Holdings, Inc. | | | | | | | 281 | | | | 23,236 | |
International Paper Co.(b) | | | | | | | 769 | | | | 41,388 | |
Packaging Corp. of America | | | | | | | 209 | | | | 47,052 | |
SIG Group AG | | | | | | | 713 | | | | 14,098 | |
Smurfit WestRock PLC | | | | | | | 1,212 | | | | 65,278 | |
| | | | | | | | | | | | |
| | | | | | | | | | | 314,921 | |
| | | | | | | | | | | | |
METALS & MINING–0.7% | | | | | | | | | | | | |
Agnico Eagle Mines Ltd.(b) | | | | | | | 1,169 | | | | 91,458 | |
Anglo American PLC | | | | | | | 2,962 | | | | 87,578 | |
Antofagasta PLC | | | | | | | 919 | | | | 18,205 | |
ArcelorMittal SA | | | | | | | 1,093 | | | | 25,395 | |
Barrick Gold Corp. (Toronto) | | | | | | | 4,086 | | | | 63,360 | |
BHP Group Ltd. | | | | | | | 11,821 | | | | 288,370 | |
BlueScope Steel Ltd. | | | | | | | 1,022 | | | | 11,817 | |
Boliden AB | | | | | | | 637 | | | | 17,922 | |
Endeavour Mining PLC | | | | | | | 427 | | | | 7,627 | |
First Quantum Minerals Ltd.(a) | | | | | | | 1,652 | | | | 21,296 | |
Fortescue Ltd.(b) | | | | | | | 3,947 | | | | 44,445 | |
Franco-Nevada Corp. | | | | | | | 448 | | | | 52,646 | |
Freeport-McMoRan, Inc. | | | | | | | 3,348 | | | | 127,492 | |
Glencore PLC(a) | | | | | | | 24,169 | | | | 106,444 | |
Ivanhoe Mines Ltd.–Class A(a)(b) | | | | | | | 1,731 | | | | 20,544 | |
JFE Holdings, Inc. | | | | | | | 1,378 | | | | 15,516 | |
Kinross Gold Corp. | | | | | | | 2,864 | | | | 26,599 | |
Lundin Mining Corp.(b) | | | | | | | 1,539 | | | | 13,244 | |
Mineral Resources Ltd. | | | | | | | 412 | | | | 8,695 | |
Newmont Corp. (New York) | | | | | | | 2,665 | | | | 99,191 | |
Nippon Steel Corp. | | | | | | | 2,095 | | | | 42,100 | |
Norsk Hydro ASA | | | | | | | 3,277 | | | | 18,026 | |
Northern Star Resources Ltd. | | | | | | | 2,679 | | | | 25,454 | |
Nucor Corp. | | | | | | | 553 | | | | 64,541 | |
Pan American Silver Corp.(b) | | | | | | | 846 | | | | 17,115 | |
Reliance, Inc. | | | | | | | 129 | | | | 34,735 | |
Rio Tinto Ltd.(b) | | | | | | | 865 | | | | 62,724 | |
Rio Tinto PLC | | | | | | | 2,627 | | | | 155,072 | |
South32 Ltd. | | | | | | | 10,552 | | | | 22,134 | |
Steel Dynamics, Inc. | | | | | | | 342 | | | | 39,012 | |
Sumitomo Metal Mining Co., Ltd.(b) | | | | | | | 572 | | | | 13,041 | |
Teck Resources Ltd.–Class B | | | | | | | 1,062 | | | | 43,058 | |
Wheaton Precious Metals Corp.(b) | | | | | | | 1,057 | | | | 59,495 | |
| | | | | | | | | | | | |
| | | | | | | | | | | 1,744,351 | |
| | | | | | | | | | | | |
PAPER & FOREST PRODUCTS–0.1% | | | | | | | | | | | | |
Holmen AB–Class B | | | | | | | 178 | | | | 6,529 | |
15
| | |
| DYNAMIC ASSET ALLOCATION PORTFOLIO |
| PORTFOLIO OF INVESTMENTS | | |
| |
| (continued) | | AB Variable Products Series Fund |
| | | | | | | | | | | | |
| Company | | | | | Shares | | | U.S. $ Value | |
| | | | | | | | | | | | |
Mondi PLC | | | | | | | 1,029 | | | $ | 15,319 | |
Stora Enso Oyj–Class R(b) | | | | | | | 1,356 | | | | 13,647 | |
Svenska Cellulosa AB SCA–Class B | | | | | | | 1,413 | | | | 17,922 | |
UPM-Kymmene Oyj(b) | | | | | | | 1,244 | | | | 34,210 | |
West Fraser Timber Co., Ltd.(b) | | | | | | | 127 | | | | 11,004 | |
| | | | | | | | | | | | |
| | | | | | | | | | | 98,631 | |
| | | | | | | | | | | | |
| | | | | | | | | | | 5,238,979 | |
| | | | | | | | | | | | |
UTILITIES–1.6% | | | | | | | | | | | | |
ELECTRIC UTILITIES–1.0% | | | | | | | | | | | | |
Acciona SA(b) | | | | | | | 58 | | | | 6,527 | |
Alliant Energy Corp. | | | | | | | 598 | | | | 35,366 | |
American Electric Power Co., Inc. | | | | | | | 1,240 | | | | 114,365 | |
BKW AG | | | | | | | 49 | | | | 8,118 | |
Chubu Electric Power Co., Inc. | | | | | | | 1,539 | | | | 16,146 | |
CK Infrastructure Holdings Ltd. | | | | | | | 1,403 | | | | 10,415 | |
CLP Holdings Ltd. | | | | | | | 3,629 | | | | 30,437 | |
Constellation Energy Corp. | | | | | | | 729 | | | | 163,085 | |
Duke Energy Corp. | | | | | | | 1,799 | | | | 193,824 | |
Edison International | | | | | | | 900 | | | | 71,856 | |
EDP SA | | | | | | | 7,312 | | | | 23,391 | |
Elia Group SA/NV(b) | | | | | | | 69 | | | | 5,309 | |
Emera, Inc. | | | | | | | 672 | | | | 25,118 | |
Endesa SA | | | | | | | 740 | | | | 15,913 | |
Enel SpA | | | | | | | 18,955 | | | | 135,266 | |
Entergy Corp. | | | | | | | 996 | | | | 75,517 | |
Evergy, Inc. | | | | | | | 536 | | | | 32,991 | |
Eversource Energy | | | | | | | 833 | | | | 47,839 | |
Exelon Corp. | | | | | | | 2,332 | | | | 87,777 | |
FirstEnergy Corp.(b) | | | | | | | 1,275 | | | | 50,720 | |
Fortis, Inc./Canada | | | | | | | 1,154 | | | | 47,952 | |
Fortum Oyj(b) | | | | | | | 1,045 | | | | 14,630 | |
Hydro One Ltd.(c) | | | | | | | 768 | | | | 23,653 | |
Iberdrola SA(b) | | | | | | | 14,086 | | | | 194,108 | |
Kansai Electric Power Co., Inc. (The)(b) | | | | | | | 1,671 | | | | 18,521 | |
Mercury NZ Ltd. | | | | | | | 1,631 | | | | 5,337 | |
NextEra Energy, Inc. | | | | | | | 4,821 | | | | 345,618 | |
NRG Energy, Inc. | | | | | | | 481 | | | | 43,396 | |
Origin Energy Ltd. | | | | | | | 4,015 | | | | 27,045 | |
PG&E Corp. | | | | | | | 4,732 | | | | 95,492 | |
Power Assets Holdings Ltd. | | | | | | | 3,358 | | | | 23,386 | |
PPL Corp. | | | | | | | 1,720 | | | | 55,831 | |
Redeia Corp. SA | | | | | | | 946 | | | | 16,154 | |
Southern Co. (The) | | | | | | | 2,550 | | | | 209,916 | |
SSE PLC | | | | | | | 2,573 | | | | 51,574 | |
Terna–Rete Elettrica Nazionale(b) | | | | | | | 3,279 | | | | 25,910 | |
Tokyo Electric Power Co. Holdings, Inc.(a) | | | | | | | 3,584 | | | | 10,713 | |
Verbund AG | | | | | | | 159 | | | | 11,529 | |
Xcel Energy, Inc. | | | | | | | 1,299 | | | | 87,708 | |
| | | | | | | | | | | | |
| | | | | | | | | | | 2,458,453 | |
| | | | | | | | | | | | |
| | | | | | | | | | | | |
| Company | | | | | Shares | | | U.S. $ Value | |
| | | | | | | | | | | | |
GAS UTILITIES–0.1% | | | | | | | | | | | | |
AltaGas Ltd.(b) | | | | | | | 694 | | | $ | 16,164 | |
APA Group | | | | | | | 3,017 | | | | 12,989 | |
Atmos Energy Corp. | | | | | | | 362 | | | | 50,416 | |
Hong Kong & China Gas Co., Ltd. | | | | | | | 25,787 | | | | 20,547 | |
Osaka Gas Co., Ltd. | | | | | | | 840 | | | | 18,372 | |
Snam SpA(b) | | | | | | | 4,699 | | | | 20,829 | |
Tokyo Gas Co., Ltd. | | | | | | | 750 | | | | 20,780 | |
| | | | | | | | | | | | |
| | | | | | | | | | | 160,097 | |
| | | | | | | | | | | | |
INDEPENDENT POWER AND RENEWABLE ELECTRICITY PRODUCERS–0.1% | | | | | | | | | | | | |
AES Corp. (The) | | | | | | | 1,657 | | | | 21,325 | |
Brookfield Renewable Corp. | | | | | | | 314 | | | | 8,690 | |
EDP Renovaveis SA(b) | | | | | | | 727 | | | | 7,551 | |
Meridian Energy Ltd. | | | | | | | 3,037 | | | | 10,042 | |
Orsted AS(a) | | | | | | | 392 | | | | 17,700 | |
RWE AG | | | | | | | 1,474 | | | | 44,019 | |
Vistra Corp. | | | | | | | 801 | | | | 110,434 | |
| | | | | | | | | | | | |
| | | | | | | | | | | 219,761 | |
| | | | | | | | | | | | |
MULTI-UTILITIES–0.4% | | | | | | | | | | | | |
Ameren Corp. | | | | | | | 622 | | | | 55,445 | |
Canadian Utilities Ltd.–Class A | | | | | | | 310 | | | | 7,516 | |
CenterPoint Energy, Inc. | | | | | | | 1,519 | | | | 48,198 | |
Centrica PLC | | | | | | | 12,015 | | | | 20,046 | |
CMS Energy Corp. | | | | | | | 696 | | | | 46,388 | |
Consolidated Edison, Inc. | | | | | | | 807 | | | | 72,009 | |
Dominion Energy, Inc. | | | | | | | 1,955 | | | | 105,296 | |
DTE Energy Co. | | | | | | | 483 | | | | 58,322 | |
E.ON SE | | | | | | | 5,233 | | | | 60,954 | |
Engie SA | | | | | | | 4,257 | | | | 67,513 | |
National Grid PLC | | | | | | | 11,386 | | | | 135,269 | |
NiSource, Inc. | | | | | | | 1,045 | | | | 38,414 | |
Public Service Enterprise Group, Inc. | | | | | | | 1,161 | | | | 98,093 | |
Sembcorp Industries Ltd. | | | | | | | 2,000 | | | | 8,091 | |
Sempra | | | | | | | 1,476 | | | | 129,475 | |
Veolia Environnement SA | | | | | | | 1,640 | | | | 46,014 | |
WEC Energy Group, Inc.(b) | | | | | | | 737 | | | | 69,308 | |
| | | | | | | | | | | | |
| | | | | | | | | | | 1,066,351 | |
| | | | | | | | | | | | |
WATER UTILITIES–0.0% | | | | | | | | | | | | |
American Water Works Co., Inc. | | | | | | | 454 | | | | 56,518 | |
Essential Utilities, Inc. | | | | | | | 606 | | | | 22,010 | |
Severn Trent PLC | | | | | | | 629 | | | | 19,721 | |
United Utilities Group PLC | | | | | | | 1,589 | | | | 20,903 | |
| | | | | | | | | | | | |
| | | | | | | | | | | 119,152 | |
| | | | | | | | | | | | |
| | | | | | | | | | | 4,023,814 | |
| | | | | | | | | | | | |
REAL ESTATE–1.3% | | | | | | | | | | | | |
DIVERSIFIED REITs–0.0% | | | | | | | | | | | | |
Covivio SA/France | | | | | | | 130 | | | | 6,589 | |
GPT Group (The) | | | | | | | 4,463 | | | | 12,023 | |
16
| | |
| |
| | | AB Variable Products Series Fund |
| | | | | | | | | | | | |
| Company | | | | | Shares | | | U.S. $ Value | |
| | | | | | | | | | | | |
Land Securities Group PLC | | | | | | | 1,649 | | | $ | 12,042 | |
Mirvac Group(b) | | | | | | | 9,194 | | | | 10,633 | |
Stockland | | | | | | | 5,562 | | | | 16,497 | |
WP Carey, Inc.(b) | | | | | | | 510 | | | | 27,785 | |
| | | | | | | | | | | | |
| | | | | | | | | | | 85,569 | |
| | | | | | | | | | | | |
HEALTH CARE REITs–0.1% | | | | | | | | | | | | |
Alexandria Real Estate Equities, Inc. | | | | | | | 367 | | | | 35,801 | |
Healthpeak Properties, Inc. | | | | | | | 1,630 | | | | 33,040 | |
Ventas, Inc. | | | | | | | 967 | | | | 56,947 | |
Welltower, Inc. | | | | | | | 1,441 | | | | 181,609 | |
| | | | | | | | | | | | |
| | | | | | | | | | | 307,397 | |
| | | | | | | | | | | | |
HOTEL & RESORT REITs–0.0% | | | | | | | | | | | | |
Host Hotels & Resorts, Inc. | | | | | | | 1,637 | | | | 28,680 | |
| | | | | | | | | | | | |
INDUSTRIAL REITs–0.1% | | | | | | | | | | | | |
CapitaLand Ascendas REIT | | | | | | | 8,639 | | | | 16,224 | |
Goodman Group | | | | | | | 4,010 | | | | 88,148 | |
Prologis, Inc. | | | | | | | 2,157 | | | | 227,995 | |
Segro PLC(b) | | | | | | | 2,995 | | | | 26,269 | |
Warehouses De Pauw CVA(b) | | | | | | | 420 | | | | 8,256 | |
| | | | | | | | | | | | |
| | | | | | | | | | | 366,892 | |
| | | | | | | | | | | | |
OFFICE REITs–0.0% | | | | | | | | | | | | |
BXP, Inc. | | | | | | | 350 | | | | 26,026 | |
Gecina SA | | | | | | | 107 | | | | 10,024 | |
Japan Real Estate Investment Corp. | | | | | | | 15 | | | | 10,293 | |
Nippon Building Fund, Inc.(b) | | | | | | | 18 | | | | 14,002 | |
| | | | | | | | | | | | |
| | | | | | | | | | | 60,345 | |
| | | | | | | | | | | | |
REAL ESTATE MANAGEMENT & DEVELOPMENT–0.3% | | | | | | | | | | | | |
Azrieli Group Ltd. | | | | | | | 99 | | | | 8,171 | |
CapitaLand Investment Ltd./Singapore | | | | | | | 5,504 | | | | 10,552 | |
CBRE Group, Inc.–Class A(a) | | | | | | | 714 | | | | 93,741 | |
CK Asset Holdings Ltd. | | | | | | | 4,531 | | | | 18,493 | |
CoStar Group, Inc.(a) | | | | | | | 955 | | | | 68,368 | |
Daito Trust Construction Co., Ltd. | | | | | | | 183 | | | | 20,458 | |
Daiwa House Industry Co., Ltd. | | | | | | | 1,344 | | | | 41,262 | |
Fastighets AB Balder–Class B(a) | | | | | | | 1,544 | | | | 10,746 | |
FirstService Corp. | | | | | | | 94 | | | | 17,028 | |
Henderson Land Development Co., Ltd. | | | | | | | 2,938 | | | | 8,906 | |
Hongkong Land Holdings Ltd. | | | | | | | 2,595 | | | | 11,555 | |
Hulic Co., Ltd. | | | | | | | 901 | | | | 7,826 | |
LEG Immobilien SE | | | | | | | 174 | | | | 14,758 | |
Mitsubishi Estate Co., Ltd. | | | | | | | 2,535 | | | | 35,190 | |
| | | | | | | | | | | | |
| Company | | | | | Shares | | | U.S. $ Value | |
| | | | | | | | | | | | |
Mitsui Fudosan Co., Ltd. | | | | | | | 6,207 | | | $ | 49,639 | |
Sagax AB–Class B | | | | | | | 512 | | | | 10,507 | |
Sino Land Co., Ltd. | | | | | | | 8,242 | | | | 8,317 | |
Sumitomo Realty & Development Co., Ltd. | | | | | | | 715 | | | | 22,236 | |
Sun Hung Kai Properties Ltd. | | | | | | | 3,616 | | | | 34,408 | |
Swiss Prime Site AG (REG) | | | | | | | 180 | | | | 19,619 | |
Unibail-Rodamco-Westfield(a) | | | | | | | 276 | | | | 20,787 | |
Vonovia SE | | | | | | | 1,726 | | | | 52,544 | |
Wharf Holdings Ltd. (The) | | | | | | | 2,000 | | | | 5,612 | |
Wharf Real Estate Investment Co., Ltd. | | | | | | | 3,876 | | | | 9,859 | |
Zillow Group, Inc.–Class C(a) | | | | | | | 358 | | | | 26,510 | |
| | | | | | | | | | | | |
| | | | | | | | | | | 627,092 | |
| | | | | | | | | | | | |
RESIDENTIAL REITs–0.2% | | | | | | | | | | | | |
American Homes 4 Rent–Class A | | | | | | | 767 | | | | 28,701 | |
AvalonBay Communities, Inc. | | | | | | | 331 | | | | 72,810 | |
Camden Property Trust | | | | | | | 249 | | | | 28,894 | |
Canadian Apartment Properties REIT | | | | | | | 191 | | | | 5,665 | |
Equity LifeStyle Properties, Inc. | | | | | | | 413 | | | | 27,506 | |
Equity Residential | | | | | | | 795 | | | | 57,049 | |
Essex Property Trust, Inc. | | | | | | | 150 | | | | 42,816 | |
Invitation Homes, Inc. | | | | | | | 1,356 | | | | 43,351 | |
Mid-America Apartment Communities, Inc. | | | | | | | 272 | | | | 42,043 | |
Sun Communities, Inc. | | | | | | | 291 | | | | 35,784 | |
UDR, Inc. | | | | | | | 730 | | | | 31,689 | |
| | | | | | | | | | | | |
| | | | | | | | | | | 416,308 | |
| | | | | | | | | | | | |
RETAIL REITs–0.2% | | | | | | | | | | | | |
CapitaLand Integrated Commercial Trust | | | | | | | 13,354 | | | | 18,832 | |
Kimco Realty Corp. | | | | | | | 1,571 | | | | 36,809 | |
Klepierre SA | | | | | | | 501 | | | | 14,429 | |
Link REIT | | | | | | | 5,973 | | | | 25,119 | |
Realty Income Corp. | | | | | | | 2,030 | | | | 108,422 | |
Regency Centers Corp. | | | | | | | 402 | | | | 29,720 | |
Scentre Group | | | | | | | 12,121 | | | | 25,658 | |
Simon Property Group, Inc. | | | | | | | 760 | | | | 130,880 | |
Vicinity Ltd. | | | | | | | 9,016 | | | | 11,685 | |
| | | | | | | | | | | | |
| | | | | | | | | | | 401,554 | |
| | | | | | | | | | | | |
SPECIALIZED REITs–0.4% | | | | | | | | | | | | |
American Tower Corp. | | | | | | | 1,088 | | | | 199,550 | |
Crown Castle, Inc. | | | | | | | 1,013 | | | | 91,940 | |
Digital Realty Trust, Inc. | | | | | | | 763 | | | | 135,303 | |
Equinix, Inc. | | | | | | | 221 | | | | 208,379 | |
Extra Space Storage, Inc. | | | | | | | 494 | | | | 73,902 | |
Gaming and Leisure Properties, Inc.(b) | | | | | | | 640 | | | | 30,822 | |
Iron Mountain, Inc. | | | | | | | 684 | | | | 71,895 | |
17
| | |
| DYNAMIC ASSET ALLOCATION PORTFOLIO |
| PORTFOLIO OF INVESTMENTS | | |
| |
| (continued) | | AB Variable Products Series Fund |
| | | | | | | | | | | | |
| Company | | | | | Shares | | | U.S. $ Value | |
| | | | | | | | | | | | |
Public Storage | | | | | | | 367 | | | $ | 109,895 | |
SBA Communications Corp. | | | | | | | 250 | | | | 50,950 | |
VICI Properties, Inc. | | | | | | | 2,441 | | | | 71,302 | |
Weyerhaeuser Co. | | | | | | | 1,695 | | | | 47,714 | |
| | | | | | | | | | | | |
| | | | | | | | | | | 1,091,652 | |
| | | | | | | | | | | | |
| | | | | | | | | | | 3,385,489 | |
| | | | | | | | | | | | |
Total Common Stocks
(cost $67,220,207) | | | | | | | | | | | 162,674,818 | |
| | | | | | | | | | | | |
| | | Principal
Amount
(000) | | | | |
GOVERNMENTS– TREASURIES–33.7% | | | | | | | | | | | | |
UNITED STATES–33.7% | | | | | | | | | | | | |
U.S. Treasury Bonds | | | | | | | | | | | | |
1.25%, 05/15/2050 | | | $ | | | | 552 | | | | 262,170 | |
2.25%, 08/15/2046 | | | | | | | 3,477 | | | | 2,246,947 | |
2.25%, 08/15/2049 | | | | | | | 287 | | | | 177,940 | |
2.25%, 02/15/2052 | | | | | | | 2,286 | | | | 1,387,727 | |
2.375%, 11/15/2049 | | | | | | | 584 | | | | 371,252 | |
2.375%, 05/15/2051 | | | | | | | 1,859 | | | | 1,170,526 | |
2.50%, 02/15/2045 | | | | | | | 212 | | | | 147,485 | |
2.50%, 05/15/2046 | | | | | | | 42 | | | | 28,830 | |
2.75%, 08/15/2047 | | | | | | | 143 | | | | 100,892 | |
2.875%, 05/15/2043 | | | | | | | 221 | | | | 167,325 | |
2.875%, 08/15/2045 | | | | | | | 2,897 | | | | 2,138,643 | |
2.875%, 11/15/2046 | | | | | | | 187 | | | | 135,693 | |
2.875%, 05/15/2049 | | | | | | | 313 | | | | 222,345 | |
2.875%, 05/15/2052 | | | | | | | 417 | | | | 292,240 | |
3.00%, 05/15/2045 | | | | | | | 265 | | | | 200,406 | |
3.00%, 02/15/2047 | | | | | | | 238 | | | | 176,344 | |
3.00%, 05/15/2047 | | | | | | | 409 | | | | 302,818 | |
3.00%, 02/15/2048 | | | | | | | 350 | | | | 257,252 | |
3.00%, 08/15/2048 | | | | | | | 792 | | | | 579,442 | |
3.00%, 02/15/2049 | | | | | | | 257 | | | | 186,990 | |
3.125%, 02/15/2043 | | | | | | | 487 | | | | 384,414 | |
3.50%, 02/15/2039 | | | | | | | 555 | | | | 486,668 | |
3.625%, 08/15/2043 | | | | | | | 1,869 | | | | 1,584,015 | |
3.625%, 05/15/2053 | | | | | | | 1,351 | | | | 1,099,976 | |
3.75%, 11/15/2043 | | | | | | | 123 | | | | 106,250 | |
4.00%, 11/15/2052 | | | | | | | 208 | | | | 181,306 | |
4.25%, 05/15/2039 | | | | | | | 134 | | | | 127,068 | |
4.25%, 08/15/2054 | | | | | | | 214 | | | | 195,719 | |
4.375%, 11/15/2039 | | | | | | | 502 | | | | 481,641 | |
4.375%, 08/15/2043 | | | | | | | 128 | | | | 120,843 | |
4.50%, 08/15/2039 | | | | | | | 179 | | | | 174,107 | |
4.75%, 02/15/2037 | | | | | | | 651 | | | | 660,053 | |
4.75%, 11/15/2053 | | | | | | | 352 | | | | 348,711 | |
5.25%, 11/15/2028 | | | | | | | 2,017 | | | | 2,075,825 | |
5.375%, 02/15/2031 | | | | | | | 359 | | | | 375,107 | |
5.50%, 08/15/2028 | | | | | | | 762 | | | | 791,826 | |
6.00%, 02/15/2026 | | | | | | | 856 | | | | 869,204 | |
6.125%, 11/15/2027 | | | | | | | 1,389 | | | | 1,454,753 | |
6.25%, 05/15/2030 | | | | | | | 374 | | | | 406,116 | |
| | | | | | | | | | | | |
| Company | |
Principal
Amount
(000) | | | U.S. $ Value | |
| | | | | | | | | | | | |
U.S. Treasury Notes | | | | | | | | | | | | |
0.50%, 02/28/2026 | | | $ | | | | 1,120 | | | $ | 1,072,733 | |
0.625%, 05/15/2030 | | | | | | | 934 | | | | 765,990 | |
0.625%, 08/15/2030 | | | | | | | 997 | | | | 809,839 | |
0.75%, 05/31/2026 | | | | | | | 1,952 | | | | 1,858,499 | |
0.75%, 08/31/2026 | | | | | | | 1,015 | | | | 958,288 | |
0.875%, 09/30/2026 | | | | | | | 1,513 | | | | 1,427,327 | |
1.00%, 07/31/2028 | | | | | | | 2,116 | | | | 1,882,973 | |
1.125%, 10/31/2026 | | | | | | | 1,163 | | | | 1,099,398 | |
1.25%, 12/31/2026 | | | | | | | 919 | | | | 866,211 | |
1.375%, 11/15/2031 | | | | | | | 407 | | | | 332,205 | |
1.50%, 08/15/2026 | | | | | | | 1,541 | | | | 1,475,026 | |
1.50%, 02/15/2030 | | | | | | | 523 | | | | 453,774 | |
1.625%, 02/15/2026 | | | | | | | 640 | | | | 621,503 | |
1.625%, 05/15/2031 | | | | | | | 3,081 | | | | 2,598,631 | |
1.75%, 11/15/2029 | | | | | | | 984 | | | | 872,466 | |
1.875%, 02/15/2032 | | | | | | | 1,787 | | | | 1,503,035 | |
2.00%, 11/15/2026 | | | | | | | 4,808 | | | | 4,613,618 | |
2.25%, 08/15/2027 | | | | | | | 2,292 | | | | 2,177,831 | |
2.25%, 11/15/2027 | | | | | | | 3,588 | | | | 3,392,159 | |
2.375%, 05/15/2027 | | | | | | | 4,367 | | | | 4,181,498 | |
2.375%, 05/15/2029 | | | | | | | 1,096 | | | | 1,009,782 | |
2.625%, 02/15/2029 | | | | | | | 451 | | | | 421,264 | |
2.75%, 02/15/2028 | | | | | | | 129 | | | | 122,848 | |
2.75%, 08/15/2032 | | | | | | | 949 | | | | 841,290 | |
2.875%, 05/15/2028 | | | | | | | 400 | | | | 382,224 | |
2.875%, 05/15/2032 | | | | | | | 2,242 | | | | 2,013,866 | |
3.125%, 11/15/2028 | | | | | | | 912 | | | | 872,289 | |
3.125%, 08/31/2029 | | | | | | | 727 | | | | 688,321 | |
3.375%, 05/15/2033 | | | | | | | 1,115 | | | | 1,024,938 | |
3.50%, 04/30/2028 | | | | | | | 794 | | | | 773,999 | |
3.50%, 09/30/2029 | | | | | | | 608 | | | | 584,530 | |
3.50%, 02/15/2033 | | | | | | | 1,420 | | | | 1,321,581 | |
3.625%, 03/31/2028 | | | | | | | 1,209 | | | | 1,183,673 | |
3.625%, 08/31/2029 | | | | | | | 807 | | | | 781,112 | |
3.625%, 09/30/2031 | | | | | | | 599 | | | | 569,332 | |
3.75%, 12/31/2028 | | | | | | | 1,202 | | | | 1,174,564 | |
3.875%, 08/15/2033 | | | | | | | 1,128 | | | | 1,074,448 | |
3.875%, 08/15/2034 | | | | | | | 911 | | | | 861,465 | |
4.00%, 06/30/2028 | | | | | | | 694 | | | | 686,537 | |
4.00%, 01/31/2029 | | | | | | | 561 | | | | 553,286 | |
4.00%, 07/31/2029 | | | | | | | 752 | | | | 739,523 | |
4.00%, 02/15/2034 | | | | | | | 1,412 | | | | 1,351,952 | |
4.125%, 10/31/2027 | | | | | | | 603 | | | | 600,152 | |
4.125%, 11/15/2032 | | | | | | | 787 | | | | 767,304 | |
4.25%, 02/28/2029 | | | | | | | 1,018 | | | | 1,013,129 | |
4.25%, 06/30/2029 | | | | | | | 567 | | | | 563,313 | |
4.375%, 08/31/2028 | | | | | | | 1,306 | | | | 1,306,316 | |
4.375%, 11/30/2028 | | | | | | | 237 | | | | 237,474 | |
4.375%, 05/15/2034 | | | | | | | 888 | | | | 874,286 | |
4.50%, 05/31/2029 | | | | | | | 1,211 | | | | 1,216,387 | |
4.50%, 11/15/2033 | | | | | | | 1,206 | | | | 1,201,211 | |
4.625%, 09/30/2028 | | | | | | | 578 | | | | 583,419 | |
4.625%, 04/30/2029 | | | | | | | 1,925 | | | | 1,943,751 | |
| | | | | | | | | | | | |
Total Governments–Treasuries
(cost $93,742,587) | | | | | | | | | | | 84,779,439 | |
| | | | | | | | | | | | |
18
| | |
| |
| | | AB Variable Products Series Fund |
| | | | | | | | | | | | |
| Company | |
Principal
Amount
(000) | | | U.S. $ Value | |
| | | | | | | | | | | | |
AGENCIES–0.8% | | | | | | | | | | | | |
AGENCY
DEBENTURES–0.8% | | | | | | | | | |
Federal Farm Credit Banks Funding Corp.
4.625%, 03/05/2026 | | | $ | | | | 219 | | | $ | 219,813 | |
Federal Home Loan Banks
4.625%, 11/17/2026 | | | | | | | 800 | | | | 804,696 | |
Federal National Mortgage Association
6.625%, 11/15/2030 | | | | | | | 900 | | | | 999,234 | |
| | | | | | | | | | | | |
Total Agencies
(cost $2,021,844) | | | | | | | | | | | 2,023,743 | |
| | | | | | | | | | | | |
| | | Notional
Amount | | | | |
PURCHASED OPTIONS– PUTS–0.5% | | | | | | | | | | | | |
OPTIONS ON EQUITY INDICES–0.5% | | | | | | | | | | | | |
Euro STOXX 50 Index
Expiration: Sep 2025; Contracts: 850;
Exercise Price: EUR 4,200.00;
Counterparty: UBS AG(a) | | | EUR | | | | 3,570,000 | | | | 74,516 | |
Euro STOXX 50 Index
Expiration: Sep 2025; Contracts: 280;
Exercise Price: EUR 4,200.00;
Counterparty: UBS AG(a) | | | EUR | | | | 1,176,000 | | | | 24,547 | |
FTSE 100 Index
Expiration: Oct 2025; Contracts: 190;
Exercise Price: GBP 7,200.00;
Counterparty: UBS AG(a) | | | GBP | | | | 1,368,000 | | | | 23,867 | |
FTSE 100 Index
Expiration: Oct 2025; Contracts: 50;
Exercise Price: GBP 7,200.00;
Counterparty: UBS AG(a) | | | GBP | | | | 360,000 | | | | 6,281 | |
Nikkei 225 Index
Expiration: Dec 2025; Contracts: 11,000; Exercise Price: JPY 31,000.00;
Counterparty: UBS AG(a) | | | JPY | | | | 341,000,000 | | | | 54,424 | |
| | | | | | | | | | | | |
| Company | | Notional
Amount | | | U.S. $ Value | |
| | | | | | | | | | | | |
Nikkei 225 Index
Expiration: Dec 2025; Contracts: 3,000; Exercise Price: JPY 31,000.00;
Counterparty: UBS AG(a) | | | JPY | | | | 93,000,000 | | | $ | 14,843 | |
S&P 500 Index
Expiration: Nov 2025; Contracts: 6,900; Exercise Price: USD 5,150.00;
Counterparty: UBS AG(a) | | | USD | | | | 35,535,000 | | | | 835,501 | |
S&P 500 Index
Expiration: Nov 2025; Contracts: 1,500; Exercise Price: USD 5,150.00;
Counterparty: UBS AG(a) | | | USD | | | | 7,725,000 | | | | 181,631 | |
| | | | | | | | | | | | |
Total Purchased Options–Puts
(premiums paid $1,084,978) | | | | | | | | | | | 1,215,610 | |
| | | | | | | | | | | | |
| | | Shares | | | | |
WARRANTS–0.0% | | | | | | | | | | | | |
INFORMATION TECHNOLOGY–0.0% | | | | | | | | | | | | |
SOFTWARE–0.0% | | | | | | | | | | | | |
Constellation Software, Inc., expiring 03/31/2040(a)(b)(d)(e)
(cost $0) | | | | | | | 52 | | | | –0 | – |
| | | | | | | | | | | | |
| | | Principal
Amount
(000) | | | | |
SHORT-TERM INVESTMENTS–0.4% | | | | | | | | | | | | |
U.S. TREASURY BILLS–0.4% | | | | | | | | | | | | |
U.S. Treasury Bill
Zero Coupon, 01/30/2025
(cost $914,102) | | | $ | | | | 918 | | | | 914,667 | |
| | | | | | | | | | | | |
TOTAL INVESTMENTS BEFORE SECURITY LENDING COLLATERAL FOR SECURITIES LOANED–100.1%
(cost $164,983,718) | | | | | | | | | | | 251,608,277 | |
| | | | | | | | | | | | |
19
| | |
| DYNAMIC ASSET ALLOCATION PORTFOLIO |
| PORTFOLIO OF INVESTMENTS | | |
| |
| (continued) | | AB Variable Products Series Fund |
| | | | | | | | | | | | |
| Company | | | | | Shares | | | U.S. $ Value | |
| | | | | | | | | | | | |
INVESTMENTS OF CASH COLLATERAL FOR SECURITIES LOANED–1.1% | | | | | | | | | | | | |
INVESTMENT COMPANIES–1.1% | | | | | | | | | | | | |
AB Fixed Income Shares, Inc.–Government Money Market Portfolio–Class AB, 4.43%(f)(g)(h)
(cost $2,922,091) | | | | | | | 2,922,091 | | | $ | 2,922,091 | |
| | | | | | | | | | | | |
TOTAL INVESTMENTS–101.2%
(cost $167,905,809) | | | | | | | | | | | 254,530,368 | |
Other assets less liabilities–(1.2)% | | | | | | | | | | | (3,112,366 | ) |
| | | | | | | | | | | | |
NET ASSETS–100.0% | | | | | | | | | | $ | 251,418,002 | |
| | | | | | | | | | | | |
FUTURES (see Note D)
| | | | | | | | | | | | | | | | |
| Description | | Number of
Contracts | | | Expiration
Month | | | Current
Notional | | | Value and
Unrealized
Appreciation
(Depreciation) | |
Purchased Contracts | | | | | | | | | | | | | | | | |
Euro STOXX 50 Index Futures | | | 43 | | | | March 2025 | | | $ | 2,174,072 | | | $ | (35,563 | ) |
Euro-Bund Futures | | | 6 | | | | March 2025 | | | | 829,343 | | | | (19,076 | ) |
Long Gilt Futures | | | 18 | | | | March 2025 | | | | 2,082,385 | | | | (63,380 | ) |
MSCI EAFE Futures | | | 1 | | | | March 2025 | | | | 113,375 | | | | (572 | ) |
Nikkei 225 (OSE) Futures | | | 2 | | | | March 2025 | | | | 507,166 | | | | 9,203 | |
OMXS 30 Index Futures | | | 2 | | | | January 2025 | | | | 44,885 | | | | (1,117 | ) |
S&P 500 E-Mini Futures | | | 23 | | | | March 2025 | | | | 6,826,113 | | | | (162,130 | ) |
S&P 500 MIC E-Mini Futures | | | 7 | | | | March 2025 | | | | 207,751 | | | | (4,656 | ) |
TOPIX Index Futures | | | 8 | | | | March 2025 | | | | 1,416,759 | | | | 25,847 | |
U.S. T-Note 2 Yr (CBT) Futures | | | 55 | | | | March 2025 | | | | 11,308,516 | | | | 5,086 | |
U.S. T-Note 10 Yr (CBT) Futures | | | 106 | | | | March 2025 | | | | 11,527,500 | | | | (114,433 | ) |
U.S. Ultra Bond (CBT) Futures | | | 24 | | | | March 2025 | | | | 2,853,750 | | | | (165,788 | ) |
|
Sold Contracts | |
FTSE 100 Index Futures | | | 21 | | | | March 2025 | | | | 2,150,645 | | | | 13,715 | |
MSCI Singapore IX ETS Futures | | | 1 | | | | January 2025 | | | | 27,346 | | | | 57 | |
S&P TSX 60 Index Futures | | | 7 | | | | March 2025 | | | | 1,446,409 | | | | 26,742 | |
SPI 200 Futures | | | 7 | | | | March 2025 | | | | 882,561 | | | | 13,238 | |
U.S. T-Note 5 Yr (CBT) Futures | | | 35 | | | | March 2025 | | | | 3,720,664 | | | | 19,658 | |
| | | | | | | | | | | | | | | | |
| | | | | | | | | | | | | | $ | (453,169) | |
| | | | | | | | | | | | | | | | |
20
| | |
| |
| | | AB Variable Products Series Fund |
FORWARD CURRENCY EXCHANGE CONTRACTS (see Note D)
| | | | | | | | | | | | | | | | | | | | | | | | |
| Counterparty | | Contracts to
Deliver
(000) | | | In Exchange
For
(000) | | | Settlement
Date | | | Unrealized
Appreciation
(Depreciation) | |
Bank of America, NA | | | GBP | | | | 5,760 | | | | USD | | | | 7,212 | | | | 01/16/2025 | | | $ | 2,125 | |
Bank of America, NA | | | USD | | | | 4,211 | | | | GBP | | | | 3,286 | | | | 01/16/2025 | | | | (97,856 | ) |
Bank of America, NA | | | AUD | | | | 4,039 | | | | USD | | | | 2,618 | | | | 02/05/2025 | | | | 117,906 | |
Bank of America, NA | | | NZD | | | | 1,799 | | | | USD | | | | 1,050 | | | | 02/05/2025 | | | | 42,747 | |
Bank of America, NA | | | SEK | | | | 14,121 | | | | USD | | | | 1,280 | | | | 02/05/2025 | | | | 1,476 | |
Bank of America, NA | | | USD | | | | 2,047 | | | | NZD | | | | 3,500 | | | | 02/05/2025 | | | | (88,273 | ) |
Bank of America, NA | | | USD | | | | 943 | | | | SEK | | | | 10,281 | | | | 02/05/2025 | | | | (11,753 | ) |
Bank of America, NA | | | USD | | | | 737 | | | | JPY | | | | 112,588 | | | | 02/21/2025 | | | | (17,306 | ) |
Barclays Bank PLC | | | USD | | | | 2,802 | | | | GBP | | | | 2,209 | | | | 01/16/2025 | | | | (36,355 | ) |
Barclays Bank PLC | | | AUD | | | | 6,393 | | | | USD | | | | 4,064 | | | | 02/05/2025 | | | | 107,092 | |
Barclays Bank PLC | | | NOK | | | | 11,807 | | | | USD | | | | 1,064 | | | | 02/05/2025 | | | | 26,693 | |
Citibank, NA | | | USD | | | | 3,478 | | | | GBP | | | | 2,772 | | | | 01/16/2025 | | | | (8,001 | ) |
Deutsche Bank AG | | | CAD | | | | 1,289 | | | | USD | | | | 930 | | | | 02/05/2025 | | | | 32,491 | |
Deutsche Bank AG | | | NOK | | | | 10,766 | | | | USD | | | | 968 | | | | 02/05/2025 | | | | 21,968 | |
Deutsche Bank AG | | | USD | | | | 6,387 | | | | CAD | | | | 9,090 | | | | 02/05/2025 | | | | (55,267 | ) |
Deutsche Bank AG | | | USD | | | | 2,403 | | | | NOK | | | | 26,638 | | | | 02/05/2025 | | | | (62,778 | ) |
Deutsche Bank AG | | | USD | | | | 1,533 | | | | JPY | | | | 233,615 | | | | 02/21/2025 | | | | (40,228 | ) |
Deutsche Bank AG | | | EUR | | | | 9,499 | | | | USD | | | | 9,993 | | | | 02/27/2025 | | | | 130,162 | |
Goldman Sachs Bank USA | | | USD | | | | 869 | | | | GBP | | | | 687 | | | | 01/16/2025 | | | | (9,449 | ) |
Goldman Sachs Bank USA | | | CAD | | | | 3,421 | | | | USD | | | | 2,475 | | | | 02/05/2025 | | | | 92,402 | |
Goldman Sachs Bank USA | | | SEK | | | | 20,589 | | | | USD | | | | 1,879 | | | | 02/05/2025 | | | | 15,275 | |
HSBC Bank USA | | | CAD | | | | 2,520 | | | | USD | | | | 1,806 | | | | 02/05/2025 | | | | 51,081 | |
JPMorgan Chase Bank, NA | | | USD | | | | 5,947 | | | | AUD | | | | 9,152 | | | | 02/05/2025 | | | | (281,376 | ) |
Morgan Stanley Capital Services, Inc. | | | USD | | | | 1,336 | | | | SEK | | | | 14,699 | | | | 02/05/2025 | | | | (5,249 | ) |
State Street Bank & Trust Co. | | | AUD | | | | 567 | | | | USD | | | | 367 | | | | 02/05/2025 | | | | 16,695 | |
State Street Bank & Trust Co. | | | NOK | | | | 7,006 | | | | USD | | | | 629 | | | | 02/05/2025 | | | | 13,714 | |
State Street Bank & Trust Co. | | | NZD | | | | 529 | | | | USD | | | | 305 | | | | 02/05/2025 | | | | 8,793 | |
State Street Bank & Trust Co. | | | SEK | | | | 579 | | | | USD | | | | 53 | | | | 02/05/2025 | | | | 358 | |
State Street Bank & Trust Co. | | | USD | | | | 274 | | | | CAD | | | | 384 | | | | 02/05/2025 | | | | (6,705 | ) |
State Street Bank & Trust Co. | | | USD | | | | 39 | | | | NOK | | | | 434 | | | | 02/05/2025 | | | | (1,106 | ) |
UBS AG | | | AUD | | | | 2,685 | | | | USD | | | | 1,745 | | | | 02/05/2025 | | | | 82,989 | |
UBS AG | | | CHF | | | | 3,389 | | | | USD | | | | 3,822 | | | | 02/27/2025 | | | | 66,764 | |
| | | | | | | | | | | | | | | | | | | | | | | | |
| | | | | | | | | | | | | | | | | | | | | | $ | 109,029 | |
| | | | | | | | | | | | | | | | | | | | | | | | |
| (a) | | Non-income producing security. |
| (b) | | Represents entire or partial securities out on loan. See Note E for securities lending information. |
| (c) | | Security is exempt from registration under Rule 144A or Regulation S of the Securities Act of 1933. These securities are considered restricted, but liquid and may be resold in transactions exempt from registration. At December 31, 2024, the aggregate market value of these securities amounted to $74,479 or 0.0% of net assets. |
| (d) | | Security in which significant unobservable inputs (Level 3) were used in determining fair value. |
| (e) | | Fair valued by the Adviser. |
| (f) | | Affiliated investments. |
| (g) | | To obtain a copy of the fund’s shareholder report, please go to the Securities and Exchange Commission’s website at www.sec.gov, or call AB at (800) 227-4618. |
| (h) | | The rate shown represents the 7-day yield as of period end. |
21
| | |
| DYNAMIC ASSET ALLOCATION PORTFOLIO |
| PORTFOLIO OF INVESTMENTS | | |
| |
| (continued) | | AB Variable Products Series Fund |
Currency Abbreviations:
AUD—Australian Dollar
CAD—Canadian Dollar
CHF—Swiss Franc
EUR—Euro
GBP—Great British Pound
JPY—Japanese Yen
NOK—Norwegian Krone
NZD—New Zealand Dollar
SEK—Swedish Krona
USD—United States Dollar
Glossary:
ADR—American Depositary Receipt
CBT—Chicago Board of Trade
EAFE—Europe, Australia, and Far East
ETS—Emission Trading Scheme
FTSE—Financial Times Stock Exchange
MSCI—Morgan Stanley Capital International
OMXS—Stockholm Stock Exchange
OSE—Osaka Securities Exchange
REG—Registered Shares
REIT—Real Estate Investment Trust
SPI—Share Price Index
TOPIX—Tokyo Price Index
TSX—Toronto Stock Exchange
See notes to financial statements.
22
| | |
| DYNAMIC ASSET ALLOCATION PORTFOLIO |
| STATEMENT OF ASSETS & LIABILITIES | | |
| |
| December 31, 2024 | | AB Variable Products Series Fund |
| | | | |
ASSETS | |
Investments in securities, at value | | | | |
Unaffiliated issuers (cost $164,983,718) | | $ | 251,608,277 | (a) |
Affiliated issuers (cost $2,922,091—investment of cash collateral for securities loaned) | | | 2,922,091 | |
Cash collateral due from broker | | | 1,324,118 | |
Foreign currencies, at value (cost $68,960) | | | 69,036 | |
Unaffiliated interest and dividends receivable | | | 888,567 | |
Unrealized appreciation on forward currency exchange contracts | | | 830,731 | |
Receivable for investment securities sold | | | 528,044 | |
Receivable due from Adviser | | | 18,966 | |
Affiliated dividends receivable | | | 4,309 | |
Receivable for capital stock sold | | | 2,114 | |
| | | | |
Total assets | | | 258,196,253 | |
| | | | |
LIABILITIES | | | | |
Due to custodian | | | 299,569 | |
Payable for collateral received on securities loaned | | | 2,922,091 | |
Payable for investment securities purchased | | | 1,102,698 | |
Cash collateral due to broker | | | 1,100,000 | |
Unrealized depreciation on forward currency exchange contracts | | | 721,702 | |
Advisory fee payable | | | 148,003 | |
Payable for capital stock redeemed | | | 91,205 | |
Payable for variation margin on futures | | | 90,094 | |
Distribution fee payable | | | 52,819 | |
Administrative fee payable | | | 24,045 | |
Foreign capital gains tax payable | | | 1,614 | |
Transfer Agent fee payable | | | 167 | |
Directors’ fees payable | | | 33 | |
Accrued expenses | | | 224,211 | |
| | | | |
Total liabilities | | | 6,778,251 | |
| | | | |
NET ASSETS | | $ | 251,418,002 | |
| | | | |
COMPOSITION OF NET ASSETS | |
Capital stock, at par | | $ | 25,865 | |
Additional paid-in capital | | | 174,003,053 | |
Distributable earnings | | | 77,389,084 | |
| | | | |
NET ASSETS | | $ | 251,418,002 | |
| | | | |
Net Asset Value Per Share—1 billion shares of capital stock authorized, $.001 par value
| | | | | | | | | | | | |
| Class | | Net Assets | | | Shares
Outstanding | | | Net Asset
Value | |
| | | |
| A | | $ | 188,823 | | | | 19,323 | | | $ | 9.77 | |
| | | |
| B | | $ | 251,229,179 | | | | 25,845,779 | | | $ | 9.72 | |
| (a) | | Includes securities on loan with a value of $5,551,153 (see Note E). |
See notes to financial statements.
23
| | |
| DYNAMIC ASSET ALLOCATION PORTFOLIO |
| STATEMENT OF OPERATIONS | | |
| |
| Year Ended December 31, 2024 | | AB Variable Products Series Fund |
| | | | |
INVESTMENT INCOME | | | | |
Dividends | | | | |
Unaffiliated issuers (net of foreign taxes withheld of $193,954) | | $ | 2,842,750 | |
Affiliated issuers | | | 283,457 | |
Interest | | | 2,673,062 | |
Securities lending income | | | 12,458 | |
| | | | |
| | | 5,811,727 | |
| | | | |
EXPENSES | | | | |
Advisory fee (see Note B) | | | 1,802,937 | |
Distribution fee—Class B | | | 643,438 | |
Transfer agency—Class A | | | 1 | |
Transfer agency—Class B | | | 2,232 | |
Custody and accounting | | | 121,821 | |
Administrative | | | 94,150 | |
Audit and tax | | | 93,122 | |
Legal | | | 41,737 | |
Printing | | | 39,531 | |
Directors’ fees | | | 24,104 | |
Miscellaneous | | | 50,009 | |
| | | | |
Total expenses | | | 2,913,082 | |
Less: expenses waived and reimbursed by the Adviser (see Notes B & E) | | | (89,900 | ) |
| | | | |
Net expenses | | | 2,823,182 | |
| | | | |
Net investment income | | | 2,988,545 | |
| | | | |
REALIZED AND UNREALIZED GAIN (LOSS) ON INVESTMENT AND FOREIGN CURRENCY TRANSACTIONS | | | | |
Net realized gain (loss) on: | | | | |
Investment transactions | | | 1,160,797 | |
Forward currency exchange contracts | | | 761,623 | |
Futures | | | 1,904,753 | |
Swaps | | | 24,846 | |
Foreign currency transactions | | | (27,489 | ) |
Net change in unrealized appreciation (depreciation) of: | | | | |
Investments(a) | | | 20,418,340 | |
Forward currency exchange contracts | | | 169,414 | |
Futures | | | (1,667,234 | ) |
Swaps | | | 587 | |
Foreign currency denominated assets and liabilities | | | (61,257 | ) |
| | | | |
Net gain on investment and foreign currency transactions | | | 22,684,380 | |
| | | | |
NET INCREASE IN NET ASSETS FROM OPERATIONS | | $ | 25,672,925 | |
| | | | |
| (a) | | Net of increase in accrued foreign capital gains taxes on unrealized gains of $1,614. |
See notes to financial statements.
24
| | |
| | |
| DYNAMIC ASSET ALLOCATION PORTFOLIO |
| |
| STATEMENT OF CHANGES IN NET ASSETS | | AB Variable Products Series Fund |
| | | | | | | | |
| | | Year Ended
December 31,
2024 | | | Year Ended
December 31,
2023 | |
INCREASE (DECREASE) IN NET ASSETS FROM OPERATIONS | | | | | | | | |
Net investment income | | $ | 2,988,545 | | | $ | 2,861,589 | |
Net realized gain (loss) on investment and foreign currency transactions | | | 3,824,530 | | | | (7,397,655 | ) |
Net change in unrealized appreciation (depreciation) of investments and foreign currency denominated assets and liabilities | | | 18,859,850 | | | | 35,313,267 | |
| | | | | | | | |
Net increase in net assets from operations | | | 25,672,925 | | | | 30,777,201 | |
Distributions to Shareholders | | | | | | | | |
Class A | | | (2,481 | ) | | | (1,818 | ) |
Class B | | | (2,801,157 | ) | | | (1,462,051 | ) |
CAPITAL STOCK TRANSACTIONS | | | | | | | | |
Net decrease | | | (25,268,198 | ) | | | (11,093,686 | ) |
| | | | | | | | |
Total increase (decrease) | | | (2,398,911 | ) | | | 18,219,646 | |
NET ASSETS | | | | | | | | |
Beginning of period | | | 253,816,913 | | | | 235,597,267 | |
| | | | | | | | |
End of period | | $ | 251,418,002 | | | $ | 253,816,913 | |
| | | | | | | | |
See notes to financial statements.
25
| | |
| DYNAMIC ASSET ALLOCATION PORTFOLIO |
| NOTES TO FINANCIAL STATEMENTS |
| |
| December 31, 2024 | | AB Variable Products Series Fund |
NOTE A: Significant Accounting Policies
The AB Dynamic Asset Allocation Portfolio (the “Portfolio”) is a series of AB Variable Products Series Fund, Inc. (the “Fund”). The Portfolio’s investment objective is to maximize total return consistent with AllianceBernstein L.P. (the “Adviser”) determination of reasonable risk. The Portfolio is diversified as defined under the Investment Company Act of 1940 (the “1940 Act”). The Fund was incorporated in the State of Maryland as an open-end series investment company. The Fund offers nine separately managed pools of assets which have differing investment objectives and policies. The Portfolio offers Class A and Class B shares. Both classes of shares have identical voting, dividend, liquidating and other rights, except that Class B shares bear a distribution expense and have exclusive voting rights with respect to the Class B distribution plan.
The Portfolio offers and sells its shares only to separate accounts of certain life insurance companies for the purpose of funding variable annuity contracts and variable life insurance policies. Sales are made without a sales charge at the Portfolio’s net asset value per share.
The financial statements have been prepared in conformity with U.S. generally accepted accounting principles (“U.S. GAAP”), which require management to make certain estimates and assumptions that affect the reported amounts of assets and liabilities in the financial statements and amounts of income and expenses during the reporting period. Actual results could differ from those estimates. The Portfolio is an investment company under U.S. GAAP and follows the accounting and reporting guidance applicable to investment companies. The following is a summary of significant accounting policies followed by the Portfolio.
1. Security Valuation
Portfolio securities are valued at market value determined on the basis of market quotations or, if market quotations are not readily available or are unreliable, at “fair value” as determined in accordance with procedures approved by and under the oversight of the Fund’s Board of Directors (the “Board”). Pursuant to these procedures, the Adviser serves as the Portfolio’s valuation designee pursuant to Rule 2a-5 of the 1940 Act. In this capacity, the Adviser is responsible, among other things, for making all fair value determinations relating to the Portfolio’s portfolio investments, subject to the Board’s oversight.
In general, the market values of securities which are readily available and deemed reliable are determined as follows: securities listed on a national securities exchange (other than securities listed on the NASDAQ Stock Market, Inc. (“NASDAQ”)) or on a foreign securities exchange are valued at the last sale price at the close of the exchange or foreign securities exchange. If there has been no sale on such day, the securities are valued at the last traded price from the previous day. Securities listed on more than one exchange are valued by reference to the principal exchange on which the securities are traded; securities listed only on NASDAQ are valued in accordance with the NASDAQ Official Closing Price; listed or over the counter (“OTC”) market put or call options are valued at the mid level between the current bid and ask prices. If either a current bid or current ask price is unavailable, the Adviser will have discretion to determine the best valuation (e.g., last trade price in the case of listed options); open futures are valued using the closing settlement price or, in the absence of such a price, the most recent quoted bid price. If there are no quotations available for the day of valuation, the last available closing settlement price is used; U.S. Government securities and any other debt instruments having 60 days or less remaining until maturity are generally valued at market by an independent pricing vendor, if a market price is available. If a market price is not available, the securities are valued at amortized cost. This methodology is commonly used for short term securities that have an original maturity of 60 days or less, as well as short term securities that had an original term to maturity that exceeded 60 days. In instances when amortized cost is utilized, the Valuation Committee (the “Committee”) must reasonably conclude that the utilization of amortized cost is approximately the same as the fair value of the security. Factors the Committee will consider include, but are not limited to, an impairment of the creditworthiness of the issuer or material changes in interest rates. Fixed-income securities, including mortgage-backed and asset-backed securities, may be valued on the basis of prices provided by a pricing service or at a price obtained from one or more of the major broker-dealers. In cases where broker-dealer quotes are obtained, the Adviser may establish procedures whereby changes in market yields or spreads are used to adjust, on a daily basis, a recently obtained quoted price on a security. Swaps and other derivatives are valued daily, primarily using independent pricing services, independent pricing models using market inputs, as well as third party broker-dealers or counterparties. Open-end mutual funds are valued at the closing net asset value per share, while exchange-traded funds are valued at the closing market price per share.
Securities for which market quotations are not readily available (including restricted securities) or are deemed unreliable are valued at fair value as deemed appropriate by the Adviser. Factors considered in making this determination may include, but are not limited to, information obtained by contacting the issuer, analysts, analysis of the issuer’s financial statements or
26
| | |
| |
| | | AB Variable Products Series Fund |
other available documents. In addition, the Portfolio may use fair value pricing for securities primarily traded in non-U.S. markets because most foreign markets close well before the Portfolio values its securities at 4:00 p.m., Eastern Time. The earlier close of these foreign markets gives rise to the possibility that significant events, including broad market moves, may have occurred in the interim and may materially affect the value of those securities. To account for this, the Portfolio generally values many of its foreign equity securities using fair value prices based on third party vendor modeling tools to the extent available.
2. Fair Value Measurements
In accordance with U.S. GAAP regarding fair value measurements, fair value is defined as the price that the Portfolio would receive to sell an asset or pay to transfer a liability in an orderly transaction between market participants at the measurement date. U.S. GAAP establishes a framework for measuring fair value, and a three-level hierarchy for fair value measurements based upon the transparency of inputs to the valuation of an asset or liability (including those valued based on their market values as described in Note A.1 above). Inputs may be observable or unobservable and refer broadly to the assumptions that market participants would use in pricing the asset or liability. Observable inputs reflect the assumptions market participants would use in pricing the asset or liability based on market data obtained from sources independent of the Portfolio. Unobservable inputs reflect the Portfolio’s own assumptions about the assumptions that market participants would use in pricing the asset or liability based on the best information available in the circumstances. Each investment is assigned a level based upon the observability of the inputs which are significant to the overall valuation. The three-tier hierarchy of inputs is summarized below.
| | • | | Level 1—quoted prices in active markets for identical investments |
| | • | | Level 2—other significant observable inputs (including quoted prices for similar investments, interest rates, prepayment speeds, credit risk, etc.) |
| | • | | Level 3—significant unobservable inputs (including the Portfolio’s own assumptions in determining the fair value of investments) |
The fair value of debt instruments, such as bonds, and over-the-counter derivatives is generally based on market price quotations, recently executed market transactions (where observable) or industry recognized modeling techniques and are generally classified as Level 2. Pricing vendor inputs to Level 2 valuations may include quoted prices for similar investments in active markets, interest rate curves, coupon rates, currency rates, yield curves, option adjusted spreads, default rates, credit spreads and other unique security features in order to estimate the relevant cash flows which are then discounted to calculate fair values. If these inputs are unobservable and significant to the fair value, these investments will be classified as Level 3.
Where readily available market prices or relevant bid prices are not available for certain equity investments, such investments may be valued based on similar publicly traded investments, movements in relevant indices since last available prices or based upon underlying company fundamentals and comparable company data (such as multiples to earnings or other multiples to equity). Where an investment is valued using an observable input, such as another publicly traded security, the investment will be classified as Level 2. If management determines that an adjustment is appropriate based on restrictions on resale, illiquidity or uncertainty, and such adjustment is a significant component of the valuation, the investment will be classified as Level 3. An investment will also be classified as Level 3 where management uses company fundamentals and other significant inputs to determine the valuation.
Options are valued using market-based inputs to models, broker or dealer quotations, or alternative pricing sources with reasonable levels of price transparency, where such inputs and models are available. Alternatively, the values may be obtained through unobservable management determined inputs and/or management’s proprietary models. Where models are used, the selection of a particular model to value an option depends upon the contractual terms of, and specific risks inherent in, the option as well as the availability of pricing information in the market. Valuation models require a variety of inputs, including contractual terms, market prices, measures of volatility and correlations of such inputs. Exchange traded options generally will be classified as Level 2. For options that do not trade on an exchange but trade in liquid markets, inputs can generally be verified and model selection does not involve significant management judgment. Options are classified within Level 2 on the fair value hierarchy when all of the significant inputs can be corroborated to market evidence. Otherwise such instruments are classified as Level 3.
Other fixed income investments, including non-U.S. government and corporate debt, are generally valued using quoted market prices, if available, which are typically impacted by current interest rates, maturity dates and any perceived credit risk
27
| | |
| DYNAMIC ASSET ALLOCATION PORTFOLIO |
| NOTES TO FINANCIAL STATEMENTS |
| |
| (continued) | | AB Variable Products Series Fund |
of the issuer. Additionally, in the absence of quoted market prices, these inputs are used by pricing vendors to derive a valuation based upon industry or proprietary models which incorporate issuer specific data with relevant yield/spread comparisons with more widely quoted bonds with similar key characteristics. Those investments for which there are observable inputs are classified as Level 2. Where the inputs are not observable, the investments are classified as Level 3.
The following table summarizes the valuation of the Portfolio’s investments by the above fair value hierarchy levels as of December 31, 2024:
| | | | | | | | | | | | | | | | |
| | | Level 1 | | | Level 2 | | | Level 3 | | | Total | |
Investments in Securities: | | | | | | | | | | | | | | | | |
Assets: | | | | | | | | | | | | | | | | |
Common Stocks: | | | | | | | | | | | | | | | | |
Information Technology | | $ | 39,486,233 | | | $ | 3,185,127 | | | | $ –0 | – | | $ | 42,671,360 | |
Financials | | | 17,782,234 | | | | 8,151,929 | | | | –0 | – | | | 25,934,163 | |
Consumer Discretionary | | | 14,097,820 | | | | 4,043,989 | | | | –0 | – | | | 18,141,809 | |
Industrials | | | 10,718,529 | | | | 6,521,504 | | | | –0 | – | | | 17,240,033 | |
Health Care | | | 12,249,007 | | | | 4,573,165 | | | | –0 | – | | | 16,822,172 | |
Communication Services | | | 11,679,572 | | | | 1,531,717 | | | | –0 | – | | | 13,211,289 | |
Consumer Staples | | | 6,908,606 | | | | 3,007,297 | | | | –0 | – | | | 9,915,903 | |
Energy | | | 4,771,329 | | | | 1,318,478 | | | | –0 | – | | | 6,089,807 | |
Materials | | | 2,967,418 | | | | 2,271,561 | | | | –0 | – | | | 5,238,979 | |
Utilities | | | 2,843,614 | | | | 1,180,200 | | | | –0 | – | | | 4,023,814 | |
Real Estate | | | 2,651,323 | | | | 734,166 | | | | –0 | – | | | 3,385,489 | |
Governments—Treasuries | | | –0 | – | | | 84,779,439 | | | | –0 | – | | | 84,779,439 | |
Agencies | | | –0 | – | | | 2,023,743 | | | | –0 | – | | | 2,023,743 | |
Purchased Options—Puts | | | –0 | – | | | 1,215,610 | | | | –0 | – | | | 1,215,610 | |
Warrants | | | –0 | – | | | –0 | – | | | 0 | (a) | | | –0 | – |
Short-Term Investments | | | –0 | – | | | 914,667 | | | | –0 | – | | | 914,667 | |
Investments of Cash Collateral for Securities Loaned in Affiliated Money Market Fund | | | 2,922,091 | | | | –0 | – | | | –0 | – | | | 2,922,091 | |
| | | | | | | | | | | | | | | | |
Total Investments in Securities | | | 129,077,776 | | | | 125,452,592 | | | | 0 | (a) | | | 254,530,368 | |
Other Financial Instruments(b): | | | | | | | | | | | | | | | | |
Assets: | |
Futures | | | 113,546 | | | | –0 | – | | | –0 | – | | | 113,546 | (c) |
Forward Currency Exchange Contracts | | | –0 | – | | | 830,731 | | | | –0 | – | | | 830,731 | |
Liabilities: | |
Futures | | | (566,715 | ) | | | –0 | – | | | –0 | – | | | (566,715 | )(c) |
Forward Currency Exchange Contracts | | | –0 | – | | | (721,702 | ) | | | –0 | – | | | (721,702 | ) |
| | | | | | | | | | | | | | | | |
Total | | $ | 128,624,607 | | | $ | 125,561,621 | | | | $ 0 | (a) | | $ | 254,186,228 | |
| | | | | | | | | | | | | | | | |
| (a) | | The Portfolio held securities with zero market value at period end. |
| (b) | | Other financial instruments include derivative instruments, such as futures, forwards and swaps. Derivative instruments are valued at the unrealized appreciation (depreciation) on the instrument. Other financial instruments may also include swaps with upfront premiums, written options and written swaptions which are valued at market value. |
| (c) | | Only variation margin receivable (payable) at period end is reported within the statement of assets and liabilities. This amount reflects cumulative unrealized appreciation (depreciation) on futures and centrally cleared swaps as reported in the portfolio of investments. Where applicable, centrally cleared swaps with upfront premiums are presented here at market value. |
3. Currency Translation
Assets and liabilities denominated in foreign currencies and commitments under forward currency exchange contracts are translated into U.S. dollars at the mean of the quoted bid and ask prices of such currencies against the U.S. dollar. Purchases and sales of portfolio securities are translated into U.S. dollars at the rates of exchange prevailing when such securities were acquired or sold. Income and expenses are translated into U.S. dollars at rates of exchange prevailing when accrued.
28
| | |
| |
| | | AB Variable Products Series Fund |
Net realized gain or loss on foreign currency transactions represents foreign exchange gains and losses from sales and maturities of foreign fixed income investments, holding of foreign currencies, currency gains or losses realized between the trade and settlement dates on foreign investment transactions, and the difference between the amounts of dividends, interest and foreign withholding taxes recorded on the Portfolio’s books and the U.S. dollar equivalent amounts actually received or paid. Net unrealized currency gains and losses from valuing foreign currency denominated assets and liabilities at period end exchange rates are reflected as a component of net unrealized appreciation or depreciation of foreign currency denominated assets and liabilities.
4. Taxes
It is the Portfolio’s policy to meet the requirements of the Internal Revenue Code applicable to regulated investment companies and to distribute all of its investment company taxable income and net realized gains, if any, to shareholders. Therefore, no provisions for federal income or excise taxes are required. The Portfolio may be subject to taxes imposed by countries in which it invests. Such taxes are generally based on income and/or capital gains earned or repatriated. Taxes are accrued and applied to net investment income, net realized gains and net unrealized appreciation/depreciation as such income and/or gains are earned.
In accordance with U.S. GAAP requirements regarding accounting for uncertainties in income taxes, management has analyzed the Portfolio’s tax positions taken or expected to be taken on federal and state income tax returns for all open tax years (the current and the prior three tax years) and has concluded that no provision for income tax is required in the Portfolio’s financial statements.
5. Investment Income and Investment Transactions
Dividend income is recorded on the ex-dividend date or as soon as the Portfolio is informed of the dividend. Interest income is accrued daily. Investment transactions are accounted for on the date the securities are purchased or sold. Investment gains or losses are determined on the identified cost basis. Non-cash dividends, if any, are recorded on the ex-dividend date at the fair value of the securities received. The Portfolio amortizes premiums and accretes discounts as adjustments to interest income. The Portfolio accounts for distributions received from real estate investment trust (“REIT”) investments or from regulated investment companies as dividend income, realized gain, or return of capital based on information provided by the REIT or the investment company.
6. Class Allocations
All income earned and expenses incurred by the Portfolio are borne on a pro-rata basis by each outstanding class of shares, based on the proportionate interest in the Portfolio represented by the net assets of such class, except for class specific expenses which are allocated to the respective class. Expenses of the Fund are charged proportionately to each portfolio or based on other appropriate methods. Realized and unrealized gains and losses are allocated among the various share classes based on respective net assets.
7. Dividends and Distributions
Dividends and distributions to shareholders, if any, are recorded on the ex-dividend date. Income dividends and capital gains distributions are determined in accordance with federal tax regulations and may differ from those determined in accordance with U.S. GAAP. To the extent these differences are permanent, such amounts are reclassified within the capital accounts based on their federal tax basis treatment; temporary differences do not require such reclassification.
8. Cash and Short-Term Investments
Cash and short-term investments include cash on hand and short-term investments with maturities of less than one year when purchased.
9. Segment Information
The Portfolio represents a single operating segment. An operating segment is defined in U.S. GAAP as a component of a public entity that engages in business activities from which it may recognize revenues and incur expenses, has operating results that are regularly reviewed by the public entity’s chief operating decision maker (“CODM”) to make decisions about resources to be allocated to the segment and assess its performance, and has discrete financial information available. The Portfolio’s President is the CODM. The CODM monitors the operating results of the Portfolio as a whole and the pre-determined Portfolio’s long term investment strategy, which is executed by the portfolio management group. The qualitative and quantitative information contained within the financial statements is used by the CODM to assess the segments
29
| | |
| DYNAMIC ASSET ALLOCATION PORTFOLIO |
| NOTES TO FINANCIAL STATEMENTS |
| |
| (continued) | | AB Variable Products Series Fund |
performance versus the Portfolio’s comparative benchmark and to make resource allocation decisions. Segment assets are reflected on the statement of assets and liabilities and segment expenses are listed on the statement of operations.
NOTE B: Advisory Fee and Other Transactions with Affiliates
Under the terms of the investment advisory agreement, the Portfolio pays the Adviser an advisory fee at an annual rate of .70% of the Portfolio’s average daily net assets. The Adviser has agreed to waive its fees and bear certain expenses to the extent necessary to limit total operating expenses on an annual basis (the “Expense Caps”) to .85% and 1.10% of daily average net assets for Class A and Class B shares, respectively. The Expense Caps will remain in effect until May 1, 2025 and then may be extended by the Adviser for additional one-year terms. For the year ended December 31, 2024, such reimbursements/waivers amounted to $80,263.
Pursuant to the investment advisory agreement, the Portfolio may reimburse the Adviser for certain legal and accounting services provided to the Portfolio by the Adviser. For the year ended December 31, 2024, the reimbursement for such services amounted to $94,150.
The Portfolio compensates AllianceBernstein Investor Services, Inc. (“ABIS”), a wholly-owned subsidiary of the Adviser, under a Transfer Agency Agreement for providing personnel and facilities to perform transfer agency services for the Portfolio. Such compensation retained by ABIS amounted to $1,950 for the year ended December 31, 2024.
The Portfolio may invest in AB Government Money Market Portfolio which has a contractual annual advisory fee rate of .20% of the portfolio’s average daily net assets and bears its own expenses. The Adviser had contractually agreed to waive .10% of the advisory fee of AB Government Money Market Portfolio (resulting in a net advisory fee of .10%) until August 31, 2023. Effective September 1, 2023, the Adviser has contractually agreed to waive .05% of the advisory fee of AB Government Money Market Portfolio (resulting in a net advisory fee of .15%) until August 31, 2024. In connection with the investment by the Portfolio in AB Government Money Market Portfolio, the Adviser has contractually agreed to waive its advisory fee from the Portfolio in an amount equal to the Portfolio’s pro rata share of the effective advisory fee of AB Government Money Market Portfolio, as borne indirectly by the Portfolio as an acquired fund fee and expense. For the year ended December 31, 2024, such waiver amounted to $8,088.
A summary of the Portfolio’s transactions in AB mutual funds for the year ended December 31, 2024 is as follows:
| | | | | | | | | | | | | | | | | | | | |
Portfolio | | Market Value
12/31/23
(000) | | | Purchases
at Cost
(000) | | | Sales
Proceeds
(000) | | | Market Value
12/31/24
(000) | | | Dividend
Income
(000) | |
AB Government Money Market Portfolio | | $ | 6,268 | | | $ | 46,274 | | | $ | 52,542 | | | $ | –0 | – | | $ | 283 | |
AB Government Money Market Portfolio* | | | 1,616 | | | | 14,975 | | | | 13,669 | | | | 2,922 | | | | –0 | – |
| | | | | | | | | | | | | | | | | | | | |
Total | | | | | | | | | | | | | | $ | 2,922 | | | $ | 283 | |
| | | | | | | | | | | | | | | | | | | | |
| * | | Investments of cash collateral for securities lending transactions (see Note E). |
NOTE C: Distribution Plan
The Portfolio has adopted a Distribution Plan (the “Plan”) for Class B shares pursuant to Rule 12b-1 under the 1940 Act. Under the Plan, the Portfolio pays distribution and servicing fees to AllianceBernstein Investments, Inc. (the “Distributor”), a wholly-owned subsidiary of the Adviser, at an annual rate of up to .50% of the Portfolio’s average daily net assets attributable to Class B shares. The fees are accrued daily and paid monthly. The Board currently limits payments under the Plan to .25% of the Portfolio’s average daily net assets attributable to Class B shares. The Plan provides that the Distributor will use such payments in their entirety for distribution assistance and promotional activities.
The Portfolio is not obligated under the Plan to pay any distribution and servicing fees in excess of the amounts set forth above. The purpose of the payments to the Distributor under the Plan is to compensate the Distributor for its distribution services with respect to the sale of the Portfolio’s Class B shares. Since the Distributor’s compensation is not directly tied to its expenses, the amount of compensation received by it under the Plan during any year may be more or less than its actual expenses. For this reason, the Plan is characterized by the staff of the Securities and Exchange Commission as being of the “compensation” variety.
In the event that the Plan is terminated or not continued, no distribution or servicing fees (other than current amounts accrued but not yet paid) would be owed by the Portfolio to the Distributor.
30
| | |
| |
| | | AB Variable Products Series Fund |
The Plan also provides that the Adviser may use its own resources to finance the distribution of the Portfolio’s shares.
NOTE D: Investment Transactions
Purchases and sales of investment securities (excluding short-term investments) for the year ended December 31, 2024 were as follows:
| | | | | | | | |
| | | Purchases | | | Sales | |
Investment securities (excluding U.S. government securities) | | $ | 10,051,475 | | | $ | 28,816,917 | |
U.S. government securities | | | 16,084,642 | | | | 14,897,420 | |
The cost of investments for federal income tax purposes, gross unrealized appreciation and unrealized depreciation are as follows:
| | | | |
Cost | | $ | 169,816,929 | |
| | | | |
Gross unrealized appreciation | | $ | 100,523,232 | |
Gross unrealized depreciation | | | (15,762,565 | ) |
| | | | |
Net unrealized appreciation | | $ | 84,760,667 | |
| | | | |
1. Derivative Financial Instruments
The Portfolio may use derivatives in an effort to earn income and enhance returns, to replace more traditional direct investments, to obtain exposure to otherwise inaccessible markets (collectively, “investment purposes”), or to hedge or adjust the risk profile of its portfolio.
The principal types of derivatives utilized by the Portfolio, as well as the methods in which they may be used are:
The Portfolio may buy or sell futures for investment purposes or for the purpose of hedging its portfolio against adverse effects of potential movements in the market. The Portfolio bears the market risk that arises from changes in the value of these instruments and the imperfect correlation between movements in the price of the futures and movements in the price of the assets, reference rates or indices which they are designed to track. Among other things, the Portfolio may purchase or sell futures for foreign currencies or options thereon for non-hedging purposes as a means of making direct investment in foreign currencies, as described below under “Currency Transactions”.
At the time the Portfolio enters into futures, the Portfolio deposits with the broker or segregates at its custodian cash or securities as collateral to satisfy initial margin requirements set by the exchange on which the transaction is effected. Pursuant to the contract, with respect to cash collateral, the Portfolio agrees to receive from or pay to the broker an amount of cash equal to the daily fluctuation in the value of the contract; in the case of securities collateral, the Fund agrees to adjust the securities position held in the segregated account accordingly. Such receipts, payments or adjustments are known as variation margin and are recorded by the Portfolio as unrealized gains or losses. Risks may arise from the potential inability of a counterparty to meet the terms of the contract. The credit/counterparty risk for exchange-traded futures is generally less than privately negotiated futures, since the clearinghouse, which is the issuer or counterparty to each exchange-traded future, has robust risk mitigation standards, including the requirement to provide initial and variation margin. When the contract is closed, the Portfolio records a realized gain or loss equal to the difference between the value of the contract at the time it was opened and the time it was closed.
Use of long futures subjects the Portfolio to risk of loss in excess of the amounts shown on the statement of assets and liabilities, up to the notional value of the futures. Use of short futures subjects the Portfolio to unlimited risk of loss. Under some circumstances, futures exchanges may establish daily limits on the amount that the price of futures can vary from the previous day’s settlement price, which could effectively prevent liquidation of unfavorable positions.
During the year ended December 31, 2024, the Portfolio held futures for hedging and non-hedging purposes.
| | • | | Forward Currency Exchange Contracts |
The Portfolio may enter into forward currency exchange contracts in order to hedge its exposure to changes in foreign currency exchange rates on its foreign portfolio holdings, to hedge certain firm purchase and sale commitments denominated in foreign currencies and for non-hedging purposes as a means of making direct investments in foreign currencies, as described below under “Currency Transactions”.
31
| | |
| DYNAMIC ASSET ALLOCATION PORTFOLIO |
| NOTES TO FINANCIAL STATEMENTS |
| |
| (continued) | | AB Variable Products Series Fund |
A forward currency exchange contract is a commitment to purchase or sell a foreign currency at a future date at a negotiated forward rate. The gain or loss arising from the difference between the original contract and the closing of such contract would be included in net realized gain or loss on forward currency exchange contracts. Fluctuations in the value of open forward currency exchange contracts are recorded for financial reporting purposes as unrealized appreciation and/or depreciation by the Portfolio. Risks may arise from the potential inability of a counterparty to meet the terms of a contract and from unanticipated movements in the value of a foreign currency relative to the U.S. dollar.
During the year ended December 31, 2024, the Portfolio held forward currency exchange contracts for hedging and non-hedging purposes.
For hedging and investment purposes, the Portfolio may purchase and write (sell) put and call options on U.S. and foreign securities, including government securities, and foreign currencies that are traded on U.S. and foreign securities exchanges and over-the-counter markets. Among other things, the Portfolio may use options transactions for non-hedging purposes as a means of making direct investments in foreign currencies, as described below under “Currency Transactions” and may use options strategies involving the purchase and/or writing of various combinations of call and/or put options, for hedging and investment purposes.
The risk associated with purchasing an option is that the Portfolio pays a premium whether or not the option is exercised. Additionally, the Portfolio bears the risk of loss of the premium and change in market value should the counterparty not perform under the contract. If a put or call purchased option by the Portfolio were permitted to expire without being sold or exercised, its premium would represent a loss to the Portfolio. Put and call purchased options are accounted for in the same manner as portfolio securities. The cost of securities acquired through the exercise of call options is increased by premiums paid. The proceeds from securities sold through the exercise of put options are decreased by the premiums paid.
When the Portfolio writes an option, the premium received by the Portfolio is recorded as a liability and is subsequently adjusted to the current market value of the written option. The Portfolio’s maximum payment for written put options equates to the number of shares multiplied by the strike price. In certain circumstances maximum payout amounts may be partially offset by recovery values of the respective referenced assets and upfront premium received upon entering into the contract. Premiums received from written options which expire unexercised are recorded by the Portfolio on the expiration date as realized gains from written options. The difference between the premium received and the amount paid on effecting a closing purchase transaction, including brokerage commissions, is also treated as a realized gain, or if the premium received is less than the amount paid for the closing purchase transaction, as a realized loss. If a call option is exercised, the premium received is added to the proceeds from the sale of the underlying security or currency in determining whether the Portfolio has realized a gain or loss. If a put option is exercised, the premium received reduces the cost basis of the security or currency purchased by the Portfolio. In writing an option, the Portfolio bears the market risk of an unfavorable change in the price of the security or currency underlying the written option. Exercise of the written option by the Portfolio could result in the Portfolio selling or buying a security or currency at a price different from the current market value.
During the year ended December 31, 2024, the Portfolio held purchased options for hedging and non-hedging purposes.
The Portfolio may enter into swaps for investment purposes or to hedge its exposure to interest rates, credit risk, equity markets or currencies. The Portfolio may also enter into swaps for non-hedging purposes as a means of gaining market exposures, making direct investments in foreign currencies, as described below under “Currency Transactions” or in order to take a “long” or “short” position with respect to an underlying referenced asset described below under “Total Return Swaps”. A swap is an agreement that obligates two parties to exchange a series of cash flows at specified intervals based upon or calculated by reference to changes in specified prices, rates or indexes for a specified amount of an underlying asset or inflation. The payment flows are usually netted against each other, with the difference being paid by one party to the other. In addition, collateral may be pledged or received by the Portfolio in accordance with the terms of the respective swaps to provide value and recourse to the Portfolio or its counterparties in the event of default, bankruptcy or insolvency by one of the parties to the swap.
32
| | |
| |
| | | AB Variable Products Series Fund |
Risks may arise as a result of the failure of the counterparty to the swap to comply with the terms of the swap. The loss incurred by the failure of a counterparty is generally limited to the net interim payment to be received by the Portfolio, and/or the termination value at the end of the contract. Therefore, the Portfolio considers the creditworthiness of each counterparty to a swap in evaluating potential counterparty risk. This risk is mitigated by having a netting arrangement between the Portfolio and the counterparty and by the posting of collateral by the counterparty to the Portfolio to cover the Portfolio’s exposure to the counterparty. Additionally, risks may arise from unanticipated movements in interest rates, inflation or in the value of the underlying securities. The Portfolio accrues for the interim payments on swaps on a daily basis, with the net amount recorded within unrealized appreciation (depreciation) of swaps on the statement of assets and liabilities, where applicable. Once the interim payments are settled in cash, the net amount is recorded as realized gain/(loss) on swaps on the statement of operations, in addition to any realized gain/(loss) recorded upon the termination of swaps. Upfront premiums paid or received for swaps are recognized as cost or proceeds on the statement of assets and liabilities and are amortized on a straight line basis over the life of the contract. Amortized upfront premiums are included in net realized gain/(loss) from swaps on the statement of operations. Fluctuations in the value of swaps are recorded as a component of net change in unrealized appreciation (depreciation) of swaps on the statement of operations.
Total Return Swaps:
The Portfolio may enter into total return swaps in order to take a “long” or “short” position with respect to an underlying referenced asset. The Portfolio is subject to market price volatility of the underlying referenced asset. A total return swap involves commitments to pay interest in exchange for a market linked return based on a notional amount. To the extent that the total return of the security, group of securities or index underlying the transaction exceeds or falls short of the offsetting interest obligation, the Portfolio will receive a payment from or make a payment to the counterparty.
During the year ended December 31, 2024, the Portfolio held total return swaps for hedging and non-hedging purposes.
The Portfolio typically enters into International Swaps and Derivatives Association, Inc. Master Agreements (“ISDA Master Agreement”) with its OTC derivative contract counterparties in order to, among other things, reduce its credit risk to OTC counterparties. ISDA Master Agreements include provisions for general obligations, representations, collateral and events of default or termination. Under an ISDA Master Agreement, the Portfolio typically may offset with the OTC counterparty certain derivative financial instruments’ payables and/or receivables with collateral held and/or posted and create one single net payment (close-out netting) in the event of default or termination. In the event of a default by an OTC counterparty, the return of collateral with market value in excess of the Portfolio’s net liability, held by the defaulting party, may be delayed or denied.
The Portfolio’s ISDA Master Agreements may contain provisions for early termination of OTC derivative transactions in the event the net assets of the Portfolio decline below specific levels (“net asset contingent features”). If these levels are triggered, the Portfolio’s OTC counterparty has the right to terminate such transaction and require the Portfolio to pay or receive a settlement amount in connection with the terminated transaction. If OTC derivatives were held at period end, please refer to netting arrangements by the OTC counterparty table below for additional details.
During the year ended December 31, 2024, the Portfolio had entered into the following derivatives:
| | | | | | | | | | | | |
| | | Asset Derivatives | | | Liability Derivatives | |
Derivative Type | | Statement of
Assets and Liabilities
Location | | Fair Value | | | Statement of
Assets and Liabilities
Location | | Fair Value | |
Interest rate contracts | | Receivable for variation margin on futures | | $ | 24,744 | * | | Payable for variation margin on futures | | $ | 362,677 | * |
| | | | |
Equity contracts | | Receivable for variation margin on futures | | | 88,802 | * | | Payable for variation margin on futures | | | 204,038 | * |
| | | | |
Foreign currency contracts | | Unrealized appreciation on forward currency exchange contracts | | | 830,731 | | | Unrealized depreciation on forward currency exchange contracts | | | 721,702 | |
| | | | |
Equity contracts | | Investments in securities, at value | | | 1,215,610 | | | | | | | |
| | | | | | | | | | | | |
| | | | |
Total | | | | $ | 2,159,887 | | | | | $ | 1,288,417 | |
| | | | | | | | | | | | |
33
| | |
| DYNAMIC ASSET ALLOCATION PORTFOLIO |
| NOTES TO FINANCIAL STATEMENTS |
| |
| (continued) | | AB Variable Products Series Fund |
| * | | Only variation margin receivable/payable at period end is reported within the statement of assets and liabilities. This amount reflects cumulative unrealized appreciation (depreciation) on futures and centrally cleared swaps as reported in the portfolio of investments. |
| | | | | | | | | | |
Derivative Type | | Location of Gain or (Loss) on Derivatives
Within Statement of Operations | | Realized Gain or
(Loss) on
Derivatives | | | Change in Unrealized
Appreciation or
(Depreciation) | |
Interest rate contracts | | Net realized gain (loss) on futures; Net change in unrealized appreciation (depreciation) of futures | | $ | (356,132 | ) | | $ | (1,369,389 | ) |
| | | |
Equity contracts | | Net realized gain (loss) on futures; Net change in unrealized appreciation (depreciation) of futures | | | 2,260,885 | | | | (297,845 | ) |
| | | |
Foreign currency contracts | | Net realized gain (loss) on forward currency exchange contracts; Net change in unrealized appreciation (depreciation) of forward currency exchange contracts | | | 761,623 | | | | 169,414 | |
| | | |
Equity contracts | | Net realized gain (loss) on investment transactions; Net change in unrealized appreciation (depreciation) of investments | | | (1,372,449 | ) | | | 265,688 | |
| | | |
Equity contracts | | Net realized gain (loss) on swaps; Net change in unrealized appreciation (depreciation) of swaps | | | 24,846 | | | | 587 | |
| | | | | | | | | | |
Total | | | | $ | 1,318,773 | | | $ | (1,231,545 | ) |
| | | | | | | | | | |
The following table represents the average monthly volume of the Portfolio’s derivative transactions during the year ended December 31, 2024:
| | | | |
Futures: | | | | |
Average notional amount of buy contracts | | $ | 51,542,268 | |
Average notional amount of sale contracts | | $ | 7,362,272 | |
Forward Currency Exchange Contracts: | | | | |
Average principal amount of buy contracts | | $ | 32,998,311 | |
Average principal amount of sale contracts | | $ | 35,489,450 | |
Purchased Options: | | | | |
Average notional amount | | $ | 47,212,584 | |
Total Return Swaps: | | | | |
Average notional amount | | $ | 198,426 | (a) |
| (a) | | Positions were open for nine months during the year. |
For financial reporting purposes, the Portfolio does not offset derivative assets and derivative liabilities that are subject to netting arrangements in the statement of assets and liabilities.
34
| | |
| |
| | | AB Variable Products Series Fund |
All OTC derivatives held at period end were subject to netting arrangements. The following table presents the Portfolio’s derivative assets and liabilities by OTC counterparty net of amounts available for offset under ISDA Master Agreements (“MA”) and net of the related collateral received/pledged by the Portfolio as of December 31, 2024. Exchange-traded derivatives and centrally cleared swaps are not subject to netting arrangements and as such are excluded from the table.
| | | | | | | | | | | | | | | | | | | | |
Counterparty | | Derivative Assets
Subject to a MA | | | Derivatives
Available for
Offset | | | Cash Collateral
Received* | | | Security Collateral
Received* | | | Net Amount of
Derivative Assets | |
Bank of America, NA | | $ | 164,254 | | | $ | (164,254 | ) | | $ | –0 | – | | $ | –0 | – | | $ | –0 | – |
Barclays Bank PLC | | | 133,785 | | | | (36,355 | ) | | | –0 | – | | | –0 | – | | | 97,430 | |
Deutsche Bank AG | | | 184,621 | | | | (158,273 | ) | | | –0 | – | | | –0 | – | | | 26,348 | |
Goldman Sachs Bank USA | | | 107,677 | | | | (9,449 | ) | | | –0 | – | | | –0 | – | | | 98,228 | |
HSBC Bank USA | | | 51,081 | | | | –0 | – | | | –0 | – | | | –0 | – | | | 51,081 | |
State Street Bank & Trust Co. | | | 39,560 | | | | (7,811 | ) | | | –0 | – | | | –0 | – | | | 31,749 | |
UBS AG | | | 1,365,363 | | | | –0 | – | | | (1,100,000 | ) | | | –0 | – | | | 265,363 | |
| | | | | | | | | | | | | | | | | | | | |
Total | | $ | 2,046,341 | | | $ | (376,142 | ) | | $ | (1,100,000 | ) | | $ | –0 | – | | $ | 570,199 | ^ |
| | | | | | | | | | | | | | | | | | | | |
| | | | | |
Counterparty | | Derivative Liabilities
Subject to a MA | | | Derivatives
Available for
Offset | | | Cash Collateral
Pledged* | | | Security Collateral
Pledged* | | | Net Amount of
Derivative Liabilities | |
Bank of America, NA | | $ | 215,188 | | | $ | (164,254 | ) | | $ | –0 | – | | $ | –0 | – | | $ | 50,934 | |
Barclays Bank PLC | | | 36,355 | | | | (36,355 | ) | | | –0 | – | | | –0 | – | | | –0 | – |
Citibank, NA | | | 8,001 | | | | –0 | – | | | –0 | – | | | –0 | – | | | 8,001 | |
Deutsche Bank AG | | | 158,273 | | | | (158,273 | ) | | | –0 | – | | | –0 | – | | | –0 | – |
Goldman Sachs Bank USA | | | 9,449 | | | | (9,449 | ) | | | –0 | – | | | –0 | – | | | –0 | – |
JPMorgan Chase Bank, NA | | | 281,376 | | | | –0 | – | | | –0 | – | | | –0 | – | | | 281,376 | |
Morgan Stanley Capital Services, Inc. | | | 5,249 | | | | –0 | – | | | –0 | – | | | –0 | – | | | 5,249 | |
State Street Bank & Trust Co. | | | 7,811 | | | | (7,811 | ) | | | –0 | – | | | –0 | – | | | –0 | – |
| | | | | | | | | | | | | | | | | | | | |
Total | | $ | 721,702 | | | $ | (376,142 | ) | | $ | –0 | – | | $ | –0 | – | | $ | 345,560 | ^ |
| | | | | | | | | | | | | | | | | | | | |
| * | | The actual collateral received/pledged may be more than the amount reported due to over-collateralization. |
| ^ | | Net amount represents the net receivable/payable that would be due from/to the counterparty in the event of default or termination. The net amount from OTC financial derivative instruments can only be netted across transactions governed under the same master agreement with the same counterparty. |
35
| | |
| DYNAMIC ASSET ALLOCATION PORTFOLIO |
| NOTES TO FINANCIAL STATEMENTS |
| |
| (continued) | | AB Variable Products Series Fund |
2. Currency Transactions
The Portfolio may invest in non-U.S. Dollar-denominated securities on a currency hedged or unhedged basis. The Portfolio may seek investment opportunities by taking long or short positions in currencies through the use of currency-related derivatives, including forward currency exchange contracts, futures and options on futures, swaps, and other options. The Portfolio may enter into transactions for investment opportunities when it anticipates that a foreign currency will appreciate or depreciate in value but securities denominated in that currency are not held by the Portfolio and do not present attractive investment opportunities. Such transactions may also be used when the Adviser believes that it may be more efficient than a direct investment in a foreign currency-denominated security. The Portfolio may also conduct currency exchange contracts on a spot basis (i.e., for cash at the spot rate prevailing in the currency exchange market for buying or selling currencies).
NOTE E: Securities Lending
The Portfolio may enter into securities lending transactions. Under the Portfolio’s securities lending program, all loans of securities will be collateralized continually by cash collateral and/or non-cash collateral. Non-cash collateral will include only securities issued or guaranteed by the U.S. government or its agencies or instrumentalities. If the Portfolio cannot sell or repledge any non-cash collateral, such collateral will not be reflected in the portfolio of investments. If a loan is collateralized by cash, the Portfolio will be compensated for the loan from a portion of the net return from the income earned on cash collateral after a rebate is paid to the borrower (in some cases, this rebate may be a “negative rebate” or fee paid by the borrower to the Portfolio in connection with the loan), and payments are made for fees of the securities lending agent and for certain other administrative expenses. If the Portfolio receives non-cash collateral, the Portfolio will receive a fee from the borrower generally equal to a negotiated percentage of the market value of the loaned securities. The Portfolio will have the right to call a loan and obtain the securities loaned at any time on notice to the borrower within the normal and customary settlement time for the securities. While the securities are on loan, the borrower is obligated to pay the Portfolio amounts equal to any dividend income or other distributions from the securities; however, these distributions will not be afforded the same preferential tax treatment as qualified dividends. The Portfolio will not be able to exercise voting rights with respect to any securities during the existence of a loan, but will have the right to regain ownership of loaned securities in order to exercise voting or other ownership rights. Collateral received and securities loaned are marked to market daily to ensure that the securities loaned are secured by collateral. The lending agent currently invests the cash collateral received in Government Money Market Portfolio, an eligible money market vehicle, in accordance with the investment restrictions of the Portfolio, and as approved by the Board. The collateral received on securities loaned is recorded as an asset as well as a corresponding liability in the statement of assets and liabilities. The collateral will be adjusted the next business day to maintain the required collateral amount. The amounts of securities lending income from the borrowers and Government Money Market Portfolio are reflected in the statement of operations. When the Portfolio earns net securities lending income from Government Money Market Portfolio, the income is inclusive of a rebate expense paid to the borrower. In connection with the cash collateral investment by the Portfolio in Government Money Market Portfolio, the Adviser has agreed to waive a portion of the Portfolio’s share of the advisory fees of Government Money Market Portfolio, as borne indirectly by the Portfolio as an acquired fund fee and expense. When the Portfolio lends securities, its investment performance will continue to reflect changes in the value of the securities loaned. A principal risk of lending portfolio securities is that the borrower may fail to return the loaned securities upon termination of the loan and that the collateral will not be sufficient to replace the loaned securities. The lending agent has agreed to indemnify the Portfolio in the case of default of any securities borrower.
A summary of the Portfolio’s transactions surrounding securities lending for the year ended December 31, 2024 is as follows:
| | | | | | | | | | | | | | | | | | | | | | |
| | | | | | | | | | | | | Government Money Market
Portfolio | |
Market Value
of Securities on Loan* | | | Cash Collateral* | | | Market Value of
Non-Cash
Collateral* | | | Income from
Borrowers | | | Income Earned | | | Advisory Fee
Waived | |
| $ | 5,551,153 | | | $ | 2,922,091 | | | $ | 2,914,260 | | | $ | 12,458 | | | $ | –0 | – | | $ | 1,549 | |
| * | | As of December 31, 2024. |
36
| | |
| |
| | | AB Variable Products Series Fund |
NOTE F: Capital Stock
Each class consists of 500,000,000 authorized shares. Transactions in capital shares for each class were as follows:
| | | | | | | | | | | | | | | | | | | | |
| | | SHARES | | | | | | AMOUNT | |
| | | Year Ended
December 31,
2024 | | | Year Ended
December 31,
2023 | | | | | | Year Ended
December 31,
2024 | | | Year Ended
December 31,
2023 | |
Class A | |
Shares sold | | | 2,657 | | | | 2,915 | | | | | | | $ | 25,039 | | | $ | 24,456 | |
Shares issued in reinvestment of dividends | | | 263 | | | | 214 | | | | | | | | 2,481 | | | | 1,818 | |
Shares redeemed | | | (8,853 | ) | | | (6,942 | ) | | | | | | | (80,486 | ) | | | (57,972 | ) |
| | | | | | | | | | | | | | | | | | | | |
Net decrease | | | (5,933 | ) | | | (3,813 | ) | | | | | | $ | (52,966 | ) | | $ | (31,698 | ) |
| | | | | | | | | | | | | | | | | | | | |
Class B | |
Shares sold | | | 1,172,404 | | | | 1,935,596 | | | | | | | $ | 11,014,981 | | | $ | 16,171,966 | |
Shares issued on reinvestment of dividends | | | 298,981 | | | | 172,819 | | | | | | | | 2,801,157 | | | | 1,462,051 | |
Shares redeemed | | | (4,118,173 | ) | | | (3,442,663 | ) | | | | | | | (39,031,370 | ) | | | (28,696,005 | ) |
| | | | | | | | | | | | | | | | | | | | |
Net decrease | | | (2,646,788 | ) | | | (1,334,248 | ) | | | | | | $ | (25,215,232 | ) | | $ | (11,061,988 | ) |
| | | | | | | | | | | | | | | | | | | | |
At December 31, 2024, certain shareholders of the Portfolio owned 92% in aggregate of the Portfolio’s outstanding shares. Significant transactions by such shareholders, if any, may impact the Portfolio’s performance.
NOTE G: Risks Involved in Investing in the Portfolio
Market Risk—The value of the Portfolio’s assets will fluctuate as the market or markets in which the Portfolio invests fluctuate. The value of the Portfolio’s investments may decline, sometimes rapidly and unpredictably, simply because of economic changes or other events, including public health crises (including the occurrence of a contagious disease or illness) and regional and global conflicts, that affect large portions of the market. It includes the risk that a particular style of investing may underperform the market generally.
Interest-Rate Risk—Changes in interest rates will affect the value of investments in fixed-income securities. When interest rates rise, the value of existing investments in fixed-income securities tends to fall and this decrease in value may not be offset by higher income from new investments. Interest-rate risk is generally greater for fixed-income securities with longer maturities or durations. The Portfolio may be subject to a greater risk of rising interest rates than would normally be the case due to the recent end of a period of historically low rates and the effects of potential central bank monetary policy, and government fiscal policy, initiatives and market reactions to those initiatives.
Credit Risk—An issuer or guarantor of a fixed-income security, or the counterparty to a derivatives or other contract, may be unable or unwilling to make timely payments of interest or principal, or to otherwise honor its obligations. The issuer or guarantor may default, causing a loss of the full principal amount of a security and accrued interest. The degree of risk for a particular security may be reflected in its credit rating. There is the possibility that the credit rating of a fixed-income security may be downgraded after purchase, which may adversely affect the value of the security. Investments in fixed-income securities with lower ratings tend to have a higher probability that an issuer will default or fail to meet its payment obligations.
Allocation Risk—The allocation of investments among different global asset classes may have a significant effect on the Portfolio’s net asset value, or NAV, when one of these asset classes is performing more poorly than others. As both the direct investments and derivatives positions will be periodically adjusted to reflect the Adviser’s view of market and economic conditions, there will be transaction costs that may be, over time, significant. In addition, there is a risk that certain asset allocation decisions may not achieve the desired results and, as a result, the Portfolio may incur significant losses.
Foreign (Non-U.S.) Risk—The Portfolio’s investments in securities of non-U.S. issuers may involve more risk than those of U.S. issuers. These securities may fluctuate more widely in price and may be more difficult to trade due to adverse market, economic, political, regulatory or other factors.
Emerging-Market Risk—Investments in emerging market countries may have more risk because the markets are less developed and less liquid, and because these investments may be subject to increased economic, political, regulatory or other uncertainties.
37
| | |
| DYNAMIC ASSET ALLOCATION PORTFOLIO |
| NOTES TO FINANCIAL STATEMENTS |
| |
| (continued) | | AB Variable Products Series Fund |
Currency Risk—Fluctuations in currency exchange rates may negatively affect the value of the Portfolio’s investments or reduce its returns.
ETF Risk—ETFs, are investment companies. When the Portfolio invests in an ETF, the Portfolio bears its share of the ETF’s expenses and runs the risk that the ETF may not achieve its investment objective.
Derivatives Risk—Derivatives may be difficult to price or unwind and leveraged so that small changes may produce disproportionate losses for the Portfolio. A short position in a derivative instrument involves the risk of a theoretically unlimited increase in the value of the underlying asset, reference rate or index, which could cause the Portfolio to suffer a potentially unlimited loss. Derivatives, especially over-the-counter derivatives, are also subject to counterparty risk, which is the risk that the counterparty (the party on the other side of the transaction) on a derivative transaction will be unable or unwilling to honor its contractual obligations to the Portfolio.
Leverage Risk—When the Portfolio borrows money or otherwise leverages its investments, its performance may be volatile because leverage tends to exaggerate the effect of any increase or decrease in the value of the Portfolio’s investments. The Portfolio may create leverage through the use of reverse repurchase arrangements, forward currency exchange contracts, forward commitments, dollar rolls or futures or by borrowing money. The use of other types of derivative instruments by the Portfolio, such as options and swaps, may also result in a form of leverage. Leverage may result in higher returns to the Portfolio than if the Portfolio were not leveraged, but may also adversely affect returns, particularly if the market is declining.
Illiquid Investments Risk—Illiquid investments risk exists when certain investments are or become difficult to purchase or sell. Difficulty in selling such investments may result in sales at disadvantageous prices affecting the value of your investment in the Portfolio. Causes of illiquid investments risk may include low trading volumes, large positions and heavy redemptions of Portfolio shares.
Capitalization Risk—Investments in small- and mid-capitalization companies may be more volatile than investments in large-capitalization companies. Investments in small- and mid-capitalization companies may have additional risks because these companies have limited product lines, markets or financial resources.
Real Estate Risk— The Portfolio’s investments in real estate securities have many of the same risks as direct ownership of real estate, including the risk that the value of real estate could decline due to a variety of factors that affect the real estate market generally. Investments in real estate investment trusts, or REITs, may have additional risks. REITs are dependent on the capability of their managers, may have limited diversification, and could be significantly affected by changes in taxes. Some REITs may utilize leverage, which increases investment risk and may potentially increase the Portfolio’s losses.
Indemnification Risk—In the ordinary course of business, the Portfolio enters into contracts that contain a variety of indemnifications. The Portfolio’s maximum exposure under these arrangements is unknown. However, the Portfolio has not had prior claims or losses pursuant to these indemnification provisions and expects the risk of loss thereunder to be remote. Therefore, the Portfolio has not accrued any liability in connection with these indemnification provisions.
Management Risk—The Portfolio is subject to management risk because it is an actively-managed investment fund. The Adviser will apply its investment techniques and risk analyses in making investment decisions for the Portfolio, but there is no guarantee that its techniques will produce the intended results. Some of these techniques may incorporate, or rely upon, quantitative models, but there is no guarantee that these models will generate accurate forecasts, reduce risk or otherwise perform as expected.
NOTE H: Joint Credit Facility
A number of open-end mutual funds managed by the Adviser, including the Portfolio, participate in a $325 million revolving credit facility (the “Facility”) intended to provide short-term financing related to redemptions and other short term liquidity requirements, subject to certain restrictions. Commitment fees related to the Facility are paid by the participating funds and are included in miscellaneous expenses in the statement of operations. The Portfolio did not utilize the Facility during the year ended December 31, 2024.
38
| | |
| |
| | | AB Variable Products Series Fund |
NOTE I: Distributions to Shareholders
The tax character of distributions paid during the fiscal years ended December 31, 2024 and December 31, 2023 were as follows:
| | | | | | | | |
| | | 2024 | | | 2023 | |
Distributions paid from: | | | | | | | | |
Ordinary income | | $ | 2,803,638 | | | $ | 1,463,869 | |
Net long-term capital gains | | | –0 | – | | | –0 | – |
| | | | | | | | |
Total taxable distributions paid | | $ | 2,803,638 | | | $ | 1,463,869 | |
| | | | | | | | |
As of December 31, 2024, the components of accumulated earnings (deficit) on a tax basis were as follows:
| | | | |
Undistributed ordinary income | | $ | 3,946,523 | |
Accumulated capital and other losses | | | (11,295,364 | )(a) |
Unrealized appreciation (depreciation) | | | 84,737,925 | (b) |
| | | | |
Total accumulated earnings (deficit) | | $ | 77,389,084 | |
| | | | |
| (a) | | As of December 31, 2024, the Portfolio had a net capital loss carryforward of $11,119,481. During the fiscal year, the Portfolio utilized $1,471,863 of capital loss carry forwards to offset current year net realized gains. As of December 31, 2024, the cumulative deferred loss on straddles was $175,883. |
| (b) | | The differences between book-basis and tax-basis unrealized appreciation (depreciation) are attributable primarily to the recognition for tax purposes of unrealized gains/losses on certain derivative instruments, return of capital distributions received from underlying securities, the tax treatment of passive foreign investment companies (PFICs), and the tax deferral of losses on wash sales, corporate restructuring. |
For tax purposes, net realized capital losses may be carried over to offset future capital gains, if any. Funds are permitted to carry forward capital losses for an indefinite period, and such losses will retain their character as either short-term or long-term capital losses. As of December 31, 2024, the Portfolio had a net short-term capital loss carryforward of $7,078,145 and a net long-term capital loss carryforward of $4,041,336, which may be carried forward for an indefinite period.
During the current fiscal year, there were no permanent differences that resulted in adjustments to distributable earnings or additional paid-in capital.
NOTE J: Subsequent Events
Management has evaluated subsequent events for possible recognition or disclosure in the financial statements through the date the financial statements are issued. Management has determined that there are no material events that would require disclosure in the Portfolio’s financial statements through this date.
39
| | |
| DYNAMIC ASSET ALLOCATION PORTFOLIO |
| |
| FINANCIAL HIGHLIGHTS | | AB Variable Products Series Fund |
Selected Data For A Share Of Capital Stock Outstanding Throughout Each Period
| | | | | | | | | | | | | | | | | | | | |
| | | CLASS A | |
| | | Year Ended December 31, | |
| | | 2024 | | | 2023 | | | 2022 | | | 2021 | | | 2020 | |
Net asset value, beginning of period | | | $8.95 | | | | $7.94 | | | | $14.94 | | | | $13.89 | | | | $13.46 | |
| | | | | | | | | | | | | | | | | | | | |
| | | | | | | | | | | | | | | | | | | | |
Income From Investment Operations | | | | | | | | | | | | | | | | | | | | |
Net investment income(a)(b) | | | .13 | | | | .12 | | | | .12 | | | | .14 | | | | .15 | |
Net realized and unrealized gain (loss) on investment and foreign currency transactions | | | .82 | | | | .96 | | | | (2.57 | ) | | | 1.20 | | | | .51 | |
| | | | | | | | | | | | | | | | | | | | |
Net increase (decrease) in net asset value from operations | | | .95 | | | | 1.08 | | | | (2.45 | ) | | | 1.34 | | | | .66 | |
| | | | | | | | | | | | | | | | | | | | |
| | | | | | | | | | | | | | | | | | | | |
Less: Dividends and Distributions | | | | | | | | | | | | | | | | | | | | |
Dividends from net investment income | | | (.13 | ) | | | (.07 | ) | | | (.38 | ) | | | (.29 | ) | | | (.23 | ) |
Distributions from net realized gain on investment transactions | | | –0 | – | | | –0 | – | | | (4.17 | ) | | | –0 | – | | | –0 | – |
| | | | | | | | | | | | | | | | | | | | |
Total dividends and distributions | | | (.13 | ) | | | (.07 | ) | | | (4.55 | ) | | | (.29 | ) | | | (.23 | ) |
| | | | | | | | | | | | | | | | | | | | |
Net asset value, end of period | | | $9.77 | | | | $8.95 | | | | $7.94 | | | | $14.94 | | | | $13.89 | |
| | | | | | | | | | | | | | | | | | | | |
| | | | | | | | | | | | | | | | | | | | |
Total Return | | | | | | | | | | | | | | | | | | | | |
Total investment return based on net asset value(c) | | | 10.65 | % | | | 13.70 | % | | | (18.45 | )% | | | 9.67 | % | | | 5.02 | % |
| | | | | | | | | | | | | | | | | | | | |
Ratios/Supplemental Data | | | | | | | | | | | | | | | | | | | | |
Net assets, end of period (000’s omitted) | | | $189 | | | | $226 | | | | $231 | | | | $412 | | | | $364 | |
Ratio to average net assets of: | | | | | | | | | | | | | | | | | | | | |
Expenses, net of waivers/reimbursements(d)‡ | | | .85 | % | | | .85 | % | | | .84 | % | | | .82 | % | | | .80 | % |
Expenses, before waivers/reimbursements(d)‡ | | | .88 | % | | | .93 | % | | | .91 | % | | | .83 | % | | | .80 | % |
Net investment income(b) | | | 1.41 | % | | | 1.42 | % | | | 1.10 | % | | | .98 | % | | | 1.18 | % |
Portfolio turnover rate | | | 11 | % | | | 12 | % | | | 16 | % | | | 32 | % | | | 13 | % |
| | | | | | | | | | | | | | | | | | | | |
‡ Expense ratios exclude the estimated acquired fund fees of the affiliated/unaffiliated underlying | |
portfolios | | | .00 | % | | | .00 | % | | | .01 | % | | | .01 | % | | | .01 | % |
See footnote summary on page 41.
40
| | |
| |
| | | AB Variable Products Series Fund |
Selected Data For A Share Of Capital Stock Outstanding Throughout Each Period
| | | | | | | | | | | | | | | | | | | | |
| | | CLASS B | |
| | | Year Ended December 31, | |
| | | 2024 | | | 2023 | | | 2022 | | | 2021 | | | 2020 | |
Net asset value, beginning of period | | | $8.90 | | | | $7.89 | | | | $14.85 | | | | $13.80 | | | | $13.36 | |
| | | | | | | | | | | | | | | | | | | | |
| | | | | | | | | | | | | | | | | | | | |
Income From Investment Operations | | | | | | | | | | | | | | | | | | | | |
Net investment income(a)(b) | | | .11 | | | | .10 | | | | .09 | | | | .12 | | | | .12 | |
Net realized and unrealized gain (loss) on investment and foreign currency transactions | | | .81 | | | | .96 | | | | (2.56 | ) | | | 1.16 | | | | .51 | |
| | | | | | | | | | | | | | | | | | | | |
Net increase (decrease) in net asset value from operations | | | .92 | | | | 1.06 | | | | (2.47 | ) | | | 1.28 | | | | .63 | |
| | | | | | | | | | | | | | | | | | | | |
| | | | | | | | | | | | | | | | | | | | |
Less: Dividends and Distributions | | | | | | | | | | | | | | | | | | | | |
Dividends from net investment income | | | (.10 | ) | | | (.05 | ) | | | (.32 | ) | | | (.23 | ) | | | (.19 | ) |
Distributions from net realized gain on investment transactions | | | –0 | – | | | –0 | – | | | (4.17 | ) | | | –0 | – | | | –0 | – |
| | | | | | | | | | | | | | | | | | | | |
Total dividends and distributions | | | (.10 | ) | | | (.05 | ) | | | (4.49 | ) | | | (.23 | ) | | | (.19 | ) |
| | | | | | | | | | | | | | | | | | | | |
Net asset value, end of period | | | $9.72 | | | | $8.90 | | | | $7.89 | | | | $14.85 | | | | $13.80 | |
| | | | | | | | | | | | | | | | | | | | |
| | | | | | | | | | | | | | | | | | | | |
Total Return | | | | | | | | | | | | | | | | | | | | |
Total investment return based on net asset value(c) | | | 10.43 | % | | | 13.48 | % | | | (18.68 | )% | | | 9.28 | % | | | 4.86 | % |
| | | | | | | | | | | | | | | | | | | | |
Ratios/Supplemental Data | | | | | | | | | | | | | | | | | | | | |
Net assets, end of period (000’s omitted) | | | $251,229 | | | | $253,591 | | | | $235,366 | | | | $301,920 | | | | $548,422 | |
Ratio to average net assets of: | | | | | | | | | | | | | | | | | | | | |
Expenses, net of waivers/reimbursements(d)‡ | | | 1.10 | % | | | 1.10 | % | | | 1.09 | % | | | 1.06 | % | | | 1.05 | % |
Expenses, before waivers/reimbursements(d)‡ | | | 1.13 | % | | | 1.18 | % | | | 1.17 | % | | | 1.07 | % | | | 1.06 | % |
Net investment income(b) | | | 1.16 | % | | | 1.18 | % | | | .87 | % | | | .80 | % | | | .93 | % |
Portfolio turnover rate | | | 11 | % | | | 12 | % | | | 16 | % | | | 32 | % | | | 13 | % |
| | | | | | | | | | | | | | | | | | | | |
‡ Expense ratios exclude the estimated acquired fund fees of the affiliated/unaffiliated underlying | |
portfolios | | | .00 | % | | | .00 | % | | | .01 | % | | | .01 | % | | | .01 | % |
| (a) | | Based on average shares outstanding. |
| (b) | | Net of expenses waived/reimbursed by the Adviser. |
| (c) | | Total investment return is calculated assuming an initial investment made at the net asset value at the beginning of the period, reinvestment of all dividends and distributions at net asset value during the period, and redemption on the last day of the period. Total investment return does not reflect (i) insurance company’s separate account related expense charges and (ii) the deductions of taxes that a shareholder would pay on Portfolio distributions or the redemption of Portfolio shares. Total investment return calculated for a period of less than one year is not annualized. |
| (d) | | In connection with the Portfolio’s investments in affiliated underlying portfolios, the Portfolio incurs no direct expenses, but bears proportionate shares of the fees and expenses (i.e., operating, administrative and investment advisory fees) of the affiliated underlying portfolios. The Adviser has contractually agreed to waive its fees from the Portfolio in an amount equal to the Portfolio’s pro rata share of certain acquired fund fees and expenses, and for the year ended December 31, 2022, such waiver amounted to .01%. |
See notes to financial statements.
41
| | |
| | |
| REPORT OF INDEPENDENT REGISTERED | | |
| |
| PUBLIC ACCOUNTING FIRM | | AB Variable Products Series Fund |
To the Board of Directors and Shareholders of AB Dynamic Asset Allocation Portfolio
Opinion on the Financial Statements
We have audited the accompanying statement of assets and liabilities of AB Dynamic Asset Allocation Portfolio (the “Portfolio”) (one of the series constituting AB Variable Products Series Fund, Inc. (the “Fund”)), including the portfolio of investments, as of December 31, 2024, and the related statement of operations for the year then ended, the statements of changes in net assets for each of the two years in the period then ended, the financial highlights for each of the five years in the period then ended and the related notes (collectively referred to as the “financial statements”). In our opinion, the financial statements present fairly, in all material respects, the financial position of the Portfolio (one of the series constituting AB Variable Products Series Fund, Inc.) at December 31, 2024, the results of its operations for the year then ended, the changes in its net assets for each of the two years in the period then ended and its financial highlights for each of the five years in the period then ended, in conformity with U.S. generally accepted accounting principles.
Basis for Opinion
These financial statements are the responsibility of the Fund’s management. Our responsibility is to express an opinion on the Portfolio’s financial statements based on our audits. We are a public accounting firm registered with the Public Company Accounting Oversight Board (United States) (“PCAOB”) and are required to be independent with respect to the Fund in accordance with the U.S. federal securities laws and the applicable rules and regulations of the Securities and Exchange Commission and the PCAOB.
We conducted our audits in accordance with the standards of the PCAOB. Those standards require that we plan and perform the audit to obtain reasonable assurance about whether the financial statements are free of material misstatement, whether due to error or fraud. The Fund is not required to have, nor were we engaged to perform, an audit of the Fund’s internal control over financial reporting. As part of our audits, we are required to obtain an understanding of internal control over financial reporting but not for the purpose of expressing an opinion on the effectiveness of the Fund’s internal control over financial reporting. Accordingly, we express no such opinion.
Our audits included performing procedures to assess the risks of material misstatement of the financial statements, whether due to error or fraud, and performing procedures that respond to those risks. Such procedures included examining, on a test basis, evidence regarding the amounts and disclosures in the financial statements. Our procedures included confirmation of securities owned as of December 31, 2024, by correspondence with the custodian, brokers and others; when replies were not received from brokers or others, we performed other auditing procedures. Our audits also included evaluating the accounting principles used and significant estimates made by management, as well as evaluating the overall presentation of the financial statements. We believe that our audits provide a reasonable basis for our opinion.

We have served as the auditor of one or more of the AB investment companies since 1968.
New York, New York
February 14, 2025
42
| | |
| | |
| | |
| |
| 2024 TAX INFORMATION (unaudited) | | AB Variable Products Series Fund |
For Federal income tax purposes, the following information is furnished with respect to the distributions paid by the Portfolio during the taxable year ended December 31, 2024. For corporate shareholders, 53.21% of dividends paid qualify for the dividends received deduction.
43
| | |
| | |
| | |
| |
| DYNAMIC ASSET ALLOCATION PORTFOLIO | | AB Variable Products Series Fund |
INFORMATION REGARDING THE REVIEW AND APPROVAL OF THE FUND’S ADVISORY AGREEMENT
The disinterested directors (the “directors”) of AB Variable Products Series Fund, Inc. (the “Company”) unanimously approved the continuance of the Company’s Advisory Agreement with the Adviser in respect of AB Dynamic Asset Allocation Portfolio (the “Fund”) at a meeting held in-person on November 5-7, 2024 (the “Meeting”).
Prior to approval of the continuance of the Advisory Agreement, the directors had requested from the Adviser, and received and evaluated, extensive materials. They reviewed the proposed continuance of the Advisory Agreement with the Adviser and with experienced counsel who are independent of the Adviser, who advised on the relevant legal standards. The directors also reviewed additional materials, including comparative analytical data prepared by the Senior Vice President of the Fund. The directors also discussed the proposed continuance in private sessions with counsel.
The directors considered their knowledge of the nature and quality of the services provided by the Adviser to the Fund gained from their experience as directors or trustees of most of the registered investment companies advised by the Adviser, their overall confidence in the Adviser’s integrity and competence they have gained from that experience, the Adviser’s initiative in identifying and raising potential issues with the directors and its responsiveness, frankness and attention to concerns raised by the directors in the past, including the Adviser’s willingness to consider and implement organizational and operational changes designed to improve investment results and the services provided to the AB Funds. The directors noted that they have four regular meetings each year, at each of which they review extensive materials and information from the Adviser, including information on the investment performance of the Fund and the underlying funds advised by the Adviser in which the Fund invests a portion of its assets.
The directors also considered all factors they believed relevant, including the specific matters discussed below. During the course of their deliberations, the directors evaluated, among other things, the reasonableness of the advisory fee. The directors did not identify any particular information that was all-important or controlling, and different directors may have attributed different weights to the various factors. The directors determined that the selection of the Adviser to manage the Fund and the overall arrangements between the Fund and the Adviser, as provided in the Advisory Agreement, including the advisory fee, were fair and reasonable in light of the services performed, expenses incurred and such other matters as the directors considered relevant in the exercise of their business judgment. The material factors and conclusions that formed the basis for the directors’ determinations included the following:
Nature, Extent and Quality of Services Provided
The directors considered the scope and quality of services provided by the Adviser under the Advisory Agreement, including the quality of the investment research capabilities of the Adviser and the other resources it has dedicated to performing services for the Fund. The directors noted that the Adviser from time to time reviews the Fund’s investment strategies and from time to time proposes changes intended to improve the Fund’s relative or absolute performance for the directors’ consideration. They also noted the professional experience and qualifications of the Fund’s portfolio management team and other senior personnel of the Adviser. The directors also considered that the Advisory Agreement provides that the Fund will reimburse the Adviser for the cost to it of providing certain clerical, accounting, administrative and other services to the Fund by employees of the Adviser or its affiliates. Requests for these reimbursements are made on a quarterly basis and subject to approval by the directors. Reimbursements, to the extent requested and paid, result in a higher rate of total compensation from the Fund to the Adviser than the fee rate stated in the Advisory Agreement. The directors noted that the methodology used to determine the reimbursement amounts had been reviewed by an independent consultant at the request of the directors. The quality of administrative and other services, including the Adviser’s role in coordinating the activities of the Fund’s other service providers, also was considered. The directors concluded that, overall, they were satisfied with the nature, extent and quality of services provided to the Fund under the Advisory Agreement.
Costs of Services Provided and Profitability
The directors reviewed a schedule of the revenues and expenses and related notes indicating the profitability of the Fund to the Adviser for calendar years 2022 and 2023 that had been prepared with an expense allocation methodology arrived at in consultation with an independent consultant at the request of the directors. The directors noted the assumptions and methods of allocation used by the Adviser in preparing fund-specific profitability data and understood that there are a number of potentially acceptable allocation methodologies for information of this type. The directors noted that the profitability information reflected all revenues and expenses of the Adviser’s relationship with the Fund, including those relating to its subsidiaries that provide transfer agency, distribution and brokerage services to the Fund. The directors recognized that it is difficult to make comparisons of the profitability of the Advisory Agreement with the profitability of fund advisory contracts
44
| | |
| |
| | | AB Variable Products Series Fund |
for unaffiliated funds because comparative information is not generally publicly available and is affected by numerous factors. The directors focused on the profitability of the Adviser’s relationship with the Fund before taxes and distribution expenses. The directors concluded that the Adviser’s level of profitability from its relationship with the Fund was not unreasonable.
Fall-Out Benefits
The directors considered the other benefits to the Adviser and its affiliates from their relationships with the Fund and the money market fund advised by the Adviser in which the Fund invests, including, but not limited to, benefits relating to soft dollar arrangements (whereby investment advisers receive brokerage and research services from brokers that execute agency transactions for their clients); 12b-1 fees and sales charges received by the Fund’s principal underwriter (which is a wholly owned subsidiary of the Adviser) in respect of the Fund’s Class B shares; brokerage commissions paid by the Fund to brokers affiliated with the Adviser; and transfer agency fees paid by the Fund to a wholly owned subsidiary of the Adviser. The directors recognized that the Adviser’s profitability would be somewhat lower without these benefits. The directors understood that the Adviser also might derive reputational and other benefits from its association with the Fund.
Investment Results
In addition to the information reviewed by the directors in connection with the Meeting, the directors receive detailed performance information for the Fund at each regular Board meeting during the year.
At the Meeting, the directors reviewed performance information prepared by an independent service provider (the “15(c) service provider”), showing the performance of the Class A shares of the Fund against a group of similar funds (“peer group”) and a larger group of similar funds (“peer universe”), each selected by the 15(c) service provider, and information prepared by the Adviser showing performance of the Class A shares against a broad-based securities market index, in each case for the 1-, 3-, 5- and 10-year periods July 31, 2024 and (in the case of comparisons with the broad-based securities market index) for the period from inception. The directors discussed with the Adviser the reasons for the Fund’s underperformance in the periods reviewed and determined to continue to monitor the Fund’s performance closely.
Advisory Fees and Other Expenses
The directors considered the advisory fee rate payable by the Fund to the Adviser and information prepared by the 15(c) service provider concerning advisory fee rates payable by other funds in the same category as the Fund. The directors recognized that it is difficult to make comparisons of advisory fees because there are variations in the services that are included in the fees payable by other funds. The directors compared the Fund’s contractual advisory fee rate with a peer group median and noted that it was above the median. They also noted that the Adviser’s total rate of compensation, taking into account the impact of the administrative expense reimbursement paid to the Adviser in the latest fiscal year, was above the median.
The directors also considered the Adviser’s fee schedule for other clients utilizing investment strategies similar to those of the Fund. For this purpose, they reviewed the relevant advisory fee information from the Adviser’s Form ADV and in a report from the Fund’s Senior Vice President and noted the differences between the Fund’s fee schedule, on the one hand, and the Adviser’s institutional fee schedule and the schedule of fees charged by the Adviser to any offshore funds and for services to any sub-advised funds utilizing investment strategies similar to the those of Fund, on the other. The directors noted that the Adviser may, in some cases, agree to fee rates with large institutional clients that are lower than those reviewed by the directors and that they had previously discussed with the Adviser its policies in respect of such arrangements.
The Adviser reviewed with the directors the significantly greater scope of the services it provides to the Fund relative to institutional, offshore fund and sub-advised fund clients. In this regard, the Adviser noted, among other things, that, compared to institutional and offshore or sub-advisory accounts, the Fund (i) demands considerably more portfolio management, research and trading resources due to significantly higher daily cash flows; (ii) has more tax and regulatory restrictions and compliance obligations; (iii) must prepare and file or distribute regulatory and other communications about fund operations; and (iv) must provide shareholder servicing to retail investors. The Adviser also reviewed the greater legal risks presented by the large and changing population of Fund shareholders who may assert claims against the Adviser in individual or class actions, and the greater entrepreneurial risk in offering new fund products, which require substantial investment to launch, may not succeed, and generally must be priced to compete with larger, more
45
| | |
|
| DYNAMIC ASSET ALLOCATION PORTFOLIO |
| |
| (continued) | | AB Variable Products Series Fund |
established funds resulting in lack of profitability to the Adviser until a new fund achieves scale. In light of the substantial differences in services rendered by the Adviser to institutional, offshore fund and sub-advised fund clients as compared to the Fund, and the different risk profile, the directors considered these fee comparisons inapt and did not place significant weight on them in their deliberations.
In connection with their review of the Fund’s advisory fee, the directors also considered the total expense ratio of the Class A shares of the Fund in comparison to the medians for a peer group and a peer universe selected by the 15(c) service provider. The Class A expense ratio of the Fund was based on the Fund’s latest fiscal year and reflected the impact of the Adviser’s expense cap for the Fund. The directors noted that it was likely that the expense ratios of some of the other funds in the Fund’s category were lowered by waivers or reimbursements by those funds’ investment advisers, which in some cases might be voluntary or temporary. The directors view expense ratio information as relevant to their evaluation of the Adviser’s services because the Adviser is responsible for coordinating services provided to the Fund by others. The directors noted that the Fund’s expense ratio was above the medians. After reviewing and discussing the Adviser’s explanations of the reasons for this, the directors concluded that the Fund’s expense ratio was acceptable.
Economies of Scale
The directors noted that the advisory fee schedule for the Fund does not contain breakpoints and that they had previously discussed their strong preference for breakpoints in advisory contracts with the Adviser. The directors took into consideration prior presentations by an independent consultant on economies of scale in the mutual fund industry and for the AB Funds, and presentations from time to time by the Adviser concerning certain of its views on economies of scale. The directors also had requested and received from the Adviser certain updates on economies of scale in advance of the Meeting. The directors believe that economies of scale may be realized (if at all) by the Adviser across a variety of products and services, and not only in respect of a single fund. The directors noted that there is no established methodology for setting breakpoints that give effect to the fund-specific services provided by a fund’s adviser and to the economies of scale that an adviser may realize in its overall mutual fund business or those components of it which directly or indirectly affect a fund’s operations. The directors observed that in the mutual fund industry as a whole, as well as among funds similar to the Fund, there is no uniformity or pattern in the fees and asset levels at which breakpoints (if any) apply. The directors also noted that the advisory agreements for many funds do not have breakpoints at all. The directors informed the Adviser that they would monitor the Fund’s asset level (which was well below the level at which they would anticipate adding an initial breakpoint) and its profitability to the Adviser and anticipated revisiting the question of breakpoints in the future if circumstances warranted doing so.
46
VPS-DAA-0151-1224
DEC 12.31.24

ANNUAL FINANCIAL STATEMENTS AND ADDITIONAL INFORMATION
AB VARIABLE PRODUCTS SERIES FUND, INC.
| + | | AB DISCOVERY VALUE PORTFOLIO |
Investment Products Offered
| | • | | Are Not Bank Guaranteed |
AllianceBernstein Investments, Inc. (ABI) is the distributor of the AB family of mutual funds. ABI is a member of FINRA and is an affiliate of AllianceBernstein L.P., the Adviser of the funds.
You may obtain a description of the Fund’s proxy voting policies and procedures, and information regarding how the Fund voted proxies relating to portfolio securities during the most recent 12-month period ended June 30, without charge. Simply visit AB’s website at www.abfunds.com or go to the Securities and Exchange Commission’s (the “Commission”) website at www.sec.gov, or call AB at (800) 227 4618.
The Fund files its complete schedule of portfolio holdings with the Commission for the first and third quarters of each fiscal year as an exhibit to its reports on Form N-PORT. The Fund’s Form N-PORT reports are available on the Commission’s website at www.sec.gov.
The [A/B] logo and AllianceBernstein® are registered trademarks used by permission of the owner, AllianceBernstein L.P.
| | |
| DISCOVERY VALUE PORTFOLIO | | |
| PORTFOLIO OF INVESTMENTS | | |
| |
| December 31, 2024 | | AB Variable Products Series Fund |
| | | | | | | | |
| Company | | Shares | | | U.S. $ Value | |
| | | | | | | | |
COMMON STOCKS–99.4% | | | | | | | | |
INDUSTRIALS–20.9% | | | | | | | | |
AIR FREIGHT & LOGISTICS–1.7% | | | | | | | | |
CH Robinson Worldwide, Inc. | | | 114,802 | | | $ | 11,861,343 | |
| | | | | | | | |
BUILDING PRODUCTS–0.5% | | | | | | | | |
Builders FirstSource, Inc.(a)(b) | | | 26,050 | | | | 3,723,326 | |
| | | | | | | | |
COMMERCIAL SERVICES & SUPPLIES–2.2% | | | | | | | | |
ABM Industries, Inc. | | | 156,971 | | | | 8,033,776 | |
MillerKnoll, Inc.(a) | | | 329,063 | | | | 7,433,533 | |
| | | | | | | | |
| | | | | | | 15,467,309 | |
| | | | | | | | |
CONSTRUCTION & ENGINEERING–3.7% | | | | | | | | |
Fluor Corp.(b) | | | 178,150 | | | | 8,786,358 | |
MasTec, Inc.(a)(b) | | | 64,961 | | | | 8,843,791 | |
WillScot Holdings Corp.(b) | | | 240,703 | | | | 8,051,515 | |
| | | | | | | | |
| | | | | | | 25,681,664 | |
| | | | | | | | |
ELECTRICAL EQUIPMENT–1.2% | | | | | | | | |
Regal Rexnord Corp.(a) | | | 54,508 | | | | 8,455,826 | |
| | | | | | | | |
GROUND TRANSPORTATION–1.2% | | | | | | | | |
ArcBest Corp. | | | 86,984 | | | | 8,117,347 | |
| | | | | | | | |
MACHINERY–6.6% | | | | | | | | |
Gates Industrial Corp. PLC(a)(b) | | | 413,690 | | | | 8,509,603 | |
John Bean Technologies Corp.(a) | | | 73,143 | | | | 9,296,475 | |
Middleby Corp. (The)(a)(b) | | | 71,106 | | | | 9,631,308 | |
Oshkosh Corp. | | | 80,300 | | | | 7,634,121 | |
Pentair PLC(a) | | | 106,970 | | | | 10,765,461 | |
| | | | | | | | |
| | | | | | | 45,836,968 | |
| | | | | | | | |
PROFESSIONAL SERVICES–2.1% | | | | | | | | |
Robert Half, Inc.(a) | | | 127,985 | | | | 9,017,823 | |
WNS Holdings Ltd.(a)(b) | | | 115,093 | | | | 5,454,257 | |
| | | | | | | | |
| | | | | | | 14,472,080 | |
| | | | | | | | |
TRADING COMPANIES & DISTRIBUTORS–1.7% | | | | | | | | |
Core & Main, Inc.–Class A(a)(b) | | | 161,640 | | | | 8,229,093 | |
Herc Holdings, Inc. | | | 18,880 | | | | 3,574,550 | |
| | | | | | | | |
| | | | | | | 11,803,643 | |
| | | | | | | | |
| | | | | | | 145,419,506 | |
| | | | | | | | |
FINANCIALS–20.4% | | | | | | | | |
BANKS–11.0% | | | | | | | | |
BankUnited, Inc. | | | 191,404 | | | | 7,305,891 | |
Comerica, Inc.(a) | | | 137,243 | | | | 8,488,480 | |
| | | | | | | | |
First BanCorp./Puerto Rico(a) | | | 396,254 | | | | 7,366,362 | |
First Citizens BancShares, Inc./NC–Class A(a) | | | 4,723 | | | | 9,979,793 | |
First Hawaiian, Inc.(a) | | | 359,838 | | | | 9,337,796 | |
Texas Capital Bancshares, Inc.(a)(b) | | | 91,562 | | | | 7,160,148 | |
Webster Financial Corp. | | | 149,589 | | | | 8,260,305 | |
Wintrust Financial Corp.(a) | | | 80,690 | | | | 10,062,850 | |
Zions Bancorp NA | | | 159,186 | | | | 8,635,840 | |
| | | | | | | | |
| | | | | | | 76,597,465 | |
| | | | | | | | |
CAPITAL MARKETS–3.8% | | | | | | | | |
Cboe Global Markets, Inc. | | | 43,170 | | | | 8,435,418 | |
Invesco Ltd. | | | 522,268 | | | | 9,129,245 | |
Stifel Financial Corp. | | | 81,344 | | | | 8,628,971 | |
| | | | | | | | |
| | | | | | | 26,193,634 | |
| | | | | | | | |
FINANCIAL SERVICES–2.4% | | | | | | | | |
NCR Atleos Corp.(a)(b) | | | 302,868 | | | | 10,273,283 | |
Walker & Dunlop, Inc.(a) | | | 68,840 | | | | 6,691,936 | |
| | | | | | | | |
| | | | | | | 16,965,219 | |
| | | | | | | | |
INSURANCE–3.2% | | | | | | | | |
American Financial Group, Inc./OH(a) | | | 73,326 | | | | 10,040,529 | |
Hanover Insurance Group, Inc. (The) | | | 53,630 | | | | 8,294,416 | |
Kemper Corp. | | | 61,800 | | | | 4,105,992 | |
| | | | | | | | |
| | | | | | | 22,440,937 | |
| | | | | | | | |
| | | | | | | 142,197,255 | |
| | | | | | | | |
CONSUMER DISCRETIONARY–15.4% | | | | | | | | |
AUTOMOBILE COMPONENTS–2.2% | | | | | | | | |
Adient PLC(b) | | | 361,990 | | | | 6,237,088 | |
BorgWarner, Inc.(a) | | | 300,175 | | | | 9,542,563 | |
| | | | | | | | |
| | | | | | | 15,779,651 | |
| | | | | | | | |
DIVERSIFIED CONSUMER SERVICES–1.2% | | | | | | | | |
ADT, Inc.(a) | | | 1,191,394 | | | | 8,232,532 | |
| | | | | | | | |
HOTELS, RESTAURANTS & LEISURE–1.4% | | | | | | | | |
Dine Brands Global, Inc.(a) | | | 101,030 | | | | 3,041,003 | |
Viking Holdings Ltd.(a)(b) | | | 154,114 | | | | 6,790,263 | |
| | | | | | | | |
| | | | | | | 9,831,266 | |
| | | | | | | | |
HOUSEHOLD DURABLES–0.9% | | | | | | | | |
Taylor Morrison Home Corp.(b) | | | 100,829 | | | | 6,171,743 | |
| | | | | | | | |
LEISURE PRODUCTS–1.0% | | | | | | | | |
Brunswick Corp./DE(a) | | | 109,690 | | | | 7,094,749 | |
| | | | | | | | |
SPECIALTY RETAIL–4.5% | | | | | | | | |
AutoNation, Inc.(a)(b) | | | 53,959 | | | | 9,164,397 | |
Bath & Body Works, Inc.(a) | | | 309,572 | | | | 12,002,106 | |
Group 1 Automotive, Inc.(a) | | | 23,620 | | | | 9,955,358 | |
| | | | | | | | |
| | | | | | | 31,121,861 | |
| | | | | | | | |
1
| | |
| DISCOVERY VALUE PORTFOLIO | | |
| PORTFOLIO OF INVESTMENTS | | |
| |
| (continued) | | AB Variable Products Series Fund |
| | | | | | | | |
| Company | | Shares | | | U.S. $ Value | |
| | | | | | | | |
TEXTILES, APPAREL & LUXURY GOODS–4.2% | | | | | | | | |
Crocs, Inc.(a)(b) | | | 78,117 | | | $ | 8,556,155 | |
PVH Corp.(a) | | | 65,991 | | | | 6,978,548 | |
Tapestry, Inc.(a) | | | 206,941 | | | | 13,519,456 | |
| | | | | | | 29,054,159 | |
| | | | | | | | |
| | | | | | | 107,285,961 | |
| | | | | | | | |
INFORMATION TECHNOLOGY–12.0% | | | | | | | | |
COMMUNICATIONS EQUIPMENT–3.9% | | | | | | | | |
Calix, Inc.(b) | | | 145,005 | | | | 5,056,325 | |
F5, Inc.(b) | | | 50,160 | | | | 12,613,735 | |
Lumentum Holdings, Inc.(a)(b) | | | 108,756 | | | | 9,130,066 | |
| | | | | | | | |
| | | | | | | 26,800,126 | |
| | | | | | | | |
ELECTRONIC EQUIPMENT, INSTRUMENTS & COMPONENTS–3.2% | | | | | | | | |
Avnet, Inc.(a) | | | 131,960 | | | | 6,904,147 | |
Belden, Inc.(a) | | | 49,984 | | | | 5,628,698 | |
TD SYNNEX Corp.(a) | | | 82,090 | | | | 9,627,515 | |
| | | | | | | | |
| | | | | | | 22,160,360 | |
| | | | | | | | |
SEMICONDUCTORS & SEMICONDUCTOR EQUIPMENT–2.7% | | | | | | | | |
Amkor Technology, Inc.(a) | | | 268,958 | | | | 6,909,531 | |
FormFactor, Inc.(a)(b) | | | 200,922 | | | | 8,840,568 | |
Synaptics, Inc.(a)(b) | | | 41,677 | | | | 3,180,789 | |
| | | | | | | | |
| | | | | | | 18,930,888 | |
| | | | | | | | |
SOFTWARE–2.2% | | | | | | | | |
ACI Worldwide, Inc.(b) | | | 114,806 | | | | 5,959,579 | |
CommVault Systems, Inc.(b) | | | 26,496 | | | | 3,998,511 | |
Gen Digital, Inc. | | | 203,991 | | | | 5,585,274 | |
| | | | | | | | |
| | | | | | | 15,543,364 | |
| | | | | | | | |
| | | | | | | 83,434,738 | |
| | | | | | | | |
REAL ESTATE–8.1% | | | | | | | | |
DIVERSIFIED REITS–0.6% | | | | | | | | |
Broadstone Net Lease, Inc.–Class A | | | 245,061 | | | | 3,886,668 | |
| | | | | | | | |
HOTEL & RESORT REITS–0.9% | | | | | | | | |
Ryman Hospitality Properties, Inc. | | | 57,880 | | | | 6,039,199 | |
| | | | | | | | |
INDUSTRIAL REITS–1.9% | | | | | | | | |
First Industrial Realty Trust, Inc.(a) | | | 122,767 | | | | 6,154,310 | |
STAG Industrial, Inc. | | | 211,298 | | | | 7,146,098 | |
| | | | | | | | |
| | | | | | | 13,300,408 | |
| | | | | | | | |
OFFICE REITS–1.2% | | | | | | | | |
COPT Defense Properties(a) | | | 282,450 | | | | 8,741,828 | |
| | | | | | | | |
| | | | | | | | |
REAL ESTATE MANAGEMENT & DEVELOPMENT–1.5% | | | | | | | | |
Jones Lang LaSalle, Inc.(b) | | | 41,858 | | | | 10,595,934 | |
| | | | | | | | |
RESIDENTIAL REITS–1.4% | | | | | | | | |
Independence Realty Trust, Inc.(a) | | | 493,530 | | | | 9,791,635 | |
| | | | | | | | |
SPECIALIZED REITS–0.6% | | | | | | | | |
CubeSmart | | | 99,886 | | | | 4,280,115 | |
| | | | | | | | |
| | | | | | | 56,635,787 | |
| | | | | | | | |
HEALTH CARE–6.6% | | | | | | | | |
HEALTH CARE EQUIPMENT & SUPPLIES–2.7% | | | | | | | | |
Avantor, Inc.(a)(b) | | | 352,820 | | | | 7,433,918 | |
Integra LifeSciences Holdings Corp.(a)(b) | | | 181,700 | | | | 4,120,956 | |
Teleflex, Inc.(a) | | | 39,290 | | | | 6,992,834 | |
| | | | | | | | |
| | | | | | | 18,547,708 | |
| | | | | | | | |
HEALTH CARE PROVIDERS & SERVICES–2.5% | | | | | | | | |
AMN Healthcare Services, Inc.(b) | | | 96,460 | | | | 2,307,323 | |
Encompass Health Corp. | | | 111,570 | | | | 10,303,490 | |
Pediatrix Medical Group, Inc.(a)(b) | | | 396,110 | | | | 5,196,963 | |
| | | | | | | | |
| | | | | | | 17,807,776 | |
| | | | | | | | |
LIFE SCIENCES TOOLS & SERVICES–1.4% | | | | | | | | |
ICON PLC(a)(b) | | | 47,610 | | | | 9,984,293 | |
| | | | | | | | |
| | | | | | | 46,339,777 | |
| | | | | | | | |
ENERGY–5.4% | | | | | | | | |
OIL, GAS & CONSUMABLE FUELS–5.4% | | | | | | | | |
Cameco Corp. (New York) | | | 200,540 | | | | 10,305,751 | |
HF Sinclair Corp.(a) | | | 71,685 | | | | 2,512,559 | |
Magnolia Oil & Gas Corp.–Class A(a) | | | 338,292 | | | | 7,909,267 | |
Matador Resources Co.(a) | | | 163,540 | | | | 9,200,760 | |
Northern Oil and Gas, Inc.(a) | | | 212,497 | | | | 7,896,389 | |
| | | | | | | | |
| | | | | | | 37,824,726 | |
| | | | | | | | |
MATERIALS–3.1% | | | | | | | | |
CHEMICALS–1.8% | | | | | | | | |
Avient Corp.(a) | | | 181,050 | | | | 7,397,703 | |
Element Solutions, Inc. | | | 211,469 | | | | 5,377,657 | |
| | | | | | | | |
| | | | | | | 12,775,360 | |
| | | | | | | | |
CONTAINERS & PACKAGING–1.3% | | | | | | | | |
Graphic Packaging Holding Co.(a) | | | 331,670 | | | | 9,008,157 | |
| | | | | | | | |
| | | | | | | 21,783,517 | |
| | | | | | | | |
2
| | |
| |
| | | AB Variable Products Series Fund |
| | | | | | | | |
| Company | | Shares | | | U.S. $ Value | |
| | | | | | | | |
UTILITIES–2.8% | | | | | | | | |
ELECTRIC UTILITIES–2.8% | | | | | | | | |
IDACORP, Inc.(a) | | | 86,574 | | | $ | 9,460,807 | |
Portland General Electric Co.(a) | | | 55,225 | | | | 2,408,914 | |
TXNM Energy, Inc.(a) | | | 153,747 | | | | 7,559,740 | |
| | | | | | | | |
| | | | | | | 19,429,461 | |
| | | | | | | | |
CONSUMER STAPLES–2.7% | | | | | | | | |
CONSUMER STAPLES DISTRIBUTION & RETAIL–1.5% | | | | | | | | |
BJ’s Wholesale Club Holdings, Inc.(a)(b) | | | 118,510 | | | | 10,588,868 | |
| | | | | | | | |
FOOD PRODUCTS–1.2% | | | | | | | | |
Nomad Foods Ltd. | | | 477,541 | | | | 8,013,138 | |
| | | | | | | | |
| | | | | | | 18,602,006 | |
| | | | | | | | |
COMMUNICATION SERVICES–2.0% | | | | | | | | |
MEDIA–2.0% | | | | | | | | |
Criteo SA (Sponsored ADR)(b) | | | 187,529 | | | | 7,418,647 | |
Nexstar Media Group, Inc.(a) | | | 41,923 | | | | 6,622,577 | |
| | | | | | | | |
| | | | | | | 14,041,224 | |
| | | | | | | | |
Total Common Stocks
(cost $608,759,973) | | | | | | | 692,993,958 | |
| | | | | | | | |
SHORT-TERM INVESTMENTS–0.5% | | | | | | | | |
INVESTMENT COMPANIES–0.5% | | | | | | | | |
AB Fixed Income Shares, Inc.–Government Money Market Portfolio–Class AB, 4.43%(c)(d)(e)
(cost $3,835,365) | | | 3,835,365 | | | | 3,835,365 | |
| | | | | | | | |
TOTAL INVESTMENTS BEFORE SECURITY LENDING COLLATERAL FOR SECURITIES LOANED–99.9%
(cost $612,595,338) | | | | | | | 696,829,323 | |
| | | | | | | | |
| | | | | | | | |
INVESTMENTS OF CASH COLLATERAL FOR SECURITIES LOANED–7.9% | | | | | | | | |
INVESTMENT COMPANIES–7.9% | | | | | | | | |
AB Fixed Income Shares, Inc.–Government Money Market Portfolio–Class AB, 4.43%(c)(d)(e)
(cost $54,912,779) | | | 54,912,779 | | | | 54,912,779 | |
| | | | | | | | |
TOTAL INVESTMENTS–107.8%
(cost $667,508,117) | | | | | | | 751,742,102 | |
| | | | | | | | |
Other assets less liabilities–(7.8)% | | | | | | | (54,713,433 | ) |
| | | | | | | | |
NET ASSETS–100.0% | | | | | | $ | 697,028,669 | |
| | | | | | | | |
| (a) | | Represents entire or partial securities out on loan. See Note E for securities lending information. |
| (b) | | Non-income producing security. |
| (c) | | Affiliated investments. |
| (d) | | The rate shown represents the 7-day yield as of period end. |
| (e) | | To obtain a copy of the fund’s shareholder report, please go to the Securities and Exchange Commission’s website at www.sec.gov, or call AB at (800) 227-4618. |
Glossary:
ADR—American Depositary Receipt
REIT—Real Estate Investment Trust
See notes to financial statements.
3
| | |
| DISCOVERY VALUE PORTFOLIO | | |
| STATEMENT OF ASSETS & LIABILITIES | | |
| |
| December 31, 2024 | | AB Variable Products Series Fund |
| | | | |
ASSETS | |
Investments in securities, at value | | | | |
Unaffiliated issuers (cost $608,759,973) | | $ | 692,993,958 | (a) |
Affiliated issuers (cost $58,748,144—including investment of cash collateral for securities loaned of $54,912,779) | | | 58,748,144 | |
Cash | | | 22 | |
Unaffiliated dividends receivable | | | 969,591 | |
Receivable for capital stock sold | | | 277,672 | |
Receivable for investment securities sold | | | 179,267 | |
Affiliated dividends receivable | | | 16,226 | |
Receivable due from Adviser | | | 2,266 | |
| | | | |
Total assets | | | 753,187,146 | |
| | | | |
LIABILITIES | |
Payable for collateral received on securities loaned | | | 54,912,779 | |
Advisory fee payable | | | 448,283 | |
Payable for capital stock redeemed | | | 363,374 | |
Payable for investment securities purchased | | | 179,134 | |
Distribution fee payable | | | 91,364 | |
Administrative fee payable | | | 24,220 | |
Transfer Agent fee payable | | | 167 | |
Directors’ fees payable | | | 163 | |
Accrued expenses | | | 138,993 | |
| | | | |
Total liabilities | | | 56,158,477 | |
| | | | |
NET ASSETS | | $ | 697,028,669 | |
| | | | |
COMPOSITION OF NET ASSETS | |
Capital stock, at par | | $ | 38,432 | |
Additional paid-in capital | | | 535,103,721 | |
Distributable earnings | | | 161,886,516 | |
| | | | |
NET ASSETS | | $ | 697,028,669 | |
| | | | |
Net Asset Value Per Share—1 billion shares of capital stock authorized, $.001 par value
| | | | | | | | | | | | |
| Class | | Net Assets | | | Shares
Outstanding | | | Net Asset
Value | |
| | | |
| A | | $ | 271,350,714 | | | | 14,813,460 | | | $ | 18.32 | |
| | | |
| B | | $ | 425,677,955 | | | | 23,618,330 | | | $ | 18.02 | |
| (a) | | Includes securities on loan with a value of $177,659,464 (see Note E). |
See notes to financial statements.
4
| | |
| DISCOVERY VALUE PORTFOLIO | | |
| STATEMENT OF OPERATIONS | | |
| |
| Year Ended December 31, 2024 | | AB Variable Products Series Fund |
| | | | |
INVESTMENT INCOME | | | | |
Dividends | | | | |
Unaffiliated issuers (net of foreign taxes withheld of $32,709) | | $ | 11,457,767 | |
Affiliated issuers | | | 224,840 | |
Interest | | | 717 | |
Securities lending income | | | 138,178 | |
| | | | |
| | | 11,821,502 | |
| | | | |
EXPENSES | | | | |
Advisory fee (see Note B) | | | 5,321,328 | |
Distribution fee—Class B | | | 1,107,483 | |
Transfer agency—Class A | | | 2,503 | |
Transfer agency—Class B | | | 4,158 | |
Administrative | | | 94,676 | |
Printing | | | 79,454 | |
Custody and accounting | | | 69,927 | |
Legal | | | 67,118 | |
Audit and tax | | | 51,419 | |
Directors’ fees | | | 30,413 | |
Miscellaneous | | | 22,855 | |
| | | | |
Total expenses | | | 6,851,334 | |
Less: expenses waived and reimbursed by the Adviser (see Notes B & E) | | | (10,126 | ) |
| | | | |
Net expenses | | | 6,841,208 | |
| | | | |
Net investment income | | | 4,980,294 | |
| | | | |
REALIZED AND UNREALIZED GAIN (LOSS) ON INVESTMENT AND FOREIGN CURRENCY TRANSACTIONS | | | | |
Net realized gain (loss) on: | | | | |
Investment transactions | | | 75,328,717 | |
Foreign currency transactions | | | (2,648 | ) |
Net change in unrealized appreciation (depreciation) of investments | | | (13,528,536 | ) |
| | | | |
Net gain on investment and foreign currency transactions | | | 61,797,533 | |
| | | | |
NET INCREASE IN NET ASSETS FROM OPERATIONS | | $ | 66,777,827 | |
| | | | |
See notes to financial statements.
5
| | |
| | |
| DISCOVERY VALUE PORTFOLIO | | |
| |
| STATEMENT OF CHANGES IN NET ASSETS | | AB Variable Products Series Fund |
| | | | | | | | |
| | | Year Ended
December 31,
2024 | | | Year Ended
December 31,
2023 | |
INCREASE (DECREASE) IN NET ASSETS FROM OPERATIONS | | | | | | | | |
Net investment income | | $ | 4,980,294 | | | $ | 4,923,861 | |
Net realized gain on investment transactions and foreign currency transactions | | | 75,326,069 | | | | 35,759,325 | |
Net change in unrealized appreciation (depreciation) of investments | | | (13,528,536 | ) | | | 66,873,944 | |
| | | | | | | | |
Net increase in net assets from operations | | | 66,777,827 | | | | 107,557,130 | |
Distributions to Shareholders | | | | | | | | |
Class A | | | (15,717,646 | ) | | | (22,107,220 | ) |
Class B | | | (25,029,921 | ) | | | (40,508,165 | ) |
CAPITAL STOCK TRANSACTIONS | | | | | | | | |
Net increase (decrease) | | | (47,076,392 | ) | | | 13,461,192 | |
| | | | | | | | |
Total increase (decrease) | | | (21,046,132 | ) | | | 58,402,937 | |
NET ASSETS | | | | | | | | |
Beginning of period | | | 718,074,801 | | | | 659,671,864 | |
| | | | | | | | |
End of period | | $ | 697,028,669 | | | $ | 718,074,801 | |
| | | | | | | | |
See notes to financial statements.
6
| | |
| DISCOVERY VALUE PORTFOLIO |
| NOTES TO FINANCIAL STATEMENTS |
| |
| December 31, 2024 | | AB Variable Products Series Fund |
NOTE A: Significant Accounting Policies
The AB Discovery Value Portfolio (the “Portfolio”) (formerly known as AB Small/Mid Cap Value Portfolio) is a series of AB Variable Products Series Fund, Inc. (the “Fund”). The Portfolio’s investment objective is long-term growth of capital. The Portfolio is diversified as defined under the Investment Company Act of 1940 (the “1940 Act”). The Fund was incorporated in the State of Maryland as an open-end series investment company. The Fund offers nine separately managed pools of assets which have differing investment objectives and policies. The Portfolio offers Class A and Class B shares. Both classes of shares have identical voting, dividend, liquidating and other rights, except that Class B shares bear a distribution expense and have exclusive voting rights with respect to the Class B distribution plan.
The Portfolio offers and sells its shares only to separate accounts of certain life insurance companies for the purpose of funding variable annuity contracts and variable life insurance policies. Sales are made without a sales charge at the Portfolio’s net asset value per share.
The financial statements have been prepared in conformity with U.S. generally accepted accounting principles (“U.S. GAAP”), which require management to make certain estimates and assumptions that affect the reported amounts of assets and liabilities in the financial statements and amounts of income and expenses during the reporting period. Actual results could differ from those estimates. The Portfolio is an investment company under U.S. GAAP and follows the accounting and reporting guidance applicable to investment companies. The following is a summary of significant accounting policies followed by the Portfolio.
1. Security Valuation
Portfolio securities are valued at market value determined on the basis of market quotations or, if market quotations are not readily available or are unreliable, at “fair value” as determined in accordance with procedures approved by and under the oversight of the Fund’s Board of Directors (the “Board”). Pursuant to these procedures, AllianceBernstein L.P. (the “Adviser”) serves as the Portfolio’s valuation designee pursuant to Rule 2a-5 of the 1940 Act. In this capacity, the Adviser is responsible, among other things, for making all fair value determinations relating to the Portfolio’s portfolio investments, subject to the Board’s oversight.
In general, the market values of securities which are readily available and deemed reliable are determined as follows: securities listed on a national securities exchange (other than securities listed on the NASDAQ Stock Market, Inc. (“NASDAQ”)) or on a foreign securities exchange are valued at the last sale price at the close of the exchange or foreign securities exchange. If there has been no sale on such day, the securities are valued at the last traded price from the previous day. Securities listed on more than one exchange are valued by reference to the principal exchange on which the securities are traded; securities listed only on NASDAQ are valued in accordance with the NASDAQ Official Closing Price; listed or over the counter (“OTC”) market put or call options are valued at the mid level between the current bid and ask prices. If either a current bid or current ask price is unavailable, the Adviser will have discretion to determine the best valuation (e.g., last trade price in the case of listed options); open futures are valued using the closing settlement price or, in the absence of such a price, the most recent quoted bid price. If there are no quotations available for the day of valuation, the last available closing settlement price is used; U.S. Government securities and any other debt instruments having 60 days or less remaining until maturity are generally valued at market by an independent pricing vendor, if a market price is available. If a market price is not available, the securities are valued at amortized cost. This methodology is commonly used for short term securities that have an original maturity of 60 days or less, as well as short term securities that had an original term to maturity that exceeded 60 days. In instances when amortized cost is utilized, the Valuation Committee (the “Committee”) must reasonably conclude that the utilization of amortized cost is approximately the same as the fair value of the security. Factors the Committee will consider include, but are not limited to, an impairment of the creditworthiness of the issuer or material changes in interest rates. Fixed-income securities, including mortgage-backed and asset-backed securities, may be valued on the basis of prices provided by a pricing service or at a price obtained from one or more of the major broker-dealers. In cases where broker-dealer quotes are obtained, the Adviser may establish procedures whereby changes in market yields or spreads are used to adjust, on a daily basis, a recently obtained quoted price on a security. Swaps and other derivatives are valued daily, primarily using independent pricing services, independent pricing models using market inputs, as well as third party broker-dealers or counterparties. Open-end mutual funds are valued at the closing net asset value per share, while exchange-traded funds are valued at the closing market price per share.
Securities for which market quotations are not readily available (including restricted securities) or are deemed unreliable are valued at fair value as deemed appropriate by the Adviser. Factors considered in making this determination may include, but
7
| | |
| DISCOVERY VALUE PORTFOLIO | | |
| NOTES TO FINANCIAL STATEMENTS | | |
| |
| (continued) | | AB Variable Products Series Fund |
are not limited to, information obtained by contacting the issuer, analysts, analysis of the issuer’s financial statements or other available documents. In addition, the Portfolio may use fair value pricing for securities primarily traded in non-U.S. markets because most foreign markets close well before the Portfolio values its securities at 4:00 p.m., Eastern Time. The earlier close of these foreign markets gives rise to the possibility that significant events, including broad market moves, may have occurred in the interim and may materially affect the value of those securities. To account for this, the Portfolio generally values many of its foreign equity securities using fair value prices based on third party vendor modeling tools to the extent available.
2. Fair Value Measurements
In accordance with U.S. GAAP regarding fair value measurements, fair value is defined as the price that the Portfolio would receive to sell an asset or pay to transfer a liability in an orderly transaction between market participants at the measurement date. U.S. GAAP establishes a framework for measuring fair value, and a three-level hierarchy for fair value measurements based upon the transparency of inputs to the valuation of an asset or liability (including those valued based on their market values as described in Note A.1 above). Inputs may be observable or unobservable and refer broadly to the assumptions that market participants would use in pricing the asset or liability. Observable inputs reflect the assumptions market participants would use in pricing the asset or liability based on market data obtained from sources independent of the Portfolio. Unobservable inputs reflect the Portfolio’s own assumptions about the assumptions that market participants would use in pricing the asset or liability based on the best information available in the circumstances. Each investment is assigned a level based upon the observability of the inputs which are significant to the overall valuation. The three-tier hierarchy of inputs is summarized below.
| | • | | Level 1—quoted prices in active markets for identical investments |
| | • | | Level 2—other significant observable inputs (including quoted prices for similar investments, interest rates, prepayment speeds, credit risk, etc.) |
| | • | | Level 3—significant unobservable inputs (including the Portfolio’s own assumptions in determining the fair value of investments) |
Where readily available market prices or relevant bid prices are not available for certain equity investments, such investments may be valued based on similar publicly traded investments, movements in relevant indices since last available prices or based upon underlying company fundamentals and comparable company data (such as multiples to earnings or other multiples to equity). Where an investment is valued using an observable input, such as another publicly traded security, the investment will be classified as Level 2. If management determines that an adjustment is appropriate based on restrictions on resale, illiquidity or uncertainty, and such adjustment is a significant component of the valuation, the investment will be classified as Level 3. An investment will also be classified as Level 3 where management uses company fundamentals and other significant inputs to determine the valuation.
The following table summarizes the valuation of the Portfolio’s investments by the above fair value hierarchy levels as of December 31, 2024:
| | | | | | | | | | | | | | | | |
| | | Level 1 | | | Level 2 | | | Level 3 | | | Total | |
Investments in Securities: | | | | | | | | | | | | | | | | |
Assets: | | | | | | | | | | | | | | | | |
Common Stocks(a) | | $ | 692,993,958 | | | $ | –0 | – | | $ | –0 | – | | $ | 692,993,958 | |
Short-Term Investments | | | 3,835,365 | | | | –0 | – | | | –0 | – | | | 3,835,365 | |
Investments of Cash Collateral for Securities Loaned in Affiliated Money Market Fund | | | 54,912,779 | | | | –0 | – | | | –0 | – | | | 54,912,779 | |
| | | | | | | | | | | | | | | | |
Total Investments in Securities | | | 751,742,102 | | | | –0 | – | | | –0 | – | | | 751,742,102 | |
Other Financial Instruments(b) | | | –0 | – | | | –0 | – | | | –0 | – | | | –0 | – |
| | | | | | | | | | | | | | | | |
Total | | $ | 751,742,102 | | | $ | –0 | – | | $ | –0 | – | | $ | 751,742,102 | |
| | | | | | | | | | | | | | | | |
| (a) | | See Portfolio of Investments for sector classifications. |
| (b) | | Other financial instruments include derivative instruments, such as futures, forwards and swaps. Derivative instruments are valued at the unrealized appreciation (depreciation) on the instrument. Other financial instruments may also include swaps with upfront premiums, written options and written swaptions which are valued at market value. |
8
| | |
| |
| | | AB Variable Products Series Fund |
3. Currency Translation
Assets and liabilities denominated in foreign currencies and commitments under forward currency exchange contracts are translated into U.S. dollars at the mean of the quoted bid and ask prices of such currencies against the U.S. dollar. Purchases and sales of portfolio securities are translated into U.S. dollars at the rates of exchange prevailing when such securities were acquired or sold. Income and expenses are translated into U.S. dollars at rates of exchange prevailing when accrued.
Net realized gain or loss on foreign currency transactions represents foreign exchange gains and losses from sales and maturities of foreign fixed income investments, holding of foreign currencies, currency gains or losses realized between the trade and settlement dates on foreign investment transactions, and the difference between the amounts of dividends, interest and foreign withholding taxes recorded on the Portfolio’s books and the U.S. dollar equivalent amounts actually received or paid. Net unrealized currency gains and losses from valuing foreign currency denominated assets and liabilities at period end exchange rates are reflected as a component of net unrealized appreciation or depreciation of foreign currency denominated assets and liabilities.
4. Taxes
It is the Portfolio’s policy to meet the requirements of the Internal Revenue Code applicable to regulated investment companies and to distribute all of its investment company taxable income and net realized gains, if any, to shareholders. Therefore, no provisions for federal income or excise taxes are required. The Portfolio may be subject to taxes imposed by countries in which it invests. Such taxes are generally based on income and/or capital gains earned or repatriated. Taxes are accrued and applied to net investment income, net realized gains and net unrealized appreciation/depreciation as such income and/or gains are earned.
In accordance with U.S. GAAP requirements regarding accounting for uncertainties in income taxes, management has analyzed the Portfolio’s tax positions taken or expected to be taken on federal and state income tax returns for all open tax years (the current and the prior three tax years) and has concluded that no provision for income tax is required in the Portfolio’s financial statements.
5. Investment Income and Investment Transactions
Dividend income is recorded on the ex-dividend date or as soon as the Portfolio is informed of the dividend. Interest income is accrued daily. Investment transactions are accounted for on the date the securities are purchased or sold. Investment gains or losses are determined on the identified cost basis. Non-cash dividends, if any, are recorded on the ex-dividend date at the fair value of the securities received. The Portfolio amortizes premiums and accretes discounts as adjustments to interest income. The Portfolio accounts for distributions received from real estate investment trust (“REIT”) investments or from regulated investment companies as dividend income, realized gain, or return of capital based on information provided by the REIT or the investment company.
6. Class Allocations
All income earned and expenses incurred by the Portfolio are borne on a pro-rata basis by each outstanding class of shares, based on the proportionate interest in the Portfolio represented by the net assets of such class, except for class specific expenses which are allocated to the respective class. Expenses of the Fund are charged proportionately to each portfolio or based on other appropriate methods. Realized and unrealized gains and losses are allocated among the various share classes based on respective net assets.
7. Dividends and Distributions
Dividends and distributions to shareholders, if any, are recorded on the ex-dividend date. Income dividends and capital gains distributions are determined in accordance with federal tax regulations and may differ from those determined in accordance with U.S. GAAP. To the extent these differences are permanent, such amounts are reclassified within the capital accounts based on their federal tax basis treatment; temporary differences do not require such reclassification.
8. Cash and Short-Term Investments
Cash and short-term investments include cash on hand and short-term investments with maturities of less than one year when purchased.
9. Segment Information
The Portfolio represents a single operating segment. An operating segment is defined in U.S. GAAP as a component of a public entity that engages in business activities from which it may recognize revenues and incur expenses, has operating
9
| | |
| DISCOVERY VALUE PORTFOLIO | | |
| NOTES TO FINANCIAL STATEMENTS | | |
| |
| (continued) | | AB Variable Products Series Fund |
results that are regularly reviewed by the public entity’s chief operating decision maker (“CODM”) to make decisions about resources to be allocated to the segment and assess its performance, and has discrete financial information available. The Portfolio’s President is the CODM. The CODM monitors the operating results of the Portfolio as a whole and the pre-determined Portfolio’s long term investment strategy, which is executed by the portfolio management group. The qualitative and quantitative information contained within the financial statements is used by the CODM to assess the segments performance versus the Portfolio’s comparative benchmark and to make resource allocation decisions. Segment assets are reflected on the statement of assets and liabilities and segment expenses are listed on the statement of operations.
NOTE B: Advisory Fee and Other Transactions with Affiliates
Under the terms of the investment advisory agreement, the Portfolio pays the Adviser an advisory fee at an annual rate of .75% of the first $2.5 billion, .65% of the next $2.5 billion and .60% in excess of $5 billion, of the Portfolio’s average daily net assets. The fee is accrued daily and paid monthly. The Adviser has agreed to waive its fees and bear certain expenses to the extent necessary to limit total operating expenses on an annual basis (the “Expense Caps”) to 1.20% and 1.45% of daily average net assets for Class A and Class B shares, respectively. For the year ended December 31, 2024, there were no expenses waived by the Adviser.
Pursuant to the investment advisory agreement, the Portfolio may reimburse the Adviser for certain legal and accounting services provided to the Portfolio by the Adviser. For the year ended December 31, 2024, the reimbursement for such services amounted to $94,676.
The Portfolio compensates AllianceBernstein Investor Services, Inc. (“ABIS”), a wholly-owned subsidiary of the Adviser, under a Transfer Agency Agreement for providing personnel and facilities to perform transfer agency services for the Portfolio. Such compensation retained by ABIS amounted to $1,950 for the year ended December 31, 2024.
The Portfolio may invest in AB Government Money Market Portfolio which has a contractual annual advisory fee rate of .20% of the portfolio’s average daily net assets and bears its own expenses. The Adviser had contractually agreed to waive .10% of the advisory fee of AB Government Money Market Portfolio (resulting in a net advisory fee of .10%) until August 31, 2023. Effective September 1, 2023, the Adviser has contractually agreed to waive .05% of the advisory fee of AB Government Money Market Portfolio (resulting in a net advisory fee of .15%) until August 31, 2024. In connection with the investment by the Portfolio in AB Government Money Market Portfolio, the Adviser has contractually agreed to waive its advisory fee from the Portfolio in an amount equal to the Portfolio’s pro rata share of the effective advisory fee of AB Government Money Market Portfolio, as borne indirectly by the Portfolio as an acquired fund fee and expense. For the year ended December 31, 2024, such waiver amounted to $6,728.
A summary of the Portfolio’s transactions in AB mutual funds for the year ended December 31, 2024 is as follows:
| | | | | | | | | | | | | | | | | | | | |
Portfolio | | Market Value
12/31/23
(000) | | | Purchases
at Cost
(000) | | | Sales
Proceeds
(000) | | | Market Value
12/31/24
(000) | | | Dividend
Income
(000) | |
AB Government Money Market Portfolio | | $ | 3,805 | | | $ | 175,495 | | | $ | 175,465 | | | $ | 3,835 | | | $ | 225 | |
AB Government Money Market Portfolio* | | | 832 | | | | 219,797 | | | | 165,716 | | | | 54,913 | | | | –0 | – |
| | | | | | | | | | | | | | | | | | | | |
Total | | | | | | | | | | | | | | $ | 58,748 | | | $ | 225 | |
| | | | | | | | | | | | | | | | | | | | |
| * | | Investments of cash collateral for securities lending transactions (see Note E). |
NOTE C: Distribution Plan
The Portfolio has adopted a Distribution Plan (the “Plan”) for Class B shares pursuant to Rule 12b-1 under the 1940 Act. Under the Plan, the Portfolio pays distribution and servicing fees to AllianceBernstein Investments, Inc. (the “Distributor”), a wholly-owned subsidiary of the Adviser, at an annual rate of up to .50% of the Portfolio’s average daily net assets attributable to Class B shares. The fees are accrued daily and paid monthly. The Board currently limits payments under the Plan to .25% of the Portfolio’s average daily net assets attributable to Class B shares. The Plan provides that the Distributor will use such payments in their entirety for distribution assistance and promotional activities.
The Portfolio is not obligated under the Plan to pay any distribution and servicing fees in excess of the amounts set forth above. The purpose of the payments to the Distributor under the Plan is to compensate the Distributor for its distribution services with respect to the sale of the Portfolio’s Class B shares. Since the Distributor’s compensation is not directly tied to its expenses, the amount of compensation received by it under the Plan during any year may be more or less than its actual
10
| | |
| |
| | | AB Variable Products Series Fund |
expenses. For this reason, the Plan is characterized by the staff of the Securities and Exchange Commission as being of the “compensation” variety.
In the event that the Plan is terminated or not continued, no distribution or servicing fees (other than current amounts accrued but not yet paid) would be owed by the Portfolio to the Distributor.
The Plan also provides that the Adviser may use its own resources to finance the distribution of the Portfolio’s shares.
NOTE D: Investment Transactions
Purchases and sales of investment securities (excluding short-term investments) for the year ended December 31, 2024 were as follows:
| | | | | | | | |
| | | Purchases | | | Sales | |
Investment securities (excluding U.S. government securities) | | $ | 373,490,164 | | | $ | 457,216,902 | |
U.S. government securities | | | –0 | – | | | –0 | – |
The cost of investments for federal income tax purposes, gross unrealized appreciation and unrealized depreciation are as follows:
| | | | |
Cost | | $ | 670,499,679 | |
| | | | |
Gross unrealized appreciation | | $ | 132,542,075 | |
Gross unrealized depreciation | | | (51,299,652 | ) |
| | | | |
Net unrealized appreciation | | $ | 81,242,423 | |
| | | | |
1. Derivative Financial Instruments
The Portfolio may use derivatives in an effort to earn income and enhance returns, to replace more traditional direct investments, to obtain exposure to otherwise inaccessible markets (collectively, “investment purposes”), or to hedge or adjust the risk profile of its portfolio.
The Portfolio did not engage in derivatives transactions for the year ended December 31, 2024.
2. Currency Transactions
The Portfolio may invest in non-U.S. Dollar-denominated securities on a currency hedged or unhedged basis. The Portfolio may seek investment opportunities by taking long or short positions in currencies through the use of currency-related derivatives, including forward currency exchange contracts, futures and options on futures, swaps, and other options. The Portfolio may enter into transactions for investment opportunities when it anticipates that a foreign currency will appreciate or depreciate in value but securities denominated in that currency are not held by the Portfolio and do not present attractive investment opportunities. Such transactions may also be used when the Adviser believes that it may be more efficient than a direct investment in a foreign currency-denominated security. The Portfolio may also conduct currency exchange contracts on a spot basis (i.e., for cash at the spot rate prevailing in the currency exchange market for buying or selling currencies).
NOTE E: Securities Lending
The Portfolio may enter into securities lending transactions. Under the Portfolio’s securities lending program, all loans of securities will be collateralized continually by cash collateral and/or non-cash collateral. Non-cash collateral will include only securities issued or guaranteed by the U.S. government or its agencies or instrumentalities. If the Portfolio cannot sell or repledge any non-cash collateral, such collateral will not be reflected in the portfolio of investments. If a loan is collateralized by cash, the Portfolio will be compensated for the loan from a portion of the net return from the income earned on cash collateral after a rebate is paid to the borrower (in some cases, this rebate may be a “negative rebate” or fee paid by the borrower to the Portfolio in connection with the loan), and payments are made for fees of the securities lending agent and for certain other administrative expenses. If the Portfolio receives non-cash collateral, the Portfolio will receive a fee from the borrower generally equal to a negotiated percentage of the market value of the loaned securities. The Portfolio will have the right to call a loan and obtain the securities loaned at any time on notice to the borrower within the normal and customary settlement time for the securities. While the securities are on loan, the borrower is obligated to pay the Portfolio amounts equal to any dividend income or other distributions from the securities; however, these distributions will not be afforded the same preferential tax treatment as qualified dividends. The Portfolio will not be able to exercise voting rights with respect to any securities during the existence of a loan, but will have the right to regain ownership of loaned securities in order to
11
| | |
| DISCOVERY VALUE PORTFOLIO | | |
| NOTES TO FINANCIAL STATEMENTS | | |
| |
| (continued) | | AB Variable Products Series Fund |
exercise voting or other ownership rights. Collateral received and securities loaned are marked to market daily to ensure that the securities loaned are secured by collateral. The lending agent currently invests the cash collateral received in AB Government Money Market Portfolio, an eligible money market vehicle, in accordance with the investment restrictions of the Portfolio, and as approved by the Board. The collateral received on securities loaned is recorded as an asset as well as a corresponding liability in the statement of assets and liabilities. The collateral will be adjusted the next business day to maintain the required collateral amount. The amounts of securities lending income from the borrowers and AB Government Money Market Portfolio are reflected in the statement of operations. When the Portfolio earns net securities lending income from AB Government Money Market Portfolio, the income is inclusive of a rebate expense paid to the borrower. In connection with the cash collateral investment by the Portfolio in AB Government Money Market Portfolio, the Adviser has agreed to waive a portion of the Portfolio’s share of the advisory fees of AB Government Money Market Portfolio, as borne indirectly by the Portfolio as an acquired fund fee and expense. When the Portfolio lends securities, its investment performance will continue to reflect changes in the value of the securities loaned. A principal risk of lending portfolio securities is that the borrower may fail to return the loaned securities upon termination of the loan and that the collateral will not be sufficient to replace the loaned securities. The lending agent has agreed to indemnify the Portfolio in the case of default of any securities borrower.
A summary of the Portfolio’s transactions surrounding securities lending for the year ended December 31, 2024 is as follows:
| | | | | | | | | | | | | | | | | | | | | | |
| | | | | | | | | | | | | AB Government Money
Market Portfolio | |
Market Value of
Securities
on Loan* | | | Cash Collateral* | | | Market Value of
Non-Cash
Collateral* | | | Income from
Borrowers | | | Income Earned | | | Advisory Fee
Waived | |
| $ | 177,659,464 | | | $ | 54,912,779 | | | $ | 126,176,171 | | | $ | 138,178 | | | $ | –0 | – | | $ | 3,398 | |
| * | | As of December 31, 2024. |
NOTE F: Capital Stock
Each class consists of 500,000,000 authorized shares. Transactions in capital shares for each class were as follows:
| | | | | | | | | | | | | | | | | | | | |
| | | SHARES | | | | | | AMOUNT | |
| | | Year Ended
December 31,
2024 | | | Year Ended
December 31,
2023 | | | | | | Year Ended
December 31,
2024 | | | Year Ended
December 31,
2023 | |
Class A | | | | | | | | | | | | | | | | | | | | |
Shares sold | | | 1,081,016 | | | | 1,485,530 | | | | | | | $ | 19,812,611 | | | $ | 24,512,123 | |
Shares issued in reinvestment of dividends and distributions | | | 910,113 | | | | 1,319,834 | | | | | | | | 15,717,646 | | | | 22,107,220 | |
Shares redeemed | | | (1,830,723 | ) | | | (1,902,203 | ) | | | | | | | (33,273,557 | ) | | | (31,889,060 | ) |
| | | | | | | | | | | | | | | | | | | | |
Net increase | | | 160,406 | | | | 903,161 | | | | | | | $ | 2,256,700 | | | $ | 14,730,283 | |
| | | | | | | | | | | | | | | | | | | | |
Class B | | | | | | | | | | | | | | | | | | | | |
Shares sold | | | 762,271 | | | | 1,449,832 | | | | | | | $ | 13,662,298 | | | $ | 23,808,551 | |
Shares issued on reinvestment of dividends and distributions | | | 1,471,482 | | | | 2,453,553 | | | | | | | | 25,029,921 | | | | 40,508,165 | |
Shares redeemed | | | (4,903,222 | ) | | | (3,914,785 | ) | | | | | | | (88,025,311 | ) | | | (65,585,807 | ) |
| | | | | | | | | | | | | | | | | | | | |
Net decrease | | | (2,669,469 | ) | | | (11,400 | ) | | | | | | $ | (49,333,092 | ) | | $ | (1,269,091 | ) |
| | | | | | | | | | | | | | | | | | | | |
At December 31, 2024, certain shareholders of the Portfolio owned 72% in aggregate of the Portfolio’s outstanding shares. Significant transactions by such shareholders, if any, may impact the Portfolio’s performance.
NOTE G: Risks Involved in Investing in the Portfolio
Market Risk—The value of the Portfolio’s assets will fluctuate as the market or markets in which the Portfolio invests fluctuate. The value of the Portfolio’s investments may decline, sometimes rapidly and unpredictably, simply because of economic changes or other events, including public health crises (including the occurrence of a contagious disease or illness) and regional and global conflicts, that affect large portions of the market. It includes the risk that a particular style of investing may underperform the market generally.
12
| | |
| |
| | | AB Variable Products Series Fund |
Sector Risk—The Portfolio may have more risk than a more diversified portfolio because it may invest to a significant extent in one or more particular market sectors, such as the industrials sector. To the extent it does so, market or economic factors affecting the relevant sector(s) could have a major effect on the value of the Portfolio’s investments.
Capitalization Risk—Investments in small- and mid-capitalization companies may be more volatile than investments in large-capitalization companies. Investments in small- and mid-capitalization companies may have additional risks because these companies have limited product lines, markets or financial resources.
Foreign (Non-U.S.) Risk—Investments in securities of non-U.S. issuers may involve more risk than those of U.S. issuers. These securities may fluctuate more widely in price and may be more difficult to trade due to adverse market, economic, political, regulatory or other factors.
Currency Risk—Fluctuations in currency exchange rates may negatively affect the value of the Portfolio’s investments or reduce its returns.
Derivatives Risk—Derivatives may be difficult to price or unwind and leveraged so that small changes may produce disproportionate losses for the Portfolio. A short position in a derivative instrument involves the risk of a theoretically unlimited increase in the value of the underlying asset, reference rate or index, which could cause the Portfolio to suffer a potentially unlimited loss. Derivatives, especially over-the-counter derivatives, are also subject to counterparty risk, which is the risk that the counterparty (the party on the other side of the transaction) on a derivative transaction will be unable or unwilling to honor its contractual obligations to the Portfolio.
Indemnification Risk—In the ordinary course of business, the Portfolio enters into contracts that contain a variety of indemnifications. The Portfolio’s maximum exposure under these arrangements is unknown. However, the Portfolio has not had prior claims or losses pursuant to these indemnification provisions and expects the risk of loss thereunder to be remote. Therefore, the Portfolio has not accrued any liability in connection with these indemnification provisions.
Management Risk—The Portfolio is subject to management risk because it is an actively-managed investment fund. The Adviser will apply its investment techniques and risk analyses in making investment decisions for the Portfolio, but there is no guarantee that its techniques will produce the intended results. Some of these techniques may incorporate, or rely upon, quantitative models, but there is no guarantee that these models will generate accurate forecasts, reduce risk or otherwise perform as expected.
NOTE H: Joint Credit Facility
A number of open-end mutual funds managed by the Adviser, including the Portfolio, participate in a $325 million revolving credit facility (the “Facility”) intended to provide short-term financing related to redemptions and other short term liquidity requirements, subject to certain restrictions. Commitment fees related to the Facility are paid by the participating funds and are included in miscellaneous expenses in the statement of operations. The Portfolio did not utilize the Facility during the year ended December 31, 2024.
NOTE I: Distributions to Shareholders
The tax character of distributions paid during the fiscal years ended December 31, 2024 and December 31, 2023 were as follows:
| | | | | | | | |
| | | 2024 | | | 2023 | |
Distributions paid from: | | | | | | | | |
Ordinary income | | $ | 10,009,617 | | | $ | 9,916,054 | |
Net long-term capital gains | | | 30,737,950 | | | | 52,699,331 | |
| | | | | | | | |
Total taxable distributions paid | | $ | 40,747,567 | | | $ | 62,615,385 | |
| | | | | | | | |
As of December 31, 2024, the components of accumulated earnings (deficit) on a tax basis were as follows:
| | | | |
Undistributed ordinary income | | $ | 17,767,166 | |
Undistributed capital gains | | | 62,876,928 | |
Unrealized appreciation (depreciation) | | | 81,242,424 | (a) |
| | | | |
Total accumulated earnings (deficit) | | $ | 161,886,518 | |
| | | | |
| (a) | | The difference between book-basis and tax-basis unrealized appreciation (depreciation) is attributable primarily to the tax deferral of losses on wash sales. |
13
| | |
| DISCOVERY VALUE PORTFOLIO | | |
| NOTES TO FINANCIAL STATEMENTS | | |
| |
| (continued) | | AB Variable Products Series Fund |
For tax purposes, net realized capital losses may be carried over to offset future capital gains, if any. Funds are permitted to carry forward capital losses for an indefinite period, and such losses will retain their character as either short-term or long-term capital losses. As of December 31, 2024, the Portfolio did not have any capital loss carryforwards.
During the current fiscal year, there were no permanent differences that resulted in adjustments to undistributed net investment income, accumulated net realized loss on investment and foreign currency transactions, or additional paid-in capital.
NOTE J: Subsequent Events
Management has evaluated subsequent events for possible recognition or disclosure in the financial statements through the date the financial statements are issued. Management has determined that there are no material events that would require disclosure in the Portfolio’s financial statements through this date.
14
| | |
| | |
| DISCOVERY VALUE PORTFOLIO | | |
| |
| FINANCIAL HIGHLIGHTS | | AB Variable Products Series Fund |
Selected Data For A Share Of Capital Stock Outstanding Throughout Each Period
| | | | | | | | | | | | | | | | | | | | |
| | | CLASS A | |
| | | Year Ended December 31, | |
| | 2024 | | | 2023 | | | 2022 | | | 2021 | | | 2020 | |
Net asset value, beginning of period | | | $17.71 | | | | $16.62 | | | | $23.46 | | | | $17.39 | | | | $17.91 | |
| | | | | | | | | | | | | | | | | | | | |
| | | | | | | | | | | | | | | | | | | | |
Income From Investment Operations | | | | | | | | | | | | | | | | | | | | |
Net investment income(a)(b) | | | .16 | | | | .15 | | | | .19 | | | | .21 | | | | .17 | |
Net realized and unrealized gain (loss) on investment transactions and foreign currency transactions | | | 1.54 | | | | 2.61 | | | | (3.74 | ) | | | 6.03 | | | | .20 | |
| | | | | | | | | | | | | | | | | | | | |
Net increase (decrease) in net asset value from operations | | | 1.70 | | | | 2.76 | | | | (3.55 | ) | | | 6.24 | | | | .37 | |
| | | | | | | | | | | | | | | | | | | | |
| | | | | | | | | | | | | | | | | | | | |
Less: Dividends and Distributions | | | | | | | | | | | | | | | | | | | | |
Dividends from net investment income | | | (.16 | ) | | | (.19 | ) | | | (.22 | ) | | | (.17 | ) | | | (.16 | ) |
Distributions from net realized gain on investment transactions | | | (.93 | ) | | | (1.48 | ) | | | (3.07 | ) | | | –0 | – | | | (.73 | ) |
| | | | | | | | | | | | | | | | | | | | |
Total dividends and distributions | | | (1.09 | ) | | | (1.67 | ) | | | (3.29 | ) | | | (.17 | ) | | | (.89 | ) |
| | | | | | | | | | | | | | | | | | | | |
Net asset value, end of period | | | $18.32 | | | | $17.71 | | | | $16.62 | | | | $23.46 | | | | $17.39 | |
| | | | | | | | | | | | | | | | | | | | |
| | | | | | | | | | | | | | | | | | | | |
Total Return | | | | | | | | | | | | | | | | | | | | |
Total investment return based on net asset value(c) | | | 10.02 | % | | | 17.18 | % | | | (15.63 | )% | | | 35.95 | % | | | 3.37 | % |
| | | | | | | | | | | | | | | | | | | | |
Ratios/Supplemental Data | | | | | | | | | | | | | | | | | | | | |
Net assets, end of period (000’s omitted) | | | $271,351 | | | | $259,538 | | | | $228,586 | | | | $286,390 | | | | $222,441 | |
Ratio to average net assets of: | | | | | | | | | | | | | | | | | | | | |
Expenses, net of waivers/reimbursements | | | .81 | % | | | .81 | % | | | .80 | % | | | .80 | % | | | .83 | % |
Expenses, before waivers/reimbursements | | | .81 | % | | | .81 | % | | | .80 | % | | | .80 | % | | | .83 | % |
Net investment income(b) | | | .86 | % | | | .91 | % | | | 1.00 | % | | | .98 | % | | | 1.17 | % |
Portfolio turnover rate | | | 53 | % | | | 49 | % | | | 42 | % | | | 54 | % | | | 58 | % |
See footnote summary on page 16.
15
| | |
| DISCOVERY VALUE PORTFOLIO | | |
| FINANCIAL HIGHLIGHTS | | |
| |
| (continued) | | AB Variable Products Series Fund |
Selected Data For A Share Of Capital Stock Outstanding Throughout Each Period
| | | | | | | | | | | | | | | | | | | | |
| | | CLASS B | |
| | | Year Ended December 31, | |
| | 2024 | | | 2023 | | | 2022 | | | 2021 | | | 2020 | |
Net asset value, beginning of period | | | $17.44 | | | | $16.39 | | | | $23.17 | | | | $17.19 | | | | $17.72 | |
| | | | | | | | | | | | | | | | | | | | |
| | | | | | | | | | | | | | | | | | | | |
Income From Investment Operations | | | | | | | | | | | | | | | | | | | | |
Net investment income(a)(b) | | | .11 | | | | .11 | | | | .14 | | | | .16 | | | | .13 | |
Net realized and unrealized gain (loss) on investment transactions and foreign currency transactions | | | 1.52 | | | | 2.56 | | | | (3.68 | ) | | | 5.95 | | | | .18 | |
| | | | | | | | | | | | | | | | | | | | |
Net increase (decrease) in net asset value from operations | | | 1.63 | | | | 2.67 | | | | (3.54 | ) | | | 6.11 | | | | .31 | |
| | | | | | | | | | | | | | | | | | | | |
| | | | | | | | | | | | | | | | | | | | |
Less: Dividends and Distributions | | | | | | | | | | | | | | | | | | | | |
Dividends from net investment income | | | (.12 | ) | | | (.14 | ) | | | (.17 | ) | | | (.13 | ) | | | (.11 | ) |
Distributions from net realized gain on investment transactions | | | (.93 | ) | | | (1.48 | ) | | | (3.07 | ) | | | –0 | – | | | (.73 | ) |
| | | | | | | | | | | | | | | | | | | | |
Total dividends and distributions | | | (1.05 | ) | | | (1.62 | ) | | | (3.24 | ) | | | (.13 | ) | | | (.84 | ) |
| | | | | | | | | | | | | | | | | | | | |
Net asset value, end of period | | | $18.02 | | | | $17.44 | | | | $16.39 | | | | $23.17 | | | | $17.19 | |
| | | | | | | | | | | | | | | | | | | | |
| | | | | | | | | | | | | | | | | | | | |
Total Return | | | | | | | | | | | | | | | | | | | | |
Total investment return based on net asset value(c) | | | 9.72 | % | | | 16.86 | % | | | (15.82 | )% | | | 35.60 | % | | | 3.05 | % |
| | | | | | | | | | | | | | | | | | | | |
Ratios/Supplemental Data | | | | | | | | | | | | | | | | | | | | |
Net assets, end of period (000’s omitted) | | | $425,678 | | | | $458,537 | | | | $431,086 | | | | $563,741 | | | | $432,719 | |
Ratio to average net assets of: | | | | | | | | | | | | | | | | | | | | |
Expenses, net of waivers/reimbursements | | | 1.06 | % | | | 1.06 | % | | | 1.05 | % | | | 1.05 | % | | | 1.08 | % |
Expenses, before waivers/reimbursements | | | 1.06 | % | | | 1.06 | % | | | 1.05 | % | | | 1.05 | % | | | 1.08 | % |
Net investment income(b) | | | .61 | % | | | .65 | % | | | .74 | % | | | .73 | % | | | .91 | % |
Portfolio turnover rate. | | | 53 | % | | | 49 | % | | | 42 | % | | | 54 | % | | | 58 | % |
| (a) | | Based on average shares outstanding. |
| (b) | | Net of expenses waived/reimbursed by the Adviser. |
| (c) | | Total investment return is calculated assuming an initial investment made at the net asset value at the beginning of the period, reinvestment of all dividends and distributions at net asset value during the period, and redemption on the last day of the period. Total investment return does not reflect (i) insurance company’s separate account related expense charges and (ii) the deductions of taxes that a shareholder would pay on Portfolio distributions or the redemption of Portfolio shares. Total investment return calculated for a period of less than one year is not annualized. |
See notes to financial statements.
16
| | |
| | |
| REPORT OF INDEPENDENT REGISTERED | | |
| |
| PUBLIC ACCOUNTING FIRM | | AB Variable Products Series Fund |
To the Board of Directors and Shareholders of AB Discovery Value Portfolio
Opinion on the Financial Statements
We have audited the accompanying statement of assets and liabilities of AB Discovery Value Portfolio (the “Portfolio”) (one of the series constituting AB Variable Products Series Fund, Inc. (the “Fund”)), including the portfolio of investments, as of December 31, 2024, and the related statement of operations for the year then ended, the statements of changes in net assets for each of the two years in the period then ended, the financial highlights for each of the five years in the period then ended and the related notes (collectively referred to as the “financial statements”). In our opinion, the financial statements present fairly, in all material respects, the financial position of the Portfolio (one of the series constituting AB Variable Products Series Fund, Inc.) at December 31, 2024, the results of its operations for the year then ended, the changes in its net assets for each of the two years in the period then ended and its financial highlights for each of the five years in the period then ended, in conformity with U.S. generally accepted accounting principles.
Basis for Opinion
These financial statements are the responsibility of the Fund’s management. Our responsibility is to express an opinion on the Portfolio’s financial statements based on our audits. We are a public accounting firm registered with the Public Company Accounting Oversight Board (United States) (“PCAOB”) and are required to be independent with respect to the Fund in accordance with the U.S. federal securities laws and the applicable rules and regulations of the Securities and Exchange Commission and the PCAOB.
We conducted our audits in accordance with the standards of the PCAOB. Those standards require that we plan and perform the audit to obtain reasonable assurance about whether the financial statements are free of material misstatement, whether due to error or fraud. The Fund is not required to have, nor were we engaged to perform, an audit of the Fund’s internal control over financial reporting. As part of our audits, we are required to obtain an understanding of internal control over financial reporting but not for the purpose of expressing an opinion on the effectiveness of the Fund’s internal control over financial reporting. Accordingly, we express no such opinion.
Our audits included performing procedures to assess the risks of material misstatement of the financial statements, whether due to error or fraud, and performing procedures that respond to those risks. Such procedures included examining, on a test basis, evidence regarding the amounts and disclosures in the financial statements. Our procedures included confirmation of securities owned as of December 31, 2024, by correspondence with the custodian, brokers and others; when replies were not received from brokers or others, we performed other auditing procedures. Our audits also included evaluating the accounting principles used and significant estimates made by management, as well as evaluating the overall presentation of the financial statements. We believe that our audits provide a reasonable basis for our opinion.

We have served as the auditor of one or more of the AB investment companies since 1968.
New York, New York
February 14, 2025
17
| | |
| | |
| | |
| |
| 2024 TAX INFORMATION (unaudited) | | AB Variable Products Series Fund |
For Federal income tax purposes, the following information is furnished with respect to the distributions paid by the Portfolio during the taxable year ended December 31, 2024. For corporate shareholders, 83.18% of dividends paid qualify for the dividends received deduction. The Portfolio designates $30,737,950 of dividends paid as long-term capital gain dividends.
18
| | |
| | |
| DISCOVERY VALUE PORTFOLIO | | |
| |
| CONTINUANCE DISCLOSURE | | AB Variable Products Series Fund |
INFORMATION REGARDING THE REVIEW AND APPROVAL OF THE FUND’S ADVISORY AGREEMENT
The disinterested directors (the “directors”) of AB Variable Products Series Fund, Inc. (the “Company”) unanimously approved the continuance of the Company’s Advisory Agreement with the Adviser in respect of AB Discovery Value Portfolio (formerly AB Small/Mid Cap Value Portfolio) (the “Fund”) at a meeting held by video conference on May 7-9, 2024 (the “Meeting”).
Prior to approval of the continuance of the Advisory Agreement, the directors had requested from the Adviser, and received and evaluated, extensive materials. They reviewed the proposed continuance of the Advisory Agreement with the Adviser and with experienced counsel who are independent of the Adviser, who advised on the relevant legal standards. The directors also reviewed additional materials, including comparative analytical data prepared by the Senior Vice President of the Fund. The directors also discussed the proposed continuance in private sessions with counsel.
The directors considered their knowledge of the nature and quality of the services provided by the Adviser to the Fund gained from their experience as directors or trustees of most of the registered investment companies advised by the Adviser, their overall confidence in the Adviser’s integrity and competence they have gained from that experience, the Adviser’s initiative in identifying and raising potential issues with the directors and its responsiveness, frankness and attention to concerns raised by the directors in the past, including the Adviser’s willingness to consider and implement organizational and operational changes designed to improve investment results and the services provided to the AB Funds. The directors noted that they have four regular meetings each year, at each of which they review extensive materials and information from the Adviser, including information on the investment performance of the Fund.
The directors also considered all factors they believed relevant, including the specific matters discussed below. During the course of their deliberations, the directors evaluated, among other things, the reasonableness of the advisory fee. The directors did not identify any particular information that was all-important or controlling, and different directors may have attributed different weights to the various factors. The directors determined that the selection of the Adviser to manage the Fund and the overall arrangements between the Fund and the Adviser, as provided in the Advisory Agreement, including the advisory fee, were fair and reasonable in light of the services performed, expenses incurred and such other matters as the directors considered relevant in the exercise of their business judgment. The material factors and conclusions that formed the basis for the directors’ determinations included the following:
Nature, Extent and Quality of Services Provided
The directors considered the scope and quality of services provided by the Adviser under the Advisory Agreement, including the quality of the investment research capabilities of the Adviser and the other resources it has dedicated to performing services for the Fund. The directors noted that the Adviser from time to time reviews the Fund’s investment strategies and from time to time proposes changes intended to improve the Fund’s relative or absolute performance for the directors’ consideration. They also noted the professional experience and qualifications of the Fund’s portfolio management team and other senior personnel of the Adviser. The directors also considered that the Advisory Agreement provides that the Fund will reimburse the Adviser for the cost to it of providing certain clerical, accounting, administrative and other services to the Fund by employees of the Adviser or its affiliates. Requests for these reimbursements are made on a quarterly basis and subject to approval by the directors. Reimbursements, to the extent requested and paid, result in a higher rate of total compensation from the Fund to the Adviser than the fee rate stated in the Advisory Agreement. The directors noted that the methodology used to determine the reimbursement amounts had been reviewed by an independent consultant at the request of the directors. The quality of administrative and other services, including the Adviser’s role in coordinating the activities of the Fund’s other service providers, also was considered. The directors concluded that, overall, they were satisfied with the nature, extent and quality of services provided to the Fund under the Advisory Agreement.
Costs of Services Provided and Profitability
The directors reviewed a schedule of the revenues and expenses and related notes indicating the profitability of the Fund to the Adviser for calendar years 2022 and 2023 that had been prepared with an expense allocation methodology arrived at in consultation with an independent consultant at the request of the directors. The directors noted the assumptions and methods of allocation used by the Adviser in preparing fund-specific profitability data and understood that there are a number of potentially acceptable allocation methodologies for information of this type. The directors noted that the profitability information reflected all revenues and expenses of the Adviser’s relationship with the Fund, including those relating to its subsidiaries that provide transfer agency, distribution and brokerage services to the Fund. The directors recognized that it is difficult to make comparisons of the profitability of the Advisory Agreement with the profitability of fund advisory contracts
19
| | |
| DISCOVERY VALUE PORTFOLIO | | |
| CONTINUANCE DISCLOSURE | | |
| |
| (continued) | | AB Variable Products Series Fund |
for unaffiliated funds because comparative information is not generally publicly available and is affected by numerous factors. The directors focused on the profitability of the Adviser’s relationship with the Fund before taxes and distribution expenses. The directors concluded that the Adviser’s level of profitability from its relationship with the Fund was not unreasonable.
Fall-Out Benefits
The directors considered the other benefits to the Adviser and its affiliates from their relationships with the Fund, including, but not limited to, benefits relating to soft dollar arrangements (whereby investment advisers receive brokerage and research services from brokers that execute agency transactions for their clients); 12b-1 fees and sales charges received by the Fund’s principal underwriter (which is a wholly owned subsidiary of the Adviser) in respect of the Fund’s Class B shares; brokerage commissions paid by the Fund to brokers affiliated with the Adviser; and transfer agency fees paid by the Fund to a wholly owned subsidiary of the Adviser. The directors recognized that the Adviser’s profitability would be somewhat lower without these benefits. The directors understood that the Adviser also might derive reputational and other benefits from its association with the Fund.
Investment Results
In addition to the information reviewed by the directors in connection with the Meeting, the directors receive detailed performance information for the Fund at each regular Board meeting during the year.
At the Meeting, the directors reviewed performance information prepared by an independent service provider (the “15(c) service provider”), showing the performance of the Class A Shares of the Fund against a group of similar funds (“peer group”) and a larger group of similar funds (“peer universe”), each selected by the 15(c) service provider, and information prepared by the Adviser showing performance of the Class A Shares against a broad-based securities market index, in each case for the 1-, 3-, 5- and 10-year periods ended February 29, 2024 and (in the case of comparisons with the broad-based securities market index) for the period from inception. Based on their review, the directors concluded that the Fund’s investment performance was acceptable.
Advisory Fees and Other Expenses
The directors considered the advisory fee rate payable by the Fund to the Adviser and information prepared by the 15(c) service provider concerning advisory fee rates payable by other funds in the same category as the Fund. The directors recognized that it is difficult to make comparisons of advisory fees because there are variations in the services that are included in the fees paid by other funds. The directors compared the Fund’s contractual effective advisory fee rate with a peer group median and noted that it was lower than the median. They also noted that the Adviser’s total rate of compensation, taking into account the impact of the administrative expense reimbursement paid to the Adviser in the latest fiscal year, was lower than the median.
The directors also considered the Adviser’s fee schedule for other clients utilizing investment strategies similar to those of the Fund. For this purpose, they reviewed the relevant advisory fee information from the Adviser’s Form ADV and in a report from the Fund’s Senior Vice President and noted the differences between the Fund’s fee schedule, on the one hand, and the Adviser’s institutional fee schedule and the schedule of fees charged by the Adviser to any offshore funds and for services to any sub-advised funds utilizing investment strategies similar to those of the Fund, on the other. The directors noted that the Adviser may, in some cases, agree to fee rates with large institutional clients that are lower than those reviewed by the directors and that they had previously discussed with the Adviser its policies in respect of such arrangements. The directors also compared the advisory fee rate for the Fund with that for another fund advised by the Adviser utilizing similar investment strategies.
The Adviser reviewed with the directors the significantly greater scope of the services it provides to the Fund relative to institutional, offshore fund and sub-advised fund clients. In this regard, the Adviser noted, among other things, that, compared to institutional and offshore or sub-advisory accounts, the Fund (i) demands considerably more portfolio management, research and trading resources due to significantly higher daily cash flows; (ii) has more tax and regulatory restrictions and compliance obligations; (iii) must prepare and file or distribute regulatory and other communications about fund operations; and (iv) must provide shareholder servicing to retail investors. The Adviser also reviewed the greater legal risks presented by the large and changing population of Fund shareholders who may assert claims against the Adviser in individual or class actions, and the greater entrepreneurial risk in offering new fund products, which require substantial investment to launch, may not succeed, and generally must be priced to compete with larger, more established funds resulting in lack of
20
| | |
| |
| | | AB Variable Products Series Fund |
profitability to the Adviser until a new fund achieves scale. In light of the substantial differences in services rendered by the Adviser to institutional, offshore fund and sub-advised fund clients as compared to the Fund, and the different risk profile, the directors considered these fee comparisons inapt and did not place significant weight on them in their deliberations.
In connection with their review of the Fund’s advisory fee, the directors also considered the total expense ratio of the Class A shares of the Fund in comparison to the medians for a peer group and a peer universe selected by the 15(c) service provider. The Class A expense ratio of the Fund was based on the Fund’s latest fiscal year. The Adviser had agreed to cap the Fund’s expenses, but the directors noted that the Fund’s expense ratio was currently below the level of the Adviser’s cap. The directors noted that it was likely that the expense ratios of some of the other funds in the Fund’s category were lowered by waivers or reimbursements by those funds’ investment advisers, which in some cases might be voluntary or temporary. The directors view expense ratio information as relevant to their evaluation of the Adviser’s services because the Adviser is responsible for coordinating services provided to the Fund by others. The directors noted that the Fund’s expense ratio was equal to the median of a peer group and lower than the median of a peer universe. Based on their review, the directors concluded that the Fund’s expense ratio was acceptable.
Economies of Scale
The directors noted that the advisory fee schedule for the Fund contains breakpoints that reduce the fee rates on assets above specified levels. The directors took into consideration prior presentations by an independent consultant on economies of scale in the mutual fund industry and for the AB Funds, and presentations from time to time by the Adviser concerning certain of its views on economies of scale. The directors also had requested and received from the Adviser certain updates on economies of scale in advance of the Meeting. The directors believe that economies of scale may be realized (if at all) by the Adviser across a variety of products and services, and not only in respect of a single fund. The directors noted that there is no established methodology for setting breakpoints that give effect to the fund-specific services provided by a fund’s adviser and to the economies of scale that an adviser may realize in its overall mutual fund business or those components of it which directly or indirectly affect a fund’s operations. The directors observed that in the mutual fund industry as a whole, as well as among funds similar to the Fund, there is no uniformity or pattern in the fees and asset levels at which breakpoints (if any) apply. The directors also noted that the advisory agreements for many funds do not have breakpoints at all. Having taken these factors into account, the directors concluded that the Fund’s shareholders would benefit from a sharing of economies of scale in the event the Fund’s net assets exceed a breakpoint in the future.
21
VPS-DV-0151-1224
DEC 12.31.24

ANNUAL FINANCIAL STATEMENTS AND ADDITIONAL INFORMATION
AB VARIABLE PRODUCTS
SERIES FUND, INC.
| + | | AB GLOBAL RISK ALLOCATION—MODERATE PORTFOLIO |
Investment Products Offered
| | • | | Are Not Bank Guaranteed |
AllianceBernstein Investments, Inc. (ABI) is the distributor of the AB family of mutual funds. ABI is a member of FINRA and is an affiliate of AllianceBernstein L.P., the Adviser of the funds.
You may obtain a description of the Fund’s proxy voting policies and procedures, and information regarding how the Fund voted proxies relating to portfolio securities during the most recent 12-month period ended June 30, without charge. Simply visit AB’s website at www.abfunds.com or go to the Securities and Exchange Commission’s (the “Commission”) website at www.sec.gov, or call AB at (800) 227 4618.
The Fund files its complete schedule of portfolio holdings with the Commission for the first and third quarters of each fiscal year as an exhibit to its reports on Form N-PORT. The Fund’s Form N-PORT reports are available on the Commission’s website at www.sec.gov.
The [A/B] logo and AllianceBernstein® are registered trademarks used by permission of the owner, AllianceBernstein L.P.
| | |
| GLOBAL RISK ALLOCATION—MODERATE PORTFOLIO |
| PORTFOLIO OF INVESTMENTS | | |
| |
| December 31, 2024 | | AB Variable Products Series Fund |
| | | | | | | | |
| Company | | Shares | | |
U.S. $ Value | |
| | | | | | | | |
COMMON STOCKS–63.9% | | | | | | | | |
| | | | | | | | |
INFORMATION TECHNOLOGY–17.2% | | | | | | | | |
COMMUNICATIONS
EQUIPMENT–0.5% | | | | | | | | |
Arista Networks, Inc.(a) | | | 7,257 | | | $ | 802,116 | |
Cisco Systems, Inc. | | | 28,002 | | | | 1,657,718 | |
F5, Inc.(a) | | | 408 | | | | 102,600 | |
Juniper Networks, Inc. | | | 2,326 | | | | 87,109 | |
Motorola Solutions, Inc. | | | 1,174 | | | | 542,658 | |
Nokia Oyj | | | 35,738 | | | | 158,084 | |
Telefonaktiebolaget LM Ericsson–Class B | | | 18,616 | | | | 150,761 | |
| | | | | | | | |
| | | | | | | 3,501,046 | |
| | | | | | | | |
ELECTRONIC EQUIPMENT, INSTRUMENTS & COMPONENTS–0.5% | | | | | | | | |
Amphenol Corp.–Class A | | | 8,470 | | | | 588,241 | |
CDW Corp./DE | | | 936 | | | | 162,901 | |
Corning, Inc. | | | 5,414 | | | | 257,273 | |
Halma PLC | | | 2,544 | | | | 85,348 | |
Hexagon AB–Class B | | | 13,913 | | | | 132,833 | |
Jabil, Inc. | | | 793 | | | | 114,113 | |
Keyence Corp. | | | 1,302 | | | | 529,226 | |
Keysight Technologies, Inc.(a) | | | 1,219 | | | | 195,808 | |
Kyocera Corp. | | | 8,595 | | | | 85,191 | |
Murata Manufacturing Co., Ltd. | | | 11,327 | | | | 179,701 | |
Omron Corp. | | | 1,173 | | | | 39,496 | |
Shimadzu Corp. | | | 1,585 | | | | 44,362 | |
TDK Corp. | | | 13,010 | | | | 167,550 | |
TE Connectivity PLC | | | 2,102 | | | | 300,523 | |
Teledyne Technologies, Inc.(a) | | | 327 | | | | 151,771 | |
Trimble, Inc.(a) | | | 1,716 | | | | 121,253 | |
Yaskawa Electric Corp. | | | 1,506 | | | | 38,433 | |
Yokogawa Electric Corp. | | | 1,528 | | | | 32,500 | |
Zebra Technologies Corp.–Class A(a) | | | 362 | | | | 139,812 | |
| | | | | | | | |
| | | | | | | 3,366,335 | |
| | | | | | | | |
IT SERVICES–0.7% | | | | | | | | |
Accenture PLC–Class A | | | 4,390 | | | | 1,544,358 | |
Akamai Technologies, Inc.(a) | | | 1,055 | | | | 100,911 | |
Bechtle AG | | | 549 | | | | 17,607 | |
Capgemini SE | | | 1,041 | | | | 170,024 | |
Cognizant Technology Solutions Corp.–Class A | | | 3,483 | | | | 267,843 | |
EPAM Systems, Inc.(a) | | | 398 | | | | 93,060 | |
Fujitsu Ltd. | | | 11,092 | | | | 194,848 | |
Gartner, Inc.(a) | | | 542 | | | | 262,583 | |
GoDaddy, Inc.–Class A(a) | | | 986 | | | | 194,607 | |
| | | | | | | | |
International Business Machines Corp. | | | 6,496 | | | | 1,428,016 | |
NEC Corp. | | | 1,643 | | | | 140,603 | |
Nomura Research Institute Ltd. | | | 2,529 | | | | 74,255 | |
NTT Data Group Corp. | | | 4,225 | | | | 80,338 | |
Obic Co., Ltd. | | | 2,165 | | | | 64,427 | |
Otsuka Corp. | | | 1,526 | | | | 34,899 | |
SCSK Corp. | | | 1,046 | | | | 21,893 | |
TIS, Inc. | | | 1,423 | | | | 33,611 | |
VeriSign, Inc.(a) | | | 581 | | | | 120,244 | |
Wix.com Ltd.(a) | | | 354 | | | | 75,951 | |
| | | | | | | | |
| | | | | | | 4,920,078 | |
| | | | | | | | |
SEMICONDUCTORS & SEMICONDUCTOR EQUIPMENT–6.1% | | | | | | | | |
Advanced Micro Devices, Inc.(a) | | | 11,400 | | | | 1,377,006 | |
Advantest Corp. | | | 5,128 | | | | 291,572 | |
Analog Devices, Inc. | | | 3,488 | | | | 741,061 | |
Applied Materials, Inc. | | | 5,792 | | | | 941,953 | |
ASM International NV | | | 315 | | | | 182,128 | |
ASML Holding NV | | | 2,678 | | | | 1,875,763 | |
BE Semiconductor Industries NV(b) | | | 517 | | | | 70,864 | |
Broadcom, Inc. | | | 32,722 | | | | 7,586,269 | |
Disco Corp. | | | 616 | | | | 163,411 | |
Enphase Energy, Inc.(a) | | | 949 | | | | 65,177 | |
First Solar, Inc.(a) | | | 752 | | | | 132,532 | |
Infineon Technologies AG | | | 8,752 | | | | 285,680 | |
Intel Corp. | | | 30,299 | | | | 607,495 | |
KLA Corp. | | | 940 | | | | 592,313 | |
Kokusai Electric Corp.(b) | | | 1,045 | | | | 13,694 | |
Lam Research Corp. | | | 9,039 | | | | 652,887 | |
Lasertec Corp.(b) | | | 536 | | | | 50,247 | |
Microchip Technology, Inc. | | | 3,773 | | | | 216,382 | |
Micron Technology, Inc. | | | 7,789 | | | | 655,522 | |
Monolithic Power Systems, Inc. | | | 343 | | | | 202,953 | |
NVIDIA Corp. | | | 172,324 | | | | 23,141,390 | |
NXP Semiconductors NV | | | 1,785 | | | | 371,012 | |
ON Semiconductor Corp.(a) | | | 2,991 | | | | 188,583 | |
QUALCOMM, Inc. | | | 7,805 | | | | 1,199,004 | |
Renesas Electronics Corp.(a) | | | 11,270 | | | | 142,622 | |
SCREEN Holdings Co., Ltd. | | | 544 | | | | 32,116 | |
Skyworks Solutions, Inc. | | | 1,122 | | | | 99,499 | |
STMicroelectronics NV | | | 4,580 | | | | 114,715 | |
Teradyne, Inc. | | | 1,144 | | | | 144,052 | |
Texas Instruments, Inc. | | | 6,408 | | | | 1,201,564 | |
Tokyo Electron Ltd. | | | 2,999 | | | | 450,808 | |
| | | | | | | | |
| | | | | | | 43,790,274 | |
| | | | | | | | |
1
| | |
| GLOBAL RISK ALLOCATION—MODERATE PORTFOLIO |
| PORTFOLIO OF INVESTMENTS | | |
| |
| (continued) | | AB Variable Products Series Fund |
| | | | | | | | |
| Company | | Shares | | |
U.S. $ Value | |
| | | | | | | | |
SOFTWARE–5.5% | |
Adobe, Inc.(a) | | | 3,092 | | | $ | 1,374,951 | |
ANSYS, Inc.(a) | | | 614 | | | | 207,121 | |
Autodesk, Inc.(a) | | | 1,510 | | | | 446,311 | |
Cadence Design Systems, Inc.(a) | | | 1,927 | | | | 578,986 | |
Check Point Software Technologies Ltd.(a) | | | 590 | | | | 110,153 | |
Crowdstrike Holdings, Inc.–Class A(a) | | | 1,635 | | | | 559,432 | |
CyberArk Software Ltd.(a) | | | 289 | | | | 96,280 | |
Dassault Systemes SE | | | 4,485 | | | | 155,198 | |
Fair Isaac Corp.(a) | | | 171 | | | | 340,449 | |
Fortinet, Inc.(a) | | | 4,469 | | | | 422,231 | |
Gen Digital, Inc. | | | 3,810 | | | | 104,318 | |
Intuit, Inc. | | | 1,969 | | | | 1,237,516 | |
Microsoft Corp. | | | 52,230 | | | | 22,014,945 | |
Monday.com Ltd.(a) | | | 251 | | | | 59,095 | |
Nemetschek SE | | | 387 | | | | 37,594 | |
Nice Ltd.(a) | | | 421 | | | | 71,496 | |
Oracle Corp. | | | 11,291 | | | | 1,881,532 | |
Oracle Corp. Japan | | | 257 | | | | 24,597 | |
Palantir Technologies, Inc.–Class A(a) | | | 14,400 | | | | 1,089,072 | |
Palo Alto Networks, Inc.(a) | | | 4,598 | | | | 836,652 | |
PTC, Inc.(a) | | | 844 | | | | 155,186 | |
Roper Technologies, Inc. | | | 753 | | | | 391,447 | |
Sage Group PLC (The) | | | 6,733 | | | | 106,977 | |
Salesforce, Inc. | | | 6,716 | | | | 2,245,360 | |
SAP SE | | | 6,998 | | | | 1,721,327 | |
ServiceNow, Inc.(a) | | | 1,447 | | | | 1,533,994 | |
Synopsys, Inc.(a) | | | 1,079 | | | | 523,703 | |
Temenos AG (REG) | | | 378 | | | | 26,710 | |
Trend Micro, Inc./Japan | | | 848 | | | | 45,718 | |
Tyler Technologies, Inc.(a) | | | 301 | | | | 173,569 | |
WiseTech Global Ltd. | | | 1,233 | | | | 92,047 | |
Workday, Inc.–Class A(a) | | | 1,496 | | | | 386,013 | |
Xero Ltd.(a) | | | 972 | | | | 101,149 | |
| | | | | | | | |
| | | | | | | 39,151,129 | |
| | | | | | | | |
TECHNOLOGY HARDWARE, STORAGE & PERIPHERALS–3.9% | | | | | | | | |
Apple, Inc. | | | 106,190 | | | | 26,592,100 | |
Brother Industries Ltd. | | | 1,552 | | | | 26,254 | |
Canon, Inc. | | | 6,250 | | | | 203,010 | |
Dell Technologies, Inc.–Class C | | | 2,158 | | | | 248,688 | |
FUJIFILM Holdings Corp. | | | 7,494 | | | | 155,048 | |
Hewlett Packard Enterprise Co. | | | 9,180 | | | | 195,993 | |
HP, Inc. | | | 6,770 | | | | 220,905 | |
Logitech International SA (REG) | | | 1,019 | | | | 84,115 | |
| | | | | | | | |
NetApp, Inc. | | | 1,439 | | | | 167,039 | |
Ricoh Co., Ltd. | | | 3,572 | | | | 40,566 | |
Seagate Technology Holdings PLC | | | 1,486 | | | | 128,257 | |
Seiko Epson Corp. | | | 1,933 | | | | 34,877 | |
Super Micro Computer, Inc.(a) | | | 3,538 | | | | 107,838 | |
Western Digital Corp.(a) | | | 2,429 | | | | 144,841 | |
| | | | | | | | |
| | | | | | | 28,349,531 | |
| | | | | | | | |
| | | | | | | 123,078,393 | |
| | | | | | | | |
FINANCIALS–9.9% | | | | | | | | |
BANKS–3.4% | | | | | | | | |
ABN AMRO Bank NV(b) | | | 3,072 | | | | 47,406 | |
AIB Group PLC | | | 12,488 | | | | 69,057 | |
ANZ Group Holdings Ltd. | | | 19,960 | | | | 351,691 | |
Banco Bilbao Vizcaya Argentaria SA | | | 38,624 | | | | 377,914 | |
Banco BPM SpA | | | 8,634 | | | | 69,906 | |
Banco de Sabadell SA | | | 36,469 | | | | 70,869 | |
Banco Santander SA | | | 103,849 | | | | 480,431 | |
Bank Hapoalim BM | | | 8,472 | | | | 102,275 | |
Bank Leumi Le-Israel BM | | | 10,104 | | | | 120,211 | |
Bank of America Corp. | | | 46,895 | | | | 2,061,035 | |
Bank of Ireland Group PLC | | | 6,732 | | | | 61,392 | |
Banque Cantonale Vaudoise (REG) | | | 202 | | | | 18,599 | |
Barclays PLC | | | 97,398 | | | | 325,815 | |
BNP Paribas SA | | | 6,821 | | | | 418,787 | |
BOC Hong Kong Holdings Ltd. | | | 24,772 | | | | 79,100 | |
BPER Banca SPA | | | 6,671 | | | | 42,547 | |
CaixaBank SA | | | 26,789 | | | | 145,442 | |
Chiba Bank Ltd. (The) | | | 3,848 | | | | 29,660 | |
Citigroup, Inc. | | | 13,286 | | | | 935,202 | |
Citizens Financial Group, Inc. | | | 3,096 | | | | 135,481 | |
Commerzbank AG | | | 6,351 | | | | 104,299 | |
Commonwealth Bank of Australia | | | 11,216 | | | | 1,061,271 | |
Concordia Financial Group Ltd. | | | 7,034 | | | | 38,683 | |
Credit Agricole SA | | | 7,133 | | | | 98,147 | |
Danske Bank A/S | | | 4,622 | | | | 131,046 | |
DBS Group Holdings Ltd. | | | 13,338 | | | | 427,422 | |
DNB Bank ASA | | | 6,001 | | | | 119,807 | |
Erste Group Bank AG | | | 2,257 | | | | 139,699 | |
Fifth Third Bancorp | | | 4,711 | | | | 199,181 | |
FinecoBank Banca Fineco SpA | | | 4,096 | | | | 71,486 | |
Hang Seng Bank Ltd.(b) | | | 5,068 | | | | 62,077 | |
HSBC Holdings PLC | | | 122,005 | | | | 1,198,467 | |
Huntington Bancshares, Inc./OH | | | 10,206 | | | | 166,052 | |
2
| | |
| |
| | | AB Variable Products Series Fund |
| | | | | | | | |
| Company | | Shares | | |
U.S. $ Value | |
| | | | | | | | |
ING Groep NV | | | 22,138 | | | $ | 346,937 | |
Intesa Sanpaolo SpA | | | 98,022 | | | | 393,148 | |
Israel Discount Bank Ltd.–Class A | | | 8,293 | | | | 56,731 | |
Japan Post Bank Co., Ltd. | | | 9,687 | | | | 91,558 | |
JPMorgan Chase & Co. | | | 19,778 | | | | 4,740,984 | |
KBC Group NV | | | 1,538 | | | | 118,748 | |
KeyCorp | | | 6,964 | | | | 119,363 | |
Lloyds Banking Group PLC | | | 411,051 | | | | 280,718 | |
M&T Bank Corp. | | | 1,166 | | | | 219,220 | |
Mediobanca Banca di Credito Finanziario SpA | | | 3,350 | | | | 48,923 | |
Mitsubishi UFJ Financial Group, Inc. | | | 74,435 | | | | 869,007 | |
Mizrahi Tefahot Bank Ltd. | | | 1,039 | | | | 44,977 | |
Mizuho Financial Group, Inc. | | | 16,149 | | | | 394,238 | |
National Australia Bank Ltd. | | | 20,604 | | | | 472,086 | |
NatWest Group PLC | | | 47,310 | | | | 237,082 | |
Nordea Bank Abp (Helsinki) | | | 21,144 | | | | 230,697 | |
Oversea-Chinese Banking Corp., Ltd. | | | 22,668 | | | | 276,846 | |
PNC Financial Services Group, Inc. (The) | | | 2,787 | | | | 537,473 | |
Regions Financial Corp. | | | 6,385 | | | | 150,175 | |
Resona Holdings, Inc. | | | 13,998 | | | | 100,908 | |
Shizuoka Financial Group, Inc. | | | 2,912 | | | | 23,617 | |
Skandinaviska Enskilda Banken AB–Class A | | | 10,634 | | | | 145,729 | |
Societe Generale SA | | | 4,827 | | | | 135,472 | |
Standard Chartered PLC | | | 14,082 | | | | 173,366 | |
Sumitomo Mitsui Financial Group, Inc. | | | 25,034 | | | | 600,822 | |
Sumitomo Mitsui Trust Holdings, Inc. | | | 4,346 | | | | 101,521 | |
Svenska Handelsbanken AB–Class A | | | 9,774 | | | | 100,917 | |
Swedbank AB–Class A | | | 5,689 | | | | 112,335 | |
Truist Financial Corp. | | | 9,326 | | | | 404,562 | |
UniCredit SpA | | | 9,874 | | | | 395,437 | |
United Overseas Bank Ltd. | | | 8,464 | | | | 224,769 | |
US Bancorp | | | 10,959 | | | | 524,169 | |
Wells Fargo & Co. | | | 23,390 | | | | 1,642,914 | |
Westpac Banking Corp. | | | 23,044 | | | | 459,981 | |
| | | | | | | | |
| | | | | | | 24,535,887 | |
| | | | | | | | |
CAPITAL MARKETS–2.0% | | | | | | | | |
3i Group PLC | | | 6,523 | | | | 290,360 | |
Ameriprise Financial, Inc. | | | 682 | | | | 363,117 | |
Amundi SA | | | 412 | | | | 27,419 | |
ASX Ltd. | | | 1,300 | | | | 52,277 | |
| | | | | | | | |
Bank of New York Mellon Corp. (The) | | | 5,108 | | | | 392,448 | |
Blackrock, Inc. | | | 1,023 | | | | 1,048,688 | |
Blackstone, Inc. | | | 5,072 | | | | 874,514 | |
Cboe Global Markets, Inc. | | | 735 | | | | 143,619 | |
Charles Schwab Corp. (The) | | | 10,502 | | | | 777,253 | |
CME Group, Inc. | | | 2,532 | | | | 588,006 | |
CVC Capital Partners PLC(a)(b)(c) | | | 1,425 | | | | 31,511 | |
Daiwa Securities Group, Inc. | | | 8,930 | | | | 58,927 | |
Deutsche Bank AG (REG) | | | 12,700 | | | | 219,163 | |
Deutsche Boerse AG | | | 1,262 | | | | 290,709 | |
EQT AB | | | 2,496 | | | | 68,999 | |
Euronext NV | | | 524 | | | | 58,786 | |
FactSet Research Systems, Inc. | | | 267 | | | | 128,235 | |
Franklin Resources, Inc. | | | 2,171 | | | | 44,050 | |
Futu Holdings Ltd. (ADR) | | | 375 | | | | 29,996 | |
Goldman Sachs Group, Inc. (The) | | | 2,205 | | | | 1,262,627 | |
Hargreaves Lansdown PLC | | | 2,385 | | | | 32,727 | |
Hong Kong Exchanges & Clearing Ltd. | | | 8,063 | | | | 301,788 | |
Intercontinental Exchange, Inc. | | | 4,034 | | | | 601,106 | |
Invesco Ltd. | | | 3,157 | | | | 55,184 | |
Japan Exchange Group, Inc.(b) | | | 6,642 | | | | 73,696 | |
Julius Baer Group Ltd. | | | 1,380 | | | | 89,522 | |
KKR & Co., Inc. | | | 4,742 | | | | 701,389 | |
London Stock Exchange Group PLC | | | 3,205 | | | | 452,401 | |
Macquarie Group Ltd. | | | 2,427 | | | | 331,924 | |
MarketAxess Holdings, Inc. | | | 265 | | | | 59,901 | |
Moody’s Corp. | | | 1,095 | | | | 518,340 | |
Morgan Stanley | | | 8,715 | | | | 1,095,650 | |
MSCI, Inc. | | | 551 | | | | 330,606 | |
Nasdaq, Inc. | | | 2,907 | | | | 224,740 | |
Nomura Holdings, Inc. | | | 20,119 | | | | 116,727 | |
Northern Trust Corp. | | | 1,393 | | | | 142,783 | |
Partners Group Holding AG | | | 152 | | | | 206,460 | |
Raymond James Financial, Inc. | | | 1,285 | | | | 199,599 | |
S&P Global, Inc. | | | 2,230 | | | | 1,110,607 | |
SBI Holdings, Inc. | | | 1,819 | | | | 45,686 | |
Schroders PLC | | | 5,404 | | | | 21,844 | |
Singapore Exchange Ltd. | | | 5,739 | | | | 53,497 | |
State Street Corp. | | | 2,059 | | | | 202,091 | |
T. Rowe Price Group, Inc. | | | 1,561 | | | | 176,533 | |
UBS Group AG (REG) | | | 22,043 | | | | 674,884 | |
| | | | | | | | |
| | | | | | | 14,570,389 | |
| | | | | | | | |
3
| | |
| GLOBAL RISK ALLOCATION—MODERATE PORTFOLIO |
| PORTFOLIO OF INVESTMENTS | | |
| |
| (continued) | | AB Variable Products Series Fund |
| | | | | | | | |
| Company | | Shares | | |
U.S. $ Value | |
| | | | | | | | |
CONSUMER FINANCE–0.3% | | | | | | | | |
American Express Co. | | | 3,910 | | | $ | 1,160,449 | |
Capital One Financial Corp. | | | 2,680 | | | | 477,897 | |
Discover Financial Services | | | 1,764 | | | | 305,578 | |
Synchrony Financial | | | 2,735 | | | | 177,775 | |
| | | | | | | | |
| | | | | | | 2,121,699 | |
| | | | | | | | |
FINANCIAL SERVICES–2.3% | | | | | | | | |
Adyen NV(a)(b) | | | 146 | | | | 216,967 | |
Apollo Global Management, Inc. | | | 3,140 | | | | 518,602 | |
Berkshire Hathaway, Inc.–Class B(a) | | | 12,877 | | | | 5,836,887 | |
Corpay, Inc.(a) | | | 490 | | | | 165,826 | |
Edenred SE | | | 1,643 | | | | 54,015 | |
Eurazeo SE | | | 281 | | | | 20,960 | |
EXOR NV | | | 667 | | | | 61,148 | |
Fidelity National Information Services, Inc. | | | 3,782 | | | | 305,472 | |
Fiserv, Inc.(a) | | | 3,997 | | | | 821,064 | |
Global Payments, Inc. | | | 1,788 | | | | 200,363 | |
Groupe Bruxelles Lambert NV | | | 557 | | | | 38,085 | |
Industrivarden AB–Class A | | | 815 | | | | 25,761 | |
Industrivarden AB–Class C | | | 1,076 | | | | 33,986 | |
Infratil Ltd. | | | 6,156 | | | | 43,392 | |
Investor AB–Class B | | | 11,600 | | | | 307,248 | |
Jack Henry & Associates, Inc. | | | 513 | | | | 89,929 | |
L E Lundbergforetagen AB–Class B | | | 509 | | | | 23,064 | |
M&G PLC | | | 15,160 | | | | 37,515 | |
Mastercard, Inc.–Class A | | | 5,758 | | | | 3,031,990 | |
Mitsubishi HC Capital, Inc. | | | 5,901 | | | | 38,889 | |
Nexi SpA(a)(b) | | | 3,451 | | | | 19,209 | |
ORIX Corp. | | | 7,726 | | | | 165,985 | |
PayPal Holdings, Inc.(a) | | | 7,043 | | | | 601,120 | |
Sofina SA(b) | | | 103 | | | | 23,250 | |
Visa, Inc.–Class A | | | 12,140 | | | | 3,836,726 | |
Wise PLC–Class A(a) | | | 4,466 | | | | 59,359 | |
| | | | | | | | |
| | | | | | | 16,576,812 | |
| | | | | | | | |
INSURANCE–1.9% | | | | | | | | |
Admiral Group PLC | | | 1,745 | | | | 57,648 | |
Aegon Ltd.(b) | | | 9,051 | | | | 53,860 | |
Aflac, Inc. | | | 3,512 | | | | 363,281 | |
Ageas SA/NV | | | 1,071 | | | | 52,072 | |
AIA Group Ltd. | | | 73,195 | | | | 525,750 | |
Allianz SE (REG) | | | 2,625 | | | | 806,827 | |
Allstate Corp. (The) | | | 1,860 | | | | 358,589 | |
American International Group, Inc. | | | 4,382 | | | | 319,010 | |
| | | | | | | | |
Aon PLC–Class A | | | 1,519 | | | | 545,564 | |
Arch Capital Group Ltd. | | | 2,632 | | | | 243,065 | |
Arthur J Gallagher & Co. | | | 1,541 | | | | 437,413 | |
ASR Nederland NV | | | 1,063 | | | | 50,558 | |
Assurant, Inc. | | | 360 | | | | 76,759 | |
Aviva PLC | | | 17,940 | | | | 105,148 | |
AXA SA | | | 11,802 | | | | 420,029 | |
Baloise Holding AG (REG) | | | 292 | | | | 52,911 | |
Brown & Brown, Inc. | | | 1,667 | | | | 170,067 | |
Chubb Ltd. | | | 2,634 | | | | 727,774 | |
Cincinnati Financial Corp. | | | 1,098 | | | | 157,783 | |
Dai-ichi Life Holdings, Inc. | | | 6,058 | | | | 161,423 | |
Erie Indemnity Co.–Class A | | | 175 | | | | 72,140 | |
Everest Group Ltd. | | | 302 | | | | 109,463 | |
Generali(b) | | | 6,311 | | | | 178,550 | |
Gjensidige Forsikring ASA | | | 1,341 | | | | 23,678 | |
Globe Life, Inc. | | | 590 | | | | 65,797 | |
Hannover Rueck SE | | | 404 | | | | 101,169 | |
Hartford Financial Services Group, Inc. (The) | | | 2,037 | | | | 222,848 | |
Helvetia Holding AG (REG) | | | 249 | | | | 41,069 | |
Insurance Australia Group Ltd. | | | 15,883 | | | | 83,072 | |
Japan Post Holdings Co., Ltd. | | | 12,878 | | | | 121,282 | |
Japan Post Insurance Co., Ltd. | | | 1,282 | | | | 23,548 | |
Legal & General Group PLC | | | 39,519 | | | | 113,472 | |
Loews Corp. | | | 1,270 | | | | 107,556 | |
Marsh & McLennan Cos., Inc. | | | 3,450 | | | | 732,815 | |
Medibank Pvt Ltd. | | | 18,462 | | | | 43,273 | |
MetLife, Inc. | | | 4,086 | | | | 334,562 | |
MS&AD Insurance Group Holdings, Inc. | | | 8,612 | | | | 185,998 | |
Muenchener Rueckversicherungs-Gesellschaft AG in Muenchen (REG) | | | 897 | | | | 452,592 | |
NN Group NV | | | 1,814 | | | | 79,106 | |
Phoenix Group Holdings PLC | | | 4,700 | | | | 29,949 | |
Poste Italiane SpA | | | 3,065 | | | | 43,348 | |
Principal Financial Group, Inc. | | | 1,478 | | | | 114,412 | |
Progressive Corp. (The) | | | 4,115 | | | | 985,995 | |
Prudential Financial, Inc. | | | 2,501 | | | | 296,444 | |
Prudential PLC | | | 18,066 | | | | 143,372 | |
QBE Insurance Group Ltd. | | | 10,088 | | | | 119,804 | |
Sampo Oyj–Class A(b) | | | 3,316 | | | | 135,442 | |
Sompo Holdings, Inc. | | | 5,999 | | | | 155,436 | |
Suncorp Group Ltd. | | | 8,526 | | | | 100,170 | |
4
| | |
| |
| | | AB Variable Products Series Fund |
| | | | | | | | |
| Company | | Shares | | |
U.S. $ Value | |
| | | | | | | | |
Swiss Life Holding AG (REG) | | | 193 | | | $ | 149,009 | |
Swiss Re AG | | | 2,021 | | | | 292,711 | |
T&D Holdings, Inc. | | | 3,277 | | | | 59,981 | |
Talanx AG | | | 433 | | | | 36,827 | |
Tokio Marine Holdings, Inc. | | | 12,579 | | | | 451,437 | |
Travelers Cos., Inc. (The) | | | 1,595 | | | | 384,220 | |
Tryg A/S | | | 2,273 | | | | 47,947 | |
Unipol Gruppo SpA | | | 2,645 | | | | 33,032 | |
W R Berkley Corp. | | | 2,115 | | | | 123,770 | |
Willis Towers Watson PLC | | | 708 | | | | 221,774 | |
Zurich Insurance Group AG | | | 981 | | | | 583,465 | |
| | | | | | | | |
| | | | | | | 13,286,066 | |
| | | | | | | | |
| | | | | | | 71,090,853 | |
| | | | | | | | |
CONSUMER DISCRETIONARY–7.2% | | | | | | | | |
AUTOMOBILE COMPONENTS–0.1% | | | | | | | | |
Aisin Corp. | | | 3,549 | | | | 39,650 | |
Aptiv PLC(a) | | | 1,869 | | | | 113,037 | |
BorgWarner, Inc. | | | 1,536 | | | | 48,829 | |
Bridgestone Corp. | | | 3,822 | | | | 128,469 | |
Cie Generale des Etablissements Michelin SCA | | | 4,477 | | | | 147,318 | |
Continental AG | | | 737 | | | | 49,662 | |
Denso Corp. | | | 12,659 | | | | 174,530 | |
Sumitomo Electric Industries Ltd. | | | 4,783 | | | | 85,508 | |
| | | | | | | | |
| | | | | | | 787,003 | |
| | | | | | | | |
AUTOMOBILES–1.7% | | | | | | | | |
Bayerische Motoren Werke AG | | | 1,943 | | | | 158,918 | |
Bayerische Motoren Werke AG (Preference Shares) | | | 375 | | | | 28,093 | |
Dr. Ing. h.c. F. Porsche AG (Preference Shares)(c) | | | 763 | | | | 46,237 | |
Ferrari NV(b) | | | 845 | | | | 360,560 | |
Ford Motor Co. | | | 27,422 | | | | 271,478 | |
General Motors Co. | | | 7,725 | | | | 411,511 | |
Honda Motor Co., Ltd. | | | 30,044 | | | | 286,043 | |
Isuzu Motors Ltd.(b) | | | 3,821 | | | | 51,979 | |
Mercedes-Benz Group AG | | | 5,019 | | | | 279,818 | |
Nissan Motor Co., Ltd.(b) | | | 14,903 | | | | 45,198 | |
Porsche Automobil Holding SE (Preference Shares) | | | 1,027 | | | | 38,698 | |
Renault SA | | | 1,289 | | | | 62,753 | |
Stellantis NV (Milan) | | | 13,169 | | | | 171,308 | |
Subaru Corp. | | | 3,937 | | | | 69,954 | |
Suzuki Motor Corp. | | | 10,521 | | | | 117,881 | |
Tesla, Inc.(a) | | | 19,619 | | | | 7,922,937 | |
| | | | | | | | |
Toyota Motor Corp. | | | 68,830 | | | | 1,343,922 | |
Volkswagen AG (Preference Shares) | | | 1,382 | | | | 127,510 | |
Yamaha Motor Co., Ltd. | | | 6,226 | | | | 54,855 | |
| | | | | | | | |
| | | | | | | 11,849,653 | |
| | | | | | | | |
BROADLINE RETAIL–2.3% | | | | | | | | |
Amazon.com, Inc.(a) | | | 65,743 | | | | 14,423,357 | |
Cie Financiere Richemont SA (REG) | | | 3,603 | | | | 545,041 | |
eBay, Inc. | | | 3,365 | | | | 208,462 | |
Global-e Online Ltd.(a) | | | 672 | | | | 36,644 | |
Next PLC | | | 798 | | | | 94,661 | |
Pan Pacific International Holdings Corp. | | | 2,550 | | | | 69,275 | |
Prosus NV | | | 9,168 | | | | 364,197 | |
Rakuten Group, Inc.(a) | | | 10,068 | | | | 54,241 | |
Wesfarmers Ltd. | | | 7,605 | | | | 335,970 | |
| | | | | | | | |
| | | | | | | 16,131,848 | |
| | | | | | | | |
DISTRIBUTORS–0.0% | | | | | | | | |
D’ieteren Group | | | 144 | | | | 23,954 | |
Genuine Parts Co. | | | 977 | | | | 114,075 | |
LKQ Corp. | | | 1,826 | | | | 67,105 | |
Pool Corp. | | | 267 | | | | 91,031 | |
| | | | | | | | |
| | | | | | | 296,165 | |
| | | | | | | | |
DIVERSIFIED CONSUMER SERVICES–0.0% | | | | | | | | |
Pearson PLC | | | 4,019 | | | | 64,446 | |
| | | | | | | | |
HOTELS, RESTAURANTS & LEISURE–1.2% | | | | | | | | |
Accor SA | | | 1,307 | | | | 63,569 | |
Airbnb, Inc.–Class A(a) | | | 3,041 | | | | 399,618 | |
Amadeus IT Group SA(b) | | | 3,019 | | | | 213,094 | |
Aristocrat Leisure Ltd. | | | 3,796 | | | | 160,307 | |
Booking Holdings, Inc. | | | 233 | | | | 1,157,642 | |
Caesars Entertainment, Inc.(a) | | | 1,493 | | | | 49,896 | |
Carnival Corp.(a) | | | 7,297 | | | | 181,841 | |
Chipotle Mexican Grill, Inc.(a) | | | 9,572 | | | | 577,192 | |
Compass Group PLC | | | 11,372 | | | | 378,385 | |
Darden Restaurants, Inc. | | | 825 | | | | 154,019 | |
Delivery Hero SE(a) | | | 1,251 | | | | 35,143 | |
Domino’s Pizza, Inc. | | | 243 | | | | 102,002 | |
Entain PLC | | | 4,071 | | | | 34,947 | |
Evolution AB | | | 1,136 | | | | 87,604 | |
Expedia Group, Inc.(a) | | | 863 | | | | 160,803 | |
Galaxy Entertainment Group Ltd. | | | 14,639 | | | | 61,625 | |
Genting Singapore Ltd. | | | 40,481 | | | | 22,710 | |
Hilton Worldwide Holdings, Inc. | | | 1,713 | | | | 423,385 | |
InterContinental Hotels Group PLC | | | 1,067 | | | | 132,760 | |
5
| | |
| GLOBAL RISK ALLOCATION—MODERATE PORTFOLIO |
| PORTFOLIO OF INVESTMENTS | | |
| |
| (continued) | | AB Variable Products Series Fund |
| | | | | | | | |
| Company | | Shares | | |
U.S. $ Value | |
| | | | | | | | |
La Francaise des Jeux SACA | | | 683 | | | $ | 26,303 | |
Las Vegas Sands Corp. | | | 2,445 | | | | 125,575 | |
Lottery Corp., Ltd. (The) | | | 14,921 | | | | 45,510 | |
Marriott International, Inc./MD–Class A | | | 1,620 | | | | 451,883 | |
McDonald’s Corp. | | | 5,034 | | | | 1,459,306 | |
McDonald’s Holdings Co. Japan Ltd. | | | 578 | | | | 22,705 | |
MGM Resorts International(a) | | | 1,590 | | | | 55,093 | |
Norwegian Cruise Line Holdings Ltd.(a) | | | 3,089 | | | | 79,480 | |
Oriental Land Co., Ltd./Japan | | | 7,304 | | | | 157,446 | |
Royal Caribbean Cruises Ltd. | | | 1,738 | | | | 400,939 | |
Sands China Ltd.(a) | | | 16,254 | | | | 43,278 | |
Sodexo SA | | | 593 | | | | 48,864 | |
Starbucks Corp. | | | 7,963 | | | | 726,624 | |
Whitbread PLC | | | 1,203 | | | | 44,282 | |
Wynn Resorts Ltd. | | | 650 | | | | 56,004 | |
Yum! Brands, Inc. | | | 1,961 | | | | 263,088 | |
Zensho Holdings Co., Ltd. | | | 645 | | | | 36,528 | |
| | | | | | | | |
| | | | | | | 8,439,450 | |
| | | | | | | | |
HOUSEHOLD DURABLES–0.3% | | | | | | | | |
Barratt Redrow PLC | | | 9,240 | | | | 50,653 | |
Berkeley Group Holdings PLC | | | 685 | | | | 33,336 | |
DR Horton, Inc. | | | 2,049 | | | | 286,491 | |
Garmin Ltd. | | | 1,079 | | | | 222,554 | |
Lennar Corp.–Class A | | | 1,678 | | | | 228,829 | |
Mohawk Industries, Inc.(a) | | | 368 | | | | 43,840 | |
NVR, Inc.(a) | | | 22 | | | | 179,936 | |
Panasonic Holdings Corp. | | | 15,609 | | | | 159,533 | |
Persimmon PLC | | | 2,144 | | | | 32,026 | |
PulteGroup, Inc. | | | 1,441 | | | | 156,925 | |
SEB SA | | | 167 | | | | 15,092 | |
Sekisui House Ltd. | | | 3,994 | | | | 95,233 | |
Sony Group Corp. | | | 41,890 | | | | 882,854 | |
Taylor Wimpey PLC | | | 23,731 | | | | 36,119 | |
| | | | | | | | |
| | | | | | | 2,423,421 | |
| | | | | | | | |
LEISURE PRODUCTS–0.0% | | | | | | | | |
Bandai Namco Holdings, Inc. | | | 3,976 | | | | 94,809 | |
Hasbro, Inc. | | | 921 | | | | 51,493 | |
Shimano, Inc. | | | 511 | | | | 68,738 | |
| | | | | | | | |
| | | | | | | 215,040 | |
| | | | | | | | |
SPECIALTY RETAIL–1.1% | | | | | | | | |
AutoZone, Inc.(a) | | | 119 | | | | 381,038 | |
Avolta AG | | | 614 | | | | 24,648 | |
Best Buy Co., Inc. | | | 1,373 | | | | 117,803 | |
| | | | | | | | |
CarMax, Inc.(a) | | | 1,088 | | | | 88,955 | |
Fast Retailing Co., Ltd. | | | 1,278 | | | | 431,123 | |
H & M Hennes & Mauritz AB–Class B(b) | | | 3,797 | | | | 51,179 | |
Home Depot, Inc. (The) | | | 6,978 | | | | 2,714,372 | |
Industria de Diseno Textil SA | | | 7,311 | | | | 374,498 | |
JD Sports Fashion PLC | | | 17,374 | | | | 20,766 | |
Kingfisher PLC | | | 12,234 | | | | 38,028 | |
Lowe’s Cos., Inc. | | | 3,985 | | | | 983,498 | |
Nitori Holdings Co., Ltd. | | | 536 | | | | 63,512 | |
O’Reilly Automotive, Inc.(a) | | | 406 | | | | 481,435 | |
Ross Stores, Inc. | | | 2,331 | | | | 352,610 | |
TJX Cos., Inc. (The) | | | 7,923 | | | | 957,178 | |
Tractor Supply Co. | | | 3,753 | | | | 199,134 | |
Ulta Beauty, Inc.(a) | | | 331 | | | | 143,962 | |
Zalando SE(a) | | | 1,504 | | | | 50,314 | |
ZOZO, Inc. | | | 905 | | | | 27,872 | |
| | | | | | | | |
| | | | | | | 7,501,925 | |
| | | | | | | | |
TEXTILES, APPAREL & LUXURY GOODS–0.5% | | | | | | | | |
adidas AG | | | 1,086 | | | | 267,117 | |
Asics Corp. | | | 4,575 | | | | 89,248 | |
Deckers Outdoor Corp.(a) | | | 1,067 | | | | 216,697 | |
Hermes International SCA | | | 212 | | | | 508,666 | |
Kering SA | | | 499 | | | | 123,251 | |
Lululemon Athletica, Inc.(a) | | | 794 | | | | 303,634 | |
LVMH Moet Hennessy Louis Vuitton SE | | | 1,844 | | | | 1,212,970 | |
Moncler SpA(b) | | | 1,566 | | | | 82,670 | |
NIKE, Inc.–Class B | | | 8,364 | | | | 632,904 | |
Pandora A/S | | | 549 | | | | 100,443 | |
Puma SE | | | 708 | | | | 32,554 | |
Ralph Lauren Corp. | | | 283 | | | | 65,367 | |
Swatch Group AG (The) (BR) | | | 194 | | | | 35,262 | |
Tapestry, Inc. | | | 1,637 | | | | 106,945 | |
| | | | | | | | |
| | | | | | | 3,777,728 | |
| | | | | | | | |
| | | | | | | 51,486,679 | |
| | | | | | | | |
HEALTH CARE–6.8% | | | | | | | | |
BIOTECHNOLOGY–0.9% | | | | | | | | |
AbbVie, Inc. | | | 12,414 | | | | 2,205,968 | |
Amgen, Inc. | | | 3,776 | | | | 984,177 | |
Argenx SE(a) | | | 401 | | | | 247,702 | |
Biogen, Inc.(a) | | | 1,024 | | | | 156,590 | |
CSL Ltd. | | | 3,245 | | | | 566,093 | |
Genmab A/S(a) | | | 421 | | | | 87,923 | |
Gilead Sciences, Inc. | | | 8,755 | | | | 808,699 | |
Grifols SA(a)(b) | | | 2,000 | | | | 18,900 | |
Incyte Corp.(a) | | | 1,123 | | | | 77,566 | |
Moderna, Inc.(a) | | | 2,379 | | | | 98,919 | |
Regeneron Pharmaceuticals, Inc.(a) | | | 740 | | | | 527,124 | |
6
| | |
| |
| | | AB Variable Products Series Fund |
| | | | | | | | |
| Company | | Shares | | |
U.S. $ Value | |
| | | | | | | | |
Swedish Orphan Biovitrum AB(a) | | | 1,313 | | | $ | 37,667 | |
Vertex Pharmaceuticals, Inc.(a) | | | 1,809 | | | | 728,484 | |
Zealand Pharma A/S(a) | | | 429 | | | | 42,675 | |
| | | | | | | | |
| | | | | | | 6,588,487 | |
| | | | | | | | |
HEALTH CARE EQUIPMENT & SUPPLIES–1.4% | | | | | | | | |
Abbott Laboratories | | | 12,185 | | | | 1,378,245 | |
Alcon AG | | | 3,349 | | | | 283,953 | |
Align Technology, Inc.(a) | | | 493 | | | | 102,795 | |
Baxter International, Inc. | | | 3,587 | | | | 104,597 | |
Becton Dickinson & Co. | | | 2,031 | | | | 460,773 | |
BioMerieux | | | 278 | | | | 29,755 | |
Boston Scientific Corp.(a) | | | 10,354 | | | | 924,819 | |
Carl Zeiss Meditec AG (BR) | | | 270 | | | | 12,640 | |
Cochlear Ltd. | | | 439 | | | | 78,616 | |
Coloplast A/S–Class B | | | 845 | | | | 92,580 | |
Cooper Cos., Inc. (The)(a) | | | 1,399 | | | | 128,610 | |
Demant A/S(a) | | | 593 | | | | 21,826 | |
Dexcom, Inc.(a) | | | 2,744 | | | | 213,401 | |
DiaSorin SpA | | | 150 | | | | 15,472 | |
Edwards Lifesciences Corp.(a) | | | 4,143 | | | | 306,706 | |
EssilorLuxottica SA | | | 1,992 | | | | 485,908 | |
Fisher & Paykel Healthcare Corp., Ltd. | | | 3,928 | | | | 84,425 | |
GE Healthcare, Inc. | | | 3,210 | | | | 250,958 | |
Getinge AB–Class B | | | 1,533 | | | | 25,147 | |
Hologic, Inc.(a) | | | 1,632 | | | | 117,651 | |
Hoya Corp. | | | 2,349 | | | | 291,526 | |
IDEXX Laboratories, Inc.(a) | | | 575 | | | | 237,728 | |
Insulet Corp.(a) | | | 493 | | | | 128,708 | |
Intuitive Surgical, Inc.(a) | | | 2,502 | | | | 1,305,944 | |
Koninklijke Philips NV(a) | | | 5,354 | | | | 135,624 | |
Medtronic PLC | | | 9,009 | | | | 719,639 | |
Olympus Corp. | | | 7,884 | | | | 117,710 | |
ResMed, Inc. | | | 1,031 | | | | 235,779 | |
Siemens Healthineers AG | | | 1,890 | | | | 99,805 | |
Smith & Nephew PLC | | | 5,861 | | | | 72,632 | |
Solventum Corp.(a) | | | 971 | | | | 64,144 | |
Sonova Holding AG (REG) | | | 340 | | | | 111,183 | |
STERIS PLC | | | 693 | | | | 142,453 | |
Straumann Holding AG (REG) | | | 748 | | | | 94,219 | |
Stryker Corp. | | | 2,410 | | | | 867,721 | |
Sysmex Corp. | | | 3,370 | | | | 61,788 | |
Teleflex, Inc. | | | 326 | | | | 58,022 | |
Terumo Corp. | | | 8,981 | | | | 173,385 | |
Zimmer Biomet Holdings, Inc. | | | 1,399 | | | | 147,776 | |
| | | | | | | | |
| | | | | | | 10,184,663 | |
| | | | | | | | |
| | | | | | | | |
HEALTH CARE PROVIDERS & SERVICES–1.1% | | | | | | | | |
Amplifon SpA(b) | | | 835 | | | | 21,516 | |
Cardinal Health, Inc. | | | 1,700 | | | | 201,059 | |
Cencora, Inc. | | | 1,232 | | | | 276,806 | |
Centene Corp.(a) | | | 3,547 | | | | 214,877 | |
Cigna Group (The) | | | 1,954 | | | | 539,577 | |
CVS Health Corp. | | | 8,840 | | | | 396,828 | |
DaVita, Inc.(a) | | | 317 | | | | 47,407 | |
Elevance Health, Inc. | | | 1,629 | | | | 600,938 | |
Fresenius Medical Care AG | | | 1,377 | | | | 62,696 | |
Fresenius SE & Co. KGaA(a) | | | 2,831 | | | | 98,267 | |
HCA Healthcare, Inc. | | | 1,281 | | | | 384,492 | |
Henry Schein, Inc.(a) | | | 876 | | | | 60,619 | |
Humana, Inc. | | | 846 | | | | 214,639 | |
Labcorp Holdings, Inc. | | | 588 | | | | 134,840 | |
McKesson Corp. | | | 892 | | | | 508,360 | |
Molina Healthcare, Inc.(a) | | | 402 | | | | 117,002 | |
Quest Diagnostics, Inc. | | | 784 | | | | 118,274 | |
Ramsay Health Care Ltd.(b) | | | 1,235 | | | | 26,354 | |
Sonic Healthcare Ltd. | | | 3,059 | | | | 51,021 | |
UnitedHealth Group, Inc. | | | 6,465 | | | | 3,270,385 | |
Universal Health Services, Inc.–Class B | | | 412 | | | | 73,921 | |
| | | | | | | | |
| | | | | | | 7,419,878 | |
| | | | | | | | |
HEALTH CARE TECHNOLOGY–0.0% | | | | | | | | |
M3, Inc.(b) | | | 2,954 | | | | 25,596 | |
Pro Medicus Ltd. | | | 385 | | | | 59,472 | |
| | | | | | | | |
| | | | | | | 85,068 | |
| | | | | | | | |
LIFE SCIENCES TOOLS & SERVICES–0.6% | | | | | | | | |
Agilent Technologies, Inc. | | | 2,019 | | | | 271,232 | |
Bachem Holding AG | | | 226 | | | | 14,453 | |
Bio-Techne Corp. | | | 1,116 | | | | 80,385 | |
Charles River Laboratories International, Inc.(a)(b) | | | 359 | | | | 66,271 | |
Danaher Corp. | | | 4,516 | | | | 1,036,648 | |
Eurofins Scientific SE | | | 906 | | | | 46,208 | |
IQVIA Holdings, Inc.(a) | | | 1,211 | | | | 237,974 | |
Lonza Group AG (REG) | | | 484 | | | | 285,675 | |
Mettler-Toledo International, Inc.(a) | | | 148 | | | | 181,105 | |
QIAGEN NV(a) | | | 1,487 | | | | 66,653 | |
Revvity, Inc. | | | 855 | | | | 95,427 | |
Sartorius AG (Preference Shares) | | | 176 | | | | 39,113 | |
Sartorius Stedim Biotech | | | 196 | | | | 38,265 | |
Thermo Fisher Scientific, Inc. | | | 2,687 | | | | 1,397,858 | |
Waters Corp.(a) | | | 417 | | | | 154,699 | |
7
| | |
| GLOBAL RISK ALLOCATION—MODERATE PORTFOLIO |
| PORTFOLIO OF INVESTMENTS | | |
| |
| (continued) | | AB Variable Products Series Fund |
| | | | | | | | |
| Company | | Shares | | |
U.S. $ Value | |
| | | | | | | | |
West Pharmaceutical Services, Inc. | | | 509 | | | $ | 166,728 | |
| | | | | | | | |
| | | | | | | 4,178,694 | |
| | | | | | | | |
PHARMACEUTICALS–2.8% | | | | | | | | |
Astellas Pharma, Inc. | | | 12,114 | | | | 117,636 | |
AstraZeneca PLC | | | 10,389 | | | | 1,354,514 | |
Bayer AG (REG) | | | 6,584 | | | | 131,515 | |
Bristol-Myers Squibb Co. | | | 14,248 | | | | 805,867 | |
Chugai Pharmaceutical Co., Ltd. | | | 4,496 | | | | 198,189 | |
Daiichi Sankyo Co., Ltd. | | | 11,782 | | | | 322,393 | |
Eisai Co., Ltd. | | | 1,687 | | | | 45,936 | |
Eli Lilly & Co. | | | 5,535 | | | | 4,273,020 | |
Galderma Group AG(a) | | | 558 | | | | 61,878 | |
GSK PLC | | | 27,782 | | | | 468,606 | |
Hikma Pharmaceuticals PLC | | | 1,116 | | | | 27,824 | |
Ipsen SA | | | 253 | | | | 28,999 | |
Johnson & Johnson | | | 16,914 | | | | 2,446,103 | |
Kyowa Kirin Co., Ltd. | | | 1,626 | | | | 24,452 | |
Merck & Co., Inc. | | | 17,771 | | | | 1,767,859 | |
Merck KGaA | | | 866 | | | | 126,023 | |
Novartis AG (REG) | | | 13,208 | | | | 1,285,894 | |
Novo Nordisk A/S–Class B | | | 21,583 | | | | 1,862,221 | |
Ono Pharmaceutical Co., Ltd. | | | 2,503 | | | | 26,060 | |
Orion Oyj–Class B(b) | | | 725 | | | | 32,127 | |
Otsuka Holdings Co., Ltd. | | | 3,000 | | | | 163,200 | |
Pfizer, Inc. | | | 39,811 | | | | 1,056,186 | |
Recordati Industria Chimica e Farmaceutica SpA(b) | | | 701 | | | | 36,749 | |
Roche Holding AG (BR) | | | 215 | | | | 64,220 | |
Roche Holding AG (Genusschein) | | | 4,708 | | | | 1,316,388 | |
Sandoz Group AG | | | 2,744 | | | | 112,484 | |
Sanofi SA | | | 7,654 | | | | 744,051 | |
Shionogi & Co., Ltd. | | | 5,061 | | | | 70,981 | |
Takeda Pharmaceutical Co., Ltd. | | | 10,650 | | | | 281,930 | |
Teva Pharmaceutical Industries Ltd. (Sponsored ADR)(a) | | | 7,592 | | | | 167,328 | |
UCB SA | | | 847 | | | | 168,607 | |
Viatris, Inc. | | | 8,385 | | | | 104,393 | |
Zoetis, Inc. | | | 3,169 | | | | 516,325 | |
| | | | | | | | |
| | | | | | | 20,209,958 | |
| | | | | | | | |
| | | | | | | 48,666,748 | |
| | | | | | | | |
INDUSTRIALS–6.6% | | | | | | | | |
AEROSPACE & DEFENSE–1.3% | | | | | | | | |
Airbus SE | | | 3,982 | | | | 637,641 | |
Axon Enterprise, Inc.(a) | | | 509 | | | | 302,509 | |
BAE Systems PLC | | | 20,254 | | | | 290,549 | |
Boeing Co. (The)(a) | | | 5,252 | | | | 929,604 | |
Dassault Aviation SA | | | 132 | | | | 26,972 | |
| | | | | | | | |
Elbit Systems Ltd. | | | 179 | | | | 46,936 | |
General Dynamics Corp. | | | 1,813 | | | | 477,707 | |
General Electric Co. | | | 7,603 | | | | 1,268,104 | |
Howmet Aerospace, Inc. | | | 2,854 | | | | 312,142 | |
Huntington Ingalls Industries, Inc. | | | 275 | | | | 51,967 | |
Kongsberg Gruppen ASA | | | 590 | | | | 66,379 | |
L3Harris Technologies, Inc. | | | 1,332 | | | | 280,093 | |
Leonardo SpA | | | 2,713 | | | | 72,990 | |
Lockheed Martin Corp. | | | 1,482 | | | | 720,163 | |
Melrose Industries PLC | | | 8,645 | | | | 59,740 | |
MTU Aero Engines AG | | | 361 | | | | 120,572 | |
Northrop Grumman Corp. | | | 962 | | | | 451,457 | |
Rheinmetall AG | | | 292 | | | | 186,561 | |
Rolls-Royce Holdings PLC(a) | | | 56,999 | | | | 404,202 | |
RTX Corp. | | | 9,351 | | | | 1,082,098 | |
Saab AB–Class B | | | 2,147 | | | | 45,360 | |
Safran SA | | | 2,434 | | | | 533,308 | |
Singapore Technologies Engineering Ltd. | | | 10,451 | | | | 35,660 | |
Textron, Inc. | | | 1,303 | | | | 99,667 | |
Thales SA | | | 621 | | | | 89,173 | |
TransDigm Group, Inc. | | | 395 | | | | 500,576 | |
| | | | | | | | |
| | | | | | | 9,092,130 | |
| | | | | | | | |
AIR FREIGHT & LOGISTICS–0.3% | | | | | | | | |
CH Robinson Worldwide, Inc. | | | 830 | | | | 85,755 | |
Deutsche Post AG | | | 6,836 | | | | 241,327 | |
DSV A/S | | | 1,370 | | | | 291,763 | |
Expeditors International of Washington, Inc. | | | 983 | | | | 108,887 | |
FedEx Corp. | | | 1,579 | | | | 444,220 | |
InPost SA(a) | | | 1,508 | | | | 25,745 | |
SG Holdings Co., Ltd. | | | 2,143 | | | | 20,485 | |
United Parcel Service, Inc.–Class B | | | 5,138 | | | | 647,902 | |
| | | | | | | | |
| | | | | | | 1,866,084 | |
| | | | | | | | |
BUILDING PRODUCTS–0.4% | | | | | | | | |
A O Smith Corp. | | | 837 | | | | 57,092 | |
AGC, Inc. | | | 1,310 | | | | 38,266 | |
Allegion PLC | | | 611 | | | | 79,845 | |
Assa Abloy AB–Class B | | | 6,717 | | | | 198,395 | |
Builders FirstSource, Inc.(a) | | | 808 | | | | 115,487 | |
Carrier Global Corp. | | | 5,882 | | | | 401,505 | |
Cie de Saint-Gobain SA | | | 3,040 | | | | 270,139 | |
Daikin Industries Ltd. | | | 1,766 | | | | 206,058 | |
Geberit AG (REG) | | | 224 | | | | 127,036 | |
Johnson Controls International PLC | | | 4,671 | | | | 368,682 | |
Kingspan Group PLC | | | 1,036 | | | | 75,315 | |
Lennox International, Inc. | | | 225 | | | | 137,093 | |
Masco Corp. | | | 1,516 | | | | 110,016 | |
8
| | |
| |
| | | AB Variable Products Series Fund |
| | | | | | | | |
| Company | | Shares | | |
U.S. $ Value | |
| | | | | | | | |
Nibe Industrier AB–Class B | | | 10,159 | | | $ | 39,701 | |
Otis Worldwide Corp. | | | 2,806 | | | | 259,864 | |
ROCKWOOL A/S–Class B | | | 63 | | | | 22,418 | |
TOTO Ltd. | | | 947 | | | | 22,687 | |
Trane Technologies PLC | | | 1,581 | | | | 583,942 | |
| | | | | | | | |
| | | | | | | 3,113,541 | |
| | | | | | | | |
COMMERCIAL SERVICES & SUPPLIES–0.3% | | | | | | | | |
Brambles Ltd. | | | 9,334 | | | | 111,011 | |
Cintas Corp. | | | 2,408 | | | | 439,942 | |
Copart, Inc.(a) | | | 6,159 | | | | 353,465 | |
Dai Nippon Printing Co., Ltd. | | | 2,598 | | | | 36,355 | |
Rentokil Initial PLC | | | 16,917 | | | | 84,441 | |
Republic Services, Inc. | | | 1,430 | | | | 287,687 | |
Rollins, Inc. | | | 1,973 | | | | 91,449 | |
Secom Co., Ltd. | | | 2,810 | | | | 95,427 | |
Securitas AB–Class B(b) | | | 3,297 | | | | 40,764 | |
TOPPAN Holdings, Inc. | | | 1,600 | | | | 42,445 | |
Veralto Corp. | | | 1,737 | | | | 176,913 | |
Waste Management, Inc. | | | 2,566 | | | | 517,793 | |
| | | | | | | | |
| | | | | | | 2,277,692 | |
| | | | | | | | |
CONSTRUCTION & ENGINEERING–0.1% | | | | | | | | |
ACS Actividades de Construccion y Servicios SA | | | 1,184 | | | | 59,333 | |
Bouygues SA | | | 1,271 | | | | 37,635 | |
Eiffage SA | | | 493 | | | | 43,232 | |
Ferrovial SE(b) | | | 3,189 | | | | 133,857 | |
Kajima Corp. | | | 2,654 | | | | 48,077 | |
Obayashi Corp. | | | 4,347 | | | | 57,238 | |
Quanta Services, Inc. | | | 1,037 | | | | 327,744 | |
Skanska AB–Class B | | | 2,281 | | | | 47,964 | |
Taisei Corp.(b) | | | 1,113 | | | | 46,633 | |
Vinci SA | | | 3,352 | | | | 345,110 | |
| | | | | | | | |
| | | | | | | 1,146,823 | |
| | | | | | | | |
ELECTRICAL EQUIPMENT–0.7% | | | | | | | | |
ABB Ltd. (REG) | | | 10,599 | | | | 572,330 | |
AMETEK, Inc. | | | 1,625 | | | | 292,922 | |
Eaton Corp. PLC | | | 2,776 | | | | 921,271 | |
Emerson Electric Co. | | | 4,006 | | | | 496,464 | |
Fuji Electric Co., Ltd. | | | 899 | | | | 48,062 | |
Fujikura Ltd. | | | 1,700 | | | | 69,404 | |
GE Vernova, Inc. | | | 1,938 | | | | 637,466 | |
Generac Holdings, Inc.(a) | | | 418 | | | | 64,811 | |
Hubbell, Inc. | | | 377 | | | | 157,922 | |
Legrand SA | | | 1,757 | | | | 170,906 | |
Mitsubishi Electric Corp. | | | 12,732 | | | | 214,989 | |
NIDEC Corp. | | | 5,588 | | | | 100,370 | |
Prysmian SpA | | | 1,883 | | | | 120,505 | |
Rockwell Automation, Inc. | | | 793 | | | | 226,631 | |
| | | | | | | | |
Schneider Electric SE | | | 3,665 | | | | 912,423 | |
Siemens Energy AG(a) | | | 4,285 | | | | 227,412 | |
Vestas Wind Systems A/S(a) | | | 6,767 | | | | 92,822 | |
| | | | | | | | |
| | | | | | | 5,326,710 | |
| | | | | | | | |
GROUND TRANSPORTATION–0.5% | | | | | | | | |
Central Japan Railway Co. | | | 5,171 | | | | 97,037 | |
CSX Corp. | | | 13,547 | | | | 437,162 | |
East Japan Railway Co. | | | 6,075 | | | | 107,594 | |
Grab Holdings Ltd.–Class A(a) | | | 14,160 | | | | 66,835 | |
Hankyu Hanshin Holdings, Inc. | | | 1,532 | | | | 39,931 | |
JB Hunt Transport Services, Inc. | | | 560 | | | | 95,570 | |
MTR Corp., Ltd. | | | 10,418 | | | | 36,190 | |
Norfolk Southern Corp. | | | 1,589 | | | | 372,938 | |
Old Dominion Freight Line, Inc. | | | 1,320 | | | | 232,848 | |
Tokyu Corp. | | | 3,546 | | | | 37,789 | |
Uber Technologies, Inc.(a) | | | 14,793 | | | | 892,314 | |
Union Pacific Corp. | | | 4,259 | | | | 971,222 | |
West Japan Railway Co. | | | 2,940 | | | | 52,073 | |
| | | | | | | | |
| | | | | | | 3,439,503 | |
| | | | | | | | |
INDUSTRIAL CONGLOMERATES–0.5% | | | | | | | | |
3M Co. | | | 3,826 | | | | 493,898 | |
CK Hutchison Holdings Ltd. | | | 17,948 | | | | 95,420 | |
DCC PLC | | | 663 | | | | 42,482 | |
Hikari Tsushin, Inc.(b) | | | 118 | | | | 25,612 | |
Hitachi Ltd. | | | 31,039 | | | | 760,146 | |
Honeywell International, Inc. | | | 4,568 | | | | 1,031,866 | |
Investment AB Latour–Class B | | | 993 | | | | 24,769 | |
Jardine Matheson Holdings Ltd. | | | 1,070 | | | | 43,799 | |
Keppel Ltd. | | | 9,750 | | | | 48,849 | |
Lifco AB–Class B | | | 1,563 | | | | 45,302 | |
Sekisui Chemical Co., Ltd. | | | 2,529 | | | | 43,302 | |
Siemens AG (REG) | | | 5,093 | | | | 993,108 | |
Smiths Group PLC | | | 2,310 | | | | 49,528 | |
Swire Pacific Ltd.–Class A | | | 2,777 | | | | 25,114 | |
| | | | | | | | |
| | | | | | | 3,723,195 | |
| | | | | | | | |
MACHINERY–1.2% | | | | | | | | |
Alfa Laval AB | | | 1,939 | | | | 81,157 | |
Alstom SA(a) | | | 2,320 | | | | 51,766 | |
Atlas Copco AB–Class A | | | 18,001 | | | | 274,725 | |
Atlas Copco AB–Class B | | | 10,460 | | | | 141,325 | |
Caterpillar, Inc. | | | 3,392 | | | | 1,230,482 | |
9
| | |
| GLOBAL RISK ALLOCATION—MODERATE PORTFOLIO |
| PORTFOLIO OF INVESTMENTS | | |
| |
| (continued) | | AB Variable Products Series Fund |
| | | | | | | | |
| Company | | Shares | | |
U.S. $ Value | |
| | | | | | | | |
Cummins, Inc. | | | 964 | | | $ | 336,050 | |
Daifuku Co., Ltd. | | | 2,161 | | | | 44,398 | |
Daimler Truck Holding AG | | | 3,309 | | | | 126,742 | |
Deere & Co. | | | 1,788 | | | | 757,576 | |
Dover Corp. | | | 964 | | | | 180,846 | |
Epiroc AB–Class A | | | 4,418 | | | | 76,995 | |
Epiroc AB–Class B | | | 2,614 | | | | 40,781 | |
FANUC Corp. | | | 6,330 | | | | 165,358 | |
Fortive Corp. | | | 2,437 | | | | 182,775 | |
GEA Group AG | | | 1,040 | | | | 51,660 | |
Hitachi Construction Machinery Co., Ltd.(b) | | | 720 | | | | 15,958 | |
Hoshizaki Corp. | | | 727 | | | | 28,585 | |
IDEX Corp. | | | 532 | | | | 111,342 | |
Illinois Tool Works, Inc. | | | 1,888 | | | | 478,721 | |
Indutrade AB | | | 1,832 | | | | 45,904 | |
Ingersoll Rand, Inc. | | | 2,831 | | | | 256,092 | |
Knorr-Bremse AG | | | 486 | | | | 35,275 | |
Komatsu Ltd. | | | 5,893 | | | | 160,539 | |
Kone Oyj–Class B | | | 2,278 | | | | 111,053 | |
Kubota Corp. | | | 6,295 | | | | 72,926 | |
Makita Corp. | | | 1,593 | | | | 48,442 | |
Metso Oyj(b) | | | 4,168 | | | | 38,802 | |
MINEBEA MITSUMI, Inc. | | | 2,430 | | | | 38,924 | |
Mitsubishi Heavy Industries Ltd. | | | 21,455 | | | | 299,167 | |
Nordson Corp. | | | 382 | | | | 79,930 | |
PACCAR, Inc. | | | 3,789 | | | | 394,132 | |
Parker-Hannifin Corp. | | | 904 | | | | 574,971 | |
Pentair PLC | | | 1,161 | | | | 116,843 | |
Rational AG | | | 34 | | | | 29,121 | |
Sandvik AB | | | 7,145 | | | | 128,120 | |
Schindler Holding AG | | | 273 | | | | 75,425 | |
Schindler Holding AG (REG) | | | 157 | | | | 42,830 | |
SKF AB–Class B | | | 2,285 | | | | 42,888 | |
SMC Corp. | | | 383 | | | | 148,727 | |
Snap-on, Inc. | | | 369 | | | | 125,268 | |
Spirax Group PLC | | | 493 | | | | 42,172 | |
Stanley Black & Decker, Inc. | | | 1,083 | | | | 86,954 | |
Techtronic Industries Co., Ltd. | | | 9,200 | | | | 120,943 | |
Toyota Industries Corp. | | | 1,081 | | | | 86,940 | |
Trelleborg AB–Class B | | | 1,428 | | | | 48,867 | |
VAT Group AG(c) | | | 181 | | | | 68,439 | |
Volvo AB–Class A | | | 1,342 | | | | 32,800 | |
Volvo AB–Class B | | | 10,646 | | | | 258,721 | |
Wartsila OYJ Abp | | | 3,372 | | | | 59,761 | |
Westinghouse Air Brake Technologies Corp. | | | 1,208 | | | | 229,025 | |
Xylem, Inc./NY | | | 1,707 | | | | 198,046 | |
Yangzijiang Shipbuilding Holdings Ltd. | | | 17,000 | | | | 37,159 | |
| | | | | | | | |
| | | | | | | 8,512,448 | |
| | | | | | | | |
| | | | | | | | |
MARINE TRANSPORTATION–0.1% | | | | | | | | |
AP Moller–Maersk A/S–Class A | | | 20 | | | | 32,177 | |
AP Moller–Maersk A/S–Class B | | | 31 | | | | 51,577 | |
Kawasaki Kisen Kaisha Ltd. | | | 2,531 | | | | 36,008 | |
Kuehne + Nagel International AG (REG) | | | 324 | | | | 74,340 | |
Mitsui OSK Lines Ltd. | | | 2,304 | | | | 80,175 | |
Nippon Yusen KK(b) | | | 2,886 | | | | 96,056 | |
SITC International Holdings Co., Ltd. | | | 8,980 | | | | 23,813 | |
| | | | | | | | |
| | | | | | | 394,146 | |
| | | | | | | | |
PASSENGER AIRLINES–0.1% | | | | | | | | |
ANA Holdings, Inc. | | | 1,069 | | | | 19,402 | |
Delta Air Lines, Inc. | | | 4,504 | | | | 272,492 | |
Deutsche Lufthansa AG (REG) | | | 4,022 | | | | 25,848 | |
Japan Airlines Co., Ltd. | | | 965 | | | | 15,213 | |
Qantas Airways Ltd.(a) | | | 5,137 | | | | 28,438 | |
Singapore Airlines Ltd.(b) | | | 9,966 | | | | 46,984 | |
Southwest Airlines Co.(b) | | | 4,213 | | | | 141,641 | |
United Airlines Holdings, Inc.(a) | | | 2,310 | | | | 224,301 | |
| | | | | | | | |
| | | | | | | 774,319 | |
| | | | | | | | |
PROFESSIONAL SERVICES–0.6% | | | | | | | | |
Adecco Group AG (REG) | | | 1,129 | | | | 27,889 | |
Automatic Data Processing, Inc. | | | 2,862 | | | | 837,793 | |
Broadridge Financial Solutions, Inc. | | | 821 | | | | 185,620 | |
Bureau Veritas SA | | | 2,130 | | | | 64,710 | |
Computershare Ltd. | | | 3,555 | | | | 74,678 | |
Dayforce, Inc.(a)(b) | | | 1,108 | | | | 80,485 | |
Equifax, Inc. | | | 871 | | | | 221,974 | |
Experian PLC | | | 6,163 | | | | 264,885 | |
Intertek Group PLC | | | 1,082 | | | | 63,924 | |
Jacobs Solutions, Inc. | | | 873 | | | | 116,650 | |
Leidos Holdings, Inc. | | | 937 | | | | 134,984 | |
Paychex, Inc. | | | 2,250 | | | | 315,495 | |
Paycom Software, Inc. | | | 342 | | | | 70,100 | |
Randstad NV(b) | | | 728 | | | | 30,651 | |
Recruit Holdings Co., Ltd. | | | 9,440 | | | | 656,155 | |
RELX PLC (London) | | | 12,489 | | | | 565,864 | |
SGS SA (REG) | | | 1,016 | | | | 101,922 | |
Teleperformance SE | | | 366 | | | | 31,393 | |
Verisk Analytics, Inc. | | | 992 | | | | 273,227 | |
Wolters Kluwer NV | | | 1,598 | | | | 265,499 | |
| | | | | | | | |
| | | | | | | 4,383,898 | |
| | | | | | | | |
10
| | |
| |
| | | AB Variable Products Series Fund |
| | | | | | | | |
| Company | | Shares | | |
U.S. $ Value | |
| | | | | | | | |
TRADING COMPANIES & DISTRIBUTORS–0.4% | | | | | | | | |
AddTech AB | | | 1,742 | | | $ | 47,466 | |
AerCap Holdings NV | | | 1,302 | | | | 124,601 | |
Ashtead Group PLC | | | 2,931 | | | | 181,335 | |
Beijer Ref AB | | | 2,580 | | | | 38,076 | |
Brenntag SE | | | 871 | | | | 52,381 | |
Bunzl PLC | | | 2,251 | | | | 92,685 | |
Fastenal Co. | | | 4,025 | | | | 289,438 | |
ITOCHU Corp. | | | 7,957 | | | | 391,280 | |
Marubeni Corp. | | | 9,538 | | | | 143,152 | |
Mitsubishi Corp. | | | 22,381 | | | | 366,192 | |
Mitsui & Co., Ltd. | | | 16,926 | | | | 351,030 | |
MonotaRO Co., Ltd. | | | 1,678 | | | | 28,516 | |
Reece Ltd. | | | 1,516 | | | | 20,943 | |
Rexel SA | | | 1,499 | | | | 38,179 | |
SGH Ltd. | | | 1,364 | | | | 38,802 | |
Sumitomo Corp. | | | 7,259 | | | | 157,093 | |
Toyota Tsusho Corp. | | | 4,266 | | | | 75,442 | |
United Rentals, Inc. | | | 461 | | | | 324,747 | |
WW Grainger, Inc. | | | 311 | | | | 327,809 | |
| | | | | | | | |
| | | | | | | 3,089,167 | |
| | | | | | | | |
TRANSPORTATION INFRASTRUCTURE–0.1% | | | | | | | | |
Aena SME SA | | | 503 | | | | 102,661 | |
Aeroports de Paris SA | | | 232 | | | | 26,862 | |
Auckland International Airport Ltd. | | | 10,146 | | | | 49,387 | |
Getlink SE | | | 2,028 | | | | 32,338 | |
Transurban Group | | | 20,799 | | | | 171,904 | |
| | | | | | | | |
| | | | | | | 383,152 | |
| | | | | | | | |
| | | | | | | 47,522,808 | |
| | | | | | | | |
COMMUNICATION SERVICES–5.3% | | | | | | | | |
DIVERSIFIED TELECOMMUNICATION SERVICES–0.8% | | | | | | | | |
AT&T, Inc. | | | 50,407 | | | | 1,147,767 | |
BT Group PLC(b) | | | 43,361 | | | | 78,157 | |
Cellnex Telecom
SA(a)(b) | | | 3,551 | | | | 112,164 | |
Charter Communications, Inc.–Class A(a) | | | 679 | | | | 232,741 | |
Comcast Corp.–Class A | | | 26,816 | | | | 1,006,405 | |
Deutsche Telekom AG (REG) | | | 23,393 | | | | 700,926 | |
Elisa Oyj | | | 954 | | | | 41,307 | |
HKT Trust & HKT Ltd.–Class SS | | | 25,371 | | | | 31,334 | |
Infrastrutture Wireless Italiane SpA | | | 2,253 | | | | 22,887 | |
Koninklijke KPN NV | | | 26,061 | | | | 95,030 | |
Nippon Telegraph & Telephone Corp. | | | 200,242 | | | | 200,015 | |
Orange SA | | | 12,478 | | | | 124,503 | |
| | | | | | | | |
Singapore Telecommunications Ltd. | | | 49,850 | | | | 112,303 | |
Swisscom AG (REG) | | | 174 | | | | 96,840 | |
Telecom Italia SpA/Milano(a)(b) | | | 66,799 | | | | 17,072 | |
Telefonica SA(b) | | | 26,598 | | | | 108,543 | |
Telenor ASA | | | 4,128 | | | | 46,057 | |
Telia Co. AB | | | 15,816 | | | | 43,960 | |
Telstra Group Ltd. | | | 27,110 | | | | 67,187 | |
Verizon Communications, Inc. | | | 29,573 | | | | 1,182,624 | |
Washington H Soul Pattinson & Co., Ltd.(b) | | | 1,602 | | | | 33,863 | |
| | | | | | | | |
| | | | | | | 5,501,685 | |
| | | | | | | | |
ENTERTAINMENT–0.9% | | | | | | | | |
Bollore SE | | | 4,780 | | | | 29,392 | |
Capcom Co., Ltd. | | | 2,319 | | | | 50,446 | |
CTS Eventim AG & Co. KGaA | | | 418 | | | | 35,336 | |
Electronic Arts, Inc. | | | 1,677 | | | | 245,345 | |
Konami Group Corp. | | | 672 | | | | 62,879 | |
Live Nation Entertainment, Inc.(a) | | | 1,102 | | | | 142,709 | |
Netflix, Inc.(a) | | | 3,003 | | | | 2,676,634 | |
Nexon Co., Ltd. | | | 2,252 | | | | 33,499 | |
Nintendo Co., Ltd. | | | 6,955 | | | | 405,072 | |
Sea Ltd. (ADR)(a) | | | 2,481 | | | | 263,234 | |
Spotify Technology SA(a) | | | 1,027 | | | | 459,459 | |
Take-Two Interactive Software, Inc.(a) | | | 1,147 | | | | 211,140 | |
Toho Co., Ltd./Tokyo | | | 749 | | | | 29,271 | |
Universal Music Group NV(b) | | | 5,516 | | | | 141,094 | |
Walt Disney Co. (The) | | | 12,722 | | | | 1,416,595 | |
Warner Bros Discovery, Inc.(a) | | | 15,683 | | | | 165,769 | |
| | | | | | | | |
| | | | | | | 6,367,874 | |
| | | | | | | | |
INTERACTIVE MEDIA & SERVICES–3.3% | | | | | | | | |
Alphabet, Inc.–Class A | | | 41,047 | | | | 7,770,197 | |
Alphabet, Inc.–Class C | | | 33,434 | | | | 6,367,171 | |
Auto Trader Group PLC | | | 5,999 | | | | 59,359 | |
CAR Group Ltd. | | | 2,531 | | | | 56,325 | |
LY Corp. | | | 19,194 | | | | 50,751 | |
Match Group, Inc.(a) | | | 1,764 | | | | 57,700 | |
Meta Platforms, Inc.–Class A | | | 15,315 | | | | 8,967,086 | |
REA Group Ltd.(b) | | | 354 | | | | 50,928 | |
Scout24 SE | | | 503 | | | | 44,384 | |
SEEK Ltd.(b) | | | 2,392 | | | | 33,287 | |
| | | | | | | | |
| | | | | | | 23,457,188 | |
| | | | | | | | |
MEDIA–0.1% | | | | | | | | |
Dentsu Group, Inc. | | | 1,356 | | | | 32,586 | |
Fox Corp.–Class A | | | 1,554 | | | | 75,493 | |
Fox Corp.–Class B | | | 927 | | | | 42,401 | |
11
| | |
| GLOBAL RISK ALLOCATION—MODERATE PORTFOLIO |
| PORTFOLIO OF INVESTMENTS | | |
| |
| (continued) | | AB Variable Products Series Fund |
| | | | | | | | |
| Company | | Shares | | |
U.S. $ Value | |
| | | | | | | | |
Informa PLC | | | 8,914 | | | $ | 88,905 | |
Interpublic Group of Cos., Inc. (The) | | | 2,617 | | | | 73,328 | |
News Corp.–Class A | | | 2,662 | | | | 73,311 | |
News Corp.–Class B(b) | | | 787 | | | | 23,948 | |
Omnicom Group, Inc. | | | 1,382 | | | | 118,907 | |
Paramount Global–Class B | | | 4,180 | | | | 43,723 | |
Publicis Groupe SA | | | 1,534 | | | | 163,309 | |
WPP PLC | | | 7,230 | | | | 74,526 | |
| | | | | | | | |
| | | | | | | 810,437 | |
| | | | | | | | |
WIRELESS TELECOMMUNICATION SERVICES–0.2% | | | | | | | | |
KDDI Corp. | | | 10,271 | | | | 327,138 | |
SoftBank Corp. | | | 191,670 | | | | 241,952 | |
SoftBank Group Corp. | | | 6,388 | | | | 365,047 | |
T-Mobile US, Inc. | | | 3,424 | | | | 755,780 | |
Tele2 AB–Class B | | | 3,664 | | | | 36,180 | |
Vodafone Group PLC | | | 148,889 | | | | 127,014 | |
| | | | | | | | |
| | | | | | | 1,853,111 | |
| | | | | | | | |
| | | | | | | 37,990,295 | |
| | | | | | | | |
CONSUMER STAPLES–4.0% | | | | | | | | |
BEVERAGES–0.8% | | | | | | | | |
Anheuser-Busch InBev SA/NV | | | 6,022 | | | | 301,485 | |
Asahi Group Holdings Ltd. | | | 9,672 | | | | 101,466 | |
Brown-Forman Corp.–Class B | | | 1,279 | | | | 48,576 | |
Carlsberg AS–Class B | | | 640 | | | | 61,467 | |
Coca-Cola Co. (The) | | | 27,236 | | | | 1,695,713 | |
Coca-Cola Europacific Partners PLC | | | 1,388 | | | | 106,612 | |
Coca-Cola HBC AG–Class DI | | | 1,456 | | | | 49,740 | |
Constellation Brands, Inc.–Class A | | | 1,097 | | | | 242,437 | |
Davide Campari-Milano NV(b) | | | 4,127 | | | | 25,829 | |
Diageo PLC | | | 14,913 | | | | 473,903 | |
Heineken Holding NV | | | 869 | | | | 52,101 | |
Heineken NV(b) | | | 1,930 | | | | 137,549 | |
Keurig Dr Pepper, Inc. | | | 7,909 | | | | 254,037 | |
Kirin Holdings Co., Ltd. | | | 5,200 | | | | 67,517 | |
Molson Coors Beverage Co.–Class B | | | 1,227 | | | | 70,332 | |
Monster Beverage Corp.(a) | | | 4,919 | | | | 258,543 | |
PepsiCo, Inc. | | | 9,638 | | | | 1,465,554 | |
Pernod Ricard SA | | | 1,358 | | | | 153,436 | |
Suntory Beverage & Food Ltd. | | | 930 | | | | 29,548 | |
Treasury Wine Estates Ltd. | | | 5,440 | | | | 38,106 | |
| | | | | | | | |
| | | | | | | 5,633,951 | |
| | | | | | | | |
| | | | | | | | |
CONSUMER STAPLES DISTRIBUTION & RETAIL–1.2% | | | | | | | | |
Aeon Co., Ltd. | | | 4,377 | | | | 102,437 | |
Carrefour SA | | | 3,636 | | | | 51,750 | |
Coles Group Ltd.(b) | | | 8,982 | | | | 104,852 | |
Costco Wholesale Corp. | | | 3,113 | | | | 2,852,349 | |
Dollar General Corp. | | | 1,545 | | | | 117,142 | |
Dollar Tree, Inc.(a)(b) | | | 1,420 | | | | 106,415 | |
Endeavour Group Ltd./Australia(b) | | | 10,206 | | | | 26,477 | |
J Sainsbury PLC | | | 11,852 | | | | 40,500 | |
Jeronimo Martins SGPS SA | | | 1,898 | | | | 36,273 | |
Kesko Oyj–Class B(b) | | | 1,831 | | | | 34,546 | |
Kobe Bussan Co., Ltd. | | | 1,007 | | | | 22,013 | |
Koninklijke Ahold Delhaize NV | | | 6,228 | | | | 203,151 | |
Kroger Co. (The) | | | 4,676 | | | | 285,937 | |
Marks & Spencer Group PLC | | | 13,749 | | | | 64,389 | |
MatsukiyoCocokara & Co. | | | 2,197 | | | | 31,986 | |
Seven & i Holdings Co., Ltd. | | | 14,820 | | | | 232,342 | |
Sysco Corp. | | | 3,451 | | | | 263,863 | |
Target Corp. | | | 3,236 | | | | 437,442 | |
Tesco PLC | | | 45,920 | | | | 211,202 | |
Walgreens Boots Alliance, Inc. | | | 5,042 | | | | 47,042 | |
Walmart, Inc. | | | 30,493 | | | | 2,755,043 | |
Woolworths Group Ltd. | | | 8,187 | | | | 154,330 | |
| | | | | | | | |
| | | | | | | 8,181,481 | |
| | | | | | | | |
FOOD PRODUCTS–0.7% | | | | | | | | |
Ajinomoto Co., Inc. | | | 3,107 | | | | 126,489 | |
Archer-Daniels-Midland Co. | | | 3,359 | | | | 169,697 | |
Associated British Foods PLC | | | 2,238 | | | | 57,088 | |
Barry Callebaut AG (REG) | | | 24 | | | | 31,955 | |
Bunge Global SA | | | 981 | | | | 76,283 | |
Chocoladefabriken Lindt & Spruengli AG | | | 7 | | | | 77,650 | |
Chocoladefabriken Lindt & Spruengli AG (REG) | | | 1 | | | | 109,894 | |
Conagra Brands, Inc. | | | 3,353 | | | | 93,046 | |
Danone SA | | | 4,327 | | | | 292,417 | |
General Mills, Inc. | | | 3,900 | | | | 248,703 | |
Hershey Co. (The) | | | 1,038 | | | | 175,785 | |
Hormel Foods Corp. | | | 2,042 | | | | 64,057 | |
J M Smucker Co. (The) | | | 748 | | | | 82,370 | |
JDE Peet’s NV | | | 817 | | | | 14,037 | |
Kellanova | | | 1,889 | | | | 152,952 | |
Kerry Group PLC–Class A | | | 1,026 | | | | 98,954 | |
Kikkoman Corp. | | | 4,542 | | | | 50,435 | |
Kraft Heinz Co. (The) | | | 6,201 | | | | 190,433 | |
12
| | |
| |
| | | AB Variable Products Series Fund |
| | | | | | | | |
| Company | | Shares | | |
U.S. $ Value | |
| | | | | | | | |
Lamb Weston Holdings, Inc. | | | 1,002 | | | $ | 66,964 | |
Lotus Bakeries NV | | | 3 | | | | 33,579 | |
McCormick & Co., Inc./MD (Non-Voting) | | | 1,772 | | | | 135,097 | |
MEIJI Holdings Co., Ltd. | | | 1,571 | | | | 31,960 | |
Mondelez International, Inc.–Class A | | | 9,394 | | | | 561,104 | |
Mowi ASA | | | 3,120 | | | | 53,471 | |
Nestle SA (REG) | | | 17,558 | | | | 1,440,514 | |
Nissin Foods Holdings Co., Ltd. | | | 1,342 | | | | 32,421 | |
Orkla ASA | | | 4,699 | | | | 40,652 | |
Salmar ASA | | | 443 | | | | 21,055 | |
The Campbell’s Company | | | 1,380 | | | | 57,794 | |
Tyson Foods, Inc.–Class A | | | 2,008 | | | | 115,339 | |
WH Group Ltd. | | | 55,829 | | | | 43,024 | |
Wilmar International Ltd. | | | 12,860 | | | | 29,189 | |
Yakult Honsha Co., Ltd. | | | 1,717 | | | | 32,524 | |
| | | | | | | | |
| | | | | | | 4,806,932 | |
| | | | | | | | |
HOUSEHOLD PRODUCTS–0.6% | | | | | | | | |
Church & Dwight Co., Inc. | | | 1,721 | | | | 180,206 | |
Clorox Co. (The) | | | 870 | | | | 141,297 | |
Colgate-Palmolive Co. | | | 5,740 | | | | 521,823 | |
Essity AB–Class B | | | 4,087 | | | | 109,232 | |
Henkel AG & Co. KGaA | | | 697 | | | | 53,716 | |
Henkel AG & Co. KGaA (Preference Shares) | | | 1,134 | | | | 99,493 | |
Kimberly-Clark Corp. | | | 2,343 | | | | 307,027 | |
Procter & Gamble Co. (The) | | | 16,544 | | | | 2,773,601 | |
Reckitt Benckiser Group PLC | | | 4,633 | | | | 280,439 | |
Unicharm Corp. | | | 7,503 | | | | 61,855 | |
| | | | | | | | |
| | | | | | | 4,528,689 | |
| | | | | | | | |
PERSONAL CARE PRODUCTS–0.3% | | | | | | | | |
Beiersdorf AG | | | 665 | | | | 85,416 | |
Estee Lauder Cos., Inc. (The)–Class A | | | 1,640 | | | | 122,967 | |
Haleon PLC | | | 51,573 | | | | 243,175 | |
Kao Corp. | | | 3,118 | | | | 126,159 | |
Kenvue, Inc. | | | 13,469 | | | | 287,563 | |
L’Oreal SA | | | 1,610 | | | | 569,945 | |
Shiseido Co., Ltd. | | | 2,677 | | | | 47,338 | |
Unilever PLC (London) | | | 16,637 | | | | 945,324 | |
| | | | | | | | |
| | | | | | | 2,427,887 | |
| | | | | | | | |
TOBACCO–0.4% | | | | | | | | |
Altria Group, Inc. | | | 11,906 | | | | 622,565 | |
British American Tobacco PLC | | | 13,353 | | | | 481,839 | |
Imperial Brands PLC | | | 5,376 | | | | 171,918 | |
Japan Tobacco, Inc. | | | 8,033 | | | | 206,069 | |
| | | | | | | | |
Philip Morris International, Inc. | | | 10,923 | | | | 1,314,583 | |
| | | | | | | | |
| | | | | | | 2,796,974 | |
| | | | | | | | |
| | | | | | | 28,375,914 | |
| | | | | | | | |
ENERGY–2.1% | | | | | | | | |
ENERGY EQUIPMENT & SERVICES–0.1% | | | | | | | | |
Baker Hughes Co. | | | 6,952 | | | | 285,171 | |
Halliburton Co. | | | 6,172 | | | | 167,817 | |
Schlumberger NV | | | 9,921 | | | | 380,371 | |
Tenaris SA | | | 2,728 | | | | 51,500 | |
| | | | | | | | |
| | | | | | | 884,859 | |
| | | | | | | | |
OIL, GAS & CONSUMABLE FUELS–2.0% | | | | | | | | |
Aker BP ASA | | | 2,118 | | | | 41,637 | |
APA Corp.(b) | | | 2,599 | | | | 60,011 | |
BP PLC | | | 108,404 | | | | 535,837 | |
Chevron Corp. | | | 11,741 | | | | 1,700,566 | |
ConocoPhillips | | | 9,087 | | | | 901,158 | |
Coterra Energy, Inc. | | | 5,175 | | | | 132,169 | |
Devon Energy Corp. | | | 4,615 | | | | 151,049 | |
Diamondback Energy, Inc. | | | 1,313 | | | | 215,109 | |
ENEOS Holdings, Inc. | | | 18,288 | | | | 95,942 | |
Eni SpA | | | 15,408 | | | | 210,756 | |
EOG Resources, Inc. | | | 3,951 | | | | 484,314 | |
EQT Corp. | | | 4,192 | | | | 193,293 | |
Equinor ASA | | | 5,615 | | | | 133,182 | |
Exxon Mobil Corp. | | | 30,876 | | | | 3,321,331 | |
Galp Energia SGPS SA | | | 3,116 | | | | 51,647 | |
Hess Corp. | | | 1,942 | | | | 258,305 | |
Idemitsu Kosan Co., Ltd. | | | 6,026 | | | | 39,693 | |
Inpex Corp. | | | 5,921 | | | | 74,495 | |
Kinder Morgan, Inc. | | | 13,578 | | | | 372,037 | |
Marathon Petroleum Corp. | | | 2,258 | | | | 314,991 | |
Neste Oyj(b) | | | 2,836 | | | | 35,890 | |
Occidental Petroleum Corp. | | | 4,746 | | | | 234,500 | |
OMV AG | | | 987 | | | | 38,278 | |
ONEOK, Inc. | | | 4,104 | | | | 412,042 | |
Phillips 66 | | | 2,901 | | | | 330,511 | |
Repsol SA | | | 7,890 | | | | 96,005 | |
Santos Ltd. | | | 21,764 | | | | 90,123 | |
Shell PLC | | | 41,577 | | | | 1,295,996 | |
Targa Resources Corp. | | | 1,532 | | | | 273,462 | |
Texas Pacific Land Corp. | | | 132 | | | | 145,987 | |
TotalEnergies SE | | | 14,462 | | | | 805,748 | |
Valero Energy Corp. | | | 2,224 | | | | 272,640 | |
Williams Cos., Inc. (The) | | | 8,564 | | | | 463,484 | |
Woodside Energy Group Ltd.(b) | | | 12,725 | | | | 197,046 | |
| | | | | | | | |
| | | | | | | 13,979,234 | |
| | | | | | | | |
| | | | | | | 14,864,093 | |
| | | | | | | | |
13
| | |
| GLOBAL RISK ALLOCATION—MODERATE PORTFOLIO |
| PORTFOLIO OF INVESTMENTS | | |
| |
| (continued) | | AB Variable Products Series Fund |
| | | | | | | | |
| Company | | Shares | | |
U.S. $ Value | |
| | | | | | | | |
MATERIALS–1.9% | | | | | | | | |
CHEMICALS–1.0% | | | | | | | | |
Air Liquide SA | | | 3,875 | | | $ | 629,919 | |
Air Products and Chemicals, Inc. | | | 1,562 | | | | 453,042 | |
Akzo Nobel NV(b) | | | 1,145 | | | | 68,726 | |
Albemarle Corp. | | | 826 | | | | 71,102 | |
Arkema SA | | | 377 | | | | 28,687 | |
Asahi Kasei Corp. | | | 8,398 | | | | 57,864 | |
BASF SE | | | 5,982 | | | | 262,317 | |
Celanese Corp. | | | 768 | | | | 53,153 | |
CF Industries Holdings, Inc. | | | 1,223 | | | | 104,346 | |
Clariant AG (REG) | | | 1,446 | | | | 16,139 | |
Corteva, Inc. | | | 4,828 | | | | 275,003 | |
Covestro AG(a) | | | 1,204 | | | | 72,335 | |
Croda International PLC | | | 889 | | | | 37,602 | |
Dow, Inc. | | | 4,918 | | | | 197,359 | |
DSM-Firmenich AG | | | 1,246 | | | | 125,951 | |
DuPont de Nemours, Inc. | | | 2,936 | | | | 223,870 | |
Eastman Chemical Co. | | | 814 | | | | 74,334 | |
Ecolab, Inc. | | | 1,770 | | | | 414,746 | |
EMS-Chemie Holding AG (REG) | | | 47 | | | | 31,714 | |
Evonik Industries AG | | | 1,718 | | | | 29,862 | |
FMC Corp. | | | 877 | | | | 42,631 | |
Givaudan SA (REG) | | | 62 | | | | 271,026 | |
ICL Group Ltd. | | | 5,190 | | | | 25,633 | |
IMCD NV(b) | | | 382 | | | | 56,769 | |
International Flavors & Fragrances, Inc. | | | 1,805 | | | | 152,613 | |
Linde PLC | | | 3,345 | | | | 1,400,451 | |
LyondellBasell Industries NV–Class A | | | 1,825 | | | | 135,543 | |
Mitsubishi Chemical Group Corp. | | | 9,075 | | | | 45,834 | |
Mitsui Chemicals, Inc. | | | 1,142 | | | | 24,929 | |
Mosaic Co. (The) | | | 2,232 | | | | 54,863 | |
Nippon Paint Holdings Co., Ltd. | | | 6,347 | | | | 40,979 | |
Nippon Sanso Holdings Corp. | | | 1,159 | | | | 32,160 | |
Nitto Denko Corp. | | | 4,730 | | | | 79,080 | |
Novonesis (Novozymes) B | | | 2,361 | | | | 133,790 | |
Orica Ltd. | | | 3,316 | | | | 33,994 | |
PPG Industries, Inc. | | | 1,630 | | | | 194,704 | |
Sherwin-Williams Co. (The) | | | 1,628 | | | | 553,406 | |
Shin-Etsu Chemical Co., Ltd. | | | 12,060 | | | | 397,222 | |
Sika AG (REG) | | | 1,022 | | | | 243,856 | |
Syensqo SA(b) | | | 497 | | | | 36,296 | |
Symrise AG | | | 890 | | | | 94,939 | |
Toray Industries, Inc. | | | 9,283 | | | | 58,779 | |
Yara International ASA | | | 1,110 | | | | 29,384 | |
| | | | | | | | |
| | | | | | | 7,366,952 | |
| | | | | | | | |
| | | | | | | | |
CONSTRUCTION MATERIALS–0.2% | | | | | | | | |
Heidelberg Materials AG | | | 915 | | | | 113,060 | |
Holcim AG | | | 3,493 | | | | 336,323 | |
James Hardie Industries PLC(a) | | | 2,878 | | | | 88,702 | |
Martin Marietta Materials, Inc. | | | 429 | | | | 221,579 | |
Vulcan Materials Co. | | | 928 | | | | 238,710 | |
| | | | | | | | |
| | | | | | | 998,374 | |
| | | | | | | | |
CONTAINERS & PACKAGING–0.1% | | | | | | | | |
Amcor PLC | | | 10,154 | | | | 95,549 | |
Avery Dennison Corp. | | | 564 | | | | 105,541 | |
Ball Corp. | | | 2,097 | | | | 115,608 | |
International Paper Co. | | | 2,441 | | | | 131,375 | |
Packaging Corp. of America | | | 630 | | | | 141,832 | |
SIG Group AG | | | 2,050 | | | | 40,534 | |
Smurfit WestRock PLC | | | 3,471 | | | | 186,948 | |
| | | | | | | | |
| | | | | | | 817,387 | |
| | | | | | | | |
METALS & MINING–0.5% | | | | | | | | |
Anglo American PLC | | | 8,516 | | | | 251,794 | |
Antofagasta PLC | | | 2,644 | | | | 52,376 | |
ArcelorMittal SA | | | 3,144 | | | | 73,049 | |
BHP Group Ltd. | | | 34,005 | | | | 829,544 | |
BlueScope Steel Ltd. | | | 2,941 | | | | 34,007 | |
Boliden AB | | | 1,834 | | | | 51,599 | |
Endeavour Mining PLC | | | 1,228 | | | | 21,935 | |
Fortescue Ltd. | | | 11,348 | | | | 127,785 | |
Freeport-McMoRan, Inc. | | | 10,095 | | | | 384,418 | |
Glencore PLC(a) | | | 69,502 | | | | 306,099 | |
JFE Holdings, Inc. | | | 3,852 | | | | 43,374 | |
Mineral Resources Ltd. | | | 1,186 | | | | 25,030 | |
Newmont Corp. (New York) | | | 7,998 | | | | 297,686 | |
Nippon Steel Corp. | | | 6,096 | | | | 122,503 | |
Norsk Hydro ASA | | | 9,427 | | | | 51,855 | |
Northern Star Resources Ltd. | | | 7,704 | | | | 73,197 | |
Nucor Corp. | | | 1,650 | | | | 192,571 | |
Rio Tinto Ltd.(b) | | | 2,488 | | | | 180,412 | |
Rio Tinto PLC | | | 7,557 | | | | 446,090 | |
South32 Ltd. | | | 30,356 | | | | 63,674 | |
Steel Dynamics, Inc. | | | 995 | | | | 113,500 | |
Sumitomo Metal Mining Co., Ltd.(b) | | | 1,654 | | | | 37,709 | |
| | | | | | | | |
| | | | | | | 3,780,207 | |
| | | | | | | | |
PAPER & FOREST PRODUCTS–0.1% | | | | | | | | |
Holmen AB–Class B | | | 511 | | | | 18,744 | |
Mondi PLC | | | 2,959 | | | | 44,053 | |
Stora Enso Oyj–Class R(b) | | | 3,902 | | | | 39,270 | |
Svenska Cellulosa AB SCA–Class B | | | 4,066 | | | | 51,571 | |
14
| | |
| |
| | | AB Variable Products Series Fund |
| | | | | | | | |
| Company | | Shares | | |
U.S. $ Value | |
| | | | | | | | |
UPM-Kymmene Oyj(b) | | | 3,577 | | | $ | 98,366 | |
| | | | | | | | |
| | | | | | | 252,004 | |
| | | | | | | | |
| | | | | | | 13,214,924 | |
| | | | | | | | |
UTILITIES–1.6% | | | | | | | | |
ELECTRIC UTILITIES–1.0% | | | | | | | | |
Acciona SA(b) | | | 165 | | | | 18,568 | |
Alliant Energy Corp. | | | 1,803 | | | | 106,629 | |
American Electric Power Co., Inc. | | | 3,741 | | | | 345,032 | |
BKW AG | | | 142 | | | | 23,527 | |
Chubu Electric Power Co., Inc. | | | 4,313 | | | | 45,248 | |
CK Infrastructure Holdings Ltd. | | | 4,216 | | | | 31,297 | |
CLP Holdings Ltd. | | | 10,993 | | | | 92,202 | |
Constellation Energy Corp. | | | 2,197 | | | | 491,491 | |
Duke Energy Corp. | | | 5,427 | | | | 584,705 | |
Edison International | | | 2,720 | | | | 217,165 | |
EDP SA | | | 21,035 | | | | 67,291 | |
Elia Group SA/NV(b) | | | 197 | | | | 15,158 | |
Endesa SA | | | 2,129 | | | | 45,783 | |
Enel SpA | | | 54,508 | | | | 388,978 | |
Entergy Corp. | | | 3,012 | | | | 228,370 | |
Evergy, Inc. | | | 1,616 | | | | 99,465 | |
Eversource Energy | | | 2,574 | | | | 147,825 | |
Exelon Corp. | | | 7,059 | | | | 265,701 | |
FirstEnergy Corp. | | | 3,603 | | | | 143,327 | |
Fortum Oyj(b) | | | 3,008 | | | | 42,111 | |
Iberdrola SA | | | 40,525 | | | | 558,443 | |
Kansai Electric Power Co., Inc. (The)(b) | | | 4,713 | | | | 52,238 | |
Mercury NZ Ltd. | | | 4,691 | | | | 15,349 | |
NextEra Energy, Inc. | | | 14,447 | | | | 1,035,705 | |
NRG Energy, Inc. | | | 1,423 | | | | 128,383 | |
Origin Energy Ltd. | | | 11,544 | | | | 77,761 | |
PG&E Corp. | | | 15,358 | | | | 309,924 | |
Pinnacle West Capital Corp. | | | 799 | | | | 67,731 | |
Power Assets Holdings Ltd. | | | 9,273 | | | | 64,581 | |
PPL Corp. | | | 5,184 | | | | 168,273 | |
Redeia Corp. SA | | | 2,720 | | | | 46,448 | |
Southern Co. (The) | | | 7,697 | | | | 633,617 | |
SSE PLC | | | 7,400 | | | | 148,329 | |
Terna–Rete Elettrica Nazionale(b) | | | 9,431 | | | | 74,522 | |
Tokyo Electric Power Co. Holdings, Inc.(a) | | | 10,220 | | | | 30,549 | |
Verbund AG | | | 456 | | | | 33,064 | |
Xcel Energy, Inc. | | | 4,034 | | | | 272,376 | |
| | | | | | | | |
| | | | | | | 7,117,166 | |
| | | | | | | | |
GAS UTILITIES–0.1% | | | | | | | | |
APA Group | | | 8,681 | | | | 37,373 | |
Atmos Energy Corp. | | | 1,091 | | | | 151,943 | |
Hong Kong & China Gas Co., Ltd. | | | 74,951 | | | | 59,720 | |
Osaka Gas Co., Ltd. | | | 2,469 | | | | 54,001 | |
| | | | | | | | |
Snam SpA(b) | | | 13,518 | | | | 59,922 | |
Tokyo Gas Co., Ltd. | | | 2,312 | | | | 64,058 | |
| | | | | | | | |
| | | | | | | 427,017 | |
| | | | | | | | |
INDEPENDENT POWER AND RENEWABLE ELECTRICITY PRODUCERS–0.1% | | | | | | | | |
AES Corp. (The) | | | 4,995 | | | | 64,286 | |
EDP Renovaveis SA(b) | | | 2,091 | | | | 21,718 | |
Meridian Energy Ltd. | | | 8,738 | | | | 28,893 | |
Orsted AS(a) | | | 1,127 | | | | 50,888 | |
RWE AG | | | 4,237 | | | | 126,532 | |
Vistra Corp. | | | 2,394 | | | | 330,061 | |
| | | | | | | | |
| | | | | | | 622,378 | |
| | | | | | | | |
MULTI-UTILITIES–0.4% | | | | | | | | |
Ameren Corp. | | | 1,875 | | | | 167,138 | |
CenterPoint Energy, Inc. | | | 4,578 | | | | 145,260 | |
Centrica PLC | | | 34,568 | | | | 57,672 | |
CMS Energy Corp. | | | 2,099 | | | | 139,898 | |
Consolidated Edison, Inc. | | | 2,434 | | | | 217,186 | |
Dominion Energy, Inc. | | | 5,901 | | | | 317,828 | |
DTE Energy Co. | | | 1,455 | | | | 175,691 | |
E.ON SE | | | 15,046 | | | | 175,257 | |
Engie SA | | | 12,240 | | | | 194,119 | |
National Grid PLC | | | 32,745 | | | | 389,019 | |
NiSource, Inc. | | | 3,279 | | | | 120,536 | |
Public Service Enterprise Group, Inc. | | | 3,500 | | | | 295,715 | |
Sembcorp Industries Ltd. | | | 5,983 | | | | 24,204 | |
Sempra | | | 4,450 | | | | 390,354 | |
Veolia Environnement SA | | | 4,715 | | | | 132,291 | |
WEC Energy Group, Inc.(b) | | | 2,222 | | | | 208,957 | |
| | | | | | | | |
| | | | | | | 3,151,125 | |
| | | | | | | | |
WATER UTILITIES–0.0% | | | | | | | | |
American Water Works Co., Inc. | | | 1,369 | | | | 170,427 | |
Severn Trent PLC | | | 1,811 | | | | 56,779 | |
United Utilities Group PLC | | | 4,571 | | | | 60,130 | |
| | | | | | | | |
| | | | | | | 287,336 | |
| | | | | | | | |
| | | | | | | 11,605,022 | |
| | | | | | | | |
REAL ESTATE–1.3% | | | | | | | | |
DIVERSIFIED REITs–0.0% | | | | | | | | |
Covivio SA/France | | | 374 | | | | 18,956 | |
GPT Group (The) | | | 12,841 | | | | 34,592 | |
Land Securities Group PLC | | | 4,744 | | | | 34,645 | |
Mirvac Group(b) | | | 26,452 | | | | 30,592 | |
Stockland | | | 16,003 | | | | 47,466 | |
| | | | | | | | |
| | | | | | | 166,251 | |
| | | | | | | | |
HEALTH CARE REITs–0.1% | | | | | | | | |
Alexandria Real Estate Equities, Inc. | | | 1,093 | | | | 106,622 | |
15
| | |
| GLOBAL RISK ALLOCATION—MODERATE PORTFOLIO |
| PORTFOLIO OF INVESTMENTS | | |
| |
| (continued) | | AB Variable Products Series Fund |
| | | | | | | | |
| Company | | Shares | | |
U.S. $ Value | |
| | | | | | | | |
Healthpeak Properties, Inc. | | | 4,914 | | | $ | 99,607 | |
Ventas, Inc. | | | 2,947 | | | | 173,549 | |
Welltower, Inc. | | | 4,156 | | | | 523,780 | |
| | | | | | | | |
| | | | | | | 903,558 | |
| | | | | | | | |
HOTEL & RESORT REITs–0.0% | | | | | | | | |
Host Hotels & Resorts, Inc. | | | 4,911 | | | | 86,041 | |
| | | | | | | | |
INDUSTRIAL REITs–0.2% | | | | | | | | |
CapitaLand Ascendas REIT | | | 25,020 | | | | 46,987 | |
Goodman Group | | | 11,530 | | | | 253,452 | |
Prologis, Inc. | | | 6,506 | | | | 687,684 | |
Segro PLC(b) | | | 8,612 | | | | 75,536 | |
Warehouses De Pauw CVA(b) | | | 1,210 | | | | 23,787 | |
| | | | | | | | |
| | | | | | | 1,087,446 | |
| | | | | | | | |
OFFICE REITS–0.0% | | | | | | | | |
BXP, Inc. | | | 1,022 | | | | 75,996 | |
Gecina SA | | | 308 | | | | 28,855 | |
Japan Real Estate Investment Corp. | | | 45 | | | | 30,877 | |
Nippon Building Fund, Inc.(b) | | | 51 | | | | 39,674 | |
| | | | | | | | |
| | | | | | | 175,402 | |
| | | | | | | | |
REAL ESTATE MANAGEMENT & DEVELOPMENT–0.2% | | | | | | | | |
Azrieli Group Ltd. | | | 285 | | | | 23,522 | |
CapitaLand Investment Ltd./Singapore | | | 15,674 | | | | 30,048 | |
CBRE Group, Inc.–Class A(a) | | | 2,113 | | | | 277,416 | |
CK Asset Holdings Ltd. | | | 12,887 | | | | 52,597 | |
CoStar Group, Inc.(a) | | | 2,880 | | | | 206,179 | |
Daito Trust Construction Co., Ltd. | | | 392 | | | | 43,823 | |
Daiwa House Industry Co., Ltd. | | | 3,951 | | | | 121,300 | |
Fastighets AB Balder–Class B(a) | | | 4,443 | | | | 30,922 | |
Henderson Land Development Co., Ltd. | | | 9,723 | | | | 29,475 | |
Hongkong Land Holdings Ltd. | | | 7,386 | | | | 32,889 | |
Hulic Co., Ltd. | | | 2,570 | | | | 22,322 | |
LEG Immobilien SE | | | 499 | | | | 42,324 | |
Mitsubishi Estate Co., Ltd. | | | 7,259 | | | | 100,768 | |
Mitsui Fudosan Co., Ltd. | | | 17,875 | | | | 142,952 | |
Sagax AB–Class B | | | 1,473 | | | | 30,229 | |
Sino Land Co., Ltd. | | | 26,057 | | | | 26,293 | |
Sumitomo Realty & Development Co., Ltd. | | | 2,112 | | | | 65,681 | |
| | | | | | | | |
Sun Hung Kai Properties Ltd. | | | 9,699 | | | | 92,289 | |
Swiss Prime Site AG (REG) | | | 518 | | | | 56,459 | |
Unibail-Rodamco-Westfield(a) | | | 794 | | | | 59,800 | |
Vonovia SE | | | 4,963 | | | | 151,088 | |
Wharf Holdings Ltd. (The) | | | 7,160 | | | | 20,090 | |
Wharf Real Estate Investment Co., Ltd. | | | 11,179 | | | | 28,434 | |
| | | | | | | | |
| | | | | | | 1,686,900 | |
| | | | | | | | |
RESIDENTIAL REITs–0.1% | | | | | | | | |
AvalonBay Communities, Inc. | | | 998 | | | | 219,530 | |
Camden Property Trust | | | 749 | | | | 86,914 | |
Equity Residential | | | 2,399 | | | | 172,152 | |
Essex Property Trust, Inc. | | | 451 | | | | 128,733 | |
Invitation Homes, Inc. | | | 4,002 | | | | 127,944 | |
Mid-America Apartment Communities, Inc. | | | 821 | | | | 126,902 | |
UDR, Inc. | | | 2,109 | | | | 91,552 | |
| | | | | | | | |
| | | | | | | 953,727 | |
| | | | | | | | |
RETAIL REITs–0.2% | | | | | | | | |
CapitaLand Integrated Commercial Trust | | | 39,468 | | | | 55,658 | |
Federal Realty Investment Trust | | | 537 | | | | 60,117 | |
Kimco Realty Corp. | | | 4,736 | | | | 110,964 | |
Klepierre SA | | | 1,442 | | | | 41,529 | |
Link REIT | | | 17,296 | | | | 72,738 | |
Realty Income Corp. | | | 6,148 | | | | 328,365 | |
Regency Centers Corp. | | | 1,148 | | | | 84,872 | |
Scentre Group | | | 34,869 | | | | 73,812 | |
Simon Property Group, Inc. | | | 2,155 | | | | 371,113 | |
Vicinity Ltd. | | | 25,940 | | | | 33,619 | |
| | | | | | | | |
| | | | | | | 1,232,787 | |
| | | | | | | | |
SPECIALIZED REITs–0.5% | | | | | | | | |
American Tower Corp. | | | 3,283 | | | | 602,135 | |
Crown Castle, Inc. | | | 3,053 | | | | 277,090 | |
Digital Realty Trust, Inc. | | | 2,191 | | | | 388,530 | |
Equinix, Inc. | | | 678 | | | | 639,280 | |
Extra Space Storage, Inc. | | | 1,489 | | | | 222,754 | |
Iron Mountain, Inc. | | | 2,062 | | | | 216,737 | |
Public Storage | | | 1,107 | | | | 331,480 | |
SBA Communications Corp. | | | 755 | | | | 153,869 | |
VICI Properties, Inc. | | | 7,406 | | | | 216,329 | |
Weyerhaeuser Co. | | | 5,104 | | | | 143,678 | |
| | | | | | | | |
| | | | | | | 3,191,882 | |
| | | | | | | | |
| | | | | | | 9,483,994 | |
| | | | | | | | |
Total Common Stocks
(cost $357,683,865) | | | | | | | 457,379,723 | |
| | | | | | | | |
16
| | |
| |
| | | AB Variable Products Series Fund |
| | | | | | | | | | | | |
Company | | | | | Principal
Amount
(000) | | | U.S. $ Value | |
| | | | | | | | | | | | |
GOVERNMENTS–TREASURIES–2.7% | | | | | | | | | | | | |
JAPAN–2.7% | | | | | | | | | | | | |
Japan Government Ten Year Bond
Series 374
0.80%, 03/20/2034 | | | JPY | | | | 1,260,000 | | | $ | 7,855,971 | |
Japan Government Twenty Year Bond
Series 188
1.60%, 03/20/2044 | | | | | | | 1,367,000 | | | | 8,353,083 | |
Japan Government Thirty Year Bond
Series 82
1.80%, 03/20/2054 | | | | | | | 504,000 | | | | 2,908,847 | |
| | | | | | | | | | | | |
Total Governments–Treasuries
(cost $19,487,808) | | | | | | | | | | | 19,117,901 | |
| | | | | | | | | | | | |
| | | | | | Notional
Amount | | | | |
PURCHASED OPTIONS–PUTS–0.1% | | | | | | | | | | | | |
OPTIONS ON INDICES–0.1% | | | | | | | | | | | | |
Euro STOXX 50 Index
Expiration: Jan 2025; Contracts: 340;
Exercise Price: EUR 4,725.00;
Counterparty: Morgan Stanley & Co., Inc.(a) | | | EUR | | | | 16,065,000 | | | | 69,910 | |
FTSE 100 Index
Expiration: Jan 2025; Contracts: 59;
Exercise Price: GBP 7,850.00;
Counterparty: Morgan Stanley & Co., Inc.(a) | | | GBP | | | | 4,631,500 | | | | 7,940 | |
Nikkei 225 Index
Expiration: Jan 2025; Contracts: 46;
Exercise Price: JPY 38,875.00;
Counterparty: Morgan Stanley & Co., Inc.(a) | | | JPY | | | | 1,788,250,000 | | | | 39,467 | |
| | | | | | | | | | | | |
S&P 500 Index
Expiration: Jan 2025; Contracts: 190;
Exercise Price: USD 5,720.00;
Counterparty: Morgan Stanley & Co., Inc.(a) | | | USD | | | | 108,680,000 | | | | 381,900 | |
| | | | | | | | | | | | |
Total Purchased Options–Puts
(premiums paid $1,047,455) | | | | | | | | | | | 499,217 | |
| | | | | | | | | | | | |
| | | | | | Shares | | | | |
SHORT-TERM
INVESTMENTS–31.3% | | | | | | | | | | | | |
INVESTMENT COMPANIES–31.3% | | | | | | | | | | | | |
AB Fixed Income Shares, Inc.–Government Money Market Portfolio–Class AB, 4.43%(d)(e)(f)
(cost $223,884,798) | | | | | | | 223,884,798 | | | | 223,884,798 | |
| | | | | | | | | | | | |
TOTAL INVESTMENTS BEFORE SECURITY LENDING COLLATERAL FOR SECURITIES LOANED–98.0%
(cost $602,103,926) | | | | | | | | | | | 700,881,639 | |
| | | | | | | | | | | | |
INVESTMENTS OF CASH COLLATERAL FOR SECURITIES LOANED–0.3% | | | | | | | | | | | | |
INVESTMENT COMPANIES–0.3% | | | | | | | | | | | | |
AB Fixed Income Shares, Inc.–Government Money Market Portfolio–Class AB, 4.43%(d)(e)(f)
(cost $2,321,175) | | | | | | | 2,321,175 | | | | 2,321,175 | |
| | | | | | | | | | | | |
TOTAL INVESTMENTS–98.3% (cost $604,425,101) | | | | | | | | | | | 703,202,814 | |
Other assets less liabilities–1.7% | | | | | | | | | | | 12,516,173 | |
| | | | | | | | | | | | |
NET ASSETS–100.0% | | | | | | | $ | 715,718,987 | |
| | | | | | | | | | | | |
17
| | |
| GLOBAL RISK ALLOCATION—MODERATE PORTFOLIO |
| PORTFOLIO OF INVESTMENTS | | |
| |
| (continued) | | AB Variable Products Series Fund |
FUTURES (see Note D)
| | | | | | | | | | | | | | | | |
| Description | | Number of
Contracts | | | Expiration
Month | | | Current
Notional | | | Value and
Unrealized
Appreciation
(Depreciation) | |
Purchased Contracts | |
10 Yr Canadian Bond Futures | | | 85 | | | | March 2025 | | | $ | 7,250,235 | | | $ | 131,721 | |
Euro STOXX 50 Index Futures | | | 118 | | | | March 2025 | | | | 5,966,059 | | | | (56,172 | ) |
Euro-BTP Futures | | | 123 | | | | March 2025 | | | | 15,286,594 | | | | (318,716 | ) |
Euro-Bund Futures | | | 109 | | | | March 2025 | | | | 15,066,393 | | | | (362,575 | ) |
Euro-OAT Futures | | | 152 | | | | March 2025 | | | | 19,429,226 | | | | (379,660 | ) |
Long Gilt Futures | | | 155 | | | | March 2025 | | | | 17,931,649 | | | | (495,014 | ) |
MSCI EAFE Futures | | | 4 | | | | March 2025 | | | | 453,500 | | | | (10,568 | ) |
Nikkei 225 (CME) Futures | | | 9 | | | | March 2025 | | | | 1,776,825 | | | | 7,498 | |
OMXS 30 Index Futures | | | 14 | | | | January 2025 | | | | 314,194 | | | | (7,797 | ) |
S&P Mid 400 E-Mini Futures | | | 13 | | | | March 2025 | | | | 4,090,710 | | | | (221,366 | ) |
S&P/TSX 60 Index Futures | | | 52 | | | | March 2025 | | | | 10,744,749 | | | | (261,815 | ) |
TOPIX Index Futures | | | 27 | | | | March 2025 | | | | 4,781,563 | | | | 87,234 | |
U.S. Long Bond (CBT) Futures | | | 266 | | | | March 2025 | | | | 30,282,437 | | | | (702,719 | ) |
U.S. T-Note 2 Yr (CBT) Futures | | | 110 | | | | March 2025 | | | | 22,617,031 | | | | (5,319 | ) |
U.S. T-Note 5 Yr (CBT) Futures | | | 760 | | | | March 2025 | | | | 80,791,563 | | | | (452,316 | ) |
U.S. T-Note 10 Yr (CBT) Futures | | | 4 | | | | March 2025 | | | | 435,000 | | | | (4,350 | ) |
U.S. Ultra Bond (CBT) Futures | | | 118 | | | | March 2025 | | | | 14,030,937 | | | | (453,743 | ) |
|
Sold Contracts | |
FTSE 100 Index Futures | | | 25 | | | | March 2025 | | | | 2,560,291 | | | | 21,139 | |
MSCI Singapore IX ETS Futures | | | 11 | | | | January 2025 | | | | 300,805 | | | | 625 | |
S&P 500 E-Mini Futures | | | 49 | | | | March 2025 | | | | 14,542,588 | | | | 344,084 | |
SPI 200 Futures | | | 13 | | | | March 2025 | | | | 1,639,042 | | | | 25,031 | |
U.S. 10 Yr Ultra Futures | | | 70 | | | | March 2025 | | | | 7,791,875 | | | | 169,492 | |
| | | | | | | | | | | | | | | | |
| | | $ | (2,945,306 | ) |
| | | | | | | | | | | | | | | | |
FORWARD CURRENCY EXCHANGE CONTRACTS (see Note D)
| | | | | | | | | | | | | | | | | | | | | | | | |
| Counterparty | | Contracts to
Deliver
(000) | | | In Exchange
For
(000) | | | Settlement
Date | | | Unrealized
Appreciation
(Depreciation) | |
Bank of America, NA | | | TWD | | | | 35,939 | | | | USD | | | | 1,113 | | | | 02/27/2025 | | | $ | 19,239 | |
Barclays Bank PLC | | | GBP | | | | 14,227 | | | | USD | | | | 18,303 | | | | 01/16/2025 | | | | 493,492 | |
Barclays Bank PLC | | | KRW | | | | 833,868 | | | | USD | | | | 597 | | | | 01/17/2025 | | | | 32,659 | |
Barclays Bank PLC | | | USD | | | | 596 | | | | KRW | | | | 836,810 | | | | 01/17/2025 | | | | (29,217 | ) |
Barclays Bank PLC | | | CAD | | | | 4,687 | | | | USD | | | | 3,362 | | | | 02/05/2025 | | | | 97,008 | |
Citibank, NA | | | USD | | | | 1,127 | | | | TWD | | | | 36,270 | | | | 02/27/2025 | | | | (22,728 | ) |
Deutsche Bank AG | | | JPY | | | | 5,494,833 | | | | USD | | | | 36,055 | | | | 02/21/2025 | | | | 946,209 | |
Goldman Sachs Bank USA | | | USD | | | | 5,932 | | | | CAD | | | | 8,199 | | | | 02/05/2025 | | | | (221,469 | ) |
Morgan Stanley Capital Services, Inc. | | | SEK | | | | 40,747 | | | | USD | | | | 3,704 | | | | 02/05/2025 | | | | 14,550 | |
Morgan Stanley Capital Services, Inc. | | | EUR | | | | 36,895 | | | | USD | | | | 38,811 | | | | 02/27/2025 | | | | 503,698 | |
Standard Chartered Bank | | | SGD | | | | 1,930 | | | | USD | | | | 1,436 | | | | 02/14/2025 | | | | 20,035 | |
State Street Bank & Trust Co. | | | CNH | | | | 2 | | | | USD | | | | 0 | * | | | 01/23/2025 | | | | 4 | |
State Street Bank & Trust Co. | | | NOK | | | | 7,823 | | | | USD | | | | 708 | | | | 02/05/2025 | | | | 20,591 | |
State Street Bank & Trust Co. | | | NZD | | | | 310 | | | | USD | | | | 181 | | | | 02/05/2025 | | | | 7,733 | |
UBS AG | | | AUD | | | | 7,281 | | | | USD | | | | 4,732 | | | | 02/05/2025 | | | | 224,995 | |
UBS AG | | | CHF | | | | 7,416 | | | | USD | | | | 8,365 | | | | 02/27/2025 | | | | 146,118 | |
| | | | | | | | | | | | | | | | | | | | | | | | |
| | | $ | 2,252,917 | |
| | | | | | | | | | | | | | | | | | | | | | | | |
18
| | |
| |
| | | AB Variable Products Series Fund |
PUT OPTIONS WRITTEN (see Note D)
| | | | | | | | | | | | | | | | | | | | | | | | | | | | | | | | | | | | |
| Description | | Counterparty | | | Contracts | | | Exercise
Price | | | Expiration
Month | | | Notional
(000) | | | Premiums
Received | | | U.S. $ Value | |
Euro STOXX
50 Index(g) | | | Morgan Stanley & Co., Inc. | | | | 340 | | | | EUR | | | | 4,525.00 | | | | January 2025 | | | | EUR | | | | 15,385 | | | $ | 50,935 | | | $ | (21,660 | ) |
FTSE 100
Index(g) | | | Morgan Stanley & Co., Inc. | | | | 59 | | | | GBP | | | | 7,500.00 | | | | January 2025 | | | | GBP | | | | 4,425 | | | | 9,559 | | | | (4,616 | ) |
Nikkei 225
Index(h) | | | Morgan Stanley & Co., Inc. | | | | 46 | | | | JPY | | | | 37,250.00 | | | | January 2025 | | | | JPY | | | | 1,713,500 | | | | 47,620 | | | | (8,771 | ) |
S&P 500
Index(i) | | | Morgan Stanley & Co., Inc. | | | | 190 | | | | USD | | | | 5,480.00 | | | | January 2025 | | | | USD | | | | 104,120 | | | | 354,727 | | | | (94,050 | ) |
| | | | | | | | | | | | | | | | | | | | | | | | | | | | | | | | | | | | |
| | | | | | | | | | | | | | | | | | | | | | | | | | | | | | $ | 462,841 | | | | $ (129,097 | ) |
| | | | | | | | | | | | | | | | | | | | | | | | | | | | | | | | | | | | |
| * | | Notional amount less than 500. |
| (a) | | Non-income producing security. |
| (b) | | Represents entire or partial securities out on loan. See Note E for securities lending information. |
| (c) | | Security is exempt from registration under Rule 144A or Regulation S of the Securities Act of 1933. These securities are considered restricted, but liquid and may be resold in transactions exempt from registration. At December 31, 2024, the aggregate market value of these securities amounted to $146,187 or 0.0% of net assets. |
| (d) | | Affiliated investments. |
| (e) | | To obtain a copy of the fund’s shareholder report, please go to the Securities and Exchange Commission’s website at www.sec.gov, or call AB at (800) 227-4618. |
| (f) | | The rate shown represents the 7-day yield as of period end. |
| (g) | | One contract relates to 10 shares. |
| (h) | | One contract relates to 1000 shares. |
| (i) | | One contract relates to 100 shares. |
19
| | |
| GLOBAL RISK ALLOCATION—MODERATE PORTFOLIO |
| PORTFOLIO OF INVESTMENTS | | |
| |
| (continued) | | AB Variable Products Series Fund |
Currency Abbreviations:
AUD—Australian Dollar
CAD—Canadian Dollar
CHF—Swiss Franc
CNH—Chinese Yuan Renminbi (Offshore)
EUR—Euro
GBP—Great British Pound
JPY—Japanese Yen
KRW—South Korean Won
NOK—Norwegian Krone
NZD—New Zealand Dollar
SEK—Swedish Krona
SGD—Singapore Dollar
TWD—New Taiwan Dollar
USD—United States Dollar
Glossary:
ADR—American Depositary Receipt
BR—Bearer
BTP—Buoni del Tesoro Poliennali
CBT—Chicago Board of Trade
CME—Chicago Mercantile Exchange
EAFE—Europe, Australia, and Far East
ETS—Emission Trading Scheme
FTSE—Financial Times Stock Exchange
MSCI—Morgan Stanley Capital International
OAT—Obligations Assimilables du Trésor
OMXS—Stockholm Stock Exchange
REG—Registered Shares
REIT—Real Estate Investment Trust
SPI—Share Price Index
TOPIX—Tokyo Price Index
TSX—Toronto Stock Exchange
See notes to financial statements.
20
| | |
| GLOBAL RISK ALLOCATION—MODERATE PORTFOLIO |
| STATEMENT OF ASSETS & LIABILITIES | | |
| |
| December 31, 2024 | | AB Variable Products Series Fund |
| | | | | | | | |
ASSETS | |
Investments in securities, at value | |
Unaffiliated issuers (cost $378,219,128) | | $ | 476,996,841 | (a) |
Affiliated issuers (cost $226,205,973—including investment of cash collateral for securities loaned of $2,321,175) | | | 226,205,973 | |
Cash | | | 1,635 | |
Cash collateral due from broker | | | 7,026,092 | |
Foreign currencies, at value (cost $6,095,583) | | | 5,919,678 | |
Unrealized appreciation on forward currency exchange contracts | | | 2,526,331 | |
Affiliated dividends receivable | | | 887,252 | |
Unaffiliated dividends and interest receivable | | | 826,629 | |
Receivable due from Adviser | | | 41,259 | |
Receivable for capital stock sold | | | 12,638 | |
Receivable for variation margin on futures | | | 9,725 | |
| | | | |
Total assets | | | 720,454,053 | |
| | | | |
LIABILITIES | |
Options written, at value (premiums received $462,841) | | | 129,097 | |
Payable for collateral received on securities loaned | | | 2,321,175 | |
Payable for capital stock redeemed | | | 1,307,901 | |
Advisory fee payable | | | 284,070 | |
Unrealized depreciation on forward currency exchange contracts | | | 273,414 | |
Distribution fee payable | | | 150,986 | |
Administrative fee payable | | | 22,292 | |
Foreign capital gains tax payable | | | 3,688 | |
Transfer Agent fee payable | | | 167 | |
Accrued expenses | | | 242,276 | |
| | | | |
Total liabilities | | | 4,735,066 | |
| | | | |
NET ASSETS | | $ | 715,718,987 | |
| | | | |
COMPOSITION OF NET ASSETS | |
Capital stock, at par | | $ | 56,693 | |
Additional paid-in capital | | | 652,709,753 | |
Distributable earnings | | | 62,952,541 | |
| | | | |
NET ASSETS | | $ | 715,718,987 | |
| | | | |
Net Asset Value Per Share—1 billion shares of capital stock authorized, $.001 par value
| | | | | | | | | | | | |
| Class | | Net Assets | | | Shares
Outstanding | | | Net Asset
Value | |
| | | |
| B | | $ | 715,718,987 | | | | 56,693,260 | | | $ | 12.62 | |
| (a) | | Includes securities on loan with a value of $4,819,115 (see Note E). |
See notes to financial statements.
21
| | |
| GLOBAL RISK ALLOCATION—MODERATE PORTFOLIO |
| STATEMENT OF OPERATIONS | | |
| |
| Year Ended December 31, 2024 | | AB Variable Products Series Fund |
| | | | |
INVESTMENT INCOME | | | | |
Dividends | | | | |
Unaffiliated issuers (net of foreign taxes withheld of $591,926) | | $ | 10,120,723 | |
Affiliated issuers | | | 8,797,369 | |
Interest | | | 771,365 | |
Securities lending income | | | 18,367 | |
| | | | |
| | | 19,707,824 | |
| | | | |
EXPENSES | | | | |
Advisory fee (see Note B) | | | 3,578,958 | |
Distribution fee—Class B | | | 1,904,977 | |
Transfer agency—Class B | | | 1,951 | |
Audit and tax | | | 93,139 | |
Administrative | | | 92,581 | |
Legal | | | 69,416 | |
Printing | | | 47,495 | |
Custody and accounting | | | 38,140 | |
Directors’ fees | | | 30,965 | |
Miscellaneous | | | 56,142 | |
| | | | |
Total expenses | | | 5,913,764 | |
Less: expenses waived and reimbursed by the Adviser (see Notes B & E) | | | (308,354 | ) |
| | | | |
Net expenses | | | 5,605,410 | |
| | | | |
Net investment income | | | 14,102,414 | |
| | | | |
REALIZED AND UNREALIZED GAIN (LOSS) ON INVESTMENT AND FOREIGN CURRENCY TRANSACTIONS | | | | |
Net realized gain on: | | | | |
Investment transactions | | | 17,349,615 | |
Forward currency exchange contracts | | | 980,858 | |
Futures | | | 1,700,491 | |
Options written | | | 3,631,354 | |
Foreign currency transactions | | | 468,717 | |
Net change in unrealized appreciation (depreciation) of: | | | | |
Investments(a) | | | 55,260,563 | |
Forward currency exchange contracts | | | 7,451,038 | |
Futures | | | (10,482,597 | ) |
Options written | | | 145,560 | |
Foreign currency denominated assets and liabilities | | | (1,051,396 | ) |
| | | | |
Net gain on investment and foreign currency transactions | | | 75,454,203 | |
| | | | |
NET INCREASE IN NET ASSETS FROM OPERATIONS | | $ | 89,556,617 | |
| | | | |
| (a) | | Net of increase in accrued foreign capital gains taxes on unrealized gains of $3,688. |
See notes to financial statements.
22
| | |
| | | |
| GLOBAL RISK ALLOCATION—MODERATE PORTFOLIO |
| |
| STATEMENT OF CHANGES IN NET ASSETS | | AB Variable Products Series Fund |
| | | | | | | | |
| | | Year Ended
December 31,
2024 | | | Year Ended
December 31,
2023 | |
INCREASE (DECREASE) IN NET ASSETS FROM OPERATIONS | |
Net investment income | | $ | 14,102,414 | | | $ | 15,599,895 | |
Net realized gain (loss) on investment transactions and foreign currency transactions | | | 24,131,035 | | | | (26,245,624 | ) |
Net change in unrealized appreciation (depreciation) of investments and foreign currency denominated assets and liabilities | | | 51,323,168 | | | | 119,167,653 | |
| | | | | | | | |
Net increase in net assets from operations | | | 89,556,617 | | | | 108,521,924 | |
Distributions to Shareholders | | | | | | | | |
Class A | | | –0 | – | | | (294 | ) |
Class B | | | (14,233,081 | ) | | | (16,918,128 | ) |
CAPITAL STOCK TRANSACTIONS | | | | | | | | |
Net decrease | | | (135,200,766 | ) | | | (115,408,919 | ) |
| | | | | | | | |
Total decrease | | | (59,877,230 | ) | | | (23,805,417 | ) |
NET ASSETS | | | | | | | | |
Beginning of period | | | 775,596,217 | | | | 799,401,634 | |
| | | | | | | | |
End of period | | $ | 715,718,987 | | | $ | 775,596,217 | |
| | | | | | | | |
See notes to financial statements.
23
| | |
| GLOBAL RISK ALLOCATION—MODERATE PORTFOLIO |
| NOTES TO FINANCIAL STATEMENTS | | |
| |
| December 31, 2024 | | AB Variable Products Series Fund |
NOTE A: Significant Accounting Policies
The AB Global Risk Allocation—Moderate Portfolio (the “Portfolio”) is a series of AB Variable Products Series Fund, Inc. (the “Fund”). The Portfolio’s investment objective is to generate income and price appreciation without assuming what AllianceBernstein L.P. (the “Adviser”) considers undue risk. The Portfolio is diversified as defined under the Investment Company Act of 1940 (the “1940 Act”). The Fund was incorporated in the State of Maryland as an open-end series investment company. The Fund offers nine separately managed pools of assets which have differing investment objectives and policies. The Portfolio offers Class B shares. Effective December 1, 2023, Class A shares of the Portfolio were liquidated. Both classes of shares have identical voting, dividend, liquidating and other rights, except that Class B shares bear a distribution expense and have exclusive voting rights with respect to the Class B distribution plan.
The Portfolio offers and sells its shares only to separate accounts of certain life insurance companies for the purpose of funding variable annuity contracts and variable life insurance policies. Sales are made without a sales charge at the Portfolio’s net asset value per share.
The financial statements have been prepared in conformity with U.S. generally accepted accounting principles (“U.S. GAAP”), which require management to make certain estimates and assumptions that affect the reported amounts of assets and liabilities in the financial statements and amounts of income and expenses during the reporting period. Actual results could differ from those estimates. The Portfolio is an investment company under U.S. GAAP and follows the accounting and reporting guidance applicable to investment companies. The following is a summary of significant accounting policies followed by the Portfolio.
1. Security Valuation
Portfolio securities are valued at market value determined on the basis of market quotations or, if market quotations are not readily available or are unreliable, at “fair value” as determined in accordance with procedures approved by and under the oversight of the Fund’s Board of Directors (the “Board”). Pursuant to these procedures, the Adviser serves as the Portfolio’s valuation designee pursuant to Rule 2a-5 of the 1940 Act. In this capacity, the Adviser is responsible, among other things, for making all fair value determinations relating to the Portfolio’s portfolio investments, subject to the Board’s oversight.
In general, the market values of securities which are readily available and deemed reliable are determined as follows: securities listed on a national securities exchange (other than securities listed on the NASDAQ Stock Market, Inc. (“NASDAQ”)) or on a foreign securities exchange are valued at the last sale price at the close of the exchange or foreign securities exchange. If there has been no sale on such day, the securities are valued at the last traded price from the previous day. Securities listed on more than one exchange are valued by reference to the principal exchange on which the securities are traded; securities listed only on NASDAQ are valued in accordance with the NASDAQ Official Closing Price; listed or over the counter (“OTC”) market put or call options are valued at the mid level between the current bid and ask prices. If either a current bid or current ask price is unavailable, the Adviser will have discretion to determine the best valuation (e.g., last trade price in the case of listed options); open futures are valued using the closing settlement price or, in the absence of such a price, the most recent quoted bid price. If there are no quotations available for the day of valuation, the last available closing settlement price is used; U.S. Government securities and any other debt instruments having 60 days or less remaining until maturity are generally valued at market by an independent pricing vendor, if a market price is available. If a market price is not available, the securities are valued at amortized cost. This methodology is commonly used for short term securities that have an original maturity of 60 days or less, as well as short term securities that had an original term to maturity that exceeded 60 days. In instances when amortized cost is utilized, the Valuation Committee (the “Committee”) must reasonably conclude that the utilization of amortized cost is approximately the same as the fair value of the security. Factors the Committee will consider include, but are not limited to, an impairment of the creditworthiness of the issuer or material changes in interest rates. Fixed-income securities, including mortgage-backed and asset-backed securities, may be valued on the basis of prices provided by a pricing service or at a price obtained from one or more of the major broker-dealers. In cases where broker-dealer quotes are obtained, the Adviser may establish procedures whereby changes in market yields or spreads are used to adjust, on a daily basis, a recently obtained quoted price on a security. Swaps and other derivatives are valued daily, primarily using independent pricing services, independent pricing models using market inputs, as well as third party broker-dealers or counterparties. Open-end mutual funds are valued at the closing net asset value per share, while exchange-traded funds are valued at the closing market price per share.
24
| | |
| |
| | | AB Variable Products Series Fund |
Securities for which market quotations are not readily available (including restricted securities) or are deemed unreliable are valued at fair value as deemed appropriate by the Adviser. Factors considered in making this determination may include, but are not limited to, information obtained by contacting the issuer, analysts, analysis of the issuer’s financial statements or other available documents. In addition, the Portfolio may use fair value pricing for securities primarily traded in non-U.S. markets because most foreign markets close well before the Portfolio values its securities at 4:00 p.m., Eastern Time. The earlier close of these foreign markets gives rise to the possibility that significant events, including broad market moves, may have occurred in the interim and may materially affect the value of those securities. To account for this, the Portfolio generally values many of its foreign equity securities using fair value prices based on third party vendor modeling tools to the extent available.
2. Fair Value Measurements
In accordance with U.S. GAAP regarding fair value measurements, fair value is defined as the price that the Portfolio would receive to sell an asset or pay to transfer a liability in an orderly transaction between market participants at the measurement date. U.S. GAAP establishes a framework for measuring fair value, and a three-level hierarchy for fair value measurements based upon the transparency of inputs to the valuation of an asset or liability (including those valued based on their market values as described in Note A.1 above). Inputs may be observable or unobservable and refer broadly to the assumptions that market participants would use in pricing the asset or liability. Observable inputs reflect the assumptions market participants would use in pricing the asset or liability based on market data obtained from sources independent of the Portfolio. Unobservable inputs reflect the Portfolio’s own assumptions about the assumptions that market participants would use in pricing the asset or liability based on the best information available in the circumstances. Each investment is assigned a level based upon the observability of the inputs which are significant to the overall valuation. The three-tier hierarchy of inputs is summarized below.
| | • | | Level 1—quoted prices in active markets for identical investments |
| | • | | Level 2—other significant observable inputs (including quoted prices for similar investments, interest rates, prepayment speeds, credit risk, etc.) |
| | • | | Level 3—significant unobservable inputs (including the Portfolio’s own assumptions in determining the fair value of investments) |
The fair value of debt instruments, such as bonds, and over-the-counter derivatives is generally based on market price quotations, recently executed market transactions (where observable) or industry recognized modeling techniques and are generally classified as Level 2. Pricing vendor inputs to Level 2 valuations may include quoted prices for similar investments in active markets, interest rate curves, coupon rates, currency rates, yield curves, option adjusted spreads, default rates, credit spreads and other unique security features in order to estimate the relevant cash flows which are then discounted to calculate fair values. If these inputs are unobservable and significant to the fair value, these investments will be classified as Level 3.
Where readily available market prices or relevant bid prices are not available for certain equity investments, such investments may be valued based on similar publicly traded investments, movements in relevant indices since last available prices or based upon underlying company fundamentals and comparable company data (such as multiples to earnings or other multiples to equity). Where an investment is valued using an observable input, such as another publicly traded security, the investment will be classified as Level 2. If management determines that an adjustment is appropriate based on restrictions on resale, illiquidity or uncertainty, and such adjustment is a significant component of the valuation, the investment will be classified as Level 3. An investment will also be classified as Level 3 where management uses company fundamentals and other significant inputs to determine the valuation.
Options are valued using market-based inputs to models, broker or dealer quotations, or alternative pricing sources with reasonable levels of price transparency, where such inputs and models are available. Alternatively, the values may be obtained through unobservable management determined inputs and/or management’s proprietary models. Where models are used, the selection of a particular model to value an option depends upon the contractual terms of, and specific risks inherent in, the option as well as the availability of pricing information in the market. Valuation models require a variety of inputs, including contractual terms, market prices, measures of volatility and correlations of such inputs. Exchange traded options generally will be classified as Level 2. For options that do not trade on an exchange but trade in liquid markets, inputs can generally be verified and model selection does not involve significant management judgment. Options are classified within Level 2 on the fair value hierarchy when all of the significant inputs can be corroborated to market evidence. Otherwise such instruments are classified as Level 3.
25
| | |
| GLOBAL RISK ALLOCATION—MODERATE PORTFOLIO |
| NOTES TO FINANCIAL STATEMENTS | | |
| |
| (continued) | | AB Variable Products Series Fund |
Other fixed income investments, including non-U.S. government and corporate debt, are generally valued using quoted market prices, if available, which are typically impacted by current interest rates, maturity dates and any perceived credit risk of the issuer. Additionally, in the absence of quoted market prices, these inputs are used by pricing vendors to derive a valuation based upon industry or proprietary models which incorporate issuer specific data with relevant yield/spread comparisons with more widely quoted bonds with similar key characteristics. Those investments for which there are observable inputs are classified as Level 2. Where the inputs are not observable, the investments are classified as Level 3.
The following table summarizes the valuation of the Portfolio’s investments by the above fair value hierarchy levels as of December 31, 2024:
| | | | | | | | | | | | | | | | |
| | | Level 1 | | | Level 2 | | | Level 3 | | | Total | |
Investments in Securities: | | | | | | | | | | | | | | | | |
Assets: | | | | | | | | | | | | | | | | |
Common Stocks: | | | | | | | | | | | | | | | | |
Information Technology | | $ | 114,002,101 | | | $ | 9,076,292 | | | $ | –0 | – | | $ | 123,078,393 | |
Financials | | | 47,631,348 | | | | 23,459,505 | | | | –0 | – | | | 71,090,853 | |
Consumer Discretionary | | | 39,861,518 | | | | 11,625,161 | | | | –0 | – | | | 51,486,679 | |
Health Care | | | 35,531,306 | | | | 13,135,442 | | | | –0 | – | | | 48,666,748 | |
Industrials | | | 28,793,306 | | | | 18,729,502 | | | | –0 | – | | | 47,522,808 | |
Communication Services | | | 33,596,955 | | | | 4,393,340 | | | | –0 | – | | | 37,990,295 | |
Consumer Staples | | | 19,924,843 | | | | 8,451,071 | | | | –0 | – | | | 28,375,914 | |
Energy | | | 11,070,318 | | | | 3,793,775 | | | | –0 | – | | | 14,864,093 | |
Materials | | | 6,698,818 | | | | 6,516,106 | | | | –0 | – | | | 13,214,924 | |
Utilities | | | 8,202,957 | | | | 3,402,065 | | | | –0 | – | | | 11,605,022 | |
Real Estate | | | 7,377,588 | | | | 2,106,406 | | | | –0 | – | | | 9,483,994 | |
Governments—Treasuries | | | –0 | – | | | 19,117,901 | | | | –0 | – | | | 19,117,901 | |
Purchased Options—Puts | | | –0 | – | | | 499,217 | | | | –0 | – | | | 499,217 | |
Short-Term Investments | | | 223,884,798 | | | | –0 | – | | | –0 | – | | | 223,884,798 | |
Investments of Cash Collateral for Securities Loaned in Affiliated Money Market Fund | | | 2,321,175 | | | | –0 | – | | | –0 | – | | | 2,321,175 | |
| | | | | | | | | | | | | | | | |
Total Investments in Securities | | | 578,897,031 | | | | 124,305,783 | | | | –0 | – | | | 703,202,814 | |
Other Financial Instruments(a): | | | | | | | | | | | | | | | | |
Assets: | | | | | | | | | | | | | | | | |
Futures | | | 786,824 | | | | –0 | – | | | –0 | – | | | 786,824 | (b) |
Forward Currency Exchange Contracts | | | –0 | – | | | 2,526,331 | | | | –0 | – | | | 2,526,331 | |
Liabilities: | | | | | | | | | | | | | | | | |
Futures | | | (3,732,130 | ) | | | –0 | – | | | –0 | – | | | (3,732,130 | )(b) |
Forward Currency Exchange Contracts | | | –0 | – | | | (273,414 | ) | | | –0 | – | | | (273,414 | ) |
Put Options Written | | | –0 | – | | | (129,097 | ) | | | –0 | – | | | (129,097 | ) |
| | | | | | | | | | | | | | | | |
Total | | $ | 575,951,725 | | | $ | 126,429,603 | | | $ | –0 | – | | $ | 702,381,328 | |
| | | | | | | | | | | | | | | | |
| (a) | | Other financial instruments include derivative instruments, such as futures, forwards and swaps. Derivative instruments are valued at the unrealized appreciation (depreciation) on the instrument. Other financial instruments may also include swaps with upfront premiums, written options and written swaptions which are valued at market value. |
| (b) | | Only variation margin receivable (payable) at period end is reported within the statement of assets and liabilities. This amount reflects cumulative unrealized appreciation (depreciation) on futures and centrally cleared swaps as reported in the portfolio of investments. Where applicable, centrally cleared swaps with upfront premiums are presented here at market value. |
3. Currency Translation
Assets and liabilities denominated in foreign currencies and commitments under forward currency exchange contracts are translated into U.S. dollars at the mean of the quoted bid and ask prices of such currencies against the U.S. dollar. Purchases and sales of portfolio securities are translated into U.S. dollars at the rates of exchange prevailing when such securities were acquired or sold. Income and expenses are translated into U.S. dollars at rates of exchange prevailing when accrued.
26
| | |
| |
| | | AB Variable Products Series Fund |
Net realized gain or loss on foreign currency transactions represents foreign exchange gains and losses from sales and maturities of foreign fixed income investments, holding of foreign currencies, currency gains or losses realized between the trade and settlement dates on foreign investment transactions, and the difference between the amounts of dividends, interest and foreign withholding taxes recorded on the Portfolio’s books and the U.S. dollar equivalent amounts actually received or paid. Net unrealized currency gains and losses from valuing foreign currency denominated assets and liabilities at period end exchange rates are reflected as a component of net unrealized appreciation or depreciation of foreign currency denominated assets and liabilities.
4. Taxes
It is the Portfolio’s policy to meet the requirements of the Internal Revenue Code applicable to regulated investment companies and to distribute all of its investment company taxable income and net realized gains, if any, to shareholders. Therefore, no provisions for federal income or excise taxes are required. The Portfolio may be subject to taxes imposed by countries in which it invests. Such taxes are generally based on income and/or capital gains earned or repatriated. Taxes are accrued and applied to net investment income, net realized gains and net unrealized appreciation/depreciation as such income and/or gains are earned.
In accordance with U.S. GAAP requirements regarding accounting for uncertainties in income taxes, management has analyzed the Portfolio’s tax positions taken or expected to be taken on federal and state income tax returns for all open tax years (the current and the prior three tax years) and has concluded that no provision for income tax is required in the Portfolio’s financial statements.
5. Investment Income and Investment Transactions
Dividend income is recorded on the ex-dividend date or as soon as the Portfolio is informed of the dividend. Interest income is accrued daily. Investment transactions are accounted for on the date the securities are purchased or sold. Investment gains or losses are determined on the identified cost basis. Non-cash dividends, if any, are recorded on the ex-dividend date at the fair value of the securities received. The Portfolio amortizes premiums and accretes discounts as adjustments to interest income. The Portfolio accounts for distributions received from real estate investment trust (“REIT”) investments or from regulated investment companies as dividend income, realized gain, or return of capital based on information provided by the REIT or the investment company.
6. Class Allocations
All income earned and expenses incurred by the Portfolio are borne on a pro-rata basis by each outstanding class of shares, based on the proportionate interest in the Portfolio represented by the net assets of such class, except for class specific expenses which are allocated to the respective class. Expenses of the Fund are charged proportionately to each portfolio or based on other appropriate methods. Realized and unrealized gains and losses are allocated among the various share classes based on respective net assets.
7. Dividends and Distributions
Dividends and distributions to shareholders, if any, are recorded on the ex-dividend date. Income dividends and capital gains distributions are determined in accordance with federal tax regulations and may differ from those determined in accordance with U.S. GAAP. To the extent these differences are permanent, such amounts are reclassified within the capital accounts based on their federal tax basis treatment; temporary differences do not require such reclassification.
8. Cash and Short-Term Investments
Cash and short-term investments include cash on hand and short-term investments with maturities of less than one year when purchased.
9. Segment Information
The Portfolio represents a single operating segment. An operating segment is defined in U.S. GAAP as a component of a public entity that engages in business activities from which it may recognize revenues and incur expenses, has operating results that are regularly reviewed by the public entity’s chief operating decision maker (“CODM”) to make decisions about resources to be allocated to the segment and assess its performance, and has discrete financial information available. The Portfolio’s President is the CODM. The CODM monitors the operating results of the Portfolio as a whole and the pre-determined Portfolio’s long term investment strategy, which is executed by the portfolio management group. The qualitative and quantitative information contained within the financial statements is used by the CODM to assess the segments performance versus the Portfolio’s comparative benchmark and to make resource allocation decisions. Segment assets are reflected on the statement of assets and liabilities and segment expenses are listed on the statement of operations.
27
| | |
| GLOBAL RISK ALLOCATION—MODERATE PORTFOLIO |
| NOTES TO FINANCIAL STATEMENTS | | |
| |
| (continued) | | AB Variable Products Series Fund |
NOTE B: Advisory Fee and Other Transactions with Affiliates
Under the terms of the investment advisory agreement, the Portfolio pays the Adviser an advisory fee at an annual rate of .60% of the first $100 million, .45% of the excess over $100 million up to $1 billion and .40% of the excess over $1 billion of the Portfolio’s average daily net assets. The fee is accrued daily and paid monthly. The Adviser has agreed to waive its fees and bear certain expenses, to the extent necessary to limit total operating expenses (excluding interest expense, taxes, extraordinary expenses, expenses associated with securities sold short, and brokerage commissions and other transaction costs), inclusive of the Portfolio’s proportionate share of fees and expenses of registered investment companies or series thereof in which the Portfolio invests (“Acquired Fund Expenses”) on an annual basis (the “Expense Caps”) to 1.00% of daily average net assets for Class B. The Expense Caps may not be terminated by the Adviser before May 1, 2025. For the year ended December 31, 2024, there were no such operating expenses waived by the Adviser. For the year ended December 31, 2024, such waiver for Acquired Fund Expenses for both affiliated and unaffiliated underlying portfolios amounted to $302,177 and $3,515, respectively.
A summary of the Portfolio’s transactions in AB mutual funds for the year ended December 31, 2024 is as follows:
| | | | | | | | | | | | | | | | | | | | |
Portfolio | | Market Value
12/31/23
(000) | | | Purchases
at Cost
(000) | | | Sales
Proceeds
(000) | | | Market Value
12/31/24
(000) | | | Dividend
Income
(000) | |
AB Government Money Market Portfolio | | $ | 139,612 | | | $ | 307,992 | | | $ | 223,719 | | | $ | 223,885 | | | $ | 8,797 | |
AB Government Money Market Portfolio* | | | 1,939 | | | | 30,945 | | | | 30,563 | | | | 2,321 | | | | –0 | – |
| | | | | | | | | | | | | | | | | | | | |
Total | | | | | | | | | | | | | | $ | 226,206 | | | $ | 8,797 | |
| | | | | | | | | | | | | | | | | | | | |
| * | | Investments of cash collateral for securities lending transactions (see Note E). |
Pursuant to the investment advisory agreement, the Portfolio may reimburse the Adviser for certain legal and accounting services provided to the Portfolio by the Adviser. For the year ended December 31, 2024, the reimbursement for such services amounted to $92,581.
The Portfolio compensates AllianceBernstein Investor Services, Inc. (“ABIS”), a wholly-owned subsidiary of the Adviser, under a Transfer Agency Agreement for providing personnel and facilities to perform transfer agency services for the Portfolio. Such compensation retained by ABIS amounted to $1,950 for the year ended December 31, 2024.
NOTE C: Distribution Plan
The Portfolio has adopted a Distribution Plan (the “Plan”) for Class B shares pursuant to Rule 12b-1 under the 1940 Act. Under the Plan, the Portfolio pays distribution and servicing fees to AllianceBernstein Investments, Inc. (the “Distributor”), a wholly-owned subsidiary of the Adviser, at an annual rate of up to .50% of the Portfolio’s average daily net assets attributable to Class B shares. The fees are accrued daily and paid monthly. The Board currently limits payments under the Plan to .25% of the Portfolio’s average daily net assets attributable to Class B shares. The Plan provides that the Distributor will use such payments in their entirety for distribution assistance and promotional activities.
The Portfolio is not obligated under the Plan to pay any distribution and servicing fees in excess of the amounts set forth above. The purpose of the payments to the Distributor under the Plan is to compensate the Distributor for its distribution services with respect to the sale of the Portfolio’s Class B shares. Since the Distributor’s compensation is not directly tied to its expenses, the amount of compensation received by it under the Plan during any year may be more or less than its actual expenses. For this reason, the Plan is characterized by the staff of the Securities and Exchange Commission as being of the “compensation” variety.
In the event that the Plan is terminated or not continued, no distribution or servicing fees (other than current amounts accrued but not yet paid) would be owed by the Portfolio to the Distributor.
The Plan also provides that the Adviser may use its own resources to finance the distribution of the Portfolio’s shares.
NOTE D: Investment Transactions
Purchases and sales of investment securities (excluding short-term investments) for the year ended December 31, 2024 were as follows:
| | | | | | | | |
| | | Purchases | | | Sales | |
Investment securities (excluding U.S. government securities) | | $ | 45,785,929 | | | $ | 260,655,172 | |
U.S. government securities | | | –0 | – | | | –0 | – |
28
| | |
| |
| | | AB Variable Products Series Fund |
The cost of investments for federal income tax purposes, gross unrealized appreciation and unrealized depreciation are as follows:
| | | | |
Cost | | $ | 605,752,265 | |
| | | | |
Gross unrealized appreciation | | | 135,178,848 | |
Gross unrealized depreciation | | | (37,117,500 | ) |
| | | | |
Net unrealized appreciation | | $ | 98,061,348 | |
| | | | |
1. Derivative Financial Instruments
The Portfolio may use derivatives in an effort to earn income and enhance returns, to replace more traditional direct investments, to obtain exposure to otherwise inaccessible markets (collectively, “investment purposes”), or to hedge or adjust the risk profile of its portfolio.
The principal types of derivatives utilized by the Portfolio, as well as the methods in which they may be used are:
The Portfolio may buy or sell futures for investment purposes or for the purpose of hedging its portfolio against adverse effects of potential movements in the market. The Portfolio bears the market risk that arises from changes in the value of these instruments and the imperfect correlation between movements in the price of the futures and movements in the price of the assets, reference rates or indices which they are designed to track. Among other things, the Portfolio may purchase or sell futures for foreign currencies or options thereon for non-hedging purposes as a means of making direct investment in foreign currencies, as described below under “Currency Transactions”.
At the time the Portfolio enters into futures, the Portfolio deposits with the broker or segregates at its custodian cash or securities as collateral to satisfy initial margin requirements set by the exchange on which the transaction is effected. Pursuant to the contract, with respect to cash collateral, the Portfolio agrees to receive from or pay to the broker an amount of cash equal to the daily fluctuation in the value of the contract; in the case of securities collateral, the Fund agrees to adjust the securities position held in the segregated account accordingly. Such receipts, payments or adjustments are known as variation margin and are recorded by the Portfolio as unrealized gains or losses. Risks may arise from the potential inability of a counterparty to meet the terms of the contract. The credit/counterparty risk for exchange-traded futures is generally less than privately negotiated futures, since the clearinghouse, which is the issuer or counterparty to each exchange-traded future, has robust risk mitigation standards, including the requirement to provide initial and variation margin. When the contract is closed, the Portfolio records a realized gain or loss equal to the difference between the value of the contract at the time it was opened and the time it was closed.
Use of long futures subjects the Portfolio to risk of loss in excess of the amounts shown on the statement of assets and liabilities, up to the notional value of the futures. Use of short futures subjects the Portfolio to unlimited risk of loss. Under some circumstances, futures exchanges may establish daily limits on the amount that the price of futures can vary from the previous day’s settlement price, which could effectively prevent liquidation of unfavorable positions.
During the year ended December 31, 2024, the Portfolio held futures for hedging and non-hedging purposes.
| | • | | Forward Currency Exchange Contracts |
The Portfolio may enter into forward currency exchange contracts in order to hedge its exposure to changes in foreign currency exchange rates on its foreign portfolio holdings, to hedge certain firm purchase and sale commitments denominated in foreign currencies and for non-hedging purposes as a means of making direct investments in foreign currencies, as described below under “Currency Transactions”.
A forward currency exchange contract is a commitment to purchase or sell a foreign currency at a future date at a negotiated forward rate. The gain or loss arising from the difference between the original contract and the closing of such contract would be included in net realized gain or loss on forward currency exchange contracts. Fluctuations in the value of open forward currency exchange contracts are recorded for financial reporting purposes as unrealized appreciation and/or depreciation by the Portfolio. Risks may arise from the potential inability of a counterparty to meet the terms of a contract and from unanticipated movements in the value of a foreign currency relative to the U.S. dollar.
29
| | |
| GLOBAL RISK ALLOCATION—MODERATE PORTFOLIO |
| NOTES TO FINANCIAL STATEMENTS | | |
| |
| (continued) | | AB Variable Products Series Fund |
During the year ended December 31, 2024, the Portfolio held forward currency exchange contracts for hedging and non-hedging purposes.
For hedging and investment purposes, the Portfolio may purchase and write (sell) put and call options on U.S. and foreign securities, including government securities, and foreign currencies that are traded on U.S. and foreign securities exchanges and over-the-counter markets. Among other things, the Portfolio may use options transactions for non-hedging purposes as a means of making direct investments in foreign currencies, as described below under “Currency Transactions” and may use options strategies involving the purchase and/or writing of various combinations of call and/or put options, for hedging and investment purposes.
The risk associated with purchasing an option is that the Portfolio pays a premium whether or not the option is exercised. Additionally, the Portfolio bears the risk of loss of the premium and change in market value should the counterparty not perform under the contract. If a put or call purchased option by the Portfolio were permitted to expire without being sold or exercised, its premium would represent a loss to the Portfolio. Put and call purchased options are accounted for in the same manner as portfolio securities. The cost of securities acquired through the exercise of call options is increased by premiums paid. The proceeds from securities sold through the exercise of put options are decreased by the premiums paid.
When the Portfolio writes an option, the premium received by the Portfolio is recorded as a liability and is subsequently adjusted to the current market value of the written option. The Portfolio’s maximum payment for written put options equates to the number of shares multiplied by the strike price. In certain circumstances maximum payout amounts may be partially offset by recovery values of the respective referenced assets and upfront premium received upon entering into the contract. Premiums received from written options which expire unexercised are recorded by the Portfolio on the expiration date as realized gains from written options. The difference between the premium received and the amount paid on effecting a closing purchase transaction, including brokerage commissions, is also treated as a realized gain, or if the premium received is less than the amount paid for the closing purchase transaction, as a realized loss. If a call option is exercised, the premium received is added to the proceeds from the sale of the underlying security or currency in determining whether the Portfolio has realized a gain or loss. If a put option is exercised, the premium received reduces the cost basis of the security or currency purchased by the Portfolio. In writing an option, the Portfolio bears the market risk of an unfavorable change in the price of the security or currency underlying the written option. Exercise of the written option by the Portfolio could result in the Portfolio selling or buying a security or currency at a price different from the current market value.
During the year ended December 31, 2024, the Portfolio held purchased options for hedging and non-hedging purposes.
During the year ended December 31, 2024, the Portfolio held written options for hedging and non-hedging purposes.
The Portfolio typically enters into International Swaps and Derivatives Association, Inc. Master Agreements (“ISDA Master Agreement”) with its OTC derivative contract counterparties in order to, among other things, reduce its credit risk to OTC counterparties. ISDA Master Agreements include provisions for general obligations, representations, collateral and events of default or termination. Under an ISDA Master Agreement, the Portfolio typically may offset with the OTC counterparty certain derivative financial instruments’ payables and/or receivables with collateral held and/or posted and create one single net payment (close-out netting) in the event of default or termination. In the event of a default by an OTC counterparty, the return of collateral with market value in excess of the Portfolio’s net liability, held by the defaulting party, may be delayed or denied.
The Portfolio’s ISDA Master Agreements may contain provisions for early termination of OTC derivative transactions in the event the net assets of the Portfolio decline below specific levels (“net asset contingent features”). If these levels are triggered, the Portfolio’s OTC counterparty has the right to terminate such transaction and require the Portfolio to pay or receive a settlement amount in connection with the terminated transaction. If OTC derivatives were held at period end, please refer to netting arrangements by the OTC counterparty table below for additional details.
30
| | |
| |
| | | AB Variable Products Series Fund |
During the year ended December 31, 2024, the Portfolio had entered into the following derivatives:
| | | | | | | | | | | | |
| | | Asset Derivatives | | | Liability Derivatives | |
Derivative Type | | Statement of
Assets and Liabilities
Location | | Fair Value | | | Statement of
Assets and Liabilities
Location | | Fair Value | |
Interest rate contracts | | Receivable for variation margin on futures | | $ | 301,213 | * | | Payable for variation margin on futures | | $ | 3,174,412 | * |
| | | | |
Equity contracts | | Receivable for variation margin on futures | | | 485,611 | * | | Payable for variation margin on futures | | | 557,718 | * |
| | | | |
Foreign currency contracts | | Unrealized appreciation on forward currency exchange contracts | | | 2,526,331 | | | Unrealized depreciation on forward currency exchange contracts | | | 273,414 | |
| | | | |
Equity contracts | | Investments in securities, at value | | | 499,217 | | | | | | | |
| | | | |
Equity contracts | | | | | | | | Options written, at value | | | 129,097 | |
| | | | | | | | | | | | |
Total | | | | $ | 3,812,372 | | | | | $ | 4,134,641 | |
| | | | | | | | | | | | |
| * | | Only variation margin receivable/payable at period end is reported within the statement of assets and liabilities. This amount reflects cumulative unrealized appreciation (depreciation) on futures and centrally cleared swaps as reported in the portfolio of investments. |
| | | | | | | | | | |
Derivative Type | | Location of Gain or (Loss) on
Derivatives Within Statement of Operations | | Realized Gain or
(Loss) on
Derivatives | | | Change in Unrealized
Appreciation or
(Depreciation) | |
Interest rate contracts | | Net realized gain (loss) on futures; Net change in unrealized appreciation (depreciation) of futures | | $ | 535,811 | | | $ | (11,713,902 | ) |
| | | |
Equity contracts | | Net realized gain (loss) on futures; Net change in unrealized appreciation (depreciation) of futures | | | 1,164,680 | | | | 1,231,305 | |
| | | |
Foreign currency contracts | | Net realized gain (loss) on forward currency exchange contracts; Net change in unrealized appreciation (depreciation) of forward currency exchange contracts | | | 980,858 | | | | 7,451,038 | |
| | | |
Equity contracts | | Net realized gain (loss) on investment transactions; Net change in unrealized appreciation (depreciation) of investments | | | (12,229,856 | ) | | | 12,227 | |
| | | |
Equity contracts | | Net realized gain (loss) on options written; Net change in unrealized appreciation (depreciation) of options written | | | 3,631,354 | | | | 145,560 | |
| | | | | | | | | | |
Total | | | | $ | (5,917,153 | ) | | $ | (2,873,772 | ) |
| | | | | | | | | | |
31
| | |
| GLOBAL RISK ALLOCATION—MODERATE PORTFOLIO |
| NOTES TO FINANCIAL STATEMENTS | | |
| |
| (continued) | | AB Variable Products Series Fund |
The following table represents the average monthly volume of the Portfolio’s derivative transactions during the year ended December 31, 2024:
| | | | |
Futures: | | | | |
Average notional amount of buy contracts | | $ | 259,954,222 | |
Average notional amount of sale contracts | | $ | 68,924,796 | |
Forward Currency Exchange Contracts: | | | | |
Average principal amount of buy contracts | | $ | 26,434,521 | (a) |
Average principal amount of sale contracts | | $ | 150,367,583 | |
Purchased Options: | | | | |
Average notional amount | | $ | 164,102,212 | |
Options Written: | | | | |
Average notional amount | | $ | 156,769,025 | |
| (a) | | Positions were open for 10 months during the year. |
For financial reporting purposes, the Portfolio does not offset derivative assets and derivative liabilities that are subject to netting arrangements in the statement of assets and liabilities.
All OTC derivatives held at period end were subject to netting arrangements. The following table presents the Portfolio’s derivative assets and liabilities by OTC counterparty net of amounts available for offset under ISDA Master Agreements (“MA”) and net of the related collateral received/pledged by the Portfolio as of December 31, 2024. Exchange-traded derivatives and centrally cleared swaps are not subject to netting arrangements and as such are excluded from the table.
| | | | | | | | | | | | | | | | | | | | |
Counterparty | | Derivative
Assets Subject
to a MA | | | Derivatives
Available for
Offset | | | Cash Collateral
Received* | | | Security Collateral
Received* | | | Net Amount of
Derivative
Assets | |
Bank of America, NA | | $ | 19,239 | | | $ | –0 | – | | $ | –0 | – | | $ | –0 | – | | $ | 19,239 | |
Barclays Bank PLC | | | 623,159 | | | | (29,217 | ) | | | –0 | – | | | –0 | – | | | 593,942 | |
Deutsche Bank AG | | | 946,209 | | | | –0 | – | | | –0 | – | | | –0 | – | | | 946,209 | |
Morgan Stanley Capital Services, Inc. | | | 518,248 | | | | –0 | – | | | –0 | – | | | –0 | – | | | 518,248 | |
Standard Chartered Bank | | | 20,035 | | | | –0 | – | | | –0 | – | | | –0 | – | | | 20,035 | |
State Street Bank & Trust Co. | | | 28,328 | | | | –0 | – | | | –0 | – | | | –0 | – | | | 28,328 | |
UBS AG | | | 371,113 | | | | –0 | – | | | –0 | – | | | –0 | – | | | 371,113 | |
| | | | | | | | | | | | | | | | | | | | |
Total | | $ | 2,526,331 | | | $ | (29,217 | ) | | $ | –0 | – | | $ | –0 | – | | $ | 2,497,114 | ^ |
| | | | | | | | | | | | | | | | | | | | |
| | | | | |
Counterparty | | Derivative
Liabilities Subject
to a MA | | | Derivatives
Available for
Offset | | | Cash Collateral
Pledged* | | | Security Collateral
Pledged* | | | Net Amount of
Derivative
Liabilities | |
Barclays Bank PLC | | $ | 29,217 | | | $ | (29,217 | ) | | $ | –0 | – | | $ | –0 | – | | $ | –0 | – |
Citibank, NA | | | 22,728 | | | | –0 | – | | | –0 | – | | | –0 | – | | | 22,728 | |
Goldman Sachs Bank USA | | | 221,469 | | | | –0 | – | | | –0 | – | | | –0 | – | | | 221,469 | |
| | | | | | | | | | | | | | | | | | | | |
Total | | $ | 273,414 | | | $ | (29,217 | ) | | $ | –0 | – | | $ | –0 | – | | $ | 244,197 | ^ |
| | | | | | | | | | | | | | | | | | | | |
| * | | The actual collateral received/pledged may be more than the amount reported due to over-collateralization. |
| ^ | | Net amount represents the net receivable/payable that would be due from/to the counterparty in the event of default or termination. The net amount from OTC financial derivative instruments can only be netted across transactions governed under the same master agreement with the same counterparty. |
2. Currency Transactions
The Portfolio may invest in non-U.S. Dollar-denominated securities on a currency hedged or unhedged basis. The Portfolio may seek investment opportunities by taking long or short positions in currencies through the use of currency-related derivatives, including forward currency exchange contracts, futures and options on futures, swaps, and other options. The Portfolio may enter into transactions for investment opportunities when it anticipates that a foreign currency will appreciate or depreciate in value but securities denominated in that currency are not held by the Portfolio and do not present attractive investment opportunities. Such transactions may also be used when the Adviser believes that it may be more efficient than a
32
| | |
| |
| | | AB Variable Products Series Fund |
direct investment in a foreign currency-denominated security. The Portfolio may also conduct currency exchange contracts on a spot basis (i.e., for cash at the spot rate prevailing in the currency exchange market for buying or selling currencies).
NOTE E: Securities Lending
The Portfolio may enter into securities lending transactions. Under the Portfolio’s securities lending program, all loans of securities will be collateralized continually by cash collateral and/or non-cash collateral. Non-cash collateral will include only securities issued or guaranteed by the U.S. government or its agencies or instrumentalities. If the Portfolio cannot sell or repledge any non-cash collateral, such collateral will not be reflected in the portfolio of investments. If a loan is collateralized by cash, the Portfolio will be compensated for the loan from a portion of the net return from the income earned on cash collateral after a rebate is paid to the borrower (in some cases, this rebate may be a “negative rebate” or fee paid by the borrower to the Portfolio in connection with the loan), and payments are made for fees of the securities lending agent and for certain other administrative expenses. If the Portfolio receives non-cash collateral, the Portfolio will receive a fee from the borrower generally equal to a negotiated percentage of the market value of the loaned securities. The Portfolio will have the right to call a loan and obtain the securities loaned at any time on notice to the borrower within the normal and customary settlement time for the securities. While the securities are on loan, the borrower is obligated to pay the Portfolio amounts equal to any dividend income or other distributions from the securities; however, these distributions will not be afforded the same preferential tax treatment as qualified dividends. The Portfolio will not be able to exercise voting rights with respect to any securities during the existence of a loan, but will have the right to regain ownership of loaned securities in order to exercise voting or other ownership rights. Collateral received and securities loaned are marked to market daily to ensure that the securities loaned are secured by collateral. The lending agent currently invests the cash collateral received in AB Government Money Market Portfolio, an eligible money market vehicle, in accordance with the investment restrictions of the Portfolio, and as approved by the Board. The collateral received on securities loaned is recorded as an asset as well as a corresponding liability in the statement of assets and liabilities. The collateral will be adjusted the next business day to maintain the required collateral amount. The amounts of securities lending income from the borrowers and AB Government Money Market Portfolio are reflected in the statement of operations. When the Portfolio earns net securities lending income from AB Government Money Market Portfolio, the income is inclusive of a rebate expense paid to the borrower. In connection with the cash collateral investment by the Portfolio in AB Government Money Market Portfolio, the Adviser has agreed to waive a portion of the Portfolio’s share of the advisory fees of AB Government Money Market Portfolio, as borne indirectly by the Portfolio as an acquired fund fee and expense. When the Portfolio lends securities, its investment performance will continue to reflect changes in the value of the securities loaned. A principal risk of lending portfolio securities is that the borrower may fail to return the loaned securities upon termination of the loan and that the collateral will not be sufficient to replace the loaned securities. The lending agent has agreed to indemnify the Portfolio in the case of default of any securities borrower.
A summary of the Portfolio’s transactions surrounding securities lending for the year ended December 31, 2024 is as follows:
| | | | | | | | | | | | | | | | | | | | | | |
| | | | | | | | | | | | | AB Government Money Market
Portfolio | |
Market Value of
Securities on Loan* | | | Cash Collateral* | | | Market Value of
Non-Cash
Collateral* | | | Income from
Borrowers | | | Income Earned | | | Advisory Fee
Waived | |
| $ | 4,819,115 | | | $ | 2,321,175 | | | $ | 2,742,241 | | | $ | 18,367 | | | $ | –0 | – | | $ | 2,662 | |
| * | | As of December 31, 2024. |
33
| | |
| GLOBAL RISK ALLOCATION—MODERATE PORTFOLIO |
| NOTES TO FINANCIAL STATEMENTS | | |
| |
| (continued) | | AB Variable Products Series Fund |
NOTE F: Capital Stock
Each class consists of 500,000,000 authorized shares. Transactions in capital shares for each class were as follows:
| | | | | | | | | | | | | | | | | | | | |
| | | SHARES | | | | | | AMOUNT | |
| | | Year Ended
December 31,
2024 | | | Year Ended
December 31,
2023 | | | | | | Year Ended
December 31,
2024 | | | Year Ended
December 31,
2023 | |
Class A | | | | | | | | | | | | | | | | | | | | |
Shares redeemed | | | –0 | – | | | (1,100 | ) | | | | | | $ | –0 | – | | $ | (12,328 | ) |
| | | | | | | | | | | | | | | | | | | | |
Net decrease | | | –0 | – | | | (1,100 | ) | | | | | | $ | –0 | – | | $ | (12,328 | ) |
| | | | | | | | | | | | | | | | | | | | |
Class B | | | | | | | | | | | | | | | | | | | | |
Shares sold | | | 1,576,021 | | | | 962,162 | | | | | | | $ | 19,260,216 | | | $ | 10,335,729 | |
Shares issued on reinvestment of dividends | | | 1,181,169 | | | | 1,554,975 | | | | | | | | 14,233,081 | | | | 16,918,128 | |
Shares redeemed | | | (13,745,723 | ) | | | (13,233,973 | ) | | | | | | | (168,694,063 | ) | | | (142,650,448 | ) |
| | | | | | | | | | | | | | | | | | | | |
Net decrease | | | (10,988,533 | ) | | | (10,716,836 | ) | | | | | | $ | (135,200,766 | ) | | $ | (115,396,591 | ) |
| | | | | | | | | | | | | | | | | | | | |
There were no transactions in capital shares for Class A for the year ended December 31, 2024.
At December 31, 2024, a shareholder of the Portfolio owned 96% of the Portfolio’s outstanding shares. Significant transactions by such shareholder, if any, may impact the Portfolio’s performance.
NOTE G: Risks Involved in Investing in the Portfolio
Market Risk—The value of the Portfolio’s assets will fluctuate as the market or markets in which the Portfolio invests fluctuate. The value of the Portfolio’s investments may decline, sometimes rapidly and unpredictably, simply because of economic changes or other events, including public health crises (including the occurrence of a contagious disease or illness) and regional and global conflicts, that affect large portions of the market. It includes the risk that a particular style of investing may underperform the market generally.
Allocation Risk—The allocation of investments among asset classes may have a significant effect on the Portfolio’s net asset value, or NAV, when the asset classes in which the Portfolio has invested more heavily perform worse than the asset classes invested in less heavily.
Interest Rate Risk—Changes in interest rates will affect the value of investments in fixed-income securities. When interest rates rise, the value of existing investments in fixed-income securities tends to fall and this decrease in value may not be offset by higher income from new investments. Interest-rate risk is generally greater for fixed-income securities with longer maturities or durations. The Portfolio may be subject to a greater risk of rising interest rates than would normally be the case due to the recent end of a period of historically low rates and the effects of potential central bank monetary policy, and government fiscal policy, initiatives and market reactions to those initiatives.
Credit Risk—An issuer or guarantor of a fixed-income security, or the counterparty to a derivatives or other contract, may be unable or unwilling to make timely payments of interest or principal, or to otherwise honor its obligations. The issuer or guarantor may default, causing a loss of the full principal amount of a security and accrued interest. The degree of risk for a particular security may be reflected in its credit rating. There is the possibility that the credit rating of a fixed-income security may be downgraded after purchase, which may adversely affect the value of the security.
High Yield Securities Risk—Investments in fixed-income securities with ratings below investment grade (commonly known as “junk bonds”) tend to have a higher probability that an issuer will default or fail to meet its payment obligations. These securities may be subject to greater price volatility due to such factors as specific corporate developments, interest rate sensitivity and negative perceptions of the junk bond market generally, and may be more difficult to trade than other types of securities.
Foreign (Non-U.S.) Risk—Investments in securities of non-U.S. issuers may involve more risk than those of U.S. issuers. These securities may fluctuate more widely in price and may be more difficult to trade due to adverse market, economic, political, regulatory or other factors.
Currency Risk—Fluctuations in currency exchange rates may negatively affect the value of the Portfolio’s investments or reduce its returns.
34
| | |
| |
| | | AB Variable Products Series Fund |
Investment in Other Investment Companies Risk—As with other investments, investments in other investment companies, including ETFs (Exchange Traded Funds), are subject to market and selection risk. In addition, contract holders of the Portfolio bear both their proportionate share of expenses in the Portfolio (including management fees) and, indirectly, the expenses of the investment companies in which the Portfolio invests (to the extent these expenses are not waived or reimbursed by the Adviser).
Derivatives Risk—Derivatives may be difficult to price or unwind and leveraged so that small changes may produce disproportionate losses for the Portfolio. A short position in a derivative instrument involves the risk of a theoretically unlimited increase in the value of the underlying asset, reference rate or index, which could cause the Portfolio to suffer a potentially unlimited loss. Derivatives, especially over-the-counter derivatives, are also subject to counterparty risk, which is the risk that the counterparty (the party on the other side of the transaction) on a derivative transaction will be unable or unwilling to honor its contractual obligations to the Portfolio.
Leverage Risk—When the Portfolio borrows money or otherwise leverages its investments, its performance may be volatile because leverage tends to exaggerate the effect of any increase or decrease in the value of the Portfolio’s investments. The Portfolio may create leverage through the use of reverse repurchase arrangements, forward currency exchange contracts, forward commitments, dollar rolls or futures or by borrowing money. The use of other types of derivative instruments by the Portfolio, such as options and swaps, may also result in a form of leverage. Leverage may result in higher returns to the Portfolio than if the Portfolio were not leveraged, but may also adversely affect returns, particularly if the market is declining.
Illiquid Investments Risk—Illiquid investments risk exists when certain investments are or become difficult to purchase or sell. Difficulty in selling such investments may result in sales at disadvantageous prices affecting the value of your investment in the Portfolio. Causes of illiquid investments risk may include low trading volumes and large positions. Foreign fixed-income securities may have more illiquid investments risk because secondary trading markets for these securities may be smaller and less well-developed and the securities may trade less frequently than domestic securities. Illiquid investments risk may be higher in a rising interest rate environment, when the value and liquidity of fixed-income securities generally decline.
Indemnification Risk—In the ordinary course of business, the Portfolio enters into contracts that contain a variety of indemnifications. The Portfolio’s maximum exposure under these arrangements is unknown. However, the Portfolio has not had prior claims or losses pursuant to these indemnification provisions and expects the risk of loss thereunder to be remote. Therefore, the Portfolio has not accrued any liability in connection with these indemnification provisions.
Management Risk—The Portfolio is subject to management risk because it is an actively-managed investment fund. The Adviser will apply its investment techniques and risk analyses in making investment decisions for the Portfolio, but there is no guarantee that its techniques will produce the intended results. Some of these techniques may incorporate, or rely upon, quantitative models, but there is no guarantee that these models will generate accurate forecasts, reduce risk or otherwise perform as expected.
NOTE H: Joint Credit Facility
A number of open-end mutual funds managed by the Adviser, including the Portfolio, participate in a $325 million revolving credit facility (the “Facility”) intended to provide short-term financing related to redemptions and other short term liquidity requirements, subject to certain restrictions. Commitment fees related to the Facility are paid by the participating funds and are included in miscellaneous expenses in the statement of operations. The Portfolio did not utilize the Facility during the year ended December 31, 2024.
NOTE I: Distributions to Shareholders
The tax character of distributions paid during the fiscal year ended December 31, 2024 and December 31, 2023 were as follows:
| | | | | | | | |
| | | 2024 | | | 2023 | |
Distributions paid from: | | | | | | | | |
Ordinary income | | $ | 14,233,081 | | | $ | 16,918,422 | |
Net long-term capital gains | | | –0 | – | | | –0 | – |
| | | | | | | | |
Total taxable distributions paid | | $ | 14,233,081 | | | $ | 16,918,422 | |
| | | | | | | | |
35
| | |
| GLOBAL RISK ALLOCATION—MODERATE PORTFOLIO |
| NOTES TO FINANCIAL STATEMENTS | | |
| |
| (continued) | | AB Variable Products Series Fund |
As of December 31, 2024, the components of accumulated earnings (deficit) on a tax basis were as follows:
| | | | |
Undistributed ordinary income | | $ | 23,819,135 | |
Accumulated capital and other losses | | | (58,675,308 | )(a) |
Unrealized appreciation (depreciation) | | | 97,808,714 | (b) |
| | | | |
Total accumulated earnings (deficit) | | $ | 62,952,541 | |
| | | | |
| (a) | | As of December 31, 2024, the Portfolio had a net capital loss carryforward of $58,636,458. During the fiscal year, the Portfolio utilized $12,564,094 of capital loss carry forwards to offset current year net realized gains. As of December 31, 2024, the cumulative deferred loss on straddles was $38,850. |
| (b) | | The differences between book-basis and tax-basis unrealized appreciation (depreciation) are attributable primarily to the recognition for tax purposes of unrealized gains/losses on certain derivative instruments, the tax treatment of passive foreign investment companies (PFICs), and the tax deferral of losses on wash sales. |
For tax purposes, net realized capital losses may be carried over to offset future capital gains, if any. Funds are permitted to carry forward capital losses for an indefinite period, and such losses will retain their character as either short-term or long-term capital losses. As of December 31, 2024, the Portfolio had a net short-term capital loss carryforward of $32,095,652 and a net long-term capital loss carryforward of $26,540,806, which may be carried forward for an indefinite period.
During the current fiscal year, there were no permanent differences that resulted in adjustments to distributable earnings or additional paid-in capital.
NOTE J: Subsequent Events
Management has evaluated subsequent events for possible recognition or disclosure in the financial statements through the date the financial statements are issued. Management has determined that there are no material events that would require disclosure in the Portfolio’s financial statements through this date.
36
| | |
| |
| GLOBAL RISK ALLOCATION—MODERATE PORTFOLIO |
| |
| FINANCIAL HIGHLIGHTS | | AB Variable Products Series Fund |
Selected Data For A Share Of Capital Stock Outstanding Throughout Each Period
| | | | | | | | | | | | | | | | | | | | |
| | | CLASS B | |
| | | Year Ended December 31, | |
| | | 2024 | | | 2023 | | | 2022 | | | 2021 | | | 2020 | |
Net asset value, beginning of period | | | $11.46 | | | | $10.20 | | | | $12.25 | | | | $10.94 | | | | $11.19 | |
| | | | | | | | | | | | | | | | | | | | |
| | | | | | | | | | | | | | | | | | | | |
Income From Investment Operations | | | | | | | | | | | | | | | | | | | | |
Net investment income(a)(b) | | | .23 | | | | .21 | | | | .10 | | | | .01 | | | | .00 | (c) |
Net realized and unrealized gain (loss) on investment transactions and foreign currency transactions | | | 1.17 | | | | 1.29 | | | | (1.80 | ) | | | 1.30 | | | | .23 | |
Contributions from Affiliates | | | –0 | – | | | –0 | – | | | .00 | (c) | | | .00 | (c) | | | –0 | – |
| | | | | | | | | | | | | | | | | | | | |
Net increase (decrease) in net asset value from operations | | | 1.40 | | | | 1.50 | | | | (1.70 | ) | | | 1.31 | | | | .23 | |
| | | | | | | | | | | | | | | | | | | | |
| | | | | | | | | | | | | | | | | | | | |
Less: Dividends and Distributions | | | | | | | | | | | | | | | | | | | | |
Dividends from net investment income | | | (.24 | ) | | | (.24 | ) | | | (.07 | ) | | | –0 | – | | | (.14 | ) |
Distributions from net realized gain on investment transactions | | | –0 | – | | | –0 | – | | | (.28 | ) | | | –0 | – | | | (.34 | ) |
| | | | | | | | | | | | | | | | | | | | |
Total dividends and distributions | | | (.24 | ) | | | (.24 | ) | | | (.35 | ) | | | –0 | – | | | (.48 | ) |
| | | | | | | | | | | | | | | | | | | | |
Net asset value, end of period | | | $12.62 | | | | $11.46 | | | | $10.20 | | | | $12.25 | | | | $10.94 | |
| | | | | | | | | | | | | | | | | | | | |
| | | | | | | | | | | | | | | | | | | | |
Total Return | | | | | | | | | | | | | | | | | | | | |
Total investment return based on net asset value(d) | | | 12.28 | % | | | 14.79 | % | | | (14.07 | )% | | | 11.97 | % | | | 2.45 | % |
| | | | | | | | | | | | | | | | | | | | |
Ratios/Supplemental Data | | | | | | | | | | | | | | | | | | | | |
Net assets, end of period (000’s omitted) | | | $715,719 | | | | $775,596 | | | | $799,391 | | | | $1,065,829 | | | | $89,696 | |
Ratio to average net assets of: | | | | | | | | | | | | | | | | | | | | |
Expenses, net of waivers/reimbursements(e)(f)‡ | | | .74 | % | | | .77 | % | | | .75 | % | | | .75 | % | | | .94 | % |
Expenses, before waivers/reimbursements(e)(f)‡ | | | .78 | % | | | .80 | % | | | .79 | % | | | .78 | % | | | 1.20 | % |
Net investment income(b) | | | 1.85 | % | | | 1.98 | % | | | .92 | % | | | .09 | % | | | .01 | % |
Portfolio turnover rate | | | 8 | % | | | 3 | % | | | 2 | % | | | 18 | % | | | 31 | % |
| | | | | | | | | | | | | | | | | | | | |
‡ Expense ratios exclude the estimated acquired fund fees of the affiliated/unaffiliated underlying | |
portfolios | | | .04 | % | | | .03 | % | | | .04 | % | | | .03 | % | | | .06 | % |
See footnote summary on page 38.
37
| | |
| |
| | | AB Variable Products Series Fund |
| (a) | | Based on average shares outstanding. |
| (b) | | Net of expenses waived/reimbursed by the Adviser. |
| (c) | | Amount is less than $.005. |
| (d) | | Total investment return is calculated assuming an initial investment made at the net asset value at the beginning of the period, reinvestment of all dividends and distributions at net asset value during the period, and redemption on the last day of the period. Total investment return does not reflect (i) insurance company’s separate account related expense charges and (ii) the deductions of taxes that a shareholder would pay on Portfolio distributions or the redemption of Portfolio shares. Total investment return calculated for a period of less than one year is not annualized. |
| (e) | | In connection with the Portfolio’s investments in affiliated underlying portfolios, the Portfolio incurs no direct expenses, but bears proportionate shares of the fees and expenses (i.e., operating, administrative and investment advisory fees) of the affiliated underlying portfolios. The Adviser has contractually agreed to waive its fees from the Portfolio in an amount equal to the Portfolio’s pro rata share of certain acquired fund fees and expenses, and for the years ended December 31, 2024, December 31, 2023, December 31, 2022, December 31, 2021 and December 31, 2020, such waiver amounted to .04%, .03%, .04%, .03% and .06%, respectively. |
| (f) | | The expense ratios presented below exclude interest/bank overdraft expense: |
| | | | | | | | | | | | | | | | | | | | |
| | | Year Ended December 31, | |
| | | 2024 | | | 2023 | | | 2022 | | | 2021 | | | 2020 | |
Class B | | | | | | | | | | | | | | | | | | | | |
Net of waivers/reimbursements | | | .74 | % | | | .77 | % | | | .75 | % | | | .75 | % | | | .94 | % |
Before waivers/reimbursements | | | .78 | % | | | .80 | % | | | .79 | % | | | .78 | % | | | 1.20 | % |
See notes to financial statements.
38
| | |
| | | |
| REPORT OF INDEPENDENT REGISTERED | | |
| |
| PUBLIC ACCOUNTING FIRM | | AB Variable Products Series Fund |
To the Board of Directors and Shareholders of AB Global Risk Allocation—Moderate Portfolio
Opinion on the Financial Statements
We have audited the accompanying statement of assets and liabilities of AB Global Risk Allocation—Moderate Portfolio (the “Portfolio”) (one of the series constituting AB Variable Products Series Fund, Inc. (the “Fund”)), including the portfolio of investments, as of December 31, 2024, and the related statement of operations for the year then ended, the statements of changes in net assets for each of the two years in the period then ended, the financial highlights for each of the five years in the period then ended and the related notes (collectively referred to as the “financial statements”). In our opinion, the financial statements present fairly, in all material respects, the financial position of the Portfolio (one of the series constituting AB Variable Products Series Fund, Inc.) at December 31, 2024, the results of its operations for the year then ended, the changes in its net assets for each of the two years in the period then ended and its financial highlights for each of the five years in the period then ended, in conformity with U.S. generally accepted accounting principles.
Basis for Opinion
These financial statements are the responsibility of the Fund’s management. Our responsibility is to express an opinion on the Portfolio’s financial statements based on our audits. We are a public accounting firm registered with the Public Company Accounting Oversight Board (United States) (“PCAOB”) and are required to be independent with respect to the Fund in accordance with the U.S. federal securities laws and the applicable rules and regulations of the Securities and Exchange Commission and the PCAOB.
We conducted our audits in accordance with the standards of the PCAOB. Those standards require that we plan and perform the audit to obtain reasonable assurance about whether the financial statements are free of material misstatement, whether due to error or fraud. The Fund is not required to have, nor were we engaged to perform, an audit of the Fund’s internal control over financial reporting. As part of our audits, we are required to obtain an understanding of internal control over financial reporting but not for the purpose of expressing an opinion on the effectiveness of the Fund’s internal control over financial reporting. Accordingly, we express no such opinion.
Our audits included performing procedures to assess the risks of material misstatement of the financial statements, whether due to error or fraud, and performing procedures that respond to those risks. Such procedures included examining, on a test basis, evidence regarding the amounts and disclosures in the financial statements. Our procedures included confirmation of securities owned as of December 31, 2024, by correspondence with the custodian, brokers and others; when replies were not received from brokers or others, we performed other auditing procedures. Our audits also included evaluating the accounting principles used and significant estimates made by management, as well as evaluating the overall presentation of the financial statements. We believe that our audits provide a reasonable basis for our opinion.

We have served as the auditor of one or more of the AB investment companies since 1968.
New York, New York
February 14, 2025
39
| | |
| | |
| | |
| |
| 2024 FEDERAL TAX INFORMATION (unaudited) | | AB Variable Products Series Fund |
For Federal income tax purposes, the following information is furnished with respect to the distributions paid by the Portfolio during the taxable year ended December 31, 2024. For corporate shareholders, 40.93% of dividends paid qualify for the dividends received deduction.
40
| | |
| | | |
| GLOBAL RISK ALLOCATION— | | |
| |
| MODERATE PORTFOLIO | | AB Variable Products Series Fund |
INFORMATION REGARDING THE REVIEW AND APPROVAL OF THE FUND’S ADVISORY AGREEMENT
The disinterested directors (the “directors”) of AB Variable Products Series Fund, Inc. (the “Company”) unanimously approved the continuance of the Company’s Advisory Agreement with the Adviser in respect of AB Global Risk Allocation—Moderate Portfolio (the “Fund”) at a meeting held in-person on November 5-7, 2024 (the “Meeting”).
Prior to approval of the continuance of the Advisory Agreement, the directors had requested from the Adviser, and received and evaluated, extensive materials. They reviewed the proposed continuance of the Advisory Agreement with the Adviser and with experienced counsel who are independent of the Adviser, who advised on the relevant legal standards. The directors also reviewed additional materials, including comparative analytical data prepared by the Senior Vice President of the Fund. The directors also discussed the proposed continuance in private sessions with counsel.
The directors considered their knowledge of the nature and quality of the services provided by the Adviser to the Fund gained from their experience as directors or trustees of most of the registered investment companies advised by the Adviser, their overall confidence in the Adviser’s integrity and competence they have gained from that experience, the Adviser’s initiative in identifying and raising potential issues with the directors and its responsiveness, frankness and attention to concerns raised by the directors in the past, including the Adviser’s willingness to consider and implement organizational and operational changes designed to improve investment results and the services provided to the AB Funds. The directors noted that they have four regular meetings each year, at each of which they review extensive materials and information from the Adviser, including information on the investment performance of the Fund and the money market fund advised by the Adviser in which the Fund invests a portion of its assets.
The directors also considered all factors they believed relevant, including the specific matters discussed below. During the course of their deliberations, the directors evaluated, among other things, the reasonableness of the advisory fee. The directors did not identify any particular information that was all-important or controlling, and different directors may have attributed different weights to the various factors. The directors determined that the selection of the Adviser to manage the Fund and the overall arrangements between the Fund and the Adviser, as provided in the Advisory Agreement, including the advisory fee, were fair and reasonable in light of the services performed, expenses incurred and such other matters as the directors considered relevant in the exercise of their business judgment. The material factors and conclusions that formed the basis for the directors’ determinations included the following:
Nature, Extent and Quality of Services Provided
The directors considered the scope and quality of services provided by the Adviser under the Advisory Agreement, including the quality of the investment research capabilities of the Adviser and the other resources it has dedicated to performing services for the Fund. The directors noted that the Adviser from time to time reviews the Fund’s investment strategies and from time to time proposes changes intended to improve the Fund’s relative or absolute performance for the directors’ consideration. They also noted the professional experience and qualifications of the Fund’s portfolio management team and other senior personnel of the Adviser. The directors also considered that the Advisory Agreement provides that the Fund will reimburse the Adviser for the cost to it of providing certain clerical, accounting, administrative and other services to the Fund by employees of the Adviser or its affiliates. Requests for these reimbursements are made on a quarterly basis and subject to approval by the directors. Reimbursements, to the extent requested and paid, result in a higher rate of total compensation from the Fund to the Adviser than the fee rate stated in the Advisory Agreement. The directors noted that the methodology used to determine the reimbursement amounts had been reviewed by an independent consultant at the request of the directors. The quality of administrative and other services, including the Adviser’s role in coordinating the activities of the Fund’s other service providers, also was considered. The directors concluded that, overall, they were satisfied with the nature, extent and quality of services provided to the Fund under the Advisory Agreement.
Costs of Services Provided and Profitability
The directors reviewed a schedule of the revenues and expenses and related notes indicating the profitability of the Fund to the Adviser for calendar years 2022 and 2023 that had been prepared with an expense allocation methodology arrived at in consultation with an independent consultant at the request of the directors. The directors noted the assumptions and methods of allocation used by the Adviser in preparing fund-specific profitability data and understood that there are a number of potentially acceptable allocation methodologies for information of this type. The directors noted that the profitability information reflected all revenues and expenses of the Adviser’s relationship with the Fund, including those relating to its subsidiaries that provide transfer agency, distribution and brokerage services to the Fund. The directors recognized that it is difficult to make comparisons of the profitability of the Advisory Agreement with the profitability of fund advisory contracts
41
| | |
| GLOBAL RISK ALLOCATION— | | |
| MODERATE PORTFOLIO | | |
| |
| (continued) | | AB Variable Products Series Fund |
for unaffiliated funds because comparative information is not generally publicly available and is affected by numerous factors. The directors focused on the profitability of the Adviser’s relationship with the Fund before taxes and distribution expenses. The directors concluded that the Adviser’s level of profitability from its relationship with the Fund was not unreasonable.
Fall-Out Benefits
The directors considered the other benefits to the Adviser and its affiliates from their relationships with the Fund and the money market fund advised by the Adviser in which the Fund invests, including, but not limited to, benefits relating to soft dollar arrangements (whereby investment advisers receive brokerage and research services from brokers that execute agency transactions for their clients); 12b-1 fees and sales charges received by the Fund’s principal underwriter (which is a wholly owned subsidiary of the Adviser) in respect of the Fund’s Class B shares; brokerage commissions paid by the Fund to brokers affiliated with the Adviser; and transfer agency fees paid by the Fund to a wholly owned subsidiary of the Adviser. The directors recognized that the Adviser’s profitability would be somewhat lower without these benefits. The directors understood that the Adviser also might derive reputational and other benefits from its association with the Fund.
Investment Results
In addition to the information reviewed by the directors in connection with the Meeting, the directors receive detailed performance information for the Fund at each regular Board meeting during the year.
At the Meeting, the directors reviewed performance information prepared by an independent service provider (the “15(c) service provider”), showing the performance of the Class B shares of the Fund against a group of similar funds (“peer group”) and a larger group of similar funds (“peer universe”), each selected by the 15(c) service provider, and information prepared by the Adviser showing performance of the Class B shares against a broad-based securities market index, in each case for the 1-, 3- and 5-year periods ended July 31, 2024 and (in the case of comparisons with the broad-based securities market index) for the period from inception. Based on their review, the directors concluded that the Fund’s investment performance was acceptable.
Advisory Fees and Other Expenses
The directors considered the advisory fee rate payable by the Fund to the Adviser and information prepared by the 15(c) service provider concerning advisory fee rates payable by other funds in the same category as the Fund. The directors recognized that it is difficult to make comparisons of advisory fees because there are variations in the services that are included in the fees payable by other funds. The directors compared the Fund’s contractual effective advisory fee rate with a peer group median and noted that it was lower than the median. They also noted that the Adviser’s total rate of compensation, taking into account the impact of the administrative expense reimbursement paid to the Adviser in the latest fiscal year, was lower than the median.
The directors also considered the Adviser’s fee schedule for other clients utilizing investment strategies similar to those of the Fund. For this purpose, they reviewed the relevant advisory fee information from the Adviser’s Form ADV and in a report from the Fund’s Senior Vice President and noted the differences between the Fund’s fee schedule, on the one hand, and the Adviser’s institutional fee schedule and the schedule of fees charged by the Adviser to any offshore funds and for services to any sub-advised funds utilizing investment strategies similar to those of the Fund, on the other. The directors noted that the Adviser may, in some cases, agree to fee rates with large institutional clients that are lower than those reviewed by the directors and that they had previously discussed with the Adviser its policies in respect of such arrangements.
The Adviser reviewed with the directors the significantly greater scope of the services it provides to the Fund relative to institutional, offshore fund and sub-advised fund clients. In this regard, the Adviser noted, among other things, that, compared to institutional and offshore or sub-advisory accounts, the Fund (i) demands considerably more portfolio management, research and trading resources due to significantly higher daily cash flows; (ii) has more tax and regulatory restrictions and compliance obligations; (iii) must prepare and file or distribute regulatory and other communications about fund operations; and (iv) must provide shareholder servicing to retail investors. The Adviser also reviewed the greater legal risks presented by the large and changing population of Fund shareholders who may assert claims against the Adviser in individual or class actions, and the greater entrepreneurial risk in offering new fund products, which require substantial investment to launch, may not succeed, and generally must be priced to compete with larger, more established funds resulting in lack of profitability to the Adviser until a new fund achieves scale. In light of the substantial differences in services rendered by the Adviser to institutional, offshore fund and sub-advised fund clients as compared to the Fund, and the different risk profile, the directors considered these fee comparisons inapt and did not place significant weight on them in their deliberations.
42
| | |
| |
| | | AB Variable Products Series Fund |
In connection with their review of the Fund’s advisory fee, the directors also considered the total expense ratio of the Class B shares of the Fund in comparison to the medians for a peer group and a peer universe selected by the 15(c) service provider. The Class B expense ratio of the Fund was based on the Fund’s latest fiscal year. The Adviser had agreed to cap the Fund’s expenses, but the directors noted that the Fund’s expense ratio was currently below the level of the Adviser’s cap. The directors noted that it was likely that the expense ratios of some of the other funds in the Fund’s category were lowered by waivers or reimbursements by those funds’ investment advisers, which in some cases might be voluntary or temporary. The directors view expense ratio information as relevant to their evaluation of the Adviser’s services because the Adviser is responsible for coordinating services provided to the Fund by others. Based on their review, the directors concluded that the Fund’s expense ratio was acceptable.
Economies of Scale
The directors noted that the advisory fee schedule for the Fund contains breakpoints and that the Fund’s net assets were higher than a breakpoint level. Accordingly, the Fund’s current effective advisory fee rate reflected a reduction due to the breakpoint and would be further reduced to the extent the net assets of the Fund increase. The directors took into consideration prior presentations by an independent consultant on economies of scale in the mutual fund industry and for the AB Funds, and presentations from time to time by the Adviser concerning certain of its views on economies of scale. The directors also had requested and received from the Adviser certain updates on economies of scale in advance of the Meeting. The directors believe that economies of scale may be realized (if at all) by the Adviser across a variety of products and services, and not only in respect of a single fund. The directors noted that there is no established methodology for setting breakpoints that give effect to the fund-specific services provided by a fund’s adviser and to the economies of scale that an adviser may realize in its overall mutual fund business or those components of it which directly or indirectly affect a fund’s operations. The directors observed that in the mutual fund industry as a whole, as well as among funds similar to the Fund, there is no uniformity or pattern in the fees and asset levels at which breakpoints (if any) apply. The directors also noted that the advisory agreements for many funds do not have breakpoints at all. Having taken these factors into account, the directors concluded that the Fund’s breakpoint arrangements were acceptable and provide a means for sharing any economies of scale.
43
VPS-GRA-0151-1224
DEC 12.31.24

ANNUAL FINANCIAL STATEMENTS AND ADDITIONAL INFORMATION
AB VARIABLE PRODUCTS
SERIES FUND, INC.
| + | | AB INTERNATIONAL VALUE PORTFOLIO |
Investment Products Offered
| | • | | Are Not Bank Guaranteed |
AllianceBernstein Investments, Inc. (ABI) is the distributor of the AB family of mutual funds. ABI is a member of FINRA and is an affiliate of AllianceBernstein L.P., the Adviser of the funds.
You may obtain a description of the Fund’s proxy voting policies and procedures, and information regarding how the Fund voted proxies relating to portfolio securities during the most recent 12-month period ended June 30, without charge. Simply visit AB’s website at www.abfunds.com or go to the Securities and Exchange Commission’s (the “Commission”) website at www.sec.gov, or call AB at (800) 227 4618.
The Fund files its complete schedule of portfolio holdings with the Commission for the first and third quarters of each fiscal year as an exhibit to its reports on Form N-PORT. The Fund’s Form N-PORT reports are available on the Commission’s website at www.sec.gov.
The [A/B] logo and AllianceBernstein® are registered trademarks used by permission of the owner, AllianceBernstein L.P.
| | |
| INTERNATIONAL VALUE PORTFOLIO | | |
| PORTFOLIO OF INVESTMENTS | | |
| |
| December 31, 2024 | | AB Variable Products Series Fund |
| | | | | | | | |
Company | | Shares | | | U.S. $ Value | |
| | | | | | | | |
COMMON STOCKS–99.0% | | | | | | | | |
| | | | | | | | |
INDUSTRIALS–18.9% | | | | | | | | |
AEROSPACE & DEFENSE–5.9% | | | | | | | | |
Airbus SE | | | 39,785 | | | $ | 6,370,805 | |
BAE Systems PLC | | | 242,818 | | | | 3,483,290 | |
Melrose Industries PLC | | | 734,715 | | | | 5,077,157 | |
| | | | | | | | |
| | | | | | | 14,931,252 | |
| | | | | | | | |
AIR FREIGHT & LOGISTICS–0.9% | | | | | | | | |
SG Holdings Co., Ltd. | | | 250,500 | | | | 2,394,555 | |
| | | | | | | | |
CONSTRUCTION & ENGINEERING–3.3% | | | | | | | | |
Shimizu Corp. | | | 554,500 | | | | 4,379,228 | |
Vinci SA | | | 38,005 | | | | 3,912,863 | |
| | | | | | | | |
| | | | | | | 8,292,091 | |
| | | | | | | | |
ELECTRICAL EQUIPMENT–0.8% | | | | | | | | |
Fuji Electric Co., Ltd. | | | 38,900 | | | | 2,079,660 | |
| | | | | | | | |
MACHINERY–6.5% | | | | | | | | |
Amada Co., Ltd. | | | 226,300 | | | | 2,200,200 | |
CNH Industrial NV | | | 310,718 | | | | 3,520,435 | |
Kawasaki Heavy Industries Ltd. | | | 68,400 | | | | 3,115,880 | |
Techtronic Industries Co., Ltd. | | | 278,500 | | | | 3,661,145 | |
Toyota Industries Corp. | | | 48,400 | | | | 3,892,591 | |
| | | | | | | | |
| | | | | | | 16,390,251 | |
| | | | | | | | |
PASSENGER AIRLINES–1.5% | | | | | | | | |
Ryanair Holdings PLC (Sponsored ADR)(a) | | | 87,432 | | | | 3,811,161 | |
| | | | | | | | |
| | | | | | | 47,898,970 | |
| | | | | | | | |
FINANCIALS–15.1% | | | | | | | | |
BANKS–10.4% | | | | | | | | |
ABN AMRO Bank NV | | | 185,228 | | | | 2,858,357 | |
Danske Bank A/S | | | 133,624 | | | | 3,788,597 | |
Erste Group Bank AG | | | 97,718 | | | | 6,048,360 | |
NatWest Group PLC | | | 1,470,991 | | | | 7,371,505 | |
Resona Holdings, Inc. | | | 869,800 | | | | 6,270,193 | |
| | | | | | | | |
| | | | | | | 26,337,012 | |
| | | | | | | | |
INSURANCE–4.7% | | | | | | | | |
ASR Nederland NV | | | 76,615 | | | | 3,643,955 | |
AXA SA | | | 149,091 | | | | 5,306,090 | |
Prudential PLC | | | 389,424 | | | | 3,090,476 | |
| | | | | | | | |
| | | | | | | 12,040,521 | |
| | | | | | | | |
| | | | | | | 38,377,533 | |
| | | | | | | | |
CONSUMER DISCRETIONARY–11.8% | | | | | | | | |
AUTOMOBILES–2.8% | | | | | | | | |
Honda Motor Co., Ltd. | | | 385,100 | | | | 3,666,462 | |
Subaru Corp. | | | 201,800 | | | | 3,585,645 | |
| | | | | | | | |
| | | | | | | 7,252,107 | |
| | | | | | | | |
| | | | | | | | |
HOTELS, RESTAURANTS & LEISURE–0.7% | | | | | | | | |
Entain PLC | | | 195,480 | | | | 1,678,071 | |
| | | | | | | | |
HOUSEHOLD DURABLES–3.5% | | | | | | | | |
Persimmon PLC | | | 128,008 | | | | 1,912,109 | |
Sony Group Corp. | | | 334,800 | | | | 7,056,090 | |
| | | | | | | | |
| | | | | | | 8,968,199 | |
| | | | | | | | |
SPECIALTY RETAIL–2.9% | | | | | | | | |
Industria de Diseno Textil SA | | | 89,688 | | | | 4,594,172 | |
JD Sports Fashion PLC | | | 2,305,109 | | | | 2,755,167 | |
| | | | | | | | |
| | | | | | | 7,349,339 | |
| | | | | | | | |
TEXTILES, APPAREL & LUXURY GOODS–1.9% | | | | | | | | |
Burberry Group PLC | | | 386,204 | | | | 4,722,913 | |
| | | | | | | | |
| | | | | | | 29,970,629 | |
| | | | | | | | |
HEALTH CARE–11.4% | | | | | | | | |
HEALTH CARE EQUIPMENT & SUPPLIES–3.4% | | | | | | | | |
ResMed, Inc. | | | 216,966 | | | | 4,923,491 | |
Siemens Healthineers AG | | | 71,170 | | | | 3,758,265 | |
| | | | | | | | |
| | | | | | | 8,681,756 | |
| | | | | | | | |
HEALTH CARE PROVIDERS & SERVICES–1.7% | | | | | | | | |
Fresenius SE & Co. KGaA(b) | | | 126,748 | | | | 4,399,544 | |
| | | | | | | | |
PHARMACEUTICALS–6.3% | | | | | | | | |
GSK PLC | | | 185,283 | | | | 3,125,217 | |
Merck KGaA | | | 26,267 | | | | 3,822,449 | |
Roche Holding AG (Genusschein) | | | 31,901 | | | | 8,919,731 | |
| | | | | | | | |
| | | | | | | 15,867,397 | |
| | | | | | | | |
| | | | | | | 28,948,697 | |
| | | | | | | | |
CONSUMER STAPLES–9.8% | | | | | | | | |
BEVERAGES–3.0% | | | | | | | | |
Coca-Cola Europacific Partners PLC | | | 59,063 | | | | 4,536,629 | |
Heineken NV(a) | | | 43,435 | | | | 3,095,574 | |
| | | | | | | | |
| | | | | | | 7,632,203 | |
| | | | | | | | |
CONSUMER STAPLES DISTRIBUTION & RETAIL–2.4% | | | | | | | | |
Koninklijke Ahold Delhaize NV | | | 190,016 | | | | 6,198,114 | |
| | | | | | | | |
FOOD PRODUCTS–2.1% | | | | | | | | |
Nestle SA (REG) | | | 64,953 | | | | 5,328,950 | |
| | | | | | | | |
PERSONAL CARE PRODUCTS–2.3% | | | | | | | | |
Haleon PLC | | | 1,227,554 | | | | 5,788,100 | |
| | | | | | | | |
| | | | | | | 24,947,367 | |
| | | | | | | | |
1
| | |
| INTERNATIONAL VALUE PORTFOLIO | | |
| PORTFOLIO OF INVESTMENTS | | |
| |
| (continued) | | AB Variable Products Series Fund |
| | | | | | | | |
Company | | Shares | | | U.S. $ Value | |
| | | | | | | | |
MATERIALS–8.5% | | | | | | | | |
CHEMICALS–4.4% | | | | | | | | |
Arkema SA | | | 43,782 | | | $ | 3,331,472 | |
Kuraray Co., Ltd. | | | 297,100 | | | | 4,255,581 | |
Tosoh Corp. | | | 268,200 | | | | 3,584,751 | |
| | | | | | | | |
| | | | | | | 11,171,804 | |
| | | | | | | | |
CONSTRUCTION MATERIALS–2.2% | | | | | | | | |
CRH PLC | | | 59,464 | | | | 5,501,609 | |
| | | | | | | | |
METALS & MINING–1.9% | | | | | | | | |
Endeavour Mining PLC | | | 118,346 | | | | 2,113,949 | |
Lundin Mining Corp.(a) | | | 334,333 | | | | 2,877,108 | |
| | | | | | | | |
| | | | | | | 4,991,057 | |
| | | | | | | | |
| | | | | | | 21,664,470 | |
| | | | | | | | |
ENERGY–8.2% | | | | | | | | |
ENERGY EQUIPMENT & SERVICES–4.9% | | | | | | | | |
Shell PLC | | | 272,241 | | | | 8,543,790 | |
Vallourec SACA(b) | | | 226,382 | | | | 3,862,512 | |
| | | | | | | | |
| | | | | | | 12,406,302 | |
| | | | | | | | |
OIL, GAS & CONSUMABLE FUELS–3.3% | | | | | | | | |
Cameco Corp. (Toronto) | | | 93,269 | | | | 4,795,653 | |
Repsol SA | | | 303,959 | | | | 3,698,560 | |
| | | | | | | | |
| | | | | | | 8,494,213 | |
| | | | | | | | |
| | | | | | | 20,900,515 | |
| | | | | | | | |
INFORMATION TECHNOLOGY–6.6% | | | | | | | | |
SEMICONDUCTORS & SEMICONDUCTOR EQUIPMENT–5.4% | | | | | | | | |
NXP Semiconductors NV | | | 15,084 | | | | 3,135,209 | |
Taiwan Semiconductor Manufacturing Co., Ltd. | | | 160,000 | | | | 5,200,004 | |
Tokyo Electron Ltd. | | | 36,200 | | | | 5,441,558 | |
| | | | | | | | |
| | | | | | | 13,776,771 | |
| | | | | | | | |
TECHNOLOGY HARDWARE, STORAGE & PERIPHERALS–1.2% | | | | | | | | |
Samsung Electronics Co., Ltd. | | | 81,265 | | | | 2,900,088 | |
| | | | | | | | |
| | | | | | | 16,676,859 | |
| | | | | | | | |
COMMUNICATION SERVICES–5.4% | | | | | | | | |
DIVERSIFIED TELECOMMUNICATION SERVICES–5.4% | | | | | | | | |
Deutsche Telekom AG (REG) | | | 209,964 | | | | 6,291,167 | |
Koninklijke KPN NV | | | 1,000,449 | | | | 3,648,074 | |
Telstra Group Ltd. | | | 1,535,555 | | | | 3,805,569 | |
| | | | | | | | |
| | | | | | | 13,744,810 | |
| | | | | | | | |
| | | | | | | | |
UTILITIES–3.3% | | | | | | | | |
ELECTRIC UTILITIES–3.3% | | | | | | | | |
EDP SA | | | 1,289,752 | | | | 4,125,937 | |
Enel SpA | | | 590,088 | | | | 4,210,969 | |
| | | | | | | | |
| | | | | | | 8,336,906 | |
| | | | | | | | |
Total Common Stocks
(cost $226,192,163) | | | | | | | 251,466,756 | |
| | | | | | | | |
SHORT-TERM INVESTMENTS–0.9% | | | | | | | | |
INVESTMENT COMPANIES–0.9% | | | | | | | | |
AB Fixed Income Shares, Inc.–Government Money Market Portfolio–Class AB, 4.43%(c)(d)(e)
(cost $2,345,399) | | | 2,345,399 | | | | 2,345,399 | |
| | | | | | | | |
TOTAL INVESTMENTS BEFORE SECURITY LENDING COLLATERAL FOR SECURITIES LOANED–99.9%
(cost $228,537,562) | | | | | | | 253,812,155 | |
| | | | | | | | |
INVESTMENTS OF CASH COLLATERAL FOR SECURITIES
LOANED–0.2% | | | | | | | | |
INVESTMENT COMPANIES–0.2% | | | | | | | | |
AB Fixed Income Shares, Inc.–Government Money Market Portfolio–Class AB, 4.43%(c)(d)(e)
(cost $598,502) | | | 598,502 | | | | 598,502 | |
| | | | | | | | |
TOTAL INVESTMENTS–100.1%
(cost $229,136,064) | | | | | | | 254,410,657 | |
Other assets less liabilities–(0.1)% | | | | | | | (283,992 | ) |
| | | | | | | | |
NET ASSETS–100.0% | | | | | | $ | 254,126,665 | |
| | | | | | | | |
2
| | |
| |
| | | AB Variable Products Series Fund |
FORWARD CURRENCY EXCHANGE CONTRACTS (see Note D)
| | | | | | | | | | | | | | | | | | | | | | | | |
| Counterparty | | Contracts to
Deliver
(000) | | | In Exchange
For
(000) | | | Settlement
Date | | | Unrealized
Appreciation
(Depreciation) | |
Bank of America, NA | | | GBP | | | | 5,810 | | | | USD | | | | 7,481 | | | | 01/16/2025 | | | $ | 208,469 | |
Bank of America, NA | | | USD | | | | 17,481 | | | | AUD | | | | 26,899 | | | | 02/05/2025 | | | | (831,390 | ) |
Bank of America, NA | | | USD | | | | 3,414 | | | | SGD | | | | 4,596 | | | | 02/14/2025 | | | | (42,788 | ) |
Bank of America, NA | | | USD | | | | 4,374 | | | | JPY | | | | 666,663 | | | | 02/21/2025 | | | | (114,578 | ) |
Bank of America, NA | | | EUR | | | | 20,078 | | | | USD | | | | 21,085 | | | | 02/27/2025 | | | | 238,930 | |
Bank of America, NA | | | TWD | | | | 146,857 | | | | USD | | | | 4,549 | | | | 02/27/2025 | | | | 78,618 | |
BNP Paribas SA | | | CHF | | | | 699 | | | | USD | | | | 784 | | | | 02/27/2025 | | | | 9,117 | |
BNP Paribas SA | | | EUR | | | | 624 | | | | USD | | | | 651 | | | | 02/27/2025 | | | | 2,994 | |
Citibank, NA | | | GBP | | | | 623 | | | | USD | | | | 784 | | | | 01/16/2025 | | | | 3,739 | |
Citibank, NA | | | USD | | | | 821 | | | | GBP | | | | 654 | | | | 01/16/2025 | | | | (2,091 | ) |
Citibank, NA | | | KRW | | | | 4,347,965 | | | | USD | | | | 3,247 | | | | 01/17/2025 | | | | 302,140 | |
Citibank, NA | | | CAD | | | | 11,353 | | | | USD | | | | 8,215 | | | | 02/05/2025 | | | | 307,225 | |
Deutsche Bank AG | | | EUR | | | | 848 | | | | USD | | | | 892 | | | | 02/27/2025 | | | | 11,269 | |
Goldman Sachs Bank USA | | | USD | | | | 2,178 | | | | NOK | | | | 24,088 | | | | 02/05/2025 | | | | (61,772 | ) |
Goldman Sachs Bank USA | | | USD | | | | 689 | | | | JPY | | | | 104,960 | | | | 02/21/2025 | | | | (18,118 | ) |
HSBC Bank USA | | | USD | | | | 291 | | | | KRW | | | | 405,778 | | | | 01/17/2025 | | | | (16,523 | ) |
HSBC Bank USA | | | AUD | | | | 1,719 | | | | USD | | | | 1,095 | | | | 02/05/2025 | | | | 30,952 | |
HSBC Bank USA | | | USD | | | | 2,247 | | | | ILS | | | | 7,989 | | | | 02/20/2025 | | | | (46,914 | ) |
HSBC Bank USA | | | USD | | | | 2,989 | | | | JPY | | | | 455,723 | | | | 02/21/2025 | | | | (77,299 | ) |
HSBC Bank USA | | | EUR | | | | 987 | | | | USD | | | | 1,039 | | | | 02/27/2025 | | | | 14,536 | |
JPMorgan Chase Bank, NA | | | EUR | | | | 675 | | | | USD | | | | 704 | | | | 02/27/2025 | | | | 2,677 | |
Morgan Stanley Capital Services, Inc. | | | GBP | | | | 528 | | | | USD | | | | 666 | | | | 01/16/2025 | | | | 5,531 | |
Morgan Stanley Capital Services, Inc. | | | USD | | | | 1,615 | | | | GBP | | | | 1,273 | | | | 01/16/2025 | | | | (21,870 | ) |
Morgan Stanley Capital Services, Inc. | | | KRW | | | | 1,557,554 | | | | USD | | | | 1,126 | | | | 01/17/2025 | | | | 70,936 | |
Morgan Stanley Capital Services, Inc. | | | USD | | | | 682 | | | | KRW | | | | 935,223 | | | | 01/17/2025 | | | | (48,389 | ) |
Morgan Stanley Capital Services, Inc. | | | USD | | | | 8,741 | | | | SEK | | | | 96,157 | | | | 02/05/2025 | | | | (34,336 | ) |
NatWest Markets PLC | | | CAD | | | | 974 | | | | USD | | | | 699 | | | | 02/05/2025 | | | | 20,558 | |
State Street Bank & Trust Co. | | | USD | | | | 806 | | | | GBP | | | | 637 | | | | 01/16/2025 | | | | (8,601 | ) |
State Street Bank & Trust Co. | | | USD | | | | 268 | | | | KRW | | | | 376,067 | | | | 01/17/2025 | | | | (13,474 | ) |
State Street Bank & Trust Co. | | | USD | | | | 511 | | | | TRY | | | | 18,533 | | | | 01/22/2025 | | | | 3,485 | |
State Street Bank & Trust Co. | | | SEK | | | | 4,627 | | | | USD | | | | 425 | | | | 02/05/2025 | | | | 6,244 | |
State Street Bank & Trust Co. | | | USD | | | | 395 | | | | AUD | | | | 607 | | | | 02/05/2025 | | | | (18,914 | ) |
State Street Bank & Trust Co. | | | USD | | | | 460 | | | | CAD | | | | 663 | | | | 02/05/2025 | | | | 2,029 | |
State Street Bank & Trust Co. | | | USD | | | | 709 | | | | CAD | | | | 1,004 | | | | 02/05/2025 | | | | (9,695 | ) |
State Street Bank & Trust Co. | | | JPY | | | | 131,304 | | | | USD | | | | 863 | | | | 02/21/2025 | | | | 24,423 | |
State Street Bank & Trust Co. | | | JPY | | | | 149,125 | | | | USD | | | | 952 | | | | 02/21/2025 | | | | (807 | ) |
State Street Bank & Trust Co. | | | USD | | | | 121 | | | | EUR | | | | 116 | | | | 02/27/2025 | | | | (617 | ) |
UBS AG | | | HKD | | | | 17,587 | | | | USD | | | | 2,264 | | | | 02/21/2025 | | | | (1,217 | ) |
UBS AG | | | USD | | | | 9,680 | | | | CHF | | | | 8,582 | | | | 02/27/2025 | | | | (169,089 | ) |
UBS AG | | | USD | | | | 2,243 | | | | EUR | | | | 2,151 | | | | 02/27/2025 | | | | (9,832 | ) |
| | | | | | | | | | | | | | | | | | | | | | | | |
| | | | | | | | | | | | | | | | | | | | | | $ | (204,442 | ) |
| | | | | | | | | | | | | | | | | | | | | | | | |
3
| | |
| INTERNATIONAL VALUE PORTFOLIO | | |
| PORTFOLIO OF INVESTMENTS | | |
| |
| (continued) | | AB Variable Products Series Fund |
| (a) | | Represents entire or partial securities out on loan. See Note E for securities lending information. |
| (b) | | Non-income producing security. |
| (c) | | Affiliated investments. |
| (d) | | The rate shown represents the 7-day yield as of period end. |
| (e) | | To obtain a copy of the fund’s shareholder report, please go to the Securities and Exchange Commission’s website at www.sec.gov, or call AB at (800) 227-4618. |
Currency Abbreviations:
AUD—Australian Dollar
CAD—Canadian Dollar
CHF—Swiss Franc
EUR—Euro
GBP—Great British Pound
HKD—Hong Kong Dollar
ILS—Israeli Shekel
JPY—Japanese Yen
KRW—South Korean Won
NOK—Norwegian Krone
SEK—Swedish Krona
SGD—Singapore Dollar
TRY—Turkish Lira
TWD—New Taiwan Dollar
USD—United States Dollar
Glossary:
ADR—American Depositary Receipt
REG—Registered Shares
See notes to financial statements.
4
| | |
| INTERNATIONAL VALUE PORTFOLIO | | |
| STATEMENT OF ASSETS & LIABILITIES | | |
| |
| December 31, 2024 | | AB Variable Products Series Fund |
| | | | |
ASSETS | |
Investments in securities, at value | | | | |
Unaffiliated issuers (cost $226,192,163) | | $ | 251,466,756 | (a) |
Affiliated issuers (cost $2,943,901—including investment of cash collateral for securities loaned of $598,502) | | | 2,943,901 | |
Foreign currencies, at value (cost $249,002) | | | 247,866 | |
Unrealized appreciation on forward currency exchange contracts | | | 1,343,872 | |
Unaffiliated dividends receivable | | | 876,814 | |
Receivable for capital stock sold | | | 151,459 | |
Receivable due from Adviser | | | 52,460 | |
Affiliated dividends receivable | | | 9,459 | |
| | | | |
Total assets | | | 257,092,587 | |
| | | | |
LIABILITIES | |
Unrealized depreciation on forward currency exchange contracts | | | 1,548,314 | |
Payable for collateral received on securities loaned | | | 598,502 | |
Cash collateral due to broker | | | 250,000 | |
Payable for capital stock redeemed | | | 166,117 | |
Advisory fee payable | | | 161,131 | |
Distribution fee payable | | | 44,244 | |
Administrative fee payable | | | 22,179 | |
Transfer Agent fee payable | | | 167 | |
Accrued expenses | | | 175,268 | |
| | | | |
Total liabilities | | | 2,965,922 | |
| | | | |
NET ASSETS | | $ | 254,126,665 | |
| | | | |
COMPOSITION OF NET ASSETS | |
Capital stock, at par | | $ | 16,866 | |
Additional paid-in capital | | | 232,067,619 | |
Distributable earnings | | | 22,042,180 | |
| | | | |
NET ASSETS | | $ | 254,126,665 | |
| | | | |
Net Asset Value Per Share—1 billion shares of capital stock authorized, $.001 par value
| | | | | | | | | | | | |
| Class | | Net Assets | | | Shares
Outstanding | | | Net Asset
Value | |
| | | |
| A | | $ | 45,729,947 | | | | 3,024,441 | | | $ | 15.12 | |
| | | |
| B | | $ | 208,396,718 | | | | 13,841,648 | | | $ | 15.06 | |
| (a) | | Includes securities on loan with a value of $6,602,947 (see Note E). |
See notes to financial statements.
5
| | |
| INTERNATIONAL VALUE PORTFOLIO | | |
| STATEMENT OF OPERATIONS | | |
| |
| Year Ended December 31, 2024 | | AB Variable Products Series Fund |
| | | | |
INVESTMENT INCOME | | | | |
Dividends | | | | |
Unaffiliated issuers (net of foreign taxes withheld of $893,237) | | $ | 8,538,763 | |
Affiliated issuers | | | 320,865 | |
Interest | | | 8,312 | |
Securities lending income | | | 27,167 | |
| | | | |
| | | 8,895,107 | |
| | | | |
EXPENSES | | | | |
Advisory fee (see Note B) | | | 2,098,624 | |
Distribution fee—Class B | | | 584,086 | |
Transfer agency—Class A | | | 951 | |
Transfer agency—Class B | | | 4,795 | |
Printing | | | 101,460 | |
Custody and accounting | | | 95,253 | |
Administrative | | | 92,683 | |
Audit and tax | | | 67,891 | |
Legal | | | 55,332 | |
Directors’ fees | | | 24,383 | |
Miscellaneous | | | 31,805 | |
| | | | |
Total expenses | | | 3,157,263 | |
Less: expenses waived and reimbursed by the Adviser (see Notes B & E) | | | (70,076 | ) |
| | | | |
Net expenses | | | 3,087,187 | |
| | | | |
Net investment income | | | 5,807,920 | |
| | | | |
REALIZED AND UNREALIZED GAIN (LOSS) ON INVESTMENT AND FOREIGN CURRENCY TRANSACTIONS | | | | |
Net realized gain (loss) on: | | | | |
Investment transactions | | | 15,172,084 | |
Forward currency exchange contracts | | | (1,739,118 | ) |
Foreign currency transactions | | | (5,961 | ) |
Net change in unrealized appreciation (depreciation) of: | | | | |
Investments | | | (4,007,818 | ) |
Forward currency exchange contracts | | | (1,033,654 | ) |
Foreign currency denominated assets and liabilities | | | (61,569 | ) |
| | | | |
Net gain on investment and foreign currency transactions | | | 8,323,964 | |
| | | | |
NET INCREASE IN NET ASSETS FROM OPERATIONS | | $ | 14,131,884 | |
| | | | |
See notes to financial statements.
6
| | |
| | | |
| INTERNATIONAL VALUE PORTFOLIO | | |
| |
| STATEMENT OF CHANGES IN NET ASSETS | | AB Variable Products Series Fund |
| | | | | | | | |
| | | Year Ended
December 31,
2024 | | | Year Ended
December 31,
2023 | |
INCREASE (DECREASE) IN NET ASSETS FROM OPERATIONS | | | | | | | | |
Net investment income | | $ | 5,807,920 | | | $ | 5,106,075 | |
Net realized gain (loss) on investment and foreign currency transactions | | | 13,427,005 | | | | (953,321 | ) |
Net change in unrealized appreciation (depreciation) of investments and foreign currency denominated assets and liabilities | | | (5,103,041 | ) | | | 33,042,877 | |
| | | | | | | | |
Net increase in net assets from operations | | | 14,131,884 | | | | 37,195,631 | |
Distributions to Shareholders | | | | | | | | |
Class A | | | (1,259,417 | ) | | | (355,217 | ) |
Class B | | | (5,086,573 | ) | | | (1,645,638 | ) |
CAPITAL STOCK TRANSACTIONS | | | | | | | | |
Net decrease | | | (39,227,503 | ) | | | (12,883,371 | ) |
| | | | | | | | |
Total increase (decrease) | | | (31,441,609 | ) | | | 22,311,405 | |
NET ASSETS | | | | | | | | |
Beginning of period | | | 285,568,274 | | | | 263,256,869 | |
| | | | | | | | |
End of period | | $ | 254,126,665 | | | $ | 285,568,274 | |
| | | | | | | | |
See notes to financial statements.
7
| | |
| INTERNATIONAL VALUE PORTFOLIO | | |
| NOTES TO FINANCIAL STATEMENTS | | |
| |
| December 31, 2024 | | AB Variable Products Series Fund |
NOTE A: Significant Accounting Policies
The AB International Value Portfolio (the “Portfolio”) is a series of AB Variable Products Series Fund, Inc. (the “Fund”). The Portfolio’s investment objective is long-term growth of capital. The Portfolio is diversified as defined under the Investment Company Act of 1940 (the “1940 Act”). The Fund was incorporated in the State of Maryland as an open-end series investment company. The Fund offers nine separately managed pools of assets which have differing investment objectives and policies. The Portfolio offers Class A and Class B shares. Both classes of shares have identical voting, dividend, liquidating and other rights, except that Class B shares bear a distribution expense and have exclusive voting rights with respect to the Class B distribution plan.
The Portfolio offers and sells its shares only to separate accounts of certain life insurance companies for the purpose of funding variable annuity contracts and variable life insurance policies. Sales are made without a sales charge at the Portfolio’s net asset value per share.
The financial statements have been prepared in conformity with U.S. generally accepted accounting principles (“U.S. GAAP”), which require management to make certain estimates and assumptions that affect the reported amounts of assets and liabilities in the financial statements and amounts of income and expenses during the reporting period. Actual results could differ from those estimates. The Portfolio is an investment company under U.S. GAAP and follows the accounting and reporting guidance applicable to investment companies. The following is a summary of significant accounting policies followed by the Portfolio.
1. Security Valuation
Portfolio securities are valued at market value determined on the basis of market quotations or, if market quotations are not readily available or are unreliable, at “fair value” as determined in accordance with procedures approved by and under the oversight of the Fund’s Board of Directors (the “Board”). Pursuant to these procedures, AllianceBernstein L.P. (the “Adviser”) serves as the Portfolio’s valuation designee pursuant to Rule 2a-5 of the 1940 Act. In this capacity, the Adviser is responsible, among other things, for making all fair value determinations relating to the Portfolio’s portfolio investments, subject to the Board’s oversight.
In general, the market values of securities which are readily available and deemed reliable are determined as follows: securities listed on a national securities exchange (other than securities listed on the NASDAQ Stock Market, Inc. (“NASDAQ”)) or on a foreign securities exchange are valued at the last sale price at the close of the exchange or foreign securities exchange. If there has been no sale on such day, the securities are valued at the last traded price from the previous day. Securities listed on more than one exchange are valued by reference to the principal exchange on which the securities are traded; securities listed only on NASDAQ are valued in accordance with the NASDAQ Official Closing Price; listed or over the counter (“OTC”) market put or call options are valued at the mid level between the current bid and ask prices. If either a current bid or current ask price is unavailable, the Adviser will have discretion to determine the best valuation (e.g., last trade price in the case of listed options); open futures are valued using the closing settlement price or, in the absence of such a price, the most recent quoted bid price. If there are no quotations available for the day of valuation, the last available closing settlement price is used; U.S. Government securities and any other debt instruments having 60 days or less remaining until maturity are generally valued at market by an independent pricing vendor, if a market price is available. If a market price is not available, the securities are valued at amortized cost. This methodology is commonly used for short term securities that have an original maturity of 60 days or less, as well as short term securities that had an original term to maturity that exceeded 60 days. In instances when amortized cost is utilized, the Valuation Committee (the “Committee”) must reasonably conclude that the utilization of amortized cost is approximately the same as the fair value of the security. Factors the Committee will consider include, but are not limited to, an impairment of the creditworthiness of the issuer or material changes in interest rates. Fixed-income securities, including mortgage-backed and asset-backed securities, may be valued on the basis of prices provided by a pricing service or at a price obtained from one or more of the major broker-dealers. In cases where broker-dealer quotes are obtained, the Adviser may establish procedures whereby changes in market yields or spreads are used to adjust, on a daily basis, a recently obtained quoted price on a security. Swaps and other derivatives are valued daily, primarily using independent pricing services, independent pricing models using market inputs, as well as third party broker-dealers or counterparties. Open-end mutual funds are valued at the closing net asset value per share, while exchange-traded funds are valued at the closing market price per share.
Securities for which market quotations are not readily available (including restricted securities) or are deemed unreliable are valued at fair value as deemed appropriate by the Adviser. Factors considered in making this determination may include, but
8
| | |
| |
| | | AB Variable Products Series Fund |
are not limited to, information obtained by contacting the issuer, analysts, analysis of the issuer’s financial statements or other available documents. In addition, the Portfolio may use fair value pricing for securities primarily traded in non-U.S. markets because most foreign markets close well before the Portfolio values its securities at 4:00 p.m., Eastern Time. The earlier close of these foreign markets gives rise to the possibility that significant events, including broad market moves, may have occurred in the interim and may materially affect the value of those securities. To account for this, the Portfolio generally values many of its foreign equity securities using fair value prices based on third party vendor modeling tools to the extent available.
2. Fair Value Measurements
In accordance with U.S. GAAP regarding fair value measurements, fair value is defined as the price that the Portfolio would receive to sell an asset or pay to transfer a liability in an orderly transaction between market participants at the measurement date. U.S. GAAP establishes a framework for measuring fair value, and a three-level hierarchy for fair value measurements based upon the transparency of inputs to the valuation of an asset or liability (including those valued based on their market values as described in Note A.1 above). Inputs may be observable or unobservable and refer broadly to the assumptions that market participants would use in pricing the asset or liability. Observable inputs reflect the assumptions market participants would use in pricing the asset or liability based on market data obtained from sources independent of the Portfolio. Unobservable inputs reflect the Portfolio’s own assumptions about the assumptions that market participants would use in pricing the asset or liability based on the best information available in the circumstances. Each investment is assigned a level based upon the observability of the inputs which are significant to the overall valuation. The three-tier hierarchy of inputs is summarized below.
| | • | | Level 1—quoted prices in active markets for identical investments |
| | • | | Level 2—other significant observable inputs (including quoted prices for similar investments, interest rates, prepayment speeds, credit risk, etc.) |
| | • | | Level 3—significant unobservable inputs (including the Portfolio’s own assumptions in determining the fair value of investments) |
The fair value of debt instruments, such as bonds, and over-the-counter derivatives is generally based on market price quotations, recently executed market transactions (where observable) or industry recognized modeling techniques and are generally classified as Level 2. Pricing vendor inputs to Level 2 valuations may include quoted prices for similar investments in active markets, interest rate curves, coupon rates, currency rates, yield curves, option adjusted spreads, default rates, credit spreads and other unique security features in order to estimate the relevant cash flows which are then discounted to calculate fair values. If these inputs are unobservable and significant to the fair value, these investments will be classified as Level 3.
Where readily available market prices or relevant bid prices are not available for certain equity investments, such investments may be valued based on similar publicly traded investments, movements in relevant indices since last available prices or based upon underlying company fundamentals and comparable company data (such as multiples to earnings or other multiples to equity). Where an investment is valued using an observable input, such as another publicly traded security, the investment will be classified as Level 2. If management determines that an adjustment is appropriate based on restrictions on resale, illiquidity or uncertainty, and such adjustment is a significant component of the valuation, the investment will be classified as Level 3. An investment will also be classified as Level 3 where management uses company fundamentals and other significant inputs to determine the valuation.
The following table summarizes the valuation of the Portfolio’s investments by the above fair value hierarchy levels as of December 31, 2024:
| | | | | | | | | | | | | | | | |
| | | Level 1 | | | Level 2 | | | Level 3 | | | Total | |
Investments in Securities: | | | | | | | | | | | | | | | | |
Assets: | | | | | | | | | | | | | | | | |
Common Stocks: | | | | | | | | | | | | | | | | |
Industrials | | $ | 7,331,596 | | | $ | 40,567,374 | | | $ | –0 | – | | $ | 47,898,970 | |
Financials | | | –0 | – | | | 38,377,533 | | | | –0 | – | | | 38,377,533 | |
Consumer Discretionary | | | –0 | – | | | 29,970,629 | | | | –0 | – | | | 29,970,629 | |
Health Care | | | –0 | – | | | 28,948,697 | | | | –0 | – | | | 28,948,697 | |
Consumer Staples | | | 10,734,743 | | | | 14,212,624 | | | | –0 | – | | | 24,947,367 | |
9
| | |
| INTERNATIONAL VALUE PORTFOLIO | | |
| NOTES TO FINANCIAL STATEMENTS | | |
| |
| (continued) | | AB Variable Products Series Fund |
| | | | | | | | | | | | | | | | |
| | | Level 1 | | | Level 2 | | | Level 3 | | | Total | |
Materials | | $ | 8,378,717 | | | $ | 13,285,753 | | | $ | –0 | – | | $ | 21,664,470 | |
Energy | | | 4,795,653 | | | | 16,104,862 | | | | –0 | – | | | 20,900,515 | |
Information Technology | | | 3,135,209 | | | | 13,541,650 | | | | –0 | – | | | 16,676,859 | |
Communication Services | | | –0 | – | | | 13,744,810 | | | | –0 | – | | | 13,744,810 | |
Utilities | | | –0 | – | | | 8,336,906 | | | | –0 | – | | | 8,336,906 | |
Short-Term Investments | | | 2,345,399 | | | | –0 | – | | | –0 | – | | | 2,345,399 | |
Investments of Cash Collateral for Securities Loaned in Affiliated Money Market Fund | | | 598,502 | | | | –0 | – | | | –0 | – | | | 598,502 | |
| | | | | | | | | | | | | | | | |
Total Investments in Securities | | | 37,319,819 | | | | 217,090,838 | (a) | | | –0 | – | | | 254,410,657 | |
Other Financial Instruments(b): | | | | | | | | | | | | | | | | |
Assets: | | | | | | | | | | | | | | | | |
Forward Currency Exchange Contracts | | | –0 | – | | | 1,343,872 | | | | –0 | – | | | 1,343,872 | |
Liabilities: | | | | | | | | | | | | | | | | |
Forward Currency Exchange Contracts | | | –0 | – | | | (1,548,314 | ) | | | –0 | – | | | (1,548,314 | ) |
| | | | | | | | | | | | | | | | |
Total | | $ | 37,319,819 | | | $ | 216,886,396 | | | $ | –0 | – | | $ | 254,206,215 | |
| | | | | | | | | | | | | | | | |
| (a) | | A significant portion of the Portfolio’s foreign equity investments are categorized as Level 2 investments since they are valued using fair value prices based on third party vendor modeling tools to the extent available, see Note A.1. |
| (b) | | Other financial instruments include derivative instruments, such as futures, forwards and swaps. Derivative instruments are valued at the unrealized appreciation (depreciation) on the instrument. Other financial instruments may also include swaps with upfront premiums, written options and written swaptions which are valued at market value. |
3. Currency Translation
Assets and liabilities denominated in foreign currencies and commitments under forward currency exchange contracts are translated into U.S. dollars at the mean of the quoted bid and ask prices of such currencies against the U.S. dollar. Purchases and sales of portfolio securities are translated into U.S. dollars at the rates of exchange prevailing when such securities were acquired or sold. Income and expenses are translated into U.S. dollars at rates of exchange prevailing when accrued.
Net realized gain or loss on foreign currency transactions represents foreign exchange gains and losses from sales and maturities of foreign fixed income investments, holding of foreign currencies, currency gains or losses realized between the trade and settlement dates on foreign investment transactions, and the difference between the amounts of dividends, interest and foreign withholding taxes recorded on the Portfolio’s books and the U.S. dollar equivalent amounts actually received or paid. Net unrealized currency gains and losses from valuing foreign currency denominated assets and liabilities at period end exchange rates are reflected as a component of net unrealized appreciation or depreciation of foreign currency denominated assets and liabilities.
4. Taxes
It is the Portfolio’s policy to meet the requirements of the Internal Revenue Code applicable to regulated investment companies and to distribute all of its investment company taxable income and net realized gains, if any, to shareholders. Therefore, no provisions for federal income or excise taxes are required. The Portfolio may be subject to taxes imposed by countries in which it invests. Such taxes are generally based on income and/or capital gains earned or repatriated. Taxes are accrued and applied to net investment income, net realized gains and net unrealized appreciation/depreciation as such income and/or gains are earned.
In accordance with U.S. GAAP requirements regarding accounting for uncertainties in income taxes, management has analyzed the Portfolio’s tax positions taken or expected to be taken on federal and state income tax returns for all open tax years (the current and the prior three tax years) and has concluded that no provision for income tax is required in the Portfolio’s financial statements.
5. Investment Income and Investment Transactions
Dividend income is recorded on the ex-dividend date or as soon as the Portfolio is informed of the dividend. Interest income is accrued daily. Investment transactions are accounted for on the date the securities are purchased or sold. Investment gains or losses are determined on the identified cost basis. Non-cash dividends, if any, are recorded on the ex-dividend date at the fair value of the securities received. The Portfolio amortizes premiums and accretes discounts as adjustments to interest
10
| | |
| |
| | | AB Variable Products Series Fund |
income. The Portfolio accounts for distributions received from real estate investment trust (“REIT”) investments or from regulated investment companies as dividend income, realized gain, or return of capital based on information provided by the REIT or the investment company.
6. Class Allocations
All income earned and expenses incurred by the Portfolio are borne on a pro-rata basis by each outstanding class of shares, based on the proportionate interest in the Portfolio represented by the net assets of such class, except for class specific expenses which are allocated to the respective class. Expenses of the Fund are charged proportionately to each portfolio or based on other appropriate methods. Realized and unrealized gains and losses are allocated among the various share classes based on respective net assets.
7. Dividends and Distributions
Dividends and distributions to shareholders, if any, are recorded on the ex-dividend date. Income dividends and capital gains distributions are determined in accordance with federal tax regulations and may differ from those determined in accordance with U.S. GAAP. To the extent these differences are permanent, such amounts are reclassified within the capital accounts based on their federal tax basis treatment; temporary differences do not require such reclassification.
8. Cash and Cash Equivalents
Cash and short-term investments include cash on hand and short-term investments with maturities of less than one year when purchased.
9. Segment Information
The Portfolio represents a single operating segment. An operating segment is defined in U.S. GAAP as a component of a public entity that engages in business activities from which it may recognize revenues and incur expenses, has operating results that are regularly reviewed by the public entity’s chief operating decision maker (“CODM”) to make decisions about resources to be allocated to the segment and assess its performance, and has discrete financial information available. The Portfolio’s President is the CODM. The CODM monitors the operating results of the Portfolio as a whole and the pre-determined Portfolio’s long term investment strategy, which is executed by the portfolio management group. The qualitative and quantitative information contained within the financial statements is used by the CODM to assess the segments performance versus the Portfolio’s comparative benchmark and to make resource allocation decisions. Segment assets are reflected on the statement of assets and liabilities and segment expenses are listed on the statement of operations.
NOTE B: Advisory Fee and Other Transactions with Affiliates
Under the terms of the investment advisory agreement, the Portfolio pays the Adviser an advisory fee at an annual rate of .75% of the first $2.5 billion, .65% of the next $2.5 billion and .60% in excess of $5 billion, of the Portfolio’s average daily net assets. The fee is accrued daily and paid monthly. The Adviser has agreed to waive its fees and bear certain expenses to the extent necessary to limit total operating expenses on an annual basis (the “Expense Caps”) to 1.20% and 1.45% of daily average net assets for Class A and Class B shares, respectively. Effective June 1, 2024, the Adviser has voluntarily agreed to waive its fees and bear certain expenses to the extent necessary to limit total operating expenses on an annual basis to .92% and 1.17% of the daily average net assets for the Class A and Class B, respectively. For the year ended December 31, 2024, such reimbursements/waivers amounted to $56,174.
Pursuant to the investment advisory agreement, the Portfolio may reimburse the Adviser for certain legal and accounting services provided to the Portfolio by the Adviser. For the year ended December 31, 2024, the reimbursement for such services amounted to $92,683.
The Portfolio compensates AllianceBernstein Investor Services, Inc. (“ABIS”), a wholly-owned subsidiary of the Adviser, under a Transfer Agency Agreement for providing personnel and facilities to perform transfer agency services for the Portfolio. Such compensation retained by ABIS amounted to $1,950 for the year ended December 31, 2024.
The Portfolio may invest in AB Government Money Market Portfolio which has a contractual annual advisory fee rate of .20% of the portfolio’s average daily net assets and bears its own expenses. The Adviser had contractually agreed to waive .10% of the advisory fee of AB Government Money Market Portfolio (resulting in a net advisory fee of .10%) until August 31, 2023. Effective September 1, 2023, the Adviser has contractually agreed to waive .05% of the advisory fee of AB Government Money Market Portfolio (resulting in a net advisory fee of .15%) until August 31, 2024. In connection with
11
| | |
| INTERNATIONAL VALUE PORTFOLIO | | |
| NOTES TO FINANCIAL STATEMENTS | | |
| |
| (continued) | | AB Variable Products Series Fund |
the investment by the Portfolio in AB Government Money Market Portfolio, the Adviser has contractually agreed to waive its advisory fee from the Portfolio in an amount equal to the Portfolio’s pro rata share of the effective advisory fee of AB Government Money Market Portfolio, as borne indirectly by the Portfolio as an acquired fund fee and expense. For the year ended December 31, 2024, such waiver amounted to $9,667.
A summary of the Portfolio’s transactions in AB mutual funds for the year ended December 31, 2024 is as follows:
| | | | | | | | | | | | | | | | | | | | |
Portfolio | | Market Value
12/31/23
(000) | | | Purchases
at Cost
(000) | | | Sales
Proceeds
(000) | | | Market Value
12/31/24
(000) | | | Dividend
Income
(000) | |
AB Government Money Market Portfolio | | $ | 3,119 | | | $ | 94,643 | | | $ | 95,417 | | | $ | 2,345 | | | $ | 321 | |
AB Government Money Market Portfolio* | | | 273 | | | | 60,530 | | | | 60,204 | | | | 599 | | | | –0 | – |
| | | | | | | | | | | | | | | | | | | | |
Total | | | | | | | | | | | | | | $ | 2,944 | | | $ | 321 | |
| | | | | | | | | | | | | | | | | | | | |
| * | | Investments of cash collateral for securities lending transactions (see Note E). |
NOTE C: Distribution Plan
The Portfolio has adopted a Distribution Plan (the “Plan”) for Class B shares pursuant to Rule 12b-1 under the 1940 Act. Under the Plan, the Portfolio pays distribution and servicing fees to AllianceBernstein Investments, Inc. (the “Distributor”), a wholly-owned subsidiary of the Adviser, at an annual rate of up to .50% of the Portfolio’s average daily net assets attributable to Class B shares. The fees are accrued daily and paid monthly. The Board currently limits payments under the Plan to .25% of the Portfolio’s average daily net assets attributable to Class B shares. The Plan provides that the Distributor will use such payments in their entirety for distribution assistance and promotional activities.
The Portfolio is not obligated under the Plan to pay any distribution and servicing fees in excess of the amounts set forth above. The purpose of the payments to the Distributor under the Plan is to compensate the Distributor for its distribution services with respect to the sale of the Portfolio’s Class B shares. Since the Distributor’s compensation is not directly tied to its expenses, the amount of compensation received by it under the Plan during any year may be more or less than its actual expenses. For this reason, the Plan is characterized by the staff of the Securities and Exchange Commission as being of the “compensation” variety.
In the event that the Plan is terminated or not continued, no distribution or servicing fees (other than current amounts accrued but not yet paid) would be owed by the Portfolio to the Distributor.
The Plan also provides that the Adviser may use its own resources to finance the distribution of the Portfolio’s shares.
NOTE D: Investment Transactions
Purchases and sales of investment securities (excluding short-term investments) for the year ended December 31, 2024 were as follows:
| | | | | | | | |
| | | Purchases | | | Sales | |
Investment securities (excluding U.S. government securities) | | $ | 137,615,915 | | | $ | 175,695,768 | |
U.S. government securities | | | –0 | – | | | –0 | – |
The cost of investments for federal income tax purposes, gross unrealized appreciation and unrealized depreciation are as follows:
| | | | |
Cost | | $ | 231,598,285 | |
| | | | |
Gross unrealized appreciation | | $ | 39,954,970 | |
Gross unrealized depreciation | | | (17,107,986 | ) |
| | | | |
Net unrealized appreciation | | $ | 22,846,984 | |
| | | | |
12
| | |
| |
| | | AB Variable Products Series Fund |
1. Derivative Financial Instruments
The Portfolio may use derivatives in an effort to earn income and enhance returns, to replace more traditional direct investments, to obtain exposure to otherwise inaccessible markets (collectively, “investment purposes”), or to hedge or adjust the risk profile of its portfolio.
The principal type of derivative utilized by the Portfolio, as well as the methods in which they may be used are:
| | • | | Forward Currency Exchange Contracts |
The Portfolio may enter into forward currency exchange contracts in order to hedge its exposure to changes in foreign currency exchange rates on its foreign portfolio holdings, to hedge certain firm purchase and sale commitments denominated in foreign currencies and for non-hedging purposes as a means of making direct investments in foreign currencies, as described below under “Currency Transactions”.
A forward currency exchange contract is a commitment to purchase or sell a foreign currency at a future date at a negotiated forward rate. The gain or loss arising from the difference between the original contract and the closing of such contract would be included in net realized gain or loss on forward currency exchange contracts. Fluctuations in the value of open forward currency exchange contracts are recorded for financial reporting purposes as unrealized appreciation and/or depreciation by the Portfolio. Risks may arise from the potential inability of a counterparty to meet the terms of a contract and from unanticipated movements in the value of a foreign currency relative to the U.S. dollar.
During the year ended December 31, 2024, the Portfolio held forward currency exchange contracts for hedging purposes.
The Portfolio typically enters into International Swaps and Derivatives Association, Inc. Master Agreements (“ISDA Master Agreement”) with its OTC derivative contract counterparties in order to, among other things, reduce its credit risk to OTC counterparties. ISDA Master Agreements include provisions for general obligations, representations, collateral and events of default or termination. Under an ISDA Master Agreement, the Portfolio typically may offset with the OTC counterparty certain derivative financial instruments’ payables and/or receivables with collateral held and/or posted and create one single net payment (close-out netting) in the event of default or termination. In the event of a default by an OTC counterparty, the return of collateral with market value in excess of the Portfolio’s net liability, held by the defaulting party, may be delayed or denied.
The Portfolio’s ISDA Master Agreements may contain provisions for early termination of OTC derivative transactions in the event the net assets of the Portfolio decline below specific levels (“net asset contingent features”). If these levels are triggered, the Portfolio’s OTC counterparty has the right to terminate such transaction and require the Portfolio to pay or receive a settlement amount in connection with the terminated transaction. If OTC derivatives were held at period end, please refer to netting arrangements by the OTC counterparty table below for additional details.
During the year ended December 31, 2024, the Portfolio had entered into the following derivatives:
| | | | | | | | | | | | |
| | | Asset Derivatives | | | Liability Derivatives | |
Derivative Type | | Statement of
Assets and Liabilities Location | | Fair Value | | | Statement of
Assets and Liabilities Location | | Fair Value | |
Foreign currency contracts | | Unrealized appreciation on forward currency exchange contracts | | $ | 1,343,872 | | | Unrealized depreciation on forward currency exchange contracts | | $ | 1,548,314 | |
| | | | | | | | | | | | |
Total | | | | $ | 1,343,872 | | | | | $ | 1,548,314 | |
| | | | | | | | | | | | |
| | | | | | | | | | | | |
Derivative Type | | Location of Gain or (Loss) on Derivatives
Within Statement of Operations | | Realized Gain or
(Loss) on
Derivatives | | | Change in Unrealized
Appreciation or
(Depreciation) | |
Foreign currency contracts | | Net realized gain (loss) on forward currency exchange contracts; Net change in unrealized appreciation (depreciation) of forward currency exchange contracts | | $ | (1,739,118 | ) | | $ | (1,033,654 | ) |
| | | | | | | | | | |
Total | | | | $ | (1,739,118 | ) | | $ | (1,033,654 | ) |
| | | | | | | | | | |
13
| | |
| INTERNATIONAL VALUE PORTFOLIO | | |
| NOTES TO FINANCIAL STATEMENTS | | |
| |
| (continued) | | AB Variable Products Series Fund |
The following table represents the average monthly volume of the Portfolio’s derivative transactions during the year ended December 31, 2024:
| | | | |
Forward Currency Exchange Contracts: | | | | |
Average principal amount of buy contracts | | $ | 81,448,559 | |
Average principal amount of sale contracts | | $ | 69,784,980 | |
For financial reporting purposes, the Portfolio does not offset derivative assets and derivative liabilities that are subject to netting arrangements in the statement of assets and liabilities.
All OTC derivatives held at period end were subject to netting arrangements. The following table presents the Portfolio’s derivative assets and liabilities by OTC counterparty net of amounts available for offset under ISDA Master Agreements (“MA”) and net of the related collateral received/pledged by the Portfolio as of December 31, 2024. Exchange-traded derivatives and centrally cleared swaps are not subject to netting arrangements and as such are excluded from the table.
| | | | | | | | | | | | | | | | | | | | |
Counterparty | | Derivative Assets
Subject to a MA | | | Derivatives
Available for
Offset | | | Cash Collateral
Received* | | | Security Collateral
Received* | | | Net Amount of
Derivative
Assets | |
Bank of America, NA | | $ | 526,017 | | | $ | (526,017 | ) | | $ | –0 | – | | $ | –0 | – | | $ | –0 | – |
BNP Paribas SA | | | 12,111 | | | | –0 | – | | | –0 | – | | | –0 | – | | | 12,111 | |
Citibank, NA | | | 613,104 | | | | (2,091 | ) | | | (250,000 | ) | | | –0 | – | | | 361,013 | |
Deutsche Bank AG | | | 11,269 | | | | –0 | – | | | –0 | – | | | –0 | – | | | 11,269 | |
HSBC Bank USA | | | 45,488 | | | | (45,488 | ) | | | –0 | – | | | –0 | – | | | –0 | – |
JPMorgan Chase Bank, NA | | | 2,677 | | | | –0 | – | | | –0 | – | | | –0 | – | | | 2,677 | |
Morgan Stanley Capital Services, Inc. | | | 76,467 | | | | (76,467 | ) | | | –0 | – | | | –0 | – | | | –0 | – |
NatWest Markets PLC | | | 20,558 | | | | –0 | – | | | –0 | – | | | –0 | – | | | 20,558 | |
State Street Bank & Trust Co. | | | 36,181 | | | | (36,181 | ) | | | –0 | – | | | –0 | – | | | –0 | – |
| | | | | | | | | | | | | | | | | | | | |
Total | | $ | 1,343,872 | | | $ | (686,244 | ) | | $ | (250,000 | ) | | $ | –0 | – | | $ | 407,628 | ^ |
| | | | | | | | | | | | | | | | | | | | |
| | | | | |
Counterparty | | Derivative Liabilities
Subject to a MA | | | Derivatives
Available for
Offset | | | Cash Collateral
Pledged* | | | Security Collateral
Pledged* | | | Net Amount of
Derivative
Liabilities | |
Bank of America, NA | | $ | 988,756 | | | $ | (526,017 | ) | | $ | –0 | – | | $ | –0 | – | | $ | 462,739 | |
Citibank, NA | | | 2,091 | | | | (2,091 | ) | | | –0 | – | | | –0 | – | | | –0 | – |
Goldman Sachs Bank USA | | | 79,890 | | | | –0 | – | | | –0 | – | | | –0 | – | | | 79,890 | |
HSBC Bank USA | | | 140,736 | | | | (45,488 | ) | | | –0 | – | | | –0 | – | | | 95,248 | |
Morgan Stanley Capital Services, Inc. | | | 104,595 | | | | (76,467 | ) | | | –0 | – | | | –0 | – | | | 28,128 | |
State Street Bank & Trust Co. | | | 52,108 | | | | (36,181 | ) | | | –0 | – | | | –0 | – | | | 15,927 | |
UBS AG | | | 180,138 | | | | –0 | – | | | –0 | – | | | –0 | – | | | 180,138 | |
| | | | | | | | | | | | | | | | | | | | |
Total | | $ | 1,548,314 | | | $ | (686,244 | ) | | $ | –0 | – | | $ | –0 | – | | $ | 862,070 | ^ |
| | | | | | | | | | | | | | | | | | | | |
| * | | The actual collateral received/pledged may be more than the amount reported due to over-collateralization. |
| ^ | | Net amount represents the net receivable/payable that would be due from/to the counterparty in the event of default or termination. The net amount from OTC financial derivative instruments can only be netted across transactions governed under the same master agreement with the same counterparty. |
2. Currency Transactions
The Portfolio may invest in non-U.S. Dollar-denominated securities on a currency hedged or unhedged basis. The Portfolio may seek investment opportunities by taking long or short positions in currencies through the use of currency-related derivatives, including forward currency exchange contracts, futures and options on futures, swaps, and other options. The Portfolio may enter into transactions for investment opportunities when it anticipates that a foreign currency will appreciate or depreciate in value but securities denominated in that currency are not held by the Portfolio and do not present attractive investment opportunities. Such transactions may also be used when the Adviser believes that it may be more efficient than a direct investment in a foreign currency-denominated security. The Portfolio may also conduct currency exchange contracts on a spot basis (i.e., for cash at the spot rate prevailing in the currency exchange market for buying or selling currencies).
14
| | |
| |
| | | AB Variable Products Series Fund |
NOTE E: Securities Lending
The Portfolio may enter into securities lending transactions. Under the Portfolio’s securities lending program, all loans of securities will be collateralized continually by cash collateral and/or non-cash collateral. Non-cash collateral will include only securities issued or guaranteed by the U.S. government or its agencies or instrumentalities. If the Portfolio cannot sell or repledge any non-cash collateral, such collateral will not be reflected in the portfolio of investments. If a loan is collateralized by cash, the Portfolio will be compensated for the loan from a portion of the net return from the income earned on cash collateral after a rebate is paid to the borrower (in some cases, this rebate may be a “negative rebate” or fee paid by the borrower to the Portfolio in connection with the loan), and payments are made for fees of the securities lending agent and for certain other administrative expenses. If the Portfolio receives non-cash collateral, the Portfolio will receive a fee from the borrower generally equal to a negotiated percentage of the market value of the loaned securities. The Portfolio will have the right to call a loan and obtain the securities loaned at any time on notice to the borrower within the normal and customary settlement time for the securities. While the securities are on loan, the borrower is obligated to pay the Portfolio amounts equal to any dividend income or other distributions from the securities; however, these distributions will not be afforded the same preferential tax treatment as qualified dividends. The Portfolio will not be able to exercise voting rights with respect to any securities during the existence of a loan, but will have the right to regain ownership of loaned securities in order to exercise voting or other ownership rights. Collateral received and securities loaned are marked to market daily to ensure that the securities loaned are secured by collateral. The lending agent currently invests the cash collateral received in AB Government Money Market Portfolio, an eligible money market vehicle, in accordance with the investment restrictions of the Portfolio, and as approved by the Board. The collateral received on securities loaned is recorded as an asset as well as a corresponding liability in the statement of assets and liabilities. The collateral will be adjusted the next business day to maintain the required collateral amount. The amounts of securities lending income from the borrowers and AB Government Money Market Portfolio are reflected in the statement of operations. When the Portfolio earns net securities lending income from AB Government Money Market Portfolio, the income is inclusive of a rebate expense paid to the borrower. In connection with the cash collateral investment by the Portfolio in AB Government Money Market Portfolio, the Adviser has agreed to waive a portion of the Portfolio’s share of the advisory fees of AB Government Money Market Portfolio, as borne indirectly by the Portfolio as an acquired fund fee and expense. When the Portfolio lends securities, its investment performance will continue to reflect changes in the value of the securities loaned. A principal risk of lending portfolio securities is that the borrower may fail to return the loaned securities upon termination of the loan and that the collateral will not be sufficient to replace the loaned securities. The lending agent has agreed to indemnify the Portfolio in the case of default of any securities borrower.
A summary of the Portfolio’s transactions surrounding securities lending for the year ended December 31, 2024 is as follows:
| | | | | | | | | | | | | | | | | | | | | | |
| | | | | | | | | | | | | AB Government Money
Market Portfolio | |
Market Value of
Securities on Loan* | | | Cash Collateral* | | | Market Value of
Non-Cash
Collateral* | | | Income from
Borrowers | | | Income Earned | | | Advisory Fee
Waived | |
| $ | 6,602,947 | | | $ | 598,502 | | | $ | 6,273,456 | | | $ | 27,167 | | | $ | –0 | – | | $ | 4,235 | |
| * | | As of December 31, 2024. |
NOTE F: Capital Stock
Each class consists of 500,000,000 authorized shares. Transactions in capital shares for each class were as follows:
| | | | | | | | | | | | | | | | | | | | |
| | | SHARES | | | | | | AMOUNT | |
| | | Year Ended
December 31,
2024 | | | Year Ended
December 31,
2023 | | | | | | Year Ended
December 31,
2024 | | | Year Ended
December 31,
2023 | |
Class A | |
Shares sold | | | 354,407 | | | | 416,897 | | | | | | | $ | 5,462,071 | | | $ | 5,999,806 | |
Shares issued in reinvestment of dividends | | | 82,007 | | | | 24,650 | | | | | | | | 1,259,417 | | | | 355,217 | |
Shares redeemed | | | (405,948 | ) | | | (551,140 | ) | | | | | | | (6,306,092 | ) | | | (7,835,184 | ) |
| | | | | | | | | | | | | | | | | | | | |
Net increase (decrease) | | | 30,466 | | | | (109,593 | ) | | | | | | $ | 415,396 | | | $ | (1,480,161 | ) |
| | | | | | | | | | | | | | | | | | | | |
15
| | |
| INTERNATIONAL VALUE PORTFOLIO | | |
| NOTES TO FINANCIAL STATEMENTS | | |
| |
| (continued) | | AB Variable Products Series Fund |
| | | | | | | | | | | | | | | | | | | | |
| | | SHARES | | | | | | AMOUNT | |
| | | Year Ended
December 31,
2024 | | | Year Ended
December 31,
2023 | | | | | | Year Ended
December 31,
2024 | | | Year Ended
December 31,
2023 | |
Class B | |
Shares sold | | | 892,064 | | | | 2,539,673 | | | | | | | $ | 14,003,321 | | | $ | 37,164,439 | |
Shares issued on reinvestment of dividends | | | 332,521 | | | | 114,759 | | | | | | | | 5,086,573 | | | | 1,645,638 | |
Shares redeemed | | | (3,786,600 | ) | | | (3,547,605 | ) | | | | | | | (58,732,793 | ) | | | (50,213,287 | ) |
| | | | | | | | | | | | | | | | | | | | |
Net decrease | | | (2,562,015 | ) | | | (893,173 | ) | | | | | | $ | (39,642,899 | ) | | $ | (11,403,210 | ) |
| | | | | | | | | | | | | | | | | | | | |
At December 31, 2024, certain shareholders of the Portfolio owned 55% in aggregate of the Portfolio’s outstanding shares. Significant transactions by such shareholders, if any, may impact the Portfolio’s performance.
NOTE G: Risks Involved in Investing in the Portfolio
Market Risk—The value of the Portfolio’s assets will fluctuate as the market or markets in which the Portfolio invests fluctuate. The value of the Portfolio’s investments may decline, sometimes rapidly and unpredictably, simply because of economic changes or other events, including public health crises (including the occurrence of a contagious disease or illness) and regional and global conflicts, that affect large portions of the market. It includes the risk that a particular style of investing may underperform the market generally.
Foreign (Non-U.S.) Risk—Investments in securities of non-U.S. issuers may involve more risk than those of U.S. issuers. These securities may fluctuate more widely in price and may be more difficult to trade due to adverse market, economic, political, regulatory or other factors.
Emerging-Market Risk—Investments in emerging market countries may have more risk because the markets are less developed and less liquid, and because these investments may be subject to increased economic, political, regulatory or other uncertainties.
Currency Risk—Fluctuations in currency exchange rates may negatively affect the value of the Portfolio’s investments or reduce its returns.
Derivatives Risk—Derivatives may be difficult to price or unwind and leveraged so that small changes may produce disproportionate losses for the Portfolio. A short position in a derivative instrument involves the risk of a theoretically unlimited increase in the value of the underlying asset, reference rate or index, which could cause the Portfolio to suffer a potentially unlimited loss. Derivatives, especially over-the-counter derivatives, are also subject to counterparty risk, which is the risk that the counterparty (the party on the other side of the transaction) on a derivative transaction will be unable or unwilling to honor its contractual obligations to the Portfolio.
Leverage Risk—When the Portfolio borrows money or otherwise leverages its investments, its performance may be volatile because leverage tends to exaggerate the effect of any increase or decrease in the value of the Portfolio’s investments. The Portfolio may create leverage through the use of reverse repurchase arrangements, forward currency exchange contracts, forward commitments, dollar rolls or futures or by borrowing money. The use of other types of derivative instruments by the Portfolio, such as options and swaps, may also result in a form of leverage. Leverage may result in higher returns to the Portfolio than if the Portfolio were not leveraged, but may also adversely affect returns, particularly if the market is declining.
Indemnification Risk—In the ordinary course of business, the Portfolio enters into contracts that contain a variety of indemnifications. The Portfolio’s maximum exposure under these arrangements is unknown. However, the Portfolio has not had prior claims or losses pursuant to these indemnification provisions and expects the risk of loss thereunder to be remote. Therefore, the Portfolio has not accrued any liability in connection with these indemnification provisions.
Management Risk—The Portfolio is subject to management risk because it is an actively-managed investment fund. The Adviser will apply its investment techniques and risk analyses in making investment decisions for the Portfolio, but there is no guarantee that its techniques will produce the intended results. Some of these techniques may incorporate, or rely upon, quantitative models, but there is no guarantee that these models will generate accurate forecasts, reduce risk or otherwise perform as expected.
16
| | |
| |
| | | AB Variable Products Series Fund |
NOTE H: Joint Credit Facility
A number of open-end mutual funds managed by the Adviser, including the Portfolio, participate in a $325 million revolving credit facility (the “Facility”) intended to provide short-term financing related to redemptions and other short term liquidity requirements, subject to certain restrictions. Commitment fees related to the Facility are paid by the participating funds and are included in miscellaneous expenses in the statement of operations. The Portfolio did not utilize the Facility during the year ended December 31, 2024.
NOTE I: Distributions to Shareholders
The tax character of distributions paid during the fiscal years ended December 31, 2024 and December 31, 2023 were as follows:
| | | | | | | | |
| | | 2024 | | | 2023 | |
Distributions paid from: | | | | | | | | |
Ordinary income | | $ | 6,345,990 | | | $ | 2,000,855 | |
| | | | | | | | |
Total taxable distributions paid | | $ | 6,345,990 | | | $ | 2,000,855 | |
| | | | | | | | |
As of December 31, 2024, the components of accumulated earnings (deficit) on a tax basis were as follows:
| | | | |
Undistributed ordinary income | | $ | 1,847,403 | |
Accumulated capital and other losses | | | (2,624,144 | )(a) |
Unrealized appreciation (depreciation) | | | 22,818,921 | (b) |
| | | | |
Total accumulated earnings (deficit) | | $ | 22,042,180 | |
| | | | |
| (a) | | As of December 31, 2024, the Portfolio had a net capital loss carryforward of $2,624,144. During the fiscal year, the Portfolio utilized $12,927,737 of capital loss carry forwards to offset current year net realized gains. |
| (b) | | The differences between book-basis and tax-basis unrealized appreciation (depreciation) are attributable primarily to the recognition for tax purposes of unrealized gains (losses) on certain derivative instruments, the tax treatment of passive foreign investment companies (PFICs), the tax treatment of hyper-inflationary currency contracts, and the tax deferral of losses on wash sales. |
For tax purposes, net realized capital losses may be carried over to offset future capital gains, if any. Funds are permitted to carry forward capital losses for an indefinite period, and such losses will retain their character as either short-term or long-term capital losses. As of December 31, 2024, the Portfolio had a net short-term capital loss carryforward of $2,624,144 which may be carried forward for an indefinite period.
During the current fiscal year, there were no permanent differences that resulted in adjustments to distributable earnings or additional paid-in capital.
NOTE J: Subsequent Events
Management has evaluated subsequent events for possible recognition or disclosure in the financial statements through the date the financial statements are issued. Management has determined that there are no material events that would require disclosure in the Portfolio’s financial statements through this date.
17
| | |
| | |
| INTERNATIONAL VALUE PORTFOLIO | | |
| |
| FINANCIAL HIGHLIGHTS | | AB Variable Products Series Fund |
Selected Data For A Share Of Capital Stock Outstanding Throughout Each Period
| | | | | | | | | | | | | | | | | | | | |
| | | CLASS A | |
| | | Year Ended December 31, | |
| | | 2024 | | | 2023 | | | 2022 | | | 2021 | | | 2020 | |
Net asset value, beginning of period | | | $14.79 | | | | $12.95 | | | | $15.72 | | | | $14.45 | | | | $14.37 | |
| | | | | | | | | | | | | | | | | | | | |
| | | | | | | | | | | | | | | | | | | | |
Income From Investment Operations | | | | | | | | | | | | | | | | | | | | |
Net investment income(a)(b) | | | .35 | | | | .29 | | | | .44 | | | | .37 | | | | .18 | |
Net realized and unrealized gain (loss) on investment and foreign currency transactions | | | .40 | | | | 1.67 | | | | (2.58 | ) | | | 1.22 | | | | .14 | |
| | | | | | | | | | | | | | | | | | | | |
Net increase (decrease) in net asset value from operations | | | .75 | | | | 1.96 | | | | (2.14 | ) | | | 1.59 | | | | .32 | |
| | | | | | | | | | | | | | | | | | | | |
| | | | | | | | | | | | | | | | | | | | |
Less: Dividends and Distributions | | | | | | | | | | | | | | | | | | | | |
Dividends from net investment income | | | (.42 | ) | | | (.12 | ) | | | (.60 | ) | | | (.32 | ) | | | (.24 | ) |
Return of capital | | | –0 | – | | | –0 | – | | | (.03 | ) | | | –0 | – | | | –0 | – |
| | | | | | | | | | | | | | | | | | | | |
Total dividends | | | (.42 | ) | | | (.12 | ) | | | (.63 | ) | | | (.32 | ) | | | (.24 | ) |
| | | | | | | | | | | | | | | | | | | | |
Net asset value, end of period | | | $15.12 | | | | $14.79 | | | | $12.95 | | | | $15.72 | | | | $14.45 | |
| | | | | | | | | | | | | | | | | | | | |
| | | | | | | | | | | | | | | | | | | | |
Total Return | | | | | | | | | | | | | | | | | | | | |
Total investment return based on net asset value(c)* | | | 5.07 | % | | | 15.15 | % | | | (13.61 | )% | | | 11.08 | % | | | 2.46 | % |
| | | | | | | | | | | | | | | | | | | | |
Ratios/Supplemental Data | | | | | | | | | | | | | | | | | | | | |
Net assets, end of period (000’s omitted) | | | $45,730 | | | | $44,286 | | | | $40,197 | | | | $45,175 | | | | $41,994 | |
Ratio to average net assets of: | | | | | | | | | | | | | | | | | | | | |
Expenses, net of waivers/reimbursements | | | .90 | % | | | .90 | % | | | .88 | % | | | .90 | % | | | .91 | % |
Expenses, before waivers/reimbursements | | | .92 | % | | | .90 | % | | | .89 | % | | | .90 | % | | | .92 | % |
Net investment income(b) | | | 2.26 | % | | | 2.03 | % | | | 3.24 | % | | | 2.34 | % | | | 1.47 | % |
Portfolio turnover rate | | | 51 | % | | | 46 | % | | | 37 | % | | | 43 | % | | | 54 | % |
See footnote summary on page 19.
18
| | |
| |
| | | AB Variable Products Series Fund |
Selected Data For A Share Of Capital Stock Outstanding Throughout Each Period
| | | | | | | | | | | | | | | | | | | | |
| | | CLASS B | |
| | | Year Ended December 31, | |
| | | 2024 | | | 2023 | | | 2022 | | | 2021 | | | 2020 | |
Net asset value, beginning of period | | | $14.71 | | | | $12.90 | | | | $15.62 | | | | $14.34 | | | | $14.24 | |
| | | | | | | | | | | | | | | | | | | | |
| | | | | | | | | | | | | | | | | | | | |
Income From Investment Operations | | | | | | | | | | | | | | | | | | | | |
Net investment income(a)(b) | | | .31 | | | | .26 | | | | .40 | | | | .32 | | | | .14 | |
Net realized and unrealized gain (loss) on investment and foreign currency transactions | | | .40 | | | | 1.65 | | | | (2.56 | ) | | | 1.23 | | | | .15 | |
| | | | | | | | | | | | | | | | | | | | |
Net increase (decrease) in net asset value from operations | | | .71 | | | | 1.91 | | | | (2.16 | ) | | | 1.55 | | | | .29 | |
| | | | | | | | | | | | | | | | | | | | |
| | | | | | | | | | | | | | | | | | | | |
Less: Dividends and Distributions | | | | | | | | | | | | | | | | | | | | |
Dividends from net investment income | | | (.36 | ) | | | (.10 | ) | | | (.53 | ) | | | (.27 | ) | | | (.19 | ) |
Return of capital | | | –0 | – | | | –0 | – | | | (.03 | ) | | | –0 | – | | | –0 | – |
| | | | | | | | | | | | | | | | | | | | |
Total dividends | | | (.36 | ) | | | (.10 | ) | | | (.56 | ) | | | (.27 | ) | | | (.19 | ) |
| | | | | | | | | | | | | | | | | | | | |
Net asset value, end of period | | | $15.06 | | | | $14.71 | | | | $12.90 | | | | $15.62 | | | | $14.34 | |
| | | | | | | | | | | | | | | | | | | | |
| | | | | | | | | | | | | | | | | | | | |
Total Return | | | | | | | | | | | | | | | | | | | | |
Total investment return based on net asset value(c)* | | | 4.81 | % | | | 14.83 | % | | | (13.80 | )% | | | 10.86 | % | | | 2.21 | % |
| | | | | | | | | | | | | | | | | | | | |
Ratios/Supplemental Data | | | | | | | | | | | | | | | | | | | | |
Net assets, end of period (000’s omitted) | | | $208,397 | | | | $241,282 | | | | $223,060 | | | | $304,737 | | | | $299,415 | |
Ratio to average net assets of: | | | | | | | | | | | | | | | | | | | | |
Expenses, net of waivers/reimbursements | | | 1.14 | % | | | 1.15 | % | | | 1.13 | % | | | 1.15 | % | | | 1.16 | % |
Expenses, before waivers/reimbursements | | | 1.17 | % | | | 1.15 | % | | | 1.14 | % | | | 1.15 | % | | | 1.17 | % |
Net investment income(b) | | | 2.04 | % | | | 1.80 | % | | | 2.98 | % | | | 2.08 | % | | | 1.18 | % |
Portfolio turnover rate | | | 51 | % | | | 46 | % | | | 37 | % | | | 43 | % | | | 54 | % |
| (a) | | Based on average shares outstanding. |
| (b) | | Net of expenses waived/reimbursed by the Adviser. |
| (c) | | Total investment return is calculated assuming an initial investment made at the net asset value at the beginning of the period, reinvestment of all dividends and distributions at net asset value during the period, and redemption on the last day of the period. Total investment return does not reflect (i) insurance company’s separate account related expense charges and (ii) the deductions of taxes that a shareholder would pay on Portfolio distributions or the redemption of Portfolio shares. Total investment return calculated for a period of less than one year is not annualized. |
| * | | Includes the impact of proceeds received and credited to the Portfolio resulting from class action settlements, which enhanced the Portfolio’s performance for the years ended December 31, 2024, December 31, 2022 and December 31, 2020 by .01%, .01% and .04%, respectively. |
See notes to financial statements.
19
| | |
| | |
| REPORT OF INDEPENDENT REGISTERED | | |
| |
| PUBLIC ACCOUNTING FIRM | | AB Variable Products Series Fund |
To the Board of Directors and Shareholders of AB International Value Portfolio
Opinion on the Financial Statements
We have audited the accompanying statement of assets and liabilities of AB International Value Portfolio (the “Portfolio”) (one of the series constituting AB Variable Products Series Fund, Inc. (the “Fund”)), including the portfolio of investments, as of December 31, 2024, and the related statement of operations for the year then ended, the statements of changes in net assets for each of the two years in the period then ended, the financial highlights for each of the five years in the period then ended and the related notes (collectively referred to as the “financial statements”). In our opinion, the financial statements present fairly, in all material respects, the financial position of the Portfolio (one of the series constituting AB Variable Products Series Fund, Inc.) at December 31, 2024, the results of its operations for the year then ended, the changes in its net assets for each of the two years in the period then ended and its financial highlights for each of the five years in the period then ended, in conformity with U.S. generally accepted accounting principles.
Basis for Opinion
These financial statements are the responsibility of the Fund’s management. Our responsibility is to express an opinion on the Portfolio’s financial statements based on our audits. We are a public accounting firm registered with the Public Company Accounting Oversight Board (United States) (“PCAOB”) and are required to be independent with respect to the Fund in accordance with the U.S. federal securities laws and the applicable rules and regulations of the Securities and Exchange Commission and the PCAOB.
We conducted our audits in accordance with the standards of the PCAOB. Those standards require that we plan and perform the audit to obtain reasonable assurance about whether the financial statements are free of material misstatement, whether due to error or fraud. The Fund is not required to have, nor were we engaged to perform, an audit of the Fund’s internal control over financial reporting. As part of our audits, we are required to obtain an understanding of internal control over financial reporting but not for the purpose of expressing an opinion on the effectiveness of the Fund’s internal control over financial reporting. Accordingly, we express no such opinion.
Our audits included performing procedures to assess the risks of material misstatement of the financial statements, whether due to error or fraud, and performing procedures that respond to those risks. Such procedures included examining, on a test basis, evidence regarding the amounts and disclosures in the financial statements. Our procedures included confirmation of securities owned as of December 31, 2024, by correspondence with the custodian, brokers and others; when replies were not received from brokers or others, we performed other auditing procedures. Our audits also included evaluating the accounting principles used and significant estimates made by management, as well as evaluating the overall presentation of the financial statements. We believe that our audits provide a reasonable basis for our opinion.

We have served as the auditor of one or more of the AB investment companies since 1968.
New York, New York
February 14, 2025
20
| | |
| | |
| | |
| |
| 2024 TAX INFORMATION (unaudited) | | AB Variable Products Series Fund |
For Federal income tax purposes, the following information is furnished with respect to the earnings of the Portfolio for the taxable year ended December 31, 2024.
The Portfolio intends to make an election to pass through foreign taxes to its shareholders. For the taxable year ended December 31, 2024, $584,244 of foreign taxes may be passed through and the associated foreign source income for information reporting purposes is $7,629,322.
21
| | |
| | | |
| | | |
| |
| INTERNATIONAL VALUE PORTFOLIO | | AB Variable Products Series Fund |
INFORMATION REGARDING THE REVIEW AND APPROVAL OF THE FUND’S ADVISORY AGREEMENT
The disinterested directors (the “directors”) of AB Variable Products Series Fund, Inc. (the “Company”) unanimously approved the continuance of the Company’s Advisory Agreement with the Adviser in respect of AB International Value Portfolio (the “Fund”) at a meeting held by video conference on May 7-9, 2024 (the “Meeting”).
Prior to approval of the continuance of the Advisory Agreement, the directors had requested from the Adviser, and received and evaluated, extensive materials. They reviewed the proposed continuance of the Advisory Agreement with the Adviser and with experienced counsel who are independent of the Adviser, who advised on the relevant legal standards. The directors also reviewed additional materials, including comparative analytical data prepared by the Senior Vice President of the Fund. The directors also discussed the proposed continuance in private sessions with counsel.
The directors considered their knowledge of the nature and quality of the services provided by the Adviser to the Fund gained from their experience as directors or trustees of most of the registered investment companies advised by the Adviser, their overall confidence in the Adviser’s integrity and competence they have gained from that experience, the Adviser’s initiative in identifying and raising potential issues with the directors and its responsiveness, frankness and attention to concerns raised by the directors in the past, including the Adviser’s willingness to consider and implement organizational and operational changes designed to improve investment results and the services provided to the AB Funds. The directors noted that they have four regular meetings each year, at each of which they review extensive materials and information from the Adviser, including information on the investment performance of the Fund.
The directors also considered all factors they believed relevant, including the specific matters discussed below. During the course of their deliberations, the directors evaluated, among other things, the reasonableness of the advisory fee. The directors did not identify any particular information that was all-important or controlling, and different directors may have attributed different weights to the various factors. The directors determined that the selection of the Adviser to manage the Fund and the overall arrangements between the Fund and the Adviser, as provided in the Advisory Agreement, including the advisory fee, were fair and reasonable in light of the services performed, expenses incurred and such other matters as the directors considered relevant in the exercise of their business judgment. The material factors and conclusions that formed the basis for the directors’ determinations included the following:
Nature, Extent and Quality of Services Provided
The directors considered the scope and quality of services provided by the Adviser under the Advisory Agreement, including the quality of the investment research capabilities of the Adviser and the other resources it has dedicated to performing services for the Fund. The directors noted that the Adviser from time to time reviews the Fund’s investment strategies and from time to time proposes changes intended to improve the Fund’s relative or absolute performance for the directors’ consideration. They also noted the professional experience and qualifications of the Fund’s portfolio management team and other senior personnel of the Adviser. The directors also considered that the Advisory Agreement provides that the Fund will reimburse the Adviser for the cost to it of providing certain clerical, accounting, administrative and other services to the Fund by employees of the Adviser or its affiliates. Requests for these reimbursements are made on a quarterly basis and subject to approval by the directors. Reimbursements, to the extent requested and paid, result in a higher rate of total compensation from the Fund to the Adviser than the fee rate stated in the Advisory Agreement. The directors noted that the methodology used to determine the reimbursement amounts had been reviewed by an independent consultant at the request of the directors. The quality of administrative and other services, including the Adviser’s role in coordinating the activities of the Fund’s other service providers, also was considered. The directors concluded that, overall, they were satisfied with the nature, extent and quality of services provided to the Fund under the Advisory Agreement.
Costs of Services Provided and Profitability
The directors reviewed a schedule of the revenues and expenses and related notes indicating the profitability of the Fund to the Adviser for calendar years 2022 and 2023 that had been prepared with an expense allocation methodology arrived at in consultation with an independent consultant at the request of the directors. The directors noted the assumptions and methods of allocation used by the Adviser in preparing fund-specific profitability data and understood that there are a number of potentially acceptable allocation methodologies for information of this type. The directors noted that the profitability information reflected all revenues and expenses of the Adviser’s relationship with the Fund, including those relating to its subsidiaries that provide transfer agency, distribution and brokerage services to the Fund. The directors recognized that it is difficult to make comparisons of the profitability of the Advisory Agreement with the profitability of fund advisory contracts
22
| | |
| |
| | | AB Variable Products Series Fund |
for unaffiliated funds because comparative information is not generally publicly available and is affected by numerous factors. The directors focused on the profitability of the Adviser’s relationship with the Fund before taxes and distribution expenses. The directors concluded that the Adviser’s level of profitability from its relationship with the Fund was not unreasonable.
Fall-Out Benefits
The directors considered the other benefits to the Adviser and its affiliates from their relationships with the Fund, including, but not limited to, benefits relating to soft dollar arrangements (whereby investment advisers receive brokerage and research services from brokers that execute agency transactions for their clients); 12b-1 fees and sales charges received by the Fund’s principal underwriter (which is a wholly owned subsidiary of the Adviser) in respect of the Fund’s Class B shares; brokerage commissions paid by the Fund to brokers affiliated with the Adviser; and transfer agency fees paid by the Fund to a wholly owned subsidiary of the Adviser. The directors recognized that the Adviser’s profitability would be somewhat lower without these benefits. The directors understood that the Adviser also might derive reputational and other benefits from its association with the Fund.
Investment Results
In addition to the information reviewed by the directors in connection with the Meeting, the directors receive detailed performance information for the Fund at each regular Board meeting during the year.
At the Meeting, the directors reviewed performance information prepared by an independent service provider (the “15(c) service provider”), showing the performance of the Class A Shares of the Fund against a group of similar funds (“peer group”) and a larger group of similar funds (“peer universe”), each selected by the 15(c) service provider, and information prepared by the Adviser showing performance of the Class A Shares against a broad-based securities market index, in each case for the 1-, 3-, 5- and 10-year periods ended February 29, 2024 and (in the case of comparisons with the broad-based securities market index) for the period from inception. The directors discussed with the Adviser the reasons for the Fund’s underperformance in the periods reviewed and determined to continue to monitor the Fund’s performance closely.
Advisory Fees and Other Expenses
The directors considered the advisory fee rate payable by the Fund to the Adviser and information prepared by the 15(c) service provider concerning advisory fee rates payable by other funds in the same category as the Fund. The directors recognized that it is difficult to make comparisons of advisory fees because there are variations in the services that are included in the fees paid by other funds. The directors compared the Fund’s contractual effective advisory fee rate with a peer group median and noted that it was lower than the median. They also noted that the Adviser’s total rate of compensation, taking into account the administrative expense reimbursement paid to the Adviser in the latest fiscal year, was close to the median.
The directors also considered the Adviser’s fee schedule for other clients utilizing investment strategies similar to those of the Fund. For this purpose, they reviewed the relevant advisory fee information from the Adviser’s Form ADV and in a report from the Fund’s Senior Vice President and noted the differences between the Fund’s fee schedule, on the one hand, and the Adviser’s institutional fee schedule, on the other. The directors noted that the Adviser may, in some cases, agree to fee rates with large institutional clients that are lower than those reviewed by the directors and that they had previously discussed with the Adviser its policies in respect of such arrangements. The directors also compared the advisory fee rate for the Fund with that for another fund advised by the Adviser utilizing similar investment strategies.
The Adviser reviewed with the directors the significantly greater scope of the services it provides to the Fund relative to institutional clients. In this regard, the Adviser noted, among other things, that, compared to institutional accounts, the Fund (i) demands considerably more portfolio management, research and trading resources due to significantly higher daily cash flows; (ii) has more tax and regulatory restrictions and compliance obligations; (iii) must prepare and file or distribute regulatory and other communications about fund operations; and (iv) must provide shareholder servicing to retail investors. The Adviser also reviewed the greater legal risks presented by the large and changing population of Fund shareholders who may assert claims against the Adviser in individual or class actions, and the greater entrepreneurial risk in offering new fund products, which require substantial investment to launch, may not succeed, and generally must be priced to compete with larger, more established funds resulting in lack of profitability to the Adviser until a new fund achieves scale. In light of the substantial differences in services rendered by the Adviser to institutional clients as compared to the Fund, and the different risk profile, the directors considered these fee comparisons inapt and did not place significant weight on them in their deliberations.
23
| | |
| | | |
| INTERNATIONAL VALUE PORTFOLIO | | |
| |
| (continued) | | AB Variable Products Series Fund |
In connection with their review of the Fund’s advisory fee, the directors also considered the total expense ratio of the Class A shares of the Fund in comparison to the medians for a peer group and a peer universe selected by the 15(c) service provider. The Class A expense ratio of the Fund was based on the Fund’s latest fiscal year. The Adviser had agreed to cap the Fund’s expenses, but the directors noted that the Fund’s expense ratio was currently below the level of the Adviser’s cap. The directors noted that it was likely that the expense ratios of some of the other funds in the Fund’s category were lowered by waivers or reimbursements by those funds’ investment advisers, which in some cases might be voluntary or temporary. The directors view expense ratio information as relevant to their evaluation of the Adviser’s services because the Adviser is responsible for coordinating services provided to the Fund by others. The directors noted that the Fund’s expense ratio was above the median of a peer group and lower than the median of a peer universe. After reviewing and discussing the Adviser’s explanations of the reasons for this, the directors requested that the Adviser implement, effective June 1, 2024, a voluntary expense limitation agreement capping total expenses at 0.92% for Class A shares of the Fund, with a corresponding expense limitation for the Fund’s other share class, and the Adviser agreed to this.
Economies of Scale
The directors noted that the advisory fee schedule for the Fund contains breakpoints that reduce the fee rates on assets above specified levels. The directors took into consideration prior presentations by an independent consultant on economies of scale in the mutual fund industry and for the AB Funds, and presentations from time to time by the Adviser concerning certain of its views on economies of scale. The directors also had requested and received from the Adviser certain updates on economies of scale in advance of the Meeting. The directors believe that economies of scale may be realized (if at all) by the Adviser across a variety of products and services, and not only in respect of a single fund. The directors noted that there is no established methodology for setting breakpoints that give effect to the fund-specific services provided by a fund’s adviser and to the economies of scale that an adviser may realize in its overall mutual fund business or those components of it which directly or indirectly affect a fund’s operations. The directors observed that in the mutual fund industry as a whole, as well as among funds similar to the Fund, there is no uniformity or pattern in the fees and asset levels at which breakpoints (if any) apply. The directors also noted that the advisory agreements for many funds do not have breakpoints at all. Having taken these factors into account, the directors concluded that the Fund’s shareholders would benefit from a sharing of economies of scale in the event the Fund’s net assets exceed a breakpoint in the future.
24
VPS-IV-0151-1224
DEC 12.31.24

ANNUAL FINANCIAL STATEMENTS AND ADDITIONAL INFORMATION
AB VARIABLE PRODUCTS
SERIES FUND, INC.
| + | | AB LARGE CAP GROWTH PORTFOLIO |
Investment Products Offered
| | • | | Are Not Bank Guaranteed |
AllianceBernstein Investments, Inc. (ABI) is the distributor of the AB family of mutual funds. ABI is a member of FINRA and is an affiliate of AllianceBernstein L.P., the Adviser of the funds.
You may obtain a description of the Fund’s proxy voting policies and procedures, and information regarding how the Fund voted proxies relating to portfolio securities during the most recent 12-month period ended June 30, without charge. Simply visit AB’s website at www.abfunds.com or go to the Securities and Exchange Commission’s (the “Commission”) website at www.sec.gov, or call AB at (800) 227 4618.
The Fund files its complete schedule of portfolio holdings with the Commission for the first and third quarters of each fiscal year as an exhibit to its reports on Form N-PORT. The Fund’s Form N-PORT reports are available on the Commission’s website at www.sec.gov.
The [A/B] logo and AllianceBernstein® are registered trademarks used by permission of the owner, AllianceBernstein L.P.
| | |
| LARGE CAP GROWTH PORTFOLIO | | |
| PORTFOLIO OF INVESTMENTS | | |
| |
| December 31, 2024 | | AB Variable Products Series Fund |
| | | | | | | | |
| Company | | Shares | | | U.S. $ Value | |
| | | | | | | | |
COMMON STOCKS–97.9% | | | | | | | | |
| | | | | | | | |
INFORMATION TECHNOLOGY–35.7% | | | | | | | | |
COMMUNICATIONS EQUIPMENT–3.2% | | | | | | | | |
Arista Networks, Inc.(a) | | | 168,262 | | | $ | 18,597,999 | |
Motorola Solutions, Inc. | | | 25,600 | | | | 11,833,088 | |
| | | | | | | | |
| | | | | | | 30,431,087 | |
| | | | | | | | |
IT SERVICES–0.4% | | | | | | | | |
Shopify, Inc.–Class A(a) | | | 35,372 | | | | 3,761,105 | |
| | | | | | | | |
SEMICONDUCTORS & SEMICONDUCTOR EQUIPMENT–19.5% | | | | | | | | |
Applied Materials, Inc. | | | 58,593 | | | | 9,528,979 | |
ASML Holding NV (REG) | | | 6,380 | | | | 4,421,850 | |
Astera Labs, Inc.(a) | | | 35,500 | | | | 4,701,975 | |
Broadcom, Inc. | | | 144,077 | | | | 33,402,812 | |
NVIDIA Corp. | | | 673,979 | | | | 90,508,640 | |
QUALCOMM, Inc. | | | 81,064 | | | | 12,453,052 | |
Taiwan Semiconductor Manufacturing Co., Ltd. (Sponsored ADR) | | | 59,980 | | | | 11,845,450 | |
Texas Instruments, Inc. | | | 97,886 | | | | 18,354,604 | |
| | | | | | | | |
| | | | | | | 185,217,362 | |
| | | | | | | | |
SOFTWARE–12.6% | | | | | | | | |
AppLovin Corp.–Class A(a) | | | 27,927 | | | | 9,043,600 | |
Cadence Design Systems, Inc.(a) | | | 29,285 | | | | 8,798,971 | |
Manhattan Associates, Inc.(a) | | | 28,201 | | | | 7,621,038 | |
Microsoft Corp. | | | 186,235 | | | | 78,498,053 | |
ServiceNow, Inc.(a) | | | 9,550 | | | | 10,124,146 | |
Synopsys, Inc.(a) | | | 12,553 | | | | 6,092,724 | |
| | | | | | | | |
| | | | | | | 120,178,532 | |
| | | | | | | | |
| | | | | | | 339,588,086 | |
| | | | | | | | |
COMMUNICATION SERVICES–15.5% | | | | | | | | |
ENTERTAINMENT–4.1% | | | | | | | | |
Netflix, Inc.(a) | | | 43,922 | | | | 39,148,557 | |
| | | | | | | | |
INTERACTIVE MEDIA & SERVICES–11.4% | | | | | | | | |
Alphabet, Inc.–Class C | | | 278,994 | | | | 53,131,618 | |
Meta Platforms, Inc.–Class A | | | 87,373 | | | | 51,157,765 | |
Reddit, Inc.–Class A(a) | | | 24,830 | | | | 4,058,215 | |
| | | | | | | | |
| | | | | | | 108,347,598 | |
| | | | | | | | |
| | | | | | | 147,496,155 | |
| | | | | | | | |
CONSUMER DISCRETIONARY–15.0% | | | | | | | | |
AUTOMOBILES–0.7% | | | | | | | | |
Ferrari NV | | | 15,818 | | | | 6,720,119 | |
| | | | | | | | |
BROADLINE RETAIL–6.7% | | | | | | | | |
Amazon.com, Inc.(a) | | | 289,705 | | | | 63,558,380 | |
| | | | | | | | |
| | | | | | | | |
HOTELS, RESTAURANTS & LEISURE–1.7% | | | | | | | | |
Chipotle Mexican Grill, Inc.(a) | | | 263,470 | | | | 15,887,241 | |
| | | | | | | | |
SPECIALTY RETAIL–3.9% | | | | | | | | |
Home Depot, Inc. (The) | | | 65,314 | | | | 25,406,493 | |
Tractor Supply Co. | | | 216,485 | | | | 11,486,694 | |
| | | | | | | | |
| | | | | | | 36,893,187 | |
| | | | | | | | |
TEXTILES, APPAREL & LUXURY GOODS–2.0% | | | | | | | | |
Lululemon Athletica, Inc.(a) | | | 33,935 | | | | 12,977,084 | |
On Holding AG–Class A(a) | | | 110,730 | | | | 6,064,682 | |
| | | | | | | | |
| | | | | | | 19,041,766 | |
| | | | | | | | |
| | | | | | | 142,100,693 | |
| | | | | | | | |
HEALTH CARE–11.5% | | | | | | | | |
BIOTECHNOLOGY–1.3% | | | | | | | | |
Genmab A/S (Sponsored ADR)(a) | | | 147,067 | | | | 3,069,288 | |
Vertex Pharmaceuticals, Inc.(a) | | | 22,885 | | | | 9,215,790 | |
| | | | | | | | |
| | | | | | | 12,285,078 | |
| | | | | | | | |
HEALTH CARE EQUIPMENT & SUPPLIES–2.2% | | | | | | | | |
IDEXX Laboratories, Inc.(a) | | | 8,507 | | | | 3,517,134 | |
Intuitive Surgical, Inc.(a) | | | 33,623 | | | | 17,549,861 | |
| | | | | | | | |
| | | | | | | 21,066,995 | |
| | | | | | | | |
HEALTH CARE PROVIDERS & SERVICES–1.4% | | | | | | | | |
UnitedHealth Group, Inc. | | | 25,150 | | | | 12,722,379 | |
| | | | | | | | |
HEALTH CARE TECHNOLOGY–0.9% | | | | | | | | |
Veeva Systems, Inc.–Class A(a) | | | 42,175 | | | | 8,867,294 | |
| | | | | | | | |
LIFE SCIENCES TOOLS & SERVICES–2.1% | | | | | | | | |
Mettler-Toledo International, Inc.(a) | | | 4,783 | | | | 5,852,861 | |
Waters Corp.(a) | | | 18,446 | | | | 6,843,097 | |
West Pharmaceutical Services, Inc. | | | 22,770 | | | | 7,458,541 | |
| | | | | | | | |
| | | | | | | 20,154,499 | |
| | | | | | | | |
PHARMACEUTICALS–3.6% | | | | | | | | |
Eli Lilly & Co. | | | 31,815 | | | | 24,561,180 | |
Zoetis, Inc. | | | 59,714 | | | | 9,729,202 | |
| | | | | | | | |
| | | | | | | 34,290,382 | |
| | | | | | | | |
| | | | | | | 109,386,627 | |
| | | | | | | | |
INDUSTRIALS–7.5% | | | | | | | | |
AEROSPACE & DEFENSE–0.6% | | | | | | | | |
Axon Enterprise, Inc.(a) | | | 9,224 | | | | 5,482,008 | |
| | | | | | | | |
1
| | |
| LARGE CAP GROWTH PORTFOLIO | | |
| PORTFOLIO OF INVESTMENTS | | |
| |
| (continued) | | AB Variable Products Series Fund |
| | | | | | | | |
| Company | | Shares | | | U.S. $ Value | |
| | | | | | | | |
BUILDING PRODUCTS–2.0% | | | | | | | | |
Otis Worldwide Corp. | | | 128,451 | | | $ | 11,895,847 | |
Trex Co., Inc.(a) | | | 97,644 | | | | 6,740,365 | |
| | | | | | | | |
| | | | | | | 18,636,212 | |
| | | | | | | | |
COMMERCIAL SERVICES & SUPPLIES–2.0% | | | | | | | | |
Copart, Inc.(a) | | | 336,059 | | | | 19,286,426 | |
| | | | | | | | |
GROUND TRANSPORTATION–0.8% | | | | | | | | |
Saia, Inc.(a)(b) | | | 16,380 | | | | 7,464,857 | |
| | | | | | | | |
PROFESSIONAL SERVICES–1.3% | | | | | | | | |
Verisk Analytics, Inc. | | | 46,157 | | | | 12,713,023 | |
| | | | | | | | |
TRADING COMPANIES & DISTRIBUTORS–0.8% | | | | | | | | |
United Rentals, Inc. | | | 10,630 | | | | 7,488,197 | |
| | | | | | | | |
| | | | | | | 71,070,723 | |
| | | | | | | | |
FINANCIALS–5.8% | | | | | | | | |
CAPITAL MARKETS–1.2% | | | | | | | | |
Cboe Global Markets, Inc. | | | 58,619 | | | | 11,454,153 | |
| | | | | | | | |
FINANCIAL SERVICES–4.6% | | | | | | | | |
Visa, Inc.–Class A | | | 138,826 | | | | 43,874,569 | |
| | | | | | | | |
| | | | | | | 55,328,722 | |
| | | | | | | | |
CONSUMER STAPLES–5.6% | | | | | | | | |
BEVERAGES–2.4% | | | | | | | | |
Celsius Holdings, Inc.(a)(b) | | | 124,441 | | | | 3,277,776 | |
Monster Beverage Corp.(a) | | | 366,885 | | | | 19,283,476 | |
| | | | | | | | |
| | | | | | | 22,561,252 | |
| | | | | | | | |
CONSUMER STAPLES DISTRIBUTION & RETAIL–3.2% | | | | | | | | |
Costco Wholesale Corp. | | | 33,815 | | | | 30,983,670 | |
| | | | | | | | |
| | | | | | | 53,544,922 | |
| | | | | | | | |
MATERIALS–1.3% | | | | | | | | |
CHEMICALS–1.3% | | | | | | | | |
Sherwin-Williams Co. (The) | | | 36,951 | | | | 12,560,753 | |
| | | | | | | | |
Total Common Stocks
(cost $475,718,108) | | | | | | | 931,076,681 | |
| | | | | | | | |
RIGHTS–0.0% | | | | | | | | |
HEALTH CARE–0.0% | | | | | | | | |
HEALTH CARE PROVIDERS & SERVICES–0.0% | | | | | | | | |
ABIOMED, Inc. (CVR)(a)(c)(d)
(cost $11,601) | | | 11,373 | | | | 11,601 | |
| | | | | | | | |
| | | | | | | | |
SHORT-TERM INVESTMENTS–2.4% | | | | | | | | |
INVESTMENT COMPANIES–2.4% | | | | | | | | |
AB Fixed Income Shares, Inc.–Government Money Market Portfolio–Class AB, 4.43%(e)(f)(g)
(cost $22,856,701) | | | 22,856,701 | | | | 22,856,701 | |
| | | | | | | | |
Total Investments Before Security Lending Collateral for Securities
Loaned–100.3%
(cost $498,586,410) | | | | | | | 953,944,983 | |
| | | | | | | | |
INVESTMENTS OF CASH COLLATERAL FOR SECURITIES
LOANED–0.3% | | | | | | | | |
INVESTMENT COMPANIES–0.3% | | | | | | | | |
AB Fixed Income Shares, Inc.–Government Money Market Portfolio–Class AB, 4.43%(e)(f)(g)
(cost $3,264,694) | | | 3,264,694 | | | | 3,264,694 | |
| | | | | | | | |
TOTAL INVESTMENTS–100.6%
(cost $501,851,104) | | | | | | | 957,209,677 | |
Other assets less
liabilities–(0.6)% | | | | | | | (5,716,344 | ) |
| | | | | | | | |
NET ASSETS–100.0% | | | | | | $ | 951,493,333 | |
| | | | | | | | |
| (a) | | Non-income producing security. |
| (b) | | Represents entire or partial securities out on loan. See Note E for securities lending information. |
| (c) | | Security in which significant unobservable inputs (Level 3) were used in determining fair value. |
| (d) | | Fair valued by the Adviser. |
| (e) | | Affiliated investments. |
| (f) | | The rate shown represents the 7-day yield as of period end. |
| (g) | | To obtain a copy of the fund’s shareholder report, please go to the Securities and Exchange Commission’s website at www.sec.gov, or call AB at (800) 227-4618. |
Glossary:
ADR—American Depositary Receipt
CVR—Contingent Value Right
REG—Registered Shares
See notes to financial statements.
2
| | |
| LARGE CAP GROWTH PORTFOLIO | | |
| STATEMENT OF ASSETS & LIABILITIES | | |
| |
| December 31, 2024 | | AB Variable Products Series Fund |
| | | | |
ASSETS | |
Investments in securities, at value | | | | |
Unaffiliated issuers (cost $475,729,709) | | $ | 931,088,282 | (a) |
Affiliated issuers (cost $26,121,395—including investment of cash collateral for securities loaned of $3,264,694) | | | 26,121,395 | |
Receivable for capital stock sold | | | 350,880 | |
Receivable for investment securities sold | | | 227,694 | |
Unaffiliated dividends receivable | | | 61,778 | |
Affiliated dividends receivable | | | 51,800 | |
Receivable due from Adviser | | | 2,327 | |
| | | | |
Total assets | | | 957,904,156 | |
| | | | |
LIABILITIES | |
Payable for collateral received on securities loaned | | | 3,264,694 | |
Payable for capital stock redeemed | | | 1,235,789 | |
Payable for investment securities purchased | | | 1,140,105 | |
Advisory fee payable | | | 475,444 | |
Distribution fee payable | | | 118,891 | |
Administrative fee payable | | | 24,141 | |
Transfer Agent fee payable | | | 167 | |
Accrued expenses and other liabilities | | | 151,592 | |
| | | | |
Total liabilities | | | 6,410,823 | |
| | | | |
NET ASSETS | | $ | 951,493,333 | |
| | | | |
COMPOSITION OF NET ASSETS | | | | |
Capital stock, at par | | $ | 11,430 | |
Additional paid-in capital | | | 409,691,092 | |
Distributable earnings | | | 541,790,811 | |
| | | | |
NET ASSETS | | $ | 951,493,333 | |
| | | | |
Net Asset Value Per Share—1 billion shares of capital stock authorized, $.001 par value
| | | | | | | | | | | | |
| Class | | Net Assets | | | Shares
Outstanding | | | Net Asset
Value | |
| | | |
| A | | $ | 375,852,497 | | | | 4,208,375 | | | $ | 89.31 | |
| | | |
| B | | $ | 575,640,836 | | | | 7,221,140 | | | $ | 79.72 | |
| (a) | | Includes securities on loan with a value of $3,986,911 (see Note E). |
See notes to financial statements.
3
| | |
| LARGE CAP GROWTH PORTFOLIO | | |
| STATEMENT OF OPERATIONS | | |
| |
| Year Ended December 31, 2024 | | AB Variable Products Series Fund |
| | | | |
INVESTMENT INCOME | | | | |
Dividends | | | | |
Unaffiliated issuers (net of foreign taxes withheld of $25,296) | | $ | 4,403,432 | |
Affiliated issuers | | | 871,903 | |
Interest | | | 356 | |
Securities lending income | | | 3,820 | |
| | | | |
| | | 5,279,511 | |
| | | | |
EXPENSES | | | | |
Advisory fee (see Note B) | | | 5,262,769 | |
Distribution fee—Class B | | | 1,279,964 | |
Transfer agency—Class A | | | 3,529 | |
Transfer agency—Class B | | | 4,945 | |
Administrative | | | 93,919 | |
Custody and accounting | | | 79,037 | |
Legal | | | 73,978 | |
Printing | | | 70,329 | |
Audit and tax | | | 42,167 | |
Directors’ fees | | | 32,195 | |
Miscellaneous | | | 22,673 | |
| | | | |
Total expenses | | | 6,965,505 | |
Less: expenses waived and reimbursed by the Adviser (see Notes B & E) | | | (27,284 | ) |
| | | | |
Net expenses | | | 6,938,221 | |
| | | | |
Net investment loss | | | (1,658,710 | ) |
| | | | |
REALIZED AND UNREALIZED GAIN ON INVESTMENT TRANSACTIONS | | | | |
Net realized gain on investment transactions | | | 90,877,917 | |
Net change in unrealized appreciation (depreciation) of investments | | | 101,144,866 | |
| | | | |
Net gain on investment transactions | | | 192,022,783 | |
| | | | |
NET INCREASE IN NET ASSETS FROM OPERATIONS | | $ | 190,364,073 | |
| | | | |
See notes to financial statements.
4
| | |
| | |
| LARGE CAP GROWTH PORTFOLIO | | |
| |
| STATEMENT OF CHANGES IN NET ASSETS | | AB Variable Products Series Fund |
| | | | | | | | |
| | | Year Ended
December 31,
2024 | | | Year Ended
December 31,
2023 | |
INCREASE (DECREASE) IN NET ASSETS FROM OPERATIONS | |
Net investment income (loss) | | $ | (1,658,710 | ) | | $ | 199,068 | |
Net realized gain on investment transactions | | | 90,877,917 | | | | 36,901,940 | |
Net change in unrealized appreciation (depreciation) of investments | | | 101,144,866 | | | | 166,659,053 | |
Contributions from Affiliates (see Note B) | | | –0 | – | | | 488 | |
| | | | | | | | |
Net increase in net assets from operations | | | 190,364,073 | | | | 203,760,549 | |
Distributions to Shareholders | |
Class A | | | (14,973,256 | ) | | | (20,050,816 | ) |
Class B | | | (23,217,785 | ) | | | (28,501,444 | ) |
CAPITAL STOCK TRANSACTIONS | |
Net increase | | | 25,827,317 | | | | 27,201,448 | |
| | | | | | | | |
Total increase | | | 178,000,349 | | | | 182,409,737 | |
NET ASSETS | |
Beginning of period | | | 773,492,984 | | | | 591,083,247 | |
| | | | | | | | |
End of period | | $ | 951,493,333 | | | $ | 773,492,984 | |
| | | | | | | | |
See notes to financial statements.
5
| | |
| LARGE CAP GROWTH PORTFOLIO | | |
| NOTES TO FINANCIAL STATEMENTS | | |
| |
| December 31, 2024 | | AB Variable Products Series Fund |
NOTE A: Significant Accounting Policies
The AB Large Cap Growth Portfolio (the “Portfolio”) is a series of AB Variable Products Series Fund, Inc. (the “Fund”). The Portfolio’s investment objective is long-term growth of capital. The Portfolio is diversified as defined under the Investment Company Act of 1940 (the “1940 Act”). The Fund was incorporated in the State of Maryland as an open-end series investment company. The Fund offers nine separately managed pools of assets which have differing investment objectives and policies. The Portfolio offers Class A and Class B shares. Both classes of shares have identical voting, dividend, liquidating and other rights, except that Class B shares bear a distribution expense and have exclusive voting rights with respect to the Class B distribution plan.
The Portfolio offers and sells its shares only to separate accounts of certain life insurance companies for the purpose of funding variable annuity contracts and variable life insurance policies. Sales are made without a sales charge at the Portfolio’s net asset value per share.
The financial statements have been prepared in conformity with U.S. generally accepted accounting principles (“U.S. GAAP”), which require management to make certain estimates and assumptions that affect the reported amounts of assets and liabilities in the financial statements and amounts of income and expenses during the reporting period. Actual results could differ from those estimates. The Portfolio is an investment company under U.S. GAAP and follows the accounting and reporting guidance applicable to investment companies. The following is a summary of significant accounting policies followed by the Portfolio.
1. Security Valuation
Portfolio securities are valued at market value determined on the basis of market quotations or, if market quotations are not readily available or are unreliable, at “fair value” as determined in accordance with procedures approved by and under the oversight of the Fund’s Board of Directors (the “Board”). Pursuant to these procedures, AllianceBernstein L.P. (the “Adviser”) serves as the Portfolio’s valuation designee pursuant to Rule 2a-5 of the 1940 Act. In this capacity, the Adviser is responsible, among other things, for making all fair value determinations relating to the Portfolio’s portfolio investments, subject to the Board’s oversight.
In general, the market values of securities which are readily available and deemed reliable are determined as follows: securities listed on a national securities exchange (other than securities listed on the NASDAQ Stock Market, Inc. (“NASDAQ”)) or on a foreign securities exchange are valued at the last sale price at the close of the exchange or foreign securities exchange. If there has been no sale on such day, the securities are valued at the last traded price from the previous day. Securities listed on more than one exchange are valued by reference to the principal exchange on which the securities are traded; securities listed only on NASDAQ are valued in accordance with the NASDAQ Official Closing Price; listed or over the counter (“OTC”) market put or call options are valued at the mid level between the current bid and ask prices. If either a current bid or current ask price is unavailable, the Adviser will have discretion to determine the best valuation (e.g., last trade price in the case of listed options); open futures are valued using the closing settlement price or, in the absence of such a price, the most recent quoted bid price. If there are no quotations available for the day of valuation, the last available closing settlement price is used; U.S. Government securities and any other debt instruments having 60 days or less remaining until maturity are generally valued at market by an independent pricing vendor, if a market price is available. If a market price is not available, the securities are valued at amortized cost. This methodology is commonly used for short term securities that have an original maturity of 60 days or less, as well as short term securities that had an original term to maturity that exceeded 60 days. In instances when amortized cost is utilized, the Valuation Committee (the “Committee”) must reasonably conclude that the utilization of amortized cost is approximately the same as the fair value of the security. Factors the Committee will consider include, but are not limited to, an impairment of the creditworthiness of the issuer or material changes in interest rates. Fixed-income securities, including mortgage-backed and asset-backed securities, may be valued on the basis of prices provided by a pricing service or at a price obtained from one or more of the major broker-dealers. In cases where broker-dealer quotes are obtained, the Adviser may establish procedures whereby changes in market yields or spreads are used to adjust, on a daily basis, a recently obtained quoted price on a security. Swaps and other derivatives are valued daily, primarily using independent pricing services, independent pricing models using market inputs, as well as third party broker-dealers or counterparties. Open-end mutual funds are valued at the closing net asset value per share, while exchange-traded funds are valued at the closing market price per share.
Securities for which market quotations are not readily available (including restricted securities) or are deemed unreliable are valued at fair value as deemed appropriate by the Adviser. Factors considered in making this determination may include, but
6
| | |
| |
| | | AB Variable Products Series Fund |
are not limited to, information obtained by contacting the issuer, analysts, analysis of the issuer’s financial statements or other available documents. In addition, the Portfolio may use fair value pricing for securities primarily traded in non-U.S. markets because most foreign markets close well before the Portfolio values its securities at 4:00 p.m., Eastern Time. The earlier close of these foreign markets gives rise to the possibility that significant events, including broad market moves, may have occurred in the interim and may materially affect the value of those securities. To account for this, the Portfolio generally values many of its foreign equity securities using fair value prices based on third party vendor modeling tools to the extent available.
2. Fair Value Measurements
In accordance with U.S. GAAP regarding fair value measurements, fair value is defined as the price that the Portfolio would receive to sell an asset or pay to transfer a liability in an orderly transaction between market participants at the measurement date. U.S. GAAP establishes a framework for measuring fair value, and a three-level hierarchy for fair value measurements based upon the transparency of inputs to the valuation of an asset or liability (including those valued based on their market values as described in Note A.1 above). Inputs may be observable or unobservable and refer broadly to the assumptions that market participants would use in pricing the asset or liability. Observable inputs reflect the assumptions market participants would use in pricing the asset or liability based on market data obtained from sources independent of the Portfolio. Unobservable inputs reflect the Portfolio’s own assumptions about the assumptions that market participants would use in pricing the asset or liability based on the best information available in the circumstances. Each investment is assigned a level based upon the observability of the inputs which are significant to the overall valuation. The three-tier hierarchy of inputs is summarized below.
| | • | | Level 1—quoted prices in active markets for identical investments |
| | • | | Level 2—other significant observable inputs (including quoted prices for similar investments, interest rates, prepayment speeds, credit risk, etc.) |
| | • | | Level 3—significant unobservable inputs (including the Portfolio’s own assumptions in determining the fair value of investments) |
Where readily available market prices or relevant bid prices are not available for certain equity investments, such investments may be valued based on similar publicly traded investments, movements in relevant indices since last available prices or based upon underlying company fundamentals and comparable company data (such as multiples to earnings or other multiples to equity). Where an investment is valued using an observable input, such as another publicly traded security, the investment will be classified as Level 2. If management determines that an adjustment is appropriate based on restrictions on resale, illiquidity or uncertainty, and such adjustment is a significant component of the valuation, the investment will be classified as Level 3. An investment will also be classified as Level 3 where management uses company fundamentals and other significant inputs to determine the valuation.
The following table summarizes the valuation of the Portfolio’s investments by the above fair value hierarchy levels as of December 31, 2024:
| | | | | | | | | | | | | | | | |
| | | Level 1 | | | Level 2 | | | Level 3 | | | Total | |
Investments in Securities: | | | | | | | | | | | | | | | | |
Assets: | | | | | | | | | | | | | | | | |
Common Stocks(a) | | $ | 931,076,681 | | | $ | –0 | – | | $ | –0 | – | | $ | 931,076,681 | |
Rights | | | –0 | – | | | –0 | – | | | 11,601 | | | | 11,601 | |
Short-Term Investments | | | 22,856,701 | | | | –0 | – | | | –0 | – | | | 22,856,701 | |
Investments of Cash Collateral for Securities Loaned in Affiliated Money Market Fund | | | 3,264,694 | | | | –0 | – | | | –0 | – | | | 3,264,694 | |
| | | | | | | | | | | | | | | | |
Total Investments in Securities | | | 957,198,076 | | | | –0 | – | | | 11,601 | | | | 957,209,677 | |
Other Financial Instruments(b) | | | –0 | – | | | –0 | – | | | –0 | – | | | –0 | – |
| | | | | | | | | | | | | | | | |
Total | | $ | 957,198,076 | | | $ | –0 | – | | $ | 11,601 | | | $ | 957,209,677 | |
| | | | | | | | | | | | | | | | |
| (a) | | See Portfolio of Investments for sector classifications. |
| (b) | | Other financial instruments include derivative instruments, such as futures, forwards and swaps. Derivative instruments are valued at the unrealized appreciation (depreciation) on the instrument. Other financial instruments may also include swaps with upfront premiums, written options and written swaptions which are valued at market value. |
7
| | |
| LARGE CAP GROWTH PORTFOLIO | | |
| NOTES TO FINANCIAL STATEMENTS | | |
| |
| (continued) | | AB Variable Products Series Fund |
3. Currency Translation
Assets and liabilities denominated in foreign currencies and commitments under forward currency exchange contracts are translated into U.S. dollars at the mean of the quoted bid and ask prices of such currencies against the U.S. dollar. Purchases and sales of portfolio securities are translated into U.S. dollars at the rates of exchange prevailing when such securities were acquired or sold. Income and expenses are translated into U.S. dollars at rates of exchange prevailing when accrued.
Net realized gain or loss on foreign currency transactions represents foreign exchange gains and losses from sales and maturities of foreign fixed income investments, holding of foreign currencies, currency gains or losses realized between the trade and settlement dates on foreign investment transactions, and the difference between the amounts of dividends, interest and foreign withholding taxes recorded on the Portfolio’s books and the U.S. dollar equivalent amounts actually received or paid. Net unrealized currency gains and losses from valuing foreign currency denominated assets and liabilities at period end exchange rates are reflected as a component of net unrealized appreciation or depreciation of foreign currency denominated assets and liabilities.
4. Taxes
It is the Portfolio’s policy to meet the requirements of the Internal Revenue Code applicable to regulated investment companies and to distribute all of its investment company taxable income and net realized gains, if any, to shareholders. Therefore, no provisions for federal income or excise taxes are required. The Portfolio may be subject to taxes imposed by countries in which it invests. Such taxes are generally based on income and/or capital gains earned or repatriated. Taxes are accrued and applied to net investment income, net realized gains and net unrealized appreciation/depreciation as such income and/or gains are earned.
In accordance with U.S. GAAP requirements regarding accounting for uncertainties in income taxes, management has analyzed the Portfolio’s tax positions taken or expected to be taken on federal and state income tax returns for all open tax years (the current and the prior three tax years) and has concluded that no provision for income tax is required in the Portfolio’s financial statements.
5. Investment Income and Investment Transactions
Dividend income is recorded on the ex-dividend date or as soon as the Portfolio is informed of the dividend. Interest income is accrued daily. Investment transactions are accounted for on the date the securities are purchased or sold. Investment gains or losses are determined on the identified cost basis. Non-cash dividends, if any, are recorded on the ex-dividend date at the fair value of the securities received. The Portfolio amortizes premiums and accretes discounts as adjustments to interest income.
The Portfolio accounts for distributions received from real estate investment trust (“REIT”) investments or from regulated investment companies as dividend income, realized gain, or return of capital based on information provided by the REIT or the investment company.
6. Class Allocations
All income earned and expenses incurred by the Portfolio are borne on a pro-rata basis by each outstanding class of shares, based on the proportionate interest in the Portfolio represented by the net assets of such class, except for class specific expenses which are allocated to the respective class. Expenses of the Fund are charged proportionately to each portfolio or based on other appropriate methods. Realized and unrealized gains and losses are allocated among the various share classes based on respective net assets.
7. Dividends and Distributions
Dividends and distributions to shareholders, if any, are recorded on the ex-dividend date. Income dividends and capital gains distributions are determined in accordance with federal tax regulations and may differ from those determined in accordance with U.S. GAAP. To the extent these differences are permanent, such amounts are reclassified within the capital accounts based on their federal tax basis treatment; temporary differences do not require such reclassification.
8. Cash and Short-Term Investments
Cash and short-term investments include cash on hand and short-term investments with maturities of less than one year when purchased.
9. Segment Information
The Portfolio represents a single operating segment. An operating segment is defined in U.S. GAAP as a component of a public entity that engages in business activities from which it may recognize revenues and incur expenses, has operating
8
| | |
| |
| | | AB Variable Products Series Fund |
results that are regularly reviewed by the public entity’s chief operating decision maker (“CODM”) to make decisions about resources to be allocated to the segment and assess its performance, and has discrete financial information available. The Portfolio’s President is the CODM. The CODM monitors the operating results of the Portfolio as a whole and the pre-determined Portfolio’s long term investment strategy, which is executed by the portfolio management group. The qualitative and quantitative information contained within the financial statements is used by the CODM to assess the segments performance versus the Portfolio’s comparative benchmark and to make resource allocation decisions. Segment assets are reflected on the statement of assets and liabilities and segment expenses are listed on the statement of operations.
NOTE B: Advisory Fee and Other Transactions with Affiliates
Under the terms of the investment advisory agreement, the Portfolio pays the Adviser an advisory fee at an annual rate of .60% of the first $2.5 billion, .50% of the next $2.5 billion and .45% in excess of $5 billion, of the Portfolio’s average daily net assets. The fee is accrued daily and paid monthly.
Pursuant to the investment advisory agreement, the Portfolio may reimburse the Adviser for certain legal and accounting services provided to the Portfolio by the Adviser. For the year ended December 31, 2024, the reimbursement for such services amounted to $93,919.
The Portfolio compensates AllianceBernstein Investor Services, Inc. (“ABIS”), a wholly-owned subsidiary of the Adviser, under a Transfer Agency Agreement for providing personnel and facilities to perform transfer agency services for the Portfolio. Such compensation retained by ABIS amounted to $1,950 for the year ended December 31, 2024.
The Portfolio may invest in AB Government Money Market Portfolio which has a contractual annual advisory fee rate of .20% of the portfolio’s average daily net assets and bears its own expenses. The Adviser had contractually agreed to waive .10% of the advisory fee of AB Government Money Market Portfolio (resulting in a net advisory fee of .10%) until August 31, 2023. Effective September 1, 2023, the Adviser has contractually agreed to waive .05% of the advisory fee of AB Government Money Market Portfolio (resulting in a net advisory fee of .15%) until August 31, 2024. In connection with the investment by the Portfolio in AB Government Money Market Portfolio, the Adviser has contractually agreed to waive its advisory fee from the Portfolio in an amount equal to the Portfolio’s pro rata share of the effective advisory fee of AB Government Money Market Portfolio, as borne indirectly by the Portfolio as an acquired fund fee and expense. For the year ended December 31, 2024, such waiver amounted to $27,150.
A summary of the Portfolio’s transactions in AB mutual funds for the year ended December 31, 2024 is as follows:
| | | | | | | | | | | | | | | | | | | | |
Portfolio | | Market Value
12/31/23
(000) | | | Purchases
at Cost
(000) | | | Sales
Proceeds
(000) | | | Market Value
12/31/24
(000) | | | Dividend
Income
(000) | |
AB Government Money Market Portfolio | | $ | 35,427 | | | $ | 98,771 | | | $ | 111,342 | | | $ | 22,856 | | | $ | 872 | |
AB Government Money Market Portfolio* | | | –0 | – | | | 4,555 | | | | 1,290 | | | | 3,265 | | | | –0 | – |
| | | | | | | | | | | | | | | | | | | | |
Total | | | | | | | | | | | | | | $ | 26,121 | | | $ | 872 | |
| | | | | | | | | | | | | | | | | | | | |
| * | | Investments of cash collateral for securities lending transactions (see Note E). |
During the year ended December 31, 2023, the Adviser reimbursed the Portfolio $488 for trading losses incurred due to a trade entry error.
NOTE C: Distribution Plan
The Portfolio has adopted a Distribution Plan (the “Plan”) for Class B shares pursuant to Rule 12b-1 under the 1940 Act. Under the Plan, the Portfolio pays distribution and servicing fees to AllianceBernstein Investments, Inc. (the “Distributor”), a wholly-owned subsidiary of the Adviser, at an annual rate of up to .50% of the Portfolio’s average daily net assets attributable to Class B shares. The fees are accrued daily and paid monthly. The Board currently limits payments under the Plan to .25% of the Portfolio’s average daily net assets attributable to Class B shares. The Plan provides that the Distributor will use such payments in their entirety for distribution assistance and promotional activities.
The Portfolio is not obligated under the Plan to pay any distribution and servicing fees in excess of the amounts set forth above. The purpose of the payments to the Distributor under the Plan is to compensate the Distributor for its distribution services with respect to the sale of the Portfolio’s Class B shares. Since the Distributor’s compensation is not directly tied to
9
| | |
| LARGE CAP GROWTH PORTFOLIO | | |
| NOTES TO FINANCIAL STATEMENTS | | |
| |
| (continued) | | AB Variable Products Series Fund |
its expenses, the amount of compensation received by it under the Plan during any year may be more or less than its actual expenses. For this reason, the Plan is characterized by the staff of the Securities and Exchange Commission as being of the “compensation” variety.
In the event that the Plan is terminated or not continued, no distribution or servicing fees (other than current amounts accrued but not yet paid) would be owed by the Portfolio to the Distributor.
The Plan also provides that the Adviser may use its own resources to finance the distribution of the Portfolio’s shares.
NOTE D: Investment Transactions
Purchases and sales of investment securities (excluding short-term investments) for the year ended December 31, 2024 were as follows:
| | | | | | | | |
| | | Purchases | | | Sales | |
Investment securities (excluding U.S. government securities) | | $ | 234,494,158 | | | $ | 234,238,761 | |
U.S. government securities | | | –0 | – | | | –0 | – |
The cost of investments for federal income tax purposes, gross unrealized appreciation and unrealized depreciation are as follows:
| | | | |
Cost | | $ | 504,547,679 | |
| | | | |
Gross unrealized appreciation | | | 467,329,593 | |
Gross unrealized depreciation | | | (14,667,595 | ) |
| | | | |
Net unrealized appreciation | | $ | 452,661,998 | |
| | | | |
1. Derivative Financial Instruments
The Portfolio may use derivatives in an effort to earn income and enhance returns, to replace more traditional direct investments, to obtain exposure to otherwise inaccessible markets (collectively, “investment purposes”), or to hedge or adjust the risk profile of its portfolio.
The Portfolio did not engage in derivatives transactions for the year ended December 31, 2024.
2. Currency Transactions
The Portfolio may invest in non-U.S. Dollar-denominated securities on a currency hedged or unhedged basis. The Portfolio may seek investment opportunities by taking long or short positions in currencies through the use of currency-related derivatives, including forward currency exchange contracts, futures and options on futures, swaps, and other options. The Portfolio may enter into transactions for investment opportunities when it anticipates that a foreign currency will appreciate or depreciate in value but securities denominated in that currency are not held by the Portfolio and do not present attractive investment opportunities. Such transactions may also be used when the Adviser believes that it may be more efficient than a direct investment in a foreign currency-denominated security. The Portfolio may also conduct currency exchange contracts on a spot basis (i.e., for cash at the spot rate prevailing in the currency exchange market for buying or selling currencies).
NOTE E: Securities Lending
The Portfolio may enter into securities lending transactions. Under the Portfolio’s securities lending program, all loans of securities will be collateralized continually by cash collateral and/or non-cash collateral. Non-cash collateral will include only securities issued or guaranteed by the U.S. government or its agencies or instrumentalities. If the Portfolio cannot sell or repledge any non-cash collateral, such collateral will not be reflected in the portfolio of investments. If a loan is collateralized by cash, the Portfolio will be compensated for the loan from a portion of the net return from the income earned on cash collateral after a rebate is paid to the borrower (in some cases, this rebate may be a “negative rebate” or fee paid by the borrower to the Portfolio in connection with the loan), and payments are made for fees of the securities lending agent and for certain other administrative expenses. If the Portfolio receives non-cash collateral, the Portfolio will receive a fee from the borrower generally equal to a negotiated percentage of the market value of the loaned securities. The Portfolio will have the right to call a loan and obtain the securities loaned at any time on notice to the borrower within the normal and customary settlement time for the securities. While the securities are on loan, the borrower is obligated to pay the Portfolio amounts equal to any dividend income or other distributions from the securities; however, these distributions will not be afforded the same preferential tax treatment as qualified dividends. The Portfolio will not be able to exercise voting rights with respect to any securities during the existence of a loan, but will have the right to regain ownership of loaned securities in order to
10
| | |
| |
| | | AB Variable Products Series Fund |
exercise voting or other ownership rights. Collateral received and securities loaned are marked to market daily to ensure that the securities loaned are secured by collateral. The lending agent currently invests the cash collateral received in AB Government Money Market Portfolio, an eligible money market vehicle, in accordance with the investment restrictions of the Portfolio, and as approved by the Board. The collateral received on securities loaned is recorded as an asset as well as a corresponding liability in the statement of assets and liabilities. The collateral will be adjusted the next business day to maintain the required collateral amount. The amounts of securities lending income from the borrowers and AB Government Money Market Portfolio are reflected in the statement of operations. When the Portfolio earns net securities lending income from AB Government Money Market Portfolio, the income is inclusive of a rebate expense paid to the borrower. In connection with the cash collateral investment by the Portfolio in AB Government Money Market Portfolio, the Adviser has agreed to waive a portion of the Portfolio’s share of the advisory fees of AB Government Money Market Portfolio, as borne indirectly by the Portfolio as an acquired fund fee and expense. When the Portfolio lends securities, its investment performance will continue to reflect changes in the value of the securities loaned. A principal risk of lending portfolio securities is that the borrower may fail to return the loaned securities upon termination of the loan and that the collateral will not be sufficient to replace the loaned securities. The lending agent has agreed to indemnify the Portfolio in the case of default of any securities borrower.
A summary of the Portfolio’s transactions surrounding securities lending for the year ended December 31, 2024 is as follows:
| | | | | | | | | | | | | | | | | | | | | | |
Market Value of
Securities on Loan* | | | Cash Collateral* | | | Market Value of
Non-Cash
Collateral* | | | Income from
Borrowers | | | AB Government Money
Market Portfolio | |
| | Income Earned | | | Advisory Fee
Waived | |
| $ | 3,986,911 | | | $ | 3,264,694 | | | $ | 764,570 | | | $ | 3,820 | | | $ | –0– | | | $ | 134 | |
| * | | As of December 31, 2024. |
NOTE F: Capital Stock
Each class consists of 500,000,000 authorized shares. Transactions in capital shares for each class were as follows:
| | | | | | | | | | | | | | | | | | | | |
| | | SHARES | | | | | | AMOUNT | |
| | | Year Ended
December 31, 2024 | | | Year Ended
December 31, 2023 | | | | | | Year Ended
December 31, 2024 | | | Year Ended
December 31, 2023 | |
Class A | |
Shares sold | | | 180,385 | | | | 303,693 | | | | | | | $ | 15,397,210 | | | $ | 20,384,732 | |
Shares issued in reinvestment of dividends and distributions | | | 188,628 | | | | 295,735 | | | | | | | | 14,973,256 | | | | 20,050,816 | |
Shares redeemed | | | (593,493 | ) | | | (591,209 | ) | | | | | | | (50,409,600 | ) | | | (40,029,950 | ) |
| | | | | | | | | | | | | | | | | | | | |
Net increase (decrease) | | | (224,480 | ) | | | 8,219 | | | | | | | $ | (20,039,134 | ) | | $ | 405,598 | |
| | | | | | | | | | | | | | | | | | | | |
Class B | |
Shares sold | | | 1,103,284 | | | | 606,789 | | | | | | | $ | 85,672,707 | | | $ | 37,120,401 | |
Shares issued on reinvestment of distributions | | | 327,380 | | | | 467,160 | | | | | | | | 23,217,785 | | | | 28,501,444 | |
Shares redeemed | | | (828,978 | ) | | | (637,919 | ) | | | | | | | (63,024,041 | ) | | | (38,825,995 | ) |
| | | | | | | | | | | | | | | | | | | | |
Net increase | | | 601,686 | | | | 436,030 | | | | | | | $ | 45,866,451 | | | $ | 26,795,850 | |
| | | | | | | | | | | | | | | | | | | | |
At December 31, 2024, certain shareholders of the Portfolio owned 62% in aggregate of the Portfolio’s outstanding shares. Significant transactions by such shareholders, if any, may impact the Portfolio’s performance.
NOTE G: Risks Involved in Investing in the Portfolio
Market Risk—The value of the Portfolio’s assets will fluctuate as the market or markets in which the Portfolio invests fluctuate. The value of the Portfolio’s investments may decline, sometimes rapidly and unpredictably, simply because of economic changes or other events, including public health crises (including the occurrence of a contagious disease or illness) and regional and global conflicts, that affect large portions of the market. It includes the risk that a particular style of investing may underperform the market generally.
11
| | |
| LARGE CAP GROWTH PORTFOLIO | | |
| NOTES TO FINANCIAL STATEMENTS | | |
| |
| (continued) | | AB Variable Products Series Fund |
Focused Portfolio Risk—Investments in a limited number of companies may have more risk because changes in the value of a single security may have a more significant effect, either negative or positive, on the Portfolio’s net asset value, or NAV, than would be the case if the Portfolio were invested in a larger number of companies.
Sector Risk—The Portfolio may have more risk than a more diversified portfolio because it may invest to a significant extent in one or more particular market sectors, such as the information technology or health care sector. To the extent it does so, market or economic factors affecting the relevant sector(s) could have a major effect on the value of the Portfolio’s investments.
Foreign (Non-U.S.) Risk—Investments in securities of non-U.S. issuers may involve more risk than those of U.S. issuers. These securities may fluctuate more widely in price and may be more difficult to trade due to adverse market, economic, political, regulatory or other factors.
Derivatives Risk—Derivatives may be difficult to price or unwind and leveraged so that small changes may produce disproportionate losses for the Portfolio. A short position in a derivative instrument involves the risk of a theoretically unlimited increase in the value of the underlying asset, reference rate or index, which could cause the Portfolio to suffer a potentially unlimited loss. Derivatives, especially over-the-counter derivatives, are also subject to counterparty risk, which is the risk that the counterparty (the party on the other side of the transaction) on a derivative transaction will be unable or unwilling to honor its contractual obligations to the Portfolio.
Indemnification Risk—In the ordinary course of business, the Portfolio enters into contracts that contain a variety of indemnifications. The Portfolio’s maximum exposure under these arrangements is unknown. However, the Portfolio has not had prior claims or losses pursuant to these indemnification provisions and expects the risk of loss thereunder to be remote. Therefore, the Portfolio has not accrued any liability in connection with these indemnification provisions.
Management Risk—The Portfolio is subject to management risk because it is an actively-managed investment fund. The Adviser will apply its investment techniques and risk analyses in making investment decisions for the Portfolio, but there is no guarantee that its techniques will produce the intended results. Some of these techniques may incorporate, or rely upon, quantitative models, but there is no guarantee that these models will generate accurate forecasts, reduce risk or otherwise perform as expected.
NOTE H: Joint Credit Facility
A number of open-end mutual funds managed by the Adviser, including the Portfolio, participate in a $325 million revolving credit facility (the “Facility”) intended to provide short-term financing related to redemptions and other short term liquidity requirements, subject to certain restrictions. Commitment fees related to the Facility are paid by the participating funds and are included in miscellaneous expenses in the statement of operations. The Portfolio did not utilize the Facility during the year ended December 31, 2024.
NOTE I: Distributions to Shareholders
The tax character of distributions paid during the fiscal years ended December 31, 2024 and December 31, 2023 were as follows:
| | | | | | | | |
| | | 2024 | | | 2023 | |
Distributions paid from: | | | | | | | | |
Ordinary income | | $ | 199,068 | | | $ | –0 | – |
Net long-term capital gains | | | 37,991,973 | | | $ | 48,552,260 | |
| | | | | | | | |
Total taxable distributions paid | | $ | 38,191,041 | | | $ | 48,552,260 | |
| | | | | | | | |
As of December 31, 2024, the components of accumulated earnings (deficit) on a tax basis were as follows:
| | | | |
Undistributed capital gains | | $ | 89,128,813 | |
Unrealized appreciation (depreciation) | | | 452,661,998 | (a) |
| | | | |
Total accumulated earnings (deficit) | | $ | 541,790,811 | |
| | | | |
| (a) | | The differences between book-basis and tax-basis unrealized appreciation (depreciation) is attributable primarily to the tax deferral of losses on wash sales. |
For tax purposes, net realized capital losses may be carried over to offset future capital gains, if any. Funds are permitted to carry forward capital losses for an indefinite period, and such losses will retain their character as either short-term or long-term capital losses. As of December 31, 2024, the Portfolio did not have any capital loss carryforwards.
12
| | |
| |
| | | AB Variable Products Series Fund |
During the current fiscal year, permanent differences primarily due to the disallowance of a net operating loss resulted in a net increase in distributable earnings and a net decrease in additional paid-in capital. These reclassifications had no effect on net assets.
NOTE J: Subsequent Events
Management has evaluated subsequent events for possible recognition or disclosure in the financial statements through the date the financial statements are issued. Management has determined that there are no material events that would require disclosure in the Portfolio’s financial statements through this date.
13
| | |
| | |
| LARGE CAP GROWTH PORTFOLIO | | |
| |
| FINANCIAL HIGHLIGHTS | | AB Variable Products Series Fund |
Selected Data For A Share Of Capital Stock Outstanding Throughout Each Period
| | | | | | | | | | | | | | | | | | | | |
| | | CLASS A | |
| | | Year Ended December 31, | |
| | | 2024 | | | 2023 | | | 2022 | | | 2021 | | | 2020 | |
Net asset value, beginning of period | | | $74.50 | | | | $58.90 | | | | $93.09 | | | | $77.09 | | | | $61.26 | |
| | | | | | | | | | | | | | | | | | | | |
| | | | | | | | | | | | | | | | | | | | |
Income From Investment Operations | | | | | | | | | | | | | | | | | | | | |
Net investment income (loss)(a)(b) | | | (.04 | ) | | | .11 | | | | (.05 | ) | | | (.19 | ) | | | (.06 | ) |
Net realized and unrealized gain (loss) on investment transactions | | | 18.41 | | | | 20.12 | | | | (25.48 | ) | | | 22.16 | | | | 21.18 | |
Contributions from Affiliates | | | –0 | – | | | .00 | (c) | | | –0 | – | | | –0 | – | | | –0 | – |
| | | | | | | | | | | | | | | | | | | | |
Net increase (decrease) in net asset value from operations | | | 18.37 | | | | 20.23 | | | | (25.53 | ) | | | 21.97 | | | | 21.12 | |
| | | | | | | | | | | | | | | | | | | | |
| | | | | | | | | | | | | | | | | | | | |
Less: Dividends and Distributions | | | | | | | | | | | | | | | | | | | | |
Dividends from net investment income | | | (.05 | ) | | | –0 | – | | | –0 | – | | | –0 | – | | | –0 | – |
Distributions from net realized gain on investment transactions | | | (3.51 | ) | | | (4.63 | ) | | | (8.66 | ) | | | (5.97 | ) | | | (5.29 | ) |
| | | | | | | | | | | | | | | | | | | | |
Total dividends and distributions | | | (3.56 | ) | | | (4.63 | ) | | | (8.66 | ) | | | (5.97 | ) | | | (5.29 | ) |
| | | | | | | | | | | | | | | | | | | | |
Net asset value, end of period | | | $89.31 | | | | $74.50 | | | | $58.90 | | | | $93.09 | | | | $77.09 | |
| | | | | | | | | | | | | | | | | | | | |
| | | | | | | | | | | | | | | | | | | | |
Total Return | | | | | | | | | | | | | | | | | | | | |
Total investment return based on net asset value(d)* | | | 25.26 | % | | | 35.13 | % | | | (28.51 | )% | | | 28.98 | % | | | 35.49 | % |
| | | | | | | | | | | | | | | | | | | | |
Ratios/Supplemental Data | | | | | | | | | | | | | | | | | | | | |
Net assets, end of period
(000’s omitted) | | | $375,852 | | | | $330,245 | | | | $260,596 | | | | $389,051 | | | | $331,436 | |
Ratio to average net assets of: | | | | | | | | | | | | | | | | | | | | |
Expenses, net of waivers/reimbursements(e)‡ | | | .65 | % | | | .65 | % | | | .65 | % | | | .65 | % | | | .66 | % |
Expenses, before waivers/reimbursements(e)‡ | | | .65 | % | | | .66 | % | | | .65 | % | | | .65 | % | | | .67 | % |
Net investment income (loss)(b) | | | (.04 | )% | | | .17 | % | | | (.07 | )% | | | (.22 | )% | | | (.08 | )% |
Portfolio turnover rate | | | 27 | % | | | 30 | % | | | 34 | % | | | 17 | % | | | 33 | % |
| | | | | | | | | | | | | | | | | | | | |
‡ Expense ratios exclude the estimated acquired fund fees of the affiliated/unaffiliated underlying | |
portfolios | | | .00 | % | | | .01 | % | | | .00 | % | | | .00 | % | | | .01 | % |
See footnote summary on page 15.
14
| | |
| |
| | | AB Variable Products Series Fund |
Selected Data For A Share Of Capital Stock Outstanding Throughout Each Period
| | | | | | | | | | | | | | | | | | | | |
| | | CLASS B | |
| | | Year Ended December 31, | |
| | | 2024 | | | 2023 | | | 2022 | | | 2021 | | | 2020 | |
Net asset value, beginning of period | | | $66.96 | | | | $53.45 | | | | $85.67 | | | | $71.51 | | | | $57.28 | |
| | | | | | | | | | | | | | | | | | | | |
| | | | | | | | | | | | | | | | | | | | |
Income From Investment Operations | | | | | | | | | | | | | | | | | | | | |
Net investment loss(a)(b) | | | (.22 | ) | | | (.05 | ) | | | (.20 | ) | | | (.37 | ) | | | (.21 | ) |
Net realized and unrealized gain (loss) on investment transactions | | | 16.49 | | | | 18.19 | | | | (23.36 | ) | | | 20.50 | | | | 19.73 | |
Contributions from Affiliates | | | –0 | – | | | .00 | (c) | | | –0 | – | | | –0 | – | | | –0 | – |
| | | | | | | | | | | | | | | | | | | | |
Net increase (decrease) in net asset value from operations | | | 16.27 | | | | 18.14 | | | | (23.56 | ) | | | 20.13 | | | | 19.52 | |
| | | | | | | | | | | | | | | | | | | | |
| | | | | | | | | | | | | | | | | | | | |
Less: Distributions | | | | | | | | | | | | | | | | | | | | |
Distributions from net realized gain on investment transactions | | | (3.51 | ) | | | (4.63 | ) | | | (8.66 | ) | | | (5.97 | ) | | | (5.29 | ) |
| | | | | | | | | | | | | | | | | | | | |
Net asset value, end of period | | | $79.72 | | | | $66.96 | | | | $53.45 | | | | $85.67 | | | | $71.51 | |
| | | | | | | | | | | | | | | | | | | | |
| | | | | | | | | | | | | | | | | | | | |
Total Return | | | | | | | | | | | | | | | | | | | | |
Total investment return based on net asset value(d)* | | | 24.95 | % | | | 34.78 | % | | | (28.69 | )% | | | 28.65 | % | | | 35.15 | % |
| | | | | | | | | | | | | | | | | | | | |
Ratios/Supplemental Data | | | | | | | | | | | | | | | | | | | | |
Net assets, end of period
(000’s omitted) | | | $575,641 | | | | $443,248 | | | | $330,487 | | | | $490,111 | | | | $413,127 | |
Ratio to average net assets of: | | | | | | | | | | | | | | | | | | | | |
Expenses, net of waivers/reimbursements(e)‡ | | | .90 | % | | | .90 | % | | | .90 | % | | | .90 | % | | | .91 | % |
Expenses, before waivers/reimbursements(e)‡ | | | .90 | % | | | .91 | % | | | .90 | % | | | .90 | % | | | .92 | % |
Net investment loss(b) | | | (.29 | )% | | | (.08 | )% | | | (.32 | )% | | | (.47 | )% | | | (.33 | )% |
Portfolio turnover rate | | | 27 | % | | | 30 | % | | | 34 | % | | | 17 | % | | | 33 | % |
| | | | | | | | | | | | | | | | | | | | |
‡ Expense ratios exclude the estimated acquired fund fees of the affiliated/unaffiliated underlying | |
portfolios | | | .00 | % | | | .01 | % | | | .00 | % | | | .00 | % | | | .01 | % |
| (a) | | Based on average shares outstanding. |
| (b) | | Net of expenses waived/reimbursed by the Adviser. |
| (c) | | Amount is less than $.005. |
| (d) | | Total investment return is calculated assuming an initial investment made at the net asset value at the beginning of the period, reinvestment of all dividends and distributions at net asset value during the period, and redemption on the last day of the period. Total investment return does not reflect (i) insurance company’s separate account related expense charges and (ii) the deductions of taxes that a shareholder would pay on Portfolio distributions or the redemption of Portfolio shares. Total investment return calculated for a period of less than one year is not annualized. |
| (e) | | In connection with the Portfolio’s investments in affiliated underlying portfolios, the Portfolio incurs no direct expenses, but bears proportionate shares of the fees and expenses (i.e., operating, administrative and investment advisory fees) of the affiliated underlying portfolios. The Adviser has contractually agreed to waive its fees from the Portfolio in an amount equal to the Portfolio’s pro rata share of certain acquired fund fees and expenses, and for the years ended December 31, 2023 and December 31, 2020, such waiver amounted to .01% and .01%, respectively. |
| * | | Includes the impact of proceeds received and credited to the Portfolio resulting from class action settlements, which enhanced the Portfolio’s performance for the year ended December 31, 2024 by .11%. |
See notes to financial statements.
15
| | |
| | |
| REPORT OF INDEPENDENT REGISTERED | | |
| |
| PUBLIC ACCOUNTING FIRM | | AB Variable Products Series Fund |
To the Board of Directors and Shareholders of AB Large Cap Growth Portfolio
Opinion on the Financial Statements
We have audited the accompanying statement of assets and liabilities of AB Large Cap Growth Portfolio (the “Portfolio”) (one of the series constituting AB Variable Products Series Fund, Inc. (the “Fund”)), including the portfolio of investments, as of December 31, 2024, and the related statement of operations for the year then ended, the statements of changes in net assets for each of the two years in the period then ended, the financial highlights for each of the five years in the period then ended and the related notes (collectively referred to as the “financial statements”). In our opinion, the financial statements present fairly, in all material respects, the financial position of the Portfolio (one of the series constituting AB Variable Products Series Fund, Inc.) at December 31, 2024, the results of its operations for the year then ended, the changes in its net assets for each of the two years in the period then ended and its financial highlights for each of the five years in the period then ended, in conformity with U.S. generally accepted accounting principles.
Basis for Opinion
These financial statements are the responsibility of the Fund’s management. Our responsibility is to express an opinion on the Portfolio’s financial statements based on our audits. We are a public accounting firm registered with the Public Company Accounting Oversight Board (United States) (“PCAOB”) and are required to be independent with respect to the Fund in accordance with the U.S. federal securities laws and the applicable rules and regulations of the Securities and Exchange Commission and the PCAOB.
We conducted our audits in accordance with the standards of the PCAOB. Those standards require that we plan and perform the audit to obtain reasonable assurance about whether the financial statements are free of material misstatement, whether due to error or fraud. The Fund is not required to have, nor were we engaged to perform, an audit of the Fund’s internal control over financial reporting. As part of our audits, we are required to obtain an understanding of internal control over financial reporting but not for the purpose of expressing an opinion on the effectiveness of the Fund’s internal control over financial reporting. Accordingly, we express no such opinion.
Our audits included performing procedures to assess the risks of material misstatement of the financial statements, whether due to error or fraud, and performing procedures that respond to those risks. Such procedures included examining, on a test basis, evidence regarding the amounts and disclosures in the financial statements. Our procedures included confirmation of securities owned as of December 31, 2024, by correspondence with the custodian, brokers and others; when replies were not received from brokers or others, we performed other auditing procedures. Our audits also included evaluating the accounting principles used and significant estimates made by management, as well as evaluating the overall presentation of the financial statements. We believe that our audits provide a reasonable basis for our opinion.

We have served as the auditor of one or more of the AB investment companies since 1968.
New York, New York
February 14, 2025
16
| | |
| | |
| | |
| |
| 2024 TAX INFORMATION (unaudited) | | AB Variable Products Series Fund |
For Federal income tax purposes, the following information is furnished with respect to the distributions paid by the Portfolio during the taxable year ended December 31, 2024. The Portfolio designates $37,991,973 of dividends paid as long-term capital gain dividends.
17
| | |
| | |
| LARGE CAP GROWTH PORTFOLIO | | |
| |
| CONTINUANCE DISCLOSURE | | AB Variable Products Series Fund |
INFORMATION REGARDING THE REVIEW AND APPROVAL OF THE FUND’S ADVISORY AGREEMENT
The disinterested directors (the “directors”) of AB Variable Products Series Fund, Inc. (the “Company”) unanimously approved the continuance of the Company’s Advisory Agreement with the Adviser in respect of AB Large Cap Growth Portfolio (the “Fund”) at a meeting held by video conference on May 7-9, 2024 (the “Meeting”).
Prior to approval of the continuance of the Advisory Agreement, the directors had requested from the Adviser, and received and evaluated, extensive materials. They reviewed the proposed continuance of the Advisory Agreement with the Adviser and with experienced counsel who are independent of the Adviser, who advised on the relevant legal standards. The directors also reviewed additional materials, including comparative analytical data prepared by the Senior Vice President of the Fund. The directors also discussed the proposed continuance in private sessions with counsel.
The directors considered their knowledge of the nature and quality of the services provided by the Adviser to the Fund gained from their experience as directors or trustees of most of the registered investment companies advised by the Adviser, their overall confidence in the Adviser’s integrity and competence they have gained from that experience, the Adviser’s initiative in identifying and raising potential issues with the directors and its responsiveness, frankness and attention to concerns raised by the directors in the past, including the Adviser’s willingness to consider and implement organizational and operational changes designed to improve investment results and the services provided to the AB Funds. The directors noted that they have four regular meetings each year, at each of which they review extensive materials and information from the Adviser, including information on the investment performance of the Fund and the money market fund advised by the Adviser in which the Fund invests a portion of its assets.
The directors also considered all factors they believed relevant, including the specific matters discussed below. During the course of their deliberations, the directors evaluated, among other things, the reasonableness of the advisory fee. The directors did not identify any particular information that was all-important or controlling, and different directors may have attributed different weights to the various factors. The directors determined that the selection of the Adviser to manage the Fund and the overall arrangements between the Fund and the Adviser, as provided in the Advisory Agreement, including the advisory fee, were fair and reasonable in light of the services performed, expenses incurred and such other matters as the directors considered relevant in the exercise of their business judgment. The material factors and conclusions that formed the basis for the directors’ determinations included the following:
Nature, Extent and Quality of Services Provided
The directors considered the scope and quality of services provided by the Adviser under the Advisory Agreement, including the quality of the investment research capabilities of the Adviser and the other resources it has dedicated to performing services for the Fund. The directors noted that the Adviser from time to time reviews the Fund’s investment strategies and from time to time proposes changes intended to improve the Fund’s relative or absolute performance for the directors’ consideration. They also noted the professional experience and qualifications of the Fund’s portfolio management team and other senior personnel of the Adviser. The directors also considered that the Advisory Agreement provides that the Fund will reimburse the Adviser for the cost to it of providing certain clerical, accounting, administrative and other services to the Fund by employees of the Adviser or its affiliates. Requests for these reimbursements are made on a quarterly basis and subject to approval by the directors. Reimbursements, to the extent requested and paid, result in a higher rate of total compensation from the Fund to the Adviser than the fee rate stated in the Advisory Agreement. The directors noted that the methodology used to determine the reimbursement amounts had been reviewed by an independent consultant at the request of the directors. The quality of administrative and other services, including the Adviser’s role in coordinating the activities of the Fund’s other service providers, also was considered. The directors concluded that, overall, they were satisfied with the nature, extent and quality of services provided to the Fund under the Advisory Agreement.
Costs of Services Provided and Profitability
The directors reviewed a schedule of the revenues and expenses and related notes indicating the profitability of the Fund to the Adviser for calendar years 2022 and 2023 that had been prepared with an expense allocation methodology arrived at in consultation with an independent consultant at the request of the directors. The directors noted the assumptions and methods of allocation used by the Adviser in preparing fund-specific profitability data and understood that there are a number of potentially acceptable allocation methodologies for information of this type. The directors noted that the profitability information reflected all revenues and expenses of the Adviser’s relationship with the Fund, including those relating to its subsidiaries that provide transfer agency, distribution and brokerage services to the Fund. The directors recognized that it is difficult to make comparisons of the profitability of the Advisory Agreement with the profitability of fund advisory contracts
18
| | |
| |
| | | AB Variable Products Series Fund |
for unaffiliated funds because comparative information is not generally publicly available and is affected by numerous factors. The directors focused on the profitability of the Adviser’s relationship with the Fund before taxes and distribution expenses. The directors concluded that the Adviser’s level of profitability from its relationship with the Fund was not unreasonable.
Fall-Out Benefits
The directors considered the other benefits to the Adviser and its affiliates from their relationships with the Fund and the money market fund advised aby the Adviser in which the Fund invests, including, but not limited to, benefits relating to soft dollar arrangements (whereby investment advisers receive brokerage and research services from brokers that execute agency transactions for their clients); 12b-1 fees and sales charges received by the Fund’s principal underwriter (which is a wholly owned subsidiary of the Adviser) in respect of the Fund’s Class B shares; brokerage commissions paid by the Fund to brokers affiliated with the Adviser; and transfer agency fees paid by the Fund to a wholly owned subsidiary of the Adviser. The directors recognized that the Adviser’s profitability would be somewhat lower without these benefits. The directors understood that the Adviser also might derive reputational and other benefits from its association with the Fund.
Investment Results
In addition to the information reviewed by the directors in connection with the Meeting, the directors receive detailed performance information for the Fund at each regular Board meeting during the year.
At the Meeting, the directors reviewed performance information prepared by an independent service provider (the “15(c) service provider”), showing the performance of the Class A Shares of the Fund against a group of similar funds (“peer group”) and a larger group of similar funds (“peer universe”), each selected by the 15(c) service provider, and information prepared by the Adviser showing performance of the Class A Shares against a broad-based securities market index, in each case for the 1-, 3-, 5- and 10-year periods ended February 29, 2024 and (in the case of comparisons with the broad-based securities market index) for the period from inception. Based on their review, the directors concluded that the Fund’s investment performance was acceptable.
Advisory Fees and Other Expenses
The directors considered the advisory fee rate payable by the Fund to the Adviser and information prepared by the 15(c) service provider concerning advisory fee rates payable by other funds in the same category as the Fund. The directors recognized that it is difficult to make comparisons of advisory fees because there are variations in the services that are included in the fees paid by other funds. The directors compared the Fund’s contractual effective advisory fee rate with a peer group median and noted that it was lower than the median. They also noted that the Adviser’s total rate of compensation, taking into account the impact of the administrative expense reimbursement paid to the Adviser in the latest fiscal year, was lower than the median.
The directors also considered the Adviser’s fee schedule for other clients utilizing investment strategies similar to those of the Fund. For this purpose, they reviewed the relevant advisory fee information from the Adviser’s Form ADV and in a report from the Fund’s Senior Vice President and noted the differences between the Fund’s fee schedule, on the one hand, and the Adviser’s institutional fee schedule and the schedule of fees charged by the Adviser to any offshore funds and for services to any sub-advised funds utilizing investment strategies similar to those of the Fund, on the other. The directors noted that the Adviser may, in some cases, agree to fee rates with large institutional clients that are lower than those reviewed by the directors and that they had previously discussed with the Adviser its policies in respect of such arrangements. The directors also compared the advisory fee rate for the Fund with that for another funds advised by the Adviser utilizing similar investment strategies.
The Adviser reviewed with the directors the significantly greater scope of the services it provides to the Fund relative to institutional, offshore fund and sub-advised fund clients. In this regard, the Adviser noted, among other things, that, compared to institutional and offshore or sub-advisory accounts, the Fund (i) demands considerably more portfolio management, research and trading resources due to significantly higher daily cash flows; (ii) has more tax and regulatory restrictions and compliance obligations; (iii) must prepare and file or distribute regulatory and other communications about fund operations; and (iv) must provide shareholder servicing to retail investors. The Adviser also reviewed the greater legal risks presented by the large and changing population of Fund shareholders who may assert claims against the Adviser in individual or class actions, and the greater entrepreneurial risk in offering new fund products, which require substantial investment to launch, may not succeed, and generally must be priced to compete with larger, more established funds resulting in lack of profitability to the Adviser until a new fund achieves scale. In light of the substantial differences in services rendered by the
19
| | |
| LARGE CAP GROWTH PORTFOLIO | | |
| CONTINUANCE DISCLOSURE | | |
| |
| (continued) | | AB Variable Products Series Fund |
Adviser to institutional, offshore fund and sub-advised fund clients as compared to the Fund, and the different risk profile, the directors considered these fee comparisons inapt and did not place significant weight on them in their deliberations.
In connection with their review of the Fund’s advisory fee, the directors also considered the total expense ratio of the Class A shares of the Fund in comparison to the medians for a peer group and a peer universe selected by the 15(c) service provider. The Class A expense ratio of the Fund was based on the Fund’s latest fiscal year. The directors noted that it was likely that the expense ratios of some of the other funds in the Fund’s category were lowered by waivers or reimbursements by those funds’ investment advisers, which in some cases might be voluntary or temporary. The directors view expense ratio information as relevant to their evaluation of the Adviser’s services because the Adviser is responsible for coordinating services provided to the Fund by others. The directors noted that the Fund’s expense ratio was lower than the medians. Based on their review, the directors concluded that the Fund’s expense ratio was acceptable.
Economies of Scale
The directors noted that the advisory fee schedule for the Fund contains breakpoints that reduce the fee rates on assets above specified levels. The directors took into consideration prior presentations by an independent consultant on economies of scale in the mutual fund industry and for the AB Funds, and presentations from time to time by the Adviser concerning certain of its views on economies of scale. The directors also had requested and received from the Adviser certain updates on economies of scale in advance of the Meeting. The directors believe that economies of scale may be realized (if at all) by the Adviser across a variety of products and services, and not only in respect of a single fund. The directors noted that there is no established methodology for setting breakpoints that give effect to the fund-specific services provided by a fund’s adviser and to the economies of scale that an adviser may realize in its overall mutual fund business or those components of it which directly or indirectly affect a fund’s operations. The directors observed that in the mutual fund industry as a whole, as well as among funds similar to the Fund, there is no uniformity or pattern in the fees and asset levels at which breakpoints (if any) apply. The directors also noted that the advisory agreements for many funds do not have breakpoints at all. Having taken these factors into account, the directors concluded that the Fund’s shareholders would benefit from a sharing of economies of scale in the event the Fund’s net assets exceed a breakpoint in the future.
20
VPS-LCG-0151-1224
DEC 12.31.24

ANNUAL FINANCIAL STATEMENTS AND ADDITIONAL INFORMATION
AB VARIABLE PRODUCTS SERIES FUND, INC.
| + | | AB RELATIVE VALUE PORTFOLIO |
Investment Products Offered
| | • | | Are Not Bank Guaranteed |
AllianceBernstein Investments, Inc. (ABI) is the distributor of the AB family of mutual funds. ABI is a member of FINRA and is an affiliate of AllianceBernstein L.P., the Adviser of the funds.
You may obtain a description of the Fund’s proxy voting policies and procedures, and information regarding how the Fund voted proxies relating to portfolio securities during the most recent 12-month period ended June 30, without charge. Simply visit AB’s website at www.abfunds.com or go to the Securities and Exchange Commission’s (the “Commission”) website at www.sec.gov, or call AB at (800) 227 4618.
The Fund files its complete schedule of portfolio holdings with the Commission for the first and third quarters of each fiscal year as an exhibit to its reports on Form N-PORT. The Fund’s Form N-PORT reports are available on the Commission’s website at www.sec.gov.
The [A/B] logo and AllianceBernstein® are registered trademarks used by permission of the owner, AllianceBernstein L.P.
| | |
| RELATIVE VALUE PORTFOLIO | | |
| PORTFOLIO OF INVESTMENTS | | |
| |
| December 31, 2024 | | AB Variable Products Series Fund |
| | | | | | | | |
Company | | Shares | | | U.S. $ Value | |
| | | | | | | | |
COMMON STOCKS–96.5% | | | | | | | | |
FINANCIALS–23.2% | | | | | | | | |
BANKS–8.6% | | | | | | | | |
Citigroup, Inc. | | | 340,563 | | | $ | 23,972,229 | |
JPMorgan Chase & Co. | | | 157,360 | | | | 37,720,766 | |
Wells Fargo & Co. | | | 250,203 | | | | 17,574,259 | |
| | | | | | | | |
| | | | | | | 79,267,254 | |
| | | | | | | | |
CAPITAL MARKETS–3.2% | | | | | | | | |
Blackstone Secured Lending Fund(a) | | | 216,341 | | | | 6,989,978 | |
S&P Global, Inc. | | | 45,254 | | | | 22,537,849 | |
| | | | | | | | |
| | | | | | | 29,527,827 | |
| | | | | | | | |
FINANCIAL SERVICES–8.9% | | | | | | | | |
Berkshire Hathaway, Inc.– Class B(b) | | | 80,935 | | | | 36,686,217 | |
Fiserv, Inc.(b) | | | 136,333 | | | | 28,005,525 | |
Mastercard, Inc.– Class A | | | 21,702 | | | | 11,427,622 | |
MGIC Investment Corp. | | | 242,948 | | | | 5,760,297 | |
| | | | | | | | |
| | | | | | | 81,879,661 | |
| | | | | | | | |
INSURANCE–2.5% | | | | | | | | |
Axis Capital Holdings Ltd.(a) | | | 188,565 | | | | 16,710,631 | |
MetLife, Inc. | | | 76,056 | | | | 6,227,465 | |
| | | | | | | | |
| | | | | | | 22,938,096 | |
| | | | | | | | |
| | | | | | | 213,612,838 | |
| | | | | | | | |
HEALTH CARE–17.4% | | | | | | | | |
BIOTECHNOLOGY–6.5% | | | | | | | | |
Amgen, Inc. | | | 9,250 | | | | 2,410,920 | |
Gilead Sciences, Inc. | | | 214,039 | | | | 19,770,782 | |
Regeneron Pharmaceuticals, Inc.(b) | | | 34,106 | | | | 24,294,727 | |
United Therapeutics Corp.(a)(b) | | | 37,099 | | | | 13,090,011 | |
| | | | | | | | |
| | | | | | | 59,566,440 | |
| | | | | | | | |
HEALTH CARE EQUIPMENT & SUPPLIES–1.5% | | | | | | | | |
GE Healthcare, Inc.(a) | | | 173,175 | | | | 13,538,821 | |
| | | | | | | | |
HEALTH CARE PROVIDERS & SERVICES–4.5% | | | | | | | | |
Cencora, Inc. | | | 71,197 | | | | 15,996,542 | |
Elevance Health, Inc. | | | 36,053 | | | | 13,299,952 | |
HCA Healthcare, Inc. | | | 17,343 | | | | 5,205,501 | |
Quest Diagnostics, Inc. | | | 49,832 | | | | 7,517,656 | |
| | | | | | | | |
| | | | | | | 42,019,651 | |
| | | | | | | | |
PHARMACEUTICALS–4.9% | | | | | | | | |
Johnson & Johnson | | | 160,823 | | | | 23,258,222 | |
Merck & Co., Inc. | | | 123,960 | | | | 12,331,541 | |
Roche Holding AG (Sponsored ADR)(a) | | | 281,903 | | | | 9,832,777 | |
| | | | | | | | |
| | | | | | | 45,422,540 | |
| | | | | | | | |
| | | | | | | 160,547,452 | |
| | | | | | | | |
| | | | | | | | |
INDUSTRIALS–15.1% | | | | | | | | |
AEROSPACE & DEFENSE–2.6% | | | | | | | | |
Curtiss-Wright Corp. | | | 21,723 | | | | 7,708,841 | |
RTX Corp. | | | 143,205 | | | | 16,571,683 | |
| | | | | | | | |
| | | | | | | 24,280,524 | |
| | | | | | | | |
BUILDING PRODUCTS–1.7% | | | | | | | | |
A O Smith Corp. | | | 81,776 | | | | 5,577,941 | |
Allegion PLC | | | 42,785 | | | | 5,591,144 | |
Builders FirstSource, Inc.(b) | | | 34,678 | | | | 4,956,526 | |
| | | | | | | | |
| | | | | | | 16,125,611 | |
| | | | | | | | |
COMMERCIAL SERVICES & SUPPLIES–1.2% | | | | | | | | |
Veralto Corp. | | | 110,520 | | | | 11,256,462 | |
| | | | | | | | |
ELECTRICAL EQUIPMENT–3.2% | | | | | | | | |
Emerson Electric Co. | | | 39,664 | | | | 4,915,559 | |
Generac Holdings, Inc.(a)(b) | | | 77,918 | | | | 12,081,186 | |
nVent Electric PLC | | | 177,166 | | | | 12,075,635 | |
| | | | | | | | |
| | | | | | | 29,072,380 | |
| | | | | | | | |
GROUND TRANSPORTATION–1.6% | | | | | | | | |
JB Hunt Transport Services, Inc.(a) | | | 87,248 | | | | 14,889,744 | |
| | | | | | | | |
MACHINERY–2.5% | | | | | | | | |
Allison Transmission Holdings, Inc. | | | 24,944 | | | | 2,695,449 | |
Dover Corp. | | | 30,721 | | | | 5,763,259 | |
PACCAR, Inc. | | | 56,435 | | | | 5,870,369 | |
Westinghouse Air Brake Technologies Corp. | | | 46,190 | | | | 8,757,162 | |
| | | | | | | | |
| | | | | | | 23,086,239 | |
| | | | | | | | |
PROFESSIONAL SERVICES–1.4% | | | | | | | | |
FTI Consulting, Inc.(a)(b) | | | 24,184 | | | | 4,622,288 | |
Robert Half, Inc. | | | 116,862 | | | | 8,234,096 | |
| | | | | | | | |
| | | | | | | 12,856,384 | |
| | | | | | | | |
TRADING COMPANIES & DISTRIBUTORS–0.9% | | | | | | | | |
Ferguson Enterprises, Inc. | | | 20,343 | | | | 3,530,934 | |
MSC Industrial Direct Co., Inc.–Class A(a) | | | 58,807 | | | | 4,392,295 | |
| | | | | | | | |
| | | | | | | 7,923,229 | |
| | | | | | | | |
| | | | | | | 139,490,573 | |
| | | | | | | | |
CONSUMER STAPLES–9.5% | | | | | | | | |
CONSUMER STAPLES DISTRIBUTION & RETAIL–5.9% | | | | | | | | |
Casey’s General Stores, Inc. | | | 28,864 | | | | 11,436,783 | |
Target Corp. | | | 53,282 | | | | 7,202,661 | |
1
| | |
| RELATIVE VALUE PORTFOLIO | | |
| PORTFOLIO OF INVESTMENTS | | |
| |
| (continued) | | AB Variable Products Series Fund |
| | | | | | | | |
Company | | Shares | | | U.S. $ Value | |
| | | | | | | | |
Walmart, Inc. | | | 400,030 | | | $ | 36,142,710 | |
| | | | | | | | |
| | | | | | | 54,782,154 | |
| | | | | | | | |
TOBACCO–3.6% | | | | | | | | |
Philip Morris International, Inc. | | | 272,926 | | | | 32,846,644 | |
| | | | | | | | |
| | | | | | | 87,628,798 | |
| | | | | | | | |
INFORMATION TECHNOLOGY–9.3% | | | | | | | | |
ELECTRONIC EQUIPMENT, INSTRUMENTS & COMPONENTS–0.6% | | | | | | | | |
TE Connectivity PLC | | | 36,530 | | | | 5,222,694 | |
| | | | | | | | |
IT SERVICES–2.8% | | | | | | | | |
Accenture PLC– Class A | | | 74,581 | | | | 26,236,850 | |
| | | | | | | | |
SEMICONDUCTORS & SEMICONDUCTOR EQUIPMENT–5.9% | | | | | | | | |
Intel Corp. | | | 392,478 | | | | 7,869,184 | |
Lam Research Corp. | | | 54,400 | | | | 3,929,312 | |
QUALCOMM, Inc. | | | 66,979 | | | | 10,289,314 | |
Taiwan Semiconductor Manufacturing Co., Ltd. (Sponsored ADR) | | | 63,301 | | | | 12,501,315 | |
Texas Instruments, Inc. | | | 104,540 | | | | 19,602,295 | |
| | | | | | | | |
| | | | | | | 54,191,420 | |
| | | | | | | | |
| | | | | | | 85,650,964 | |
| | | | | | | | |
CONSUMER DISCRETIONARY–7.7% | | | | | | | | |
AUTOMOBILE COMPONENTS–1.0% | | | | | | | | |
BorgWarner, Inc. | | | 284,229 | | | | 9,035,640 | |
| | | | | | | | |
HOTELS, RESTAURANTS & LEISURE–1.2% | | | | | | | | |
Starbucks Corp. | | | 126,360 | | | | 11,530,350 | |
| | | | | | | | |
HOUSEHOLD DURABLES–0.7% | | | | | | | | |
DR Horton, Inc. | | | 45,029 | | | | 6,295,955 | |
| | | | | | | | |
SPECIALTY RETAIL–2.2% | | | | | | | | |
Dick’s Sporting Goods, Inc.(a) | | | 21,920 | | | | 5,016,173 | |
Ross Stores, Inc. | | | 98,825 | | | | 14,949,258 | |
| | | | | | | | |
| | | | | | | 19,965,431 | |
| | | | | | | | |
TEXTILES, APPAREL & LUXURY GOODS–2.6% | | | | | | | | |
Lululemon Athletica, Inc.(b) | | | 34,011 | | | | 13,006,146 | |
NIKE, Inc.– Class B | | | 140,610 | | | | 10,639,959 | |
| | | | | | | | |
| | | | | | | 23,646,105 | |
| | | | | | | | |
| | | | | | | 70,473,481 | |
| | | | | | | | |
| | | | | | | | |
ENERGY–6.4% | | | | | | | | |
ENERGY EQUIPMENT & SERVICES–0.4% | | | | | | | | |
Helmerich & Payne, Inc. | | | 104,570 | | | | 3,348,331 | |
| | | | | | | | |
OIL, GAS & CONSUMABLE FUELS–6.0% | | | | | | | | |
Chevron Corp.(a) | | | 88,286 | | | | 12,787,344 | |
ConocoPhillips | | | 85,600 | | | | 8,488,952 | |
EOG Resources, Inc. | | | 157,974 | | | | 19,364,453 | |
Phillips 66 | | | 132,976 | | | | 15,149,956 | |
| | | | | | | | |
| | | | | | | 55,790,705 | |
| | | | | | | | |
| | | | | | | 59,139,036 | |
| | | | | | | | |
COMMUNICATION SERVICES–3.9% | | | | | | | | |
DIVERSIFIED TELECOMMUNICATION SERVICES–1.4% | | | | | | | | |
Comcast Corp.– Class A | | | 347,100 | | | | 13,026,663 | |
| | | | | | | | |
ENTERTAINMENT–2.5% | | | | | | | | |
Electronic Arts, Inc. | | | 159,306 | | | | 23,306,468 | |
| | | | | | | | |
| | | | | | | 36,333,131 | |
| | | | | | | | |
MATERIALS–3.2% | | | | | | | | |
CHEMICALS–1.4% | | | | | | | | |
CF Industries Holdings, Inc. | | | 98,013 | | | | 8,362,469 | |
PPG Industries, Inc. | | | 39,916 | | | | 4,767,966 | |
| | | | | | | | |
| | | | | | | 13,130,435 | |
| | | | | | | | |
CONTAINERS & PACKAGING–0.6% | | | | | | | | |
Sealed Air Corp.(a) | | | 166,472 | | | | 5,631,748 | |
| | | | | | | | |
METALS & MINING–1.2% | | | | | | | | |
Steel Dynamics, Inc. | | | 97,051 | | | | 11,070,608 | |
| | | | | | | | |
| | | | | | | 29,832,791 | |
| | | | | | | | |
REAL ESTATE–0.8% | | | | | | | | |
SPECIALIZED REITS–0.8% | | | | | | | | |
Public Storage | | | 25,219 | | | | 7,551,577 | |
| | | | | | | | |
Total Common Stocks
(cost $719,504,132) | | | | | | | 890,260,641 | |
| | | | | | | | |
SHORT-TERM INVESTMENTS–2.3% | | | | | | | | |
INVESTMENT COMPANIES–2.3% | | | | | | | | |
AB Fixed Income Shares, Inc.–Government Money Market Portfolio–Class AB, 4.43%(c)(d)(e)
(cost $20,864,539) | | | 20,864,539 | | | | 20,864,539 | |
| | | | | | | | |
TOTAL INVESTMENTS BEFORE SECURITY LENDING COLLATERAL FOR SECURITIES
LOANED–98.8%
(cost $740,368,671) | | | | | | | 911,125,180 | |
| | | | | | | | |
2
| | |
| |
| | | AB Variable Products Series Fund |
| | | | | | | | |
Company | | Shares | | | U.S. $ Value | |
| | | | | | | | |
INVESTMENTS OF CASH COLLATERAL FOR SECURITIES
LOANED–2.6% | | | | | | | | |
INVESTMENT COMPANIES–2.6% | | | | | | | | |
AB Fixed Income Shares, Inc.–Government Money Market Portfolio–Class AB, 4.43%(c)(d)(e)
(cost $23,970,730) | | | 23,970,730 | | | $ | 23,970,730 | |
| | | | | | | | |
TOTAL INVESTMENTS–101.4%
(cost $764,339,401) | | | | | | | 935,095,910 | |
Other assets less
liabilities–(1.4)% | | | | | | | (12,661,653 | ) |
| | | | | | | | |
NET ASSETS–100.0% | | | | | | $ | 922,434,257 | |
| | | | | | | | |
| (a) | | Represents entire or partial securities out on loan. See Note E for securities lending information. |
| (b) | | Non-income producing security. |
| (c) | | Affiliated investments. |
| (d) | | The rate shown represents the 7-day yield as of period end. |
| (e) | | To obtain a copy of the fund’s shareholder report, please go to the Securities and Exchange Commission’s website at www.sec.gov, or call AB at (800) 227-4618. |
Glossary:
ADR–American Depositary Receipt
REIT–Real Estate Investment Trust
See notes to financial statements.
3
| | |
| RELATIVE VALUE PORTFOLIO | | |
| STATEMENT OF ASSETS & LIABILITIES | | |
| |
| December 31, 2024 | | AB Variable Products Series Fund |
| | | | |
ASSETS | | | | |
Investments in securities, at value | | | | |
Unaffiliated issuers (cost $719,504,132) | | $ | 890,260,641 | (a) |
Affiliated issuers (cost $44,835,269—including investment of cash collateral for securities loaned of $23,970,730) | | | 44,835,269 | |
Cash | | | 20,571 | |
Receivable for capital stock sold | | | 10,922,635 | |
Unaffiliated dividends receivable | | | 1,911,247 | |
Affiliated dividends receivable | | | 83,812 | |
Receivable due from Adviser | | | 3,595 | |
Other assets | | | 917,363 | |
| | | | |
Total assets | | | 948,955,133 | |
| | | | |
LIABILITIES | | | | |
Payable for collateral received on securities loaned | | | 23,970,730 | |
Payable for investment securities purchased | | | 917,982 | |
Payable for capital stock redeemed | | | 851,614 | |
Advisory fee payable | | | 423,283 | |
Distribution fee payable | | | 150,074 | |
Administrative fee payable | | | 24,067 | |
Transfer Agent fee payable | | | 167 | |
Directors’ fees payable | | | 93 | |
Accrued expenses | | | 182,866 | |
| | | | |
Total liabilities | | | 26,520,876 | |
| | | | |
NET ASSETS | | $ | 922,434,257 | |
| | | | |
COMPOSITION OF NET ASSETS | | | | |
Capital stock, at par | | $ | 29,706 | |
Additional paid-in capital | | | 655,859,401 | |
Distributable earnings | | | 266,545,150 | |
| | | | |
NET ASSETS | | $ | 922,434,257 | |
| | | | |
Net Asset Value Per Share—1 billion shares of capital stock authorized, $.001 par value
| | | | | | | | | | | | |
| Class | | Net Assets | | | Shares
Outstanding | | | Net Asset
Value | |
| | | |
| A | | $ | 210,860,490 | | | | 6,655,444 | | | $ | 31.68 | |
| | | |
| B | | $ | 711,573,767 | | | | 23,050,890 | | | $ | 30.87 | |
| (a) | | Includes securities on loan with a value of $69,273,941 (see Note E). |
See notes to financial statements.
4
| | |
| RELATIVE VALUE PORTFOLIO | | |
| STATEMENT OF OPERATIONS | | |
| |
| Year Ended December 31, 2024 | | AB Variable Products Series Fund |
| | | | |
INVESTMENT INCOME | | | | |
Dividends | | | | |
Unaffiliated issuers (net of foreign taxes withheld of $108,059) | | $ | 16,066,154 | |
Affiliated issuers | | | 1,470,254 | |
Interest | | | 756 | |
Securities lending income | | | 34,619 | |
| | | | |
| | | 17,571,783 | |
| | | | |
EXPENSES | | | | |
Advisory fee (see Note B) | | | 5,008,417 | |
Distribution fee—Class B | | | 1,796,953 | |
Transfer agency—Class A | | | 1,960 | |
Transfer agency—Class B | | | 7,357 | |
Printing | | | 108,692 | |
Administrative | | | 95,375 | |
Custody and accounting | | | 88,102 | |
Legal | | | 75,099 | |
Audit and tax | | | 49,072 | |
Directors’ fees | | | 33,047 | |
Miscellaneous | | | 26,785 | |
| | | | |
Total expenses | | | 7,290,859 | |
Less: expenses waived and reimbursed by the Adviser (see Notes B & E) | | | (49,430 | ) |
| | | | |
Net expenses | | | 7,241,429 | |
| | | | |
Net investment income | | | 10,330,354 | |
| | | | |
REALIZED AND UNREALIZED GAIN ON INVESTMENT TRANSACTIONS | | | | |
Net realized gain on investment transactions | | | 90,733,236 | |
Net change in unrealized appreciation (depreciation) of investments | | | 6,898,581 | |
| | | | |
Net gain on investment transactions | | | 97,631,817 | |
| | | | |
NET INCREASE IN NET ASSETS FROM OPERATIONS | | $ | 107,962,171 | |
| | | | |
See notes to financial statements.
5
| | |
| | |
| RELATIVE VALUE PORTFOLIO | | |
| |
| STATEMENT OF CHANGES IN NET ASSETS | | AB Variable Products Series Fund |
| | | | | | | | |
| | | Year Ended
December 31,
2024 | | | Year Ended
December 31,
2023 | |
INCREASE IN NET ASSETS FROM OPERATIONS | | | | | | | | |
Net investment income | | $ | 10,330,354 | | | $ | 11,942,773 | |
Net realized gain on investment transactions | | | 90,733,236 | | | | 33,533,788 | |
Net change in unrealized appreciation (depreciation) of investments | | | 6,898,581 | | | | 47,309,060 | |
| | | | | | | | |
Net increase in net assets from operations | | | 107,962,171 | | | | 92,785,621 | |
Distributions to Shareholders | | | | | | | | |
Class A | | | (9,860,890 | ) | | | (15,270,443 | ) |
Class B | | | (34,400,457 | ) | | | (62,328,817 | ) |
CAPITAL STOCK TRANSACTIONS | | | | | | | | |
Net increase (decrease) | | | (16,530 | ) | | | 8,728,514 | |
| | | | | | | | |
Total increase | | | 63,684,294 | | | | 23,914,875 | |
NET ASSETS | | | | | | | | |
Beginning of period | | | 858,749,963 | | | | 834,835,088 | |
| | | | | | | | |
End of period | | $ | 922,434,257 | | | $ | 858,749,963 | |
| | | | | | | | |
See notes to financial statements.
6
| | |
| RELATIVE VALUE PORTFOLIO | | |
| NOTES TO FINANCIAL STATEMENTS | | |
| |
| December 31, 2024 | | AB Variable Products Series Fund |
NOTE A: Significant Accounting Policies
The AB Relative Value Portfolio (the “Portfolio”) (formerly known as AB Growth and Income Portfolio) is a series of AB Variable Products Series Fund, Inc. (the “Fund”). The Portfolio’s investment objective is long-term growth of capital. The Portfolio is diversified as defined under the Investment Company Act of 1940 (the “1940 Act”). The Fund was incorporated in the State of Maryland as an open-end series investment company. The Fund offers nine separately managed pools of assets which have differing investment objectives and policies. The Portfolio offers Class A and Class B shares. Both classes of shares have identical voting, dividend, liquidating and other rights, except that Class B shares bear a distribution expense and have exclusive voting rights with respect to the Class B distribution plan.
The Portfolio offers and sells its shares only to separate accounts of certain life insurance companies for the purpose of funding variable annuity contracts and variable life insurance policies. Sales are made without a sales charge at the Portfolio’s net asset value per share.
The financial statements have been prepared in conformity with U.S. generally accepted accounting principles (“U.S. GAAP”), which require management to make certain estimates and assumptions that affect the reported amounts of assets and liabilities in the financial statements and amounts of income and expenses during the reporting period. Actual results could differ from those estimates. The Portfolio is an investment company under U.S. GAAP and follows the accounting and reporting guidance applicable to investment companies. The following is a summary of significant accounting policies followed by the Portfolio.
1. Security Valuation
Portfolio securities are valued at market value determined on the basis of market quotations or, if market quotations are not readily available or are unreliable, at “fair value” as determined in accordance with procedures approved by and under the oversight of the Fund’s Board of Directors (the “Board”). Pursuant to these procedures, AllianceBernstein L.P. (the “Adviser”) serves as the Portfolio’s valuation designee pursuant to Rule 2a-5 of the 1940 Act. In this capacity, the Adviser is responsible, among other things, for making all fair value determinations relating to the Portfolio’s portfolio investments, subject to the Board’s oversight.
In general, the market values of securities which are readily available and deemed reliable are determined as follows: securities listed on a national securities exchange (other than securities listed on the NASDAQ Stock Market, Inc. (“NASDAQ”)) or on a foreign securities exchange are valued at the last sale price at the close of the exchange or foreign securities exchange. If there has been no sale on such day, the securities are valued at the last traded price from the previous day. Securities listed on more than one exchange are valued by reference to the principal exchange on which the securities are traded; securities listed only on NASDAQ are valued in accordance with the NASDAQ Official Closing Price; listed or over the counter (“OTC”) market put or call options are valued at the mid level between the current bid and ask prices. If either a current bid or current ask price is unavailable, the Adviser will have discretion to determine the best valuation (e.g., last trade price in the case of listed options); open futures are valued using the closing settlement price or, in the absence of such a price, the most recent quoted bid price. If there are no quotations available for the day of valuation, the last available closing settlement price is used; U.S. Government securities and any other debt instruments having 60 days or less remaining until maturity are generally valued at market by an independent pricing vendor, if a market price is available. If a market price is not available, the securities are valued at amortized cost. This methodology is commonly used for short term securities that have an original maturity of 60 days or less, as well as short term securities that had an original term to maturity that exceeded 60 days. In instances when amortized cost is utilized, the Valuation Committee (the “Committee”) must reasonably conclude that the utilization of amortized cost is approximately the same as the fair value of the security. Factors the Committee will consider include, but are not limited to, an impairment of the creditworthiness of the issuer or material changes in interest rates. Fixed-income securities, including mortgage-backed and asset-backed securities, may be valued on the basis of prices provided by a pricing service or at a price obtained from one or more of the major broker-dealers. In cases where broker-dealer quotes are obtained, the Adviser may establish procedures whereby changes in market yields or spreads are used to adjust, on a daily basis, a recently obtained quoted price on a security. Swaps and other derivatives are valued daily, primarily using independent pricing services, independent pricing models using market inputs, as well as third party broker-dealers or counterparties. Open-end mutual funds are valued at the closing net asset value per share, while exchange-traded funds are valued at the closing market price per share.
Securities for which market quotations are not readily available (including restricted securities) or are deemed unreliable are valued at fair value as deemed appropriate by the Adviser. Factors considered in making this determination may include, but
7
| | |
| RELATIVE VALUE PORTFOLIO | | |
| NOTES TO FINANCIAL STATEMENTS | | |
| |
| (continued) | | AB Variable Products Series Fund |
are not limited to, information obtained by contacting the issuer, analysts, analysis of the issuer’s financial statements or other available documents. In addition, the Portfolio may use fair value pricing for securities primarily traded in non-U.S. markets because most foreign markets close well before the Portfolio values its securities at 4:00 p.m., Eastern Time. The earlier close of these foreign markets gives rise to the possibility that significant events, including broad market moves, may have occurred in the interim and may materially affect the value of those securities. To account for this, the Portfolio generally values many of its foreign equity securities using fair value prices based on third party vendor modeling tools to the extent available.
2. Fair Value Measurements
In accordance with U.S. GAAP regarding fair value measurements, fair value is defined as the price that the Portfolio would receive to sell an asset or pay to transfer a liability in an orderly transaction between market participants at the measurement date. U.S. GAAP establishes a framework for measuring fair value, and a three-level hierarchy for fair value measurements based upon the transparency of inputs to the valuation of an asset or liability (including those valued based on their market values as described in Note A.1 above). Inputs may be observable or unobservable and refer broadly to the assumptions that market participants would use in pricing the asset or liability. Observable inputs reflect the assumptions market participants would use in pricing the asset or liability based on market data obtained from sources independent of the Portfolio. Unobservable inputs reflect the Portfolio’s own assumptions about the assumptions that market participants would use in pricing the asset or liability based on the best information available in the circumstances. Each investment is assigned a level based upon the observability of the inputs which are significant to the overall valuation. The three-tier hierarchy of inputs is summarized below.
| | • | | Level 1—quoted prices in active markets for identical investments |
| | • | | Level 2—other significant observable inputs (including quoted prices for similar investments, interest rates, prepayment speeds, credit risk, etc.) |
| | • | | Level 3—significant unobservable inputs (including the Portfolio’s own assumptions in determining the fair value of investments) |
Where readily available market prices or relevant bid prices are not available for certain equity investments, such investments may be valued based on similar publicly traded investments, movements in relevant indices since last available prices or based upon underlying company fundamentals and comparable company data (such as multiples to earnings or other multiples to equity). Where an investment is valued using an observable input, such as another publicly traded security, the investment will be classified as Level 2. If management determines that an adjustment is appropriate based on restrictions on resale, illiquidity or uncertainty, and such adjustment is a significant component of the valuation, the investment will be classified as Level 3. An investment will also be classified as Level 3 where management uses company fundamentals and other significant inputs to determine the valuation.
The following table summarizes the valuation of the Portfolio’s investments by the above fair value hierarchy levels as of December 31, 2024:
| | | | | | | | | | | | | | | | |
| | | Level 1 | | | Level 2 | | | Level 3 | | | Total | |
Investments in Securities: | | | | | | | | | | | | | | | | |
Assets: | | | | | | | | | | | | | | | | |
Common Stocks(a) | | $ | 890,260,641 | | | $ | –0 | – | | $ | –0 | – | | $ | 890,260,641 | |
Short-Term Investments | | | 20,864,539 | | | | –0 | – | | | –0 | – | | | 20,864,539 | |
Investments of Cash Collateral for Securities Loaned in Affiliated Money Market Fund | | | 23,970,730 | | | | –0 | – | | | –0 | – | | | 23,970,730 | |
| | | | | | | | | | | | | | | | |
Total Investments in Securities | | | 935,095,910 | | | | –0 | – | | | –0 | – | | | 935,095,910 | |
Other Financial Instruments(b) | | | –0 | – | | | –0 | – | | | –0 | – | | | –0 | – |
| | | | | | | | | | | | | | | | |
Total | | $ | 935,095,910 | | | $ | –0 | – | | $ | –0 | – | | $ | 935,095,910 | |
| | | | | | | | | | | | | | | | |
| (a) | | See Portfolio of Investments for sector classifications. |
| (b) | | Other financial instruments include derivative instruments, such as futures, forwards and swaps. Derivative instruments are valued at the unrealized appreciation (depreciation) on the instrument. Other financial instruments may also include swaps with upfront premiums, written options and written swaptions which are valued at market value. |
8
| | |
| |
| | | AB Variable Products Series Fund |
3. Currency Translation
Assets and liabilities denominated in foreign currencies and commitments under forward currency exchange contracts are translated into U.S. dollars at the mean of the quoted bid and ask prices of such currencies against the U.S. dollar. Purchases and sales of portfolio securities are translated into U.S. dollars at the rates of exchange prevailing when such securities were acquired or sold. Income and expenses are translated into U.S. dollars at rates of exchange prevailing when accrued.
Net realized gain or loss on foreign currency transactions represents foreign exchange gains and losses from sales and maturities of foreign fixed income investments, holding of foreign currencies, currency gains or losses realized between the trade and settlement dates on foreign investment transactions, and the difference between the amounts of dividends, interest and foreign withholding taxes recorded on the Portfolio’s books and the U.S. dollar equivalent amounts actually received or paid. Net unrealized currency gains and losses from valuing foreign currency denominated assets and liabilities at period end exchange rates are reflected as a component of net unrealized appreciation or depreciation of foreign currency denominated assets and liabilities.
4. Taxes
It is the Portfolio’s policy to meet the requirements of the Internal Revenue Code applicable to regulated investment companies and to distribute all of its investment company taxable income and net realized gains, if any, to shareholders. Therefore, no provisions for federal income or excise taxes are required. The Portfolio may be subject to taxes imposed by countries in which it invests. Such taxes are generally based on income and/or capital gains earned or repatriated. Taxes are accrued and applied to net investment income, net realized gains and net unrealized appreciation/depreciation as such income and/or gains are earned.
In accordance with U.S. GAAP requirements regarding accounting for uncertainties in income taxes, management has analyzed the Portfolio’s tax positions taken or expected to be taken on federal and state income tax returns for all open tax years (the current and the prior three tax years) and has concluded that no provision for income tax is required in the Portfolio’s financial statements.
5. Investment Income and Investment Transactions
Dividend income is recorded on the ex-dividend date or as soon as the Portfolio is informed of the dividend. Interest income is accrued daily. Investment transactions are accounted for on the date the securities are purchased or sold. Investment gains or losses are determined on the identified cost basis. Non-cash dividends, if any, are recorded on the ex-dividend date at the fair value of the securities received. The Portfolio amortizes premiums and accretes discounts as adjustments to interest income.
The Portfolio accounts for distributions received from real estate investment trust (“REIT”) investments or from regulated investment companies as dividend income, realized gain, or return of capital based on information provided by the REIT or the investment company.
6. Class Allocations
All income earned and expenses incurred by the Portfolio are borne on a pro-rata basis by each outstanding class of shares, based on the proportionate interest in the Portfolio represented by the net assets of such class, except for class specific expenses which are allocated to the respective class. Expenses of the Fund are charged proportionately to each portfolio or based on other appropriate methods. Realized and unrealized gains and losses are allocated among the various share classes based on respective net assets.
7. Dividends and Distributions
Dividends and distributions to shareholders, if any, are recorded on the ex-dividend date. Income dividends and capital gains distributions are determined in accordance with federal tax regulations and may differ from those determined in accordance with U.S. GAAP. To the extent these differences are permanent, such amounts are reclassified within the capital accounts based on their federal tax basis treatment; temporary differences do not require such reclassification.
8. Cash and Short-Term Investments
Cash and short-term investments include cash on hand and short-term investments with maturities of less than one year when purchased.
9
| | |
| RELATIVE VALUE PORTFOLIO | | |
| NOTES TO FINANCIAL STATEMENTS | | |
| |
| (continued) | | AB Variable Products Series Fund |
9. Segment Information
The Portfolio represents a single operating segment. An operating segment is defined in U.S. GAAP as a component of a public entity that engages in business activities from which it may recognize revenues and incur expenses, has operating results that are regularly reviewed by the public entity’s chief operating decision maker (“CODM”) to make decisions about resources to be allocated to the segment and assess its performance, and has discrete financial information available. The Portfolio’s President is the CODM. The CODM monitors the operating results of the Portfolio as a whole and the pre-determined Portfolio’s long term investment strategy, which is executed by the portfolio management group. The qualitative and quantitative information contained within the financial statements is used by the CODM to assess the segments performance versus the Portfolio’s comparative benchmark and to make resource allocation decisions. Segment assets are reflected on the statement of assets and liabilities and segment expenses are listed on the statement of operations.
NOTE B: Advisory Fee and Other Transactions with Affiliates
Under the terms of the investment advisory agreement, the Portfolio pays the Adviser an advisory fee at an annual rate of .55% of the first $2.5 billion, .45% of the next $2.5 billion and .40% in excess of $5 billion, of the Portfolio’s average daily net assets. The fee is accrued daily and paid monthly.
Pursuant to the investment advisory agreement, the Portfolio may reimburse the Adviser for certain legal and accounting services provided to the Portfolio by the Adviser. For the year ended December 31, 2024, the reimbursement for such services amounted to $95,375.
The Portfolio compensates AllianceBernstein Investor Services, Inc. (“ABIS”), a wholly-owned subsidiary of the Adviser, under a Transfer Agency Agreement for providing personnel and facilities to perform transfer agency services for the Portfolio. Such compensation retained by ABIS amounted to $1,950 for the year ended December 31, 2024.
The Portfolio may invest in AB Government Money Market Portfolio which has a contractual annual advisory fee rate of .20% of the portfolio’s average daily net assets and bears its own expenses. The Adviser had contractually agreed to waive .10% of the advisory fee of AB Government Money Market Portfolio (resulting in a net advisory fee of .10%) until August 31, 2023. Effective September 1, 2023, the Adviser has contractually agreed to waive .05% of the advisory fee of AB Government Money Market Portfolio (resulting in a net advisory fee of .15%) until August 31, 2024. In connection with the investment by the Portfolio in AB Government Money Market Portfolio, the Adviser has contractually agreed to waive its advisory fee from the Portfolio in an amount equal to the Portfolio’s pro rata share of the effective advisory fee of AB Government Money Market Portfolio, as borne indirectly by the Portfolio as an acquired fund fee and expense. For the year ended December 31, 2024, such waiver amounted to $45,305.
A summary of the Portfolio’s transactions in AB mutual funds for the year ended December 31, 2024 is as follows:
| | | | | | | | | | | | | | | | | | | | |
Portfolio | | Market Value
12/31/23
(000) | | | Purchases
at Cost
(000) | | | Sales
Proceeds
(000) | | | Market Value
12/31/24
(000) | | | Dividend
Income
(000) | |
AB Government Money Market Portfolio | | $ | 39,970 | | | $ | 176,423 | | | $ | 195,529 | | | $ | 20,864 | | | $ | 1,470 | |
AB Government Money Market Portfolio* | | | 16,533 | | | | 90,941 | | | | 83,503 | | | | 23,971 | | | | 0 | ** |
| | | | | | | | | | | | | | | | | | | | |
Total | | | | | | | | | | | | | | $ | 44,835 | | | $ | 1,470 | |
| | | | | | | | | | | | | | | | | | | | |
| * | | Investments of cash collateral for securities lending transactions (see Note E). |
| ** | | Amount is less than $500. |
NOTE C: Distribution Plan
The Portfolio has adopted a Distribution Plan (the “Plan”) for Class B shares pursuant to Rule 12b-1 under the 1940 Act. Under the Plan, the Portfolio pays distribution and servicing fees to AllianceBernstein Investments, Inc. (the “Distributor”), a wholly-owned subsidiary of the Adviser, at an annual rate of up to .50% of the Portfolio’s average daily net assets attributable to Class B shares. The fees are accrued daily and paid monthly. The Board currently limits payments under the Plan to .25% of the Portfolio’s average daily net assets attributable to Class B shares. The Plan provides that the Distributor will use such payments in their entirety for distribution assistance and promotional activities.
The Portfolio is not obligated under the Plan to pay any distribution and servicing fees in excess of the amounts set forth above. The purpose of the payments to the Distributor under the Plan is to compensate the Distributor for its distribution services with respect to the sale of the Portfolio’s Class B shares. Since the Distributor’s compensation is not directly tied to
10
| | |
| |
| | | AB Variable Products Series Fund |
its expenses, the amount of compensation received by it under the Plan during any year may be more or less than its actual expenses. For this reason, the Plan is characterized by the staff of the Securities and Exchange Commission as being of the “compensation” variety.
In the event that the Plan is terminated or not continued, no distribution or servicing fees (other than current amounts accrued but not yet paid) would be owed by the Portfolio to the Distributor.
The Plan also provides that the Adviser may use its own resources to finance the distribution of the Portfolio’s shares.
NOTE D: Investment Transactions
Purchases and sales of investment securities (excluding short-term investments) for the year ended December 31, 2024 were as follows:
| | | | | | | | |
| | | Purchases | | | Sales | |
Investment securities (excluding U.S. government securities) | | $ | 508,677,240 | | | $ | 534,182,015 | |
U.S. government securities | | | –0 | – | | | –0 | – |
The cost of investments for federal income tax purposes, gross unrealized appreciation and unrealized depreciation are as follows:
| | | | |
Cost | | $ | 767,070,494 | |
| | | | |
Gross unrealized appreciation | | $ | 186,613,484 | |
Gross unrealized depreciation | | | (18,588,068 | ) |
| | | | |
Net unrealized appreciation | | $ | 168,025,416 | |
| | | | |
1. Derivative Financial Instruments
The Portfolio may use derivatives in an effort to earn income and enhance returns, to replace more traditional direct investments, to obtain exposure to otherwise inaccessible markets (collectively, “investment purposes”), or to hedge or adjust the risk profile of its portfolio.
The Portfolio did not engage in derivatives transactions for the year ended December 31, 2024.
2. Currency Transactions
The Portfolio may invest in non-U.S. Dollar-denominated securities on a currency hedged or unhedged basis. The Portfolio may seek investment opportunities by taking long or short positions in currencies through the use of currency-related derivatives, including forward currency exchange contracts, futures and options on futures, swaps, and other options. The Portfolio may enter into transactions for investment opportunities when it anticipates that a foreign currency will appreciate or depreciate in value but securities denominated in that currency are not held by the Portfolio and do not present attractive investment opportunities. Such transactions may also be used when the Adviser believes that it may be more efficient than a direct investment in a foreign currency-denominated security. The Portfolio may also conduct currency exchange contracts on a spot basis (i.e., for cash at the spot rate prevailing in the currency exchange market for buying or selling currencies).
NOTE E: Securities Lending
The Portfolio may enter into securities lending transactions. Under the Portfolio’s securities lending program, all loans of securities will be collateralized continually by cash collateral and/or non-cash collateral. Non-cash collateral will include only securities issued or guaranteed by the U.S. government or its agencies or instrumentalities. If the Portfolio cannot sell or repledge any non-cash collateral, such collateral will not be reflected in the portfolio of investments. If a loan is collateralized by cash, the Portfolio will be compensated for the loan from a portion of the net return from the income earned on cash collateral after a rebate is paid to the borrower (in some cases, this rebate may be a “negative rebate” or fee paid by the borrower to the Portfolio in connection with the loan), and payments are made for fees of the securities lending agent and for certain other administrative expenses. If the Portfolio receives non-cash collateral, the Portfolio will receive a fee from the borrower generally equal to a negotiated percentage of the market value of the loaned securities. The Portfolio will have the right to call a loan and obtain the securities loaned at any time on notice to the borrower within the normal and customary settlement time for the securities. While the securities are on loan, the borrower is obligated to pay the Portfolio amounts equal to any dividend income or other distributions from the securities; however, these distributions will not be afforded the same preferential tax treatment as qualified dividends. The Portfolio will not be able to exercise voting rights with respect to any securities during the existence of a loan, but will have the right to regain ownership of loaned securities in order to
11
| | |
| RELATIVE VALUE PORTFOLIO | | |
| NOTES TO FINANCIAL STATEMENTS | | |
| |
| (continued) | | AB Variable Products Series Fund |
exercise voting or other ownership rights. Collateral received and securities loaned are marked to market daily to ensure that the securities loaned are secured by collateral. The lending agent currently invests the cash collateral received in AB Government Money Market Portfolio, an eligible money market vehicle, in accordance with the investment restrictions of the Portfolio, and as approved by the Board. The collateral received on securities loaned is recorded as an asset as well as a corresponding liability in the statement of assets and liabilities. The collateral will be adjusted the next business day to maintain the required collateral amount. The amounts of securities lending income from the borrowers and AB Government Money Market Portfolio are reflected in the statement of operations. When the Portfolio earns net securities lending income from AB Government Money Market Portfolio, the income is inclusive of a rebate expense paid to the borrower. In connection with the cash collateral investment by the Portfolio in AB Government Money Market Portfolio, the Adviser has agreed to waive a portion of the Portfolio’s share of the advisory fees of AB Government Money Market Portfolio, as borne indirectly by the Portfolio as an acquired fund fee and expense. When the Portfolio lends securities, its investment performance will continue to reflect changes in the value of the securities loaned. A principal risk of lending portfolio securities is that the borrower may fail to return the loaned securities upon termination of the loan and that the collateral will not be sufficient to replace the loaned securities. The lending agent has agreed to indemnify the Portfolio in the case of default of any securities borrower.
A summary of the Portfolio’s transactions surrounding securities lending for the year ended December 31, 2024 is as follows:
| | | | | | | | | | | | | | | | | | | | | | |
| | | | | | | | | | | | | AB Government Money
Market Portfolio | |
Market Value of
Securities on Loan* | | | Cash Collateral* | | | Market Value of
Non-Cash
Collateral* | | | Income from
Borrowers | | | Income Earned | | | Advisory Fee
Waived | |
| $ | 69,273,941 | | | $ | 23,970,730 | | | $ | 46,840,082 | | | $ | 34,311 | | | $ | 308 | | | $ | 4,125 | |
| * | | As of December 31, 2024. |
NOTE F: Capital Stock
Each class consists of 500,000,000 authorized shares. Transactions in capital shares for each class were as follows:
| | | | | | | | | | | | | | | | | | | | |
| | | SHARES | | | | | | AMOUNT | |
| | | Year Ended
December 31,
2024 | | | Year Ended
December 31,
2023 | | | | | | Year Ended
December 31,
2024 | | | Year Ended
December 31,
2023 | |
Class A | | | | | | | | | | | | | | | | | | | | |
Shares sold | | | 1,488,728 | | | | 958,264 | | | | | | | $ | 47,509,996 | | | $ | 27,676,936 | |
Shares issued in reinvestment of dividends and distributions | | | 322,990 | | | | 545,958 | | | | | | | | 9,860,890 | | | | 15,270,443 | |
Shares redeemed | | | (1,068,235 | ) | | | (1,028,628 | ) | | | | | | | (33,761,481 | ) | | | (29,725,520 | ) |
| | | | | | | | | | | | | | | | | | | | |
Net increase | | | 743,483 | | | | 475,594 | | | | | | | $ | 23,609,405 | | | $ | 13,221,859 | |
| | | | | | | | | | | | | | | | | | | | |
Class B | | | | | | | | | | | | | | | | | | | | |
Shares sold | | | 1,733,484 | | | | 1,489,635 | | | | | | | $ | 54,152,119 | | | $ | 42,230,544 | |
Shares issued on reinvestment of dividends and distributions | | | 1,155,153 | | | | 2,281,435 | | | | | | | | 34,400,457 | | | | 62,328,817 | |
Shares redeemed | | | (3,615,533 | ) | | | (3,874,936 | ) | | | | | | | (112,178,511 | ) | | | (109,052,706 | ) |
| | | | | | | | | | | | | | | | | | | | |
Net decrease | | | (726,896 | ) | | | (103,866 | ) | | | | | | $ | (23,625,935 | ) | | $ | (4,493,345 | ) |
| | | | | | | | | | | | | | | | | | | | |
At December 31, 2024, certain shareholders of the Portfolio owned 45% in aggregate of the Portfolio’s outstanding shares. Significant transactions by such shareholders, if any, may impact the Portfolio’s performance.
NOTE G: Risks Involved in Investing in the Portfolio
Market Risk—The value of the Portfolio’s assets will fluctuate as the market or markets in which the Portfolio invests fluctuate. The value of the Portfolio’s investments may decline, sometimes rapidly and unpredictably, simply because of economic changes or other events, including public health crises (including the occurrence of a contagious disease or illness) and regional and global conflicts, that affect large portions of the market. It includes the risk that a particular style of investing may underperform the market generally.
12
| | |
| |
| | | AB Variable Products Series Fund |
Capitalization Risk—Investments in small- and mid-capitalization companies may be more volatile than investments in large-capitalization companies. Investments in small- and mid-capitalization companies may have additional risks because these companies have limited product lines, markets or financial resources.
Derivatives Risk—Derivatives may be difficult to price or unwind and leveraged so that small changes may produce disproportionate losses for the Portfolio. A short position in a derivative instrument involves the risk of a theoretically unlimited increase in the value of the underlying asset, reference rate or index, which could cause the Portfolio to suffer a potentially unlimited loss. Derivatives, especially over-the-counter derivatives, are also subject to counterparty risk, which is the risk that the counterparty (the party on the other side of the transaction) on a derivative transaction will be unable or unwilling to honor its contractual obligations to the Portfolio.
Indemnification Risk—In the ordinary course of business, the Portfolio enters into contracts that contain a variety of indemnifications. The Portfolio’s maximum exposure under these arrangements is unknown. However, the Portfolio has not had prior claims or losses pursuant to these indemnification provisions and expects the risk of loss thereunder to be remote. Therefore, the Portfolio has not accrued any liability in connection with these indemnification provisions.
Management Risk—The Portfolio is subject to management risk because it is an actively-managed investment fund. The Adviser will apply its investment techniques and risk analyses in making investment decisions for the Portfolio, but there is no guarantee that its techniques will produce the intended results. Some of these techniques may incorporate, or rely upon, quantitative models, but there is no guarantee that these models will generate accurate forecasts, reduce risk or otherwise perform as expected.
NOTE H: Joint Credit Facility
A number of open-end mutual funds managed by the Adviser, including the Portfolio, participate in a $325 million revolving credit facility (the “Facility”) intended to provide short-term financing related to redemptions and other short term liquidity requirements, subject to certain restrictions. Commitment fees related to the Facility are paid by the participating funds and are included in miscellaneous expenses in the statement of operations. The Portfolio did not utilize the Facility during the year ended December 31, 2024.
NOTE I: Distributions to Shareholders
The tax character of distributions paid during the fiscal years ended December 31, 2024 and December 31, 2023 were as follows:
| | | | | | | | |
| | | 2024 | | | 2023 | |
Distributions paid from: | | | | | | | | |
Ordinary income | | $ | 11,941,310 | | | $ | 10,958,671 | |
Net long-term capital gains | | | 32,320,037 | | | | 66,640,589 | |
| | | | | | | | |
Total taxable distributions paid | | $ | 44,261,347 | | | $ | 77,599,260 | |
| | | | | | | | |
As of December 31, 2024, the components of accumulated earnings (deficit) on a tax basis were as follows:
| | | | |
Undistributed ordinary income | | $ | 10,330,103 | |
Undistributed capital gains | | | 88,189,633 | |
Unrealized appreciation (depreciation) | | | 168,025,416 | (a) |
| | | | |
Total accumulated earnings (deficit) | | $ | 266,545,152 | |
| | | | |
| (a) | | The difference between book-basis and tax-basis unrealized appreciation (depreciation) is attributable primarily to the tax deferral of losses on wash sales. |
For tax purposes, net realized capital losses may be carried over to offset future capital gains, if any. Funds are permitted to carry forward capital losses for an indefinite period, and such losses will retain their character as either short-term or long-term capital losses. As of December 31, 2024, the Portfolio did not have any capital loss carryforwards.
During the current fiscal year, there were no permanent differences that resulted in adjustments to distributable earnings or additional paid-in capital.
13
| | |
| RELATIVE VALUE PORTFOLIO | | |
| NOTES TO FINANCIAL STATEMENTS | | |
| |
| (continued) | | AB Variable Products Series Fund |
NOTE J: Subsequent Events
Management has evaluated subsequent events for possible recognition or disclosure in the financial statements through the date the financial statements are issued. Management has determined that there are no material events that would require disclosure in the Portfolio’s financial statements through this date.
14
| | |
| | |
| RELATIVE VALUE PORTFOLIO | | |
| |
| FINANCIAL HIGHLIGHTS | | AB Variable Products Series Fund |
Selected Data For A Share Of Capital Stock Outstanding Throughout Each Period
| | | | | | | | | | | | | | | | | | | | |
| | | CLASS A | |
| | | Year Ended December 31, | |
| | | 2024 | | | 2023 | | | 2022 | | | 2021 | | | 2020 | |
Net asset value, beginning of period | | | $29.50 | | | | $29.00 | | | | $36.83 | | | | $28.97 | | | | $30.30 | |
| | | | | | | | | | | | | | | | | | | | |
| | | | | | | | | | | | | | | | | | | | |
Income From Investment Operations | | | | | | | | | | | | | | | | | | | | |
Net investment income(a)(b) | | | .42 | | | | .47 | | | | .48 | | | | .38 | | | | .40 | |
Net realized and unrealized gain (loss) on investment transactions | | | 3.36 | | | | 2.86 | | | | (2.21 | ) | | | 7.76 | | | | .13 | |
| | | | | | | | | | | | | | | | | | | | |
Net increase (decrease) in net asset value from operations | | | 3.78 | | | | 3.33 | | | | (1.73 | ) | | | 8.14 | | | | .53 | |
| | | | | | | | | | | | | | | | | | | | |
| | | | | | | | | | | | | | | | | | | | |
Less: Dividends and Distributions | | | | | | | | | | | | | | | | | | | | |
Dividends from net investment income | | | (.47 | ) | | | (.45 | ) | | | (.49 | ) | | | (.28 | ) | | | (.42 | ) |
Distributions from net realized gain on investment transactions | | | (1.13 | ) | | | (2.38 | ) | | | (5.61 | ) | | | –0 | – | | | (1.44 | ) |
| | | | | | | | | | | | | | | | | | | | |
Total dividends and distributions | | | (1.60 | ) | | | (2.83 | ) | | | (6.10 | ) | | | (.28 | ) | | | (1.86 | ) |
| | | | | | | | | | | | | | | | | | | | |
Net asset value, end of period | | | $31.68 | | | | $29.50 | | | | $29.00 | | | | $36.83 | | | | $28.97 | |
| | | | | | | | | | | | | | | | | | | | |
| | | | | | | | | | | | | | | | | | | | |
Total Return | | | | | | | | | | | | | | | | | | | | |
Total investment return based on net asset value(c)* | | | 13.02 | % | | | 12.03 | % | | | (4.19 | )% | | | 28.15 | % | | | 2.72 | % |
| | | | | | | | | | | | | | | | | | | | |
Ratios/Supplemental Data | | | | | | | | | | | | | | | | | | | | |
Net assets, end of period (000’s omitted) | | | $210,860 | | | | $174,389 | | | | $157,648 | | | | $170,190 | | | | $143,269 | |
Ratio to average net assets of: | | | | | | | | | | | | | | | | | | | | |
Expenses, net of waivers/reimbursements(d)‡ | | | .60 | % | | | .60 | % | | | .59 | % | | | .59 | % | | | .61 | % |
Expenses, before waivers/reimbursements(d)‡ | | | .60 | % | | | .61 | % | | | .59 | % | | | .59 | % | | | .62 | % |
Net investment income(b) | | | 1.33 | % | | | 1.65 | % | | | 1.50 | % | | | 1.13 | % | | | 1.53 | % |
Portfolio turnover rate | | | 58 | % | | | 70 | % | | | 66 | % | | | 51 | % | | | 54 | % |
| | | | | | | | | | | | | | | | | | | | |
‡ Expense ratios exclude the estimated acquired fund fees of the affiliated/unaffiliated underlying | |
portfolios | | | .01 | % | | | .01 | % | | | .00 | % | | | .00 | % | | | .01 | % |
See footnote summary on page 16.
15
| | |
| RELATIVE VALUE PORTFOLIO | | |
| FINANCIAL HIGHLIGHTS | | |
| |
| (continued) | | AB Variable Products Series Fund |
Selected Data For A Share Of Capital Stock Outstanding Throughout Each Period
| | | | | | | | | | | | | | | | | | | | |
| | | CLASS B | |
| | | Year Ended December 31, | |
| | | 2024 | | | 2023 | | | 2022 | | | 2021 | | | 2020 | |
Net asset value, beginning of period | | | $28.78 | | | | $28.36 | | | | $36.12 | | | | $28.43 | | | | $29.76 | |
| | | | | | | | | | | | | | | | | | | | |
| | | | | | | | | | | | | | | | | | | | |
Income From Investment Operations | | | | | | | | | | | | | | | | | | | | |
Net investment income(a)(b) | | | .34 | | | | .39 | | | | .39 | | | | .29 | | | | .33 | |
Net realized and unrealized gain (loss) on investment transactions | | | 3.28 | | | | 2.79 | | | | (2.16 | ) | | | 7.61 | | | | .13 | |
| | | | | | | | | | | | | | | | | | | | |
Net increase (decrease) in net asset value from operations | | | 3.62 | | | | 3.18 | | | | (1.77 | ) | | | 7.90 | | | | .46 | |
| | | | | | | | | | | | | | | | | | | | |
| | | | | | | | | | | | | | | | | | | | |
Less: Dividends and Distributions | | | | | | | | | | | | | | | | | | | | |
Dividends from net investment income | | | (.40 | ) | | | (.38 | ) | | | (.38 | ) | | | (.21 | ) | | | (.35 | ) |
Distributions from net realized gain on investment transactions | | | (1.13 | ) | | | (2.38 | ) | | | (5.61 | ) | | | –0 | – | | | (1.44 | ) |
| | | | | | | | | | | | | | | | | | | | |
Total dividends and distributions | | | (1.53 | ) | | | (2.76 | ) | | | (5.99 | ) | | | (.21 | ) | | | (1.79 | ) |
| | | | | | | | | | | | | | | | | | | | |
Net asset value, end of period | | | $30.87 | | | | $28.78 | | | | $28.36 | | | | $36.12 | | | | $28.43 | |
| | | | | | | | | | | | | | | | | | | | |
| | | | | | | | | | | | | | | | | | | | |
Total Return | | | | | | | | | | | | | | | | | | | | |
Total investment return based on net asset value(c)* | | | 12.76 | % | | | 11.72 | % | | | (4.42 | )% | | | 27.84 | % | | | 2.47 | % |
| | | | | | | | | | | | | | | | | | | | |
Ratios/Supplemental Data | | | | | | | | | | | | | | | | | | | | |
Net assets, end of period (000’s omitted) | | | $711,574 | | | | $684,361 | | | | $677,187 | | | | $752,562 | | | | $868,715 | |
Ratio to average net assets of: | | | | | | | | | | | | | | | | | | | | |
Expenses, net of waivers/reimbursements(d)‡ | | | .85 | % | | | .85 | % | | | .84 | % | | | .84 | % | | | .86 | % |
Expenses, before waivers/reimbursements(d)‡ | | | .85 | % | | | .86 | % | | | .84 | % | | | .85 | % | | | .87 | % |
Net investment income(b) | | | 1.08 | % | | | 1.40 | % | | | 1.25 | % | | | .87 | % | | | 1.28 | % |
Portfolio turnover rate | | | 58 | % | | | 70 | % | | | 66 | % | | | 51 | % | | | 54 | % |
| | | | | | | | | | | | | | | | | | | | |
‡ Expense ratios exclude the estimated acquired fund fees of the affiliated/unaffiliated underlying | |
portfolios | | | .01 | % | | | .01 | % | | | .00 | % | | | .00 | % | | | .01 | % |
| (a) | | Based on average shares outstanding. |
| (b) | | Net of expenses waived/reimbursed by the Adviser. |
| (c) | | Total investment return is calculated assuming an initial investment made at the net asset value at the beginning of the period, reinvestment of all dividends and distributions at net asset value during the period, and redemption on the last day of the period. Total investment return does not reflect (i) insurance company’s separate account related expense charges and (ii) the deductions of taxes that a shareholder would pay on Portfolio distributions or the redemption of Portfolio shares. Total investment return calculated for a period of less than one year is not annualized. |
| (d) | | In connection with the Portfolio’s investments in affiliated underlying portfolios, the Portfolio incurs no direct expenses, but bears proportionate shares of the fees and expenses (i.e., operating, administrative and investment advisory fees) of the affiliated underlying portfolios. The Adviser has contractually agreed to waive its fees from the Portfolio in an amount equal to the Portfolio’s pro rata share of certain acquired fund fees and expenses, and for the years ended December 31, 2023 and December 31, 2020, such waiver amounted to .01% and .01%, respectively. |
| * | | Includes the impact of proceeds received and credited to the Portfolio resulting from class action settlements, which enhanced the Portfolio’s performance for the year ended December 31, 2024 by .10%. |
See notes to financial statements.
16
| | |
| | |
| REPORT OF INDEPENDENT REGISTERED |
| |
| PUBLIC ACCOUNTING FIRM | | AB Variable Products Series Fund |
To the Board of Directors and Shareholders of AB Relative Value Portfolio
Opinion on the Financial Statements
We have audited the accompanying statement of assets and liabilities of AB Relative Value Portfolio (the “Portfolio”) (one of the series constituting AB Variable Products Series Fund, Inc. (the “Fund”)), including the portfolio of investments, as of December 31, 2024, and the related statement of operations for the year then ended, the statements of changes in net assets for each of the two years in the period then ended, the financial highlights for each of the five years in the period then ended and the related notes (collectively referred to as the “financial statements”). In our opinion, the financial statements present fairly, in all material respects, the financial position of the Portfolio (one of the series constituting AB Variable Products Series Fund, Inc.) at December 31, 2024, the results of its operations for the year then ended, the changes in its net assets for each of the two years in the period then ended and its financial highlights for each of the five years in the period then ended, in conformity with U.S. generally accepted accounting principles.
Basis for Opinion
These financial statements are the responsibility of the Fund’s management. Our responsibility is to express an opinion on the Portfolio’s financial statements based on our audits. We are a public accounting firm registered with the Public Company Accounting Oversight Board (United States) (“PCAOB”) and are required to be independent with respect to the Fund in accordance with the U.S. federal securities laws and the applicable rules and regulations of the Securities and Exchange Commission and the PCAOB.
We conducted our audits in accordance with the standards of the PCAOB. Those standards require that we plan and perform the audit to obtain reasonable assurance about whether the financial statements are free of material misstatement, whether due to error or fraud. The Fund is not required to have, nor were we engaged to perform, an audit of the Fund’s internal control over financial reporting. As part of our audits, we are required to obtain an understanding of internal control over financial reporting but not for the purpose of expressing an opinion on the effectiveness of the Fund’s internal control over financial reporting. Accordingly, we express no such opinion.
Our audits included performing procedures to assess the risks of material misstatement of the financial statements, whether due to error or fraud, and performing procedures that respond to those risks. Such procedures included examining, on a test basis, evidence regarding the amounts and disclosures in the financial statements. Our procedures included confirmation of securities owned as of December 31, 2024, by correspondence with the custodian, brokers and others; when replies were not received from brokers or others, we performed other auditing procedures. Our audits also included evaluating the accounting principles used and significant estimates made by management, as well as evaluating the overall presentation of the financial statements. We believe that our audits provide a reasonable basis for our opinion.

We have served as the auditor of one or more of the AB investment companies since 1968.
New York, New York
February 14, 2025
17
| | |
| | |
| | |
| |
| 2024 FEDERAL TAX INFORMATION (unaudited) | | AB Variable Products Series Fund |
For Federal income tax purposes, the following information is furnished with respect to the distributions paid by the Portfolio during the taxable year ended December 31, 2024. For corporate shareholders, 100% of dividends paid qualify for the dividends received deduction. The Portfolio designates $32,320,037 of dividends paid as long-term capital gain dividends.
18
| | |
| | | |
| | | |
| |
| RELATIVE VALUE PORTFOLIO | | AB Variable Products Series Fund |
INFORMATION REGARDING THE REVIEW AND APPROVAL OF THE FUND’S ADVISORY AGREEMENT
The disinterested directors (the “directors”) of AB Variable Products Series Fund, Inc. (the “Company”) unanimously approved the continuance of the Company’s Advisory Agreement with the Adviser in respect of AB Relative Value Portfolio (formerly AB Growth and Income Portfolio) (the “Fund”) at a meeting held by video conference on May 7-9, 2024 (the “Meeting”).
Prior to approval of the continuance of the Advisory Agreement, the directors had requested from the Adviser, and received and evaluated, extensive materials. They reviewed the proposed continuance of the Advisory Agreement with the Adviser and with experienced counsel who are independent of the Adviser, who advised on the relevant legal standards. The directors also reviewed additional materials, including comparative analytical data prepared by the Senior Vice President of the Fund. The directors also discussed the proposed continuance in private sessions with counsel.
The directors considered their knowledge of the nature and quality of the services provided by the Adviser to the Fund gained from their experience as directors or trustees of most of the registered investment companies advised by the Adviser, their overall confidence in the Adviser’s integrity and competence they have gained from that experience, the Adviser’s initiative in identifying and raising potential issues with the directors and its responsiveness, frankness and attention to concerns raised by the directors in the past, including the Adviser’s willingness to consider and implement organizational and operational changes designed to improve investment results and the services provided to the AB Funds. The directors noted that they have four regular meetings each year, at each of which they review extensive materials and information from the Adviser, including information on the investment performance of the Fund and the money market fund advised by the Adviser in which the Fund invests a portion of its assets.
The directors also considered all factors they believed relevant, including the specific matters discussed below. During the course of their deliberations, the directors evaluated, among other things, the reasonableness of the advisory fee. The directors did not identify any particular information that was all-important or controlling, and different directors may have attributed different weights to the various factors. The directors determined that the selection of the Adviser to manage the Fund and the overall arrangements between the Fund and the Adviser, as provided in the Advisory Agreement, including the advisory fee, were fair and reasonable in light of the services performed, expenses incurred and such other matters as the directors considered relevant in the exercise of their business judgment. The material factors and conclusions that formed the basis for the directors’ determinations included the following:
Nature, Extent and Quality of Services Provided
The directors considered the scope and quality of services provided by the Adviser under the Advisory Agreement, including the quality of the investment research capabilities of the Adviser and the other resources it has dedicated to performing services for the Fund. The directors noted that the Adviser from time to time reviews the Fund’s investment strategies and from time to time proposes changes intended to improve the Fund’s relative or absolute performance for the directors’ consideration. They also noted the professional experience and qualifications of the Fund’s portfolio management team and other senior personnel of the Adviser. The directors also considered that the Advisory Agreement provides that the Fund will reimburse the Adviser for the cost to it of providing certain clerical, accounting, administrative and other services to the Fund by employees of the Adviser or its affiliates. Requests for these reimbursements are made on a quarterly basis and subject to approval by the directors. Reimbursements, to the extent requested and paid, result in a higher rate of total compensation from the Fund to the Adviser than the fee rate stated in the Advisory Agreement. The directors noted that the methodology used to determine the reimbursement amounts had been reviewed by an independent consultant at the request of the directors. The quality of administrative and other services, including the Adviser’s role in coordinating the activities of the Fund’s other service providers, also was considered. The directors concluded that, overall, they were satisfied with the nature, extent and quality of services provided to the Fund under the Advisory Agreement.
Costs of Services Provided and Profitability
The directors reviewed a schedule of the revenues and expenses and related notes indicating the profitability of the Fund to the Adviser for calendar years 2022 and 2023 that had been prepared with an expense allocation methodology arrived at in consultation with an independent consultant at the request of the directors. The directors noted the assumptions and methods of allocation used by the Adviser in preparing fund-specific profitability data and understood that there are a number of potentially acceptable allocation methodologies for information of this type. The directors noted that the profitability information reflected all revenues and expenses of the Adviser’s relationship with the Fund, including those relating to its
19
| | |
| | | |
| RELATIVE VALUE PORTFOLIO | | |
| |
| (continued) | | AB Variable Products Series Fund |
subsidiaries that provide transfer agency, distribution and brokerage services to the Fund. The directors recognized that it is difficult to make comparisons of the profitability of the Advisory Agreement with the profitability of fund advisory contracts for unaffiliated funds because comparative information is not generally publicly available and is affected by numerous factors. The directors focused on the profitability of the Adviser’s relationship with the Fund before taxes and distribution expenses. The directors concluded that the Adviser’s level of profitability from its relationship with the Fund was not unreasonable.
Fall-Out Benefits
The directors considered the other benefits to the Adviser and its affiliates from their relationships with the Fund and the money market fund advised by the Adviser in which the Fund invests, including, but not limited to, benefits relating to soft dollar arrangements (whereby investment advisers receive brokerage and research services from brokers that execute agency transactions for their clients); 12b-1 fees and sales charges received by the Fund’s principal underwriter (which is a wholly owned subsidiary of the Adviser) in respect of the Fund’s Class B shares; brokerage commissions paid by the Fund to brokers affiliated with the Adviser; and transfer agency fees paid by the Fund to a wholly owned subsidiary of the Adviser. The directors recognized that the Fund’s profitability to the Adviser would be somewhat lower without these benefits. The directors understood that the Adviser also might derive reputational and other benefits from its association with the Fund.
Investment Results
In addition to the information reviewed by the directors in connection with the Meeting, the directors receive detailed performance information for the Fund at each regular Board meeting during the year.
At the Meeting, the directors reviewed performance information prepared by an independent service provider (the “15(c) service provider”), showing the performance of the Class A Shares of the Fund against a group of similar funds (“peer group”) and a larger group of similar funds (“peer universe”), each selected by the 15(c) service provider, and information prepared by the Adviser showing performance of the Class A Shares against a broad-based securities market index, in each case for the 1-, 3-, 5- and 10-year periods ended February 29, 2024 and (in the case of comparisons with the broad-based securities market index) for the period from inception. Based on their review, the directors concluded that the Fund’s investment performance was acceptable.
Advisory Fees and Other Expenses
The directors considered the advisory fee rate payable by the Fund to the Adviser and information prepared by the 15(c) service provider concerning advisory fee rates payable by other funds in the same category as the Fund. The directors recognized that it is difficult to make comparisons of advisory fees because there are variations in the services that are included in the fees paid by other funds. The directors compared the Fund’s contractual effective advisory fee rate with a peer group median and noted that it was lower than the median. They also noted that the Adviser’s total rate of compensation, taking into account the impact of the administrative expense reimbursement paid to the Adviser in the latest fiscal year, was lower than the median.
The directors also considered the Adviser’s fee schedule for other clients utilizing investment strategies similar to those of the Fund. For this purpose, they reviewed the relevant advisory fee information from the Adviser’s Form ADV and in a report from the Fund’s Senior Vice President and noted the differences between the Fund’s fee schedule, on the one hand, and the Adviser’s institutional fee schedule and the schedule of fees charged by the Adviser to any offshore funds and for services to any sub-advised funds utilizing investment strategies similar to those of the Fund, on the other. The directors noted that the Adviser may, in some cases, agree to fee rates with large institutional clients that are lower than those reviewed by the directors and that they had previously discussed with the Adviser its policies in respect of such arrangements. The directors also compared the advisory fee rate for the Fund with that for another fund advised by the Adviser utilizing similar investment strategies.
The Adviser reviewed with the directors the significantly greater scope of the services it provides to the Fund relative to institutional, offshore fund and sub-advised fund clients. In this regard, the Adviser noted, among other things, that, compared to institutional and offshore or sub-advisory accounts, the Fund (i) demands considerably more portfolio management, research and trading resources due to significantly higher daily cash flows; (ii) has more tax and regulatory restrictions and compliance obligations; (iii) must prepare and file or distribute regulatory and other communications about fund operations; and (iv) must provide shareholder servicing to retail investors. The Adviser also reviewed the greater legal risks presented by the large and changing population of Fund shareholders who may assert claims against the Adviser in individual or class
20
| | |
| |
| | | AB Variable Products Series Fund |
actions, and the greater entrepreneurial risk in offering new fund products, which require substantial investment to launch, may not succeed, and generally must be priced to compete with larger, more established funds resulting in lack of profitability to the Adviser until a new fund achieves scale. In light of the substantial differences in services rendered by the Adviser to institutional, offshore fund and sub-advised fund clients as compared to the Fund, and the different risk profile, the directors considered these fee comparisons inapt and did not place significant weight on them in their deliberations.
In connection with their review of the Fund’s advisory fee, the directors also considered the total expense ratio of the Class A shares of the Fund in comparison to the medians for a peer group and a peer universe selected by the 15(c) service provider. The Class A expense ratio of the Fund was based on the Fund’s latest fiscal year. The directors noted that it was likely that the expense ratios of some of the other funds in the Fund’s category were lowered by waivers or reimbursements by those funds’ investment advisers, which in some cases might be voluntary or temporary. The directors view expense ratio information as relevant to their evaluation of the Adviser’s services because the Adviser is responsible for coordinating services provided to the Fund by others. The directors noted that the Fund’s expense ratio was lower than the medians. Based on their review, the directors concluded that the Fund’s expense ratio was acceptable.
Economies of Scale
The directors noted that the advisory fee schedule for the Fund contains breakpoints that reduce the fee rates on assets above specified levels. The directors took into consideration prior presentations by an independent consultant on economies of scale in the mutual fund industry and for the AB Funds, and presentations from time to time by the Adviser concerning certain of its views on economies of scale. The directors also had requested and received from the Adviser certain updates on economies of scale in advance of the Meeting. The directors believe that economies of scale may be realized (if at all) by the Adviser across a variety of products and services, and not only in respect of a single fund. The directors noted that there is no established methodology for setting breakpoints that give effect to the fund-specific services provided by a fund’s adviser and to the economies of scale that an adviser may realize in its overall mutual fund business or those components of it which directly or indirectly affect a fund’s operations. The directors observed that in the mutual fund industry as a whole, as well as among funds similar to the Fund, there is no uniformity or pattern in the fees and asset levels at which breakpoints (if any) apply. The directors also noted that the advisory agreements for many funds do not have breakpoints at all. Having taken these factors into account, the directors concluded that the Fund’s shareholders would benefit from a sharing of economies of scale in the event the Fund’s net assets exceed a breakpoint in the future.
21
VPS-RV-0151-1224
DEC 12.31.24

ANNUAL FINANCIAL STATEMENTS AND ADDITIONAL INFORMATION
AB VARIABLE PRODUCTS SERIES FUND, INC.
| + | | AB SMALL CAP GROWTH PORTFOLIO |
Investment Products Offered
| | • | | Are Not Bank Guaranteed |
AllianceBernstein Investments, Inc. (ABI) is the distributor of the AB family of mutual funds. ABI is a member of FINRA and is an affiliate of AllianceBernstein L.P., the Adviser of the funds.
You may obtain a description of the Fund’s proxy voting policies and procedures, and information regarding how the Fund voted proxies relating to portfolio securities during the most recent 12-month period ended June 30, without charge. Simply visit AB’s website at www.abfunds.com or go to the Securities and Exchange Commission’s (the “Commission”) website at www.sec.gov, or call AB at (800) 227 4618.
The Fund files its complete schedule of portfolio holdings with the Commission for the first and third quarters of each fiscal year as an exhibit to its reports on Form N-PORT. The Fund’s Form N-PORT reports are available on the Commission’s website at www.sec.gov.
The [A/B] logo and AllianceBernstein® are registered trademarks used by permission of the owner, AllianceBernstein L.P.
| | |
| SMALL CAP GROWTH PORTFOLIO | | |
| PORTFOLIO OF INVESTMENTS | | |
| |
| December 31, 2024 | | AB Variable Products Series Fund |
| | | | | | | | |
| Company | | Shares | | | U.S. $ Value | |
| | | | | | | | |
COMMON STOCKS–99.0% | | | | | | | | |
| | | | | | | | |
INFORMATION TECHNOLOGY–24.3% | | | | | | | | |
COMMUNICATIONS EQUIPMENT–0.1% | | | | | | | | |
Lumentum Holdings, Inc.(a) | | | 789 | | | $ | 66,237 | |
| | | | | | | | |
ELECTRONIC EQUIPMENT, INSTRUMENTS & COMPONENTS–2.6% | | | | | | | | |
Fabrinet(a) | | | 3,971 | | | | 873,143 | |
Novanta, Inc.(a) | | | 5,383 | | | | 822,361 | |
| | | | | | | | |
| | | | | | | 1,695,504 | |
| | | | | | | | |
SEMICONDUCTORS & SEMICONDUCTOR EQUIPMENT–5.9% | | | | | | | | |
Credo Technology Group Holding Ltd.(a) | | | 13,266 | | | | 891,608 | |
Impinj, Inc.(a) | | | 4,114 | | | | 597,600 | |
MACOM Technology Solutions Holdings, Inc.(a) | | | 7,086 | | | | 920,542 | |
Onto Innovation, Inc.(a) | | | 1,439 | | | | 239,838 | |
Semtech Corp.(a) | | | 18,339 | | | | 1,134,267 | |
Universal Display Corp. | | | 439 | | | | 64,182 | |
| | | | | | | | |
| | | | | | | 3,848,037 | |
| | | | | | | | |
SOFTWARE–13.8% | | | | | | | | |
Alkami Technology, Inc.(a) | | | 26,940 | | | | 988,159 | |
Altair Engineering, Inc.–Class A(a) | | | 6,263 | | | | 683,356 | |
Braze, Inc.–Class A(a) | | | 17,338 | | | | 726,115 | |
Clearwater Analytics Holdings, Inc.–Class A(a) | | | 41,056 | | | | 1,129,861 | |
Intapp, Inc.(a) | | | 16,208 | | | | 1,038,771 | |
Klaviyo, Inc.–Class A(a) | | | 22,363 | | | | 922,250 | |
Monday.com Ltd.(a) | | | 2,697 | | | | 634,982 | |
Onestream, Inc.(a) | | | 25,084 | | | | 715,396 | |
Rubrik, Inc.–Class A(a) | | | 14,002 | | | | 915,171 | |
ServiceTitan, Inc.(a) | | | 1,422 | | | | 146,281 | |
SPS Commerce, Inc.(a) | | | 5,727 | | | | 1,053,711 | |
| | | | | | | | |
| | | | | | | 8,954,053 | |
| | | | | | | | |
TECHNOLOGY HARDWARE, STORAGE & PERIPHERALS–1.9% | | | | | | | | |
ACV Auctions, Inc.–Class A(a) | | | 55,379 | | | | 1,196,186 | |
| | | | | | | | |
| | | | | | | 15,760,017 | |
| | | | | | | | |
INDUSTRIALS–23.1% | | | | | | | | |
AEROSPACE & DEFENSE–5.1% | | | | | | | | |
AeroVironment, Inc.(a)(b) | | | 4,207 | | | | 647,415 | |
Curtiss-Wright Corp. | | | 2,298 | | | | 815,491 | |
Leonardo DRS, Inc.(a) | | | 29,821 | | | | 963,516 | |
Loar Holdings, Inc.(a) | | | 5,772 | | | | 426,609 | |
Standardaero, Inc.(a) | | | 16,985 | | | | 420,549 | |
| | | | | | | | |
| | | | | | | 3,273,580 | |
| | | | | | | | |
| | | | | | | | |
BUILDING PRODUCTS–5.7% | | | | | | | | |
Armstrong World Industries, Inc. | | | 6,248 | | | | 883,030 | |
AZEK Co., Inc. (The)(a) | | | 16,259 | | | | 771,815 | |
CSW Industrials, Inc.(b) | | | 3,046 | | | | 1,074,629 | |
Knife River Corp.(a) | | | 9,562 | | | | 971,881 | |
| | | | | | | | |
| | | | | | | 3,701,355 | |
| | | | | | | | |
COMMERCIAL SERVICES & SUPPLIES–1.0% | | | | | | | | |
Tetra Tech, Inc. | | | 15,758 | | | | 627,799 | |
| | | | | | | | |
CONSTRUCTION & ENGINEERING–3.9% | | | | | | | | |
Construction Partners, Inc.–Class A(a) | | | 12,027 | | | | 1,063,908 | |
Everus Construction Group, Inc.(a) | | | 7,756 | | | | 509,957 | |
Primoris Services Corp. | | | 12,817 | | | | 979,219 | |
| | | | | | | | |
| | | | | | | 2,553,084 | |
| | | | | | | | |
GROUND TRANSPORTATION–1.2% | | | | | | | | |
ArcBest Corp. | | | 8,324 | | | | 776,796 | |
| | | | | | | | |
MACHINERY–4.2% | | | | | | | | |
Esab Corp. | | | 7,180 | | | | 861,169 | |
ITT, Inc. | | | 6,248 | | | | 892,714 | |
SPX Technologies, Inc.(a) | | | 6,645 | | | | 966,981 | |
| | | | | | | | |
| | | | | | | 2,720,864 | |
| | | | | | | | |
MARINE TRANSPORTATION–1.1% | | | | | | | | |
Kirby Corp.(a) | | | 6,947 | | | | 734,993 | |
| | | | | | | | |
PROFESSIONAL SERVICES–0.9% | | | | | | | | |
FTI Consulting, Inc.(a) | | | 3,188 | | | | 609,322 | |
| | | | | | | | |
| | | | | | | 14,997,793 | |
| | | | | | | | |
HEALTH CARE–21.1% | | | | | | | | |
BIOTECHNOLOGY–13.1% | | | | | | | | |
Akero Therapeutics, Inc.(a) | | | 9,741 | | | | 270,995 | |
Apogee Therapeutics, Inc.(a) | | | 7,569 | | | | 342,876 | |
ARS Pharmaceuticals, Inc.(a) | | | 21,365 | | | | 225,401 | |
Ascendis Pharma A/S (ADR)(a) | | | 2,488 | | | | 342,523 | |
Bicara Therapeutics, Inc.(a) | | | 7,339 | | | | 127,845 | |
Blueprint Medicines Corp.(a) | | | 6,379 | | | | 556,376 | |
Bridgebio Pharma, Inc.(a) | | | 15,226 | | | | 417,801 | |
CG oncology, Inc.(a) | | | 10,567 | | | | 303,061 | |
Cullinan Therapeutics, Inc.(a) | | | 15,324 | | | | 186,646 | |
Cytokinetics, Inc.(a) | | | 7,577 | | | | 356,422 | |
Denali Therapeutics, Inc.(a) | | | 18,211 | | | | 371,140 | |
Dianthus Therapeutics, Inc.(a) | | | 9,177 | | | | 200,059 | |
Halozyme Therapeutics, Inc.(a) | | | 11,944 | | | | 571,043 | |
Insmed, Inc.(a) | | | 12,229 | | | | 844,290 | |
Korro Bio, Inc.(a) | | | 5,795 | | | | 220,616 | |
Legend Biotech Corp. (ADR)(a) | | | 8,314 | | | | 270,538 | |
Merus NV(a) | | | 6,340 | | | | 266,597 | |
1
| | |
| SMALL CAP GROWTH PORTFOLIO | | |
| PORTFOLIO OF INVESTMENTS | | |
| |
| (continued) | | AB Variable Products Series Fund |
| | | | | | | | |
| Company | | Shares | | | U.S. $ Value | |
| | | | | | | | |
MoonLake Immunotherapeutics(a) | | | 5,739 | | | $ | 310,767 | |
Newamsterdam Pharma Co. NV(a) | | | 10,388 | | | | 266,972 | |
Ultragenyx Pharmaceutical, Inc.(a) | | | 5,785 | | | | 243,375 | |
Upstream Bio, Inc.(a)(b) | | | 10,433 | | | | 171,518 | |
Vaxcyte, Inc.(a) | | | 9,833 | | | | 804,929 | |
Viking Therapeutics, Inc.(a)(b) | | | 4,315 | | | | 173,636 | |
Viridian Therapeutics, Inc.(a) | | | 18,513 | | | | 354,894 | |
Xenon Pharmaceuticals, Inc.(a) | | | 7,583 | | | | 297,254 | |
| | | | | | | | |
| | | | | | | 8,497,574 | |
| | | | | | | | |
HEALTH CARE EQUIPMENT & SUPPLIES–3.3% | | | | | | | | |
AtriCure, Inc.(a) | | | 21,071 | | | | 643,930 | |
Glaukos Corp.(a) | | | 4,698 | | | | 704,418 | |
Masimo Corp.(a) | | | 4,764 | | | | 787,489 | |
| | | | | | | | |
| | | | | | | 2,135,837 | |
| | | | | | | | |
HEALTH CARE PROVIDERS & SERVICES–2.0% | | | | | | | | |
BrightSpring Health Services, Inc.(a)(b) | | | 29,236 | | | | 497,889 | |
PROCEPT BioRobotics Corp.(a) | | | 9,898 | | | | 796,987 | |
| | | | | | | | |
| | | | | | | 1,294,876 | |
| | | | | | | | |
LIFE SCIENCES TOOLS & SERVICES–1.9% | | | | | | | | |
Quanterix Corp.(a) | | | 22,985 | | | | 244,330 | |
Repligen Corp.(a) | | | 4,855 | | | | 698,829 | |
Tempus AI, Inc.(a)(b) | | | 9,600 | | | | 324,096 | |
| | | | | | | | |
| | | | | | | 1,267,255 | |
| | | | | | | | |
PHARMACEUTICALS–0.8% | | | | | | | | |
Intra-Cellular Therapies, Inc.(a) | | | 4,275 | | | | 357,048 | |
Rapport Therapeutics, Inc.(a) | | | 10,185 | | | | 180,682 | |
| | | | | | | | |
| | | | | | | 537,730 | |
| | | | | | | | |
| | | | | | | 13,733,272 | |
| | | | | | | | |
CONSUMER DISCRETIONARY–14.5% | | | | | | | | |
AUTOMOBILE COMPONENTS–1.6% | | | | | | | | |
Modine Manufacturing Co.(a) | | | 8,846 | | | | 1,025,517 | |
| | | | | | | | |
BROADLINE RETAIL–1.5% | | | | | | | | |
Ollie’s Bargain Outlet Holdings, Inc.(a)(b) | | | 8,698 | | | | 954,432 | |
| | | | | | | | |
DIVERSIFIED CONSUMER SERVICES–0.7% | | | | | | | | |
KinderCare Learning Cos., Inc.(a) | | | 25,755 | | | | 458,439 | |
| | | | | | | | |
HOTELS, RESTAURANTS & LEISURE–3.6% | | | | | | | | |
Dutch Bros, Inc.–Class A(a) | | | 18,051 | | | | 945,511 | |
Texas Roadhouse, Inc. | | | 3,697 | | | | 667,050 | |
| | | | | | | | |
Wingstop, Inc. | | | 2,592 | | | | 736,646 | |
| | | | | | | | |
| | | | | | | 2,349,207 | |
| | | | | | | | |
HOUSEHOLD DURABLES–3.4% | | | | | | | | |
Champion Homes, Inc.(a) | | | 9,762 | | | | 860,032 | |
Meritage Homes Corp. | | | 3,151 | | | | 484,687 | |
SharkNinja, Inc.(a) | | | 8,748 | | | | 851,705 | |
| | | | | | | | |
| | | | | | | 2,196,424 | |
| | | | | | | | |
SPECIALTY RETAIL–3.7% | | | | | | | | |
Boot Barn Holdings, Inc.(a) | | | 7,956 | | | | 1,207,880 | |
Five Below, Inc.(a) | | | 4,649 | | | | 487,959 | |
RH(a) | | | 1,817 | | | | 715,153 | |
| | | | | | | | |
| | | | | | | 2,410,992 | |
| | | | | | | | |
| | | | | | | 9,395,011 | |
| | | | | | | | |
FINANCIALS–10.0% | | | | | | | | |
CAPITAL MARKETS–5.8% | | | | | | | | |
Houlihan Lokey, Inc. | | | 4,497 | | | | 780,949 | |
Piper Sandler Cos. | | | 3,449 | | | | 1,034,527 | |
StepStone Group, Inc.–Class A | | | 17,182 | | | | 994,494 | |
Stifel Financial Corp. | | | 8,597 | | | | 911,970 | |
| | | | | | | | |
| | | | | | | 3,721,940 | |
| | | | | | | | |
FINANCIAL SERVICES–2.6% | | | | | | | | |
NCR Atleos Corp.(a) | | | 26,742 | | | | 907,089 | |
Shift4 Payments, Inc.–Class A(a)(b) | | | 7,704 | | | | 799,521 | |
| | | | | | | | |
| | | | | | | 1,706,610 | |
| | | | | | | | |
INSURANCE–1.6% | | | | | | | | |
RLI Corp. | | | 4,410 | | | | 726,901 | |
TWFG, Inc.(a) | | | 10,229 | | | | 315,053 | |
| | | | | | | | |
| | | | | | | 1,041,954 | |
| | | | | | | | |
| | | | | | | 6,470,504 | |
| | | | | | | | |
CONSUMER STAPLES–4.2% | | | | | | | | |
CONSUMER STAPLES DISTRIBUTION & RETAIL–1.5% | | | | | | | | |
Chefs’ Warehouse, Inc. (The)(a) | | | 20,048 | | | | 988,767 | |
| | | | | | | | |
FOOD PRODUCTS–1.3% | | | | | | | | |
Freshpet, Inc.(a) | | | 5,727 | | | | 848,226 | |
| | | | | | | | |
PERSONAL CARE PRODUCTS–1.4% | | | | | | | | |
BellRing Brands, Inc.(a) | | | 11,785 | | | | 887,882 | |
| | | | | | | | |
| | | | | | | 2,724,875 | |
| | | | | | | | |
MATERIALS–1.2% | | | | | | | | |
CHEMICALS–1.2% | | | | | | | | |
Element Solutions, Inc. | | | 29,853 | | | | 759,162 | |
| | | | | | | | |
ENERGY–0.6% | | | | | | | | |
ENERGY EQUIPMENT & SERVICES–0.5% | | | | | | | | |
TechnipFMC PLC | | | 12,679 | | | | 366,930 | |
| | | | | | | | |
2
| | |
| |
| | | AB Variable Products Series Fund |
| | | | | | | | |
| Company | | Shares | | | U.S. $ Value | |
| | | | | | | | |
OIL, GAS & CONSUMABLE FUELS–0.1% | | | | | | | | |
Permian Resources Corp. | | | 2,705 | | | $ | 38,898 | |
| | | | | | | | |
| | | | | | | 405,828 | |
| | | | | | | | |
Total Common Stocks
(cost $52,056,103) | | | | | | | 64,246,462 | |
| | | | | | | | |
SHORT-TERM INVESTMENTS–1.0% | | | | | | | | |
INVESTMENT COMPANIES–1.0% | | | | | | | | |
AB Fixed Income Shares, Inc.–Government Money Market Portfolio–Class AB, 4.43%(c)(d)(e)
(cost $682,959) | | | 682,959 | | | | 682,959 | |
| | | | | | | | |
TOTAL INVESTMENTS BEFORE SECURITY LENDING COLLATERAL FOR SECURITIES LOANED–100.0%
(cost $52,739,062) | | | | | | | 64,929,421 | |
| | | | | | | | |
INVESTMENTS OF CASH COLLATERAL FOR SECURITIES LOANED–1.9% | | | | | | | | |
INVESTMENT COMPANIES–1.9% | | | | | | | | |
AB Fixed Income Shares, Inc.–Government Money Market Portfolio–Class AB, 4.43%(c)(d)(e)
(cost $1,211,308) | | | 1,211,308 | | | | 1,211,308 | |
| | | | | | | | |
TOTAL INVESTMENTS–101.9%
(cost $53,950,370) | | | | | | | 66,140,729 | |
Other assets less liabilities–(1.9)% | | | | | | | (1,245,931 | ) |
| | | | | | | | |
NET ASSETS–100.0% | | | | | | $ | 64,894,798 | |
| | | | | | | | |
| (a) | | Non-income producing security. |
| (b) | | Represents entire or partial securities out on loan. See Note E for securities lending information. |
| (c) | | Affiliated investments. |
| (d) | | The rate shown represents the 7-day yield as of period end. |
| (e) | | To obtain a copy of the fund’s shareholder report, please go to the Securities and Exchange Commission’s website at www.sec.gov, or call AB at (800) 227-4618. |
Glossary:
ADR—American Depositary Receipt
See notes to financial statements.
3
| | |
| SMALL CAP GROWTH PORTFOLIO | | |
| STATEMENT OF ASSETS & LIABILITIES | | |
| |
| December 31, 2024 | | AB Variable Products Series Fund |
| | | | |
ASSETS | |
Investments in securities, at value | | | | |
Unaffiliated issuers (cost $52,056,103) | | $ | 64,246,462 | (a) |
Affiliated issuers (cost $1,894,267—including investment of cash collateral for securities loaned of $1,211,308) | | | 1,894,267 | |
Cash | | | 11 | |
Receivable for capital stock sold | | | 166,899 | |
Receivable for investment securities sold | | | 31,660 | |
Receivable due from Adviser | | | 24,850 | |
Unaffiliated dividends and interest receivable | | | 12,860 | |
Affiliated dividends receivable | | | 3,998 | |
| | | | |
Total assets | | | 66,381,007 | |
| | | | |
LIABILITIES | |
Payable for collateral received on securities loaned | | | 1,211,308 | |
Payable for investment securities purchased | | | 72,439 | |
Advisory fee payable | | | 41,435 | |
Administrative fee payable | | | 23,960 | |
Distribution fee payable | | | 8,436 | |
Payable for capital stock redeemed | | | 7,094 | |
Transfer Agent fee payable | | | 178 | |
Directors’ fees payable | | | 2 | |
Accrued expenses | | | 121,357 | |
| | | | |
Total liabilities | | | 1,486,209 | |
| | | | |
NET ASSETS | | $ | 64,894,798 | |
| | | | |
COMPOSITION OF NET ASSETS | |
Capital stock, at par | | $ | 6,184 | |
Additional paid-in capital | | | 55,465,845 | |
Distributable earnings | | | 9,422,769 | |
| | | | |
NET ASSETS | | $ | 64,894,798 | |
| | | | |
Net Asset Value Per Share—1 billion shares of capital stock authorized, $.001 par value
| | | | | | | | | | | | |
| Class | | Net Assets | | | Shares
Outstanding | | | Net Asset
Value | |
| | | |
| A | | $ | 25,353,154 | | | | 1,994,340 | | | $ | 12.71 | |
| | | |
| B | | $ | 39,541,644 | | | | 4,189,889 | | | $ | 9.44 | |
| (a) | | Includes securities on loan with a value of $3,785,559 (see Note E). |
See notes to financial statements.
4
| | |
| SMALL CAP GROWTH PORTFOLIO | | |
| STATEMENT OF OPERATIONS | | |
| |
| Year Ended December 31, 2024 | | AB Variable Products Series Fund |
| | | | |
INVESTMENT INCOME | | | | |
Dividends | | | | |
Unaffiliated issuers | | $ | 169,677 | |
Affiliated issuers | | | 41,125 | |
Interest | | | 182 | |
Securities lending income | | | 83,025 | |
| | | | |
| | | 294,009 | |
| | | | |
EXPENSES | | | | |
Advisory fee (see Note B) | | | 444,758 | |
Distribution fee—Class B | | | 95,468 | |
Transfer agency—Class A | | | 1,454 | |
Transfer agency—Class B | | | 2,631 | |
Administrative | | | 94,216 | |
Custody and accounting | | | 74,591 | |
Audit and tax | | | 42,290 | |
Legal | | | 31,659 | |
Printing | | | 26,569 | |
Directors’ fees | | | 21,371 | |
Miscellaneous | | | 9,039 | |
| | | | |
Total expenses | | | 844,046 | |
Less: expenses waived and reimbursed by the Adviser (see Notes B & E) | | | (216,578 | ) |
| | | | |
Net expenses | | | 627,468 | |
| | | | |
Net investment loss | | | (333,459 | ) |
| | | | |
REALIZED AND UNREALIZED GAIN ON INVESTMENT TRANSACTIONS | | | | |
Net realized gain on investment transactions | | | 8,936,895 | |
Net change in unrealized appreciation (depreciation) of investments | | | 987,931 | |
| | | | |
Net gain on investment transactions | | | 9,924,826 | |
| | | | |
NET INCREASE IN NET ASSETS FROM OPERATIONS | | $ | 9,591,367 | |
| | | | |
See notes to financial statements.
5
| | |
| | | |
| SMALL CAP GROWTH PORTFOLIO | | |
| |
| STATEMENT OF CHANGES IN NET ASSETS | | AB Variable Products Series Fund |
| | | | | | | | |
| | | Year Ended
December 31,
2024 | | | Year Ended
December 31,
2023 | |
INCREASE (DECREASE) IN NET ASSETS FROM OPERATIONS | | | | | | | | |
Net investment loss | | $ | (333,459 | ) | | $ | (285,468 | ) |
Net realized gain (loss) on investment transactions | | | 8,936,895 | | | | (805,999 | ) |
Net change in unrealized appreciation (depreciation) of investments | | | 987,931 | | | | 9,867,204 | |
Contributions from Affiliates (see Note B) | | | –0 | – | | | 90 | |
| | | | | | | | |
Net increase in net assets from operations | | | 9,591,367 | | | | 8,775,827 | |
Distributions to Shareholders | | | | | | | | |
Class A | | | (49,738 | ) | | | –0 | – |
CAPITAL STOCK TRANSACTIONS | | | | | | | | |
Net decrease | | | (1,774,244 | ) | | | (1,352,135 | ) |
| | | | | | | | |
Total increase | | | 7,767,385 | | | | 7,423,692 | |
NET ASSETS | | | | | | | | |
Beginning of period | | | 57,127,413 | | | | 49,703,721 | |
| | | | | | | | |
End of period | | $ | 64,894,798 | | | $ | 57,127,413 | |
| | | | | | | | |
See notes to financial statements.
6
| | |
| SMALL CAP GROWTH PORTFOLIO | | |
| NOTES TO FINANCIAL STATEMENTS | | |
| |
| December 31, 2024 | | AB Variable Products Series Fund |
NOTE A: Significant Accounting Policies
The AB Small Cap Growth Portfolio (the “Portfolio”) is a series of AB Variable Products Series Fund, Inc. (the “Fund”). The Portfolio’s investment objective is long-term growth of capital. The Portfolio is diversified as defined under the Investment Company Act of 1940 (the “1940 Act”). The Fund was incorporated in the State of Maryland as an open-end series investment company. The Fund offers nine separately managed pools of assets which have differing investment objectives and policies. The Portfolio offers Class A and Class B shares. Both classes of shares have identical voting, dividend, liquidating and other rights, except that Class B shares bear a distribution expense and have exclusive voting rights with respect to the Class B distribution plan.
The Portfolio offers and sells its shares only to separate accounts of certain life insurance companies for the purpose of funding variable annuity contracts and variable life insurance policies. Sales are made without a sales charge at the Portfolio’s net asset value per share.
The financial statements have been prepared in conformity with U.S. generally accepted accounting principles (“U.S. GAAP”), which require management to make certain estimates and assumptions that affect the reported amounts of assets and liabilities in the financial statements and amounts of income and expenses during the reporting period. Actual results could differ from those estimates. The Portfolio is an investment company under U.S. GAAP and follows the accounting and reporting guidance applicable to investment companies. The following is a summary of significant accounting policies followed by the Portfolio.
1. Security Valuation
Portfolio securities are valued at market value determined on the basis of market quotations or, if market quotations are not readily available or are unreliable, at “fair value” as determined in accordance with procedures approved by and under the oversight of the Fund’s Board of Directors (the “Board”). Pursuant to these procedures, AllianceBernstein L.P. (the “Adviser”) serves as the Portfolio’s valuation designee pursuant to Rule 2a-5 of the 1940 Act. In this capacity, the Adviser is responsible, among other things, for making all fair value determinations relating to the Portfolio’s portfolio investments, subject to the Board’s oversight.
In general, the market values of securities which are readily available and deemed reliable are determined as follows: securities listed on a national securities exchange (other than securities listed on the NASDAQ Stock Market, Inc. (“NASDAQ”)) or on a foreign securities exchange are valued at the last sale price at the close of the exchange or foreign securities exchange. If there has been no sale on such day, the securities are valued at the last traded price from the previous day. Securities listed on more than one exchange are valued by reference to the principal exchange on which the securities are traded; securities listed only on NASDAQ are valued in accordance with the NASDAQ Official Closing Price; listed or over the counter (“OTC”) market put or call options are valued at the mid level between the current bid and ask prices. If either a current bid or current ask price is unavailable, the Adviser will have discretion to determine the best valuation (e.g., last trade price in the case of listed options); open futures are valued using the closing settlement price or, in the absence of such a price, the most recent quoted bid price. If there are no quotations available for the day of valuation, the last available closing settlement price is used; U.S. Government securities and any other debt instruments having 60 days or less remaining until maturity are generally valued at market by an independent pricing vendor, if a market price is available. If a market price is not available, the securities are valued at amortized cost. This methodology is commonly used for short term securities that have an original maturity of 60 days or less, as well as short term securities that had an original term to maturity that exceeded 60 days. In instances when amortized cost is utilized, the Valuation Committee (the “Committee”) must reasonably conclude that the utilization of amortized cost is approximately the same as the fair value of the security. Factors the Committee will consider include, but are not limited to, an impairment of the creditworthiness of the issuer or material changes in interest rates. Fixed-income securities, including mortgage-backed and asset-backed securities, may be valued on the basis of prices provided by a pricing service or at a price obtained from one or more of the major broker-dealers. In cases where broker-dealer quotes are obtained, the Adviser may establish procedures whereby changes in market yields or spreads are used to adjust, on a daily basis, a recently obtained quoted price on a security. Swaps and other derivatives are valued daily, primarily using independent pricing services, independent pricing models using market inputs, as well as third party broker-dealers or counterparties. Open-end mutual funds are valued at the closing net asset value per share, while exchange-traded funds are valued at the closing market price per share.
Securities for which market quotations are not readily available (including restricted securities) or are deemed unreliable are valued at fair value as deemed appropriate by the Adviser. Factors considered in making this determination may include, but
7
| | |
| SMALL CAP GROWTH PORTFOLIO |
| NOTES TO FINANCIAL STATEMENTS |
| |
| (continued) | | AB Variable Products Series Fund |
are not limited to, information obtained by contacting the issuer, analysts, analysis of the issuer’s financial statements or other available documents. In addition, the Portfolio may use fair value pricing for securities primarily traded in non-U.S. markets because most foreign markets close well before the Portfolio values its securities at 4:00 p.m., Eastern Time. The earlier close of these foreign markets gives rise to the possibility that significant events, including broad market moves, may have occurred in the interim and may materially affect the value of those securities. To account for this, the Portfolio generally values many of its foreign equity securities using fair value prices based on third party vendor modeling tools to the extent available.
2. Fair Value Measurements
In accordance with U.S. GAAP regarding fair value measurements, fair value is defined as the price that the Portfolio would receive to sell an asset or pay to transfer a liability in an orderly transaction between market participants at the measurement date. U.S. GAAP establishes a framework for measuring fair value, and a three-level hierarchy for fair value measurements based upon the transparency of inputs to the valuation of an asset or liability (including those valued based on their market values as described in Note A.1 above). Inputs may be observable or unobservable and refer broadly to the assumptions that market participants would use in pricing the asset or liability. Observable inputs reflect the assumptions market participants would use in pricing the asset or liability based on market data obtained from sources independent of the Portfolio. Unobservable inputs reflect the Portfolio’s own assumptions about the assumptions that market participants would use in pricing the asset or liability based on the best information available in the circumstances. Each investment is assigned a level based upon the observability of the inputs which are significant to the overall valuation. The three-tier hierarchy of inputs is summarized below.
| | • | | Level 1—quoted prices in active markets for identical investments |
| | • | | Level 2—other significant observable inputs (including quoted prices for similar investments, interest rates, prepayment speeds, credit risk, etc.) |
| | • | | Level 3—significant unobservable inputs (including the Portfolio’s own assumptions in determining the fair value of investments) |
Where readily available market prices or relevant bid prices are not available for certain equity investments, such investments may be valued based on similar publicly traded investments, movements in relevant indices since last available prices or based upon underlying company fundamentals and comparable company data (such as multiples to earnings or other multiples to equity). Where an investment is valued using an observable input, such as another publicly traded security, the investment will be classified as Level 2. If management determines that an adjustment is appropriate based on restrictions on resale, illiquidity or uncertainty, and such adjustment is a significant component of the valuation, the investment will be classified as Level 3. An investment will also be classified as Level 3 where management uses company fundamentals and other significant inputs to determine the valuation.
The following table summarizes the valuation of the Portfolio’s investments by the above fair value hierarchy levels as of December 31, 2024:
| | | | | | | | | | | | | | | | |
| | | Level 1 | | | Level 2 | | | Level 3 | | | Total | |
Investments in Securities: | | | | | | | | | | | | | | | | |
Assets: | | | | | | | | | | | | | | | | |
Common Stocks(a) | | $ | 64,246,462 | | | $ | –0 | – | | $ | –0 | – | | $ | 64,246,462 | |
Short-Term Investments | | | 682,959 | | | | | | | | –0 | – | | | 682,959 | |
Investments of Cash Collateral for Securities
Loaned in Affiliated Money Market Fund | | | 1,211,308 | | | | –0 | – | | | –0 | – | | | 1,211,308 | |
| | | | | | | | | | | | | | | | |
Total Investments in Securities | | | 66,140,729 | | | | –0 | – | | | –0 | – | | | 66,140,729 | |
Other Financial Instruments(b) | | | –0 | – | | | –0 | – | | | –0 | – | | | –0 | – |
| | | | | | | | | | | | | | | | |
Total | | $ | 66,140,729 | | | $ | –0 | – | | $ | –0 | – | | $ | 66,140,729 | |
| | | | | | | | | | | | | | | | |
| (a) | | See Portfolio of Investments for sector classifications. |
| (b) | | Other financial instruments include derivative instruments, such as futures, forwards and swaps. Derivative instruments are valued at the unrealized appreciation (depreciation) on the instrument. Other financial instruments may also include swaps with upfront premiums, written options and written swaptions which are valued at market value. |
8
| | |
| |
| | | AB Variable Products Series Fund |
3. Currency Translation
Assets and liabilities denominated in foreign currencies and commitments under forward currency exchange contracts are translated into U.S. dollars at the mean of the quoted bid and ask prices of such currencies against the U.S. dollar. Purchases and sales of portfolio securities are translated into U.S. dollars at the rates of exchange prevailing when such securities were acquired or sold. Income and expenses are translated into U.S. dollars at rates of exchange prevailing when accrued.
Net realized gain or loss on foreign currency transactions represents foreign exchange gains and losses from sales and maturities of foreign fixed income investments, holding of foreign currencies, currency gains or losses realized between the trade and settlement dates on foreign investment transactions, and the difference between the amounts of dividends, interest and foreign withholding taxes recorded on the Portfolio’s books and the U.S. dollar equivalent amounts actually received or paid. Net unrealized currency gains and losses from valuing foreign currency denominated assets and liabilities at period end exchange rates are reflected as a component of net unrealized appreciation or depreciation of foreign currency denominated assets and liabilities.
4. Taxes
It is the Portfolio’s policy to meet the requirements of the Internal Revenue Code applicable to regulated investment companies and to distribute all of its investment company taxable income and net realized gains, if any, to shareholders. Therefore, no provisions for federal income or excise taxes are required. The Portfolio may be subject to taxes imposed by countries in which it invests. Such taxes are generally based on income and/or capital gains earned or repatriated. Taxes are accrued and applied to net investment income, net realized gains and net unrealized appreciation/depreciation as such income and/or gains are earned.
In accordance with U.S. GAAP requirements regarding accounting for uncertainties in income taxes, management has analyzed the Portfolio’s tax positions taken or expected to be taken on federal and state income tax returns for all open tax years (the current and the prior three tax years) and has concluded that no provision for income tax is required in the Portfolio’s financial statements.
5. Investment Income and Investment Transactions
Dividend income is recorded on the ex-dividend date or as soon as the Portfolio is informed of the dividend. Interest income is accrued daily. Investment transactions are accounted for on the date the securities are purchased or sold. Investment gains or losses are determined on the identified cost basis. Non-cash dividends, if any, are recorded on the ex-dividend date at the fair value of the securities received. The Portfolio amortizes premiums and accretes discounts as adjustments to interest income.
The Portfolio accounts for distributions received from real estate investment trust (“REIT”) investments or from regulated investment companies as dividend income, realized gain, or return of capital based on information provided by the REIT or the investment company.
6. Class Allocations
All income earned and expenses incurred by the Portfolio are borne on a pro-rata basis by each outstanding class of shares, based on the proportionate interest in the Portfolio represented by the net assets of such class, except for class specific expenses which are allocated to the respective class. Expenses of the Fund are charged proportionately to each portfolio or based on other appropriate methods. Realized and unrealized gains and losses are allocated among the various share classes based on respective net assets.
7. Dividends and Distributions
Dividends and distributions to shareholders, if any, are recorded on the ex-dividend date. Income dividends and capital gains distributions are determined in accordance with federal tax regulations and may differ from those determined in accordance with U.S. GAAP. To the extent these differences are permanent, such amounts are reclassified within the capital accounts based on their federal tax basis treatment; temporary differences do not require such reclassification.
8. Cash and Short-Term Investments
Cash and short-term investments include cash on hand and short-term investments with maturities of less than one year when purchased.
9
| | |
| SMALL CAP GROWTH PORTFOLIO |
| NOTES TO FINANCIAL STATEMENTS |
| |
| (continued) | | AB Variable Products Series Fund |
9. Segment Information
The Portfolio represents a single operating segment. An operating segment is defined in U.S. GAAP as a component of a public entity that engages in business activities from which it may recognize revenues and incur expenses, has operating results that are regularly reviewed by the public entity’s chief operating decision maker (“CODM”) to make decisions about resources to be allocated to the segment and assess its performance, and has discrete financial information available. The Portfolio’s President is the CODM. The CODM monitors the operating results of the Portfolio as a whole and the pre-determined Portfolio’s long term investment strategy, which is executed by the portfolio management group. The qualitative and quantitative information contained within the financial statements is used by the CODM to assess the segments performance versus the Portfolio’s comparative benchmark and to make resource allocation decisions. Segment assets are reflected on the statement of assets and liabilities and segment expenses are listed on the statement of operations.
NOTE B: Advisory Fee and Other Transactions with Affiliates
Under the terms of the investment advisory agreement, the Portfolio pays the Adviser an advisory fee at an annual rate of .75% of the first $2.5 billion, .65% of the next $2.5 billion and .60% in excess of $5 billion, of the Portfolio’s average daily net assets. The fee is accrued daily and paid monthly. The Adviser has agreed to waive its fees and bear certain expenses to the extent necessary to limit total operating expenses (excluding expenses associated with acquired fund fees and expenses other than the advisory fees of any AB mutual funds in which the Portfolio may invest, interest expense, taxes, extraordinary expenses, and brokerage commissions and other transaction costs) on an annual basis (the “Expense Caps”) to .90% and 1.15% of daily average net assets for Class A and Class B shares, respectively. For the year ended December 31, 2024, such reimbursements/waivers amounted to $214,869. This fee waiver and/or expense reimbursement agreement extends through May 1, 2025 and then may be extended by the Adviser for additional one-year terms.
Pursuant to the investment advisory agreement, the Portfolio may reimburse the Adviser for certain legal and accounting services provided to the Portfolio by the Adviser. For the year ended December 31, 2024, the reimbursement for such services amounted to $94,216.
The Portfolio compensates AllianceBernstein Investor Services, Inc. (“ABIS”), a wholly-owned subsidiary of the Adviser, under a Transfer Agency Agreement for providing personnel and facilities to perform transfer agency services for the Portfolio. Such compensation retained by ABIS amounted to $1,950 for the year ended December 31, 2024.
The Portfolio may invest in AB Government Money Market Portfolio which has a contractual annual advisory fee rate of .20% of the portfolio’s average daily net assets and bears its own expenses. The Adviser had contractually agreed to waive .10% of the advisory fee of AB Government Money Market Portfolio (resulting in a net advisory fee of .10%) until August 31, 2023. Effective September 1, 2023, the Adviser has contractually agreed to waive .05% of the advisory fee of AB Government Money Market Portfolio (resulting in a net advisory fee of .15%) until August 31, 2024. In connection with the investment by the Portfolio in AB Government Money Market Portfolio, the Adviser has contractually agreed to waive its advisory fee from the Portfolio in an amount equal to the Portfolio’s pro rata share of the effective advisory fee of AB Government Money Market Portfolio, as borne indirectly by the Portfolio as an acquired fund fee and expense. For the year ended December 31, 2024, such waiver amounted to $1,265.
A summary of the Portfolio’s transactions in AB mutual funds for the year ended December 31, 2024 is as follows:
| | | | | | | | | | | | | | | | | | | | |
Portfolio | | Market Value
12/31/23
(000) | | | Purchases
at Cost
(000) | | | Sales
Proceeds
(000) | | | Market Value
12/31/24
(000) | | | Dividend
Income
(000) | |
AB Government Money Market Portfolio | | $ | 1,031 | | | $ | 19,606 | | | $ | 19,954 | | | $ | 683 | | | $ | 41 | |
AB Government Money Market Portfolio* | | | 412 | | | | 13,185 | | | | 12,386 | | | | 1,211 | | | | 5 | |
| | | | | | | | | | | | | | | | | | | | |
Total | | | | | | | | | | | | | | $ | 1,894 | | | $ | 46 | |
| | | | | | | | | | | | | | | | | | | | |
| * | | Investments of cash collateral for securities lending transactions (see Note E). |
During the year ended December 31, 2023, the Adviser reimbursed the Portfolio $90 for trading losses incurred due to a trade entry error.
NOTE C: Distribution Plan
The Portfolio has adopted a Distribution Plan (the “Plan”) for Class B shares pursuant to Rule 12b-1 under the 1940 Act. Under the Plan, the Portfolio pays distribution and servicing fees to AllianceBernstein Investments, Inc. (the “Distributor”), a wholly-
10
| | |
| |
| | | AB Variable Products Series Fund |
owned subsidiary of the Adviser, at an annual rate of up to .50% of the Portfolio’s average daily net assets attributable to Class B shares. The fees are accrued daily and paid monthly. The Board currently limits payments under the Plan to .25% of the Portfolio’s average daily net assets attributable to Class B shares. The Plan provides that the Distributor will use such payments in their entirety for distribution assistance and promotional activities.
The Portfolio is not obligated under the Plan to pay any distribution and servicing fees in excess of the amounts set forth above. The purpose of the payments to the Distributor under the Plan is to compensate the Distributor for its distribution services with respect to the sale of the Portfolio’s Class B shares. Since the Distributor’s compensation is not directly tied to its expenses, the amount of compensation received by it under the Plan during any year may be more or less than its actual expenses. For this reason, the Plan is characterized by the staff of the Securities and Exchange Commission as being of the “compensation” variety.
In the event that the Plan is terminated or not continued, no distribution or servicing fees (other than current amounts accrued but not yet paid) would be owed by the Portfolio to the Distributor.
The Plan also provides that the Adviser may use its own resources to finance the distribution of the Portfolio’s shares.
NOTE D: Investment Transactions
Purchases and sales of investment securities (excluding short-term investments) for the year ended December 31, 2024 were as follows:
| | | | | | | | |
| | | Purchases | | | Sales | |
Investment securities (excluding U.S. government securities) | | $ | 54,376,685 | | | $ | 56,746,816 | |
U.S. government securities | | | –0 | – | | | –0 | – |
The cost of investments for federal income tax purposes, gross unrealized appreciation and unrealized depreciation are as follows:
| | | | |
Cost | | $ | 55,433,280 | |
| | | | |
Gross unrealized appreciation | | $ | 14,776,808 | |
Gross unrealized depreciation | | | (4,069,359 | ) |
| | | | |
Net unrealized appreciation | | $ | 10,707,449 | |
| | | | |
1. Derivative Financial Instruments
The Portfolio may use derivatives in an effort to earn income and enhance returns, to replace more traditional direct investments, to obtain exposure to otherwise inaccessible markets (collectively, “investment purposes”), or to hedge or adjust the risk profile of its portfolio.
The Portfolio did not engage in derivatives transactions for the year ended December 31, 2024.
2. Currency Transactions
The Portfolio may invest in non-U.S. Dollar-denominated securities on a currency hedged or unhedged basis. The Portfolio may seek investment opportunities by taking long or short positions in currencies through the use of currency-related derivatives, including forward currency exchange contracts, futures and options on futures, swaps, and other options. The Portfolio may enter into transactions for investment opportunities when it anticipates that a foreign currency will appreciate or depreciate in value but securities denominated in that currency are not held by the Portfolio and do not present attractive investment opportunities. Such transactions may also be used when the Adviser believes that it may be more efficient than a direct investment in a foreign currency-denominated security. The Portfolio may also conduct currency exchange contracts on a spot basis (i.e., for cash at the spot rate prevailing in the currency exchange market for buying or selling currencies).
NOTE E: Securities Lending
The Portfolio may enter into securities lending transactions. Under the Portfolio’s securities lending program, all loans of securities will be collateralized continually by cash collateral and/or non-cash collateral. Non-cash collateral will include only securities issued or guaranteed by the U.S. government or its agencies or instrumentalities. If the Portfolio cannot sell or repledge any non-cash collateral, such collateral will not be reflected in the portfolio of investments. If a loan is collateralized by cash, the Portfolio will be compensated for the loan from a portion of the net return from the income earned on cash collateral after a rebate is paid to the borrower (in some cases, this rebate may be a “negative rebate” or fee paid by the bor-
11
| | |
| SMALL CAP GROWTH PORTFOLIO |
| NOTES TO FINANCIAL STATEMENTS |
| |
| (continued) | | AB Variable Products Series Fund |
rower to the Portfolio in connection with the loan), and payments are made for fees of the securities lending agent and for certain other administrative expenses. If the Portfolio receives non-cash collateral, the Portfolio will receive a fee from the borrower generally equal to a negotiated percentage of the market value of the loaned securities. The Portfolio will have the right to call a loan and obtain the securities loaned at any time on notice to the borrower within the normal and customary settlement time for the securities. While the securities are on loan, the borrower is obligated to pay the Portfolio amounts equal to any dividend income or other distributions from the securities; however, these distributions will not be afforded the same preferential tax treatment as qualified dividends. The Portfolio will not be able to exercise voting rights with respect to any securities during the existence of a loan, but will have the right to regain ownership of loaned securities in order to exercise voting or other ownership rights. Collateral received and securities loaned are marked to market daily to ensure that the securities loaned are secured by collateral. The lending agent currently invests the cash collateral received in AB Government Money Market Portfolio, an eligible money market vehicle, in accordance with the investment restrictions of the Portfolio, and as approved by the Board. The collateral received on securities loaned is recorded as an asset as well as a corresponding liability in the statement of assets and liabilities. The collateral will be adjusted the next business day to maintain the required collateral amount. The amounts of securities lending income from the borrowers and AB Government Money Market Portfolio are reflected in the statement of operations. When the Portfolio earns net securities lending income from AB Government Money Market Portfolio, the income is inclusive of a rebate expense paid to the borrower. In connection with the cash collateral investment by the Portfolio in AB Government Money Market Portfolio, the Adviser has agreed to waive a portion of the Portfolio’s share of the advisory fees of AB Government Money Market Portfolio, as borne indirectly by the Portfolio as an acquired fund fee and expense. When the Portfolio lends securities, its investment performance will continue to reflect changes in the value of the securities loaned. A principal risk of lending portfolio securities is that the borrower may fail to return the loaned securities upon termination of the loan and that the collateral will not be sufficient to replace the loaned securities. The lending agent has agreed to indemnify the Portfolio in the case of default of any securities borrower.
A summary of the Portfolio’s transactions surrounding securities lending for the year ended December 31, 2024 is as follows:
| | | | | | | | | | | | | | | | | | | | | | |
| | | | | | | | | | | | | AB Government Money Market
Portfolio | |
Market Value of
Securities on Loan* | | | Cash Collateral* | | | Market Value of
Non-Cash
Collateral* | | | Income from
Borrowers | | | Income Earned | | | Advisory Fee
Waived | |
|
| $ | 3,785,559 | | | $ | 1,211,308 | | | $ | 2,678,379 | | | $ | 78,029 | | | $ | 4,996 | | | $ | 444 | |
| * | | As of December 31, 2024. |
NOTE F: Capital Stock
Each class consists of 500,000,000 authorized shares. Transactions in capital shares for each class were as follows:
| | | | | | | | | | | | | | | | | | | | |
| | | SHARES | | | | | | AMOUNT | |
| | | Year Ended
December 31,
2024 | | | Year Ended
December 31,
2023 | | | | | | Year Ended
December 31,
2024 | | | Year Ended
December 31,
2023 | |
Class A | | | | | | | | | | | | | | | | | | | | |
Shares sold | | | 511,268 | | | | 240,943 | | | | | | | $ | 6,668,045 | | | $ | 2,405,631 | |
Shares issued in reinvestment of dividends | | | 4,413 | | | | –0 | – | | | | | | | 49,738 | | | | –0 | – |
Shares redeemed | | | (334,328 | ) | | | (320,406 | ) | | | | | | | (3,984,470 | ) | | | (3,234,270 | ) |
| | | | | | | | | | | | | | | | | | | | |
Net increase (decrease) | | | 181,353 | | | | (79,463 | ) | | | | | | $ | 2,733,313 | | | $ | (828,639 | ) |
| | | | | | | | | | | | | | | | | | | | |
Class B | |
Shares sold | | | 880,965 | | | | 885,610 | | | | | | | $ | 7,576,975 | | | $ | 6,484,511 | |
Shares redeemed | | | (1,416,878 | ) | | | (960,393 | ) | | | | | | | (12,084,532 | ) | | | (7,008,007 | ) |
| | | | | | | | | | | | | | | | | | | | |
Net decrease | | | (535,913 | ) | | | (74,783 | ) | | | | | | $ | (4,507,557 | ) | | $ | (523,496 | ) |
| | | | | | | | | | | | | | | | | | | | |
At December 31, 2024, certain shareholders of the Portfolio owned 60% in aggregate of the Portfolio’s outstanding shares. Significant transactions by such shareholders, if any, may impact the Portfolio’s performance.
12
| | |
| |
| | | AB Variable Products Series Fund |
NOTE G: Risks Involved in Investing in the Portfolio
Market Risk—The value of the Portfolio’s assets will fluctuate as the market or markets in which the Portfolio invests fluctuate. The value of the Portfolio’s investments may decline, sometimes rapidly and unpredictably, simply because of economic changes or other events, including public health crises (including the occurrence of a contagious disease or illness) and regional and global conflicts, that affect large portions of the market. It includes the risk that a particular style of investing may underperform the market generally.
Sector Risk—The Portfolio may have more risk than a more diversified portfolio because it may invest to a significant extent in one or more particular market sectors, such as the information technology or health care sector. To the extent it does so, market or economic factors affecting the relevant sector(s) could have a major effect on the value of the Portfolio’s investments.
Capitalization Risk—Investments in small- and mid-capitalization companies may be more volatile than investments in large-capitalization companies. Investments in small- and mid-capitalization companies may have additional risks because these companies have limited product lines, markets or financial resources.
Foreign (Non-U.S.) Risk—Investments in securities of non-U.S. issuers may involve more risk than those of U.S. issuers. These securities may fluctuate more widely in price and may be more difficult to trade due to adverse market, economic, political, regulatory or other factors.
Indemnification Risk—In the ordinary course of business, the Portfolio enters into contracts that contain a variety of indemnifications. The Portfolio’s maximum exposure under these arrangements is unknown. However, the Portfolio has not had prior claims or losses pursuant to these indemnification provisions and expects the risk of loss thereunder to be remote. Therefore, the Portfolio has not accrued any liability in connection with these indemnification provisions.
Management Risk—The Portfolio is subject to management risk because it is an actively-managed investment fund. The Adviser will apply its investment techniques and risk analyses in making investment decisions for the Portfolio, but there is no guarantee that its techniques will produce the intended results. Some of these techniques may incorporate, or rely upon, quantitative models, but there is no guarantee that these models will generate accurate forecasts, reduce risk or otherwise perform as expected.
NOTE H: Joint Credit Facility
A number of open-end mutual funds managed by the Adviser, including the Portfolio, participate in a $325 million revolving credit facility (the “Facility”) intended to provide short-term financing related to redemptions and other short term liquidity requirements, subject to certain restrictions. Commitment fees related to the Facility are paid by the participating funds and are included in miscellaneous expenses in the statement of operations. The Portfolio did not utilize the Facility during the year ended December 31, 2024.
NOTE I: Distributions to Shareholders
The tax character of distributions paid during the fiscal years ended December 31, 2024 and December 31, 2023 were as follows:
| | | | | | | | |
| | | 2024 | | | 2023 | |
Distributions paid from: | | | | | | | | |
Ordinary income | | $ | 49,738 | | | $ | –0 | – |
| | | | | | | | |
Total taxable distributions paid | | $ | 49,738 | | | $ | –0 | – |
| | | | | | | | |
As of December 31, 2024, the components of accumulated earnings (deficit) on a tax basis were as follows:
| | | | |
Accumulated capital and other losses | | $ | (1,290,255 | )(a) |
Unrealized appreciation (depreciation) | | | 10,713,024 | (b) |
| | | | |
Total accumulated earnings (deficit) | | $ | 9,422,769 | |
| | | | |
| (a) | | As of December 31, 2024, the Portfolio had a net capital loss carryforward of $1,290,255. During the fiscal year, the Portfolio utilized $8,152,463 of capital loss carry forwards to offset current year net realized gains. |
| (b) | | The differences between book-basis and tax-basis unrealized appreciation (depreciation) are attributable primarily to the tax treatment of passive foreign investment companies (PFICs) and the tax deferral of losses on wash sales. |
13
| | |
| SMALL CAP GROWTH PORTFOLIO |
| NOTES TO FINANCIAL STATEMENTS |
| |
| (continued) | | AB Variable Products Series Fund |
For tax purposes, net realized capital losses may be carried over to offset future capital gains, if any. Funds are permitted to carry forward capital losses for an indefinite period, and such losses will retain their character as either short-term or long-term capital losses. As of December 31, 2024, the Portfolio had a net short-term capital loss carryforward of $1,290,255, which may be carried forward for an indefinite period.
During the current fiscal year, permanent differences primarily due to the disallowance of a net operating loss and taxable overdistributions resulted in a net increase in distributable earnings and a net decrease in additional paid-in capital. These reclassifications had no effect on net assets.
NOTE J: Subsequent Events
Management has evaluated subsequent events for possible recognition or disclosure in the financial statements through the date the financial statements are issued. Management has determined that there are no material events that would require disclosure in the Portfolio’s financial statements through this date.
14
| | |
| | |
| SMALL CAP GROWTH PORTFOLIO |
| |
| FINANCIAL HIGHLIGHTS | | AB Variable Products Series Fund |
Selected Data For A Share Of Capital Stock Outstanding Throughout Each Period
| | | | | | | | | | | | | | | | | | | | |
| | | CLASS A | |
| | | Year Ended December 31, | |
| | | 2024 | | | 2023 | | | 2022 | | | 2021 | | | 2020 | |
Net asset value, beginning of period | | | $10.74 | | | | $ 9.10 | | | | $25.13 | | | | $28.76 | | | | $19.92 | |
| | | | | | | | | | | | | | | | | | | | |
| | | | | | | | | | | | | | | | | | | | |
Income From Investment Operations | | | | | | | | | | | | | | | | | | | | |
Net investment loss(a)(b) | | | (.05 | ) | | | (.04 | ) | | | (.06 | ) | | | (.20 | ) | | | (.13 | ) |
Net realized and unrealized gain (loss) on investment transactions | | | 2.05 | | | | 1.68 | | | | (8.86 | ) | | | 2.87 | | | | 10.49 | |
Contributions from Affiliates | | | –0 | – | | | .00 | (c) | | | –0 | – | | | –0 | – | | | –0 | – |
| | | | | | | | | | | | | | | | | | | | |
Net increase (decrease) in net asset value from operations | | | 2.00 | | | | 1.64 | | | | (8.92 | ) | | | 2.67 | | | | 10.36 | |
| | | | | | | | | | | | | | | | | | | | |
| | | | | | | | | | | | | | | | | | | | |
Less: Dividends and Distributions | | | | | | | | | | | | | | | | | | | | |
Dividends from net investment income | | | (.03 | ) | | | –0 | – | | | –0 | – | | | –0 | – | | | –0 | – |
Distributions from net realized gain on investment transactions | | | –0 | – | | | –0 | – | | | (7.11 | ) | | | (6.30 | ) | | | (1.52 | ) |
| | | | | | | | | | | | | | | | | | | | |
Total dividends and distributions | | | (.03 | ) | | | –0 | – | | | (7.11 | ) | | | (6.30 | ) | | | (1.52 | ) |
| | | | | | | | | | | | | | | | | | | | |
Net asset value, end of period | | | $12.71 | | | | $10.74 | | | | $ 9.10 | | | | $25.13 | | | | $28.76 | |
| | | | | | | | | | | | | | | | | | | | |
| | | | | | | | | | | | | | | | | | | | |
Total Return | | | | | | | | | | | | | | | | | | | | |
Total investment return based on net asset value(d)* | | | 18.64 | % | | | 18.02 | % | | | (39.09 | )% | | | 9.46 | % | | | 53.98 | % |
| | | | | | | | | | | | | | | | | | | | |
Ratios/Supplemental Data | | | | | | | | | | | | | | | | | | | | |
Net assets, end of period (000’s omitted) | | | $25,353 | | | | $19,464 | | | | $17,213 | | | | $32,295 | | | | $34,314 | |
Ratio to average net assets of: | | | | | | | | | | | | | | | | | | | | |
Expenses, net of waivers/reimbursements(e) | | | .90 | % | | | .90 | % | | | .90 | % | | | .91 | % | | | .90 | % |
Expenses, before waivers/reimbursements(e) | | | 1.26 | % | | | 1.31 | % | | | 1.22 | % | | | 1.08 | % | | | 1.09 | % |
Net investment loss(b) | | | (.39 | )% | | | (.38 | )% | | | (.42 | )% | | | (.71 | )% | | | (.60 | )% |
Portfolio turnover rate | | | 92 | % | | | 69 | % | | | 67 | % | | | 67 | % | | | 103 | % |
See footnote summary on page 16.
15
| | |
| SMALL CAP GROWTH PORTFOLIO | | |
| FINANCIAL HIGHLIGHTS | | |
| |
| (continued) | | AB Variable Products Series Fund |
Selected Data For A Share Of Capital Stock Outstanding Throughout Each Period
| | | | | | | | | | | | | | | | | | | | |
| | | CLASS B | |
| | | Year Ended December 31, | |
| | | 2024 | | | 2023 | | | 2022 | | | 2021 | | | 2020 | |
Net asset value, beginning of period | | | $7.97 | | | | $6.77 | | | | $21.35 | | | | $25.36 | | | | $17.75 | |
| | | | | | | | | | | | | | | | | | | | |
| | | | | | | | | | | | | | | | | | | | |
Income From Investment Operations | | | | | | | | | | | | | | | | | | | | |
Net investment loss(a)(b) | | | (.06 | ) | | | (.05 | ) | | | (.07 | ) | | | (.24 | ) | | | (.16 | ) |
Net realized and unrealized gain (loss) on investment transactions | | | 1.53 | | | | 1.25 | | | | (7.40 | ) | | | 2.53 | | | | 9.29 | |
Contributions from Affiliates | | | –0 | – | | | .00 | (c) | | | –0 | – | | | –0 | – | | | –0 | – |
| | | | | | | | | | | | | | | | | | | | |
Net increase (decrease) in net asset value from operations | | | 1.47 | | | | 1.20 | | | | (7.47 | ) | | | 2.29 | | | | 9.13 | |
| | | | | | | | | | | | | | | | | | | | |
| | | | | | | | | | | | | | | | | | | | |
Less: Distributions | | | | | | | | | | | | | | | | | | | | |
Distributions from net realized gain on investment transactions | | | –0 | – | | | –0 | – | | | (7.11 | ) | | | (6.30 | ) | | | (1.52 | ) |
| | | | | | | | | | | | | | | | | | | | |
Net asset value, end of period | | | $9.44 | | | | $7.97 | | | | $ 6.77 | | | | $21.35 | | | | $25.36 | |
| | | | | | | | | | | | | | | | | | | | |
| | | | | | | | | | | | | | | | | | | | |
Total Return | | | | | | | | | | | | | | | | | | | | |
Total investment return based on net asset value(d)* | | | 18.44 | % | | | 17.72 | % | | | (39.26 | )% | | | 9.20 | % | | | 53.64 | % |
| | | | | | | | | | | | | | | | | | | | |
Ratios/Supplemental Data | | | | | | | | | | | | | | | | | | | | |
Net assets, end of period (000’s omitted) | | | $39,542 | | | | $37,663 | | | | $32,491 | | | | $54,079 | | | | $84,816 | |
Ratio to average net assets of: | | | | | | | | | | | | | | | | | | | | |
Expenses, net of waivers/reimbursements(e) | | | 1.15 | % | | | 1.15 | % | | | 1.15 | % | | | 1.15 | % | | | 1.15 | % |
Expenses, before waivers/reimbursements(e) | | | 1.51 | % | | | 1.56 | % | | | 1.47 | % | | | 1.31 | % | | | 1.33 | % |
Net investment loss(b) | | | (.66 | )% | | | (.62 | )% | | | (.67 | )% | | | (.96 | )% | | | (.84 | )% |
Portfolio turnover rate | | | 92 | % | | | 69 | % | | | 67 | % | | | 67 | % | | | 103 | % |
| (a) | | Based on average shares outstanding. |
| (b) | | Net of expenses waived/reimbursed by the Adviser. |
| (c) | | Amount is less than $.005. |
| (d) | | Total investment return is calculated assuming an initial investment made at the net asset value at the beginning of the period, reinvestment of all dividends and distributions at net asset value during the period, and redemption on the last day of the period. Total investment return does not reflect (i) insurance company’s separate account related expense charges and (ii) the deductions of taxes that a shareholder would pay on Portfolio distributions or the redemption of Portfolio shares. Total investment return calculated for a period of less than one year is not annualized. |
| (e) | | The expense ratios presented below exclude interest/bank overdraft expense: |
| | | | | | | | | | | | | | | | | | | | |
| | | Year Ended December 31, | |
| | | 2024 | | | 2023 | | | 2022 | | | 2021 | | | 2020 | |
Class A | |
Net of waivers/reimbursements | | | .90 | % | | | .90 | % | | | .90 | % | | | .90 | % | | | .90 | % |
Before waivers/reimbursements | | | 1.26 | % | | | 1.31 | % | | | 1.22 | % | | | 1.07 | % | | | 1.09 | % |
Class B | |
Net of waivers/reimbursements | | | 1.15 | % | | | 1.15 | % | | | 1.15 | % | | | 1.15 | % | | | 1.15 | % |
Before waivers/reimbursements | | | 1.51 | % | | | 1.56 | % | | | 1.47 | % | | | 1.31 | % | | | 1.33 | % |
| * | | Includes the impact of proceeds received and credited to the Portfolio resulting from class action settlements, which enhanced the Portfolio’s performance for the years ended December 31, 2024, December 31, 2023 and December 31, 2021 by .01%, .02% and .03%, respectively. |
See notes to financial statements.
16
| | |
| | |
| REPORT OF INDEPENDENT REGISTERED | | |
| |
| PUBLIC ACCOUNTING FIRM | | AB Variable Products Series Fund |
To the Board of Directors and Shareholders of AB Small Cap Growth Portfolio
Opinion on the Financial Statements
We have audited the accompanying statement of assets and liabilities of AB Small Cap Growth Portfolio (the “Portfolio”) (one of the series constituting AB Variable Products Series Fund, Inc. (the “Fund”)), including the portfolio of investments, as of December 31, 2024, and the related statement of operations for the year then ended, the statements of changes in net assets for each of the two years in the period then ended, the financial highlights for each of the five years in the period then ended and the related notes (collectively referred to as the “financial statements”). In our opinion, the financial statements present fairly, in all material respects, the financial position of the Portfolio (one of the series constituting AB Variable Products Series Fund, Inc.) at December 31, 2024, the results of its operations for the year then ended, the changes in its net assets for each of the two years in the period then ended and its financial highlights for each of the five years in the period then ended, in conformity with U.S. generally accepted accounting principles.
Basis for Opinion
These financial statements are the responsibility of the Fund’s management. Our responsibility is to express an opinion on the Portfolio’s financial statements based on our audits. We are a public accounting firm registered with the Public Company Accounting Oversight Board (United States) (“PCAOB”) and are required to be independent with respect to the Fund in accordance with the U.S. federal securities laws and the applicable rules and regulations of the Securities and Exchange Commission and the PCAOB.
We conducted our audits in accordance with the standards of the PCAOB. Those standards require that we plan and perform the audit to obtain reasonable assurance about whether the financial statements are free of material misstatement, whether due to error or fraud. The Fund is not required to have, nor were we engaged to perform, an audit of the Fund’s internal control over financial reporting. As part of our audits, we are required to obtain an understanding of internal control over financial reporting but not for the purpose of expressing an opinion on the effectiveness of the Fund’s internal control over financial reporting. Accordingly, we express no such opinion.
Our audits included performing procedures to assess the risks of material misstatement of the financial statements, whether due to error or fraud, and performing procedures that respond to those risks. Such procedures included examining, on a test basis, evidence regarding the amounts and disclosures in the financial statements. Our procedures included confirmation of securities owned as of December 31, 2024, by correspondence with the custodian, brokers and others; when replies were not received from brokers or others, we performed other auditing procedures. Our audits also included evaluating the accounting principles used and significant estimates made by management, as well as evaluating the overall presentation of the financial statements. We believe that our audits provide a reasonable basis for our opinion.

We have served as the auditor of one or more of the AB investment companies since 1968.
New York, New York
February 14, 2025
17
| | |
| | |
|
| SMALL CAP GROWTH PORTFOLIO |
| |
| CONTINUANCE DISCLOSURE | | AB Variable Products Series Fund |
INFORMATION REGARDING THE REVIEW AND APPROVAL OF THE FUND’S ADVISORY AGREEMENT
The disinterested directors (the “directors”) of AB Variable Products Series Fund, Inc. (the “Company”) unanimously approved the continuance of the Company’s Advisory Agreement with the Adviser in respect of AB Small Cap Growth Portfolio (the “Fund”) at a meeting held by video conference on May 7-9, 2024 (the “Meeting”).
Prior to approval of the continuance of the Advisory Agreement, the directors had requested from the Adviser, and received and evaluated, extensive materials. They reviewed the proposed continuance of the Advisory Agreement with the Adviser and with experienced counsel who are independent of the Adviser, who advised on the relevant legal standards. The directors also reviewed additional materials, including comparative analytical data prepared by the Senior Vice President of the Fund. The directors also discussed the proposed continuance in private sessions with counsel.
The directors considered their knowledge of the nature and quality of the services provided by the Adviser to the Fund gained from their experience as directors or trustees of most of the registered investment companies advised by the Adviser, their overall confidence in the Adviser’s integrity and competence they have gained from that experience, the Adviser’s initiative in identifying and raising potential issues with the directors and its responsiveness, frankness and attention to concerns raised by the directors in the past, including the Adviser’s willingness to consider and implement organizational and operational changes designed to improve investment results and the services provided to the AB Funds. The directors noted that they have four regular meetings each year, at each of which they review extensive materials and information from the Adviser, including information on the investment performance of the Fund.
The directors also considered all factors they believed relevant, including the specific matters discussed below. During the course of their deliberations, the directors evaluated, among other things, the reasonableness of the advisory fee. The directors did not identify any particular information that was all-important or controlling, and different directors may have attributed different weights to the various factors. The directors determined that the selection of the Adviser to manage the Fund and the overall arrangements between the Fund and the Adviser, as provided in the Advisory Agreement, including the advisory fee, were fair and reasonable in light of the services performed, expenses incurred and such other matters as the directors considered relevant in the exercise of their business judgment. The material factors and conclusions that formed the basis for the directors’ determinations included the following:
Nature, Extent and Quality of Services Provided
The directors considered the scope and quality of services provided by the Adviser under the Advisory Agreement, including the quality of the investment research capabilities of the Adviser and the other resources it has dedicated to performing services for the Fund. The directors noted that the Adviser from time to time reviews the Fund’s investment strategies and from time to time proposes changes intended to improve the Fund’s relative or absolute performance for the directors’ consideration. They also noted the professional experience and qualifications of the Fund’s portfolio management team and other senior personnel of the Adviser. The directors also considered that the Advisory Agreement provides that the Fund will reimburse the Adviser for the cost to it of providing certain clerical, accounting, administrative and other services to the Fund by employees of the Adviser or its affiliates. Requests for these reimbursements are made on a quarterly basis and subject to approval by the directors. Reimbursements, to the extent requested and paid, result in a higher rate of total compensation from the Fund to the Adviser than the fee rate stated in the Advisory Agreement. The directors noted that the methodology used to determine the reimbursement amounts had been reviewed by an independent consultant at the request of the directors. The quality of administrative and other services, including the Adviser’s role in coordinating the activities of the Fund’s other service providers, also was considered. The directors concluded that, overall, they were satisfied with the nature, extent and quality of services provided to the Fund under the Advisory Agreement.
Costs of Services Provided and Profitability
The directors reviewed a schedule of the revenues and expenses and related notes indicating the profitability of the Fund to the Adviser for calendar years 2022 and 2023 that had been prepared with an expense allocation methodology arrived at in consultation with an independent consultant at the request of the directors. The directors noted the assumptions and methods of allocation used by the Adviser in preparing fund-specific profitability data and understood that there are a number of potentially acceptable allocation methodologies for information of this type. The directors noted that the profitability information reflected all revenues and expenses of the Adviser’s relationship with the Fund, including those relating to its subsidiaries that provide transfer agency, distribution and brokerage services to the Fund. The directors recognized that it is difficult to make comparisons of the profitability of the Advisory Agreement with the profitability of fund advisory contracts for unaffiliated funds because comparative information is not generally publicly available and is affected by numerous
18
| | |
| |
| | | AB Variable Products Series Fund |
factors. The directors focused on the profitability of the Adviser’s relationship with the Fund before taxes and distribution expenses. The directors concluded that the Adviser’s level of profitability from its relationship with the Fund in 2022 was not unreasonable. The directors noted that the Fund was not profitable to the Adviser in 2023.
Fall-Out Benefits
The directors considered the other benefits to the Adviser and its affiliates from their relationships with the Fund, including, but not limited to, benefits relating to soft dollar arrangements (whereby investment advisers receive brokerage and research services from brokers that execute agency transactions for their clients); 12b-1 fees and sales charges received by the Fund’s principal underwriter (which is a wholly owned subsidiary of the Adviser) in respect of the Fund’s Class B shares; brokerage commissions paid by the Fund to brokers affiliated with the Adviser; and transfer agency fees paid by the Fund to a wholly owned subsidiary of the Adviser. The directors recognized that the Fund’s recent unprofitability to the Adviser would be exacerbated without these benefits. The directors understood that the Adviser also might derive reputational and other benefits from its association with the Fund.
Investment Results
In addition to the information reviewed by the directors in connection with the Meeting, the directors receive detailed performance information for the Fund at each regular Board meeting during the year.
At the Meeting, the directors reviewed performance information prepared by an independent service provider (the “15(c) service provider”), showing the performance of the Class A Shares of the Fund against a group of similar funds (“peer group”) and a larger group of similar funds (“peer universe”), each selected by the 15(c) service provider, and information prepared by the Adviser showing performance of the Class A Shares against a broad-based securities market index, in each case for the 1-, 3-, 5- and 10-year periods ended February 29, 2024 and (in the case of comparisons with the broad-based securities market index) for the period from inception. Based on their review, the directors concluded that the Fund’s investment performance was acceptable.
Advisory Fees and Other Expenses
The directors considered the advisory fee rate payable by the Fund to the Adviser and information prepared by the 15(c) service provider concerning advisory fee rates payable by other funds in the same category as the Fund. The directors recognized that it is difficult to make comparisons of advisory fees because there are variations in the services that are included in the fees paid by other funds. The directors compared the Fund’s contractual effective advisory fee rate with a peer group median and noted that it was lower than the median. They also noted that the Adviser’s total rate of compensation, taking into account the administrative expense reimbursement paid to the Adviser in the latest fiscal year, was above the median and discussed with the Adviser the reasons it was above the median.
The directors also considered the Adviser’s fee schedule for other clients utilizing investment strategies similar to those of the Fund. For this purpose, they reviewed the relevant advisory fee information from the Adviser’s Form ADV and in a report from the Fund’s Senior Vice President and noted the differences between the Fund’s fee schedule, on the one hand, and the Adviser’s institutional fee schedule and the schedule of fees charged by the Adviser to any offshore funds and for services to any sub-advised funds utilizing investment strategies similar to those of the Fund, on the other. The directors noted that the Adviser may, in some cases, agree to fee rates with large institutional clients that are lower than those reviewed by the directors and that they had previously discussed with the Adviser its policies in respect of such arrangements. The directors also compared the advisory fee rate for the Fund with those for two other funds advised by the Adviser utilizing similar investment strategies.
The Adviser reviewed with the directors the significantly greater scope of the services it provides to the Fund relative to institutional, offshore fund and sub-advised fund clients. In this regard, the Adviser noted, among other things, that, compared to institutional and offshore or sub-advisory accounts, the Fund (i) demands considerably more portfolio management, research and trading resources due to significantly higher daily cash flows; (ii) has more tax and regulatory restrictions and compliance obligations; (iii) must prepare and file or distribute regulatory and other communications about fund operations; and (iv) must provide shareholder servicing to retail investors. The Adviser also reviewed the greater legal risks presented by the large and changing population of Fund shareholders who may assert claims against the Adviser in individual or class actions, and the greater entrepreneurial risk in offering new fund products, which require substantial investment to launch, may not succeed, and generally must be priced to compete with larger, more established funds resulting in lack of profitability to the Adviser until a new fund achieves scale. In light of the substantial differences in services rendered by the
19
| | |
| SMALL CAP GROWTH PORTFOLIO |
| CONTINUANCE DISCLOSURE | | |
| |
| (continued) | | AB Variable Products Series Fund |
Adviser to institutional, offshore fund and sub-advised fund clients as compared to the Fund, and the different risk profile, the directors considered these fee comparisons inapt and did not place significant weight on them in their deliberations.
In connection with their review of the Fund’s advisory fee, the directors also considered the total expense ratio of the Class A shares of the Fund in comparison to the medians for a peer group and a peer universe selected by the 15(c) service provider. The Class A expense ratio of the Fund was based on the Fund’s latest fiscal year and reflected the impact of the Adviser’s expense cap for the Fund. The directors noted that it was likely that the expense ratios of some of the other funds in the Fund’s category were lowered by waivers or reimbursements by those funds’ investment advisers, which in some cases might be voluntary or temporary. The directors view expense ratio information as relevant to their evaluation of the Adviser’s services because the Adviser is responsible for coordinating services provided to the Fund by others. The directors noted that the Fund’s expense ratio was above the median of a peer group and lower than the median of a peer universe. After reviewing and discussing the Adviser’s explanations of the reasons for this, the directors concluded that the Fund’s expense ratio was acceptable.
Economies of Scale
The directors noted that the advisory fee schedule for the Fund contains breakpoints that reduce the fee rates on assets above specified levels. The directors took into consideration prior presentations by an independent consultant on economies of scale in the mutual fund industry and for the AB Funds, and presentations from time to time by the Adviser concerning certain of its views on economies of scale. The directors also had requested and received from the Adviser certain updates on economies of scale in advance of the Meeting. The directors believe that economies of scale may be realized (if at all) by the Adviser across a variety of products and services, and not only in respect of a single fund. The directors noted that there is no established methodology for setting breakpoints that give effect to the fund-specific services provided by a fund’s adviser and to the economies of scale that an adviser may realize in its overall mutual fund business or those components of it which directly or indirectly affect a fund’s operations. The directors observed that in the mutual fund industry as a whole, as well as among funds similar to the Fund, there is no uniformity or pattern in the fees and asset levels at which breakpoints (if any) apply. The directors also noted that the advisory agreements for many funds do not have breakpoints at all. Having taken these factors into account, the directors concluded that the Fund’s shareholders would benefit from a sharing of economies of scale in the event the Fund’s net assets exceed a breakpoint in the future.
20
VPS-SCG-0151-1224
DEC 12.31.24

ANNUAL FINANCIAL STATEMENTS AND ADDITIONAL INFORMATION
AB VARIABLE PRODUCTS
SERIES FUND, INC.
| + | | AB SUSTAINABLE GLOBAL THEMATIC PORTFOLIO |
Investment Products Offered
| | • | | Are Not Bank Guaranteed |
AllianceBernstein Investments, Inc. (ABI) is the distributor of the AB family of mutual funds. ABI is a member of FINRA and is an affiliate of AllianceBernstein L.P., the Adviser of the funds.
You may obtain a description of the Fund’s proxy voting policies and procedures, and information regarding how the Fund voted proxies relating to portfolio securities during the most recent 12-month period ended June 30, without charge. Simply visit AB’s website at www.abfunds.com or go to the Securities and Exchange Commission’s (the “Commission”) website at www.sec.gov, or call AB at (800) 227 4618.
The Fund files its complete schedule of portfolio holdings with the Commission for the first and third quarters of each fiscal year as an exhibit to its reports on Form N-PORT. The Fund’s Form N-PORT reports are available on the Commission’s website at www.sec.gov.
The [A/B] logo and AllianceBernstein® are registered trademarks used by permission of the owner, AllianceBernstein L.P.
| | |
| SUSTAINABLE GLOBAL THEMATIC PORTFOLIO |
| PORTFOLIO OF INVESTMENTS | | |
| |
| December 31, 2024 | | AB Variable Products Series Fund |
| | | | | | | | |
Company | | Shares | | | U.S. $ Value | |
| | | | | | | | |
COMMON STOCKS–99.2% | | | | | | | | |
| | | | | | | | |
INFORMATION TECHNOLOGY–32.8% | | | | | | | | |
COMMUNICATIONS EQUIPMENT–1.7% | | | | | | | | |
Arista Networks, Inc.(a) | | | 24,781 | | | $ | 2,739,044 | |
| | | | | | | | |
ELECTRONIC EQUIPMENT, INSTRUMENTS & COMPONENTS–6.4% | | | | | | | | |
Flex Ltd.(a) | | | 120,518 | | | | 4,626,686 | |
Halma PLC | | | 78,831 | | | | 2,644,695 | |
Keyence Corp. | | | 7,400 | | | | 3,007,888 | |
| | | | | | | | |
| | | | | | | 10,279,269 | |
| | | | | | | | |
IT SERVICES–2.3% | | | | | | | | |
Accenture PLC–Class A | | | 10,531 | | | | 3,704,701 | |
| | | | | | | | |
SEMICONDUCTORS & SEMICONDUCTOR EQUIPMENT–10.5% | | | | | | | | |
ASML Holding NV | | | 2,826 | | | | 1,979,427 | |
Monolithic Power Systems, Inc. | | | 3,425 | | | | 2,026,573 | |
NVIDIA Corp. | | | 38,737 | | | | 5,201,992 | |
NXP Semiconductors NV | | | 13,127 | | | | 2,728,447 | |
Taiwan Semiconductor Manufacturing Co., Ltd. | | | 152,000 | | | | 4,940,003 | |
| | | | | | | | |
| | | | | | | 16,876,442 | |
| | | | | | | | |
SOFTWARE–11.9% | | | | | | | | |
Adobe, Inc.(a) | | | 7,066 | | | | 3,142,109 | |
Bentley Systems, Inc.–Class B | | | 34,944 | | | | 1,631,885 | |
Cadence Design Systems, Inc.(a) | | | 11,040 | | | | 3,317,078 | |
Fair Isaac Corp.(a) | | | 1,451 | | | | 2,888,839 | |
Microsoft Corp. | | | 14,502 | | | | 6,112,593 | |
Palo Alto Networks, Inc.(a) | | | 11,783 | | | | 2,144,035 | |
| | | | | | | | |
| | | | | | | 19,236,539 | |
| | | | | | | | |
| | | | | | | 52,835,995 | |
| | | | | | | | |
FINANCIALS–19.1% | | | | | | | | |
BANKS–2.7% | | | | | | | | |
Bank Mandiri Persero Tbk PT | | | 3,415,000 | | | | 1,202,091 | |
NU Holdings Ltd./Cayman Islands–Class A(a) | | | 299,092 | | | | 3,098,593 | |
| | | | | | | | |
| | | | | | | 4,300,684 | |
| | | | | | | | |
CAPITAL MARKETS–5.8% | | | | | | | | |
Jefferies Financial Group, Inc. | | | 40,820 | | | | 3,200,288 | |
London Stock Exchange Group PLC | | | 29,932 | | | | 4,225,046 | |
Partners Group Holding AG | | | 1,381 | | | | 1,875,802 | |
| | | | | | | | |
| | | | | | | 9,301,136 | |
| | | | | | | | |
FINANCIAL SERVICES–5.3% | | | | | | | | |
Fiserv, Inc.(a) | | | 20,228 | | | | 4,155,236 | |
Visa, Inc.–Class A | | | 13,843 | | | | 4,374,941 | |
| | | | | | | | |
| | | | | | | 8,530,177 | |
| | | | | | | | |
INSURANCE–5.3% | | | | | | | | |
Aflac, Inc. | | | 32,020 | | | | 3,312,149 | |
AIA Group Ltd. | | | 445,400 | | | | 3,199,247 | |
| | | | | | | | |
Reinsurance Group of America, Inc. | | | 9,510 | | | | 2,031,621 | |
| | | | | | | | |
| | | | | | | 8,543,017 | |
| | | | | | | | |
| | | | | | | 30,675,014 | |
| | | | | | | | |
INDUSTRIALS–18.5% | | | | | | | | |
AEROSPACE & DEFENSE–1.6% | | | | | | | | |
Hexcel Corp. | | | 40,705 | | | | 2,552,203 | |
| | | | | | | | |
COMMERCIAL SERVICES & SUPPLIES–6.2% | | | | | | | | |
Tetra Tech, Inc. | | | 50,724 | | | | 2,020,844 | |
Veralto Corp. | | | 39,834 | | | | 4,057,093 | |
Waste Management, Inc. | | | 18,844 | | | | 3,802,531 | |
| | | | | | | | |
| | | | | | | 9,880,468 | |
| | | | | | | | |
CONSTRUCTION & ENGINEERING–3.6% | | | | | | | | |
AECOM | | | 30,614 | | | | 3,270,188 | |
WSP Global, Inc. | | | 14,315 | | | | 2,519,129 | |
| | | | | | | | |
| | | | | | | 5,789,317 | |
| | | | | | | | |
ELECTRICAL EQUIPMENT–3.3% | | | | | | | | |
Prysmian SpA | | | 25,855 | | | | 1,654,625 | |
Rockwell Automation, Inc. | | | 12,711 | | | | 3,632,676 | |
| | | | | | | | |
| | | | | | | 5,287,301 | |
| | | | | | | | |
MACHINERY–0.9% | | | | | | | | |
TOMRA Systems ASA | | | 115,454 | | | | 1,494,103 | |
| | | | | | | | |
PROFESSIONAL SERVICES–2.9% | | | | | | | | |
Experian PLC | | | 54,228 | | | | 2,330,711 | |
RELX PLC (London) | | | 52,355 | | | | 2,372,151 | |
| | | | | | | | |
| | | | | | | 4,702,862 | |
| | | | | | | | |
| | | | | | | 29,706,254 | |
| | | | | | | | |
HEALTH CARE–13.6% | | | | | | | | |
HEALTH CARE EQUIPMENT & SUPPLIES–9.3% | | | | | | | | |
Alcon AG | | | 33,954 | | | | 2,878,875 | |
Becton Dickinson & Co. | | | 14,449 | | | | 3,278,044 | |
GE Healthcare, Inc. | | | 42,376 | | | | 3,312,956 | |
Hologic, Inc.(a) | | | 30,087 | | | | 2,168,972 | |
Terumo Corp. | | | 175,003 | | | | 3,378,561 | |
| | | | | | | | |
| | | | | | | 15,017,408 | |
| | | | | | | | |
HEALTH CARE PROVIDERS & SERVICES–2.0% | | | | | | | | |
Apollo Hospitals Enterprise Ltd. | | | 36,907 | | | | 3,140,278 | |
| | | | | | | | |
LIFE SCIENCES TOOLS & SERVICES–2.3% | | | | | | | | |
Bruker Corp.(b) | | | 21,258 | | | | 1,246,144 | |
ICON PLC(a) | | | 11,518 | | | | 2,415,440 | |
| | | | | | | | |
| | | | | | | 3,661,584 | |
| | | | | | | | |
| | | | | | | 21,819,270 | |
| | | | | | | | |
1
| | |
| SUSTAINABLE GLOBAL THEMATIC PORTFOLIO |
| PORTFOLIO OF INVESTMENTS | | |
| |
| (continued) | | AB Variable Products Series Fund |
| | | | | | | | |
Company | | Shares | | | U.S. $ Value | |
| | | | | | | | |
CONSUMER DISCRETIONARY–6.1% | | | | | | | | |
AUTOMOBILE COMPONENTS–1.5% | | | | | | | | |
Aptiv PLC(a) | | | 39,777 | | | $ | 2,405,713 | |
| | | | | | | | |
BROADLINE RETAIL–2.4% | | | | | | | | |
MercadoLibre, Inc.(a) | | | 2,264 | | | | 3,849,796 | |
| | | | | | | | |
TEXTILES, APPAREL & LUXURY GOODS–2.2% | | | | | | | | |
On Holding AG–Class A(a) | | | 66,238 | | | | 3,627,855 | |
| | | | | | | | |
| | | | | | | 9,883,364 | |
| | | | | | | | |
CONSUMER STAPLES–3.9% | | | | | | | | |
HOUSEHOLD PRODUCTS–1.9% | | | | | | | | |
Procter & Gamble Co. (The) | | | 18,238 | | | | 3,057,601 | |
| | | | | | | | |
PERSONAL CARE PRODUCTS–2.0% | | | | | | | | |
Unilever PLC (London) | | | 57,380 | | | | 3,260,365 | |
| | | | | | | | |
| | | | | | | 6,317,966 | |
| | | | | | | | |
UTILITIES–3.7% | | | | | | | | |
ELECTRIC UTILITIES–2.4% | | | | | | | | |
NextEra Energy, Inc. | | | 53,777 | | | | 3,855,273 | |
| | | | | | | | |
WATER UTILITIES–1.3% | | | | | | | | |
Cia de Saneamento Basico do Estado de Sao Paulo SABESP | | | 141,535 | | | | 2,024,553 | |
| | | | | | | | |
| | | | | | | 5,879,826 | |
| | | | | | | | |
Company | | Shares | | | U.S. $ Value | |
| | | | | | | | |
ENERGY–1.5% | | | | | | | | |
OIL, GAS & CONSUMABLE FUELS–1.5% | | | | | | | | |
Cameco Corp. (New York) | | | 46,500 | | | | 2,389,635 | |
| | | | | | | | |
Total Common Stocks
(cost $127,869,521) | | | | | | | 159,507,324 | |
| | | | | | | | |
SHORT-TERM INVESTMENTS–0.9% | | | | | | | | |
INVESTMENT COMPANIES–0.9% | | | | | | | | |
AB Fixed Income Shares, Inc.–Government Money Market Portfolio–Class AB, 4.43%(c)(d)(e)
(cost $1,471,050) | | | 1,471,050 | | | | 1,471,050 | |
| | | | | | | | |
TOTAL INVESTMENTS–100.1%
(cost $129,340,571) | | | | | | | 160,978,374 | |
Other assets less liabilities–(0.1)% | | | | | | | (108,690 | ) |
| | | | | | | | |
NET ASSETS–100.0% | | | | | | $ | 160,869,684 | |
| | | | | | | | |
FORWARD CURRENCY EXCHANGE CONTRACTS (see Note D)
| | | | | | | | | | | | | | | | | | | | | | | | |
| Counterparty | | Contracts to
Deliver
(000) | | | In Exchange
For
(000) | | | Settlement
Date | | | Unrealized
Appreciation
(Depreciation) | |
Bank of America, NA | | | BRL | | | | 20,930 | | | | USD | | | | 3,595 | | | | 01/03/2025 | | | $ | 207,075 | |
Bank of America, NA | | | USD | | | | 3,380 | | | | BRL | | | | 20,930 | | | | 01/03/2025 | | | | 7,906 | |
Bank of America, NA | | | GBP | | | | 8,823 | | | | USD | | | | 11,361 | | | | 01/16/2025 | | | | 316,578 | |
Bank of America, NA | | | CAD | | | | 2,056 | | | | USD | | | | 1,434 | | | | 02/05/2025 | | | | 2,395 | |
Bank of America, NA | | | USD | | | | 2,796 | | | | AUD | | | | 4,303 | | | | 02/05/2025 | | | | (132,996 | ) |
Bank of America, NA | | | USD | | | | 1,091 | | | | JPY | | | | 166,336 | | | | 02/21/2025 | | | | (28,588 | ) |
Bank of America, NA | | | TWD | | | | 55,900 | | | | USD | | | | 1,731 | | | | 02/27/2025 | | | | 29,925 | |
Barclays Bank PLC | | | USD | | | | 4,757 | | | | CNH | | | | 34,397 | | | | 01/23/2025 | | | | (68,292 | ) |
Citibank, NA | | | BRL | | | | 2,592 | | | | USD | | | | 431 | | | | 01/03/2025 | | | | 11,395 | |
Citibank, NA | | | USD | | | | 419 | | | | BRL | | | | 2,592 | | | | 01/03/2025 | | | | 979 | |
Citibank, NA | | | USD | | | | 2,268 | | | | KRW | | | | 3,037,523 | | | | 01/17/2025 | | | | (211,077 | ) |
Citibank, NA | | | BRL | | | | 3,044 | | | | USD | | | | 491 | | | | 02/04/2025 | | | | 1,093 | |
Citibank, NA | | | CAD | | | | 1,467 | | | | USD | | | | 1,025 | | | | 02/05/2025 | | | | 3,648 | |
Citibank, NA | | | USD | | | | 1,939 | | | | CAD | | | | 2,680 | | | | 02/05/2025 | | | | (72,524 | ) |
Deutsche Bank AG | | | USD | | | | 9,305 | | | | EUR | | | | 8,845 | | | | 02/27/2025 | | | | (121,195 | ) |
Goldman Sachs Bank USA | | | NOK | | | | 14,842 | | | | USD | | | | 1,342 | | | | 02/05/2025 | | | | 38,062 | |
HSBC Bank USA | | | BRL | | | | 2,539 | | | | USD | | | | 410 | | | | 01/03/2025 | | | | (959 | ) |
HSBC Bank USA | | | USD | | | | 413 | | | | BRL | | | | 2,539 | | | | 01/03/2025 | | | | (2,063 | ) |
2
| | |
| |
| | | AB Variable Products Series Fund |
| | | | | | | | | | | | | | | | | | | | | | | | |
| Counterparty | | Contracts to
Deliver
(000) | | | In Exchange
For
(000) | | | Settlement
Date | | | Unrealized
Appreciation
(Depreciation) | |
HSBC Bank USA | | | GBP | | | | 512 | | | | USD | | | | 641 | | | | 01/16/2025 | | | $ | 294 | |
HSBC Bank USA | | | USD | | | | 1,039 | | | | GBP | | | | 831 | | | | 01/16/2025 | | | | 1,083 | |
JPMorgan Chase Bank, NA | | | BRL | | | | 2,804 | | | | USD | | | | 455 | | | | 01/03/2025 | | | | 1,027 | |
JPMorgan Chase Bank, NA | | | USD | | | | 453 | | | | BRL | | | | 2,804 | | | | 01/03/2025 | | | | 1,059 | |
Morgan Stanley Capital Services, Inc. | | | BRL | | | | 23,787 | | | | USD | | | | 3,841 | | | | 01/03/2025 | | | | (8,985 | ) |
Morgan Stanley Capital Services, Inc. | | | USD | | | | 3,857 | | | | BRL | | | | 23,787 | | | | 01/03/2025 | | | | (6,774 | ) |
Morgan Stanley Capital Services, Inc. | | | KRW | | | | 594,327 | | | | USD | | | | 432 | | | | 01/17/2025 | | | | 29,491 | |
Morgan Stanley Capital Services, Inc. | | | BRL | | | | 23,787 | | | | USD | | | | 3,835 | | | | 02/04/2025 | | | | 7,182 | |
Morgan Stanley Capital Services, Inc. | | | USD | | | | 1,079 | | | | SEK | | | | 11,865 | | | | 02/05/2025 | | | | (4,237 | ) |
State Street Bank & Trust Co. | | | USD | | | | 415 | | | | GBP | | | | 329 | | | | 01/16/2025 | | | | (3,378 | ) |
State Street Bank & Trust Co. | | | CNH | | | | 3,012 | | | | USD | | | | 412 | | | | 01/23/2025 | | | | 1,239 | |
State Street Bank & Trust Co. | | | USD | | | | 462 | | | | SGD | | | | 622 | | | | 02/14/2025 | | | | (6,047 | ) |
State Street Bank & Trust Co. | | | USD | | | | 498 | | | | ZAR | | | | 9,091 | | | | 02/14/2025 | | | | (18,261 | ) |
State Street Bank & Trust Co. | | | USD | | | | 360 | | | | MXN | | | | 7,348 | | | | 02/20/2025 | | | | (10,524 | ) |
State Street Bank & Trust Co. | | | EUR | | | | 428 | | | | USD | | | | 445 | | | | 02/27/2025 | | | | 782 | |
UBS AG | | | HKD | | | | 21,089 | | | | USD | | | | 2,715 | | | | 02/21/2025 | | | | (1,460 | ) |
UBS AG | | | CHF | | | | 4,679 | | | | USD | | | | 5,278 | | | | 02/27/2025 | | | | 92,190 | |
| | | | | | | | | | | | | | | | | | | | | | | | |
| | | $ | 56,043 | |
| | | | | | | | | | | | | | | | | | | | | | | | |
| (a) | | Non-income producing security. |
| (b) | | Represents entire or partial securities out on loan. See Note E for securities lending information. |
| (c) | | Affiliated investments. |
| (d) | | The rate shown represents the 7-day yield as of period end. |
| (e) | | To obtain a copy of the fund’s shareholder report, please go to the Securities and Exchange Commission’s website at www.sec.gov, or call AB at (800) 227-4618. |
Currency Abbreviations:
AUD—Australian Dollar
BRL—Brazilian Real
CAD—Canadian Dollar
CHF—Swiss Franc
CNH—Chinese Yuan Renminbi (Offshore)
EUR—Euro
GBP—Great British Pound
HKD—Hong Kong Dollar
JPY—Japanese Yen
KRW—South Korean Won
MXN—Mexican Peso
NOK—Norwegian Krone
SEK—Swedish Krona
SGD—Singapore Dollar
TWD—New Taiwan Dollar
USD—United States Dollar
ZAR—South African Rand
See notes to financial statements.
3
| | |
| SUSTAINABLE GLOBAL THEMATIC PORTFOLIO |
| STATEMENT OF ASSETS & LIABILITIES | | |
| |
| December 31, 2024 | | AB Variable Products Series Fund |
| | | | |
ASSETS | |
Investments in securities, at value | | | | |
Unaffiliated issuers (cost $127,869,521) | | $ | 159,507,324 | (a) |
Affiliated issuers (cost $1,471,050) | | | 1,471,050 | |
Foreign currencies, at value (cost $211,341) | | | 206,955 | |
Unrealized appreciation on forward currency exchange contracts | | | 753,403 | |
Receivable for investment securities sold | | | 345,936 | |
Unaffiliated dividends receivable | | | 231,055 | |
Receivable for capital stock sold | | | 41,008 | |
Affiliated dividends receivable | | | 12,925 | |
Receivable due from Adviser | | | 7,275 | |
| | | | |
Total assets | | | 162,576,931 | |
| | | | |
LIABILITIES | |
Unrealized depreciation on forward currency exchange contracts | | | 697,360 | |
Payable for investment securities purchased and foreign currency transactions | | | 376,835 | |
Foreign capital gains tax payable | | | 294,167 | |
Advisory fee payable | | | 101,797 | |
Payable for capital stock redeemed | | | 55,531 | |
Administrative fee payable | | | 24,558 | |
Distribution fee payable | | | 20,812 | |
Transfer Agent fee payable | | | 167 | |
Directors’ fees payable | | | 27 | |
Accrued expenses | | | 135,993 | |
| | | | |
Total liabilities | | | 1,707,247 | |
| | | | |
NET ASSETS | | $ | 160,869,684 | |
| | | | |
COMPOSITION OF NET ASSETS | | | | |
Capital stock, at par | | $ | 4,778 | |
Additional paid-in capital | | | 109,655,482 | |
Distributable earnings | | | 51,209,424 | |
| | | | |
NET ASSETS | | $ | 160,869,684 | |
| | | | |
Net Asset Value Per Share—1 billion shares of capital stock authorized, $.001 par value
| | | | | | | | | | | | |
| Class | | Net Assets | | | Shares
Outstanding | | | Net Asset
Value | |
| | | |
| A | | $ | 62,599,495 | | | | 1,781,923 | | | $ | 35.13 | |
| | | |
| B | | $ | 98,270,189 | | | | 2,996,194 | | | $ | 32.80 | |
| (a) | | Includes securities on loan with a value of $105,106 (see Note E). |
See notes to financial statements.
4
| | |
| SUSTAINABLE GLOBAL THEMATIC PORTFOLIO |
| STATEMENT OF OPERATIONS | | |
| |
| Year Ended December 31, 2024 | | AB Variable Products Series Fund |
| | | | |
INVESTMENT INCOME | | | | |
Dividends | | | | |
Unaffiliated issuers (net of foreign taxes withheld of $103,573) | | $ | 1,656,582 | |
Affiliated issuers | | | 164,770 | |
Interest | | | 839 | |
Securities lending income | | | 601 | |
| | | | |
| | | 1,822,792 | |
| | | | |
EXPENSES | | | | |
Advisory fee (see Note B) | | | 1,266,756 | |
Distribution fee—Class B | | | 263,388 | |
Transfer agency—Class A | | | 2,107 | |
Transfer agency—Class B | | | 3,488 | |
Administrative | | | 95,231 | |
Custody and accounting | | | 66,276 | |
Audit and tax | | | 60,867 | |
Printing | | | 49,348 | |
Legal | | | 38,001 | |
Directors’ fees | | | 22,889 | |
Miscellaneous | | | 19,400 | |
| | | | |
Total expenses | | | 1,887,751 | |
Less: expenses waived and reimbursed by the Adviser (see Note B) | | | (90,117 | ) |
| | | | |
Net expenses | | | 1,797,634 | |
| | | | |
Net investment income | | | 25,158 | |
| | | | |
REALIZED AND UNREALIZED GAIN (LOSS) ON INVESTMENT AND FOREIGN CURRENCY TRANSACTIONS | | | | |
Net realized gain (loss) on: | | | | |
Investment transactions(a) | | | 20,806,189 | |
Forward currency exchange contracts | | | (527,949 | ) |
Foreign currency transactions | | | (96,659 | ) |
Net change in unrealized appreciation (depreciation) of: | | | | |
Investments(b) | | | (9,922,965 | ) |
Forward currency exchange contracts | | | 7,840 | |
Foreign currency denominated assets and liabilities | | | (30,097 | ) |
| | | | |
Net gain on investment and foreign currency transactions | | | 10,236,359 | |
| | | | |
NET INCREASE IN NET ASSETS FROM OPERATIONS | | $ | 10,261,517 | |
| | | | |
| (a) | | Net of foreign realized capital gains taxes of $7,261. |
| (b) | | Net of increase in accrued foreign capital gains taxes on unrealized gains of $114,337. |
See notes to financial statements.
5
| | |
|
| SUSTAINABLE GLOBAL THEMATIC PORTFOLIO |
| |
| STATEMENT OF CHANGES IN NET ASSETS | | AB Variable Products Series Fund |
| | | | | | | | |
| | | Year Ended
December 31,
2024 | | | Year Ended
December 31,
2023 | |
INCREASE (DECREASE) IN NET ASSETS FROM OPERATIONS | | | | | | | | |
Net investment income | | $ | 25,158 | | | $ | 242,988 | |
Net realized gain on investment and foreign currency transactions | | | 20,181,581 | | | | 864,038 | |
Net change in unrealized appreciation (depreciation) of investments and foreign currency denominated assets and liabilities | | | (9,945,222 | ) | | | 22,130,507 | |
| | | | | | | | |
Net increase in net assets from operations | | | 10,261,517 | | | | 23,237,533 | |
Distributions to Shareholders | | | | | | | | |
Class A | | | (180,118 | ) | | | (3,403,390 | ) |
Class B | | | (318,763 | ) | | | (6,377,144 | ) |
CAPITAL STOCK TRANSACTIONS | | | | | | | | |
Net decrease | | | (12,638,265 | ) | | | (2,769,396 | ) |
| | | | | | | | |
Total increase (decrease) | | | (2,875,629 | ) | | | 10,687,603 | |
NET ASSETS | | | | | | | | |
Beginning of period | | | 163,745,313 | | | | 153,057,710 | |
| | | | | | | | |
End of period | | $ | 160,869,684 | | | $ | 163,745,313 | |
| | | | | | | | |
See notes to financial statements.
6
| | |
| SUSTAINABLE GLOBAL THEMATIC PORTFOLIO |
| NOTES TO FINANCIAL STATEMENTS | | |
| |
| December 31, 2024 | | AB Variable Products Series Fund |
NOTE A: Significant Accounting Policies
The AB Sustainable Global Thematic Portfolio (the “Portfolio”) (formerly known as AB Global Thematic Growth Portfolio) is a series of AB Variable Products Series Fund, Inc. (the “Fund”). The Portfolio’s investment objective is long-term growth of capital. The Portfolio is diversified as defined under the Investment Company Act of 1940 (the “1940 Act”). The Fund was incorporated in the State of Maryland as an open-end series investment company. The Fund offers nine separately managed pools of assets which have differing investment objectives and policies. The Portfolio offers Class A and Class B shares. Both classes of shares have identical voting, dividend, liquidating and other rights, except that Class B shares bear a distribution expense and have exclusive voting rights with respect to the Class B distribution plan.
The Portfolio offers and sells its shares only to separate accounts of certain life insurance companies for the purpose of funding variable annuity contracts and variable life insurance policies. Sales are made without a sales charge at the Portfolio’s net asset value per share.
The financial statements have been prepared in conformity with U.S. generally accepted accounting principles (“U.S. GAAP”), which require management to make certain estimates and assumptions that affect the reported amounts of assets and liabilities in the financial statements and amounts of income and expenses during the reporting period. Actual results could differ from those estimates. The Portfolio is an investment company under U.S. GAAP and follows the accounting and reporting guidance applicable to investment companies. The following is a summary of significant accounting policies followed by the Portfolio.
1. Security Valuation
Portfolio securities are valued at market value determined on the basis of market quotations or, if market quotations are not readily available or are unreliable, at “fair value” as determined in accordance with procedures approved by and under the oversight of the Fund’s Board of Directors (the “Board”). Pursuant to these procedures, AllianceBernstein L.P. (the “Adviser”) serves as the Portfolio’s valuation designee pursuant to Rule 2a-5 of the 1940 Act. In this capacity, the Adviser is responsible, among other things, for making all fair value determinations relating to the Portfolio’s portfolio investments, subject to the Board’s oversight.
In general, the market values of securities which are readily available and deemed reliable are determined as follows: securities listed on a national securities exchange (other than securities listed on the NASDAQ Stock Market, Inc. (“NASDAQ”)) or on a foreign securities exchange are valued at the last sale price at the close of the exchange or foreign securities exchange. If there has been no sale on such day, the securities are valued at the last traded price from the previous day. Securities listed on more than one exchange are valued by reference to the principal exchange on which the securities are traded; securities listed only on NASDAQ are valued in accordance with the NASDAQ Official Closing Price; listed or over the counter (“OTC”) market put or call options are valued at the mid level between the current bid and ask prices. If either a current bid or current ask price is unavailable, the Adviser will have discretion to determine the best valuation (e.g., last trade price in the case of listed options); open futures are valued using the closing settlement price or, in the absence of such a price, the most recent quoted bid price. If there are no quotations available for the day of valuation, the last available closing settlement price is used; U.S. Government securities and any other debt instruments having 60 days or less remaining until maturity are generally valued at market by an independent pricing vendor, if a market price is available. If a market price is not available, the securities are valued at amortized cost. This methodology is commonly used for short term securities that have an original maturity of 60 days or less, as well as short term securities that had an original term to maturity that exceeded 60 days. In instances when amortized cost is utilized, the Valuation Committee (the “Committee”) must reasonably conclude that the utilization of amortized cost is approximately the same as the fair value of the security. Factors the Committee will consider include, but are not limited to, an impairment of the creditworthiness of the issuer or material changes in interest rates. Fixed-income securities, including mortgage-backed and asset-backed securities, may be valued on the basis of prices provided by a pricing service or at a price obtained from one or more of the major broker-dealers. In cases where broker-dealer quotes are obtained, the Adviser may establish procedures whereby changes in market yields or spreads are used to adjust, on a daily basis, a recently obtained quoted price on a security. Swaps and other derivatives are valued daily, primarily using independent pricing services, independent pricing models using market inputs, as well as third party broker-dealers or counterparties. Open-end mutual funds are valued at the closing net asset value per share, while exchange-traded funds are valued at the closing market price per share.
Securities for which market quotations are not readily available (including restricted securities) or are deemed unreliable are valued at fair value as deemed appropriate by the Adviser. Factors considered in making this determination may include, but
7
| | |
| SUSTAINABLE GLOBAL THEMATIC PORTFOLIO |
| NOTES TO FINANCIAL STATEMENTS | | |
| |
| (continued) | | AB Variable Products Series Fund |
are not limited to, information obtained by contacting the issuer, analysts, analysis of the issuer’s financial statements or other available documents. In addition, the Portfolio may use fair value pricing for securities primarily traded in non-U.S. markets because most foreign markets close well before the Portfolio values its securities at 4:00 p.m., Eastern Time. The earlier close of these foreign markets gives rise to the possibility that significant events, including broad market moves, may have occurred in the interim and may materially affect the value of those securities. To account for this, the Portfolio generally values many of its foreign equity securities using fair value prices based on third party vendor modeling tools to the extent available.
2. Fair Value Measurements
In accordance with U.S. GAAP regarding fair value measurements, fair value is defined as the price that the Portfolio would receive to sell an asset or pay to transfer a liability in an orderly transaction between market participants at the measurement date. U.S. GAAP establishes a framework for measuring fair value, and a three-level hierarchy for fair value measurements based upon the transparency of inputs to the valuation of an asset or liability (including those valued based on their market values as described in Note A.1 above). Inputs may be observable or unobservable and refer broadly to the assumptions that market participants would use in pricing the asset or liability. Observable inputs reflect the assumptions market participants would use in pricing the asset or liability based on market data obtained from sources independent of the Portfolio. Unobservable inputs reflect the Portfolio’s own assumptions about the assumptions that market participants would use in pricing the asset or liability based on the best information available in the circumstances. Each investment is assigned a level based upon the observability of the inputs which are significant to the overall valuation. The three-tier hierarchy of inputs is summarized below.
| | • | | Level 1—quoted prices in active markets for identical investments |
| | • | | Level 2—other significant observable inputs (including quoted prices for similar investments, interest rates, prepayment speeds, credit risk, etc.) |
| | • | | Level 3—significant unobservable inputs (including the Portfolio’s own assumptions in determining the fair value of investments) |
The fair value of debt instruments, such as bonds, and over-the-counter derivatives is generally based on market price quotations, recently executed market transactions (where observable) or industry recognized modeling techniques and are generally classified as Level 2. Pricing vendor inputs to Level 2 valuations may include quoted prices for similar investments in active markets, interest rate curves, coupon rates, currency rates, yield curves, option adjusted spreads, default rates, credit spreads and other unique security features in order to estimate the relevant cash flows which are then discounted to calculate fair values. If these inputs are unobservable and significant to the fair value, these investments will be classified as Level 3.
Where readily available market prices or relevant bid prices are not available for certain equity investments, such investments may be valued based on similar publicly traded investments, movements in relevant indices since last available prices or based upon underlying company fundamentals and comparable company data (such as multiples to earnings or other multiples to equity). Where an investment is valued using an observable input, such as another publicly traded security, the investment will be classified as Level 2. If management determines that an adjustment is appropriate based on restrictions on resale, illiquidity or uncertainty, and such adjustment is a significant component of the valuation, the investment will be classified as Level 3. An investment will also be classified as Level 3 where management uses company fundamentals and other significant inputs to determine the valuation.
8
| | |
| |
| | | AB Variable Products Series Fund |
The following table summarizes the valuation of the Portfolio’s investments by the above fair value hierarchy levels as of December 31, 2024:
| | | | | | | | | | | | | | | | |
| | | Level 1 | | | Level 2 | | | Level 3 | | | Total | |
Investments in Securities: | | | | | | | | | | | | | | | | |
Assets: | | | | | | | | | | | | | | | | |
Common Stocks: | | | | | | | | | | | | | | | | |
Information Technology | | $ | 40,263,982 | | | $ | 12,572,013 | | | $ | –0 | – | | $ | 52,835,995 | |
Financials | | | 20,172,828 | | | | 10,502,186 | | | | –0 | – | | | 30,675,014 | |
Industrials | | | 21,854,664 | | | | 7,851,590 | | | | –0 | – | | | 29,706,254 | |
Health Care | | | 12,421,556 | | | | 9,397,714 | | | | –0 | – | | | 21,819,270 | |
Consumer Discretionary | | | 9,883,364 | | | | –0 | – | | | –0 | – | | | 9,883,364 | |
Consumer Staples | | | 3,057,601 | | | | 3,260,365 | | | | –0 | – | | | 6,317,966 | |
Utilities | | | 3,855,273 | | | | 2,024,553 | | | | –0 | – | | | 5,879,826 | |
Energy | | | 2,389,635 | | | | –0 | – | | | –0 | – | | | 2,389,635 | |
Short-Term Investments | | | 1,471,050 | | | | –0 | – | | | –0 | – | | | 1,471,050 | |
| | | | | | | | | | | | | | | | |
Total Investments in Securities | | | 115,369,953 | | | | 45,608,421 | (a) | | | –0 | – | | | 160,978,374 | |
Other Financial Instruments(b): | | | | | | | | | | | | | | | | |
Assets: | | | | | | | | | | | | | | | | |
Forward Currency Exchange Contracts | | | –0 | – | | | 753,403 | | | | –0 | – | | | 753,403 | |
Liabilities: | | | | | | | | | | | | | | | | |
Forward Currency Exchange Contracts | | | –0 | – | | | (697,360 | ) | | | –0 | – | | | (697,360 | ) |
| | | | | | | | | | | | | | | | |
Total | | $ | 115,369,953 | | | $ | 45,664,464 | | | $ | –0 | – | | $ | 161,034,417 | |
| | | | | | | | | | | | | | | | |
| (a) | | A significant portion of the Portfolio’s foreign equity investments are categorized as Level 2 investments since they are valued using fair value prices based on third party vendor modeling tools to the extent available, see Note A.1. |
| (b) | | Other financial instruments include derivative instruments, such as futures, forwards and swaps. Derivative instruments are valued at the unrealized appreciation (depreciation) on the instrument. Other financial instruments may also include swaps with upfront premiums, written options and written swaptions which are valued at market value. |
3. Currency Translation
Assets and liabilities denominated in foreign currencies and commitments under forward currency exchange contracts are translated into U.S. dollars at the mean of the quoted bid and ask prices of such currencies against the U.S. dollar. Purchases and sales of portfolio securities are translated into U.S. dollars at the rates of exchange prevailing when such securities were acquired or sold. Income and expenses are translated into U.S. dollars at rates of exchange prevailing when accrued.
Net realized gain or loss on foreign currency transactions represents foreign exchange gains and losses from sales and maturities of foreign fixed income investments, holding of foreign currencies, currency gains or losses realized between the trade and settlement dates on foreign investment transactions, and the difference between the amounts of dividends, interest and foreign withholding taxes recorded on the Portfolio’s books and the U.S. dollar equivalent amounts actually received or paid. Net unrealized currency gains and losses from valuing foreign currency denominated assets and liabilities at period end exchange rates are reflected as a component of net unrealized appreciation or depreciation of foreign currency denominated assets and liabilities.
4. Taxes
It is the Portfolio’s policy to meet the requirements of the Internal Revenue Code applicable to regulated investment companies and to distribute all of its investment company taxable income and net realized gains, if any, to shareholders. Therefore, no provisions for federal income or excise taxes are required. The Portfolio may be subject to taxes imposed by countries in which it invests. Such taxes are generally based on income and/or capital gains earned or repatriated. Taxes are accrued and applied to net investment income, net realized gains and net unrealized appreciation/depreciation as such income and/or gains are earned.
In accordance with U.S. GAAP requirements regarding accounting for uncertainties in income taxes, management has analyzed the Portfolio’s tax positions taken or expected to be taken on federal and state income tax returns for all open tax years (the current and the prior three tax years) and has concluded that no provision for income tax is required in the Portfolio’s financial statements.
9
| | |
| SUSTAINABLE GLOBAL THEMATIC PORTFOLIO |
| NOTES TO FINANCIAL STATEMENTS | | |
| |
| (continued) | | AB Variable Products Series Fund |
5. Investment Income and Investment Transactions
Dividend income is recorded on the ex-dividend date or as soon as the Portfolio is informed of the dividend. Interest income is accrued daily. Investment transactions are accounted for on the date the securities are purchased or sold. Investment gains or losses are determined on the identified cost basis. Non-cash dividends, if any, are recorded on the ex-dividend date at the fair value of the securities received. The Portfolio amortizes premiums and accretes discounts as adjustments to interest income. The Portfolio accounts for distributions received from real estate investment trust (“REIT”) investments or from regulated investment companies as dividend income, realized gain, or return of capital based on information provided by the REIT or the investment company.
6. Class Allocations
All income earned and expenses incurred by the Portfolio are borne on a pro-rata basis by each outstanding class of shares, based on the proportionate interest in the Portfolio represented by the net assets of such class, except for class specific expenses which are allocated to the respective class. Expenses of the Fund are charged proportionately to each portfolio or based on other appropriate methods. Realized and unrealized gains and losses are allocated among the various share classes based on respective net assets.
7. Dividends and Distributions
Dividends and distributions to shareholders, if any, are recorded on the ex-dividend date. Income dividends and capital gains distributions are determined in accordance with federal tax regulations and may differ from those determined in accordance with U.S. GAAP. To the extent these differences are permanent, such amounts are reclassified within the capital accounts based on their federal tax basis treatment; temporary differences do not require such reclassification.
8. Cash and Short-Term Investments
Cash and short-term investments include cash on hand and short-term investments with maturities of less than one year when purchased.
9. Segment Information
The Portfolio represents a single operating segment. An operating segment is defined in U.S. GAAP as a component of a public entity that engages in business activities from which it may recognize revenues and incur expenses, has operating results that are regularly reviewed by the public entity’s chief operating decision maker (“CODM”) to make decisions about resources to be allocated to the segment and assess its performance, and has discrete financial information available. The Portfolio’s President is the CODM. The CODM monitors the operating results of the Portfolio as a whole and the pre-determined Portfolio’s long term investment strategy, which is executed by the portfolio management group. The qualitative and quantitative information contained within the financial statements is used by the CODM to assess the segments performance versus the Portfolio’s comparative benchmark and to make resource allocation decisions. Segment assets are reflected on the statement of assets and liabilities and segment expenses are listed on the statement of operations.
NOTE B: Advisory Fee and Other Transactions with Affiliates
Under the terms of the investment advisory agreement, the Portfolio pays the Adviser an advisory fee at an annual rate of .75% of the first $2.5 billion, .65% of the next $2.5 billion and .60% in excess of $5 billion, of the Portfolio’s average daily net assets. The fee is accrued daily and paid monthly. The Adviser has contractually agreed to waive its management fee and/or bear expenses of the Portfolio in order to reduce the Portfolio’s total operating expenses by an amount equal to .05% on an annual basis of the average net assets for Class A and Class B. For the year ended December 31, 2024, such reimbursements/waivers amounted to $84,451. This fee waiver and/or expense reimbursement agreement extends through May 1, 2025 and then may be extended by the Adviser for additional one-year terms.
Pursuant to the investment advisory agreement, the Portfolio may reimburse the Adviser for certain legal and accounting services provided to the Portfolio by the Adviser. For the year ended December 31, 2024, the reimbursement for such services amounted to $95,231.
The Portfolio compensates AllianceBernstein Investor Services, Inc. (“ABIS”), a wholly-owned subsidiary of the Adviser, under a Transfer Agency Agreement for providing personnel and facilities to perform transfer agency services for the Portfolio. Such compensation retained by ABIS amounted to $1,950 for the year ended December 31, 2024.
The Portfolio may invest in AB Government Money Market Portfolio which has a contractual annual advisory fee rate of .20% of the portfolio’s average daily net assets and bears its own expenses. The Adviser had contractually agreed to waive .10% of the advisory fee of AB Government Money Market Portfolio (resulting in a net advisory fee of .10%) until
10
| | |
| |
| | | AB Variable Products Series Fund |
August 31, 2023. Effective September 1, 2023, the Adviser has contractually agreed to waive .05% of the advisory fee of AB Government Money Market Portfolio (resulting in a net advisory fee of .15%) until August 31, 2024. In connection with the investment by the Portfolio in AB Government Money Market Portfolio, the Adviser has contractually agreed to waive its advisory fee from the Portfolio in an amount equal to the Portfolio’s pro rata share of the effective advisory fee of AB Government Money Market Portfolio, as borne indirectly by the Portfolio as an acquired fund fee and expense. For the year ended December 31, 2024, such waiver amounted to $5,666.
A summary of the Portfolio’s transactions in AB mutual funds for the year ended December 31, 2024 is as follows:
| | | | | | | | | | | | | | | | | | | | |
Portfolio | | Market Value
12/31/23
(000) | | | Purchases
at Cost
(000) | | | Sales
Proceeds
(000) | | | Market Value
12/31/24
(000) | | | Dividend
Income
(000) | |
AB Government Money Market Portfolio | | $ | 536 | | | $ | 49,951 | | | $ | 49,016 | | | $ | 1,471 | | | $ | 165 | |
NOTE C: Distribution Plan
The Portfolio has adopted a Distribution Plan (the “Plan”) for Class B shares pursuant to Rule 12b-1 under the 1940 Act. Under the Plan, the Portfolio pays distribution and servicing fees to AllianceBernstein Investments, Inc. (the “Distributor”), a wholly-owned subsidiary of the Adviser, at an annual rate of up to .50% of the Portfolio’s average daily net assets attributable to Class B shares. The fees are accrued daily and paid monthly. The Board currently limits payments under the Plan to .25% of the Portfolio’s average daily net assets attributable to Class B shares. The Plan provides that the Distributor will use such payments in their entirety for distribution assistance and promotional activities.
The Portfolio is not obligated under the Plan to pay any distribution and servicing fees in excess of the amounts set forth above. The purpose of the payments to the Distributor under the Plan is to compensate the Distributor for its distribution services with respect to the sale of the Portfolio’s Class B shares. Since the Distributor’s compensation is not directly tied to its expenses, the amount of compensation received by it under the Plan during any year may be more or less than its actual expenses. For this reason, the Plan is characterized by the staff of the Securities and Exchange Commission as being of the “compensation” variety.
In the event that the Plan is terminated or not continued, no distribution or servicing fees (other than current amounts accrued but not yet paid) would be owed by the Portfolio to the Distributor.
The Plan also provides that the Adviser may use its own resources to finance the distribution of the Portfolio’s shares.
NOTE D: Investment Transactions
Purchases and sales of investment securities (excluding short-term investments) for the year ended December 31, 2024 were as follows:
| | | | | | | | |
| | | Purchases | | | Sales | |
Investment securities (excluding U.S. government securities) | | $ | 76,897,020 | | | $ | 91,179,898 | |
U.S. government securities | | | –0 | – | | | –0 | – |
The cost of investments for federal income tax purposes, gross unrealized appreciation and unrealized depreciation are as follows:
| | | | |
Cost | | $ | 129,582,280 | |
| | | | |
Gross unrealized appreciation | | $ | 37,475,541 | |
Gross unrealized depreciation | | | (6,056,983 | ) |
| | | | |
Net unrealized appreciation | | $ | 31,418,558 | |
| | | | |
1. Derivative Financial Instruments
The Portfolio may use derivatives in an effort to earn income and enhance returns, to replace more traditional direct investments, to obtain exposure to otherwise inaccessible markets (collectively, “investment purposes”), or to hedge or adjust the risk profile of its portfolio.
The principal type of derivative utilized by the Portfolio, as well as the methods in which they may be used are:
| | • | | Forward Currency Exchange Contracts |
The Portfolio may enter into forward currency exchange contracts in order to hedge its exposure to changes in foreign currency exchange rates on its foreign portfolio holdings, to hedge certain firm purchase and sale
11
| | |
| SUSTAINABLE GLOBAL THEMATIC PORTFOLIO |
| NOTES TO FINANCIAL STATEMENTS | | |
| |
| (continued) | | AB Variable Products Series Fund |
commitments denominated in foreign currencies and for non-hedging purposes as a means of making direct investments in foreign currencies, as described below under “Currency Transactions”.
A forward currency exchange contract is a commitment to purchase or sell a foreign currency at a future date at a negotiated forward rate. The gain or loss arising from the difference between the original contract and the closing of such contract would be included in net realized gain or loss on forward currency exchange contracts. Fluctuations in the value of open forward currency exchange contracts are recorded for financial reporting purposes as unrealized appreciation and/or depreciation by the Portfolio. Risks may arise from the potential inability of a counterparty to meet the terms of a contract and from unanticipated movements in the value of a foreign currency relative to the U.S. dollar.
During the year ended December 31, 2024, the Portfolio held forward currency exchange contracts for hedging purposes.
The Portfolio typically enters into International Swaps and Derivatives Association, Inc. Master Agreements (“ISDA Master Agreement”) with its OTC derivative contract counterparties in order to, among other things, reduce its credit risk to OTC counterparties. ISDA Master Agreements include provisions for general obligations, representations, collateral and events of default or termination. Under an ISDA Master Agreement, the Portfolio typically may offset with the OTC counterparty certain derivative financial instruments’ payables and/or receivables with collateral held and/or posted and create one single net payment (close-out netting) in the event of default or termination. In the event of a default by an OTC counterparty, the return of collateral with market value in excess of the Portfolio’s net liability, held by the defaulting party, may be delayed or denied.
The Portfolio’s ISDA Master Agreements may contain provisions for early termination of OTC derivative transactions in the event the net assets of the Portfolio decline below specific levels (“net asset contingent features”). If these levels are triggered, the Portfolio’s OTC counterparty has the right to terminate such transaction and require the Portfolio to pay or receive a settlement amount in connection with the terminated transaction. If OTC derivatives were held at period end, please refer to netting arrangements by the OTC counterparty table below for additional details.
During the year ended December 31, 2024, the Portfolio had entered into the following derivatives:
| | | | | | | | | | | | |
| | | Asset Derivatives | | | Liability Derivatives | |
Derivative Type | | Statement of
Assets and Liabilities
Location | | Fair Value | | | Statement of
Assets and Liabilities
Location | | Fair Value | |
Foreign currency contracts | | Unrealized appreciation on forward currency exchange contracts | | $ | 753,403 | | | Unrealized depreciation on forward currency exchange contracts | | $ | 697,360 | |
| | | | | | | | | | | | |
Total | | | | $ | 753,403 | | | | | $ | 697,360 | |
| | | | | | | | | | | | |
| | | | | | | | | | |
Derivative Type | | Location of Gain or (Loss) on Derivatives
Within Statement of Operations | | Realized Gain or
(Loss) on
Derivatives | | | Change in Unrealized
Appreciation or
(Depreciation) | |
Foreign currency contracts | | Net realized gain (loss) on forward currency exchange contracts; Net change in unrealized appreciation (depreciation) of forward currency exchange contracts | | $ | (527,949 | ) | | $ | 7,840 | |
| | | | | | | | | | |
Total | | | | $ | (527,949 | ) | | $ | 7,840 | |
| | | | | | | | | | |
The following table represents the average monthly volume of the Portfolio’s derivative transactions during the year ended December 31, 2024:
| | | | |
Forward Currency Exchange Contracts: | | | | |
Average principal amount of buy contracts | | $ | 30,846,556 | |
Average principal amount of sale contracts | | $ | 28,840,507 | |
For financial reporting purposes, the Portfolio does not offset derivative assets and derivative liabilities that are subject to netting arrangements in the statement of assets and liabilities.
12
| | |
| |
| | | AB Variable Products Series Fund |
All OTC derivatives held at period end were subject to netting arrangements. The following table presents the Portfolio’s derivative assets and liabilities by OTC counterparty net of amounts available for offset under ISDA Master Agreements (“MA”) and net of the related collateral received/pledged by the Portfolio as of December 31, 2024. Exchange-traded derivatives and centrally cleared swaps are not subject to netting arrangements and as such are excluded from the table.
| | | | | | | | | | | | | | | | | | | | |
Counterparty | | Derivative Assets
Subject to a MA | | | Derivatives
Available for
Offset | | | Cash Collateral
Received* | | | Security Collateral
Received* | | | Net Amount of
Derivative Assets | |
Bank of America, NA | | $ | 563,879 | | | $ | (161,584 | ) | | $ | –0 | – | | $ | –0 | – | | $ | 402,295 | |
Citibank, NA | | | 17,115 | | | | (17,115 | ) | | | –0 | – | | | –0 | – | | | –0 | – |
Goldman Sachs Bank USA | | | 38,062 | | | | –0 | – | | | –0 | – | | | –0 | – | | | 38,062 | |
HSBC Bank USA | | | 1,377 | | | | (1,377 | ) | | | –0 | – | | | –0 | – | | | –0 | – |
JPMorgan Chase Bank, NA | | | 2,086 | | | | –0 | – | | | –0 | – | | | –0 | – | | | 2,086 | |
Morgan Stanley Capital Services, Inc. | | | 36,673 | | | | (19,996 | ) | | | –0 | – | | | –0 | – | | | 16,677 | |
State Street Bank & Trust Co. | | | 2,021 | | | | (2,021 | ) | | | –0 | – | | | –0 | – | | | –0 | – |
UBS AG | | | 92,190 | | | | (1,460 | ) | | | –0 | – | | | –0 | – | | | 90,730 | |
| | | | | | | | | | | | | | | | | | | | |
Total | | $ | 753,403 | | | $ | (203,553 | ) | | $ | –0 | – | | $ | –0 | – | | $ | 549,850 | ^ |
| | | | | | | | | | | | | | | | | | | | |
| | | | | |
Counterparty | | Derivative Liabilities
Subject to a MA | | | Derivatives
Available for
Offset | | | Cash Collateral
Pledged* | | | Security Collateral
Pledged* | | | Net Amount of
Derivative Liabilities | |
Bank of America, NA | | $ | 161,584 | | | $ | (161,584 | ) | | $ | –0 | – | | $ | –0 | – | | $ | –0 | – |
Barclays Bank PLC | | | 68,292 | | | | –0 | – | | | –0 | – | | | –0 | – | | | 68,292 | |
Citibank, NA | | | 283,601 | | | | (17,115 | ) | | | –0 | – | | | –0 | – | | | 266,486 | |
Deutsche Bank AG | | | 121,195 | | | | –0 | – | | | –0 | – | | | –0 | – | | | 121,195 | |
HSBC Bank USA | | | 3,022 | | | | (1,377 | ) | | | –0 | – | | | –0 | – | | | 1,645 | |
Morgan Stanley Capital Services, Inc. | | | 19,996 | | | | (19,996 | ) | | | –0 | – | | | –0 | – | | | –0 | – |
State Street Bank & Trust Co. | | | 38,210 | | | | (2,021 | ) | | | –0 | – | | | –0 | – | | | 36,189 | |
UBS AG | | | 1,460 | | | | (1,460 | ) | | | –0 | – | | | –0 | – | | | –0 | – |
| | | | | | | | | | | | | | | | | | | | |
Total | | $ | 697,360 | | | $ | (203,553 | ) | | $ | –0 | – | | $ | –0 | – | | $ | 493,807 | ^ |
| | | | | | | | | | | | | | | | | | | | |
| * | | The actual collateral received/pledged may be more than the amount reported due to over-collateralization. |
| ^ | | Net amount represents the net receivable/payable that would be due from/to the counterparty in the event of default or termination. The net amount from OTC financial derivative instruments can only be netted across transactions governed under the same master agreement with the same counterparty. |
2. Currency Transactions
The Portfolio may invest in non-U.S. Dollar-denominated securities on a currency hedged or unhedged basis. The Portfolio may seek investment opportunities by taking long or short positions in currencies through the use of currency-related derivatives, including forward currency exchange contracts, futures and options on futures, swaps, and other options. The Portfolio may enter into transactions for investment opportunities when it anticipates that a foreign currency will appreciate or depreciate in value but securities denominated in that currency are not held by the Portfolio and do not present attractive investment opportunities. Such transactions may also be used when the Adviser believes that it may be more efficient than a direct investment in a foreign currency-denominated security. The Portfolio may also conduct currency exchange contracts on a spot basis (i.e., for cash at the spot rate prevailing in the currency exchange market for buying or selling currencies).
NOTE E: Securities Lending
The Portfolio may enter into securities lending transactions. Under the Portfolio’s securities lending program, all loans of securities will be collateralized continually by cash collateral and/or non-cash collateral. Non-cash collateral will include only securities issued or guaranteed by the U.S. government or its agencies or instrumentalities. If the Portfolio cannot sell or repledge any non-cash collateral, such collateral will not be reflected in the portfolio of investments. If a loan is collateralized by cash, the Portfolio will be compensated for the loan from a portion of the net return from the income earned on cash collateral after a rebate is paid to the borrower (in some cases, this rebate may be a “negative rebate” or fee paid by the borrower to the Portfolio in connection with the loan), and payments are made for fees of the securities lending agent and for
13
| | |
| SUSTAINABLE GLOBAL THEMATIC PORTFOLIO |
| NOTES TO FINANCIAL STATEMENTS | | |
| |
| (continued) | | AB Variable Products Series Fund |
certain other administrative expenses. If the Portfolio receives non-cash collateral, the Portfolio will receive a fee from the borrower generally equal to a negotiated percentage of the market value of the loaned securities. The Portfolio will have the right to call a loan and obtain the securities loaned at any time on notice to the borrower within the normal and customary settlement time for the securities. While the securities are on loan, the borrower is obligated to pay the Portfolio amounts equal to any dividend income or other distributions from the securities; however, these distributions will not be afforded the same preferential tax treatment as qualified dividends. The Portfolio will not be able to exercise voting rights with respect to any securities during the existence of a loan, but will have the right to regain ownership of loaned securities in order to exercise voting or other ownership rights. Collateral received and securities loaned are marked to market daily to ensure that the securities loaned are secured by collateral. The lending agent currently invests the cash collateral received in AB Government Money Market Portfolio, an eligible money market vehicle, in accordance with the investment restrictions of the Portfolio, and as approved by the Board. The collateral received on securities loaned is recorded as an asset as well as a corresponding liability in the statement of assets and liabilities. The collateral will be adjusted the next business day to maintain the required collateral amount. The amounts of securities lending income from the borrowers and AB Government Money Market Portfolio are reflected in the statement of operations. When the Portfolio earns net securities lending income from AB Government Money Market Portfolio, the income is inclusive of a rebate expense paid to the borrower. In connection with the cash collateral investment by the Portfolio in AB Government Money Market Portfolio, the Adviser has agreed to waive a portion of the Portfolio’s share of the advisory fees of AB Government Money Market Portfolio, as borne indirectly by the Portfolio as an acquired fund fee and expense. When the Portfolio lends securities, its investment performance will continue to reflect changes in the value of the securities loaned. A principal risk of lending portfolio securities is that the borrower may fail to return the loaned securities upon termination of the loan and that the collateral will not be sufficient to replace the loaned securities. The lending agent has agreed to indemnify the Portfolio in the case of default of any securities borrower.
A summary of the Portfolio’s transactions surrounding securities lending for the year ended December 31, 2024 is as follows:
| | | | | | | | | | | | | | | | | | | | | | |
| | | | | | | | | | | | | AB Government Money Market
Portfolio | |
Market Value of
Securities on Loan* | | | Cash Collateral* | | | Market Value of
Non-Cash
Collateral* | | | Income from
Borrowers | | | Income Earned | | | Advisory Fee
Waived | |
| $ | 105,106 | | | $ | –0 | – | | $ | 107,228 | | | $ | 601 | | | $ | –0 | – | | $ | –0 | – |
| * | | As of December 31, 2024. |
NOTE F: Capital Stock
Each class consists of 500,000,000 authorized shares. Transactions in capital shares for each class were as follows:
| | | | | | | | | | | | | | | | | | | | |
| | | SHARES | | | | | | AMOUNT | |
| | | Year Ended
December 31,
2024 | | | Year Ended
December 31,
2023 | | | | | | Year Ended
December 31,
2024 | | | Year Ended
December 31,
2023 | |
Class A | | | | | | | | | | | | | | | | | | | | |
Shares sold | | | 238,563 | | | | 129,672 | | | | | | | $ | 8,094,654 | | | $ | 4,084,925 | |
Shares issued in reinvestment of dividends and distributions | | | 5,110 | | | | 106,924 | | | | | | | | 180,118 | | | | 3,403,390 | |
Shares redeemed | | | (217,969 | ) | | | (207,721 | ) | | | | | | | (7,625,362 | ) | | | (6,621,923 | ) |
| | | | | | | | | | | | | | | | | | | | |
Net increase | | | 25,704 | | | | 28,875 | | | | | | | $ | 649,410 | | | $ | 866,392 | |
| | | | | | | | | | | | | | | | | | | | |
Class B | | | | | | | | | | | | | | | | | | | | |
Shares sold | | | 147,446 | | | | 197,320 | | | | | | | $ | 4,834,675 | | | $ | 5,765,234 | |
Shares issued on reinvestment of dividends and distributions | | | 9,677 | | | | 213,783 | | | | | | | | 318,763 | | | | 6,377,144 | |
Shares redeemed | | | (558,846 | ) | | | (529,397 | ) | | | | | | | (18,441,113 | ) | | | (15,778,166 | ) |
| | | | | | | | | | | | | | | | | | | | |
Net decrease | | | (401,723 | ) | | | (118,294 | ) | | | | | | $ | (13,287,675 | ) | | $ | (3,635,788 | ) |
| | | | | | | | | | | | | | | | | | | | |
At December 31, 2024, certain shareholders of the Portfolio owned 60% in aggregate of the Portfolio’s outstanding shares. Significant transactions by such shareholders, if any, may impact the Portfolio’s performance.
14
| | |
| |
| | | AB Variable Products Series Fund |
NOTE G: Risks Involved in Investing in the Portfolio
Market Risk—The value of the Portfolio’s assets will fluctuate as the market or markets in which the Portfolio invests fluctuate. The value of the Portfolio’s investments may decline, sometimes rapidly and unpredictably, simply because of economic changes or other events, including public health crises (including the occurrence of a contagious disease or illness) and regional and global conflicts, that affect large portions of the market. It includes the risk that a particular style of investing may underperform the market generally.
Sector Risk—The Portfolio may have more risk than a more diversified portfolio because it may invest to a significant extent in one or more particular market sectors, such as the information technology sector. To the extent it does so, market or economic factors affecting the relevant sector(s) could have a major effect on the value of the Portfolio’s investments.
ESG Risk—Applying ESG and sustainability criteria to the investment process may exclude securities of certain issuers for non-investment reasons and, therefore, the Portfolio may forgo some market opportunities available to funds that do not use ESG or sustainability criteria. Securities of companies with ESG practices may shift into and out of favor depending on market and economic conditions, and the Portfolio’s performance may at times be better or worse than the performance of funds that do not use ESG or sustainability criteria. Furthermore, ESG and sustainability criteria are not uniformly defined, and the Portfolio’s ESG and sustainability criteria may differ from those used by other funds. In addition, in evaluating an investment, the Adviser is dependent upon information and data that may be incomplete, inaccurate or unavailable, which could adversely affect the analysis of the ESG and sustainability factors relevant to a particular investment.
Foreign (Non-U.S.) Risk—Investments in securities of non-U.S. issuers may involve more risk than those of U.S. issuers. These securities may fluctuate more widely in price and may be more difficult to trade due to adverse market, economic, political, regulatory or other factors.
Emerging-Market Risk—Investments in emerging market countries may have more risk because the markets are less developed and less liquid, and because these investments may be subject to increased economic, political, regulatory or other uncertainties.
Currency Risk—Fluctuations in currency exchange rates may negatively affect the value of the Portfolio’s investments or reduce its returns.
Capitalization Risk—Investments in small- and mid-capitalization companies may be more volatile than investments in large-capitalization companies. Investments in small- and mid-capitalization companies may have additional risks because these companies may have limited product lines, markets or financial resources.
Derivatives Risk—Derivatives may be difficult to price or unwind and leveraged so that small changes may produce disproportionate losses for the Portfolio. A short position in a derivative instrument involves the risk of a theoretically unlimited increase in the value of the underlying asset, reference rate or index, which could cause the Portfolio to suffer a potentially unlimited loss. Derivatives, especially over-the-counter derivatives, are also subject to counterparty risk, which is the risk that the counterparty (the party on the other side of the transaction) on a derivative transaction will be unable or unwilling to honor its contractual obligations to the Portfolio.
Focused Portfolio Risk—Investments in a limited number of companies may have more risk because changes in the value of a single security may have a more significant effect, either negative or positive, on the Portfolio’s net asset value, or NAV, than would be the case if the Portfolio were invested in a larger number of companies.
Indemnification Risk—In the ordinary course of business, the Portfolio enters into contracts that contain a variety of indemnifications. The Portfolio’s maximum exposure under these arrangements is unknown. However, the Portfolio has not had prior claims or losses pursuant to these indemnification provisions and expects the risk of loss thereunder to be remote. Therefore, the Portfolio has not accrued any liability in connection with these indemnification provisions.
Management Risk—The Portfolio is subject to management risk because it is an actively-managed investment fund. The Adviser will apply its investment techniques and risk analyses in making investment decisions for the Portfolio, but there is no guarantee that its techniques will produce the intended results. Some of these techniques may incorporate, or rely upon, quantitative models, but there is no guarantee that these models will generate accurate forecasts, reduce risk or otherwise perform as expected.
NOTE H: Joint Credit Facility
A number of open-end mutual funds managed by the Adviser, including the Portfolio, participate in a $325 million revolving credit facility (the “Facility”) intended to provide short-term financing related to redemptions and other short term liquidity
15
| | |
| SUSTAINABLE GLOBAL THEMATIC PORTFOLIO |
| NOTES TO FINANCIAL STATEMENTS | | |
| |
| (continued) | | AB Variable Products Series Fund |
requirements, subject to certain restrictions. Commitment fees related to the Facility are paid by the participating funds and are included in miscellaneous expenses in the statement of operations. The Portfolio did not utilize the Facility during the year ended December 31, 2024.
NOTE I: Distributions to Shareholders
The tax character of distributions paid during the fiscal years ended December 31, 2024 and December 31, 2023 were as follows:
| | | | | | | | |
| | | 2024 | | | 2023 | |
Distributions paid from: | | | | | | | | |
Ordinary income | | $ | –0 | – | | $ | 186,160 | |
Net long-term capital gains | | | 498,881 | | | | 9,594,374 | |
| | | | | | | | |
Total taxable distributions paid | | $ | 498,881 | | | $ | 9,780,534 | |
| | | | | | | | |
As of December 31, 2024, the components of accumulated earnings (deficit) on a tax basis were as follows:
| | | | |
Undistributed ordinary income | | $ | 110,418 | |
Undistributed capital gains | | | 19,985,654 | |
Unrealized appreciation (depreciation) | | | 31,113,352 | (a) |
| | | | |
Total accumulated earnings (deficit) | | $ | 51,209,424 | |
| | | | |
| (a) | | The differences between book-basis and tax-basis unrealized appreciation (depreciation) are attributable primarily to the recognition for tax purposes of unrealized gains/losses on certain derivative instruments and the tax deferral of losses on wash sales. |
For tax purposes, net realized capital losses may be carried over to offset future capital gains, if any. Funds are permitted to carry forward capital losses for an indefinite period, and such losses will retain their character as either short-term or long-term capital losses. As of December 31, 2024, the Portfolio did not have any capital loss carryforwards.
During the current fiscal year, there were no permanent differences that resulted in adjustments to distributable earnings or additional paid-in capital.
NOTE J: Subsequent Events
Management has evaluated subsequent events for possible recognition or disclosure in the financial statements through the date the financial statements are issued. Management has determined that there are no material events that would require disclosure in the Portfolio’s financial statements through this date.
16
| | |
| |
| SUSTAINABLE GLOBAL THEMATIC PORTFOLIO |
| |
| FINANCIAL HIGHLIGHTS | | AB Variable Products Series Fund |
Selected Data For A Share Of Capital Stock Outstanding Throughout Each Period
| | | | | | | | | | | | | | | | | | | | |
| | | CLASS A | |
| | | Year Ended December 31, | |
| | | 2024 | | | 2023 | | | 2022 | | | 2021 | | | 2020 | |
Net asset value, beginning of period | | | $33.17 | | | | $30.42 | | | | $46.20 | | | | $42.40 | | | | $33.52 | |
| | | | | | | | | | | | | | | | | | | | |
| | | | | | | | | | | | | | | | | | | | |
Income From Investment Operations | | | | | | | | | | | | | | | | | | | | |
Net investment income (loss)(a)(b) | | | .06 | | | | .10 | | | | .07 | | | | (.10 | ) | | | (.10 | ) |
Net realized and unrealized gain (loss) on investment and foreign currency transactions | | | 2.00 | | | | 4.68 | | | | (12.25 | ) | | | 9.46 | | | | 12.64 | |
| | | | | | | | | | | | | | | | | | | | |
Net increase (decrease) in net asset value from operations | | | 2.06 | | | | 4.78 | | | | (12.18 | ) | | | 9.36 | | | | 12.54 | |
| | | | | | | | | | | | | | | | | | | | |
| | | | | | | | | | | | | | | | | | | | |
Less: Dividends and Distributions | | | | | | | | | | | | | | | | | | | | |
Dividends from net investment income | | | –0 | – | | | (.09 | ) | | | –0 | – | | | –0 | – | | | (.24 | ) |
Distributions from net realized gain on investment transactions | | | (.10 | ) | | | (1.94 | ) | | | (3.60 | ) | | | (5.56 | ) | | | (3.42 | ) |
| | | | | | | | | | | | | | | | | | | | |
Total dividends and distributions | | | (.10 | ) | | | (2.03 | ) | | | (3.60 | ) | | | (5.56 | ) | | | (3.66 | ) |
| | | | | | | | | | | | | | | | | | | | |
Net asset value, end of period | | | $35.13 | | | | $33.17 | | | | $30.42 | | | | $46.20 | | | | $42.40 | |
| | | | | | | | | | | | | | | | | | | | |
| | | | | | | | | | | | | | | | | | | | |
Total Return | | | | | | | | | | | | | | | | | | | | |
Total investment return based on net asset value(c) | | | 6.21 | % | | | 16.01 | % | | | (26.98 | )% | | | 22.87 | % | | | 39.41 | % |
| | | | | | | | | | | | | | | | | | | | |
Ratios/Supplemental Data | | | | | | | | | | | | | | | | | | | | |
Net assets, end of period (000’s omitted) | | | $62,599 | | | | $58,246 | | | | $52,543 | | | | $70,723 | | | | $58,316 | |
Ratio to average net assets of: | | | | | | | | | | | | | | | | | | | | |
Expenses, net of waivers/reimbursements(d)‡ | | | .91 | % | | | .92 | % | | | .90 | % | | | .88 | % | | | .94 | % |
Expenses, before waivers/reimbursements(d)‡ | | | .96 | % | | | .97 | % | | | .96 | % | | | .93 | % | | | 1.00 | % |
Net investment income (loss)(b) | | | .17 | % | | | .32 | % | | | .20 | % | | | (.22 | )% | | | (.29 | )% |
Portfolio turnover rate | | | 47 | % | | | 32 | % | | | 43 | % | | | 24 | % | | | 44 | % |
| | | | | | | | | | | | | | | | | | | | |
‡ Expense ratios exclude the estimated acquired fund fees of the affiliated/unaffiliated underlying | |
portfolios | | | .00 | % | | | .00 | % | | | .00 | % | | | .00 | % | | | .01 | % |
See footnote summary on page 18.
17
| | |
| SUSTAINABLE GLOBAL THEMATIC PORTFOLIO |
| FINANCIAL HIGHLIGHTS | | |
| |
| (continued) | | AB Variable Products Series Fund |
Selected Data For A Share Of Capital Stock Outstanding Throughout Each Period
| | | | | | | | | | | | | | | | | | | | |
| | | CLASS B | |
| | | Year Ended December 31, | |
| | | 2024 | | | 2023 | | | 2022 | | | 2021 | | | 2020 | |
Net asset value, beginning of period | | | $31.05 | | | | $28.59 | | | | $43.80 | | | | $40.54 | | | | $32.19 | |
| | | | | | | | | | | | | | | | | | | | |
| | | | | | | | | | | | | | | | | | | | |
Income From Investment Operations | | | | | | | | | | | | | | | | | | | | |
Net investment income (loss)(a)(b) | | | (.03 | ) | | | .02 | | | | (.02 | ) | | | (.20 | ) | | | (.18 | ) |
Net realized and unrealized gain (loss) on investment and foreign currency transactions | | | 1.88 | | | | 4.39 | | | | (11.59 | ) | | | 9.02 | | | | 12.11 | |
| | | | | | | | | | | | | | | | | | | | |
Net increase (decrease) in net asset value from operations | | | 1.85 | | | | 4.41 | | | | (11.61 | ) | | | 8.82 | | | | 11.93 | |
| | | | | | | | | | | | | | | | | | | | |
| | | | | | | | | | | | | | | | | | | | |
Less: Dividends and Distributions | | | | | | | | | | | | | | | | | | | | |
Dividends from net investment income | | | –0 | – | | | (.01 | ) | | | –0 | – | | | –0 | – | | | (.16 | ) |
Distributions from net realized gain on investment transactions | | | (.10 | ) | | | (1.94 | ) | | | (3.60 | ) | | | (5.56 | ) | | | (3.42 | ) |
| | | | | | | | | | | | | | | | | | | | |
Total dividends and distributions | | | (.10 | ) | | | (1.95 | ) | | | (3.60 | ) | | | (5.56 | ) | | | (3.58 | ) |
| | | | | | | | | | | | | | | | | | | | |
Net asset value, end of period | | | $32.80 | | | | $31.05 | | | | $28.59 | | | | $43.80 | | | | $40.54 | |
| | | | | | | | | | | | | | | | | | | | |
| | | | | | | | | | | | | | | | | | | | |
Total Return | | | | | | | | | | | | | | | | | | | | |
Total investment return based on net asset value(c) | | | 5.96 | % | | | 15.70 | % | | | (27.17 | )% | | | 22.57 | % | | | 39.08 | % |
| | | | | | | | | | | | | | | | | | | | |
Ratios/Supplemental Data | | | | | | | | | | | | | | | | | | | | |
Net assets, end of period (000’s omitted) | | | $98,271 | | | | $105,499 | | | | $100,515 | | | | $149,808 | | | | $127,062 | |
Ratio to average net assets of: | | | | | | | | | | | | | | | | | | | | |
Expenses, net of waivers/reimbursements(d)‡ | | | 1.16 | % | | | 1.17 | % | | | 1.15 | % | | | 1.13 | % | | | 1.19 | % |
Expenses, before waivers/reimbursements(d)‡ | | | 1.21 | % | | | 1.22 | % | | | 1.21 | % | | | 1.18 | % | | | 1.25 | % |
Net investment income (loss)(b) | | | (.08 | )% | | | .07 | % | | | (.05 | )% | | | (.47 | )% | | | (.54 | )% |
Portfolio turnover rate | | | 47 | % | | | 32 | % | | | 43 | % | | | 24 | % | | | 44 | % |
| | | | | | | | | | | | | | | | | | | | |
‡ Expense ratios exclude the estimated acquired fund fees of the affiliated/unaffiliated underlying | |
portfolios | | | .00 | % | | | .00 | % | | | .00 | % | | | .00 | % | | | .01 | % |
| (a) | | Based on average shares outstanding. |
| (b) | | Net of expenses waived/reimbursed by the Adviser. |
| (c) | | Total investment return is calculated assuming an initial investment made at the net asset value at the beginning of the period, reinvestment of all dividends and distributions at net asset value during the period, and redemption on the last day of the period. Total investment return does not reflect (i) insurance company’s separate account related expense charges and (ii) the deductions of taxes that a shareholder would pay on Portfolio distributions or the redemption of Portfolio shares. Total investment return calculated for a period of less than one year is not annualized. |
| (d) | | In connection with the Portfolio’s investments in affiliated underlying portfolios, the Portfolio incurs no direct expenses, but bears proportionate shares of the fees and expenses (i.e., operating, administrative and investment advisory fees) of the affiliated underlying portfolios. The Adviser has contractually agreed to waive its fees from the Portfolio in an amount equal to the Portfolio’s pro rata share of certain acquired fund fees and expenses, and for the year ended December 31, 2020, such waiver amounted to .01%. |
See notes to financial statements.
18
| | |
| | | |
| REPORT OF INDEPENDENT REGISTERED | | |
| |
| PUBLIC ACCOUNTING FIRM | | AB Variable Products Series Fund |
To the Board of Directors and Shareholders of AB Sustainable Global Thematic Portfolio
Opinion on the Financial Statements
We have audited the accompanying statement of assets and liabilities of AB Sustainable Global Thematic Portfolio (the “Portfolio”) (one of the series constituting AB Variable Products Series Fund, Inc. (the “Fund”)), including the portfolio of investments, as of December 31, 2024, and the related statement of operations for the year then ended, the statements of changes in net assets for each of the two years in the period then ended, the financial highlights for each of the five years in the period then ended and the related notes (collectively referred to as the “financial statements”). In our opinion, the financial statements present fairly, in all material respects, the financial position of the Portfolio (one of the series constituting AB Variable Products Series Fund, Inc.) at December 31, 2024, the results of its operations for the year then ended, the changes in its net assets for each of the two years in the period then ended and its financial highlights for each of the five years in the period then ended, in conformity with U.S. generally accepted accounting principles.
Basis for Opinion
These financial statements are the responsibility of the Fund’s management. Our responsibility is to express an opinion on the Portfolio’s financial statements based on our audits. We are a public accounting firm registered with the Public Company Accounting Oversight Board (United States) (“PCAOB”) and are required to be independent with respect to the Fund in accordance with the U.S. federal securities laws and the applicable rules and regulations of the Securities and Exchange Commission and the PCAOB.
We conducted our audits in accordance with the standards of the PCAOB. Those standards require that we plan and perform the audit to obtain reasonable assurance about whether the financial statements are free of material misstatement, whether due to error or fraud. The Fund is not required to have, nor were we engaged to perform, an audit of the Fund’s internal control over financial reporting. As part of our audits, we are required to obtain an understanding of internal control over financial reporting but not for the purpose of expressing an opinion on the effectiveness of the Fund’s internal control over financial reporting. Accordingly, we express no such opinion.
Our audits included performing procedures to assess the risks of material misstatement of the financial statements, whether due to error or fraud, and performing procedures that respond to those risks. Such procedures included examining, on a test basis, evidence regarding the amounts and disclosures in the financial statements. Our procedures included confirmation of securities owned as of December 31, 2024, by correspondence with the custodian, brokers and others; when replies were not received from brokers or others, we performed other auditing procedures. Our audits also included evaluating the accounting principles used and significant estimates made by management, as well as evaluating the overall presentation of the financial statements. We believe that our audits provide a reasonable basis for our opinion.

We have served as the auditor of one or more of the AB investment companies since 1968.
New York, New York
February 14, 2025
19
| | |
| | |
| | |
| |
| 2024 FEDERAL TAX INFORMATION (unaudited) | | AB Variable Products Series Fund |
For Federal income tax purposes, the following information is furnished with respect to the distributions paid by the Portfolio during the taxable year ended December 31, 2024. The Portfolio designates $498,881 of dividends paid as longterm capital gain dividends.
20
| | |
| | | |
| |
| |
| SUSTAINABLE GLOBAL THEMATIC PORTFOLIO | | AB Variable Products Series Fund |
INFORMATION REGARDING THE REVIEW AND APPROVAL OF THE FUND’S ADVISORY AGREEMENT
The disinterested directors (the “directors”) of AB Variable Products Series Fund, Inc. (the “Company”) unanimously approved the continuance of the Company’s Advisory Agreement with the Adviser in respect of AB Sustainable Global Thematic Portfolio (the “Fund”) at a meeting held by video conference on May 7-9, 2024 (the “Meeting”).
Prior to approval of the continuance of the Advisory Agreement, the directors had requested from the Adviser, and received and evaluated, extensive materials. They reviewed the proposed continuance of the Advisory Agreement with the Adviser and with experienced counsel who are independent of the Adviser, who advised on the relevant legal standards. The directors also reviewed additional materials, including comparative analytical data prepared by the Senior Vice President of the Fund. The directors also discussed the proposed continuance in private sessions with counsel.
The directors considered their knowledge of the nature and quality of the services provided by the Adviser to the Fund gained from their experience as directors or trustees of most of the registered investment companies advised by the Adviser, their overall confidence in the Adviser’s integrity and competence they have gained from that experience, the Adviser’s initiative in identifying and raising potential issues with the directors and its responsiveness, frankness and attention to concerns raised by the directors in the past, including the Adviser’s willingness to consider and implement organizational and operational changes designed to improve investment results and the services provided to the AB Funds. The directors noted that they have four regular meetings each year, at each of which they review extensive materials and information from the Adviser, including information on the investment performance of the Fund.
The directors also considered all factors they believed relevant, including the specific matters discussed below. During the course of their deliberations, the directors evaluated, among other things, the reasonableness of the advisory fee. The directors did not identify any particular information that was all-important or controlling, and different directors may have attributed different weights to the various factors. The directors determined that the selection of the Adviser to manage the Fund and the overall arrangements between the Fund and the Adviser, as provided in the Advisory Agreement, including the advisory fee, were fair and reasonable in light of the services performed, expenses incurred and such other matters as the directors considered relevant in the exercise of their business judgment. The material factors and conclusions that formed the basis for the directors’ determinations included the following:
Nature, Extent and Quality of Services Provided
The directors considered the scope and quality of services provided by the Adviser under the Advisory Agreement, including the quality of the investment research capabilities of the Adviser and the other resources it has dedicated to performing services for the Fund. The directors noted that the Adviser from time to time reviews the Fund’s investment strategies and from time to time proposes changes intended to improve the Fund’s relative or absolute performance for the directors’ consideration. They also noted the professional experience and qualifications of the Fund’s portfolio management team and other senior personnel of the Adviser. The directors also considered that the Advisory Agreement provides that the Fund will reimburse the Adviser for the cost to it of providing certain clerical, accounting, administrative and other services to the Fund by employees of the Adviser or its affiliates. Requests for these reimbursements are made on a quarterly basis and subject to approval by the directors. Reimbursements, to the extent requested and paid, result in a higher rate of total compensation from the Fund to the Adviser than the fee rate stated in the Advisory Agreement. The directors noted that the methodology used to determine the reimbursement amounts had been reviewed by an independent consultant at the request of the directors. The quality of administrative and other services, including the Adviser’s role in coordinating the activities of the Fund’s other service providers, also was considered. The directors concluded that, overall, they were satisfied with the nature, extent and quality of services provided to the Fund under the Advisory Agreement.
Costs of Services Provided and Profitability
The directors reviewed a schedule of the revenues and expenses and related notes indicating the profitability of the Fund to the Adviser for calendar years 2022 and 2023 that had been prepared with an expense allocation methodology arrived at in consultation with an independent consultant at the request of the directors. The directors noted the assumptions and methods of allocation used by the Adviser in preparing fund-specific profitability data and understood that there are a number of potentially acceptable allocation methodologies for information of this type. The directors noted that the profitability information reflected all revenues and expenses of the Adviser’s relationship with the Fund, including those relating to its subsidiaries that provide transfer agency, distribution and brokerage services to the Fund. The directors recognized that it is difficult to make comparisons of the profitability of the Advisory Agreement with the profitability of fund advisory contracts for unaffiliated funds because comparative information is not generally publicly available and is affected by numerous
21
| | |
| |
| | | AB Variable Products Series Fund |
factors. The directors focused on the profitability of the Adviser’s relationship with the Fund before taxes and distribution expenses. The directors concluded that the Adviser’s level of profitability from its relationship with the Fund was not unreasonable.
Fall-Out Benefits
The directors considered the other benefits to the Adviser and its affiliates from their relationships with the Fund, including, but not limited to, benefits relating to soft dollar arrangements (whereby investment advisers receive brokerage and research services from brokers that execute agency transactions for their clients); 12b-1 fees and sales charges received by the Fund’s principal underwriter (which is a wholly owned subsidiary of the Adviser) in respect of the Fund’s Class B shares; brokerage commissions paid by the Fund to brokers affiliated with the Adviser; and transfer agency fees paid by the Fund to a wholly owned subsidiary of the Adviser. The directors recognized that the Adviser’s profitability would be somewhat lower without these benefits. The directors understood that the Adviser also might derive reputational and other benefits from its association with the Fund.
Investment Results
In addition to the information reviewed by the directors in connection with the Meeting, the directors receive detailed performance information for the Fund at each regular Board meeting during the year.
At the Meeting, the directors reviewed performance information prepared by an independent service provider (the “15(c) service provider”), showing the performance of the Class A Shares of the Fund against a group of similar funds (“peer group”) and a larger group of similar funds (“peer universe”), each selected by the 15(c) service provider, and information prepared by the Adviser showing performance of the Class A Shares against a broad-based securities market index, in each case for the 1-, 3-, 5- and 10-year periods ended February 29, 2024. Based on their review and their discussion with the Adviser of the reasons for the Fund’s underperformance in the more recent periods reviewed, the directors concluded that the Fund’s investment performance was acceptable. The directors determined to continue to monitor the Fund’s performance closely.
Advisory Fees and Other Expenses
The directors considered the advisory fee rate payable by the Fund to the Adviser and information prepared by the 15(c) service provider concerning advisory fee rates payable by other funds in the same category as the Fund. The directors recognized that it is difficult to make comparisons of advisory fees because there are variations in the services that are included in the fees paid by other funds. The directors compared the Fund’s contractual effective advisory fee rate with a peer group median and noted that it was lower than the median. They also noted that the Adviser’s total rate of compensation, taking into account the impact of the administrative expense reimbursement paid to the Adviser in the latest fiscal year, was lower than the median.
The directors also considered the Adviser’s fee schedule for other clients utilizing investment strategies similar to those of the Fund. For this purpose, they reviewed the relevant advisory fee information from the Adviser’s Form ADV and in a report from the Fund’s Senior Vice President and noted the differences between the Fund’s fee schedule, on the one hand, and the Adviser’s institutional fee schedule and the schedule of fees charged by the Adviser to any offshore funds and for services to any sub-advised funds utilizing investment strategies similar to those of the Fund, on the other. The directors noted that the Adviser may, in some cases, agree to fee rates with large institutional clients that are lower than those reviewed by the directors and that they had previously discussed with the Adviser its policies in respect of such arrangements. The directors also compared the advisory fee rate for the Fund with that for another fund advised by the Adviser utilizing similar investment strategies.
The Adviser reviewed with the directors the significantly greater scope of the services it provides to the Fund relative to institutional, offshore fund and sub-advised fund clients. In this regard, the Adviser noted, among other things, that, compared to institutional and offshore or sub-advisory accounts, the Fund (i) demands considerably more portfolio management, research and trading resources due to significantly higher daily cash flows; (ii) has more tax and regulatory restrictions and compliance obligations; (iii) must prepare and file or distribute regulatory and other communications about fund operations; and (iv) must provide shareholder servicing to retail investors. The Adviser also reviewed the greater legal risks presented by the large and changing population of Fund shareholders who may assert claims against the Adviser in individual or class actions, and the greater entrepreneurial risk in offering new fund products, which require substantial investment to launch, may not succeed, and generally must be priced to compete with larger, more established funds resulting in lack of
22
| | |
| |
| SUSTAINABLE GLOBAL THEMATIC PORTFOLIO |
| |
| (continued) | | AB Variable Products Series Fund |
profitability to the Adviser until a new fund achieves scale. In light of the substantial differences in services rendered by the Adviser to institutional, offshore fund and sub-advised fund clients as compared to funds such as the Fund, and the different risk profile, the directors considered these fee comparisons inapt and did not place significant weight on them in their deliberations.
In connection with their review of the Fund’s advisory fee, the directors also considered the total expense ratio of the Class A shares of the Fund in comparison to the medians for a peer group and a peer universe selected by the 15(c) service provider. The Class A expense ratio of the Fund was based on the Fund’s latest fiscal year. The directors noted that it was likely that the expense ratios of some of the other funds in the Fund’s category were lowered by waivers or reimbursements by those funds’ investment advisers, which in some cases might be voluntary or temporary. The directors view expense ratio information as relevant to their evaluation of the Adviser’s services because the Adviser is responsible for coordinating services provided to the Fund by others. The directors noted that the Fund’s expense ratio was above the medians, after giving effect to a voluntary waiver by the Adviser. After reviewing and discussing the Adviser’s explanations of the reasons for this, the directors concluded that the Fund’s expense ratio was acceptable.
Economies of Scale
The directors noted that the advisory fee schedule for the Fund contains breakpoints that reduce the fee rates on assets above specified levels. The directors took into consideration prior presentations by an independent consultant on economies of scale in the mutual fund industry and for the AB Funds, and presentations from time to time by the Adviser concerning certain of its views on economies of scale. The directors also had requested and received from the Adviser certain updates on economies of scale in advance of the Meeting. The directors believe that economies of scale may be realized (if at all) by the Adviser across a variety of products and services, and not only in respect of a single fund. The directors noted that there is no established methodology for setting breakpoints that give effect to the fund-specific services provided by a fund’s adviser and to the economies of scale that an adviser may realize in its overall mutual fund business or those components of it which directly or indirectly affect a fund’s operations. The directors observed that in the mutual fund industry as a whole, as well as among funds similar to the Fund, there is no uniformity or pattern in the fees and asset levels at which breakpoints (if any) apply. The directors also noted that the advisory agreements for many funds do not have breakpoints at all. Having taken these factors into account, the directors concluded that the Fund’s shareholders would benefit from a sharing of economies of scale in the event the Fund’s net assets exceed a breakpoint in the future.
23
VPS-SGT-0151-1224
ITEM 8. CHANGES IN AND DISAGREEMENTS WITH ACCOUNTANTS FOR OPEN-END MANAGEMENT INVESTMENT COMPANIES.
There were no disagreements with accountants during the reporting period.
ITEM 9. PROXY DISCLOSURES FOR OPEN-END MANAGEMENT INVESTMENT COMPANIES
There were no shareholder meetings during the reporting period.
ITEM 10. REMUNERATION PAID TO DIRECTORS, OFFICERS, AND OTHERS OF OPEN-END MANAGEMENT INVESTMENT COMPANIES.
Aggregate remuneration paid to all Directors and advisory board members are included within the Financial Statements under Item 1 of this Form N-CSR.
ITEM 11. STATEMENT REGARDING BASIS FOR APPROVAL OF INVESTMENT ADVISORY CONTRACT.
Statement regarding basis for Approval of Investment Advisory Contract included within the Financial Statements under Item 1 of this Form N-CSR.
ITEM 12. DISCLOSURE OF PROXY VOTING POLICIES AND PROCEDURES FOR CLOSED-END MANAGEMENT INVESTMENT COMPANIES.
Not applicable to the registrant.
ITEM 13. PORTFOLIO MANAGERS OF CLOSED END MANAGEMENT INVESTMENT COMPANIES.
Not applicable to the registrant.
ITEM 14. PURCHASES OF EQUITY SECURITIES BY CLOSED-END MANAGEMENT INVESTMENT COMPANY OF AND AFFILIDATED PURCHASERS.
Not applicable to the registrant.
ITEM 15. SUBMISSION OF MATTERS TO A VOTE OF SECURITY HOLDERS.
There have been no material changes to the procedures by which shareholders may recommend nominees to the Fund’s Board of Directors since the Fund last provided disclosure in response to this item.
ITEM 16. CONTROLS AND PROCEDURES.
(a) The registrant’s principal executive officer and principal financial officer have concluded that the registrant’s disclosure controls and procedures (as defined in Rule 30a-2(c) under the Investment Company Act of 1940, as amended) are effective at the reasonable assurance level based on their evaluation of these controls and procedures as of a date within 90 days of the filing date of this document.
(b) There were no changes in the registrant’s internal controls over financial reporting that occurred during the period covered by this report that has materially affected, or is reasonably likely to materially affect, the registrant’s internal control over financial reporting.
ITEM 17. DISCLOSURE OF SECURITIES LENDING ACTIVITIES FOR CLOSED-END MANAGEMENT INVESTMENT COMPANIES.
Not applicable to the registrant.
ITEM 18. RECOVERY OF ERRONEOUSLY AWARDED COMPENSATION.
Not applicable to the registrant
ITEM 19. EXHIBITS.
The following exhibits are attached to this Form N-CSR:
SIGNATURES
Pursuant to the requirements of the Securities Exchange Act of 1934 and the Investment Company Act of 1940, the registrant has duly caused this report to be signed on its behalf by the undersigned, thereunto duly authorized.
| | |
| (Registrant): AB Variable Products Series Fund, Inc. |
| |
| By: | | /s/ Onur Erzan |
| | Onur Erzan |
| | President |
| |
| Date: | | February 14, 2025 |
Pursuant to the requirements of the Securities Exchange Act of 1934 and the Investment Company Act of 1940, this report has been signed below by the following persons on behalf of the registrant and in the capacities and on the dates indicated.
| | |
| By: | | /s/ Onur Erzan |
| | Onur Erzan |
| | President |
| |
| Date: | | February 14, 2025 |
| |
| By: | | /s/ Stephen M. Woetzel |
| | Stephen M. Woetzel |
| | Treasurer and Chief Financial Officer |
| |
| Date: | | February 14, 2025 |