
SCHEDULE 14A
(Rule 14a-101)
INFORMATION REQUIRED IN PROXY STATEMENT
SCHEDULE 14A INFORMATION
Proxy Statement Pursuant to Section 14(a) of the Securities Exchange Act of 1934
Filed by the Registrant (X) |
| ||
Filed by a Party other than the Registrant ( | ) | ||
Check the appropriate box: |
| ||
( | ) | Preliminary Proxy Statement | ( ) Confidential, for Use of the Commission Only (as permitted |
( | ) | Definitive Proxy Statement | by Rule 14a-6(e)(2)) |
| |||
() Definitive Additional Materials
(X) Soliciting Material Under Rule 14a-12
VOYA PRIME RATE TRUST
(Name of Registrant as Specified in Its Charter)
________________________________________________________________
(Name of Person(s) Filing Proxy Statement, if other than the Registrant)
Payment of filing fee (Check the appropriate box):
(X)No fee required.
( ) Fee computed on table below per Exchange Act Rules 14a-6(i)(1) and 0-11.
(1)Title of each class of securities to which transaction applies:
(2)Aggregate number of securities to which transaction applies:
(3)Per unit price or other underlying value of transaction computed pursuant to Exchange Act Rule 0-11 (Set forth the amount on which the filing fee is calculated and state how it was determined.):
(4)Proposed maximum aggregate value of transaction:
(5)Total fee paid:
( ) Fee paid previously with preliminary materials:
() Check box if any part of the fee is offset as provided by Exchange Act Rule 0-11(a)(2) and identify the filing for which the offsetting fee was paid previously. Identify the previous filing by registration statement number, or the Form or Schedule and the date of its filing.
(1)Amount Previously Paid:
(2)Form, Schedule or Registration Statement No.:
(3)Filing Party:
(4)Date Filed:
On April 21, 2020, representatives of Voya Prime Rate Trust (the "Fund") hosted an online seminar open to all shareholders. A presentation was made available to attendees of this online seminar. A copy of this presentation is filed herewith.
***
IMPORTANT INFORMATION.
Information regarding the ownership of the trustees and officers of the Fund in common shares and other securities of the Fund is included in their filings with the SEC on Forms 3, 4, and 5, which can be found through the SEC's website at www.sec.gov. Additional information about the trustees and officers of the Fund and their interests is set forth in the Fund's Annual Report on N-CSR for the fiscal year ended February 28, 2019 (which was filed with the SEC on May 8, 2019), the Fund's proxy statement for its 2019 Annual Meeting of Shareholders (which was filed with the SEC on May 10, 2019), the Fund's registration statement on Form N-2 (which was last filed June 26, 2019) and in the Fund's other SEC filings, which can be found through the SEC's website at www.sec.gov. More detailed and updated information regarding the identity of potential participants, and their direct or indirect interests in the Fund, by security holdings or otherwise, will be set forth in the proxy statement and other materials to be filed with the SEC in connection with the 2020 Annual Meeting. Shareholders will be able to obtain any proxy statement, any amendments or supplements to the proxy statement and other documents filed by the Fund with the SEC for no charge at the SEC's website at www.sec.gov. Copies will also be available at no charge on the Fund's website at https://individuals.voya.com/product/closed-end-fund/profile/voya-prime-rate- trust.

Voya Prime Rate Trust ("PPR") – Webinar
Presented by
Dan Norman, Group Head and Senior Managing Director Chuck LeMieux, Senior Vice President, Portfolio Manager Tamara Wieging, Vice President, Client Portfolio Manager
April 2020
CID 1159056

Presenter Biographies
Dan Norman
Group Head and Senior Managing Director, Senior Loans
Years of investment experience: 34
Years with company: 27
Dan Norman is senior managing director, group head of the Voya Investment Management senior loan group. He co- manages the group with Jeff Bakalar, and serves as a member of the group's investment committee. Dan is a former member of the board of directors of the Loan Syndications and Trading Association and the International Association of Credit Portfolio Managers. Dan received his MBA from the University of Nebraska.
Chuck E. LeMieux, CFA
Senior Vice President, Portfolio Manager
Years of investment experience: 32
Years with company: 21
Chuck LeMieux is a senior vice president, portfolio manager of the Voya Investment Management senior loan group. Chuck serves as a member of the senior loan group's investment committee. Chuck also serves as the portfolio manager for U.S. mutual funds and offshore commingled funds. Prior to joining the firm, Chuck was an assistant treasurer for a major Arizona power and water utility and also worked in a variety of business and investment positions in the chemicals and global mining industries. Chuck received his MBA from the University of Arizona and holds the Chartered Financial Analyst®.
2

Voya Prime Rate Trust: Principal Risks
Risk is inherent in all investing. The following are the principal risks associated with investing in Voya Prime Rate Trust.
Credit Risk: The fund invests a substantial portion of its assets in below investment grade senior bank loans and other below investment grade assets. Below investment grade loans involve a greater risk that borrowers may not make timely payment of the interest and principal due on their loans. They also involve a greater risk that the value of such loans could decline significantly. If borrowers do not make timely payments of the interest due on their loans, the yield on the fund's Common Shares will decrease. If borrowers do not make timely payment of the principal due on their loans, or if the value of such loans decreases, the fund's NAV will decrease.
Interest rate risk: The yield on senior loans is directly affected by changes in market interest rates. If such rates fall, the yield may fall. Also, if overall interest rates on loans decline, the yield may fall and the value of the loans may decrease. When market interest rates rise, there may be a delay in the rise in the yield on loans due to a lag between changes in such rates and the resetting of the floating rates on the loans. There may also be a delay due to the effect of LIBOR floors, which establish a lower limit on the LIBOR portion of a loan's yield. Rises in market interest rates must exceed applicable LIBOR floors before such rises will affect the yield on a loan with a LIBOR floor.
Leverage risk: The fund's use of leverage through borrowings and the issuance of Preferred Shares can adversely affect the yield on the fund's Common Shares. To the extent that the fund is unable to invest the proceeds from the use of leverage in assets which pay interest at a rate which exceeds the rate paid on the leverage, the yield on the fund's Common Shares will decrease. In addition, in the event of a general market decline in the value of assets such as those in which the fund invests, the effect of that decline will be magnified in the fund because of the additional assets purchased with proceeds of the leverage.
Limited secondary market for loans: Because of the limited secondary market for loans, the fund may be limited in its ability to sell loans in its portfolio in a timely fashion and/or at a favorable price.
Demand for loans: An increase in demand for loans may adversely affect the rate of interest payable on new loans acquired by the fund, and it may also increase the price of loans in the secondary market. A decrease in the demand for loans may adversely affect the price of loans in the fund's portfolio, which could cause the fund's NAV to decline.
This is not, and is not intended to be, a description of all risks of investing in the fund. The fund's current Prospectus should be read carefully before investing. Consider the fund's investment objective, risks, and charges and expenses carefully before investing.
3

PPR History and Overview
Founded in May 1988; the first senior loan fund
First senior loan fund to list on the NYSE (May 1992)
Voya's Senior Loan Group began managing PPR in April 1995
PPR is structurally different than most closed-end loan funds
–Loan-only style
No high-yield bonds
No structured credit
–Lower leverage on average than peers
Morningstar Closed- | Total Leverage Ratio |
End Loan Funds | as of December 31, |
| 2019 |
Highest Category Ratio | 39.00% |
(Fund 1) |
|
Lowest Category Ratio | 27.06% |
(Fund 31) |
|
Voya Prime Rate Trust | 27.42% |
(Leverage Rank Order – |
|
Fund 30) |
|
Category Average | 33.43% |
Leverage provided via a low cost revolving credit facility
No preferred shares
–Pays monthly dividend
Source: Morningstar: CE Bank Loan Category; data as of December 31, 2019
Note: We are using December 31 leverage data as a source for leverage data for the Morningstar Closed End Loan Funds because Morningstar's leverage ratio methodology utilizes the borrowings reported on a fund's most recent regulatory filing divided by the assets at the noted period end. Normally this approach would likely not be materially different than the actual official leverage ratio of a fund at that point in time, but given the massive marked-to-market changes in March we did not want to misrepresent leverage levels which each manager was likely adjusting relative to their usual percentages.
4

Voya Senior Loan Platform
Competitive Strengths
High-level of primary and secondary market access, built upon tenure in the market and size/stability of platform
Dedicated to investment in senior loans
Top 10 Institutional Manager – Average Allocation per Syndicated Loan1
Diversified global investor base with active institutional and retail clients in over 25 countries
58 team members, with 35 team members together for
10+ years, including 27 team members together for 15+ years
Assets ($ billions)
Mutual Funds
(Retail) $2.6 bn
10%
35% | 55% |
Structured | |
| Products |
Institutional | $15.0 bn |
| |
Products |
|
$9.5 bn |
|
Total Assets: $27.1 billion
Team members as of 03/31/2020; AUM and other stats as of 12/31/19. Totals may not equal due to rounding.
1Source: S&P LCD ("LCD") as of 12/31/2019. Includes all accounts that LCD was able to track with commitments of $10 million or more in estimated allocations. The data is based on LCD's collection and therefore is, by definition, incomplete. LCD's collection does not include loans that are not syndicated; materially different rankings could result from a change in collections or ranking methodology. Only accounts with more than 50 commitments were included in this analysis
5
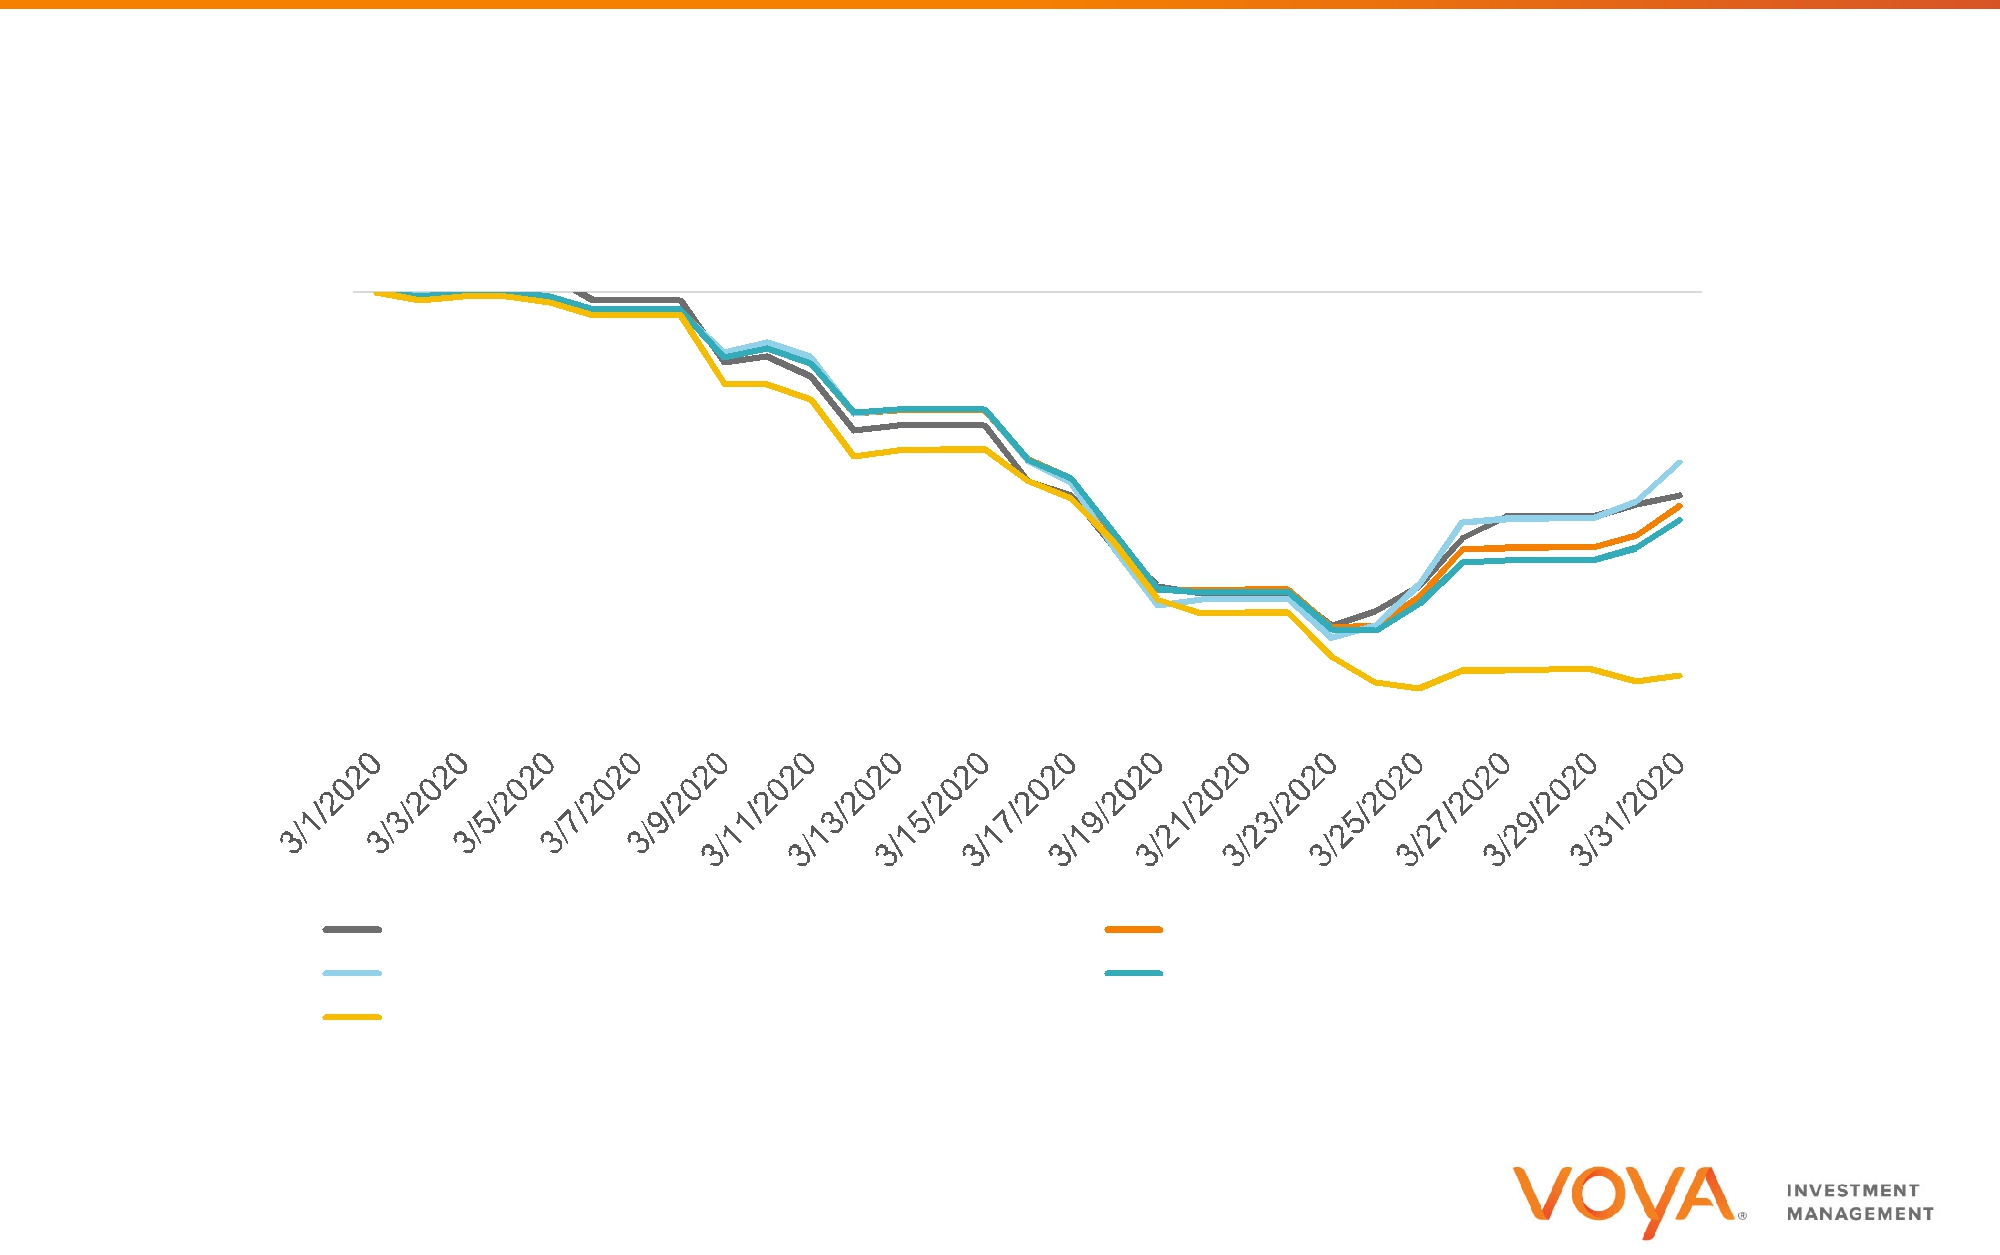
COVID-19 and Total Returns
Daily Cumulative Returns
S&P/LSTA Leveraged Loan Index and Ratings Constrained
Sub-Indices;
March 2020
0.0%
-5.0%
-10.0%
-15.0%
-20.0%
-25.0%
ICE BofA US HY Index: -11.76% | S&P/LSTA Loan Index: -12.37% |
BB Loan Index: -9.86% | Single B Loan Index: -13.18% |
CCC Loan Index: -22.20% |
|
Source: S&P/LCD and Bloomberg (ICE Bof A US HY Index).. Investors cannot invest directly in an index. Past performance is no guarantee of future results.
6

Price, Yields and Relative Value Trends
Loan Prices: BBs have rebounded the strongest following March's sharp sell-off; single-Bs trail behind
| 100 | |
par | 96 | |
92 | ||
% of | ||
88 | ||
| 84 | |
| 80 |
 S&P/LSTA LL Index
  BB
BB  B
B
Source: S&P/LCD. Data as of March 31, 2020
Yields: high-yield bonds have historically been priced wider; the current inversion points to better relative value for loans
14% | 12.67% | |
12% | ||
|
10%
8%
6%
4%
2%
 Senior Loans (Discount Yield to 3 Year Call)
 US HY (YTW): -361 bps
 US IG (YTW): -898 bps
7

Fundamentals
Loan Default Rate: while still below historical average, most signs point to a significant uptick as distressed ratio climbs
12%
10%
March 2020
8%$ Rate: 1.84% Avg. Rate: 2.91%
6%
4%
2%
0%
By Principal Amount | Average by Principal Amount |
Downgrade Activity: activity has increased substantially, particularly in sectors most at-risk to impact of COVID-19
| 12 |
|
| 10 | March 2020 |
|
| |
| 8 | 3-Months: 11.40 |
| 12-Months: 4.58 | |
(%) |
| |
6 |
| |
|
| |
| 4 |
|
2
0
Rolling 3-Months | Rolling 12-Months |
Source: S&P/LCD. Data as of March 31, 2020
8

Q2 2020 Market Outlook
MACRO HEADWINDS/VOLATILITY
FED/GOVERNMENT POLICY
TECHNICALS
FUNDAMENTALS
9

PPR Performance History vs. S&P/LSTA Index
20% |
|
|
|
|
|
|
| 1.14% | 3.08% | 0.91% | 3.08% |
|
|
|
|
|
|
| |||||
0% |
|
|
|
|
|
|
| ||||
|
|
|
|
|
|
|
|
|
| ||
|
|
|
|
| -9.16% -4.02% | -0.78% | -0.61% -1.97% |
|
|
| |
|
|
|
|
|
|
|
|
| |||
-20% |
|
| -13.05% |
| -13.05% | -6.42% |
|
|
| ||
| -20.60% | -20.60% | -16.87%-17.35% |
|
|
|
|
| |||
-40% |
| -25.23% | -25.23% |
|
|
|
|
|
| ||
|
|
|
|
|
|
| |||||
|
| 3-Month | YTD |
|
| 1-Year | 3-Year | 5-Year | 10-Year | ||||||
|
| Portfolio Gross (Market Value) |
|
| Portfolio Net (NAV) |
|
| S&P/LSTA Leveraged Loan Index |
| ||||||
|
|
|
|
| |||||||||||
|
|
|
|
| |||||||||||
|
|
|
|
|
|
|
|
|
|
|
|
|
|
|
|
|
|
|
|
|
|
|
|
|
|
|
|
|
| Gross Expense | Net Expense |
(%) |
|
|
| 3-Month | YTD | 1-Year | 3-Year | 5-Year | 10-Year | Ratio1 | Ratio1 | ||||
Portfolio (NAV) |
| -20.60% | -20.60% | -16.87% | -4.02% | -0.61% | 3.08% | 3.03% | 3.03% | ||||||
|
|
|
|
|
|
|
|
|
|
|
|
|
| ||
Portfolio (Market Price) |
| -25.23% | -25.23% | -17.35% | -6.42% | -1.97% | 0.91% | ||||||||
|
|
| |||||||||||||
S&P/LSTA Leveraged Loan Index |
| -13.05% | -13.05% | -9.16% | -0.78% | 1.14% | 3.08% |
|
| ||||||
|
|
|
|
|
|
|
|
|
| ||||||
Excess NAV Returns Over Index |
| -7.55% | -7.55% | -7.71% | -3.24% | -1.75% | 0.00% |
|
| ||||||
|
|
|
|
|
|
|
|
|
|
|
|
|
|
|
|
Data as of March 31, 2020. Source: Voya Investment Management; S&P/LCD.
The S&P/LSTA Leveraged Loan Index is an unmanaged total return index that captures accrued interest, repayments, and market value changes. Investors cannot invest directly in an index. The performance quoted represents past performance and does not guarantee future results. Current performance may be lower or higher than the performance information shown. The investment return and principal value of an investment in the Portfolio will fluctuate, so that your shares, when redeemed, may be worth more or less than their original cost. See above "Average Annual Total Returns %" for performance information current to the most recent month-end.
Returns for the other share classes will vary due to different charges and expenses. Performance assumes reinvestment of distributions and does not account for taxes.
Total investment return at net asset value has been calculated assuming a purchase at net asset value at the beginning of the period and a sale at net asset value at the end of the period; and assumes reinvestment of dividends, capital gain distributions and return of capital distributions/allocations, if any, in accordance with the provisions of the dividend reinvestment plan. Net asset value equals total Fund assets net of Fund expenses such as operating costs and management fees. Total investment return at net asset value is not annualized for periods less than one year.
1.The Adviser has contractually agreed to limit expenses of the Trust. This expense limitation agreement excludes interest, taxes, investment-related costs, leverage expenses, and extraordinary expenses and may be subject to possible recoupment. Please see the Trust's prospectus for more information. The expense limits will continue through at least 2020- 07-01. If the Trust were not to borrow, or the interest expense on the borrowings is excluded from the expenses of the Trust, the net annual expenses would be 1.22%.
10

PPR Portfolio Characteristics
Characteristics |
| Portfolio | Index |
|
| Asset Breakdown (%) |
| Portfolio | ||
Number of Industries |
| 35 |
| 38 |
|
| Senior Loans |
| 90.26% | |
Number of Issuers |
| 323 |
| 1172 |
|
| - | First Lien |
| 98.16% |
Average per Issuer |
| 2,651,253 |
|
|
| - | Second Lien |
| 1.84% | |
Portfolio AUM ($ Billions)/Index Market Value Outstanding | $0.86 | $991.15 |
|
| - | Secured |
| 100.00% | ||
Weighted Average Spread |
| 3.34% | 3.45% |
|
| - | Unsecured |
| 0.00% | |
Weighted Average Coupon* |
| 4.60% | 5.05% |
|
| Fixed Rate Notes/Bonds |
| 0.00% | ||
Weighted Average Maturity (years) |
| 4.99 |
| 4.91 |
|
| Structured Products |
| 0.00% | |
Weighted Average Market Price |
| 84.28% | 82.85% |
|
| Cash & Other Net Assets** | 9.74% | |||
|
|
|
|
|
|
| Total |
| 100% | |
Top 10 Portfolio Holdings | % of AUM |
| Top 10 Portfolio Industries (S&P) | Portfolio | Index | |||||
Asurion, LLC | 1.37% |
| Electronics/Electrical |
|
| 13.58% | 15.69% | |||
Transdigm, Inc. | 1.16% |
| Business Equipment & Services |
| 8.93% | 9.51% | ||||
Novolex (aka Flex Acquisition Company, Inc) | 0.83% |
| Health Care |
|
|
|
|
| 8.36% | 9.76% |
Global Medical Response, Inc. (fka Air Medical | 0.82% |
| Telecommunications |
|
| 6.73% | 4.87% | |||
Group Holdings, Inc.) |
| Automotive |
|
|
|
|
| 4.59% | 2.57% | |
|
|
|
|
|
|
| ||||
Calpine Corp | 0.80% |
| Diversified Insurance |
|
| 4.44% | 3.63% | |||
Belron S.A. | 0.80% |
| Leisure Goods/Activities/Movies |
| 4.21% | 4.02% | ||||
Internet Brands, Inc. | 0.75% |
| Radio & Television |
|
| 3.79% | 2.33% | |||
AlixPartners, LLP | 0.71% |
| Containers & Glass Products |
|
| 3.44% | 2.40% | |||
PPD, Inc. | 0.71% |
| Building & Development |
|
| 3.11% | 2.93% | |||
Rackspace Hosting | 0.67% |
|
|
|
|
|
|
|
|
|
|
|
|
|
|
|
|
|
| ||
|
|
|
|
|
|
|
|
|
|
|
Data as of March 31, 2020. Source: Voya Investment Management and S&P/LSTA Leveraged Loan Index.
*These weightings reflect "other net assets." "Other net assets" includes cash, payables, receivables and all other assets and liabilities on the balance sheet.
**The Portfolio's weighted average coupon is calculated by using nominal spread and 60-day LIBOR, while the Index's weighted average coupon is calculated using nominal spread and weighted average contracts. Portfolio holdings and characteristics are subject to change and may not be representative of current holdings and characteristics.
11

PPR Ratings Distribution vs. S&P/LSTA Index
35% |
| Trust: | 2.19% |
|
| Trust: 80.40% | 33.02% |
| Trust: 17.41% |
| |||||
|
|
|
|
| |||||||||||
|
|
|
|
|
|
|
|
| |||||||
30% |
| Index: 9.36% |
|
| Index: 66.71% |
|
| 27.10% |
| Index: 23.92% |
| ||||
25% |
|
|
|
|
|
|
|
|
| 23.04% |
|
|
|
| |
20% |
|
|
|
|
|
|
|
|
|
|
|
| 15.43% |
| |
|
|
|
|
|
|
|
|
|
| 15.70% |
|
| |||
|
|
|
|
|
|
|
|
|
|
|
|
|
| ||
15% |
|
|
|
|
|
|
|
|
|
|
|
| 12.41% |
| |
|
|
|
|
|
|
|
|
|
|
|
|
|
| ||
10% |
|
|
| 9.12% |
| 10.20% | 9.34% 9.86% |
|
|
|
| ||||
|
|
|
|
| 7.98% |
|
|
|
| 6.77% |
| ||||
|
|
|
|
| 6.07% |
|
|
|
|
|
|
|
| ||
|
|
|
|
|
|
|
|
|
|
|
| 5.01% |
| ||
5% |
|
|
|
| 4.80% |
|
|
|
|
|
|
|
|
| |
|
|
| 2.19% |
|
|
|
|
|
|
|
|
|
| 1.72% | |
|
| 0.00%0.00% |
|
|
|
|
|
|
|
|
|
| |||
|
|
|
|
|
|
|
|
|
|
|
| 0.00% | |||
0% |
| 0.00% | 0.25% |
|
|
|
|
|
|
|
|
|
| ||
| BBB+ | BBB | BBB- | BB+ |
|
| BB | BB- |
| B+ | B | B- | CCC and | NR* | |
|
|
|
|
| |||||||||||
|
|
|
|
|
|
|
|
|
|
|
|
|
| Below |
|
|
|
|
|
|
|
|
| Trust |
|
| S&P/LSTA Index |
|
|
|
|
|
|
|
|
|
|
|
|
|
|
|
|
|
| ||
|
|
|
|
|
|
|
|
|
|
|
|
|
| ||
Data as of March 31, 2020. Source: Voya Investment Management and S&P/LSTA Leveraged Loan Index.
Portfolio holdings and characteristics are subject to change and may not be representative of current holdings and characteristics.
The Standard & Poor's rating scale is as follows, from excellent (high grade) to poor (including default): AAA to D, with intermediate ratings offered at each level between AA and CCC. Anything lower than a BBB- rating is considered a non-investment grade or junk bond. Any security that is not rated by Standard & Poor's is placed in the NR (Not Rated) category.
12
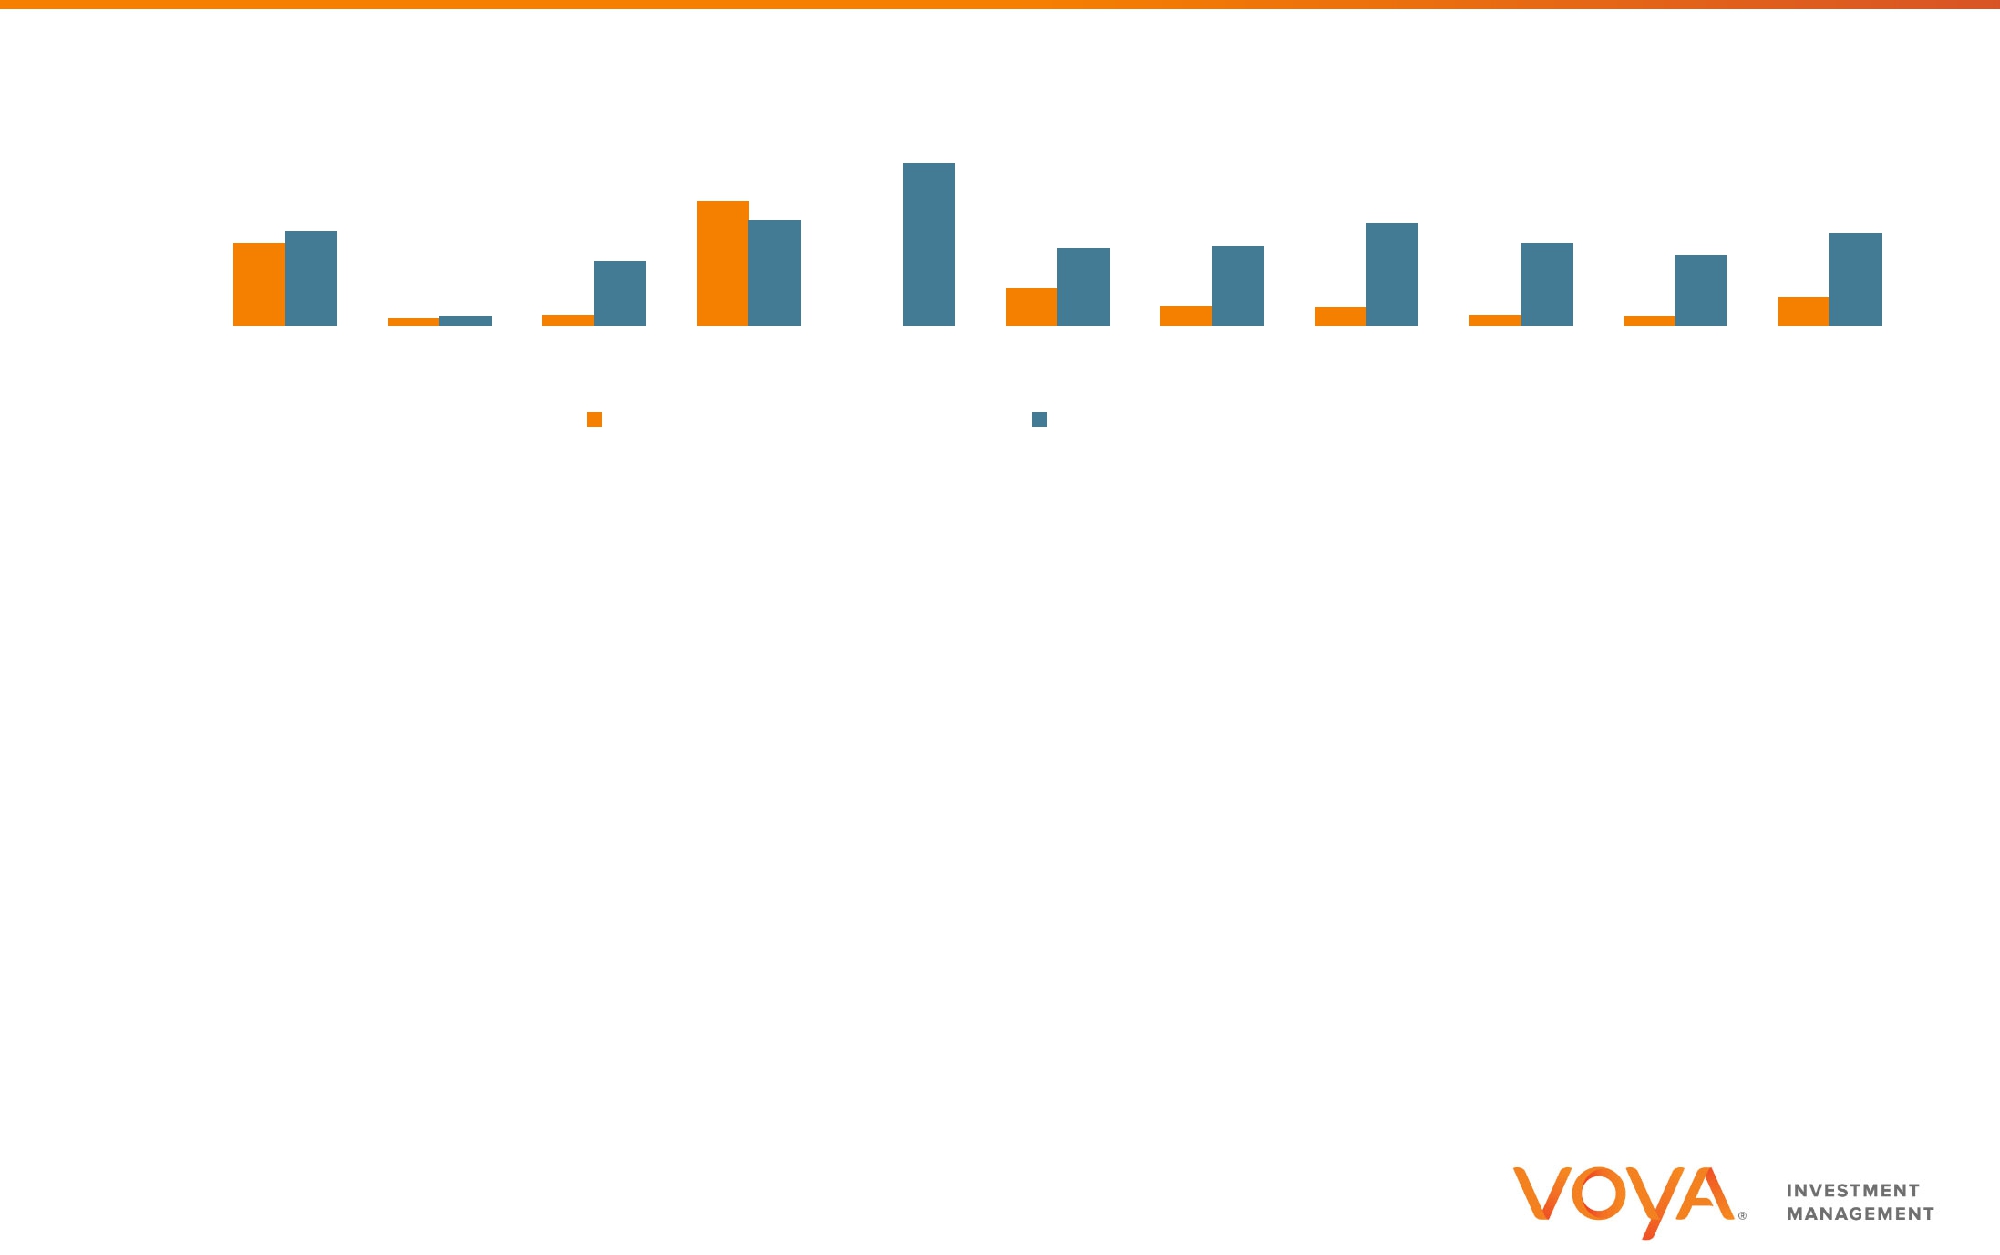
PPR Default Rate Profile
Prime Rate Trust Aggregate Default Rate vs. Index
4.00% |
|
|
|
|
| 3.24% |
|
|
|
|
|
|
|
|
| |
|
|
|
|
|
|
|
|
|
|
|
|
|
|
|
| |
3.00% |
|
|
| 2.48% |
|
|
|
|
| 2.05% |
|
|
|
| ||
2.00% | 1.87% |
| 1.27% | 2.11% |
| 1.54% | 1.58% | 1.63% | 1.39% | 1.84% | ||||||
1.65% |
|
|
|
|
|
|
| |||||||||
1.00% |
| 0.14%0.17% 0.21% |
| 0.00% | 0.74% | 0.38% | 0.37% | 0.21% | 0.19% | 0.57% | ||||||
0.00% |
|
|
|
|
| |||||||||||
2010 | 2011 | 2012 | 2013 | 2014 | 2015 | 2016 | 2017 |
| 2018 | 2019 |
| LTM | ||||
|
|
|
| |||||||||||||
|
|
|
| PPR Aggregate Default Rate | S&P/LSTA Index Default Rate |
|
|
|
| |||||||
|
|
|
|
|
|
|
|
|
|
|
|
|
|
|
|
|
|
|
|
|
| 2010 | 2011 | 2012 | 2013 | 2014 | 2015 | 2016 | 2017 | 2018 | 2019 | LTM |
|
|
|
|
|
|
|
|
|
|
|
|
|
|
|
| ||
| Default Rates by Amount (%) |
|
|
|
|
|
|
|
|
|
|
|
|
| ||
| Prime Rate Trust Payment |
| 1.23% | 0.14% | 0.21% | 1.09% 0.00% 0.12% 0.23% 0.09% 0.21% | 0.19% | 0.57% |
| |||||||
| Prime Rate Trust Aggregate |
| 1.65% | 0.14% | 0.21% | 2.48% 0.00% 0.74% 0.38% 0.37% 0.21% | 0.19% | 0.57% |
| |||||||
| S&P/LSTA Index |
| 1.87% | 0.17% | 1.27% | 2.11% | 3.24% | 1.54% | 1.58% | 2.05% | 1.63% | 1.39% | 1.84% |
| ||
LTM Data as of March 31, 2020. Past performance does not guarantee future results and there is the possibility of loss. Aggregate Default count and rate includes both Payment Defaults and other categories of defaults, as described on the following slide. Source: Voya Investment Management, S&P/LCD LoanStats Weekly "Lagging Twelve-Month Default Rate by Principal Amount & Rolling Twelve-Month Principal Amount of Index Defaults."
LTM shows defaults over the most recent 12 months. Therefore, the number and amount of defaults shown include defaults from portions of the previous year. Lagging twelve month default rate is shown to permit comparison to the S&P Index rate, which also shows lagging twelve months. Payment defaults are included within aggregate default statistics.
The information provided from market and index sources may be subject to change, and such data may be restated in the future as additional information becomes available from public sources.
Please see explanation on the following slide for a description of how defaults are determined and default and recovery rates are calculated and presented. Aggregate Default rate for the Trust includes both Payment Defaults and other categories of defaults, as described on the following slide.
13

Questions?
14

Voya Prime Rate Trust
Risk is inherent in all investing. The following are the principal risks associated with investing in Voya Prime Rate Trust.
Credit Risk: The fund invests a substantial portion of its assets in below investment grade senior bank loans and other below investment grade assets. Below investment grade loans involve a greater risk that borrowers may not make timely payment of the interest and principal due on their loans. They also involve a greater risk that the value of such loans could decline significantly. If borrowers do not make timely payments of the interest due on their loans, the yield on the fund's Common Shares will decrease. If borrowers do not make timely payment of the principal due on their loans, or if the value of such loans decreases, the fund's NAV will decrease.
Interest rate risk: The yield on senior loans is directly affected by changes in market interest rates. If such rates fall, the yield may fall. Also, if overall interest rates on loans decline, the yield may fall and the value of the loans may decrease. When market interest rates rise, there may be a delay in the rise in the yield on loans due to a lag between changes in such rates and the resetting of the floating rates on the loans. There may also be a delay due to the effect of LIBOR floors, which establish a lower limit on the LIBOR portion of a loan's yield. Rises in market interest rates must exceed applicable LIBOR floors before such rises will affect the yield on a loan with a LIBOR floor.
Leverage risk: The fund's use of leverage through borrowings and the issuance of Preferred Shares can adversely affect the yield on the fund's Common Shares. To the extent that the fund is unable to invest the proceeds from the use of leverage in assets which pay interest at a rate which exceeds the rate paid on the leverage, the yield on the fund's Common Shares will decrease. In addition, in the event of a general market decline in the value of assets such as those in which the fund invests, the effect of that decline will be magnified in the fund because of the additional assets purchased with proceeds of the leverage.
Limited secondary market for loans: Because of the limited secondary market for loans, the fund may be limited in its ability to sell loans in its portfolio in a timely fashion and/or at a favorable price.
Demand for loans: An increase in demand for loans may adversely affect the rate of interest payable on new loans acquired by the fund, and it may also increase the price of loans in the secondary market. A decrease in the demand for loans may adversely affect the price of loans in the fund's portfolio, which could cause the fund's NAV to decline.
This is not, and is not intended to be, a description of all risks of investing in the fund. The fund's current Prospectus should be read carefully before investing. Consider the fund's investment objective, risks, and charges and expenses carefully before investing.
15

Disclosures
This information is proprietary and cannot be reproduced or distributed. Certain information may be received from sources Voya Investment Management ("Voya IM") considers reliable; Voya IM does not represent that such information is accurate or complete. Certain statements contained herein may constitute "projections," "forecasts" and other "forward-looking statements" which do not reflect actual results and are based primarily upon applying retroactively a hypothetical set of assumptions to certain historical financial data. Actual results, performance or events may differ materially from those in such statements. Any opinions, projections, forecasts and forward-looking statements presented herein are valid only as of the date of this document and are subject to change. Nothing contained herein should be construed as (i) an offer to buy any security or (ii) a recommendation as to the advisability of investing in, purchasing or selling any security. Voya IM assumes no obligation to update any forward-looking information.
Past performance is no guarantee of future results.
©2019 Voya Investments Distributor, LLC, 230 Park Ave, New York, NY 10169
Voya assumes no obligation to update any forward-looking information contained in this document.
This is not, and is not intended to be, a description of all risks of investing in senior loans. The applicable offering documents should be read carefully before investing. Voya Compliance Approval ID #20200108-1050290-3159152.
www.voyainvestments.com
16